The Human Genome Browser at UCSC W. James Kent, 1,5 Charles W. Sugnet, 2 Terrence S. Furey, 2 Krishna M. Roskin, 2 Tom H. Pringle, 3 Alan M. Zahler, 1 and David Haussler 4 1 Department of Molecular, Cellular, and Developmental Biology, and Center for Molecular Biology of RNA, University of California, Santa Cruz, California 95064, USA; 2 Department of Computer Science, University of California, Santa Cruz, California 95064, USA; 3 Sperling Biomedical Foundation; Eugene, Oregon, 97405, USA; 4 Howard Hughes Medical Institute and Department of Computer Science, University of California, Santa Cruz, California 95064, USA As vertebrate genome sequences near completion and research refocuses to their analysis, the issue of effective genome annotation display becomes critical. A mature web tool for rapid and reliable display of any requested portion of the genome at any scale, together with several dozen aligned annotation tracks, is provided at http://genome.ucsc.edu. This browser displays assembly contigs and gaps, mRNA and expressed sequence tag alignments, multiple gene predictions, cross-species homologies, single nucleotide polymorphisms, sequence-tagged sites, radiation hybrid data, transposon repeats, and more as a stack of coregistered tracks. Text and sequence-based searches provide quick and precise access to any region of specific interest. Secondary links from individual features lead to sequence details and supplementary off-site databases. One-half of the annotation tracks are computed at the University of California, Santa Cruz from publicly available sequence data; collaborators worldwide provide the rest. Users can stably add their own custom tracks to the browser for educational or research purposes. The conceptual and technical framework of the browser, its underlying MYSQL database, and overall use are described. The web site currently serves over 50,000 pages per day to over 3000 different users. We are fortunate to live in a time when the vast majority of the human genome has been sequenced, is freely available, and where work proceeds rapidly to fill in the remaining gaps. The public mapping and sequencing efforts have spanned a decade and involved thousands of people (Consortium 2001; McPherson et al. 2001). The end result of the sequencing ef- forts will be three billion A’s, Cs, Gs, and Ts in a particular order that somehow contains instructions for building a hu- man body. Over 2.7 billion bases are in the public databases today. Finding which of the 2.7 billion bases are relevant to a particular aspect of biology or medicine can be a challenge. For the most part, researchers would prefer to view the ge- nome at a higher level—at the level of an exon, a gene, a chromosome band, or a biochemical pathway. The base-by- base view is best reserved for preparing primers for experi- ments or looking for DNA motifs associated with particular functions. Interactive computer programs that can search and display a genome at various levels are very useful tools, and a number of these programs exist. One of the earliest-such programs was a Caenorhabdi- tis elegans database (ACEDB) (Eeckman and Durbin 1995; Kelley 2000). ACEDB began as a database to keep track of C. elegans strains and information from genetic crosses (J. Thi- erry-Mieg, pers. comm.). Soon ACEDB could display genetic maps. ACEDB was adopted by the C. elegans sequencing project at the Sanger Centre and Washington University (Consortium 1998). As cosmid and then sequence maps of C. elegans became available, these were added to ACEDB. ACEDB is a very flexible program and has been used in many other sequencing projects as well, including Arabidopsis and parts of the human genome project. Because of its use of the middle and right mouse buttons and other X-windows user interface features, ACEDB works best on a Unix or Linux system. The WormBase project (Stein et al. 2001) is actively adapting parts of ACEDB for use in their web-based display. The Saccharomyces Genome Database (SGD) at http:// genome-www.stanford.edu/Saccharomyces/ was designed with the web in mind. At SGD, it is possible to search for a gene either by name or by sequence, browse neighboring genes, retrieve the full sequence for a gene, look up functional summaries of most genes, and link into the literature all with a few clicks in a web browser. SGD was first described in 1998 (Cherry et al. 1998) and currently receives over 50,000 hits per week from biomedical researchers. There are currently at least three sites that attempt to provide a similar service for the public working draft of the human genome. The open source Ensembl project at www. ensembl.org has been online since the very early days of the working draft (Birney et al. 2001). Ensembl was conceived before there were assemblies available of the draft human ge- nome. Because the average size of the sequence contigs before assembly was considerably smaller than the average size of a human gene, initially Ensembl focused on identifying exons. Ensembl ran the Genscan program (Burge and Karlin 1997) to find genes in finished and draft clones. The contigs inside of draft clones were ordered when possible by mRNA informa- tion, but no attempt was made to merge overlapping clones. Genscan is a sensitive program but has a relatively high false rate of positive predictions. The putative exons Genscan identified were translated into protein, and when homolo- gous proteins could be found in the EMBL database, the exons were marked as confirmed. When possible, exons were 5 Corresponding author. E-MAIL [email protected] Article and publication are at http://www.genome.org/cgi/doi/10.1101/ gr.229102. Article published online before print in May 2002. Resource 996 Genome Research 12:996–1006 ©2002 by Cold Spring Harbor Laboratory Press ISSN 1088-9051/01 $5.00; www.genome.org www.genome.org

Welcome message from author
This document is posted to help you gain knowledge. Please leave a comment to let me know what you think about it! Share it to your friends and learn new things together.
Transcript
The Human Genome Browser at UCSCW. James Kent,1,5 Charles W. Sugnet,2 Terrence S. Furey,2 Krishna M. Roskin,2
Tom H. Pringle,3 Alan M. Zahler,1 and David Haussler4
1Department of Molecular, Cellular, and Developmental Biology, and Center for Molecular Biology of RNA, Universityof California, Santa Cruz, California 95064, USA; 2Department of Computer Science, University of California, Santa Cruz,California 95064, USA; 3Sperling Biomedical Foundation; Eugene, Oregon, 97405, USA; 4Howard Hughes Medical Instituteand Department of Computer Science, University of California, Santa Cruz, California 95064, USA
As vertebrate genome sequences near completion and research refocuses to their analysis, the issue of effectivegenome annotation display becomes critical. A mature web tool for rapid and reliable display of any requestedportion of the genome at any scale, together with several dozen aligned annotation tracks, is provided athttp://genome.ucsc.edu. This browser displays assembly contigs and gaps, mRNA and expressed sequence tagalignments, multiple gene predictions, cross-species homologies, single nucleotide polymorphisms,sequence-tagged sites, radiation hybrid data, transposon repeats, and more as a stack of coregistered tracks. Textand sequence-based searches provide quick and precise access to any region of specific interest. Secondary linksfrom individual features lead to sequence details and supplementary off-site databases. One-half of theannotation tracks are computed at the University of California, Santa Cruz from publicly available sequencedata; collaborators worldwide provide the rest. Users can stably add their own custom tracks to the browser foreducational or research purposes. The conceptual and technical framework of the browser, its underlyingMYSQL database, and overall use are described. The web site currently serves over 50,000 pages per day toover 3000 different users.
We are fortunate to live in a time when the vast majority ofthe human genome has been sequenced, is freely available,and where work proceeds rapidly to fill in the remaining gaps.The public mapping and sequencing efforts have spanned adecade and involved thousands of people (Consortium 2001;McPherson et al. 2001). The end result of the sequencing ef-forts will be three billion A’s, Cs, Gs, and Ts in a particularorder that somehow contains instructions for building a hu-man body. Over 2.7 billion bases are in the public databasestoday.
Finding which of the 2.7 billion bases are relevant to aparticular aspect of biology or medicine can be a challenge.For the most part, researchers would prefer to view the ge-nome at a higher level—at the level of an exon, a gene, achromosome band, or a biochemical pathway. The base-by-base view is best reserved for preparing primers for experi-ments or looking for DNA motifs associated with particularfunctions. Interactive computer programs that can search anddisplay a genome at various levels are very useful tools, and anumber of these programs exist.
One of the earliest-such programs was a Caenorhabdi-tis elegans database (ACEDB) (Eeckman and Durbin1995; Kelley 2000). ACEDB began as a database to keep track ofC. elegans strains and information from genetic crosses (J. Thi-erry-Mieg, pers. comm.). Soon ACEDB could display geneticmaps. ACEDB was adopted by the C. elegans sequencingproject at the Sanger Centre and Washington University(Consortium 1998). As cosmid and then sequence maps of C.elegans became available, these were added to ACEDB. ACEDB is
a very flexible program and has been used in many othersequencing projects as well, including Arabidopsis and parts ofthe human genome project. Because of its use of the middleand right mouse buttons and other X-windows user interfacefeatures, ACEDB works best on a Unix or Linux system. TheWormBase project (Stein et al. 2001) is actively adapting partsof ACEDB for use in their web-based display.
The Saccharomyces Genome Database (SGD) at http://genome-www.stanford.edu/Saccharomyces/ was designedwith the web in mind. At SGD, it is possible to search for agene either by name or by sequence, browse neighboringgenes, retrieve the full sequence for a gene, look up functionalsummaries of most genes, and link into the literature all witha few clicks in a web browser. SGD was first described in 1998(Cherry et al. 1998) and currently receives over 50,000 hits perweek from biomedical researchers.
There are currently at least three sites that attempt toprovide a similar service for the public working draft of thehuman genome. The open source Ensembl project at www.ensembl.org has been online since the very early days of theworking draft (Birney et al. 2001). Ensembl was conceivedbefore there were assemblies available of the draft human ge-nome. Because the average size of the sequence contigs beforeassembly was considerably smaller than the average size of ahuman gene, initially Ensembl focused on identifying exons.Ensembl ran the Genscan program (Burge and Karlin 1997) tofind genes in finished and draft clones. The contigs inside ofdraft clones were ordered when possible by mRNA informa-tion, but no attempt was made to merge overlapping clones.Genscan is a sensitive program but has a relatively high falserate of positive predictions. The putative exons Genscanidentified were translated into protein, and when homolo-gous proteins could be found in the EMBL database, the exonswere marked as confirmed. When possible, exons were
5Corresponding author.E-MAIL [email protected] and publication are at http://www.genome.org/cgi/doi/10.1101/gr.229102. Article published online before print in May 2002.
Resource
996 Genome Research 12:996–1006 ©2002 by Cold Spring Harbor Laboratory Press ISSN 1088-9051/01 $5.00; www.genome.orgwww.genome.org
grouped together into genes. Ensembl produced a web-baseddisplay of their gene predictions and supporting evidence.When the University of California, Santa Cruz (UCSC) ge-nome assemblies (Consortium 2001; Kent and Haussler 2001)became available, Ensembl quickly shifted to them and overtime has added many additional annotations including Ge-newise gene predictions (Birney and Durbin 1997), homologywith other species, positions of single nucleotide polymor-phisms (SNPs) (Sachidanandam et al. 2001), and so forth. En-sembl recently has started to annotate the mouse genome aswell.
The National Center for Biotechnology Information(NCBI) from the beginning has hosted the human genome aspart of the BLAST-searchable GenBank (Benson et al. 1999).Inside GenBank, the genome is present as many separate re-cords, mainly in records associated with bacterial artificialchromosome (BAC) clones. NCBI made their own assembly ofthe public human genome data available recently. Their as-sembly can be BLAST searched, and the relative positions ofvarious features can be viewed on their map viewer. A pagewith links to NCBI’s human genome-specific resources is athttp://www.ncbi.nlm.nih.gov/genome/guide/human/. Theseresources include the RefSeq set of nonredundant mRNA se-quences (Maglott et al. 2000; Pruitt and Maglott 2001). Func-tional descriptions of many of the RefSeq genes are availablein the associated LocusLink and OMIM (Maglott et al. 2000;Pruitt and Maglott 2001) databases.
A third site that serves the human genome is the focus ofthis paper. The distinguishing features of the UCSC browserare the breadth of annotations, speed, stability, extensibility,and consistency of user interface. We actively seek data fromthird parties to display. Each set of annotations is showngraphically as a horizontal “track” over the genome sequence.Currently, one-half of the 31 annotation tracks in the browserare computed at UCSC while the other half are generated bycollaborators worldwide. The browser is highly integratedwith the BLAT sequence search tool (Kent 2002).
The UCSC browser had humble origins. The code origi-nated with a small script in the C programming language,which displayed a splicing diagram for a gene prediction fromthe nematode C. elegans (Kent and Zahler 2000). This web-based splicing display later acquired tracks for mRNA align-ments and for homology with the related nematode Cae-norhabditis briggsae. This was published as the tracks display athttp://www.cse.ucsc.edu/∼kent/intronerator (Kent and Zahler2000a,b). It would have been difficult to move this browser tothe human genome before the draft assembly because of thefragmented and redundant nature of the “Working Draft.”Because the human genome is 30 times larger than the C.elegans genome, even after the assembly, the software re-quired substantial revision. In the end, we were able to main-tain the same interactive response time we had on the wormon the vastly larger human data set via a series of algorithmicimprovements, via use of the MySQL database, via a set ofLinux pentium-class machines acting as web servers, and viasystems tuning by our systems administrators. The result is asite that has become very popular with biologists. Currently,the UCSC Human Genome Browser at http://genome.ucsc.edu receives >50,000 hits per working day, from morethan 3000 different users. In this paper, we describe the over-all conceptual framework behind the browser and its use. Weexplain some of the algorithmic tricks behind the browser,demonstrate how to add your own tracks, and provide detailson how some of the tracks were generated at UCSC.
RESULTS AND DISCUSSION
Using the BrowserTo start a browser session, follow the “browser” link at http://genome.ucsc.edu. This will take you to a page where you cansearch for a gene by name, author, keyword, and so forth, ordirectly specify the region to view as either a chromosomeband or a chromosome and range of bases. You can also enterthe browser via a search for homologous regions to a DNA orprotein sequence using the “BLAT” link. The BLAT search typi-cally only takes a few seconds. The main browser display (Fig.1) contains three main parts. On top is a series of controls forsearching and for zooming and scrolling across a chromo-some. In the middle is a dynamically generated picture thatgraphically displays genome annotations. On the bottom isanother series of controls that fine-tune the graphic display.
The browser represents annotations as a series of hori-zontal tracks laid out over the genome. Each track displays aparticular type of annotation, such as Genscan gene predic-tions, mRNA alignments, or interspersed repeats. Each trackcan be displayed in dense mode, fully expanded, or can behidden. By default most tracks are displayed in dense modewhere they take up a single line. Clicking on a dense trackopens it up to a full mode, where there is a separate line foreach item. Clicking on an item brings up detailed informationon that item. Some particularly important tracks, such as thetrack for known genes, are fully open by default. The trackdisplay is useful at many scales, from a view of an entire chro-mosome down to the alternative splicing patterns of a singlegene (Figs. 2–5). The notion of a track is important in theunderlying database as well as in the browser itself. The tracksare relatively independent of each other both in the user in-terface and the underlying programming. As a consequence,it is very easy to add another track when new annotationsbecome available. The tracks relate to each other simply by allbeing synchronized to the same underlying sequence. Theuser can see many lines of evidence in a single screen and onthat basis quickly is able to make informed judgments aboutthe biology of a particular region.
The graphic display of the browser is invaluable for get-ting a quick overview of a particular region in the genome andfor visually correlating various types of features. However,there is a limit to what can be displayed in a single window.As mentioned above, clicking on an individual item in a fullyopened track brings up further information on the track as awhole and on the specific item. In many cases, this includeslinks to other databases such as those at NCBI and Ensembl.Figure 6 shows the details page for the known gene VLDLR(the very-low-density lipoprotein receptor). It’s possible to re-trieve the mRNA and protein sequence for this gene from thispage, as well as the genomic sequence with exons in uppercase.
At times, the user might want a list of features in a par-ticular section of the genome in a text rather than a graphicalformat. The Table Browser, which is accessible from the“tables” link, extracts information in a tab-delimited formatsuitable for import into text editors, spreadsheets, or yourown databases. The database behind both the graphical andtable browsers is described further in a later section.
Correlations Between TracksA common use of the browser is to look for evidence of pre-viously unidentified genes. The EST, cross-species homology,
UCSC Human Genome Browser
Genome Research 997www.genome.org
and ab initio gene prediction tracks in particular are very use-ful for this purpose. Table 1A provides a summary of how wellthese various tracks correlate with the RefSeq-based KnownGene tracks across the entire genome and Table 1B provides a
summary of how well the various tracks correlate with theSanger Centre gene annotations on chromosome 22 (Dun-ham et al. 1999). The Exofish track, based on homology withthe pufferfish Tetraodon nigroviridis (Roest Crollius et al. 2000)
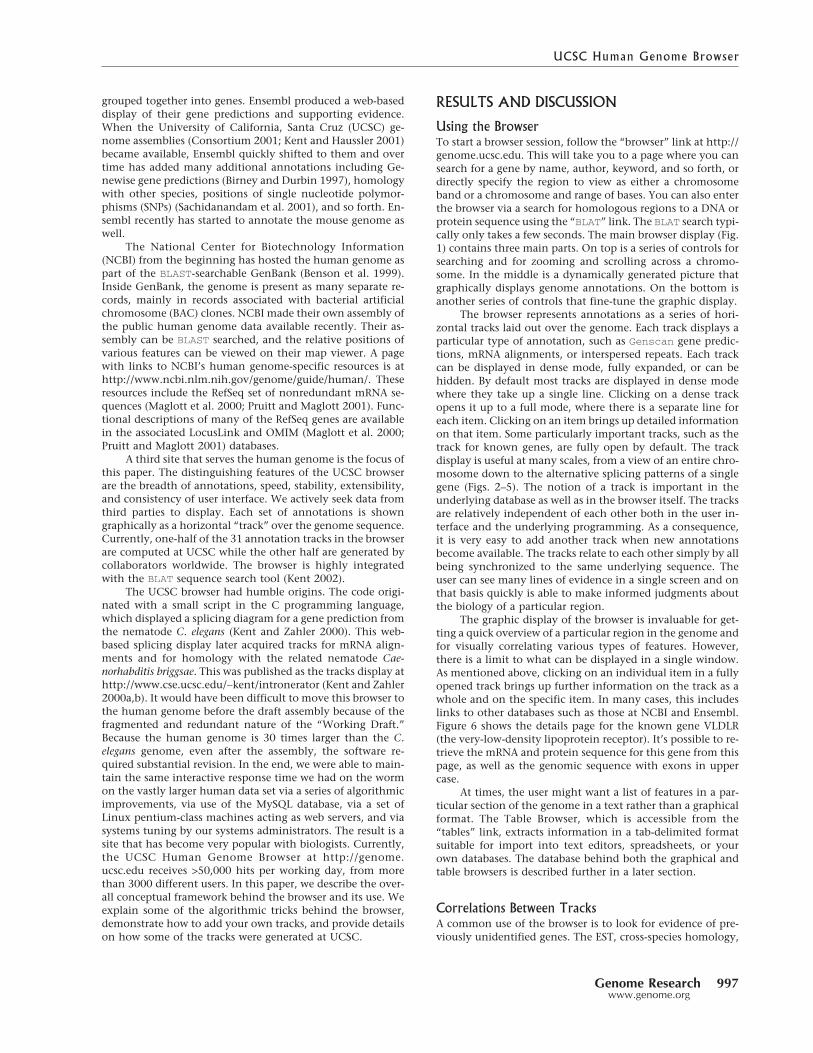
Figure 1 Part of the HOXA cluster as viewed in the University of California, Santa Cruz (UCSC) genome browser. The shortcut bar in blue providesquick access to BLAT searches, the DNA sequence, the annotations as text tables, earlier or later assemblies the genome, the corresponding NCBIand Ensembl views, and the user’s guide. The controls directly beneath position the browser over a specific region in the genome. The large whitepicture in the middle displays various annotations. At the bottom are controls for fine-tuning the display and for the individual tracks. Only the first15 of 31 available tracks are shown here.
This region contains three known genes that are all transcribed on the reverse strand as indicated by the arrowheads in the introns. Note thealternative splicing of HOXA1 in the Human RNA track. The Spliced EST track indicates that there is active transcription of a region between HOXA1and HOXA2. Expressed sequence tag evidence for the presence of additional nonannotated genes in well studied regions like this often can befound using the UCSC browser. The Mouse Blat track indicated a high level of conservation between mouse and human in this region. Both theMouse Blat and the Exofish ecores are based on translated alignments, but in highly conserved regions such as this it is not unusual for eventranslated alignments to paint conserved noncoding regions. The noncoding regions have diverged considerably more between human andpufferfish than between human and mouse.
Kent et al.
998 Genome Researchwww.genome.org
is exceedingly specific, but covers less than half of bases inknown coding regions. This coverage will increase somewhatas more pufferfish sequence is added. The Genscan track, onthe other hand, covers well over three-quarters of bases inknown coding regions, but has only moderate specificity. TheEnsembl, Fgenesh++ (Salamov and Solovyev 2000) and Genie(Kulp et al. 1996, 1997) gene prediction tracks available insome versions of the browser integrate ab initio gene-findingtechniques with homology evidence. Currently, there is nogene prediction tool that integrates all of the evidence dis-played in the browser into a definitive track. The genomeassembly and annotations found on the April 2001 version ofthe browser were used for these tables.
Tracks Based on Human mRNAThere are several tracks based on alignments of human mRNAsequences with the genome. All human mRNAs from the pri-mate database in GenBank are used to make the HumanmRNA track. All human ESTs from dbEST in GenBank areused to make the Human EST and Spliced EST tracks. In allcases, the alignment is done with the BLAT program (Kent2002) using the default nucleotide alignment parameters.
In many cases, a single mRNA will align in multipleplaces in the draft human genome. This can be a result ofpsuedogenes, genes that share a common domain, recent du-plication events in the human genome, and assembly errorsin the draft. We filter the alignments to help focus on thegenes rather than the psuedogenes and paralogs. The firstfilter is based on percentage identity. For ESTs, the thresholdis 93%. For mRNAs, the threshold is 96%. These thresholdswere chosen to be ∼2% below the mean error rate observed inthe first large-scale cDNA sequencing projects in the 1990s.Because the error rate of modern cDNA projects is consider-ably less, we are considering increasing these thresholds inthe future. Note that because exons frequently are missingfrom the draft genome, the percentage identity is only calcu-lated within the blocks that do align. The second filter is a“near best in genome” filter. A score based largely on percentidentity is assigned to each alignment. The best-scoring align-ment for each base of the mRNA sequence is recorded. Align-ments that do not score within 1% of the best score for at least20 bases in a row are filtered out. The combination of filtersreduces the number of alignments by fivefold to tenfold,however most of the alignments eliminated are quite short
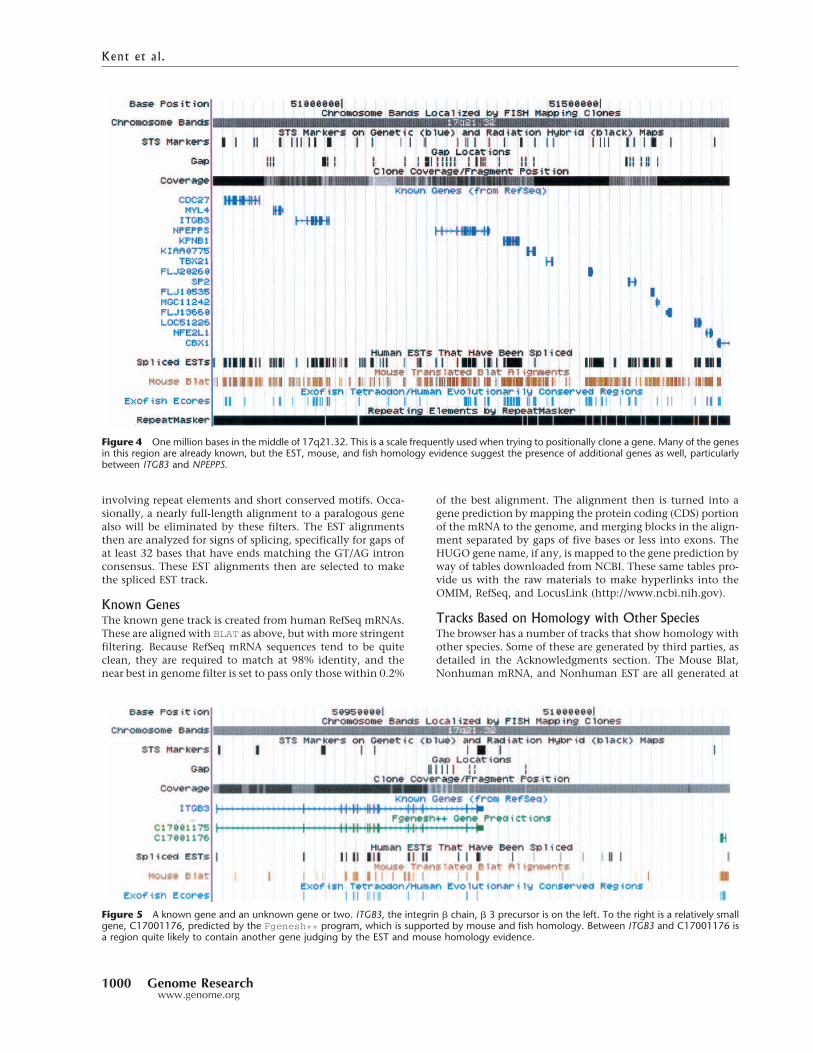
Figure 3 Chromosome 17 band q21.32. This region spans several million bases and is covered by a mix of finished and draft clones. The largeblocks in the gap track indicate gaps between clones, while the small ticks indicate gaps within draft clones. Where there is evidence for the relativeorder and orientation of the contigs on either side of a gap, a white line is drawn though the gap. Most of the contigs in this region are ordered.At this scale, it is possible to resolve most individual genes but not necessarily individual exons.
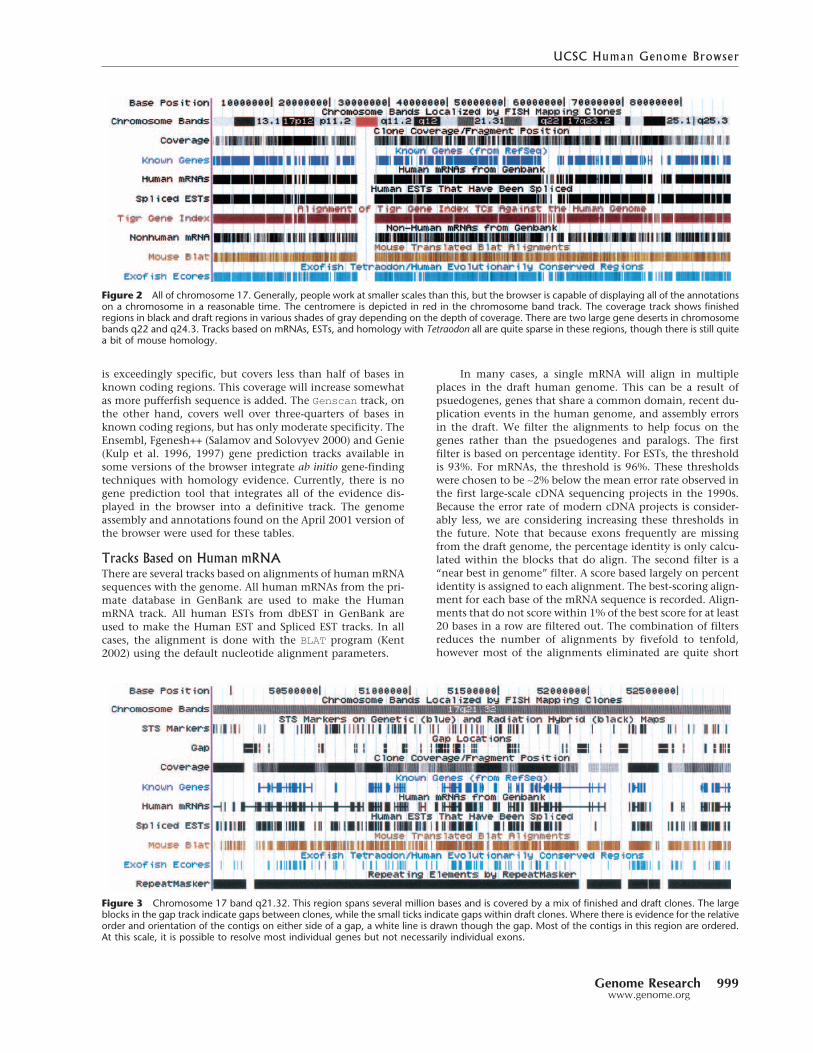
Figure 2 All of chromosome 17. Generally, people work at smaller scales than this, but the browser is capable of displaying all of the annotationson a chromosome in a reasonable time. The centromere is depicted in red in the chromosome band track. The coverage track shows finishedregions in black and draft regions in various shades of gray depending on the depth of coverage. There are two large gene deserts in chromosomebands q22 and q24.3. Tracks based on mRNAs, ESTs, and homology with Tetraodon all are quite sparse in these regions, though there is still quitea bit of mouse homology.
UCSC Human Genome Browser
Genome Research 999www.genome.org
involving repeat elements and short conserved motifs. Occa-sionally, a nearly full-length alignment to a paralogous genealso will be eliminated by these filters. The EST alignmentsthen are analyzed for signs of splicing, specifically for gaps ofat least 32 bases that have ends matching the GT/AG intronconsensus. These EST alignments then are selected to makethe spliced EST track.
Known GenesThe known gene track is created from human RefSeq mRNAs.These are aligned with BLAT as above, but with more stringentfiltering. Because RefSeq mRNA sequences tend to be quiteclean, they are required to match at 98% identity, and thenear best in genome filter is set to pass only those within 0.2%
of the best alignment. The alignment then is turned into agene prediction by mapping the protein coding (CDS) portionof the mRNA to the genome, and merging blocks in the align-ment separated by gaps of five bases or less into exons. TheHUGO gene name, if any, is mapped to the gene prediction byway of tables downloaded from NCBI. These same tables pro-vide us with the raw materials to make hyperlinks into theOMIM, RefSeq, and LocusLink (http://www.ncbi.nih.gov).
Tracks Based on Homology with Other SpeciesThe browser has a number of tracks that show homology withother species. Some of these are generated by third parties, asdetailed in the Acknowledgments section. The Mouse Blat,Nonhuman mRNA, and Nonhuman EST are all generated at
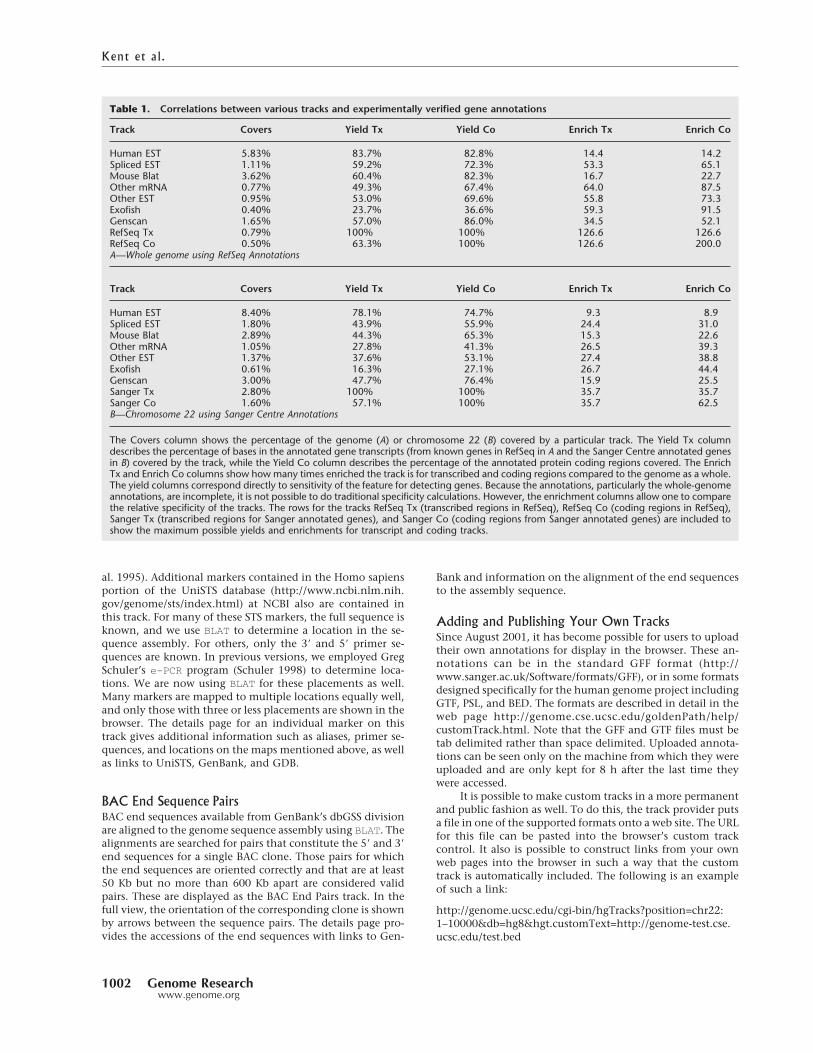
Figure 5 A known gene and an unknown gene or two. ITGB3, the integrin � chain, � 3 precursor is on the left. To the right is a relatively smallgene, C17001176, predicted by the Fgenesh++ program, which is supported by mouse and fish homology. Between ITGB3 and C17001176 isa region quite likely to contain another gene judging by the EST and mouse homology evidence.
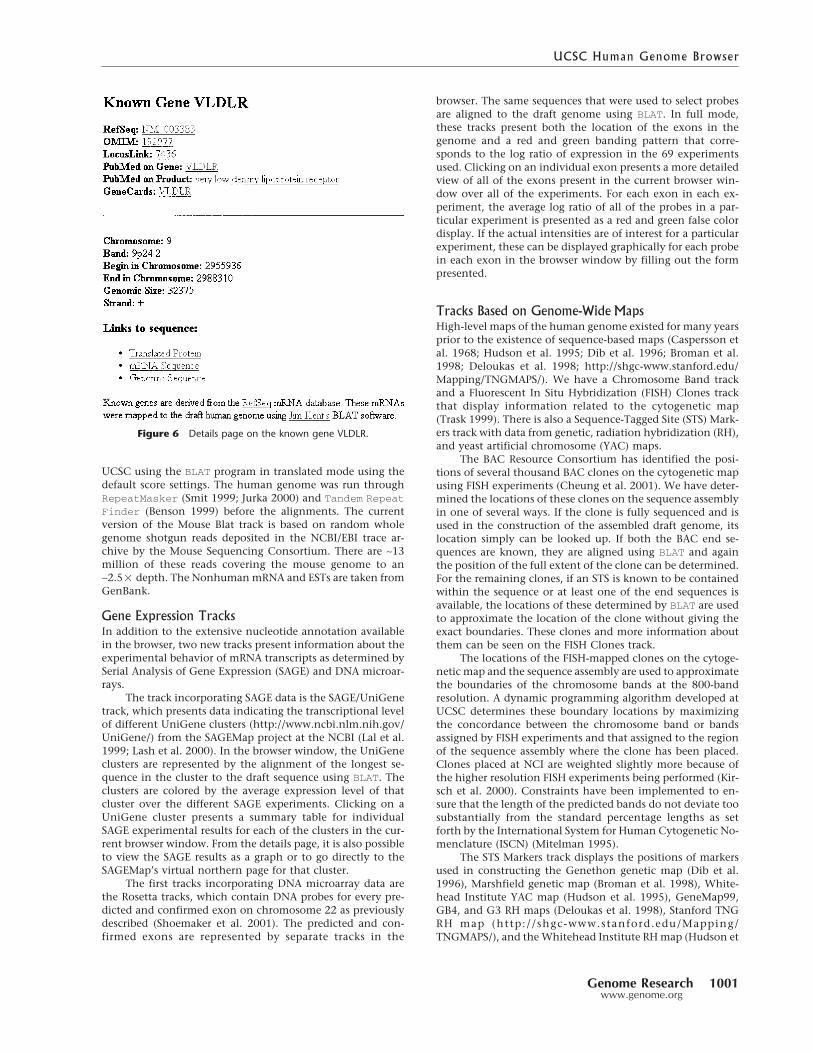
Figure 4 One million bases in the middle of 17q21.32. This is a scale frequently used when trying to positionally clone a gene. Many of the genesin this region are already known, but the EST, mouse, and fish homology evidence suggest the presence of additional genes as well, particularlybetween ITGB3 and NPEPPS.
Kent et al.
1000 Genome Researchwww.genome.org
UCSC using the BLAT program in translated mode using thedefault score settings. The human genome was run throughRepeatMasker (Smit 1999; Jurka 2000) and Tandem RepeatFinder (Benson 1999) before the alignments. The currentversion of the Mouse Blat track is based on random wholegenome shotgun reads deposited in the NCBI/EBI trace ar-chive by the Mouse Sequencing Consortium. There are ∼13million of these reads covering the mouse genome to an∼2.5� depth. The Nonhuman mRNA and ESTs are taken fromGenBank.
Gene Expression TracksIn addition to the extensive nucleotide annotation availablein the browser, two new tracks present information about theexperimental behavior of mRNA transcripts as determined bySerial Analysis of Gene Expression (SAGE) and DNA microar-rays.
The track incorporating SAGE data is the SAGE/UniGenetrack, which presents data indicating the transcriptional levelof different UniGene clusters (http://www.ncbi.nlm.nih.gov/UniGene/) from the SAGEMap project at the NCBI (Lal et al.1999; Lash et al. 2000). In the browser window, the UniGeneclusters are represented by the alignment of the longest se-quence in the cluster to the draft sequence using BLAT. Theclusters are colored by the average expression level of thatcluster over the different SAGE experiments. Clicking on aUniGene cluster presents a summary table for individualSAGE experimental results for each of the clusters in the cur-rent browser window. From the details page, it is also possibleto view the SAGE results as a graph or to go directly to theSAGEMap’s virtual northern page for that cluster.
The first tracks incorporating DNA microarray data arethe Rosetta tracks, which contain DNA probes for every pre-dicted and confirmed exon on chromosome 22 as previouslydescribed (Shoemaker et al. 2001). The predicted and con-firmed exons are represented by separate tracks in the
browser. The same sequences that were used to select probesare aligned to the draft genome using BLAT. In full mode,these tracks present both the location of the exons in thegenome and a red and green banding pattern that corre-sponds to the log ratio of expression in the 69 experimentsused. Clicking on an individual exon presents a more detailedview of all of the exons present in the current browser win-dow over all of the experiments. For each exon in each ex-periment, the average log ratio of all of the probes in a par-ticular experiment is presented as a red and green false colordisplay. If the actual intensities are of interest for a particularexperiment, these can be displayed graphically for each probein each exon in the browser window by filling out the formpresented.
Tracks Based on Genome-Wide MapsHigh-level maps of the human genome existed for many yearsprior to the existence of sequence-based maps (Caspersson etal. 1968; Hudson et al. 1995; Dib et al. 1996; Broman et al.1998; Deloukas et al. 1998; http://shgc-www.stanford.edu/Mapping/TNGMAPS/). We have a Chromosome Band trackand a Fluorescent In Situ Hybridization (FISH) Clones trackthat display information related to the cytogenetic map(Trask 1999). There is also a Sequence-Tagged Site (STS) Mark-ers track with data from genetic, radiation hybridization (RH),and yeast artificial chromosome (YAC) maps.
The BAC Resource Consortium has identified the posi-tions of several thousand BAC clones on the cytogenetic mapusing FISH experiments (Cheung et al. 2001). We have deter-mined the locations of these clones on the sequence assemblyin one of several ways. If the clone is fully sequenced and isused in the construction of the assembled draft genome, itslocation simply can be looked up. If both the BAC end se-quences are known, they are aligned using BLAT and againthe position of the full extent of the clone can be determined.For the remaining clones, if an STS is known to be containedwithin the sequence or at least one of the end sequences isavailable, the locations of these determined by BLAT are usedto approximate the location of the clone without giving theexact boundaries. These clones and more information aboutthem can be seen on the FISH Clones track.
The locations of the FISH-mapped clones on the cytoge-netic map and the sequence assembly are used to approximatethe boundaries of the chromosome bands at the 800-bandresolution. A dynamic programming algorithm developed atUCSC determines these boundary locations by maximizingthe concordance between the chromosome band or bandsassigned by FISH experiments and that assigned to the regionof the sequence assembly where the clone has been placed.Clones placed at NCI are weighted slightly more because ofthe higher resolution FISH experiments being performed (Kir-sch et al. 2000). Constraints have been implemented to en-sure that the length of the predicted bands do not deviate toosubstantially from the standard percentage lengths as setforth by the International System for Human Cytogenetic No-menclature (ISCN) (Mitelman 1995).
The STS Markers track displays the positions of markersused in constructing the Genethon genetic map (Dib et al.1996), Marshfield genetic map (Broman et al. 1998), White-head Institute YAC map (Hudson et al. 1995), GeneMap99,GB4, and G3 RH maps (Deloukas et al. 1998), Stanford TNGRH map (http://shgc-www.stanford.edu/Mapping/TNGMAPS/), and the Whitehead Institute RH map (Hudson et
Figure 6 Details page on the known gene VLDLR.
UCSC Human Genome Browser
Genome Research 1001www.genome.org
al. 1995). Additional markers contained in the Homo sapiensportion of the UniSTS database (http://www.ncbi.nlm.nih.gov/genome/sts/index.html) at NCBI also are contained inthis track. For many of these STS markers, the full sequence isknown, and we use BLAT to determine a location in the se-quence assembly. For others, only the 3� and 5� primer se-quences are known. In previous versions, we employed GregSchuler’s e-PCR program (Schuler 1998) to determine loca-tions. We are now using BLAT for these placements as well.Many markers are mapped to multiple locations equally well,and only those with three or less placements are shown in thebrowser. The details page for an individual marker on thistrack gives additional information such as aliases, primer se-quences, and locations on the maps mentioned above, as wellas links to UniSTS, GenBank, and GDB.
BAC End Sequence PairsBAC end sequences available from GenBank’s dbGSS divisionare aligned to the genome sequence assembly using BLAT. Thealignments are searched for pairs that constitute the 5� and 3�
end sequences for a single BAC clone. Those pairs for whichthe end sequences are oriented correctly and that are at least50 Kb but no more than 600 Kb apart are considered validpairs. These are displayed as the BAC End Pairs track. In thefull view, the orientation of the corresponding clone is shownby arrows between the sequence pairs. The details page pro-vides the accessions of the end sequences with links to Gen-
Bank and information on the alignment of the end sequencesto the assembly sequence.
Adding and Publishing Your Own TracksSince August 2001, it has become possible for users to uploadtheir own annotations for display in the browser. These an-notations can be in the standard GFF format (http://www.sanger.ac.uk/Software/formats/GFF), or in some formatsdesigned specifically for the human genome project includingGTF, PSL, and BED. The formats are described in detail in theweb page http://genome.cse.ucsc.edu/goldenPath/help/customTrack.html. Note that the GFF and GTF files must betab delimited rather than space delimited. Uploaded annota-tions can be seen only on the machine from which they wereuploaded and are only kept for 8 h after the last time theywere accessed.
It is possible to make custom tracks in a more permanentand public fashion as well. To do this, the track provider putsa file in one of the supported formats onto a web site. The URLfor this file can be pasted into the browser’s custom trackcontrol. It also is possible to construct links from your ownweb pages into the browser in such a way that the customtrack is automatically included. The following is an exampleof such a link:
http://genome.ucsc.edu/cgi-bin/hgTracks?position=chr22:1–10000&db=hg8&hgt.customText=http://genome-test.cse.ucsc.edu/test.bed
Table 1. Correlations between various tracks and experimentally verified gene annotations
Track Covers Yield Tx Yield Co Enrich Tx Enrich Co
Human EST 5.83% 83.7% 82.8% 14.4 14.2Spliced EST 1.11% 59.2% 72.3% 53.3 65.1Mouse Blat 3.62% 60.4% 82.3% 16.7 22.7Other mRNA 0.77% 49.3% 67.4% 64.0 87.5Other EST 0.95% 53.0% 69.6% 55.8 73.3Exofish 0.40% 23.7% 36.6% 59.3 91.5Genscan 1.65% 57.0% 86.0% 34.5 52.1RefSeq Tx 0.79% 100% 100% 126.6 126.6RefSeq Co 0.50% 63.3% 100% 126.6 200.0A—Whole genome using RefSeq Annotations
Track Covers Yield Tx Yield Co Enrich Tx Enrich Co
Human EST 8.40% 78.1% 74.7% 9.3 8.9Spliced EST 1.80% 43.9% 55.9% 24.4 31.0Mouse Blat 2.89% 44.3% 65.3% 15.3 22.6Other mRNA 1.05% 27.8% 41.3% 26.5 39.3Other EST 1.37% 37.6% 53.1% 27.4 38.8Exofish 0.61% 16.3% 27.1% 26.7 44.4Genscan 3.00% 47.7% 76.4% 15.9 25.5Sanger Tx 2.80% 100% 100% 35.7 35.7Sanger Co 1.60% 57.1% 100% 35.7 62.5B—Chromosome 22 using Sanger Centre Annotations
The Covers column shows the percentage of the genome (A) or chromosome 22 (B) covered by a particular track. The Yield Tx columndescribes the percentage of bases in the annotated gene transcripts (from known genes in RefSeq in A and the Sanger Centre annotated genesin B) covered by the track, while the Yield Co column describes the percentage of the annotated protein coding regions covered. The EnrichTx and Enrich Co columns show how many times enriched the track is for transcribed and coding regions compared to the genome as a whole.The yield columns correspond directly to sensitivity of the feature for detecting genes. Because the annotations, particularly the whole-genomeannotations, are incomplete, it is not possible to do traditional specificity calculations. However, the enrichment columns allow one to comparethe relative specificity of the tracks. The rows for the tracks RefSeq Tx (transcribed regions in RefSeq), RefSeq Co (coding regions in RefSeq),Sanger Tx (transcribed regions for Sanger annotated genes), and Sanger Co (coding regions from Sanger annotated genes) are included toshow the maximum possible yields and enrichments for transcript and coding tracks.
Kent et al.
1002 Genome Researchwww.genome.org
The position specifies where the browser should open. The dbvariable specifies the database version. It is always of the formhgN, where N is incremented for each version. For the August2001 version, the db variable is “hg8”. The customText con-tains the URL for the custom track file. Tracks produced inthis method are not as fast as tracks loaded into the databaseat UCSC, but if the size of the track file is less than 1 or 2 Mb,the performance is usually very good.
The Challenge of Change—Keeping Upwith the Working DraftOne of the challenges of annotating the human genome isthat there are so many versions of it. At UCSC, we try toassemble a new version approximately every three months toincorporate new sequence. The chromosomal coordinates ofgenes and other features change with each version. Occasion-ally, a chunk of sequence will even get moved from one chro-mosome to another as the map is refined. We have recentlyput in a feature to help jump between the most recent threeversions. This feature is available from the “convert” button atthe top of the browser. It works by performing a BLAT searchon the first 1000, last 1000, and middle 1000 bases in thecurrent window. If all three searches land uniquely in thesame order on the other version, the program announces asuccessful conversion. If the search results are not so straight-forward, the user is given various options to find the corre-sponding sequence. Frequently, if the feature the user is look-ing for is tied to an mRNA, it is simplest just to BLAT themRNA.
The DatabaseThe genome.ucsc.edu database is built on top of MySQL (ww-w.mysql.com). We initially chose this database to be compat-ible with the Ensembl project. MySQL has turned out to bevery well suited to our purposes. It is extremely efficient atretrieving data from indexed files. We use MySQL as a “read-mostly” database. We load the database in large batches andthe rest of the time treat it as read-only. Each of our seven webservers has a copy of the database on local disk.
To create the graphical display, the browser queriesMySQL track by track, asking for data that overlaps the dis-play window. The SQL query to fetch these data for the cpg-Island track on a window covering from base 10,000 to base20,000 on chromosome 3 is as follows:
select * from cpgIsland where chrom = “chr3” and chromStart<20000 and chromEnd >10000
We created indices on chrom,chromStart and chrom,chro-mEnd for this table. The query went reasonably fast for smalltables, such as the 29,005-item cpgIsland table. Even for rela-tively small tables, sorting the data by chrom,chromStart be-fore loading the database turned out to be critical for perfor-mance. If the indices are small enough to fit into RAM, thispresorting reduces the number of disk seeks needed to loadthe data from one track to a very small number, often to asingle seek.
For larger tables, such as the 4.2-million-item EST align-ment table, more complicated schemes were needed for goodinteractive performance. As a first step, we split such tablesbetween chromosomes so that the basic query becomes some-thing like this:
select * from chr2_est where chromStart <20000 and chromEnd>10000
This reduced the size of the indices by eliminating the need toindex the chromosome field, making it more likely for theindices to fit into RAM. In general, the database had to scanthe index for half of the chromosome when the query wasformulated in this fashion. As a consequence, the browser wasslower on large chromosomes than on smaller ones. The per-formance was still tolerable we felt (response time was typi-cally <5 sec even on the largest chromosome), but as we addedmore data, the performance degraded. When the large mousehomology tables were added, it was clear that we needed amore intelligent scheme.
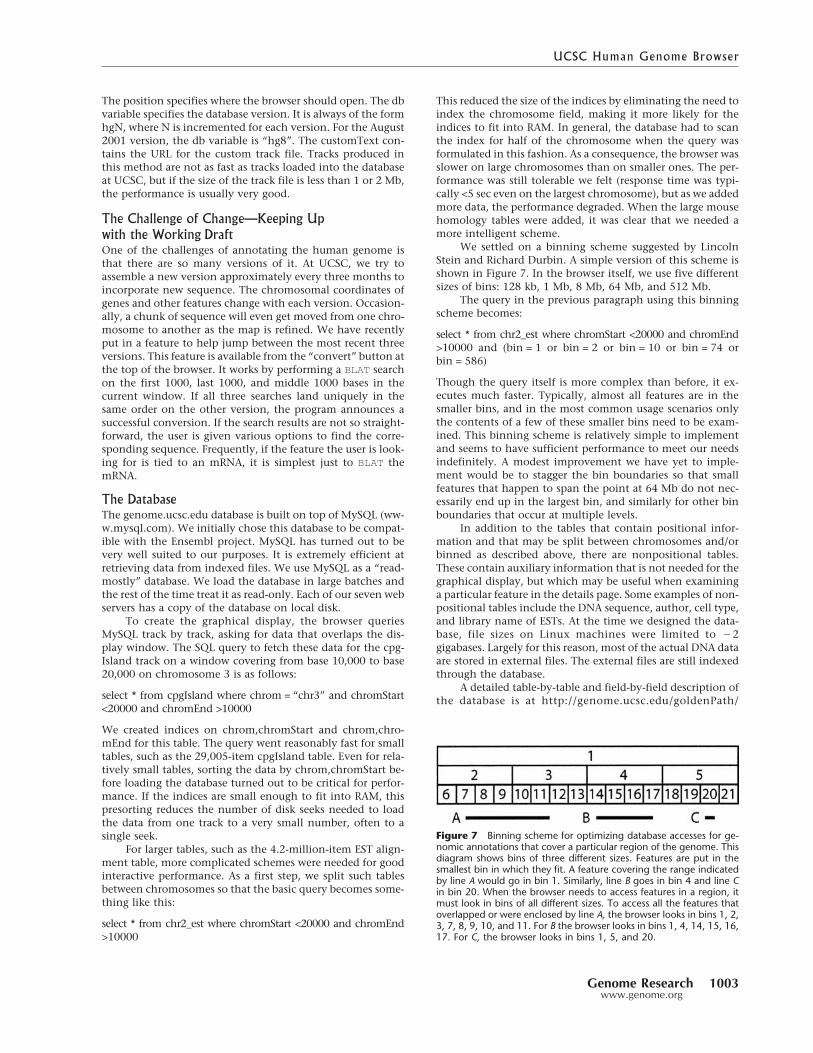
We settled on a binning scheme suggested by LincolnStein and Richard Durbin. A simple version of this scheme isshown in Figure 7. In the browser itself, we use five differentsizes of bins: 128 kb, 1 Mb, 8 Mb, 64 Mb, and 512 Mb.
The query in the previous paragraph using this binningscheme becomes:
select * from chr2_est where chromStart <20000 and chromEnd>10000 and (bin = 1 or bin = 2 or bin = 10 or bin = 74 orbin = 586)
Though the query itself is more complex than before, it ex-ecutes much faster. Typically, almost all features are in thesmaller bins, and in the most common usage scenarios onlythe contents of a few of these smaller bins need to be exam-ined. This binning scheme is relatively simple to implementand seems to have sufficient performance to meet our needsindefinitely. A modest improvement we have yet to imple-ment would be to stagger the bin boundaries so that smallfeatures that happen to span the point at 64 Mb do not nec-essarily end up in the largest bin, and similarly for other binboundaries that occur at multiple levels.
In addition to the tables that contain positional infor-mation and that may be split between chromosomes and/orbinned as described above, there are nonpositional tables.These contain auxiliary information that is not needed for thegraphical display, but which may be useful when examininga particular feature in the details page. Some examples of non-positional tables include the DNA sequence, author, cell type,and library name of ESTs. At the time we designed the data-base, file sizes on Linux machines were limited to �2gigabases. Largely for this reason, most of the actual DNA dataare stored in external files. The external files are still indexedthrough the database.
A detailed table-by-table and field-by-field description ofthe database is at http://genome.ucsc.edu/goldenPath/
Figure 7 Binning scheme for optimizing database accesses for ge-nomic annotations that cover a particular region of the genome. Thisdiagram shows bins of three different sizes. Features are put in thesmallest bin in which they fit. A feature covering the range indicatedby line A would go in bin 1. Similarly, line B goes in bin 4 and line Cin bin 20. When the browser needs to access features in a region, itmust look in bins of all different sizes. To access all the features thatoverlapped or were enclosed by line A, the browser looks in bins 1, 2,3, 7, 8, 9, 10, and 11. For B the browser looks in bins 1, 4, 14, 15, 16,17. For C, the browser looks in bins 1, 5, and 20.
UCSC Human Genome Browser
Genome Research 1003www.genome.org
gbdDescriptions.html. The entire database is dumped weeklyinto tab-delimited files that can be downloaded either a tableat a time or as a single large zip file at genome.ucsc.edu. Withthe Table Browser at http://genome.ucsc.edu/goldenPath/hgText.html, it is possible to extract subsets of the database,in many cases eliminating the need to set up your own copyof the MySQL database.
Enhanced functions are provided for downloading DNAsequence data itself. At any point while browsing, the user canuse the “DNA” link at the top of the browser to download thegenome sequence for the region currently being viewed. Basicoptions include reverse complementation, upper/lower case,and masking of repeats by RepeatMasker (Smit 1999; Jurka2000), possibly using lower case. Here, the output is a simpletext file. Advanced options produce an HTML file containingthe sequence. These options allow users to use a variety ofcombinations of case, underlining, bold, italic, and color torepresent one or more kinds of annotation on the genomesequence. Any track of annotation that is available on thebrowser can be represented in the sequence using any com-bination of these representation modes. Multiple tracks ofannotation can be represented simultaneously in the se-quence by choosing a different mode or combination ofmodes for each track.
The Programming Interface Between the Databaseand the BrowserThere is a natural tension between how an object is repre-sented in the database and in computer programs such as thescripts that make up the browser. A program in the C lan-guage typically will represent an object as a “struct” of somesort and have a family of functions that operate on this struc-ture. An object in a relational database may be represented asa row in a table, as an entire table, or even as an abstract entityspanning multiple tables that are joined together by an ap-propriate SQL query at run time. Some programmers haveeven resorted to converting their objects to some sort of com-plex text format such as XML, and storing the object as a“blob” in the database. A disadvantage of this last approach isthat it becomes difficult to index the fields of the object sepa-rately.
In the browser database, we found a pragmatic compro-mise that works very well for us. We have a program,autoSql, which takes a data definition as an input. From thisdefinition, autoSql creates a C structure, a C function to loadthe structure from an array of strings (which is how a MySQLquery returns a row in a table), a C function to save the struc-ture as a line in a tab-separated file (which can be used to loadthe database), a C function to free up the dynamic memoryused by the structure, and a SQL create statement. There isthus a one-to-one correspondence between a structure inmemory and a row in a table on disk, and likewise a one-to-one correspondence between the fields in structure inmemory and the fields in a row. The autoSql definitions caninclude arrays and substructures. The arrays are represented inthe database as comma-separated lists stored as blobs. WhileautoSql is capable of generating code to handle substruc-tures, these also end up stored in blobs. Because blobs aredifficult to index, we have not actually used this feature in thegenome.ucsc.edu database, though arrays are fairly common.See http://www.soe.ucsc.edu/∼kent/exe/doc/autoSql.doc formore information on autoSql.
Most of the browser database also can be accessed via theDistributed Annotation Service (DAS) protocol (Dowell et al.2001). DAS is a rapidly evolving open source standard fordistributing genomic annotations over the web. It is similar infunction to the publishing-your-own tracks system we de-scribe here, but the data is transmitted in an XML rather thana tab-separated format. Further information on DAS can befound at http://www.biodas.org. The web address of our DASserver is http://genome.ucsc.edu/cgi-bin/das. Because of thelarge size of the annotations, particularly when represented inDAS-GFF XML format, for best results, enable compression onthe DAS clients when accessing our DAS server.
Other FeaturesThe UCSC browser is linked with the Ensembl human ge-nome browser at http://www.ensembl.org in such a way thatusers viewing any region of the genome at UCSC can switcheasily to viewing the same region in the Ensembl browser andvice versa. Like the facility for user-published tracks describedabove, this is another way the power of the web can be ex-ploited to enrich the variety of information about a gene orregion of interest that is rapidly accessible to a user. Mirrors ofthe UCSC browser in Europe and Asia provide faster access tothe information contained in the browser and its database toresearchers in these parts of the world and serve as redundantsites for all users on occasions where a power outage or someother exceptional condition puts genome.ucsc.edu tempo-rarily off line. Because the browser runs on Linux with aMySQL database, we are able to help academic and nonprofitinstitutions set up mirror sites at no cost to the mirroringinstitution. Finally, help and frequently-asked-questionspages are available to assist users with features of the browserand database that are not evident from self-exploration. Thisinformation is supplemented by a moderated and archivede-mail discussion group.
ConclusionThe web site at http://genome.ucsc.edu is a valuable tool forexploring the human genome. It provides fast sequence andtext-based search facilities. The graphical display is relativelysimple to use yet quite powerful and is able to handle hugeannotation sets such as those describing human repeats orhuman/mouse homologies smoothly. The underlying data-base has a relatively simple yet robust design and can be ac-cessed by many methods. It is possible for visitors to incor-porate custom annotations in the context of the annotationsbuilt into the browser either in a public or a private fashion.In the coming years, we plan to continue adding to this siteand to adapt it to other genomes. We have already adapted itto the mouse genome.
ACKNOWLEDGMENTSWe acknowledge the following individuals and institutionswho contributed programs and/or data for tracks: BarbaraTrask, Vivian Cheung, Norma Nowak, and colleagues for theFISH data that was used to create the chromosome bands andFISH Clones tracks; Greg Schuler, Arek Kasprzyk, WonheeJang, and Sanja Rogic for helping process the map informa-tion to generate the STS track, and Genethon, the MarshfieldClinic, the David Cox lab, Whitehead Institute, and the In-ternational RH Mapping Consortium for generating the data;Bob Waterston, John McPhearson, Asif Chinwalla, LaDeanaHillier, Shiaw-Pyng Jang, John Wallis, and colleagues atWashington University for the map that drove the assembly
Kent et al.
1004 Genome Researchwww.genome.org
and that formed the basis for the FPC Contig track and alsofor their work on the CpG Island track; Deanna Church forthe Mouse Synteny track; Jeff Bailey and Evan Eichler for theGenomic Duplications track; Kim Pruitt, Donna Maglott, andcolleagues for the RefSeq and LocusLink project, which formsthe basis of our Known Genes track; David Kulp, Ray Wheeler,Alan Williams, and Affymetrix Corp. for the Genie gene pre-diction tracks; Ewan Birney, Michelle Clamp, Tim Hubbard,Elia Stupka, Imre Vastrik and the Ensembl project for the En-sembl gene prediction track and help with the TPF maps; Vic-tor Solovyev and A. Salamov for the Fgenesh++ gene predic-tion and the TSSW Promoter tracks; Danielle-et-Jean Thierry-Mieg and Vahan Simonyan for the Acembly gene predictiontracks; Ian Dunham and colleagues at the Sanger Centre forthe chromosome 22 annotations, and Victoria Haghighi andBill Noble for remapping these annotations; Greg Schuler,Lukas Wagner, and colleagues at NCBI for the Unigene data-base and the EST 3� end track; John Quackenbush, FooCheung, and colleagues at TIGR for the TIGR Gene Indextrack; Hugues Roest Crollius, Olivier Jaillon, Jean Weissen-bach, and colleagues at Genoscope for the Exofish track; GuySlader and the Mouse Sequencing Consortium for the Exon-erate Mouse track; Ming Li and colleagues at BioinformaticsSolutions for the Pattern Hunter Mouse track; Lincoln Stein,Steve Sherry, the SNP Consortium, and the NIH for the SNPtracks; Arian Smit, Victor Pollara, and J. Jurka for the Repeat-Masker track; Sean Eddy, Todd Lowe, and colleagues for theRNA Genes track; G. Benson for the trf program, which isthe basis of the Simple Repeats track; and Kim Worley, JamesDurbin, John Bouck, and Richard Gibbs for introducing us totrf and executing the early runs of that program and theCpG island finder. We also thank all the members of theInternational Human Genome Project and everyone who hasever contributed data to Genbank for the sequence that formsthe basis of this work. W.J.K, T.F., K.R., A.Z., and D.H. ac-knowledge support from NHGRI Award 1 P41 HG02371–01.T.F also acknowledges support from DOE Grant DE-FG03–99ER62849. C.S. acknowledges support from Howard HughesMedical Institute Award SC-00–63.
The publication costs of this article were defrayed in partby payment of page charges. This article must therefore behereby marked “advertisement” in accordance with 18 USCsection 1734 solely to indicate this fact.
REFERENCESBenson, D.A., Boguski, M.S., Lipman, D.J., Ostell, J., Ouellette, B.F.,
Rapp, B.A., and Wheeler, D.L. 1999. GenBank. Nucleic Acids Res.27: 12–17.
Benson, G. 1999. Tandem repeats finder: A program to analyze DNAsequences. Nucleic Acids Res. 27: 573–580.
Birney, E., Bateman, A., Clamp, M.E., and Hubbard, T.J. 2001.Mining the draft human genome. Nature 409: 827–828.
Birney, E. and Durbin, R. 1997. Dynamite: A flexible code generatinglanguage for dynamic programming methods used in sequencecomparison. Ismb 5: 56–64.
Broman, K.W., Murray, J.C., Sheffield, V.C., White, R.L., and Weber,J.L. 1998. Comprehensive human genetic maps: Individual andsex-specific variation in recombination. Am. J. Hum. Genet.63: 861–869.
Burge, C. and Karlin, S. 1997. Prediction of complete gene structuresin human genomic DNA. J. Mol. Biol. 268: 78–94.
Caspersson, T., Farber, S., Foley, G.E., Kudynowski, J., Modest, E.J.,Simonsson, E., Wagh, U., and Zech, L. 1968. Chemicaldifferentiation along metaphase chromosomes. Exp. Cell Res.49: 219–222.
Cherry, J.M., Adler, C., Ball, C., Chervitz, S.A., Dwight, S.S., Hester,E.T., Jia, Y., Juvik, G., Roe, T., Schroeder, M., et al. 1998. SGD:Saccharomyces genome database. Nucleic Acids Res. 26: 73–79.
Cheung, V.G., Nowak, N., Jang, W., Kirsch, I.R., Zhao, S., Chen,X.N., Furey, T.S., Kim, U.J., Kuo, W.L., Olivier, M., et al. 2001.Integration of cytogenetic landmarks into the draft sequence ofthe human genome. Nature 409: 953–958.
Consortium, T.C.E.S. 1998. Genome sequence of the nematode C.
elegans: A platform for investigating biology. The C. elegansSequencing Consortium. Science 282: 2012–2018.
Consortium, T.I.H.G.S. 2001. Initial sequencing and analysis of thehuman genome. Nature 409: 860–921.
Deloukas, P., Schuler, G.D., Gyapay, G., Beasley, E.M., Soderlund, C.,Rodriguez-Tome, P., Hui, L., Matise, T.C., McKusick, K.B.,Beckmann, J.S., et al. 1998. A physical map of 30,000 humangenes. Science 282: 744–746.
Dib, C., Faure, S., Fizames, C., Samson, D., Drouot, N., Vignal, A.,Millasseau, P., Marc, S., Hazan, J., Seboun, E., et al. 1996. Acomprehensive genetic map of the human genome based on5,264 microsatellites. Nature 380: 152–154.
Dowell, R.D., Jokerst, R.M., Day, A., Eddy, S.R., and Stein, L. 2001.The distributed annotation system. BMC Bioinformatics 2: 7.
Dunham, I., Shimizu, N., Roe, B.A., Chissoe, S., Hunt, A.R., Collins,J.E., Bruskiewich, R., Beare, D.M., Clamp, M., Smink, L.J., et al.1999. The DNA sequence of human chromosome 22. Nature402: 489–495.
Eeckman, F.H. and Durbin, R. 1995. ACeDB and macace. MethodsCell Biol. 48: 583–605.
Hudson, T.J., Stein, L.D., Gerety, S.S., Ma, J., Castle, A.B., Silva, J.,Slonim, D.K., Baptista, R., Kruglyak, L., Xu, S.H., et al. 1995. AnSTS-based map of the human genome. Science 270: 1945–1954.
Jurka, J. 2000. Repbase update: A database and an electronic journalof repetitive elements. Trends Genet. 16: 418–420.
Kelley, S. 2000. Getting started with Acedb. Brief Bioinform.1: 131–137.
Kent, W.J. 2002. BLAT the BLAT-like alignment tool. Gen. Res. 12:656–664.
Kent, W.J. and Haussler, D. 2001. Assembly of the working draft ofthe human genome with GigAssembler. Genome Res.11: 1541–1548.
Kent, W.J. and Zahler, A.M. 2000a. Conservation, regulation,synteny, and introns in a large-scale C. briggsae-C. elegansgenomic alignment. Genome Res. 10: 1115–1125.
——. 2000b. The intronerator: Exploring introns and alternativesplicing in C. elegans. Nucleic Acids Res. 28: 91–93.
Kirsch, I.R., Green, E.D., Yonescu, R., Strausberg, R., Carter, N.,Bentley, D., Leversha, M.A., Dunham, I., Braden, V.V.,Hilgenfeld, E., et al. 2000. A systematic, high-resolution linkageof the cytogenetic and physical maps of the human genome.Nat. Genet. 24: 339–340.
Kulp, D., Haussler, D., Reese, M.G., and Eeckman, F.H. 1996. Ageneralized hidden Markov model for the recognition of humangenes in DNA. Ismb 4: 134–142.
——. 1997. Integrating database homology in a probabilistic genestructure model. Pac. Symp. Biocomput. 232–244.
Lal, A., Lash, A.E., Altschul, S.F., Velculescu, V., Zhang, L.,McLendon, R.E., Marra, M.A., Prange, C., Morin, P.J., Polyak, K.,et al. 1999. A public database for gene expression in humancancers. Cancer Res. 59: 5403–5407.
Lash, A.E., Tolstoshev, C.M., Wagner, L., Schuler, G.D., Strausberg,R.L., Riggins, G.J., and Altschul, S.F. 2000. SAGEmap: A publicgene expression resource. Genome Res. 10: 1051–1060.
Maglott, D.R., Katz, K.S., Sicotte, H., and Pruitt, K.D. 2000. NCBI’sLocusLink and RefSeq. Nucleic Acids Res. 28: 126–128.
McPherson, J.D., Marra, M., Hillier, L., Waterston, R.H., Chinwalla,A., Wallis, J., Sekhon, M., Wylie, K., Mardis, E.R., Wilson, R.K., etal. 2001. A physical map of the human genome. Nature409: 934–941.
Mitelman, F. 1995. An international system for human cytogeneticnomenclature. S. Karger, Basel.
Pruitt, K.D. and Maglott, D.R. 2001. RefSeq and LocusLink: NCBIgene-centered resources. Nucleic Acids Res. 29: 137–140.
Roest Crollius, H., Jaillon, O., Bernot, A., Dasilva, C., Bouneau, L.,Fischer, C., Fizames, C., Wincker, P., Brottier, P., Quetier, F., etal. 2000. Estimate of human gene number provided bygenome-wide analysis using Tetraodon nigroviridis DNA sequence.Nat. Genet. 25: 235–238.
Sachidanandam, R., Weissman, D., Schmidt, S.C., Kakol, J.M., Stein,L.D., Marth, G., Sherry, S., Mullikin, J.C., Mortimore, B.J., Willey,W.L., et al. 2001. A map of human genome sequence variationcontaining 1.42 million single nucleotide polymorphisms. Nature409: 928–933.
Salamov, A.A. and Solovyev, V.V. 2000. Ab initio gene finding inDrosophila genomic DNA. Genome Res. 10: 516–522.
Schuler, G.D. 1998. Electronic PCR: Bridging the gap betweengenome mapping and genome sequencing. Trends Biotechnol.16: 456–459.
Shoemaker, D.D., Schadt, E.E., Armour, C.D., He, Y.D.,
UCSC Human Genome Browser
Genome Research 1005www.genome.org
Garrett-Engele, P., McDonagh, P.D., Loerch, P.M., Leonardson,A., Lum, P.Y., Cavet, G., et al. 2001. Experimental annotation ofthe human genome using microarray technology. Nature409: 922–927.
Smit, A.F. 1999. Interspersed repeats and other mementos oftransposable elements in mammalian genomes. Curr. Opin. Genet.Dev. 9: 657–663.
Stein, L., Sternberg, P., Durbin, R., Thierry-Mieg, J., and Spieth, J.2001. WormBase: Network access to the genome and biology ofCaenorhabditis elegans. Nucleic Acids Res. 29: 82–86.
Trask, B. 1999. Genome analysis: A laboratory manual. Cold SpringHarbor Press, Cold Spring Harbor, New York.
WEB SITE REFERENCEShttp://genome.ucsc.edu; The UCSC Human Genome Browser. A web
tool for display of any requested portion of the genome at anyscale, together with several dozen aligned annotation tracks.
http://shgc-www.stanford.edu/Mapping/TNGMAPS/; Radiationhybrid maps at Stanford University.
http://genome-www.stanford.edu/Saccharomyces/; TheSaccharomyces Genome Database (SGD) at Stanford University.
http://www.biodas.org; Distributed Annotation System web site.http://www.cse.ucsc.edu/∼kent/intronerator; C. elegans genome
browser with an emphasis on alternative splicing.http://www.ensembl.org; Ensembl human genome browser.http://www.ncbi.nlm.nih.gov/genome/guide/human/; A page with
links to NCBI’s human genome-specific resources.http://www.sanger.ac.uk/Software/formats/GFF; Description of the
Gene Finder Format (GFF).www.mysql.com; The main web site for the MySQL database.
Received December 19, 2001; accepted in revised form April 3, 2002.
Kent et al.
1006 Genome Researchwww.genome.org
Related Documents