Copyright @ 2006 by the American College of Sports Medicine. Unauthorized reproduction of this article is prohibited. SPECIAL REPORT The Human Gene Map for Performance and Health-Related Fitness Phenotypes: The 2005 Update TUOMO RANKINEN 1 , MOLLY S. BRAY 2 , JAMES M. HAGBERG 3 , LOUIS PE ´ RUSSE 4 , STEPHEN M. ROTH 3 , BERND WOLFARTH 5 , and CLAUDE BOUCHARD 1 1 Human Genomics Laboratory, Pennington Biomedical Research Center, Baton Rouge, LA; 2 Children_s Nutrition Research Center, Baylor College of Medicine, Houston, TX; 3 Department of Kinesiology, College of Health and Human Performance, University of Maryland, College Park, MD; 4 Division of Kinesiology, Department of Preventive Medicine, Laval University, Ste-Foy, Que´bec, CANADA; and 5 Preventive and Rehabilitative Sports Medicine, Technical University Munich, Munich, GERMANY ABSTRACT RANKINEN, T., M. S. BRAY, J. M. HAGBERG, L. PE ´ RUSSE, S. M. ROTH, B. WOLFARTH, and C. BOUCHARD. The Human Gene Map for Performance and Health-Related Fitness Phenotypes: The 2005 Update. Med. Sci. Sports Exerc., Vol. 38, No. 11, pp. 1863–1888, 2006. The current review presents the 2005 update of the human gene map for physical performance and health- related fitness phenotypes. It is based on peer-reviewed papers published by the end of 2005. The genes and markers with evidence of association or linkage with a performance or fitness phenotype in sedentary or active people, in adaptation to acute exercise, or for training-induced changes are positioned on the genetic map of all autosomes and the X chromosome. Negative studies are reviewed, but a gene or locus must be supported by at least one positive study before being inserted on the map. By the end of 2000, in the early version of the gene map, 29 loci were depicted. In contrast, the 2005 human gene map for physical performance and health-related phenotypes includes 165 autosomal gene entries and QTL, plus five others on the X chromosome. Moreover, there are 17 mitochondrial genes in which sequence variants have been shown to influence relevant fitness and performance phenotypes. Thus, the map is growing in complexity. Unfortunately, progress is slow in the field of genetics of fitness and performance, primarily because the number of laboratories and scientists focused on the role of genes and sequence variations in exercise-related traits continues to be quite limited. Key Words: CANDIDATE GENES, QUANTITATIVE TRAIT LOCI, LINKAGE, GENETIC VARIANTS, MITOCHON- DRIAL GENOME, NUCLEAR GENOME, GENETICS T his paper constitutes the sixth installment in the series on the human gene map for performance and health-related fitness phenotypes published in this journal. It covers the peer-reviewed literature published by the end of December 2005. The search for relevant publications is primarily based on the journals available in MEDLINE, the National Library of Medicine_s pub- lication database covering the fields of Life Sciences, biomedicine, and health, using a combination of key words (e.g., exercise, physical activity, performance, training, genetics, genotype, polymorphism, mutation, linkage). Other sources include personal reprint collections of the authors and documents made available to us by colleagues who are publishing in this field. The electronic prepubli- cations, that is, articles that are made available on the Web site of a journal before being published in print, are not included in the current review. The goal of the human gene map for fitness and performance is to review all genetic loci and markers shown to be related to physical perfor- mance or health-related fitness phenotypes in at least one study. Negative studies are briefly reviewed for a balanced presentation of the evidence. However, the nonsignificant results are not incorporated in the summary tables. The physical performance phenotypes for which genetic data are available include cardiorespiratory endurance, elite endurance athlete status, muscle strength, other muscle performance traits, and exercise intolerance of variable degrees. Consistent with the previous reviews, the pheno- types of health-related fitness retained are grouped under the following categories: hemodynamic traits including exer- cise heart rate, blood pressure and heart morphology; Address for correspondence: Claude Bouchard, PhD, Human Genomics Laboratory, Pennington Biomedical Research Center, 6400 Perkins Road, Baton Rouge, LA 70808-4124; E-mail: [email protected]. Submitted for publication April 2006. Accepted for publication May 2006. 0195-9131/06/3811-1863/0 MEDICINE & SCIENCE IN SPORTS & EXERCISE Ò Copyright Ó 2006 by the American College of Sports Medicine DOI: 10.1249/01.mss.0000233789.01164.4f 1863

Welcome message from author
This document is posted to help you gain knowledge. Please leave a comment to let me know what you think about it! Share it to your friends and learn new things together.
Transcript
Copyright @ 2006 by the American College of Sports Medicine. Unauthorized reproduction of this article is prohibited.
SPECIAL REPORT
The Human Gene Map for Performanceand Health-Related Fitness Phenotypes:The 2005 Update
TUOMO RANKINEN1, MOLLY S. BRAY2, JAMES M. HAGBERG3, LOUIS PERUSSE4, STEPHEN M. ROTH3,BERND WOLFARTH5, and CLAUDE BOUCHARD1
1Human Genomics Laboratory, Pennington Biomedical Research Center, Baton Rouge, LA; 2Children_s Nutrition ResearchCenter, Baylor College of Medicine, Houston, TX; 3Department of Kinesiology, College of Health and Human Performance,University of Maryland, College Park, MD; 4Division of Kinesiology, Department of Preventive Medicine, Laval University,Ste-Foy, Quebec, CANADA; and 5Preventive and Rehabilitative Sports Medicine, Technical University Munich, Munich,GERMANY
ABSTRACT
RANKINEN, T., M. S. BRAY, J. M. HAGBERG, L. PERUSSE, S. M. ROTH, B. WOLFARTH, and C. BOUCHARD. The Human
Gene Map for Performance and Health-Related Fitness Phenotypes: The 2005 Update. Med. Sci. Sports Exerc., Vol. 38, No. 11,
pp. 1863–1888, 2006. The current review presents the 2005 update of the human gene map for physical performance and health-
related fitness phenotypes. It is based on peer-reviewed papers published by the end of 2005. The genes and markers with evidence of
association or linkage with a performance or fitness phenotype in sedentary or active people, in adaptation to acute exercise, or for
training-induced changes are positioned on the genetic map of all autosomes and the X chromosome. Negative studies are reviewed, but a
gene or locus must be supported by at least one positive study before being inserted on the map. By the end of 2000, in the early version of
the gene map, 29 loci were depicted. In contrast, the 2005 human gene map for physical performance and health-related phenotypes
includes 165 autosomal gene entries and QTL, plus five others on the X chromosome. Moreover, there are 17 mitochondrial genes in
which sequence variants have been shown to influence relevant fitness and performance phenotypes. Thus, the map is growing in
complexity. Unfortunately, progress is slow in the field of genetics of fitness and performance, primarily because the number of
laboratories and scientists focused on the role of genes and sequence variations in exercise-related traits continues to be quite
limited. Key Words: CANDIDATE GENES, QUANTITATIVE TRAIT LOCI, LINKAGE, GENETIC VARIANTS, MITOCHON-
DRIAL GENOME, NUCLEAR GENOME, GENETICS
This paper constitutes the sixth installment in the
series on the human gene map for performance and
health-related fitness phenotypes published in this
journal. It covers the peer-reviewed literature published by
the end of December 2005. The search for relevant
publications is primarily based on the journals available
in MEDLINE, the National Library of Medicine_s pub-
lication database covering the fields of Life Sciences,
biomedicine, and health, using a combination of key words
(e.g., exercise, physical activity, performance, training,
genetics, genotype, polymorphism, mutation, linkage).
Other sources include personal reprint collections of the
authors and documents made available to us by colleagues
who are publishing in this field. The electronic prepubli-
cations, that is, articles that are made available on the Web
site of a journal before being published in print, are not
included in the current review. The goal of the human gene
map for fitness and performance is to review all genetic
loci and markers shown to be related to physical perfor-
mance or health-related fitness phenotypes in at least one
study. Negative studies are briefly reviewed for a balanced
presentation of the evidence. However, the nonsignificant
results are not incorporated in the summary tables.
The physical performance phenotypes for which genetic
data are available include cardiorespiratory endurance, elite
endurance athlete status, muscle strength, other muscle
performance traits, and exercise intolerance of variable
degrees. Consistent with the previous reviews, the pheno-
types of health-related fitness retained are grouped under the
following categories: hemodynamic traits including exer-
cise heart rate, blood pressure and heart morphology;
Address for correspondence: Claude Bouchard, PhD, Human Genomics
Laboratory, Pennington Biomedical Research Center, 6400 Perkins Road,
Baton Rouge, LA 70808-4124; E-mail: [email protected].
Submitted for publication April 2006.
Accepted for publication May 2006.
0195-9131/06/3811-1863/0
MEDICINE & SCIENCE IN SPORTS & EXERCISE�
Copyright � 2006 by the American College of Sports Medicine
DOI: 10.1249/01.mss.0000233789.01164.4f
1863
Copyright @ 2006 by the American College of Sports Medicine. Unauthorized reproduction of this article is prohibited.
anthropometry and body composition; insulin and glucose
metabolism; and blood lipid, lipoprotein, and hemostatic
factors. Here, we are not concerned about the effects of
specific genes on these phenotypes unless the focus is on
exercise, exercise training, athletes, or active people
compared against controls or inactive individuals, or
exercise intolerance. This is particularly important for the
genetic studies that have focused on body mass index,
adiposity, fat-free mass, adipose tissue distribution, and
various abdominal fat phenotypes. If there were no exercise-
related issues in those studies, the papers are not considered
here. However, the interested reader can obtain a full
summary of these other studies in one of our complementary
papers published every year in Obesity Research under the
general theme of the status of the human obesity gene map.
The interested reader may also consult the following
electronic version of this other map (http://obesitygene.
pbrc.edu).
The studies incorporated in the review are fully referenced so
that the interested reader can access the original papers. Of
interest tosomecouldbetheearlyobservationsmadeonathletes,
particularly Olympic athletes. The results of these case-control
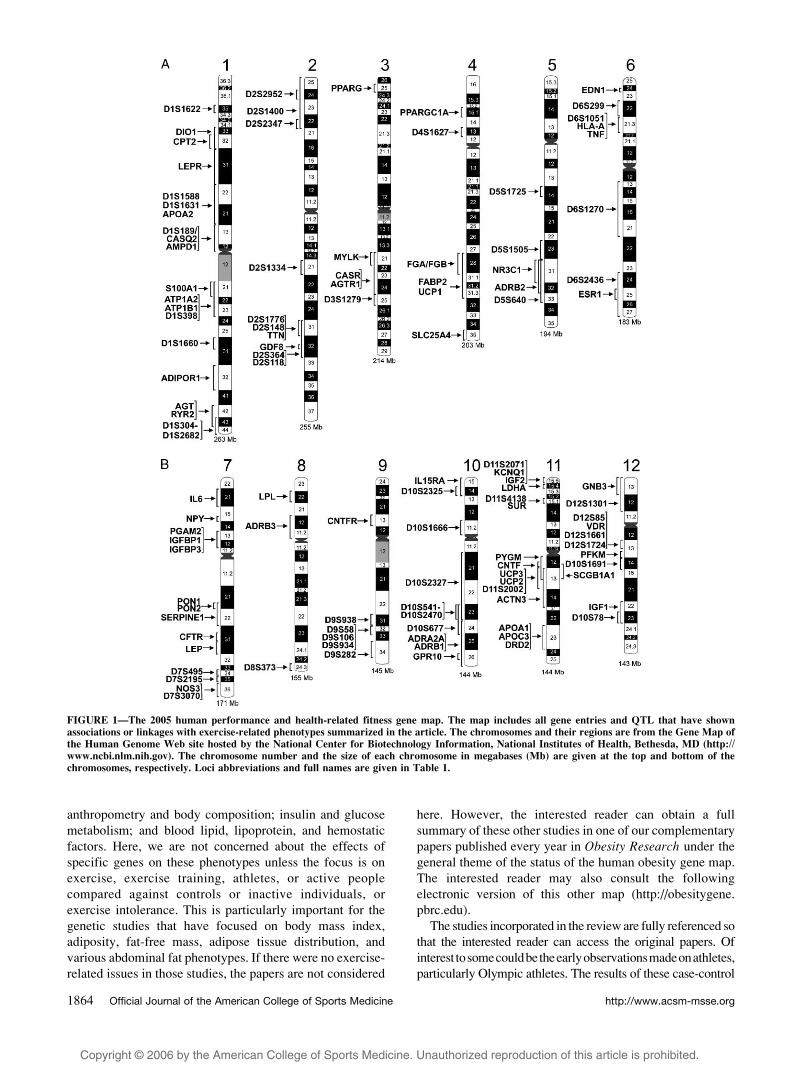
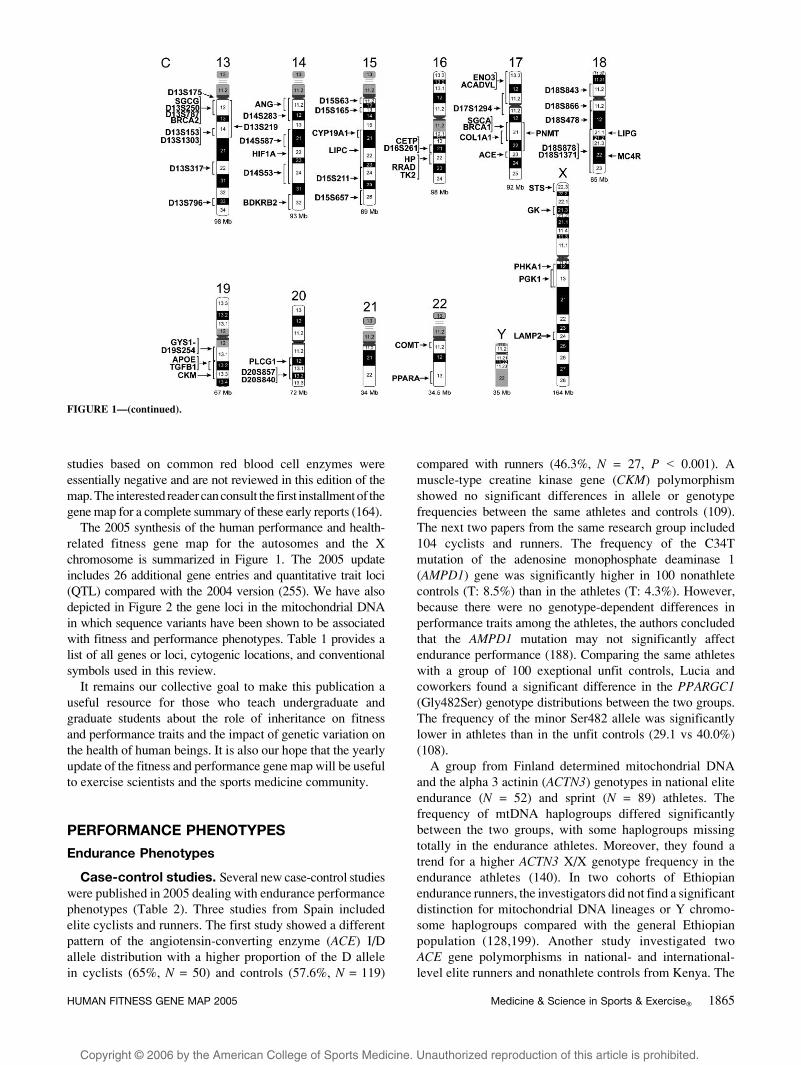
FIGURE 1—The 2005 human performance and health-related fitness gene map. The map includes all gene entries and QTL that have shown
associations or linkages with exercise-related phenotypes summarized in the article. The chromosomes and their regions are from the Gene Map of
the Human Genome Web site hosted by the National Center for Biotechnology Information, National Institutes of Health, Bethesda, MD (http://
www.ncbi.nlm.nih.gov). The chromosome number and the size of each chromosome in megabases (Mb) are given at the top and bottom of the
chromosomes, respectively. Loci abbreviations and full names are given in Table 1.
http://www.acsm-msse.org1864 Official Journal of the American College of Sports Medicine
Copyright @ 2006 by the American College of Sports Medicine. Unauthorized reproduction of this article is prohibited.
studies based on common red blood cell enzymes were
essentially negative and are not reviewed in this edition of the
map. The interested readercan consult the first installmentof the
gene map for a complete summary of these early reports (164).
The 2005 synthesis of the human performance and health-
related fitness gene map for the autosomes and the X
chromosome is summarized in Figure 1. The 2005 update
includes 26 additional gene entries and quantitative trait loci
(QTL) compared with the 2004 version (255). We have also
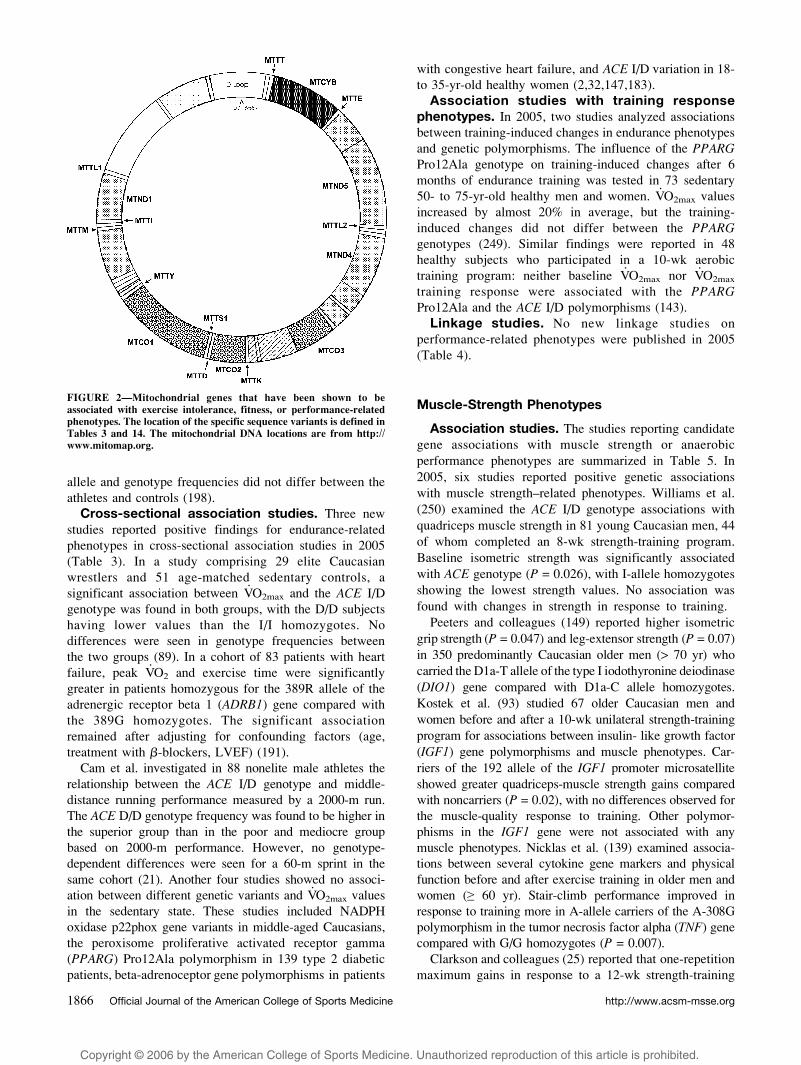
depicted in Figure 2 the gene loci in the mitochondrial DNA
in which sequence variants have been shown to be associated
with fitness and performance phenotypes. Table 1 provides a
list of all genes or loci, cytogenic locations, and conventional
symbols used in this review.
It remains our collective goal to make this publication a
useful resource for those who teach undergraduate and
graduate students about the role of inheritance on fitness
and performance traits and the impact of genetic variation on
the health of human beings. It is also our hope that the yearly
update of the fitness and performance gene map will be useful
to exercise scientists and the sports medicine community.
PERFORMANCE PHENOTYPES
Endurance Phenotypes
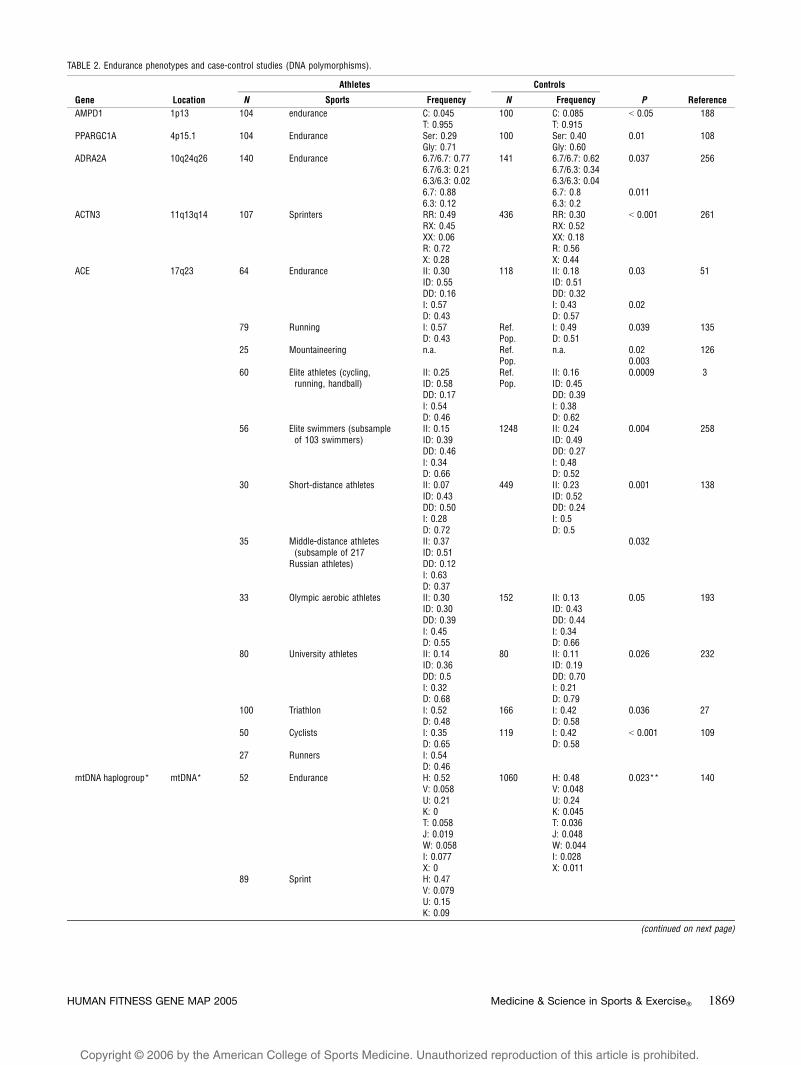
Case-control studies. Several new case-control studies
were published in 2005 dealing with endurance performance
phenotypes (Table 2). Three studies from Spain included
elite cyclists and runners. The first study showed a different
pattern of the angiotensin-converting enzyme (ACE) I/D
allele distribution with a higher proportion of the D allele
in cyclists (65%, N = 50) and controls (57.6%, N = 119)
compared with runners (46.3%, N = 27, P G 0.001). A
muscle-type creatine kinase gene (CKM) polymorphism
showed no significant differences in allele or genotype
frequencies between the same athletes and controls (109).
The next two papers from the same research group included
104 cyclists and runners. The frequency of the C34T
mutation of the adenosine monophosphate deaminase 1
(AMPD1) gene was significantly higher in 100 nonathlete
controls (T: 8.5%) than in the athletes (T: 4.3%). However,
because there were no genotype-dependent differences in
performance traits among the athletes, the authors concluded
that the AMPD1 mutation may not significantly affect
endurance performance (188). Comparing the same athletes
with a group of 100 exeptional unfit controls, Lucia and
coworkers found a significant difference in the PPARGC1(Gly482Ser) genotype distributions between the two groups.
The frequency of the minor Ser482 allele was significantly
lower in athletes than in the unfit controls (29.1 vs 40.0%)
(108).
A group from Finland determined mitochondrial DNA
and the alpha 3 actinin (ACTN3) genotypes in national elite
endurance (N = 52) and sprint (N = 89) athletes. The
frequency of mtDNA haplogroups differed significantly
between the two groups, with some haplogroups missing
totally in the endurance athletes. Moreover, they found a
trend for a higher ACTN3 X/X genotype frequency in the
endurance athletes (140). In two cohorts of Ethiopian
endurance runners, the investigators did not find a significant
distinction for mitochondrial DNA lineages or Y chromo-
some haplogroups compared with the general Ethiopian
population (128,199). Another study investigated two
ACE gene polymorphisms in national- and international-
level elite runners and nonathlete controls from Kenya. The
FIGURE 1—(continued).
HUMAN FITNESS GENE MAP 2005 Medicine & Science in Sports & Exercised 1865
Copyright @ 2006 by the American College of Sports Medicine. Unauthorized reproduction of this article is prohibited.
allele and genotype frequencies did not differ between the
athletes and controls (198).
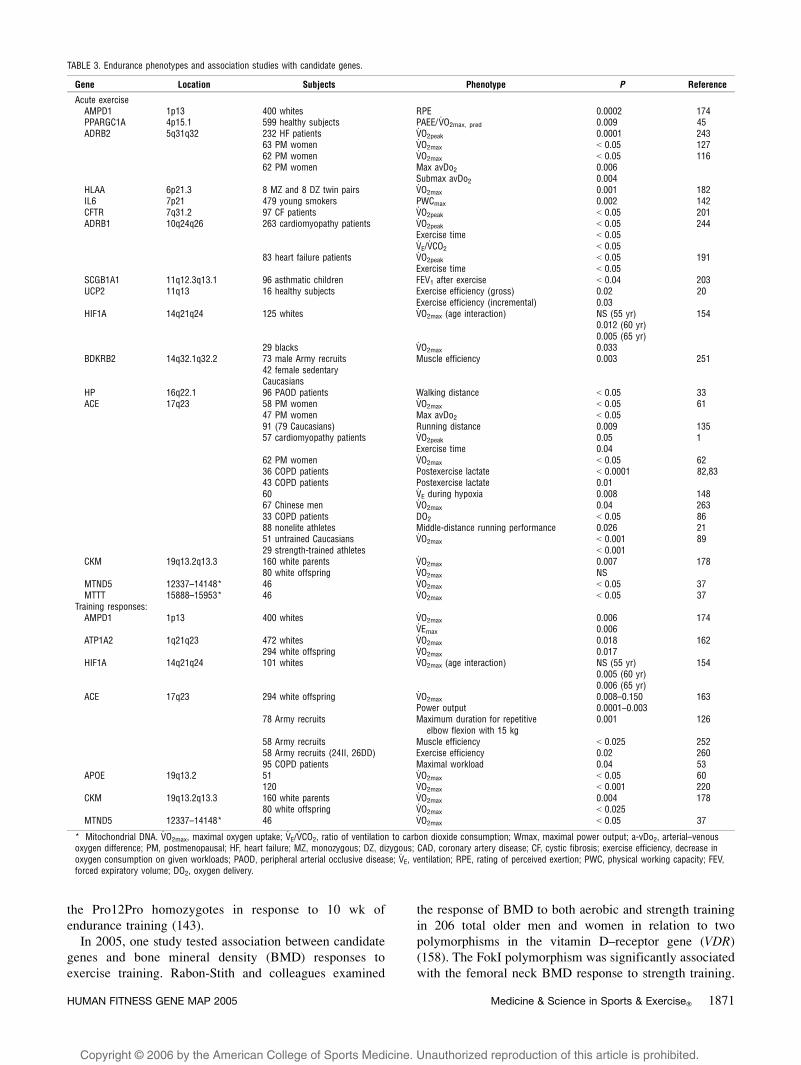
Cross-sectional association studies. Three new
studies reported positive findings for endurance-related
phenotypes in cross-sectional association studies in 2005
(Table 3). In a study comprising 29 elite Caucasian
wrestlers and 51 age-matched sedentary controls, a
significant association between V.O2max and the ACE I/D
genotype was found in both groups, with the D/D subjects
having lower values than the I/I homozygotes. No
differences were seen in genotype frequencies between
the two groups (89). In a cohort of 83 patients with heart
failure, peak V.O2 and exercise time were significantly
greater in patients homozygous for the 389R allele of the
adrenergic receptor beta 1 (ADRB1) gene compared with
the 389G homozygotes. The significant association
remained after adjusting for confounding factors (age,
treatment with A-blockers, LVEF) (191).
Cam et al. investigated in 88 nonelite male athletes the
relationship between the ACE I/D genotype and middle-
distance running performance measured by a 2000-m run.
The ACE D/D genotype frequency was found to be higher in
the superior group than in the poor and mediocre group
based on 2000-m performance. However, no genotype-
dependent differences were seen for a 60-m sprint in the
same cohort (21). Another four studies showed no associ-
ation between different genetic variants and V.O2max values
in the sedentary state. These studies included NADPH
oxidase p22phox gene variants in middle-aged Caucasians,
the peroxisome proliferative activated receptor gamma
(PPARG) Pro12Ala polymorphism in 139 type 2 diabetic
patients, beta-adrenoceptor gene polymorphisms in patients
with congestive heart failure, and ACE I/D variation in 18-
to 35-yr-old healthy women (2,32,147,183).
Association studies with training responsephenotypes. In 2005, two studies analyzed associations
between training-induced changes in endurance phenotypes
and genetic polymorphisms. The influence of the PPARGPro12Ala genotype on training-induced changes after 6
months of endurance training was tested in 73 sedentary
50- to 75-yr-old healthy men and women. V.O2max values
increased by almost 20% in average, but the training-
induced changes did not differ between the PPARGgenotypes (249). Similar findings were reported in 48
healthy subjects who participated in a 10-wk aerobic
training program: neither baseline V.O2max nor V
.O2max
training response were associated with the PPARGPro12Ala and the ACE I/D polymorphisms (143).
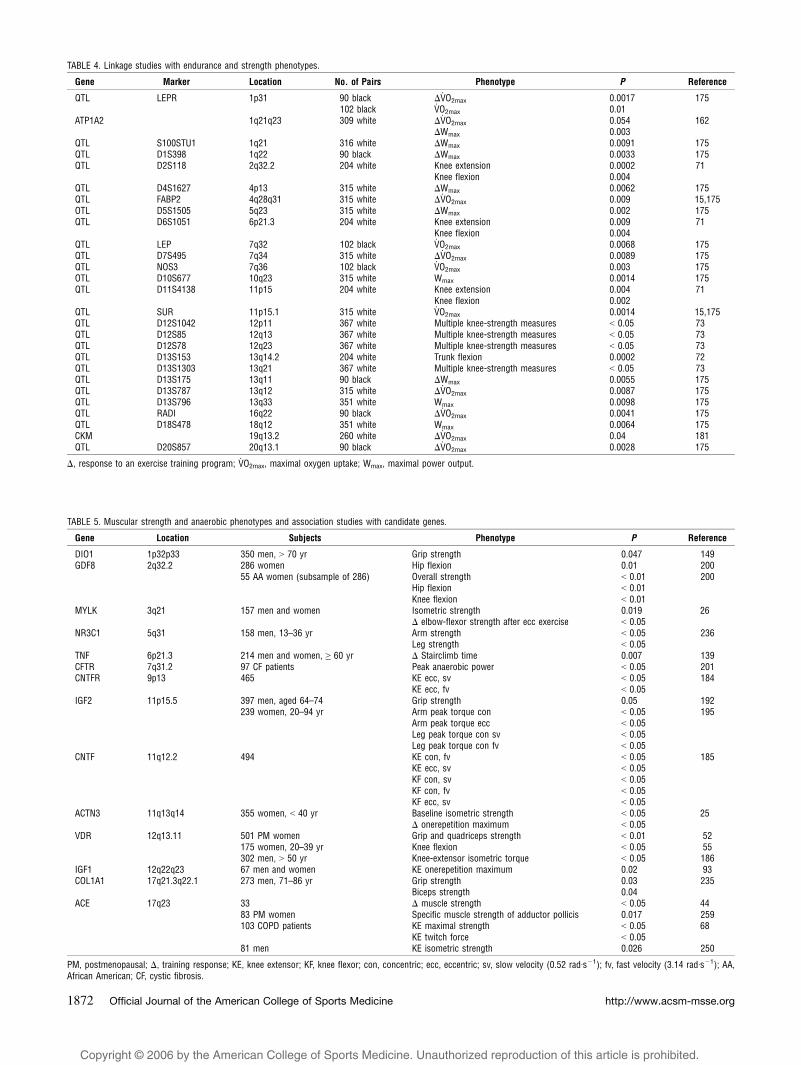
Linkage studies. No new linkage studies on
performance-related phenotypes were published in 2005
(Table 4).
Muscle-Strength Phenotypes
Association studies. The studies reporting candidate
gene associations with muscle strength or anaerobic
performance phenotypes are summarized in Table 5. In
2005, six studies reported positive genetic associations
with muscle strength–related phenotypes. Williams et al.
(250) examined the ACE I/D genotype associations with
quadriceps muscle strength in 81 young Caucasian men, 44
of whom completed an 8-wk strength-training program.
Baseline isometric strength was significantly associated
with ACE genotype (P = 0.026), with I-allele homozygotes
showing the lowest strength values. No association was
found with changes in strength in response to training.
Peeters and colleagues (149) reported higher isometric
grip strength (P = 0.047) and leg-extensor strength (P = 0.07)
in 350 predominantly Caucasian older men (> 70 yr) who
carried the D1a-T allele of the type I iodothyronine deiodinase
(DIO1) gene compared with D1a-C allele homozygotes.
Kostek et al. (93) studied 67 older Caucasian men and
women before and after a 10-wk unilateral strength-training
program for associations between insulin- like growth factor
(IGF1) gene polymorphisms and muscle phenotypes. Car-
riers of the 192 allele of the IGF1 promoter microsatellite
showed greater quadriceps-muscle strength gains compared
with noncarriers (P = 0.02), with no differences observed for
the muscle-quality response to training. Other polymor-
phisms in the IGF1 gene were not associated with any
muscle phenotypes. Nicklas et al. (139) examined associa-
tions between several cytokine gene markers and physical
function before and after exercise training in older men and
women (Q 60 yr). Stair-climb performance improved in
response to training more in A-allele carriers of the A-308G
polymorphism in the tumor necrosis factor alpha (TNF) gene
compared with G/G homozygotes (P = 0.007).
Clarkson and colleagues (25) reported that one-repetition
maximum gains in response to a 12-wk strength-training
FIGURE 2—Mitochondrial genes that have been shown to be
associated with exercise intolerance, fitness, or performance-related
phenotypes. The location of the specific sequence variants is defined in
Tables 3 and 14. The mitochondrial DNA locations are from http://
www.mitomap.org.
http://www.acsm-msse.org1866 Official Journal of the American College of Sports Medicine
Copyright @ 2006 by the American College of Sports Medicine. Unauthorized reproduction of this article is prohibited.
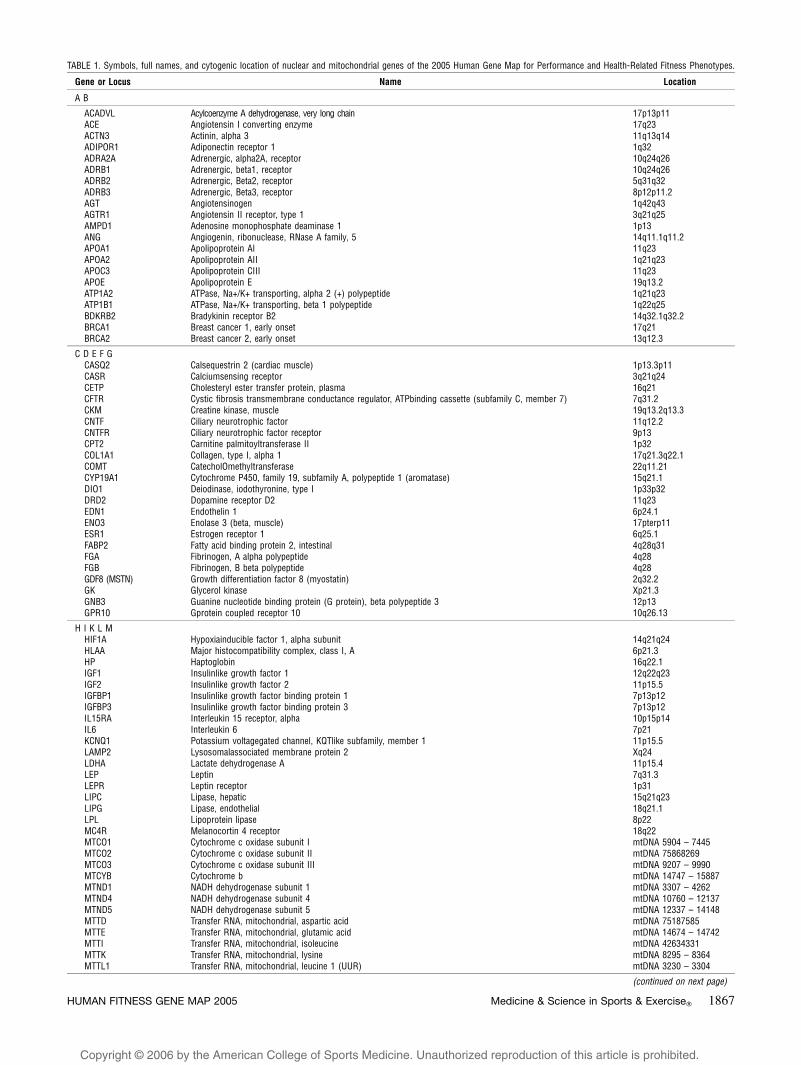
TABLE 1. Symbols, full names, and cytogenic location of nuclear and mitochondrial genes of the 2005 Human Gene Map for Performance and Health-Related Fitness Phenotypes.
Gene or Locus Name Location
A B
ACADVL Acylcoenzyme A dehydrogenase, very long chain 17p13p11ACE Angiotensin I converting enzyme 17q23ACTN3 Actinin, alpha 3 11q13q14ADIPOR1 Adiponectin receptor 1 1q32ADRA2A Adrenergic, alpha2A, receptor 10q24q26ADRB1 Adrenergic, beta1, receptor 10q24q26ADRB2 Adrenergic, Beta2, receptor 5q31q32ADRB3 Adrenergic, Beta3, receptor 8p12p11.2AGT Angiotensinogen 1q42q43AGTR1 Angiotensin II receptor, type 1 3q21q25AMPD1 Adenosine monophosphate deaminase 1 1p13ANG Angiogenin, ribonuclease, RNase A family, 5 14q11.1q11.2APOA1 Apolipoprotein AI 11q23APOA2 Apolipoprotein AII 1q21q23APOC3 Apolipoprotein CIII 11q23APOE Apolipoprotein E 19q13.2ATP1A2 ATPase, Na+/K+ transporting, alpha 2 (+) polypeptide 1q21q23ATP1B1 ATPase, Na+/K+ transporting, beta 1 polypeptide 1q22q25BDKRB2 Bradykinin receptor B2 14q32.1q32.2BRCA1 Breast cancer 1, early onset 17q21BRCA2 Breast cancer 2, early onset 13q12.3
C D E F GCASQ2 Calsequestrin 2 (cardiac muscle) 1p13.3p11CASR Calciumsensing receptor 3q21q24CETP Cholesteryl ester transfer protein, plasma 16q21CFTR Cystic fibrosis transmembrane conductance regulator, ATPbinding cassette (subfamily C, member 7) 7q31.2CKM Creatine kinase, muscle 19q13.2q13.3CNTF Ciliary neurotrophic factor 11q12.2CNTFR Ciliary neurotrophic factor receptor 9p13CPT2 Carnitine palmitoyltransferase II 1p32COL1A1 Collagen, type I, alpha 1 17q21.3q22.1COMT CatecholOmethyltransferase 22q11.21CYP19A1 Cytochrome P450, family 19, subfamily A, polypeptide 1 (aromatase) 15q21.1DIO1 Deiodinase, iodothyronine, type I 1p33p32DRD2 Dopamine receptor D2 11q23EDN1 Endothelin 1 6p24.1ENO3 Enolase 3 (beta, muscle) 17pterp11ESR1 Estrogen receptor 1 6q25.1FABP2 Fatty acid binding protein 2, intestinal 4q28q31FGA Fibrinogen, A alpha polypeptide 4q28FGB Fibrinogen, B beta polypeptide 4q28GDF8 (MSTN) Growth differentiation factor 8 (myostatin) 2q32.2GK Glycerol kinase Xp21.3GNB3 Guanine nucleotide binding protein (G protein), beta polypeptide 3 12p13GPR10 Gprotein coupled receptor 10 10q26.13
H I K L MHIF1A Hypoxiainducible factor 1, alpha subunit 14q21q24HLAA Major histocompatibility complex, class I, A 6p21.3HP Haptoglobin 16q22.1IGF1 Insulinlike growth factor 1 12q22q23IGF2 Insulinlike growth factor 2 11p15.5IGFBP1 Insulinlike growth factor binding protein 1 7p13p12IGFBP3 Insulinlike growth factor binding protein 3 7p13p12IL15RA Interleukin 15 receptor, alpha 10p15p14IL6 Interleukin 6 7p21KCNQ1 Potassium voltagegated channel, KQTlike subfamily, member 1 11p15.5LAMP2 Lysosomalassociated membrane protein 2 Xq24LDHA Lactate dehydrogenase A 11p15.4LEP Leptin 7q31.3LEPR Leptin receptor 1p31LIPC Lipase, hepatic 15q21q23LIPG Lipase, endothelial 18q21.1LPL Lipoprotein lipase 8p22MC4R Melanocortin 4 receptor 18q22MTCO1 Cytochrome c oxidase subunit I mtDNA 5904 – 7445MTCO2 Cytochrome c oxidase subunit II mtDNA 75868269MTCO3 Cytochrome c oxidase subunit III mtDNA 9207 – 9990MTCYB Cytochrome b mtDNA 14747 – 15887MTND1 NADH dehydrogenase subunit 1 mtDNA 3307 – 4262MTND4 NADH dehydrogenase subunit 4 mtDNA 10760 – 12137MTND5 NADH dehydrogenase subunit 5 mtDNA 12337 – 14148MTTD Transfer RNA, mitochondrial, aspartic acid mtDNA 75187585MTTE Transfer RNA, mitochondrial, glutamic acid mtDNA 14674 – 14742MTTI Transfer RNA, mitochondrial, isoleucine mtDNA 42634331MTTK Transfer RNA, mitochondrial, lysine mtDNA 8295 – 8364MTTL1 Transfer RNA, mitochondrial, leucine 1 (UUR) mtDNA 3230 – 3304
(continued on next page)
HUMAN FITNESS GENE MAP 2005 Medicine & Science in Sports & Exercised 1867
Copyright @ 2006 by the American College of Sports Medicine. Unauthorized reproduction of this article is prohibited.
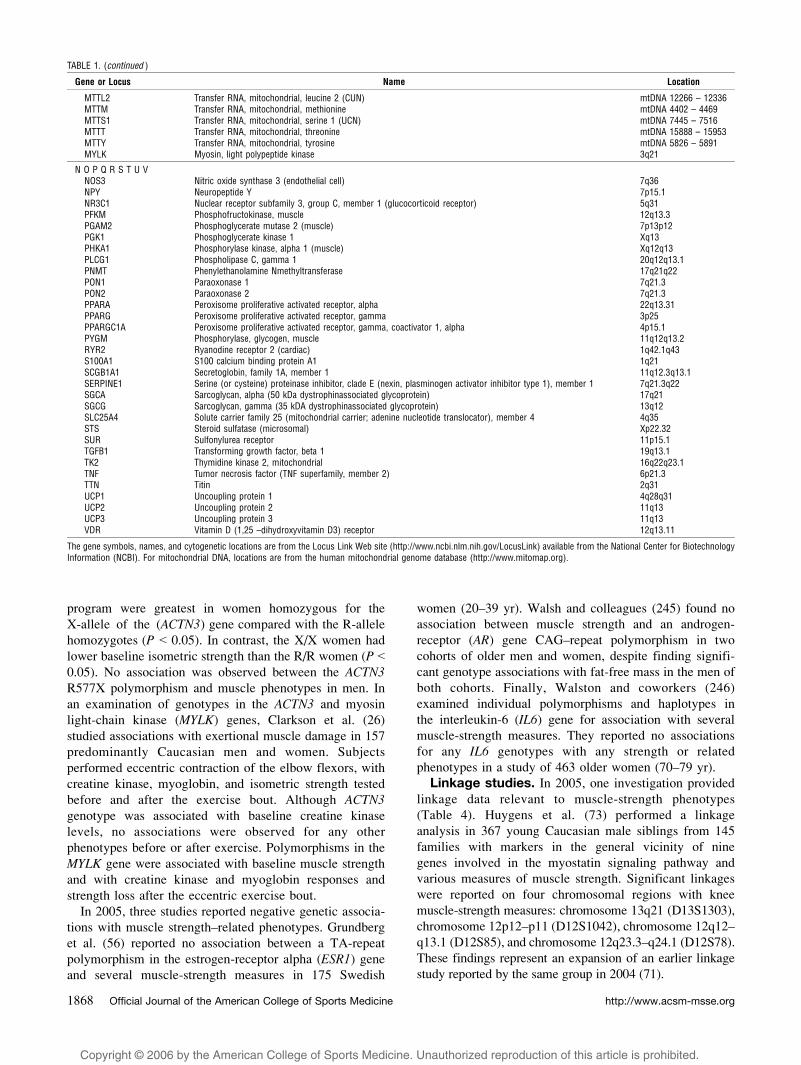
program were greatest in women homozygous for the
X-allele of the (ACTN3) gene compared with the R-allele
homozygotes (P G 0.05). In contrast, the X/X women had
lower baseline isometric strength than the R/R women (P G0.05). No association was observed between the ACTN3R577X polymorphism and muscle phenotypes in men. In
an examination of genotypes in the ACTN3 and myosin
light-chain kinase (MYLK) genes, Clarkson et al. (26)
studied associations with exertional muscle damage in 157
predominantly Caucasian men and women. Subjects
performed eccentric contraction of the elbow flexors, with
creatine kinase, myoglobin, and isometric strength tested
before and after the exercise bout. Although ACTN3genotype was associated with baseline creatine kinase
levels, no associations were observed for any other
phenotypes before or after exercise. Polymorphisms in the
MYLK gene were associated with baseline muscle strength
and with creatine kinase and myoglobin responses and
strength loss after the eccentric exercise bout.
In 2005, three studies reported negative genetic associa-
tions with muscle strength–related phenotypes. Grundberg
et al. (56) reported no association between a TA-repeat
polymorphism in the estrogen-receptor alpha (ESR1) gene
and several muscle-strength measures in 175 Swedish
women (20–39 yr). Walsh and colleagues (245) found no
association between muscle strength and an androgen-
receptor (AR) gene CAG–repeat polymorphism in two
cohorts of older men and women, despite finding signifi-
cant genotype associations with fat-free mass in the men of
both cohorts. Finally, Walston and coworkers (246)
examined individual polymorphisms and haplotypes in
the interleukin-6 (IL6) gene for association with several
muscle-strength measures. They reported no associations
for any IL6 genotypes with any strength or related
phenotypes in a study of 463 older women (70–79 yr).
Linkage studies. In 2005, one investigation provided
linkage data relevant to muscle-strength phenotypes
(Table 4). Huygens et al. (73) performed a linkage
analysis in 367 young Caucasian male siblings from 145
families with markers in the general vicinity of nine
genes involved in the myostatin signaling pathway and
various measures of muscle strength. Significant linkages
were reported on four chromosomal regions with knee
muscle-strength measures: chromosome 13q21 (D13S1303),
chromosome 12p12–p11 (D12S1042), chromosome 12q12–
q13.1 (D12S85), and chromosome 12q23.3–q24.1 (D12S78).
These findings represent an expansion of an earlier linkage
study reported by the same group in 2004 (71).
TABLE 1. (continued )
Gene or Locus Name Location
MTTL2 Transfer RNA, mitochondrial, leucine 2 (CUN) mtDNA 12266 – 12336MTTM Transfer RNA, mitochondrial, methionine mtDNA 4402 – 4469MTTS1 Transfer RNA, mitochondrial, serine 1 (UCN) mtDNA 7445 – 7516MTTT Transfer RNA, mitochondrial, threonine mtDNA 15888 – 15953MTTY Transfer RNA, mitochondrial, tyrosine mtDNA 5826 – 5891MYLK Myosin, light polypeptide kinase 3q21
N O P Q R S T U VNOS3 Nitric oxide synthase 3 (endothelial cell) 7q36NPY Neuropeptide Y 7p15.1NR3C1 Nuclear receptor subfamily 3, group C, member 1 (glucocorticoid receptor) 5q31PFKM Phosphofructokinase, muscle 12q13.3PGAM2 Phosphoglycerate mutase 2 (muscle) 7p13p12PGK1 Phosphoglycerate kinase 1 Xq13PHKA1 Phosphorylase kinase, alpha 1 (muscle) Xq12q13PLCG1 Phospholipase C, gamma 1 20q12q13.1PNMT Phenylethanolamine Nmethyltransferase 17q21q22PON1 Paraoxonase 1 7q21.3PON2 Paraoxonase 2 7q21.3PPARA Peroxisome proliferative activated receptor, alpha 22q13.31PPARG Peroxisome proliferative activated receptor, gamma 3p25PPARGC1A Peroxisome proliferative activated receptor, gamma, coactivator 1, alpha 4p15.1PYGM Phosphorylase, glycogen, muscle 11q12q13.2RYR2 Ryanodine receptor 2 (cardiac) 1q42.1q43S100A1 S100 calcium binding protein A1 1q21SCGB1A1 Secretoglobin, family 1A, member 1 11q12.3q13.1SERPINE1 Serine (or cysteine) proteinase inhibitor, clade E (nexin, plasminogen activator inhibitor type 1), member 1 7q21.3q22SGCA Sarcoglycan, alpha (50 kDa dystrophinassociated glycoprotein) 17q21SGCG Sarcoglycan, gamma (35 kDA dystrophinassociated glycoprotein) 13q12SLC25A4 Solute carrier family 25 (mitochondrial carrier; adenine nucleotide translocator), member 4 4q35STS Steroid sulfatase (microsomal) Xp22.32SUR Sulfonylurea receptor 11p15.1TGFB1 Transforming growth factor, beta 1 19q13.1TK2 Thymidine kinase 2, mitochondrial 16q22q23.1TNF Tumor necrosis factor (TNF superfamily, member 2) 6p21.3TTN Titin 2q31UCP1 Uncoupling protein 1 4q28q31UCP2 Uncoupling protein 2 11q13UCP3 Uncoupling protein 3 11q13VDR Vitamin D (1,25 –dihydroxyvitamin D3) receptor 12q13.11
The gene symbols, names, and cytogenetic locations are from the Locus Link Web site (http://www.ncbi.nlm.nih.gov/LocusLink) available from the National Center for BiotechnologyInformation (NCBI). For mitochondrial DNA, locations are from the human mitochondrial genome database (http://www.mitomap.org).
http://www.acsm-msse.org1868 Official Journal of the American College of Sports Medicine
Copyright @ 2006 by the American College of Sports Medicine. Unauthorized reproduction of this article is prohibited.
TABLE 2. Endurance phenotypes and case-control studies (DNA polymorphisms).
Gene Location
Athletes Controls
P ReferenceN Sports Frequency N Frequency
AMPD1 1p13 104 endurance C: 0.045 100 C: 0.085 G 0.05 188T: 0.955 T: 0.915
PPARGC1A 4p15.1 104 Endurance Ser: 0.29 100 Ser: 0.40 0.01 108Gly: 0.71 Gly: 0.60
ADRA2A 10q24q26 140 Endurance 6.7/6.7: 0.77 141 6.7/6.7: 0.62 0.037 2566.7/6.3: 0.21 6.7/6.3: 0.346.3/6.3: 0.02 6.3/6.3: 0.046.7: 0.88 6.7: 0.8 0.0116.3: 0.12 6.3: 0.2
ACTN3 11q13q14 107 Sprinters RR: 0.49 436 RR: 0.30 G 0.001 261RX: 0.45 RX: 0.52XX: 0.06 XX: 0.18R: 0.72 R: 0.56X: 0.28 X: 0.44
ACE 17q23 64 Endurance II: 0.30 118 II: 0.18 0.03 51ID: 0.55 ID: 0.51DD: 0.16 DD: 0.32I: 0.57 I: 0.43 0.02D: 0.43 D: 0.57
79 Running I: 0.57 Ref. I: 0.49 0.039 135D: 0.43 Pop. D: 0.51
25 Mountaineering n.a. Ref. n.a. 0.02 126Pop. 0.003
60 Elite athletes (cycling,running, handball)
II: 0.25 Ref. II: 0.16 0.0009 3ID: 0.58DD: 0.17I: 0.54D: 0.46
Pop. ID: 0.45DD: 0.39I: 0.38D: 0.62
56 Elite swimmers (subsampleof 103 swimmers)
II: 0.15ID: 0.39
1248 II: 0.24ID: 0.49
0.004 258
DD: 0.46 DD: 0.27I: 0.34 I: 0.48D: 0.66 D: 0.52
30 Short-distance athletes II: 0.07 449 II: 0.23 0.001 138ID: 0.43 ID: 0.52DD: 0.50 DD: 0.24I: 0.28 I: 0.5D: 0.72 D: 0.5
35 Middle-distance athletes(subsample of 217
Russian athletes)
II: 0.37 0.032ID: 0.51DD: 0.12I: 0.63D: 0.37
33 Olympic aerobic athletes II: 0.30 152 II: 0.13 0.05 193ID: 0.30 ID: 0.43DD: 0.39 DD: 0.44I: 0.45 I: 0.34D: 0.55 D: 0.66
80 University athletes II: 0.14 80 II: 0.11 0.026 232ID: 0.36 ID: 0.19DD: 0.5 DD: 0.70I: 0.32 I: 0.21D: 0.68 D: 0.79
100 Triathlon I: 0.52 166 I: 0.42 0.036 27D: 0.48 D: 0.58
50 Cyclists I: 0.35 119 I: 0.42 G 0.001 109D: 0.65 D: 0.58
27 Runners I: 0.54D: 0.46
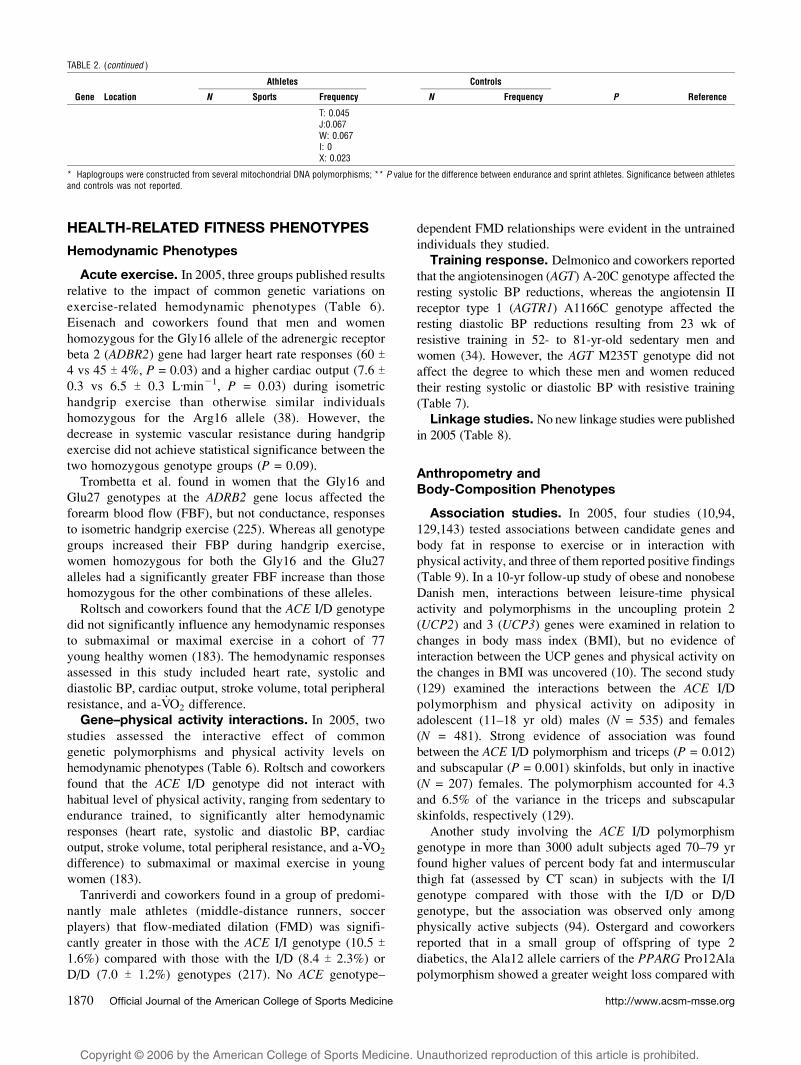
mtDNA haplogroup* mtDNA* 52 Endurance H: 0.52 1060 H: 0.48 0.023** 140V: 0.058 V: 0.048U: 0.21 U: 0.24K: 0 K: 0.045T: 0.058 T: 0.036J: 0.019 J: 0.048W: 0.058 W: 0.044I: 0.077 I: 0.028X: 0 X: 0.011
89 Sprint H: 0.47V: 0.079U: 0.15K: 0.09
(continued on next page)
HUMAN FITNESS GENE MAP 2005 Medicine & Science in Sports & Exercised 1869
Copyright @ 2006 by the American College of Sports Medicine. Unauthorized reproduction of this article is prohibited.
HEALTH-RELATED FITNESS PHENOTYPES
Hemodynamic Phenotypes
Acute exercise. In 2005, three groups published results
relative to the impact of common genetic variations on
exercise-related hemodynamic phenotypes (Table 6).
Eisenach and coworkers found that men and women
homozygous for the Gly16 allele of the adrenergic receptor
beta 2 (ADBR2) gene had larger heart rate responses (60 T4 vs 45 T 4%, P = 0.03) and a higher cardiac output (7.6 T0.3 vs 6.5 T 0.3 LIminj1, P = 0.03) during isometric
handgrip exercise than otherwise similar individuals
homozygous for the Arg16 allele (38). However, the
decrease in systemic vascular resistance during handgrip
exercise did not achieve statistical significance between the
two homozygous genotype groups (P = 0.09).
Trombetta et al. found in women that the Gly16 and
Glu27 genotypes at the ADRB2 gene locus affected the
forearm blood flow (FBF), but not conductance, responses
to isometric handgrip exercise (225). Whereas all genotype
groups increased their FBP during handgrip exercise,
women homozygous for both the Gly16 and the Glu27
alleles had a significantly greater FBF increase than those
homozygous for the other combinations of these alleles.
Roltsch and coworkers found that the ACE I/D genotype
did not significantly influence any hemodynamic responses
to submaximal or maximal exercise in a cohort of 77
young healthy women (183). The hemodynamic responses
assessed in this study included heart rate, systolic and
diastolic BP, cardiac output, stroke volume, total peripheral
resistance, and a-V.O2 difference.
Gene–physical activity interactions. In 2005, two
studies assessed the interactive effect of common
genetic polymorphisms and physical activity levels on
hemodynamic phenotypes (Table 6). Roltsch and coworkers
found that the ACE I/D genotype did not interact with
habitual level of physical activity, ranging from sedentary to
endurance trained, to significantly alter hemodynamic
responses (heart rate, systolic and diastolic BP, cardiac
output, stroke volume, total peripheral resistance, and a-V.O2
difference) to submaximal or maximal exercise in young
women (183).
Tanriverdi and coworkers found in a group of predomi-
nantly male athletes (middle-distance runners, soccer
players) that flow-mediated dilation (FMD) was signifi-
cantly greater in those with the ACE I/I genotype (10.5 T1.6%) compared with those with the I/D (8.4 T 2.3%) or
D/D (7.0 T 1.2%) genotypes (217). No ACE genotype–
dependent FMD relationships were evident in the untrained
individuals they studied.
Training response. Delmonico and coworkers reported
that the angiotensinogen (AGT) A-20C genotype affected the
resting systolic BP reductions, whereas the angiotensin II
receptor type 1 (AGTR1) A1166C genotype affected the
resting diastolic BP reductions resulting from 23 wk of
resistive training in 52- to 81-yr-old sedentary men and
women (34). However, the AGT M235T genotype did not
affect the degree to which these men and women reduced
their resting systolic or diastolic BP with resistive training
(Table 7).
Linkage studies. No new linkage studies were published
in 2005 (Table 8).
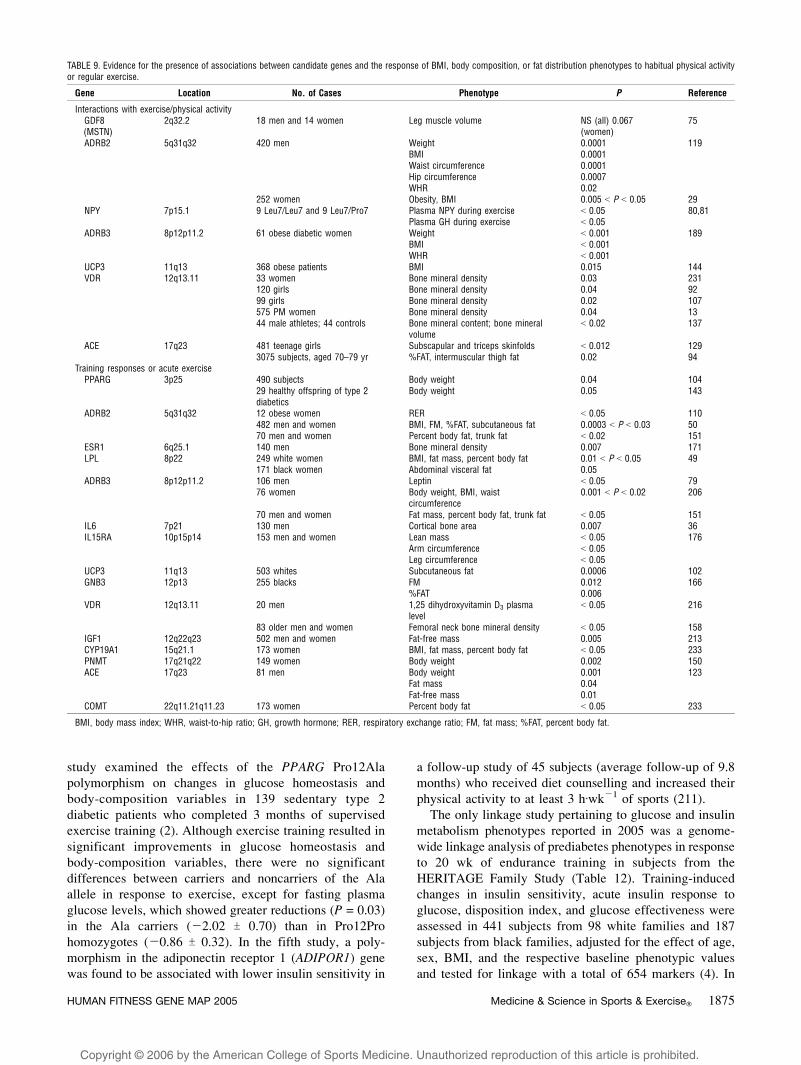
Anthropometry andBody-Composition Phenotypes
Association studies. In 2005, four studies (10,94,
129,143) tested associations between candidate genes and
body fat in response to exercise or in interaction with
physical activity, and three of them reported positive findings
(Table 9). In a 10-yr follow-up study of obese and nonobese
Danish men, interactions between leisure-time physical
activity and polymorphisms in the uncoupling protein 2
(UCP2) and 3 (UCP3) genes were examined in relation to
changes in body mass index (BMI), but no evidence of
interaction between the UCP genes and physical activity on
the changes in BMI was uncovered (10). The second study
(129) examined the interactions between the ACE I/D
polymorphism and physical activity on adiposity in
adolescent (11–18 yr old) males (N = 535) and females
(N = 481). Strong evidence of association was found
between the ACE I/D polymorphism and triceps (P = 0.012)
and subscapular (P = 0.001) skinfolds, but only in inactive
(N = 207) females. The polymorphism accounted for 4.3
and 6.5% of the variance in the triceps and subscapular
skinfolds, respectively (129).
Another study involving the ACE I/D polymorphism
genotype in more than 3000 adult subjects aged 70–79 yr
found higher values of percent body fat and intermuscular
thigh fat (assessed by CT scan) in subjects with the I/I
genotype compared with those with the I/D or D/D
genotype, but the association was observed only among
physically active subjects (94). Ostergard and coworkers
reported that in a small group of offspring of type 2
diabetics, the Ala12 allele carriers of the PPARG Pro12Ala
polymorphism showed a greater weight loss compared with
TABLE 2. (continued )
Gene Location
Athletes Controls
P ReferenceN Sports Frequency N Frequency
T: 0.045J:0.067W: 0.067I: 0X: 0.023
* Haplogroups were constructed from several mitochondrial DNA polymorphisms; ** P value for the difference between endurance and sprint athletes. Significance between athletesand controls was not reported.
http://www.acsm-msse.org1870 Official Journal of the American College of Sports Medicine
Copyright @ 2006 by the American College of Sports Medicine. Unauthorized reproduction of this article is prohibited.
the Pro12Pro homozygotes in response to 10 wk of
endurance training (143).
In 2005, one study tested association between candidate
genes and bone mineral density (BMD) responses to
exercise training. Rabon-Stith and colleagues examined
the response of BMD to both aerobic and strength training
in 206 total older men and women in relation to two
polymorphisms in the vitamin D–receptor gene (VDR)
(158). The FokI polymorphism was significantly associated
with the femoral neck BMD response to strength training.
TABLE 3. Endurance phenotypes and association studies with candidate genes.
Gene Location Subjects Phenotype P Reference
Acute exerciseAMPD1 1p13 400 whites RPE 0.0002 174PPARGC1A 4p15.1 599 healthy subjects PAEE/V
.O2max, pred 0.009 45
ADRB2 5q31q32 232 HF patients V.O2peak 0.0001 243
63 PM women V.O2max G 0.05 127
62 PM women V.O2max G 0.05 116
62 PM women Max avDo2 0.006Submax avDo2 0.004
HLAA 6p21.3 8 MZ and 8 DZ twin pairs V.O2max 0.001 182
IL6 7p21 479 young smokers PWCmax 0.002 142CFTR 7q31.2 97 CF patients V
.O2peak G 0.05 201
ADRB1 10q24q26 263 cardiomyopathy patients V.O2peak G 0.05 244
Exercise time G 0.05V.E/V.CO2 G 0.05
83 heart failure patients V.O2peak G 0.05 191
Exercise time G 0.05SCGB1A1 11q12.3q13.1 96 asthmatic children FEV1 after exercise G 0.04 203UCP2 11q13 16 healthy subjects Exercise efficiency (gross) 0.02 20
Exercise efficiency (incremental) 0.03HIF1A 14q21q24 125 whites V
.O2max (age interaction) NS (55 yr) 154
0.012 (60 yr)0.005 (65 yr)
29 blacks V.O2max 0.033
BDKRB2 14q32.1q32.2 73 male Army recruits Muscle efficiency 0.003 25142 female sedentaryCaucasians
HP 16q22.1 96 PAOD patients Walking distance G 0.05 33ACE 17q23 58 PM women V
.O2max G 0.05 61
47 PM women Max avDo2 G 0.0591 (79 Caucasians) Running distance 0.009 13557 cardiomyopathy patients V
.O2peak 0.05 1
Exercise time 0.0462 PM women V
.O2max G 0.05 62
36 COPD patients Postexercise lactate G 0.0001 82,8343 COPD patients Postexercise lactate 0.0160 V
.E during hypoxia 0.008 148
67 Chinese men V.O2max 0.04 263
33 COPD patients DO2 G 0.05 8688 nonelite athletes Middle-distance running performance 0.026 2151 untrained Caucasians V
.O2max G 0.001 89
29 strength-trained athletes G 0.001CKM 19q13.2q13.3 160 white parents V
.O2max 0.007 178
80 white offspring V.O2max NS
MTND5 12337–14148* 46 V.O2max G 0.05 37
MTTT 15888–15953* 46 V.O2max G 0.05 37
Training responses:AMPD1 1p13 400 whites V
.O2max 0.006 174
V.Emax 0.006
ATP1A2 1q21q23 472 whites V.O2max 0.018 162
294 white offspring V.O2max 0.017
HIF1A 14q21q24 101 whites V.O2max (age interaction) NS (55 yr) 154
0.005 (60 yr)0.006 (65 yr)
ACE 17q23 294 white offspring V.O2max 0.008–0.150 163
Power output 0.0001–0.00378 Army recruits Maximum duration for repetitive
elbow flexion with 15 kg0.001 126
58 Army recruits Muscle efficiency G 0.025 25258 Army recruits (24II, 26DD) Exercise efficiency 0.02 26095 COPD patients Maximal workload 0.04 53
APOE 19q13.2 51 V.O2max G 0.05 60
120 V.O2max G 0.001 220
CKM 19q13.2q13.3 160 white parents V.O2max 0.004 178
80 white offspring V.O2max G 0.025
MTND5 12337–14148* 46 V.O2max G 0.05 37
* Mitochondrial DNA. V.O2max, maximal oxygen uptake; V
.E/V.CO2, ratio of ventilation to carbon dioxide consumption; Wmax, maximal power output; a-vDo2, arterial–venous
oxygen difference; PM, postmenopausal; HF, heart failure; MZ, monozygous; DZ, dizygous; CAD, coronary artery disease; CF, cystic fibrosis; exercise efficiency, decrease inoxygen consumption on given workloads; PAOD, peripheral arterial occlusive disease; V
.E, ventilation; RPE, rating of perceived exertion; PWC, physical working capacity; FEV,
forced expiratory volume; DO2, oxygen delivery.
HUMAN FITNESS GENE MAP 2005 Medicine & Science in Sports & Exercised 1871
Copyright @ 2006 by the American College of Sports Medicine. Unauthorized reproduction of this article is prohibited.
TABLE 4. Linkage studies with endurance and strength phenotypes.
Gene Marker Location No. of Pairs Phenotype P Reference
QTL LEPR 1p31 90 black $V.O2max 0.0017 175
102 black V.O2max 0.01
ATP1A2 1q21q23 309 white $V.O2max 0.054 162
$Wmax 0.003QTL S100STU1 1q21 316 white $Wmax 0.0091 175QTL D1S398 1q22 90 black $Wmax 0.0033 175QTL D2S118 2q32.2 204 white Knee extension 0.0002 71
Knee flexion 0.004QTL D4S1627 4p13 315 white $Wmax 0.0062 175QTL FABP2 4q28q31 315 white $V
.O2max 0.009 15,175
OTL D5S1505 5q23 315 white $Wmax 0.002 175QTL D6S1051 6p21.3 204 white Knee extension 0.009 71
Knee flexion 0.004QTL LEP 7q32 102 black V
.O2max 0.0068 175
QTL D7S495 7q34 315 white $V.O2max 0.0089 175
QTL NOS3 7q36 102 black V.O2max 0.003 175
OTL D10S677 10q23 315 white Wmax 0.0014 175QTL D11S4138 11p15 204 white Knee extension 0.004 71
Knee flexion 0.002QTL SUR 11p15.1 315 white V
.O2max 0.0014 15,175
QTL D12S1042 12p11 367 white Multiple knee-strength measures G 0.05 73QTL D12S85 12q13 367 white Multiple knee-strength measures G 0.05 73QTL D12S78 12q23 367 white Multiple knee-strength measures G 0.05 73QTL D13S153 13q14.2 204 white Trunk flexion 0.0002 72QTL D13S1303 13q21 367 white Multiple knee-strength measures G 0.05 73QTL D13S175 13q11 90 black $Wmax 0.0055 175QTL D13S787 13q12 315 white $V
.O2max 0.0087 175
QTL D13S796 13q33 351 white Wmax 0.0098 175QTL RADI 16q22 90 black $V
.O2max 0.0041 175
QTL D18S478 18q12 351 white Wmax 0.0064 175CKM 19q13.2 260 white $V
.O2max 0.04 181
QTL D20S857 20q13.1 90 black $V.O2max 0.0028 175
$, response to an exercise training program; V.O2max, maximal oxygen uptake; Wmax, maximal power output.
TABLE 5. Muscular strength and anaerobic phenotypes and association studies with candidate genes.
Gene Location Subjects Phenotype P Reference
DIO1 1p32p33 350 men, 9 70 yr Grip strength 0.047 149GDF8 2q32.2 286 women Hip flexion 0.01 200
55 AA women (subsample of 286) Overall strength G 0.01 200Hip flexion G 0.01Knee flexion G 0.01
MYLK 3q21 157 men and women Isometric strength 0.019 26$ elbow-flexor strength after ecc exercise G 0.05
NR3C1 5q31 158 men, 13–36 yr Arm strength G 0.05 236Leg strength G 0.05
TNF 6p21.3 214 men and women, Q 60 yr $ Stairclimb time 0.007 139CFTR 7q31.2 97 CF patients Peak anaerobic power G 0.05 201CNTFR 9p13 465 KE ecc, sv G 0.05 184
KE ecc, fv G 0.05IGF2 11p15.5 397 men, aged 64–74 Grip strength 0.05 192
239 women, 20–94 yr Arm peak torque con G 0.05 195Arm peak torque ecc G 0.05Leg peak torque con sv G 0.05Leg peak torque con fv G 0.05
CNTF 11q12.2 494 KE con, fv G 0.05 185KE ecc, sv G 0.05KF con, sv G 0.05KF con, fv G 0.05KF ecc, sv G 0.05
ACTN3 11q13q14 355 women, G 40 yr Baseline isometric strength G 0.05 25$ onerepetition maximum G 0.05
VDR 12q13.11 501 PM women Grip and quadriceps strength G 0.01 52175 women, 20–39 yr Knee flexion G 0.05 55302 men, 9 50 yr Knee-extensor isometric torque G 0.05 186
IGF1 12q22q23 67 men and women KE onerepetition maximum 0.02 93COL1A1 17q21.3q22.1 273 men, 71–86 yr Grip strength 0.03 235
Biceps strength 0.04ACE 17q23 33 $ muscle strength G 0.05 44
83 PM women Specific muscle strength of adductor pollicis 0.017 259103 COPD patients KE maximal strength G 0.05 68
KE twitch force G 0.0581 men KE isometric strength 0.026 250
PM, postmenopausal; $, training response; KE, knee extensor; KF, knee flexor; con, concentric; ecc, eccentric; sv, slow velocity (0.52 radIsj1); fv, fast velocity (3.14 radIsj1); AA,African American; CF, cystic fibrosis.
http://www.acsm-msse.org1872 Official Journal of the American College of Sports Medicine
Copyright @ 2006 by the American College of Sports Medicine. Unauthorized reproduction of this article is prohibited.
There was no association between either VDR polymor-
phism with the BMD response to aerobic training.
Linkage studies. No linkage studies pertaining to
training-induced changes in body-composition phenotypes
(Table 10) were reported in 2005.
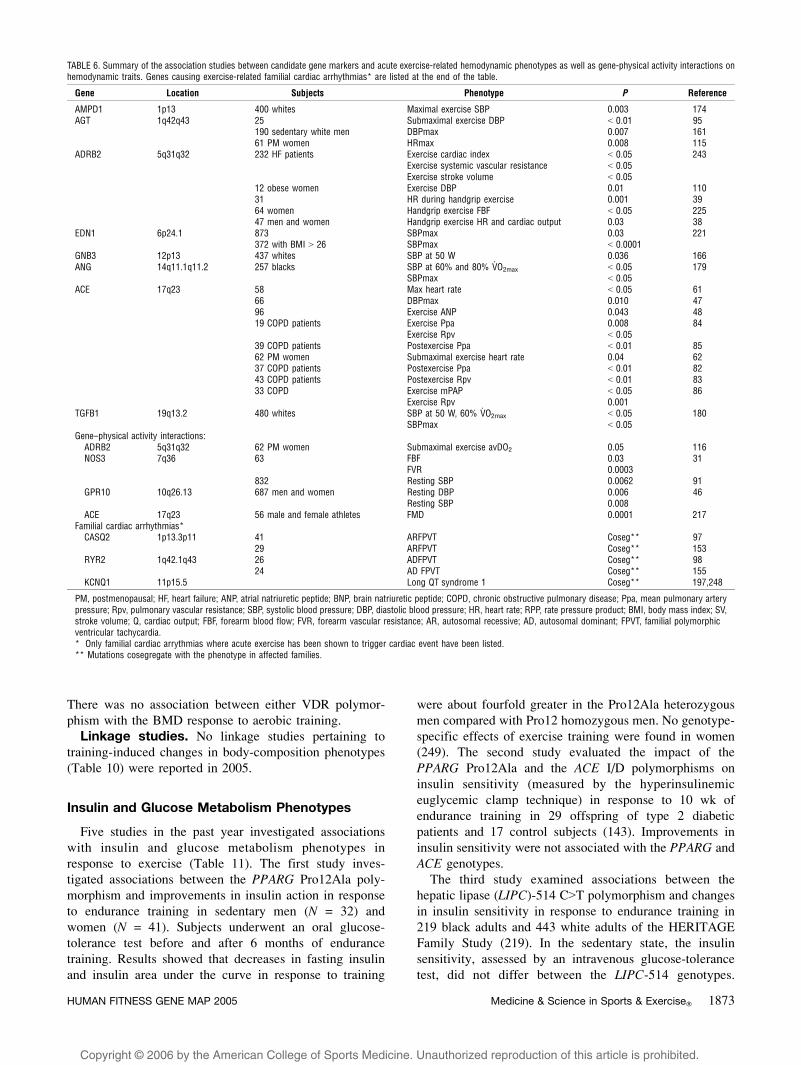
Insulin and Glucose Metabolism Phenotypes
Five studies in the past year investigated associations
with insulin and glucose metabolism phenotypes in
response to exercise (Table 11). The first study inves-
tigated associations between the PPARG Pro12Ala poly-
morphism and improvements in insulin action in response
to endurance training in sedentary men (N = 32) and
women (N = 41). Subjects underwent an oral glucose-
tolerance test before and after 6 months of endurance
training. Results showed that decreases in fasting insulin
and insulin area under the curve in response to training
were about fourfold greater in the Pro12Ala heterozygous
men compared with Pro12 homozygous men. No genotype-
specific effects of exercise training were found in women
(249). The second study evaluated the impact of the
PPARG Pro12Ala and the ACE I/D polymorphisms on
insulin sensitivity (measured by the hyperinsulinemic
euglycemic clamp technique) in response to 10 wk of
endurance training in 29 offspring of type 2 diabetic
patients and 17 control subjects (143). Improvements in
insulin sensitivity were not associated with the PPARG and
ACE genotypes.
The third study examined associations between the
hepatic lipase (LIPC)-514 C9T polymorphism and changes
in insulin sensitivity in response to endurance training in
219 black adults and 443 white adults of the HERITAGE
Family Study (219). In the sedentary state, the insulin
sensitivity, assessed by an intravenous glucose-tolerance
test, did not differ between the LIPC-514 genotypes.
TABLE 6. Summary of the association studies between candidate gene markers and acute exercise-related hemodynamic phenotypes as well as gene-physical activity interactions onhemodynamic traits. Genes causing exercise-related familial cardiac arrhythmias* are listed at the end of the table.
Gene Location Subjects Phenotype P Reference
AMPD1 1p13 400 whites Maximal exercise SBP 0.003 174AGT 1q42q43 25 Submaximal exercise DBP G 0.01 95
190 sedentary white men DBPmax 0.007 16161 PM women HRmax 0.008 115
ADRB2 5q31q32 232 HF patients Exercise cardiac index G 0.05 243Exercise systemic vascular resistance G 0.05Exercise stroke volume G 0.05
12 obese women Exercise DBP 0.01 11031 HR during handgrip exercise 0.001 3964 women Handgrip exercise FBF G 0.05 22547 men and women Handgrip exercise HR and cardiac output 0.03 38
EDN1 6p24.1 873 SBPmax 0.03 221372 with BMI 9 26 SBPmax G 0.0001
GNB3 12p13 437 whites SBP at 50 W 0.036 166ANG 14q11.1q11.2 257 blacks SBP at 60% and 80% V
.O2max G 0.05 179
SBPmax G 0.05ACE 17q23 58 Max heart rate G 0.05 61
66 DBPmax 0.010 4796 Exercise ANP 0.043 4819 COPD patients Exercise Ppa 0.008 84
Exercise Rpv G 0.0539 COPD patients Postexercise Ppa G 0.01 8562 PM women Submaximal exercise heart rate 0.04 6237 COPD patients Postexercise Ppa G 0.01 8243 COPD patients Postexercise Rpv G 0.01 8333 COPD Exercise mPAP G 0.05 86
Exercise Rpv 0.001TGFB1 19q13.2 480 whites SBP at 50 W, 60% V
.O2max G 0.05 180
SBPmax G 0.05Gene–physical activity interactions:
ADRB2 5q31q32 62 PM women Submaximal exercise avDO2 0.05 116NOS3 7q36 63 FBF 0.03 31
FVR 0.0003832 Resting SBP 0.0062 91
GPR10 10q26.13 687 men and women Resting DBP 0.006 46Resting SBP 0.008
ACE 17q23 56 male and female athletes FMD 0.0001 217Familial cardiac arrhythmias*
CASQ2 1p13.3p11 41 ARFPVT Coseg** 9729 ARFPVT Coseg** 153
RYR2 1q42.1q43 26 ADFPVT Coseg** 9824 AD FPVT Coseg** 155
KCNQ1 11p15.5 Long QT syndrome 1 Coseg** 197,248
PM, postmenopausal; HF, heart failure; ANP, atrial natriuretic peptide; BNP, brain natriuretic peptide; COPD, chronic obstructive pulmonary disease; Ppa, mean pulmonary arterypressure; Rpv, pulmonary vascular resistance; SBP, systolic blood pressure; DBP, diastolic blood pressure; HR, heart rate; RPP, rate pressure product; BMI, body mass index; SV,stroke volume; Q, cardiac output; FBF, forearm blood flow; FVR, forearm vascular resistance; AR, autosomal recessive; AD, autosomal dominant; FPVT, familial polymorphicventricular tachycardia.* Only familial cardiac arrythmias where acute exercise has been shown to trigger cardiac event have been listed.** Mutations cosegregate with the phenotype in affected families.
HUMAN FITNESS GENE MAP 2005 Medicine & Science in Sports & Exercised 1873
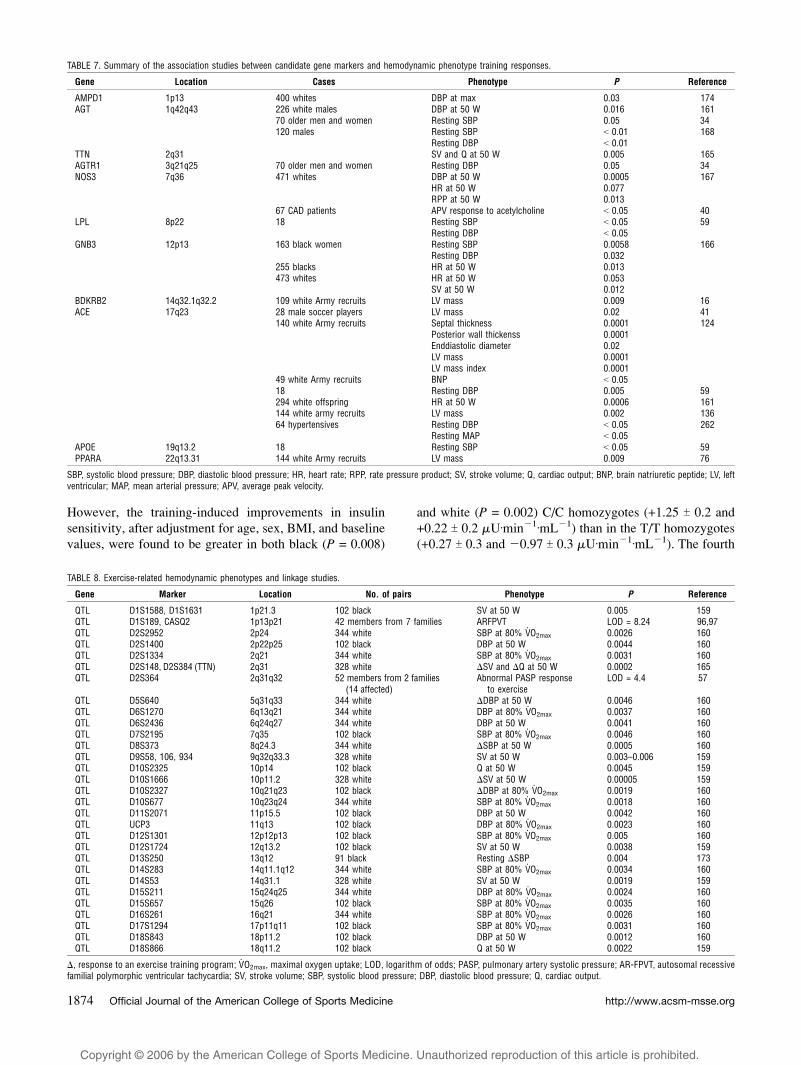
Copyright @ 2006 by the American College of Sports Medicine. Unauthorized reproduction of this article is prohibited.
However, the training-induced improvements in insulin
sensitivity, after adjustment for age, sex, BMI, and baseline
values, were found to be greater in both black (P = 0.008)
and white (P = 0.002) C/C homozygotes (+1.25 T 0.2 and
+0.22 T 0.2 KUIminj1ImLj1) than in the T/T homozygotes
(+0.27 T 0.3 and j0.97 T 0.3 KUIminj1ImLj1). The fourth
TABLE 7. Summary of the association studies between candidate gene markers and hemodynamic phenotype training responses.
Gene Location Cases Phenotype P Reference
AMPD1 1p13 400 whites DBP at max 0.03 174AGT 1q42q43 226 white males DBP at 50 W 0.016 161
70 older men and women Resting SBP 0.05 34120 males Resting SBP G 0.01 168
Resting DBP G 0.01TTN 2q31 SV and Q at 50 W 0.005 165AGTR1 3q21q25 70 older men and women Resting DBP 0.05 34NOS3 7q36 471 whites DBP at 50 W 0.0005 167
HR at 50 W 0.077RPP at 50 W 0.013
67 CAD patients APV response to acetylcholine G 0.05 40LPL 8p22 18 Resting SBP G 0.05 59
Resting DBP G 0.05GNB3 12p13 163 black women Resting SBP 0.0058 166
Resting DBP 0.032255 blacks HR at 50 W 0.013473 whites HR at 50 W 0.053
SV at 50 W 0.012BDKRB2 14q32.1q32.2 109 white Army recruits LV mass 0.009 16ACE 17q23 28 male soccer players LV mass 0.02 41
140 white Army recruits Septal thickness 0.0001 124Posterior wall thickenss 0.0001Enddiastolic diameter 0.02LV mass 0.0001LV mass index 0.0001
49 white Army recruits BNP G 0.0518 Resting DBP 0.005 59294 white offspring HR at 50 W 0.0006 161144 white army recruits LV mass 0.002 13664 hypertensives Resting DBP G 0.05 262
Resting MAP G 0.05APOE 19q13.2 18 Resting SBP G 0.05 59PPARA 22q13.31 144 white Army recruits LV mass 0.009 76
SBP, systolic blood pressure; DBP, diastolic blood pressure; HR, heart rate; RPP, rate pressure product; SV, stroke volume; Q, cardiac output; BNP, brain natriuretic peptide; LV, leftventricular; MAP, mean arterial pressure; APV, average peak velocity.
TABLE 8. Exercise-related hemodynamic phenotypes and linkage studies.
Gene Marker Location No. of pairs Phenotype P Reference
QTL D1S1588, D1S1631 1p21.3 102 black SV at 50 W 0.005 159QTL D1S189, CASQ2 1p13p21 42 members from 7 families ARFPVT LOD = 8.24 96,97QTL D2S2952 2p24 344 white SBP at 80% V
.O2max 0.0026 160
QTL D2S1400 2p22p25 102 black DBP at 50 W 0.0044 160QTL D2S1334 2q21 344 white SBP at 80% V
.O2max 0.0031 160
QTL D2S148, D2S384 (TTN) 2q31 328 white $SV and $Q at 50 W 0.0002 165QTL D2S364 2q31q32 52 members from 2 families
(14 affected)Abnormal PASP response
to exerciseLOD = 4.4 57
QTL D5S640 5q31q33 344 white $DBP at 50 W 0.0046 160QTL D6S1270 6q13q21 344 white DBP at 80% V
.O2max 0.0037 160
QTL D6S2436 6q24q27 344 white DBP at 50 W 0.0041 160QTL D7S2195 7q35 102 black SBP at 80% V
.O2max 0.0046 160
QTL D8S373 8q24.3 344 white $SBP at 50 W 0.0005 160QTL D9S58, 106, 934 9q32q33.3 328 white SV at 50 W 0.003–0.006 159QTL D10S2325 10p14 102 black Q at 50 W 0.0045 159QTL D10S1666 10p11.2 328 white $SV at 50 W 0.00005 159QTL D10S2327 10q21q23 102 black $DBP at 80% V
.O2max 0.0019 160
QTL D10S677 10q23q24 344 white SBP at 80% V.O2max 0.0018 160
QTL D11S2071 11p15.5 102 black DBP at 50 W 0.0042 160QTL UCP3 11q13 102 black DBP at 80% V
.O2max 0.0023 160
QTL D12S1301 12p12p13 102 black SBP at 80% V.O2max 0.005 160
QTL D12S1724 12q13.2 102 black SV at 50 W 0.0038 159QTL D13S250 13q12 91 black Resting $SBP 0.004 173QTL D14S283 14q11.1q12 344 white SBP at 80% V
.O2max 0.0034 160
QTL D14S53 14q31.1 328 white SV at 50 W 0.0019 159QTL D15S211 15q24q25 344 white DBP at 80% V
.O2max 0.0024 160
QTL D15S657 15q26 102 black SBP at 80% V.O2max 0.0035 160
QTL D16S261 16q21 344 white SBP at 80% V.O2max 0.0026 160
QTL D17S1294 17p11q11 102 black SBP at 80% V.O2max 0.0031 160
QTL D18S843 18p11.2 102 black DBP at 50 W 0.0012 160QTL D18S866 18q11.2 102 black Q at 50 W 0.0022 159
$, response to an exercise training program; V.O2max, maximal oxygen uptake; LOD, logarithm of odds; PASP, pulmonary artery systolic pressure; AR-FPVT, autosomal recessive
familial polymorphic ventricular tachycardia; SV, stroke volume; SBP, systolic blood pressure; DBP, diastolic blood pressure; Q, cardiac output.
http://www.acsm-msse.org1874 Official Journal of the American College of Sports Medicine
Copyright @ 2006 by the American College of Sports Medicine. Unauthorized reproduction of this article is prohibited.
study examined the effects of the PPARG Pro12Ala
polymorphism on changes in glucose homeostasis and
body-composition variables in 139 sedentary type 2
diabetic patients who completed 3 months of supervised
exercise training (2). Although exercise training resulted in
significant improvements in glucose homeostasis and
body-composition variables, there were no significant
differences between carriers and noncarriers of the Ala
allele in response to exercise, except for fasting plasma
glucose levels, which showed greater reductions (P = 0.03)
in the Ala carriers (j2.02 T 0.70) than in Pro12Pro
homozygotes (j0.86 T 0.32). In the fifth study, a poly-
morphism in the adiponectin receptor 1 (ADIPOR1) gene
was found to be associated with lower insulin sensitivity in
a follow-up study of 45 subjects (average follow-up of 9.8
months) who received diet counselling and increased their
physical activity to at least 3 hIwkj1 of sports (211).
The only linkage study pertaining to glucose and insulin
metabolism phenotypes reported in 2005 was a genome-
wide linkage analysis of prediabetes phenotypes in response
to 20 wk of endurance training in subjects from the
HERITAGE Family Study (Table 12). Training-induced
changes in insulin sensitivity, acute insulin response to
glucose, disposition index, and glucose effectiveness were
assessed in 441 subjects from 98 white families and 187
subjects from black families, adjusted for the effect of age,
sex, BMI, and the respective baseline phenotypic values
and tested for linkage with a total of 654 markers (4). In
TABLE 9. Evidence for the presence of associations between candidate genes and the response of BMI, body composition, or fat distribution phenotypes to habitual physical activityor regular exercise.
Gene Location No. of Cases Phenotype P Reference
Interactions with exercise/physical activityGDF8(MSTN)
2q32.2 18 men and 14 women Leg muscle volume NS (all) 0.067(women)
75
ADRB2 5q31q32 420 men Weight 0.0001 119BMI 0.0001Waist circumference 0.0001Hip circumference 0.0007WHR 0.02
252 women Obesity, BMI 0.005 G P G 0.05 29NPY 7p15.1 9 Leu7/Leu7 and 9 Leu7/Pro7 Plasma NPY during exercise G 0.05 80,81
Plasma GH during exercise G 0.05ADRB3 8p12p11.2 61 obese diabetic women Weight G 0.001 189
BMI G 0.001WHR G 0.001
UCP3 11q13 368 obese patients BMI 0.015 144VDR 12q13.11 33 women Bone mineral density 0.03 231
120 girls Bone mineral density 0.04 9299 girls Bone mineral density 0.02 107575 PM women Bone mineral density 0.04 1344 male athletes; 44 controls Bone mineral content; bone mineral
volumeG 0.02 137
ACE 17q23 481 teenage girls Subscapular and triceps skinfolds G 0.012 1293075 subjects, aged 70–79 yr %FAT, intermuscular thigh fat 0.02 94
Training responses or acute exercisePPARG 3p25 490 subjects Body weight 0.04 104
29 healthy offspring of type 2diabetics
Body weight 0.05 143
ADRB2 5q31q32 12 obese women RER G 0.05 110482 men and women BMI, FM, %FAT, subcutaneous fat 0.0003 G P G 0.03 5070 men and women Percent body fat, trunk fat G 0.02 151
ESR1 6q25.1 140 men Bone mineral density 0.007 171LPL 8p22 249 white women BMI, fat mass, percent body fat 0.01 G P G 0.05 49
171 black women Abdominal visceral fat 0.05ADRB3 8p12p11.2 106 men Leptin G 0.05 79
76 women Body weight, BMI, waistcircumference
0.001 G P G 0.02 206
70 men and women Fat mass, percent body fat, trunk fat G 0.05 151IL6 7p21 130 men Cortical bone area 0.007 36IL15RA 10p15p14 153 men and women Lean mass G 0.05 176
Arm circumference G 0.05Leg circumference G 0.05
UCP3 11q13 503 whites Subcutaneous fat 0.0006 102GNB3 12p13 255 blacks FM 0.012 166
%FAT 0.006VDR 12q13.11 20 men 1,25 dihydroxyvitamin D3 plasma
levelG 0.05 216
83 older men and women Femoral neck bone mineral density G 0.05 158IGF1 12q22q23 502 men and women Fat-free mass 0.005 213CYP19A1 15q21.1 173 women BMI, fat mass, percent body fat G 0.05 233PNMT 17q21q22 149 women Body weight 0.002 150ACE 17q23 81 men Body weight 0.001 123
Fat mass 0.04Fat-free mass 0.01
COMT 22q11.21q11.23 173 women Percent body fat G 0.05 233
BMI, body mass index; WHR, waist-to-hip ratio; GH, growth hormone; RER, respiratory exchange ratio; FM, fat mass; %FAT, percent body fat.
HUMAN FITNESS GENE MAP 2005 Medicine & Science in Sports & Exercised 1875
Copyright @ 2006 by the American College of Sports Medicine. Unauthorized reproduction of this article is prohibited.
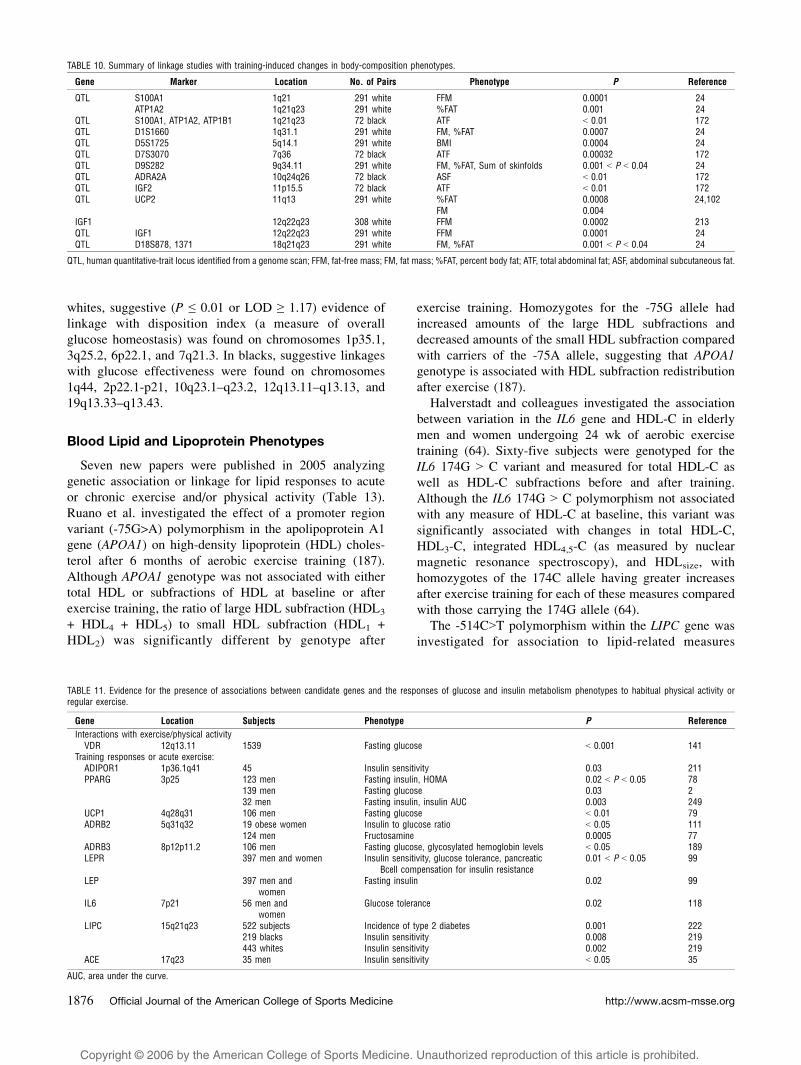
whites, suggestive (P e 0.01 or LOD Q 1.17) evidence of
linkage with disposition index (a measure of overall
glucose homeostasis) was found on chromosomes 1p35.1,
3q25.2, 6p22.1, and 7q21.3. In blacks, suggestive linkages
with glucose effectiveness were found on chromosomes
1q44, 2p22.1-p21, 10q23.1–q23.2, 12q13.11–q13.13, and
19q13.33–q13.43.
Blood Lipid and Lipoprotein Phenotypes
Seven new papers were published in 2005 analyzing
genetic association or linkage for lipid responses to acute
or chronic exercise and/or physical activity (Table 13).
Ruano et al. investigated the effect of a promoter region
variant (-75G>A) polymorphism in the apolipoprotein A1
gene (APOA1) on high-density lipoprotein (HDL) choles-
terol after 6 months of aerobic exercise training (187).
Although APOA1 genotype was not associated with either
total HDL or subfractions of HDL at baseline or after
exercise training, the ratio of large HDL subfraction (HDL3
+ HDL4 + HDL5) to small HDL subfraction (HDL1 +
HDL2) was significantly different by genotype after
exercise training. Homozygotes for the -75G allele had
increased amounts of the large HDL subfractions and
decreased amounts of the small HDL subfraction compared
with carriers of the -75A allele, suggesting that APOA1genotype is associated with HDL subfraction redistribution
after exercise (187).
Halverstadt and colleagues investigated the association
between variation in the IL6 gene and HDL-C in elderly
men and women undergoing 24 wk of aerobic exercise
training (64). Sixty-five subjects were genotyped for the
IL6 174G 9 C variant and measured for total HDL-C as
well as HDL-C subfractions before and after training.
Although the IL6 174G 9 C polymorphism not associated
with any measure of HDL-C at baseline, this variant was
significantly associated with changes in total HDL-C,
HDL3-C, integrated HDL4,5-C (as measured by nuclear
magnetic resonance spectroscopy), and HDLsize, with
homozygotes of the 174C allele having greater increases
after exercise training for each of these measures compared
with those carrying the 174G allele (64).
The -514C9T polymorphism within the LIPC gene was
investigated for association to lipid-related measures
TABLE 10. Summary of linkage studies with training-induced changes in body-composition phenotypes.
Gene Marker Location No. of Pairs Phenotype P Reference
QTL S100A1 1q21 291 white FFM 0.0001 24ATP1A2 1q21q23 291 white %FAT 0.001 24
QTL S100A1, ATP1A2, ATP1B1 1q21q23 72 black ATF G 0.01 172QTL D1S1660 1q31.1 291 white FM, %FAT 0.0007 24QTL D5S1725 5q14.1 291 white BMI 0.0004 24QTL D7S3070 7q36 72 black ATF 0.00032 172QTL D9S282 9q34.11 291 white FM, %FAT, Sum of skinfolds 0.001 G P G 0.04 24QTL ADRA2A 10q24q26 72 black ASF G 0.01 172QTL IGF2 11p15.5 72 black ATF G 0.01 172QTL UCP2 11q13 291 white %FAT 0.0008 24,102
FM 0.004IGF1 12q22q23 308 white FFM 0.0002 213QTL IGF1 12q22q23 291 white FFM 0.0001 24QTL D18S878, 1371 18q21q23 291 white FM, %FAT 0.001 G P G 0.04 24
QTL, human quantitative-trait locus identified from a genome scan; FFM, fat-free mass; FM, fat mass; %FAT, percent body fat; ATF, total abdominal fat; ASF, abdominal subcutaneous fat.
TABLE 11. Evidence for the presence of associations between candidate genes and the responses of glucose and insulin metabolism phenotypes to habitual physical activity orregular exercise.
Gene Location Subjects Phenotype P Reference
Interactions with exercise/physical activityVDR 12q13.11 1539 Fasting glucose G 0.001 141
Training responses or acute exercise:ADIPOR1 1p36.1q41 45 Insulin sensitivity 0.03 211PPARG 3p25 123 men Fasting insulin, HOMA 0.02 G P G 0.05 78
139 men Fasting glucose 0.03 232 men Fasting insulin, insulin AUC 0.003 249
UCP1 4q28q31 106 men Fasting glucose G 0.01 79ADRB2 5q31q32 19 obese women Insulin to glucose ratio G 0.05 111
124 men Fructosamine 0.0005 77ADRB3 8p12p11.2 106 men Fasting glucose, glycosylated hemoglobin levels G 0.05 189LEPR 397 men and women Insulin sensitivity, glucose tolerance, pancreatic
Bcell compensation for insulin resistance0.01 G P G 0.05 99
LEP 397 men andwomen
Fasting insulin 0.02 99
IL6 7p21 56 men andwomen
Glucose tolerance 0.02 118
LIPC 15q21q23 522 subjects Incidence of type 2 diabetes 0.001 222219 blacks Insulin sensitivity 0.008 219443 whites Insulin sensitivity 0.002 219
ACE 17q23 35 men Insulin sensitivity G 0.05 35
AUC, area under the curve.
http://www.acsm-msse.org1876 Official Journal of the American College of Sports Medicine
Copyright @ 2006 by the American College of Sports Medicine. Unauthorized reproduction of this article is prohibited.
before and after exercise in black and white families from
the HERITAGE study. Individuals from this study under-
went 20 wk of aerobic exercise training and were measured
for a lipid panel that included triglycerides (TG), low-
density and very-low-density lipoprotein (LDL and VLDL,
respectively), HDL, HDL2, HDL3, Apo-A1, and apolipo-
protein B (apoB) (219). In addition, the subjects were also
measured for postheparin hepatic lipase and lipoprotein-
lipase activity. Homozygotes for the -514C allele had
significantly higher postheparin hepatic lipase activity at
baseline and after exercise training (P G 0.0001 for both) in
both black and white subjects compared with those with
the T/T genotype. The -514C allele was also associated
with lower postheparin lipoprotein lipase in blacks and
whites before and after exercise training compared with
-514T homozygotes (219). The LIPC -514C9T poly-
morphism was significantly associated with baseline TG,
VLDL, LDL, HDL, ApoA1, and ApoB in whites and with
pretraining HDL, HDL3, and ApoA-1 in blacks. The only
posttraining variable associated with the LIPC -514C9T
variant was the training response measure of apoB in
blacks. All other pre- and postexercise lipid measures were
unrelated to the -514C9T polymorphism (219).
Two studies assessed the effects of genetic variation in
response to diet/lifestyle/behavior interventions that
included exercise. Coronary artery disease patients (N =
307) underwent a cardiac rehabilitation intervention that
included diet, eduction, psychosocial, and smoking cessa-
tion counseling, in addition to twice-weekly aerobic
exercise for 16 wk. Three gene variants were measured in
these patients: the cholesterol-ester transfer protein (CETP)
TaqIB polymorphism, the LIPC -514C9T variant, and the
apolipoprotein E (APOE) epsilon variant. Although the
cardiac rehabilitation intervention resulted in significant
improvements in all measures assessed (total cholesterol
(TC), LDL-C, HDL-C, TG, TC/HDL-C, BMI, and exercise
capacity), results of this study for genetic association were
primarily negative. Of all measures tested, the only
significant result was for TC and the CETP TaqIBpolymorphism (P G 0.048), with B1/B1 homozygotes
experiencing decreased TC levels and B2 carriers having
little or no change in TC after the lifestyle/exercise
intervention (9). In another study, men and women under-
went a diet and physical activity intervention designed to
reduce insulin resistance, and the -8503G>A polymor-
phism within the ADIPOR1 was investigated for associa-
tion to measures of insulin sensitivity and hepatic lipids
(211). The dietary therapy was aimed at reducing fat
intake, whereas the physical activity intervention involved
a minimum of 3 hIwkj1 of sports participation. After
exercise and diet therapy, homozygotes for the -8503G
allele had significantly lower hepatic lipid content (as
measured by proton magnetic resonance spectroscopy)
compared with subjects carrying the -8503A allele
(211).
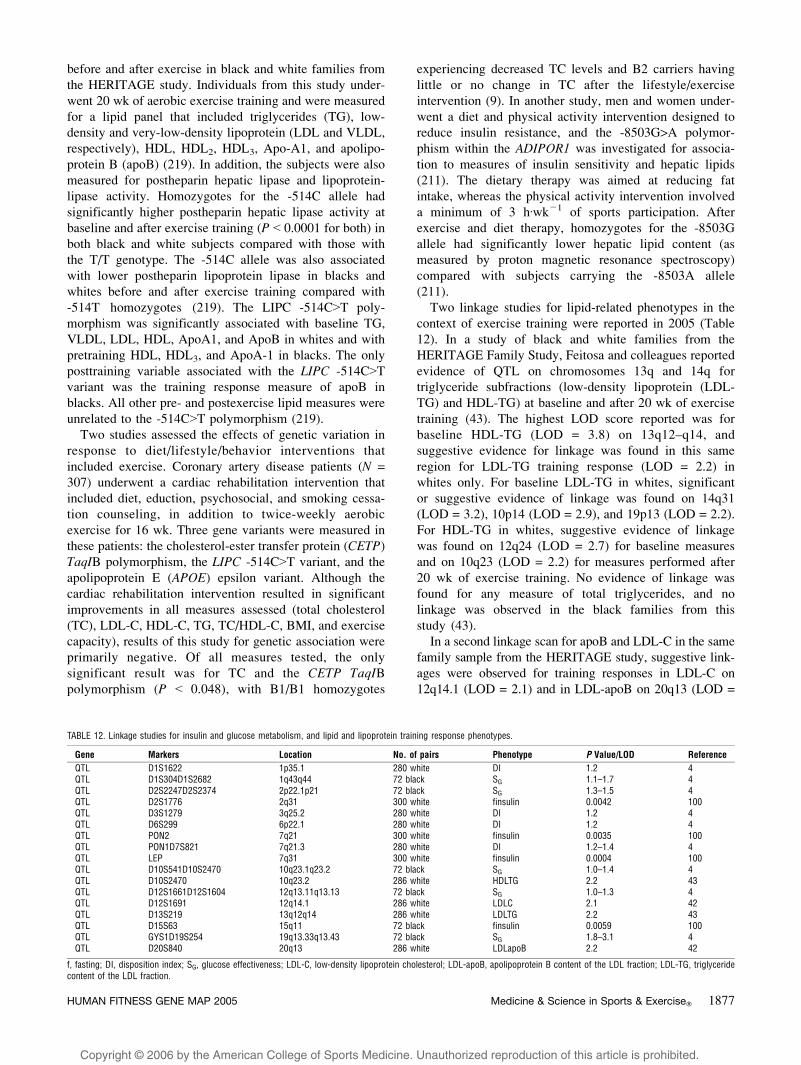
Two linkage studies for lipid-related phenotypes in the
context of exercise training were reported in 2005 (Table
12). In a study of black and white families from the
HERITAGE Family Study, Feitosa and colleagues reported
evidence of QTL on chromosomes 13q and 14q for
triglyceride subfractions (low-density lipoprotein (LDL-
TG) and HDL-TG) at baseline and after 20 wk of exercise
training (43). The highest LOD score reported was for
baseline HDL-TG (LOD = 3.8) on 13q12–q14, and
suggestive evidence for linkage was found in this same
region for LDL-TG training response (LOD = 2.2) in
whites only. For baseline LDL-TG in whites, significant
or suggestive evidence of linkage was found on 14q31
(LOD = 3.2), 10p14 (LOD = 2.9), and 19p13 (LOD = 2.2).
For HDL-TG in whites, suggestive evidence of linkage
was found on 12q24 (LOD = 2.7) for baseline measures
and on 10q23 (LOD = 2.2) for measures performed after
20 wk of exercise training. No evidence of linkage was
found for any measure of total triglycerides, and no
linkage was observed in the black families from this
study (43).
In a second linkage scan for apoB and LDL-C in the same
family sample from the HERITAGE study, suggestive link-
ages were observed for training responses in LDL-C on
12q14.1 (LOD = 2.1) and in LDL-apoB on 20q13 (LOD =
TABLE 12. Linkage studies for insulin and glucose metabolism, and lipid and lipoprotein training response phenotypes.
Gene Markers Location No. of pairs Phenotype P Value/LOD Reference
QTL D1S1622 1p35.1 280 white DI 1.2 4QTL D1S304D1S2682 1q43q44 72 black SG 1.1–1.7 4QTL D2S2247D2S2374 2p22.1p21 72 black SG 1.3–1.5 4QTL D2S1776 2q31 300 white finsulin 0.0042 100QTL D3S1279 3q25.2 280 white DI 1.2 4QTL D6S299 6p22.1 280 white DI 1.2 4QTL PON2 7q21 300 white finsulin 0.0035 100QTL PON1D7S821 7q21.3 280 white DI 1.2–1.4 4QTL LEP 7q31 300 white finsulin 0.0004 100QTL D10S541D10S2470 10q23.1q23.2 72 black SG 1.0–1.4 4QTL D10S2470 10q23.2 286 white HDLTG 2.2 43QTL D12S1661D12S1604 12q13.11q13.13 72 black SG 1.0–1.3 4QTL D12S1691 12q14.1 286 white LDLC 2.1 42QTL D13S219 13q12q14 286 white LDLTG 2.2 43QTL D15S63 15q11 72 black finsulin 0.0059 100QTL GYS1D19S254 19q13.33q13.43 72 black SG 1.8–3.1 4QTL D20S840 20q13 286 white LDLapoB 2.2 42
f, fasting; DI, disposition index; SG, glucose effectiveness; LDL-C, low-density lipoprotein cholesterol; LDL-apoB, apolipoprotein B content of the LDL fraction; LDL-TG, triglyceridecontent of the LDL fraction.
HUMAN FITNESS GENE MAP 2005 Medicine & Science in Sports & Exercised 1877
Copyright @ 2006 by the American College of Sports Medicine. Unauthorized reproduction of this article is prohibited.
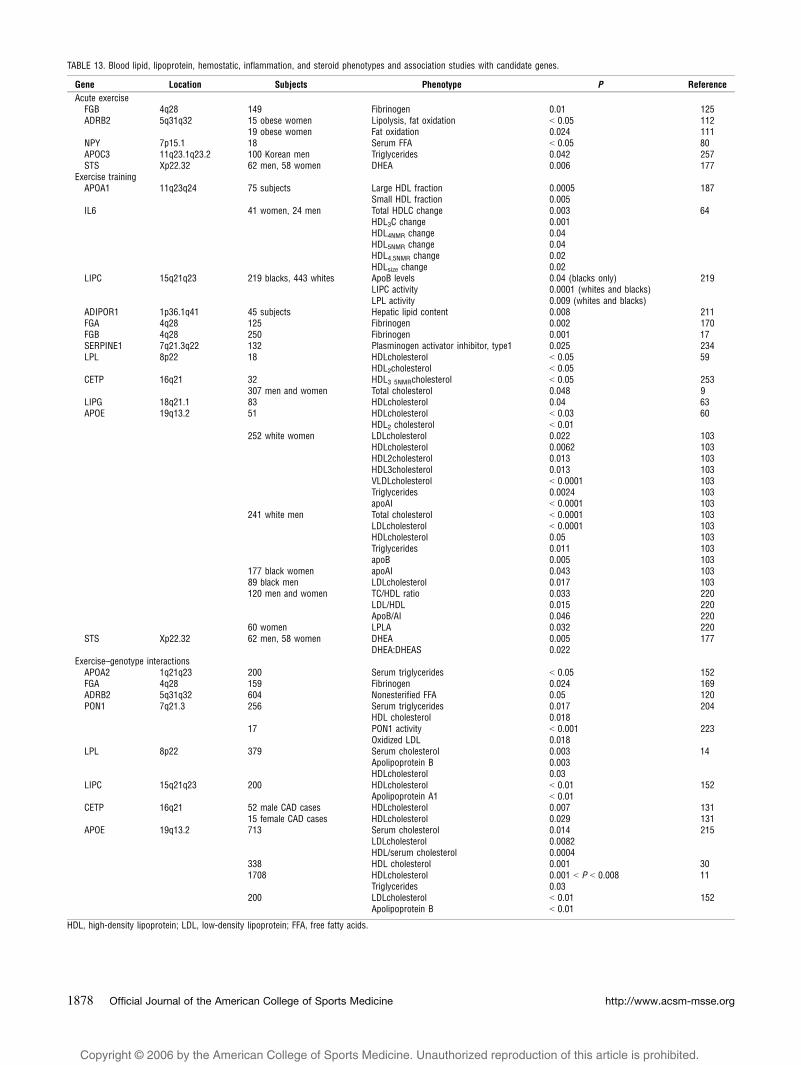
TABLE 13. Blood lipid, lipoprotein, hemostatic, inflammation, and steroid phenotypes and association studies with candidate genes.
Gene Location Subjects Phenotype P Reference
Acute exerciseFGB 4q28 149 Fibrinogen 0.01 125ADRB2 5q31q32 15 obese women Lipolysis, fat oxidation G 0.05 112
19 obese women Fat oxidation 0.024 111NPY 7p15.1 18 Serum FFA G 0.05 80APOC3 11q23.1q23.2 100 Korean men Triglycerides 0.042 257STS Xp22.32 62 men, 58 women DHEA 0.006 177
Exercise trainingAPOA1 11q23q24 75 subjects Large HDL fraction 0.0005 187
Small HDL fraction 0.005IL6 41 women, 24 men Total HDLC change 0.003 64
HDL3C change 0.001HDL4NMR change 0.04HDL5NMR change 0.04HDL4,5NMR change 0.02HDLsize change 0.02
LIPC 15q21q23 219 blacks, 443 whites ApoB levels 0.04 (blacks only) 219LIPC activity 0.0001 (whites and blacks)LPL activity 0.009 (whites and blacks)
ADIPOR1 1p36.1q41 45 subjects Hepatic lipid content 0.008 211FGA 4q28 125 Fibrinogen 0.002 170FGB 4q28 250 Fibrinogen 0.001 17SERPINE1 7q21.3q22 132 Plasminogen activator inhibitor, type1 0.025 234LPL 8p22 18 HDLcholesterol G 0.05 59
HDL2cholesterol G 0.05CETP 16q21 32 HDL3 5NMRcholesterol G 0.05 253
307 men and women Total cholesterol 0.048 9LIPG 18q21.1 83 HDLcholesterol 0.04 63APOE 19q13.2 51 HDLcholesterol G 0.03 60
HDL2 cholesterol G 0.01252 white women LDLcholesterol 0.022 103
HDLcholesterol 0.0062 103HDL2cholesterol 0.013 103HDL3cholesterol 0.013 103VLDLcholesterol G 0.0001 103Triglycerides 0.0024 103apoAI G 0.0001 103
241 white men Total cholesterol G 0.0001 103LDLcholesterol G 0.0001 103HDLcholesterol 0.05 103Triglycerides 0.011 103apoB 0.005 103
177 black women apoAI 0.043 10389 black men LDLcholesterol 0.017 103120 men and women TC/HDL ratio 0.033 220
LDL/HDL 0.015 220ApoB/AI 0.046 220
60 women LPLA 0.032 220STS Xp22.32 62 men, 58 women DHEA 0.005 177
DHEA:DHEAS 0.022Exercise–genotype interactions
APOA2 1q21q23 200 Serum triglycerides G 0.05 152FGA 4q28 159 Fibrinogen 0.024 169ADRB2 5q31q32 604 Nonesterified FFA 0.05 120PON1 7q21.3 256 Serum triglycerides 0.017 204
HDL cholesterol 0.01817 PON1 activity G 0.001 223
Oxidized LDL 0.018LPL 8p22 379 Serum cholesterol 0.003 14
Apolipoprotein B 0.003HDLcholesterol 0.03
LIPC 15q21q23 200 HDLcholesterol G 0.01 152Apolipoprotein A1 G 0.01
CETP 16q21 52 male CAD cases HDLcholesterol 0.007 13115 female CAD cases HDLcholesterol 0.029 131
APOE 19q13.2 713 Serum cholesterol 0.014 215LDLcholesterol 0.0082HDL/serum cholesterol 0.0004
338 HDL cholesterol 0.001 301708 HDLcholesterol 0.001 G P G 0.008 11
Triglycerides 0.03200 LDLcholesterol G 0.01 152
Apolipoprotein B G 0.01
HDL, high-density lipoprotein; LDL, low-density lipoprotein; FFA, free fatty acids.
http://www.acsm-msse.org1878 Official Journal of the American College of Sports Medicine
Copyright @ 2006 by the American College of Sports Medicine. Unauthorized reproduction of this article is prohibited.
2.2) (42). Significant or suggestive evidence for linkage was
found on 1q41-q44 for baseline measures of LDL-apoB
(LOD = 3.7), apoB (LOD = 2.9), and LDL-cholesterol
(LOD = 2.1) in blacks. In whites, baseline measures of
LDL-chol, LDL-apoB, and apoB were significantly or
suggestively linked to chromosomal region 8q24 (LOD =
3.6, 3.3, and 2.5, respectively).
Hemostatic Factors, Inflammation Phenotypesand Plasma Hormone Levels
No new studies were published in 2005.
Chronic Diseases
A significant interaction between physical activity and
genotype (P G 0.01) was demonstrated in an analysis of the
IGF1 gene on colon cancer outcomes. Homozygotes for a
CA repeat polymorphism within the IGF1 gene (‘‘192/
192’’) who reported no habitual physical activity were
almost 50% more likely to develop colon cancer (OR =
1.46, 95% CI = 1.08, 2.05), whereas active individuals with
the 192/192 genotype experienced decreased risk for colon
cancer (OR = 0.57, 95% CI = 0.39, 0.83) compared with
active individuals not carrying the 192 allele (209).
Similarly, for a single nucleotide polymorphism resulting
in an amino acid change from glycine to alanine at codon
32 (Gly32Ala) within the insulin-like growth factor bind-
ing protein 3 (IGFBP3) gene, the protective effect of
physical activity on colon cancer was only observed in
male carriers of the Ala32 allele (P G 0.01) (130).
In a sample of 1577 colon cancer patients (1971
controls) and 794 rectal cancer patients (1001 controls),
Slattery and colleagues reported no significant interactions
between the Pro12Ala variant in the PPARG gene and
energy expenditure (a surrogate of physical activity) in
predicting cancer risk (210). In a sample of 4248 elderly
white women, Modugno et al. also reported no association
between risk for breast cancer and either the catechol-O-
methyltransferase (COMT) Val158Met polymorphism or
an isoleucine to valine variant at codon 462 in the CYP1A1gene, a gene also involved in hydroxylation of free estrogen.
There was no significant interaction when stratifying by
physical activity (walking for exercise) (121).
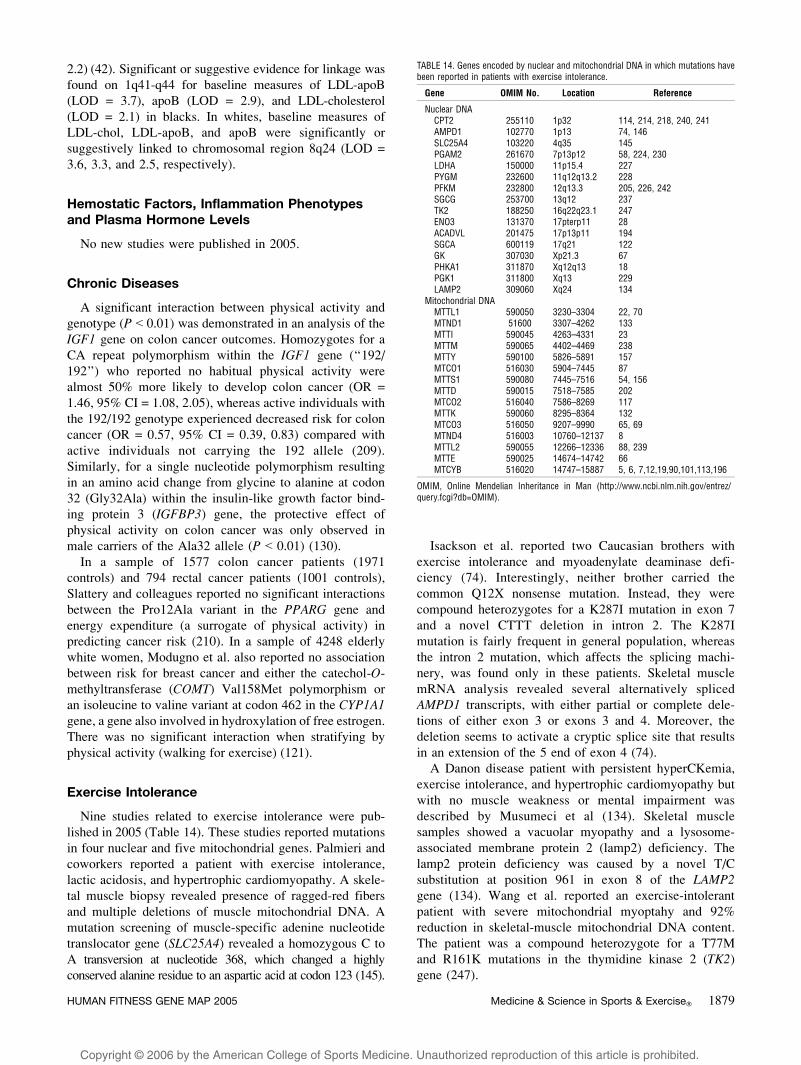
Exercise Intolerance
Nine studies related to exercise intolerance were pub-
lished in 2005 (Table 14). These studies reported mutations
in four nuclear and five mitochondrial genes. Palmieri and
coworkers reported a patient with exercise intolerance,
lactic acidosis, and hypertrophic cardiomyopathy. A skele-
tal muscle biopsy revealed presence of ragged-red fibers
and multiple deletions of muscle mitochondrial DNA. A
mutation screening of muscle-specific adenine nucleotide
translocator gene (SLC25A4) revealed a homozygous C to
A transversion at nucleotide 368, which changed a highly
conserved alanine residue to an aspartic acid at codon 123 (145).
Isackson et al. reported two Caucasian brothers with
exercise intolerance and myoadenylate deaminase defi-
ciency (74). Interestingly, neither brother carried the
common Q12X nonsense mutation. Instead, they were
compound heterozygotes for a K287I mutation in exon 7
and a novel CTTT deletion in intron 2. The K287I
mutation is fairly frequent in general population, whereas
the intron 2 mutation, which affects the splicing machi-
nery, was found only in these patients. Skeletal muscle
mRNA analysis revealed several alternatively spliced
AMPD1 transcripts, with either partial or complete dele-
tions of either exon 3 or exons 3 and 4. Moreover, the
deletion seems to activate a cryptic splice site that results
in an extension of the 5 end of exon 4 (74).
A Danon disease patient with persistent hyperCKemia,
exercise intolerance, and hypertrophic cardiomyopathy but
with no muscle weakness or mental impairment was
described by Musumeci et al (134). Skeletal muscle
samples showed a vacuolar myopathy and a lysosome-
associated membrane protein 2 (lamp2) deficiency. The
lamp2 protein deficiency was caused by a novel T/C
substitution at position 961 in exon 8 of the LAMP2gene (134). Wang et al. reported an exercise-intolerant
patient with severe mitochondrial myoptahy and 92%
reduction in skeletal-muscle mitochondrial DNA content.
The patient was a compound heterozygote for a T77M
and R161K mutations in the thymidine kinase 2 (TK2)
gene (247).
TABLE 14. Genes encoded by nuclear and mitochondrial DNA in which mutations havebeen reported in patients with exercise intolerance.
Gene OMIM No. Location Reference
Nuclear DNACPT2 255110 1p32 114, 214, 218, 240, 241AMPD1 102770 1p13 74, 146SLC25A4 103220 4q35 145PGAM2 261670 7p13p12 58, 224, 230LDHA 150000 11p15.4 227PYGM 232600 11q12q13.2 228PFKM 232800 12q13.3 205, 226, 242SGCG 253700 13q12 237TK2 188250 16q22q23.1 247ENO3 131370 17pterp11 28ACADVL 201475 17p13p11 194SGCA 600119 17q21 122GK 307030 Xp21.3 67PHKA1 311870 Xq12q13 18PGK1 311800 Xq13 229LAMP2 309060 Xq24 134
Mitochondrial DNAMTTL1 590050 3230–3304 22, 70MTND1 51600 3307–4262 133MTTI 590045 4263–4331 23MTTM 590065 4402–4469 238MTTY 590100 5826–5891 157MTCO1 516030 5904–7445 87MTTS1 590080 7445–7516 54, 156MTTD 590015 7518–7585 202MTCO2 516040 7586–8269 117MTTK 590060 8295–8364 132MTCO3 516050 9207–9990 65, 69MTND4 516003 10760–12137 8MTTL2 590055 12266–12336 88, 239MTTE 590025 14674–14742 66MTCYB 516020 14747–15887 5, 6, 7,12,19,90,101,113,196
OMIM, Online Mendelian Inheritance in Man (http://www.ncbi.nlm.nih.gov/entrez/query.fcgi?db=OMIM).
HUMAN FITNESS GENE MAP 2005 Medicine & Science in Sports & Exercised 1879
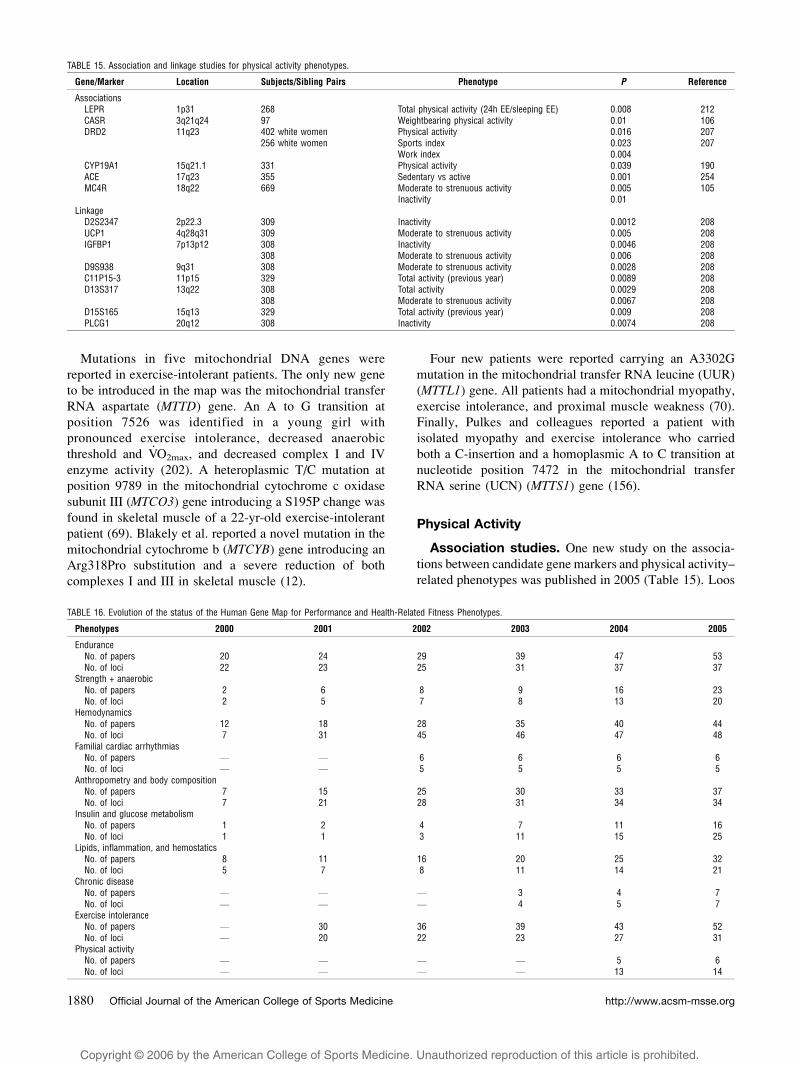
Copyright @ 2006 by the American College of Sports Medicine. Unauthorized reproduction of this article is prohibited.
Mutations in five mitochondrial DNA genes were
reported in exercise-intolerant patients. The only new gene
to be introduced in the map was the mitochondrial transfer
RNA aspartate (MTTD) gene. An A to G transition at
position 7526 was identified in a young girl with
pronounced exercise intolerance, decreased anaerobic
threshold and V.O2max, and decreased complex I and IV
enzyme activity (202). A heteroplasmic T/C mutation at
position 9789 in the mitochondrial cytochrome c oxidase
subunit III (MTCO3) gene introducing a S195P change was
found in skeletal muscle of a 22-yr-old exercise-intolerant
patient (69). Blakely et al. reported a novel mutation in the
mitochondrial cytochrome b (MTCYB) gene introducing an
Arg318Pro substitution and a severe reduction of both
complexes I and III in skeletal muscle (12).
Four new patients were reported carrying an A3302G
mutation in the mitochondrial transfer RNA leucine (UUR)
(MTTL1) gene. All patients had a mitochondrial myopathy,
exercise intolerance, and proximal muscle weakness (70).
Finally, Pulkes and colleagues reported a patient with
isolated myopathy and exercise intolerance who carried
both a C-insertion and a homoplasmic A to C transition at
nucleotide position 7472 in the mitochondrial transfer
RNA serine (UCN) (MTTS1) gene (156).
Physical Activity
Association studies. One new study on the associa-
tions between candidate gene markers and physical activity–
related phenotypes was published in 2005 (Table 15). Loos
TABLE 15. Association and linkage studies for physical activity phenotypes.
Gene/Marker Location Subjects/Sibling Pairs Phenotype P Reference
AssociationsLEPR 1p31 268 Total physical activity (24h EE/sleeping EE) 0.008 212CASR 3q21q24 97 Weightbearing physical activity 0.01 106DRD2 11q23 402 white women Physical activity 0.016 207
256 white women Sports index 0.023 207Work index 0.004
CYP19A1 15q21.1 331 Physical activity 0.039 190ACE 17q23 355 Sedentary vs active 0.001 254MC4R 18q22 669 Moderate to strenuous activity 0.005 105
Inactivity 0.01Linkage
D2S2347 2p22.3 309 Inactivity 0.0012 208UCP1 4q28q31 309 Moderate to strenuous activity 0.005 208IGFBP1 7p13p12 308 Inactivity 0.0046 208
308 Moderate to strenuous activity 0.006 208D9S938 9q31 308 Moderate to strenuous activity 0.0028 208C11P15-3 11p15 329 Total activity (previous year) 0.0089 208D13S317 13q22 308 Total activity 0.0029 208
308 Moderate to strenuous activity 0.0067 208D15S165 15q13 329 Total activity (previous year) 0.009 208PLCG1 20q12 308 Inactivity 0.0074 208
TABLE 16. Evolution of the status of the Human Gene Map for Performance and Health-Related Fitness Phenotypes.
Phenotypes 2000 2001 2002 2003 2004 2005
EnduranceNo. of papers 20 24 29 39 47 53No. of loci 22 23 25 31 37 37
Strength + anaerobicNo. of papers 2 6 8 9 16 23No. of loci 2 5 7 8 13 20
HemodynamicsNo. of papers 12 18 28 35 40 44No. of loci 7 31 45 46 47 48
Familial cardiac arrhythmiasNo. of papers V V 6 6 6 6No. of loci V V 5 5 5 5
Anthropometry and body compositionNo. of papers 7 15 25 30 33 37No. of loci 7 21 28 31 34 34
Insulin and glucose metabolismNo. of papers 1 2 4 7 11 16No. of loci 1 1 3 11 15 25
Lipids, inflammation, and hemostaticsNo. of papers 8 11 16 20 25 32No. of loci 5 7 8 11 14 21
Chronic diseaseNo. of papers V V V 3 4 7No. of loci V V V 4 5 7
Exercise intoleranceNo. of papers V 30 36 39 43 52No. of loci V 20 22 23 27 31
Physical activityNo. of papers V V V V 5 6No. of loci V V V V 13 14
http://www.acsm-msse.org1880 Official Journal of the American College of Sports Medicine

Copyright @ 2006 by the American College of Sports Medicine. Unauthorized reproduction of this article is prohibited.
and colleagues reported significant associations between a
C/T polymorphism located 2745 base pairs upstream of the
melanocortin 4 receptor (MC4R) gene start codon and physi-
cal activity phenotypes. Homozygotes for the rare T-allele
had significantly lower moderate-to-strenuous physical
activity levels and higher inactivity score than the other
genotypes (105).
Linkage studies. No new linkage studies were
published in 2005.
SUMMARY AND CONCLUSIONS
This review provides a compendium of all genes and
markers that have been associated with performance and
health-related fitness phenotypes in scientific papers
published by the end of 2005. Little progress has been
made in the last 12 months with respect to the genetic basis
of human variation in performance and health-related
fitness. Indeed, although a growing number of genes are
being identified, only a handful of them have been
investigated with a view to assess whether DNA sequence
variation in such genes play a role in the biological basis of
human individuality.
The 2005 map includes 165 autosomal entries, five X
chromosome assignments, and 17 mitochondrial DNA
markers. There are 25 more nuclear markers and one more
mitochondrial genome marker than in 2004. Given the
complexity of the performance- and health-related fitness
phenotypes, it should be obvious that we have a long way to
go before we have a satisfactory understanding of the role of
genetic inheritance on exercise-related traits and in the
adaptation to a physically active lifestyle. Given the growing
prevalence in obesity, type 2 diabetes, cardiovascular disease,
and other chronic diseases associated with physical inactivity,
an increased understanding of how the genetic susceptibilities
that lead to these diseases may interact with exercise and
physical activity interventions is urgently needed.
There is a growing number of genes with at least a
minimum of evidence supporting their involvement in
fitness- and performance-related phenotypes. This is
illustrated by the trends in the number of loci from 2000
to 2005 for the families of phenotypes as defined in this
review. Table 16 presents this synthesis for the 10 classes
of phenotypes considered here. In each case, the number of
genes or markers has increased slowly but steadily since
the topic was first reviewed in 2000.
REFERENCES
1. ABRAHAM, M. R., L. J. OLSON, M. J. JOYNER, S. T. TURNER, K. C.
BECK, and B. D. JOHNSON. Angiotensin-converting enzyme
genotype modulates pulmonary function and exercise capacity
in treated patients with congestive stable heart failure. Circu-lation 106:1794–1799, 2002.
2. ADAMO, K. B., R. J. SIGAL, K. WILLIAMS, G. KENNY, D.
PRUD_HOMME, and F. TESSON. Influence of Pro12Ala peroxisome
proliferator-activated receptor gamma2 polymorphism on glu-
cose response to exercise training in type 2 diabetes. Diabeto-logia 48:1503–1509, 2005.
3. ALVAREZ, R., N. TERRADOS, R. ORTOLANO, et al. Genetic variation
in the renin-angiotensin system and athletic performance. Eur.J. Appl. Physiol. 82:117–120, 2000.
4. AN, P., M. TERAN-GARCIA, T. RICE, T. RANKINEN, et al. Genome-
wide linkage scans for prediabetes phenotypes in response to
20 weeks of endurance exercise training in non-diabetic whites
and blacks: the HERITAGE Family Study. Diabetologia 48:
1142–1149, 2005.
5. ANDREU, A. L., C. BRUNO, T. C. DUNNE, et al. A nonsense
mutation (G15059A) in the cytochrome b gene in a patient with
exercise intolerance and myoglobinuria. Ann. Neurol. 45:
127–130, 1999.
6. ANDREU, A. L., C. BRUNO, S. SHANSKE, et al. Missense mutation
in the mtDNA cytochrome b gene in a patient with myopathy.
Neurology 51:1444–1447, 1998.
7. ANDREU, A. L., M. G. HANNA, H. REICHMANN, et al. Exercise
intolerance due to mutations in the cytochrome b gene of
mitochondrial DNA. N. Engl. J. Med. 341:1037–1044, 1999.
8. ANDREU, A. L., K. TANJI, C. BRUNO, et al. Exercise intolerance
due to a nonsense mutation in the mtDNA ND4 gene. Ann.Neurol. 45:820–823, 1999.
9. AYYOBI, A. F., J. S. HILL, H. O. MOLHUIZEN, and S. A. LEAR.
Cholesterol ester transfer protein (CETP) Taq1B polymorphism
influences the effect of a standardized cardiac rehabilitation
program on lipid risk markers. Atherosclerosis 181:363–369,
2005.
10. BERENTZEN, T., L. T. DALGAARD, L. PETERSEN, O. PEDERSEN, and
T. I. SORENSEN. Interactions between physical activity and
variants of the genes encoding uncoupling proteins -2 and -3
in relation to body weight changes during a 10-y follow-up. Int.J. Obes. (Lond.) 29:93–99, 2005.
11. BERNSTEIN, M. S., M. C. COSTANZA, R. W. JAMES, et al. Physical
activity may modulate effects of ApoE genotype on lipid
profile. Arterioscler. Thromb. Vasc. Biol. 22:133–140, 2002.
12. BLAKELY, E. L., A. L. MITCHELL, N. FISHER, et al. A
mitochondrial cytochrome b mutation causing severe respira-
tory chain enzyme deficiency in humans and yeast. FEBS J.272:3583–3592, 2005.
13. BLANCHET, C., Y. GIGUERE, D. PRUD_HOMME, M. DUMONT, F.
ROUSSEAU, and S. DODIN. Association of physical activity and
bone: influence of vitamin D receptor genotype. Med. Sci.Sports Exerc. 34:24–31, 2002.
14. BOER, J. M., J. A. KUIVENHOVEN, E. J. FESKENS, et al. Physical
activity modulates the effect of a lipoprotein lipase mutation
(D9N) on plasma lipids and lipoproteins. Clin. Genet. 56:
158–163, 1999.
15. BOUCHARD, C., T. RANKINEN, Y. C. CHAGNON, et al. Genomic
scan for maximal oxygen uptake and its response to training in
the HERITAGE Family Study. J. Appl. Physiol. 88:551–559,
2000.
16. BRULL, D., S. DHAMRAIT, S. MYERSON, et al. Bradykinin B2BKR
receptor polymorphism and left-ventricular growth response.
Lancet 358:1155–1156, 2001.
17. BRULL, D. J., S. DHAMRAIT, R. MOULDING, et al. The effect of
fibrinogen genotype on fibrinogen levels after strenuous
physical exercise. Thromb. Haemost. 87:37–41, 2002.
18. BRUNO, C., G. MANFREDI, A. L. ANDREU, et al. A splice junction
mutation in the alpha(M) gene of phosphorylase kinase in a
patient with myopathy. Biochem. Biophys. Res. Commun.249:648–651, 1998.
19. BRUNO, C., F. M. SANTORELLI, S. ASSERETO, et al. Progressive
exercise intolerance associated with a new muscle-restricted
nonsense mutation (G142X) in the mitochondrial cytochrome b
gene. Muscle Nerve 28:508–511, 2003.
20. BUEMANN, B., B. SCHIERNING, S. TOUBRO, et al. The association
between the val/ala-55 polymorphism of the uncoupling protein
2 gene and exercise efficiency. Int. J. Obes. Relat. Metab.Disord. 25:467–471, 2001.
HUMAN FITNESS GENE MAP 2005 Medicine & Science in Sports & Exercised 1881
Copyright @ 2006 by the American College of Sports Medicine. Unauthorized reproduction of this article is prohibited.
21. CAM, F. S., M. COLAKOGLU, C. SEKURI, S. COLAKOGLU, C. SAHAN,
and A. BERDELI. Association between the ACE I/D gene
polymorphism and physical performance in a homogeneous
non-elite cohort. Can. J. Appl. Physiol. 30:74–86, 2005.
22. CAMPOS, Y., J. BAUTISTA, E. GUTIERREZ-RIVAS, et al. Clinical
heterogeneity in two pedigrees with the 3243 bp tRNA
(Leu(UUR)) mutation of mitochondrial DNA. Acta Neurol.Scand. 91:62–65, 1995.
23. CAMPOS, Y., A. GARCIA, A. LOPEZ, et al. Cosegregation of the
mitochondrial DNA A1555G and G4309A mutations results
in deafness and mitochondrial myopathy. Muscle Nerve 25:
185–188, 2002.
24. CHAGNON, Y. C., T. RICE, L. PERUSSE, et al. Genomic scan for
genes affecting body composition before and after training in
Caucasians from HERITAGE. J. Appl. Physiol. 90:1777–1787,
2001.
25. CLARKSON, P. M., J. M. DEVANEY, H. GORDISH-DRESSMAN, et al.
ACTN3 genotype is associated with increases in muscle
strength in response to resistance training in women. J. Appl.Physiol. 99:154–163, 2005.
26. CLARKSON, P. M., E. P. HOFFMAN, E. ZAMBRASKI, et al. ACTN3
and MLCK genotype associations with exertional muscle
damage. J. Appl. Physiol. 99:564–569, 2005.
27. COLLINS, M., S. L. XENOPHONTOS, M. A. CARIOLOU, et al. The
ACE gene and endurance performance during the South African
Ironman Triathlons. Med. Sci. Sports Exerc. 36:1314–1320,
2004.
28. COMI, G. P., F. FORTUNATO, S. LUCCHIARI, et al. Beta-enolase
deficiency, a new metabolic myopathy of distal glycolysis. Ann.Neurol. 50:202–207, 2001.
29. CORBALAN, M. S. The 27Glu polymorphism of the beta2-
adrenergic receptor gene interacts with physical activity
influencing obesity risk among female subjects. Clin. Genet.61:305–307, 2002.
30. CORELLA, D., M. GUILLEN, C. SAIZ, et al. Environmental factors
modulate the effect of the APOE genetic polymorphism on
plasma lipid concentrations: ecogenetic studies in a Mediterra-
nean Spanish population. Metabolism 50:936–944, 2001.
31. DATA, S. A., M. H. ROLTSCH, B. HAND, R. E. FERRELL, J. J. PARK,
and M. D. BROWN. eNOS T-786C genotype, physical activity,
and peak forearm blood flow in females. Med. Sci. SportsExerc. 35:1991–1997, 2003.
32. DE GROOTE, P., N. LAMBLIN, N. HELBECQUE, et al. The impact of
beta-adrenoreceptor gene polymorphisms on survival in patients
with congestive heart failure. Eur. J. Heart Fail. 7:966–973, 2005.
33. DELANGHE, J., M. LANGLOIS, D. DUPREZ, M. DE BUYZERE, and
D. CLEMENT. Haptoglobin polymorphism and peripheral arterial
occlusive disease. Atherosclerosis 145:287–292, 1999.
34. DELMONICO, M. J., R. E. FERRELL, A. MEERASAHIB, et al. Blood
pressure response to strength training may be influenced by
angiotensinogen A-20C and angiotensin II type I receptor
A1166C genotypes in older men and women. J. Am. Geriatr.Soc. 53:204–210, 2005.
35. DENGEL, D. R., M. D. BROWN, R. E. FERRELL, T. H. t REYNOLDS,
and M. A. SUPIANO. Exercise-induced changes in insulin action
are associated with ACE gene polymorphisms in older adults.
Physiol. Genomics 11:73–80, 2002.
36. DHAMRAIT, S. S., L. JAMES, D. J. BRULL, et al. Cortical bone
resorption during exercise is interleukin-6 genotype-dependent.
Eur. J. Appl. Physiol. 89:21–25, 2003.
37. DIONNE, F. T., L. TURCOTTE, M. C. THIBAULT, M. R. BOULAY, J. S.
SKINNER, and C. BOUCHARD. Mitochondrial DNA sequence
polymorphism, VO2max, and response to endurance training.
Med. Sci. Sports Exerc. 23:177–185, 1991.
38. EISENACH, J. H., S. A. BARNES, T. L. PIKE, et al. Arg16/Gly
beta2-adrenergic receptor polymorphism alters the cardiac
output response to isometric exercise. J. Appl. Physiol.99:1776–1781, 2005.
39. EISENACH, J. H., A. M. MCGUIRE, R. M. SCHWINGLER, S. T.
TURNER, and M. J. JOYNER. The Arg16/Gly beta2-adrenergic
receptor polymorphism is associated with altered cardiovascular
responses to isometric exercise. Physiol. Genomics 16:323–328,
2004.
40. ERBS, S., Y. BAITHER, A. LINKE, et al. Promoter but not exon 7
polymorphism of endothelial nitric oxide synthase affects
training-induced correction of endothelial dysfunction. Arte-rioscler. Thromb. Vasc. Biol. 23:1814–1819, 2003.
41. FATINI, C., R. GUAZZELLI, P. MANETTI, et al. RAS genes influence
exercise-induced left ventricular hypertrophy: an elite athletes
study. Med. Sci. Sports Exerc. 32:1868–1872, 2000.
42. FEITOSA, M. F., I. B. BORECKI, T. RANKINEN, et al. Evidence of
QTLs on chromosomes 1q42 and 8q24 for LDL-cholesterol and
apoB levels in the HERITAGE family study. J. Lipid Res.46:281–286, 2005.
43. FEITOSA, M. F., T. RICE, T. RANKINEN, et al. Evidence of QTLs
on chromosomes 13q and 14q for triglycerides before and after
20 weeks of exercise training: the HERITAGE Family Study.
Atherosclerosis 182:349–360, 2005.
44. FOLLAND, J., B. LEACH, T. LITTLE, et al. Angiotensin-converting
enzyme genotype affects the response of human skeletal muscle
to functional overload. Exp. Physiol. 85:575–579, 2000.
45. FRANKS, P. W., I. BARROSO, J. LUAN, et al. PGC-1alpha genotype
modifies the association of volitional energy expenditure with
[OV0312]O2max. Med. Sci. Sports Exerc. 35:1998–2004, 2003.
46. FRANKS, P. W., S. BHATTACHARYYA, J. LUAN, et al. Association
between physical activity and blood pressure is modified by
variants in the G-protein coupled receptor 10. Hypertension43:224–228, 2004.
47. FRIEDL, W., F. KREMPLER, F. SANDHOFER, and B. PAULWEBER.
Insertion/deletion polymorphism in the angiotensin-converting-
enzyme gene and blood pressure during ergometry in normal
males. Clin. Genet. 50:541–544, 1996.
48. FRIEDL, W., J. MAIR, M. PICHLER, B. PAULWEBER, F. SANDHOFER,
and B. PUSCHENDORF. Insertion/deletion polymorphism in the
angiotensin-converting enzyme gene is associated with atrial
natriuretic peptide activity after exercise. Clin. Chim. Acta274:199–211, 1998.
49. GARENC, C., L. PERUSSE, J. BERGERON, et al. Evidence of LPL
gene-exercise interaction for body fat and LPL activity: the
HERITAGE Family Study. J. Appl. Physiol. 91:1334–1340,
2001.
50. GARENC, C., L. PERUSSE, Y. C. CHAGNON, et al. Effects of beta2-
adrenergic receptor gene variants on adiposity: the HERITAGE
Family Study. Obes. Res. 11:612–618, 2003.
51. GAYAGAY, G., B. YU, B. HAMBLY, et al. Elite endurance athletes
and the ACE I allele–the role of genes in athletic performance.
Hum. Genet. 103:48–50, 1998.
52. GEUSENS, P., C. VANDEVYVER, J. VANHOOF, J. J. CASSIMAN, S.
BOONEN, and J. RAUS. Quadriceps and grip strength are related
to vitamin D receptor genotype in elderly nonobese women.
J. Bone Miner. Res. 12:2082–2088, 1997.
53. GOSKER, H. R., H. J. PENNINGS, and A. M. SCHOLS. ACE gene
polymorphism in COPD. Am. J. Respir. Crit. Care Med.170:572–573, 2004.
54. GRAFAKOU, O., F. A. HOL, K. OTFRIED SCHWAB, et al. Exercise
intolerance, muscle pain and lactic acidaemia associated with a
7497G(A mutation in the tRNASer(UCN) gene. J. Inherit.Metab. Dis. 26:593–600, 2003.
55. GRUNDBERG, E., H. BRANDSTROM, E. L. RIBOM, O. LJUNGGREN,
H. MALLMIN, and A. KINDMARK. Genetic variation in the human
vitamin D receptor is associated with muscle strength, fat
mass and body weight in Swedish women. Eur. J. Endocrinol.150:323–328, 2004.
56. GRUNDBERG, E., E. L. RIBOM, H. BRANDSTROM, O. LJUNGGREN,
H. MALLMIN, and A. KINDMARK. A TA-repeat polymorphism in
the gene for the estrogen receptor alpha does not correlate with
http://www.acsm-msse.org1882 Official Journal of the American College of Sports Medicine
Copyright @ 2006 by the American College of Sports Medicine. Unauthorized reproduction of this article is prohibited.
muscle strength or body composition in young adult Swedish
women. Maturitas 50:153–160, 2005.
57. GRUNIG, E., B. JANSSEN, D. MERELES, et al. Abnormal pulmonary
artery pressure response in asymptomatic carriers of primary
pulmonary hypertension gene. Circulation 102:1145–1150,
2000.
58. HADJIGEORGIOU, G. M., N. KAWASHIMA, C. BRUNO, et al.
Manifesting heterozygotes in a Japanese family with a novel
mutation in the muscle-specific phosphoglycerate mutase
(PGAM-M) gene. Neuromuscul. Disord. 9:399–402, 1999.
59. HAGBERG, J. M., R. E. FERRELL, D. R. DENGEL, and K. R.
WILUND. Exercise training-induced blood pressure and plasma
lipid improvements in hypertensives may be genotype depend-
ent. Hypertension 34:18–23, 1999.
60. HAGBERG, J. M., R. E. FERRELL, L. I. KATZEL, D. R. DENGEL, J. D.
SORKIN, and A. P. GOLDBERG. Apolipoprotein E genotype and
exercise training-induced increases in plasma high-density
lipoprotein (HDL)- and HDL2-cholesterol levels in overweight
men. Metabolism 48:943–945, 1999.
61. HAGBERG, J. M., R. E. FERRELL, S. D. MCCOLE, K. R. WILUND,
and G. E. MOORE. VO2max is associated with ACE genotype in
postmenopausal women. J. Appl. Physiol. 85:1842–1846, 1998.
62. HAGBERG, J. M., S. D. MCCOLE, M. D. BROWN, et al. ACE
insertion/deletion polymorphism and submaximal exercise
hemodynamics in postmenopausal women. J. Appl. Physiol.92:1083–1088, 2002.
63. HALVERSTADT, A., D. A. PHARES, R. E. FERRELL, K. R. WILUND,
A. P. GOLDBERG, and J. M. HAGBERG. High-density lipoprotein-
cholesterol, its subfractions, and responses to exercise training
are dependent on endothelial lipase genotype. Metabolism52:1505–1511, 2003.
64. HALVERSTADT, A., D. A. PHARES, S. ROTH, R. E. FERRELL, A. P.
GOLDBERG, and J. M. HAGBERG. Interleukin-6 genotype is
associated with high-density lipoprotein cholesterol responses
to exercise training. Biochim. Biophys. Acta 1734:143–151, 2005.
65. HANNA, M. G., I. P. NELSON, S. RAHMAN, et al. Cytochrome c
oxidase deficiency associated with the first stop-codon point
mutation in human mtDNA. Am. J. Hum. Genet. 63:29–36,
1998.
66. HAO, H., E. BONILLA, G. MANFREDI, S. DIMAURO, and C. T.
MORAES. Segregation patterns of a novel mutation in the
mitochondrial tRNA glutamic acid gene associated with
myopathy and diabetes mellitus. Am. J. Hum. Genet. 56:
1017–1025, 1995.
67. HELLERUD, C., N. WRAMNER, A. ERIKSON, A. JOHANSSON, G.
SAMUELSON, and S. LINDSTEDT. Glycerol kinase deficiency:
follow-up during 20 years, genetics, biochemistry and prog-
nosis. Acta Paediatr. 93:911–921, 2004.
68. HOPKINSON, N. S., A. H. NICKOL, J. PAYNE, et al. Angiotensin
converting enzyme genotype and strength in chronic obstruc-
tive pulmonary disease. Am. J. Respir. Crit. Care Med. 170:
395–399, 2004.
69. HORVATH, R., B. G. SCHOSER, J. MULLER-HOCKER, M. VOLPEL, M.
JAKSCH, and H. LOCHMULLER. Mutations in mtDNA-encoded
cytochrome c oxidase subunit genes causing isolated myopa-
thy or severe encephalomyopathy. Neuromuscul. Disord. 15:
851–857, 2005.
70. HUTCHISON, W. M., D. THYAGARAJAN, J. POULTON, et al. Clinical
and molecular features of encephalomyopathy due to the
A3302G mutation in the mitochondrial tRNA(Leu(UUR)) gene.
Arch. Neurol. 62:1920–1923, 2005.
71. HUYGENS, W., M. A. THOMIS, M. W. PEETERS, et al. Linkage of
myostatin pathway genes with knee strength in humans.
Physiol. Genomics 17:264–270, 2004.
72. HUYGENS, W., M. A. THOMIS, M. W. PEETERS, et al. A
quantitative trait locus on 13q14.2 for trunk strength. Twin.Res. 7:603–606, 2004.
73. HUYGENS, W., M. A. THOMIS, M. W. PEETERS, J. AERSSENS, R.
VLIETINCK, and G. P. BEUNEN. Quantitative trait loci for human
muscle strength: linkage analysis of myostatin pathway genes.
Physiol. Genomics 22:390–397, 2005.
74. ISACKSON, P. J., H. BUJNICKI, C. O. HARDING, and G. D. VLADUTIU.
Myoadenylate deaminase deficiency caused by alternative
splicing due to a novel intronic mutation in the AMPD1 gene.
Mol. Genet. Metab. 86:250–256, 2005.
75. IVEY, F. M., S. M. ROTH, R. E. FERRELL, et al. Effects of age,
gender, and myostatin genotype on the hypertrophic response to
heavy resistance strength training. J. Gerontol. A Biol. Sci. Med.Sci. 55:M641–M648, 2000.
76. JAMSHIDI, Y., H. E. MONTGOMERY, H. W. HENSE, et al.
Peroxisome proliferator–activated receptor alpha gene regulates
left ventricular growth in response to exercise and hypertension.
Circulation 105:950–955, 2002.
77. KAHARA, T., T. HAYAKAWA, Y. NAGAI, A. SHIMIZU, and
T. TAKAMURA. Gln27Glu polymorphism of the beta2 adrenergic
receptor gene in healthy Japanese men is associated with the
change of fructosamine level caused by exercise. Diabetes Res.Clin. Pract. 64:207–212, 2004.
78. KAHARA, T., T. TAKAMURA, T. HAYAKAWA, et al. PPARgamma
gene polymorphism is associated with exercise-mediated
changes of insulin resistance in healthy men. Metabolism52:209–212, 2003.
79. KAHARA, T., T. TAKAMURA, T. HAYAKAWA, et al. Prediction of
exercise-mediated changes in metabolic markers by gene poly-
morphism. Diabetes Res. Clin. Pract. 57:105–110, 2002.
80. KALLIO, J., U. PESONEN, K. KAIPIO, et al. Altered intracellular
processing and release of neuropeptide Y due to leucine 7 to
proline 7 polymorphism in the signal peptide of preproneuro-
peptide Y in humans. Faseb. J. 15:1242–1244, 2001.
81. KALLIO, J., U. PESONEN, M. K. KARVONEN, et al. Enhanced
exercise-induced GH secretion in subjects with Pro7 sub-
stitution in the prepro-NPY. J. Clin. Endocrinol. Metab. 86:
5348–5352, 2001.
82. KANAZAWA, H., K. HIRATA, and J. YOSHIKAWA. Effects of cap-
topril administration on pulmonary haemodynamics and tissue
oxygenation during exercise in ACE gene subtypes in
patients with COPD: a preliminary study. Thorax 58:629–
631, 2003.
83. KANAZAWA, H., K. HIRATA, and J. YOSHIKAWA. Influence of
oxygen administration on pulmonary haemodynamics and tissue
oxygenation during exercise in COPD patients with different
ACE genotypes. Clin. Physiol. Funct. Imaging 23:332–336,
2003.
84. KANAZAWA, H., T. OKAMOTO, K. HIRATA, and J. YOSHIKAWA.
Deletion polymorphisms in the angiotensin converting enzyme
gene are associated with pulmonary hypertension evoked by
exercise challenge in patients with chronic obstructive pulmo-
nary disease. Am. J. Respir. Crit. Care Med. 162:1235–1238,
2000.
85. KANAZAWA, H., T. OTSUKA, K. HIRATA, and J. YOSHIKAWA.
Association between the angiotensin-converting enzyme gene
polymorphisms and tissue oxygenation during exercise in
patients with COPD. Chest 121:697–701, 2002.
86. KANAZAWA, H., Y. TATEISHI, and J. YOSHIKAWA. Acute effects of
nifedipine administration in pulmonary haemodynamics and
oxygen delivery during exercise in patients with chronic
obstructive pulmonary disease: implication of the angiotensin-
converting enzyme gene polymorphisms. Clin. Physiol. Funct.Imaging 24:224–228, 2004.
87. KARADIMAS, C. L., P. GREENSTEIN, C. M. SUE, et al. Recurrent
myoglobinuria due to a nonsense mutation in the COX I gene of
mitochondrial DNA. Neurology 55:644–649, 2000.
88. KARADIMAS, C. L., L. SALVIATI, S. SACCONI, et al. Mitochondrial
myopathy and ophthalmoplegia in a sporadic patient with the
G12315A mutation in mitochondrial DNA. Neuromuscul.Disord. 12:865–868, 2002.
89. KASIKCIOGLU, E., A. KAYSERILIOGLU, F. CILOGLU, et al. Angio-
tensin-converting enzyme gene polymorphism, left ventricular
HUMAN FITNESS GENE MAP 2005 Medicine & Science in Sports & Exercised 1883
Copyright @ 2006 by the American College of Sports Medicine. Unauthorized reproduction of this article is prohibited.
remodeling, and exercise capacity in strength-trained athletes.
Heart Vessels 19:287–293, 2004.
90. KEIGHTLEY, J. A., R. ANITORI, M. D. BURTON, F. QUAN, N. R.
BUIST, and N. G. KENNAWAY. Mitochondrial encephalomyopathy
and complex III deficiency associated with a stop-codon
mutation in the cytochrome b gene. Am. J. Hum. Genet.67:1400–1410, 2000.
91. KIMURA, T., T. YOKOYAMA, Y. MATSUMURA, et al. NOS3
genotype-dependent correlation between blood pressure and
physical activity. Hypertension 41:355–360, 2003.
92. KITAGAWA, I., Y. KITAGAWA, T. NAGAYA, and S. TOKUDOME.
Interplay of physical activity and vitamin D receptor
gene polymorphism on bone mineral density. J. Epidemiol.11:229–232, 2001.
93. KOSTEK, M. C., M. J. DELMONICO, J. B. REICHEL, et al. Muscle
strength response to strength training is influenced by insulin-
like growth factor 1 genotype in older adults. J. Appl. Physiol.98:2147–2154, 2005.
94. KRITCHEVSKY, S. B., B. J. NICKLAS, M. VISSER, et al. Angiotensin-
converting enzyme insertion/deletion genotype, exercise, and
physical decline. JAMA 294:691–698, 2005.
95. KRIZANOVA, O., J. KOSKA, M. VIGAS, and R. KVETNANSKY.
Correlation of M235T DNA polymorphism with cardiovascular
and endocrine responses during physical exercise in healthy
subjects. Physiol. Res. 47:81–88, 1998.
96. LAHAT, H., M. ELDAR, E. LEVY-NISSENBAUM, et al. Autosomal re-
cessive catecholamine- or exercise-induced polymorphic ventri-
cular tachycardia: clinical features and assignment of the disease
gene to chromosome 1p13-21. Circulation 103:2822–2827, 2001.
97. LAHAT, H., E. PRAS, T. OLENDER, et al. A missense mutation in a
highly conserved region of CASQ2 is associated with autosomal
recessive catecholamine-induced polymorphic ventricular
tachycardia in Bedouin families from Israel. Am. J. Hum.Genet. 69:1378–1384, 2001.
98. LAITINEN, P. J., K. M. BROWN, K. PIIPPO, et al. Mutations of the
cardiac ryanodine receptor (RyR2) gene in familial polymor-
phic ventricular tachycardia. Circulation 103:485–490, 2001.
99. LAKKA, T. A., T. RANKINEN, S. J. WEISNAGEL, et al. Leptin and
leptin receptor gene polymorphisms and changes in glucose
homeostasis in response to regular exercise in nondiabetic indi-
viduals: the HERITAGE family study. Diabetes 53:1603–1608,
2004.
100. LAKKA, T. A., T. RANKINEN, S. J. WEISNAGEL, et al. A quantitative
trait locus on 7q31 for the changes in plasma insulin in response
to exercise training: the HERITAGE Family Study. Diabetes52:1583–1587, 2003.
101. LAMANTEA, E., F. CARRARA, C. MARIOTTI, L. MORANDI, V.
TIRANTI, and M. ZEVIANI. A novel nonsense mutation (Q352X)
in the mitochondrial cytochrome b gene associated with a
combined deficiency of complexes I and III. Neuromuscul.Disord. 12:49–52, 2002.
102. LANOUETTE, C. M., Y. C. CHAGNON, T. RICE, et al. Uncoupling
protein 3 gene is associated with body composition changes
with training in HERITAGE study. J. Appl. Physiol. 92:
1111–1118, 2002.
103. LEON, A. S., K. TOGASHI, T. RANKINEN, et al. Association of
apolipoprotein E polymorphism with blood lipids and maximal
oxygen uptake in the sedentary state and after exercise training
in the HERITAGE family study. Metabolism 53:108–116,
2004.
104. LINDI, V. I., M. I. UUSITUPA, J. LINDSTROM, et al. Association of
the Pro12Ala polymorphism in the PPAR-gamma2 gene with 3-
year incidence of type 2 diabetes and body weight change in the
Finnish Diabetes Prevention Study. Diabetes 51:2581–2586, 2002.
105. LOOS, R. J., T. RANKINEN, A. TREMBLAY, L. PERUSSE, Y. CHAGNON,
and C. BOUCHARD. Melanocortin-4 receptor gene and physical
activity in the Quebec Family Study. Int. J. Obes. (Lond)29:420–428, 2005.
106. LORENTZON, M., R. LORENTZON, U. H. LERNER, and P. NORDSTROM.
Calcium sensing receptor gene polymorphism, circulating
calcium concentrations and bone mineral density in healthy
adolescent girls. Eur. J. Endocrinol. 144:257–261, 2001.
107. LORENTZON, M., R. LORENTZON, and P. NORDSTROM. Vitamin D
receptor gene polymorphism is related to bone density,
circulating osteocalcin, and parathyroid hormone in healthy
adolescent girls. J. Bone Miner. Metab. 19:302–307, 2001.
108. LUCIA, A., F. GOMEZ-GALLEGO, I. BARROSO, et al. PPARGC1A
genotype (Gly482Ser) predicts exceptional endurance capacity
in European men. J. Appl. Physiol. 99:344–348, 2005.
109. LUCIA, A., F. GOMEZ-GALLEGO, J. L. CHICHARRO, et al. Is there an
association between ACE and CKMM polymorphisms and
cycling performance status during 3-week races?Int. J. SportsMed. 26:442–447, 2005.
110. MACHO-AZCARATE, T., J. CALABUIG, A. MARTI, and J. A.
MARTINEZ. A maximal effort trial in obese women carrying the
beta2-adrenoceptor Gln27Glu polymorphism. J. Physiol. Bio-chem. 58:103–108, 2002.
111. MACHO-AZCARATE, T., A. MARTI, J. CALABUIG, and J. A.
MARTINEZ. Basal fat oxidation and after a peak oxygen
consumption test in obese women with a beta2 adrenoceptor
gene polymorphism. J. Nutr. Biochem. 14:275–279, 2003.
112. MACHO-AZCARATE, T., A. MARTI, A. GONZALEZ, J. A. MARTINEZ,
and J. IBANEZ. Gln27Glu polymorphism in the beta2 adrenergic
receptor gene and lipid metabolism during exercise in obese
women. Int. J. Obes. Relat. Metab. Disord. 26:1434–1441, 2002.
113. MANCUSO, M., M. FILOSTO, J. C. STEVENS, et al. Mitochondrial
myopathy and complex III deficiency in a patient with a
new stop-codon mutation (G339X) in the cytochrome b gene.
J. Neurol. Sci. 209:61–63, 2003.
114. MARTIN, M. A., J. C. RUBIO, P. DEL HOYO, et al. Identification of
novel mutations in Spanish patients with muscle carnitine
palmitoyltransferase II deficiency. Hum. Mutat. 15:579–580,
2000.
115. MCCOLE, S. D., M. D. BROWN, G. E. MOORE, et al. Angiotensi-
nogen M235T polymorphism associates with exercise hemo-
dynamics in postmenopausal women. Physiol. Genomics 10:
63–69, 2002.
116. MCCOLE, S. D., A. R. SHULDINER, M. D. BROWN, et al. Beta2- and
beta3-adrenergic receptor polymorphisms and exercise hemo-
dynamics in postmenopausal women. J. Appl. Physiol. 96:
526–530, 2004.
117. MCFARLAND, R., R. W. TAYLOR, P. F. CHINNERY, N. HOWELL, and
D. M. TURNBULL. A novel sporadic mutation in cytochrome c
oxidase subunit II as a cause of rhabdomyolysis. Neuromuscul.Disord. 14:162–166, 2004.
118. MCKENZIE, J. A., E. P. WEISS, I. A. GHIU, et al. Influence of the
interleukin-6 -174 G/C gene polymorphism on exercise training-
induced changes in glucose tolerance indexes. J. Appl. Physiol.97:1338–1342, 2004.
119. MEIRHAEGHE, A., N. HELBECQUE, D. COTTEL, and P. AMOUYEL.
Beta2-adrenoceptor gene polymorphism, body weight, and
physical activity. Lancet 353:896, 1999.
120. MEIRHAEGHE, A., J. LUAN, P. SELBERG-FRANKS, et al. The effect of
the Gly16Arg polymorphism of the beta(2)-adrenergic receptor
gene on plasma free fatty acid levels is modulated by physical
activity. J. Clin. Endocrinol. Metab. 86:5881–5887, 2001.
121. MODUGNO, F., J. M. ZMUDA, D. POTTER, et al. Estrogen
metabolizing polymorphisms and breast cancer risk among older
white women. Breast Cancer Res. Treat. 93:261–270, 2005.
122. MONGINI, T., C. DORIGUZZI, I. BOSONE, L. CHIADO-PIAT, E. P.
HOFFMAN, and L. PALMUCCI. Alpha-sarcoglycan deficiency
featuring exercise intolerance and myoglobinuria. Neuropedi-atrics 33:109–111, 2002.
123. MONTGOMERY, H., P. CLARKSON, M. BARNARD, et al. Angiotensin-
converting-enzyme gene insertion/deletion polymorphism and
response to physical training. Lancet 353:541–545, 1999.
http://www.acsm-msse.org1884 Official Journal of the American College of Sports Medicine
Copyright @ 2006 by the American College of Sports Medicine. Unauthorized reproduction of this article is prohibited.
124. MONTGOMERY, H. E., P. CLARKSON, C. M. DOLLERY, et al.
Association of angiotensin-converting enzyme gene I/D poly-
morphism with change in left ventricular mass in response to
physical training. Circulation 96:741–747, 1997.
125. MONTGOMERY, H. E., P. CLARKSON, O. M. NWOSE, et al. The acute
rise in plasma fibrinogen concentration with exercise is
influenced by the G-453-A polymorphism of the beta-fibrinogen
gene. Arterioscler. Thromb. Vasc. Biol. 16:386–391, 1996.
126. MONTGOMERY, H. E., R. MARSHALL, H. HEMINGWAY, et al. Human
gene for physical performance. Nature 393:221–222, 1998.
127. MOORE, G. E., A. R. SHULDINER, J. M. ZMUDA, R. E. FERRELL,
S. D. MCCOLE, and J. M. HAGBERG. Obesity gene variant and
elite endurance performance. Metabolism 50:1391–1392, 2001.
128. MORAN, C. N., R. A. SCOTT, S. M. ADAMS, et al. Y chromosome
haplogroups of elite Ethiopian endurance runners. Hum. Genet.115:492–497, 2004.
129. MORAN, C. N., C. VASSILOPOULOS, A. TSIOKANOS, et al. Effects of
interaction between angiotensin I-converting enzyme polymor-
phisms and lifestyle on adiposity in adolescent Greeks. Obes.Res. 13:1499–1504, 2005.
130. MORIMOTO, L. M., P. A. NEWCOMB, E. WHITE, J. BIGLER, and J. D.
POTTER. Insulin-like growth factor polymorphisms and color-
ectal cancer risk. Cancer Epidemiol. Biomarkers Prev. 14:
1204–1211, 2005.
131. MUKHERJEE, M., and K. R. SHETTY. Variations in high-density
lipoprotein cholesterol in relation to physical activity and Taq
1B polymorphism of the cholesteryl ester transfer protein gene.
Clin. Genet. 65:412–418, 2004.
132. MUNOZ-MALAGA, A., J. BAUTISTA, J. A. SALAZAR, et al. Lip-
omatosis, proximal myopathy, and the mitochondrial 8344 mu-
tation. A lipid storage myopathy? Muscle Nerve 23:538–542,
2000.
133. MUSUMECI, O., A. L. ANDREU, S. SHANSKE, et al. Intragenic
inversion of mtDNA: a new type of pathogenic mutation in a
patient with mitochondrial myopathy. Am. J. Hum. Genet.66:1900–1904, 2000.
134. MUSUMECI, O., C. RODOLICO, I. NISHINO, et al. Asymptomatic
hyperCKemia in a case of Danon disease due to a missense
mutation in Lamp-2 gene. Neuromuscul. Disord. 15:409–411,
2005.
135. MYERSON, S., H. HEMINGWAY, R. BUDGET, J. MARTIN, S.
HUMPHRIES, and H. MONTGOMERY. Human angiotensin I-convert-
ing enzyme gene and endurance performance. J. Appl. Physiol.87:1313–1316, 1999.
136. MYERSON, S. G., H. E. MONTGOMERY, M. WHITTINGHAM, et al.
Left ventricular hypertrophy with exercise and ACE gene
insertion/deletion polymorphism: a randomized controlled trial
with Losartan. Circulation 103:226–230, 2001.
137. NAKAMURA, O., T. ISHII, Y. ANDO, et al. Potential role of vitamin
D receptor gene polymorphism in determining bone phenotype
in young male athletes. J. Appl. Physiol. 93:1973–1979, 2002.
138. NAZAROV, I. B., D. R. WOODS, H. E. MONTGOMERY, et al. The
angiotensin converting enzyme I/D polymorphism in Russian
athletes. Eur. J. Hum. Genet. 9:797–801, 2001.
139. NICKLAS, B. J., J. MYCHALECKYJ, S. KRITCHEVSKY, et al. Physical
function and its response to exercise: associations with cytokine
gene variation in older adults with knee osteoarthritis.
J. Gerontol. A Biol. Sci. Med. Sci. 60:1292–1298, 2005.
140. NIEMI, A. K., and K. MAJAMAA. Mitochondrial DNA and ACTN3
genotypes in Finnish elite endurance and sprint athletes. Eur. J.Hum. Genet. 13:965–969, 2005.
141. ORTLEPP, J. R., J. METRIKAT, M. ALBRECHT, A. VON KORFF,
P. HANRATH, and R. HOFFMANN. The vitamin D receptor gene
variant and physical activity predicts fasting glucose levels in
healthy young men. Diabet. Med. 20:451–454, 2003.
142. ORTLEPP, J. R., J. METRIKAT, K. VESPER, et al. The interleukin-6
promoter polymorphism is associated with elevated leukocyte,
lymphocyte, and monocyte counts and reduced physical fitness
in young healthy smokers. J. Mol. Med. 81:578–584, 2003.
143. OSTERGARD, T., J. EK, Y. HAMID, et al. Influence of the PPAR-
gamma2 Pro12Ala and ACE I/D polymorphisms on insulin
sensitivity and training effects in healthy offspring of type 2
diabetic subjects. Horm. Metab. Res. 37:99–105, 2005.
144. OTABE, S., K. CLEMENT, C. DINA, et al. A genetic variation in the
5’ flanking region of the UCP3 gene is associated with body
mass index in humans in interaction with physical activity.
Diabetologia 43:245–249, 2000.
145. PALMIERI, L., S. ALBERIO, I. PISANO, et al. Complete loss-of-
function of the heart/muscle-specific adenine nucleotide trans-
locator is associated with mitochondrial myopathy and cardio-
myopathy. Hum. Mol. Genet. 14:3079–3088, 2005.
146. PANTOJA-MARTINEZ, J., C. NAVARRO FERNANDEZ-BALBUENA,
M. GORMAZ-MORENO, B. QUINTANS-CASTRO, M. A. ESPARZA-
SANCHEZ, and J. BONET-ARZO. Myoadenylate deaminase defi-
ciency in a child with myalgias induced by physical exercise.
Rev. Neurol. 39:431–434, 2004.
147. PARK, J. Y., R. E. FERRELL, J. J. PARK, et al. NADPH oxidase
p22phox gene variants are associated with systemic oxidative
stress biomarker responses to exercise training. J. Appl. Physiol.99:1905–1911, 2005.
148. PATEL, S., D. R. WOODS, N. J. MACLEOD, et al. Angiotensin-
converting enzyme genotype and the ventilatory response to
exertional hypoxia. Eur. Respir. J. 22:755–760, 2003.
149. PEETERS, R. P., A. W. VAN DEN BELD, H. VAN TOOR, et al. A
polymorphism in type I deiodinase is associated with circulating
free insulin-like growth factor I levels and body composition in
humans. J. Clin. Endocrinol. Metab. 90:256–263, 2005.
150. PETERS, W. R., J. P. MACMURRY, J. WALKER, R. J. GIESE, Jr., and
D. E. COMINGS. Phenylethanolamine N-methyltransferase G-
148A genetic variant and weight loss in obese women. Obes.Res. 11:415–419, 2003.
151. PHARES, D. A., A. A. HALVERSTADT, A. R. SHULDINER, et al.
Association between body fat response to exercise training and
multilocus ADR genotypes. Obes. Res. 12:807–815, 2004.
152. PISCIOTTA, L., A. CANTAFORA, A. PIANA, et al. Physical activity
modulates effects of some genetic polymorphisms affecting
cardiovascular risk in men aged over 40 years. Nutr. Metab.Cardiovasc. Dis. 13:202–210, 2003.
153. POSTMA, A. V., I. DENJOY, T. M. HOORNTJE, et al. Absence of
calsequestrin 2 causes severe forms of catecholaminergic poly-
morphic ventricular tachycardia. Circ. Res. 91:e21–e26, 2002.
154. PRIOR, S. J., J. M. HAGBERG, D. A. PHARES, et al. Sequence
variation in hypoxia-inducible factor 1alpha (HIF1A): associa-
tion with maximal oxygen consumption. Physiol. Genomics15:20–26, 2003.
155. PRIORI, S. G., C. NAPOLITANO, N. TISO, et al. Mutations in the
cardiac ryanodine receptor gene (hRyR2) underlie catecholami-
nergic polymorphic ventricular tachycardia. Circulation 103:
196–200, 2001.
156. PULKES, T., D. LIOLITSA, L. H. EUNSON, et al. New phenotypic
diversity associated with the mitochondrial tRNA(SerUCN)
gene mutation. Neuromuscul. Disord. 15:364–371, 2005.
157. PULKES, T., A. SIDDIQUI, J. A. MORGAN-HUGHES, and M. G.
HANNA. A novel mutation in the mitochondrial tRNA(TYr) gene
associated with exercise intolerance. Neurology 55:1210–1212,
2000.
158. RABON-STITH, K. M., J. M. HAGBERG, D. A. PHARES, et al.
Vitamin D receptor FokI genotype influences bone mineral
density response to strength training, but not aerobic training.
Exp. Physiol. 90:653–661, 2005.
159. RANKINEN, T., P. AN, L. PERUSSE, et al. Genome-wide linkage
scan for exercise stroke volume and cardiac output in the
HERITAGE Family Study. Physiol. Genomics 10:57–62,
2002.
160. RANKINEN, T., P. AN, T. RICE, et al. Genomic scan for exercise
blood pressure in the Health, Risk Factors, Exercise Training
and Genetics (HERITAGE) Family Study. Hypertension 38:
30–37, 2001.
HUMAN FITNESS GENE MAP 2005 Medicine & Science in Sports & Exercised 1885
Copyright @ 2006 by the American College of Sports Medicine. Unauthorized reproduction of this article is prohibited.
161. RANKINEN, T., J. GAGNON, L. PERUSSE, et al. AGT M235T and
ACE ID polymorphisms and exercise blood pressure in the
HERITAGE Family Study. Am. J. Physiol. Heart Circ. Physiol.279:H368–H374, 2000.
162. RANKINEN, T., L. PERUSSE, I. BORECKI, et al. The Na(+)-K(+)-
ATPase alpha2 gene and trainability of cardiorespiratory
endurance: the HERITAGE family study. J. Appl. Physiol.88:346–351, 2000.
163. RANKINEN, T., L. PERUSSE, J. GAGNON, et al. Angiotensin-
converting enzyme ID polymorphism and fitness phenotype in
the HERITAGE Family Study. J. Appl. Physiol. 88:1029–1035,
2000.
164. RANKINEN, T., L. PERUSSE, R. RAURAMAA, M. A. RIVERA,
B. WOLFARTH, and C. BOUCHARD. The human gene map for
performance and health-related fitness phenotypes. Med. Sci.Sports Exerc. 33:855–867, 2001.
165. RANKINEN, T., T. RICE, A. BOUDREAU, et al. Titin is a candidate
gene for stroke volume response to endurance training: the
HERITAGE Family Study. Physiol. Genomics 15:27–33, 2003.
166. RANKINEN, T., T. RICE, A. S. LEON, et al. G protein beta 3
polymorphism and hemodynamic and body composition pheno-
types in the HERITAGE Family Study. Physiol. Genomics8:151–157, 2002.
167. RANKINEN, T., T. RICE, L. PERUSSE, et al. NOS3 Glu298Asp
genotype and blood pressure response to endurance training: the
HERITAGE family study. Hypertension 36:885–889, 2000.
168. RAURAMAA, R., R. KUHANEN, T. A. LAKKA, et al. Physical exercise
and blood pressure with reference to the angiotensinogen
M235T polymorphism. Physiol. Genomics 10:71–77, 2002.
169. RAURAMAA, R., S. VAISANEN, A. NISSINEN, et al. Physical activity,
fibrinogen plasma level and gene polymorphisms in postmeno-
pausal women. Thromb. Haemost. 78:840–844, 1997.
170. RAURAMAA, R., S. B. VAISANEN, R. KUHANEN, I. PENTTILA, and
C. BOUCHARD. The RsaI polymorphism in the alpha-fibrinogen
gene and response of plasma fibrinogen to physical training–a
controlled randomised clinical trial in men. Thromb. Haemost.83:803–806, 2000.
171. REMES, T., S. B. VAISANEN, A. MAHONEN, et al. Aerobic exercise
and bone mineral density in middle-aged finnish men: a
controlled randomized trial with reference to androgen receptor,
aromatase, and estrogen receptor alpha gene polymorphisms.
Bone 32:412–420, 2003.
172. RICE, T., Y. C. CHAGNON, L. PERUSSE, et al. A genomewide
linkage scan for abdominal subcutaneous and visceral fat in
black and white families: The HERITAGE Family Study.
Diabetes 51:848–855, 2002.
173. RICE, T., T. RANKINEN, Y. C. CHAGNON, et al. Genomewide
linkage scan of resting blood pressure: HERITAGE Family
Study. Health, Risk Factors, Exercise Training, and Genetics.
Hypertension 39:1037–1043, 2002.
174. RICO-SANZ, J., T. RANKINEN, D. R. JOANISSE, et al. Associations
between cardiorespiratory responses to exercise and the C34T
AMPD1 gene polymorphism in the HERITAGE Family Study.
Physiol. Genomics 14:161–166, 2003.
175. RICO-SANZ, J., T. RANKINEN, T. RICE, et al. Quantitative trait loci
for maximal exercise capacity phenotypes and their responses to
training in the HERITAGE Family Study. Physiol. Genomics16:256–260, 2004.
176. RIECHMAN, S. E., G. BALASEKARAN, S. M. ROTH, and R. E.
FERRELL. Association of interleukin-15 protein and interleukin-
15 receptor genetic variation with resistance exercise training
responses. J. Appl. Physiol. 97:2214–2219, 2004.
177. RIECHMAN, S. E., T. J. FABIAN, P. D. KROBOTH, and R. E. FERRELL.
Steroid sulfatase gene variation and DHEA responsiveness to
resistance exercise in MERET. Physiol. Genomics 17:300–306,
2004.
178. RIVERA, M. A., F. T. DIONNE, J. A. SIMONEAU, et al. Muscle-
specific creatine kinase gene polymorphism and VO2max in
the HERITAGE Family Study. Med. Sci. Sports Exerc. 29:
1311–1317, 1997.
179. RIVERA, M. A., M. ECHEGARAY, T. RANKINEN, et al. Angiogenin
gene-race interaction for resting and exercise BP phenotypes: the
HERITAGE Family Study. J. Appl. Physiol. 90:1232–1238, 2001.
180. RIVERA, M. A., M. ECHEGARAY, T. RANKINEN, et al. TGF-beta(1)
gene-race interactions for resting and exercise blood pressure in
the HERITAGE Family Study. J. Appl. Physiol. 91:1808–1813,
2001.
181. RIVERA, M. A., L. PERUSSE, J. A. SIMONEAU, et al. Linkage between a
muscle-specific CK gene marker and VO2max in the HERITAGE
Family Study. Med. Sci. Sports Exerc. 31:698–701, 1999.
182. RODAS, G., G. ERCILLA, C. JAVIERRE, et al. Could the A2A11
human leucocyte antigen locus correlate with maximal aerobic
power? Clin. Sci. (Lond.) 92:331–333, 1997.
183. ROLTSCH, M. H., M. D. BROWN, B. D. HAND, et al. No association
between ACE I/D polymorphism and cardiovascular hemody-
namics during exercise in young women. Int. J. Sports Med.26:638–644, 2005.
184. ROTH, S. M., E. J. METTER, M.R. LEE, B. F. HURLEY, and R. E.
FERRELL. C174T polymorphism in the CNTF receptor gene is
associated with fat-free mass in men and women. J. Appl.Physiol. 95:1425–1430, 2003.
185. ROTH, S. M., M. A. SCHRAGER, R. E. FERRELL, et al. CNTF
genotype is associated with muscular strength and quality
in humans across the adult age span. J. Appl. Physiol. 90:
1205–1210, 2001.
186. ROTH, S. M., J. M. ZMUDA, J. A. CAULEY, P. R. SHEA, and R. E.
FERRELL. Vitamin D receptor genotype is associated with fat-free
mass and sarcopenia in elderly men. J. Gerontol. A Biol. Sci.Med. Sci. 59:10–15, 2004.
187. RUANO, G., R. L. SEIP, A. WINDEMUTH, et al. Apolipoprotein A1
genotype affects the change in high density lipoprotein
cholesterol subfractions with exercise training. Atherosclerosis185:65–69, 2005.
188. RUBIO, J. C., M. A. MARTIN, M. RABADAN, et al. Frequency of the
C34T mutation of the AMPD1 gene in world-class endurance
athletes: does this mutation impair performance? J. Appl.Physiol. 98:2108–2112, 2005.
189. SAKANE, N., T. YOSHIDA, T. UMEKAWA, A. KOGURE, Y. TAKAKURA,
and M. KONDO. Effects of Trp64Arg mutation in the beta 3-
adrenergic receptor gene on weight loss, body fat distribution,
glycemic control, and insulin resistance in obese type 2 diabetic
patients. Diabetes Care 20:1887–1890, 1997.
190. SALMEN, T., A. M. HEIKKINEN, A. MAHONEN, et al. Relation of
aromatase gene polymorphism and hormone replacement
therapy to serum estradiol levels, bone mineral density, and
fracture risk in early postmenopausal women. Ann. Med.35:282–288, 2003.
191. SANDILANDS, A. J., J. PARAMESHWAR, S. LARGE, M. J. BROWN, and
K. M. O_SHAUGHNESSY. Confirmation of a role for the 389R(G
beta-1 adrenoceptor polymorphism on exercise capacity in heart
failure. Heart 91:1613–1614, 2005.
192. SAYER, A. A., H. SYDDALL, S. D. O’DELL, et al. Polymorphism of
the IGF2 gene, birth weight and grip strength in adult men. AgeAgeing 31:468–470, 2002.
193. SCANAVINI, D., F. BERNARDI, E. CASTOLDI, F. CONCONI, and
G. MAZZONI. Increased frequency of the homozygous II ACE
genotype in Italian Olympic endurance athletes. Eur. J. Hum.Genet. 10:576–577, 2002.
194. SCHOLTE, H. R., R. N. VAN COSTER, P. C. DE JONGE, et al.
Myopathy in very-long-chain acyl-CoA dehydrogenase defi-
ciency: clinical and biochemical differences with the fatal
cardiac phenotype. Neuromuscul. Disord. 9:313–319, 1999.
195. SCHRAGER, M. A., S. M. ROTH, R. E. FERRELL, et al. Insulin-like
growth factor-2 (IGF2) genotype, fat-free mass, and muscle
performance across the adult life span. J. Appl. Physiol.97:2176–2183, 2004.
http://www.acsm-msse.org1886 Official Journal of the American College of Sports Medicine
Copyright @ 2006 by the American College of Sports Medicine. Unauthorized reproduction of this article is prohibited.
196. SCHUELKE, M., H. KRUDE, B. FINCKH, et al. Septo-optic dysplasia
associated with a new mitochondrial cytochrome b mutation.
Ann. Neurol. 51:388–392, 2002.
197. SCHWARTZ, P. J., S. G. PRIORI, C. SPAZZOLINI, et al. Genotype-
phenotype correlation in the long-QT syndrome: gene-specific
triggers for life-threatening arrhythmias. Circulation 103:89–95,
2001.
198. SCOTT, R. A., C. MORAN, R. H. WILSON, et al. No association
between angiotensin converting enzyme (ACE) gene variation
and endurance athlete status in Kenyans. Comp. Biochem.Physiol. A Mol. Integr. Physiol. 141:169–175, 2005.
199. SCOTT, R. A., R. H. WILSON, W. H. GOODWIN, et al. Mitochon-
drial DNA lineages of elite Ethiopian athletes. Comp. Biochem.Physiol. B Biochem. Mol. Biol. 140:497–503, 2005.
200. SEIBERT, M. J., Q. L. XUE, L. P. FRIED, and J. D. WALSTON.
Polymorphic variation in the human myostatin (GDF-8) gene
and association with strength measures in the Women_s Health
and Aging Study II cohort. J. Am. Geriatr. Soc. 49:1093–1096,
2001.
201. SELVADURAI, H. C., K. O. MCKAY, C. J. BLIMKIE, P. J. COOPER,
C. M. MELLIS, and P. P. VAN ASPEREN. The relationship between
genotype and exercise tolerance in children with cystic fibrosis.
Am. J. Respir. Crit. Care Med. 165:762–765, 2002.
202. SENECA, S., N. GOEMANS, R. VAN COSTER, et al. A mitochondrial
tRNA aspartate mutation causing isolated mitochondrial myo-
pathy. Am. J. Med. Genet. A 137:170–175, 2005.
203. SENGLER, C., A. HEINZMANN, S. P. JERKIC, et al. Clara cell protein
16 (CC16) gene polymorphism influences the degree of airway
responsiveness in asthmatic children. J. Allergy Clin. Immunol.111:515–519, 2003.
204. SENTI, M., C. AUBO, R. ELOSUA, J. SALA, M. TOMAS, and
J. MARRUGAT. Effect of physical activity on lipid levels in a
population-based sample of men with and without the Arg192
variant of the human paraoxonase gene. Genet. Epidemiol.18:276–286, 2000.
205. SHERMAN, J. B., N. RABEN, C. NICASTRI, et al. Common mutations
in the phosphofructokinase-M gene in Ashkenazi Jewish
patients with glycogenesis VII–and their population frequency.
Am. J. Hum. Genet. 55:305–313, 1994.
206. SHIWAKU, K., A. NOGI, E. ANUURAD, et al. Difficulty in losing
weight by behavioral intervention for women with Trp64Arg
polymorphism of the beta3-adrenergic receptor gene. Int.J. Obes. Relat. Metab. Disord. 27:1028–1036, 2003.
207. SIMONEN, R. L., T. RANKINEN, L. PERUSSE, et al. A dopamine D2
receptor gene polymorphism and physical activity in two family
studies. Physiol. Behav. 78:751–757, 2003.
208. SIMONEN, R. L., T. RANKINEN, L. PERUSSE, et al. Genome-wide
linkage scan for physical activity levels in the Quebec Family
study. Med. Sci. Sports Exerc. 35:1355–1359, 2003.
209. SLATTERY, M. L., K. B. BAUMGARTNER, T. BYERS, et al. Genetic,
anthropometric, and lifestyle factors associated with IGF-1 and
IGFBP-3 levels in Hispanic and non-Hispanic white women.
Cancer Causes Control 16:1147–1157, 2005.
210. SLATTERY, M. L., M. A. MURTAUGH, C. SWEENEY, et al.
PPARgamma, energy balance, and associations with colon and
rectal cancer. Nutr. Cancer 51:155–161, 2005.
211. STEFAN, N., F. MACHICAO, H. STAIGER, et al. Polymorphisms in
the gene encoding adiponectin receptor 1 are associated with in-
sulin resistance and high liver fat. Diabetologia 48:2282–2291,
2005.
212. STEFAN, N., B. VOZAROVA, A. DEL PARIGI, et al. The Gln223Arg
polymorphism of the leptin receptor in Pima Indians:
influence on energy expenditure, physical activity and lipid
metabolism. Int. J. Obes. Relat. Metab. Disord. 26:1629–1632,
2002.
213. SUN, G., J. GAGNON, Y. C. CHAGNON, et al. Association and
linkage between an insulin-like growth factor-1 gene poly-
morphism and fat free mass in the HERITAGE Family Study.
Int. J. Obes. Relat. Metab. Disord. 23:929–935, 1999.
214. TAGGART, R. T., D. SMAIL, C. APOLITO, and G. D. VLADUTIU.
Novel mutations associated with carnitine palmitoyltransferase
II deficiency. Hum. Mutat. 13:210–220, 1999.
215. TAIMELA, S., T. LEHTIMAKI, K. V. PORKKA, L. RASANEN, and J. S.
VIIKARI. The effect of physical activity on serum total and low-
density lipoprotein cholesterol concentrations varies with apo-
lipoprotein E phenotype in male children and young adults:
The Cardiovascular Risk in Young Finns Study. Metabolism 45:
797–803, 1996.
216. TAJIMA, O., N. ASHIZAWA, T. ISHII, et al. Interaction of the effects
between vitamin D receptor polymorphism and exercise training
on bone metabolism. J. Appl. Physiol. 88:1271–1276, 2000.
217. TANRIVERDI, H., H. EVRENGUL, S. TANRIVERDI, et al. Improved
endothelium dependent vasodilation in endurance athletes and
its relation with ACE I/D polymorphism. Circ. J. 69:1105–1110,
2005.
218. TARONI, F., E. VERDERIO, F. DWORZAK, P. J. WILLEMS, P.
CAVADINI, and S. DIDONATO. Identification of a common
mutation in the carnitine palmitoyltransferase II gene in familial
recurrent myoglobinuria patients. Nat. Genet. 4:314–320, 1993.
219. TERAN-GARCIA, M., N. SANTORO, T. RANKINEN, et al. Hepatic
lipase gene variant -514C(T is associated with lipoprotein and
insulin sensitivity response to regular exercise: the HERITAGE
Family Study. Diabetes 54:2251–2255, 2005.
220. THOMPSON, P. D., G. J. TSONGALIS, R. L. SEIP, et al. Apolipopro-
tein E genotype and changes in serum lipids and maximal
oxygen uptake with exercise training. Metabolism 53:193–202,
2004.
221. TIRET, L., O. POIRIER, V. HALLET, et al. The Lys198Asn
polymorphism in the endothelin-1 gene is associated with blood
pressure in overweight people. Hypertension 33:1169–1174,
1999.
222. TODOROVA, B., A. KUBASZEK, J. PIHLAJAMAKI, et al. The G-250A
promoter polymorphism of the hepatic lipase gene predicts the
conversion from impaired glucose tolerance to type 2 diabetes
mellitus: the Finnish Diabetes Prevention Study. J. Clin.Endocrinol. Metab. 89:2019–2023, 2004.
223. TOMAS, M., R. ELOSUA, M. SENTI, et al. Paraoxonase1-192
polymorphism modulates the effects of regular and acute
exercise on paraoxonase1 activity. J. Lipid. Res. 43:713–720,
2002.
224. TOSCANO, A., S. TSUJINO, G. VITA, S. SHANSKE, C. MESSINA, and
S. DIMAURO. Molecular basis of muscle phosphoglycerate
mutase (PGAM-M) deficiency in the Italian kindred. MuscleNerve 19:1134–1137, 1996.
225. TROMBETTA, I. C., L. T. BATALHA, M. U. RONDON, et al. Gly16 +
Glu27 beta2-adrenoceptor polymorphisms cause increased fore-
arm blood flow responses to mental stress and handgrip in
humans. J. Appl. Physiol. 98:787–794, 2005.
226. TSUJINO, S., S. SERVIDEI, P. TONIN, S. SHANSKE, G. AZAN, and
S. DIMAURO. Identification of three novel mutations in non-
Ashkenazi Italian patients with muscle phosphofructokinase
deficiency. Am. J. Hum. Genet. 54:812–819, 1994.
227. TSUJINO, S., S. SHANSKE, A. K. BROWNELL, R. G. HALLER, and
S. DIMAURO. Molecular genetic studies of muscle lactate
dehydrogenase deficiency in white patients. Ann. Neurol.36:661–665, 1994.
228. TSUJINO, S., S. SHANSKE, and S. DIMAURO. Molecular genetic
heterogeneity of myophosphorylase deficiency (McArdle_sdisease). N. Engl. J. Med. 329:241–245, 1993.
229. TSUJINO, S., S. SHANSKE, and S. DIMAURO. Molecular genetic
heterogeneity of phosphoglycerate kinase (PGK) deficiency.
Muscle Nerve 3:S45–S49, 1995.
230. TSUJINO, S., S. SHANSKE, S. SAKODA, G. FENICHEL,
and S. DIMAURO. The molecular genetic basis of muscle
phosphoglycerate mutase (PGAM) deficiency. Am. J. Hum.Genet. 52: 472–477, 1993.
231. TSURITANI, I., K. S. BROOKE-WAVELL, S. S. MASTANA, P. R. JONES,
A. E. HARDMAN, and Y. YAMADA. Does vitamin D receptor
HUMAN FITNESS GENE MAP 2005 Medicine & Science in Sports & Exercised 1887
Copyright @ 2006 by the American College of Sports Medicine. Unauthorized reproduction of this article is prohibited.
polymorphism influence the response of bone to brisk walking
in postmenopausal women? Horm. Res. 50:315–319, 1998.
232. TURGUT, G., S. TURGUT, O. GENC, A. ATALAY, and E. O. ATALAY.
The angiotensin converting enzyme I/D polymorphism in
Turkish athletes and sedentary controls. Acta Medica (HradecKralove) 47:133–136, 2004.
233. TWOROGER, S. S., J. CHUBAK, E. J. AIELLO, et al. The effect of
CYP19 and COMT polymorphisms on exercise-induced fat loss
in postmenopausal women. Obes. Res. 12:972–981, 2004.
234. VAISANEN, S. B., S. E. HUMPHRIES, L. A. LUONG, I. PENTTILA,
C. BOUCHARD, and R. RAURAMAA. Regular exercise, plasminogen
activator inhibitor-1 (PAI-1) activity and the 4G/5G promoter
polymorphism in the PAI-1 gene. Thromb. Haemost. 82:
1117–1120, 1999.
235. VAN POTTELBERGH, I., S. GOEMAERE, L. NUYTINCK, A. DE PAEPE,
and J. M. KAUFMAN. Association of the type I collagen alpha1
Sp1 polymorphism, bone density and upper limb muscle
strength in community-dwelling elderly men. Osteoporos. Int.12:895–901, 2001.
236. VAN ROSSUM, E. F., P. G. VOORHOEVE, S. J. TE VELDE, et al. The
ER22/23EK polymorphism in the glucocorticoid receptor gene
is associated with a beneficial body composition and muscle
strength in young adults. J. Clin. Endocrinol. Metab. 89:
4004–4009, 2004.
237. VERMEER, S., A. VERRIPS, M. A. WILLEMSEN, H. J. TER LAAK,
I. B. GINJAAR, and B. C. HAMEL. Novel mutations in three
patients with LGMD2C with phenotypic differences. Pediatr.Neurol. 30:291–294, 2004.
238. VISSING, J., M. B. SALAMON, P. ARLIEN-SOBORG, et al. A new
mitochondrial tRNA(Met) gene mutation in a patient with
dystrophic muscle and exercise intolerance. Neurology50:1875–1878, 1998.
239. VIVES-BAUZA, C., J. GAMEZ, M. ROIG, et al. Exercise intolerance
resulting from a muscle-restricted mutation in the mitochondrial
tRNA(Leu (CUN)) gene. Ann. Med. 33:493–496, 2001.
240. VLADUTIU, G. D., M. J. BENNETT, N. M. FISHER, et al. Phenotypic
variability among first-degree relatives with carnitine palmi-
toyltransferase II deficiency. Muscle Nerve 26:492–498, 2002.
241. VLADUTIU, G. D., M. J. BENNETT, D. SMAIL, L. J. WONG,
R. T. TAGGART, and H. B. LINDSLEY. A variable myopathy
associated with heterozygosity for the R503C mutation in the
carnitine palmitoyltransferase II gene. Mol. Genet. Metab.70:134–141, 2000.
242. VORGERD, M., J. KARITZKY, M. RISTOW, et al. Muscle phospho-
fructokinase deficiency in two generations. J. Neurol. Sci.141:95–99, 1996.
243. WAGONER, L. E., L. L. CRAFT, B. SINGH, et al. Polymorphisms of
the beta(2)-adrenergic receptor determine exercise capacity in
patients with heart failure. Circ. Res. 86:834–840, 2000.
244. WAGONER, L. E., L. L. CRAFT, P. ZENGEL, et al. Polymorphisms
of the beta1-adrenergic receptor predict exercise capacity in
heart failure. Am. Heart. J. 144:840–846, 2002.
245. WALSH, S., J. M. ZMUDA, J. A. CAULEY, et al. Androgen receptor
CAG repeat polymorphism is associated with fat-free mass in
men. J. Appl. Physiol. 98:132–137, 2005.
246. WALSTON, J., D. E. ARKING, D. FALLIN, et al. IL-6 gene variation
is not associated with increased serum levels of IL-6, muscle,
weakness, or frailty in older women. Exp. Gerontol. 40:
344–352, 2005.
247. WANG, L., A. LIMONGELLI, M. R. VILA, F. CARRARA, M. ZEVIANI,
and S. ERIKSSON. Molecular insight into mitochondrial DNA
depletion syndrome in two patients with novel mutations in the
deoxyguanosine kinase and thymidine kinase 2 genes. Mol.Genet. Metab. 84:75–82, 2005.
248. WANG, Q., M. E. CURRAN, I. SPLAWSKI, et al. Positional cloning
of a novel potassium channel gene: KVLQT1 mutations cause
cardiac arrhythmias. Nat. Genet. 12:17–23, 1996.
249. WEISS, E. P., O. KULAPUTANA, I. A. GHIU, et al. Endurance
training-induced changes in the insulin response to oral glucose
are associated with the peroxisome proliferator-activated receptor-
gamma2 Pro12Ala genotype in men but not in women.
Metabolism 54:97–102, 2005.
250. WILLIAMS, A. G., S. H. DAY, J. P. FOLLAND, P. GOHLKE,
S. DHAMRAIT, and H. E. MONTGOMERY. Circulating angiotensin
converting enzyme activity is correlated with muscle strength.
Med. Sci. Sports Exerc. 37:944–948, 2005.
251. WILLIAMS, A. G., S. S. DHAMRAIT, P. T. WOOTTON, et al.
Bradykinin receptor gene variant and human physical perfor-
mance. J. Appl. Physiol. 96:938–942, 2004.
252. WILLIAMS, A. G., M. P. RAYSON, M. JUBB, et al. The ACE gene
and muscle performance. Nature 403:614, 2000.
253. WILUND, K. R., R. E. FERRELL, D. A. PHARES, A. P. GOLDBERG,
and J. M. HAGBERG. Changes in high-density lipoprotein-
cholesterol subfractions with exercise training may be depen-
dent on cholesteryl ester transfer protein (CETP) genotype.
Metabolism 51:774–778, 2002.
254. WINNICKI, M., V. ACCURSO, M. HOFFMANN, et al. Physical activity
and angiotensin-converting enzyme gene polymorphism in mild
hypertensives. Am. J. Med. Genet. A 125:38–44, 2004.
255. WOLFARTH, B., M. S. BRAY, J. M. HAGBERG, et al. The human
gene map for performance and health-related fitness pheno-
types: the 2004 update. Med. Sci. Sports Exerc. 37:881–903,
2005.
256. WOLFARTH, B., M. A. RIVERA, J. M. OPPERT, et al. A poly-
morphism in the alpha2a-adrenoceptor gene and endurance
athlete status. Med. Sci. Sports Exerc. 32:1709–1712, 2000.
257. WOO, S. K., and H. S. KANG. Apolipoprotein C-III SstI
genotypes modulate exercise-induced hypotriglyceridemia.
Med. Sci. Sports Exerc. 36:955–959, 2004.
258. WOODS, D., M. HICKMAN, Y. JAMSHIDI, et al. Elite swimmers and
the D allele of the ACE I/D polymorphism. Hum. Genet.108:230–232, 2001.
259. WOODS, D., G. ONAMBELE, R. WOLEDGE, et al. Angiotensin-I
converting enzyme genotype-dependent benefit from hormone
replacement therapy in isometric muscle strength and bone
mineral density. J. Clin. Endocrinol. Metab. 86:2200–2204,
2001.
260. WOODS, D. R., M. WORLD, M. P. RAYSON, et al. Endurance
enhancement related to the human angiotensin I-converting
enzyme I-D polymorphism is not due to differences in the
cardiorespiratory response to training. Eur. J. Appl. Physiol.86:240–244, 2002.
261. YANG, N., D. G. MACARTHUR, J. P. GULBIN, et al. ACTN3
genotype is associated with human elite athletic performance.
Am. J. Hum. Genet. 73:627–631, 2003.
262. ZHANG, B., T. SAKAI, S. MIURA, et al. Association of angiotensin-
converting-enzyme gene polymorphism with the depressor
response to mild exercise therapy in patients with mild to moderate
essential hypertension. Clin. Genet. 62:328–333, 2002.
263. ZHAO, B., S. M. MOOCHHALA, S. THAM, et al. Relationship
between angiotensin-converting enzyme ID polymorphism and
VO(2max) of Chinese males. Life Sci. 73:2625–2630, 2003.
http://www.acsm-msse.org1888 Official Journal of the American College of Sports Medicine
Related Documents