The Human Connectome Project multimodal cortical parcellation: new avenues for brain research. Dr Emma. C. Robinson [email protected], Biomedical Engineering

Welcome message from author
This document is posted to help you gain knowledge. Please leave a comment to let me know what you think about it! Share it to your friends and learn new things together.
Transcript

The Human Connectome Project multimodal cortical parcellation:
new avenues for brain research.
Dr Emma. C. Robinson [email protected],
Biomedical Engineering

Overview
• A simple model of the human brain
• Modelling global properties of brain organisation from MRI
• The Human Connectome Projects’s “ A Multi-modal Parcellation of the Human Cerebral Cortex”
• Comparing patterns of brain connectivity against behavioural/cognitive/genetic markers
• Future Challenges
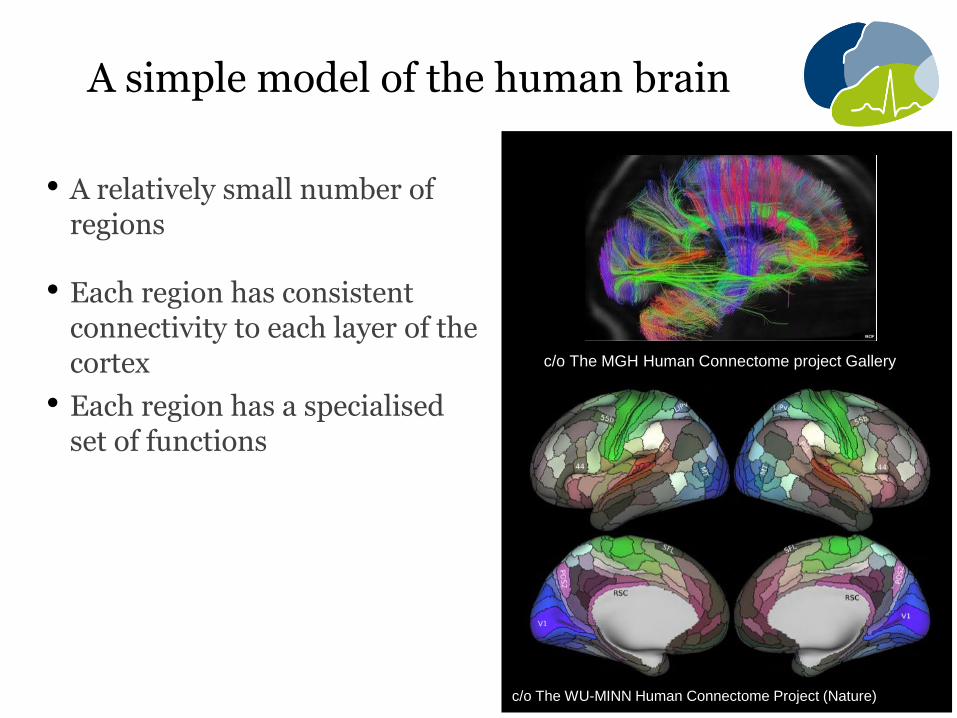
A simple model of the human brain
• A relatively small number of regions
• Each region has consistent connectivity to each layer of the cortex
• Each region has a specialised set of functions
c/o The MGH Human Connectome project Gallery
c/o The WU-MINN Human Connectome Project (Nature)

A simple model of the human brain
• Important for:
- Models of cognition
- Study of the mechanisms behind conditions such as Autism or Schizophrenia
- Design of Artificial Intelligence systems.
c/o The MGH Human Connectome project Gallery
c/o The WU-MINN Human Connectome Project (Nature, in Press) Brain “network”

The Scale of the Human Brain
• ~100 billion cells
• ~100 trillion connections
• micrometre scale
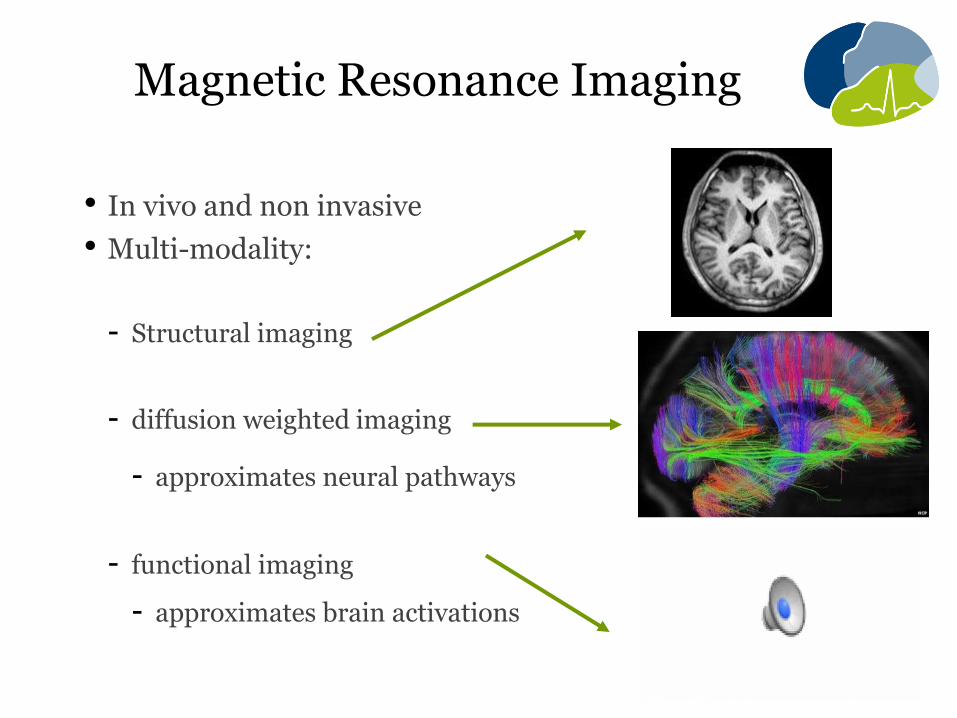
Magnetic Resonance Imaging
• In vivo and non invasive
• Multi-modality:
- Structural imaging
- diffusion weighted imaging
- approximates neural pathways
- functional imaging
- approximates brain activations

Modelling brain organisation from MRI
• Clustering algorithms:
• K-means
• ICA
• Spectral clustering
• Matrix factorisation
O'Donnell, Lauren J., and Carl-Fredrik Westin. TMI
26.11 (2007): 1562-1575.
Parisot, Sarah, et al. IPMI, 2015.

Modelling brain organisation from MRI
Different data driven parcellations of the adult human brain:
Arslan, S., Ktena, S.I., Makropoulos, A., Robinson, EC., Rueckert, D., Parisot, S., 2017, Human
brain mapping: A systematic comparison of brain parcellation methods for the human cerebral
cortex, NeuroImage. (In Press)

Modelling brain organisation from MRI
• Individual imaging data sets are very noisy: • Subject to physiological and imaging artefacts
• Low resolution
• Indirect
• Modelling error
• Disagreement between modalities • Cortical folding patterns & functional activations do not
agree
• No ground truth!!
Limitations of data driven approaches
Fischl, Bruce, et al. "Cortical folding patterns and predicting cytoarchitecture."
Cerebral cortex 18.8 (2008): 1973-1980.

The HCP Multi-modal Parcellation
• Expert manual annotations of 180 functionally specialised regions on group average data
• 97 entirely new areas • 83 areas previously reported by histological studies
Region 55b as identified across modalities and (h) as reported from histology

The HCP Multi-modal Parcellation
• Made possible by comparing data across subjects AND modalities
Image boundaries
compared against
cyto-architectonic
maps
Manual annotation of sub-regions of the visual cortex

Improving SNR through spatial
normalisation
• Map/deform data to a common space where same structures or functional activations are found at each location
e.g. smooth warping
of a structural MRI
volume until subject
A “looks” more like
subject B
A B

Cortical Surface Processing
• HCP data is projected to the cortical surface for two reasons:
1. Surface based smoothing improves SNR
2. Surface-based registration improves alignment of cortical folds

Multi-modal Surface Matching (MSM)
• Spherical framework for cortical surface registration
• Use low resolution control point grids to constrain the deformation
• Optimised using discrete methods
• Modular
Robinson, Emma C., et al. "MSM: a new flexible framework for multimodal surface matching." Neuroimage 100
(2014): 414-426.

MSM framework
• c1 and c2 represent cliques (groups of control point nodes)*
*Robinson, Emma C., et al. ”Multimodal surface matching with higher order smoothness constraints” (in revision)
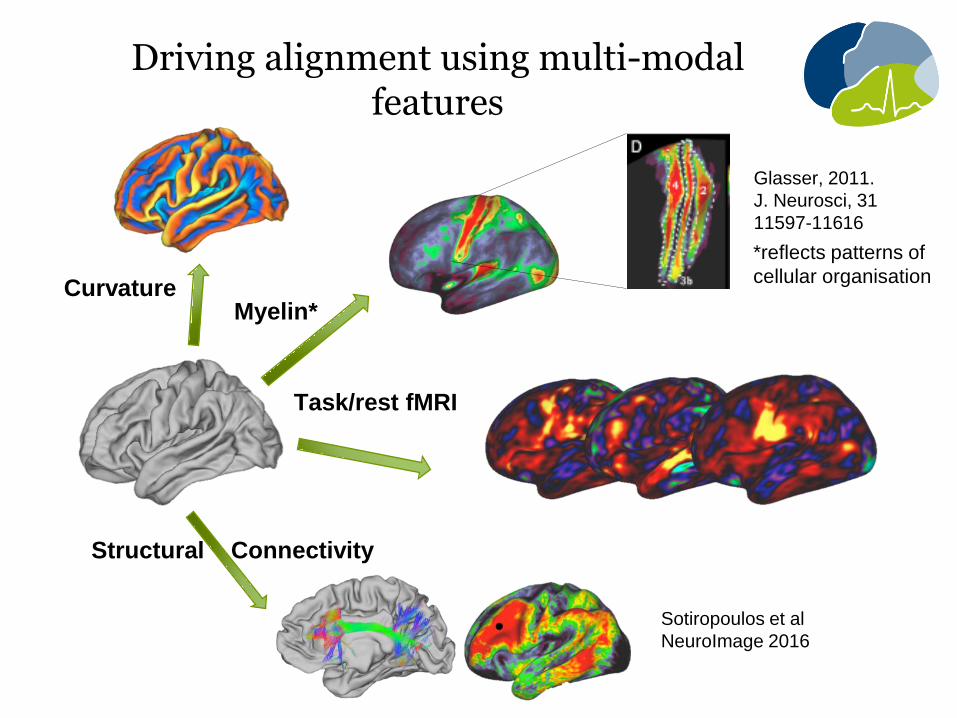
Driving alignment using multi-modal features
Curvature
Task/rest fMRI
Myelin*
Structural Connectivity
Sotiropoulos et al
NeuroImage 2016
Glasser, 2011.
J. Neurosci, 31
11597-11616
*reflects patterns of
cellular organisation
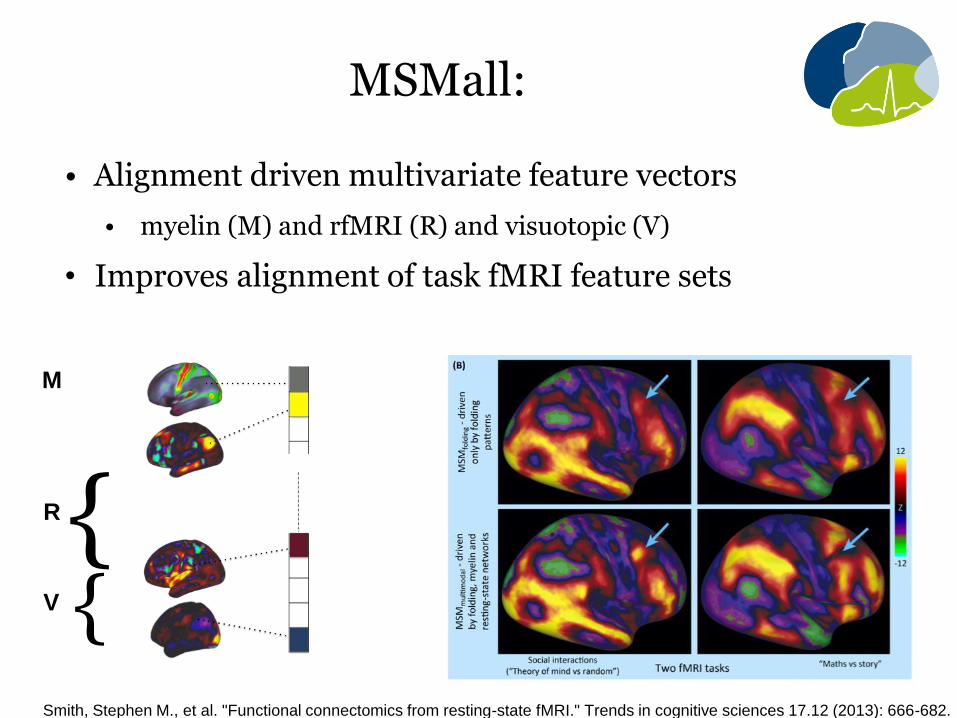
MSMall:
• Alignment driven multivariate feature vectors
• myelin (M) and rfMRI (R) and visuotopic (V)
• Improves alignment of task fMRI feature sets
Smith, Stephen M., et al. "Functional connectomics from resting-state fMRI." Trends in cognitive sciences 17.12 (2013): 666-682.
M
R { V {

The HCP Multi-modal Parcellation
• Regional boundaries found by looking for imaging
gradients in group average data
• Looking for patterns common across multiple modalities
• Informed by the literature where available

The HCP Multi-modal Parcellation
• Regional boundaries found by looking for imaging
gradients in group average data
• Looking for patterns common across multiple modalities
• Informed by the literature where available

The HCP Multi-modal Parcellation: propagating the result to individuals
• Single subject parcellations were then obtained by training MLP classifiers
• Binary classifications • Group average data propagated to training subjects
Hacker, Carl D., et al. "Resting state network estimation in individual subjects." Neuroimage 82 (2013): 616-633.
used to train classifier ONLY where subject data closely
agrees with group

The HCP Multi-modal Parcellation: propagating the result to individuals
• Output from Classifier for 4 example datasets
Group Average
Classifier results for 4 subjects
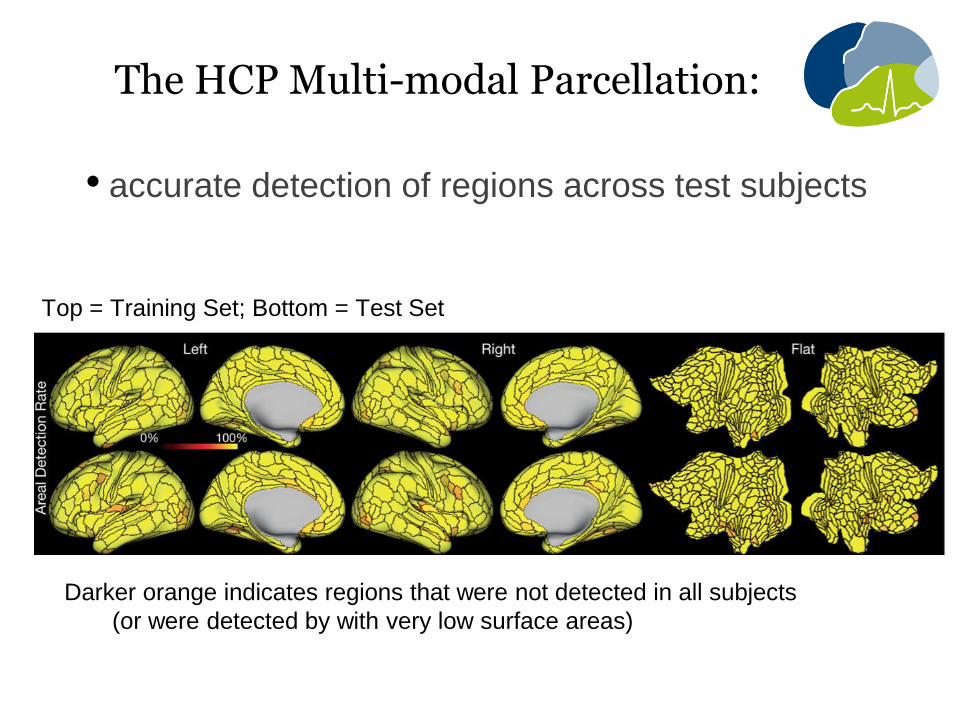
The HCP Multi-modal Parcellation:
• accurate detection of regions across test subjects
Top = Training Set; Bottom = Test Set
Darker orange indicates regions that were not detected in all subjects
(or were detected by with very low surface areas)

The HCP Multi-modal Parcellation:
• high consistency in group average parcellation
between training and test sets
Top = manual annotation; Bottom = overlap of training and test set classifier results
Blue borders= Train set; Red borders= Test set; Purple=overlap

The HCP Multi-modal Parcellation:
Advantages:
• Consistent with known patterns of cellular organisation (cyto-architecture)
• Consistent with patterns of functional organisation
• Generalisable to new subjects
• Independently validated on 210 test subjects
• Provides standardised reference framework
• aids in the clarity and efficiency of communicating results

Network Modelling
Estimating connectivity networks:
• Functional connectivity
Correlation/partial correlation of patterns of functional
activity
• Structural connectivity
Estimates of the structural integrity of DTI based estimates
of neural connectivity
htt
p://fde
ligia
nn
i.site/b
asic
s.h
tml

Predicting Cognition and Behaviour
• Conventionally brain network models have been studied through graph theory
Hagmann, Patric, et al. "Mapping the structural core of human cerebral cortex." PLoS Biol 6.7 (2008): e159.
• Networks are the collection of regions (nodes) and their connections (edges)
• Graph theory techniques explore global properties of the graph i.e.
• Clustering coefficients • Path lengths • node degree • Modularity
van den Heuvel, Martijn P., and Olaf Sporns. "Network hubs in the human brain." Trends in cognitive sciences 17.12 (2013): 683-696.

Predicting Cognition and Behaviour
• Machine learning approaches are now becoming more popular
• Prediction of age/gender/developmental outcome/disease progression
• Using:
• Classification • Regression • Unsupervised Learning -
CCA
Pandit, A. S., et al. "Whole-brain mapping of structural
connectivity in infants reveals altered connection strength
associated with growth and preterm birth." Cerebral cortex 24.9
(2014): 2324-2333.
White-matter tract regions associated with age at
scan (A) and postconceptional age at birth (B).

Predicting Cognition and Behaviour
• Machine learning approaches are now becoming more popular
• Prediction of age/gender/developmental outcome/disease progression
• Using:
• Classification • Regression • Unsupervised Learning -
CCA **** HCP data comes with 280 behavioural and demographic measures ******

Current limitations of population-based neuroimaging
Population-based analysis are not yet sensitive enough to make
accurate predictions about individuals
Why?
• Imaging studies assume that at coarse scale all brains are the same
• i.e. fixed number of regions
• Appear in the same place in all brains
• Allows us to map data to a global average space for comparison
Regional organisation of an
average human brain
HCP cortical segmentation v1.0

Current limitations of population-based neuroimaging
Population-based analysis are not yet sensitive enough to make
accurate predictions about individuals
But
• Evidence that suggests that brains vary topologically
Topological variability in the
human brain
e.g.
Van Essen, David C. "A population-average, landmark-and surface-based (PALS) atlas of human cerebral cortex." Neuroimage 28.3 (2005): 635-662. Glasser, Matthew F., et al. "A multi-modal parcellation of human cerebral cortex." Nature (2016). Amunts, K., A. Schleicher, and K. Zilles. "Cytoarchitecture of the cerebral cortex—more than localization." Neuroimage 37.4 (2007): 1061-1065.
A
A
C
C
B
B
Group 1
Group 2
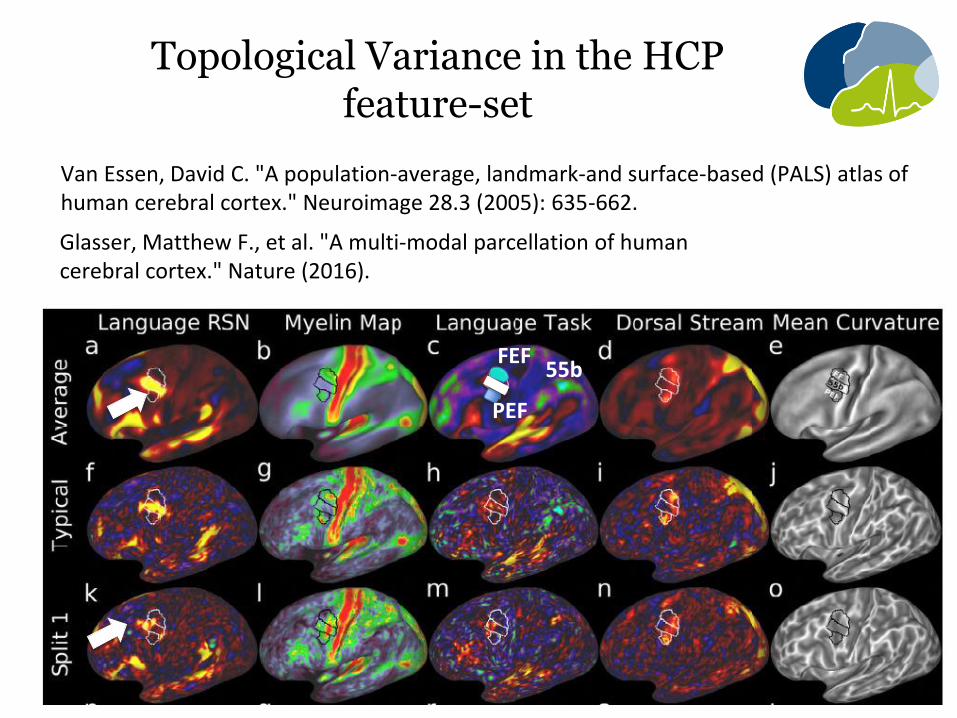
Topological Variance in the HCP feature-set
55b FEF
PEF
Van Essen, David C. "A population-average, landmark-and surface-based (PALS) atlas of human cerebral cortex." Neuroimage 28.3 (2005): 635-662. Glasser, Matthew F., et al. "A multi-modal parcellation of human cerebral cortex." Nature (2016).

Future Challenges
To improve the sensitivity of future analysis we must consider:
• New approaches for spatial normalisation
• Improve multi-modal integration
• Account for topological variation and functional non-stationarity
• Enhanced predictive models:
• Account for correlations between behavioural variables
• Do not rely on global average models of brain organisation
Conclusions
The HCP v 1.0 multi-modal parcellation:
• Cytoarchitecturally and functionally consistent
• Sensitive & Robust reference framework
Future iterations of the method will
• Map labels to diseased or developing populations
• Capture greater individual variation
• Increase sensitivity to subtle differences in behaviour/cognition/genetics disease

• Prof. Daniel Rueckert
• Dr Bernhard Mainz
• Dr Ben Glocker
• Dr Martin Rajchl
• Ira Ktena
• Salim Arslan
• Dr Sarah Parisot
• Prof Jo Hajnal
• Prof David Edwards
• Prof Julia Schnabel
Acknowledgements
• Prof. David Van Essen
• Matthew Glasser
• Tim Coalson
• Dr Carl Hacker
• Prof. Mark Jenkinson
• Prof. Steven Smith
• Prof. Saad Jbadi
• Dr Stamatios Sotiropoulos

Structure does not always align microstructure
V1 Broca’s
Amunts, Zilles, Fischle.g. Cerebral cortex 2008
Cyto-architectonics the
subdivision of the brain based on
cellular composition
The relative placement of cyto-
architechtonic regions within a
sulcus varies across subjects Amunts, Schleicher, Zilles 2007
Alignment of
cytoarchitectonic regions
using morphological
alignment leads to variable
degrees of regional overlap
FIschl et al. Cortical folding patterns and predicting cytoarchitecture. (2008)

MSM for multimodal alignment
• 3D feature sets: sulcal depth,
curvature and myelin
• Do not agree on “optimal”
alignment.
• Registration driven using
multimodal metric: α –MI
• Cost function weighting used to
up/downweight features locally
• This can lead to an improved
joint-alignment of these
features
EVARIABLEWEIGHTINGA.UNIVARIATE B.NOWEIGHTING
C.UPWEIGHTEDFOLDS
D.UPWEIGHTEDMYELIN
CURV
MYELIN
CURV
MYELIN
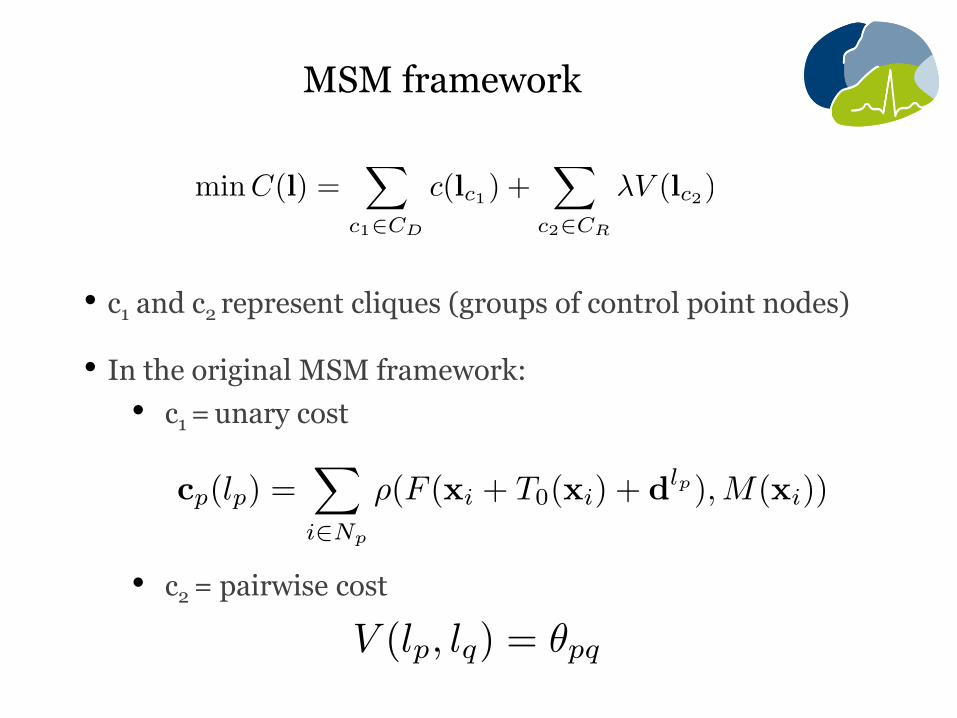
MSM framework
• c1 and c2 represent cliques (groups of control point nodes)
• In the original MSM framework:
• c1 = unary cost
• c2 = pairwise cost

MSM with higher order clique reduction
• Higher order Clique reduction (proposed by Ishikawa CVPR 2009, 2014)
• Reduces higher order cliques to pairwise In the new MSM framework
- “Multimodal Surface Matching with Higher-Order Smoothness Penalties: for Alignment of Cortical Anatomies” (in preparation)
- c1 = triplet data cost

MSM with higher order clique reduction
- c2 = triplet deformation penalty such as
Glocker, Ben, et al. "Triangleflow: Optical flow with triangulation-based higher-order
likelihoods." European Conference on Computer Vision. Springer Berlin Heidelberg,
2010.

The HCP Multi-modal Parcellation:
• improved statistical significance

The HCP multimodal parcellation of the Human Cerebral cortex
• However, not all subjects brains are topologically consistent
A Multi-modal Parcellation of Human Cerebral Cortex” Glasser et al. Nature (in press)
55
b
FEF
PEF

Feature set
• Training data = 110 D feature vectors
• Cortical thickness
• Cortical myelin
• Cortical curvature
• 20 task ICA + mean
• 77 rest ICA
• 5 hand engineered ‘visuotopic’ features
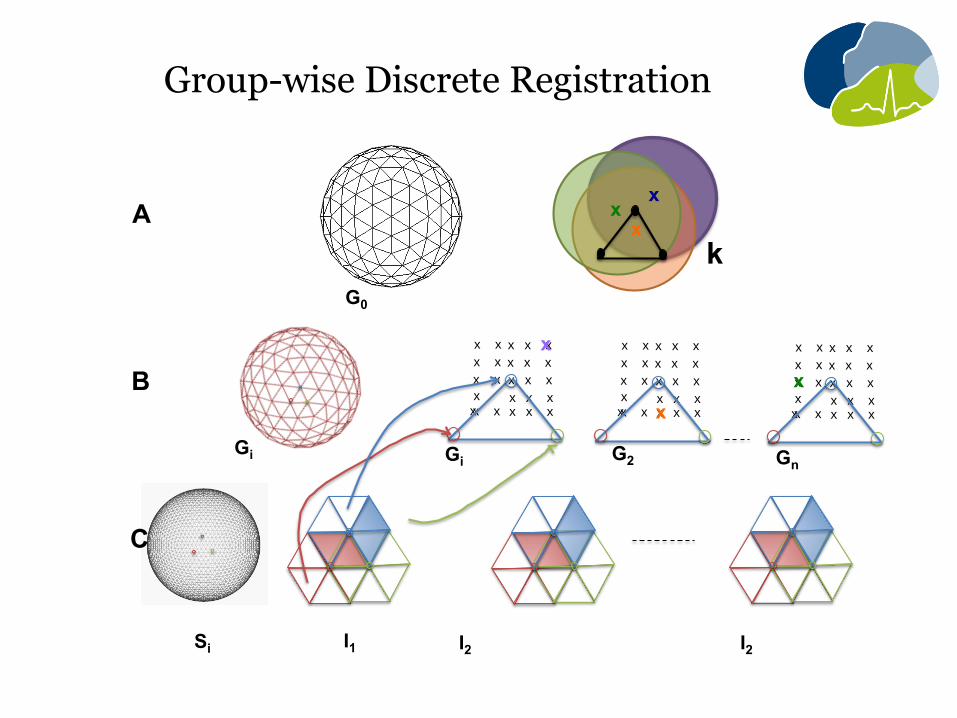
Group-wise Discrete Registration
x x x x x
x x x x x
x x
x x x x x x x x
x x x x x
x x x x x
x x x x x
x x
x x x x x x x x
x x x x x
x x x x x
x x x x x
x x
x x x x x x x x
x x x x x
I1 I2 Si
Gi Gi
I2
G2 Gn
x
G0
x
x
xx
x
k
A
B
C

Group-wise Discrete Registration
Pairwise
similarity
TRIPLET
regularisation
QUARTET
global cost
Inclusion of Higher-Order terms is made possible through clique reduction
techniques, Ishikawa 2009, 2014
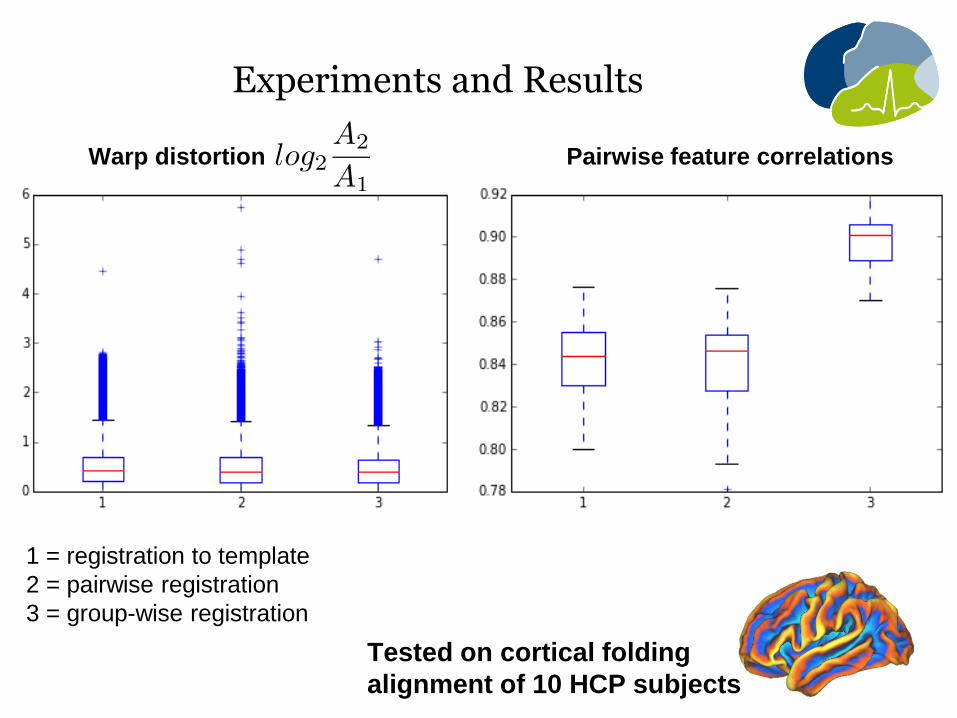
Experiments and Results
Warp distortion Pairwise feature correlations
1 = registration to template
2 = pairwise registration
3 = group-wise registration
Tested on cortical folding
alignment of 10 HCP subjects

Experiments and Results
>0.3
-1.3
1.3
HCPTEMPLATE
GROUPWISEPAIRWISESINGLEREFERENCE
` GROUP
AVERAGES
Discrete Optimisation for Group-wise Cortical Surface Atlasing” E.C. Robinson et al.
The Workshop on Biomedical Image Regisration (WBIR) 2016
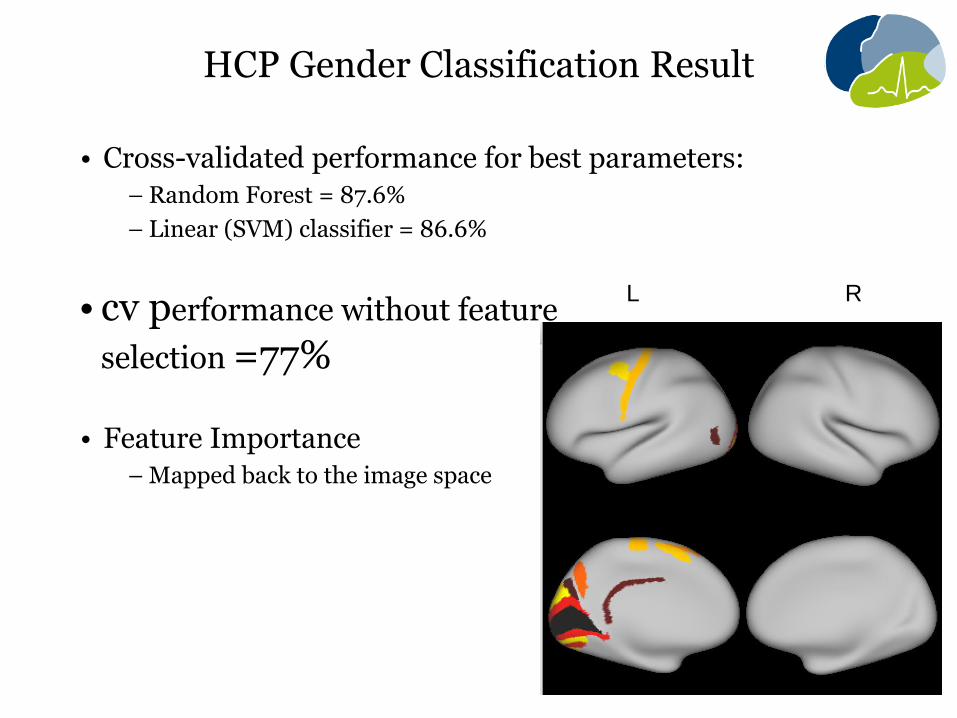
HCP Gender Classification Result
• Cross-validated performance for best parameters: – Random Forest = 87.6%
– Linear (SVM) classifier = 86.6%
• cv performance without feature
selection =77%
• Feature Importance – Mapped back to the image space
L R

HCP Fluid Intelligence Predictions
• Cross-validated performance for best parameters: – Random Forest = 0.347 ( r^2 value)
– Linear (SVM) classifier = 0.340
• CV performance without feature selection =-0.38
• Feature Importance – Mapped back to the image space
L R
Related Documents


![Evaluation Methods for Diffusion-driven ParcellationAnalysis and Machine Intelligence, vol. 26, no. 2, pp. 173-183 [5]Destrieux, C., (2010): Automatic parcellation of human cortical](https://static.cupdf.com/doc/110x72/5f8617fd88123416b81e5f92/evaluation-methods-for-diffusion-driven-parcellation-analysis-and-machine-intelligence.jpg)