3 The Historical Time Frame (Past 1000 Years) Tadeusz Niedźwiedź, Rüdiger Glaser, Daniel Hansson, Samuli Helama, Vladimir Klimenko, Ewa Łupikasza, Łukasz Małarzewski, Øyvind Nordli, Rajmund Przybylak, Dirk Riemann, and Olga Solomina Abstract This chapter summarises the climatic and environmental information that can be inferred from proxy archives of the Baltic Sea area during the past millennium (1000 years). The proxy archives mainly comprise tree-ring analyses together with historical documents on extreme weather events and weather-related disasters. In addition to the reconstructed climate, climatic conditions are simulated using a regional climate model covering the Baltic Sea area. The chapter focuses on three of the main climatic periods of the past millennium: the Medieval Warm Period (900–1350), the Transitional Period (1350–1550) and the Little Ice Age (1550– 1850). During these main historical climatic periods, climatic conditions were not uniform. Shorter warm/cool and wet/dry fluctuations were observed depending on regional factors. Keywords Millenium climate Á Medieval warm period Á Little ice age Á Baltic sea basin 3.1 Introduction This chapter addresses climate variability in the Baltic Sea basin over the past millennium (1000 years). Climate change at the millennial time scale was not discussed in the previous assessment of climate change in the Baltic Sea region (BACC Author Team 2008). Understanding of millennial climate variability is mainly based on proxy data (see Sect. 3.2). Historical notes in the form of chronicles containing information about extreme weather events, and weather-related disasters are important sources of data about climatic conditions in the past millen- nium. Together with historical documents, dendroclimatology has provided much of the information on the climatic con- ditions of the past millennium. Tree-ring width and wood density are the main sources of dendroclimatological data. Other proxy data are of less importance for the past millen- nium and are more relevant for reconstructing the climatic conditions of the Holocene as a whole. Temperature and precipitation data for the Baltic Sea region, as reconstructed from different proxy data sets were also compared against the results of a regional climate model simulation at the Swedish Meteorological and Hydrological Institute (Schimanke et al. 2012). The chapter also describes the main climatic drivers, of which solar radiation factors, atmospheric circulation patterns T. Niedźwiedź (&) Department of Climatology, University of Silesia, Katowice, Poland e-mail: [email protected] R. Glaser Á D. Riemann Institut für Physische Geographie, Albert-Ludwigs-Universität Freiburg, Freiburg im Breisgau, Germany D. Hansson Swedish Institute for the Marine Environment, Göteborg, Sweden S. Helama Global Change Research Group—Arctic Centre, University of Lapland, Rovaniemi, Finland V. Klimenko Moscow Power Engineering Institute, Technical University, Moscow, Russia E. Łupikasza Á Ł. Małarzewski Department of Climatology, University of Silesia, Sosnowiec, Poland Ø. Nordli Research and Development Department, Norwegian Meteorological Institute, Oslo, Norway R. Przybylak Department of Meteorology and Climatology, Nicolaus Copernicus University, Toruń, Poland O. Solomina Institute of Geography of the Russian Academy of Sciences, Moscow, Russia © The Author(s) 2015 The BACC II Author Team, Second Assessment of Climate Change for the Baltic Sea Basin, Regional Climate Studies, DOI 10.1007/978-3-319-16006-1_3 51

Welcome message from author
This document is posted to help you gain knowledge. Please leave a comment to let me know what you think about it! Share it to your friends and learn new things together.
Transcript

3The Historical Time Frame (Past 1000 Years)
Tadeusz Niedźwiedź, Rüdiger Glaser, Daniel Hansson, Samuli Helama,Vladimir Klimenko, Ewa Łupikasza, Łukasz Małarzewski, Øyvind Nordli,Rajmund Przybylak, Dirk Riemann, and Olga Solomina
AbstractThis chapter summarises the climatic and environmental information that can be inferred fromproxy archives of the Baltic Sea area during the past millennium (1000 years). The proxyarchives mainly comprise tree-ring analyses together with historical documents on extremeweather events and weather-related disasters. In addition to the reconstructed climate, climaticconditions are simulated using a regional climate model covering the Baltic Sea area. Thechapter focuses on three of the main climatic periods of the past millennium: the MedievalWarm Period (900–1350), the Transitional Period (1350–1550) and the Little Ice Age (1550–1850). During these main historical climatic periods, climatic conditions were not uniform.Shorter warm/cool and wet/dry fluctuations were observed depending on regional factors.
KeywordsMillenium climate � Medieval warm period � Little ice age � Baltic sea basin
3.1 Introduction
This chapter addresses climate variability in the Baltic Seabasin over the past millennium (1000 years). Climate changeat the millennial time scale was not discussed in the previousassessment of climate change in the Baltic Sea region(BACC Author Team 2008).
Understanding of millennial climate variability is mainlybased on proxy data (see Sect. 3.2). Historical notes in theform of chronicles containing information about extremeweather events, and weather-related disasters are importantsources of data about climatic conditions in the past millen-nium. Together with historical documents, dendroclimatologyhas provided much of the information on the climatic con-ditions of the past millennium. Tree-ring width and wooddensity are the main sources of dendroclimatological data.Other proxy data are of less importance for the past millen-nium and are more relevant for reconstructing the climaticconditions of the Holocene as a whole. Temperature andprecipitation data for the Baltic Sea region, as reconstructedfrom different proxy data sets were also compared against theresults of a regional climate model simulation at the SwedishMeteorological and Hydrological Institute (Schimanke et al.2012). The chapter also describes the main climatic drivers, ofwhich solar radiation factors, atmospheric circulation patterns
T. Niedźwiedź (&)Department of Climatology, University of Silesia,Katowice, Polande-mail: [email protected]
R. Glaser � D. RiemannInstitut für Physische Geographie, Albert-Ludwigs-UniversitätFreiburg, Freiburg im Breisgau, Germany
D. HanssonSwedish Institute for the Marine Environment, Göteborg, Sweden
S. HelamaGlobal Change Research Group—Arctic Centre, University ofLapland, Rovaniemi, Finland
V. KlimenkoMoscow Power Engineering Institute, Technical University,Moscow, Russia
E. Łupikasza � Ł. MałarzewskiDepartment of Climatology, University of Silesia,Sosnowiec, Poland
Ø. NordliResearch and Development Department, NorwegianMeteorological Institute, Oslo, Norway
R. PrzybylakDepartment of Meteorology and Climatology, NicolausCopernicus University, Toruń, Poland
O. SolominaInstitute of Geography of the Russian Academy of Sciences,Moscow, Russia
© The Author(s) 2015The BACC II Author Team, Second Assessment of Climate Change for the Baltic Sea Basin, Regional Climate Studies,DOI 10.1007/978-3-319-16006-1_3
51

and volcanic eruptions appear the most important. The mostunusual weather conditions in the Baltic Sea area in eachcentury have been described in several publications (e.g.Rojecki 1965; Borisenkov and Pasetsky 1988, 2002; Pfister1992, 1999; Glaser 2008).
3.2 Data Sources and Methodology
Research on millennial climate variability is mainly based onproxy data. This is because long-term instrumental measure-ments of meteorological elements (usually limited to atmo-spheric pressure, air temperature and wind) were recorded atonly a few stations and over a relatively short period.
The first non-regular measurements of atmosphericpressure by means of a barometer constructed by Torricelliin 1643 were made in the period 1649–1658 in Clermont-Ferrand, Florence, Paris and Stockholm (von Rudloff 1967).The first regular meteorological measurements were laun-ched in Greenwich (1774). The oldest continuous series ofatmospheric pressure data for the Baltic Sea basin and sur-rounding areas date back to the nineteenth century: Prague(1800), Oslo (1816), Warsaw (1826), St Petersburg (1837),Copenhagen (1842), Stockholm (1844), Berlin (1848),Uppsala (1855), Haparanda (1859) and Helsinki (1882).
The first non-regular attempts at measuring air tempera-ture began between 1654 and 1670 in Florence and Pisa inItaly (von Rudloff 1967); however, the longest homogenisedand uninterrupted series of temperature data began in 1659in central England (Manley 1974). In the Netherlands, directtemperature measurements started in 1705 in De Bilt (Cowie2007). For the Baltic Sea basin, temperature measurementswere initiated around the mid-1700s, with a denser coverageof the southern region in the late eighteenth century. Theoldest continuous observational records of temperature arefrom Sweden: Uppsala (1739—non-regular measurementsstarted in 1722), Lund (1741) and Stockholm (1756); Rus-sia: St. Petersburg (1743); and Denmark: Copenhagen(1798) (von Rudloff 1967). A few temperature series beganin the eighteenth century in central Europe: Berlin (1719),Jena (1770), Prague (1775), Warsaw (1779), Vilnius (1781),Wroclaw (1791) and Kraków (1792).
The oldest measurements of precipitation in Europestarted in 1715 in Hoofddorp-Zwanenburg in the Nether-lands and in 1725 in Padova in Italy. In the Baltic Sea area,the oldest precipitation station is Uppsala (1739) (vonRudloff 1967). In the first half of the nineteenth century,precipitation was also measured in a few other places:Warsaw (1803), Prague (1804), Copenhagen (1805), Jena(1827), Dresden (1828), Helsinki (1844) and Berlin (1847).
Historical notes in the form of chronicles containinginformation about extreme weather events and weather-related disasters are important sources of data about climatic
conditions of the past millennium. In many cases, suchnotations are very precise as they locate events in space andtime, sometimes even with an accuracy of a day. A sys-tematic daily weather diary carried from 1502 to 1540 inKraków and surroundings by Marcin Biem, a professor ofKraków Academy (Bokwa et al. 2001; Limanówka 2001) isunique on the European scale. A similar weather diary forthe north-eastern part of Poland was kept by Jan AntoniChrapowicki (Nowosad et al. 2007; Przybylak and Marci-niak 2010) for the period 1656–1685. Borisenkov andPasetsky (1988, 2002) compiled information about climateextremes and natural disasters from Russian chronicles. InSwitzerland, Pfister (1992) established the European Centreof Historical Climate with the European Climate Historicaldatabase—EURO-CLIMHIST (Pfister 1992; Brázdil et al.2010). Later, Glaser (2008) published the complete climatehistory for central Europe and Germany, covering the past1200 years. Brázdil et al. (2005) discussed the state ofEuropean historical-climatological research with specialattention to data sources, methods and significant results.
Together with historical documents, dendroclimatologyhas provided a large part of information on climatic condi-tions of the past millennium. Tree-ring width and wooddensity (Ljungqvist 2010) are the main sources of dendro-climatological data. Several recent multi-proxy reconstruc-tions were made for the northern hemisphere (Jones et al.1998, 2001a, b, 2009; Mann et al. 1998, 1999, 2008; Ber-trand et al. 2002; Mann and Jones 2003; Jones and Mann2004; Moberg et al. 2005; Ljungqvist 2010; Ljungqvist et al.2012). On a regional scale, the most important reconstruc-tions based on tree-ring or multi-proxy data are for Fenno-scandia (Briffa et al. 1992; Gouirand et al. 2008; Lindholmet al. 2009, 2011; Esper et al. 2012), Finland (Helama et al.2002, 2005, 2009b; Ogurtsov et al. 2008; Luoto and Helama2010), central and northern Sweden (Gunnarson and Lin-derholm 2002; Linderholm and Gunnarson 2005; Moberget al. 2006; Grudd 2008), eastern Norway (Kalela-Brundin1999), Germany (Glaser 2008; Glaser and Riemann 2009),the north-western Baltic Sea (Klimanov et al. 1985), Russia(Klimenko and Solomina 2010), and Poland (Przybylaket al. 2005, 2010; Przybylak 2007, 2011; Szychowska-Krąpiec 2010; Koprowski et al. 2012). Although many ofthe data sets concern the Alps (Büntgen et al. 2005, 2006),they are well correlated with the central European mountains(Bednarz 1984, 1996; Bednarz et al. 1999; Niedźwiedź2004; Büntgen et al. 2007, 2012).
Other proxy data were also applied to the millenniumtemperature reconstructions, for example, peat-bog deposits(Lamentowicz et al. 2008, 2009), lake fossils and sedimentsfrom Tsuolbmajavri Lake in northernmost Finland (Korholaet al. 2000), laminated lake sediments in Gościąż Lake incentral Poland (Starkel et al. 1996; Ralska-Jasiewiczowa et al.1998) and borehole temperatures (Majorowicz et al. 2004;
52 T. Niedźwiedź et al.
Majorowicz 2010). The reliability of the reconstructionsis discussed by Holmström (2011). For northernSweden, a summer-temperature reconstruction for the past2000 years was achieved using pollen-stratigraphical data(Bjune et al. 2009). Among other biological proxies, a fewreconstructions were based on diatoms (Korhola et al. 2000;Weckström et al. 2006) and chironomids (Korhola et al.2002). These data are of less importance for reconstructingthe climatic conditions of the past millennium and betterused for reconstructing the climate of the Holocene as awhole.
Proxy records are clearly useful for helping understandthe spatial and temporal variability of climate change,especially over periods shorter than the millennial timeframe and which fall outside the instrumental period. Otherdata sets, such as long-term variability in Baltic Sea icecover (Koslowski and Glaser 1999), runoff or oxygen con-ditions (Hansson and Omstedt 2008; Hansson et al. 2011;Hansson and Gustafsson 2011) can be used in combinationwith climate models to increase understanding.
3.3 General Features of the MillennialClimate
According to the scientific literature, four climatic periodshave occurred over the past millennium (Lamb 1977, 1982;Grove 1988; Folland et al. 1990; Brázdil 1996; Crowley2000; Crowley and Lowry 2000; Bradley et al. 2003; Brázdilet al. 2005; Xoplaki et al. 2005; NCR 2006; Esper and Frank
2009; Jones et al. 2009; Brázdil and Dobrovolný 2010;Büntgen and Tegel 2011; Büntgen et al. 2011b; Ogurtsovet al. 2011; Przybylak 2011; Ljungqvist et al. 2012):• Medieval Warm Period (MWP 900–1350) or Medieval
Climate Anomaly (MCA)• Transitional Period (TP 1350–1550)• Little Ice Age (LIA 1550–1850)• Contemporary Warm Period (CW after 1850).
The dates for the four climatic periods are approximateand may differ slightly from one geographical region toanother (Ljungqvist et al. 2012). Some shorter intervals aremainly related to the changes in solar activity or large vol-canic eruptions. The Contemporary Warm Period isaddressed in detail in Chaps. 4–9.
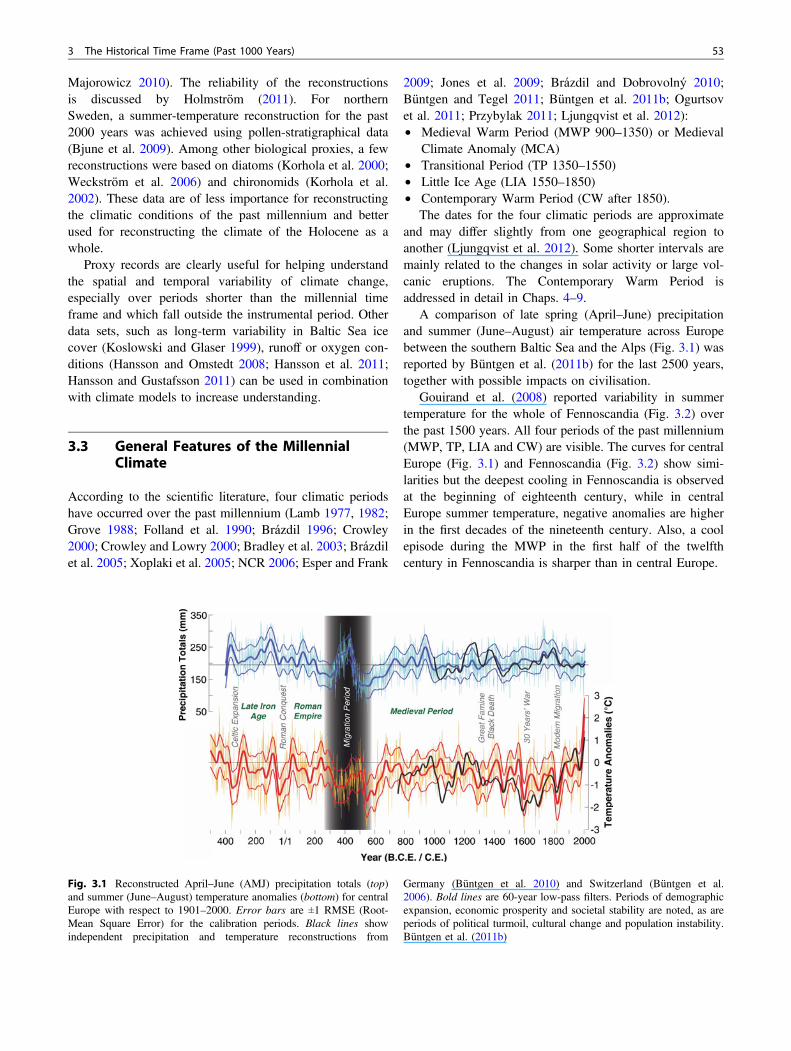
A comparison of late spring (April–June) precipitationand summer (June–August) air temperature across Europebetween the southern Baltic Sea and the Alps (Fig. 3.1) wasreported by Büntgen et al. (2011b) for the last 2500 years,together with possible impacts on civilisation.
Gouirand et al. (2008) reported variability in summertemperature for the whole of Fennoscandia (Fig. 3.2) overthe past 1500 years. All four periods of the past millennium(MWP, TP, LIA and CW) are visible. The curves for centralEurope (Fig. 3.1) and Fennoscandia (Fig. 3.2) show simi-larities but the deepest cooling in Fennoscandia is observedat the beginning of eighteenth century, while in centralEurope summer temperature, negative anomalies are higherin the first decades of the nineteenth century. Also, a coolepisode during the MWP in the first half of the twelfthcentury in Fennoscandia is sharper than in central Europe.
Fig. 3.1 Reconstructed April–June (AMJ) precipitation totals (top)and summer (June–August) temperature anomalies (bottom) for centralEurope with respect to 1901–2000. Error bars are ±1 RMSE (Root-Mean Square Error) for the calibration periods. Black lines showindependent precipitation and temperature reconstructions from
Germany (Büntgen et al. 2010) and Switzerland (Büntgen et al.2006). Bold lines are 60-year low-pass filters. Periods of demographicexpansion, economic prosperity and societal stability are noted, as areperiods of political turmoil, cultural change and population instability.Büntgen et al. (2011b)
3 The Historical Time Frame (Past 1000 Years) 53

Mean January–April air temperature for the period 1170–1994 (Fig. 3.3) and 10-year anomalies of winter and summerair temperature from 1401 to 1800 (Fig. 3.4) have beenreconstructed for Poland. The climatic history for Polandover the past millennium was reconstructed by Przybylak(2011) and more comprehensively by Przybylak et al.(2010). Tree-ring reconstruction of January–April air tem-perature indicates three relatively cool periods: 1475–1500,1600–1660 and 1725–1830 (Fig. 3.3). The peak temperatureof an exceptionally warm episode occurring 1661–1675 isslightly lower than indicated by other reconstructions forcentral Europe (compare Fig. 3.9). Cold anomalies forwinter temperature in Poland (Fig. 3.4) suggest an increasedannual temperature range during the LIA. A cool period atthe final phase of the LIA in the first half of the nineteenthcentury is also found in a reconstruction based on the full
depth of ground temperature in boreholes (Majorowicz et al.2004).
Climate change during the past millennium over the BalticSea region was simulated by the Swedish Meteorological andHydrological Institute using a regional climate model (Schi-manke et al. 2012). The authors used the Rossby CentreRegional model (RCA3) with boundary conditions from thegeneral circulation model ECHO-G. RCA3 includes radiativeforcing, changes in orbital parameters, changes in greenhousegas concentration and atmospheric circulation. The modelcovers the whole Baltic Sea area and its surroundings and hasa horizontal resolution of about 50 × 50 km. Results werepresented as 50-year running means; air temperature is largelyunderestimated (Schimanke et al. 2012). Biases in annualprecipitation are about 20 % in the Baltic Sea region andduring winter and autumn exceed 50 %.
Fig. 3.2 Regional-average summer (June–August) temperatures AD442–1970 for Fennoscandia created by merging seven reconstructionsbased on seven networks (Gouirand et al. 2008). The time series isextended to year 2000 with instrumental data. Data are shown assmoothed (Gaussian filtered) temperatures, highlighting variability on
timescales longer than 10 years (thin black), 30 years (thick dark grey) and100 years (thick light grey). The dashed horizontal line is the average forthe entire period. The uncertainty in reconstructed temperatures (based onthe calibration period statistics) is illustrated by ±2 standard errors withgrey shading (for the 10-year smoothing only)
Fig. 3.3 Reconstructed mean January–April air temperature in Polandfor the period 1170–1994 using a standardised chronology of Scots pine(Pinus sylvestris L.) tree-ring widths (modified after Przybylak et al.2005; Przybylak 2011). Rek-11 and Rek-50 represent 11- and 50-year
running means; reconstruction using areally averaged air temperaturefrom Warsaw, Bydgoszcz and Gdańsk for calibration. Obs: measuredmean January–April area-averaged air temperature from Warsaw,Bydgoszcz and Gdańsk (Przybylak et al. 2005; Przybylak 2007, 2011)
54 T. Niedźwiedź et al.
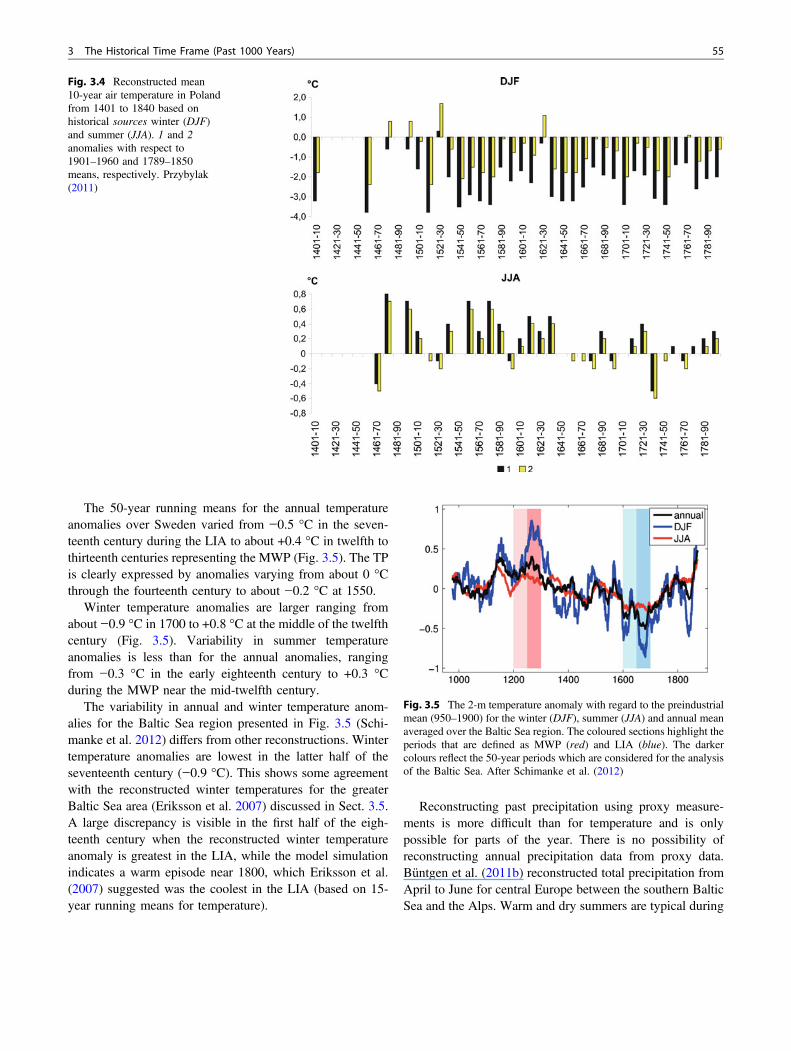
The 50-year running means for the annual temperatureanomalies over Sweden varied from −0.5 °C in the seven-teenth century during the LIA to about +0.4 °C in twelfth tothirteenth centuries representing the MWP (Fig. 3.5). The TPis clearly expressed by anomalies varying from about 0 °Cthrough the fourteenth century to about −0.2 °C at 1550.
Winter temperature anomalies are larger ranging fromabout −0.9 °C in 1700 to +0.8 °C at the middle of the twelfthcentury (Fig. 3.5). Variability in summer temperatureanomalies is less than for the annual anomalies, rangingfrom −0.3 °C in the early eighteenth century to +0.3 °Cduring the MWP near the mid-twelfth century.
The variability in annual and winter temperature anom-alies for the Baltic Sea region presented in Fig. 3.5 (Schi-manke et al. 2012) differs from other reconstructions. Wintertemperature anomalies are lowest in the latter half of theseventeenth century (−0.9 °C). This shows some agreementwith the reconstructed winter temperatures for the greaterBaltic Sea area (Eriksson et al. 2007) discussed in Sect. 3.5.A large discrepancy is visible in the first half of the eigh-teenth century when the reconstructed winter temperatureanomaly is greatest in the LIA, while the model simulationindicates a warm episode near 1800, which Eriksson et al.(2007) suggested was the coolest in the LIA (based on 15-year running means for temperature).
Reconstructing past precipitation using proxy measure-ments is more difficult than for temperature and is onlypossible for parts of the year. There is no possibility ofreconstructing annual precipitation data from proxy data.Büntgen et al. (2011b) reconstructed total precipitation fromApril to June for central Europe between the southern BalticSea and the Alps. Warm and dry summers are typical during
Fig. 3.4 Reconstructed mean10-year air temperature in Polandfrom 1401 to 1840 based onhistorical sources winter (DJF)and summer (JJA). 1 and 2anomalies with respect to1901–1960 and 1789–1850means, respectively. Przybylak(2011)
Fig. 3.5 The 2-m temperature anomaly with regard to the preindustrialmean (950–1900) for the winter (DJF), summer (JJA) and annual meanaveraged over the Baltic Sea region. The coloured sections highlight theperiods that are defined as MWP (red) and LIA (blue). The darkercolours reflect the 50-year periods which are considered for the analysisof the Baltic Sea. After Schimanke et al. (2012)
3 The Historical Time Frame (Past 1000 Years) 55

the MWP (900–1350). The onset of the TP in the latter halfof the thirteenth century is indicated by cooler and wettersummers. Total precipitation between April and June overthe past millennium in central Europe is presented inFigs. 3.1 (Büntgen et al. 2011b) and 3.6 (Büntgen et al.2011c). Generally, the MWP was drier than the first half ofthe TP and the LIA in spring and early summer seasons.
Annual precipitation simulated in the Baltic Sea catch-ment area by a regional climate model (Schimanke et al.2012) and shown in Fig. 3.7 indicates that the annual totalsare larger during the MWP than the TP and the LIA. Theannual precipitation data cannot be compared with thereconstructed data for April–June. However, the very dryperiod in the latter half of the fifteenth century is marked inboth precipitation series. The variability of river runoff to theBaltic Sea follows changes in precipitation. However, thesimulation of river runoff for the period 1500–1995 byHansson et al. (2011) presented in Chap. 5, Fig. 5.3 indicatesno significant long-term change.
3.4 The Medieval Warm Period (MWP900–1350)
At the turn of the tenth and eleventh centuries, relativelystable climate conditions with few extremes prevailed in theBaltic Sea basin and the surrounding parts of Europe. Hotand dry summers were noted in 993 and 994, respectively.For example, in Russian chronicles, eight droughts (1000,1025–1028, 1035, 1037, 1092), four wet summers with rainand floods (1002, 1031, 1034, 1043) and seven severewinters (1034/35, 1043/44, 1047/48, 1056/57, 1058/59,1066/67, 1076/77) were noted in the eleventh century (Bo-risenkov and Pasetsky 1988, 2002).
In Europe, the warmest conditions occurred between1200 and 1250, and the MWP ended about 1350 (Borisen-kov and Pasetsky 1988, 2002). Chernavskaya (1996)reconstructed the June temperature changes in EuropeanRussia over the past two millennia based on pollen analysisin peat bogs. Data from Polistovo (56.8°N, 38.1°E) suggestan earlier occurrence of the MWP (ninth to tenth centuries)in European Russia than in central Russia (tenth to eleventhcenturies). Two periods of strong cooling occurred in themiddle of the twelfth century and at the end of the fourteenthcentury. On the East European Plain, summer temperaturesduring the MWP were found to be above the long-termaverage between 900 and 1200 (Klimenko and Solomina2010). For Fennoscandia (Fig. 3.2), summer temperatureswere elevated in the tenth and eleventh centuries (Gouirandet al. 2008). Even warmer summer periods were noted in thelate twelfth century, succeeding the extreme cool summers inthe mid-twelfth century.
Fig. 3.6 a Central European andregional fir TRW (Tree RingWidth) extremes, and b theircentennial changes over the pastmillennium (network extremeswere double weighted), comparedto c annual-resolve and 40-yearlow-passed Central EuropeanApril–June precipitationvariability (Büntgen et al. 2011c)
Fig. 3.7 Annual precipitation in the Baltic Sea catchment area (green)and statistical estimated runoff (blue) as 50-year running means. AfterSchimanke et al. (2012)
56 T. Niedźwiedź et al.
Recent investigations of Fennoscandia by Ljungqvist(2010) showed that the MWP occurred between 800 and1300. At that time, warm-season (May–September) tem-peratures exceeded the contemporary warming of the end oftwentieth century by about +0.5 °C. The start of the warmingwas noted between the ninth and tenth centuries, and thepeak temperature appeared at the beginning of the secondhalf of the twelfth century. In a winter temperature simula-tion over the Baltic Sea region (Schimanke et al. 2012)during that time anomalies reached their highest value of+0.8 °C for the MWP (Fig. 3.5). Lower temperaturesoccurred at the end of the MWP, about 1350. A diatom-based July temperature reconstruction for the past 800 yearsin northern Scandinavia (Weckström et al. 2006; Holmström2011) indicates that temperature was about 0.2 °C higher inthe latter half of the fifteenth century than in 1970–2000. Anexceptionally warm period occurred in 1220–1250 and in thelatter half of the fifteenth century (1470–1500) in theTP. The frequency of extreme temperature events in Russiaincreased in the twelfth century (Borisenkov and Pasetsky1988, 2002). Winter-simulated temperature indicates thesecond warm episode of the MWP in the latter half of thethirteenth century (Schimanke et al. 2012) for the Baltic Searegion (Fig. 3.5). At the beginning of the fourteenth century,climatic conditions cooled rapidly. In 1315, a serious faminein northern Europe resulted from a series of very coldwinters (1302/03 and 1305/06) and cool and wet summers(1314–1317) across the whole of Europe (Cowie 2007).
There is less information available on precipitation in theMWP (Gouirand et al. 2008; Büntgen et al. 2011b, c).Nevertheless, a regional dendroclimatic precipitation recon-struction from southern Finland showed a uniquely pro-longed rainfall deficit coinciding with the MWP (Helamaet al. 2009a). The drought was particularly severe between1000 and 1200. The simulation of annual precipitation forthe Baltic Sea catchment using a regional climate model(Schimanke et al. 2012) shows that the driest period was themid-eleventh century and that two wet periods occurred inthe first half of the twelfth century and the latter half of thethirteenth century (Fig. 3.7). As a generalisation, relativelydry periods occurred in Europe in the years: 1272–1291, and1300–1309, while the wettest conditions were noted in1312–1322 (Borisenkov and Pasetsky 1988, 2002). InApril–June in central Europe (Fig. 3.6), wet conditions wereobserved in 1052, 1187 and 1316, and the driest in 1167(Büntgen et al. 2011c). Distinct wet periods with frequentfloods were recognised in this region at 1020–1030 and1075–1100 (Starkel 2001).
3.5 The Transitional Period(TP 1350–1550)
The increase in the intra-seasonal variability of climate at theend of the MWP in the period 1270–1350 is considered to bethe beginning of the LIA; however, Brázdil et al. (2005)suggested that the following 200-year period should betreated as transitional between the MWP and the LIA. Thisperiod was characterised by a great variability of climaticconditions. At that time, temperature decreased by about1.2 °C, but cooling occurred until the latter half of the six-teenth century (Borisenkov and Pasetsky 1988, 2002).During this period, the decreasing tendency of mean annualand seasonal temperatures simulated for Baltic Sea region(Fig. 3.5) is clearly visible.
Over the majority of Europe and Russia, very unfa-vourable conditions for agriculture in the period 1400–1480were linked to large fluctuations in temperature and pre-cipitation. For example, the summers of 1428, 1434, 1436and 1438 were hot and dry and the summer of 1435 wascool and dry, whereas the summers of 1432, 1437 and 1439were extremely wet with flooding (Borisenkov and Paset-sky 1988, 2002). In central Europe (Fig. 3.6), the first partof the TP up to about 1430 was very wet according to thereconstructed April–June precipitation curve (Büntgen et al.2011c) and followed by very dry conditions with anextremely dry and hot spring and summer in the year 1504(Glaser 2008).
In Poland (Fig. 3.4), severe winters were detected in fourdecades: 1401–1410, 1451–1460, 1511–1520 and 1541–1550 (Przybylak 2011). The warmest were winters duringthe years 1521–1530. Similar thermal conditions in winterbased on historical sources were found in Latvia (Jevrejeva2001) and Estonia (Tarand and Nordli 2001). The summerswere relatively warm in two decades: 1471–1480 and 1491–1500.
The first halves of the fifteenth and sixteenth centuriesappear relatively warm periods, but there was large vari-ability (Helama et al. 2009b). Climatic variability may bereflected in the proxy instability. According to a diatom-based reconstruction, the warmest 30-year non-overlappingperiod in northern Scandinavia occurred in 1470–1500(Weckström et al. 2006); however, according to a dendro-climatic reconstruction in this region, the summers of the latefifteenth century were anomalously cold (Helama et al.2009b). There were very warm conditions in Fennoscandiain summer at the end of the TP (Gouirand et al. 2008;Fig. 3.2).
3 The Historical Time Frame (Past 1000 Years) 57

3.6 The Little Ice Age (LIA 1550–1850)
In the latter half of the sixteenth century, the temperaturedropped. This tendency was particularly clear in the period1569–1579. Another sequence of extremely wet and coolsummers was identified at the end of the sixteenth century(Borisenkov and Pasetsky 1988, 2002). The longest con-secutive cold period occurred from the late sixteenth centuryto the mid-eighteenth century (Gouirand et al. 2008), whichis in very good agreement with a regional climate modelsimulation for temperature in the Baltic Sea region (Schi-manke et al. 2012; Fig. 3.5). But a short sequence of verywarm summers was observed in the latter part of eighteenth
century, just before the prolonged cooling at the end of theeighteenth and during the nineteenth century (Fig. 3.2).
Eriksson et al. (2007) analysed the complex descriptionof winter climate conditions during the LIA for the greaterBaltic Sea region (50–70°N, 0–30°E). Their study is basedon well-documented time series of ice cover, sea-levelpressure and winter surface-air temperatures. Using wintertemperature in connection with atmospheric circulation andice conditions, they found four cold and three warm periodsduring the LIA (Fig. 3.8). In the latter half of the sixteenthcentury, a cool phase (1562–1576) passed to a relativelymild period (1577–1591). In the seventeenth century, twophases of cold winters, 1597–1629 and 1663–1706, were
Fig. 3.8 Winter climateconditions in the greater BalticSea region since 1500. The greycolour shows seasonal winter datafrom two gridded data sets: (topto bottom) Baltic Sea mean winterair temperature. Black line in allpanels is a 15-year running mean.Blue and red fields cover periodsclassified as cold and mild,respectively (Eriksson et al. 2007)
58 T. Niedźwiedź et al.

divided by the mild period of 1630–1662. The first half ofthe eighteenth century (1707–1750) which includes thewarmest winter (1723/24) is considered to be the majorwarm period. At this time, the maximum ice extent in theBaltic Sea was similar to present-day conditions, albeit thereare many uncertainties related to the observations at thattime (Seinä and Palosuo 1996; Hansson and Omstedt 2008).The period 1730–1745 has also been described as particu-larly variable interannually, swinging from extremely mildto extremely cold winters (Jones and Briffa 2006). Theoccurrence of cold winters is related to the Late MaunderMinimum (1675–1715) which has also been discussed byLuterbacher et al. (2001) and in Chap. 4, Sect. 4.2.3. Thelongest cool period in the final phase of the LIA in the BalticSea region (1750–1877) coincided with the Dalton
Minimum (1790–1840) in solar activity (Eriksson et al.2007; see also Chap. 4). During the entire LIA, no down-ward trend in ice break-up date of the river Daugava wasdetected (see also Chap. 5).
A new reconstruction of the Baltic Sea region climate forthe past 500 years was prepared by Brázdil et al. (2010) onthe basis of instrumental data and documentary evidenceunder the MILLENNIUM project. January–April meantemperatures were reconstructed for Stockholm (1502–2008)and central Europe (1500–2007). In central Europe, thecoldest conditions were observed in the sixteenth century,while in central Sweden the end of the seventeenth centurywas cooler (Fig. 3.9). In central Europe, the warmest periodwas the first half of the eighteenth century, while in Stock-holm such conditions occurred at the end of the eighteenth
Fig. 3.9 Comparison ofreconstructed JFMA(January–April) temperaturesfor Stockholm (1502–2008)and CEuT (Central EuropeanTemperature) (1500–2007)(anomalies from the 1961–1990mean). Original series of CEuT(a) and Stockholm (b) aresmoothed with a 30-yearGaussian filter (c) and comparedusing 31-year runningcorrelations between unfiltereddata (d). The horizontal solid linein d denotes the critical value ofcorrelation coefficients forα = 0.05 for one-tailed t test(Brázdil et al. 2010)
3 The Historical Time Frame (Past 1000 Years) 59
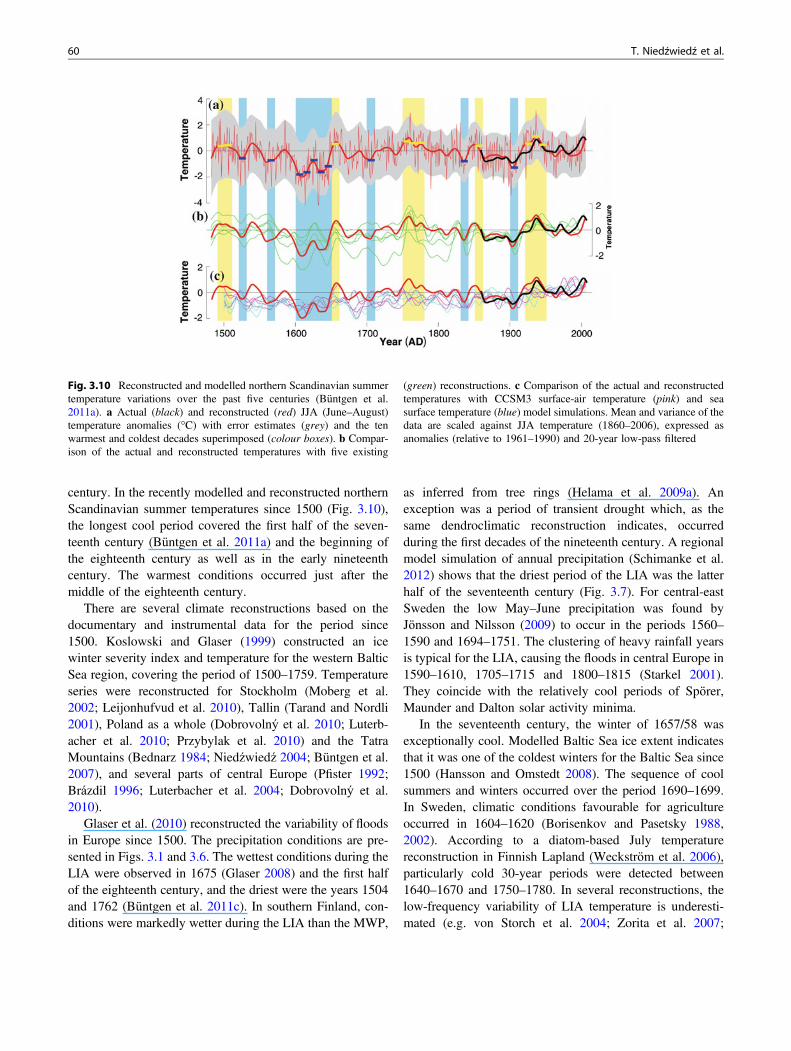
century. In the recently modelled and reconstructed northernScandinavian summer temperatures since 1500 (Fig. 3.10),the longest cool period covered the first half of the seven-teenth century (Büntgen et al. 2011a) and the beginning ofthe eighteenth century as well as in the early nineteenthcentury. The warmest conditions occurred just after themiddle of the eighteenth century.
There are several climate reconstructions based on thedocumentary and instrumental data for the period since1500. Koslowski and Glaser (1999) constructed an icewinter severity index and temperature for the western BalticSea region, covering the period of 1500–1759. Temperatureseries were reconstructed for Stockholm (Moberg et al.2002; Leijonhufvud et al. 2010), Tallin (Tarand and Nordli2001), Poland as a whole (Dobrovolný et al. 2010; Luterb-acher et al. 2010; Przybylak et al. 2010) and the TatraMountains (Bednarz 1984; Niedźwiedź 2004; Büntgen et al.2007), and several parts of central Europe (Pfister 1992;Brázdil 1996; Luterbacher et al. 2004; Dobrovolný et al.2010).
Glaser et al. (2010) reconstructed the variability of floodsin Europe since 1500. The precipitation conditions are pre-sented in Figs. 3.1 and 3.6. The wettest conditions during theLIA were observed in 1675 (Glaser 2008) and the first halfof the eighteenth century, and the driest were the years 1504and 1762 (Büntgen et al. 2011c). In southern Finland, con-ditions were markedly wetter during the LIA than the MWP,
as inferred from tree rings (Helama et al. 2009a). Anexception was a period of transient drought which, as thesame dendroclimatic reconstruction indicates, occurredduring the first decades of the nineteenth century. A regionalmodel simulation of annual precipitation (Schimanke et al.2012) shows that the driest period of the LIA was the latterhalf of the seventeenth century (Fig. 3.7). For central-eastSweden the low May–June precipitation was found byJönsson and Nilsson (2009) to occur in the periods 1560–1590 and 1694–1751. The clustering of heavy rainfall yearsis typical for the LIA, causing the floods in central Europe in1590–1610, 1705–1715 and 1800–1815 (Starkel 2001).They coincide with the relatively cool periods of Spörer,Maunder and Dalton solar activity minima.
In the seventeenth century, the winter of 1657/58 wasexceptionally cool. Modelled Baltic Sea ice extent indicatesthat it was one of the coldest winters for the Baltic Sea since1500 (Hansson and Omstedt 2008). The sequence of coolsummers and winters occurred over the period 1690–1699.In Sweden, climatic conditions favourable for agricultureoccurred in 1604–1620 (Borisenkov and Pasetsky 1988,2002). According to a diatom-based July temperaturereconstruction in Finnish Lapland (Weckström et al. 2006),particularly cold 30-year periods were detected between1640–1670 and 1750–1780. In several reconstructions, thelow-frequency variability of LIA temperature is underesti-mated (e.g. von Storch et al. 2004; Zorita et al. 2007;
Fig. 3.10 Reconstructed and modelled northern Scandinavian summertemperature variations over the past five centuries (Büntgen et al.2011a). a Actual (black) and reconstructed (red) JJA (June–August)temperature anomalies (°C) with error estimates (grey) and the tenwarmest and coldest decades superimposed (colour boxes). b Compar-ison of the actual and reconstructed temperatures with five existing
(green) reconstructions. c Comparison of the actual and reconstructedtemperatures with CCSM3 surface-air temperature (pink) and seasurface temperature (blue) model simulations. Mean and variance of thedata are scaled against JJA temperature (1860–2006), expressed asanomalies (relative to 1961–1990) and 20-year low-pass filtered
60 T. Niedźwiedź et al.

Christiansen and Ljungqvist 2011). A new method of tem-perature reconstruction (Christiansen and Ljungqvist 2011)showed that in the seventeenth century, the lowest temper-ature anomaly in the cooling northern hemisphere reached a50-year smoothing value 1.1 °C below the contemporarylevel (1880–1960). The period 1630–1700 was the coolestconsecutive period of the entire past millennium.
At the beginning of the eighteenth century, the winter of1708/09 was perhaps the coldest winter of the past 500 years(Luterbacher et al. 2004). In Poland, the coolest winters wererecorded in the decades 1701–1710 and 1741–1750, while thecoldest summers were found in the decade 1731–1740(Przybylak 2011). Very cold winters were also observed at theend of eighteenth century in 1783/84, 1788/89, 1794/95 and1798/99 (Borisenkov and Pasetsky 1988, 2002). This coldperiod continued to the end of the first half of the nineteenthcentury. In 1815, the Tambora volcanic eruption in Indonesiadischarged large amounts of ash into the upper atmosphere,resulting in the famous ‘year without a summer’ in 1816. Thisparticular year, the summer in western Europe was unusuallycold. However, that was not the case in the Baltic Sea basin(Briffa and Jones 1992). In eighteenth century in Poland,precipitation showed large variability. The period 1731–1750was wetter than normal (Przybylak 2011). But between 1751and 1766, during a generally dry period with 13 dry years, thewettest was 1755 and the driest 1762.
Dendroclimatological studies have identified several cooland rainy summers in the Carpathian Mountains (southernPoland) in the latter part of the LIA: 1650–1660, 1670–1685, 1690–1719 and 1735–1745 (Bednarz 1984, 1996).The final phase of the LIA in the first half of the nineteenthcentury was also marked by a sequence of exceptionally coldyears between 1812 and 1824. In that period, average wintertemperature in Russia and a large part of Europe was lowerthan normal by as much as 10–12 °C (Borisenkov andPasetsky 1988, 2002). In central Europe, the winter of 1829/30 was extremely cold, as well as the winters of 1822/23 and1837/38. In Norway, based on farmer diaries (Nordli et al.2003), the severely cold spring/summer (April–August)decadal temperatures were found around 1740, and the1800s and 1830s.
The cooling during the LIA had an important influence onhuman society. At the turn of the thirteenth and fourteenthcenturies, the number of farms in northern Norway decreaseddue to a drop in temperature (Cowie 2007). In Finland,abandoning of farms in the sixteenth and seventeenth cen-turies coincided with a long-term summer temperaturecooling, implying that the desertion may have resulted froma change in climatic conditions that significantly limitedagriculture as a means of subsistence (Holopainen and He-lama 2009). In the same region, harvest records show thatduring the poorest years the amount of grain harvested was
less than had been sown (Holopainen and Helama 2009).Very unfavourable weather conditions in 1697 resulted in afailed crop. This caused widespread famine, followed byover a third of the Finnish and a fifth of the Estonian pop-ulation dying in just a few years (Cowie 2007). Also, thecold winter of 1657/58 permitted the Swedish King CharlesX to walk across the frozen Belts and Sound with his armyand occupy all of Denmark, except for Copenhagen, with alarge loss of land for the Danish (Neumann 1978; Hanssonand Omstedt 2008).
There are discrepancies in the dates of both the end of theLIA and the beginning of the CW. The majority of scientistsagree on 1850 as being crucial (e.g. Grove 1988). However,some climatologists claim that the LIA did not finish untilthe last decades of the nineteenth century (e.g. Lamb 1977).In southern Poland (Tatra Mountains) according to summertemperature data, the final episode of the LIA lasted103 years: 1793–1895 (Niedźwiedź 2004).
3.7 Conclusion
According to the scientific literature, there are four climaticperiods of the past millennium: the Medieval Warm Period(MWP 900–1350), the Transitional Period (TP 1350–1550),the Little Ice Age (LIA 1550–1850), and the ContemporaryWarm Period (CW after 1850). The MWP started at thebeginning of the tenth century with relatively stable climateconditions, and few extremes prevailed in the Baltic Seabasin and the surrounding parts of Europe. The warmestconditions occurred between 1200 and 1250. Two periods ofstrong cooling were detected in the middle of the eleventhand at the beginning of the fourteenth century. During theMWP in Fennoscandia, warm-season (May–September)temperatures exceeded the contemporary warming of the endof twentieth century by about +0.5 °C. The following 200-year period should be treated as a transitional period betweenthe MWP and LIA. This period was characterised by a greatvariability in climatic conditions; at that time, temperaturedecreased by about 1.2 °C. In the latter half of the sixteenthcentury, the temperature dropped, initiating the LIA. Wintertemperatures in combination with atmospheric circulationand ice conditions indicate four cold and three warm periodsduring the LIA. In the recently modelled and reconstructednorthern Scandinavian summer temperatures since 1500, thelongest cool period prevailed during the first half of theseventeenth century and at the beginning of the eighteenthcentury, as well as during the first years of the nineteenthcentury. During these main historical climatic periods, cli-matic conditions were not uniform. Shorter warm/cool andwet/dry fluctuations were observed depending on regionalfactors.
3 The Historical Time Frame (Past 1000 Years) 61
Open Access This chapter is distributed under the terms of the CreativeCommons Attribution Noncommercial License, which permits anynoncommercial use, distribution, and reproduction in any medium,provided the original author(s) and source are credited.
References
BACC Author Team (2008) Assessment of Climate Change for theBaltic Sea Basin. Springer-Verlag, Berlin Heidelberg
Bednarz Z (1984) The comparison of dendroclimatological reconstruc-tions of summer temperatures from the Alps and Tatra Mountainsfrom 1741-1965. Dendrochronologia 2:63-72
Bednarz Z (1996) June-July temperature variation for the Babia GóraNational Park, southern Poland, for the period 1650-1910. In:Obrębska-Starkel B, Niedźwiedź T (eds), Proceedings of theInternational conference on climate dynamics and the global changeperspective, Cracow, 17-20 October 1995. Institute of Geography ofthe Jagiellonian University, Prace Geograficzne 102:523-529
Bednarz Z, Jaroszewicz B, Ptak J, Szwagrzyk J (1999) Dendrochro-nology of Norway spruce (Picea abies L. Karst.) in the Babia GóraNational Park, Poland. Dendrochronologia 16:45-55
Bertrand C, Loutre M-F, Crucifix M, Berger A (2002) Climate of thelast millennium: a sensitivity study. Tellus A 54:221-244
Bjune AE, Seppa H, Birks HJB (2009) Quantitative summer-temper-ature reconstructions for the last 2000 years based on pollen-stratigraphical data from northern Fennoscandia. J Paleolimnol41:43-56
Bokwa A, Limanówka D, Wibig J (2001) Pre-instrumental weatherobservations in Poland in the 16th and 17th centuries. In: Jones PD,Ogilvie AEJ, Davies TD, Briffa KR (eds), History and climate.Memories of the future? Kluwer/Plenum Publishers, New York,Boston, Dordrecht, London, Moscow, p 9-27
Borisenkov YeP, Pasetsky VM (1988) Millennium-long chronicle ofunusual natural events. Mysl, Moscow (in Russian)
Borisenkov YeP, Pasetsky VM (2002) Long chronicle of unusualnatural events for 2.5 millennia (5th Century BC – 20th CenturyAD). Gidrometeoizdat, St Peterburg, (in Russian)
Bradley RS, Hughes MK, Diaz HF (2003) Climate in Medieval time.Science 302:404-405
Brázdil R (1996) Reconstructions of past climate from historicalsources in the Czech lands. In: Jones PD, Bradley RS, Jouzel J(eds), Climatic variations and forcing mechanisms of the last2000 years. NATO ASI series1, vol. 41, Springer-Verlag, Berlin,p 409-431
Brázdil R, Dobrovolný P (2010) Historical climate in Central Europeduring the last 500 years. In: Przybylak R, Majorowicz J, Brázdil R,Kejna M (eds), The Polish climate in the European context: anhistorical overview. Springer, Berlin, p 41–70
Brázdil R, Pfister C, Wanner H, von Storch H, Luterbacher J (2005)Historical climatology in Europe – The state of the art. ClimaticChange 70:363-430
Brázdil R, Dobrovolný P, Luterbacher J, Moberg A, Pfister C, WheelerD, Zorita E (2010) European climate of the past 500 years: newchallenges for historical climatology. Climatic Change 101:7-40
Briffa KR, Jones PD (1992) The climate of Europe during the 1810swith special reference to 1816. In: Harington CR (ed), The Yearwithout a Summer? World Climate in 1816, Canadian Museum ofNature
Briffa KR, Jones PD, Bartholin TS, Eckstein D, Schweingruber FH,Karlén W, Zetterberg P, Eronen M (1992) Fennoscandian summersfrom AD 500: temperature changes on short and long timescales.Clim Dynam 7:111-119
Büntgen U, Tegel W (2011) European tree-ring data and the MedievalClimate Anomaly. PAGES news 19:14-15
Büntgen U, Esper J, Frank DC, Nicolussi K, Schmidhalter M (2005) A1052-year tree-ring proxy for Alpine summer temperatures. ClimDynam 25:141-153
Büntgen U, Frank DC, Nievergelt D, Esper J (2006) Summertemperature variations in the European Alps, AD 755–2004.J Climate 19:5606-5623
Büntgen U, Frank DC, Kaczka RJ, Verstege A, Zwijacz-Kozica T,Esper J (2007) Growth responses to climate in a multi-species tree-ring network in the Western Carpathian Tatra Mountains, Polandand Slovakia. Tree Physiol 27:689-702
Büntgen U, Trouet V, Frank D, Leuschner HH, Friedrichs D,Luterbacher J, Esper J (2010) Tree-ring indicators of Germansummer drought over the last millennium. Quaternary Sci Rev29:1005-1016
Büntgen U, Raible C, Frank D, Helama S, Cunningham L, Hofer D,Nievergelt D, Verstege A, Stenseth N, Esper J (2011a) Causes andconsequences of past and projected Scandinavian summer temper-atures, 500-2100 AD. PLoS ONE 6:e25133. doi:10.1371/journal.pone.0025133
Büntgen U, Tegel W, Nicolussi K, McCormick M, Frank D, Trouet V,Kaplan JO, Herzig F, Heussner K-U, Wanner H, Luterbacher J,Esper J (2011b) 2500 years of European climate variability andhuman susceptibility. Science 331:578-582
Büntgen U, Brázdil R, Heussner K-U, Hofmann J, Kontic R, Tyncl T,Pfister C, Chromá K, Tegel W (2011c) Combined dendro-documentary evidence of Central European hydroclimatic spring-time extremes over the last millennium. Quaternary Sci Rev30:3947-3959
Büntgen U, Kaczka RJ, Trnka M, Rigling A (2012) Complex climatesensitivity of Carpathian cliff site pine growth. Agr Forest Meteorol160:100-109
Chernavskaya M (1996) Climate of European Russia over the two pastmillennia. In: Obrębska-Starkel B, Niedźwiedź T (eds), Proceedingsof the International conference on climate dynamics and the globalchange perspective, Cracov, 17-20 October 1995. Institute ofGeography of the Jagiellonian University, Prace Geograficzne102:493-496
Christiansen B, Ljungqvist FC (2011) Reconstruction of the extratrop-ical NH mean temperature over the last millennium with a methodthat preserves low-frequency variability. J Climate 24:6013-6034
Cowie J (2007) Climate Change: Biological and Human Aspects.Cambridge University Press, Cambridge
Crowley TJ (2000) Causes of climate change over the past 1000 years.Science 289:270-277
Crowley TJ, Lowry T (2000) How warm was the Medieval WarmPeriod? Ambio 29:51-54
Dobrovolný P, Moberg A, Brázdil R, Pfister C, Glaser R, Wilson R,van Engelen A, Limanówka D, Kiss A, Halíčková M, Macková J,Riemann D, Luterbacher J, Böhm R (2010) Monthly, seasonal andannual temperature reconstructions for Central Europe derived fromdocumentary evidence and instrumental records since AD 1500.Climatic Change 101:69-107
Eriksson Ch, Omsted A, Overland JE, Percival DB, Mofjeld HO (2007)Characterizing of European sub-Arctic winter climate since 1500using ice, temperature, and atmospheric circulation time series.J Climate 20:5316-5334
Esper J, Frank DC (2009) The IPCC on a heterogeneous MedievalWarm Period. Climatic Change 94:267-273
Esper J, Büntgen U, Timonen M, Frank DC (2012) Variability ofextremes of northern Scandinavian summer temperatures over thepast two millennia. Global Planet Change 88-89:1-9
Folland CK, Karl TR, Vinnikov KYa (1990) Observed climatevariations and change. In: Houghton JT, Jenkins GJ, Ephraums JJ
62 T. Niedźwiedź et al.

(eds), Climate change. The IPCC scientific assessment. CambridgeUniversity Press, p 195–238
Glaser R (2008) Klimageschichte Mitteleuropas. 1200 Jahre Wetter,Klima, Katastrophen. [History of Climate for Central Europe:1200 years of weather, climate and catastrophes], Primus Verlag,Wissenschaftliche Buchgesellschaft, Darmstadt
Glaser R, Riemann D (2009) A thousand-year record of temperaturevariations for Germany and Central Europe based on documentarydata. J Quaternary Sci 24:437-449
Glaser R, Riemann D, Schönbein J, Barriendos M, Brázdil R, BertolinC, Camuffo C, Deutsch M, Dobrovolný P, van Engelen A, Enzi S,Halíčková M, Koenig SJ, Kotyza O, Limanowka D, Macková J,Sghedoni M, Martin B, Himmelsbach I (2010) The variability ofEuropean floods since AD 1500. Climatic Change 101:235-256
Gouirand I, Linderholm HW, Moberg A, Wohlfarth B (2008) On thespatiotemporal characteristics of Fennoscandian tree-ring basedsummer temperature reconstructions. Theor Appl Climatol 91:1-25
Grove JM (1988) The Little Ice Age. Methuen & Co., London, NewYork
Grudd H (2008) Torneträsk tree-ring width and density AD 500–2004:a test of climatic sensitivity and a new 1500-year reconstruction ofnorth Fennoscandian summers. Clim Dynam 31:843-857
Gunnarson BE, Linderholm HW (2002) Low-frequency summertemperature variation in central Sweden since the tenth centuryinferred from tree rings. Holocene 12:667-671
Hansson D, Gustafsson E (2011) Salinity and hypoxia in the Baltic Seasince AD 1500. J Geophys Res 116:C03027. doi:10.1029/2010JC006676
Hansson D, Omstedt A (2008) Modelling the Baltic Sea ocean climateon centennial time scale: Temperature and sea ice. Clim Dynam30:763-778
Hansson D, Eriksson C, Omstedt A, Chen D (2011) Reconstruction ofriver runoff to the Baltic Sea, AD 1500–1995. Int J Climatol31:696-703
Helama S, Lindholm M, Timonen M, Meriläinen J, Eronen M (2002)The supra-long Scots pine tree-ring record for Finnish Lapland: Part2, interannual to centennial variability in summer temperatures for7500 years. Holocene 12:681-687
Helama S, Timonen M, Lindholm M, Merilainen J, Eronen M (2005)Extracting long-period climate fluctuations from tree-ring chronol-ogies over timescales of centuries to millennia. Int J Climatol25:1767-1779
Helama S, Meriläinen J, Tuomenvirta H (2009a) Multicentennialmegadrought in northern Europe coincided with a global El Niño-Southern Oscillation drought pattern during the Medieval ClimateAnomaly. Geology 37:175-178.
Helama S, Timonen M, Holopainen J, Ogurtsov MG, Mielikäinen K,Eronen M, Lindholm M, Meriläinen J (2009b) Summer temperaturevariations in Lapland during the Medieval Warm Period and theLittle Ice Age relative to natural instability of thermohalinecirculation on multi-decadal and multi-centennial scales. J Quater-nary Sci 24:450-456
Holmström L (2011) Discussion of: A statistical analysis of multipletemperature proxies: are reconstructions of surface temperaturesover the last 1000 years reliable? Ann Appl Stat 5:71-75
Holopainen J, Helama S (2009) Little Ice Age farming in Finland:preindustrial agriculture on the edge of the Grim Reaper’s Scythe.Hum Ecol 37:213-225
Jevrejeva S (2001) Severity of winter seasons in the northern Baltic Seabetween 1529 and 1990: reconstruction and analysis. Clim Res17:55-62
Jones PD, Briffa KR (2006) Unusual climate in northwest Europeduring the period 1730 to 1745 based on instrumental anddocumentary data. Climatic Change 79:361-379
Jones PD, Mann ME (2004) Climate over the past millennia. RevGeophys 42:RG2002. doi:10.1029/2003RG000143
Jones PD, Briffa KR, Barnett TP, Tett SFB (1998) High-resolutionpalaeoclimatic records for the last millennium: interpretation,integration and comparison with General Circulation Model con-trol-run temperatures. Holocene 8:455-471
Jones PD, Ogilvie AEJ, Davies TD, Briffa KR (eds) (2001a) Historyand climate. Memories of the future? Kluwer/Plenum Publishers,New York, Boston, Dordrecht, London, Moscow
Jones PD, Osborn TJ, Briffa KR (2001b) The evolution of climate overthe last millennium. Science 292:662-667
Jones PD, Briffa KR, Osborn TJ et al (2009) High-resolutionpalaeoclimatology of the last millennium: a review of current statusand future prospects. Holocene 19:3-49
Jönsson K, Nilsson Ch (2009) Scott Pine (Pinus sylvestris L.) onshingle fields: A dendrochronologic reconstruction of early summerprecipitation in mideast Sweden. J Climate 22:4710-4722
Kalela-Brundin M (1999) Climatic information from tree-rings of Pinussylvestris L. and a reconstruction of summer temperatures back toAD 1500 in Femundsmarka, eastern Norway, using partial leastsquares regression (PLS). Holocene 9:59-77
Klimenko I, Solomina O (2010) Climatic variations in the eastEuropean plain during the last millennium: state of the art. In:Przybylak R et al (eds), The Polish Climate in the EuropeanContext: An Historical Overview, Springer, Dordrecht, Heidelberg,London, New York, p 71-101
Klimanov VA, Koff T, Punning Y-M (1985) Climatic conditions in thenorth-west Baltic during the past 2000 years. Izvestiya of RussianAcademy of Sciences Geographical Series 1: 89-96 (in Russian)
Koprowski M, Przybylak R, Zielski A, Pospieszyńska A (2012) Treerings of Scots pine (Pinus sylvestris L.) as a source of informationabout past climate in northern Poland. Int J Biometeorol 56:1-10
Korhola A, Weckström J, Holmström L, Erästö P (2000) A quantitativeHolocene climatic record from diatoms in northern Fennoscandia.Quaternary Res 54:284-294
Korhola A, Vasko K, Toivonen HTT, Olander H (2002) Holocenetemperature changes in northern Fennoscandia reconstructed fromchironomids using Bayesian modelling. Quaternary Sci Rev21:1841-1860
Koslowski G, Glaser R (1999) Variations in reconstructed ice winterseverity in the western Baltic from 1501 to 1995 and theirimplications for the North Atlantic Oscillation. Climatic Change41:175-191
Lamb HH (1977) Climate: present, past and future. Climatic history andthe future, Vol 2, Methuen & Co Ltd London
Lamb HH (1982) Climate: history and the modern world. Methuen,London
Lamentowicz M, Cedro A, Miotk-Szpiganowicz G, Mitchell EAD,Pawlyta J, Goslar T (2008) Last millennium palaeoenvironmentalchanges from a Baltic bog (Poland) inferred from stable isotopes,pollen, plant macrofossils and testate amoebae. PalaeogeogrPalaeocl 265:93-106
Lamentowicz M, Milecka K, Lamentowicz L, Galka M, Cedro A,Pawlyta J, Piotrowska N, Van der Knaap WO (2009) Climate andhuman induced hydrological change since AD 800 in an ombro-trophic mire in Pomerania (N Poland) tracked by testate amoebae,macro-fossils, pollen, and tree-rings of pine. Boreas 38:214-229
Leijonhufvud L, Wilson R, Moberg A, Söderberg J, Retsö D, SöderlindU (2010) Five centuries of Stockholm winter/spring temperaturesreconstructed from documentary evidence and instrumental obser-vations. Climatic Change 101:109-141
Limanówka D (2001) Rekonstrukcja warunków klimatycznych Krak-owa w pierwszej polowie XVI wieku (Reconstruction of climaticconditions in Cracow in the first half of the 16th century). Instytut
3 The Historical Time Frame (Past 1000 Years) 63
Meteorologii i Gospodarki Wodnej, Warszawa, Materiały Bad-awcze IMGW, Ser. Meteorologia 33:25-32
Linderholm HW, Gunnarson BE (2005) Summer climate variability inwest-central Fennoscandia during the past 3600 years. Geogr Ann A87:231-241
Lindholm M, Ogurtsov M, Aalto T, Jalkanen R, Salminen H (2009) Asummer temperature proxy from height increment of Scots pinesince 1561 at the northern timberline in Fennoscandia. Holocene19:1131-1138
Lindholm M, Jalkanen R, Salminen H, Aalto T, Ogurtsov M (2011)The height-increment record of summer temperature extended overthe last millennium in Fennoscandia. Holocene 21:319-326
Ljungqvist FC (2010) A new reconstruction of temperature variabilityin the extratropical Northern Hemisphere during the last twomillennia. Geogr Ann A 92:339-351
Ljungqvist FC, Krusic PJ, Brattström G, Sundqvist H (2012) Northernhemisphere temperature patterns in the last 12 centuries. Clim Past8:227-249
Luterbacher J, Rickli R, Xoplaki E, Tinguely C, Beck C, Pfister C,Wanner H (2001) The Late Maunder Minimum (1675–1715) – akey period for studying decadal scale climatic change in Europe.Climatic Change 49:441-462
Luterbacher J, Dietrich D, Xoplaki E, Grosjean M, Wanner H (2004)European seasonal and annual temperature variability, trends andextremes since 1500. Science 303:1499-1503
Luterbacher J, Xoplaki E, Küttel M, Zorita E,González-Rouco FJ,Jones PD, Stössel M, Rutishauser T, Wanner H, Wibig J, PrzybylakR (2010) Climate change in Poland in the past centuries and itsrelationship to European climate: evidence from reconstructions andcoupled climate models. In: Przybylak R et al (eds), The Polishclimate in the European context: an historical overview. Springer,Berlin: 3-39
Luoto TP, Helama S (2010) Palaeoclimatological and palaeolimnolog-ical records from fossil midges and tree-rings: the role of the NorthAtlantic Oscillation in eastern Finland through the Medieval ClimateAnomaly and Little Ice Age. Quaternary Sc Rev 29:2411-2423
Majorowicz J (2010) The climate of Europe in recent centuries in thecontext of the climate of mid to high latitude Northern Hemispherefrom borehole temperature logs. In: Przybylak R, Majorowicz J,Brázdil R, Kejna M (eds) The Polish climate in the Europeancontext: an historical overview. Springer, Berlin, p 103-126
Majorowicz J, Šafanda J, Przybylak R, Wójcik G (2004) Groundsurface temperature history in Poland in the 16th-20th centuriesderived from the inversion of geothermal profiles. Pure ApplGeophys 161:351-363
Manley G (1974) Central England temperatures: monthly means 1659to 1973. Q J Roy Meteor Soc 100:389-405
Mann ME, Jones PD (2003) Global surface temperatures over the pasttwo millennia. Geophys Res Lett 30:1820. doi:10.1029/2003GL017814
Mann ME, Bradley RS, Hughes MK (1998) Global-scale temperaturepatterns and climate forcing over the past 6 six centuries. Nature392:779-787
Mann ME, Bradley RS, Hughes MK (1999) Northern hemispheretemperatures during the past millennium: inferences, uncertainties,and limitations. Geophys Res Lett 26:759-762
Mann ME, Zhang Z, Hughes MK, Bradley RS, Miller SK, RutherfordS, Ni F (2008) Proxy-based reconstructions of hemispheric andglobal surface temperature variations over the past two millennia.PNAS 105:13252-13257
Moberg A, Bergström H, Krigsman JR, Svanered O (2002) Daily airtemperature and pressure series for Stockholm (1756–1998).Climatic Change 53:171-212
Moberg A, Tuomenvirta H, Nordli Ø (2005) Recent climatic trends. In:Seppälä M (ed), Physical geography of Fennoscandia. OxfordRegional Environments Series. Oxford University Press, Oxford,p 113-133
Moberg A, Gouirand I, Schoning K, Wohlfarth B, Kjellström E,Rummukainen M, de Jong R, Linderholm H, Zorita E (2006)Climate in Sweden during the past millennium – evidence fromproxy data, instrumental data and model simulations. SKB technicalreport TR-06-35. Swedish Nuclear Fuel and Waste ManagementCo, Stockholm
NCR (2006) Surface temperature reconstructions for the last2,000 years. National Research Council, Washington DC, NationalAcademies Press
Niedźwiedź T (2004) Rekonstrukcja warunków termicznych lata wTatrach od 1550 roku (Reconstruction of summer temperature in theTatra Mountains since 1550). In: Kotarba A (ed.) Rola małej epokilodowej w przekształcaniu środowiska przyrodniczego Tatr. PraceGeograficzne 197:57-88
Neumann J (1978) Great historical events that were significantlyaffected by the weather: 3, the cold winter of 1657-58, the Swedisharmy cross Denmark’s frozen sea areas. B Am Meteorol Soc59:1432-1437
Nordli Ø, Lie Ø, Nesje A, Dahl SO (2003) Spring-summer temperaturereconstruction in western Norway 1734–2003: a data-synthesisapproach. Int J Climatol 23:1821-1841
Nowosad W, Przybylak R, Marciniak K, Syta K (2007) Diariusz JanaAntoniego Chrapowickiego jako źródło do badań klimatu Rzeczy-pospolitej w II połowie XVII w. (Diary of Jan Antoni Chrapowickias a source for investigation of the climate of Poland in the secondpart of 17th century). Klio 9:21-60 (in Polish)
Ogurtsov M, Raspopov O, Helama S, Oinonen M, Lindholm M,Jungner H, Meriläinen J (2008) Climatic variability along a north-south transect of Finland over the last 500 years: signature of solarinfluence or internal climate oscillations? Geogr Ann A 90:141-150
Ogurtsov MG, Jungner H, Helama S, Lindholm M, Oinonen M (2011)Paleoclimatological evidence for unprecedented recent temperaturerise at the extratropical part of the Northern Hemisphere. Geogr AnnA 93:17-26
Pfister C (1992) Monthly temperature and precipitation in centralEurope 1525-1979: quantifying documentary evidence on weatherand its effects. In: Bradley RS, Jones PD (eds), Climate since AD1500, Routledge, London, p 118-142
Pfister C (1999) Wetternachhersage, 500 Jahre Klimavariationen undNaturkatastrophen (1496-1995). Verlag Paul Haupt, Bern, Stuttgart,Wien
Przybylak R (2007) The change in the Polish climate in recentcenturies. Pap Global Change IGBP 14:7-23
Przybylak R (2011) Changes in Poland’s climate over the lastmillennium. Czasopismo Geograficzne 82:23-48
Przybylak R, Marciniak K (2010) Climate changes in the central andnorth-eastern parts of the Polish-Lithuanian commonwealth from1656 to 1685. In: Przybylak R, Majorowicz J, Brázdil R, Kejna M(eds), The Polish Climate in the European Context: An HistoricalOverview, Springer Science + Business Media B.V. Dordrecht,Heidelberg, London, New York, p 423-443
Przybylak R, Majorowicz J, Wójcik G, Zielski A, Chorążyczewski W,Marciniak K, Nowosad W, Oliński P, Syta K (2005) Temperaturechanges in Poland from the 16th to the 20th centuries. Int J Climatol25:773-791
Przybylak R, Majorowicz J, Brázdil R, Kejna M (eds) (2010) ThePolish climate in the European context: An historical overview.Springer Science + Business Media B.V. Dordrecht, Heidelberg,London, New York
64 T. Niedźwiedź et al.
Ralska-Jasiewiczowa M, Goslar T, Madeyska T, Starkel L (eds) (1998)Lake Gościąż, central Poland a monographic study. Szafer Instituteof Botany, Polish Academy of Sciences, Kraków
Rojecki A (ed) (1965) Wyjątki ze źródeł historycznych o nad-zwyczajnych zjawiskach hydrologiczno-meteorologicznych na zi-emiach polskich w wiekach od X do XVI (Selection of historicalsources about unusual hydro-meteorological events on the Polishterritory from 10th to 16th centuries). Selection and Polishtranslation: Girguś R and Strupczewski W, PIHM, WydawnictwaKomunikacji i Łączności, Warszawa (in Polish and original textsmainly in Latin and German)
Schimanke S, Meier HEM, Kjellström E, Strandberg G, Hordoir R(2012) The climate of the Baltic Sea region during the lastmillennium simulated with a regional climate model. Clim Past8:1419-1433
Seinä A, Palosuo E (1996) The classification of the maximum annualextent of ice cover in the Baltic Sea 1720–1995. MERI 27:79-91
Starkel L (2001) Extreme rainfalls and river floods in Europe during thelast millennium. Pap Global Change IGBP 8:69-79
Starkel L, Pazdur A, Pazdur MF, Wicik B, Więckowski K (1996) Lake-level and groundwater-level changes in the Lake Gościąż area,Poland: paleoclimatic implications. Holocene 6:213-224
Szychowska-Krąpiec E (2010) Long-term chronologies of pine (Pinussylvestris L.) and fir (Abbies alba Mill.) from the Małopolska regionand their paleoclimatic interpretation. Folia Quat 79:5-124
Tarand A, Nordli Ø (2001) The Tallinn temperature series recon-structed back half a millennium by use of proxy data. ClimaticChange 48:189-199
von Rudloff H (1967) Die schwankungen und pendelungen des klimasin Europa sei dem beginn der regelmässigen Instrumenten-Beo-bachtungen (1670). Friedrich Vieweg & Sohn, Braunschweig
von Storch H, Zorita E, Jones JM, Dimitriev Y, González-Rouco F,Tett SFB (2004) Reconstructing past climate from noisy data.Science 306:679–682
Weckström J, Korhola A, Erästö P, Holmström L (2006) Temperaturepatterns over the past eight centuries in northern Fennoscandiainferred from sedimentary diatoms. Quaternary Res 66:78-86
Xoplaki E, Luterbacher J, Paeth H, Dietrich D, Steiner N, Grosjean M,Wanner H (2005) European spring and autumn temperaturevariability and change of extremes over the last half millennium.Geophys Res Lett 32:L15713. doi:10.1029/2005GL023424
Zorita E, González-Rouco F, von Storch H (2007) Comments on‘Testing the fidelity of methods used in proxy-based reconstructionsof past climate’. J Climate 20:3693-3698
3 The Historical Time Frame (Past 1000 Years) 65
Related Documents