The Hidden Academic Opportunity Gaps Among Asian Americans and Pacific Islanders: What Disaggregated Data Reveals in Washington State A publication from iCount: A Data Quality Movement for Asian Americans and Pacific Islanders

Welcome message from author
This document is posted to help you gain knowledge. Please leave a comment to let me know what you think about it! Share it to your friends and learn new things together.
Transcript

The Hidden Academic Opportunity Gaps Among Asian Americans and Pacific Islanders:What Disaggregated Data Reveals in Washington State
A publication from iCount: A Data Quality Movement for Asian Americans and Pacific Islanders

The Hidden Academic Opportunity Gaps Among Asian Americans and Pacific Islanders: What Disaggregated Data Reveals in Washington Stateii
This report was made possible through generous funding from
Educational Testing Service (ETS). Central to the collaboration between
the National Commission on Asian American and Pacific Islander Research
in Education (CARE) and ETS is the effort to promote the collection and
dissemination of disaggregated data in order to better understand the variation
of educational experiences and outcomes within the highly diverse Asian
American and Pacific Islander student population.
The authors of this report are Bach Mai Dolly Nguyen, Mike Hoa Nguyen,
Robert T. Teranishi and Shirley Hune. Other contributors were Cynthia M.
Alcantar, Edward R. Curammeng, Edwin Hernandez, Frieda Takamura, Sili Savusa,
Ay Saechao, Jeomja Yeo and David Sun. A version of this report was submitted
to the Washington State Commission on Asian Pacific American Affairs in
March 2015.

The Hidden Academic Opportunity Gaps Among Asian Americans and Pacific Islanders: What Disaggregated Data Reveals in Washington State iii
National Commission
Margarita BenitezExcelencia in Education
Estela Mara BensimonUniversity of Southern California
Carrie BillyAmerican Indian Higher Education Consortium
Michelle Asha CooperInstitute for Higher Education Policy
A. Gabriel EstebanSeton Hall University
Antonio FloresHispanic Association of Colleges and Universities
Larry GriffithUnited Negro College Fund
J.D. HokoyamaLeadership Education for Asian Pacifics, Inc.
Neil HorikoshiAsian & Pacific Islander American Scholarship Fund
Shirley HuneUniversity of Washington
Parag MehtaU.S. Department of Labor
Don NakanishiUniversity of California, Los Angeles
Kawika RileyOffice of Hawaiian Affairs
Doua ThorWhite House Initiative on AAPIs
Robert UnderwoodUniversity of Guam
iCount Research Team
Robert T. TeranishiPrincipal Investigator
Bach Mai Dolly NguyenResearch Associate
Cynthia M. AlcantarResearch Associate
Edward R. CurammengResearch Associate
Mike Hoa NguyenResearch Associate
Edwin HernandezResearch Associate
Dayanara RamirezSocial Media Intern
Research Advisory Group
Mitchell ChangUniversity of California, Los Angeles
Dina C. MarambaBinghamton University, State University of New York
Julie J. ParkUniversity of Maryland, College Park
Oiyan PoonLoyola University Chicago
Caroline Sotello Viernes TurnerCalifornia State University, Sacramento
Rican VueUniversity of California, Los Angeles
Design/Editorial Team
Sally Acquaviva, Elizabeth Costantini, Marita Gray and Eileen KerriganETS

The Hidden Academic Opportunity Gaps Among Asian Americans and Pacific Islanders: What Disaggregated Data Reveals in Washington Stateiv

The Hidden Academic Opportunity Gaps Among Asian Americans and Pacific Islanders: What Disaggregated Data Reveals in Washington State v
TABLE OF CONTENTS
PREFACE .................................................................................................................................... vii
INTRODUCTION ........................................................................................................................... 1
Purpose of the Report
A PROFILE OF ASIAN AMERICANS AND PACIFIC ISLANDERS IN WASHINGTON ........................... 5
Population Growth
Socioeconomic Characteristics
Educational Attainment
DISAGGREGATED K–12 DATA (OSPI) ............................................................................................ 9
Total Enrollment
Enrollment in Programs
Absences & Discipline
DISAGGREGATED POSTSECONDARY DATA (ERDC) ....................................................................17
CONCLUSION & RECOMMENDATIONS .......................................................................................21
TECHNICAL APPENDIX ..............................................................................................................23
REFERENCES ..............................................................................................................................25

The Hidden Academic Opportunity Gaps Among Asian Americans and Pacific Islanders: What Disaggregated Data Reveals in Washington Statevi

The Hidden Academic Opportunity Gaps Among Asian Americans and Pacific Islanders: What Disaggregated Data Reveals in Washington State vii
Asian Americans and Pacific Islanders (AAPIs) are a remarkably
diverse community, comprising 48 different ethnic subgroups
that speak over 300 different languages and represent a range
of different immigration histories. The AAPI population is also rapidly growing and
was the fastest growing racial group in 2012. Among the key civil rights issues AAPI
scholars and advocates have pressed for are improvements to data practices in order to
represent the heterogeneity in the AAPI community. As AAPI students continue to
experience a range of educational outcomes, data practices that aggregate AAPIs into
one category continue to be a significant barrier for understanding and responding to
their unique and diverse needs.
PREFACE
In 2013, the National Commission on Asian
American and Pacific Islander Research in Edu-
cation (CARE) launched iCount: A Data Quality
Movement for Asian Americans and Pacific Island-
ers in Higher Education, a collaborative effort with
the White House Initiative on Asian Americans
and Pacific Islanders (WHIAAPI) and with gener-
ous support from ETS and Asian Americans and
Pacific Islanders in Philanthropy (AAPIP). iCount
aims to raise awareness about and bring atten-
tion to the ways in which aggregate data on AAPI
students conceal significant disparities in educa-
tional experiences and outcomes between AAPI
subgroups. Additionally, iCount offers models
for data reform with the goal of addressing the
unmet needs of underserved populations. Final-
ly, iCount aims to work collaboratively with the
education field to encourage broader reform in
institutional practices related to the collection,
reporting and use of disaggregated data.
Building on the momentum of the 2013 iCount
report, the current study highlights an impor-
tant partnership in the State of Washington. In
addition to being one of the fastest-growing
and most concentrated AAPI populations in the
nation, Washington State has a history of advo-
cating for data reform to better represent the
diversity of the AAPI communities in the state,
thus making it an important partner to iCount
and the larger effort for advancing better data
practices for AAPI students across the nation.

The Hidden Academic Opportunity Gaps Among Asian Americans and Pacific Islanders: What Disaggregated Data Reveals in Washington Stateviii

The Hidden Academic Opportunity Gaps Among Asian Americans and Pacific Islanders: What Disaggregated Data Reveals in Washington State 1
Washington is a critical and unique state
for the data disaggregation movement as it
boasts a committed constituency of Asian
American and Pacific Islander (AAPI) activists and a history marked by advocacy for
data disaggregation. These efforts came to a head in 2008 with the creation of the
Educational Opportunity Gap Oversight and Accountability Committee (EOGOAC),
a state-appointed committee that focuses on strategies for closing the educational
opportunity gaps in Washington State. In its year of inception, a mandate to write a
report related to the educational disparities of AAPIs was given, spurring the later pub-
lished reports: Asian Americans in Washington State: Closing Their Hidden Achievement
Gaps and Growing Presence, Emerging Voices: Pacific Islanders and Academic Achievement
in Washington. These reports were produced through a collaborative effort between
researchers, community members and policy advocates.
INTRODUCTION
The reports highlighted the need for data disag-
gregation to more accurately represent the aca-
demic achievement* gaps between various AAPI
ethnic subgroups in Washington State.1 These
findings were based on analysis of two-tier data-
bases examining multiple variables at both the
state and district level; however, because of the
lack of disaggregated data, the authors focused
primarily on language use in the home (as an
indicator for non-English speakers or English Lan-
guage Learners [ELLs]) and students who received
free and reduced lunch (as an indicator for low-
income status). These data were supplemented
by Seattle Public School data, which was the only
dataset that collected disaggregated data. As a
result, the reports were able to demonstrate, for
example, how Asian American ELL students in the
aggregate, Southeast Asian students and Pacific
Islander students were experiencing lower lev-
els of academic achievement, in math and high
school completion than other AAPI students.
Based on these findings, the EOGOAC made a
number of recommendations, including the
need for collecting disaggregated data by ethnic
subgroup as a key strategy for closing academic
opportunity gaps. Building upon these recom-
mendations, elected officials in the state advocat-
ed at the legislative level to reform data practices
statewide. Community organizations, teachers
and other educational stakeholders voiced their
needs for disaggregated data to not only repre-
sent their unique experiences, but also to examine
opportunities for better serving their constitu-
encies. In response to these efforts, the Office of
the Superintendent of Public Instruction (OSPI)
and another state-commissioned organization,
the Washington State Education Research & Data
Center (ERDC), began collecting disaggregated
data in K–12 schools and some public colleges
and universities in 2010. These data are now avail-
able and are the focus of the current report.
* Since the previous reports, the state-appointed Educational Opportunity Gap Oversight and Accountability Committee (EOGOAC) has advo-cated for the use of the term “opportunity gap” as opposed to “achievement gap” to more pointedly demonstrate the structural barriers that exist for individuals; thus, that language has been adopted in this report.

The Hidden Academic Opportunity Gaps Among Asian Americans and Pacific Islanders: What Disaggregated Data Reveals in Washington State2
Purpose of the Report
As an extension to the 2008 reports, and in align-
ment with the continued efforts of AAPI commu-
nities advocating for data disaggregation across
Washington State, this report offers a deeper and
more nuanced perspective on the educational
realities of AAPI students and reinforces the need
for disaggregated data to unmask the hidden
opportunity gaps of particular AAPI students.
Given the continued efforts to make progress
at all levels — legislative, institutional and com-
munity — Washington State is at a critical mo-
ment to utilize the findings from this report to
advance the data disaggregation movement.
As this report is the first study to utilize the disag-
gregated data from OSPI and ERDC to analyze dis-
aggregated AAPI ethnic subgroup data in Wash-
ington State, several important themes emerged
in regard to how it can serve as a tool for advanc-
ing data reform efforts:
1. Although some disaggregated data is now
collected in the state, this report highlights
how data can be utilized to examine oppor-
tunities for pinpointing academic barriers
that particular AAPI subgroups face. The data
featured in this report offer several different
types of analyses that demonstrate a range of
possible applications.
2. Disaggregated data has been collected
since 2010; however, the access to and use
of the data has been limited. This report of-
fers a starting point from which institutions,
community-based organizations and other
educational stakeholders can work to ap-
ply disaggregated data to their own student
populations.
3. As an extension of the 2008 reports and other
advocacy efforts in the state, this report can
inform efforts by policymakers and institu-
tional leaders to reform how data is collected,
reported and disseminated to better address
the needs of the AAPI community statewide.
In addition to the many important findings offered in the
2008 Washington reports, several recommendations were
made with regard to how practitioners and policymakers
could help close the opportunity gaps for AAPIs. Included
in these recommendations were the following:
1. Adopt a data collection, research and evaluation plan to
assess the reduction of opportunity gaps over time, with
an explicit call for the disaggregation of AAPI data.
2. Foster partnerships with AAPI communities and families.
3. Foster culturally responsive approaches and practices
(e.g., changing school climate, reconsidering curricula,
and recruiting and retaining AAPI teachers and faculty).
4. Create a seamless pipeline from Pre-K to higher
education.
These recommendations offer a foundation from which
this report builds upon and a measure for examining
progress to date.

The Hidden Academic Opportunity Gaps Among Asian Americans and Pacific Islanders: What Disaggregated Data Reveals in Washington State 3
Ultimately, this report aims to demonstrate why and how data disaggregation is a critical tool for closing
the academic opportunity gaps through the advancement of equitable educational practices. Given the
momentum Washington State has already established to promote better access to and uses of disaggre-
gated data, it is a key moment for ensuring that AAPI students across the state are accurately represented
and equitably served.
“Being labeled as just ‘Asian’ or ‘Asian American’ can negatively affect a young person’s view on their culture. It is evident that when we generalize a person [by race], they feel as if their culture, ethnicity or where they come from is less valued. Data disaggregation is important because it matters where students come from, and it matters what their ethnicity, race and cultures are. As a very diverse country, it is crucial that we emphasize the importance of diversity by creating data that includes all the students’ different ethnic groups.”
— College student in Washington State
“AAPI struggles are often masked and misconceived. Data disaggregation will give visibility to AAPIs and their needs so they can be addressed — a key for educational advancement.”
— High school student in Washington State

The Hidden Academic Opportunity Gaps Among Asian Americans and Pacific Islanders: What Disaggregated Data Reveals in Washington State4

The Hidden Academic Opportunity Gaps Among Asian Americans and Pacific Islanders: What Disaggregated Data Reveals in Washington State 5
With one of the fastest growing AAPI
populations in the nation, Washington
State represents a multitude of cultures,
languages and immigration histories.2
Since the release of the previous re-
ports in 2008, the AAPI community has
experienced population growth and a changing composition. This section highlights
some of the changes that have taken place during the 2008–2013* time frame.
A PROFILE OF ASIAN AMERICANS AND PACIFIC ISLANDERS IN WASHINGTON
Population Growth
The AAPI community has a long and historic
presence in Washington State. Their arrival in the
1880s and 1890s and contributions to agricul-
ture as well as the railroad, fishing and merchant
industries played a significant role in the eco-
nomic development of the Pacific Northwest.3
The AAPI community continues to be important
to Washington State and has steadily increased
in size and proportional representation, from 7.2
percent in 2007 to 8.3 percent in 2013 (Figure 1).
Currently, in Washington State, AAPIs are the sec-
ond-largest racial minority group, second only to
Latinos/Hispanics.
Figure 1: AAPI Population Growth in Washington State, 2007–2013
Source: U.S. Census Bureau, American Community Survey, 1-Year Estimates, 2007, 2010, 2013.
* To report on population change, 2007 U.S. Census data was utilized to better capture the change that has taken place.

The Hidden Academic Opportunity Gaps Among Asian Americans and Pacific Islanders: What Disaggregated Data Reveals in Washington State6
The five largest Asian American groups in Wash-
ington are Chinese, Filipino, Vietnamese, Korean
and Asian Indian. Although these groups have
grown in size from 2007 to 2013, other ethnic
groups have grown at faster rates. For example,
the Cambodian population in Washington dou-
bled in size from 2007 to 2010 (Figure 2). South
Asians also doubled their population over this
six-year period, greater than any other AAPI sub-
group. In 2013, the five largest Native Hawaiian
and Pacific Islander (NHPI) groups in Washington
were Samoan, Guamanian/Chamorro, Native Ha-
waiian, Tongan and Fijian. NHPIs nearly doubled
in size, increasing from 21,113 in 2007 to 41,731
in 2013.
Source: U.S. Census Bureau, American Community Survey, 1-Year Estimates, 2007, 2010, 2013.
Figure 2: AAPI Subgroup Population Growth, 2007–2013

The Hidden Academic Opportunity Gaps Among Asian Americans and Pacific Islanders: What Disaggregated Data Reveals in Washington State 7
Socioeconomic Characteristics
There are important distinctions between AAPI
subgroups relative to changes in socioeconomic
status since the 2008 reports. First, while some
AAPI subgroups — South Asians, East Asians and
Filipinos — have a median household income
that is above the median household income for
all Washington State residents, there are other
subgroups (e.g., Pacific Islanders and Southeast
Asians) with a median household income below
the statewide median (Figure 3). Second, while
the median household income for South Asians,
East Asians and Filipinos increased between 2008
and 2013, the median household income de-
clined for Pacific Islanders and Southeast Asians.
Data that is further disaggregated into specific
ethnic subgroups (not in figure) also reveals a par-
ticularly significant decline in household income
for groups like Cambodians ($57,016 to $50,377).
Disaggregated data shows significant fluctua-
tions in poverty rates within ethnic subgroups
from 2008 to 2013. Additionally, Cambodians liv-
ing in poverty increased from 7.7 percent to 17.9
percent, while the Hmong population decreased
from 39.1 percent to 9.4 percent. Similarly, the
Chinese population, Washington’s largest AAPI
subgroup, increased in poverty from 9.8 percent
to 16.0 percent. Furthermore, disaggregating by
subgroup reveals a disproportionate number of
Burmese (73.4 percent), Samoans (24.1 percent),
Indonesians (26.4 percent), Malaysians (19.7 per-
cent), Native Hawaiians (21.1 percent) and Viet-
namese (18.9 percent) living in poverty.
These data point to the need for utilizing more
granular data to better understand the diverse
social circumstances of AAPIs and to explore op-
portunities for improving their social outcomes.
Their socioeconomic characteristics, disaggre-
gated by ethnic subgroups, demonstrate that
despite common misconception, some AAPI sub-
groups live in low socioeconomic households,
which have implications for the educational sta-
tus and attainment discussed in the next section.
Source: U.S. Census Bureau, American Community Survey, 3-Year Estimates, 2006–2008 & 2011–2013.
Figure 3: Median Household Income

The Hidden Academic Opportunity Gaps Among Asian Americans and Pacific Islanders: What Disaggregated Data Reveals in Washington State8
Educational Attainment
Disaggregated data on educational attainment
reveal significant differences between AAPI sub-
groups. While Asian Indians, Chinese, Japanese
and Koreans had a bachelor’s degree attainment
rate that exceeded the statewide average in
2013, other groups, including Cambodians, Fili-
pinos, Guamanians/Chamorro, Hmong, Laotians,
Native Hawaiians, Samoans and Vietnamese, had
educational attainment rates that fell below the
statewide average (Figure 4).
Even among those groups that experienced
increases in their degree attainment, their attain-
ment relative to the statewide average is a matter
of concern.
30.8%29.5%
Figure 4: Educational Attainment, Bachelor’s Degree or Higher
Source: U.S. Census Bureau, American Community Survey, 3-Year Estimates, 2006–2008 & 2011–2013.
Over the time span of five years, it is important to note the extent to which some groups have experienced gains, while others continue to struggle to improve their circumstances.

The Hidden Academic Opportunity Gaps Among Asian Americans and Pacific Islanders: What Disaggregated Data Reveals in Washington State 9
The 2008 reports featured K–12 data,
primarily from the Washington Office
of Superintendent of Public Instruction
(OSPI) to report the status and prog-
ress of AAPIs in the state. In 2004, OSPI separated data for Asian Americans and Native
Hawaiians and Pacific Islanders (NHPI). Therefore, those two reports were limited to
reporting aggregated Asian American and NHPI descriptive and academic data. In 2010,
in response to the findings of the 2008 reports, OSPI began collecting disaggregated
AAPI data to include 16 Asian American and nine NHPI subgroups, which are featured
in this report. These data provide a unique opportunity to examine the differences that
can be revealed through the utilization of disaggregated data. This section will high-
light data on total enrollment, enrollment in programs (e.g., Free or Reduced Lunch,
bilingual education, special education), absences and discipline. For some data points,
particular AAPI ethnic subgroups were featured in the figures to demonstrate the
difference from the AAPI mean or median and to highlight the disparities that exist
across AAPI subgroups.
DISAGGREGATED K–12 DATA (OSPI)
Total Enrollment
As of the 2013 academic year, just over one mil-
lion students were enrolled in K–12 public edu-
cation in Washington State. In alignment with
the state’s population generally, White students
made up the greatest proportion of students
enrolled (59.0 percent), followed by a growing
Latino population at 20.4 percent. Asian Ameri-
cans were the third largest group of students en-
rolled (7.2 percent), followed by 4.6 percent Black
and 1.6 percent American Indian/Alaska Native
students. NHPIs were the smallest population at
0.9 percent. The proportion of Asian Americans
has remained relatively stable since the 2008
reports, which reported they made up “nearly 8
percent in 2007.”4 The three largest Asian Ameri-
can student groups were Chinese, Filipino and
Vietnamese at 18.6 percent each, followed by
Asian Indians at 15.8 percent (Figure 5). Thus, as
discussed in the previous section, Washington
State’s AAPI population is not only growing, but
also diverse.
The NHPI student population grew to 0.9 per-
cent in 2013, from 0.6 percent in 2007. Despite
their seemingly small proportional representa-
tion, the NHPI community, like the Asian Ameri-
can community, is impressively heterogeneous,
representing a number of ethnic subgroups. In
fact, Washington State has the third-largest NHPI
population in the nation, following Hawai‘i and
California.5 The largest NHPI student popula-
tion in Washington is Samoan, making up 42.1
percent of the NHPI population. The second larg-
est NHPI subgroup is Guamanian/Chamorro at
21.7 percent.

The Hidden Academic Opportunity Gaps Among Asian Americans and Pacific Islanders: What Disaggregated Data Reveals in Washington State10
Enrollment in Programs
Disaggregated data on AAPI enrollment in par-
ticular programs is valuable for pinpointing stu-
dents who may be in need of particular attention
or services. The Free or Reduced Lunch (FRL) pro-
gram, for example, indicates the rate of students
eligible for the National School Lunch Program, a
federally assisted meal program based on feder-
al income poverty guidelines.6 To be eligible for
the FRL program, a student’s household income
must be at or below 130 percent of the poverty
threshold for free lunch, and between 130 and
185 percent for reduced-price lunch.7 Given its
function as the K–12 indicator for low socioeco-
nomic status, which historically has served as a
barrier to academic achievement, FRL enroll-
ment is a key data point to examine.8
In the 2008 reports, the authors discussed the
academic barrier that enrollment in the FRL pro-
gram presented for some AAPI students. Given
the limited nature of their data, the authors de-
termined that 66.7 percent of the school districts
with at least 100 NHPI students had higher rates
of FRL enrollment than the state average.9 The
authors also reported that in the Seattle Public
School District — the only district that collected
disaggregated data at the time — Southeast
Asian students were disproportionately more
likely to be enrolled in FRL as compared to their
AAPI peers.
Utilizing newly available disaggregated data,
it is now possible to expound on their findings
and to more narrowly identify how particular
student communities are disproportionately
encountering this barrier. In our analysis, AAPI
students make up 7.0 percent of the FRL enroll-
ment, in the aggregate, which suggests a lower
poverty rate as compared to the general popula-
tion. However, there are some AAPI ethnic sub-
groups that are disproportionately represented
in FRL enrollment. Vietnamese students, for ex-
ample, make up 11.0 percent of the AAPI total
K–12 enrollment, but 15 percent of FRL enroll-
ment (Figure 6). Similarly, Guamanian/Chamorro
and Other Pacific Islander students are
Figure 5: Asian American and Pacific Islander Representation in K–12 in Washington State
Asian American Subgroup Representation Pacific Islander Subgroup Representation
Source: OSPI Enrollment Data, 2013.

The Hidden Academic Opportunity Gaps Among Asian Americans and Pacific Islanders: What Disaggregated Data Reveals in Washington State 11
disproportionately enrolled in FRL. For Samoan
students, their enrollment in FRL is more than
two times their total enrollment rate at 6.5 per-
cent and 3.1 percent, respectively. Given that a
correlation between poverty and low academic
achievement has been demonstrated by previous
scholarship, these data highlights the need for
addressing challenges related to poverty and low
socioeconomic status for particular subgroups of
students who are disproportionately more likely
to be facing these academic barriers.10
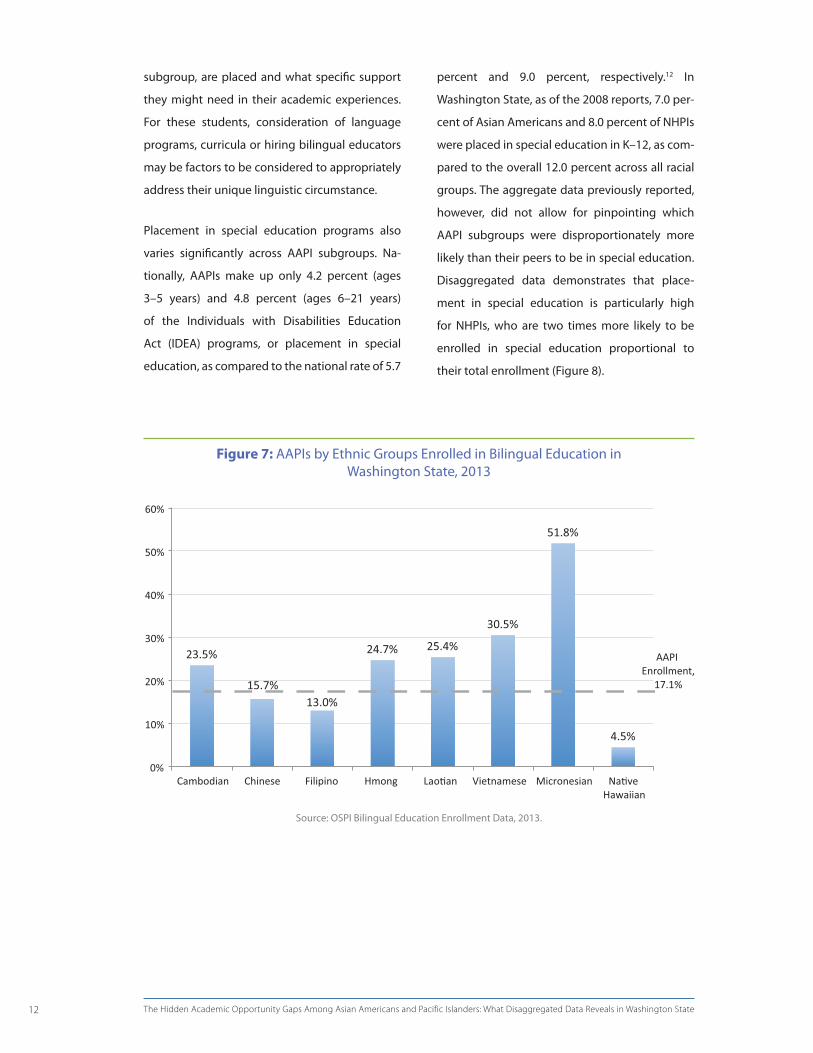
Similarly, enrollment in bilingual education for
AAPIs is an important factor to examine given
that national data indicates that AAPIs speak over
300 different languages as a primary language
spoken at home.11 Aggregate AAPI data indicates
that 17.1 percent of AAPI students are enrolled
in bilingual education programs. However, dis-
aggregated data highlights more specifically
which student groups are enrolled in bilingual
education (Figure 7). For example, 23.5 percent of
Cambodian, 24.7 percent of Hmong, 25.4 percent
of Laotian and 30.5 percent of Vietnamese stu-
dents were represented in bilingual education.
Most astonishingly, 51.8 percent of Micronesian
students were enrolled in bilingual education,
which is three times the AAPI aggregate enroll-
ment. Disaggregated data reveals valuable infor-
mation regarding where AAPI students, by ethnic
Figure 6: Proportional Representation of Ethnic Subgroups in Total Enrollment and Free or Reduced Lunch Utilization among AAPIs in Washington State, 2013
Source: OSPI FRL Enrollment Data, 2013.
Samoan students are enrolled in the Free or Reduced Lunch program at more than two times their total enrollment rate.
The Hidden Academic Opportunity Gaps Among Asian Americans and Pacific Islanders: What Disaggregated Data Reveals in Washington State12
subgroup, are placed and what specific support
they might need in their academic experiences.
For these students, consideration of language
programs, curricula or hiring bilingual educators
may be factors to be considered to appropriately
address their unique linguistic circumstance.
Placement in special education programs also
varies significantly across AAPI subgroups. Na-
tionally, AAPIs make up only 4.2 percent (ages
3–5 years) and 4.8 percent (ages 6–21 years)
of the Individuals with Disabilities Education
Act (IDEA) programs, or placement in special
education, as compared to the national rate of 5.7
percent and 9.0 percent, respectively.12 In
Washington State, as of the 2008 reports, 7.0 per-
cent of Asian Americans and 8.0 percent of NHPIs
were placed in special education in K–12, as com-
pared to the overall 12.0 percent across all racial
groups. The aggregate data previously reported,
however, did not allow for pinpointing which
AAPI subgroups were disproportionately more
likely than their peers to be in special education.
Disaggregated data demonstrates that place-
ment in special education is particularly high
for NHPIs, who are two times more likely to be
enrolled in special education proportional to
their total enrollment (Figure 8).
Figure 7: AAPIs by Ethnic Groups Enrolled in Bilingual Education in Washington State, 2013
Source: OSPI Bilingual Education Enrollment Data, 2013.

The Hidden Academic Opportunity Gaps Among Asian Americans and Pacific Islanders: What Disaggregated Data Reveals in Washington State 13
Figure 8: Proportional Representation of AAPIs by Regional Groups in Total Enrollment and Special Education Placement, Washington State, 2013
Distribution of Total Enrollment Distribution of Special Education Placement
Source: OSPI Enrollment Data, 2013; OSPI Special Education Placement Data, 2013.
“If young students in the AAPI community are not recognized, then they will feel like what they do doesn’t matter and kind of fade into the distance.”
— College student in Washington State
Absences & Discipline
Although student absences were not included
in the 2008 reports, that data is reported here,
as studies have found that student absences are
linked to academic achievement. Specifically,
truancy results in greater risks for not doing well
academically, dropping out or being pushed out,
substance abuse, and living in poverty later in
life.13 In alignment with those findings, studies
done in the state of Washington have revealed
that school factors contribute to poor academic
achievement of students of color.14 Our analysis
finds that AAPIs in the aggregate are the least
likely racial group to have unexcused absences
(five or more) at 8.3 percent, as compared to the
statewide average of 11.5 percent.
A closer examination of disaggregated data re-
veals that AAPI subgroups vary widely in regard
to their attendance patterns. Tongans and Samo-
ans, for example, are much more likely to miss five
or more days of class, unexcused (25.4 percent
and 24.3 percent, respectively), which far exceeds
the AAPI average for unexcused absences (8.3
percent) (Figure 9). Comparatively between AAPI
subgroups, it is also notable that Tongan students
are 10 times as likely as Taiwanese students to

The Hidden Academic Opportunity Gaps Among Asian Americans and Pacific Islanders: What Disaggregated Data Reveals in Washington State14
have absences. These data offer the opportunity
to explore the ways in which schools and districts
can be instrumental to improving attendance
rates. Given that a number of school-related fac-
tors can influence unexcused absences — includ-
ing unsafe schools, poor school climate and poor
relations with teachers, among other factors —
schools can play a key role in mitigating these
influences on truancy.15
School disciplinary action is another important
factor to examine in regard to student success.
The racial disproportionality in school discipline,
especially for Black and Latino students, has been
well researched.16 In large part, studies that have
examined school discipline by race have found
Black and Latino students are disproportion-
ately more likely to be targeted for suspension
and expulsion than White and Asian students.17
When Asian American students are included in
these studies, they have been depicted as the
least likely to be disciplined and, often times,
Pacific Islanders have been left out of these studies
all together.18
Figure 9: Five or More Unexcused School Absences by AAPI Subgroups in Washington State, 2013
Source: OSPI Unexcused Absence Data, 2013.

The Hidden Academic Opportunity Gaps Among Asian Americans and Pacific Islanders: What Disaggregated Data Reveals in Washington State 15
Figure 10: Proportional Disciplinary Action in Washington State, 2013
Source: OSPI Disciplinary Action Data, 2013.
In the 2008 analysis, discipline included short-
and long-term suspensions in Seattle Public
Schools. As the only district that collected disag-
gregated data, the authors were able to report
on the high rates of suspension among South-
east Asians and Filipinos, as well as Samoans. In
alignment with those findings, AAPI students
across the state today continue to experience a
wide spectrum in regard to discipline. In the re-
cent OSPI data, data is collected on the number
of students with discipline incidents resulting in
short-term suspension, long-term suspension,
or expulsion. These incidents are classified into
eight categories: bullying, tobacco, alcohol, illicit
drug use or possession, fighting without major
injury, violence without major injury, violence
with major injury and possession of a weapon.
The fighting and violence variables have been
collapsed into one category. These data reveal
important findings. Relative to their proportional
representation among AAPIs, NHPIs are dispro-
portionately more likely to be disciplined. While
NHPIs represent 11.9 percent of all AAPI students
in Washington, they made up 51.5 percent of
the recorded disciplinary action in 2013 (Figure
10). Given this, NHPI students must be further
examined in regard to the differential academic
experiences relative to disciplinary action.

The Hidden Academic Opportunity Gaps Among Asian Americans and Pacific Islanders: What Disaggregated Data Reveals in Washington State16

The Hidden Academic Opportunity Gaps Among Asian Americans and Pacific Islanders: What Disaggregated Data Reveals in Washington State 17
In Washington State,
91,398 students were
enrolled in one of the six
public four-year post-
secondary institutions in 2013. As in K–12, the White student population made up the
largest proportion at 62.3 percent, followed by Asian American at 14.5 percent and
Latino at 8.6 percent. NHPIs made up 0.8 percent of the student population. At the
time of the 2008 reports, disaggregated postsecondary data was not collected for post-
secondary institutions. This section features data from the six four-year postsecondary
institutions in Washington State, as the two-year data is not yet available. As Figure 11
demonstrates, the representation of AAPIs in postsecondary education includes a great
diversity of ethnic subgroups, as is the case in K–12 education.
DISAGGREGATED POSTSECONDARY DATA (ERDC)
Particular subgroups are disproportionately more
likely to enroll in one of the six four-year public in-
stitutions in Washington. This can be determined
by examining broader AAPI subgroups (Figure
12), which reveal that while East Asians make up
38.4 percent of the state’s AAPI population, they
make up 54.3 percent of the four-year college en-
rollment. Conversely, Southeast Asians make up
21.0 percent of the state’s AAPI population and
16.7 percent of the K–12 enrollment, but only
15.5 percent of the postsecondary enrollment.
Similarly, NHPIs make up 11.9 percent of K–12 en-
rollment but only 5.5 percent of postsecondary
enrollment in four-year institutions. In regard to
reaching a point of parity, these data reveal that
there is a large opportunity gap that continues to
exist for particular AAPI subgroups.
Figure 11: Asian American and Pacific Islander Representation in Four-Year Postsecondary Public Institutions, Washington State, 2013
Asian American Subgroup Representation Pacific Islander Subgroup Representation
Source: ERDC Postsecondary Enrollment Data, 2013.

The Hidden Academic Opportunity Gaps Among Asian Americans and Pacific Islanders: What Disaggregated Data Reveals in Washington State18
This becomes even more apparent when ex-
amining data that is further disaggregated into
specific subgroups. For example, while Chinese
make up 18.6 percent of all AAPIs in Washington,
they make up nearly a quarter of the postsecond-
ary enrollment at 24.4 percent (Figure 13). Con-
versely, while Vietnamese make up 13.6 percent of
the AAPI population, one of the five largest AAPI
groups, they make up only 10.2 percent of AAPI
enrollment in college. Similar to their Vietnamese
peers, Samoan students also experience a lower
rate of postsecondary enrollment (0.8 percent)
as compared to their proportional representa-
tion in the AAPI population in the state (1.76 per-
cent). Disaggregated data allows us to narrowly
determine which subgroups are experiencing
lesser access to postsecondary education, thus
allowing opportunities for mitigating academic
barriers facing these particular students and
communities.
Figure 12: Proportional Representation in K–12 and Four-Year Enrollment, Washington State, 2013
Source: U.S. Census Bureau, American Community Survey, 1-Year Estimates, 2013; ERDC Postsecondary Enrollment Data, 2013.

The Hidden Academic Opportunity Gaps Among Asian Americans and Pacific Islanders: What Disaggregated Data Reveals in Washington State 19
Figure 13: Proportional Representation in K–12 and College Enrollment by AAPI Subgroups, Washington State, 2013
Source: U.S. Census Bureau, American Community Survey, 1–Year Estimates, 2013; OSPI K–12 Enrollment Data, 2013; ERDC Postsecondary Enrollment Data, 2013.
The ERDC data brings to surface a few key fac-
tors. First, not only does it represent diverse
educational experiences of AAPI subgroups in
postsecondary education in Washington State,
it also narrowly targets which communities
and students are experiencing more difficulty
accessing postsecondary education. Secondly,
although the data shared here is not as extensive
as the data available for the K–12 section, it points
out the value of collecting and reporting disag-
gregated data as it reveals the opportunity gaps
that exist across groups. Finally, the ERDC data
has been underutilized in Washington State to
date; therefore, this report provides a platform
for encouraging the use of these more nuanced
data to examine student access and outcomes.
“For a long time the Asian Pacific Islander community has been grouped up into one monolithic group. Stereotypes, prejudice and microaggressions are the repercussions that arise with such action. To have representation across the Asian Pacific Islander community would create less of a negative stigma on individuals who are not represented in print culture.”
— College student in Washington State

The Hidden Academic Opportunity Gaps Among Asian Americans and Pacific Islanders: What Disaggregated Data Reveals in Washington State20

The Hidden Academic Opportunity Gaps Among Asian Americans and Pacific Islanders: What Disaggregated Data Reveals in Washington State 21
What the results of this report re-
veal is the extent to which data on
AAPIs reported in the aggregate
mask the wide spectrum of AAPI academic experiences and outcomes in Washing-
ton State. Disaggregated data unveils what is hidden beneath aggregate data and
is helpful for identifying opportunity gaps to which policies, programs, and other
resources can target. Being able to more narrowly target resources is critical for
addressing the unique barriers and challenges faced by particularly vulnerable AAPI
subgroups. Unfortunately, these subgroups are too often overlooked and underserved
without a deeper understanding of their unique life circumstances and educational
trajectories. It is these particular AAPI subgroups who will benefit the most from the
newly available data in Washington State.
CONCLUSION & RECOMMENDATIONS
A number of important recommendations for
practitioners and policymakers emerged from
this study:
n Although some disaggregated data is now
being collected, there is a need for more con-
sistent data, which can be resolved by better
guidance and rulemaking at the state level. It is
important for K–12 schools and districts, for ex-
ample, to be collecting data that can be merged
across schools and districts. This is particularly
important when it comes to identifying which
ethnic subgroups are included in surveys.
n Similar challenges exist within different sec-
tors of public higher education. Community
colleges and technical schools should be col-
lecting information similar to that collected by
public four-year colleges and universities. To
this point, it is important for K–12 data to align
with postsecondary data and for data between
postsecondary sectors to be more aligned in
order to track students within the context of
the academic pipeline.
n In addition to changes to the collection of infor-
mation, it is also important for data to be more
accessible to communities. Although disag-
gregated data has been collected since 2010,
this is the first publication that has reported
it. Access to these data is particularly impor-
tant for community and advocacy groups that
work with underrepresented and underserved
AAPI communities.
n Data should also be utilized to better inform the
work of institutional leaders and practitioners.
Disaggregated data can help target interven-
tions and support services for students who are
facing particular academic barriers and chal-
lenges. It is also critical for informing teacher
training, curricula, and culturally responsive
programs and services.
“Disaggregating data would not only have immediate change on paper, but also be a start to much more broad and subtle changes in our everyday society, which would, in turn, allow the youth in each ethnic culture to have pride in themselves and being a part of their unique culture.”
— College student in Washington State

The Hidden Academic Opportunity Gaps Among Asian Americans and Pacific Islanders: What Disaggregated Data Reveals in Washington State22

The Hidden Academic Opportunity Gaps Among Asian Americans and Pacific Islanders: What Disaggregated Data Reveals in Washington State 23
Data in this report were drawn from multiple sources:
TECHNICAL APPENDIX
U.S. Census Data
Our primary source for statewide demographic information was from the U.S. Census Bureau. To
capture changes in Washington’s AAPI population, we relied on data from the 2007, 2010 and
2013 American Community Survey (ACS), 1-Year Estimates. In order to better understand and
compare AAPI demographic conditions, we utilized two variables (Median Household Income and
Educational Attainment) from two different iterations of the American Community Survey’s 3-Year
Estimates, 2006–2008 and 2011–2013.
Office of Superintendent of Public Instruction (OSPI) Data
Data obtained through OSPI included K–12 student-level data for all students enrolled in a public
school in any of the Washington State school districts in 2013. These data were sorted by both
racial group (Asian American, broadly) and by ethnicity (ethnic subgroup). Aggregate numbers of
enrollment, including programmatic enrollment (Free or Reduced Lunch, bilingual education and
special education) were descriptively analyzed by race and/or ethnicity. Means or medians were
determined through such analysis and offered as benchmarks for comparison. Additionally, rates of
absence and discipline were included in the descriptive analysis, and means or medians were also
used as a comparison for these variables. These variables were selected as they were also used in
the 2008 reports and offer an opportunity for examining change over time. The only variable that
was not featured in the 2008 report is absences, which was included as it was determined relevant
to the opportunity gap narrative. In some cases, ethnic subgroups were aggregated into regional
groups (see below for details).
Education Research and Data Center (ERDC) Data
ERDC data included four-year postsecondary student-level data for all students enrolled in one of
the six public four-year institutions in Washington State in 2013. These data were sorted by both
racial group (Asian American, broadly) and by ethnicity (ethnic subgroup), and aggregate num-
bers of enrollment were descriptively analyzed by race and/or ethnicity. These data were compared
against ACS and OSPI data to examine proportionality of higher education enrollment. Data on
student enrollment in community and technical colleges (CTCs) were not included as that data is
reportedly not as comprehensive as the four-year college student data. Ethnic subgroups were also
aggregated into regional groups (see next page for details).

The Hidden Academic Opportunity Gaps Among Asian Americans and Pacific Islanders: What Disaggregated Data Reveals in Washington State24
Regional Groups
Our aggregates of AAPI ethnicities into regional groups included the following ethnic subgroups, which
appeared in at least one of the datasets used (ACS, OSPI, ERDC):
Subgroup Ethnicity
East Asian Chinese, Japanese, Korean, Mongolian, Singaporean, Taiwanese
Southeast Asian Burmese, Cambodian, Hmong, Indonesian, Laotian, Malaysian, Thai, Vietnamese
Filipino Filipino
South Asian Asian Indian, Bangladeshi, Bhutanese, Nepalese, Pakistani, Sri Lankan
Native Hawaiian and Pacific Islander
Fijian, Guamanian or Chamorro, Mariana Islander, Melanesian, Micronesian, Marshallese, Native Hawaiian, Palauan, Papuan, Samoan, Tongan, Toke

The Hidden Academic Opportunity Gaps Among Asian Americans and Pacific Islanders: What Disaggregated Data Reveals in Washington State 25
1 S. Hune, & D. Takeuchi, Asian Americans in Washington State: Closing Their Hidden Achievement Gaps. (Seattle, WA: Commission on Asian Pacific American Affairs, 2008); D. Takeuchi, & S. Hune, Growing Presence, Emerging Voices: Pacific Islanders & Academic Achievement in Washington (Seattle, WA: Commission on Asian Pacific American Affairs, 2008).
2 E. Hoeffel, S. Rastogi, M. Kim, & H. Shahid, The Asian Population: 2010 (Washington, DC: U.S. Census Bureau, 2012); L. Hixson, B. Hepler, & M. Kim, The Native Hawaiian and Other Pacific Islander Population: 2010 (Washington, DC: U.S. Census Bureau, 2012).
3 S. Hune, & D. Takeuchi, Asian Americans in Washington State: Closing Their Hidden Achievement Gaps.; D. Takeuchi, & S. Hune, Growing Presence, Emerging Voices: Pacific Islanders & Academic Achievement in Washington (Seattle, WA: Commission on Asian Pacific American Affairs, 2008).
4 Ibid (p. 14).
5 L. Hixson, B. Hepler, & M. Kim, The Native Hawaiian and Other Pacific Islander Population: 2010.
6 U.S. Department of Agriculture, Food and Nutrition Service [USDA] (2014). Child Nutrition Programs: Income Eligibility Guidelines, 2013–2014. Retrieved from http://www.fns.usda.gov/sites/default/files/IEG_Table-032913.pdf
7 Ibid.
8 S. J. Caldas, & C. Bankston, Effect of school population socioeconomic status on individual academic achievement. The Journal of Educational Research, 90(5), 269–277 (1997).
9 D. Takeuchi, & S. Hune, Growing Presence, Emerging Voices: Pacific Islanders & Academic Achievement in Washington (Seattle, WA: Commission on Asian Pacific American Affairs, 2008): p. 9.
10 M. Lacour, & L. Tissington, The Effects of Poverty on Academic Achievement, Educational Research and Reviews, 6, (2011); J. Teachman, K. Paasch, R. Day, & K. Carver, “Poverty during Adolescence and Subsequent Education Attainment,” Consequences of Growing Up Poor (New York, NY: Russell Sage Foundation, 1996); S. Mayer, “The ‘True’ Effect of Income,” What Money Can’t Buy: Family Income and Children’s Life Chances (Cambridge, MA: Harvard University Press, 1997); R. Haveman, B. Wolfe, & K. Wilson, “Childhood Poverty and Adolescent Schooling and Fertility Outcomes: Reduced-Form and Structural Estimates,” Consequences of Growing Up Poor (New York, NY: Russell Sage Foundation, 1996).
11 R. Teranishi, “Asian Americans and Pacific Islanders in Higher Education,” Encyclopedia of Diversity in Education (Thousand Oaks, CA: Sage Publications, 2012).
12 Department of Education, 29th Annual Report to Congress on the Implementation of the Individuals with Disabilities Education Act (Washington, DC: US Department of Education, 2007).
13 M. Gottfried, “Excused Versus Unexcused: How Student Ab-sences in Elementary School Affect Academic Achievement,” Education Evaluation and Policy Analysis, 31 (2009); M. Yeide & M. Korbin, Truancy Literature Review (Washington, DC: U.S. Department of Justice, Office of Juvenile Justice and Delinquency Prevention, 2009).
14 M. Bailey, & T. Dziko, A Plan to Close the Achievement Gap for African American Students (Olympia, WA: Superintendent of Public Instruction, 2008); F. Contreras, & T. Strikus, Understanding Opportunities to Learn for Latino Students in Washington (Seattle, WA: Washington State Commission on Hispanic Affairs, 2008); S. Hune, & D. Takeuchi, Asian Americans in Washington State: Closing Their Hidden Achievement Gaps (Seattle, WA: Commission on Asian Pacific American Affairs, 2008).
15 M. Yeidee, & M. Korbin (2009). Truancy Literature Review: Prepared for U.S. Department of Justice. Retrieved from http://www2.dsgonline.com/dso/truancy%20literature%20review.pdf
16 United States Department of Education Office of Civil Rights [OCR] (2014). Civil Rights Data Collection: Data Snapshot (School Discipline). Retrieved from http://www2.ed.gov/about/offices/list/ocr/docs/ crdc-discipline-snapshot.pdf
17 Ibid.
18 K. Hoffman, & C. Llagas, Status and Trends in the Education of Blacks (Washington, DC: U.S. Department of Education, 2003).
REFERENCES


Copyright © 2015 by Educational Testing Service. All rights reserved. ETS and the ETS logo are registered trademarks of Educational Testing Service (ETS). All other trademarks are property of their respective owners. 30371
Related Documents