Connectedness Profile: Sample p. 1 Connectedness Report: Small Rural School District, March 22, 2003 May 2000 The Hemingway Measure of Adolescent Connectedness „ „„ „ (MAC 5 Adolescent, grades 6-12) Summary of Survey Results October 29, 2002 Administration A Small Rural School District Contact Person: Claytie Davis Michael Justin Karcher, Ed.D., Ph.D. College of Education and Human Development The University of Texas ★ San Antonio 501 West Durango Blvd., Office 4.314 San Antonio, Texas 78207 [email protected] 210-458-2671 Report date: March 22, 2003 Future oriented Present oriented

Welcome message from author
This document is posted to help you gain knowledge. Please leave a comment to let me know what you think about it! Share it to your friends and learn new things together.
Transcript
Connectedness Profile: Sample p. 1
Connectedness Report: Small Rural School District, March 22, 2003
May 2000
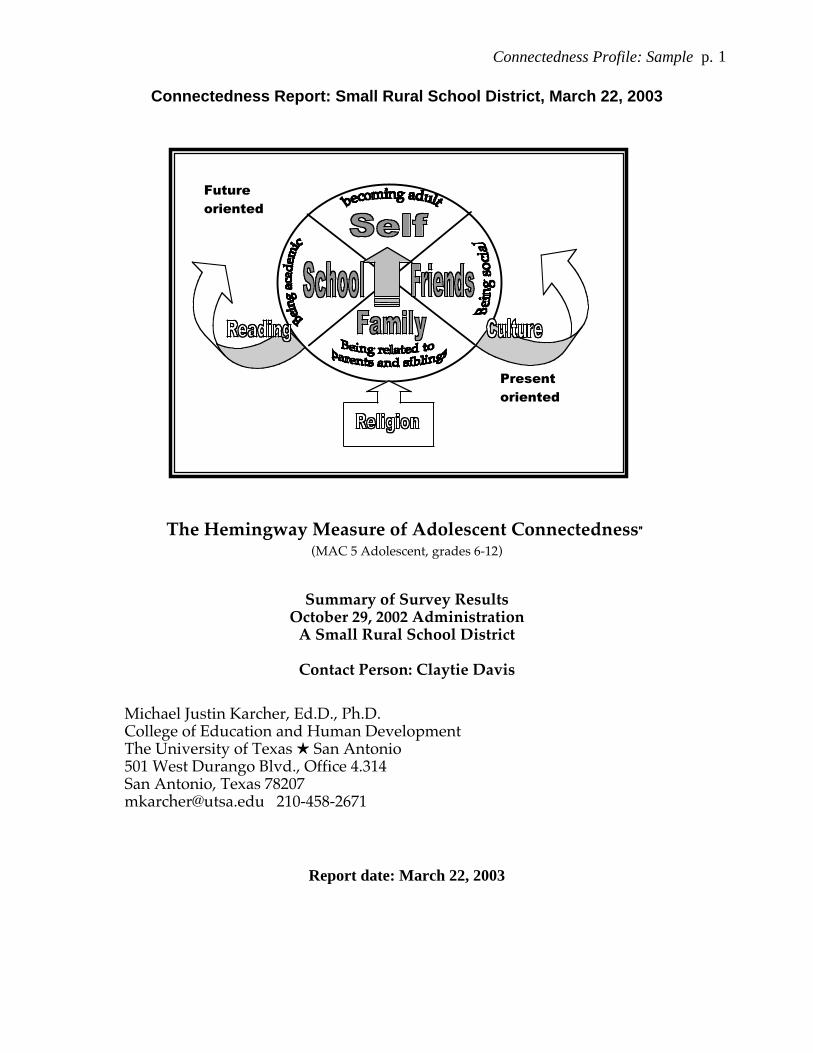
The Hemingway Measure of Adolescent Connectedness„„„„
(MAC 5 Adolescent, grades 6-12)
Summary of Survey ResultsOctober 29, 2002 Administration
A Small Rural School District
Contact Person: Claytie Davis
Michael Justin Karcher, Ed.D., Ph.D.College of Education and Human DevelopmentThe University of Texas � San Antonio501 West Durango Blvd., Office 4.314San Antonio, Texas [email protected] 210-458-2671
Report date: March 22, 2003
Future
oriented
Present
oriented

Connectedness Profile: Sample p. 2
An Overview of Adolescent Connectedness
Establishing and maintaining connectedness to others, to society, and to oneself is a pervasive
human concern (Baumeister and Leary, 1995; Gilligan, 1982; Kohut, 1977). Twenty-five years after
Maslow (1968) described belongingness as the third most fundamental need of the self, Baumeister
and Leary (1995) proposed that belongingness is perhaps the most important psychological resource
for overall human well being. They describe the need to belong as the universal need for frequent,
pleasant social contact (Baumeister & Leary, 1995) which individuals reciprocate by trying to connect
with those things, people, and place that reflect contexts of belonging. Connectedness is shaped both
by feelings of general belongingness and by assessments of person-specific interpersonal relatedness.
Within the theory of adolescent connectedness (Karcher, 2001) connectedness is described as
movement towards others through affection and activity. Connectedness is considered a response to
relatedness and belonging. When individuals feel a sense of relatedness to others and belonging in
general they, in turn, value those relationships and social institutions in which they experience
belongingness and relatedness. They pursue activities and relationships, which further cements their
affective commitment. Connectedness, then, reflects one's perception of their own involvement in and
affection for others, activities, and organizations.
Connectedness refers to involvement not only in dyadic relationships and groups, but also in
activities, abstractions, and ideologies that reflect individuals' social memberships or affiliations. For
example, descriptions of connectedness to reading, to religion, and to the future are also found in the
child and adolescent literature (Feral, 1999; Nakkula & Selman, 1991).
Connectedness is a function of the need to belong, such that when belonging and relatedness is
not experienced by an individual in one social ecology, he or she will become more connected to other
social ecologies as a compensatory act (Baumeister & Leary, 1995). For example, when disconnection
occurs with family members, connectedness with friends may increase; when adolescents become
disconnected from school, they often seek connectedness outside of school in their neighborhood
(Hirschi, 1969). Adolescents' sense of self is born out of these sometimes divergent connections to
family, teachers, friends and peers (Buhrmester, 1990; Harter, 1999) which facilitate the development
of a sense of oneself in the present as well as oneself in the future. Therefore, connectedness refers to
one’s engagement with others, but also in the process of constructing an enduring sense of self.
The Hemingway: Measure of Adolescent Connectedness (MAC 4th version; Karcher, 1999)
The Hemingway Measure of Adolescent Connectedness is based on an ecological framework
that includes these social, institutional, and self domains. The scales assess caring for and involvement

Connectedness Profile: Sample p. 3
in close relationships and important contexts. The measure also was developed through factor analyses
which allow the structure of adolescent connectedness found with the U.S. youth.
The Hemingway: Measure of Adolescent Connectedness (MAC) consists of 72 items designed
to measure the adolescents’ degree of caring for and involvement in fifteen relationships and
institutional contexts. The MAC includes subscales of 15 ecological worlds and four composite scales.
Responses to each of the items are made using a five-point, Likert-type response scale which range
from (1) not true at all, (2) not really true, (3) sort of true, (4) true, to (5) very true. There is at least
one reverse scored item in each scale. The items within each of the 15 worlds are averaged to get
separate subscale scores.
Four composite scales can be computed, which reflect the mean of all subscale items in each of
four domains: Family (parents and sibling items), Friends (friends and neighborhood items), School
(school and teacher items), and Self (present and future self items).
But the subscales also can be grouped into three underlying factors that have been found in
multiple adolescent samples in the U.S. (Karcher, 2001). These are social connectedness, academic
connectedness, and family connectedness.
The social connectedness factor includes connectedness to friends, the neighborhood, a
romantic partner, and a self-in-the-present.
The school connectedness factor includes connectedness to school, teachers, peers, culturally
different peers, reading, and self-in-the-future.
The family connectedness factor includes the connectedness to parents, siblings, mother,
father, and religion subscales.
The subscales in each of these three factors can be characterized in terms of temporality,
conventionality, and ways of connecting. The items in each of the subscales reflect a balance of
items reflecting the two primary ways of connecting—through activity/involvement and through caring
(e.g., "I work hard at school." and "I enjoy being at school."). Subscales reflect a time orientation. The
social and family subscales are generally present-oriented, and the academic subscales are typically
future-oriented. Finally, subscale worlds may either reflect conventional, adult-mediated behaviors and
attitudes (e.g., school and family subscales) or unconventional behaviors and attitudes (e.g., friends,
neighborhood, and self-in-the-present subscales) which reflect youth-directed behaviors and youth-
specific attitudes (Jessor, 1993).
Connectedness to self emerges during adolescence and is reflected by two scales in the
measure. During adolescence, specifically in the junior high years, youth undergo developmental

Connectedness Profile: Sample p. 4
transitions, including pubertal changes, new psychosocial roles, and cognitive developments that result
in the emergence of a sense of self out of their unique relationships with family memberships, teachers,
and friends (Erikson, 1950; Harter, 1999). Adolescents self-esteem in these contexts informs a
connectedness to a self-in-the-present. The ability to think abstractly also results in the development
of a self-in-the-future self (Harter, 1999).
The Consequences of Connectedness
Promoting connectedness should be a goal of parents and educators, because youth who report
greater connectedness tend to be psychologically happier, physically healthier, and generally better
able to cope with the stresses of everyday life (Baumeister & Leary, 1995; Lee & Robbins, 1995,
1998). Conversely, studies of U.S., Scottish, and Korean youth, as well as with Asian-American
adolescents, repeatedly find that youth reporting less connectedness also report more psychological
difficulties and poorer physical health (Asakawa & Csikszentmihalyi, 2000; Hendry & Reid, 2000; Lee
& Davis, 2000; Roth & Brooks-Gunn, 2001). The literature linking connectedness to unhappiness,
depression, and anxiety (e.g., Bonny, Britto, Klostermann, Hornung, & Slap, 2000; Resnick, Harris, &
Blum, 1993) as well as to academic achievement is growing in the U.S. and elsewhere, and it
highlights the importance of connectedness in adolescent development (Bonny, Britto, Klostermann, &
Slap, 1999; Cooper, 1999; Kuperminc, Blatt, & Leadbeater, 1997).
Variations in Connectedness Between Sexes
Gender differences have received the greatest attention within the research on connectedness.
The proposition that girls report greater relatedness and belonging than boys has received much
attention (Lang-Takac & Osterweil, 1992; Tolman, 1992), and empirical studies consistently reveal
clear gender differences in connectedness (Hagerty et al., 1993; Harter, Waters, Pettit, Kofkin, &
Jordan, 1997; Jacobson & Rowe, 1999; 1998; Lee, Keough, & Seagal, 1999; Lee & Robbins, 1995).
Girls tend to report greater connectedness to family and school, including connectedness to teachers.
Using Connectedness Scales to Predict the Achievement of Developmental Assets
In the Connectedness Report, which follows the basic sample demographics on the next page,
the connectedness scales are grouped by contexts: school, self, social and family. Next to these are the
name and number of the asset that is akin to the connectedness scale and the mean connectedness score
on that scale for students in your school who did not and who did have that specific asset. Below the
mean for the students with that asset is a percentage which reflects the accuracy of predicting whether
or not each students has the asset based only on the students connectedness subscale score. Higher
percentages mean the developmental asset and the connectedness scale are more interchangeable.

Connectedness Profile: Sample p. 5
October 29, 2002 Administration: A Small Rural School District--Demographics:
Sex Response N %Male 190 54%
Female 159 46%Total 349 100%
Blanks 17
Grade Response N %06 48 15%07 64 20%08 55 18%09 49 17%10 47 16%11 46 16%12 41 15%
Total 350 100%Blanks 16
Race/Ethnicity: Response N %White 181 67%Black 1 0%
Hispanic 3 1%Asian 0 0%
Bi-Racial 87 32%Other 0 0%Total 272 100%
Blanks 94
Who do you live with? Response N %Mother 88 28%Father 15 5%
Both 191 61%Other 17 5%Total 311 100%
Blanks 55
Please use this survey to tell us about yourself. Read each statement. MARK the number that bestdescribes how true that statement is for you or how much you agree with it. If a statement is unclear toyou, ask for an explanation. If it is still unclear, mark the “?”.“How TRUE about you is each sentence?”
1 – Not at all true2 – Not really true3 – Sort of true4 – True5 – Very true6–Unclear

Connectedness Profile: Sample p. 6
How to Read the Report:Currently there are no national norms against which your school’s scores can be compared.
Instead, you should consider what developmental assets are most important to your overall school
development plan, and consider what assets and forms of connectedness you can address through
curricular changes staff training, or special programs. For example, public schools have a more
difficult time addressing religious connectedness or community than do private schools, but both
schools can address children’s connectedness to other cultures. Similarly, schools can more easily
facilitate connectedness to teachers than make a child’s neighborhood feel more caring (Asset # 4).
When you review the summary findings on the next few pages, there are several questions you
should keep in mind, and you should be aware that family, school, and social connectedness have
different developmental consequences. Questions to keep in mind: On what scales are there large
differences between boys and girls? Does connectedness seem most present among the students who
have been in a building and known their teachers the longest (e.g., 8th, 11th, and 12th grades) or
among youth who are newest to the school (e.g., 9th grade). These questions suggest whether the
school climate likely facilitates a particular kind of connectedness (when it is highest among 8th and
12th graders) or erodes that kind of connectedness (when it is highest in 6th or 9th grades).
There are a couple of ways to think about the school, family, and social connectedness
subscales. Of greatest importance to the long-term academic and social competence of your students--
and the forms of connectedness most directly affected by school intervention--are the school
connectedness subscales, which are presented below. Connectedness to school, to teachers, to reading,
and to peers, particularly to culturally different peers predict positive outcomes, such as achievement,
attendance, social success, and involvement in extracurricular activities. Family connectedness may be
most relevant to your school in terms of what it suggests children are bringing with them to school:
youth who have difficult relationships with mothers, fathers, and siblings transfer those negative
expectations about relationships to teachers, friends, and peers (Karcher, 2002). Social connectedness,
despite its positive-sounding name, tends to predict problem behavior (notice the negative relationship
between Asset #31: Restraint and connectedness to a romantic partner). The higher youths
connectedness to the neighborhood (here, to peers in the neighborhood, not to adults in their
neighborhood as reflected in Asset # 4), connectedness to friends, and connectedness to romantic
partners all predict risk-taking behavior. Social connectedness is not necessarily bad, however, as long
as social connectedness is balanced with connectedness to family and to school.
Summary:This summary of findings is meant to draw your attention to some of the high and low scores
on connectedness, paying particular attention to sex differences and to grade differences. At least one
point is presented next to each form of connectedness. Overall, connectedness was strongest in 6th
grade and in 11th and 12th grades. Ninth and 10th grades appeared most at risk, with lowest scores on
school connectedness subscales. Girls were considerably more connected, that is, involved in and
concerned about school, their relationships in school (teachers, peers), and school activities (reading).

Connectedness Profile: Sample p. 7
Report focus: School Connectedness
School: Involvement in and positive feelings toward school: Boys’ connectedness scores were much
lower than girls’, and connectedness to school appeared to decline in the last three years of high school
suggesting school connectedness is not increasing over the years as you would like it to.
Teachers: Caring for teachers; wanting their respect; working to gain teachers’ trust: There were small
gender differences. Although connectedness to teachers is highest in 6th grade, it remains fairly steady,
somewhere between “sort of” and “true” until 12th grade. Notice that this scale accurately predicted
whether or not each child had the asset of positive adult role models (#14) for 83% of youth, suggesting
connectedness to teachers may generalize towards the children’s other relationships (and that children’s
other relationships with adults informs how they feel about their teachers).
Reading: Reading regularly, independently, and for fun: Girls were more connected to reading, and
aside from an all-time high of 3.3 in 6th grade, connectedness to reading was low, often below 3
(indicating “sort of” connected to reading) between 8th and 12th grade. This connectedness scale is an
excellent predictor of the Asset #25 reading for pleasure, accurately identify 88% of youth.
Peers: Can work cooperatively with and likes one’s own peers: Peer relationships varied slightly
between 6th and 12th grade, with peaks in grades 8 and 12, suggesting the longer kids have been
together the more interpersonally effective they feel. But overall, the average of 3.2 suggests most of
the students do not report feeling competent with and interested in working with their peers.
Culturally different peers: Interest in and values diversity: Aside from a high score in 6th grade, there
was a low degree of interest in culturally different peers in 7th to 9th grades, but then it increased
afterwards. Girls were much more interested in knowing their culturally different peers.
Scale Anchors: 1 = Not at all true; No 2 = Not really true; 3 = Sort of true; 4 = True; 5 = Very true.
Low connectedness scores were 1 to 3.5 (< 3.5); High connectedness scores were 3.5 to 5 (> 3.5)
Recommendations:(1) Provide more opportunities for students to work with peers, especially non-friend peers, in
interdependent tasks that are fun and facilitate success (rather than competition), such as in service
learning, extracurricular event planning, and cooperative learning or class projects.
(2) Provide teachers training and support to reach out to students in early high school, when students’
disconnection from parents appears most likely to undermine their connectedness to teachers.
(3) Include non-academic reading activities in assignments, encourage outside reading (e.g, rewards
for youth-chosen books ready by youth on their own time), and allow in-school, quiet reading time.
(4) Focus on boys’ lower connectedness (involvement and caring) as a risk-factor: that is, try to not
accept lower connectedness as the norm and acceptable, and facilitate boys’ involvement.
Connectedness Profile: Sample p. 8
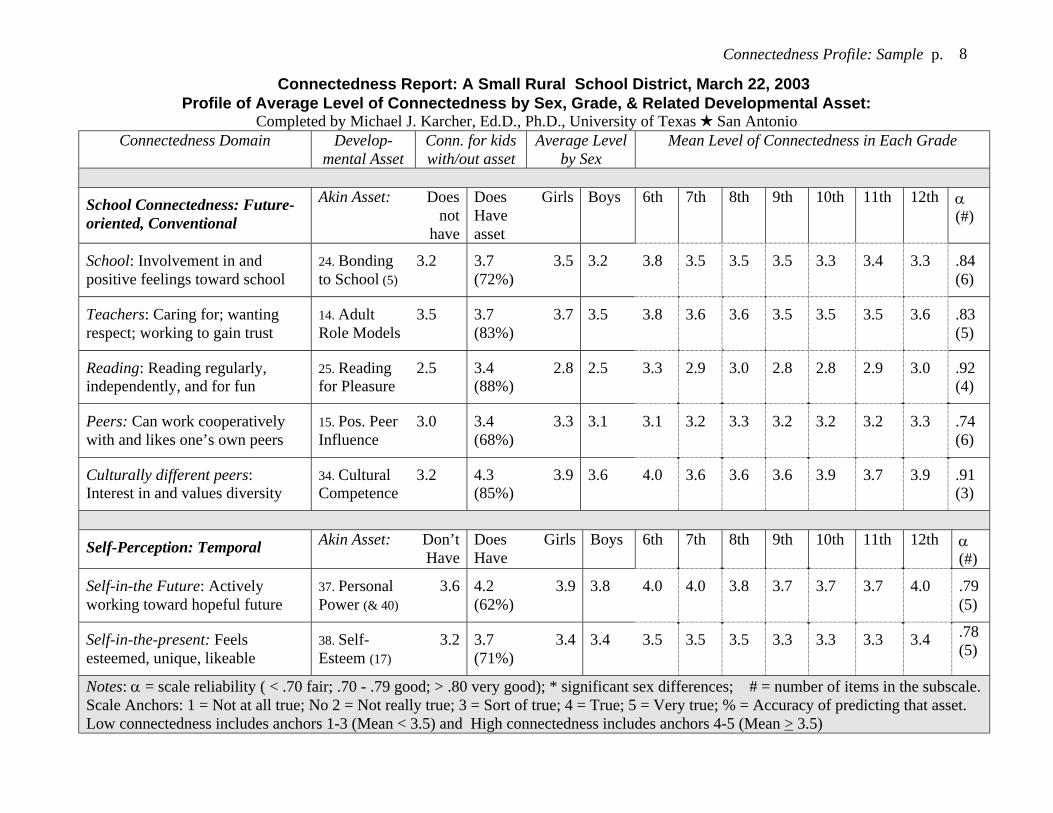
Connectedness Report: A Small Rural School District, March 22, 2003Profile of Average Level of Connectedness by Sex, Grade, & Related Developmental Asset:
Completed by Michael J. Karcher, Ed.D., Ph.D., University of Texas � San AntonioConnectedness Domain Develop-
mental AssetConn. for kidswith/out asset
Average Levelby Sex
Mean Level of Connectedness in Each Grade
School Connectedness: Future-oriented, Conventional
Akin Asset: Doesnot
have
DoesHaveasset
Girls Boys 6th 7th 8th 9th 10th 11th 12thα(#)
School: Involvement in andpositive feelings toward school
24. Bondingto School (5)
3.2 3.7(72%)
3.5 3.2 3.8 3.5 3.5 3.5 3.3 3.4 3.3 .84(6)
Teachers: Caring for; wantingrespect; working to gain trust
14. AdultRole Models
3.5 3.7(83%)
3.7 3.5 3.8 3.6 3.6 3.5 3.5 3.5 3.6 .83(5)
Reading: Reading regularly,independently, and for fun
25. Readingfor Pleasure
2.5 3.4(88%)
2.8 2.5 3.3 2.9 3.0 2.8 2.8 2.9 3.0 .92(4)
Peers: Can work cooperativelywith and likes one’s own peers
15. Pos. PeerInfluence
3.0 3.4(68%)
3.3 3.1 3.1 3.2 3.3 3.2 3.2 3.2 3.3 .74(6)
Culturally different peers:Interest in and values diversity
34. CulturalCompetence
3.2 4.3(85%)
3.9 3.6 4.0 3.6 3.6 3.6 3.9 3.7 3.9 .91(3)
Self-Perception: Temporal Akin Asset: Don’tHave
DoesHave
Girls Boys 6th 7th 8th 9th 10th 11th 12thα(#)
Self-in-the Future: Activelyworking toward hopeful future
37. PersonalPower (& 40)
3.6 4.2(62%)
3.9 3.8 4.0 4.0 3.8 3.7 3.7 3.7 4.0 .79(5)
Self-in-the-present: Feelsesteemed, unique, likeable
38. Self-Esteem (17)
3.2 3.7(71%)
3.4 3.4 3.5 3.5 3.5 3.3 3.3 3.3 3.4 .78(5)
Notes: α = scale reliability ( < .70 fair; .70 - .79 good; > .80 very good); * significant sex differences; # = number of items in the subscale.Scale Anchors: 1 = Not at all true; No 2 = Not really true; 3 = Sort of true; 4 = True; 5 = Very true; % = Accuracy of predicting that asset.Low connectedness includes anchors 1-3 (Mean < 3.5) and High connectedness includes anchors 4-5 (Mean > 3.5)

Connectedness Profile: Sample p. 9
Social Connectedness: PresentOriented, Unconventional
Akin Asset: Don’tHave
DoesHave
Girls Boys 6th 7th 8th 9th 10th 11th 12thα(#)
Friends: Trusts, spends timewith, & talks openly w/ friends
33. “Social”Competence
3.4 3.7(72%)
3.7 3.4 3.7 3.7 3.7 3.3 3.4 3.5 3.6 .85(6)
Neighborhood: Activity in andsense of safety & belonging
20. (-) Time athome (10 Safe)
3.5 3.2(-63%)
3.3 3.4 3.7 3.4 3.3 3.2 3.2 3.1 3.2 .80(6)
Romantic partner: Has, relies on,values boyfriend/girlfriend
31. Restraint 3.5 2.7(67%)
3.3 2.9 3.2 3.2 3.0 2.8 2.9 3.3 3.2 .95(4)
Family Connectedness: Present-oriented, Conventional
Akin Asset: Don’tHave
DoesHave
Girls Boys 6th 7th 8th 9th 10th 11th 12thα(#)
Parents: Spends time with,wants trust, cares for
1. FamilySupport
3.3 4.0(77%)
3.7 3.6 3.9 3.6 3.7 3.7 3.4 3.6 3.6 .83(6)
Mother: Fees close to, cares for,& communicates well with
2. PositiveFam. Comm.
3.6 4.2(77%)
3.9 3.8 4.3 4.0 3.7 3.8 3.9 3.7 3.8 .83(4)
Father: Fees close to, cares for,& communicates well with
2. PositiveFam. Comm.
3.3 4.1(76%)
3.9 3.8 3.9 4.0 3.8 3.5 3.5 3.4 3.7 .86(4)
Siblings: Frequent, enjoyablecontact with siblings
1. FamilySupport
2.8 3.3(70%)
3.5 3.0 3.2 3.0 3.0 3.2 3.0 2.9 2.9 .89(5)
Religion: Faithfulness;involvement in, importance of
19. ReligiousCommunity
2.0 3.9(84%)
3.2 2.9 3.2 3.2 2.8 2.8 2.9 2.6 3.2 .86(3)
Notes: α = scale reliability ( < .70 fair; .70 - .79 good; > .80 very good); * significant sex differences; # = number of items in the subscale.Scale Anchors: 1 = Not at all true; No 2 = Not really true; 3 = Sort of true; 4 = True; 5 = Very true; % = Accuracy of predicting that asset.Low connectedness includes anchors 1-3 (Mean < 3.5) and High connectedness includes anchors 4-5 (Mean > 3.5)

Connectedness Profile: Sample p. 10INDIVIDUAL ITEMS IN EACH SUBSCALE (Reverse score items 2, 7, 13, 18, 26, 30, 34, 45, 51, 55, 64, 70, 71)
School (6 items)(6) I work hard at school.(16) I enjoy being at school.(26) I get bored in school a lot.(36) I do well in school.(46) I feel good about myself when I am at school. (56) Doing well in school is important to me.
Teachers (6 items)(8) I care what my teachers think of me.(18) I do not get along with some of my teachers. (28) I want to be respected by my teachers.(38) I try to get along with my teachers.(48) I always try hard to earn my teachers’ trust.(50) I usually like my teachers.
Reading (4 items)(10) I enjoy spending time by myself reading.(20) I like to read.(30) I never read books in my free time. (40) I often read when I have free time.
Peers (6 items)(7) My classmates often bother me.(17) I like pretty much all of the other kids in my grade.(27) I like working with my classmates.(37) I get along well with the other students in my classes.(47) I am liked by my classmates.(57) I rarely fight or argue with the other kids at school.
Kids from other cultures (3 items)(60) I like getting to know kids from other cultural or racial groups. (65) I would like to know more people from different cultural groups. (69) I like getting to know people who are culturally different from me.
Self-in-the-present (6 items)(3) I can name 5 things that my friends like about me. (13) There is not much that is unique or special about me.(23) I can name 3 things that other kids like about me. (33) I really like who I am. (43) I have special hobbies, skills, or talents.(53) I have unique interests or skills that make me interesting.
Future (6 items)(9) I will have a good future. (19) Doing well in school will help me in the future.(29) I do things outside of school to prepare for my future. (39) I do lots of things in school to prepare for my future.(49) I think about my future often.(55) What I do now will not affect my future.

Connectedness Profile: Sample p. 11Neighborhood (6 items)(1) I like hanging out around where I live (like my neighborhood). (11) I spend a lot of time with kids around where I live.(21) I get along with the kids in my neighborhood. (31) I often spend time playing or doing things in my neighborhood. (41) I hang out a lot with kids in my neighborhood. (51) My neighborhood is boring.
Friends (6 items)(2) Spending time with friends is not so important to me. (12) I have friends I'm really close to and trust completely. (22) Spending time with my friends is a big part of my life.(32) My friends and I talk openly with each other about personal things. (42) I spend as much time as I can with my friends. (52) My friends and I spend a lot of time talking about things.
Romantic partner (5 items)(61) I spend a lot of time with a boyfriend/girlfriend.(66) I have a boyfriend/girlfriend who is very important to me.(70) I don’t really care about having a boyfriend/girlfriend. (74) I share my worries and concerns with a boyfriend/girlfriend. (76) I spend as much time as I can with a girlfriend/boyfriend.
Parents (6 items)(4) My family has fun together. (14) It is important that my parents trust me.(24) I enjoy spending time with my parents. (34) My parents and I disagree about many things.(44) My parents and I get along well.(54) I care about my parents very much.
Mother (4 items)(59) I enjoy spending time with my mother.(63) My mother and I are pretty close. (68) My mother cares a lot about me.(77) I talk with my mother about very personal things and my problems.
Father (4 items)(58) I enjoy spending time with my father.(64) My father and I are pretty close.(67) My father cares a lot about me.(78) I talk with my father about very personal things and my problems.
Siblings (5 items)(5) I have a lot of fun with my brother(s) or sister(s). (15) I feel close to my brother(s) or sister(s).(25) I enjoy spending time with my brothers/sisters.(35) I try to spend time with my brothers/sisters when I can. (45) I try to avoid being around my brother/sister(s).
Religion (3 items)(62) My religion is very important to me. (71) I attend a religious service (like church) regularly.(75) I am a religious or faithful person

Connectedness Profile: Sample p. 121. I like hanging out around where I live (like in my neighborhood.)
Response N %1-Not at all true 28 8%
2-Not really true 49 14%3-Sort of true 117 33%
4-True 107 30%5-Very True 55 15%
Total 356 100%Mean 3.3
Median 3StDev 1.129
2. Spending time with friends is not so important to me.Response N %
1-Not at all true 209 59%2-Not really true 84 24%
3-Sort of true 37 10%4-True 12 3%
5-Very True 13 4%Total 355 100%Mean 1.7
Median 1StDev 1.033
3. I can name 5 things that my friends like about me.Response N %
1-Not at all true 22 6%2-Not really true 37 11%
3-Sort of true 81 23%4-True 149 43%
5-Very True 57 16%Total 346 100%Mean 3.5
Median 4StDev 1.085
4. My family has fun together.Response N %
1-Not at all true 19 5%2-Not really true 37 10%
3-Sort of true 123 34%4-True 113 32%
5-Very True 65 18%Total 357 100%Mean 3.5
Median 3StDev 1.069
5. I have a lot of fun with my brother(s) or sister(s). (leave blank if you have none)Response N %
1-Not at all true 22 7%2-Not really true 50 15%
3-Sort of true 111 33%4-True 97 29%
5-Very True 55 16%Total 335 100%Mean 3.3
Median 3StDev 1 117
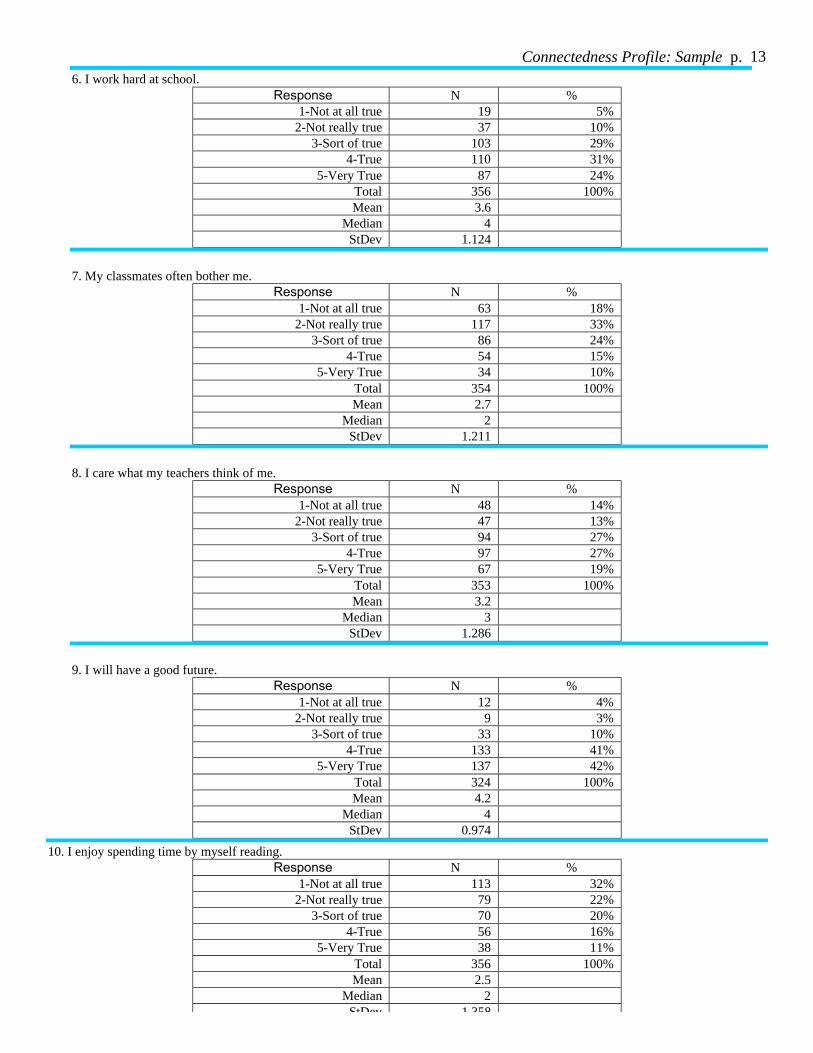
Connectedness Profile: Sample p. 136. I work hard at school.
Response N %1-Not at all true 19 5%
2-Not really true 37 10%3-Sort of true 103 29%
4-True 110 31%5-Very True 87 24%
Total 356 100%Mean 3.6
Median 4StDev 1.124
7. My classmates often bother me.Response N %
1-Not at all true 63 18%2-Not really true 117 33%
3-Sort of true 86 24%4-True 54 15%
5-Very True 34 10%Total 354 100%Mean 2.7
Median 2StDev 1.211
8. I care what my teachers think of me.Response N %
1-Not at all true 48 14%2-Not really true 47 13%
3-Sort of true 94 27%4-True 97 27%
5-Very True 67 19%Total 353 100%Mean 3.2
Median 3StDev 1.286
9. I will have a good future.Response N %
1-Not at all true 12 4%2-Not really true 9 3%
3-Sort of true 33 10%4-True 133 41%
5-Very True 137 42%Total 324 100%Mean 4.2
Median 4StDev 0.974
10. I enjoy spending time by myself reading.Response N %
1-Not at all true 113 32%2-Not really true 79 22%
3-Sort of true 70 20%4-True 56 16%
5-Very True 38 11%Total 356 100%Mean 2.5
Median 2StDev 1 358

Connectedness Profile: Sample p. 1411. I spend a lot of time with kids around where I live.
Response N %1-Not at all true 54 15%
2-Not really true 77 22%3-Sort of true 90 26%
4-True 76 22%5-Very True 54 15%
Total 351 100%Mean 3.0
Median 3StDev 1.293
12. I have friends I’m really close to and trust completely.Response N %
1-Not at all true 10 3%2-Not really true 23 6%
3-Sort of true 58 16%4-True 102 29%
5-Very True 162 46%Total 355 100%Mean 4.1
Median 4StDev 1.063
13. There is not much that is unique or special about me.Response N %
1-Not at all true 117 33%2-Not really true 116 33%
3-Sort of true 66 19%4-True 37 11%
5-Very True 14 4%Total 350 100%Mean 2.2
Median 2StDev 1.129
14. It is important that my parents trust me.Response N %
1-Not at all true 3 1%2-Not really true 10 3%
3-Sort of true 23 6%4-True 126 35%
5-Very True 193 54%Total 355 100%Mean 4.4
Median 5StDev 0.801
15. I feel close to my brother(s) or sister(s) (leave blank if you have none)Response N %
1-Not at all true 19 6%2-Not really true 42 13%
3-Sort of true 92 28%4-True 119 36%
5-Very True 57 17%Total 329 100%Mean 3.5
Median 4StDev 1 096
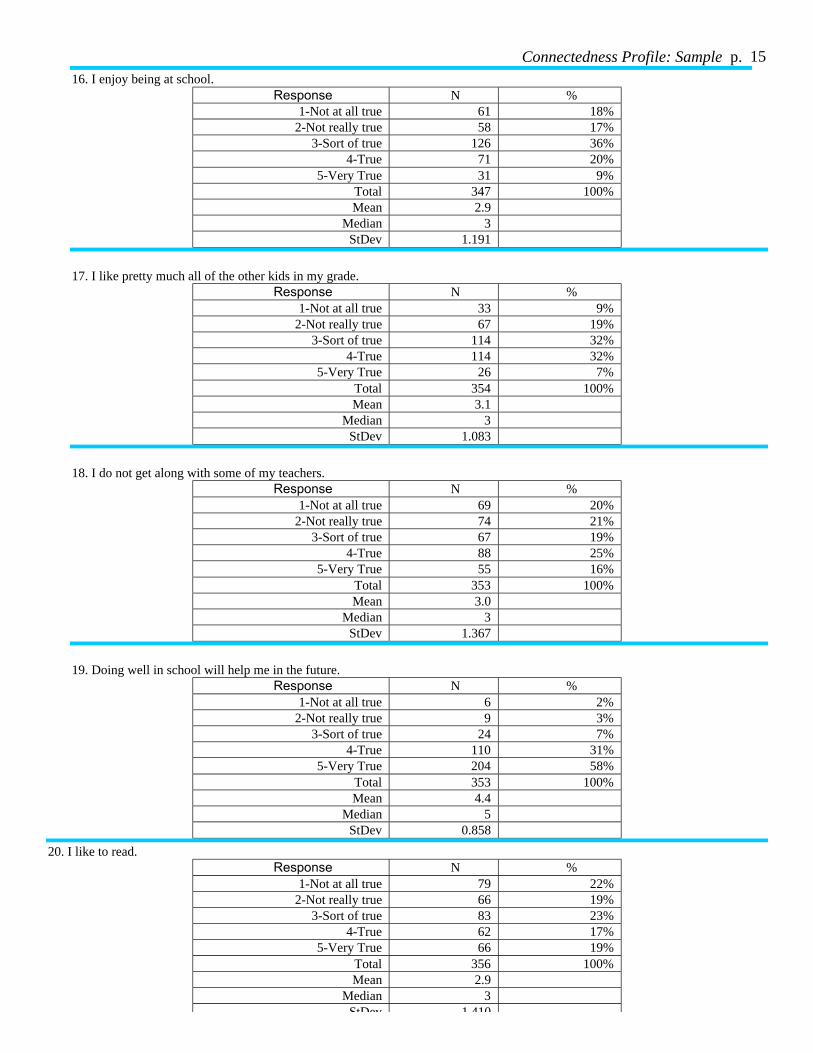
Connectedness Profile: Sample p. 1516. I enjoy being at school.
Response N %1-Not at all true 61 18%
2-Not really true 58 17%3-Sort of true 126 36%
4-True 71 20%5-Very True 31 9%
Total 347 100%Mean 2.9
Median 3StDev 1.191
17. I like pretty much all of the other kids in my grade.Response N %
1-Not at all true 33 9%2-Not really true 67 19%
3-Sort of true 114 32%4-True 114 32%
5-Very True 26 7%Total 354 100%Mean 3.1
Median 3StDev 1.083
18. I do not get along with some of my teachers.Response N %
1-Not at all true 69 20%2-Not really true 74 21%
3-Sort of true 67 19%4-True 88 25%
5-Very True 55 16%Total 353 100%Mean 3.0
Median 3StDev 1.367
19. Doing well in school will help me in the future.Response N %
1-Not at all true 6 2%2-Not really true 9 3%
3-Sort of true 24 7%4-True 110 31%
5-Very True 204 58%Total 353 100%Mean 4.4
Median 5StDev 0.858
20. I like to read.Response N %
1-Not at all true 79 22%2-Not really true 66 19%
3-Sort of true 83 23%4-True 62 17%
5-Very True 66 19%Total 356 100%Mean 2.9
Median 3StDev 1 410
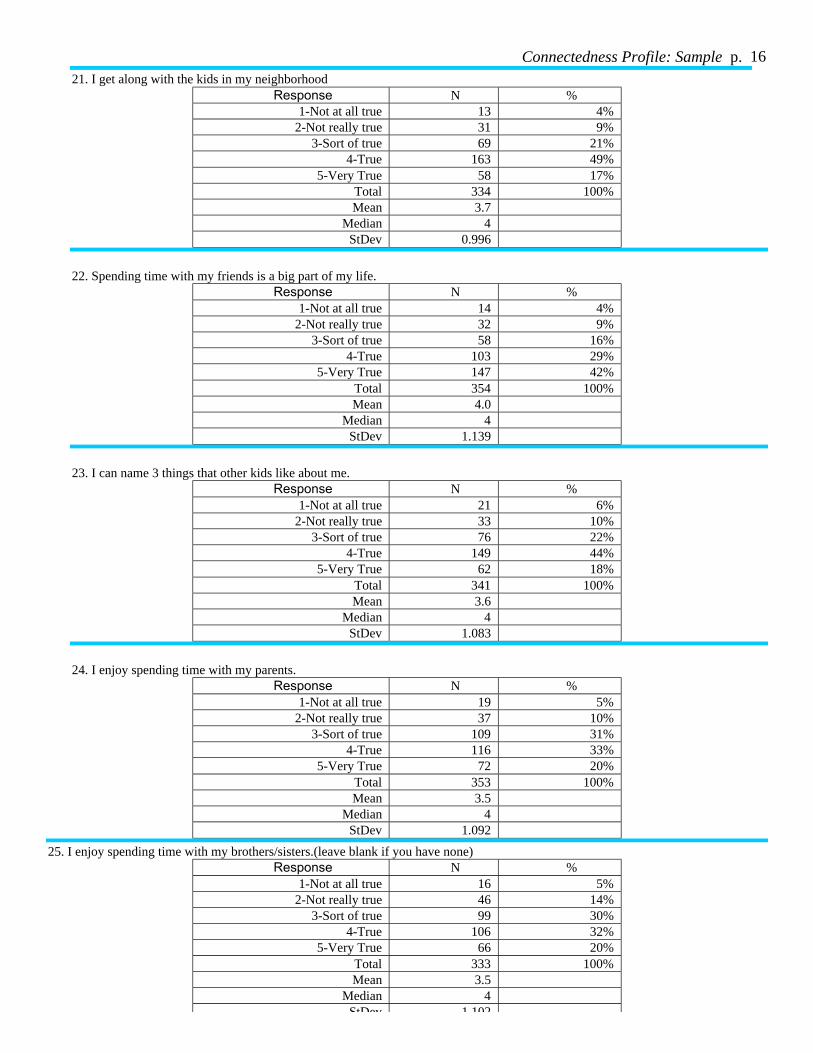
Connectedness Profile: Sample p. 1621. I get along with the kids in my neighborhood
Response N %1-Not at all true 13 4%
2-Not really true 31 9%3-Sort of true 69 21%
4-True 163 49%5-Very True 58 17%
Total 334 100%Mean 3.7
Median 4StDev 0.996
22. Spending time with my friends is a big part of my life.Response N %
1-Not at all true 14 4%2-Not really true 32 9%
3-Sort of true 58 16%4-True 103 29%
5-Very True 147 42%Total 354 100%Mean 4.0
Median 4StDev 1.139
23. I can name 3 things that other kids like about me.Response N %
1-Not at all true 21 6%2-Not really true 33 10%
3-Sort of true 76 22%4-True 149 44%
5-Very True 62 18%Total 341 100%Mean 3.6
Median 4StDev 1.083
24. I enjoy spending time with my parents.Response N %
1-Not at all true 19 5%2-Not really true 37 10%
3-Sort of true 109 31%4-True 116 33%
5-Very True 72 20%Total 353 100%Mean 3.5
Median 4StDev 1.092
25. I enjoy spending time with my brothers/sisters.(leave blank if you have none)Response N %
1-Not at all true 16 5%2-Not really true 46 14%
3-Sort of true 99 30%4-True 106 32%
5-Very True 66 20%Total 333 100%Mean 3.5
Median 4StDev 1 102

Connectedness Profile: Sample p. 1726. I get bored in school a lot.
Response N %1-Not at all true 29 8%
2-Not really true 58 17%3-Sort of true 98 28%
4-True 71 20%5-Very True 95 27%
Total 351 100%Mean 3.4
Median 3StDev 1.271
26. I like working with my classmates.Response N %
1-Not at all true 17 5%2-Not really true 39 11%
3-Sort of true 122 35%4-True 125 36%
5-Very True 47 13%Total 350 100%Mean 3.4
Median 3StDev 1.014
28. I want to be respected by my teachers.Response N %
1-Not at all true 15 4%2-Not really true 14 4%
3-Sort of true 47 13%4-True 157 45%
5-Very True 118 34%Total 351 100%Mean 4.0
Median 4StDev 1.009
29. I do things outside of school to prepare for my future.Response N %
1-Not at all true 26 7%2-Not really true 57 16%
3-Sort of true 79 23%4-True 112 32%
5-Very True 77 22%Total 351 100%Mean 3.4
Median 4StDev 1.208
30. I never read books in my free time.Response N %
1-Not at all true 114 32%2-Not really true 66 19%
3-Sort of true 49 14%4-True 55 16%
5-Very True 68 19%Total 352 100%Mean 2.7
Median 2StDev 1 527

Connectedness Profile: Sample p. 1831. I often spend time playing or doing things in my neighborhood.
Response N %1-Not at all true 34 10%
2-Not really true 63 18%3-Sort of true 88 25%
4-True 107 31%5-Very True 57 16%
Total 349 100%Mean 3.3
Median 3StDev 1.212
32. My friends and I talk openly with each other about personal things.Response N %
1-Not at all true 24 7%2-Not really true 53 15%
3-Sort of true 69 19%4-True 111 31%
5-Very True 98 28%Total 355 100%Mean 3.6
Median 4StDev 1.226
33. I really like who I am.Response N %
1-Not at all true 17 5%2-Not really true 29 8%
3-Sort of true 73 21%4-True 140 40%
5-Very True 93 26%Total 352 100%Mean 3.7
Median 4StDev 1.084
34. My parents and I disagree about many things.Response N %
1-Not at all true 29 8%2-Not really true 88 25%
3-Sort of true 91 26%4-True 80 23%
5-Very True 64 18%Total 352 100%Mean 3.2
Median 3StDev 1.228
35. I try to spend time with my brothers/sisters when I can.Response N %
1-Not at all true 27 8%2-Not really true 69 21%
3-Sort of true 96 29%4-True 87 26%
5-Very True 52 16%Total 331 100%Mean 3.2
Median 3StDev 1 178

Connectedness Profile: Sample p. 1936. I do well in school.
Response N %1-Not at all true 16 5%
2-Not really true 32 9%3-Sort of true 100 28%
4-True 127 36%5-Very True 80 23%
Total 355 100%Mean 3.6
Median 4StDev 1.067
37. I get along well with the other students in my classes.Response N %
1-Not at all true 9 3%2-Not really true 32 9%
3-Sort of true 106 30%4-True 166 47%
5-Very True 39 11%Total 352 100%Mean 3.6
Median 4StDev 0.898
38. I try to get along with my teachers.Response N %
1-Not at all true 13 4%2-Not really true 15 4%
3-Sort of true 78 22%4-True 176 50%
5-Very True 73 21%Total 355 100%Mean 3.8
Median 4StDev 0.940
39. I do lots of things in school to prepare for my future.Response N %
1-Not at all true 16 5%2-Not really true 46 13%
3-Sort of true 137 39%4-True 91 26%
5-Very True 57 16%Total 347 100%Mean 3.4
Median 3StDev 1.051
40. I often read when I have free time.Response N %
1-Not at all true 94 27%2-Not really true 90 26%
3-Sort of true 79 23%4-True 48 14%
5-Very True 40 11%Total 351 100%Mean 2.6
Median 2StDev 1 320

Connectedness Profile: Sample p. 2041. I hand out a lot with kids in my neighborhood.
Response N %1-Not at all true 41 12%
2-Not really true 81 24%3-Sort of true 91 27%
4-True 77 23%5-Very True 51 15%
Total 341 100%Mean 3.0
Median 3StDev 1.243
42. I spend as much time as I can with my friends.Response N %
1-Not at all true 9 3%2-Not really true 25 7%
3-Sort of true 72 21%4-True 110 31%
5-Very True 134 38%Total 350 100%Mean 4.0
Median 4StDev 1.052
43. I have special hobbies, skills, or talents.Response N %
1-Not at all true 12 3%2-Not really true 22 6%
3-Sort of true 59 17%4-True 139 40%
5-Very True 118 34%Total 350 100%Mean 3.9
Median 4StDev 1.032
44. My parents and I get along well.Response N %
1-Not at all true 22 6%2-Not really true 21 6%
3-Sort of true 83 24%4-True 135 39%
5-Very True 88 25%Total 349 100%Mean 3.7
Median 4StDev 1.102
45. I try to avoid being around my brother/sister(s).(leave blank if you have none)Response N %
1-Not at all true 113 35%2-Not really true 100 31%
3-Sort of true 63 19%4-True 37 11%
5-Very True 13 4%Total 326 100%Mean 2.2
Median 2StDev 1 149
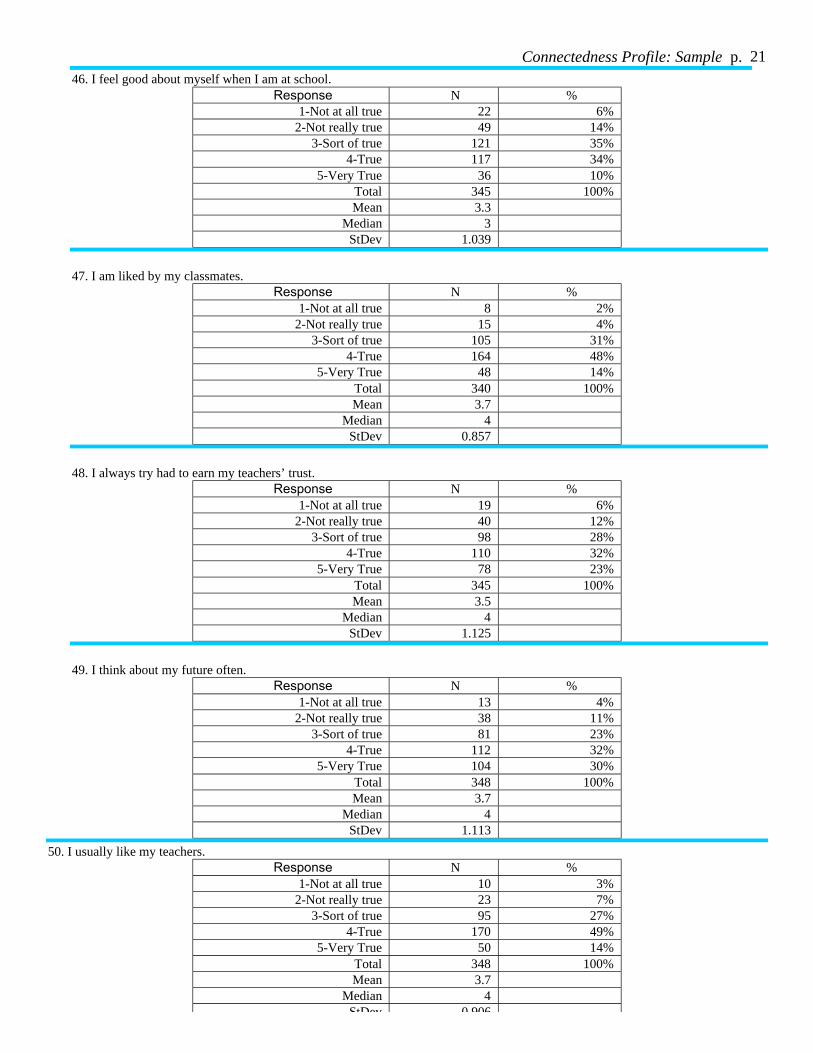
Connectedness Profile: Sample p. 2146. I feel good about myself when I am at school.
Response N %1-Not at all true 22 6%
2-Not really true 49 14%3-Sort of true 121 35%
4-True 117 34%5-Very True 36 10%
Total 345 100%Mean 3.3
Median 3StDev 1.039
47. I am liked by my classmates.Response N %
1-Not at all true 8 2%2-Not really true 15 4%
3-Sort of true 105 31%4-True 164 48%
5-Very True 48 14%Total 340 100%Mean 3.7
Median 4StDev 0.857
48. I always try had to earn my teachers’ trust.Response N %
1-Not at all true 19 6%2-Not really true 40 12%
3-Sort of true 98 28%4-True 110 32%
5-Very True 78 23%Total 345 100%Mean 3.5
Median 4StDev 1.125
49. I think about my future often.Response N %
1-Not at all true 13 4%2-Not really true 38 11%
3-Sort of true 81 23%4-True 112 32%
5-Very True 104 30%Total 348 100%Mean 3.7
Median 4StDev 1.113
50. I usually like my teachers.Response N %
1-Not at all true 10 3%2-Not really true 23 7%
3-Sort of true 95 27%4-True 170 49%
5-Very True 50 14%Total 348 100%Mean 3.7
Median 4StDev 0 906

Connectedness Profile: Sample p. 2251. My neighborhood is boring.
Response N %1-Not at all true 57 17%
2-Not really true 41 12%3-Sort of true 77 22%
4-True 82 24%5-Very True 88 26%
Total 345 100%Mean 3.3
Median 3StDev 1.398
52. My friends and I spend a lot of time talking about things.Response N %
1-Not at all true 13 4%2-Not really true 35 10%
3-Sort of true 75 22%4-True 119 34%
5-Very True 105 30%Total 347 100%Mean 3.8
Median 4StDev 1.100
53. I have unique interests or skills that make me interesting.Response N %
1-Not at all true 12 3%2-Not really true 39 11%
3-Sort of true 80 23%4-True 134 39%
5-Very True 82 24%Total 347 100%Mean 3.7
Median 4StDev 1.061
54. I care about my parents very much.Response N %
1-Not at all true 5 1%2-Not really true 7 2%
3-Sort of true 30 9%4-True 113 33%
5-Very True 190 55%Total 345 100%Mean 4.4
Median 5StDev 0.841
55. What I do now will not affect my future.Response N %
1-Not at all true 153 46%2-Not really true 44 13%
3-Sort of true 49 15%4-True 50 15%
5-Very True 35 11%Total 331 100%Mean 2.3
Median 2StDev 1 442
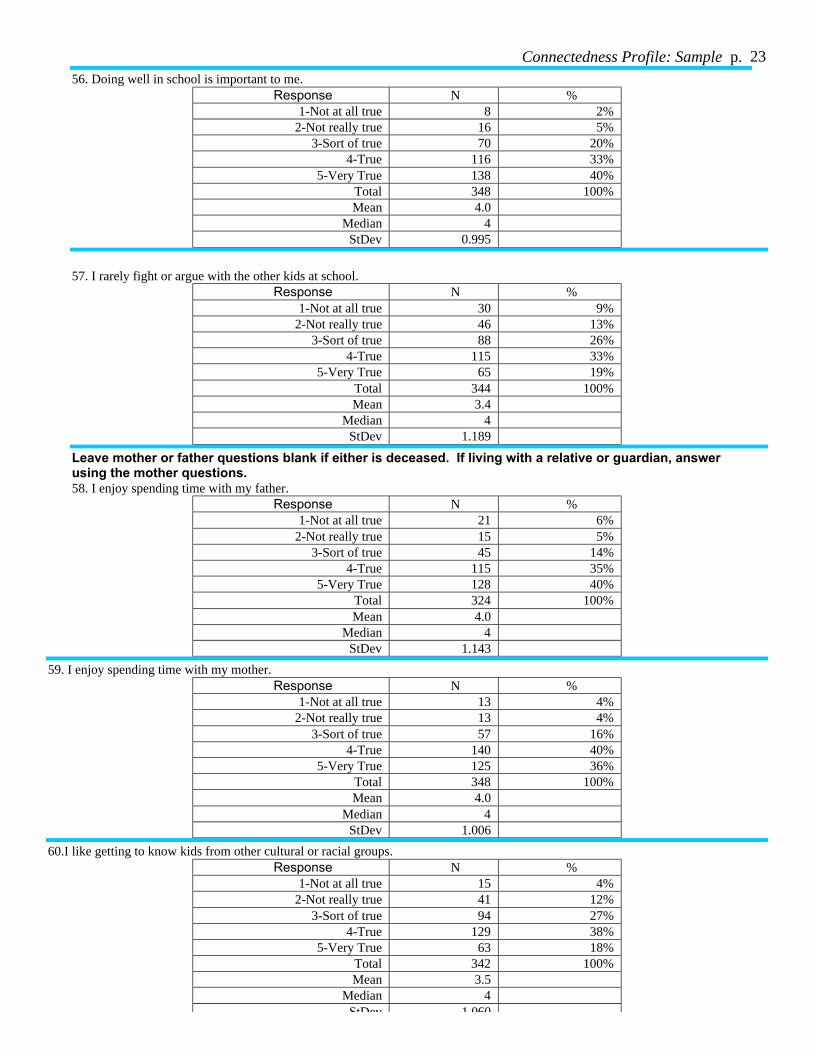
Connectedness Profile: Sample p. 2356. Doing well in school is important to me.
Response N %1-Not at all true 8 2%
2-Not really true 16 5%3-Sort of true 70 20%
4-True 116 33%5-Very True 138 40%
Total 348 100%Mean 4.0
Median 4StDev 0.995
57. I rarely fight or argue with the other kids at school.Response N %
1-Not at all true 30 9%2-Not really true 46 13%
3-Sort of true 88 26%4-True 115 33%
5-Very True 65 19%Total 344 100%Mean 3.4
Median 4StDev 1.189
Leave mother or father questions blank if either is deceased. If living with a relative or guardian, answerusing the mother questions.58. I enjoy spending time with my father.
Response N %1-Not at all true 21 6%
2-Not really true 15 5%3-Sort of true 45 14%
4-True 115 35%5-Very True 128 40%
Total 324 100%Mean 4.0
Median 4StDev 1.143
59. I enjoy spending time with my mother.Response N %
1-Not at all true 13 4%2-Not really true 13 4%
3-Sort of true 57 16%4-True 140 40%
5-Very True 125 36%Total 348 100%Mean 4.0
Median 4StDev 1.006
60.I like getting to know kids from other cultural or racial groups.Response N %
1-Not at all true 15 4%2-Not really true 41 12%
3-Sort of true 94 27%4-True 129 38%
5-Very True 63 18%Total 342 100%Mean 3.5
Median 4StDev 1 060

Connectedness Profile: Sample p. 2461. I spend a lot of time with a boyfriend/girlfriend.
Response N %1-Not at all true 61 19%
2-Not really true 51 16%3-Sort of true 43 14%
4-True 63 20%5-Very True 98 31%
Total 316 100%Mean 3.3
Median 4StDev 1.519
62. My religion is very important to me.Response N %
1-Not at all true 63 18%2-Not really true 56 16%
3-Sort of true 51 15%4-True 75 22%
5-Very True 100 29%Total 345 100%Mean 3.3
Median 4StDev 1.484
63. My mother and I are pretty close.Response N %
1-Not at all true 17 5%2-Not really true 24 7%
3-Sort of true 72 21%4-True 130 38%
5-Very True 102 30%Total 345 100%Mean 3.8
Median 4StDev 1.091
64. My father and I are pretty close.Response N %
1-Not at all true 25 8%2-Not really true 29 9%
3-Sort of true 69 21%4-True 111 34%
5-Very True 88 27%Total 322 100%Mean 3.6
Median 4StDev 1.194
65. I would like to know more people from different cultural groups.Response N %
1-Not at all true 27 8%2-Not really true 64 19%
3-Sort of true 97 29%4-True 99 29%
5-Very True 49 15%Total 336 100%Mean 3.2
Median 3StDev 1.157

Connectedness Profile: Sample p. 2566. I have a boyfriend/girlfriend who is very important to me.
Response N %1-Not at all true 83 27%
2-Not really true 28 9%3-Sort of true 33 11%
4-True 54 17%5-Very True 113 36%
Total 311 100%Mean 3.3
Median 4StDev 1.648
67. My father cares a lot about me.Response N %
1-Not at all true 19 6%2-Not really true 9 3%
3-Sort of true 22 7%4-True 87 26%
5-Very True 192 58%Total 329 100%Mean 4.3
Median 5StDev 1.095
68. My mother cares a lot about me.Response N %
1-Not at all true 6 2%2-Not really true 7 2%
3-Sort of true 18 5%4-True 90 26%
5-Very True 224 65%Total 345 100%Mean 4.5
Median 5StDev 0.829
69.I like getting to know people who are culturally different from me.Response N %
1-Not at all true 23 7%2-Not really true 51 15%
3-Sort of true 92 27%4-True 112 33%
5-Very True 60 18%Total 338 100%Mean 3.4
Median 4StDev 1.144
70. I don’t really care about having a boyfriend/girlfriend.Response N %
1-Not at all true 137 40%2-Not really true 75 22%
3-Sort of true 70 20%4-True 33 10%
5-Very True 27 8%Total 342 100%Mean 2.2
Median 2StDev 1 285

Connectedness Profile: Sample p. 2671. I attend a religious service (like at a church, synagogue, or mosque) regularly.
Response N %1-Not at all true 151 44%
2-Not really true 36 10%3-Sort of true 43 12%
4-True 46 13%5-Very True 69 20%
Total 345 100%Mean 2.6
Median 2StDev 1.611
72. My father and I argue a lot.Response N %
1-Not at all true 109 34%2-Not really true 103 33%
3-Sort of true 45 14%4-True 31 10%
5-Very True 28 9%Total 316 100%Mean 2.3
Median 2StDev 1.271
73. My mother and I argue a lot.Response N %
1-Not at all true 95 28%2-Not really true 101 29%
3-Sort of true 70 20%4-True 44 13%
5-Very True 35 10%Total 345 100%Mean 2.5
Median 2StDev 1.292
74. I share my worries and concerns with a boyfriend/girlfriend.Response N %
1-Not at all true 91 29%2-Not really true 51 16%
3-Sort of true 48 15%4-True 57 18%
5-Very True 69 22%Total 316 100%Mean 2.9
Median 3StDev 1.536
75. I am a religious or faithful person.Response N %
1-Not at all true 85 25%2-Not really true 54 16%
3-Sort of true 56 17%4-True 67 20%
5-Very True 76 22%Total 338 100%Mean 3.0
Median 3StDev 1 507

Connectedness Profile: Sample p. 2776. I spend as much time as I can with a boyfriend/girlfriend.
Response N %1-Not at all true 70 23%
2-Not really true 36 12%3-Sort of true 36 12%
4-True 67 22%5-Very True 98 32%
Total 307 100%Mean 3.3
Median 4StDev 1.566
77. I talk with my mother about very personal things and my problems.Response N %
1-Not at all true 81 24%2-Not really true 83 24%
3-Sort of true 70 20%4-True 50 15%
5-Very True 59 17%Total 343 100%Mean 2.8
Median 3StDev 1.406
78. I talk with my father about very personal things and my problems.Response N %
1-Not at all true 112 35%2-Not really true 81 25%
3-Sort of true 63 20%4-True 33 10%
5-Very True 29 9%Total 318 100%Mean 2.3
Median 2StDev 1.298

Connectedness Profile: Sample p. 28References
Ainsworth, M. S. (1989). Attachments beyond infancy. American Psychologist, 44(4), 709-716.Anant, S. S. (1969). A cross-cultural study of belongingness, anxiety, and self-sufficiency. Acta Psychologia, 31, 4, 385-
393.Armsden, G. C., McCauley, E., Greenberg, M. T., Burke, P. M., & Mitchell, J. R. (1990). Parent and peer attachment in
early adolescent depression. Journal of Abnormal Child Psychology, 18, 683-697.Asakawa, K., & Csikszentmihalyi, M. (2000). Feelings of connectedness and internalization of values in Asian American
adolescents. Journal of Youth and Adolescence, 29(2), 121-147.Baumeister, R. F., & Leary, M. R. (1995). The need to belong: Desire for interpersonal attachments as a fundamental
human motivation. Psychological Bulletin,117(3), 497-529.Bentler, P. M. & Wu, E. J. C. (1995). EQS: Structural equations program manual. Encino, CA: Multivariate Software,
Inc.Blos, P. (1962). On adolescence: A psychoanalytic perspective. New York: Free Press.Bonny, A. E., Britto, M. T., Klostermann, B. K., Hornung, R. W, & Slap, G.B. (2000). School disconnectedness:
Identifying adolescents at risk. Pediatrics, 106(5), 1017-1011.Bonny, A. E., Britto, M. T., Klostermann, B. K., & Slap, G. B. (1999). Factors associated with school connectedness
during adolescence. Journal of Adolescence Health, 24(2), 108.Buhrmester, D. (1990). Intimacy of friendship, interpersonal competence, and adjustment during preadolescence and
adolescence. Child Development, 61, 1101-1111.Bush, K. R. (2000). Separateness and connectedness in the parent-adolescent relationship as predictors of adolescent self-
esteem in US and Chinese samples. Marriage and Family Review, 30(1/2), 153-178.Campbell, D. T., & Fiske, D. W. (1959). Convergent and discriminant validation by the multitrait-multimethod matrix.
Psychological Bulletin, 56(2), 81-105.Chodorow, N. (1978). The reproduction of mothering: Psychoanalysis and the reproduction of mothering. Berkeley: The
University of California Press.Cooper, C. R. (1999). Multiple selves, multiple worlds: Cultural perspectives on individuality and connectedness in
adolescent development. In A. S. Masten (Ed.) Cultural Processes in Child Development: The MinnesotaSymposia on Child Psychology (Vol. 29, pp. 25-57). Mahwah, NJ: Lawrence Erlbaum.
Dubois, D. L., Felner, R. D., Brand, S., Phillips, R. S. C., & Lease, M. A. (1996). Early adolescent self-esteem: Adevelopmental-ecological framework and assessment strategy. Journal of Research on Adolescence, 6(4), 543-579.
Erikson, E. H. (1950). Childhood and society. New York: W. W. Norton.Feral, C. H. (1999). Connectedness and development--A theory. Paper presented at the Annual Convention of the
National Association of School Psychologists, New Orleans, LA.Gilligan, C. (1982). In a different voice: Psychological theory and women's development. Cambridge: Harvard University
Press.Grotevant, H. D., & Cooper, C. R. (1998). Individuality and connectedness in adolescent development: Review and
prospects for research on identity, relationships, and context. In E. Skoe & A. von der Lippe (Eds.), Personalitydevelopment in adolescence: A cross national and life span perspective (pp. 3-37). New York: Routledge.
Hagerty, B. M., Lynch-Sauer, J., Patusky, K. L., & Bouwsema, M. (1993). An emerging theory of human relatedness.Journal of Nursing Scholarship, 25(4), 291-296.
Harter, S. (1999). The construction of the self: A developmental perspective. New York: Guilford.Harter, S., Waters, P. L., Pettitt, N. W., Kofkin, J., & Jordan, J. (1997). Autonomy and connectedness dimensions of
relationship styles in men and women. Journal of Social and Personal Relationships, 14(2), 147-164.Heppner, P. P., Kivlighan, D. M., & Wampold, B. E. (1999). Research design in counseling (2nd Edition). Belmont, MA:
Brooks/Cole.Hendry, L. B., & Reid, M. (2000). Social relationships and health: The meaning of social "connectedness" and how it
related to health concerns for rural Scottish adolescents. Journal of Adolescence, 23(6), 705-719.Hirschi, T. (1969). Causes of delinquency. Berkeley, CA: University of California Press.Hodges, E. V. E., Finnegan, R. A., & Perry, D. G. (1999). Skewed autonomy-relatedness in preadolescents' conceptions of
their relationships with mother, father, and best friend. Developmental Psychology, 35(3), 737-748.Jacobson, K. C., & Rowe, D. C. (1999). Genetic and environmental influences on the relationships between family
connectedness, school connectedness, and adolescent depressed mood: Sex differences. DevelopmentalPsychology, 35(4), 926-939.
Jessor, R. (1993). Successful adolescent development among youth in high-risk settings. American Psychologist, 48, 117-126.

Connectedness Profile: Sample p. 29Joo, E., & Han, B. (2000). An investigation of the characteristics of "classroom alienated" middle school students in
Korea. Asia Pacific Education Review, 1(1), 123-128.Jordan, J. V., Kaplan, A. G., Miller, J. B., Stiver, I., & Surrey, J. (1991). Women's growth in connection: Writings from
the stone center. New York: Guilford Press.Karcher, M. J. (1999). The Hemingway—Measure of Adolescent Connectedness: A manual for interpretation and
scoring. Unpublished manual, University of Wisconsin-Madison.Karcher, M. J. (2001, August). Measuring adolescent connectedness: Four validation studies. Poster presented at the
annual convention of the American Psychological Association, San Francisco, CA.Karcher, M.J., Davis, C., & Powell, B. (2002). Developmental mentoring in the schools: Testing connectedness as a
mediating variable in the promotion of academic achievement. The School Community Journal, 12(2), 36-52.Karcher, M. J, & Lee, Y. (2002). Connectedness among Taiwanese middle school students: A validation study of the
Hemingway Measure of Adolescent Connectedness. Asia Pacific Education Review, 3(1), 95-114.Karcher, M. J. (2002). The cycle of violence and disconnection among rural middle school students: Teacher
disconnection as a consequence of violence. The Journal of School Violence, 1(1), 35-51.Kohut, H. (1977). Restoration of the self. New York: International Universities Press.Kuperminc, G. P., Blatt, S. J., & Leadbeater, B. J. (1997). Relatedness, self-definition, and early adolescent adjustment.
Cognitive Therapy and Research, 21(3), 301-320.Lang-Takac, E., & Osterweil, Z, (1992). Separateness and connectedness: Differences between genders. Sex Roles, 27,
277-289.Lee, R. M., & Davis, C. (2000). Cultural orientation, past multicultural experience, and a sense of belonging on campus
for Asian American college students. Journal of College Student Development, 41(1), 110-115.Lee, R. M., Keough, K. A., & Seagal, J. D. (1999). Belongingness, appraisal of campus climate, and perceived life stress
in college women and men. Unpublished manuscript. University of Minnesota-Twin Cities.Lee, R. M., & Robbins, S. B. (1995). Measuring belongingness: The Social Connectedness and the Social Assurance
Scales. Journal of Counseling Psychology, 42(2), 232-241.Lee, R. M., & Robbins, S. B. (1998). The relationship between social connectedness and anxiety, self-esteem, and social
identity. Journal of Counseling Psychology, 45(3), 338-345.Markus, H. R., & Kitayama, S. (1991). Culture and the self: Implications for cognition, emotion, and motivation.
Psychological Review, 98(2), 224-253.Maslow, A. H. (1968). Toward a psychology of being. Princeton, NJ: Van Nostrand.Muuss, R. E. (1996). Theories of adolescence (6th Ed.). New York: McGraw Hill.Nakkula, M., & Selman, R. (1991). How people "treat" each other: Pair therapy as a context for the development of
interpersonal ethics. In J. L. Gewirtz and W. M. Kurtines (Ed.), Handbook of moral behavior and development,Vol. 3: Application (pp. 179-211). Hillsdale, NJ: Lawrence Erlbaum.
Resnick, M. D., Harris, L. J., & Blum, R. W. (1993). The impact of caring and connectedness on adolescent health andwell-being. Journal of Paediatrics & Child Health, 29(Sup 1), S3-S9.
Robinson, J. P., Shaver, P. R., & Wrightsman, L. S. (1991). Criteria for scale selection and evaluation. In J. P. Robinson,P. R. Shaver, & L. S. Wrightsman (Eds.), Measures of personality and social psychological attitudes (pp. 1-14).San Diego: Academic Press.
Roth, J., & Brooks-Gunn, J. (2000). What do adolescents need for healthy development: Implications for youth policy.Social Policy Report: Society for Research in Child Development, 14(1), 1-19.
Rothbaum, F., Pott, M., Azuma, H., Miyake, K., & Weisz, J. (2000). The development of close relationships in Japan andthe United States: Paths of symbiotic harmony and generative tension. Child Development, 71(5), 1121-1142.
Ryan, R. M., Stiller, J. D., & Lynch, J. H. (1994). Representations of relationships to teachers, parents, and friends aspredictors of academic motivation and self-esteem. Journal of Early Adolescence, 14, 226-249.
Stewart, S. M., Bond, M. H., Deeds, O., & Chung, S. F. (1999). Intergenerational patterns of values and autonomyexpectations in cultures of relatedness and separateness. Journal of Cross-Cultural Psychology, 30(5), 575-593.
Tafarodi, R. W., & Lang, J. M. (1999). Self-esteem and the cultural trade-off. Journal of Cross-Cultural Psychology,30(5). 620-638.
Tolman, A. E., Diekmann, K. A., & McCartney, K. (1989). Social connectedness and mothering: Effects of maternalemployment and maternal absence. Journal of Personality & Social Psychology, 56(6), 942-949.
Youniss, J., & Ketterlinus, R. D. (1987). Communication and connectedness in mother- and father-adolescentrelationships. Journal of Youth and Adolescence, 16(3). 265-291.
Related Documents