The Health Literacy of America’s Adults Results From the 2003 National Assessment of Adult Literacy U.S. Department of Education NCES 2006–483

Welcome message from author
This document is posted to help you gain knowledge. Please leave a comment to let me know what you think about it! Share it to your friends and learn new things together.
Transcript
The Health Literacy ofAmerica’s Adults
Results From the 2003
National Assessment
of Adult Literacy
U.S. Department of Education
NCES 2006–483

The Health Literacy ofAmerica’s Adults
Results From the 2003
National Assessment
of Adult Literacy
SSeepptteemmbbeerr 22000066
Mark KutnerElizabeth GreenbergYing JinChristine PaulsenAmerican Institutes for Research
Sheida WhiteProject OfficerNational Center for Education Statistics
U.S. Department of Education
NCES 2006–483
UU..SS.. DDeeppaarrttmmeenntt ooff EEdduuccaattiioonnMargaret SpellingsSecretary
IInnssttiittuuttee ooff EEdduuccaattiioonn SScciieenncceessGrover J. WhitehurstDirector
NNaattiioonnaall CCeenntteerr ffoorr EEdduuccaattiioonn SSttaattiissttiiccssMark SchneiderCommissioner
The National Center for Education Statistics (NCES) is the primary federal entity for collecting, analyzing, and reporting datarelated to education in the United States and other nations. It fulfills a congressional mandate to collect, collate, analyze, andreport full and complete statistics on the condition of education in the United States; conduct and publish reports and spe-cialized analyses of the meaning and significance of such statistics; assist state and local education agencies in improvingtheir statistical systems; and review and report on education activities in foreign countries.
NCES activities are designed to address high-priority education data needs; provide consistent, reliable, complete, and accu-rate indicators of education status and trends; and report timely, useful, and high-quality data to the U.S. Department ofEducation, the Congress, the states, other education policymakers, practitioners, data users, and the general public. Unlessspecifically noted, all information contained herein is in the public domain.
We strive to make our products available in a variety of formats and in language that is appropriate to a variety of audiences.You, as our customer, are the best judge of our success in communicating information effectively. If you have any commentsor suggestions about this or any other NCES product or report, we would like to hear from you. Please direct your commentsto
National Center for Education StatisticsInstitute of Education SciencesU.S. Department of Education1990 K Street NWWashington, DC 20006–5651
September 2006
The NCES World Wide Web Home Page address is http://nces.ed.gov.The NCES World Wide Web Electronic Catalog is http://nces.ed.gov/pubsearch.
SSuuggggeesstteedd CCiittaattiioonn
Kutner, M., Greenberg, E., Jin, Y., and Paulsen, C. (2006). The Health Literacy of America’s Adults: Results From the 2003 NationalAssessment of Adult Literacy (NCES 2006–483). U.S. Department of Education. Washington, DC: National Center for EducationStatistics.
FFoorr oorrddeerriinngg iinnffoorrmmaattiioonn oonn tthhiiss rreeppoorrtt,, wwrriittee ttoo
U.S. Department of EducationED PubsP.O. Box 1398Jessup, MD 20794–1398
or call toll free 1–877–4ED–Pubs or order online at http://www.edpubs.org.
CCoonntteenntt CCoonnttaaccttSheida White(202) [email protected]
Executive Summary
The 2003 National Assessment of AdultLiteracy (NAAL) assessed the English liter-acy of adults in the United States. Included
in the assessment were items designed to measurethe health literacy of America’s adults. The assess-ment was administered to more than 19,000 adults(ages 16 and older) in households or prisons. Unlikeindirect measures of literacy, which rely on self-reports and other subjective evaluations, the assess-ment measured literacy directly through tasks com-pleted by adults.
The health literacy scale and health literacy taskswere guided by the definition of health literacy usedby the Institute of Medicine and Healthy People2010 (a set of national disease prevention and healthpromotion objectives led by the U.S. Department ofHealth and Human Services).This definition statesthat health literacy is:
The degree to which individuals have thecapacity to obtain, process, and understandbasic health information and services needed tomake appropriate health decisions. (HHS 2000and Institute of Medicine 2004)
These health literacy tasks represent a range of liter-acy activities that adults are likely to face in theirdaily lives. Health literacy is important for all adults.Adults may read an article in a magazine or a pam-phlet in their doctor’s office about preventive healthpractices; they may need to fill a prescription, select
iii
Literacy Levels
Demographic Characteristics
and Health Literacy
Overall Health, Health
Insurance Coverage, and
Sources of Information About
Health Issues
and buy an over-the-counter medication, or under-stand health insurance forms. Parents must managetheir children’s health care, including getting themimmunized, taking them for physicals, and havingtheir illnesses treated. Adult children are often facedwith the responsibility of managing their own par-ents’ health care. Older adults must make decisionsabout Medicare supplementary insurance and pre-scription drug benefits. Adults without medicalinsurance may need to determine whether they, theirchildren, or their parents qualify for any public pro-grams. Adults living in older houses and apartmentsmay need to make decisions about the dangers oflead paint or asbestos. All these activities require, orare facilitated by, the ability to read and understandwritten and printed information.
The health tasks for the 2003 assessment were devel-oped to fit into the NAAL’s prose, document, orquantitative scales but were distinguished from theother tasks on those scales by their health content.
■ The prose literacy scale measured the knowl-edge and skills needed to search, comprehend,and use information from texts that wereorganized in sentences or paragraphs.
■ The document literacy scale measured theknowledge and skills needed to search, compre-hend, and use information from noncontinuoustexts in various formats.
■ The quantitative scale measured the knowledgeand skills needed to identify and perform com-putations using numbers embedded in printedmaterials.
The NAAL health tasks included on the assessmentwere distributed across three domains of health andhealth care information and services: clinical, preven-tion, and navigation of the health system.
This report describes how health literacy variesacross the population and where adults with differentlevels of health literacy obtain information abouthealth issues.The analyses in this report examine dif-ferences related to literacy that are based on self-reported background characteristics among groupsin 2003. This report discusses only findings that arestatistically significant at the .05 level.
Literacy Levels
The National Research Council’s Board on Testingand Assessment (BOTA) Committee on PerformanceLevels for Adult Literacy recommended a set of per-formance levels for the prose, document, and quanti-tative scales.The Committee on Performance Levelsfor Adult Literacy recommended that new literacylevels be established for the 2003 assessment instead ofusing the same reporting levels used for the 1992National Adult Literacy Survey (Hauser et al. 2005).Differences between the 1992 and 2003 levels are dis-cussed by the Committee. Drawing on the commit-tee’s recommendations, the U.S. Department ofEducation decided to report the assessment results byusing four literacy levels for each scale: Below Basic,Basic, Intermediate, and Proficient.
The health literacy tasks were analyzed together andwere used to create a health literacy scale. Eachhealth literacy task was also classified as a prose, doc-ument, or quantitative task and was included on oneof those scales.
The BOTA Committee did not recommend per-formance levels for the health scale. Because everyhealth literacy task was included on the prose, docu-ment, or quantitative scale in addition to the healthscale, it was mapped to a performance level (BelowBasic, Basic, Intermediate, or Proficient) on one of thosescales.Tasks were mapped to each scale at the point onthe scale where an adult would have a 67 percent
iv
The Health Literacy of America’s Adults
probability of doing the task correctly. Cut-points forthe performance levels on the health scale were set sothat each task was classified into the same category onthe health scale as on the other scale (prose,document,or quantitative) with which the task was associated.
Demographic Characteristics and HealthLiteracy
■ The majority of adults (53 percent) hadIntermediate health literacy. An additional12 percent of adults had Proficient health litera-cy.Among the remaining adults, 22 percent hadBasic health literacy, and 14 percent had BelowBasic health literacy.
■ Women had higher average health literacy thanmen; 16 percent of men had Below Basic healthliteracy compared with 12 percent of women.
■ White and Asian/Pacific Islander adults hadhigher average health literacy than Black,Hispanic, American Indian/Alaska Native, andMultiracial adults. Hispanic adults had loweraverage health literacy than adults in any otherracial/ethnic group.
■ Adults who spoke only English before startingschool had higher average health literacy thanadults who spoke other languages alone orother languages and English.
■ Adults who were ages 65 and older had loweraverage health literacy than adults in youngerage groups. The percentage of adults in the 65and older age group who had Intermediate andProficient health literacy was lower than the com-parable percentage of adults in other age groups.
■ Starting with adults who had graduated fromhigh school or obtained a GED, average healthliteracy increased with each higher level of edu-cational attainment. Some 49 percent of adultswho had never attended or did not complete
high school had Below Basic health literacy,compared with 15 percent of adults who endedtheir education with a high school diploma and3 percent of adults with a bachelor’s degree.
■ Adults living below the poverty level had loweraverage health literacy than adults living abovethe poverty threshold.
Overall Health, Health Insurance Coverage,and Sources of Information About HealthIssues
■ At every increasing level of self-reported over-all health, adults had higher average health liter-acy than adults in the next lower level.
■ Adults who received health insurance coveragethrough their employer or a family member’semployer or through the military or who pri-vately purchased health insurance had higheraverage health literacy than adults whoreceived Medicare or Medicaid and adults whohad no health insurance coverage. Amongadults who received Medicare or Medicaid,27 percent and 30 percent, respectively, hadBelow Basic health literacy.
■ A lower percentage of adults with Below Basichealth literacy than adults with Basic,Intermediate, or Proficient health literacy gotinformation about health issues from any writ-ten sources, including newspapers, magazines,books or brochures, and the Internet. A higherpercentage of adults with Below Basic and Basichealth literacy than adults with Intermediate andProficient health literacy received a lot of infor-mation about health issues from radio and tele-vision.With each increasing level of health lit-eracy, a higher percentage of adults got infor-mation about health issues from family mem-bers, friends, or coworkers.
v
Executive Summary

Acknowledgments
The National Assessment of Adult Literacy(NAAL) is a complex project whose suc-cessful completion is due to the work of
countless individuals from many organizations.We,at the American Institutes for Research (AIR),especially want to thank the staff at the NationalCenter for Education Statistics (NCES) who havesupported the project. Sheida White, the NAALproject officer, has provided substantive guidanceand direction to all aspects of the assessment. Herintellectual contributions are reflected throughoutthe assessment, analyses, and report. AndrewKolstad, the project’s senior technical advisor andproject officer of the 1992 National Adult LiteracySurvey, provided both technical guidance and aninstitutional memory throughout the project andhelped us reflect on all statistical and technicalissues. Steven Gorman also played a key role inguiding all aspects of the assessment, especially thoserelated to the statistical aspects of the assessment.
Peggy Carr, NCES Associate Commissioner forAssessment, provided the project and team memberswith ongoing support, recommendations, andencouragement.We are very grateful for her leader-ship.William Tirre and Arnold Goldstein of NCESplayed invaluable roles in reviewing the report andguiding it through the review process. Their efforts are very much appreciated. We also thankMarilyn Seastrom, NCES Chief Statistician,and members of the NCES/Education Statistics
vii
Services Institute(ESSI) Technical Review Team,Kevin Bromer, LaTisha Jones, Alison Slade, AparnaSundaram, and Jed Tank, who reviewed the report andmade many suggestions that have improved the finalproduct. Other government reviewers who providedthoughtful comments are Tom Snyder and John Wirt,from NCES, and Cheryl Keenan,Director,Division ofAdult Education and Literacy in the Office ofVocational and Adult Education (OVAE), and RicardoHernandez of OVAE. We also want to thank JalehSoroui of the ESSI for her ongoing substantive contri-butions to the NAAL.Young Chun, Linda Shafer, andAlan Vanneman of National Assessment of EducationalProgress (NAEP)-ESSI reviewed the report and provided important comments and suggestions.
Cynthia Baur, Office of Disease Prevention andHealth Promotion, Office of Public Health andScience, Office of the Secretary of the Departmentof Health and Human Services, played a pivotal rolein conceptualizing, planning, designing, and report-ing on the health literacy component of NAAL.TheNAAL health literacy component is based on herintellectual contributions and perseverance. RonPugsley, former Director of the Division of AdultEducation and Literacy in the Office of Vocationaland Adult Education, played a key role in the earlyplanning stages of the health literacy report. DanSherman from AIR also provided invaluable guid-ance to the health literacy analyses and report.
Our colleagues at Westat, Inc., planned, developed,and implemented the complex sampling and weight-ing necessary for the successful completion of theassessment. Westat also planned and carried out allphases of the data collection, and was responsible fortraining and managing a group of 400 field data col-lection staff.This study could not have been success-ful without the outstanding work of the Westat proj-ect director, Martha Berlin, and the Westat team,including Michelle Amsbary, Leyla Mohadjer, andJacquie Hogan.
Many staff at AIR made substantial contributions tothe health literacy report, often under tight timelines.Stéphane Baldi and Justin Baer, senior members ofthe AIR NAAL team, provided invaluable substan-tive and technical contributions throughout theduration of the project. Bridget Boyle and Yung-chen Hsu conducted analyses for the authors when-ever requested. Rachel Greenberg and ElizabethMoore provided ongoing research and technical sup-port in developing the assessment, preparing the dataand text, and shepherding the report through therevision and review process.
We are especially appreciative of the skills and con-tributions by Holly Baker, who edited the reportthrough multiple revisions, and by Heather Block,who designed and redesigned the report. We aregrateful for their dedication and in awe of their abil-ity to work under often seemingly impossible timeconstraints.Also, Janan Musa provided the AIR teamwith invaluable guidance and administrative andlogistical support throughout the project.
We also want to acknowledge the essential contribu-tions of three other individuals.Archie Lapointe wasan active member of the AIR team during the earlystages of the NAAL, and the project greatly benefit-ed from his experience and wisdom.Another formermember of the AIR team, Eugene Johnson, whodirected the assessment’s psychometrics and prelimi-nary analysis activities, played an essential role in theproject.We also want to acknowledge the contribu-tions of Richard Venezky, who provided invaluableguidance, support, and friendship, and whose memo-ry we cherish.
Thousands of adults participated in the assessment.Their willingness to spend time answering the back-ground questions and assessment items was essentialto ensuring that meaningful data about the literacy ofAmerica’s adults could be obtained.This study wouldnot have been possible without their participation.
viii
The Health Literacy of America’s Adults
Executive Summary . . . . . . . . . . . . . . . . . . . . . . . . . . . . . . . . . . . . . . . . . . . . . . . . . iiiLiteracy Levels . . . . . . . . . . . . . . . . . . . . . . . . . . . . . . . . . . . . . . . . . . . . . . . . . . . . . . . . . . . . . . . . iv
Demographic Characteristics and Health Literacy . . . . . . . . . . . . . . . . . . . . . . . . . . . . . . . . . . . v
Overall Health, Health Insurance Coverage, and Sources of Information About
Health Issues . . . . . . . . . . . . . . . . . . . . . . . . . . . . . . . . . . . . . . . . . . . . . . . . . . . . . . . . . . . . . . . . . . v
Acknowledgments . . . . . . . . . . . . . . . . . . . . . . . . . . . . . . . . . . . . . . . . . . . . . . . . . vii
List of Tables . . . . . . . . . . . . . . . . . . . . . . . . . . . . . . . . . . . . . . . . . . . . . . . . . . . . . . . xi
List of Figures . . . . . . . . . . . . . . . . . . . . . . . . . . . . . . . . . . . . . . . . . . . . . . . . . . . . . xiv
Chapter 1: Introduction . . . . . . . . . . . . . . . . . . . . . . . . . . . . . . . . . . . . . . . . . . . . . . 1Defining and Measuring Literacy . . . . . . . . . . . . . . . . . . . . . . . . . . . . . . . . . . . . . . . . . . . . . . . . . 2
Interpreting Literacy Results . . . . . . . . . . . . . . . . . . . . . . . . . . . . . . . . . . . . . . . . . . . . . . . . . . . . . 4
Conducting the Survey. . . . . . . . . . . . . . . . . . . . . . . . . . . . . . . . . . . . . . . . . . . . . . . . . . . . . . . . . . 7
Interpretation of Results . . . . . . . . . . . . . . . . . . . . . . . . . . . . . . . . . . . . . . . . . . . . . . . . . . . . . . . . 8
Cautions in Interpretation . . . . . . . . . . . . . . . . . . . . . . . . . . . . . . . . . . . . . . . . . . . . . . . . . . . . . . . 8
Organization of the Report . . . . . . . . . . . . . . . . . . . . . . . . . . . . . . . . . . . . . . . . . . . . . . . . . . . . . . 8
Chapter 2: Demographic Characteristics and Health Literacy. . . . . . . . . . . . . . . 9Total Population . . . . . . . . . . . . . . . . . . . . . . . . . . . . . . . . . . . . . . . . . . . . . . . . . . . . . . . . . . . . . . 10
Gender . . . . . . . . . . . . . . . . . . . . . . . . . . . . . . . . . . . . . . . . . . . . . . . . . . . . . . . . . . . . . . . . . . . . . . 10
Race and Ethnicity . . . . . . . . . . . . . . . . . . . . . . . . . . . . . . . . . . . . . . . . . . . . . . . . . . . . . . . . . . . . 11
Language Spoken Before Starting School . . . . . . . . . . . . . . . . . . . . . . . . . . . . . . . . . . . . . . . . . 12
Age . . . . . . . . . . . . . . . . . . . . . . . . . . . . . . . . . . . . . . . . . . . . . . . . . . . . . . . . . . . . . . . . . . . . . . . . . 12
Highest Level of Educational Attainment . . . . . . . . . . . . . . . . . . . . . . . . . . . . . . . . . . . . . . . . . 13
Poverty Threshold . . . . . . . . . . . . . . . . . . . . . . . . . . . . . . . . . . . . . . . . . . . . . . . . . . . . . . . . . . . . . 14
Summary . . . . . . . . . . . . . . . . . . . . . . . . . . . . . . . . . . . . . . . . . . . . . . . . . . . . . . . . . . . . . . . . . . . . 14
Chapter 3: Overall Health, Health Insurance Coverage, and Sources ofInformation About Health Issues . . . . . . . . . . . . . . . . . . . . . . . . . . . . . . . . . . . . . 15
Self-Assessment of Overall Health . . . . . . . . . . . . . . . . . . . . . . . . . . . . . . . . . . . . . . . . . . . . . . . 16
Health Insurance. . . . . . . . . . . . . . . . . . . . . . . . . . . . . . . . . . . . . . . . . . . . . . . . . . . . . . . . . . . . . . 17
ix
CONTENTS
Sources of Information About Health Issues . . . . . . . . . . . . . . . . . . . . . . . . . . . . . . . . . . . . . . . . . . . . . . . . . . . . . . . . . . . . . . . . . . . . . . . . . .18
Summary . . . . . . . . . . . . . . . . . . . . . . . . . . . . . . . . . . . . . . . . . . . . . . . . . . . . . . . . . . . . . . . . . . . . . . . . . . . . . . . . . . . . . . . . . . . . . . . . . . . . . . . .20
Appendix A: Sample Health Literacy Assessment Question . . . . . . . . . . . . . . . . . . . . . . . . . . . . . . . . . . . . . . . . . . . . .23
Appendix B: Definitions of All Subpopulations and Background Variables Reported . . . . . . . . . . . . . . . . . . . . . . . .27
Appendix C: Technical Notes . . . . . . . . . . . . . . . . . . . . . . . . . . . . . . . . . . . . . . . . . . . . . . . . . . . . . . . . . . . . . . . . . . . . . . .31
Appendix D: Standard Errors for Tables and Figures . . . . . . . . . . . . . . . . . . . . . . . . . . . . . . . . . . . . . . . . . . . . . . . . . . .39
Appendix E: Additional Analyses . . . . . . . . . . . . . . . . . . . . . . . . . . . . . . . . . . . . . . . . . . . . . . . . . . . . . . . . . . . . . . . . . . .47
References . . . . . . . . . . . . . . . . . . . . . . . . . . . . . . . . . . . . . . . . . . . . . . . . . . . . . . . . . . . . . . . . . . . . . . . . . . . . . . . . . . . . . .59
x
The Health Literacy of America’s Adults
List of Tables
Table Page
1-1. Overview of the literacy levels . . . . . . . . . . . . . . . . . . . . . . . . . . . . . . . . . . . . . . . . . . . . . . . . . . . . . . . . . . . . . . . . . . . . . . . . . . . . . . . .5
2-1. Average health literacy scores of adults, by language spoken before starting school: 2003 . . . . . . . . . . . . . . . . . . . . . . . . . . . .12
2-2. Average health literacy scores of adults, by poverty threshold: 2003 . . . . . . . . . . . . . . . . . . . . . . . . . . . . . . . . . . . . . . . . . . . . . . .14
C-1. Weighted and unweighted household response rate, by survey component: 2003 . . . . . . . . . . . . . . . . . . . . . . . . . . . . . . . . . . . 33
C-2. Weighted and unweighted prison response rate, by survey component: 2003. . . . . . . . . . . . . . . . . . . . . . . . . . . . . . . . . . . . . . . 34
D2-1. Estimates and standard errors for Figure 2-1. Percentage of adults in each health literacy level: 2003 . . . . . . . . . . . . . . . . . . 40
D2-2. Estimates and standard errors for Figure 2-2. Average health literacy scores of adults, by gender: 2003 . . . . . . . . . . . . . . . . .40
D2-3. Estimates and standard errors for Figure 2-3. Percentage of adults in each health literacy level, by gender: 2003 . . . . . . . . .40
D2-4. Estimates and standard errors for Figure 2-4. Average health literacy scores of adults, by race/ethnicity: 2003 . . . . . . . . . . .40
D2-5. Estimates and standard errors for Figure 2-5. Percentage of adults in each health literacy level, by race/ethnicity: 2003 . . .41
D2-6. Estimates and standard errors for Table 2-1. Average health literacy scores of adults, by language spoken before
starting school: 2003 . . . . . . . . . . . . . . . . . . . . . . . . . . . . . . . . . . . . . . . . . . . . . . . . . . . . . . . . . . . . . . . . . . . . . . . . . . . . . . . . . . . . . . .41
D2-7. Estimates and standard errors for Figure 2-6. Average health literacy scores of adults, by age: 2003 . . . . . . . . . . . . . . . . . . . .41
D2-8. Estimates and standard errors for Figure 2-7. Percentage of adults in each health literacy level, by age: 2003 . . . . . . . . . . . .42
D2-9. Estimates and standard errors for Figure 2-8. Average health literacy scores of adults, by highest educational
attainment: 2003 . . . . . . . . . . . . . . . . . . . . . . . . . . . . . . . . . . . . . . . . . . . . . . . . . . . . . . . . . . . . . . . . . . . . . . . . . . . . . . . . . . . . . . . . . .42
D2-10. Estimates and standard errors for Table 2-2. Average health literacy scores of adults, by poverty threshold: 2003 . . . . . . . . .43
D2-11. Estimates and standard errors for Figure 2-9. Percentage of adults in each health literacy level, by highest educational
attainment: 2003 . . . . . . . . . . . . . . . . . . . . . . . . . . . . . . . . . . . . . . . . . . . . . . . . . . . . . . . . . . . . . . . . . . . . . . . . . . . . . . . . . . . . . . . . . .43
D3-1. Estimates and standard errors for Figure 3-1. Average health literacy scores of adults, by self-assessment of overall
health: 2003 . . . . . . . . . . . . . . . . . . . . . . . . . . . . . . . . . . . . . . . . . . . . . . . . . . . . . . . . . . . . . . . . . . . . . . . . . . . . . . . . . . . . . . . . . . . . . .44
D3-2. Estimates and standard errors for Figure 3-2. Percentage of adults in each health literacy level, by self-assessment
of overall health: 2003 . . . . . . . . . . . . . . . . . . . . . . . . . . . . . . . . . . . . . . . . . . . . . . . . . . . . . . . . . . . . . . . . . . . . . . . . . . . . . . . . . . . . .44
D3-3. Estimates and standard errors for Figure 3-3. Average health literacy scores of adults, by type of health insurance
coverage: 2003 . . . . . . . . . . . . . . . . . . . . . . . . . . . . . . . . . . . . . . . . . . . . . . . . . . . . . . . . . . . . . . . . . . . . . . . . . . . . . . . . . . . . . . . . . . . .44
D3-4. Estimates and standard errors for Figure 3-4. Percentage of adults in each health literacy level, by type of health
insurance coverage: 2003 . . . . . . . . . . . . . . . . . . . . . . . . . . . . . . . . . . . . . . . . . . . . . . . . . . . . . . . . . . . . . . . . . . . . . . . . . . . . . . . . . . .45
D3-5. Estimates and standard errors for Figure 3-5. Percentage of adults who got information about health issues from
printed and written media: newspapers, magazines, books or brochures, and the Internet, by health literacy level: 2003 . .45
D3-6. Estimates and standard errors for Figure 3-6. Percentage of adults who got information about health issues from
nonprint media: radio and television, by health literacy level: 2003 . . . . . . . . . . . . . . . . . . . . . . . . . . . . . . . . . . . . . . . . . . . . . . .46
D3-7. Estimates and standard errors for Figure 3-7. Percentage of adults who got information about health issues from
personal contacts: family, friends, or coworkers; or health care professionals, by health literacy level: 2003 . . . . . . . . . . . . . .46
E-1. Average health literacy scores of adults, by occupational group: 2003 . . . . . . . . . . . . . . . . . . . . . . . . . . . . . . . . . . . . . . . . . . . . .48
E-2. Average health literacy scores of adults, by self-assessment of overall health and gender: 2003 . . . . . . . . . . . . . . . . . . . . . . .48
xi
Contents
xii
The Health Literacy of America’s Adults
E-3. Average health literacy scores of adults, by self-assessment of overall health and race/ethnicity: 2003 . . . . . . . . . . . . . . . . .49
E-4. Average health literacy scores of adults, by self-assessment of overall health and age: 2003 . . . . . . . . . . . . . . . . . . . . . . . . . .49
E-5. Average health literacy scores of adults, by self-assessment of overall health and highest educational attainment:
2003 . . . . . . . . . . . . . . . . . . . . . . . . . . . . . . . . . . . . . . . . . . . . . . . . . . . . . . . . . . . . . . . . . . . . . . . . . . . . . . . . . . . . . . . . . . . . . . . . . . . . .49
E-6. Average health literacy scores of adults, by type of health insurance coverage and gender: 2003 . . . . . . . . . . . . . . . . . . . . . .50
E-7. Average health literacy scores of adults, by type of health insurance coverage and race/ethnicity: 2003 . . . . . . . . . . . . . . . .50
E-8. Average health literacy scores of adults, by type of health insurance coverage and age: 2003 . . . . . . . . . . . . . . . . . . . . . . . . .50
E-9. Average health literacy scores of adults, by type of health insurance coverage and highest educational attainment:
2003 . . . . . . . . . . . . . . . . . . . . . . . . . . . . . . . . . . . . . . . . . . . . . . . . . . . . . . . . . . . . . . . . . . . . . . . . . . . . . . . . . . . . . . . . . . . . . . . . . . . . .51
E-10. Average health literacy scores of adults who got information about health issues from newspapers, magazines,
and books or brochures, by gender: 2003 . . . . . . . . . . . . . . . . . . . . . . . . . . . . . . . . . . . . . . . . . . . . . . . . . . . . . . . . . . . . . . . . . . . . . .51
E-11. Average health literacy scores of adults who got information about health issues from the Internet, by gender: 2003 . . . .52
E-12. Average health literacy scores of adults who got information about health issues from newspapers, magazines,
and books or brochures, by race/ethnicity: 2003 . . . . . . . . . . . . . . . . . . . . . . . . . . . . . . . . . . . . . . . . . . . . . . . . . . . . . . . . . . . . . . . .52
E-13. Average health literacy scores of adults who got information about health issues from the Internet, by race/ethnicity:
2003 . . . . . . . . . . . . . . . . . . . . . . . . . . . . . . . . . . . . . . . . . . . . . . . . . . . . . . . . . . . . . . . . . . . . . . . . . . . . . . . . . . . . . . . . . . . . . . . . . . . . .53
E-14. Average health literacy scores of adults who got information about health issues from newspapers, magazines,
and books or brochures, by age: 2003 . . . . . . . . . . . . . . . . . . . . . . . . . . . . . . . . . . . . . . . . . . . . . . . . . . . . . . . . . . . . . . . . . . . . . . . . .53
E-15. Average health literacy scores of adults who got information about health issues from the Internet, by age: 2003 . . . . . . .54
E-16. Average health literacy scores of adults who got information about health issues from newspapers, magazines,
and books or brochures, by highest educational attainment: 2003 . . . . . . . . . . . . . . . . . . . . . . . . . . . . . . . . . . . . . . . . . . . . . . . .54
E-17. Average health literacy scores of adults who got information about health issues from the Internet, by highest
educational attainment: 2003 . . . . . . . . . . . . . . . . . . . . . . . . . . . . . . . . . . . . . . . . . . . . . . . . . . . . . . . . . . . . . . . . . . . . . . . . . . . . . . .54
E-18. Average health literacy scores of adults who got information about health issues from radio and television,
by gender: 2003 . . . . . . . . . . . . . . . . . . . . . . . . . . . . . . . . . . . . . . . . . . . . . . . . . . . . . . . . . . . . . . . . . . . . . . . . . . . . . . . . . . . . . . . . . . .55
E-19. Average health literacy scores of adults who got information about health issues from radio and television,
by race/ethnicity: 2003 . . . . . . . . . . . . . . . . . . . . . . . . . . . . . . . . . . . . . . . . . . . . . . . . . . . . . . . . . . . . . . . . . . . . . . . . . . . . . . . . . . . . .55
E-20. Average health literacy scores of adults who got information about health issues from radio and television,
by age: 2003 . . . . . . . . . . . . . . . . . . . . . . . . . . . . . . . . . . . . . . . . . . . . . . . . . . . . . . . . . . . . . . . . . . . . . . . . . . . . . . . . . . . . . . . . . . . . . .55
E-21. Average health literacy scores of adults who got information about health issues from radio and television,
by highest educational attainment: 2003 . . . . . . . . . . . . . . . . . . . . . . . . . . . . . . . . . . . . . . . . . . . . . . . . . . . . . . . . . . . . . . . . . . . . .56
E-22. Average health literacy scores of adults who got information about health issues from family, friends, or coworkers,
by gender: 2003 . . . . . . . . . . . . . . . . . . . . . . . . . . . . . . . . . . . . . . . . . . . . . . . . . . . . . . . . . . . . . . . . . . . . . . . . . . . . . . . . . . . . . . . . . . .56
E-23. Average health literacy scores of adults who got information about health issues from health care professionals,
by gender: 2003 . . . . . . . . . . . . . . . . . . . . . . . . . . . . . . . . . . . . . . . . . . . . . . . . . . . . . . . . . . . . . . . . . . . . . . . . . . . . . . . . . . . . . . . . . . .56
E-24. Average health literacy scores of adults who got information about health issues from family, friends, or coworkers,
by race/ethnicity: 2003 . . . . . . . . . . . . . . . . . . . . . . . . . . . . . . . . . . . . . . . . . . . . . . . . . . . . . . . . . . . . . . . . . . . . . . . . . . . . . . . . . . . . .57
E-25. Average health literacy scores of adults who got information about health issues from health care professionals,
by race/ethnicity: 2003 . . . . . . . . . . . . . . . . . . . . . . . . . . . . . . . . . . . . . . . . . . . . . . . . . . . . . . . . . . . . . . . . . . . . . . . . . . . . . . . . . . . . .57
E-26. Average health literacy scores of adults who got information about health issues from family, friends, or coworkers,
by age: 2003 . . . . . . . . . . . . . . . . . . . . . . . . . . . . . . . . . . . . . . . . . . . . . . . . . . . . . . . . . . . . . . . . . . . . . . . . . . . . . . . . . . . . . . . . . . . . . .57
E-27. Average health literacy scores of adults who got information about health issues from health care professionals,
by age: 2003 . . . . . . . . . . . . . . . . . . . . . . . . . . . . . . . . . . . . . . . . . . . . . . . . . . . . . . . . . . . . . . . . . . . . . . . . . . . . . . . . . . . . . . . . . . . . . .58
E-28. Average health literacy scores of adults who got information about health issues from family, friends, or coworkers,
by highest educational attainment: 2003 . . . . . . . . . . . . . . . . . . . . . . . . . . . . . . . . . . . . . . . . . . . . . . . . . . . . . . . . . . . . . . . . . . . . .58
E-29. Average health literacy scores of adults who got information about health issues from health care professionals,
by highest educational attainment: 2003 . . . . . . . . . . . . . . . . . . . . . . . . . . . . . . . . . . . . . . . . . . . . . . . . . . . . . . . . . . . . . . . . . . . . .58
xiii
Contents
List of Figures
Figure Page
1-1. Difficulty of selected health literacy tasks: 2003 . . . . . . . . . . . . . . . . . . . . . . . . . . . . . . . . . . . . . . . . . . . . . . . . . . . . . . . . . . . . . . . . .6
2-1. Percentage of adults in each health literacy level: 2003 . . . . . . . . . . . . . . . . . . . . . . . . . . . . . . . . . . . . . . . . . . . . . . . . . . . . . . . . . .10
2-2. Average health literacy scores of adults, by gender: 2003 . . . . . . . . . . . . . . . . . . . . . . . . . . . . . . . . . . . . . . . . . . . . . . . . . . . . . . . .10
2-3. Percentage of adults in each health literacy level, by gender: 2003 . . . . . . . . . . . . . . . . . . . . . . . . . . . . . . . . . . . . . . . . . . . . . . . .10
2-4. Average health literacy scores of adults, by race/ethnicity: 2003 . . . . . . . . . . . . . . . . . . . . . . . . . . . . . . . . . . . . . . . . . . . . . . . . . .11
2-5. Percentage of adults in each health literacy level, by race/ethnicity: 2003 . . . . . . . . . . . . . . . . . . . . . . . . . . . . . . . . . . . . . . . . . .11
2-6. Average health literacy scores of adults, by age: 2003 . . . . . . . . . . . . . . . . . . . . . . . . . . . . . . . . . . . . . . . . . . . . . . . . . . . . . . . . . . .12
2-7. Percentage of adults in each health literacy level, by age: 2003 . . . . . . . . . . . . . . . . . . . . . . . . . . . . . . . . . . . . . . . . . . . . . . . . . . .12
2-8. Average health literacy scores of adults, by highest educational attainment: 2003 . . . . . . . . . . . . . . . . . . . . . . . . . . . . . . . . . . .13
2-9. Percentage of adults in each health literacy level, by highest educational attainment: 2003 . . . . . . . . . . . . . . . . . . . . . . . . . .14
3-1. Average health literacy scores of adults, by self-assessment of overall health: 2003 . . . . . . . . . . . . . . . . . . . . . . . . . . . . . . . . . .16
3-2. Percentage of adults in each health literacy level, by self-assessment of overall health: 2003 . . . . . . . . . . . . . . . . . . . . . . . . .16
3-3. Average health literacy scores of adults, by type of health insurance coverage: 2003 . . . . . . . . . . . . . . . . . . . . . . . . . . . . . . . . .17
3-4. Percentage of adults in each health literacy level, by type of health insurance coverage: 2003 . . . . . . . . . . . . . . . . . . . . . . . . .18
3-5. Percentage of adults who got information about health issues from printed and written media: newspapers,
magazines, books or brochures, and the Internet, by health literacy level: 2003 . . . . . . . . . . . . . . . . . . . . . . . . . . . . . . . . . . . . .19
3-6. Percentage of adults who got information about health issues from nonprint media: radio and television, by health
literacy level: 2003 . . . . . . . . . . . . . . . . . . . . . . . . . . . . . . . . . . . . . . . . . . . . . . . . . . . . . . . . . . . . . . . . . . . . . . . . . . . . . . . . . . . . . . . . . . .20
3-7. Percentage of adults who got information about health issues from personal contacts: family, friends, or coworkers;
or health care professionals, by health literacy level: 2003 . . . . . . . . . . . . . . . . . . . . . . . . . . . . . . . . . . . . . . . . . . . . . . . . . . . . . . .21
xiv
The Health Literacy of America’s Adults
Introduction
Understanding the health literacy of America’sadults is important because so many aspectsof finding health care and health informa-
tion, and maintaining health, depend on understand-ing written information. Many reports have suggestedthat low health literacy is associated with poor com-munication between patients and health careproviders and with poor health outcomes, includingincreased hospitalization rates, less frequent screeningfor diseases such as cancer, and disproportionately highrates of disease and mortality (Baker et al. 1998;Berkman et al. 2004;Gordon et al. 2002;Lindau et al.2001; Rudd et al. 1999; Williams et al. 2002). Lowhealth literacy may also be associated with increaseduse of emergency rooms for primary care (Baker etal. 2004). These findings have implications for thecosts of caring for patients with low health literacy.
As the Committee on Health Literacy of theInstitute of Medicine wrote:
Health literacy is of concern to everyoneinvolved in health promotion and protection,disease prevention and early screening, healthcare maintenance, and policy making.Health lit-eracy skills are needed for dialogue and discus-sion, reading health information, interpretingcharts, making decisions about participating inresearch studies, using medical tools for personalor family health care—such as a peak flow meteror thermometer—calculating timing or dosageof medicine, or voting on health or environmentissues. (Institute of Medicine 2004, p. 31)
1
Defining and Measuring
Literacy
Interpreting Literacy Results
Conducting the Survey
Interpretation of Results
Cautions in Interpretation
Organization of the Report
1CHAPTER ONE
Health literacy is a new component of the 2003National Assessment of Adult Literacy (NAAL).NAAL assessed the English literacy of adults (ages 16and older) in the United States.The assessment wasadministered to more than 19,000 adults (ages 16 andolder) in households or prisons.
This report presents the initial findings on health lit-eracy from the assessment.Analyses presented in thisreport, including those in appendix E, are intendedto provide a summary of the relationship betweenhealth literacy and background characteristics ofadults, preventive health practices, and sources ofhealth information used by adults.
Defining and Measuring Literacy
Defining Literacy
Unlike indirect measures of literacy—which rely onself-reports and other subjective evaluations of liter-acy and education—the 2003 adult literacy assess-ment measured literacy directly by tasks representinga range of literacy activities that adults are likely toface in their daily lives.
The literacy tasks in the assessment were drawn fromactual texts and documents, which were either usedin their original format or reproduced in the assess-ment booklets. Each question appeared before thematerials needed to answer it, thus encouragingrespondents to read with purpose.
Respondents could correctly answer many assess-ment questions by skimming the text or documentfor the information necessary to perform a given lit-eracy task. None of the tasks were multiple choicetasks with a list of responses provided. Instead,respondents had to determine and write theiranswers to the questions.
The 2003 assessment used the same definition of lit-eracy as the 1992 National Adult Literacy Survey:
Using printed and written information to func-tion in society, to achieve one’s goals, and todevelop one’s knowledge and potential.
This definition acknowledges that literacy goesbeyond simply being able to sound out or recognizewords and understand text. A central feature of thedefinition is that literacy is related to achieving anobjective and that adults often read for a purpose.
Measuring Literacy
Three literacy scales—prose literacy, document liter-acy, and quantitative literacy—were used in the 2003assessment:
■ Prose literacy. The knowledge and skills neededto perform prose tasks (i.e., to search, compre-hend, and use information from continuoustexts). Prose examples include editorials, newsstories, brochures, and instructional materials.Prose texts can be further broken down asexpository, narrative, procedural, or persuasive.
■ Document literacy. The knowledge and skillsneeded to perform document tasks (i.e., tosearch, comprehend, and use information fromnoncontinuous texts in various formats).Document examples include job applications,payroll forms, transportation schedules, maps,tables, and drug and food labels.
■ Quantitative literacy. The knowledge and skillsrequired to perform quantitative tasks (i.e., toidentify and perform computations, either aloneor sequentially, using numbers embedded inprinted materials). Examples include balancing acheckbook, figuring out a tip, completing anorder form, and determining the amount ofinterest on a loan from an advertisement.
2
The Health Literacy of America’s Adults
In addition, the assessment included a health literacyscale that consisted of 12 prose, 12 document, and 4quantitative NAAL items.1 The health literacy itemsreflect the definition of health literacy as defined bythe Institute of Medicine and Healthy People 2010(a set of national disease prevention and health pro-motion objectives led by the U.S. Department ofHealth and Human Services):
The degree to which individuals have thecapacity to obtain, process, and understand basichealth information and services needed tomake appropriate health decisions. (HHS 2000and Institute of Medicine 2004)
Tasks used to measure health literacy were organizedaround three domains of health and health careinformation and services: clinical, prevention, and nav-igation of the health care system.The stimulus materialsand the 28 health literacy tasks were designed toelicit respondents’ skills for locating and understand-ing health-related information and services and torepresent the three general literacy scales—prose,document, and quantitative—developed to reportNAAL results.
The materials were selected to be representative ofreal-world health-related information, includinginsurance information, medicine directions, and pre-ventive care information. The Office of DiseasePrevention and Health Promotion (ODPHP) withinthe U.S. Department of Health and Human Servicessuggested materials and questions based on inputfrom other HHS agencies and stakeholders andexperts, and on information from federal healthmaterials and other health-related assessments.
Of the 28 health literacy tasks, 3 represented the clin-ical domain, 14 represented the prevention domain,
and 11 items represented the navigation of the healthcare system domain. The domains are defined in thefollowing way:
■ The clinical domain encompasses those activitiesassociated with the health care provider-patientinteraction, clinical encounters, diagnosis andtreatment of illness, and medication.Tasks fromthe clinical domain are filling out a patientinformation form for an office visit, understand-ing dosing instructions for medication, and fol-lowing a health care provider’s recommendationfor a diagnostic test.
■ The prevention domain encompasses those activ-ities associated with maintaining and improvinghealth, preventing disease, intervening early inemerging health problems, and engaging in self-care and self-management of illness. Examplesare following guidelines for age-appropriatepreventive health services, identifying signs andsymptoms of health problems that should beaddressed with a health professional, and under-standing how eating and exercise habits decreaserisks for developing serious illness.
■ The navigation of the health care system domainencompasses those activities related to under-standing how the health care system works andindividual rights and responsibilities. Examplesare understanding what a health insurance planwill and will not pay for, determining eligibili-ty for public insurance or assistance programs,and being able to give informed consent for ahealth care service. (HHS, 2003, p. 37)
The NAAL health literacy scale did not include tasksthat did not fit the definitions of prose, document, orquantitative literacy even if they were consistent withthe definition of health literacy used by HealthyPeople 2010. For example, none of the NAAL healthtasks required knowledge of specialized health termi-
3
Chapter 1: Introduction
1 The NAAL health literacy scale was constructed to have a meanof 245 and a standard deviation of 55.
nology. The assessment also did not measure the abil-ity to obtain information from nonprint sources,although questions about the use of all sources ofhealth information—both written and oral—wereincluded on the background questionnaire and areincluded in this report.
Background Questionnaire
The 2003 National Assessment of Adult Literacyhousehold background questionnaire was used tocollect data about various demographic and back-ground characteristics of adults. The questionnairealso included a section of questions specifically relat-ed to health status, preventive health practices, healthinsurance coverage, and sources of information abouthealth issues. A summary of the questions that wereused in analyses in this report is presented in appen-dix B on page 27.
A separate background questionnaire was developedfor adults in prison. Questions about health statusand sources of information about health issues wereincluded on the prison background questionnaire.The background questionnaire for prison inmatesdid not include questions about health insurance orabout Internet use.
Interpreting Literacy Results
In addition to reporting average literacy scores, anoth-er way to report results is by grouping adults with sim-ilar scores into a relatively small number of categories,often referred to as performance levels. Performancelevels are used to identify and characterize the relativestrengths and weaknesses of adults falling within vari-ous ranges of literacy ability.Describing the adult pop-ulation according to such levels allows analysts, policy-makers, and others to examine and discuss the typicalperformance and capabilities of specified groups with-in the adult population.2
The National Research Council’s Board on Testingand Assessment (BOTA) Committee on PerformanceLevels for Adult Literacy recommended a new set of performance levels for the prose, document, andquantitative scales for the NAAL, instead of using thesame reporting levels used for the 1992 NationalAdult Literacy Survey.3
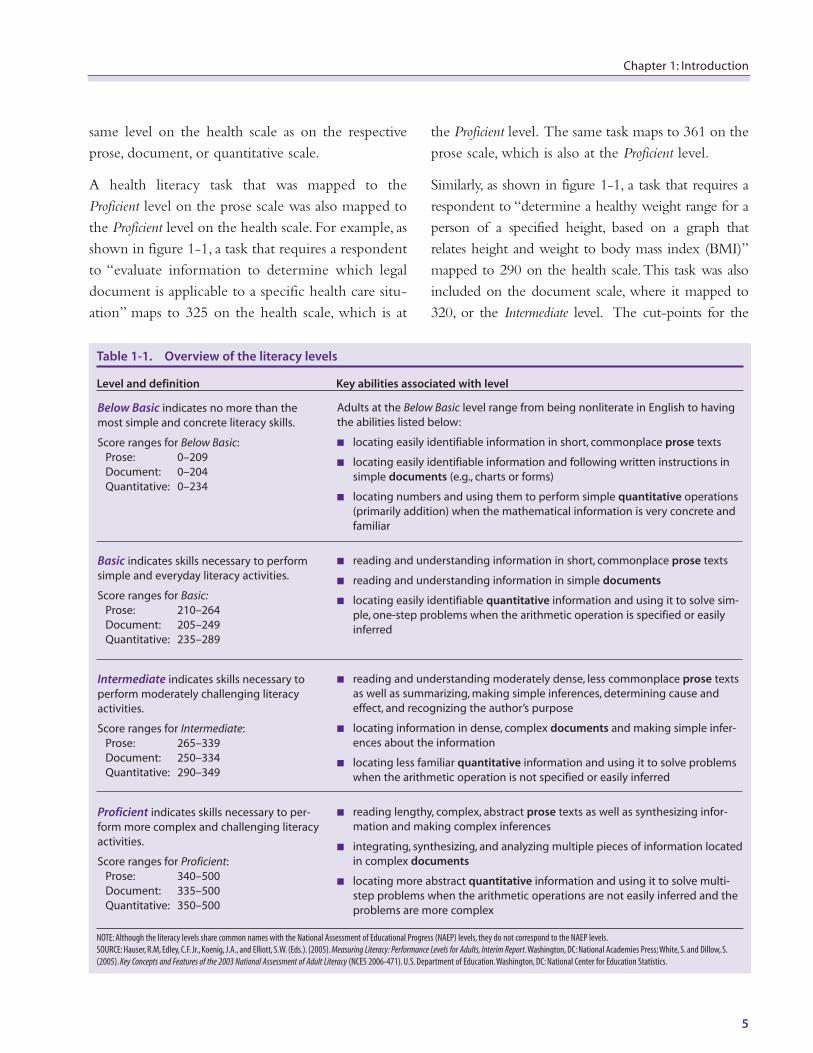
Drawing on the committee’s recommendations, theU.S. Department of Education decided to reportNAAL results for the prose, document, and quantita-tive scales by using four literacy levels for each scale:Below Basic, Basic, Intermediate, and Proficient.Table 1-1summarizes the knowledge, skills, and capabilities thatadults needed to demonstrate to be classified into oneof the four levels on the prose, document, and quan-titative scales. The items used for the health literacyscale were also classified as prose, document, andquantitative items.
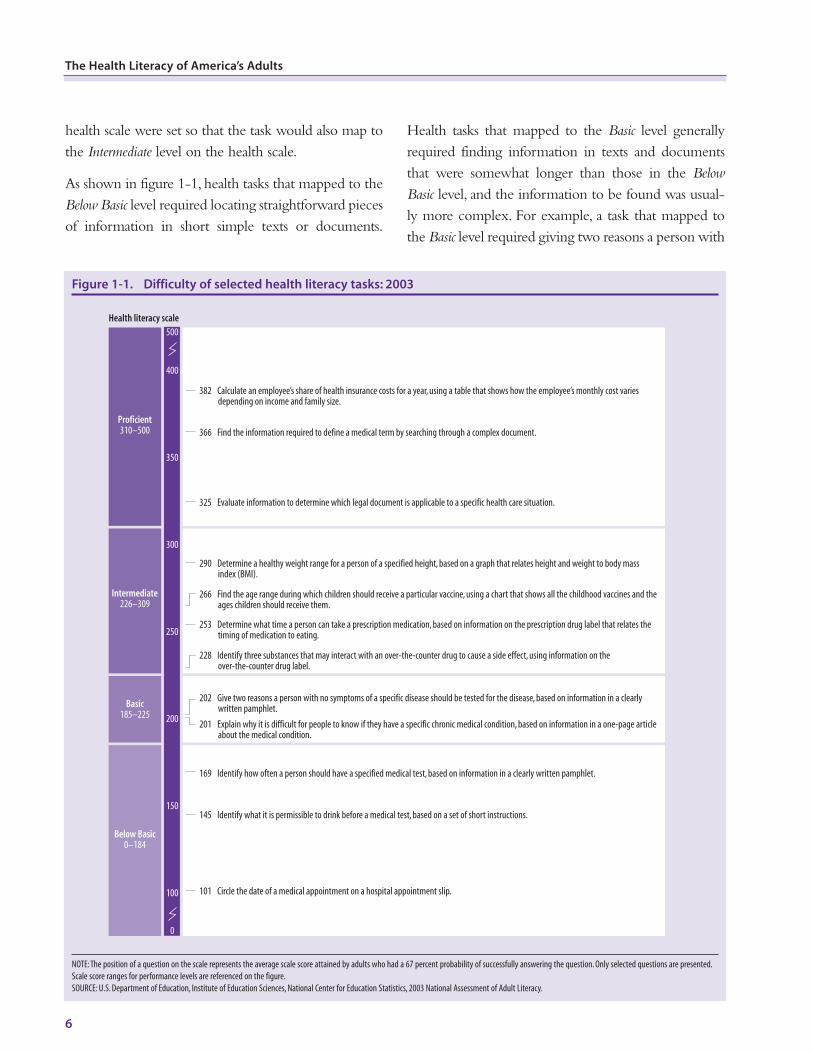
The BOTA Committee on Performance Levels forAdult Literacy was not asked to recommend per-formance levels for the health scale, because everyhealth literacy task was included on the prose, docu-ment, or quantitative scale. NCES mapped eachhealth task to the health literacy scale based on theirlevel of difficulty as prose, document, and quantita-tive items (see figure 1-1). Each health task wasmapped to the prose, document, or quantitative scale(depending upon which scale the task fell into) at thepoint on the scale (i.e., the scale score) where anadult with that scale score would have a 67 percentprobability of doing the task correctly. The 67 per-cent probability convention was used by the BOTACommittee for the prose, document, and quantitativescales. That point on the scale was classified as towhether it fell into the Below Basic, Basic, Intermediate,or Proficient level.Cut-points for the health scale wereestablished so that each task was classified into the
The Health Literacy of America’s Adults
4
2 For more information on NAAL performance levels see Whiteand Dillow (2005).
3 For a description of the process followed by the BOTACommittee on Performance Levels see Hauser et al. (2005) andWhite and Dillow (2005).
Chapter 1: Introduction
same level on the health scale as on the respectiveprose, document, or quantitative scale.
A health literacy task that was mapped to theProficient level on the prose scale was also mapped tothe Proficient level on the health scale. For example, asshown in figure 1-1, a task that requires a respondentto “evaluate information to determine which legaldocument is applicable to a specific health care situ-ation” maps to 325 on the health scale, which is at
the Proficient level. The same task maps to 361 on theprose scale, which is also at the Proficient level.
Similarly, as shown in figure 1-1, a task that requires arespondent to “determine a healthy weight range for aperson of a specified height, based on a graph thatrelates height and weight to body mass index (BMI)”mapped to 290 on the health scale.This task was alsoincluded on the document scale, where it mapped to320, or the Intermediate level. The cut-points for the
5
Table 1-1. Overview of the literacy levels
Level and definition Key abilities associated with level
Below Basic indicates no more than themost simple and concrete literacy skills.
Score ranges for Below Basic:Prose: 0–209Document: 0–204Quantitative: 0–234
Basic indicates skills necessary to performsimple and everyday literacy activities.
Score ranges for Basic:Prose: 210–264Document: 205–249Quantitative: 235–289
Intermediate indicates skills necessary toperform moderately challenging literacyactivities.
Score ranges for Intermediate:Prose: 265–339Document: 250–334Quantitative: 290–349
Proficient indicates skills necessary to per-form more complex and challenging literacyactivities.
Score ranges for Proficient:Prose: 340–500Document: 335–500Quantitative: 350–500
Adults at the Below Basic level range from being nonliterate in English to havingthe abilities listed below:
■ locating easily identifiable information in short, commonplace prose texts
■ locating easily identifiable information and following written instructions insimple documents (e.g., charts or forms)
■ locating numbers and using them to perform simple quantitative operations(primarily addition) when the mathematical information is very concrete andfamiliar
■ reading and understanding information in short, commonplace prose texts
■ reading and understanding information in simple documents
■ locating easily identifiable quantitative information and using it to solve sim-ple, one-step problems when the arithmetic operation is specified or easilyinferred
■ reading and understanding moderately dense, less commonplace prose textsas well as summarizing, making simple inferences, determining cause andeffect, and recognizing the author’s purpose
■ locating information in dense, complex documents and making simple infer-ences about the information
■ locating less familiar quantitative information and using it to solve problemswhen the arithmetic operation is not specified or easily inferred
■ reading lengthy, complex, abstract prose texts as well as synthesizing infor-mation and making complex inferences
■ integrating, synthesizing, and analyzing multiple pieces of information locatedin complex documents
■ locating more abstract quantitative information and using it to solve multi-step problems when the arithmetic operations are not easily inferred and theproblems are more complex
NOTE: Although the literacy levels share common names with the National Assessment of Educational Progress (NAEP) levels, they do not correspond to the NAEP levels.
SOURCE: Hauser, R.M, Edley, C.F. Jr., Koenig, J.A., and Elliott, S.W. (Eds.). (2005). Measuring Literacy: Performance Levels for Adults, Interim Report.Washington, DC: National Academies Press; White, S. and Dillow, S.
(2005). Key Concepts and Features of the 2003 National Assessment of Adult Literacy (NCES 2006-471). U.S. Department of Education.Washington, DC: National Center for Education Statistics.
6
The Health Literacy of America’s Adults
health scale were set so that the task would also map tothe Intermediate level on the health scale.
As shown in figure 1-1, health tasks that mapped to theBelow Basic level required locating straightforward piecesof information in short simple texts or documents.
Health tasks that mapped to the Basic level generallyrequired finding information in texts and documentsthat were somewhat longer than those in the BelowBasic level, and the information to be found was usual-ly more complex. For example, a task that mapped tothe Basic level required giving two reasons a person with
Figure 1-1. Difficulty of selected health literacy tasks: 2003
Proficient 310–500
Intermediate 226–309
Basic 185–225
Below Basic 0–184
Health literacy scale
0
150
200
100
250
300
400
350
500
253 Determine what time a person can take a prescription medication, based on information on the prescription drug label that relates the timing of medication to eating.
266 Find the age range during which children should receive a particular vaccine, using a chart that shows all the childhood vaccines and the ages children should receive them.
290 Determine a healthy weight range for a person of a specified height, based on a graph that relates height and weight to body mass index (BMI).
382 Calculate an employee’s share of health insurance costs for a year, using a table that shows how the employee’s monthly cost varies depending on income and family size.
366 Find the information required to define a medical term by searching through a complex document.
325 Evaluate information to determine which legal document is applicable to a specific health care situation.
145 Identify what it is permissible to drink before a medical test, based on a set of short instructions.
101 Circle the date of a medical appointment on a hospital appointment slip.
169 Identify how often a person should have a specified medical test, based on information in a clearly written pamphlet.
228 Identify three substances that may interact with an over-the-counter drug to cause a side effect, using information on the over-the-counter drug label.
201 Explain why it is difficult for people to know if they have a specific chronic medical condition, based on information in a one-page article about the medical condition.
202 Give two reasons a person with no symptoms of a specific disease should be tested for the disease, based on information in a clearly written pamphlet.
NOTE:The position of a question on the scale represents the average scale score attained by adults who had a 67 percent probability of successfully answering the question. Only selected questions are presented.
Scale score ranges for performance levels are referenced on the figure.
SOURCE: U.S. Department of Education, Institute of Education Sciences, National Center for Education Statistics, 2003 National Assessment of Adult Literacy.
7
Chapter 1: Introduction
no symptoms of a specific disease should be tested forthe disease by using information in a pamphlet, while atask that mapped to the Below Basic level required find-ing one piece of information–the date–on a medicalappointment slip that was shorter and simpler than thetext in the Basic task.
Health tasks that mapped to the Intermediate level wentbeyond simply searching texts and documents to findinformation. Most health tasks that mapped to theIntermediate level required adults to interpret or applyinformation that was presented in complex graphs,tables, or other health-related texts or documents.
Health tasks that mapped to the Proficient level requireddrawing abstract inferences, comparing or contrastingmultiple pieces of information within complex texts ordocuments, or applying abstract or complicated infor-mation from texts or documents.
Conducting the Survey4
The 2003 National Assessment of Adult Literacyincluded two samples: (1) adults ages 16 and older liv-ing in households and (2) prison inmates ages 16 andolder in federal and state prisons.The assessment wasadministered to approximately 19,000 adults: 18,000adults living in households and 1,200 prison inmates.
Each sample was weighted to represent its share of thetotal population of the United States, and the sampleswere combined for reporting. Household data collec-tion was conducted from March 2003 throughFebruary 2004; prison data collection was conductedfrom March through July 2004. For the householdsample, the screener response rate was 81 percent andthe background questionnaire response rate was 77percent.The final household sample response rate was62 percent.4 For the prison sample, 97 percent of pris-
ons that were selected for the study agreed to partic-ipate and the background questionnaire response ratefor prison inmates was 91 percent. The final prisonsample response rate was 88 percent.
Household interviews were conducted in respon-dents’ homes; prison interviews usually took place ina classroom or library in the prison.Whenever possi-ble, interviewers administered the background ques-tionnaire and assessment in a private setting.Assessments were administered one-on-one using acomputer-assisted personal interviewing (CAPI) system programmed into laptop computers.Respondents were encouraged to use whatever aidsthey normally used when reading and when per-forming quantitative tasks, including eyeglasses, mag-nifying glasses, rulers, and calculators.
Three percent of adults were unable to participate inthe assessment because they could not communicatein either English or Spanish or because they had amental disability that prevented them from beingtested. Literacy scores for these adults could not beestimated, and they are not included in the resultspresented in this report, or in other NAAL reports.
An additional 3 percent of adults were routed to an alternative assessment (the Adult LiteracySupplemental Assessment, or ALSA) based upon theirperformance on the seven easy screening tasks at thebeginning of the literacy assessment. Because theycould be placed on the NAAL scale based on theirresponses to the seven screening tasks,ALSA partici-pants were classified into the Below Basic level oneach NAAL literacy scale. Results for the adults whowere placed in the ALSA are included in the resultspresented in this report.
Additional information on ALSA, sampling,response rates, and data collection procedures is inappendix C.
4 Nonresponse bias analyses are discussed on page 34 of the report.All percentages in this section are weighted. For the unweightedpercentages, see tables C-1 and C-2 in appendix C.
Interpretation of Results
The statistics presented in this report are estimates ofperformance based on a sample of respondents,rather than the values that could be calculated ifevery person in the nation answered every questionon the assessment. Estimates of performance of thepopulation and groups within the population werecalculated by using sampling weights to account forthe fact that the probabilities of selection were notidentical for all respondents. Information about theuncertainty of each statistic that takes into accountthe complex sample design was estimated by usingTaylor series procedures to estimate standard errors.
The analyses in this report examine differences relatedto literacy based on self-reported background charac-teristics among groups in 2003, by using standard ttests to determine statistical significance. Statistical sig-nificance is reported at p < .05. Differences betweenaverages or percentages that are statistically significantare discussed by using comparative terms such ashigher or lower. Differences that are not statisticallysignificant either are not discussed or are referred toas “not statistically significant.” Failure to find a sta-tistically significant difference should not be inter-preted as meaning that the estimates are the same;rather, failure to find a difference may also be due tomeasurement error or sampling.
Detailed tables with estimates and standard errors forall tables and figures in this report are in appendices
D and E. Appendix C includes more informationabout the weights used for the sample and the pro-cedures used to estimate standard errors and statisti-cal significance.
Cautions in Interpretation
The purpose of this report is to examine the rela-tionship between health literacy and various self-reported background factors. This report is purelydescriptive in nature. Readers are cautioned not todraw causal inferences based solely on the results pre-sented here. It is important to note that many of thevariables examined in this report are related to oneanother, and complex interactions and relationshipshave not been explored here.
Organization of the Report
Chapter 2 of this report examines how health litera-cy varied across groups with different demographiccharacteristics, as well as the relationship betweenhealth literacy and highest level of educational attain-ment and poverty status.
Chapter 3 explores the relationship between literacyand overall health. The analyses in the chapter alsoexamine the literacy of adults who have differenttypes of health insurance or no health insurance.Thechapter concludes with an examination of the rela-tionship between literacy and sources of printed andnonprinted information used by adults.
8
The Health Literacy of America’s Adults
Demographic Characteristics andHealth Literacy
Data from the 2003 National Assessment ofAdult Literacy (NAAL) allow examina-tions of the relationships between demo-
graphic characteristics and literacy. Analyses fromthe assessment showed differences in prose, docu-ment, and quantitative literacy for adults with dif-ferent demographic characteristics. For example,women had higher prose and document literacythan men, while women’s average quantitative liter-acy was lower than men’s.The average prose, docu-ment, and quantitative literacy of White adults washigher than the average literacy of adults of otherraces or ethnicities.Adults 65 years of age and olderhad the lowest average prose, document, and quan-titative scores among all age groups (Kutner et al.2005).
The relationships between health literacy anddemographic characteristics of adults are examinedin this chapter.Also examined are the relationshipsbetween health literacy and highest level of educa-tional attainment and poverty. All the analyses inthis chapter are based on the combined householdand prison samples.
9
Total Population
Gender
Race and Ethnicity
Language Spoken Before
Starting School
Age
Highest Level of Educational
Attainment
Poverty Threshold
Summary
2CHAPTER TWO
10
The Health Literacy of America’s Adults
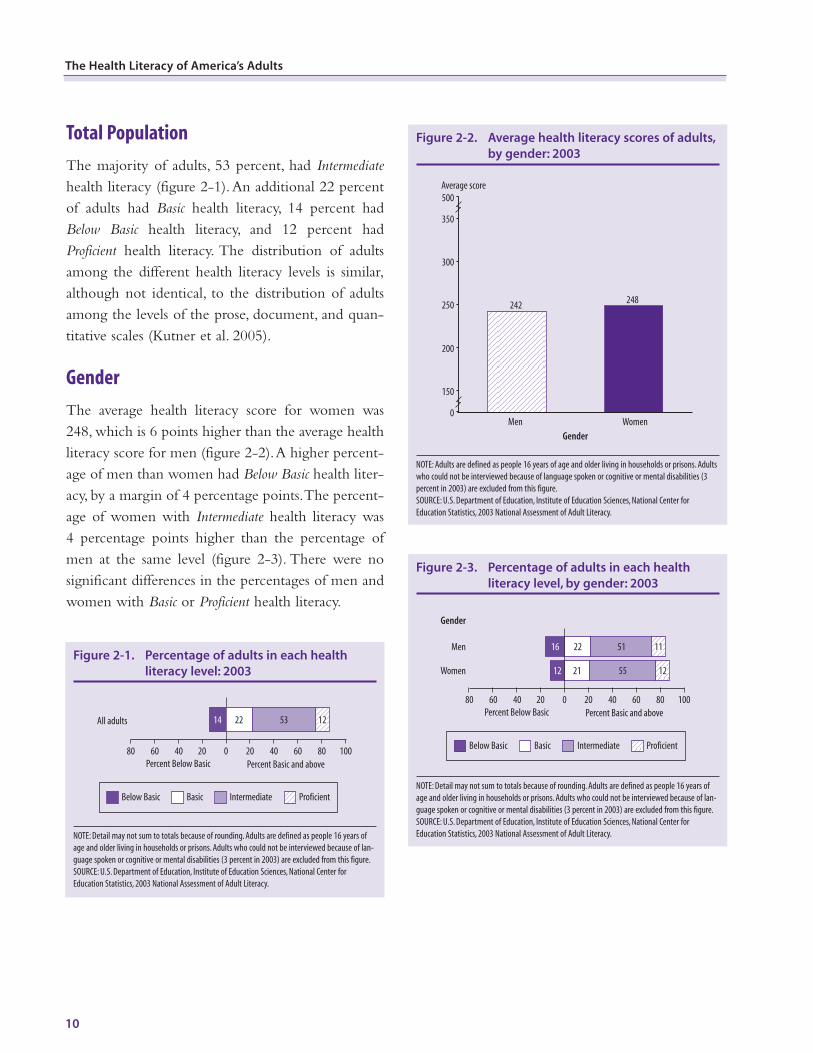
Total Population
The majority of adults, 53 percent, had Intermediatehealth literacy (figure 2-1).An additional 22 percentof adults had Basic health literacy, 14 percent hadBelow Basic health literacy, and 12 percent hadProficient health literacy. The distribution of adultsamong the different health literacy levels is similar,although not identical, to the distribution of adultsamong the levels of the prose, document, and quan-titative scales (Kutner et al. 2005).
Gender
The average health literacy score for women was248, which is 6 points higher than the average healthliteracy score for men (figure 2-2).A higher percent-age of men than women had Below Basic health liter-acy, by a margin of 4 percentage points.The percent-age of women with Intermediate health literacy was 4 percentage points higher than the percentage ofmen at the same level (figure 2-3). There were nosignificant differences in the percentages of men andwomen with Basic or Proficient health literacy.
Figure 2-3. Percentage of adults in each health
literacy level, by gender: 2003
Below Basic Basic Intermediate Proficient
16 22 51 11
12 21 55 12
0 20 40 60 80 1006080 40 20Percent Below Basic Percent Basic and above
Gender
Women
Men
NOTE: Detail may not sum to totals because of rounding. Adults are defined as people 16 years of
age and older living in households or prisons. Adults who could not be interviewed because of lan-
guage spoken or cognitive or mental disabilities (3 percent in 2003) are excluded from this figure.
SOURCE: U.S. Department of Education, Institute of Education Sciences, National Center for
Education Statistics, 2003 National Assessment of Adult Literacy.
Figure 2-1. Percentage of adults in each health
literacy level: 2003
Below Basic Basic Intermediate Proficient
0 20 40 60 80 1006080 40 20Percent Below Basic Percent Basic and above
All adults 14 22 53 12
NOTE: Detail may not sum to totals because of rounding. Adults are defined as people 16 years of
age and older living in households or prisons. Adults who could not be interviewed because of lan-
guage spoken or cognitive or mental disabilities (3 percent in 2003) are excluded from this figure.
SOURCE: U.S. Department of Education, Institute of Education Sciences, National Center for
Education Statistics, 2003 National Assessment of Adult Literacy.
Figure 2-2. Average health literacy scores of adults,
by gender: 2003
Men Women
242 248
0
150
200
250
Average score
300
350
500
Gender
NOTE: Adults are defined as people 16 years of age and older living in households or prisons. Adults
who could not be interviewed because of language spoken or cognitive or mental disabilities (3
percent in 2003) are excluded from this figure.
SOURCE: U.S. Department of Education, Institute of Education Sciences, National Center for
Education Statistics, 2003 National Assessment of Adult Literacy.
11
Chapter 2: Demographic Characteristics and Health Literacy
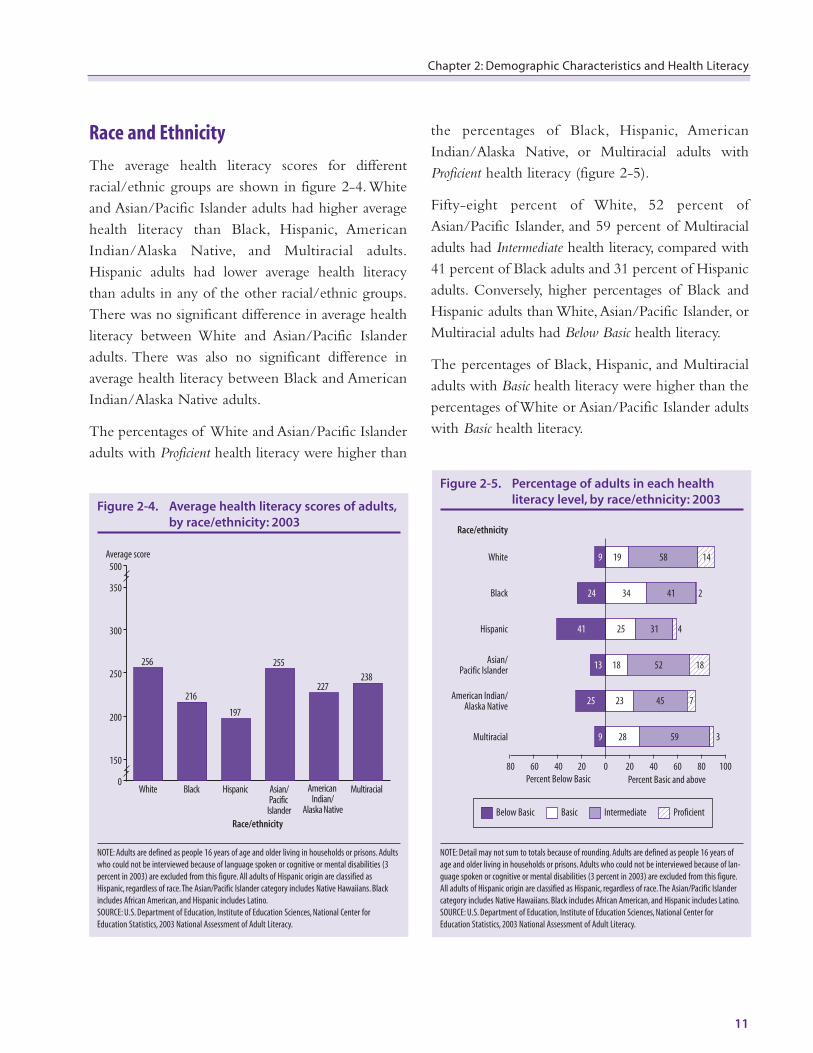
Race and Ethnicity
The average health literacy scores for differentracial/ethnic groups are shown in figure 2-4.Whiteand Asian/Pacific Islander adults had higher averagehealth literacy than Black, Hispanic, AmericanIndian/Alaska Native, and Multiracial adults.Hispanic adults had lower average health literacythan adults in any of the other racial/ethnic groups.There was no significant difference in average healthliteracy between White and Asian/Pacific Islanderadults. There was also no significant difference inaverage health literacy between Black and AmericanIndian/Alaska Native adults.
The percentages of White and Asian/Pacific Islanderadults with Proficient health literacy were higher than
the percentages of Black, Hispanic, AmericanIndian/Alaska Native, or Multiracial adults withProficient health literacy (figure 2-5).
Fifty-eight percent of White, 52 percent ofAsian/Pacific Islander, and 59 percent of Multiracialadults had Intermediate health literacy, compared with41 percent of Black adults and 31 percent of Hispanicadults. Conversely, higher percentages of Black andHispanic adults than White,Asian/Pacific Islander, orMultiracial adults had Below Basic health literacy.
The percentages of Black, Hispanic, and Multiracialadults with Basic health literacy were higher than thepercentages of White or Asian/Pacific Islander adultswith Basic health literacy.
Figure 2-4. Average health literacy scores of adults,
by race/ethnicity: 2003
0
150
200
250
Average score
300
350
500
Race/ethnicity
White Black Hispanic Asian/Pacific
Islander
American Indian/
Alaska Native
Multiracial
256
216
197
255
227238
NOTE: Adults are defined as people 16 years of age and older living in households or prisons. Adults
who could not be interviewed because of language spoken or cognitive or mental disabilities (3
percent in 2003) are excluded from this figure. All adults of Hispanic origin are classified as
Hispanic, regardless of race.The Asian/Pacific Islander category includes Native Hawaiians. Black
includes African American, and Hispanic includes Latino.
SOURCE: U.S. Department of Education, Institute of Education Sciences, National Center for
Education Statistics, 2003 National Assessment of Adult Literacy.
Figure 2-5. Percentage of adults in each health
literacy level, by race/ethnicity: 2003
Below Basic Basic Intermediate Proficient
0 20 40 60 80 1006080 40 20Percent Below Basic Percent Basic and above
Race/ethnicity
Multiracial
American Indian/Alaska Native
Asian/Pacific Islander
Hispanic
Black
White 9
24 34 41 2
41 25 31 4
13
25
9 28 59 3
19 58 14
18 52 18
23 45 7
NOTE: Detail may not sum to totals because of rounding. Adults are defined as people 16 years of
age and older living in households or prisons. Adults who could not be interviewed because of lan-
guage spoken or cognitive or mental disabilities (3 percent in 2003) are excluded from this figure.
All adults of Hispanic origin are classified as Hispanic, regardless of race.The Asian/Pacific Islander
category includes Native Hawaiians. Black includes African American, and Hispanic includes Latino.
SOURCE: U.S. Department of Education, Institute of Education Sciences, National Center for
Education Statistics, 2003 National Assessment of Adult Literacy.
The Health Literacy of America’s Adults
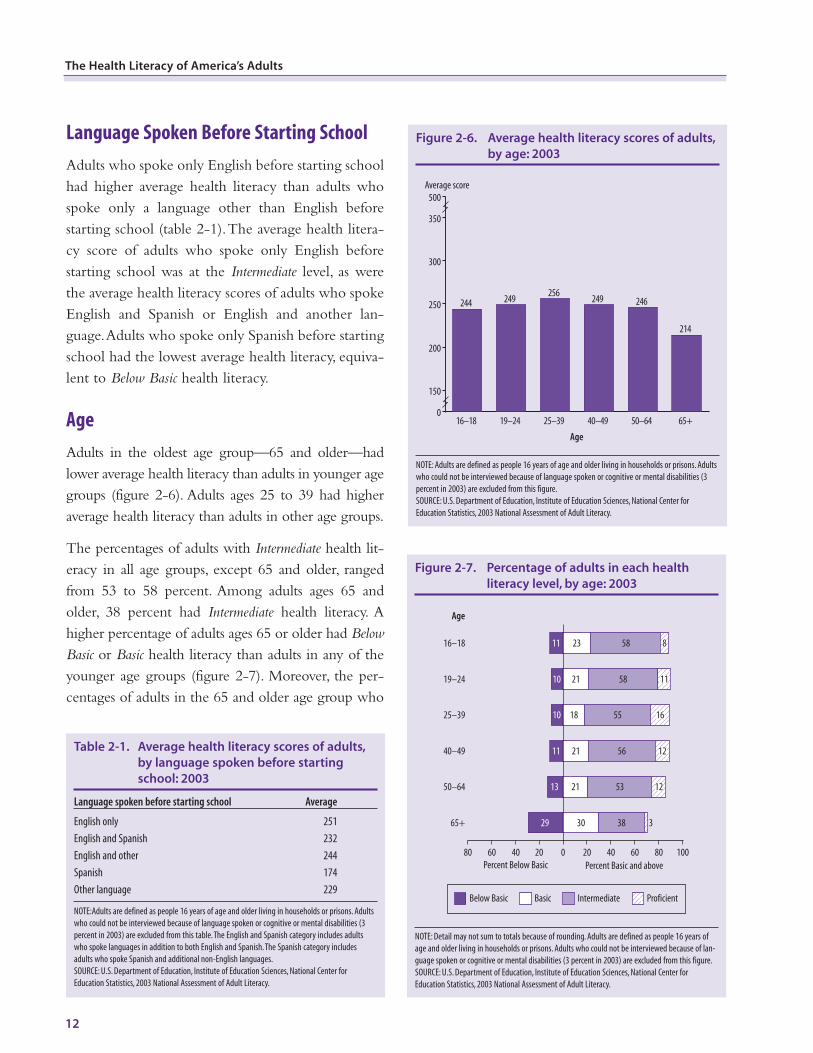
Language Spoken Before Starting School
Adults who spoke only English before starting schoolhad higher average health literacy than adults whospoke only a language other than English beforestarting school (table 2-1).The average health litera-cy score of adults who spoke only English beforestarting school was at the Intermediate level, as werethe average health literacy scores of adults who spokeEnglish and Spanish or English and another lan-guage.Adults who spoke only Spanish before startingschool had the lowest average health literacy, equiva-lent to Below Basic health literacy.
Age
Adults in the oldest age group—65 and older—hadlower average health literacy than adults in younger agegroups (figure 2-6). Adults ages 25 to 39 had higheraverage health literacy than adults in other age groups.
The percentages of adults with Intermediate health lit-eracy in all age groups, except 65 and older, rangedfrom 53 to 58 percent. Among adults ages 65 andolder, 38 percent had Intermediate health literacy. Ahigher percentage of adults ages 65 or older had BelowBasic or Basic health literacy than adults in any of theyounger age groups (figure 2-7). Moreover, the per-centages of adults in the 65 and older age group who
Figure 2-6. Average health literacy scores of adults,
by age: 2003
0
150
200
250
Average score
300
350
500
Age
16–18 19–24 25–39 40–49 50–64 65+
244 249256
249 246
214
NOTE: Adults are defined as people 16 years of age and older living in households or prisons. Adults
who could not be interviewed because of language spoken or cognitive or mental disabilities (3
percent in 2003) are excluded from this figure.
SOURCE: U.S. Department of Education, Institute of Education Sciences, National Center for
Education Statistics, 2003 National Assessment of Adult Literacy.
Figure 2-7. Percentage of adults in each health
literacy level, by age: 2003
Below Basic Basic Intermediate Proficient
0 20 40 60 80 1006080 40 20Percent Below Basic Percent Basic and above
Age
65+
50–64
40–49
25–39
19–24
16–18 11
10
10
11
13
29 30 38 3
23 58 8
21 58 11
18 55 16
21 56 12
21 53 12
NOTE: Detail may not sum to totals because of rounding. Adults are defined as people 16 years of
age and older living in households or prisons. Adults who could not be interviewed because of lan-
guage spoken or cognitive or mental disabilities (3 percent in 2003) are excluded from this figure.
SOURCE: U.S. Department of Education, Institute of Education Sciences, National Center for
Education Statistics, 2003 National Assessment of Adult Literacy.
Table 2-1. Average health literacy scores of adults,
by language spoken before starting
school: 2003
Language spoken before starting school Average
English only 251
English and Spanish 232
English and other 244
Spanish 174
Other language 229
NOTE:Adults are defined as people 16 years of age and older living in households or prisons. Adults
who could not be interviewed because of language spoken or cognitive or mental disabilities (3
percent in 2003) are excluded from this table.The English and Spanish category includes adults
who spoke languages in addition to both English and Spanish.The Spanish category includes
adults who spoke Spanish and additional non-English languages.
SOURCE: U.S. Department of Education, Institute of Education Sciences, National Center for
Education Statistics, 2003 National Assessment of Adult Literacy.
12
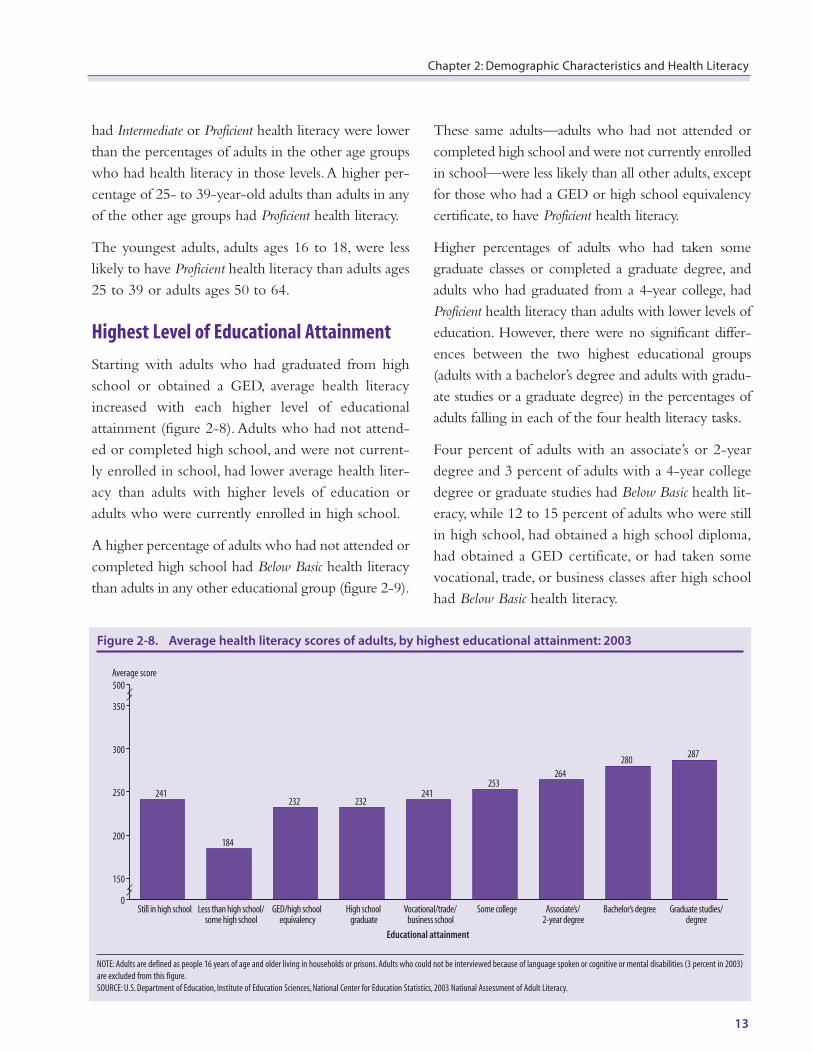
Figure 2-8. Average health literacy scores of adults, by highest educational attainment: 2003
241
184
232 232241
253264
280287
0
150
200
250
Average score
300
350
500
Educational attainment
Still in high school Less than high school/some high school
GED/high school equivalency
High school graduate
Vocational/trade/business school
Some college Bachelor’s degree Graduate studies/degree
Associate’s/2-year degree
NOTE: Adults are defined as people 16 years of age and older living in households or prisons. Adults who could not be interviewed because of language spoken or cognitive or mental disabilities (3 percent in 2003)
are excluded from this figure.
SOURCE: U.S. Department of Education, Institute of Education Sciences, National Center for Education Statistics, 2003 National Assessment of Adult Literacy.
had Intermediate or Proficient health literacy were lowerthan the percentages of adults in the other age groupswho had health literacy in those levels.A higher per-centage of 25- to 39-year-old adults than adults in anyof the other age groups had Proficient health literacy.
The youngest adults, adults ages 16 to 18, were lesslikely to have Proficient health literacy than adults ages25 to 39 or adults ages 50 to 64.
Highest Level of Educational Attainment
Starting with adults who had graduated from highschool or obtained a GED, average health literacyincreased with each higher level of educationalattainment (figure 2-8). Adults who had not attend-ed or completed high school, and were not current-ly enrolled in school, had lower average health liter-acy than adults with higher levels of education oradults who were currently enrolled in high school.
A higher percentage of adults who had not attended orcompleted high school had Below Basic health literacythan adults in any other educational group (figure 2-9).
These same adults—adults who had not attended orcompleted high school and were not currently enrolledin school—were less likely than all other adults, exceptfor those who had a GED or high school equivalencycertificate, to have Proficient health literacy.
Higher percentages of adults who had taken somegraduate classes or completed a graduate degree, andadults who had graduated from a 4-year college, hadProficient health literacy than adults with lower levels ofeducation. However, there were no significant differ-ences between the two highest educational groups(adults with a bachelor’s degree and adults with gradu-ate studies or a graduate degree) in the percentages ofadults falling in each of the four health literacy tasks.
Four percent of adults with an associate’s or 2-yeardegree and 3 percent of adults with a 4-year collegedegree or graduate studies had Below Basic health lit-eracy, while 12 to 15 percent of adults who were stillin high school, had obtained a high school diploma,had obtained a GED certificate, or had taken somevocational, trade, or business classes after high schoolhad Below Basic health literacy.
13
Chapter 2: Demographic Characteristics and Health Literacy
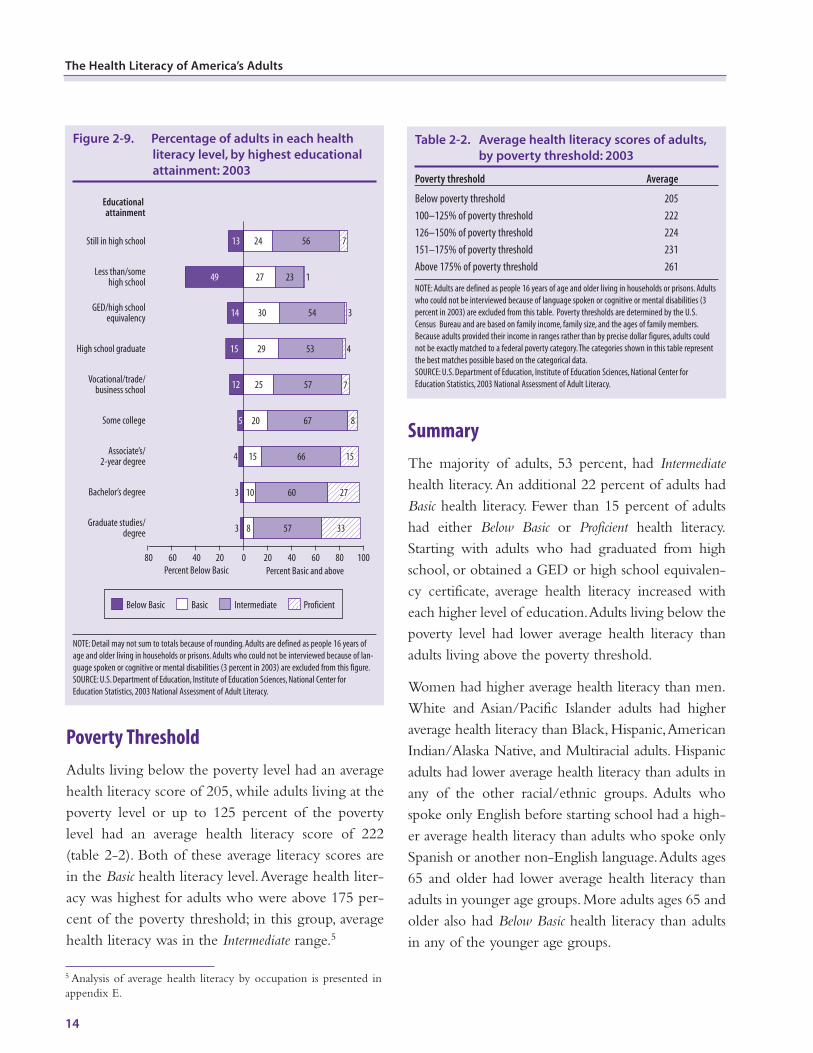
14
The Health Literacy of America’s Adults
Poverty Threshold
Adults living below the poverty level had an averagehealth literacy score of 205, while adults living at thepoverty level or up to 125 percent of the povertylevel had an average health literacy score of 222(table 2-2). Both of these average literacy scores arein the Basic health literacy level.Average health liter-acy was highest for adults who were above 175 per-cent of the poverty threshold; in this group, averagehealth literacy was in the Intermediate range.5
Summary
The majority of adults, 53 percent, had Intermediatehealth literacy.An additional 22 percent of adults hadBasic health literacy. Fewer than 15 percent of adultshad either Below Basic or Proficient health literacy.Starting with adults who had graduated from highschool, or obtained a GED or high school equivalen-cy certificate, average health literacy increased witheach higher level of education.Adults living below thepoverty level had lower average health literacy thanadults living above the poverty threshold.
Women had higher average health literacy than men.White and Asian/Pacific Islander adults had higheraverage health literacy than Black, Hispanic,AmericanIndian/Alaska Native, and Multiracial adults. Hispanicadults had lower average health literacy than adults inany of the other racial/ethnic groups. Adults whospoke only English before starting school had a high-er average health literacy than adults who spoke onlySpanish or another non-English language.Adults ages65 and older had lower average health literacy thanadults in younger age groups.More adults ages 65 andolder also had Below Basic health literacy than adultsin any of the younger age groups.
Figure 2-9. Percentage of adults in each health
literacy level, by highest educational
attainment: 2003
Below Basic Basic Intermediate Proficient
Graduate studies/degree
Bachelor’s degree
Some college
Vocational/trade/business school
High school graduate
GED/high school equivalency
Less than/some high school
Still in high school 13
49 27 23 1
14 30 54 3
15 29 53 4
12
5
4
3
3
Associate’s/2-year degree
24 56 7
25 57 7
20 67 8
15 66 15
10 60 27
8 57 33
0 20 40 60 80 1006080 40 20Percent Below Basic Percent Basic and above
Educational attainment
NOTE: Detail may not sum to totals because of rounding. Adults are defined as people 16 years of
age and older living in households or prisons. Adults who could not be interviewed because of lan-
guage spoken or cognitive or mental disabilities (3 percent in 2003) are excluded from this figure.
SOURCE: U.S. Department of Education, Institute of Education Sciences, National Center for
Education Statistics, 2003 National Assessment of Adult Literacy.
5 Analysis of average health literacy by occupation is presented inappendix E.
Table 2-2. Average health literacy scores of adults,
by poverty threshold: 2003
Poverty threshold Average
Below poverty threshold 205
100–125% of poverty threshold 222
126–150% of poverty threshold 224
151–175% of poverty threshold 231
Above 175% of poverty threshold 261
NOTE: Adults are defined as people 16 years of age and older living in households or prisons. Adults
who could not be interviewed because of language spoken or cognitive or mental disabilities (3
percent in 2003) are excluded from this table. Poverty thresholds are determined by the U.S.
Census Bureau and are based on family income, family size, and the ages of family members.
Because adults provided their income in ranges rather than by precise dollar figures, adults could
not be exactly matched to a federal poverty category.The categories shown in this table represent
the best matches possible based on the categorical data.
SOURCE: U.S. Department of Education, Institute of Education Sciences, National Center for
Education Statistics, 2003 National Assessment of Adult Literacy.
Overall Health, Health InsuranceCoverage, and Sources of InformationAbout Health Issues
Health literacy is of interest to providers ofhealth outreach programs for different seg-ments of the population. These providers
may include health insurance companies and peoplewho are designing educational programs related tohealth maintenance and improvement. A review ofmedical and public health literature noted that liter-acy has a direct influence on patient “access to cru-cial information about their rights and their healthcare, whether it involves following instruction forcare, taking medicine, comprehending disease-relat-ed information, or learning about disease preven-tion and health promotion” (Rudd et al. 1999).
This chapter examines the health literacy levels ofdifferent populations who may be targeted byhealth outreach programs, including adults with dif-ferent levels of overall health and adults who havedifferent types of health insurance coverage or nohealth insurance coverage at all.The analyses in thechapter also explore where adults with different lev-els of health literacy get information about healthissues.
The analyses of the literacy of adults who receivedvarious types of health insurance are based on thehousehold sample only. Analyses of adults whoreceived information about health issues from theInternet are also based on the household sample only
15
Self-Assessment of Overall
Health
Health Insurance
Sources of Information About
Health Issues
Summary
3CHAPTER THREE
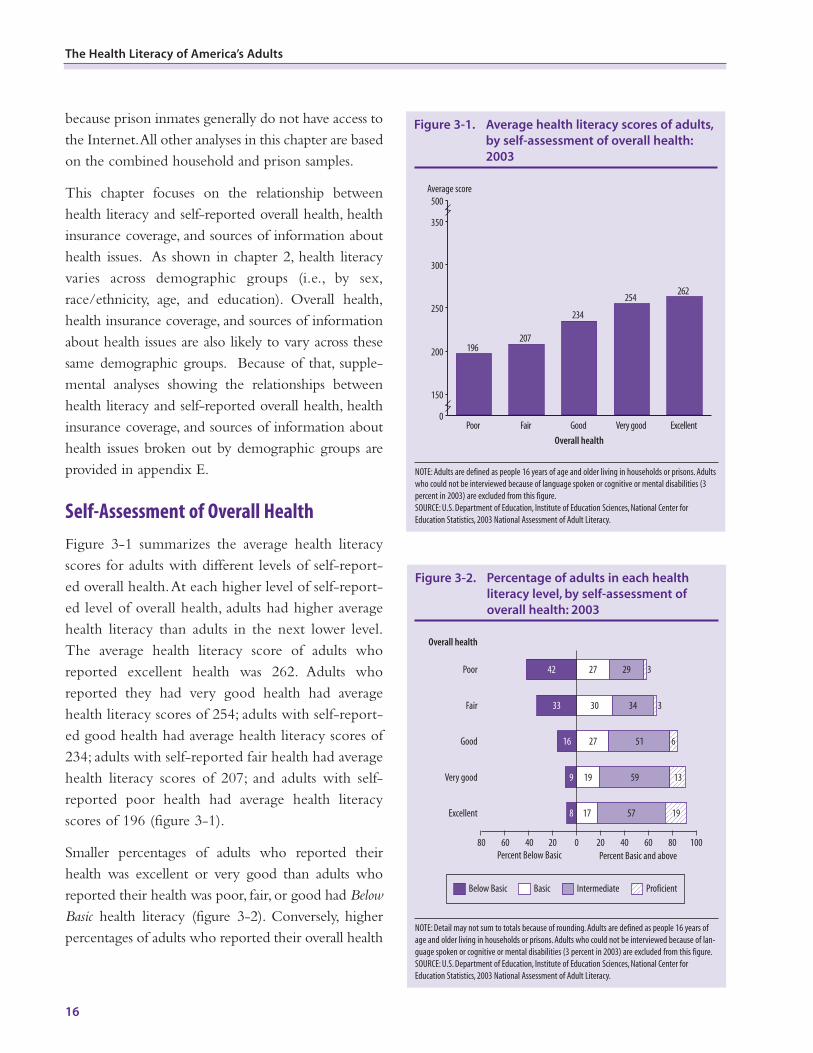
The Health Literacy of America’s Adults
because prison inmates generally do not have access tothe Internet.All other analyses in this chapter are basedon the combined household and prison samples.
This chapter focuses on the relationship betweenhealth literacy and self-reported overall health, healthinsurance coverage, and sources of information abouthealth issues. As shown in chapter 2, health literacyvaries across demographic groups (i.e., by sex,race/ethnicity, age, and education). Overall health,health insurance coverage, and sources of informationabout health issues are also likely to vary across thesesame demographic groups. Because of that, supple-mental analyses showing the relationships betweenhealth literacy and self-reported overall health, healthinsurance coverage, and sources of information abouthealth issues broken out by demographic groups areprovided in appendix E.
Self-Assessment of Overall Health
Figure 3-1 summarizes the average health literacyscores for adults with different levels of self-report-ed overall health.At each higher level of self-report-ed level of overall health, adults had higher averagehealth literacy than adults in the next lower level.The average health literacy score of adults whoreported excellent health was 262. Adults whoreported they had very good health had averagehealth literacy scores of 254; adults with self-report-ed good health had average health literacy scores of234; adults with self-reported fair health had averagehealth literacy scores of 207; and adults with self-reported poor health had average health literacyscores of 196 (figure 3-1).
Smaller percentages of adults who reported theirhealth was excellent or very good than adults whoreported their health was poor, fair, or good had BelowBasic health literacy (figure 3-2). Conversely, higherpercentages of adults who reported their overall health
Figure 3-1. Average health literacy scores of adults,
by self-assessment of overall health:
2003
196207
234
254262
0
150
200
250
Average score
300
350
500
Overall health
Poor Fair Good Very good Excellent
NOTE: Adults are defined as people 16 years of age and older living in households or prisons. Adults
who could not be interviewed because of language spoken or cognitive or mental disabilities (3
percent in 2003) are excluded from this figure.
SOURCE: U.S. Department of Education, Institute of Education Sciences, National Center for
Education Statistics, 2003 National Assessment of Adult Literacy.
16
Figure 3-2. Percentage of adults in each health
literacy level, by self-assessment of
overall health: 2003
Below Basic Basic Intermediate Proficient
42 27 29 3
33 30 34 3
16
9
8Excellent
Very good
Good
Fair
Poor
19 59 13
17 57 19
27 51 6
0 20 40 60 80 1006080 40 20Percent Below Basic Percent Basic and above
Overall health
NOTE: Detail may not sum to totals because of rounding. Adults are defined as people 16 years of
age and older living in households or prisons. Adults who could not be interviewed because of lan-
guage spoken or cognitive or mental disabilities (3 percent in 2003) are excluded from this figure.
SOURCE: U.S. Department of Education, Institute of Education Sciences, National Center for
Education Statistics, 2003 National Assessment of Adult Literacy.
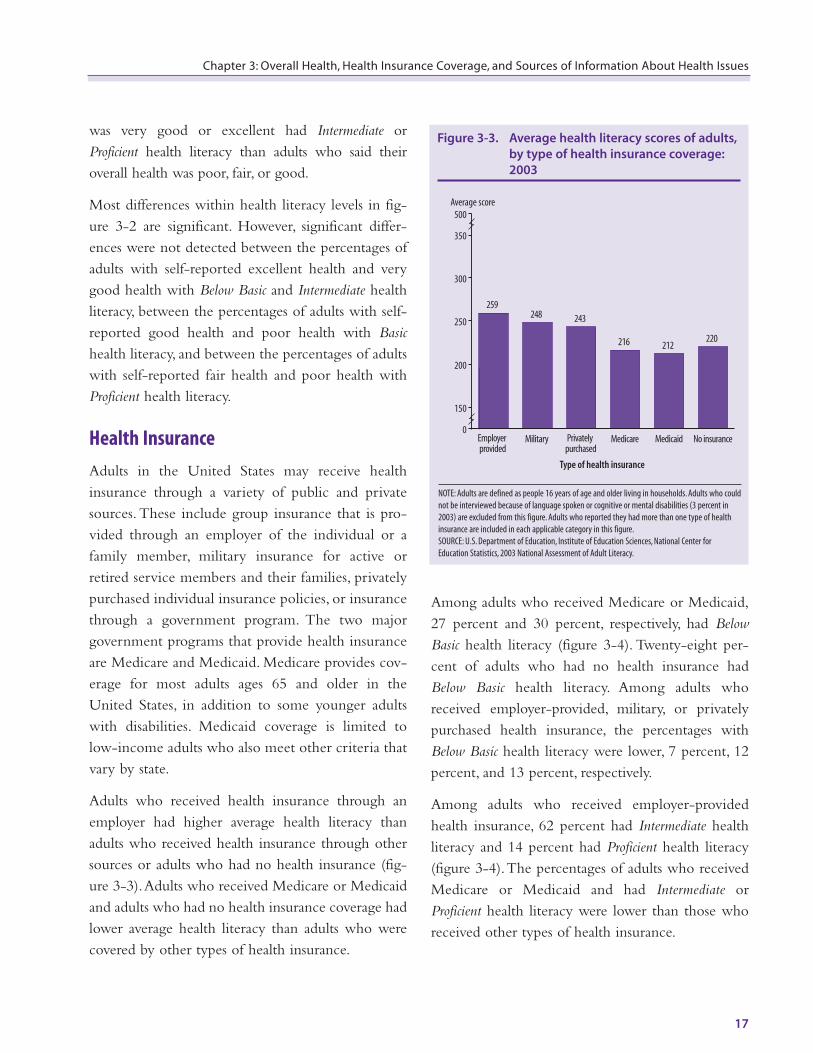
was very good or excellent had Intermediate orProficient health literacy than adults who said theiroverall health was poor, fair, or good.
Most differences within health literacy levels in fig-ure 3-2 are significant. However, significant differ-ences were not detected between the percentages ofadults with self-reported excellent health and verygood health with Below Basic and Intermediate healthliteracy, between the percentages of adults with self-reported good health and poor health with Basichealth literacy, and between the percentages of adultswith self-reported fair health and poor health withProficient health literacy.
Health Insurance
Adults in the United States may receive healthinsurance through a variety of public and privatesources. These include group insurance that is pro-vided through an employer of the individual or afamily member, military insurance for active orretired service members and their families, privatelypurchased individual insurance policies, or insurancethrough a government program. The two majorgovernment programs that provide health insuranceare Medicare and Medicaid. Medicare provides cov-erage for most adults ages 65 and older in theUnited States, in addition to some younger adultswith disabilities. Medicaid coverage is limited tolow-income adults who also meet other criteria thatvary by state.
Adults who received health insurance through anemployer had higher average health literacy thanadults who received health insurance through othersources or adults who had no health insurance (fig-ure 3-3).Adults who received Medicare or Medicaidand adults who had no health insurance coverage hadlower average health literacy than adults who werecovered by other types of health insurance.
Among adults who received Medicare or Medicaid,27 percent and 30 percent, respectively, had BelowBasic health literacy (figure 3-4). Twenty-eight per-cent of adults who had no health insurance hadBelow Basic health literacy. Among adults whoreceived employer-provided, military, or privatelypurchased health insurance, the percentages withBelow Basic health literacy were lower, 7 percent, 12percent, and 13 percent, respectively.
Among adults who received employer-providedhealth insurance, 62 percent had Intermediate healthliteracy and 14 percent had Proficient health literacy(figure 3-4).The percentages of adults who receivedMedicare or Medicaid and had Intermediate orProficient health literacy were lower than those whoreceived other types of health insurance.
Figure 3-3. Average health literacy scores of adults,
by type of health insurance coverage:
2003
Employer provided
Military Privately purchased
Medicare Medicaid No insurance
259248 243
216 212220
0
150
200
250
Average score
300
350
500
Type of health insurance
NOTE: Adults are defined as people 16 years of age and older living in households. Adults who could
not be interviewed because of language spoken or cognitive or mental disabilities (3 percent in
2003) are excluded from this figure. Adults who reported they had more than one type of health
insurance are included in each applicable category in this figure.
SOURCE: U.S. Department of Education, Institute of Education Sciences, National Center for
Education Statistics, 2003 National Assessment of Adult Literacy.
Chapter 3: Overall Health, Health Insurance Coverage, and Sources of Information About Health Issues
17
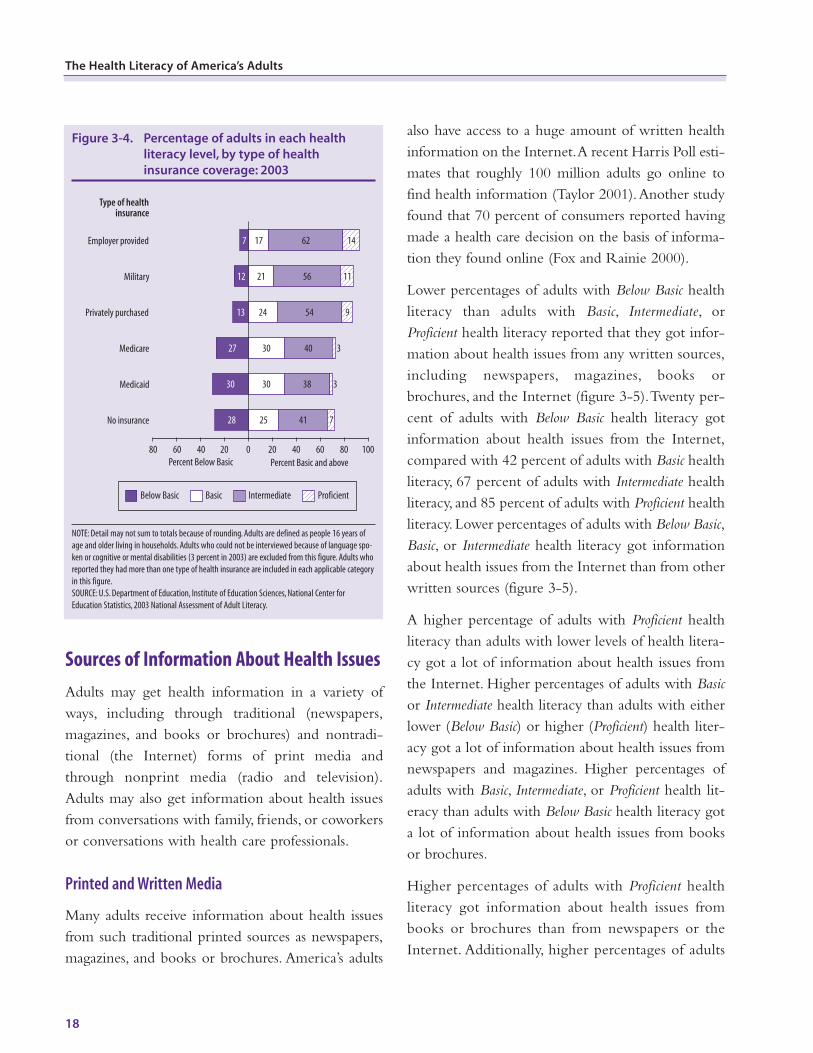
Sources of Information About Health Issues
Adults may get health information in a variety ofways, including through traditional (newspapers,magazines, and books or brochures) and nontradi-tional (the Internet) forms of print media andthrough nonprint media (radio and television).Adults may also get information about health issuesfrom conversations with family, friends, or coworkersor conversations with health care professionals.
Printed and Written Media
Many adults receive information about health issuesfrom such traditional printed sources as newspapers,magazines, and books or brochures. America’s adults
also have access to a huge amount of written healthinformation on the Internet.A recent Harris Poll esti-mates that roughly 100 million adults go online tofind health information (Taylor 2001).Another studyfound that 70 percent of consumers reported havingmade a health care decision on the basis of informa-tion they found online (Fox and Rainie 2000).
Lower percentages of adults with Below Basic healthliteracy than adults with Basic, Intermediate, orProficient health literacy reported that they got infor-mation about health issues from any written sources,including newspapers, magazines, books orbrochures, and the Internet (figure 3-5).Twenty per-cent of adults with Below Basic health literacy gotinformation about health issues from the Internet,compared with 42 percent of adults with Basic healthliteracy, 67 percent of adults with Intermediate healthliteracy, and 85 percent of adults with Proficient healthliteracy. Lower percentages of adults with Below Basic,Basic, or Intermediate health literacy got informationabout health issues from the Internet than from otherwritten sources (figure 3-5).
A higher percentage of adults with Proficient healthliteracy than adults with lower levels of health litera-cy got a lot of information about health issues fromthe Internet. Higher percentages of adults with Basicor Intermediate health literacy than adults with eitherlower (Below Basic) or higher (Proficient) health liter-acy got a lot of information about health issues fromnewspapers and magazines. Higher percentages ofadults with Basic, Intermediate, or Proficient health lit-eracy than adults with Below Basic health literacy gota lot of information about health issues from booksor brochures.
Higher percentages of adults with Proficient healthliteracy got information about health issues frombooks or brochures than from newspapers or theInternet. Additionally, higher percentages of adults
The Health Literacy of America’s Adults
18
Figure 3-4. Percentage of adults in each health
literacy level, by type of health
insurance coverage: 2003
Below Basic Basic Intermediate Proficient
0 20 40 60 80 1006080 40 20Percent Below Basic Percent Basic and above
Type of health insurance
7
12
13
27
30
28No insurance
Medicaid
Medicare
Privately purchased
Military
Employer provided 17 62 14
21 56 11
24 54 9
30 40 3
30 38 3
25 41 7
NOTE: Detail may not sum to totals because of rounding. Adults are defined as people 16 years of
age and older living in households. Adults who could not be interviewed because of language spo-
ken or cognitive or mental disabilities (3 percent in 2003) are excluded from this figure. Adults who
reported they had more than one type of health insurance are included in each applicable category
in this figure.
SOURCE: U.S. Department of Education, Institute of Education Sciences, National Center for
Education Statistics, 2003 National Assessment of Adult Literacy.
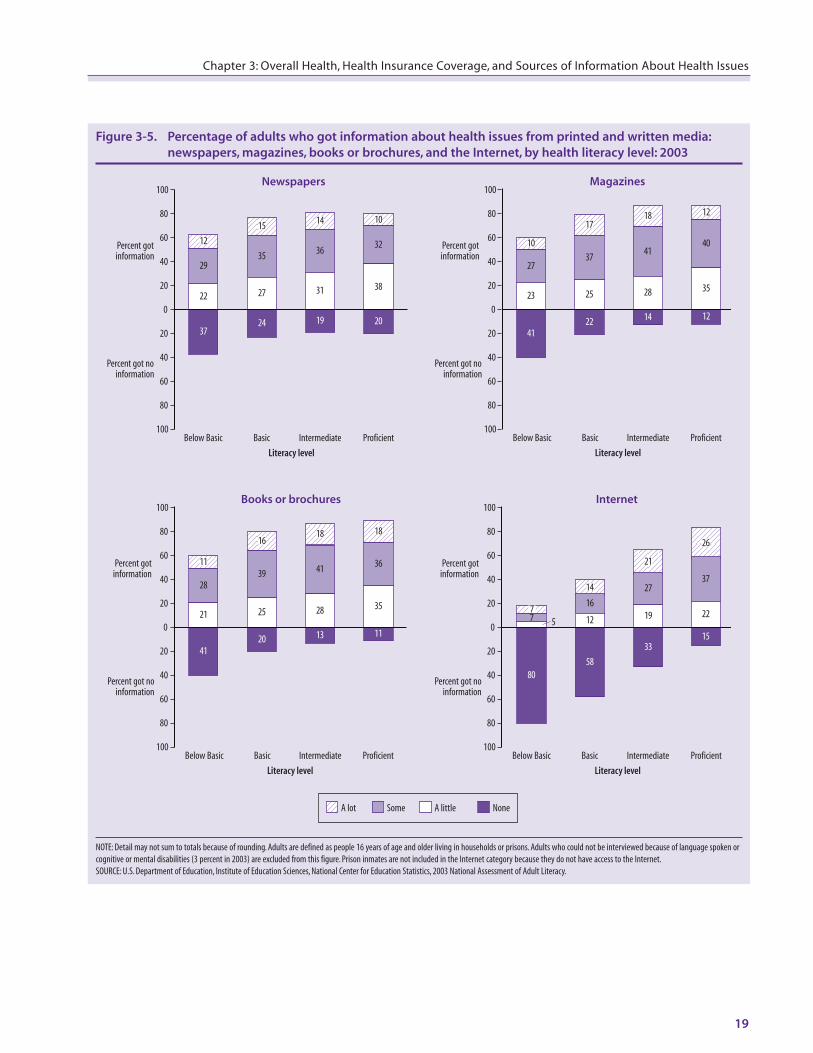
19
Chapter 3: Overall Health, Health Insurance Coverage, and Sources of Information About Health Issues
Figure 3-5. Percentage of adults who got information about health issues from printed and written media:
newspapers, magazines, books or brochures, and the Internet, by health literacy level: 2003
4122 14 12
Newspapers Magazines
NoneA littleSomeA lot
Books or brochures Internet
Percent got no information
Percent got information
0
20
20
40
40
60
60
80
80
100
100Below Basic Basic Intermediate Proficient
Literacy level
Percent got no information
Percent got information
0
20
20
40
40
60
60
80
80
100
100Below Basic Basic Intermediate Proficient
Literacy level
Percent got no information
Percent got information
0
20
20
40
40
60
60
80
80
100
100Below Basic Basic Intermediate Proficient
Literacy level
Percent got no information
Percent got information
0
20
20
40
40
60
60
80
80
100
100Below Basic Basic Intermediate Proficient
Literacy level
3724 19 20
4120 13 11
8058
3315
29
22
12
35
27
15
36
31
14
32
38
10
27
23
1037
25
17
41
28
18
40
35
12
7 57
16
12
14 27
19
21
37
22
26
28
21
1139
25
16
41
28
18
36
35
18
NOTE: Detail may not sum to totals because of rounding. Adults are defined as people 16 years of age and older living in households or prisons. Adults who could not be interviewed because of language spoken or
cognitive or mental disabilities (3 percent in 2003) are excluded from this figure. Prison inmates are not included in the Internet category because they do not have access to the Internet.
SOURCE: U.S. Department of Education, Institute of Education Sciences, National Center for Education Statistics, 2003 National Assessment of Adult Literacy.
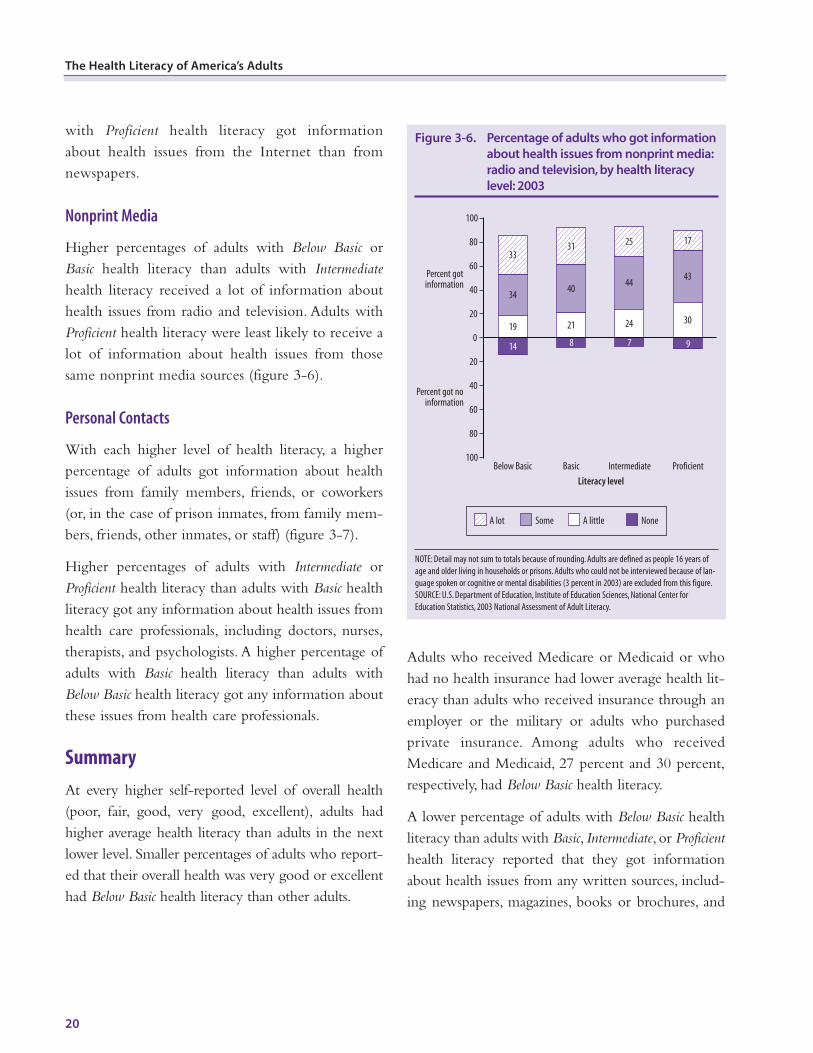
with Proficient health literacy got informationabout health issues from the Internet than fromnewspapers.
Nonprint Media
Higher percentages of adults with Below Basic orBasic health literacy than adults with Intermediatehealth literacy received a lot of information abouthealth issues from radio and television. Adults withProficient health literacy were least likely to receive alot of information about health issues from thosesame nonprint media sources (figure 3-6).
Personal Contacts
With each higher level of health literacy, a higherpercentage of adults got information about healthissues from family members, friends, or coworkers(or, in the case of prison inmates, from family mem-bers, friends, other inmates, or staff) (figure 3-7).
Higher percentages of adults with Intermediate orProficient health literacy than adults with Basic healthliteracy got any information about health issues fromhealth care professionals, including doctors, nurses,therapists, and psychologists. A higher percentage ofadults with Basic health literacy than adults withBelow Basic health literacy got any information aboutthese issues from health care professionals.
Summary
At every higher self-reported level of overall health(poor, fair, good, very good, excellent), adults hadhigher average health literacy than adults in the nextlower level. Smaller percentages of adults who report-ed that their overall health was very good or excellenthad Below Basic health literacy than other adults.
Adults who received Medicare or Medicaid or whohad no health insurance had lower average health lit-eracy than adults who received insurance through anemployer or the military or adults who purchasedprivate insurance. Among adults who receivedMedicare and Medicaid, 27 percent and 30 percent,respectively, had Below Basic health literacy.
A lower percentage of adults with Below Basic healthliteracy than adults with Basic, Intermediate, or Proficienthealth literacy reported that they got informationabout health issues from any written sources, includ-ing newspapers, magazines, books or brochures, and
20
The Health Literacy of America’s Adults
Figure 3-6. Percentage of adults who got information
about health issues from nonprint media:
radio and television, by health literacy
level: 2003
None A little Some A lot
Percent got no information
Percent got information
0
20
20
40
40
60
60
80
80
100
100Below Basic Basic Intermediate Proficient
Literacy level
33
34
19
14
25
44
24
7
17
43
30
98
31
40
21
NOTE: Detail may not sum to totals because of rounding. Adults are defined as people 16 years of
age and older living in households or prisons. Adults who could not be interviewed because of lan-
guage spoken or cognitive or mental disabilities (3 percent in 2003) are excluded from this figure.
SOURCE: U.S. Department of Education, Institute of Education Sciences, National Center for
Education Statistics, 2003 National Assessment of Adult Literacy.
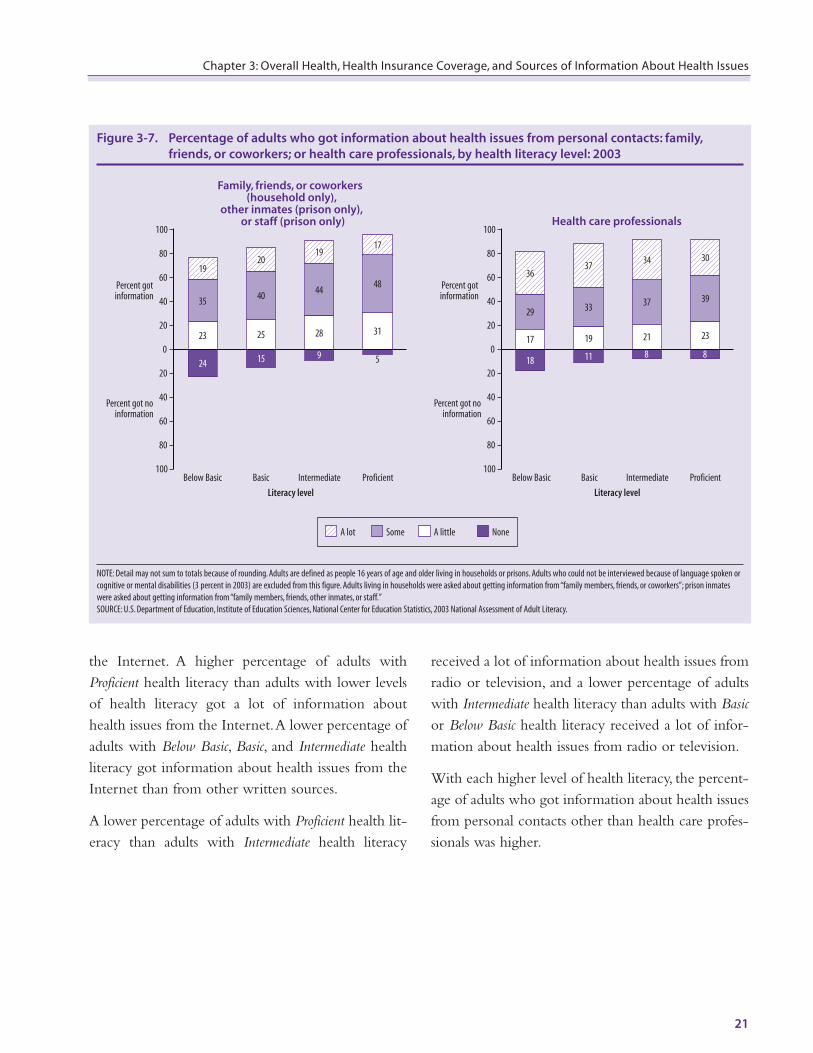
the Internet. A higher percentage of adults withProficient health literacy than adults with lower levelsof health literacy got a lot of information abouthealth issues from the Internet.A lower percentage ofadults with Below Basic, Basic, and Intermediate healthliteracy got information about health issues from theInternet than from other written sources.
A lower percentage of adults with Proficient health lit-eracy than adults with Intermediate health literacy
received a lot of information about health issues fromradio or television, and a lower percentage of adultswith Intermediate health literacy than adults with Basicor Below Basic health literacy received a lot of infor-mation about health issues from radio or television.
With each higher level of health literacy, the percent-age of adults who got information about health issuesfrom personal contacts other than health care profes-sionals was higher.
Chapter 3: Overall Health, Health Insurance Coverage, and Sources of Information About Health Issues
21
Figure 3-7. Percentage of adults who got information about health issues from personal contacts: family,
friends, or coworkers; or health care professionals, by health literacy level: 2003
18 11 8 824 15 9
Family, friends, or coworkers (household only),
other inmates (prison only), or staff (prison only) Health care professionals
None A little Some A lot
36
29
17
37
33
19
34
37
21
30
39
23
19
35
23
20
40
25
19
44
28
17
48
31
5
Percent got no information
Percent got information
0
20
20
40
40
60
60
80
80
100
100Below Basic Basic Intermediate Proficient
Literacy level
Percent got no information
Percent got information
0
20
20
40
40
60
60
80
80
100
100Below Basic Basic Intermediate Proficient
Literacy level
NOTE: Detail may not sum to totals because of rounding. Adults are defined as people 16 years of age and older living in households or prisons. Adults who could not be interviewed because of language spoken or
cognitive or mental disabilities (3 percent in 2003) are excluded from this figure. Adults living in households were asked about getting information from “family members, friends, or coworkers”; prison inmates
were asked about getting information from “family members, friends, other inmates, or staff.”
SOURCE: U.S. Department of Education, Institute of Education Sciences, National Center for Education Statistics, 2003 National Assessment of Adult Literacy.

Sample Health Literacy Assessment Question
Respondents who participated in the 2003assessment were asked to complete prose,document, and quantitative literacy tasks
of varying levels of difficulty.The sample questionon the following page illustrates the type of taskused to measure the health literacy of America’sadults.This question was originally developed forthe 1992 survey and reused in 2003.
Consistent with the design of the assessment, thesample question appears before the text needed toanswer the question. The percentage of respon-dents who answered the question correctly isreported, as well as the percentage of correctresponses for each of the four health literacy assess-ment levels.
More information about the sample assessmentquestions can be found on the Internet athttp://nces.ed.gov/naal.
23
AAPPENDIX A
24
The Health Literacy of America’s Adults
Prose and Health Literacy Question
Refer to the article on the next page to answer the following question.
According to the brochure, why is it difficult for people to know if they have high blood pressure?
_______________________________________________________________________________
_______________________________________________________________________________
Correct answer
Any statement such as the following:
Symptoms are not usually present
High blood pressure is silent
All Adults Below Basic Basic Intermediate Proficient
74 10 71 94 100
NOTE: Adults are defined as people 16 years of age and older living in households or prisons. Adults who could not be interviewed because of language spoken or cognitive or mental disabilities (3 percent in 2003)
are excluded from these data.
SOURCE: U.S. Department of Education, Institute of Education Sciences, National Center for Education Statistics, 2003 National Assessment of Adult Literacy.
Percentage of adults who answered the question correctly, health literacy scale: 2003
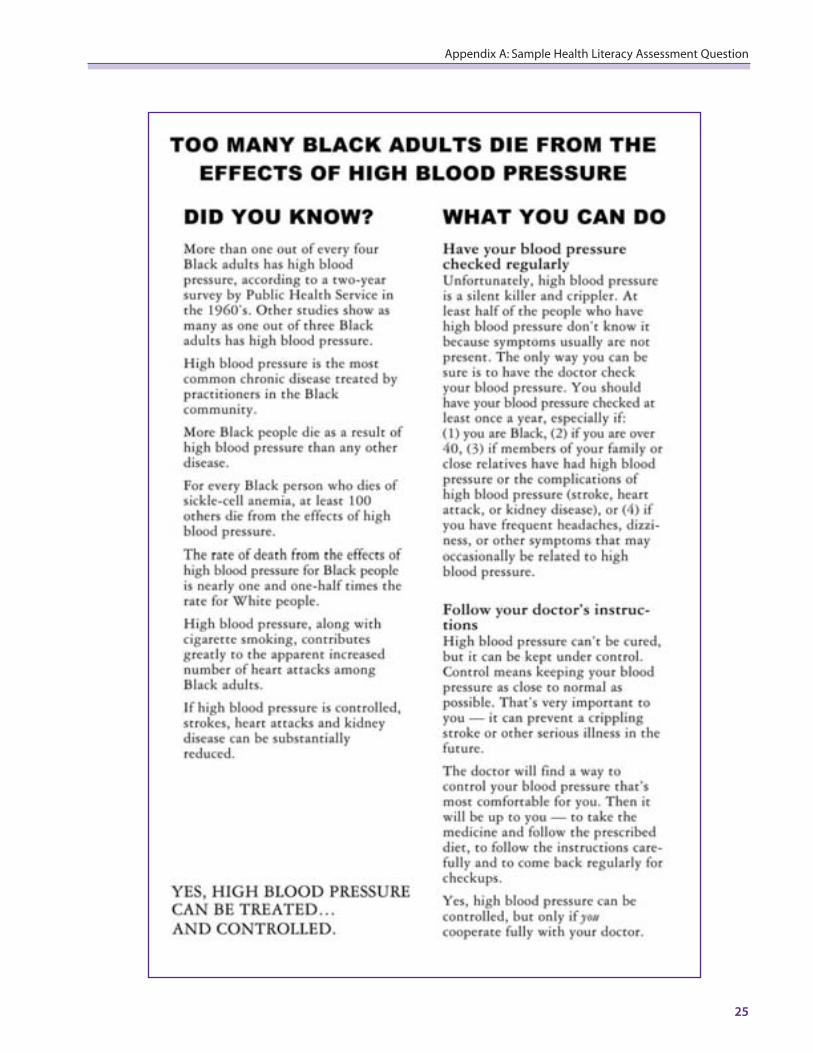
25
Appendix A: Sample Health Literacy Assessment Question

Definitions of All Subpopulations and Background Variables Reported
For the exact wording of background questions, see http://nces.ed.gov/naal.
Chapter 2
Total Population
The 2003 National Assessment of Adult Literacyincluded two samples: (1) adults ages 16 and olderliving in households and (2) inmates ages 16 andolder in federal and state prisons. The householdsample also included adults in six states that choseto participate in a concurrent State Assessment ofAdult Literacy: Kentucky, Maryland, Massachusetts,Missouri, Oklahoma, and New York. Each samplewas weighted to represent its share of the totalpopulation of the United States (99 percent for thehousehold sample and 1 percent for the prisonsample). The household and prison samples werecombined to create a nationally representativesample of America’s adults. Household data collec-tion was conducted from March 2003 throughFebruary 2004; prison data collection was con-ducted from March through July 2004.
27
BAPPENDIX B
Gender
Interviewers recorded the gender of each respondent.
Race and Ethnicity
In 2003, all respondents were asked two or threequestions about their race and ethnicity. The firstquestion asked them to indicate whether they wereHispanic or Latino.
If a respondent answered that he or she was Hispanicor Latino, the respondent was asked to choose one ormore of the following groups to describe his or herHispanic origin:
■ Mexican, Mexican American, or Chicano
■ Puerto Rican or Puerto Rican American
■ Cuban or Cuban American
■ Central or South American
■ Other Hispanic or Latino background
Respondents who identified more than one of thegroups to describe their Hispanic origin were classi-fied as “Other Hispanic or Latino background.”
Then, all respondents, including those who indicatedthey were Hispanic or Latino, were asked to chooseone or more of the following groups to describethemselves:
■ White
■ Black or African American
■ Asian
■ American Indian or Alaska Native
■ Native Hawaiian or other Pacific Islander
Individuals who responded “yes” to the first questionwere coded as Hispanic, regardless of their answer tothe second question. Individuals who identifiedmore than one group on the second question werecoded as Multiracial. Respondents of Native
Hawaiian or Pacific Islander origin were groupedwith those of Asian origin. The White, Black, andHispanic groups are reported separately. The inter-viewer recorded the race/ethnicity of respondentswho refused to answer the question.
Age
All respondents were asked to report their birthdates, and this information was used to calculate theirage. Age groups reported are 16 to 18, 19 to 24, 25to 39, 40 to 49, 50 to 64, and 65 and older. Agegroups were selected to correspond to key life stagesof many adults:
16-18: Completion of secondary education
19-24: College or job training
25-39: Early career
40-49: Mid-career
50-64: Late career
65 and older: Retirement
Highest Level of Educational Attainment
All respondents were asked to indicate the highestlevel of education they had completed.The followingoptions were provided:
■ Still in high school
■ Less than high school
■ Some high school
■ GED or high school equivalency
■ High school graduate
■ Vocational, trade, or business school after highschool
■ College: less than 2 years
■ College:Associate’s degree (A.A.)
■ College: 2 or more years, no degree
■ College graduate (B.A. or B.S.)
28
The Health Literacy of America’s Adults
■ Postgraduate, no degree
■ Postgraduate degree (M.S., M.A., Ph.D., M.D.,etc.)
Respondents who reported less than high school orsome high school were asked how many years ofeducation they completed. For certain analyses, someof these groups were collapsed. For example, respon-dents who reported some postgraduate study but nodegree were generally combined with those who hadcompleted a postgraduate degree.
Chapter 3
Self-Assessment of Overall Health
Respondents were asked how, in general, they wouldrate their overall health.They were given the follow-ing response options: excellent, very good, good,fair, poor.
Health Insurance
Respondents were asked whether they received thefollowing types of health insurance: health insurancethrough your work (school) or a family member’swork,Medicare, health insurance you or someone elsein your family purchased directly from an insurance
company or other organization that is not related topast or current employment, health insurance provid-ed as part of military service, Medicaid. Respondentscould indicate that they received multiple types ofhealth insurance.Adults who received more than onetype of health insurance were included in multiplecategories for the analyses in this report. Adults inprisons were not asked this question and they are notincluded in the analyses.
Sources of Information About Health Issues
Household respondents were asked how much infor-mation about health issues, such as diet, exercise, dis-ease prevention, or a specific disease or health condi-tion, they got from newspapers, magazines, theInternet, radio and television, books or brochures;family members, friends, or coworkers; or talking todoctors, nurses, therapists, or psychologists. Theywere given the following response options: a lot,some, a little, none. Prison respondents were askedthe same question, but instead of “family members,friends, or coworkers,” they were asked about “fami-ly members, friends, other inmates, or staff.” Prisonrespondents were not asked about the Internetbecause most prison inmates do not have access tothe Internet.
29
Appendix B: Definitions of All Subpopulations and Background Variables Reported

31
toc
1CHAPTER ONE
Technical Notes
This appendix describes the sampling, datacollection, weighting and variance estima-tion, scaling, and statistical testing proce-
dures used to collect and analyze the data for the2003 National Assessment of Adult Literacy(NAAL). Household data collection was conduct-ed from March 2003 through February 2004;prison data collection was conducted from Marchthrough July 2004.
Sampling
The 2003 National Assessment of Adult Literacyincluded two samples: (1) adults ages 16 and olderliving in households (99 percent of the sampleweighted) and (2) inmates ages 16 and older in fed-eral and state prisons (1 percent of the sampleweighted). Each sample was weighted to representits share of the total population of the United States,and the samples were combined for reporting.
Household Sample
The 2003 National Assessment of Adult Literacyhousehold sample included a nationally represen-tative probability sample of 35,365 households.The household sample was selected on the basis ofa four-stage, stratified area sample: (1) primarysampling units (PSUs) consisting of counties orgroups of contiguous counties; (2) secondary sam-pling units (referred to as segments) consisting ofarea blocks; (3) housing units containing house-holds; and (4) eligible persons within households.Person-level data were collected through a screener,
CAPPENDIX C
a background questionnaire, the literacy assessment,and the oral module. Of the 35,365 sampled house-holds, 4,671 were either vacant or not a dwelling unit,resulting in a sample of 30,694 households.1 A total of25,123 households completed the screener, whichwas used to select survey respondents. The finalscreener response rate was 81.2 percent weighted.
On the basis of the screener data, 23,732 respondentsages 16 and older were selected to complete thebackground questionnaire and the assessment; 18,186actually completed the background questionnaire. Ofthe 5,546 respondents who did not complete thebackground questionnaire, 355 were unable to do sobecause of a literacy-related barrier, either the inabil-ity to communicate in English or Spanish (the twolanguages in which the background questionnairewas administered) or a mental disability.
The final response rate for the background question-naire, which included respondents who completedthe background questionnaire and respondents whowere unable to complete the background question-naire because of language problems or a mental dis-ability, was 76.6 percent weighted. Of the 18,186adults ages 16 and older who completed the back-ground questionnaire, 17,178 completed at least onequestion on each of the three scales—prose, docu-ment, and quantitative—measured in the adult liter-acy assessment. An additional 149 were unable toanswer at least one question on each of the threescales for literacy-related reasons.2 The final responserate for the literacy assessment, which included
respondents who answered at least one question oneach scale plus the 149 respondents who were unableto do so because of language problems or a mentaldisability, was 96.6 percent weighted.
Cases were considered complete if the respondentcompleted the background questionnaire and at leastone question on each of the three scales or if therespondent was unable to answer any questionsbecause of language issues (an inability to communi-cate in English or Spanish) or a mental disability. Allother cases that did not include a complete screener,a background questionnaire, and responses to at leastone question on each of the three literacy scales wereconsidered incomplete or missing. Before imputa-tion, the overall response rate for the household sam-ple was 60.1 percent weighted.
For respondents who did not complete any literacytasks on any scale, no information is available abouttheir performance on the literacy scale they weremissing. Completely omitting these individuals fromthe analyses would have resulted in unknown biasesin estimates of the literacy skills of the national pop-ulation because refusals cannot be assumed to haveoccurred randomly. For 859 respondents3 whoanswered the background questionnaire but refused tocomplete the assessment for reasons other than lan-guage issues or a mental disability, regression-basedimputation procedures were applied to imputeresponses to one assessment item on each scale byusing the NAAL background data on age, gender,race/ethnicity, education level, country of birth, cen-sus region, and metropolitan statistical area status.
On the prose and quantitative scales, a response wasimputed for the easiest task on each scale. On the
32
The Health Literacy of America’s Adults
3 Of the 18,186 household respondents who completed the back-ground questionnaire, 17,178 completed at least one question oneach of the three scales and 149 were unable to answer at least onequestion on one or more of the scales for literacy-related reasons.The remaining 859 respondents completed the background ques-tionnaire but refused to complete the assessment.
1To increase the number of Black and Hispanic adults in the NAALsample, segments with moderate to high concentrations of Blackand Hispanic adults were given a higher selection probability.Segments in which Blacks or Hispanics accounted for 25 percentor more of the population were oversampled at a rate up to threetimes that of the remainder of the segments.
2 Of the 149 respondents who were unable to answer at least onequestion on each of the three scales for literacy-related reasons, 65respondents answered at least one question on one scale. Theremaining 84 respondents did not answer any questions on any scale.
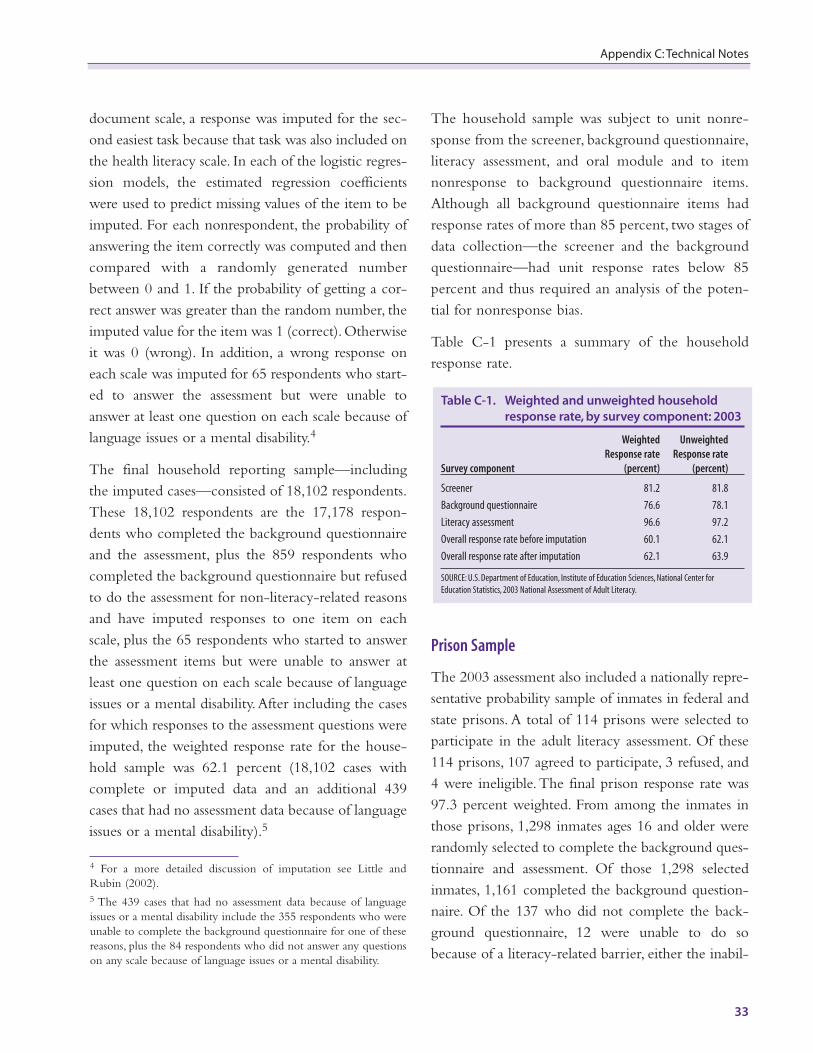
document scale, a response was imputed for the sec-ond easiest task because that task was also included onthe health literacy scale. In each of the logistic regres-sion models, the estimated regression coefficientswere used to predict missing values of the item to beimputed. For each nonrespondent, the probability ofanswering the item correctly was computed and thencompared with a randomly generated numberbetween 0 and 1. If the probability of getting a cor-rect answer was greater than the random number, theimputed value for the item was 1 (correct).Otherwiseit was 0 (wrong). In addition, a wrong response oneach scale was imputed for 65 respondents who start-ed to answer the assessment but were unable toanswer at least one question on each scale because oflanguage issues or a mental disability.4
The final household reporting sample—includingthe imputed cases—consisted of 18,102 respondents.These 18,102 respondents are the 17,178 respon-dents who completed the background questionnaireand the assessment, plus the 859 respondents whocompleted the background questionnaire but refusedto do the assessment for non-literacy-related reasonsand have imputed responses to one item on eachscale, plus the 65 respondents who started to answerthe assessment items but were unable to answer atleast one question on each scale because of languageissues or a mental disability.After including the casesfor which responses to the assessment questions wereimputed, the weighted response rate for the house-hold sample was 62.1 percent (18,102 cases withcomplete or imputed data and an additional 439cases that had no assessment data because of languageissues or a mental disability).5
The household sample was subject to unit nonre-sponse from the screener, background questionnaire,literacy assessment, and oral module and to itemnonresponse to background questionnaire items.Although all background questionnaire items hadresponse rates of more than 85 percent, two stages ofdata collection—the screener and the backgroundquestionnaire—had unit response rates below 85percent and thus required an analysis of the poten-tial for nonresponse bias.
Table C-1 presents a summary of the householdresponse rate.
Prison Sample
The 2003 assessment also included a nationally repre-sentative probability sample of inmates in federal andstate prisons. A total of 114 prisons were selected toparticipate in the adult literacy assessment. Of these114 prisons, 107 agreed to participate, 3 refused, and4 were ineligible. The final prison response rate was97.3 percent weighted. From among the inmates inthose prisons, 1,298 inmates ages 16 and older wererandomly selected to complete the background ques-tionnaire and assessment. Of those 1,298 selectedinmates, 1,161 completed the background question-naire. Of the 137 who did not complete the back-ground questionnaire, 12 were unable to do sobecause of a literacy-related barrier, either the inabil-
33
Appendix C: Technical Notes
Table C-1. Weighted and unweighted household
response rate, by survey component: 2003
Weighted UnweightedResponse rate Response rate
Survey component (percent) (percent)
Screener 81.2 81.8
Background questionnaire 76.6 78.1
Literacy assessment 96.6 97.2
Overall response rate before imputation 60.1 62.1
Overall response rate after imputation 62.1 63.9
SOURCE: U.S. Department of Education, Institute of Education Sciences, National Center for
Education Statistics, 2003 National Assessment of Adult Literacy.
4 For a more detailed discussion of imputation see Little andRubin (2002).5 The 439 cases that had no assessment data because of languageissues or a mental disability include the 355 respondents who wereunable to complete the background questionnaire for one of thesereasons, plus the 84 respondents who did not answer any questionson any scale because of language issues or a mental disability.
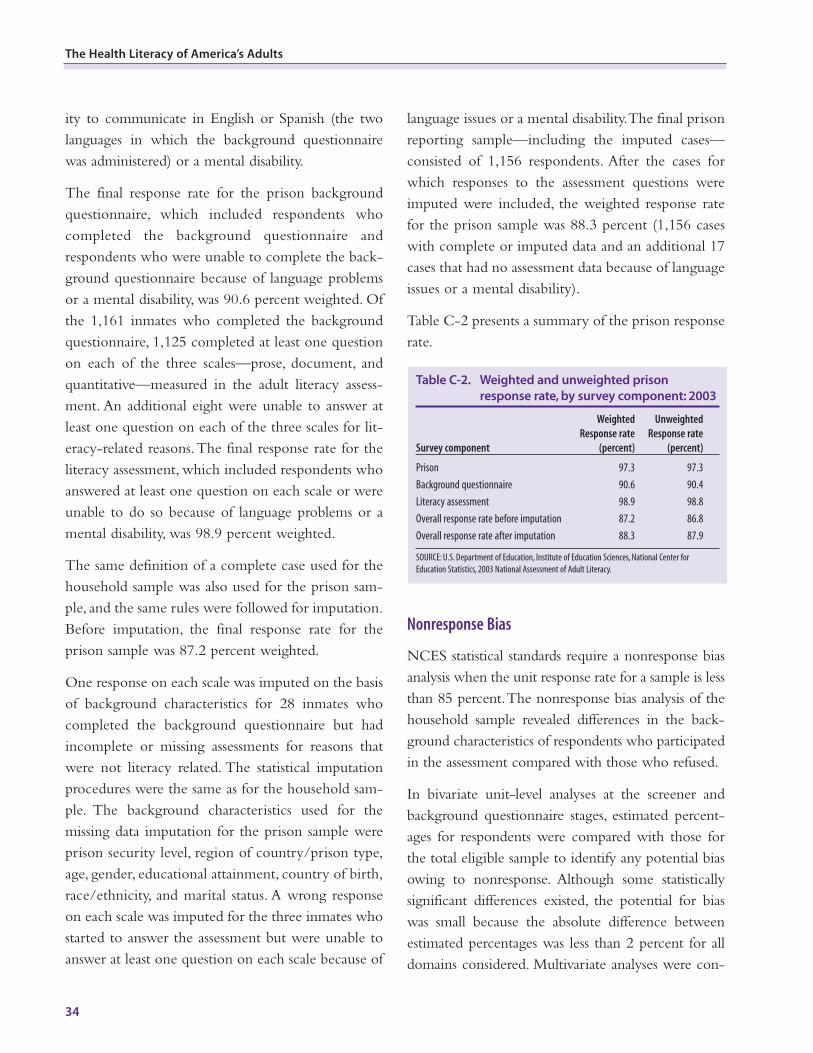
ity to communicate in English or Spanish (the twolanguages in which the background questionnairewas administered) or a mental disability.
The final response rate for the prison backgroundquestionnaire, which included respondents whocompleted the background questionnaire andrespondents who were unable to complete the back-ground questionnaire because of language problemsor a mental disability, was 90.6 percent weighted. Ofthe 1,161 inmates who completed the backgroundquestionnaire, 1,125 completed at least one questionon each of the three scales—prose, document, andquantitative—measured in the adult literacy assess-ment. An additional eight were unable to answer atleast one question on each of the three scales for lit-eracy-related reasons.The final response rate for theliteracy assessment, which included respondents whoanswered at least one question on each scale or wereunable to do so because of language problems or amental disability, was 98.9 percent weighted.
The same definition of a complete case used for thehousehold sample was also used for the prison sam-ple, and the same rules were followed for imputation.Before imputation, the final response rate for theprison sample was 87.2 percent weighted.
One response on each scale was imputed on the basisof background characteristics for 28 inmates whocompleted the background questionnaire but hadincomplete or missing assessments for reasons thatwere not literacy related. The statistical imputationprocedures were the same as for the household sam-ple. The background characteristics used for themissing data imputation for the prison sample wereprison security level, region of country/prison type,age, gender, educational attainment, country of birth,race/ethnicity, and marital status. A wrong responseon each scale was imputed for the three inmates whostarted to answer the assessment but were unable toanswer at least one question on each scale because of
language issues or a mental disability.The final prisonreporting sample—including the imputed cases—consisted of 1,156 respondents. After the cases forwhich responses to the assessment questions wereimputed were included, the weighted response ratefor the prison sample was 88.3 percent (1,156 caseswith complete or imputed data and an additional 17cases that had no assessment data because of languageissues or a mental disability).
Table C-2 presents a summary of the prison responserate.
Nonresponse Bias
NCES statistical standards require a nonresponse biasanalysis when the unit response rate for a sample is lessthan 85 percent.The nonresponse bias analysis of thehousehold sample revealed differences in the back-ground characteristics of respondents who participatedin the assessment compared with those who refused.
In bivariate unit-level analyses at the screener andbackground questionnaire stages, estimated percent-ages for respondents were compared with those forthe total eligible sample to identify any potential biasowing to nonresponse. Although some statisticallysignificant differences existed, the potential for biaswas small because the absolute difference betweenestimated percentages was less than 2 percent for alldomains considered. Multivariate analyses were con-
34
The Health Literacy of America’s Adults
Table C-2. Weighted and unweighted prison
response rate, by survey component: 2003
Weighted UnweightedResponse rate Response rate
Survey component (percent) (percent)
Prison 97.3 97.3
Background questionnaire 90.6 90.4
Literacy assessment 98.9 98.8
Overall response rate before imputation 87.2 86.8
Overall response rate after imputation 88.3 87.9
SOURCE: U.S. Department of Education, Institute of Education Sciences, National Center for
Education Statistics, 2003 National Assessment of Adult Literacy.
ducted to further explore the potential for nonre-sponse bias by identifying the domains with the mostdifferential response rates. These analyses revealedthat the lowest response rates for the screener wereamong dwelling units in segments with high medianincome, small average household size, and a largeproportion of renters. The lowest response rates forthe background questionnaire were among malesages 30 and older in segments with high medianincome. However, the variables used to define theseareas and other pockets with low response rates wereused in weighting adjustments. The analysis showedthat weighting adjustments was highly effective inreducing the bias.The general conclusion was that thepotential amount of nonresponse bias attributable tounit nonresponse at the screener and backgroundquestionnaire stages was likely to be negligible.
Data Collection
Household interviews took place in respondents’homes; prison interviews generally took place in aclassroom or library in the prison. Whenever possi-ble, interviewers administered the background ques-tionnaire and assessment in a private setting. Unlessthere were security concerns, a guard was not pres-ent in the room when inmates were interviewed.
Interviewers used a computer-assisted personal inter-viewing (CAPI) system programmed into laptopcomputers. The interviewers read the backgroundquestions from the computer screen and entered allresponses directly into the computer.Skip patterns andfollow-up probes for contradictory or out-of-rangeresponses were programmed into the computer.
After completing the background questionnaire,respondents were handed a booklet with the assess-ment questions. The interviewers followed a scriptthat introduced the assessment booklet and guidedthe respondent through the assessment.
Each assessment booklet began with the same sevenquestions. After the respondent completed thosequestions, the interviewer asked the respondent forthe book and used an algorithm to determine on thebasis of the responses to the first seven questionswhether the respondent should continue in the mainassessment or be placed in the Adult LiteracySupplemental Assessment (ALSA). Three percent ofadults weighted (5 percent unweighted) were placedin the ALSA.
ALSA was a performance-based assessment thatallowed adults with marginal literacy to demonstratewhat they could and could not do when asked tomake sense of various forms of print.The ALSAstarted with simple identification tasks and sightwords and moved to connected text, using authen-tic, highly contextualized material commonly foundat home or in the community. Respondents placedin the ALSA are included in the NAAL samplebased on their responses to the seven questionsBecause the ALSA respondents got most or all of theseven questions at the beginning of the assessmentwrong, they would have been classified into theBelow Basic level on the health scale.
A respondent who continued in the main assessmentwas given back the assessment booklet, and the inter-viewer asked the respondent to complete the tasks inthe booklet and guided the respondent through thetasks.The main assessment consisted of 12 blocks oftasks with approximately 11 questions in each block,but each assessment booklet included only 3 blocksof questions.The blocks were spiraled so that acrossthe 26 different configurations of the assessmentbooklet, each block was paired with every otherblock and each block appeared in each of the threepositions (first, middle, last) in a booklet.
For ALSA interviews, the interviewer read the ALSAscript from a printed booklet and classified therespondent’s answers into the response categories in
35
Appendix C: Technical Notes
the printed booklet.ALSA respondents were handedthe materials they were asked to read
Following the main assessment or ALSA, all respon-dents were administered the oral fluency assessment(not discussed in this report).Respondents were hand-ed a booklet with passages, number lists, letter lists,word lists, and pseudoword lists to read orally.Respondents read into a microphone that recordedtheir responses on the laptop computer.
Weighting and Variance Estimation
A complex sample design was used to select assess-ment respondents.The properties of a sample select-ed through a complex design could be very differ-ent from those of a simple random sample in whichevery individual in the target population has anequal chance of selection and in which the observa-tions from different sampled individuals can be con-sidered to be statistically independent of one anoth-er. Therefore, the properties of the sample for thecomplex data collection design were taken intoaccount during the analysis of the data. Standarderrors calculated as though the data had been collect-ed from a simple random sample would generallyunderestimate sampling errors. One way of address-ing the properties of the sample design was by usingsampling weights to account for the fact that theprobabilities of selection were not identical for allrespondents.All population and subpopulation char-acteristics based on the NAAL data used samplingweights in their estimation.
The statistics presented in this report are estimates ofgroup and subgroup performance based on a sampleof respondents, rather than the values that could becalculated if every person in the nation answeredevery question on the instrument. It is thereforeimportant to have measures of the degree of uncer-tainty of the estimates. Accordingly, in addition toproviding estimates of percentages of respondents
and their average scale score, this report providesinformation about the uncertainty of each statistic.
Because the assessment used clustered sampling, con-ventional formulas for estimating sampling variabili-ty that assume simple random sampling and henceindependence of observations are inappropriate. Forthis reason, the NAAL assessment uses a Taylor seriesprocedure based on the sandwich estimator to estimatestandard errors (Binder 1983).
Scaling
As discussed above, each respondent to the NAALreceived a booklet that included 3 of the 13 assess-ments blocks. Because each respondent did notanswer all of the NAAL items, item response theory(IRT) methods were used to estimate average scoreson the health, prose, document, and quantitative literacy scales; a simple average percent correct wouldnot allow for reporting results that are comparablefor all respondents. IRT models the probability ofanswering a question correctly as a mathematicalfunction of proficiency or skill. The main purposeof IRT analysis is to provide a common scale onwhich performance on some latent trait can be compared across groups, such as those defined by sex,race/ethnicity, or place of birth (Hambleton andSwaminathan 1985).
IRT models assume that an examinee’s performanceon each item reflects characteristics of the item andcharacteristics of the examinee. All models assumethat all items on a scale measure a common latentability or proficiency dimension (e.g., prose literacy)and that the probability of a correct response on anitem is uncorrelated with the probability of a correctresponse on another item given fixed values of thelatent trait. Items are measured in terms of their dif-ficulty as well as their ability to discriminate amongexaminees of varying ability.
36
The Health Literacy of America’s Adults
The assessment used two types of IRT models toestimate scale scores. The two-parameter logistic(2PL) model, which was used for dichotomous items(that is, items that are scored either right or wrong)takes the form
,
where is the response of person j to item i, isthe proficiency of person j, is the slope or discrimi-nation parameter for item i, and is the location ordifficulty parameter for item i.
For the partial credit items, the graded responselogistic (GRL) model was used. This model followsthe 2PL model for the probability of a score of 1 (atleast partially correct):
.
It also follows the 2PL model for the probability of ascore of 2 (completely correct):
.
In the equations above, and are the stepparameters corresponding to the response categoriesof partially or fully correct.
The scale indeterminacy was solved by setting an ori-gin and unit size to the reported scale means and
standard deviations from the 1992 assessment.6 Lineartransformation was performed to transform the orig-inal scale metric to the final reporting metric.
Levels were set and items were mapped to scales basedon the scores corresponding to a 67 percent successrate on the tasks.
Statistical Testing
The statistical comparisons in this report were basedon the t statistic. Statistical significance was determinedby calculating a t value for the difference between apair of means, or proportions, and comparing thisvalue with published tables of values at a certain levelof significance, called alpha level.The alpha level is ana priori statement of the probability of inferring thata difference exists when, in fact, it does not. Thealpha level used in this report is .05, based on a two-tailed test.The formula used to compute the t statis-tic was as follows:
,
where and are the estimates to be comparedand and are their corresponding standarderrors.
37
Appendix C: Technical Notes
6 The means for the 1992 assessment were 276 for prose, 271 fordocument, and 275 for quantitative.The standard deviations for the1992 assessment were 61 for prose, 61 for document, and 66 forquantitative.The standard deviations for the 2003 assessment were59 for prose, 57 for document, and 61 for quantitative.

39
toc
1CHAPTER ONE
Standard Errors for Tables and Figures
DAPPENDIX D
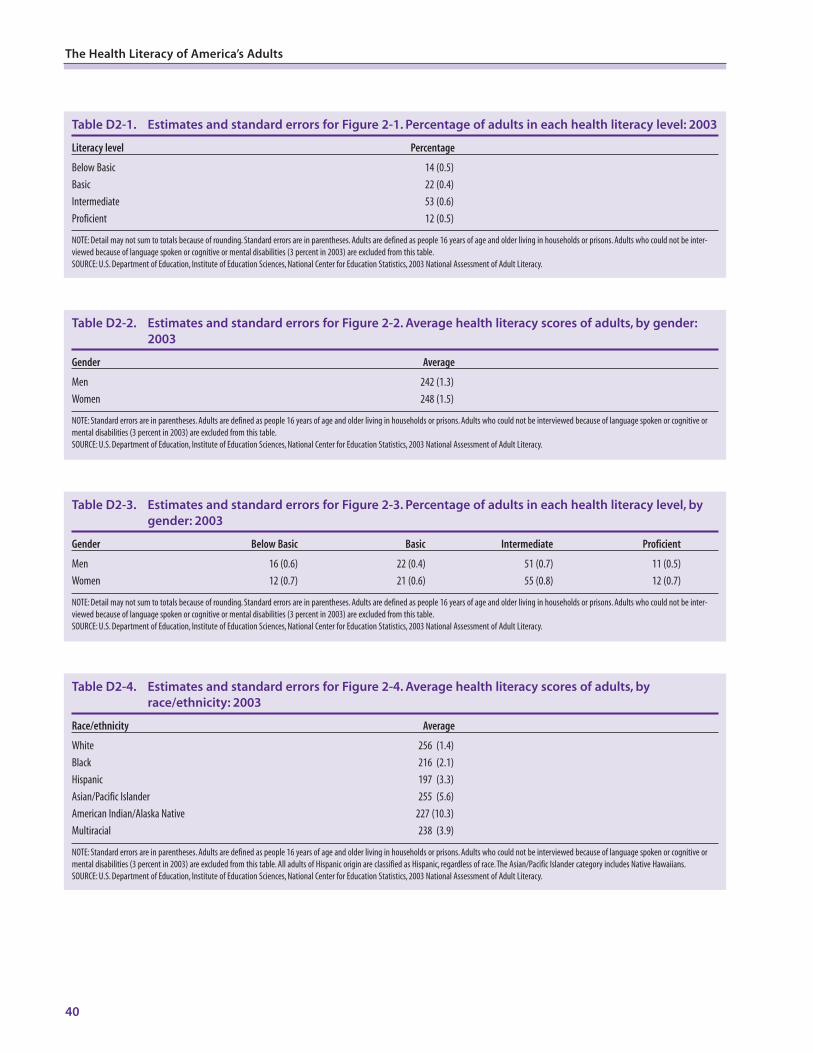
40
The Health Literacy of America’s Adults
Table D2-2. Estimates and standard errors for Figure 2-2. Average health literacy scores of adults, by gender:
2003
Gender Average
Men 242 (1.3)
Women 248 (1.5)
NOTE: Standard errors are in parentheses. Adults are defined as people 16 years of age and older living in households or prisons. Adults who could not be interviewed because of language spoken or cognitive or
mental disabilities (3 percent in 2003) are excluded from this table.
SOURCE: U.S. Department of Education, Institute of Education Sciences, National Center for Education Statistics, 2003 National Assessment of Adult Literacy.
Table D2-3. Estimates and standard errors for Figure 2-3. Percentage of adults in each health literacy level, by
gender: 2003
Gender Below Basic Basic Intermediate Proficient
Men 16 (0.6) 22 (0.4) 51 (0.7) 11 (0.5)
Women 12 (0.7) 21 (0.6) 55 (0.8) 12 (0.7)
NOTE: Detail may not sum to totals because of rounding. Standard errors are in parentheses. Adults are defined as people 16 years of age and older living in households or prisons. Adults who could not be inter-
viewed because of language spoken or cognitive or mental disabilities (3 percent in 2003) are excluded from this table.
SOURCE: U.S. Department of Education, Institute of Education Sciences, National Center for Education Statistics, 2003 National Assessment of Adult Literacy.
Table D2-4. Estimates and standard errors for Figure 2-4. Average health literacy scores of adults, by
race/ethnicity: 2003
Race/ethnicity Average
White 256 (1.4)
Black 216 (2.1)
Hispanic 197 (3.3)
Asian/Pacific Islander 255 (5.6)
American Indian/Alaska Native 227 (10.3)
Multiracial 238 (3.9)
NOTE: Standard errors are in parentheses. Adults are defined as people 16 years of age and older living in households or prisons. Adults who could not be interviewed because of language spoken or cognitive or
mental disabilities (3 percent in 2003) are excluded from this table. All adults of Hispanic origin are classified as Hispanic, regardless of race.The Asian/Pacific Islander category includes Native Hawaiians.
SOURCE: U.S. Department of Education, Institute of Education Sciences, National Center for Education Statistics, 2003 National Assessment of Adult Literacy.
Table D2-1. Estimates and standard errors for Figure 2-1. Percentage of adults in each health literacy level: 2003
Literacy level Percentage
Below Basic 14 (0.5)
Basic 22 (0.4)
Intermediate 53 (0.6)
Proficient 12 (0.5)
NOTE: Detail may not sum to totals because of rounding. Standard errors are in parentheses. Adults are defined as people 16 years of age and older living in households or prisons. Adults who could not be inter-
viewed because of language spoken or cognitive or mental disabilities (3 percent in 2003) are excluded from this table.
SOURCE: U.S. Department of Education, Institute of Education Sciences, National Center for Education Statistics, 2003 National Assessment of Adult Literacy.
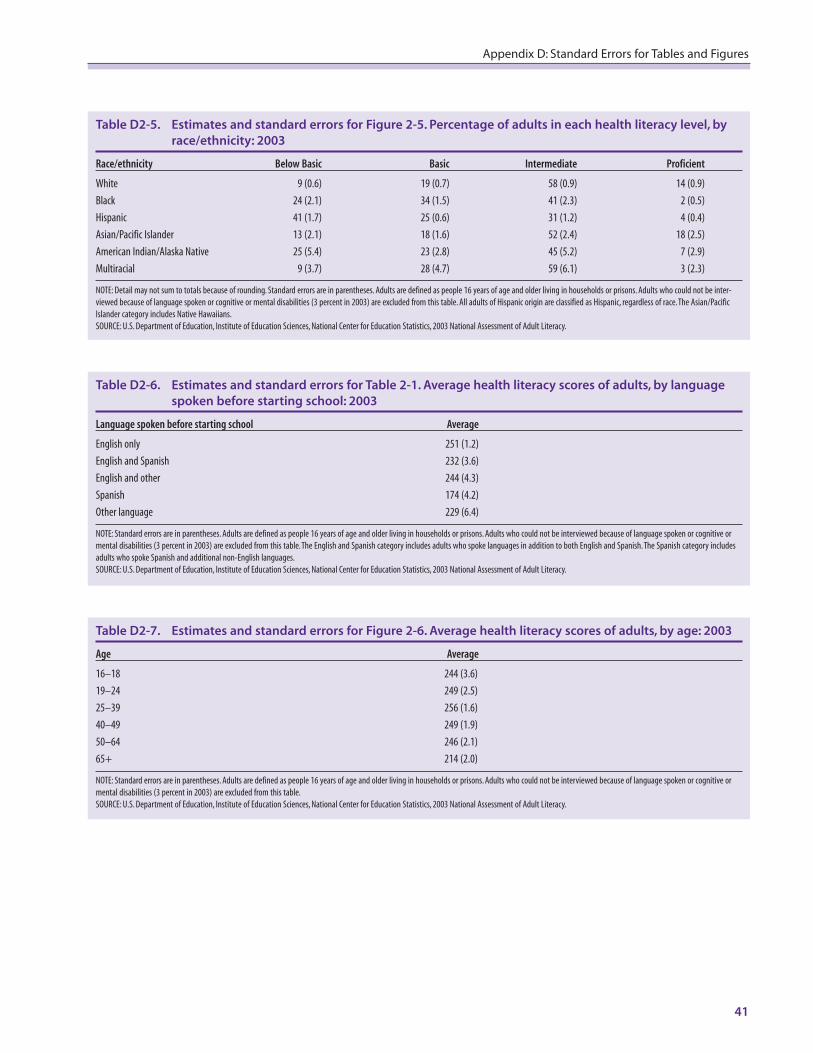
41
Appendix D: Standard Errors for Tables and Figures
Table D2-5. Estimates and standard errors for Figure 2-5. Percentage of adults in each health literacy level, by
race/ethnicity: 2003
Race/ethnicity Below Basic Basic Intermediate Proficient
White 9 (0.6) 19 (0.7) 58 (0.9) 14 (0.9)
Black 24 (2.1) 34 (1.5) 41 (2.3) 2 (0.5)
Hispanic 41 (1.7) 25 (0.6) 31 (1.2) 4 (0.4)
Asian/Pacific Islander 13 (2.1) 18 (1.6) 52 (2.4) 18 (2.5)
American Indian/Alaska Native 25 (5.4) 23 (2.8) 45 (5.2) 7 (2.9)
Multiracial 9 (3.7) 28 (4.7) 59 (6.1) 3 (2.3)
NOTE: Detail may not sum to totals because of rounding. Standard errors are in parentheses. Adults are defined as people 16 years of age and older living in households or prisons. Adults who could not be inter-
viewed because of language spoken or cognitive or mental disabilities (3 percent in 2003) are excluded from this table. All adults of Hispanic origin are classified as Hispanic, regardless of race.The Asian/Pacific
Islander category includes Native Hawaiians.
SOURCE: U.S. Department of Education, Institute of Education Sciences, National Center for Education Statistics, 2003 National Assessment of Adult Literacy.
Table D2-6. Estimates and standard errors for Table 2-1. Average health literacy scores of adults, by language
spoken before starting school: 2003
Language spoken before starting school Average
English only 251 (1.2)
English and Spanish 232 (3.6)
English and other 244 (4.3)
Spanish 174 (4.2)
Other language 229 (6.4)
NOTE: Standard errors are in parentheses. Adults are defined as people 16 years of age and older living in households or prisons. Adults who could not be interviewed because of language spoken or cognitive or
mental disabilities (3 percent in 2003) are excluded from this table.The English and Spanish category includes adults who spoke languages in addition to both English and Spanish.The Spanish category includes
adults who spoke Spanish and additional non-English languages.
SOURCE: U.S. Department of Education, Institute of Education Sciences, National Center for Education Statistics, 2003 National Assessment of Adult Literacy.
Table D2-7. Estimates and standard errors for Figure 2-6. Average health literacy scores of adults, by age: 2003
Age Average
16–18 244 (3.6)
19–24 249 (2.5)
25–39 256 (1.6)
40–49 249 (1.9)
50–64 246 (2.1)
65+ 214 (2.0)
NOTE: Standard errors are in parentheses. Adults are defined as people 16 years of age and older living in households or prisons. Adults who could not be interviewed because of language spoken or cognitive or
mental disabilities (3 percent in 2003) are excluded from this table.
SOURCE: U.S. Department of Education, Institute of Education Sciences, National Center for Education Statistics, 2003 National Assessment of Adult Literacy.
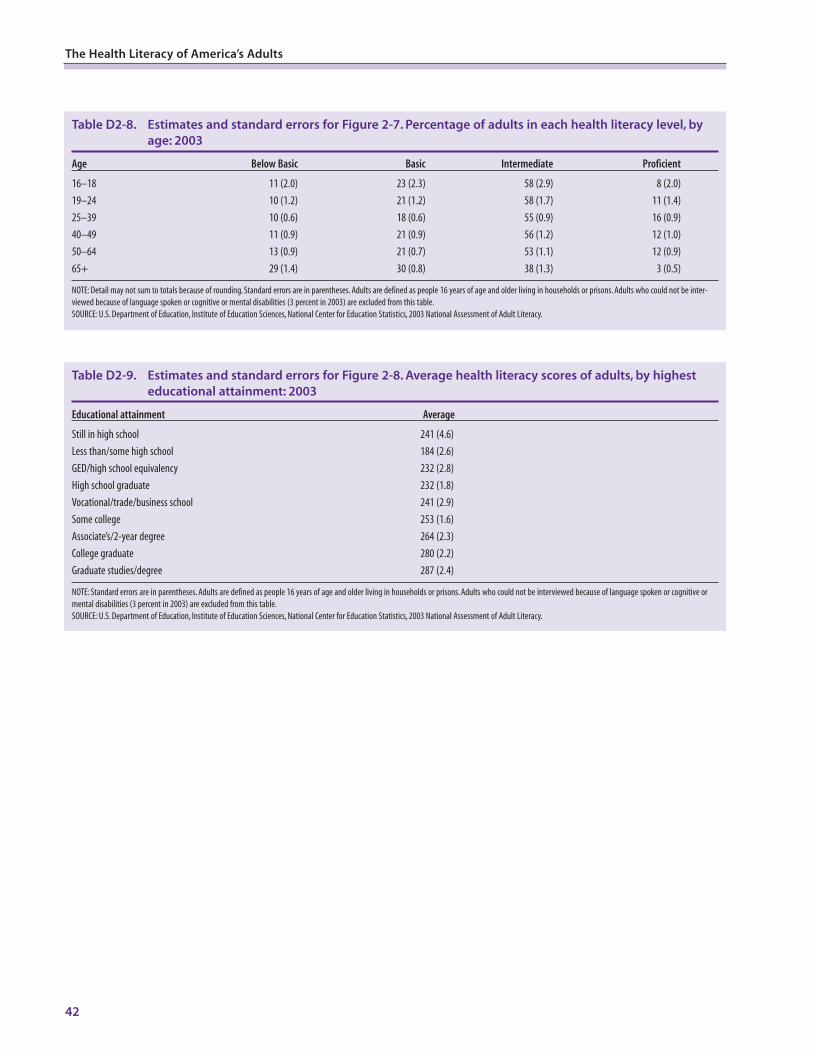
42
The Health Literacy of America’s Adults
Table D2-8. Estimates and standard errors for Figure 2-7. Percentage of adults in each health literacy level, by
age: 2003
Age Below Basic Basic Intermediate Proficient
16–18 11 (2.0) 23 (2.3) 58 (2.9) 8 (2.0)
19–24 10 (1.2) 21 (1.2) 58 (1.7) 11 (1.4)
25–39 10 (0.6) 18 (0.6) 55 (0.9) 16 (0.9)
40–49 11 (0.9) 21 (0.9) 56 (1.2) 12 (1.0)
50–64 13 (0.9) 21 (0.7) 53 (1.1) 12 (0.9)
65+ 29 (1.4) 30 (0.8) 38 (1.3) 3 (0.5)
NOTE: Detail may not sum to totals because of rounding. Standard errors are in parentheses. Adults are defined as people 16 years of age and older living in households or prisons. Adults who could not be inter-
viewed because of language spoken or cognitive or mental disabilities (3 percent in 2003) are excluded from this table.
SOURCE: U.S. Department of Education, Institute of Education Sciences, National Center for Education Statistics, 2003 National Assessment of Adult Literacy.
Table D2-9. Estimates and standard errors for Figure 2-8. Average health literacy scores of adults, by highest
educational attainment: 2003
Educational attainment Average
Still in high school 241 (4.6)
Less than/some high school 184 (2.6)
GED/high school equivalency 232 (2.8)
High school graduate 232 (1.8)
Vocational/trade/business school 241 (2.9)
Some college 253 (1.6)
Associate’s/2-year degree 264 (2.3)
College graduate 280 (2.2)
Graduate studies/degree 287 (2.4)
NOTE: Standard errors are in parentheses. Adults are defined as people 16 years of age and older living in households or prisons. Adults who could not be interviewed because of language spoken or cognitive or
mental disabilities (3 percent in 2003) are excluded from this table.
SOURCE: U.S. Department of Education, Institute of Education Sciences, National Center for Education Statistics, 2003 National Assessment of Adult Literacy.
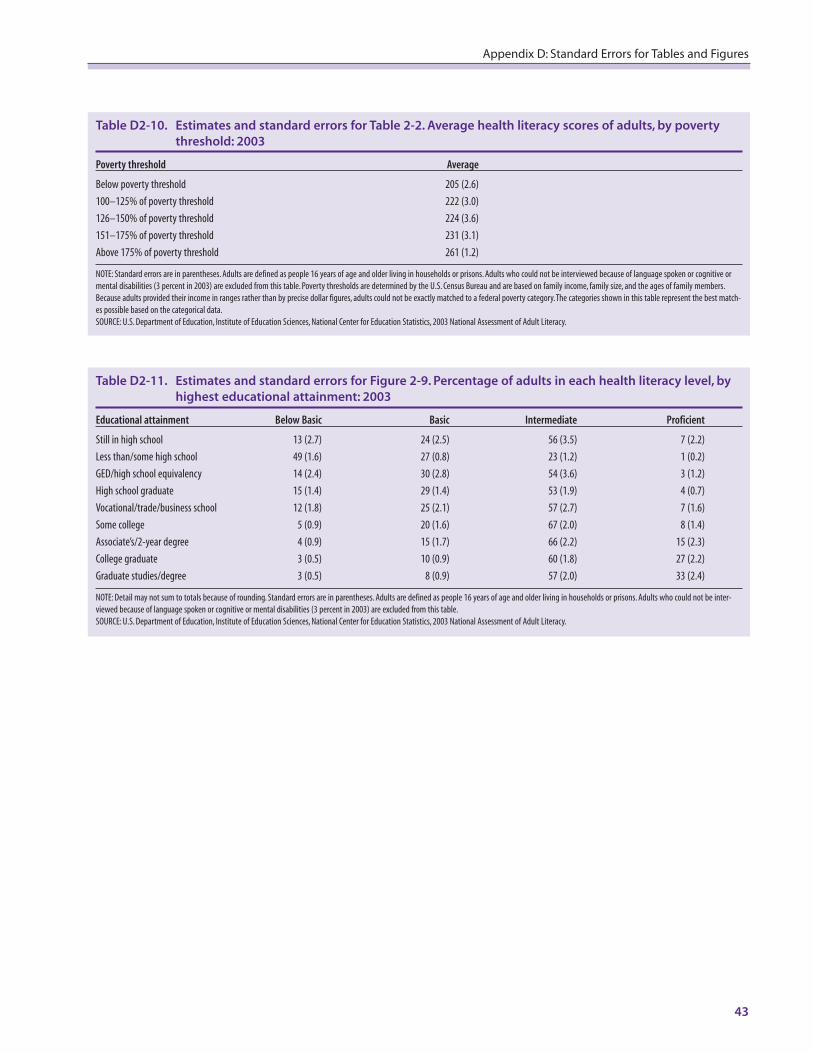
43
Appendix D: Standard Errors for Tables and Figures
Table D2-10. Estimates and standard errors for Table 2-2. Average health literacy scores of adults, by poverty
threshold: 2003
Poverty threshold Average
Below poverty threshold 205 (2.6)
100–125% of poverty threshold 222 (3.0)
126–150% of poverty threshold 224 (3.6)
151–175% of poverty threshold 231 (3.1)
Above 175% of poverty threshold 261 (1.2)
NOTE: Standard errors are in parentheses. Adults are defined as people 16 years of age and older living in households or prisons. Adults who could not be interviewed because of language spoken or cognitive or
mental disabilities (3 percent in 2003) are excluded from this table. Poverty thresholds are determined by the U.S. Census Bureau and are based on family income, family size, and the ages of family members.
Because adults provided their income in ranges rather than by precise dollar figures, adults could not be exactly matched to a federal poverty category.The categories shown in this table represent the best match-
es possible based on the categorical data.
SOURCE: U.S. Department of Education, Institute of Education Sciences, National Center for Education Statistics, 2003 National Assessment of Adult Literacy.
Table D2-11. Estimates and standard errors for Figure 2-9. Percentage of adults in each health literacy level, by
highest educational attainment: 2003
Educational attainment Below Basic Basic Intermediate Proficient
Still in high school 13 (2.7) 24 (2.5) 56 (3.5) 7 (2.2)
Less than/some high school 49 (1.6) 27 (0.8) 23 (1.2) 1 (0.2)
GED/high school equivalency 14 (2.4) 30 (2.8) 54 (3.6) 3 (1.2)
High school graduate 15 (1.4) 29 (1.4) 53 (1.9) 4 (0.7)
Vocational/trade/business school 12 (1.8) 25 (2.1) 57 (2.7) 7 (1.6)
Some college 5 (0.9) 20 (1.6) 67 (2.0) 8 (1.4)
Associate’s/2-year degree 4 (0.9) 15 (1.7) 66 (2.2) 15 (2.3)
College graduate 3 (0.5) 10 (0.9) 60 (1.8) 27 (2.2)
Graduate studies/degree 3 (0.5) 8 (0.9) 57 (2.0) 33 (2.4)
NOTE: Detail may not sum to totals because of rounding. Standard errors are in parentheses. Adults are defined as people 16 years of age and older living in households or prisons. Adults who could not be inter-
viewed because of language spoken or cognitive or mental disabilities (3 percent in 2003) are excluded from this table.
SOURCE: U.S. Department of Education, Institute of Education Sciences, National Center for Education Statistics, 2003 National Assessment of Adult Literacy.
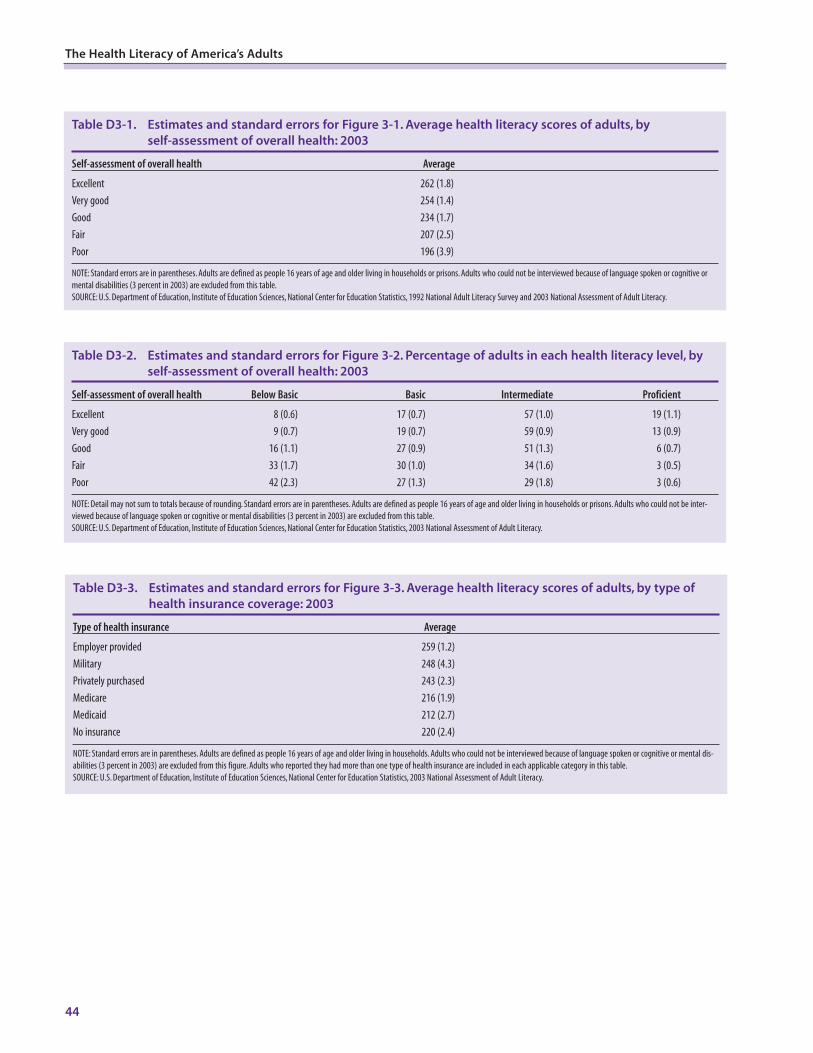
44
The Health Literacy of America’s Adults
Table D3-3. Estimates and standard errors for Figure 3-3. Average health literacy scores of adults, by type of
health insurance coverage: 2003
Type of health insurance Average
Employer provided 259 (1.2)
Military 248 (4.3)
Privately purchased 243 (2.3)
Medicare 216 (1.9)
Medicaid 212 (2.7)
No insurance 220 (2.4)
NOTE: Standard errors are in parentheses. Adults are defined as people 16 years of age and older living in households. Adults who could not be interviewed because of language spoken or cognitive or mental dis-
abilities (3 percent in 2003) are excluded from this figure. Adults who reported they had more than one type of health insurance are included in each applicable category in this table.
SOURCE: U.S. Department of Education, Institute of Education Sciences, National Center for Education Statistics, 2003 National Assessment of Adult Literacy.
Table D3-2. Estimates and standard errors for Figure 3-2. Percentage of adults in each health literacy level, by
self-assessment of overall health: 2003
Self-assessment of overall health Below Basic Basic Intermediate Proficient
Excellent 8 (0.6) 17 (0.7) 57 (1.0) 19 (1.1)
Very good 9 (0.7) 19 (0.7) 59 (0.9) 13 (0.9)
Good 16 (1.1) 27 (0.9) 51 (1.3) 6 (0.7)
Fair 33 (1.7) 30 (1.0) 34 (1.6) 3 (0.5)
Poor 42 (2.3) 27 (1.3) 29 (1.8) 3 (0.6)
NOTE: Detail may not sum to totals because of rounding. Standard errors are in parentheses. Adults are defined as people 16 years of age and older living in households or prisons. Adults who could not be inter-
viewed because of language spoken or cognitive or mental disabilities (3 percent in 2003) are excluded from this table.
SOURCE: U.S. Department of Education, Institute of Education Sciences, National Center for Education Statistics, 2003 National Assessment of Adult Literacy.
Table D3-1. Estimates and standard errors for Figure 3-1. Average health literacy scores of adults, by
self-assessment of overall health: 2003
Self-assessment of overall health Average
Excellent 262 (1.8)
Very good 254 (1.4)
Good 234 (1.7)
Fair 207 (2.5)
Poor 196 (3.9)
NOTE: Standard errors are in parentheses. Adults are defined as people 16 years of age and older living in households or prisons. Adults who could not be interviewed because of language spoken or cognitive or
mental disabilities (3 percent in 2003) are excluded from this table.
SOURCE: U.S. Department of Education, Institute of Education Sciences, National Center for Education Statistics, 1992 National Adult Literacy Survey and 2003 National Assessment of Adult Literacy.
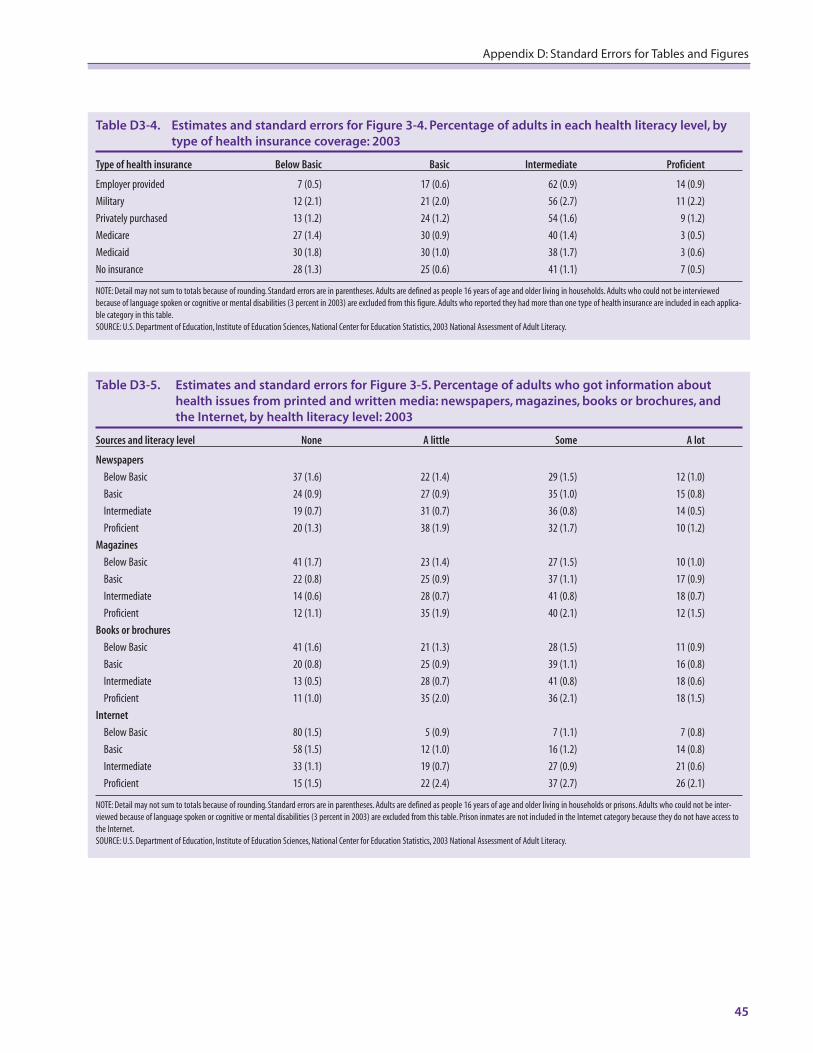
45
Appendix D: Standard Errors for Tables and Figures
Table D3-4. Estimates and standard errors for Figure 3-4. Percentage of adults in each health literacy level, by
type of health insurance coverage: 2003
Type of health insurance Below Basic Basic Intermediate Proficient
Employer provided 7 (0.5) 17 (0.6) 62 (0.9) 14 (0.9)
Military 12 (2.1) 21 (2.0) 56 (2.7) 11 (2.2)
Privately purchased 13 (1.2) 24 (1.2) 54 (1.6) 9 (1.2)
Medicare 27 (1.4) 30 (0.9) 40 (1.4) 3 (0.5)
Medicaid 30 (1.8) 30 (1.0) 38 (1.7) 3 (0.6)
No insurance 28 (1.3) 25 (0.6) 41 (1.1) 7 (0.5)
NOTE: Detail may not sum to totals because of rounding. Standard errors are in parentheses. Adults are defined as people 16 years of age and older living in households. Adults who could not be interviewed
because of language spoken or cognitive or mental disabilities (3 percent in 2003) are excluded from this figure. Adults who reported they had more than one type of health insurance are included in each applica-
ble category in this table.
SOURCE: U.S. Department of Education, Institute of Education Sciences, National Center for Education Statistics, 2003 National Assessment of Adult Literacy.
Table D3-5. Estimates and standard errors for Figure 3-5. Percentage of adults who got information about
health issues from printed and written media: newspapers, magazines, books or brochures, and
the Internet, by health literacy level: 2003
Sources and literacy level None A little Some A lot
Newspapers
Below Basic 37 (1.6) 22 (1.4) 29 (1.5) 12 (1.0)
Basic 24 (0.9) 27 (0.9) 35 (1.0) 15 (0.8)
Intermediate 19 (0.7) 31 (0.7) 36 (0.8) 14 (0.5)
Proficient 20 (1.3) 38 (1.9) 32 (1.7) 10 (1.2)
Magazines
Below Basic 41 (1.7) 23 (1.4) 27 (1.5) 10 (1.0)
Basic 22 (0.8) 25 (0.9) 37 (1.1) 17 (0.9)
Intermediate 14 (0.6) 28 (0.7) 41 (0.8) 18 (0.7)
Proficient 12 (1.1) 35 (1.9) 40 (2.1) 12 (1.5)
Books or brochures
Below Basic 41 (1.6) 21 (1.3) 28 (1.5) 11 (0.9)
Basic 20 (0.8) 25 (0.9) 39 (1.1) 16 (0.8)
Intermediate 13 (0.5) 28 (0.7) 41 (0.8) 18 (0.6)
Proficient 11 (1.0) 35 (2.0) 36 (2.1) 18 (1.5)
Internet
Below Basic 80 (1.5) 5 (0.9) 7 (1.1) 7 (0.8)
Basic 58 (1.5) 12 (1.0) 16 (1.2) 14 (0.8)
Intermediate 33 (1.1) 19 (0.7) 27 (0.9) 21 (0.6)
Proficient 15 (1.5) 22 (2.4) 37 (2.7) 26 (2.1)
NOTE: Detail may not sum to totals because of rounding. Standard errors are in parentheses. Adults are defined as people 16 years of age and older living in households or prisons. Adults who could not be inter-
viewed because of language spoken or cognitive or mental disabilities (3 percent in 2003) are excluded from this table. Prison inmates are not included in the Internet category because they do not have access to
the Internet.
SOURCE: U.S. Department of Education, Institute of Education Sciences, National Center for Education Statistics, 2003 National Assessment of Adult Literacy.
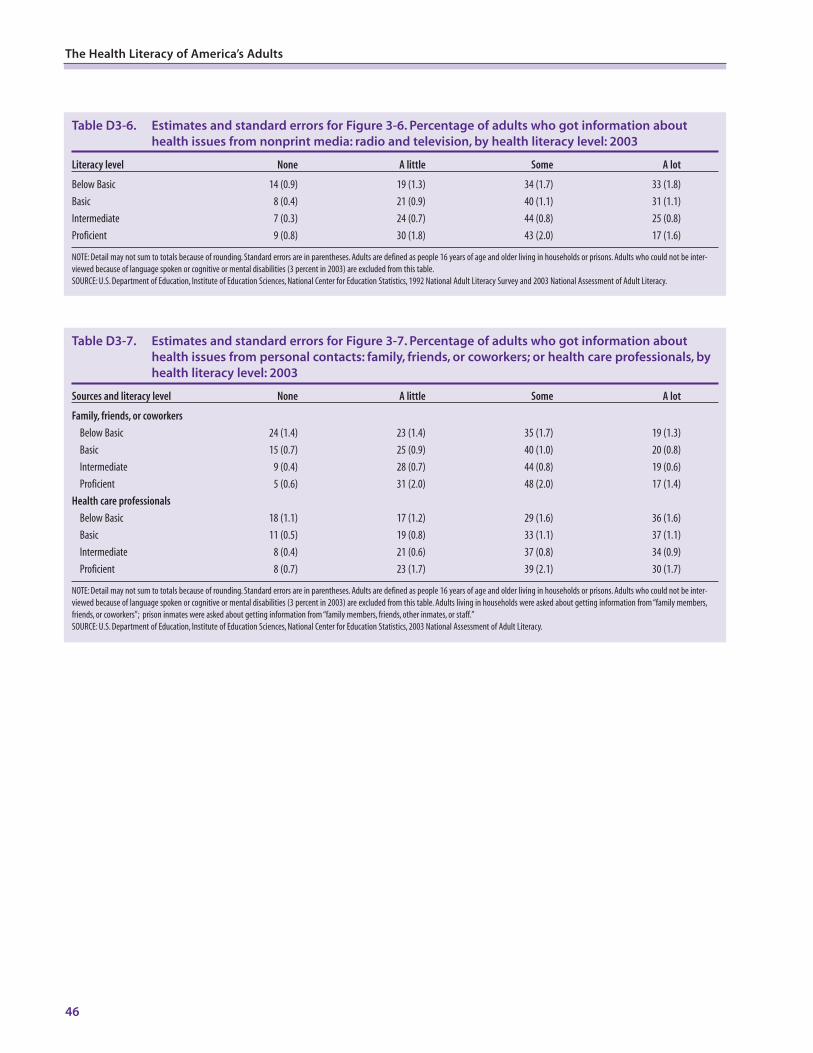
46
The Health Literacy of America’s Adults
Table D3-7. Estimates and standard errors for Figure 3-7. Percentage of adults who got information about
health issues from personal contacts: family, friends, or coworkers; or health care professionals, by
health literacy level: 2003
Sources and literacy level None A little Some A lot
Family, friends, or coworkers
Below Basic 24 (1.4) 23 (1.4) 35 (1.7) 19 (1.3)
Basic 15 (0.7) 25 (0.9) 40 (1.0) 20 (0.8)
Intermediate 9 (0.4) 28 (0.7) 44 (0.8) 19 (0.6)
Proficient 5 (0.6) 31 (2.0) 48 (2.0) 17 (1.4)
Health care professionals
Below Basic 18 (1.1) 17 (1.2) 29 (1.6) 36 (1.6)
Basic 11 (0.5) 19 (0.8) 33 (1.1) 37 (1.1)
Intermediate 8 (0.4) 21 (0.6) 37 (0.8) 34 (0.9)
Proficient 8 (0.7) 23 (1.7) 39 (2.1) 30 (1.7)
NOTE: Detail may not sum to totals because of rounding. Standard errors are in parentheses. Adults are defined as people 16 years of age and older living in households or prisons. Adults who could not be inter-
viewed because of language spoken or cognitive or mental disabilities (3 percent in 2003) are excluded from this table. Adults living in households were asked about getting information from “family members,
friends, or coworkers”; prison inmates were asked about getting information from “family members, friends, other inmates, or staff.”
SOURCE: U.S. Department of Education, Institute of Education Sciences, National Center for Education Statistics, 2003 National Assessment of Adult Literacy.
Table D3-6. Estimates and standard errors for Figure 3-6. Percentage of adults who got information about
health issues from nonprint media: radio and television, by health literacy level: 2003
Literacy level None A little Some A lot
Below Basic 14 (0.9) 19 (1.3) 34 (1.7) 33 (1.8)
Basic 8 (0.4) 21 (0.9) 40 (1.1) 31 (1.1)
Intermediate 7 (0.3) 24 (0.7) 44 (0.8) 25 (0.8)
Proficient 9 (0.8) 30 (1.8) 43 (2.0) 17 (1.6)
NOTE: Detail may not sum to totals because of rounding. Standard errors are in parentheses. Adults are defined as people 16 years of age and older living in households or prisons. Adults who could not be inter-
viewed because of language spoken or cognitive or mental disabilities (3 percent in 2003) are excluded from this table.
SOURCE: U.S. Department of Education, Institute of Education Sciences, National Center for Education Statistics, 1992 National Adult Literacy Survey and 2003 National Assessment of Adult Literacy.
Additional Analyses
47
EAPPENDIX E
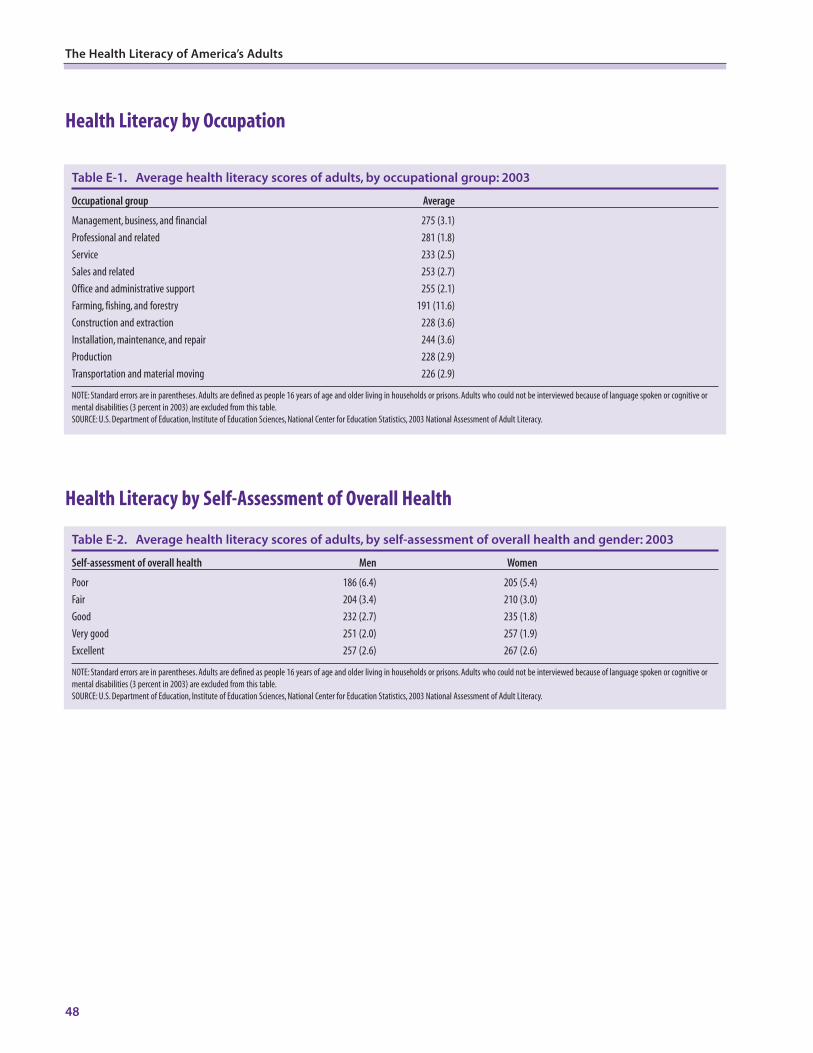
Health Literacy by Occupation
Health Literacy by Self-Assessment of Overall Health
48
The Health Literacy of America’s Adults
Table E-1. Average health literacy scores of adults, by occupational group: 2003
Occupational group Average
Management, business, and financial 275 (3.1)
Professional and related 281 (1.8)
Service 233 (2.5)
Sales and related 253 (2.7)
Office and administrative support 255 (2.1)
Farming, fishing, and forestry 191 (11.6)
Construction and extraction 228 (3.6)
Installation, maintenance, and repair 244 (3.6)
Production 228 (2.9)
Transportation and material moving 226 (2.9)
NOTE: Standard errors are in parentheses. Adults are defined as people 16 years of age and older living in households or prisons. Adults who could not be interviewed because of language spoken or cognitive or
mental disabilities (3 percent in 2003) are excluded from this table.
SOURCE: U.S. Department of Education, Institute of Education Sciences, National Center for Education Statistics, 2003 National Assessment of Adult Literacy.
Table E-2. Average health literacy scores of adults, by self-assessment of overall health and gender: 2003
Self-assessment of overall health Men Women
Poor 186 (6.4) 205 (5.4)
Fair 204 (3.4) 210 (3.0)
Good 232 (2.7) 235 (1.8)
Very good 251 (2.0) 257 (1.9)
Excellent 257 (2.6) 267 (2.6)
NOTE: Standard errors are in parentheses. Adults are defined as people 16 years of age and older living in households or prisons. Adults who could not be interviewed because of language spoken or cognitive or
mental disabilities (3 percent in 2003) are excluded from this table.
SOURCE: U.S. Department of Education, Institute of Education Sciences, National Center for Education Statistics, 2003 National Assessment of Adult Literacy.
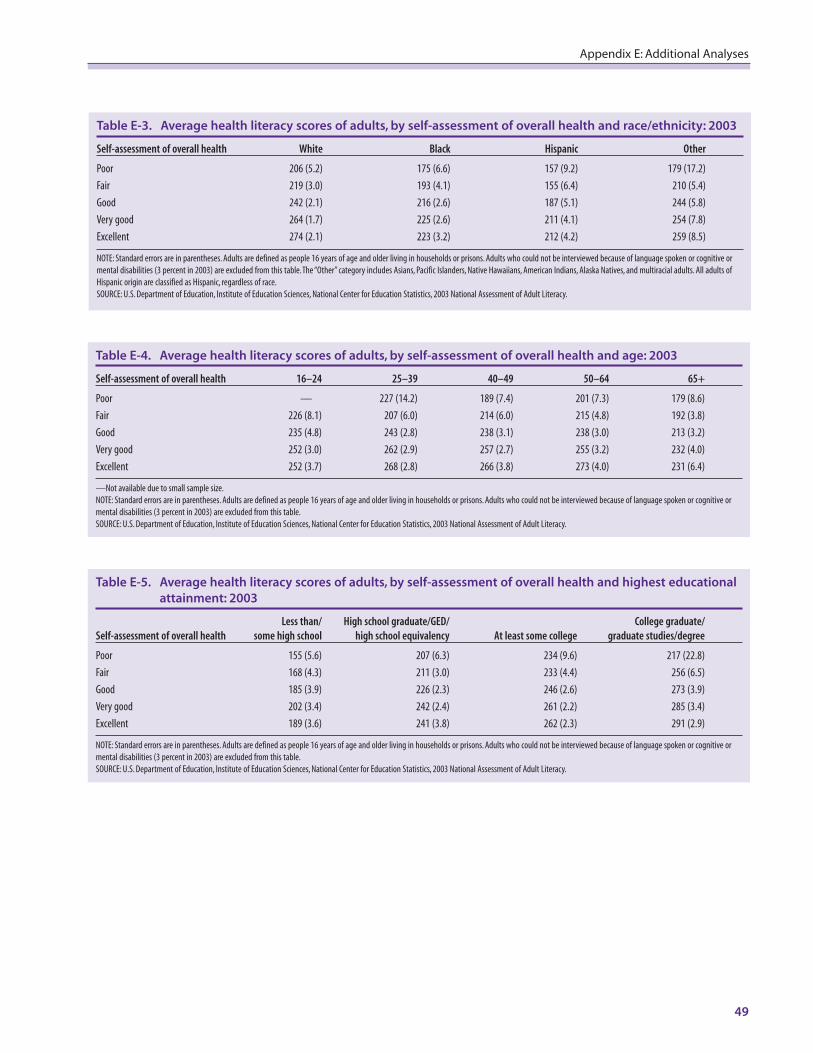
Table E-4. Average health literacy scores of adults, by self-assessment of overall health and age: 2003
Self-assessment of overall health 16–24 25–39 40–49 50–64 65+
Poor — 227 (14.2) 189 (7.4) 201 (7.3) 179 (8.6)
Fair 226 (8.1) 207 (6.0) 214 (6.0) 215 (4.8) 192 (3.8)
Good 235 (4.8) 243 (2.8) 238 (3.1) 238 (3.0) 213 (3.2)
Very good 252 (3.0) 262 (2.9) 257 (2.7) 255 (3.2) 232 (4.0)
Excellent 252 (3.7) 268 (2.8) 266 (3.8) 273 (4.0) 231 (6.4)
—Not available due to small sample size.
NOTE: Standard errors are in parentheses. Adults are defined as people 16 years of age and older living in households or prisons. Adults who could not be interviewed because of language spoken or cognitive or
mental disabilities (3 percent in 2003) are excluded from this table.
SOURCE: U.S. Department of Education, Institute of Education Sciences, National Center for Education Statistics, 2003 National Assessment of Adult Literacy.
Table E-5. Average health literacy scores of adults, by self-assessment of overall health and highest educational
attainment: 2003
Less than/ High school graduate/GED/ College graduate/Self-assessment of overall health some high school high school equivalency At least some college graduate studies/degree
Poor 155 (5.6) 207 (6.3) 234 (9.6) 217 (22.8)
Fair 168 (4.3) 211 (3.0) 233 (4.4) 256 (6.5)
Good 185 (3.9) 226 (2.3) 246 (2.6) 273 (3.9)
Very good 202 (3.4) 242 (2.4) 261 (2.2) 285 (3.4)
Excellent 189 (3.6) 241 (3.8) 262 (2.3) 291 (2.9)
NOTE: Standard errors are in parentheses. Adults are defined as people 16 years of age and older living in households or prisons. Adults who could not be interviewed because of language spoken or cognitive or
mental disabilities (3 percent in 2003) are excluded from this table.
SOURCE: U.S. Department of Education, Institute of Education Sciences, National Center for Education Statistics, 2003 National Assessment of Adult Literacy.
49
Appendix E: Additional Analyses
Table E-3. Average health literacy scores of adults, by self-assessment of overall health and race/ethnicity: 2003
Self-assessment of overall health White Black Hispanic Other
Poor 206 (5.2) 175 (6.6) 157 (9.2) 179 (17.2)
Fair 219 (3.0) 193 (4.1) 155 (6.4) 210 (5.4)
Good 242 (2.1) 216 (2.6) 187 (5.1) 244 (5.8)
Very good 264 (1.7) 225 (2.6) 211 (4.1) 254 (7.8)
Excellent 274 (2.1) 223 (3.2) 212 (4.2) 259 (8.5)
NOTE: Standard errors are in parentheses. Adults are defined as people 16 years of age and older living in households or prisons. Adults who could not be interviewed because of language spoken or cognitive or
mental disabilities (3 percent in 2003) are excluded from this table.The “Other” category includes Asians, Pacific Islanders, Native Hawaiians, American Indians, Alaska Natives, and multiracial adults. All adults of
Hispanic origin are classified as Hispanic, regardless of race.
SOURCE: U.S. Department of Education, Institute of Education Sciences, National Center for Education Statistics, 2003 National Assessment of Adult Literacy.
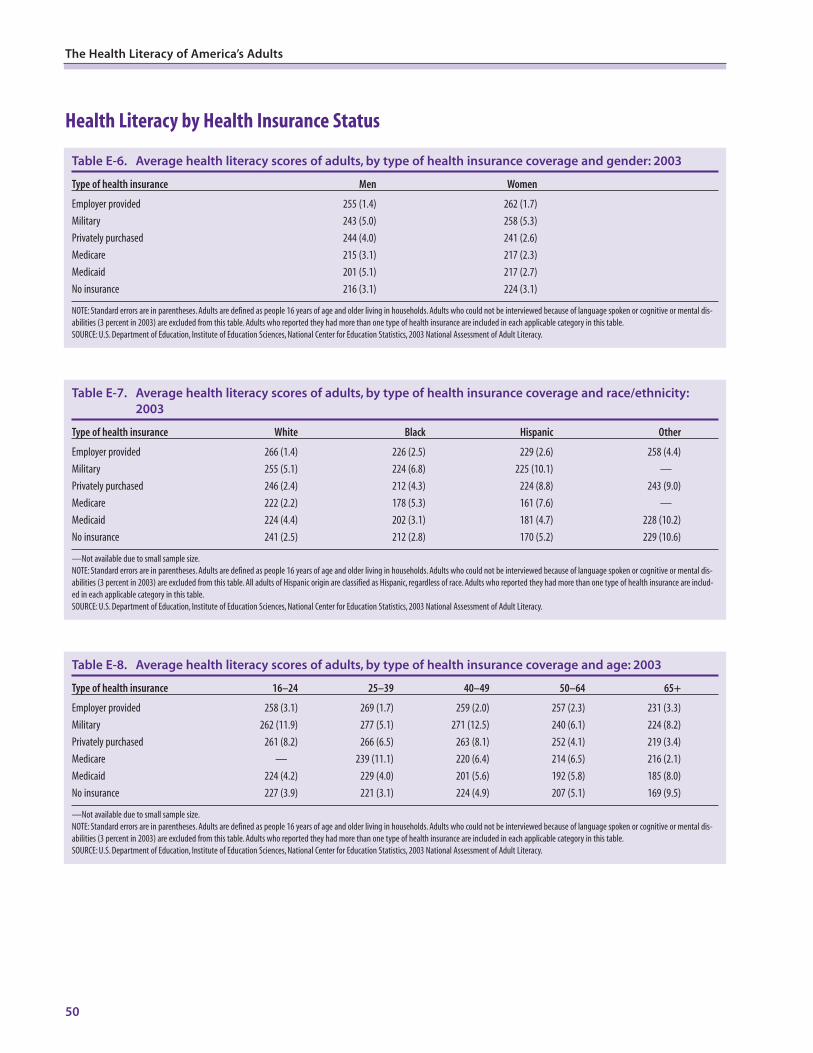
Health Literacy by Health Insurance Status
50
The Health Literacy of America’s Adults
Table E-6. Average health literacy scores of adults, by type of health insurance coverage and gender: 2003
Type of health insurance Men Women
Employer provided 255 (1.4) 262 (1.7)
Military 243 (5.0) 258 (5.3)
Privately purchased 244 (4.0) 241 (2.6)
Medicare 215 (3.1) 217 (2.3)
Medicaid 201 (5.1) 217 (2.7)
No insurance 216 (3.1) 224 (3.1)
NOTE: Standard errors are in parentheses. Adults are defined as people 16 years of age and older living in households. Adults who could not be interviewed because of language spoken or cognitive or mental dis-
abilities (3 percent in 2003) are excluded from this table. Adults who reported they had more than one type of health insurance are included in each applicable category in this table.
SOURCE: U.S. Department of Education, Institute of Education Sciences, National Center for Education Statistics, 2003 National Assessment of Adult Literacy.
Table E-7. Average health literacy scores of adults, by type of health insurance coverage and race/ethnicity:
2003
Type of health insurance White Black Hispanic Other
Employer provided 266 (1.4) 226 (2.5) 229 (2.6) 258 (4.4)
Military 255 (5.1) 224 (6.8) 225 (10.1) —
Privately purchased 246 (2.4) 212 (4.3) 224 (8.8) 243 (9.0)
Medicare 222 (2.2) 178 (5.3) 161 (7.6) —
Medicaid 224 (4.4) 202 (3.1) 181 (4.7) 228 (10.2)
No insurance 241 (2.5) 212 (2.8) 170 (5.2) 229 (10.6)
—Not available due to small sample size.
NOTE: Standard errors are in parentheses. Adults are defined as people 16 years of age and older living in households. Adults who could not be interviewed because of language spoken or cognitive or mental dis-
abilities (3 percent in 2003) are excluded from this table. All adults of Hispanic origin are classified as Hispanic, regardless of race. Adults who reported they had more than one type of health insurance are includ-
ed in each applicable category in this table.
SOURCE: U.S. Department of Education, Institute of Education Sciences, National Center for Education Statistics, 2003 National Assessment of Adult Literacy.
Table E-8. Average health literacy scores of adults, by type of health insurance coverage and age: 2003
Type of health insurance 16–24 25–39 40–49 50–64 65+
Employer provided 258 (3.1) 269 (1.7) 259 (2.0) 257 (2.3) 231 (3.3)
Military 262 (11.9) 277 (5.1) 271 (12.5) 240 (6.1) 224 (8.2)
Privately purchased 261 (8.2) 266 (6.5) 263 (8.1) 252 (4.1) 219 (3.4)
Medicare — 239 (11.1) 220 (6.4) 214 (6.5) 216 (2.1)
Medicaid 224 (4.2) 229 (4.0) 201 (5.6) 192 (5.8) 185 (8.0)
No insurance 227 (3.9) 221 (3.1) 224 (4.9) 207 (5.1) 169 (9.5)
—Not available due to small sample size.
NOTE: Standard errors are in parentheses. Adults are defined as people 16 years of age and older living in households. Adults who could not be interviewed because of language spoken or cognitive or mental dis-
abilities (3 percent in 2003) are excluded from this table. Adults who reported they had more than one type of health insurance are included in each applicable category in this table.
SOURCE: U.S. Department of Education, Institute of Education Sciences, National Center for Education Statistics, 2003 National Assessment of Adult Literacy.
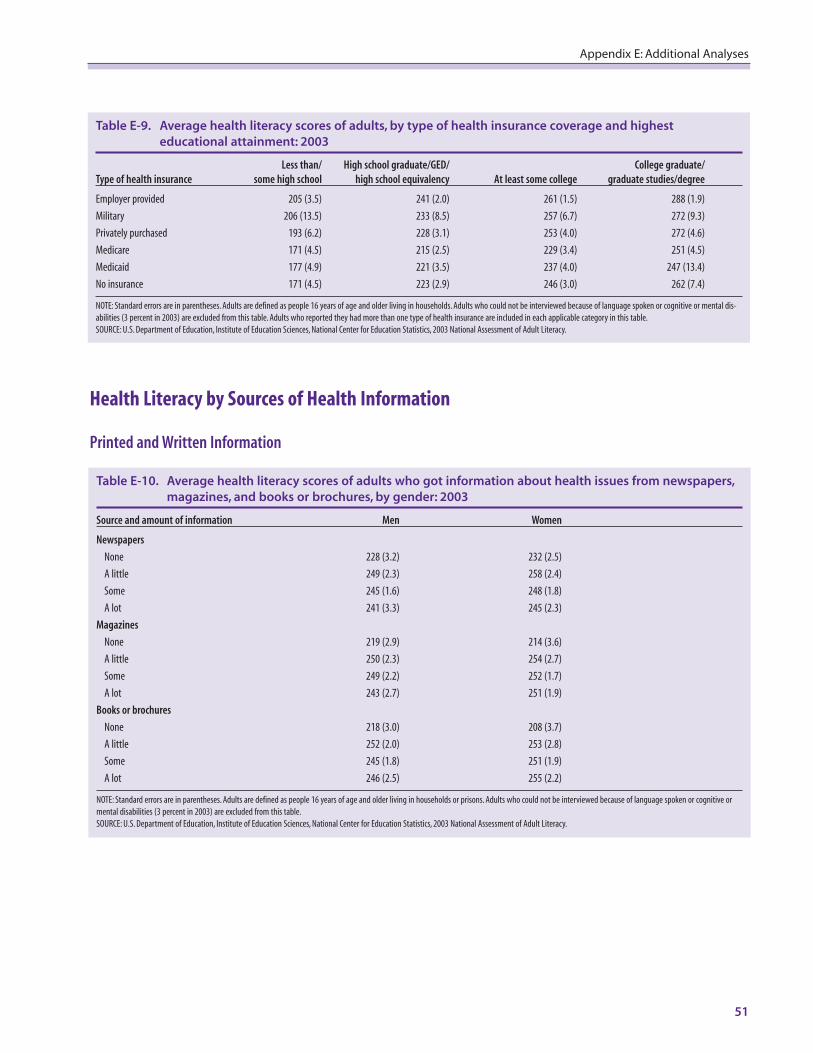
Health Literacy by Sources of Health Information
Printed and Written Information
Table E-10. Average health literacy scores of adults who got information about health issues from newspapers,
magazines, and books or brochures, by gender: 2003
Source and amount of information Men Women
Newspapers
None 228 (3.2) 232 (2.5)
A little 249 (2.3) 258 (2.4)
Some 245 (1.6) 248 (1.8)
A lot 241 (3.3) 245 (2.3)
Magazines
None 219 (2.9) 214 (3.6)
A little 250 (2.3) 254 (2.7)
Some 249 (2.2) 252 (1.7)
A lot 243 (2.7) 251 (1.9)
Books or brochures
None 218 (3.0) 208 (3.7)
A little 252 (2.0) 253 (2.8)
Some 245 (1.8) 251 (1.9)
A lot 246 (2.5) 255 (2.2)
NOTE: Standard errors are in parentheses. Adults are defined as people 16 years of age and older living in households or prisons. Adults who could not be interviewed because of language spoken or cognitive or
mental disabilities (3 percent in 2003) are excluded from this table.
SOURCE: U.S. Department of Education, Institute of Education Sciences, National Center for Education Statistics, 2003 National Assessment of Adult Literacy.
51
Appendix E: Additional Analyses
Table E-9. Average health literacy scores of adults, by type of health insurance coverage and highest
educational attainment: 2003
Less than/ High school graduate/GED/ College graduate/Type of health insurance some high school high school equivalency At least some college graduate studies/degree
Employer provided 205 (3.5) 241 (2.0) 261 (1.5) 288 (1.9)
Military 206 (13.5) 233 (8.5) 257 (6.7) 272 (9.3)
Privately purchased 193 (6.2) 228 (3.1) 253 (4.0) 272 (4.6)
Medicare 171 (4.5) 215 (2.5) 229 (3.4) 251 (4.5)
Medicaid 177 (4.9) 221 (3.5) 237 (4.0) 247 (13.4)
No insurance 171 (4.5) 223 (2.9) 246 (3.0) 262 (7.4)
NOTE: Standard errors are in parentheses. Adults are defined as people 16 years of age and older living in households. Adults who could not be interviewed because of language spoken or cognitive or mental dis-
abilities (3 percent in 2003) are excluded from this table. Adults who reported they had more than one type of health insurance are included in each applicable category in this table.
SOURCE: U.S. Department of Education, Institute of Education Sciences, National Center for Education Statistics, 2003 National Assessment of Adult Literacy.
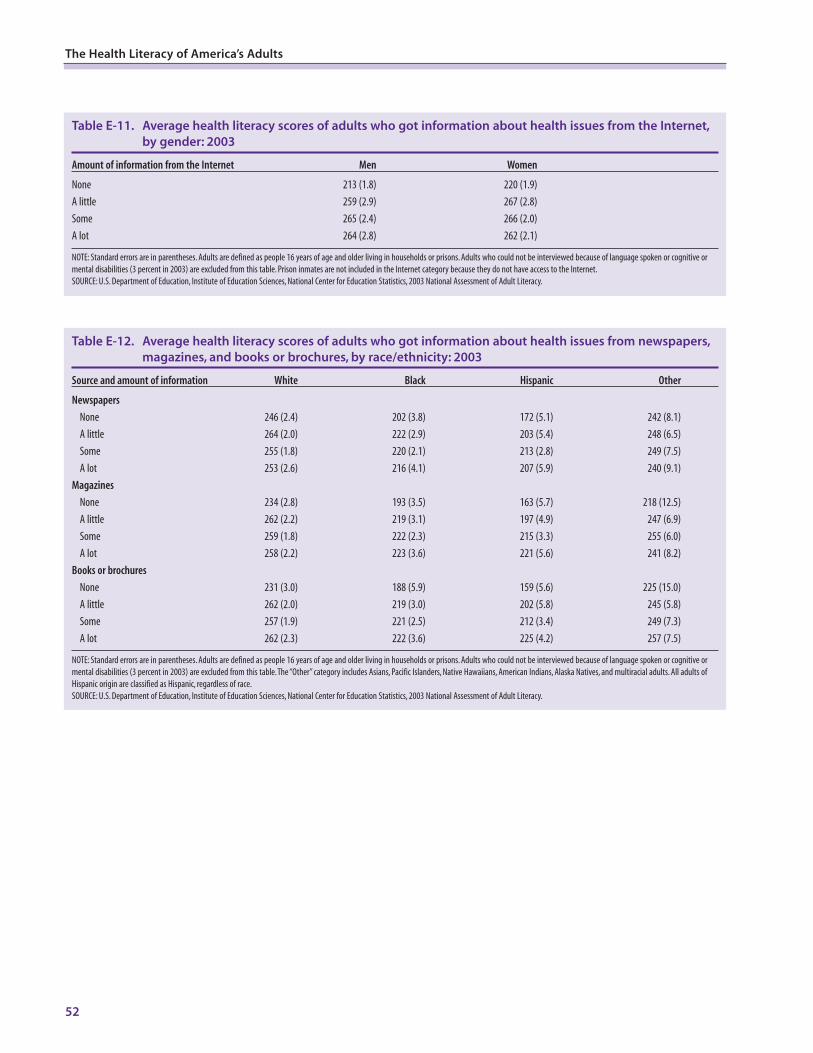
Table E-12. Average health literacy scores of adults who got information about health issues from newspapers,
magazines, and books or brochures, by race/ethnicity: 2003
Source and amount of information White Black Hispanic Other
Newspapers
None 246 (2.4) 202 (3.8) 172 (5.1) 242 (8.1)
A little 264 (2.0) 222 (2.9) 203 (5.4) 248 (6.5)
Some 255 (1.8) 220 (2.1) 213 (2.8) 249 (7.5)
A lot 253 (2.6) 216 (4.1) 207 (5.9) 240 (9.1)
Magazines
None 234 (2.8) 193 (3.5) 163 (5.7) 218 (12.5)
A little 262 (2.2) 219 (3.1) 197 (4.9) 247 (6.9)
Some 259 (1.8) 222 (2.3) 215 (3.3) 255 (6.0)
A lot 258 (2.2) 223 (3.6) 221 (5.6) 241 (8.2)
Books or brochures
None 231 (3.0) 188 (5.9) 159 (5.6) 225 (15.0)
A little 262 (2.0) 219 (3.0) 202 (5.8) 245 (5.8)
Some 257 (1.9) 221 (2.5) 212 (3.4) 249 (7.3)
A lot 262 (2.3) 222 (3.6) 225 (4.2) 257 (7.5)
NOTE: Standard errors are in parentheses. Adults are defined as people 16 years of age and older living in households or prisons. Adults who could not be interviewed because of language spoken or cognitive or
mental disabilities (3 percent in 2003) are excluded from this table.The “Other” category includes Asians, Pacific Islanders, Native Hawaiians, American Indians, Alaska Natives, and multiracial adults. All adults of
Hispanic origin are classified as Hispanic, regardless of race.
SOURCE: U.S. Department of Education, Institute of Education Sciences, National Center for Education Statistics, 2003 National Assessment of Adult Literacy.
52
The Health Literacy of America’s Adults
Table E-11. Average health literacy scores of adults who got information about health issues from the Internet,
by gender: 2003
Amount of information from the Internet Men Women
None 213 (1.8) 220 (1.9)
A little 259 (2.9) 267 (2.8)
Some 265 (2.4) 266 (2.0)
A lot 264 (2.8) 262 (2.1)
NOTE: Standard errors are in parentheses. Adults are defined as people 16 years of age and older living in households or prisons. Adults who could not be interviewed because of language spoken or cognitive or
mental disabilities (3 percent in 2003) are excluded from this table. Prison inmates are not included in the Internet category because they do not have access to the Internet.
SOURCE: U.S. Department of Education, Institute of Education Sciences, National Center for Education Statistics, 2003 National Assessment of Adult Literacy.
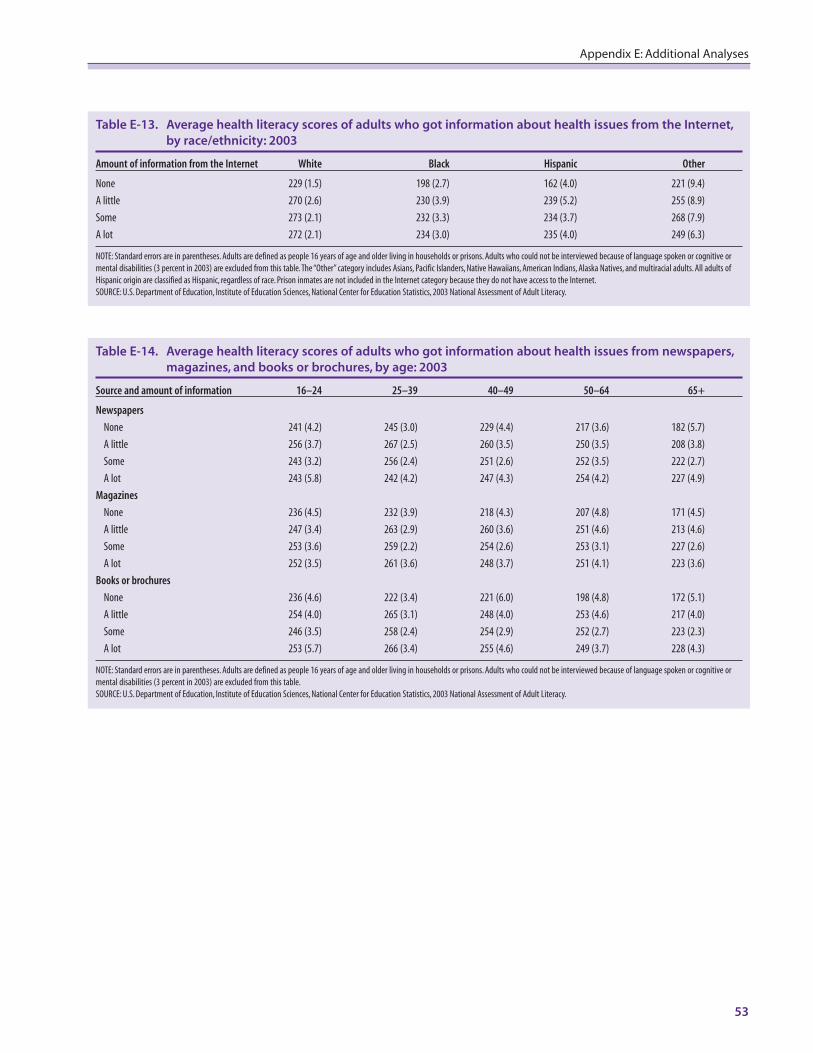
53
Appendix E: Additional Analyses
Table E-13. Average health literacy scores of adults who got information about health issues from the Internet,
by race/ethnicity: 2003
Amount of information from the Internet White Black Hispanic Other
None 229 (1.5) 198 (2.7) 162 (4.0) 221 (9.4)
A little 270 (2.6) 230 (3.9) 239 (5.2) 255 (8.9)
Some 273 (2.1) 232 (3.3) 234 (3.7) 268 (7.9)
A lot 272 (2.1) 234 (3.0) 235 (4.0) 249 (6.3)
NOTE: Standard errors are in parentheses. Adults are defined as people 16 years of age and older living in households or prisons. Adults who could not be interviewed because of language spoken or cognitive or
mental disabilities (3 percent in 2003) are excluded from this table.The “Other” category includes Asians, Pacific Islanders, Native Hawaiians, American Indians, Alaska Natives, and multiracial adults. All adults of
Hispanic origin are classified as Hispanic, regardless of race. Prison inmates are not included in the Internet category because they do not have access to the Internet.
SOURCE: U.S. Department of Education, Institute of Education Sciences, National Center for Education Statistics, 2003 National Assessment of Adult Literacy.
Table E-14. Average health literacy scores of adults who got information about health issues from newspapers,
magazines, and books or brochures, by age: 2003
Source and amount of information 16–24 25–39 40–49 50–64 65+
Newspapers
None 241 (4.2) 245 (3.0) 229 (4.4) 217 (3.6) 182 (5.7)
A little 256 (3.7) 267 (2.5) 260 (3.5) 250 (3.5) 208 (3.8)
Some 243 (3.2) 256 (2.4) 251 (2.6) 252 (3.5) 222 (2.7)
A lot 243 (5.8) 242 (4.2) 247 (4.3) 254 (4.2) 227 (4.9)
Magazines
None 236 (4.5) 232 (3.9) 218 (4.3) 207 (4.8) 171 (4.5)
A little 247 (3.4) 263 (2.9) 260 (3.6) 251 (4.6) 213 (4.6)
Some 253 (3.6) 259 (2.2) 254 (2.6) 253 (3.1) 227 (2.6)
A lot 252 (3.5) 261 (3.6) 248 (3.7) 251 (4.1) 223 (3.6)
Books or brochures
None 236 (4.6) 222 (3.4) 221 (6.0) 198 (4.8) 172 (5.1)
A little 254 (4.0) 265 (3.1) 248 (4.0) 253 (4.6) 217 (4.0)
Some 246 (3.5) 258 (2.4) 254 (2.9) 252 (2.7) 223 (2.3)
A lot 253 (5.7) 266 (3.4) 255 (4.6) 249 (3.7) 228 (4.3)
NOTE: Standard errors are in parentheses. Adults are defined as people 16 years of age and older living in households or prisons. Adults who could not be interviewed because of language spoken or cognitive or
mental disabilities (3 percent in 2003) are excluded from this table.
SOURCE: U.S. Department of Education, Institute of Education Sciences, National Center for Education Statistics, 2003 National Assessment of Adult Literacy.
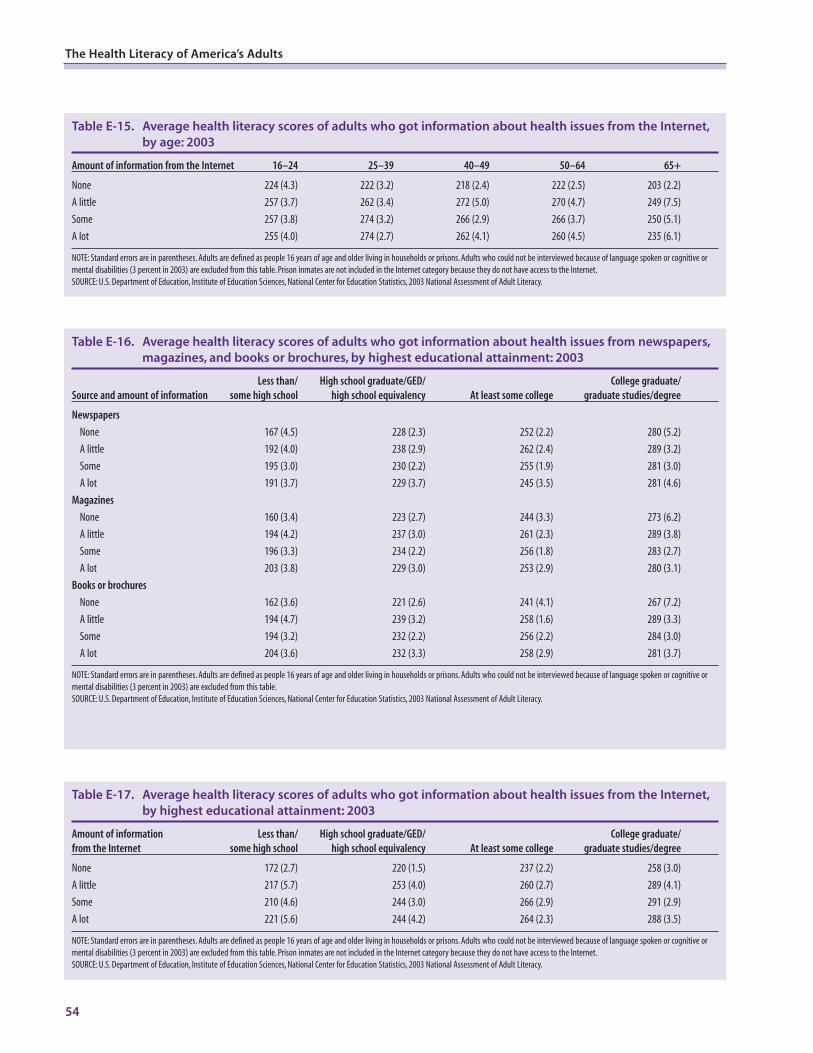
54
The Health Literacy of America’s Adults
Table E-16. Average health literacy scores of adults who got information about health issues from newspapers,
magazines, and books or brochures, by highest educational attainment: 2003
Less than/ High school graduate/GED/ College graduate/Source and amount of information some high school high school equivalency At least some college graduate studies/degree
Newspapers
None 167 (4.5) 228 (2.3) 252 (2.2) 280 (5.2)
A little 192 (4.0) 238 (2.9) 262 (2.4) 289 (3.2)
Some 195 (3.0) 230 (2.2) 255 (1.9) 281 (3.0)
A lot 191 (3.7) 229 (3.7) 245 (3.5) 281 (4.6)
Magazines
None 160 (3.4) 223 (2.7) 244 (3.3) 273 (6.2)
A little 194 (4.2) 237 (3.0) 261 (2.3) 289 (3.8)
Some 196 (3.3) 234 (2.2) 256 (1.8) 283 (2.7)
A lot 203 (3.8) 229 (3.0) 253 (2.9) 280 (3.1)
Books or brochures
None 162 (3.6) 221 (2.6) 241 (4.1) 267 (7.2)
A little 194 (4.7) 239 (3.2) 258 (1.6) 289 (3.3)
Some 194 (3.2) 232 (2.2) 256 (2.2) 284 (3.0)
A lot 204 (3.6) 232 (3.3) 258 (2.9) 281 (3.7)
NOTE: Standard errors are in parentheses. Adults are defined as people 16 years of age and older living in households or prisons. Adults who could not be interviewed because of language spoken or cognitive or
mental disabilities (3 percent in 2003) are excluded from this table.
SOURCE: U.S. Department of Education, Institute of Education Sciences, National Center for Education Statistics, 2003 National Assessment of Adult Literacy.
Table E-15. Average health literacy scores of adults who got information about health issues from the Internet,
by age: 2003
Amount of information from the Internet 16–24 25–39 40–49 50–64 65+
None 224 (4.3) 222 (3.2) 218 (2.4) 222 (2.5) 203 (2.2)
A little 257 (3.7) 262 (3.4) 272 (5.0) 270 (4.7) 249 (7.5)
Some 257 (3.8) 274 (3.2) 266 (2.9) 266 (3.7) 250 (5.1)
A lot 255 (4.0) 274 (2.7) 262 (4.1) 260 (4.5) 235 (6.1)
NOTE: Standard errors are in parentheses. Adults are defined as people 16 years of age and older living in households or prisons. Adults who could not be interviewed because of language spoken or cognitive or
mental disabilities (3 percent in 2003) are excluded from this table. Prison inmates are not included in the Internet category because they do not have access to the Internet.
SOURCE: U.S. Department of Education, Institute of Education Sciences, National Center for Education Statistics, 2003 National Assessment of Adult Literacy.
Table E-17. Average health literacy scores of adults who got information about health issues from the Internet,
by highest educational attainment: 2003
Amount of information Less than/ High school graduate/GED/ College graduate/from the Internet some high school high school equivalency At least some college graduate studies/degree
None 172 (2.7) 220 (1.5) 237 (2.2) 258 (3.0)
A little 217 (5.7) 253 (4.0) 260 (2.7) 289 (4.1)
Some 210 (4.6) 244 (3.0) 266 (2.9) 291 (2.9)
A lot 221 (5.6) 244 (4.2) 264 (2.3) 288 (3.5)
NOTE: Standard errors are in parentheses. Adults are defined as people 16 years of age and older living in households or prisons. Adults who could not be interviewed because of language spoken or cognitive or
mental disabilities (3 percent in 2003) are excluded from this table. Prison inmates are not included in the Internet category because they do not have access to the Internet.
SOURCE: U.S. Department of Education, Institute of Education Sciences, National Center for Education Statistics, 2003 National Assessment of Adult Literacy.
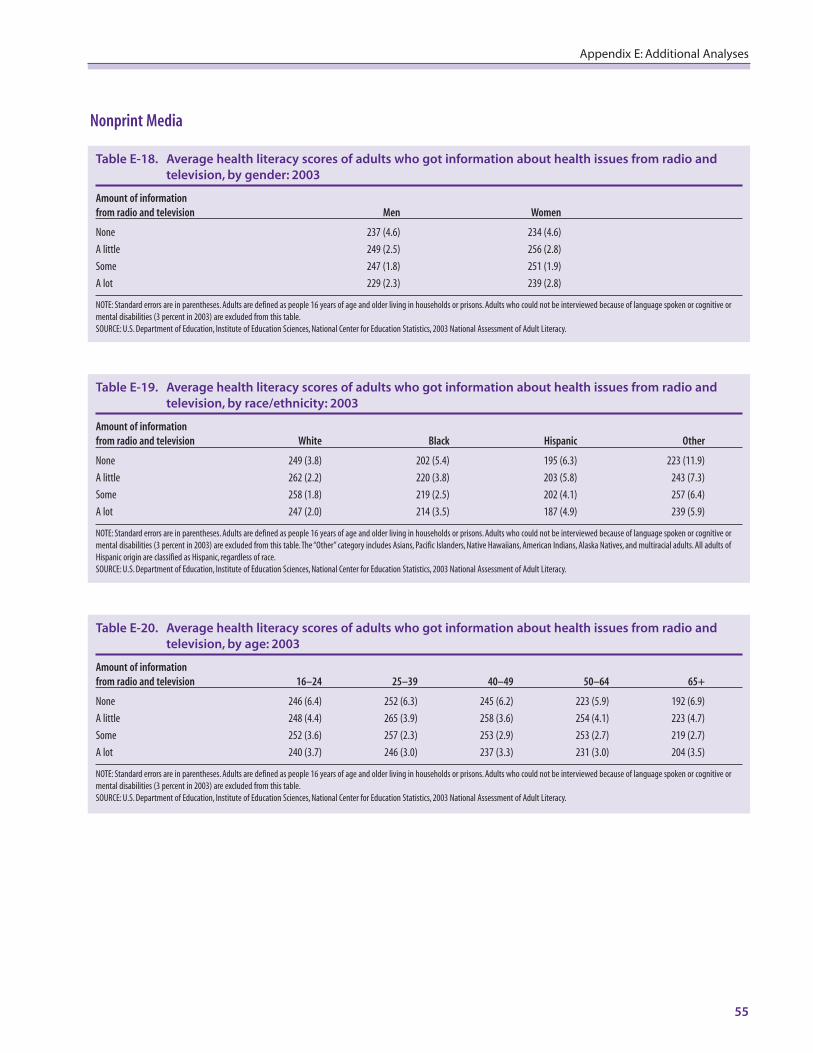
Nonprint Media
55
Appendix E: Additional Analyses
Table E-18. Average health literacy scores of adults who got information about health issues from radio and
television, by gender: 2003
Amount of information from radio and television Men Women
None 237 (4.6) 234 (4.6)
A little 249 (2.5) 256 (2.8)
Some 247 (1.8) 251 (1.9)
A lot 229 (2.3) 239 (2.8)
NOTE: Standard errors are in parentheses. Adults are defined as people 16 years of age and older living in households or prisons. Adults who could not be interviewed because of language spoken or cognitive or
mental disabilities (3 percent in 2003) are excluded from this table.
SOURCE: U.S. Department of Education, Institute of Education Sciences, National Center for Education Statistics, 2003 National Assessment of Adult Literacy.
Table E-19. Average health literacy scores of adults who got information about health issues from radio and
television, by race/ethnicity: 2003
Amount of information from radio and television White Black Hispanic Other
None 249 (3.8) 202 (5.4) 195 (6.3) 223 (11.9)
A little 262 (2.2) 220 (3.8) 203 (5.8) 243 (7.3)
Some 258 (1.8) 219 (2.5) 202 (4.1) 257 (6.4)
A lot 247 (2.0) 214 (3.5) 187 (4.9) 239 (5.9)
NOTE: Standard errors are in parentheses. Adults are defined as people 16 years of age and older living in households or prisons. Adults who could not be interviewed because of language spoken or cognitive or
mental disabilities (3 percent in 2003) are excluded from this table.The “Other” category includes Asians, Pacific Islanders, Native Hawaiians, American Indians, Alaska Natives, and multiracial adults. All adults of
Hispanic origin are classified as Hispanic, regardless of race.
SOURCE: U.S. Department of Education, Institute of Education Sciences, National Center for Education Statistics, 2003 National Assessment of Adult Literacy.
Table E-20. Average health literacy scores of adults who got information about health issues from radio and
television, by age: 2003
Amount of information from radio and television 16–24 25–39 40–49 50–64 65+
None 246 (6.4) 252 (6.3) 245 (6.2) 223 (5.9) 192 (6.9)
A little 248 (4.4) 265 (3.9) 258 (3.6) 254 (4.1) 223 (4.7)
Some 252 (3.6) 257 (2.3) 253 (2.9) 253 (2.7) 219 (2.7)
A lot 240 (3.7) 246 (3.0) 237 (3.3) 231 (3.0) 204 (3.5)
NOTE: Standard errors are in parentheses. Adults are defined as people 16 years of age and older living in households or prisons. Adults who could not be interviewed because of language spoken or cognitive or
mental disabilities (3 percent in 2003) are excluded from this table.
SOURCE: U.S. Department of Education, Institute of Education Sciences, National Center for Education Statistics, 2003 National Assessment of Adult Literacy.
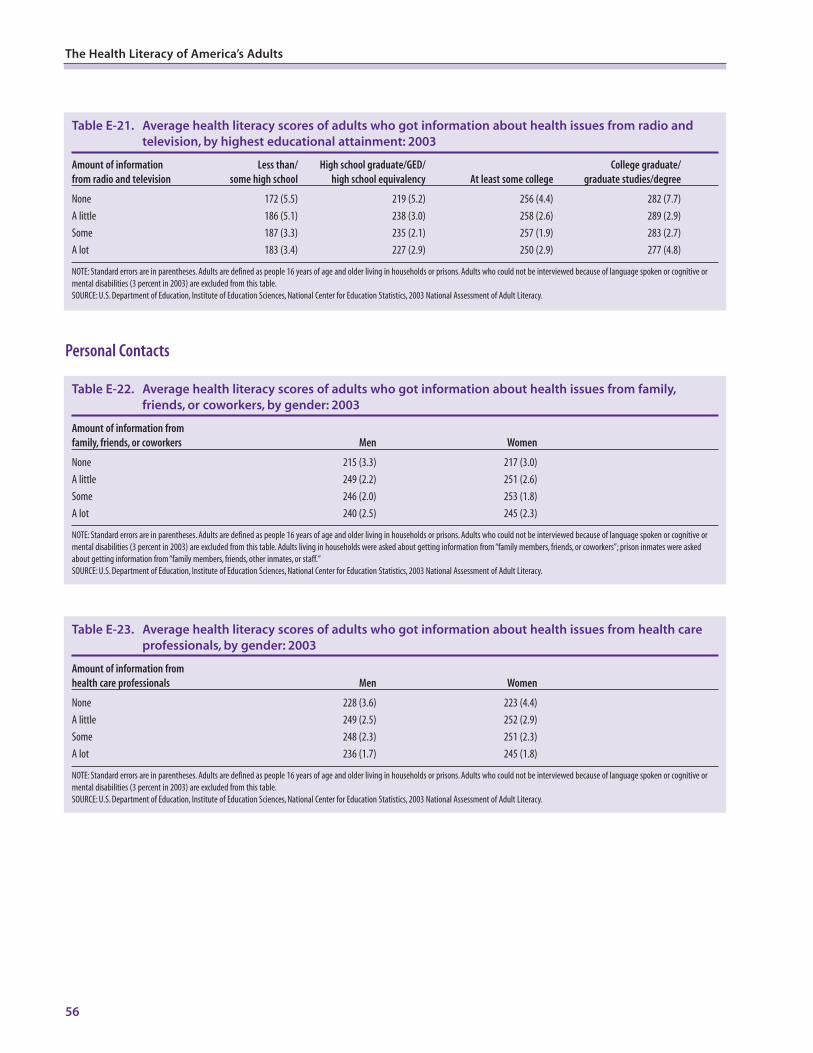
Personal Contacts
56
The Health Literacy of America’s Adults
Table E-21. Average health literacy scores of adults who got information about health issues from radio and
television, by highest educational attainment: 2003
Amount of information Less than/ High school graduate/GED/ College graduate/from radio and television some high school high school equivalency At least some college graduate studies/degree
None 172 (5.5) 219 (5.2) 256 (4.4) 282 (7.7)
A little 186 (5.1) 238 (3.0) 258 (2.6) 289 (2.9)
Some 187 (3.3) 235 (2.1) 257 (1.9) 283 (2.7)
A lot 183 (3.4) 227 (2.9) 250 (2.9) 277 (4.8)
NOTE: Standard errors are in parentheses. Adults are defined as people 16 years of age and older living in households or prisons. Adults who could not be interviewed because of language spoken or cognitive or
mental disabilities (3 percent in 2003) are excluded from this table.
SOURCE: U.S. Department of Education, Institute of Education Sciences, National Center for Education Statistics, 2003 National Assessment of Adult Literacy.
Table E-22. Average health literacy scores of adults who got information about health issues from family,
friends, or coworkers, by gender: 2003
Amount of information from family, friends, or coworkers Men Women
None 215 (3.3) 217 (3.0)
A little 249 (2.2) 251 (2.6)
Some 246 (2.0) 253 (1.8)
A lot 240 (2.5) 245 (2.3)
NOTE: Standard errors are in parentheses. Adults are defined as people 16 years of age and older living in households or prisons. Adults who could not be interviewed because of language spoken or cognitive or
mental disabilities (3 percent in 2003) are excluded from this table. Adults living in households were asked about getting information from “family members, friends, or coworkers”; prison inmates were asked
about getting information from “family members, friends, other inmates, or staff.”
SOURCE: U.S. Department of Education, Institute of Education Sciences, National Center for Education Statistics, 2003 National Assessment of Adult Literacy.
Table E-23. Average health literacy scores of adults who got information about health issues from health care
professionals, by gender: 2003
Amount of information from health care professionals Men Women
None 228 (3.6) 223 (4.4)
A little 249 (2.5) 252 (2.9)
Some 248 (2.3) 251 (2.3)
A lot 236 (1.7) 245 (1.8)
NOTE: Standard errors are in parentheses. Adults are defined as people 16 years of age and older living in households or prisons. Adults who could not be interviewed because of language spoken or cognitive or
mental disabilities (3 percent in 2003) are excluded from this table.
SOURCE: U.S. Department of Education, Institute of Education Sciences, National Center for Education Statistics, 2003 National Assessment of Adult Literacy.
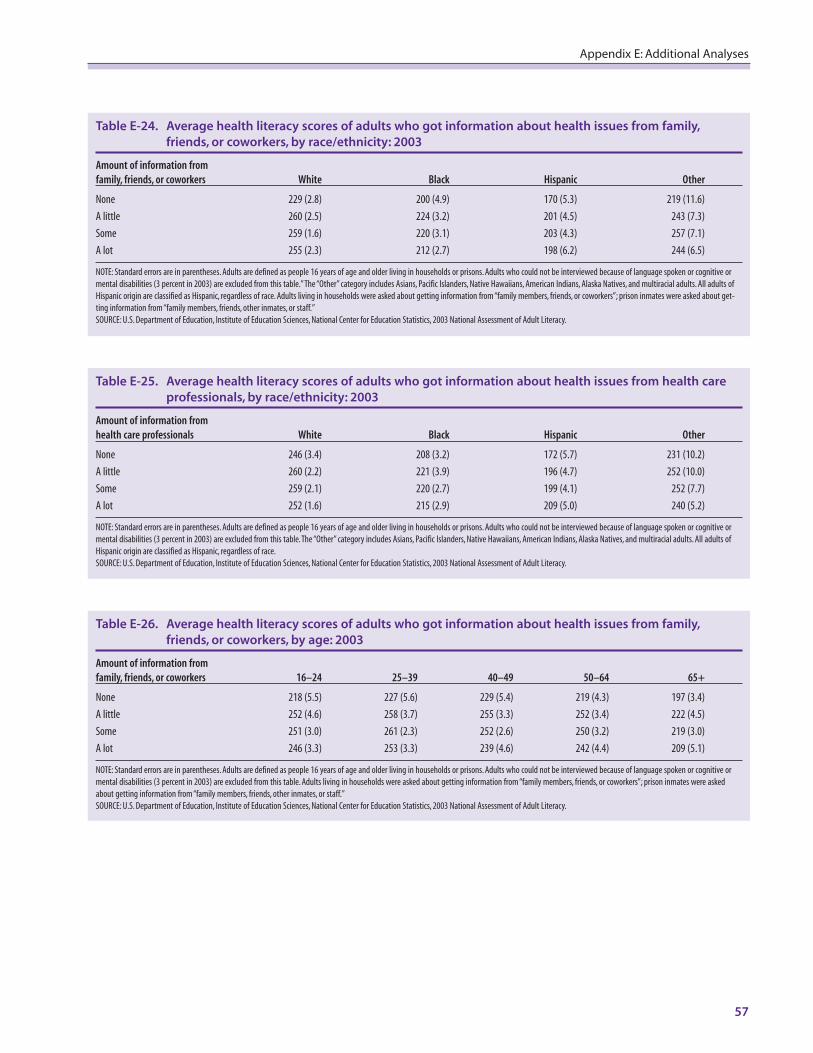
57
Appendix E: Additional Analyses
Table E-24. Average health literacy scores of adults who got information about health issues from family,
friends, or coworkers, by race/ethnicity: 2003
Amount of information from family, friends, or coworkers White Black Hispanic Other
None 229 (2.8) 200 (4.9) 170 (5.3) 219 (11.6)
A little 260 (2.5) 224 (3.2) 201 (4.5) 243 (7.3)
Some 259 (1.6) 220 (3.1) 203 (4.3) 257 (7.1)
A lot 255 (2.3) 212 (2.7) 198 (6.2) 244 (6.5)
NOTE: Standard errors are in parentheses. Adults are defined as people 16 years of age and older living in households or prisons. Adults who could not be interviewed because of language spoken or cognitive or
mental disabilities (3 percent in 2003) are excluded from this table.”The “Other” category includes Asians, Pacific Islanders, Native Hawaiians, American Indians, Alaska Natives, and multiracial adults. All adults of
Hispanic origin are classified as Hispanic, regardless of race. Adults living in households were asked about getting information from “family members, friends, or coworkers”; prison inmates were asked about get-
ting information from “family members, friends, other inmates, or staff.”
SOURCE: U.S. Department of Education, Institute of Education Sciences, National Center for Education Statistics, 2003 National Assessment of Adult Literacy.
Table E-25. Average health literacy scores of adults who got information about health issues from health care
professionals, by race/ethnicity: 2003
Amount of information fromhealth care professionals White Black Hispanic Other
None 246 (3.4) 208 (3.2) 172 (5.7) 231 (10.2)
A little 260 (2.2) 221 (3.9) 196 (4.7) 252 (10.0)
Some 259 (2.1) 220 (2.7) 199 (4.1) 252 (7.7)
A lot 252 (1.6) 215 (2.9) 209 (5.0) 240 (5.2)
NOTE: Standard errors are in parentheses. Adults are defined as people 16 years of age and older living in households or prisons. Adults who could not be interviewed because of language spoken or cognitive or
mental disabilities (3 percent in 2003) are excluded from this table.The “Other” category includes Asians, Pacific Islanders, Native Hawaiians, American Indians, Alaska Natives, and multiracial adults. All adults of
Hispanic origin are classified as Hispanic, regardless of race.
SOURCE: U.S. Department of Education, Institute of Education Sciences, National Center for Education Statistics, 2003 National Assessment of Adult Literacy.
Table E-26. Average health literacy scores of adults who got information about health issues from family,
friends, or coworkers, by age: 2003
Amount of information from family, friends, or coworkers 16–24 25–39 40–49 50–64 65+
None 218 (5.5) 227 (5.6) 229 (5.4) 219 (4.3) 197 (3.4)
A little 252 (4.6) 258 (3.7) 255 (3.3) 252 (3.4) 222 (4.5)
Some 251 (3.0) 261 (2.3) 252 (2.6) 250 (3.2) 219 (3.0)
A lot 246 (3.3) 253 (3.3) 239 (4.6) 242 (4.4) 209 (5.1)
NOTE: Standard errors are in parentheses. Adults are defined as people 16 years of age and older living in households or prisons. Adults who could not be interviewed because of language spoken or cognitive or
mental disabilities (3 percent in 2003) are excluded from this table. Adults living in households were asked about getting information from “family members, friends, or coworkers”; prison inmates were asked
about getting information from “family members, friends, other inmates, or staff.”
SOURCE: U.S. Department of Education, Institute of Education Sciences, National Center for Education Statistics, 2003 National Assessment of Adult Literacy.
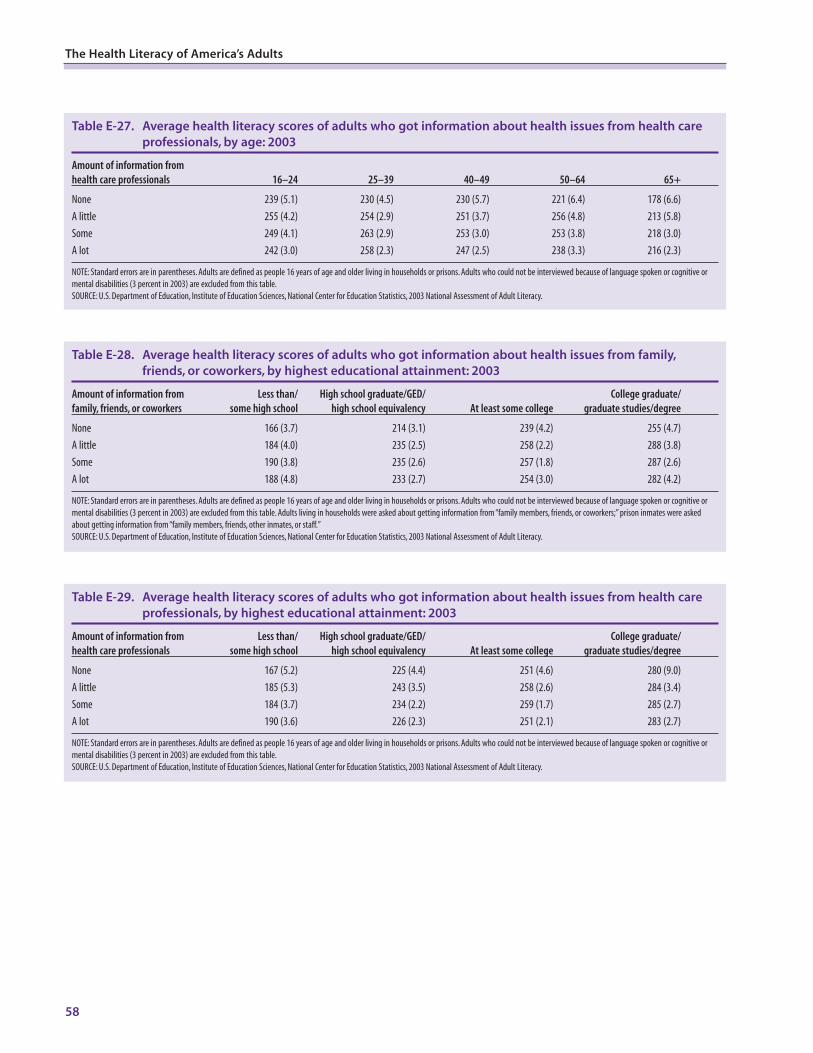
58
The Health Literacy of America’s Adults
Table E-27. Average health literacy scores of adults who got information about health issues from health care
professionals, by age: 2003
Amount of information from health care professionals 16–24 25–39 40–49 50–64 65+
None 239 (5.1) 230 (4.5) 230 (5.7) 221 (6.4) 178 (6.6)
A little 255 (4.2) 254 (2.9) 251 (3.7) 256 (4.8) 213 (5.8)
Some 249 (4.1) 263 (2.9) 253 (3.0) 253 (3.8) 218 (3.0)
A lot 242 (3.0) 258 (2.3) 247 (2.5) 238 (3.3) 216 (2.3)
NOTE: Standard errors are in parentheses. Adults are defined as people 16 years of age and older living in households or prisons. Adults who could not be interviewed because of language spoken or cognitive or
mental disabilities (3 percent in 2003) are excluded from this table.
SOURCE: U.S. Department of Education, Institute of Education Sciences, National Center for Education Statistics, 2003 National Assessment of Adult Literacy.
Table E-28. Average health literacy scores of adults who got information about health issues from family,
friends, or coworkers, by highest educational attainment: 2003
Amount of information from Less than/ High school graduate/GED/ College graduate/family, friends, or coworkers some high school high school equivalency At least some college graduate studies/degree
None 166 (3.7) 214 (3.1) 239 (4.2) 255 (4.7)
A little 184 (4.0) 235 (2.5) 258 (2.2) 288 (3.8)
Some 190 (3.8) 235 (2.6) 257 (1.8) 287 (2.6)
A lot 188 (4.8) 233 (2.7) 254 (3.0) 282 (4.2)
NOTE: Standard errors are in parentheses. Adults are defined as people 16 years of age and older living in households or prisons. Adults who could not be interviewed because of language spoken or cognitive or
mental disabilities (3 percent in 2003) are excluded from this table. Adults living in households were asked about getting information from “family members, friends, or coworkers;” prison inmates were asked
about getting information from “family members, friends, other inmates, or staff.”
SOURCE: U.S. Department of Education, Institute of Education Sciences, National Center for Education Statistics, 2003 National Assessment of Adult Literacy.
Table E-29. Average health literacy scores of adults who got information about health issues from health care
professionals, by highest educational attainment: 2003
Amount of information from Less than/ High school graduate/GED/ College graduate/health care professionals some high school high school equivalency At least some college graduate studies/degree
None 167 (5.2) 225 (4.4) 251 (4.6) 280 (9.0)
A little 185 (5.3) 243 (3.5) 258 (2.6) 284 (3.4)
Some 184 (3.7) 234 (2.2) 259 (1.7) 285 (2.7)
A lot 190 (3.6) 226 (2.3) 251 (2.1) 283 (2.7)
NOTE: Standard errors are in parentheses. Adults are defined as people 16 years of age and older living in households or prisons. Adults who could not be interviewed because of language spoken or cognitive or
mental disabilities (3 percent in 2003) are excluded from this table.
SOURCE: U.S. Department of Education, Institute of Education Sciences, National Center for Education Statistics, 2003 National Assessment of Adult Literacy.
59
toc
1CHAPTER ONEREFERENCES
ReferencesBaker, D.W., Gazmararian, J.A., Williams, M.V., Scott, T.,
Parker, R.M., Green, D., Ren, J., and Peel, J. (2004).Health Literacy and Use of Outpatient PhysicianServices by Medicare Managed Care Enrollees.Journal of General Internal Medicine, 19(3): 215–220.
Baker, D.W., Parker, R.M.,Williams, M.V., and Clark,W.S.(1998). Health Literacy and the Risk of Hospitalization.Journal of General Internal Medicine, 13(12): 791–798.
Berkman, N.D., DeWalt, D.A., Pignone, M.P., Sheridan,S.L., Lohr, K.N., Lux, L., Sutton, S.F., Swinson, T.,Bonito, A.J. (2004) Literacy and Health Outcomes.Evidence Report/Technology Assessment No. 87(Prepared by RTI International—University of NorthCarolina Evidence-based Practice Center underContract No. 290-02-0016). AHRQ Publication No.04-E007-2. Rockville, MD: Agency for HealthcareResearch and Quality.
Binder, D.A. (1983). On the Variances of AsymptoticallyNormal Estimates for Complex Surveys. InternationalStatistical Review, 51(3): 279–292.
Fox, S., and Rainie, L. (2000). The Online Health CareRevolution: How the Web Helps Americans Take Better Careof Themselves. Washington, DC: Pew Charitable Trusts.
Gordon, M.M., Hampson, R., Capell, H.A., and Madhok,R. (2002). Illiteracy in Rheumatoid Arthritis Patients asDetermined by the Rapid Estimate of Adult Literacy inMedicine (REALM) Score. Rheumatology (Oxford),41(7): 750–754.
60
The Health Literacy of America’s Adults
Hambleton, R.K., and Swaminathan, H. (1985). Item Response Theory: Principles and Applications. Boston:Kluwer-Nijhoff Publishing.
Hauser, R.M., Edley, C.F. Jr., Koenig, J.A., and Elliott, S.W. (Eds.). (2005). Measuring Literacy: Performance Levelsfor Adults, Interim Report. Washington, DC: National Academies Press.
Institute of Medicine (2004). Health Literacy: A Prescription to End Confusion. Washington, DC: Institute ofMedicine, Board on Neuroscience and Behavioral Health, Committee on Health Literacy.
Kutner, M., Greenberg, E., and Baer, J., (2005). A First Look at the Literacy of America's Adults in the 21st Century(NCES 2006-470). U.S. Department of Education, National Center for Education Statistics.Washington,DC: U.S. Government Printing Office.
Lindau, S.T.,Tomori, C., McCarville, M.A., and Bennett, C.L. (2001). Improving Rates of Cervical CancerScreening and Pap Smear Follow-Up for Low-Income Women With Limited Health Literacy. CancerInvestigation, 19(3): 316–323.
Little, R.J.A., and Rubin, D.B. (2002). Statistical Analysis with Missing Data. Hoboken, New Jersey:Wiley.
Rudd, R.E., Moeykens, B.A., and Colton,T.C. (1999). Health and Literacy:A Review of Medical and PublicHealth Literature. Review of Adult Learning and Literacy,Volume 1. San Francisco, CA: Jossey-Bass.
Taylor, H. (2001). The Harris Poll #19: Cyberchondriacs Update. Retrieved November 5, 2003, fromhttp://www.harrisinteractive.com/harris_poll/printerfriend/index.asp?PID=229.
U.S. Department of Health and Human Services (HHS). (2000). Healthy People 2010: Understanding andImproving Health. Washington, DC:Author.
U.S. Department of Health and Human Services (HHS). (2003). Communicating Health: Priorities and Strategies for Progress. Washington, DC. Retrieved June 15, 2006 from http://odphp.osophs.dhhs.gov/projects/HealthComm/.
White, S., and Dillow, S. (2005). Key Concepts and Features of the 2003 National Assessment of Adult Literacy(NCES 2006-471). U.S. Department of Education, National Center for Education Statistics.Washington,DC: U.S. Government Printing Office.
Williams, M.V., Davis, T., Parker, R.M., and Weiss, B.D. (2002). The Role of Health Literacy in Patient-Physician Communication. Family Medicine, 34(5): 383–389.
Related Documents