The Haves and Have Nots: Sophisticated Cross-Institutional Analysis Techniques that Support Budget Justifications Brian W. Keith 2014 Charleston Conference 1

The Haves and Have Nots: Sophisticated Cross-Institutional Analysis Techniques that Support Budget Justifications Brian W. Keith 2014 Charleston Conference.
Dec 27, 2015
Welcome message from author
This document is posted to help you gain knowledge. Please leave a comment to let me know what you think about it! Share it to your friends and learn new things together.
Transcript

The Haves and Have Nots:
Sophisticated Cross-Institutional Analysis Techniques that Support Budget
Justifications
Brian W. Keith
2014 Charleston Conference
1

AGENDA• Background• The Question and another one• Investigation (data and peers)• Peer Analysis• Demand and Resource comparisons• Funding comparisons
1. Percentage based2. Linear regression based
2

BACKGROUND• The University of Florida (UF) is a major,
public, comprehensive, land-grant, research university.
• It is one of only 17 public, land-grant universities that belong to the Association of American Universities, and is one of the largest universities in the nation, with more than 50,000 students.
3
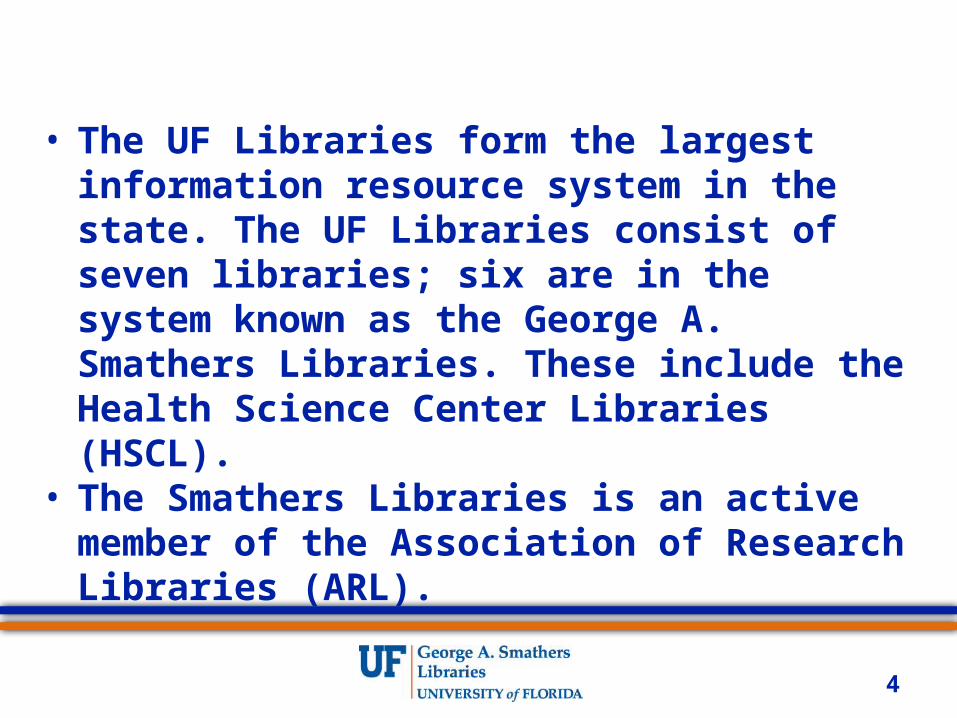
• The UF Libraries form the largest information resource system in the state. The UF Libraries consist of seven libraries; six are in the system known as the George A. Smathers Libraries. These include the Health Science Center Libraries (HSCL).
• The Smathers Libraries is an active member of the Association of Research Libraries (ARL).
4
5
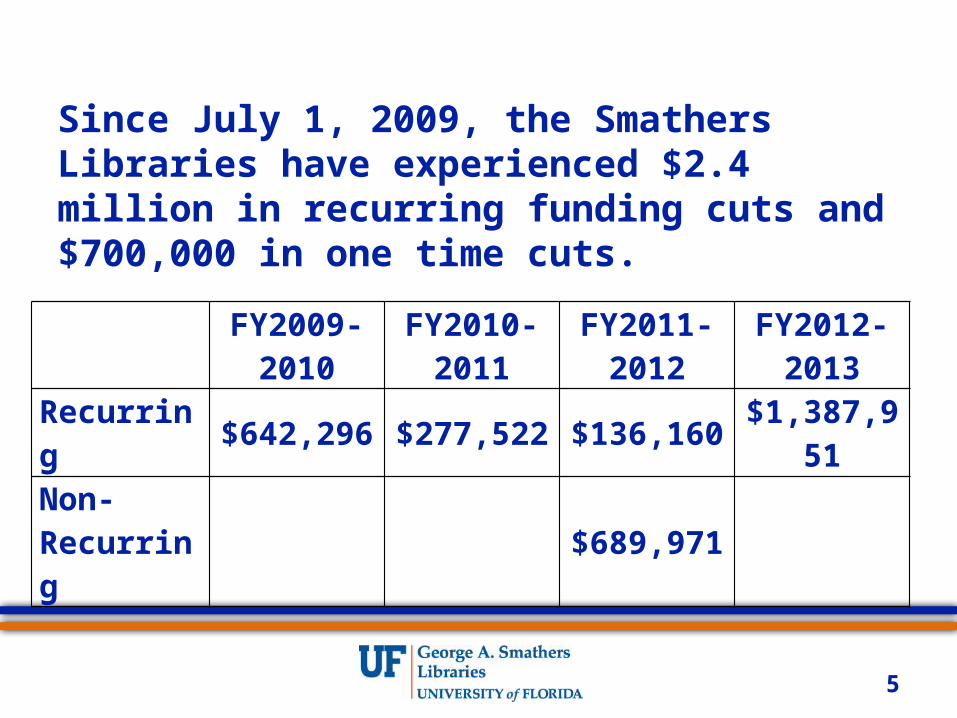
FY2009-
2010FY2010-
2011FY2011-
2012FY2012-
2013
Recurring $642,296 $277,522 $136,160 $1,387,951
Non-Recurring $689,971
Since July 1, 2009, the Smathers Libraries have experienced $2.4 million in recurring funding cuts and $700,000 in one time cuts.
6

• In 2011, UF adopted Responsibility Centered Management (RCM) for budgeting.
7

• Under RCM, the colleges became Responsibility Centers (revenue generators) and the Libraries became one of the numerous Support Units (non-revenue generating units primarily providing services to Responsibility Centers).
• The fundamental premise of RCM is to move decisions and resulting revenues to the colleges.
8
• RCM, along with decreased UF appropriations and lost purchasing power for library materials have increased pressure (internally and externally) to assess library funding and expenditures
9

• In 2014, UF launched UF Rising – a five-year initiative to elevate the University to among the nation’s top public universities.
• A combined $950 million is aimed at hiring new midcareer and eminent professors, adding new endowed professorships, and to upgrading and adding facilities.
10
• Smathers Libraries Mission
The Smathers Libraries partner with UF faculty, students and staff, as well as the University’s collaborators and constituents, to facilitate knowledge creation that contributes to UF’s standing as a preeminent public research university…
11

The QUESTION
• What should the funding be for the Smathers Libraries?
UF Libraries?
• Do the UF Libraries spend money eccentrically?
12

INVESTIGATION
• Establish Peers
13

INVESTIGATION
• Available data:
• National Center for Education Statistics (NCES) data for university characteristics that correlate with DEMAND for library resources & services
• ARL data for characteristics that reflect library RESOURCES relating to materials and staff
14

PEER ANALYSIS
• Demand v. Resources
15

PEER ANALYSIS
16
UNIVERSITYDemand
Average Excluding UF
UF as % ofNon-UF Average
Total Faculty 4,206 131%
Total Students 38,197 131%
Undergraduates 27,346 120%
Graduate Students 10,851 158%
PhD's Awarded 1,187 165%
17
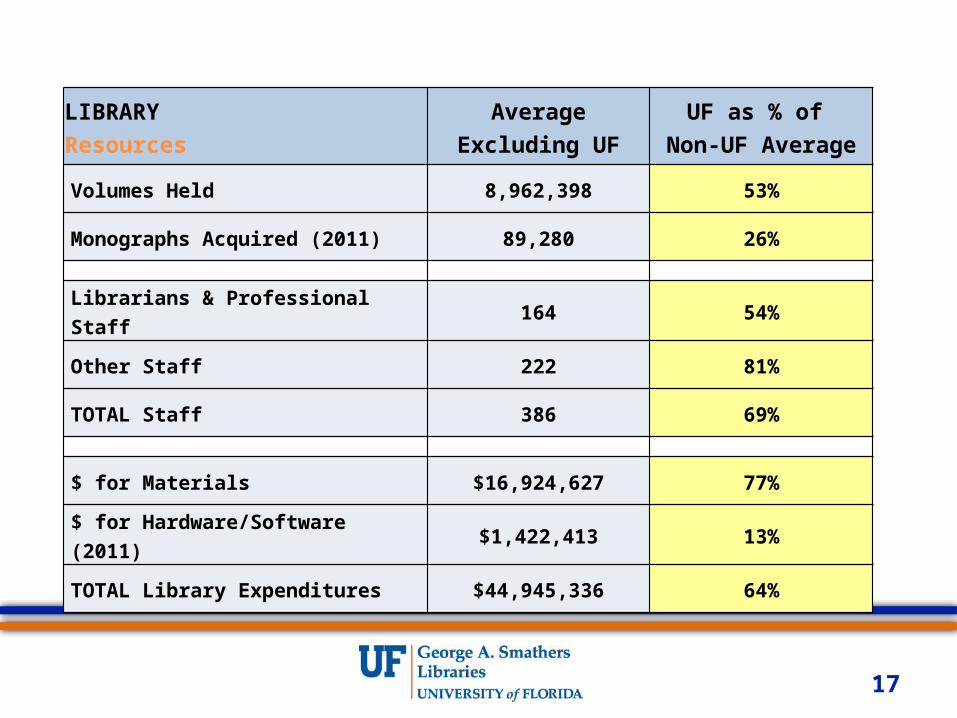
LIBRARYResources
AverageExcluding UF
UF as % of Non-UF Average
Volumes Held 8,962,398 53%
Monographs Acquired (2011) 89,280 26%
Librarians & Professional Staff 164 54%
Other Staff 222 81%
TOTAL Staff 386 69%
$ for Materials $16,924,627 77%
$ for Hardware/Software (2011) $1,422,413 13%
TOTAL Library Expenditures $44,945,336 64%

• Findings:
1. UF is above average in all metrics reflecting demand for library services and/or resources
2. The UF Libraries are below average in all metrics reflecting the resources for the delivery of services and information
18

19
Per FacultyUF AVG Ratio
Volumes Held 869 2,274 1 : 2.6Monographs Acquired (2011) 4.28 21.02 1 : 4.9
Librarians and Professional Staff 0.0162 0.0409 1 : 2.5Other Staff 0.0326 0.0555 1 : 1.7TOTAL Staff 0.0488 0.0964 1 : 2
$ for Materials $2,370 $4,214 1 : 1.8$ for HW and SW (2011) $34.51 $337.32 1 : 9.8Total Lib Expenditures $5,202 $11,288 1 : 2.2
20
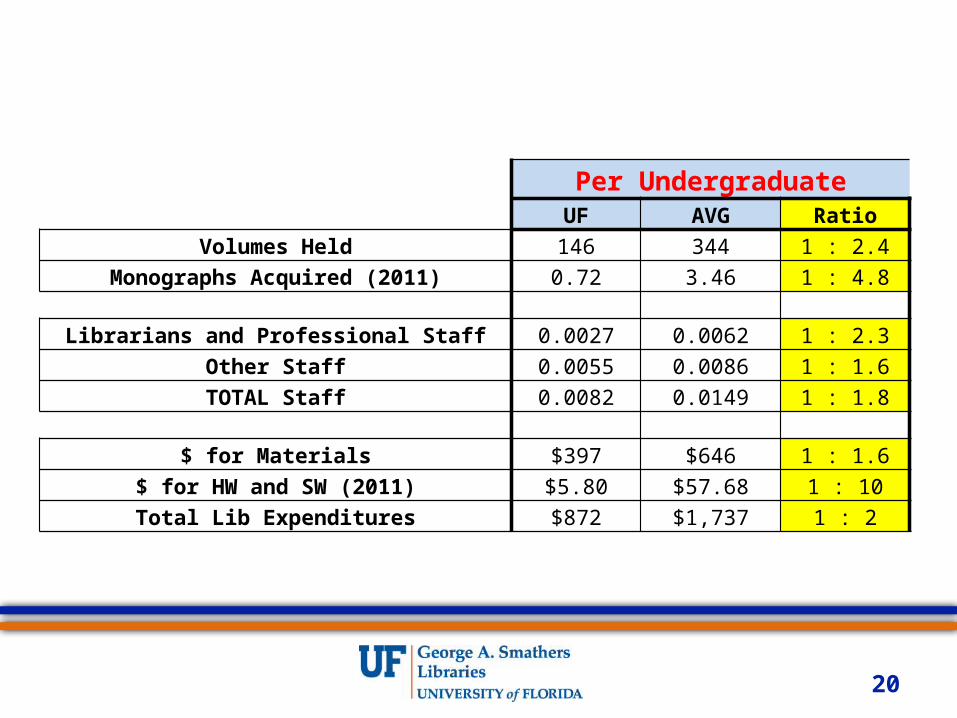
Per UndergraduateUF AVG Ratio
Volumes Held 146 344 1 : 2.4Monographs Acquired (2011) 0.72 3.46 1 : 4.8
Librarians and Professional Staff 0.0027 0.0062 1 : 2.3Other Staff 0.0055 0.0086 1 : 1.6TOTAL Staff 0.0082 0.0149 1 : 1.8
$ for Materials $397 $646 1 : 1.6$ for HW and SW (2011) $5.80 $57.68 1 : 10Total Lib Expenditures $872 $1,737 1 : 2

21
Per Graduate StudentUF AVG Ratio
Volumes Held 279 828 1 : 3Monographs Acquired (2011) 1.38 7.76 1 : 5.6
Librarians and Professional Staff 0.0052 0.0158 1 : 3Other Staff 0.0104 0.0226 1 : 2.2TOTAL Staff 0.0156 0.0384 1 : 2.5
$ for Materials $760 $1,656 1 : 2.2$ for HW and SW (2011) $11.12 $134.15 1 : 12.1Total Lib Expenditures $1,668 $4,405 1 : 2.6

22
Per PhD AwardedUF AVG Ratio
Volumes Held 2,444 7,620 1 : 3.1Monographs Acquired (2011) 11.02 75.48 1 : 6.9
Librarians and Professional Staff 0.0455 0.1428 1 : 3.1Other Staff 0.0916 0.2054 1 : 2.2TOTAL Staff 0.1372 0.3482 1 : 2.5
$ for Materials $6,664 $15,140 1 : 2.3$ for HW and SW (2011) $88.82 $1,239 1 : 14Total Lib Expenditures $14,627 $40,115 1 : 2.8
23
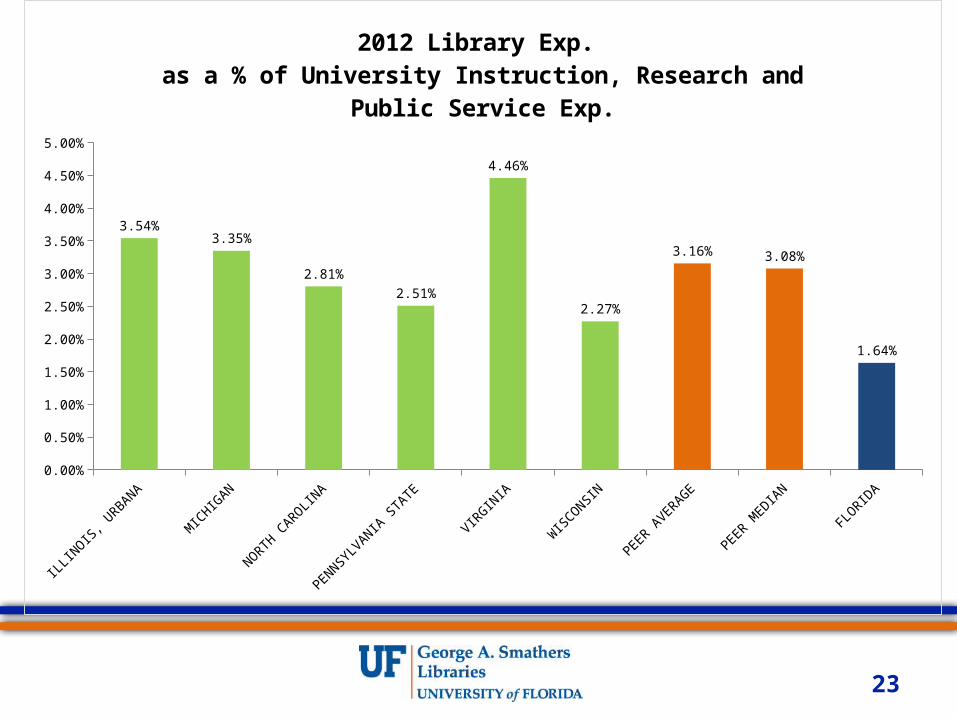
ILLINOIS, URBANA
MICHIGAN NORTH CAROLINA
PENNSYLVANIA STATE
VIRGINIA WISCONSIN PEER AVERAGE PEER MEDIAN FLORIDA0.00%
0.50%
1.00%
1.50%
2.00%
2.50%
3.00%
3.50%
4.00%
4.50%
5.00%
3.54%3.35%
2.81%
2.51%
4.46%
2.27%
3.16% 3.08%
1.64%
2012 Library Exp. as a % of University Instruction, Research and Public Service Exp.

24
ILLINOIS, URBANA
MICHIGAN NORTH CAROLINA
PENNSYLVANIA STATE
VIRGINIA WISCONSIN PEER AVERAGE PEER MEDIAN FLORIDA0.00%
0.20%
0.40%
0.60%
0.80%
1.00%
1.20%
1.40%
1.60%
1.47%
1.27%
1.13%
0.99%
1.42%
0.74%
1.17%1.20%
0.75%
2012 Materials Exp. as a % of University Instruction, Research and Public Service Exp.

25
26

27

28
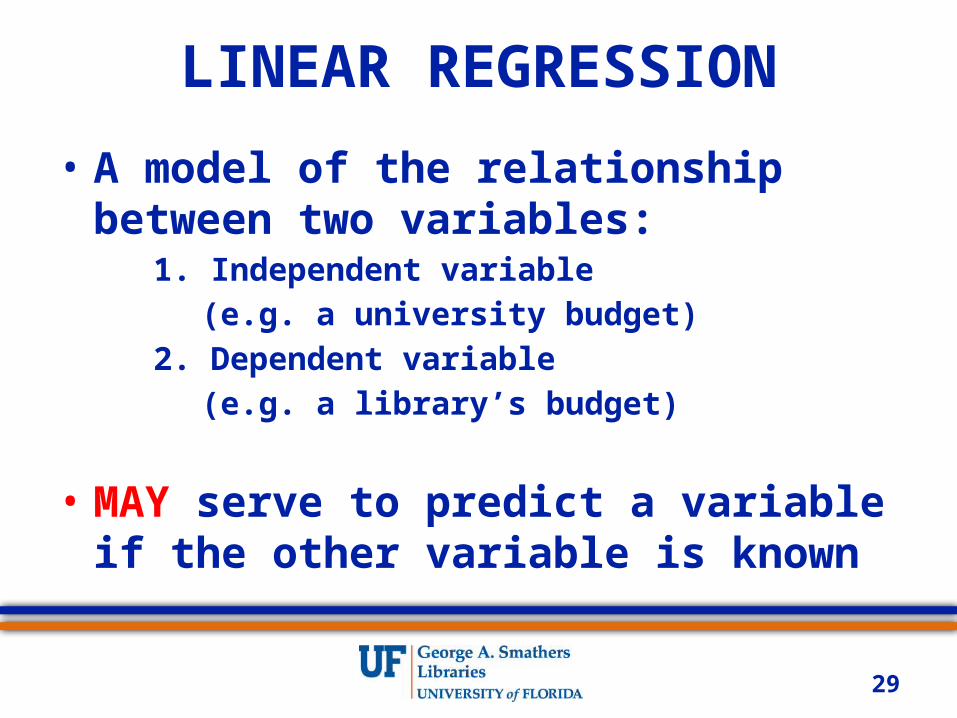
LINEAR REGRESSION
• A model of the relationship between two variables:
1. Independent variable
(e.g. a university budget)
2. Dependent variable
(e.g. a library’s budget)
• MAY serve to predict a variable if the other variable is known
29
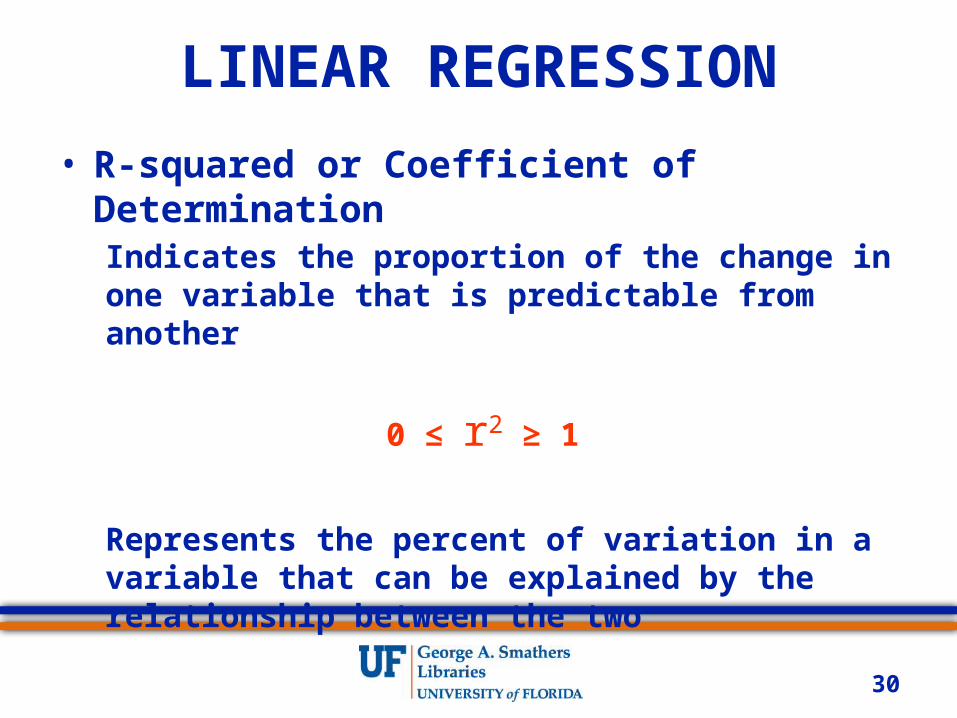
LINEAR REGRESSION
• R-squared or Coefficient of DeterminationIndicates the proportion of the change in one variable that is predictable from another
0 ≤ r2 ≥ 1
Represents the percent of variation in a variable that can be explained by the relationship between the two
30

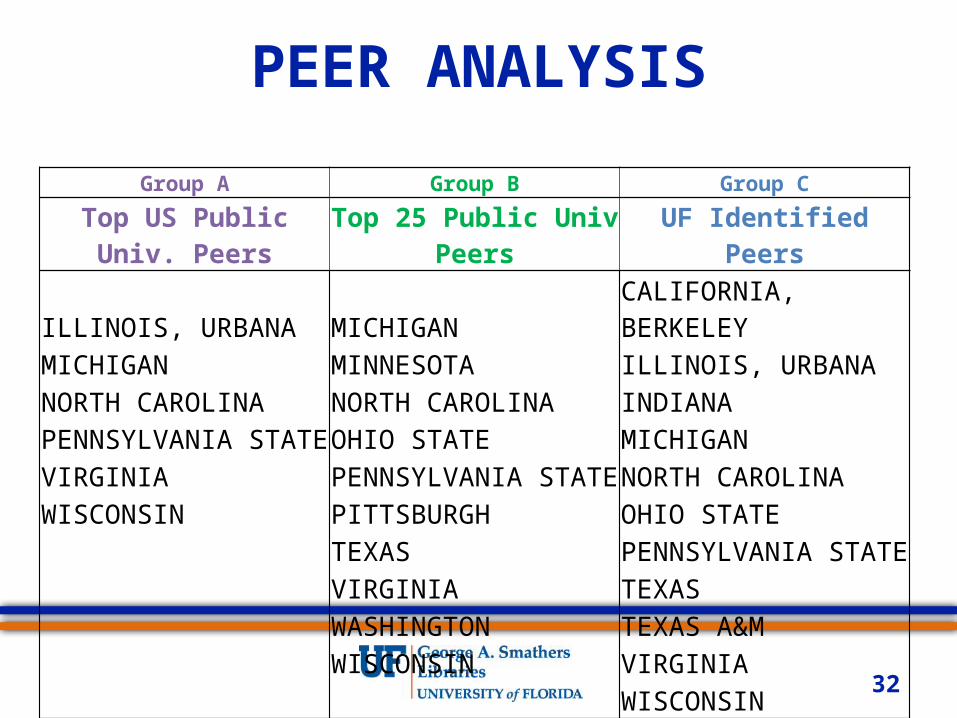
PEER ANALYSIS
• Compared UF to Three Groups of AAU Public Universities– Group A: 6 of Top 11 from US News (Aspirational
Peers)– Group B: 10 of Top 25 from US News
(Comprehensive Universities with Law & 2 or more Health Colleges)
– Group C: UF Identified Peers
31
PEER ANALYSIS
32
Group A Group B Group CTop US Public Univ. Peers Top 25 Public Univ Peers UF Identified PeersILLINOIS, URBANA MICHIGAN CALIFORNIA, BERKELEYMICHIGAN MINNESOTA ILLINOIS, URBANANORTH CAROLINA NORTH CAROLINA INDIANAPENNSYLVANIA STATE OHIO STATE MICHIGANVIRGINIA PENNSYLVANIA STATE NORTH CAROLINAWISCONSIN PITTSBURGH OHIO STATE
TEXAS PENNSYLVANIA STATEVIRGINIA TEXASWASHINGTON TEXAS A&MWISCONSIN VIRGINIA
WISCONSIN

33
0 2,000,000,000 4,000,000,000 6,000,000,00025,000,000
30,000,000
35,000,000
40,000,000
45,000,000
50,000,000
55,000,000
60,000,000
65,000,000
2008-2012 Peer Averages & UF ActualTotal Library Expenditures v. Total University Expenditures
University Expenditures
Libra
ry E
xpen
ditu
res
Group A Group B Group C UF ActualR² = 0.8637 R² = 0.6398 R² = 0.445 R² = 0.0258

34

LINEAR REGRESSION
Linear regression line formula
The model identified by the linear regression analysis of university revenue from tuition and appropriation at peer universities (independent variable) and total library expenditures at those institutions (dependent variable) for each year can be expressed in a regression line with a formula of
Y = a + bX
35

LINEAR REGRESSION
Linear regression line formula
Y = a + bX
In this formula:
Y = the dependent variable (library)
X = the independent variable (university)
b = the slope of the regression line
a = the intercept point of the regression line
and the y axis.
36

PEER ANALYSIS
37
Application of Linear Regression Formulas to Estimate Appropriate Funding for UF Libraries
UF Tuition & Appropriations
2008 $855,300,000
2009 $849,955,000
2010 $797,569,000
2011 $855,234,000
2012 $848,376,000

PEER ANALYSIS
38
Application of Linear Regression Formulas to Estimate Appropriate Funding for UF Libraries
Linear Regression for Peers: Total Library Expenditures & University Tuition and Appropriations
2008 y = 0.01x + 30,868,025
2009 y = 0.02x + 29,693,057
2010 y = 0.02x + 27,401,814
2011 y = 0.02x + 30,223,057
2012 y = 0.02x + 26,651,035

PEER ANALYSIS
39
Application of Linear Regression Formulas to Estimate Appropriate Funding for UF Libraries
UF Tuition & Appropriations
Linear Regression Line Formula
UF Libraries Projected
2008 $855,300,000 y = 0.01x + 30,868,025 $43,231,307
2009 $849,955,000 y = 0.02x + 29,693,057 $43,249,625
2010 $797,569,000 y = 0.02x + 27,401,814 $42,536,788
2011 $855,234,000 y = 0.02x + 30,223,057 $43,650,863
2012 $848,376,000 y = 0.02x + 26,651,035 $42,701,203
PEER ANALYSIS
40
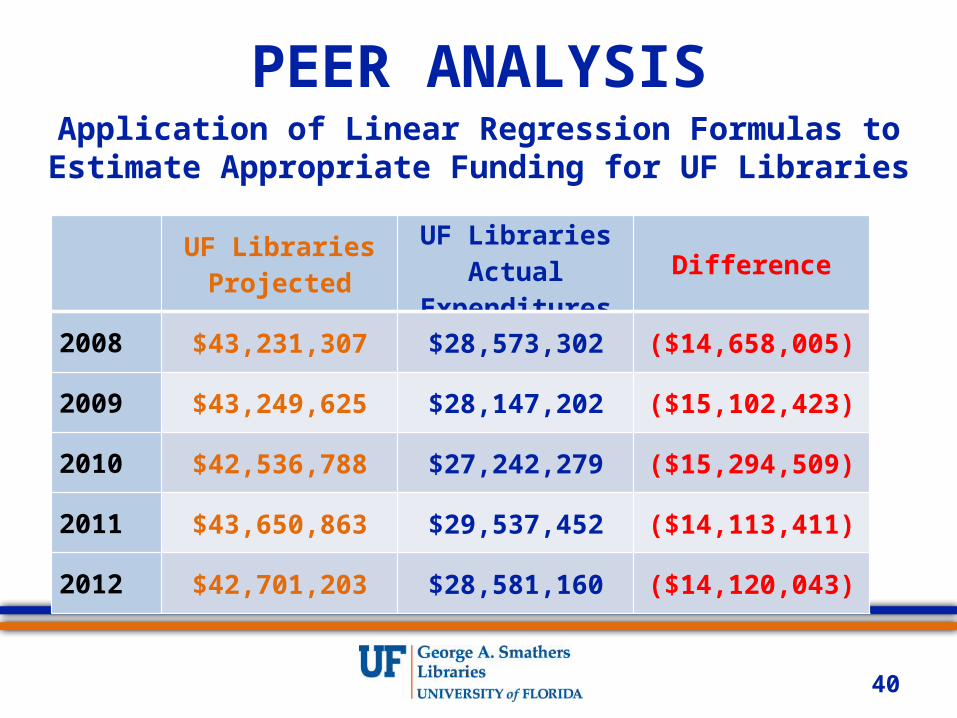
Application of Linear Regression Formulas to Estimate Appropriate Funding for UF Libraries
UF Libraries Projected
UF Libraries Actual Expenditures Difference
2008 $43,231,307 $28,573,302 ($14,658,005)
2009 $43,249,625 $28,147,202 ($15,102,423)
2010 $42,536,788 $27,242,279 ($15,294,509)
2011 $43,650,863 $29,537,452 ($14,113,411)
2012 $42,701,203 $28,581,160 ($14,120,043)

41

42

PEER ANALYSIS
• Spending within libraries
43

44
45
46
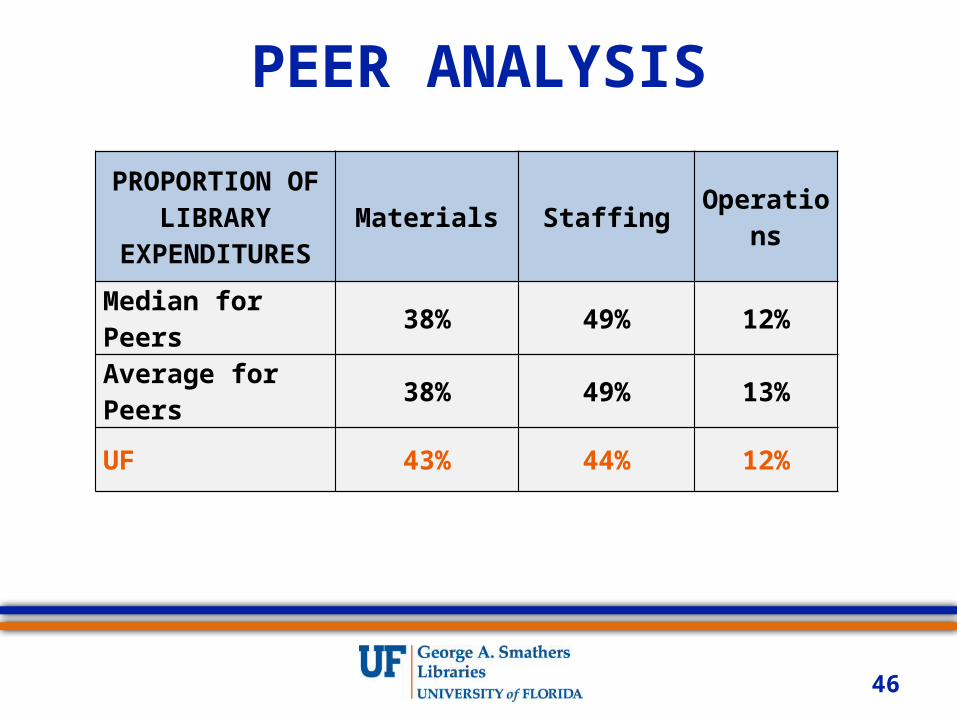
PEER ANALYSIS
PROPORTION OF LIBRARY
EXPENDITURESMaterials Staffing Operations
Median for Peers 38% 49% 12%
Average for Peers 38% 49% 13%
UF 43% 44% 12%

47
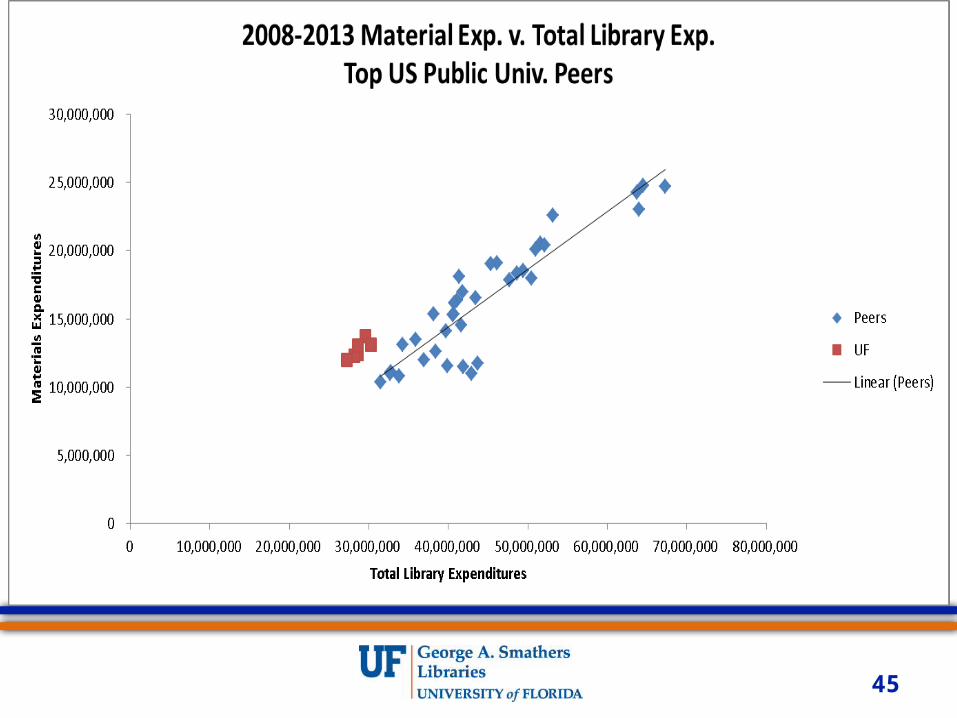
y = 0.423029510129217x - 2,523,825.53
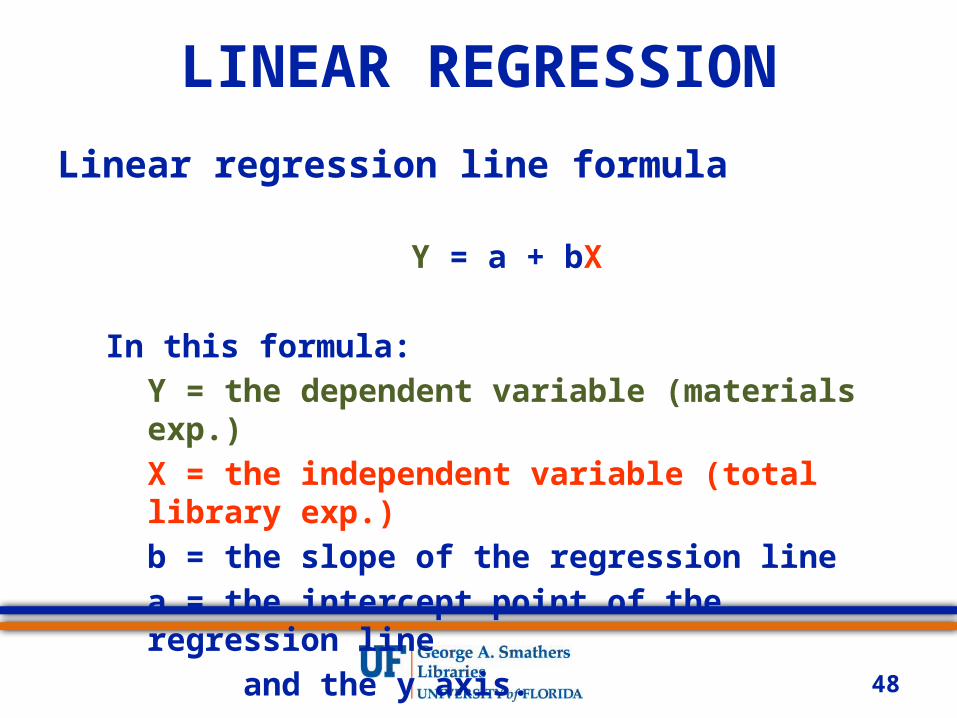
LINEAR REGRESSION
Linear regression line formula
Y = a + bX
In this formula:
Y = the dependent variable (materials exp.)
X = the independent variable (total library exp.)
b = the slope of the regression line
a = the intercept point of the regression line
and the y axis.
48

PEER ANALYSIS
49
Average UF Libraries Material Expenditures for 2008-2013
AVG $12,748,128
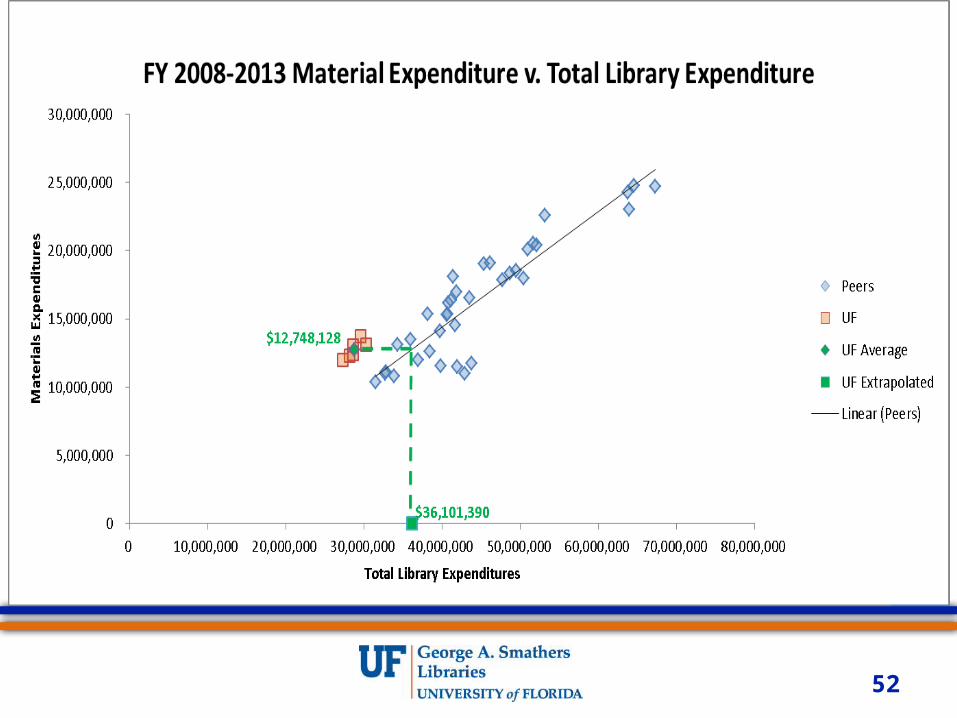
Application of Linear Regression Formulas to Examine UF Libraries Expenditures

PEER ANALYSIS
50
Average UF Libraries Material Expenditures for 2008-2013
Linear Regression for Peers: Library Materials & Total Library Expenditures
UF Libraries Projected
Total Expenditures
$12,748,128 y = 0.42x - 2,523,825.53 $36,101,390
Application of Linear Regression Formulas to Examine UF Libraries Expenditures
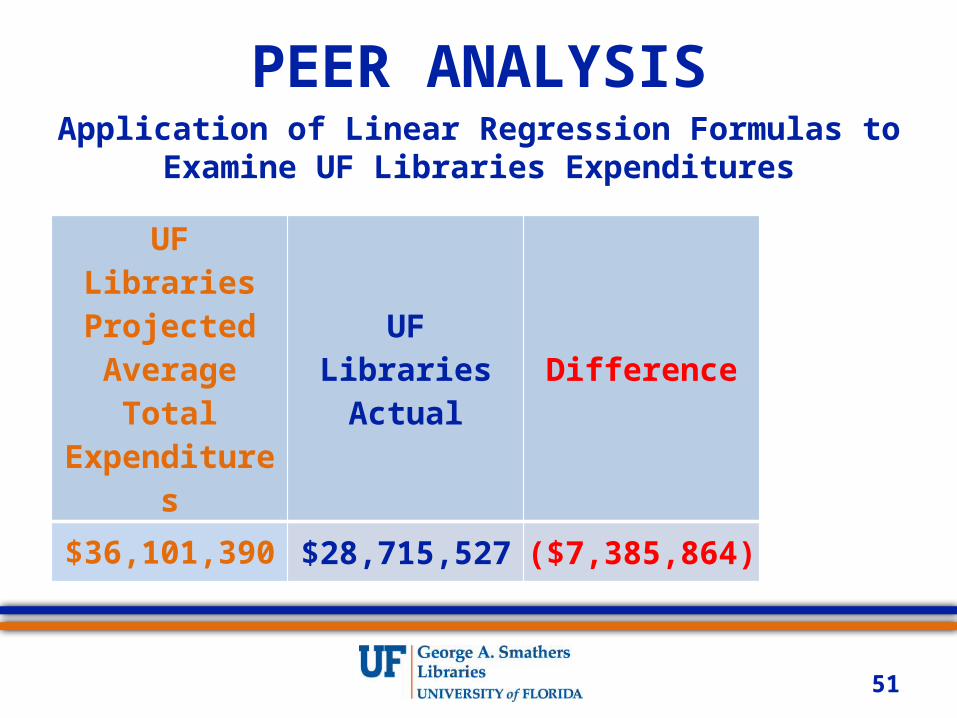
PEER ANALYSIS
51
UF Libraries Projected
Average Total Expenditures
UF Libraries Actual Difference
$36,101,390 $28,715,527 ($7,385,864)
Application of Linear Regression Formulas to Examine UF Libraries Expenditures
52

FINDINGS
• Linear regression showed there exists a relationship between library spending for staffing and materials, and total library expenditures at these top institutions
• The relationship can serve as a basis for assessing library expenditures at other institutions
53
Questions?
54
Related Documents