THE HARDER WE RUN The State of Black Buffalo in 1990 and the Present Henry-Louis Taylor, Jr., Jin-Kyu Jung, and Evan Dash a Report to the Buffalo Center for Health Equity September 2021 U.B. Center for Urban Studies School of Architecture and Planning & U.B. Community Health Equity Institute

Welcome message from author
This document is posted to help you gain knowledge. Please leave a comment to let me know what you think about it! Share it to your friends and learn new things together.
Transcript
THE HARDER WE RUN The State of Black Buffalo in 1990 and the Present
Henry-Louis Taylor, Jr., Jin-Kyu Jung, and Evan Dash
a Report to the Buffalo Center for Health Equity
September 2021
U.B. Center for Urban Studies School of Architecture and Planning &
U.B. Community Health Equity Institute

2 | P a g e
Contents
Acknowledgments 3
Figures 4
Tables 5
Executive Summary 6
Introduction 13
The Context: Rise of Buffalo’s Knowledge City 15
Black Buffalo in 1990 21
Black Buffalo in the Present 23
Racial Residential Segregation 36
Health and the Neighborhood 60
Conclusions: The Root Problems Facing Black Buffalo 63
Reflections: Where Do We Go From Here? 68
Recommendations 75
References 78
Bibliography 80
Author Profiles 84

3 | P a g e
Acknowledgments
The project, like most extensive undertaking, relied on the aid and assistance of other people.
Elizabeth Crinzi, a second-year Medical student at Jacobs School of Medicine and Biomedical Sciences,
was responsible for the report’s information on housing conditions. Jacob Kotler, a second-year student in
the Master of Urban Planning in the Department of Urban and Regional Planning in the U.B. School of
Architecture and Planning, fact-checked and reviewed all data analysis. Dr. Jason Knight, an Associate
Professor in the Department of Geography and Planning at Buffalo State College, provided valuable insight
into demolitions and data sources on Buffalo’s demolitions. The authors wish to thank Pastor George
Nicholas of Lincoln Memorial United Methodist Church, Heather R. Abraham, Associate Professor of Law
and The Director of the U.B. Civil Rights and Transparency Clinic, and Dr. Robert M. Silverman, Full
Professor in the U.B. Department of Urban and Regional Planning, for their critical review of the draft.
Lastly, Beth Kwiatek, a Senior Research Associate at the U.B. Center for Urban Studies, offered invaluable
insight. Conversations with her about the project enriched the narrative, and her editing assistance enhanced
the quality of this report.

4 | P a g e
Figures
Figure 1: Sharing Residential Space
Figure 2: Blacks and Whites Sharing Residential Space
Figure 3: 1937 HOLC Map of Buffalo, New York
Figure 4: Industrial Plants and East Side
Figure 5: Labor Market Dynamics
Figure 6 A: Erie County Municipalities by Residential Quadrants
Figure 6 B: Erie County Municipalities by Residential Quadrants Continued
Figure 8: Erie County Residential Quadrants by Municipality, 2019
Figure 9: Racial Segregation and Buffalo's Residential Quadrants by Median Home Value, 2019
Figure 10: Median Housing Values in Buffalo, 2019
Figure 11: Areas of Concentrated Poverty
Figure 12: East Side and Black Secondary Settlements, 2019 A
Figure 13: Black East Side and Secondary Settlements B
Figure 14: Population Change in Buffalo over Forty years
Figure 15: Housing Cost Burden on Buffalo's East Side
Figure 16: Exterior Condition of Residential Structures in Buffalo
Figure 17: Map of Randomly Selected Streets
Figure 18: Marshall Street—Satellite View, 2014
Figure 19: Marshall Streets, Street View, 2014
Figure 20: Satellite View of Monticello Place
Figure 21: Monticello Street, looking southward, in Hamlin Park
Figure 22: East Side Residential Quads based on Median Home Value
Figure 23: Renters and Owners in the king Urban Life Neighborhood
Figure 24: Vacant lots, King Urban Life Communities and Adjacent Neighborhoods
Figure 25: Median Housing Value at $150,000 or more by Census Tract
Figure 26: Concentration of DoH* Clinical Patients
Figure 27: Percent of Blacks in East Side Census Tracts
Figure 28: Vacant Parcels in Buffalo, NY 2020
Figure 29: Public Investments in the King Urban Life Neighborhood: Broadway-Fillmore
Figure 30: Satellite View of the King Urban Life Neighborhood
Figure 31: Winslow Avenue, Martin Luther King Neighborhood
Figure 32: Martin Luther King, Jr. Neighborhood
5 | P a g e
Tables
Table 1: Population Growth in Buffalo, 1940–1990
Table 2: Buffalo and Erie County Population in 1990 and 2019
Table 3: Income and Poverty by Race and Ethnicity in Erie County and Buffalo
Table 4: Labor Force Participation and Unemployment Rates for Blacks and Whites, Buffalo, 2019
Table 5: Median Earnings for City, Black and White Workers by Gender, 2019
Table 6: Median Household Income and Poverty Rates by Race in Buffalo, 2019
Table 7: Household Income Distribution for City, Blacks and Whites, 2019
Table 8: Household Structure by Race in Buffalo, New York, 2019
Table 9: Housing Tenure by Race in Buffalo, 2019
Table 10: Educational Attainment and Employment Status in Buffalo, 2019
Table 11: Educational Attainment for Select Racial Groups in Buffalo, 2019
Table: 12: Occupations that Do Not Pay a Living Wage
Table 13: East Side Population, 2119
Table 14: Healthy Neighborhood Rating Scale
Table 15: Health Neighborhood Rating Scores
Table 16: Select Erie County Health Indicators by Race/Ethnicity, 2015-2017

6 | P a g e
Executive Summary
Thirty-one years ago, the University at Buffalo Center for Urban Studies conducted a comprehensive study on the state of Black Buffalo titled, African Americans and the Rise of Buffalo's Post-Industrial City, 1940 to the Present (The Black Buffalo Project). The Urban League and Buffalo Common Council sponsored the project. Professor Henry-Louis Taylor, Jr., Director of the U.B. Center for Urban Studies, assembled more than ten scholars and consultants to work on that project. The Black Buffalo Project aimed to determine how the City’s emerging post-industrial or knowledge economy impacted African Americans. The study sought to determine if the Black socioeconomic trajectory was trending upward or downward. Based on the final analysis, the research team would then create a policy agenda to guide the development of an intervention strategy.
William Julius Wilson’s The Declining Significance of Race (1980) and the Truly Disadvantaged: In Inner City, the Underclass, and Public Policy (1987) guided the development of the study’s theoretical framework. Wilson argued that the emerging neoliberal knowledge economy was producing a new Black inequality. He argued that the knowledge economy was propelling a small middle class upward while dragging the Black masses downward into the low-wage sector of the labor market. He stressed that the problems of joblessness, low incomes, and poverty were spawning social challenges, such as the rise of single-parent families headed by women, that would get worse without a successful intervention strategy.
This report, the Harder We Run, uses the State of Black Buffalo Project as a reference point to
determine if African Americans have made progress over the past thirty-one years. It aims to determine if the Black socioeconomic trajectory is trending upward or downward. “Progress” is a shadowy term that requires careful definition. This report defines it as the movement of Blacks in Buffalo toward a status where most African Americans receive a good education and have jobs that pay a livable wage. Such wages will enable Blacks to live in high-quality and affordable houses in safe and vibrant East Side neighborhoods, attend and graduate on time from excellent neighborhood-based schools, and experience social well-being,
joyfulness, love, and support.
Conclusion: The Root Problems Facing Black Buffalo
The Black lament, “The harder we run, the further we fall behind,” seems appropriate for Black Buffalo. Black Buffalonians have not made progress over the past thirty-one years. The State of Black Buffalo Project warned that the socioeconomic plight of Blacks was trending downward. The Black unemployment rate was 18% in 1990, and the average household income was $39,350 in constant dollars.
Approximately 38% of Blacks had incomes below the poverty line. There were more African Americans without a high school diploma than with a college degree. About 33% owned their homes, and the majority resided on Buffalo’s East Side.
Against this backdrop, the Black Buffalo Project structured a framework to guide the development
of an action plan to halt any or more decline. Thirty-one years later, the portrait of Black Buffalo remains unchanged. The unemployment rate remains in the double digits (11%), and the average household income is $42,000 in constant dollars. Approximately 35% of Blacks have incomes below the poverty line and 32% own their homes. There are still more Blacks without a high school diploma than with a college degree,
albeit the ratio is tightening. Most Blacks live on Buffalo’s East Side and conditions are getting worse in many of those neighborhoods. The fate of Black Buffalo remains tied to East Side development. The changes in their lives over the past thirty-one years have been modest. During this period, an entire generation saw little if any improvements in their lives.
Black Buffalo did not progress. Everything changed, but everything remained the same. Over the past thirty-one years, African Americans ascended to political office and rose to positions of power and influence. Across Buffalo City you find Black faces in high places. The Mayor of Buffalo is Black. So too is the Superintendent of The Buffalo Public Schools, the Police Commissioner, and the Common Council
7 | P a g e
President. There are influential Blacks in the Erie County Legislation and the New York State Assembly. The President of Buffalo State College and the CEO of Erie County Medical Center are also Black. Black Buffalo has a legion of doctors, lawyers, judges, university professors, administrators, entrepreneurs, and African Americans heading influential social service organizations. There are large churches with powerful Black ministers. Too, there exists a small but affluent middle-class.
Still, Black Buffalo has not escaped the labor market’s low -wage sector. William Julius Wilson
warned that the neoliberal knowledge economy would push up a few Blacks while pulling the masses down. Today, most African Americans still have low wages or live in poverty. Black Buffalo still has more residents who are twenty-five years and older without a high school diploma than those with a college degree. Most Black Buffalonians are renters who pay exorbitant payments to live in substandard housing. And importantly, many homeowners primarily reside in houses that produce debt, not wealth. The social determinants of undesirable health outcomes prey on the African-American community. Consequently, unnecessary diseases ravage their bodies, and too many die prematurely. The beat goes on. The ascent of Blacks to political office and other positions of power and influence have not reduced Black inequality, nor has it eased Black misery and suffering. Today, just as it was thirty-one years ago, Black Buffalo lives in underdeveloped neighborhoods and experiences oppressive and exploitative conditions every single day. Everything has changed, but everything has remained the same.
The findings of this study indicate that there exist seven root problems facing Black Buffalo. Along
with city planners, private developers, and community leaders, African Americans must solve these problems to make progress.
1. Racial Residential Segregation. The driving force behind the challenges facing Black Buffalo is racial residential segregation. The Buffalo and Erie County populations are segregated based on house value and social class exclusivity, measured by income and educational attainment. House value, in turn, becomes the hub that catalyzes neighborhood development, including the growth and development of commercial corridors or neighborhood centers. Segregation traps Blacks in low-value, marginalized, and underdeveloped neighborhoods. These neighborhoods, in turn, become the sites of predatory inclusion, public sector underdevelopment, profiteering, and exploitation. To counter racial residential segregation, the City and County governments must fight to open all neighborhoods throughout Erie County to low-income residential development while simultaneously transforming and turning the East Side into a desirable place to live, work, and raise a family.
2. The Underdevelopment of East Side Neighborhoods . The challenges facing Black Buffalo result from housing market failure, the government's refusal to develop the East Side, and the numerous predatory actions by the owners of rental housing units. Within this framework, seven interactive issues drive the underdevelopment of the East Side.
a. Substandard rental housing is the most critical neighborhood problem confronting East Side Blacks.
b. Rent gouging is responsible for the low quality of East Side rental property. Over 55% of East Side residents pay 30% or more of their income on housing, and 36% spend more than 50%.
c. East Side land banking, euphemistically called housing demolition, takes thousands of residential parcels out of circulation and holds them for future development. The desire to profit from the sale of these lots creates a barrier to neighborhood development. The reason is the City takes them out of circulation; rather than using strategies such as modular houses to recreate and develop streets hard hit with massive demolitions, the City tore down houses and moved on to the next street. The approach transformed much of East
8 | P a g e
Side into landscaped resembled blotches on the moon’s face.
d. The scattering of more than 7,000 unkept residential vacant lots across the East Side depresses property values. These vacant parcels disfigure the East Side landscape and complicate the neighborhood development process. Also, by holding back land, the City reduces the supply of property, which potentially inflates land prices in other parts of Buffalo.
e. The East Side sidewalk infrastructure is poor. Many, if not most of the sidewalks, are in disrepair. They are difficult to traverse, especially when pushing a stroller or carrying groceries. Curb ramps and pedestrian crossings are practically non-existent. They are impassable during the winter months. These conditions make it difficult for the visually impaired and persons using a wheelchair, scooter, walker, or other mobility devices to use the sidewalks and cross streets.
f. The lack of green infrastructure is a significant East Side problem. The Kensington Expressway (Route 33), Genesee Street, Sycamore Street, Broadway, Williams, Best, East Ferry, Delavan, and Bailey Avenue bring an endless caravan of polluting vehicles through the East Side daily. The absence of a green infrastructure offers the community no protective shield against vehicular pollution and other airborne toxins.
g. On the East Side, many owner-occupied homes produce debt, not wealth. Poorly maintained rental property and unkept vacant lots have externalities that depress property values in many East Side neighborhoods.
3. Structural Joblessness. The interplay between education and labor market dynamics drives chronic joblessness in Black Buffalo. The knowledge economy produces a high- and low-wage labor market sector. Blacks are locked in the low-wage sector. Concurrently, the availability of full-time, year-round jobs in the labor market is shrinking. Because of this, many Blacks cannot find full-time work. They are seasonal, part-time, or gig workers. The numbers of part-time and seasonal workers and those not in the labor force are growing. Concurrently, the number of Blacks that are employed continues to shrink. It is important to remember that to be unemployed, a worker must be searching for a job. The double-digit unemployment rate means that many Black workers are searching but not finding jobs. Moreover, even among the employed Blacks, a significant number cannot find full-time employment. A sufficient number of full-time, year-round jobs for African Americans just do not exist. We must find creative ways to expand the existing job base. These employment challenges facing African Americans result from labor market failure. The labor market is not producing a sufficient supply of full-time, year-round jobs that pay a living wage to absorb all members of the Black labor force.
4. Low Wages. The battle cry to end poverty is nothing more than an empty slogan in the Greater
Buffalo economy. It has not happened, and it will not happen unless the City addresses the issues of low wages and labor market failure. Structurally, as previously mentioned, Buffalo’s labor market consists of high and low-wage sectors. The low-wage sector contains numerous essential jobs. The best jobs and opportunities require high levels of educational attainment. Such positions require a Bachelor’s degree or higher or specialized training. Higher educational requirements keep most Blacks off the road to higher-paying jobs. Given the correlation between schooling, educational attainment, and jobs, the disparity between the quality of schools in Black and White neighborhoods places African Americans in a non-competitive position in the labor market. Blacks become stuck in the low-wage sector. The household income of most Blacks will range between
“Extremely Low,” “Very Low,” and “Low.” And their income will remain concentrated in the bottom half of Buffalo’s income quadrant. These low incomes mean that Blacks will be confined to low-value, underdeveloped neighborhoods. Therefore, the focus should be on changing what it means to be poor rather than ending poverty.
9 | P a g e
5. Limited Educational Attainment. The problems with our local public education system have been well-documented. Still, we have seen improvement in K-12 education. However, a different and severe problem has gone unnoticed. A significant number of Blacks go to college but never get a degree. We include those with an associate degree in this category. In Buffalo, over 30% of the Black population, twenty-five years and older, have some college but no degree. This educational attainment shortcoming has a significant impact on a person’s earning potential. A 25% difference exists in a worker's household income with some college but no degree and a bachelor’s degree. There is an 84% difference in the earnings between a worker with some college but no degree and one with a graduate or professional degree.
6. Gentrification. Black neighborhoods alone the Main Street Educational Corridor are in a
gentrification danger zone. City planners designated Main Street an educational corridor because U.B. South Campus, Canisius College and Sisters Hospital, and the Buffalo Niagara Medical Campus are located on Main Sreet. Declining Black populations in these neighborhoods are indicators that displacement is already occurring. Halting this outmigration should be a top priority of policymakers.
7. Poor Health. The top problem facing African Americans is their poor health. They have
preventable diseases, make unjustifiably forced upon unhealthy life choices, and often die prematurely. These conditions result from the intertwining of medical racism with inadequate housing, neighborhood conditions, and life on the economic margin. Poor health outcomes and neighborhood underdevelopment march in tandem. The bottom line is that the houses and neighborhoods in which Blacks live are killing them.
Since the release of African Americans and the Rise of Buffalo’s Post-Industrial City, 1940-Present by the Buffalo Urban League in 1990, the City has had twenty-seven consecutive years of liberal Democratic rule. The continued downward spiral of Black Buffalo poses the question, “After almost three
decades of liberal Democratic rule, how could two liberal Democratic mayors still leave in their wake a Black community where African Americans remain stuck in underdeveloped neighborhoods, trapped in poverty, low-paying jobs, inadequate and unaffordable houses, and have bodies ravaged with disease and die prematurely?”
The answer to this question is complex. We argue that Blacks did not progress because City leaders never developed a comprehensive action plan based on the core problems facing Black Buffalo. Furthermore, the City leaders and developers were compliant in the fight to eliminate racial residential segregation. City leaders never implemented the State of Black Buffalo’s action plan. In contrast, they stressed economic development under successive administrations while marginalizing and under-developing Black communities and neighborhoods. The emphasis on the waterfront, downtown, the Buffalo Niagara Medical Campus, the Main Street knowledge corridor, the West Side neighborhood development, and brownfield reclamation came at the expense of Black Buffalo. This approach to city-building did not have to happen. The City could have connected economic development to the recreation and development of Black Buffalo, but they did not.
Our research also revealed that the City marginalized the Black East Side in its planning and development strategy. It was declared a “poor” area and thus targeted for reconstruction — a euphemism for land banking. A land bank is a large body of public land held by a private or public organization for future development or disposal. It is a form of land speculating where the aim is to sell parcels for a profit. The City’s top priorities on the East Side were land clearance and assemblage. Later, they added commercial corridor and cluster housing development to their East Side Agenda. City leaders based these two strategies on the flawed Catalytic Project Theory. This theory purports that a catalytic project will cause a corresponding and complementary development reaction on surrounding properties or communities. These

10 | P a g e
projects, in essence, will stimulate the redevelopment of underdeveloped properties. Moreover, the cluster housing development strategy suggests that new housing construction is key to solving the low-income problem. That is not accurate. Only by improving the quality of existing housing units can the conditions inside the Blacks community be significantly enhanced.
This catalytic project theory might work in upscale market-driven neighborhoods or gentrified locations, but they are not helpful in low-income, underdeveloped communities. For example, the Brown administration invested approximately $179 million on the East Side between 2006 and 2016. That spending centered on demolitions (33%), housing (28%), streets and sidewalks (13%), parks and recreation (16%), and community facilities (11%). However, the City did not collaborate with residents, engage in thoughtful neighborhood planning, or consistently make strategic investments in these communities. Consequently, the City’s bulldozer wreaked havoc across the East Side, exacerbating conditions in many neighborhoods.
Recommendations
The findings of this study resulted in the following recommendations. The City should declare the East Side a Neighborhood, Social, and Economic Development Zone and designate the Buffalo Center for Health Equity to lead the effort to transform the East Side. The Center's first task should be establishing an East Side Development Coordinating Committee (ESDCC) consisting of East Side tenants, homeowners, business persons, and stakeholders, along with representatives from the City, County, and private sector. The ESDCC should establish a Neighborhood Advisory Board consisting of East Side tenants and homeowners to oversee its activities. The ESDCC, in collaboration with the community, should formulate and implement an equitable development plan for the East Side.
Short-term Goals
1. The ESDCC should divide the East Side into neighborhood planning and development districts. The coordinating committee should identify and prioritize neighborhood development activities according to each district’s socioeconomic needs . This approach prioritizes those neighborhood districts with the greatest needs. Concurrently, the ESDCC and its neighborhood collaborators should formulate development strategies based on each planning districts’ particularities.
2. The ESDCC should develop a plan to significantly improve the quality of existing East Side rental housing units. The City must reimagine and recreate its existing building codes to dramatically improve the quality of rental housing units' exterior and interior conditions. The rental housing externalities (poor physical appearance, lack of painting, poor lawn and yard maintenance, etc.) depress property values and diminish the visual image of the neighborhood. Concurrently, poorly maintained housing units represent a serious health threat. The City must eliminate this needless danger to Black health. The ESDCC must tackle several critical issues, such as improving housing quality without increasing rents, to make this strategy work. Even so, it must be the ESDCC’s top priority.
The City must clearly distinguish between code enforcement for owner- and renter-occupied housing units and between rental units owned by people living in the neighborhood and those who reside elsewhere.
3. Rent gouging is the engine that drives the low-quality of rental housing. The ESDCC must forge a plan to reduce the housing cost burden of East Side residents. This strategy will require developing a system to subsidize the rents of low-income tenants. One possibility is for the private sector to establish a Housing Support Fund. The City could also establish a hospitality sales tax
11 | P a g e
and a hotel occupancy tax to generate a public revenue stream dedicated to this fund. Another strategy is to reduce the property taxes of owners that the lower rents for their low-income tenants and improve the quality of their units. The incomes of most East Side tenants are too low to generate rents sufficiently high to cover maintenance and upgrades. Reducing the housing cost burden of low-income residents is a challenging issue that the ESDCC must address immediately.
4. The East Side needs a vacant lot development strategy. The City and County should collaborate to fund a resident-controlled and administered Erie County Community Land Trust and give all City-owned residential parcels to that land trust. The ESDCC and Community Land Trust would work with the neighborhood planning and development districts to develop the vacant lots using a comprehensive planning project. Concurrently, the City should tether its demolition strategy to developing strategy. East Side neighborhoods and have East Side demolitions should operate under the ESDCC’s auspices.
5. The ESDCC must develop a green infrastructure to protect the population against vehicular emissions and other airborne pollutants that create health hazards. There needs to be extensive planting of trees and shrubbery, particularly along the Kensington Expressway and streets with heavy traffic, to protect residents against pollution and the heat island effect. On certain streets, especially those with anchor institutions, the City should establish zero-emission corridors that limit commercial delivery traffic and maximize the use of electric vehicles. Hospitals and other big East Side institutions should commit to electrifying their fleets to reduce the health impacts on their operations on East Side residents.
6. The sidewalks on many East Side streets are in deplorable condition. Most of the sidewalks on the East Side are in disrepair and are difficult to navigate. Many do not even have the curb ramps and pedestrian crossings recommended by Title II of the American Disabilities Act. The City must prioritize East Side sidewalk development and ensure that all neighborhoods have curb ramps and pedestrian crossings.
7. The danger of gentrification exists in East Side neighborhoods situated along the Main Street Education Corridor and near downtown Buffalo. The Black population is declining in these neighborhoods of opportunity tourism. The ESDCC should stop Black outmigration from these communities while simultaneously creating opportunities for African Americans to move back into them.
8. Undesirable health outcomes are the top problem facing East Side Blacks. The implementation of the above recommendations should lead to improved health outcomes. Additionally, the Buffalo Health Equity Center should work closely with the U.B. Community Health Equity Research Institute to formulate and implement strategies to improve access to health services and bolster the quality of care and medical treatment to East Side residents.
9. The implementation of the recommendations outlined above will produce significant economic activity on Buffalo's East Side . The City should establish a job training program that prepares residents to participate in all phases of East Side development. Residents should be the prime workers in all development activities, from street paving and sidewalk replacement to housing rehabilitation and tree planting. This way, East Siders will participate in rebuilding their communities as they rebuild their lives.
Long-Terms Goals
1. Racial Residential Segregation is the linchpin in the system of Black inequality. Dismantling racial residential segregation will involve opening the housing markets in Buffalo City and across Erie County. The City and County governments must aggressively enforce fair housing laws and build low-income housing units in high-income central city neighborhoods and suburban municipalities. Stopping gentrification and improving neighborhood conditions in the Black
12 | P a g e
community are the cornerstones in the fight against racial residential segregation.
2. The development of neighborhood commercial corridors is critical to the transformation of East Side neighborhoods. Commercial corridor development must proceed in concert with the development of the surrounding communities. Neighborhood development drives commercial corridor development. However, these two development processes occur in tandem, not sequentially. During the early stages of development, commercial corridors must establish regional niches that service the local neighborhood market and a larger regional market.
About 36% of Blacks, age twenty-five and older, have some college but no degree. These
workers are structurally locked out of the highest paying jobs, which often require a college degree or
higher. ESDCC must work with local colleges and universities to forge a more aggressive retention strategy
for their Black college students while they are still enrolled. Concurrently, these colleges and universities
should develop programs that encourage Black students who dropped out to return to school and complete
their education

13 | P a g e
Introduction
Thirty-one years ago, the U.B. Center for Urban Studies conducted a comprehensive study of the
State of Black Buffalo, entitled African Americans and the Rise of Buffalo's Post-Industrial City, 1940 to
the Present, hereafter referred to as the State of Black Buffalo study.1 An unprecedented partnership among
the Urban League, the Buffalo Common Council and its president, George K. Arthur, and the University at
Buffalo sponsored the study. Professor Henry-Louis Taylor, Jr., director of the U.B. Center for Urban Studies, led the investigation. Taylor assembled a team of more than ten scholars and consultants to work
on the project.
William Julius Wilson's provocative books, The Declining Significance of Race (1978) and The
Truly Disadvantaged: The Inner City, the Underclass, and Public Policy (1987), guided the development
of the project’s theoretical framework. Wilson argued that the rise of a neoliberal knowledge economy was producing a new Black inequality. The rapid growth of an underclass was accompanying the improving
conditions of a Black middle-class. He declared that an advancing Black middle-class did not signal the
dawning of a golden age for the masses. In contrast, the rising economy was propelling a small middle
upward while dragging the Black masses downward. Wilson indicated that growing jobless, low incomes
and poverty were spawning Black social challenges, including the rise of single-parent families headed by women, which would worsen without successful intervention.2
The Black Buffalo study intended to see if similar dynamics were occurring in the city. It aimed to
determine how Buffalo's emerging knowledge economy and the city-building process were impacting
African Americans. The study stressed change over time and conceptualized the eighties as a liminal space betwixt what was and what's next. The aim was to determine if the Black socioeconomic trajectory was
trending upward or downward. Then, based on this analysis, researchers would develop a policy agenda to
guide the development of an intervention strategy.
This report, The Harder We Run, uses the Black Buffalo project as a reference point to determine if African Americans made "progress" over the past thirty-one years. It aims to determine if the Black
socioeconomic trajectory is trending upward or downward. Progress is a shadowy term that requires careful
definition.3 This report defines it as a Black movement toward a status where most African Americans
receive a good education and have jobs that pay a livable wage. Such wages will enable most Blacks to
live in high-quality, affordable houses in safe and vibrant East Side neighborhoods, attend and graduate on
time from excellent neighborhood-based schools, and experience social well-being, joyfulness, love, and support. Social well-being refers to wellness, good physical and mental health, and meaningful social
relationships, including a sense of connectedness and belonging. At a practical level, social well-being
indicates earning a livable wage that enables you to make ends meet and residing in a good, affordable
home situated in a neighborhood of choice, where the physical and social environments are healthy
This report consists of five sections, including the introduction. The introductory section explains
the methodology, while the second part outlines the historical context that frames Black Buffalo’s
development. Part three provides a synopsis of the Black Buffalo project. Section four analyzes the status
of Black Buffalo today by focusing on the socio-economic status of African Americans, neighborhood
conditions on Buffalo's East Side, and the community's health status. The final section contains the conclusion, reflections on the City’s strategy for addressing Black Buffalo's challenges, and
recommendations.

14 | P a g e
Methodology
In this report, the status of Black Buffalo in 1990 is the reference point used to measure progress.
The State of Black Buffalo study found that African Americans' socioeconomic problems had a spatial or
neighborhood dimension. Conditions of joblessness, low incomes, poverty, and substandard housing
operating in a market economy amplified African Americans' challenges and contributed significantly to
undesirable socioeconomic outcomes. Thus, this report focused on employment, income, housing, and
neighborhood conditions to determine the status of Black Buffalo in 1990. Moreover, it uses these same variables to assess Black Buffalo's progress over the past thirty-one years.
The report relies on the U.S. Bureau of Census, American Community Surveys (5-year estates) for
2019. It uses the census tract as the primary observation unit. It examines Black Buffalo at the
neighborhood, community (East Side), and citywide scales. Concurrently, the study focuses on household
rather than family structure. The census defines a family as two people or more (one of whom is the householder) related by birth, marriage, or adoption and residing together. The problem is that many
African Americans live alone or with unrelated individuals. Consequently, the "family" concept would not
capture all African Americans. In contrast, households include all the persons occupying a housing unit.
For this same reason, this study uses median household income rather than family income. The report
situates Black Buffalo within the Erie County context. Still, it focuses its analysis on African Americans living in the urban core while acknowledging the role of suburban racism in thwarting Black progress.
Following the sociologist William Julius Wilson, this study centers on Black Buffalo rather than
the successes of individual Blacks. A characteristic feature of the neoliberal education economy is to propel
a small middle class upward while pulling the Black masses downward. Thus, this study aims to gain insight into group advancement among African Americans. Therefore, median household income is a more
meaningful performance indicator than the percentage of Blacks with incomes higher than $100,000, or the
percentage of Blacks with a Bachelor's Degree is more significant than an African American becoming
School Superintendent or Mayor. Of course, these individual accomplishments are noteworthy. Still, they
do not measure group advancement, nor are they indicators of dismantling the racist structures of
intergenerational oppression and exploitation.
This study uses a residential quadrant analysis to study racial residential segregation in Buffalo and
Erie County and explain neighborhood formation and development. This method theorizes that housing
values drive the development of neighborhoods and residential districts. The residential quadrant analysis
uses median house value as the primary variable and tethers it median household income and percentage of the population with a Bachelor's Degree. The residential quadrants are ranked from low to high based on
the median value of housing. Median household income and percentage of the population with a Bachelor's
Degree are used as surrogates for social class.
Each quadrant includes approximately 25% of the houses in a residential area. It then uses socioeconomic variables such as median income, median gross rent, and educational attainment to
understand the social class dynamics occurring within each residential quadrant. GIS classification
methods based on equal interval and natural breaks were used to conduct a fine-grained analysis of the
East Side. Additionally, the report synthesized the data from many studies on Black Buffalo and the African
American community. Finally, in numerous instances throughout this report, numbers are rounded. This process replaces a number with an approximate value with a shorter, more straightforward, and more
explicit representation. For example, replacing $23,467 with $23,000, or 5.70% with 6%.

15 | P a g e
The Context: Rise of Buffalo's Knowledge City
Buffalo, New York, is one of the most segregated cities in the United States, but it was not always
that way. During the 20th century industrial city, between 1900 and 1940, most Erie County residents lived
in the central city. In industrial Buffalo, work rather than race or ethnicity determined where in the city
people lived. Less than 20,000 Blacks resided in Buffalo, and they formed only a fraction of the population.
Trapped at the bottom of the economic ladder, African Americans held low-wage jobs, forcing them to seek lodging in the Lower East Side industrial district, close to their workplace. Housing was not yet a
commodity, so low-wage Black and White immigrant workers shared residential space on the industrial
waterfront. The Lower East Side working-class community was the racially most diverse residential district
in Buffalo. It fell within census tracts 12, 13, 14, 15, 25, and 26. The Black population primarily
concentrated in census tracts 14 and 15, where the Russian population clustered. Overall, about 16,000
African Americans lived with approximately 71,000 Polish, Italian, Germans, and Russian workers in this working-class district and a handful of Canadians, British, Irish, Austrians, and Hungarians (Figure 1).4
Figure 1: Sharing Residential Space
Source: Buffalo Municipal Housing Authority.
Sometimes Blacks and White ethnics even lived in the same dwelling unit. For example, in the
1930s, Blacks lived in a boarding house at 498 Jefferson Street with Russians and Canadians (Figure 1). As late as 1953, Blacks and White ethnicities were still living together. At 531 Clinton Street, four Blacks
and one white lived together. Nearby, at 490 Eagle Street, five Whites and three Blacks lived in the same
building. At 506 Eagle Street, half of the sixteen residents in the building were White. Thus, on the eve of
the landmark 1954 Brown v. Board of Education of Topeka, Kansas decision outlawing school segregation,

16 | P a g e
Blacks and Whites could still be found living in the same residential buildings on Buffalo's lower East Side
(Figure 2). Figure 2: Blacks and Whites Sharing Residential Space
Source: 1925 Manuscript Census Data. Cited in Studio Report (2011). Celebrating Buffalo’s
Cultural Diversity: A Vision for the Michigan Street Heritage Corridor. U.B. Department of Urban and Regional Planning.
However, this residential district was not a racial utopia. This settlement reflected the class-based
residential segregation that existed before the commodification of housing and the racial residential
segregation. Segregation based on social class did not produce racial harmony. Tensions existed between
the races. Still, the neighborhood political economy did not demand separation of the races in residential spaces. In the industrial city, the tethering of race and place did not occur. In contrast, social class placed
its stamp on the residential area. In this age of primitive transportation, the employment node catalyzed the
organization of residential space, thereby maximizing class segregation. In this setting, Blacks and White
ethnics in the common laborer and low-skilled worker class shared residential districts throughout Buffalo's
industrial city era.5
The Lower East Side was a racially diverse but highly underdeveloped low-income community,
plagued with concentrated socioeconomic problems. The situation was different in affluent White
neighborhoods. These owners used restrictive covenants to keep out Blacks as well as White immigrants

17 | P a g e
and common laborers. Although the housing market was weak and not considered a wealth-producing tool,
elite Whites nevertheless sought to maintain their neighborhoods' race and social class exclusivity.6
Racial Segregation and Profits: the Home as Commodity
The approach to residential development dramatically changed during the Great Depression. The
government aimed to use mass homeownership as an economic development tool to reboot the economy
and as a method of wealth production. Before World War II, the owner-occupied house was more of a cultural artifact than a commodity. Home buying was risky. Buyers had to put 50% down on the house and
repay the loan within two to five years. Mortgage renewal was possible, but it was not guaranteed.
Financial institutions needed to make dramatic changes in the mortgage system before mass
homeownership would work. Homebuyers needed an amortized mortgage system that extended loan
payments over 20 years to make mass homeownership feasible. However, for such a mortgage system to
work, real estate appraisers needed a method of determining the value of residential land to guide the investment decision of mortgage brokers.7
Developing a method of assessing the value of residential land fell to the real estate appraiser
Frederick M. Babcock, who became the chief underwriter for the Homeowners Loan Corporation in 1936.
Babcock used an aggregate of race, place, economics, and culture to develop a land valuation system. He played to White racist sentiments. Babcock theorized that neighborhoods had life cycles. The presence of
Blacks in a White residential area signaled the onset of rapid decline. Black residents, then, threatened
White neighborhood stability by increasing risk, lowering property values, and jeopardizing the home
investment. This residential land valuation system tethered race to place and married racism to classism.
As the percentage of Whites and social class exclusivity increased in a community, so did housing values and the neighborhood's wealth-producing capacity. In contrast, as the percentage of Blacks and social class
inclusivity increases, the community's home values and wealth-producing power declined. In this city-
building method, the home value became the residential node that catalyzed neighborhood growth and
development.8
This approach to residential development also spawned structural neighborhood inequality and
embedded it into the metropolitan landscape. Thus, the scattering of neighborhoods across the metropolitan
residential land continuum creates clusters of residential districts with similar home values, amenities,
hedonic features, and access to quality goods and services. This market-driven residential development
process stratified communities based on the interplay of race, class, and housing values. This system
produced a residential hierarchy with developed, high valued White neighborhoods at one pole and underdeveloped, low-value Black neighborhoods at the opposite pole. In this system, White neighborhood
valuation is based on Black neighborhood devaluation. Thus, the rise of mass homeownership involved a
public-private partnership. Government policies and bank redlining kept mortgage money out of Black
neighborhoods and contributed to the underdevelopment of Black communities and the rise of affluent
White communities after World War II (Figure 3).

18 | P a g e
Figure 3: 1937 HOLC Map of Buffalo, New York
Source: Residential Security Map, Buffalo, N.Y., City Survey File. Record Group 195. National Archives II, College Park, MD.
Why Does This Matter?
African Americans did not start coming to Buffalo in large numbers until after 1940 when Buffalo began transitioning from an industrial to a knowledge city.i Between 1940 and 1990, Buffalo's Black
population leaped from 18,000 to 101,000, an increase of 461%. In the period, Black Buffalo as a proportion
of the population increased from three to 31%. Meanwhile, as thousands of Blacks moved into Buffalo,
thousands of more Whites moved out. Concurrently, the city's White population plummeted from 558,000
to 212,000, a 63 % decrease (Table 1). The land valuation system created by Babcock drove residential
development after 1940. It produced a new type of racial residential segregation in Eire County.
i The statistical data in this section are from the U.S. Bureau of Census, Community Survey (5-year estimates).
Social Explorer.

19 | P a g e
Table 1: Population Growth in Buffalo, 1940 - 1990 TOTAL % % OTHER
RACES
%
YEAR
Population
Black Total Population
White of Pop & Ethnicities
Total Population
1940 575,901 17,794 3 557,618 97 489 0 1950 580,132 36,745 6 542,432 94 955 2 1960 532,759 70,904 13 459,371 86 2,484 0
1970 462,768 94,404 20 364,198 79 8,329 2 1980 357,870 94,329 26 249,120 70 14,421 4
1990 328,123 100,579 31 212,449 65 15,095 5 Source: U.S. Census Bureau. Decennial Census Reports.
In the new racial residential segregation, home values, Whiteness, and social class exclusivity
sorted the population by race and income. In this scenario, the Erie County suburbs became a
homeownership zone. The highest value and most exclusive residential districts formed in the suburbs. In contrast, the city became a site of mixed land uses and devalued residential properties, where housing values
appreciated slower than in the suburbs. This new pattern of residential segregation sorted and sifted the
population after 1940. Thus, as thousands of Blacks moved into Buffalo after 1940, realtors steered them
into East Side neighborhoods. Black Buffalo thus evolved in the spatial margin between Main Street and
Bailey Avenue. Significantly, according to the HOLC, they were moving into areas declared as “declining” in 1937. The East Side was also the industrial city's breadbasket and home to thousands of workers.
Industrial plants, big and small, dotted the East Side, and neighborhoods sprung up around them (Figure
4).9 Figure 4: Industrial Plants and East Side
Source: Work Division, Slum Determination
Area Study, Buffalo Municipal Housing Authority.
20 | P a g e
The White suburban homeownership rush emptied the East Side. In 1940, the East Side was
Buffalo's population center. The White outmigration hit this part of the city with sledgehammer force. The suburban exodus birthed the housing abandonment problem. The thousands of Blacks moving into the
declining East Side community could not offset the more significant number of Whites moving out. This
mismatch produced the housing abandonment problem. In the 1940s, a trickle of people of color,
particularly Puerto Ricans, moved to Buffalo. However, unlike the African Americans, they moved into the
far West Side industrial corridors and Black Rock, following the Italian migratory movement. The similarities between Hispanic and Italian culture drew the Puerto Rican and Latinx population into this
locale.10
Thus, during the rise of mass homeownership, realtors channeled African Americans into the worst
residential lands in the region. Not only had these areas declined by 1937, but the post-World War II
outmigration of thousands of Whites turned the East Side into a housing Zombieland.11 Meanwhile, the
federal government and financial institutions had created a land valuation system that justified the denial of loans to African Africans. Racial discrimination kept Blacks locked out of the White suburban
homeownership zone while forcing most of them to reside on residential lands the government and financial
institutions were devaluing.12 In the emerging knowledge city, these East Side residential districts were not
engines of wealth production. By 1990, when the population of Black Buffalo peaked at 101,000, with
91% of Erie County Blacks living in the core, the design and structure of the metropolitan knowledge was complete.

21 | P a g e
Black Buffalo in 1990
Blacks started coming to Buffalo in large numbers during the forties. This fifty-year period was a
transitional moment when the economy shifted from an industrial to a knowledge base. In this liminality,
the integration of incoming Blacks into the city’s landscape and new knowledge economy occurred. The
State of Black Buffalo study thus focused on the socioeconomic movement of African Americans across
time. The nineties were just one time frame in a sequence that captured the Black movement through time. The Black trajectory was thrusting downward. The low-wage sector of the economy was pulling African
American workers into it. These low incomes erected barriers that thwarted Black’s ability to meet the
challenges of thriving in the city, including the quest for good housing and quality education.
The World of Work and Income
The sociologist Brenda Moore posited that the knowledge economy had a segmented labor
market.13 Some jobs required advanced education and training while others did not, especially sales, clerical
work, food preparation, janitorial services, hospitality, and the like. Which sector would employ the most
Blacks was the big question? By 1990, three trend lines shaped the employment status of African
Americans. First, Blacks were clustering in the low-skill, low-wage sector of the knowledge economy. Second, they consistently had high unemployment rates. In both good and bad times, Black unemployment
was high. High unemployment always depressed the Black employment ratio—the percent of Blacks
holding jobs. Thus, many Black workers were searching for jobs but could not find them. They remained
in the ranks of the unemployed.14
The declining participation of Blacks in the labor force was the third trend line. Historically, most Blacks, sixteen years and older, worked or looked for jobs. Even when times were hard and jobs were
difficult to obtain, Blacks actively searched for employment. This effort to find work began changing in
the 1980s. Black workers started getting discouraged. Since the 1940s, they constantly faced double-digit
unemployment. Then, in 1990 unemployment rose to a staggering 19% compared to the 8% rate for Whites.
Not finding work discouraged many workers.15 They stopped looking altogether. In 1990, the declining participation of Blacks in the labor force was invisible citywide. However, it was increasingly evident that
some Black workers were no longer looking for jobs down on the ground in some East Side neighborhoods.
These workers had dropped out of the labor force.16
The income levels of Blacks reflected their lowly work status. The average household income for Blacks was $20,000 or $43,000 in constant dollars, compared to the average White household income of
$27,000 or $58,000 in constant dollarsii. Concurrently, 38 % of Blacks lived in poverty. A pessimistic Dr.
Brenda Moore concluded in her chapter on the economic plight of Black Buffalo, "The future does not look
bright. Indeed, jobs with low hourly wages are the ones with the highest growth rates in the Buffalo region,
which is a major contributor to the downward spiral of Buffalo's labor force, especially African
Americans."17
Housing and Neighborhood Conditions
The low incomes of African Americans forced them to search for housing in the transitional East
Side community. When the Black community expanded northward into the city's eastern neighborhoods,
ii Constant dollars refer to an adjusted value of currency used to compare dollar values from one year to another. Inflation changes the purchasing power of the dollar over time. Thus, conversion of dollars in an earlier period
make it possible to compare it with a later year.

22 | P a g e
those areas were still transitioning from White to Black. Often Blacks moved into a White-dominated
neighborhood, thinking they were integrating the community. They were not. Blacks and Whites were like ships passing in the night. As Blacks moved in, Whites moved out. By 1990, those integration illusions
were gone. Concurrently, East Side housing and neighborhood conditions were worsening. As previously
mentioned, White outmigration produced a housing abandonment problem.
During the first half of the 20th century, the East Side was Buffalo’s manufacturing center. Thousands of workers lived in this part of the city. The race-based suburban homeownership boom pulled
these White workers out of the city into the suburbs. Their departure created the East Side abandoned house
problem. In response, Buffalo mayors Frank A. Sedita, Stanley M. Makowski, and James D. Griffen used
housing demolition as the prime method of solving it. Between 1965 and 1970, they knocked down
thousands of housing units.18 They developed various neighborhood plans to accompany the demolitions
but never implemented them. Instead, the City’s bulldozer continued to knock down empty and blighting structures. The problem is the demolition strategy exacerbated the East Side neighborhood conditions. The
City demolished thousands of housing units without a coherent policy to develop or manage the vacant or
unbuilt lots. They made the housing abandonment problem worse by adding the unkept vacant lot problem
to it. Thus, from 1960 to 1990, Blacks moved into an urban locality characterized by an aging housing
stock, abandonment, and demolitions.
Most Buffalonians were renters, with few housing options in the segregated housing market.19 In
this situation, to generate profits, property owners reduced spending on housing maintenance while
charging high rents. Thus, the Black housing situation was characterized by a toxic mixture of an old
housing stock, predatory property owners, rent gouging as a means to generate hyper profits. This deadly combination forced most East Side renters to live in substandard housing units. For example, in a 1983
survey of housing conditions, U.B. Professor Alfred D. Price said a staggering 70% of rental housing in the
Masten District was substandard or deteriorating. Equally disturbing, Price said the study found that half
the owner-occupied houses in Masten were substandard or deteriorating. Price acknowledged that some
good housing and neighborhood conditions existed on the East Side, especially in the Pratt-Willard area.
Unfortunately, Pratt-Willard was the exception, not the rule. In his chapter on "Housing Buffalo's Black Community" in the State of Black Buffalo study, Price concluded: "analysis of housing patterns in black
communities paints a grim picture."20
The Education Front
The labor market and housing challenges facing African Americans circle back to education. A
significant correlation exists among educational attainment, work, and income in the United States. The
higher the levels of educational attainment, the more likely a person is to have an income that allows them to reside in desirable neighborhoods with quality housing and excellent schools. In contrast, studies on
neighborhood effects indicate that adverse neighborhood conditions produce undesirable socioeconomic
and health outcomes among Blacks.
These neighborhood effects happen because of the interaction among education, labor markets, and housing markets. For example, underdeveloped neighborhoods produce resource-depleted schools that
provide their students with substandard education, thus reducing their competitive edge in the labor market.
In the labor market, they lose the competitive struggle with Whites—educated in resource-rich schools with
an abundance of extra-curricular activities—for higher-paying jobs and more significant opportunities.
This defeat in the rigged labor market competition results in Blacks accepting employment in the low-wage
sector of the labor market. In turn, their low wages force them to search for housing in underdeveloped neighborhoods, where the intergenerational cycle of oppression and exploitation starts over again. In the
United States, inadequate schools and substandard education are tethered to underdeveloped communities.

23 | P a g e
For this reason, Kofi Lomotey and the late John Staley conclude in their chapter on "The Education
of African Americans in the Buffalo Public Schools" that "African Americans, males, in particular, are at severe risk in the Buffalo Public Schools. This claim is evident from their gross overrepresentation as
suspended students, dropouts and special education enrollees. Moreover, test results indicate that gaps
persist between reading and math scores of white and African American students."
What is to be Done? The 1990 Policy Agenda
The State of Black Buffalo project tethers its root cause analysis to an action agenda that could
meet Black Buffalo's challenges. African Americans were in dire socioeconomic circumstances in 1990.
Black Buffalo's population peaked at 101,000 residents, and 91% of Erie County Blacks lived in the city.
The unemployment rate was 19%, the average household income was $20,000 ($43,000 in constant dollars), and 38% lived below the poverty line. About 38% of Blacks 25 years and older had less than a high school
degree, and 10% had a college degree or higher.21 Most significantly, these socioeconomic issues were
rooted in neighborhood conditions, which amplified and worsened them. Yet, in a survey of 404 randomly
selected Black and White East Side registered voters in 1989, a staggering 70% expressed low levels of
confidence in the ability of the city government to improve conditions in their neighborhoods. 22
Against this backdrop, the State of Black Buffalo research team formulated a set of policy guidelines
to attack Black Buffalo's challenges. The intervention strategy centered on the Black neighborhood. The
intent was to establish an East Side Economic and Community Development Zone and initiate a series of
projects, programs, and activities to catalyze social development across various socioeconomic sectors.
The policy agenda aimed to target people and place simultaneously. Thus, the intervention strategy intended to stabilize and upgrade neighborhoods, improve the quality of life, and bolster the life chances of
individuals, families, and households.
• Develop a demand for Black labor by attracting business and industry to the East Side. This
policy had a two-fold strategy. The primary goal was to develop, support, and retain existing micro and small East Side businesses while creating new ones. The second goal aimed to attract new
businesses and industries to the East Side to train, hire, and develop Black workers and other
residents. These companies would draw their workforce primarily from East Side residents.
• Establish job training and labor force development programs to prepare workers to take
advantage of these new East Side opportunities and jobs across Erie County. This goal targeted those unemployed workers looking for jobs but who could not find employment.
Concurrently, the program would aggressively reach out to these discouraged workers and those
workers in the underground, gangster economy.
• Initiate aggressive programs aimed at housing and neighborhood development. The vast majority of Black Buffalo are renters. You cannot improve conditions significantly their housing
situation without radically improving the existing stock of rental housing on the East Side. The
action strategy called for a frontal attack on the rental housing problem while providing financial
support for low-income homeowners to repair and upgrade their homes. Moreover, the
transformation of the East Side physical environment and the rehabilitation of existing rental properties would create a massive economic boost to the community. By linking job training and
development to neighborhood transformation, Blacks would have the opportunity to rebuild their
lives by rebuilding their neighborhoods.

24 | P a g e
• Transform and develop the East Side business districts . The commercial corridors are the
windows through which people view neighborhood life and culture. The action plan called for business strip development to anchor the neighborhood transformation process. The intent was to
use business strip development as an engine to drive the transformation of neighborhoods
surrounding it.
• Develop strategies that focus on the social problems confronting Black Buffalo. The intent was to attack the social challenges facing Black Buffalo, including outlaw culture and crime. This
approach involved broadening and developing collaboration among community-based
organizations and finding new and innovative ways to improve and bolster the lives of Black
Buffalo.
This five-point plan was not a blueprint but an action guide. The intent was to create a framework
to guide experimentation and problem-solving. The aim was to use the following credo to guide the
implementation strategy: You must ask the right question to get the correct answer. You must formulate the
problem correctly to find the most effective solution. Always root your activities in reality rather than fantasy and myth. The hard truth is always better than the self -assuring lie.23
25 | P a g e
Black Buffalo in the Present
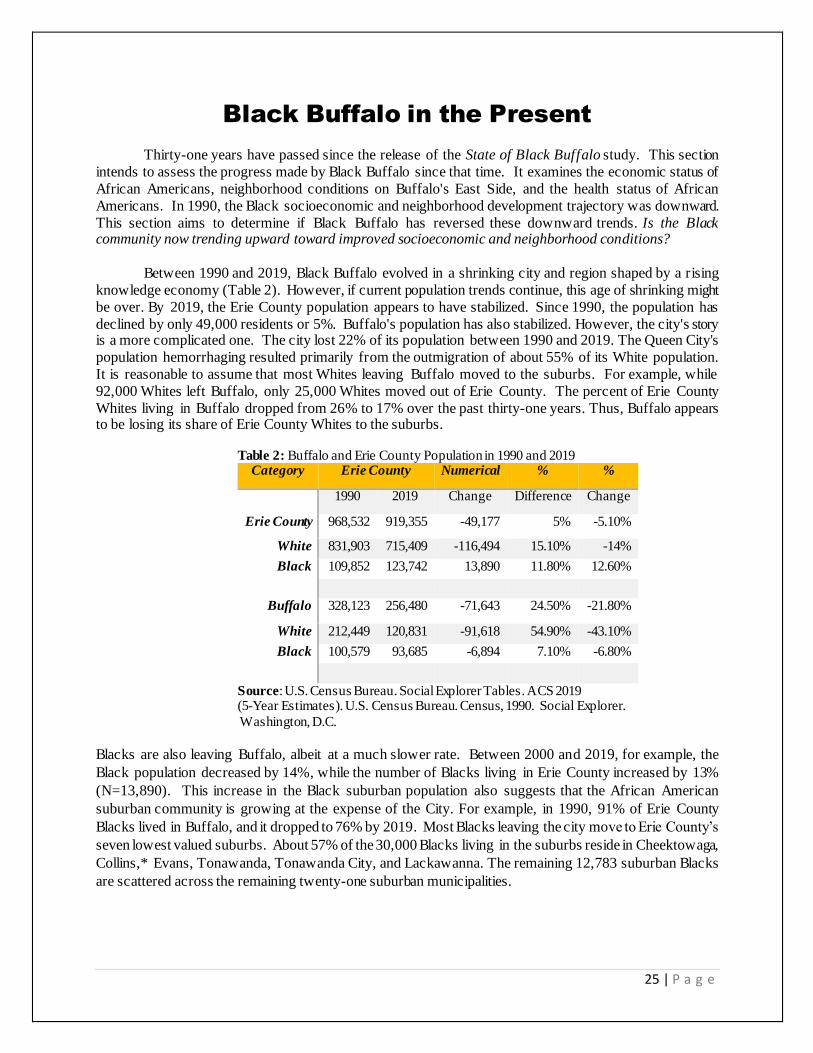
Thirty-one years have passed since the release of the State of Black Buffalo study. This section
intends to assess the progress made by Black Buffalo since that time. It examines the economic status of
African Americans, neighborhood conditions on Buffalo's East Side, and the health status of African
Americans. In 1990, the Black socioeconomic and neighborhood development trajectory was downward.
This section aims to determine if Black Buffalo has reversed these downward trends. Is the Black community now trending upward toward improved socioeconomic and neighborhood conditions?
Between 1990 and 2019, Black Buffalo evolved in a shrinking city and region shaped by a rising
knowledge economy (Table 2). However, if current population trends continue, this age of shrinking might
be over. By 2019, the Erie County population appears to have stabilized. Since 1990, the population has
declined by only 49,000 residents or 5%. Buffalo's population has also stabilized. However, the city's story is a more complicated one. The city lost 22% of its population between 1990 and 2019. The Queen City's
population hemorrhaging resulted primarily from the outmigration of about 55% of its White population.
It is reasonable to assume that most Whites leaving Buffalo moved to the suburbs. For example, while
92,000 Whites left Buffalo, only 25,000 Whites moved out of Erie County. The percent of Erie County
Whites living in Buffalo dropped from 26% to 17% over the past thirty-one years. Thus, Buffalo appears to be losing its share of Erie County Whites to the suburbs.
Table 2: Buffalo and Erie County Population in 1990 and 2019 Category Erie County Numerical % %
1990 2019 Change Difference Change
Erie County 968,532 919,355 -49,177 5% -5.10%
White 831,903 715,409 -116,494 15.10% -14%
Black 109,852 123,742 13,890 11.80% 12.60%
Buffalo 328,123 256,480 -71,643 24.50% -21.80%
White 212,449 120,831 -91,618 54.90% -43.10%
Black 100,579 93,685 -6,894 7.10% -6.80%
Source: U.S. Census Bureau. Social Explorer Tables. ACS 2019 (5-Year Estimates). U.S. Census Bureau. Census, 1990. Social Explorer.
Washington, D.C.
Blacks are also leaving Buffalo, albeit at a much slower rate. Between 2000 and 2019, for example, the
Black population decreased by 14%, while the number of Blacks living in Erie County increased by 13%
(N=13,890). This increase in the Black suburban population also suggests that the African American
suburban community is growing at the expense of the City. For example, in 1990, 91% of Erie County
Blacks lived in Buffalo, and it dropped to 76% by 2019. Most Blacks leaving the city move to Erie County’s
seven lowest valued suburbs. About 57% of the 30,000 Blacks living in the suburbs reside in Cheektowaga,
Collins,* Evans, Tonawanda, Tonawanda City, and Lackawanna. The remaining 12,783 suburban Blacks
are scattered across the remaining twenty-one suburban municipalities.

26 | P a g e
On the flip side, a significant growth spurt occurred among people of color between 1990 and 2019.
This diverse population consists of Puerto Ricans, Mexicans, Dominicans, Cuban, Asian Indians, Bangladeshi, Burmese, Chinese, Nepalese, Filipino, and others. Buffalo's designation as a refugee
destination city drives these increases in people of color. Their numbers leaped from approximately 15,000
to 42,000 between 1990 and 2019, a 178% increase. This refugee city status also explains why Asians are
the fastest growing racial group in Buffalo. Since 1990, Buffalo's Asian Population has increased by more
than 200%, jumping from about 4,000 to 15,000 in 2019.24
Ironically, people of color have been Buffalo's savior. Between 1950 and 1990, the influx of
thousands of African Americans cushioned the outmigration of thousands of more Whites. Then, from
1990 to 2019, the migration of thousands of Asians and Latinx to Buffalo stabilized the city's population.
This in-migration of Asians and Latinx was also occurring as the Black population started to decline.
Therefore, the influx of people of color, especially immigrants, has counter-balanced the outmigration of Whites and Blacks. As a consequence of these population increases and the thousands of Blacks remaining
in Buffalo, most city residents are now Blacks, Indigenous, and people of color (BIPOC). 25
This narrative, however, has a cautionary note. This colored population, functioning as a stabilizing
force in Buffalo, is characterized by limited education, low incomes, and high poverty rates. As a group, they cluster at the bottom of the City's economic order. The Asian suburban population appears to be an
exception. They are substantially better off than their cohorts residing in the core. For example, the median
income of city Asians is $30,429, but $50,725 for those living in suburban municipalities. For other people
of color, including African Americans, their suburban counterparts are not substantially better off. (Table
3). Table 3: Income and Poverty by Race and Ethnicity in Erie County and Buffalo
POPULATION COUNTY BUFFALO COUNTY BUFFALO
Median Median Poverty Poverty
H.H. Income H.H. Income Rate Rate
BLACK 31,402 28,320 31.3% 35.4%
WHITE 65,051 49,156 9.1% 20.1%
INDIGENOUS 24,167 21,548 28.9% 28.1%
ASIANS 50,725 30,429 33.5% 48.9%
LATINX 31,298 24,967 34.0% 42.1%
OTHERS 22,989 21,548 45.0% 50.3%
Source: U.S. Census Bureau, American Community Survey Tables (5-Year Estimate)2019.
Social Explorer.
Blacks in the Knowledge Economy
Financial Insecurity: When Work Disappears?
Thirty-one years ago, the trend lines showed that Blacks were disproportionately entering the low-
wage sector of the labor market.26 These low wages caused most individuals and families to live in
underdeveloped neighborhoods, rent substandard housing, and face dire financial straits. William Julius
Wilson warned that the knowledge economy propels a small group of middle-class Blacks upward while
pulling the masses downward into the low-wage sector and joblessness.27 Wilson also cautioned that work was disappearing in the Black community. He said that joblessness and low income would spawn social
havoc. The Black Buffalo study called for an intervention strategy to alter this downward trajectory and

27 | P a g e
counteract these negative trends.28 This section aims to determine if Blacks' downward socioeconomic
trajectory has reversed by examining their employment status and financial security. It explores Black's employment status by investigating four labor market elements: labor force, employed, unemployed, and
not in the labor force (Figure 5). It then assesses Black's financial security by exploring wages, earnings,
and homeownership.
Figure 5: Labor Market Dynamics
Source: U.S. Bureau of Labor Statistics. Labor Force Statistics from the Current Population. Online. Accessed on August 18, 2021.
Participation in the Labor Force
The knowledge economy was not kind to Black Buffalo in the years following 1990. The
attachment of Black male and female workers to the labor market remains weak. Blacks declining
participation in the labor force reflects their fragile connection to the labor market. The labor force
participation rate (LFPR) refers to that pool of sixteen and older workers employed or actively looking for work.29 Black labor force members are thus the primary generators of income and wealth in the Black
community. They are the economic backbone of Black Buffalo.
In 2019, the Black labor force participation rate was 56%,iii which is lower than the citywide labor
force participation rate of 60% and significantly lower than the White LFPR of 64% (Table 4). When combined with high unemployment, this low rate of Black participation in the labor force reduces their
iii The LFPR of Blacks are lower than the national LFPR, which is about 62% in 2019. U.S. Bureau of Labor
Statistics (2021). Civilian Labor Force Participation Rates. Online. Accessed on August 18, 2021.

28 | P a g e
employment rate.iv The employment rate refers to the actual percentage of workers in the labor force with
jobs. This low employment rate matters because it means that fewer and fewer Black workers have jobs. On the flip side, the knowledge economy is treating Whites much better. They have a significantly higher
labor force participation rate and lower unemployment rate. Thus, considerably more Whites than Blacks
are working.
Table 4: Labor Force Participation and Unemployment Rates for Blacks and Whites, Buffalo. 2019
16 Years & Labor Labor Force Unemployment Not in %
Category Older Force Participate Rate Labor Not in
Population Participant Rate
Force Labor Force
City 204,987 122,713 60% 7.00% 84,274 40%
Blacks 71,922 40,484 56% 11.20% 31,438 44%
Whites 97,739 62,684 64% 4.40% 35,055 36%
Source: U.S. Census Bureau, American Community Survey Tables (5-Year Estimates). Social Explorer.
This disparity in the labor force participation and unemployment rates between Blacks and White
have a gender dimension. The LFPR was low and unemployment high for Black men and women. The LFPR for Black men was 56% and slightly lower for Black women at 54%, while the unemployment rate
was 13% for Black men and 10% for Black women. These high unemployment rates for Black men and
women translate into a low employment rate of about 50% for Black workers. This figure means that only
half of Black workers, 16 years and older, have jobs. White men and women have a different reality. Whites
men's labor force participation rate was 68% and 61% for White women, with an unemployment rate of 5% for White men and 4% for White women. White thus have an employment rate of 61%, meaning that the
share of White workers with jobs is much higher than Blacks. Their labor market situation is therefore much
healthier.
This narrative suggests that there are three categories of Black workers. First, there are members of the Black labor force. These are workers who are able and willing to work. The unemployed workers
represent the second category. These workers are actively searching for work but cannot find employment.
It is a consistently large group. In both good and bad times, many Black workers cannot find a job. This
unemployed group reflects Black workers' weak connection to the labor market. They are seeking
employment, but they cannot get or keep a job. The third category of Black workers is those standing
outside the labor force, including many who have stopped looking for work altogether. This diverse group consists of retirees, students, welfare recipients, disabled workers, as well as discouraged workers, and
outlaw workers employed in the shadowy underground economy.30
The declining participation in the labor force issue matters because it means that the Black
employment-to-population ratio is shrinking. Jobs are disappearing, and Black Buffalo is increasingly dependent on fewer and fewer workers to generate income and wealth. The future looks bleak. Nationally,
labor economists predict that the Black labor force participation rate will decline, exacerbating the
iv Employment rate is the ratio of employed workers to the 16 year and older noninstitutionalized segment of the
population. It indicates how the proportion of the Black labor force with jobs.

29 | P a g e
employment-to-population ratio.31 Equally important, this prediction also implies that the downward
trajectory of Black workers will persist.32
Earnings, Household Income, and Homeownership
A linear relationship exists between the employment status of African Americans and their financial
security. Labor market dynamics will affect the economic security of Blacks and their wealth-producing
capacity by structuring their relationship to employment opportunities. An examination of Black earnings
and income will provide a more granular understanding of how these labor market dynamics impact Black
financial security. The Black labor force consists of full-time, year-round workers and those not working
full-time year-round. Full-time workers are those sixteen years old and over who work thirty-five hours or more per week for fifty to fifty-two weeks in the year. There are 40,484 Black workers in the labor force,
but only 22,562 (55%) worked full-time year-round (Table 5). In contrast, 65% of Whites and 61% of the
citywide workforce held full-time, year-round jobs. In a sharper perspective, only 31% of the sixteen-year-
old and older Black population have full-time, year-round employment. The small number of Blacks
working full-time jobs curtails Black workers' earning potential.
Table 5. Median Earnings for 16 & Over Pop: City, Black and White Workers by Gender, 2019 Median Earnings for Population 16 Years and Over: City, Black, and White
Male and Female Workers
Total Number Median Number Median Median Median
Total 16 & Full time Full Time Not FT Not FT FT/NFT All
16 & Over Over Pop Workers Earnings Workers Earning Workers Workers
Population City 204,987
Male 95,998 38,748 $42,920 24,598 $11,197 $30,325 $27,512
Female 108,989 35,696 $39,459 29,531 $11,416 $25,954
Totals 74,444
54,129
White 97,739
Male 48,098 22,261 $50,617 11,831 $12,372 $37,651 $33,386
Female 49,641 18,620 $43,891 13,081 $12,755 $30,773
Totals 40,881
24,912
Black 71,922
Male 31,105 10,139 $35,475 8,058 $10,011 $24,852 $24,241
Female 40,817 12,423 $34,552 11,235 $11,340 $23,821
Totals 22,562
19,293
Source: U.S. Census Bureau. American Community Survey Tables, 2019. Social Explorer.
Significantly, the majority of Black workers holding full-time jobs are in the labor market's low-
wage sector. About 71% of Black male workers earn less than $50,000 annually, while only 10% make more than $75,000 a year. The employment situation is slightly worse for Black Women. About 74% of
Black women earn less than $50,000, while only 9% earn more than $75,000. The earnings of most Blacks,
then, fall in the bottom half of Buffalo's income quadrant.
Whites are doing significantly better. About 48% of White male workers earn less than $50,000, but 24% make $75,000 or more. White women present an intriguing earning profile. About 59% earn less

30 | P a g e
than $50,000. However, most of their earnings fall within the $30,000 to $49,999 category. In contrast, the
earnings of most Black men and women fall into the $29,999 and below category. Moreover, although the earnings of most White women are in the lower-earning quadrants, about 16% of White women workers
still earn more than $75,000 a year. Thus, most Whites concentrate in the higher-income sector of the labor
market, while most Blacks cluster in the low-income sector. In this context, White women are doing
considerably better than both Black men and women.
Household Income
Earnings are only part of a household's financial security story. Income is another component. This broad category includes the combined gross earnings and other revenue sources of household
members, including social security payments, pensions, child support, public assistance annuities, and
money derived from rental properties, interest, and dividends. Earnings are one the most important sources
of income, and it comes primarily from wages and salary. Household income, then, is the linchpin in
workers' relationship to the labor market.v The median household income of Blacks in Buffalo is $28,320, considerably lower than the White median household income of $50,249 but higher than other people of
color, except for Asians (Table 6).
There is a 56% difference between the household income of Blacks and Whites and a 55%
difference in their poverty rates. Blacks' high poverty rate reflects the cumulative impact of their non-competitiveness in the labor market, concentration in the low-wage sector, and declining participation in
the labor force. Examining the income distribution between Black and White households will provide more
insight into the meaning of these differentials in household income and poverty rates.
Table 6: Median Household Income and Poverty Rates by Race in Buffalo, 2019
Source: U.S. Census Bureau. American Community Survey (5-year Estimates). Social Explorer.
The income distribution pattern between Blacks and Whites mirrors their earnings pattern (Table
7). About 71% of Black households have median incomes below $50,000, and 52% of these Black
households have incomes under $30,000. Significantly, only 15% of Black households have incomes higher than $75,000 annually. In contrast, White households are equally divided between those with
incomes below and above $50,000. Still, a third of White households have income higher than $75,000
annually, with 50% of White households having incomes at or above $50,000. The financial situation of
White households is thus greater than Blacks and other people of color.
v The Census Bureau also collects data on family income, but it is more restrictive and does not cover the entire Population. For
example, families consist of two or more people related by birth, marriage, or adoption. Thus, single persons living alone a re not
considered a family. Therefore, this report uses only household data.
CATEGORY MEDIAN POVERTY
HHI Rate %
BUFFALO $37,354 30%
WHITE $50,249 20.1%
BLACK $28,320 35.4%
LATINX $24,967 42.1%
ASIAN $30,429 48.9%
INDIGENOUS $21,548 28.1%
OTHER RACE $21,548 50.3%
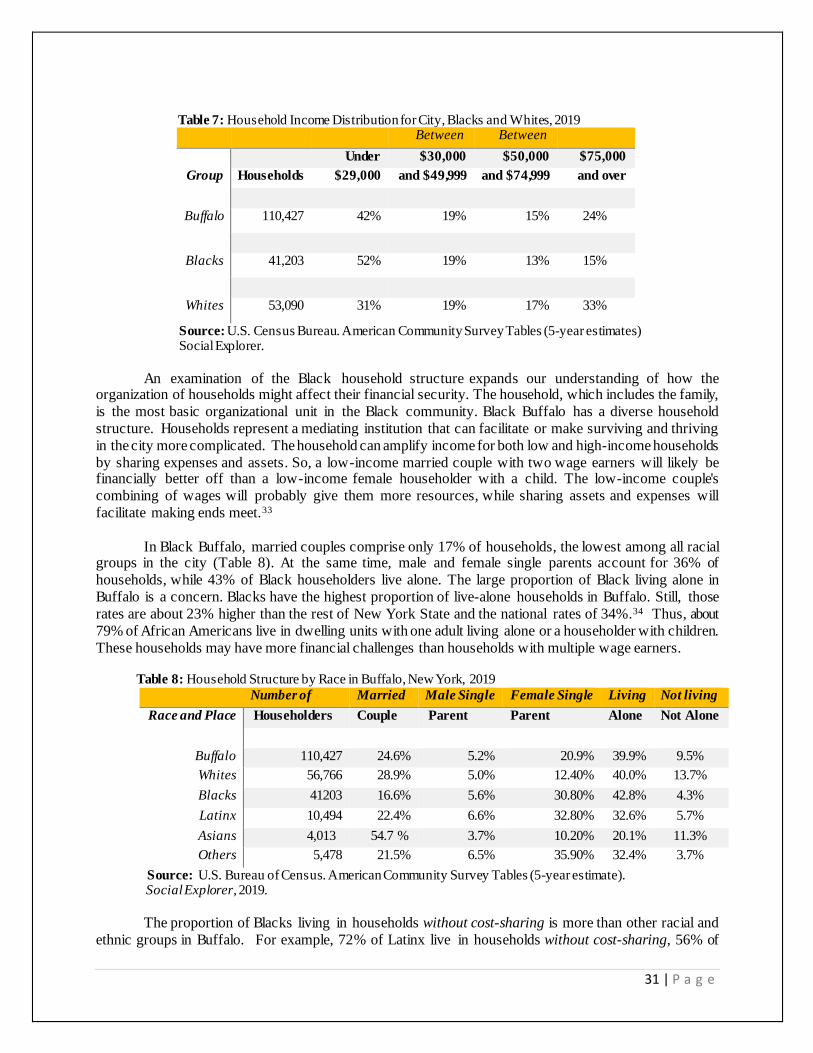
31 | P a g e
Table 7: Household Income Distribution for City, Blacks and Whites, 2019
Between Between
Under $30,000 $50,000 $75,000
Group Households $29,000 and $49,999 and $74,999 and over
Buffalo 110,427 42% 19% 15% 24%
Blacks 41,203 52% 19% 13% 15%
Whites 53,090 31% 19% 17% 33%
Source: U.S. Census Bureau. American Community Survey Tables (5-year estimates) Social Explorer.
An examination of the Black household structure expands our understanding of how the organization of households might affect their financial security. The household, which includes the family,
is the most basic organizational unit in the Black community. Black Buffalo has a diverse household
structure. Households represent a mediating institution that can facilitate or make surviving and thriving
in the city more complicated. The household can amplify income for both low and high-income households
by sharing expenses and assets. So, a low-income married couple with two wage earners will likely be financially better off than a low-income female householder with a child. The low-income couple's
combining of wages will probably give them more resources, while sharing assets and expenses will
facilitate making ends meet.33
In Black Buffalo, married couples comprise only 17% of households, the lowest among all racial groups in the city (Table 8). At the same time, male and female single parents account for 36% of
households, while 43% of Black householders live alone. The large proportion of Black living alone in
Buffalo is a concern. Blacks have the highest proportion of live-alone households in Buffalo. Still, those
rates are about 23% higher than the rest of New York State and the national rates of 34%.34 Thus, about
79% of African Americans live in dwelling units with one adult living alone or a householder with children.
These households may have more financial challenges than households with multiple wage earners.
Table 8: Household Structure by Race in Buffalo, New York, 2019 Number of Married Male Single Female Single Living Not living
Race and Place Householders Couple Parent Parent Alone Not Alone
Buffalo 110,427 24.6% 5.2% 20.9% 39.9% 9.5%
Whites 56,766 28.9% 5.0% 12.40% 40.0% 13.7%
Blacks 41203 16.6% 5.6% 30.80% 42.8% 4.3%
Latinx 10,494 22.4% 6.6% 32.80% 32.6% 5.7%
Asians 4,013 54.7 % 3.7% 10.20% 20.1% 11.3%
Others 5,478 21.5% 6.5% 35.90% 32.4% 3.7%
Source: U.S. Bureau of Census. American Community Survey Tables (5-year estimate). Social Explorer, 2019.
The proportion of Blacks living in households without cost-sharing is more than other racial and
ethnic groups in Buffalo. For example, 72% of Latinx live in households without cost-sharing, 56% of

32 | P a g e
Whites, and 34% of Asians. We theorize that household structure amplifies income, making life easier or
more challenging for the householder depending on the number of wage earners in the dwelling unit. If true, the Black household structure intensifies hardship and makes life more difficult for its inhabitants.
Homeownership
Homeownership is the third component of financial security. Homeownership matters because it
is the primary method of wealth accumulation in the United States. Appreciation in home value and equity
are the drivers of homeownership as a wealth production tool. Homeownership provides owners with
cushions during hard financial times, provides additional retirement resources, and can help finance their
children's education. Homeownership can also produce community wealth. When "sustainable"
homeownership expands in a neighborhood, it boosts the value of all homes in the community and theoretically increases social stability by improving educational performance, lowering crime rates, and
improving health outcomes.35
Homeownership is not a wealth-producing tool in Black Buffalo (Table 9). The incomes of African
Americans are too low for most of them to participate in the homeownership dream. Not surprisingly, only 32% of Blacks are homeowners. In Erie County, only 33% of African Americans own their homes. In
contrast, 52% of Whites in Buffalo are homeowners, while 73% of Erie County Whites are homeowners.
The American Community Survey does not have data on the value of owner-occupied housing by race.
Later in this report, we use geographic location to estimate the value of Black owner-occupied housing
units. However, for now, based on Black incomes, we estimate that the value of most Black owned housing units are less than the citywide median value of $90,000 and significantly lower than the Erie County
median value of $153,400. The bottom line is that homeownership is not a wealth-producing tool in Black
Buffalo.
Table 9: Housing Tenure by Race in Buffalo, 2019
Source: U.S. Census Bureau, American Community Survey (5-Year Estimates). Social Explorer.
Education and Black Labor Market Dynamics
Educational attainment, labor markets, and the Black financial insecurity are interactive. Education
is the linchpin in labor market dynamics. The level of educational attainment is a primary determinant of
how a worker fares in the labor market. This variable refers to the highest level of education that an
individual has completed. It is a cumulative measure that examines the entire population, age twenty-five
and over. Education is crucial because it plays a pivotal role in deciding if workers end up in the low- or
high-wage sector labor market. In the State of Black Buffalo, researchers warned that Blacks were on a downward education trajectory. Unless reversed, they would remain trapped in a quagmire of low incomes
and hard times. This section examines educational outcomes for African Americans twenty-five years and
RACE/ETHNICITY OWNER RENTER
CITY 40.7% 59.3%
BLACK 31.8% 68.2%
WHITE 50.5% 49.5%
LATINX 21.8% 78.2%
INDIGENOUS 11.2% 88.8%
ASIAN 37.5% 62.6%
OTHERS 18.9% 81.1%

33 | P a g e
older by analyzing three variables: (1) percent of Blacks who did not complete high (2) percent of Blacks
with some college, but no degree and (3) percent of Blacks with a B.A. degree or higher
Education attainment is vital in the knowledge economy because most high-paying jobs require
advanced education and training. The low-wage sector of the labor market will pull workers into it without
a high school degree. In Buffalo, the employment status of workers improves with their level of educational
attainment (Table 10). A worker with some college, including an associate degree, but no Bachelor's degree is more likely to be employed and have a higher wage than someone with less than a high school degree.
Moreover, a person with a Bachelor's Degree or higher is more likely to be employed and have a higher
paying job than workers with less education. We do not have data on the relationship between educational
attainment and employment status by race. However, given the racial dynamics operative in Buffalo, we
know that Whites will outperform Blacks and people of color across these levels of educational attainment.
Table 10: Educational Attainment and Employment Status in Buffalo, 2019 Not in Median Employment
Education Attainment Population Labor Force
Unemployed Labor Force
Earnings Rate
Total 25 to 64 years Pop 135,609
Less than High School 18,434 45.2 % 5.40% 54% $18,185 40%
High School Graduate 36,628 65% 8% 35% $26,799 60%
Some College, Associates 41,318 72% 6% 31% $30,847 67%
but no Bachelor's Degree
Bachelor's Degree or higher
39,229 88% 3% 12% $40,164 85%
Graduate or Professional NA NA NA NA $56,509 NA
Source: U.B. Bureau of Census. American Community Survey Tables (5-year Estimates). Social Explorer.
In Buffalo's knowledge economy, those workers without a high school diploma are non-competitive in the labor market. The lack of education traps them at the bottom of the low-wage sector.
Thus, a significant challenge facing Black Buffalo is that African Americans without a high school diploma
outnumber those with a college degree. About 18% of Blacks have less than a high school diploma, while
16% have a Bachelor's degree or higher. These numbers improved significantly over the past 31 years,
dropping by 53%. However, these educational advances have still not altered the positionality of Blacks in the labor market.
Blacks, despite educational gains, remained at the bottom of the socioeconomic order. One reason
is that a significant number of African Americans have some college but no degree (Table 11). In 2019,
about 36% of Blacks, twenty-five years and older, started college but never received a Bachelor's Degree.
Thus, while the number of Blacks going to college more than doubled over the past thirty-one years, most did not get their degrees. In 1990, for example, 19% of Blacks started but never finished college, and by
2019 that figure had jumped to 36%, a 62% increase. Going to college did add value to Black workers in
the labor force. Workers with some college but no degree are more likely to be employed and earn higher
wages than workers with less education. However, while some college added value to Black workers, it
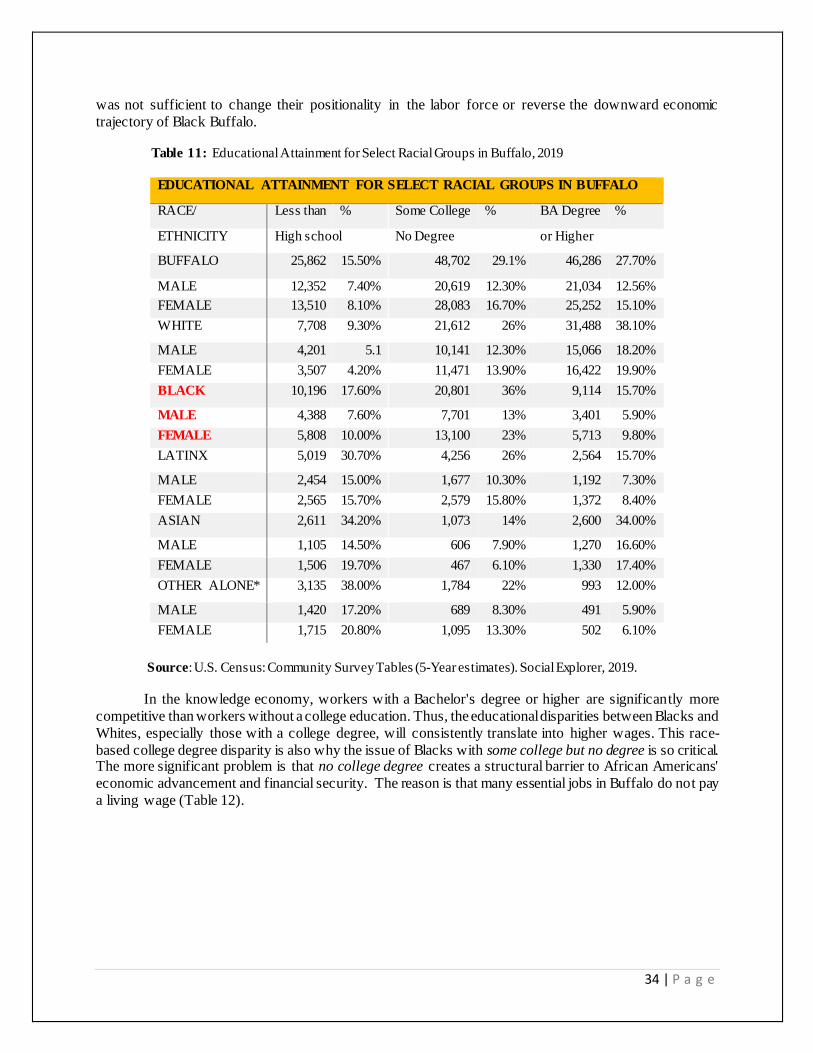
34 | P a g e
was not sufficient to change their positionality in the labor force or reverse the downward economic
trajectory of Black Buffalo. Table 11: Educational Attainment for Select Racial Groups in Buffalo, 2019
Source: U.S. Census: Community Survey Tables (5-Year estimates). Social Explorer, 2019.
In the knowledge economy, workers with a Bachelor's degree or higher are significantly more
competitive than workers without a college education. Thus, the educational disparities between Blacks and
Whites, especially those with a college degree, will consistently translate into higher wages. This race-
based college degree disparity is also why the issue of Blacks with some college but no degree is so critical. The more significant problem is that no college degree creates a structural barrier to African Americans'
economic advancement and financial security. The reason is that many essential jobs in Buffalo do not pay
a living wage (Table 12).
EDUCATIONAL ATTAINMENT FOR SELECT RACIAL GROUPS IN BUFFALO
RACE/ Less than % Some College % BA Degree %
ETHNICITY High school No Degree
or Higher
BUFFALO 25,862 15.50% 48,702 29.1% 46,286 27.70%
MALE 12,352 7.40% 20,619 12.30% 21,034 12.56%
FEMALE 13,510 8.10% 28,083 16.70% 25,252 15.10%
WHITE 7,708 9.30% 21,612 26% 31,488 38.10%
MALE 4,201 5.1 10,141 12.30% 15,066 18.20%
FEMALE 3,507 4.20% 11,471 13.90% 16,422 19.90%
BLACK 10,196 17.60% 20,801 36% 9,114 15.70%
MALE 4,388 7.60% 7,701 13% 3,401 5.90%
FEMALE 5,808 10.00% 13,100 23% 5,713 9.80%
LATINX 5,019 30.70% 4,256 26% 2,564 15.70%
MALE 2,454 15.00% 1,677 10.30% 1,192 7.30%
FEMALE 2,565 15.70% 2,579 15.80% 1,372 8.40%
ASIAN 2,611 34.20% 1,073 14% 2,600 34.00%
MALE 1,105 14.50% 606 7.90% 1,270 16.60%
FEMALE 1,506 19.70% 467 6.10% 1,330 17.40%
OTHER ALONE* 3,135 38.00% 1,784 22% 993 12.00%
MALE 1,420 17.20% 689 8.30% 491 5.90%
FEMALE 1,715 20.80% 1,095 13.30% 502 6.10%

35 | P a g e
Table 12: Occupations that Do Not Pay a Living Wage
Occupation
Number Employed
Median Income
Food Preparation/Serving
61,210
$19,960
Retail Salesperson
24,200
$20,320
Cashier
17,160
$19,470
Janitor/Cleaner
12,700
$24,510
Stock Clerk/Order Filler
9,140
$22,450
Personal Care Aides
9,090
$23,640
Teacher’s Assistant
8,810
$22,310
Laborers and Freight, Stock, and Material Movers, Hand
8,690
$25,550
Home Health Aide
5,640
$23,770
Source: Buffalo Brief: Poverty in Buffalo-Niagara. Partnership for the Public Good, 2018.

36 | P a g e
Racial Residential Segregation
How do we explain the enduring sameness about work and financial disparities between Blacks
and Whites in Buffalo and Erie County? We theorize that racial residential segregation drives these race-
based economic disparities by producing differential access to education, jobs, and economic opportunities.
The Buffalo-Erie County region is one of the most segregated areas in the United States.36 This residential
apartheid is based on home value and social class exclusivity. The land valuation system developed by Frederick M. Babcock during the 1930s continues to inform this process.
In this system, race and class interact to sort and place racial and ethnic groups in different
residential districts and neighborhoods. Thus, as the percentage of White and social class exclusivity
increases in a residential district, home values and the wealth-producing power of those communities rise.vi In contrast, as the percentage of Blacks and social class inclusivity increases in a residential district, home
values and the wealth-producing capacity of those localities decrease. Therefore, this approach to
determining residential land values produces a hierarchy of neighborhoods based on home value and social
class exclusivity. In this approach, home value is the spark that ignites neighborhood development and
determines the abundance or scarcity of amenities and accessibility to quality goods and services, including
schools, health services, social clubs and institutions, and parks and playgrounds. The home sphere also connects residents to social networks, jobs, and opportunities for economic advancement. Thus, in this
method of neighborhood development, where you live plays a significant role in determining your life
chances.37
The Racial Residential Segregation Process
We rank-ordered Erie County's twenty-eight municipalities by median home value and grouped
them into quadrants to determine how the segregation of Erie County residents occurred (Figure 6A and 6B). The County's segregation process followed the classic Babcock land valuation playbook.38 As the
percentage of Whites and social class exclusivity increased in a residential quad, these quads' home value
and wealth-producing power rose. For example, in quad one (yellow), which has the County's highest home
value, the population is 97% White and less than 1% Black. At the opposite end, in quad four (blue), which
includes Buffalo, the population is 65% White and 24% Black, with people of color comprising the remaining 11%. Most significant, approximately 88% of Erie County Blacks live in the Central City or the
adjacent low-value suburbs.
The segregation pattern becomes even shaper if we examine home values and race in municipalities
within the residential quads. For instance, Blacks comprise less than 1% (N=219) of the population in
Clarence, which has the County's highest home value. On the opposite end, in Buffalo, which has the lowest home value, Blacks comprise 37% of the population. This portrait of racial residential segregation
interweaves race and class. For example, in the highest value residential quad, Clarence, the median
household income of Whites is $101,000 while it is $121,000 for Blacks. In this exclusive suburb, the
median household income of Blacks is higher than Whites, but only 219 African Americans live in the
municipality.
Regardless, the theory is that race and class operate in tandem. A similar pattern exists in the
high-value residential quad, Amherst, where the median household income of Whites is $78,000, and
$63,000 for Blacks. In the lowest value residential quad, Cheektowaga, which is ranked 24th in home value,
the White median household income is $56,000, and the Black median is $40,000, while in low-value
vi Social class is determined the %age of the population with a Bachelor’s Degree and median household income .

37 | P a g e
Lackawanna, ranked 27th in housing values, the White median household income is $42,000, and the Black
is $33,000. Likewise, in Clarence, Blacks comprise less than 1% of the population. In Amherst, they comprise 7% of the people. In Cheektowaga, Blacks comprise12%, and 11% in Lackawanna. Buffalo is
somewhat of an outlier in this process, but the pattern still prevails. In the city, the median household
income of Whites is $50,000, while it is $28,000 for Blacks. Thus, across Erie County, the intermingling
of race and class drives the residential segregation process. In each municipality, home value and social
class are the primary determinants of who lives in the community.
Figure 6A: Residential Quadrants in Erie County, 2019
Source: U.S. Census Bureau, American Community Survey (5-year estimates) 2019.
Town/City
Rank
Median
Home
Value
Median
Household
Income
% with
B.A. or
Higher
%
White
% Black
% Poverty
Clarence 1 $294,000 $101,831 54.2% 94.6% 0.7% 3.3%
Elma 2 $251,000 $75,718 42.2% 98.0% 0.1% 4.1%
Orchard Park 3 $245,500 $90,245 48.3% 96.4% 0.9% 4.7%
Aurora 4 $226,500 $80,963 47.1% 97.5% 0.7% 5.2%
Marilla 5 $222,700 $76,688 33.1% 98.3% 0.2% 2.1%
Wales 6 $208,900 $82,269 31.0% 94.7% 0.0% 4.4%
Grand Island 7 $207,100 $80,733 39.3% 93.8% 2.2% 6.0%
Colden 8 $203,800 $75,938 28.1% 98.7% 0.8% 1.8%
Amherst 9 $202,400 $76,704 55.9% 80.2% 6.6% 9.5%
Boston 10 $182,600 $74,963 30.0% 99.1% 0.0% 4.6%
Lancaster 11 $181,100 $72,591 33.3% 96.3% 2.0% 4.6%
Alden 12 $171,300 $74,858 23.7% 86.4% 11.2% 4.5%
Eden 13 $168,000 $73,884 26.8% 97.0% 0.0% 4.4%
Holland 14 $167,500 $59,148 20.0% 97.2% 1.1% 7.9%
Hamburg 15 $166,100 $70,408 34.7% 96.6% 1.1% 7.3%
Sardinia 16 $162,800 $67,237 20.0% 99.6% 0.1% 9.6%
Newstead 17 $157,900 $64,741 29.4% 96.1% 1.2% 3.5%
West Seneca 18 $151,700 $67,617 29.6% 97.1% 1.1% 6.1%
Concord 19 $151,200 $57,428 23.6% 97.7% 0.5% 11.3%
Brant 20 $139,900 $49,324 21.5% 92.3% 2.1% 9.9%
North
Collins
21 $138,200 $59,018 22.1% 96.0% 1.0% 10.1%
Tonawanda, town
22 $138,000 $61,571 37.8% 89.2% 5.3% 8.4%
Evans 23 $126,300 $61,833 24.2% 97.0% 1.0% 11.5%
Cheektowaga 24 $113,900 $54,191 23.0% 83.1% 11.7% 10.4%
Collins 25 $109,700 $51,429 11.9% 71.6% 17.2% 11.8%
Tonawanda, city
26 $108,800 $53,115 22.6% 95.7% 0.5% 11.7%
Lackawanna 27 $94,700 $38,289 16.2% 79.2% 11.0% 22.6%
Buffalo, city 28 $89,800 $37,354 27.6% 47.1% 35.6% 30.1%

38 | P a g e
Figure 6B: Residential Quadrants in Erie County, 2019
Quadrant One
(Highest Value)
Median HH Income: $80,963
Median Home Value: $226,500
% with B.A.: 46.31%
% White: 95.81%
% Black: 0.9%
% Poverty: 4.4%
Total White: 112,010
Total Black: 1,069
% Black of Erie County: 0.1%
% Black of Total Black Erie County: 1.0%
Quadrant Two
(High Value)
Median HH Income: $74,858
Median Home Value: $181,100
% with B.A.: 45.74%
% White: 85.9%
% Black: 5.1%
% Poverty: 7.6%
Total White: 172,654
Total Black: 10,345
% Black of
Erie County: 1.1%
% Black of
Total Black Erie County: 8.4%
Quadrant Three
(Median Value)
Median HH Income: $64,741
Median Home Value: $151,700
% with B.A.: 30.96%
% White: 96.8%
% Black: 1.0%
% Poverty: 7.0%
Total White: 124,918
Total Black: 1,350
% Black of
Erie County: 0.1%
% Black of
Total Black Erie County: 1.1%
Quadrant Four
(Lowest Value)
Median HH Income: $53,115
Median Home Value: $109,700
% with B.A.: 27.44%
% White: 64.98%
% Black: 23.6%
% Poverty: 21.3%
Total White: 305,669
Total Black: 110,959
% Black of
Erie County: 12.1%
% Black of
Total Black Erie County: 89.7%
Source: U.S. Census Bureau: American Community Survey (5-year estimates). 2019.

39 | P a g e
Against this backdrop, the Erie County suburbs are hyper-segregated (Figure 7). About 84% of the
County's 715,000 Whites live in twenty-seven suburban municipalities, along with about 30,000 Blacks. This small population also includes those institutionalized Blacks at the Erie County and Wende
Correctional facilities in Alden and the Correctional Facility in Collins. Blacks comprise only 4% of the
suburban population, and their scattering across twenty-seven municipalities renders them invisible. Erie
County has a dissimilarity index of 73, making it a hyper-segregated community.vii
Figure 7: Erie County Residential Quadrants by Municipality, 2019
Source: U.S. Bureau of Census, American Community Survey (5-year estimates). Social Explorer. Map by U.B. Center for Urban Studies.
Buffalo and Racial Residential segregation
Buffalo and the suburbs have different patterns of racial residential segregation. One reason is that Blacks, Indigenous, and people of color form over 50% of the population. About 17% of Erie County's
Whites, 76% of Blacks, and 34% of indigenous and people of color live in Buffalo. This dense
concentration of Blacks, Indigenous, and people of color within a 52.2 square mile city spawns a pattern of
segregation that differs from the more dispersed suburban population. There will be a greater intermixing
of folks in the city. Even so, home values and race and social class drive residential segregation and neighborhood development (Figure 8). Main Street functions as a racial and socioeconomic divide in
Buffalo. Most Whites live on the West Side and in South Buffalo. At the same time, about 73% of Black
vii The dissimilarity index is the most commonly used measure of segregation between two groups, reflecting their distribution across neighborhood within the same city or metropolis. The dissimilarity index varies between 0 and 100, and measures the percentage of one group that would have to move across neighborhoods to be distributed in
the same way as the second group. CensusScope.

40 | P a g e
Buffalo reside on the East Side, where we find Buffalo's lowest value homes in residential quad one (blue).
Blacks comprise 68% of the quartile population, Whites 21%, with people of color forming the remaining 11%. The quad's median household income is $24,000, and only 12% of its residents have college degrees.
However, not all East Side home values are low. They are highest in the areas adjacent to the University
at Buffalo, Main Street, the Buffalo-Niagara Medical Campus, and downtown Buffalo. These locales are
in a gentrification danger zone, where residents are at risk of increased housing cost burdens, eviction or
forced moves, and ultimately neighborhood displacement.
Figure 8: Racial Segregation and Buffalo's Residential Quadrants by Median Home Value, 2018
Source: U.S. Census Bureau, 2010; U.S. Census Bureau, American Community Survey (5-year estimates). Social Explorer. Buffalo Rising, Dot Map; Map by U.B. Center for Urban Studies, Land Value.
In contrast, the City's highest home values are on the West Side, in residential quads three (green)
and four (yellow). The highest values are in quad four, where Whites comprise 72% of the population,
Blacks (14%), and people of color (14%) make up the remaining 28% of the residents (Figure 10). The
median household income is $54,000, and 51% of quartile residents have college degrees.
Home values are also high in the far West Side (green and brown residential quads), where a
mixture of people of color, African Americans, and young Whites dominate. This area is also a
gentrification danger zone, where rising home values ignite increases in rent, housing cost burdens, and
housing insecurity, thereby threatening the low-income population with displacement. In Buffalo, although the patterns differ from the suburbs, the levels of segregation are still high. Although Buffalo’s Index of
dissimilarity (61.63) is lower than the County's (73), the city still ranks as one of the most segregated
municipalities in America,
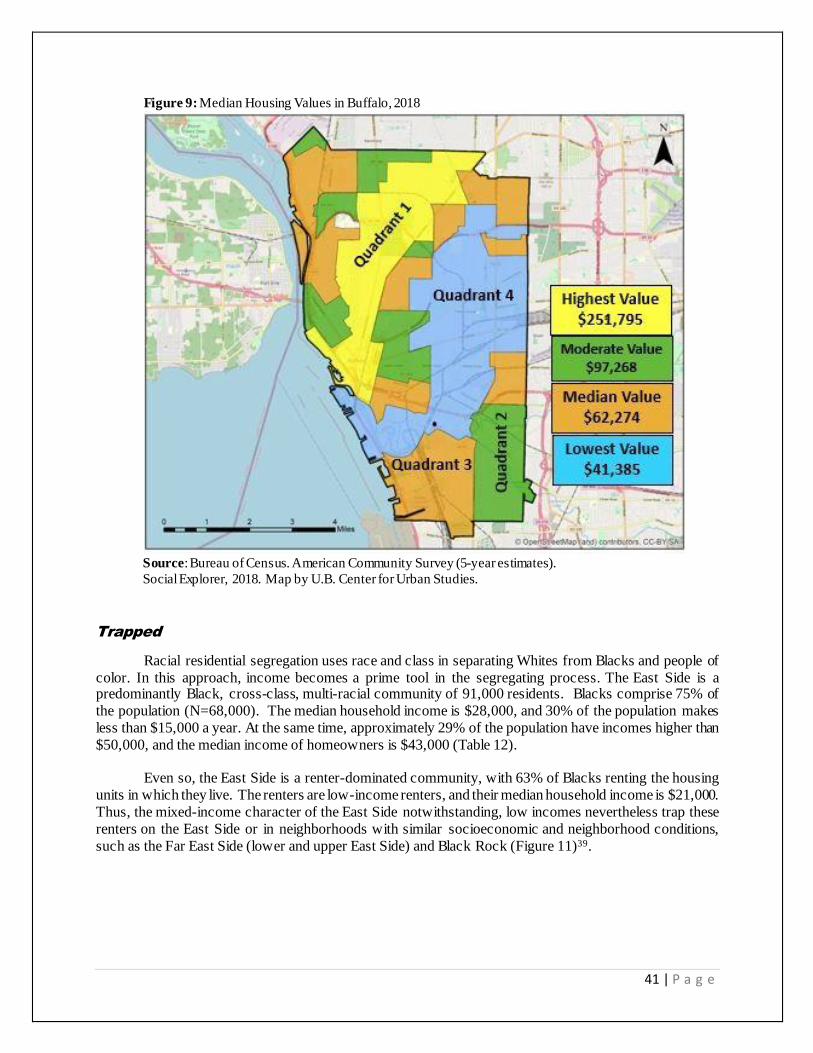
41 | P a g e
Figure 9: Median Housing Values in Buffalo, 2018
Source: Bureau of Census. American Community Survey (5-year estimates).
Social Explorer, 2018. Map by U.B. Center for Urban Studies.
Trapped
Racial residential segregation uses race and class in separating Whites from Blacks and people of
color. In this approach, income becomes a prime tool in the segregating process. The East Side is a predominantly Black, cross-class, multi-racial community of 91,000 residents. Blacks comprise 75% of
the population (N=68,000). The median household income is $28,000, and 30% of the population makes
less than $15,000 a year. At the same time, approximately 29% of the population have incomes higher than
$50,000, and the median income of homeowners is $43,000 (Table 12).
Even so, the East Side is a renter-dominated community, with 63% of Blacks renting the housing
units in which they live. The renters are low-income renters, and their median household income is $21,000.
Thus, the mixed-income character of the East Side notwithstanding, low incomes nevertheless trap these
renters on the East Side or in neighborhoods with similar socioeconomic and neighborhood conditions,
such as the Far East Side (lower and upper East Side) and Black Rock (Figure 11)39.

42 | P a g e
Table 13: East Side Population, 2119 Total Population: 91,177
White Alone 11,885 13.0%
Black or African American Alone 67,969 74.6%
American Indian and Alaska Native Alone 224 0.3%
Asian Alone 5,192 5.7%
Native Hawaiian and Other Pacific Alone 56 0.1%
Some Other Race Alone 2,665 2.9%
Two or More Races 3,186 3.5%
Source: U.S. Census Bureau. American Community Survey (5-year estimate).
Social Explorer, 2019.
Figure 10: Areas of Concentrated Poverty
Source: Fair Housing Equity Assessment. Regional Institution,
School of Architecture and Planning, University at Buffalo
43 | P a g e
If we use a housing affordability standard, these households should pay no more than 30% of their
income on housing or $525 monthly for rent. However, few non-subsidized housing units are available at this price. For example, only 21% of the housing units in Erie County and 26% in Buffalo have gross rents
less than $600 monthly. Low incomes thus keep Blacks stuck on the East Side or in similar neighborhoods
(Figure 11). For example, the median gross rent on Buffalo's East Side is $736, which is slightly below the
citywide median of $779 and significantly lower than the Erie County suburban median of $876. However,
in many Buffalo neighborhoods, the gross rents are higher than the citywide median. In the Elmwood-Bidwell neighborhood, the median gross rent is $1,009. In some upper West Side neighborhoods, it is $821,
and $808 in the Parkside community.
The Census data provides a cumulative list that shows the range of gross rents within census tracts.
Overall, about 47 % of all renter-occupied units in Buffalo and 54 % of County units have rents of more
than $800 monthly. And 61 % of the suburban apartments rent units for more than $800. Less than 17 % have apartments with monthly rentals of less than $600. Moreover, rents go up with increases in the number
of bedrooms. Therefore, two and three-bedroom apartments will cost more than one-bedroom units. Rental
increases based on the number of bedrooms is vital because single men and women are the householders in
about 36 % of the household in the Black community. These households will need two or more bedrooms
depending on the number of children and their age and gender. Moreover, married couples with children will need more than one bedroom. Thus, given the low incomes of Black renters, most will not be able to
afford the higher rents in other parts of Buffalo and Erie County.
Of course, the forces keeping African Americans out of White-dominated neighborhoods are more
than economic. Stated or unstated, racist assumptions that Black presence triggers decline in housing values still drive residential segregation. Additionally, property owners use intentional forms of racial
discrimination to reinforce and maintain this system of racial segregation. In 2013, the urban planner Robert
Silverman and sociologist Kelly Patterson, along with Master of Urban Planning Student Jade Lewis, found
that HUD and the Federal Housing Assistance Program (FHAP) processed 172 housing discrimination
cases for Buffalo from 2004–2012.40
This process is probably the tip of the city's discrimination iceberg. Millions of housing
discrimination incidents occur annually, but less than one % are reported to HUD or FHAP agencies.
Silverman, Patterson, and Lewis said that housing discrimination victims lack information on reporting
discrimination, and they perceive the complaint process as cumbersome and ineffective. Local housing
agencies and advocacy groups' limited capacity to pursue complaints and the lack of law enforcement of housing laws aggravate these perceptions. Racial discrimination and high rents notwithstanding, many low-
income Blacks do move, but they move in context (Figure 11).

44 | P a g e
Figure 11: East Side and Black Secondary Settlements, 2019
Source: Census Bureau. American Community Survey (5-year estimates). Social Explorer, 2019. Map by U.B. Center for Urban Studies
Blacks resettle in communities where the housing and neighborhood conditions are similar to the
ones they left behind.41 In these localities, they face a trilogy of the housing cost burden, low-quality housing units, and the constant threat of eviction or forced relocations. Still, a small but growing number
of African Americans are resettling outside the East Side. There are now four secondary settlements on the
lower and upper West Side and in Black Rock and in sections of Bryant, where Blacks comprise 30% or
more of the population (Figure 12). The median gross rent in these locales is $727, slightly below the East
Side median gross rent but still higher than the $525 that most East Side renters should be paying for housing.

45 | P a g e
Figure 12: Black East Side and Secondary Settlements
Source: Census Bureau: American Community Survey
(5-year estimates). Social Explorer, 2019. Map by U.B. Center for Urban Studies.
These racially diverse far West Side communities are also locales with large low-income
populations, especially among the renter class. The median household income of African Americans is
$27,000, and 52% have incomes below the poverty line. Other groups in the far West Side secondary settlements also live on the economic edge. For example, the poverty rate among Asians is 36%, Whites
23%, and 46% for the Latinx Population. In these secondary settlements, 49% of the residents are housing
cost-burdened, and 27% are severely burdened. There is an income dimension to the housing cost burden.
The lower one's income, the greater will be the housing cost burden. For example, roughly 42% of the
residents with incomes from $20,000 to $34,999 pay 30% or more of their income on housing. However, 82% of the residents with incomes from $10,000 to $19,999 spend 30% or more of their income on housing,
while 96% of residents with incomes of less than $10,000 spent 30% or more of their income on housing.
The significant issue is that these far West Side settlements resemble the East Side, reinforcing the
theory that Blacks are stuck in place. A small number of Blacks also moved into the Elmwood-Bryant neighborhood (67.02), and they have a median income of $32,000 annually. The median gross rent in this
neighborhood is $813, but approximately 53% of the units rent for more than $800. However, there are
efficiencies with a median gross rent of $693. About half the residents living in this neighborhood pay 50%
or more of their income on housing, with 24% spending more than 50%. This locale is a highly
commercialized community. Still, the housing and physical conditions were good, but they are not
affordable, especially for family households. The reality of these Blacks living in secondary settlements debunks the notion of a housing ladder, where low-income groups can climb to find affordable housing
options in developed neighborhoods of opportunity, where residents' life chances are better. Of course,
some low-income Blacks move to affluent areas, but few housing options exist in these localities. Thus,
these high-end communities can accommodate only a small number of low-income renters.

46 | P a g e
The hard reality is that rising home prices and rents will continue to keep most Blacks out of Buffalo's high-demand neighborhoods and threaten those Blacks currently living in them with
displacement.42 Even on the East Side, Blacks are being pushed out of "neighborhoods of opportunity."
For example, those Black neighborhoods near Main Street, including the Fruit Belt, are being slowly
emptied. Since the 1970s, the City has targeted this area for higher-valued uses. Thus, the Black population
has been gradually pushed out (Figure 13).43 Figure 13: Population Change in Buffalo over Forty years
Source: Census Bureau. Decennial Census, 1970-2010. U.B. Center for Urban Studies.
Rent gouging and Low-Quality Housing Units
The limited housing choices make East Side residents easy prey to the predatory actions of property
owners. A pioneering study by Princeton's Matthew Desmond and MIT's Nathan Wilmers found that
property owners used rent gouging to generate hyper-profits from their rental units.44 Rent gouging is a form of exploitation in which property owners overcharge tenants relative to the value and quality of the
dwelling unit they are renting. The landlords enrich themselves by neglecting housing maintenance while
charging exorbitant rents. The lowered housing maintenance, in turn, depresses property values in the
neighborhood, and the reduced tax assessments further increase the property owners’ net rent. Rent gouging
works in underdeveloped communities because tenants have limited housing options. This rootedness in
underdeveloped neighborhoods makes them easy prey to predatory property owners.45 Of course, we recognize that maintenance costs in these underdeveloped neighborhoods are high, owing to aging housing
stock, frequently missed payments, and high turnover rates.
Even so, these issues do not justify rent gouging on Buffalo’s East Side. Scholars Russell Weaver
of Cornell and Jason Knight of Buffalo State College used a methodology to Desmond and Wilmers to
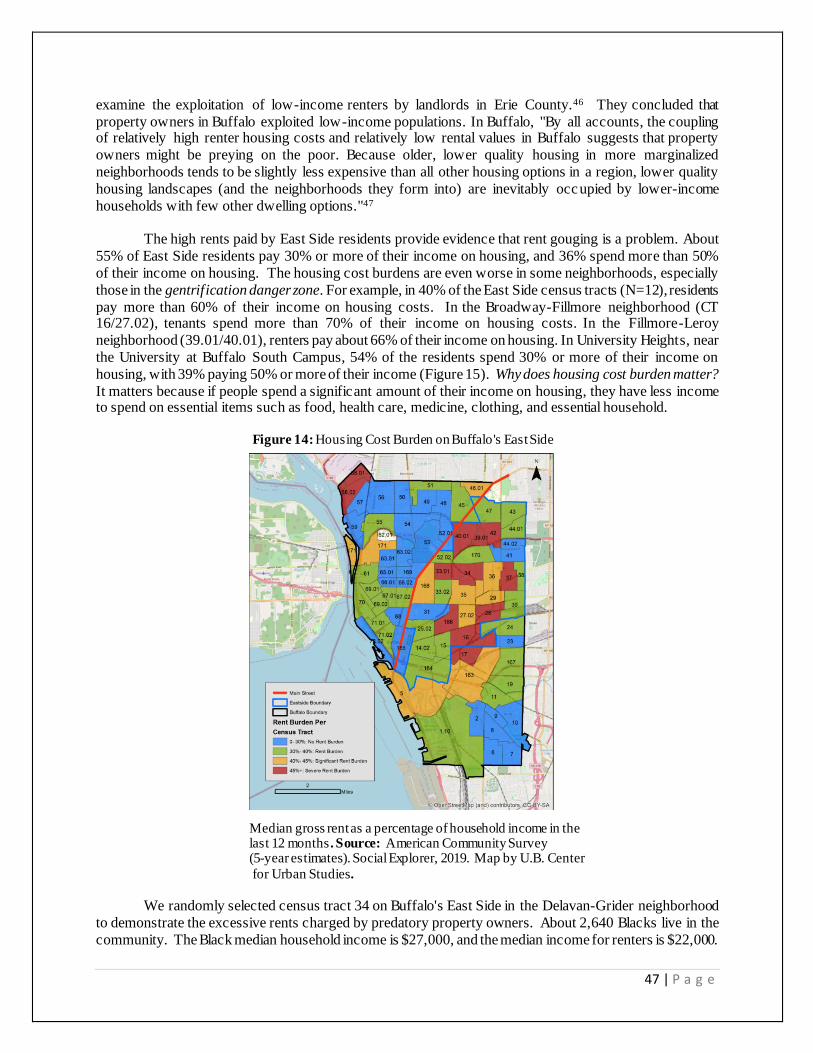
47 | P a g e
examine the exploitation of low-income renters by landlords in Erie County.46 They concluded that
property owners in Buffalo exploited low-income populations. In Buffalo, "By all accounts, the coupling of relatively high renter housing costs and relatively low rental values in Buffalo suggests that property
owners might be preying on the poor. Because older, lower quality housing in more marginalized
neighborhoods tends to be slightly less expensive than all other housing options in a region, lower quality
housing landscapes (and the neighborhoods they form into) are inevitably occupied by lower-income
households with few other dwelling options."47
The high rents paid by East Side residents provide evidence that rent gouging is a problem. About
55% of East Side residents pay 30% or more of their income on housing, and 36% spend more than 50%
of their income on housing. The housing cost burdens are even worse in some neighborhoods, especially
those in the gentrification danger zone. For example, in 40% of the East Side census tracts (N=12), residents
pay more than 60% of their income on housing costs. In the Broadway-Fillmore neighborhood (CT 16/27.02), tenants spend more than 70% of their income on housing costs. In the Fillmore-Leroy
neighborhood (39.01/40.01), renters pay about 66% of their income on housing. In University Heights, near
the University at Buffalo South Campus, 54% of the residents spend 30% or more of their income on
housing, with 39% paying 50% or more of their income (Figure 15). Why does housing cost burden matter?
It matters because if people spend a significant amount of their income on housing, they have less income to spend on essential items such as food, health care, medicine, clothing, and essential household.
Figure 14: Housing Cost Burden on Buffalo's East Side
Median gross rent as a percentage of household income in the last 12 months . Source: American Community Survey (5-year estimates). Social Explorer, 2019. Map by U.B. Center
for Urban Studies.
We randomly selected census tract 34 on Buffalo's East Side in the Delavan-Grider neighborhood
to demonstrate the excessive rents charged by predatory property owners. About 2,640 Blacks live in the
community. The Black median household income is $27,000, and the median income for renters is $22,000.

48 | P a g e
The median gross rent in the neighborhood is $735 or $8,820 yearly. Approximately 60% of these renters
spend 30% or more of their income on housing, with 47% spending 50% or more of their income on housing. The median value of an owner-occupied house in the neighborhood is $60,400. If a tenant lives
in a unit that costs $735 and pays the same rent for seven years, they will expend $61,740 in rent, enough
to purchase a median-valued home in the neighborhood. These owner-occupied units are valued
significantly higher than rental units in this neighborhood. Thus, the profit margins on these rentals are
exorbitant. You could replicate this example in any East Side neighborhood. Predatory property owners have turned the East Side into a golden goose of profitability.
Housing Conditions
Rent gouging by property owners to make excessive profits in underdeveloped neighborhoods
matters. This practice produces substandard rental housing units in cities like Buffalo, which has an aging
housing stock. The reason is that landlords make money by ignoring maintenance and charging high rents. This decision leads to the proliferation of substandard and inadequate housing on the East Side, contributing
to health issues. Substandard and inadequate housing typically has leaky roofs, broken windows, peeling
paint, debris, leaky pipes, and other signs of deferred maintenance, such as porches in need of repair. Such
houses are often rodent and pest infested and plagued with mold, moisture, and extreme fluxation of
temperature—cold in winter and hot in summer. Damp, cold, and moldy housing is associated with asthma and other respiratory diseases. Basement flooding and water leaks are a problem in these older, substandard
homes and damp houses spawn mites, roaches, respiratory viruses, and modes, all of which play a role in
respiratory disease pathogenesis. Old, dirty carpeting, often found in substandard housing, is a source of
dust, allergens, and toxic chemicals. Exposure to these agents can cause respiratory, neurological, and
hematologic (blood-related) illnesses. Lead in pipes leading into the housing can cause water contamination
and lead poisoning, while electrical issues can cause a fire. 48
There is no good data on East Side housing conditions. Studies do not distinguish between renter
and owner-occupied housing units. Most studies use a windshield analysis of exterior conditions to evaluate
housing. While imperfect, this approach does provide insight into the quality of East Side housing units. In
2016, the City surveyed 70,500 housing units. About 77% of the units ranged from average to severe distress. On the East Side, most residential structures are moderate to severely distressed (Figure 15).
The City government is not a neutral bystander in this situation. It does not aggressively enforce existing
housing laws or develop new regulatory mechanisms to improve housing quality. Also, it does not
adequately invest in maintaining the physical infrastructure of neighborhoods (sidew alks, curbs, streets,
vacant lots, and abandoned properties). Consequently, substandard housing conditions and an unkept physical infrastructure contribute to the health challenges of East Side residents.

49 | P a g e
Figure 15: Exterior Condition of Residential Structures in Buffalo
Source: Buffalo Housing Opportunity Strategy, 2016.
To deepen our understanding of how these predatory activities underdevelop the East Side and spawn undesirable health outcomes, we conducted a random windshield survey of 20 neighborhood streets
[fronting blocks] (Figure 16).

50 | P a g e
Figure 16: Map of Randomly Selected Streets
Source: U.B. Center for Urban Studies.
We then developed a Healthy Neighborhood Rating Scale to evaluate housing and neighborhood conditions (Table 14 and 15). According to the rating scale, the highest score a
fronting block could receive was 70, and the lowest was 14. The rating scale examined housing,
physical infrastructure (streets, sidewalks, curbs, handicap accessibility, and lighting), green
infrastructure (trees, gardens, bushes, etc.), mood or visual image, transit connectivity, and
proximity to food centers and polluting centers, such as major transportation arteries. The evaluation focused on ranking a housing unit's physical condition by appraising the following
variables: the roof, sidings/outdoor paint, window, doors, porch, driveways, and landscaping at
the housing level. The evaluation connected virtual analysis to ground-truthing assessments.
Scores that fall in the "Poor" to "Very Poor" category illustrate a built environment that does not
support a healthy and supportive neighborhood for its residents.

51 | P a g e
Table 14: Healthy Neighborhood Rating Scale Variable Excellent (5) Good (4) Fair (3) Poor (2) Very Poor (1)
Housing 5 4 3 4 1
Vacancies /Abandonment 5 4 3 4 1
Streets 5 4 3 4 1
Sidewalks 5 4 3 4 1
Curbs 5 4 3 4 1
Handicap Accessible 5 4 3 4 1
Lighting 5 4 3 4 1
Green Infrastructure 5 4 3 4 1
Proximity to Pollutants (Highways) 5 4 3 4 1
Mood/Visual Image 5 4 3 4 1
Attractive Destination 5 4 3 4 1
Walkability 5 4 3 4 1
Proximity to bus stop 5 4 3 4 1
Proximity to Food Centers 5 4 3 4 1
Totals 70 56 42 28 14
Source: UB Center for Urban Studies.
The virtual analysis used google street view to evaluate the streets. At the same time, we
made field trips to select streets to reaffirm the virtual analysis. The data showed that housing and neighborhood conditions on Buffalo's East Side are poor (Table 14). Only four streets (fronting
blocks) ranked as fair, and the remaining sixteen were poor. This housing and neighborhood
conditions analysis shows that unkept vacant lots, poorly maintained sidewalks, lack of tree
coverage, abandoned houses, and poorly maintained dwelling units characterize many East Side
neighborhood streets. In the Martin Luther King, Jr. neighborhood, Marshall Street, located near the park, ranked the lowest (R-23) among the twenty randomly selected fronting blocks.

52 | P a g e
Table 15: Health Neighborhood Rating Scores
Source: U.B. Center for Urban Studies.
A satellite view of the street shows how the prevalence of vacant lots and the lack of tree coverage dominate the community (Figure 17). The lack of tree coverage combined with
proximity to major thoroughfares, railroad lines, and commercial establishments spawn pollution
and put residents at risk for respiratory problems. For example, The Kensington Expressway
(Route 33), Genesee Street, Sycamore Street, Broadway, Williams, Best, East Ferry, Delavan,
and Bailey Avenue bring an endless caravan of polluting vehicles through the East Side daily. This heavy traffic and the lack of a tree canopy, and massive vacant lots create health issues. This
view also shows how the numerous vacant lots or the random unbuilding of the neighborhood
disfigures the community.

53 | P a g e
Figure 17: Marshall Street—Satellite View, 2014
Source: Google Earth.
The street-level view of Marshall reveals the deplorable state of curbs and sidewalks and
how they contribute to a neighborhood setting that discourages recreational walking (Figure 18).
The streets lack curb ramps and pedestrian crossings recommended by Title II of the American
Disabilities Act. These are important because it is difficult for the visually impaired and persons
using a wheelchair, scooter, walker, or another mobility device to cross streets. The failure of the government to install them on many East Side streets forces wheelchair and other mobile device
users to use the roads instead of sidewalks, putting them in harm's way. For example, on June 20,
2016, Nyree Greene, a seven-month-old, was struck by a car and killed. Shannon Anderson
stepped off the curb and into the streets with her baby in a stroller because of the sidewalk’s
deplorable conditions. A car jumped the curb and hit them. Anderson was not seriously injured, but her baby was killed. The City immediately replaced the dilapidated sidewalk but left hundreds
of similar sidewalks intact across the East Side.49
House and yard maintenance are problematic. Landscaping is non-existent on this street.
There are no flower gardens or shrubbery. Some housing units are in fair to good condition, but most are moderate to severely distressed. The intermixing of abandoned and occupied residential
structures with unkept vacant lots contributes to a sense of being forlorn. The street has only a
few trees and offers no shielding against pollution or to heat island effects, making it hotter than
usual in the summer. Heat islands are urbanized areas that experience higher temperatures because
greenery, especially trees, shrubbery, and gardens, are missing. In these settings, buildings, roads,
houses, and other infrastructure re-emit the sun's heat, increasing temperatures. Thus, the absence of trees and shrubbery on the East Side causes the heat island effect throughout the community.50

54 | P a g e
Figure 18: Marshall Streets, Street View, 2014
Source: Google Earth Pro, 2021.
Not all housing and neighborhood conditions are poor on the East Side. In the Hamlin Park
neighborhood, Monticello Place, near Canisius College, had the highest ranking among the randomly
selected fronting blocks. A satellite view of the fronting block will provide insight into the locational
challenges facing the neighborhood. The street and its host neighborhoods are adjacent to Sisters Hospital
and near Main Street and the Scajactaway freeway (Figure 19). Thousands of cars, buses, and trucks pass
through these corridors weekly. Yet, from this bird's eye view, it is apparent that the street and neighborhood have little tree coverage. This weak green infrastructure means that air pollution and heat island effects are
problematic in the community.
Figure 19: Satellite View of Monticello Place, 2017
Source: Google Earth Pro. 2018.

55 | P a g e
The street-level view is more reassuring (Figure 20). The houses are in good condition and well-
maintained. There are almost no vacant lots, sidewalks are in good condition, and the lawns appear well-manicured. At the same time, there is an absence of landscaping, especially gardens, in the community.
The neighborhood does not have the high-quality visual amenities and hedonic features found in the more
upscale and developed West Side and suburban neighborhoods. Also, the lack of a tree canopy is
problematic. Figure 20: Monticello Street, looking southward, in Hamlin Park, 2017
Source: Google Earth Pro, 2021.
Still, this fronting block is more advanced than most East Side neighborhoods in an East Side
context. Monticello Place also illustrates the neighborhood diversity that exists on the East Side. However,
Marshall Street is more of an East Side norm than Monticello Place. This assessment brings us to the
conclusion that housing and neighborhood conditions on the East Side do not support its residents' mental, physical, and social well-being. Our observations focused only on the external state of these East Side
homes, and we could not separate rental from owner-occupied units.
However, approximately 61% of the East Side housing units were built in 1939 or earlier. The
combination of old houses, poor maintenance, and no upkeep is toxic. Therefore, many of these housing units, especially rental housing, are at disproportion risk of containing lead paint, water intrusion, mold,
moisture, pest infestation, sources of indoor air pollution, extreme temperatures (hot in summer and cold in
winter), injury and safety issues, heating, plumbing, and electrical deficiencies, and generators of toxic
stress. Meanwhile, the condition of sidewalks and prevalence of vacant lots, and absence of neighborhood-
scaled goods and services keep most East Side locales from being walkable communities.
The East Side, Homeownership, and Wealth Production
Racial residential segregation spawn neighborhood conditions that devalue Black homes and turn
homeownership into a tool for producing debt instead of wealth. Even so, homeownership anchors the East
Side community, although only 37% of Blacks own their homes. As mentioned earlier, in market-based societies, home value is the hub that catalyzes neighborhood development. This principle holds even in
underdeveloped communities of color. To gain insight into the role of homeownership in East Side
neighborhood development, we divided the locale into residential quads based on the median value of
owner-occupied housing units (Figure 21). In this investigation, the census tract was the unit of analysis,
which we correlated with the City of Buffalo's planning neighborhoods.

56 | P a g e
Figure 21: East Side Residential Quads based on Median Home Value
Source: U.S. Census Bureau. American Community Survey
5-year estimate). Social Explorer, 2019. Map by Center for Urban Studies.
Owner-occupied housing units are scattered across the East Side. Every East Side neighborhood
has a core of homeowners, although the ratio of the renter to owners varies. The median value of owner-
occupied housing units is only $58,000. Still, housing values range across the East Side. The highest
valued homes cluster around the University at Buffalo South Campus (University Heights, Kensington-
Bailey), Main Street (Fillmore-Leroy), Sisters Hospital-Canisius College (Hamlin Park), the Buffalo-Niagara Medical Campus (the Fruit Belt), and downtown Buffalo (Pratt-Willert and Ellicott). Thus,
proximity to Main Street, universities and hospitals, and downtown add value to the property. These
localities are also in Buffalo's gentrification danger zones, making them unstable communities where low-
income residents are at risk of increased housing costs, eviction or forced moves, and displacement.
Overall, home values decrease with distance from Main Street, primarily east of Route 33. At the same time, except for Kenfield and Schiller Park, moderate value houses are situated along Buffalo's eastern
border, adjacent to the Cheektowaga border. Thus, on the East Side, homeownership is the neighborhood
anchor in every community. However, no clustering exists among these owner-occupied housing units.
Therefore, owners and renters share residential space in every neighborhood, linking their financial
destinies (Figure 23).
Examining the sharing of residential space between renters and owners in the King Urban Life
community in the Broadway-Fillmore neighborhood provides insight into the impact of rental housing units
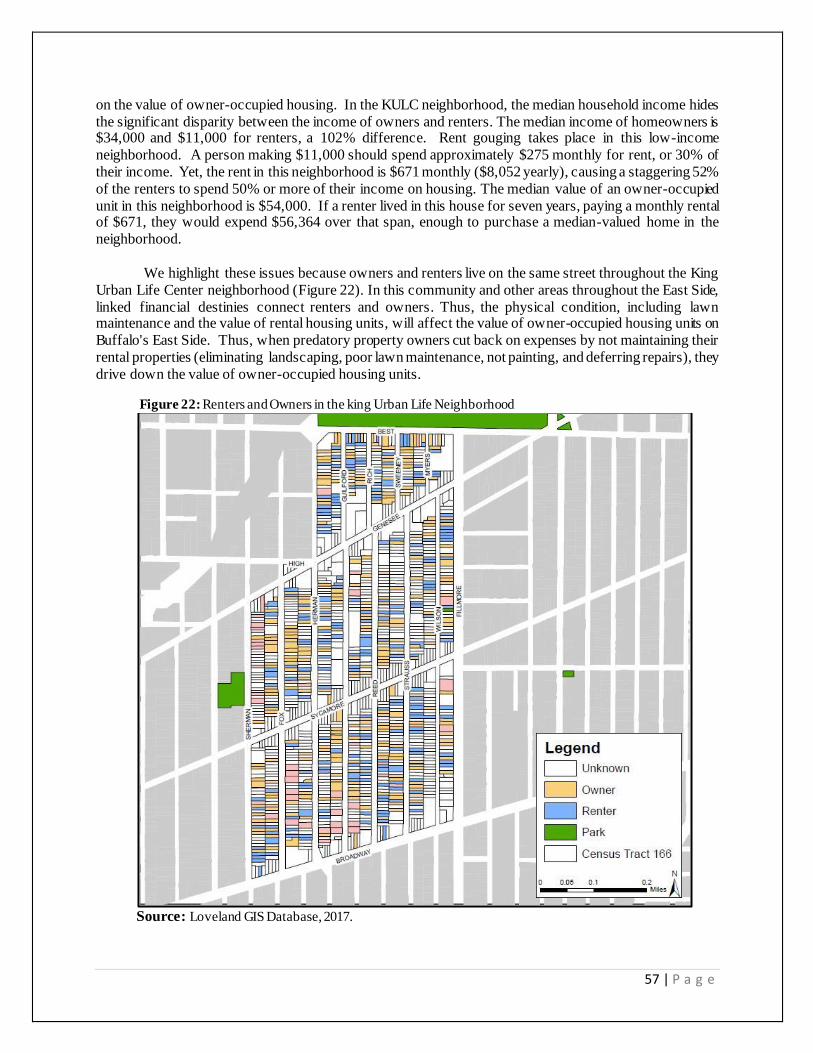
57 | P a g e
on the value of owner-occupied housing. In the KULC neighborhood, the median household income hides
the significant disparity between the income of owners and renters. The median income of homeowners is $34,000 and $11,000 for renters, a 102% difference. Rent gouging takes place in this low-income
neighborhood. A person making $11,000 should spend approximately $275 monthly for rent, or 30% of
their income. Yet, the rent in this neighborhood is $671 monthly ($8,052 yearly), causing a staggering 52%
of the renters to spend 50% or more of their income on housing. The median value of an owner-occupied
unit in this neighborhood is $54,000. If a renter lived in this house for seven years, paying a monthly rental of $671, they would expend $56,364 over that span, enough to purchase a median-valued home in the
neighborhood.
We highlight these issues because owners and renters live on the same street throughout the King
Urban Life Center neighborhood (Figure 22). In this community and other areas throughout the East Side,
linked financial destinies connect renters and owners. Thus, the physical condition, including lawn maintenance and the value of rental housing units, will affect the value of owner-occupied housing units on
Buffalo's East Side. Thus, when predatory property owners cut back on expenses by not maintaining their
rental properties (eliminating landscaping, poor lawn maintenance, not painting, and deferring repairs), they
drive down the value of owner-occupied housing units.
Figure 22: Renters and Owners in the king Urban Life Neighborhood
Source: Loveland GIS Database, 2017.

58 | P a g e
The City's failure to maintain vacant lots contribute to the devaluation of owner-occupied housing
in many East Side neighborhoods. This satellite view of the King Urban Life neighborhood shows how unkept vacant lots can negatively impact the value of owner-occupied housing (Figure 23). Thus,
underdevelopment drives down East Side housing values and prevents homeownership from becoming a
wealth production tool.
Figure 23: Vacant lots, King Urban Life Communities and Adjacent Neighborhoods
Source: Google Earth Pro, 2021.
A system of predatory inclusion victimizes Blacks. In Buffalo and Erie County, the conflation of
race and risk to property values result in Blacks homes being valued less and appreciating at lower rates
than White homes. Added to this is the city building practice of land banking that institutionalizes and
normalizes unkept vacant lots in East Side neighborhoods. The City seems to be taking property off the market and keeping it from being developed or used. This practice inflates the price of the remaining land
and stalls development. This reality poses the question, “what would be the real value of a lot on the West
Side if all the land on the East Side was available to develop or be transferred to developers at no cost?
Moreover, the City's aggressive foreclosure policies have kept the proportion of Black homeowners from growing. In 2018, the U.B. Center for Urban Studies outlined the City's aggressive
foreclosure process in the Black community as problematic.51 Thus, there has been no meaningful change
in the Black homeownership rate over the past thirty years. In 1990, 33% of Blacks owned their home.
Today, it is 32%. At the same time, rent gouging is a force that increases the hardship on Blacks while
being a source of profits for landlords. Collectively, the devaluation of Black owner-occupied homes and
rent gouging siphons off millions from the Black community.
Thus, housing values on Buffalo's East Side are the lowest in Buffalo and Erie County. For
example, we created a map of census tracts with homes with a median value of $150,000 and more. Not a
single East Side census tract appeared on the map (Figure 24). Indeed, only three census tracts on the East
Side have median house values greater than $100,000. These East Side neighborhoods are Pratt-Willert
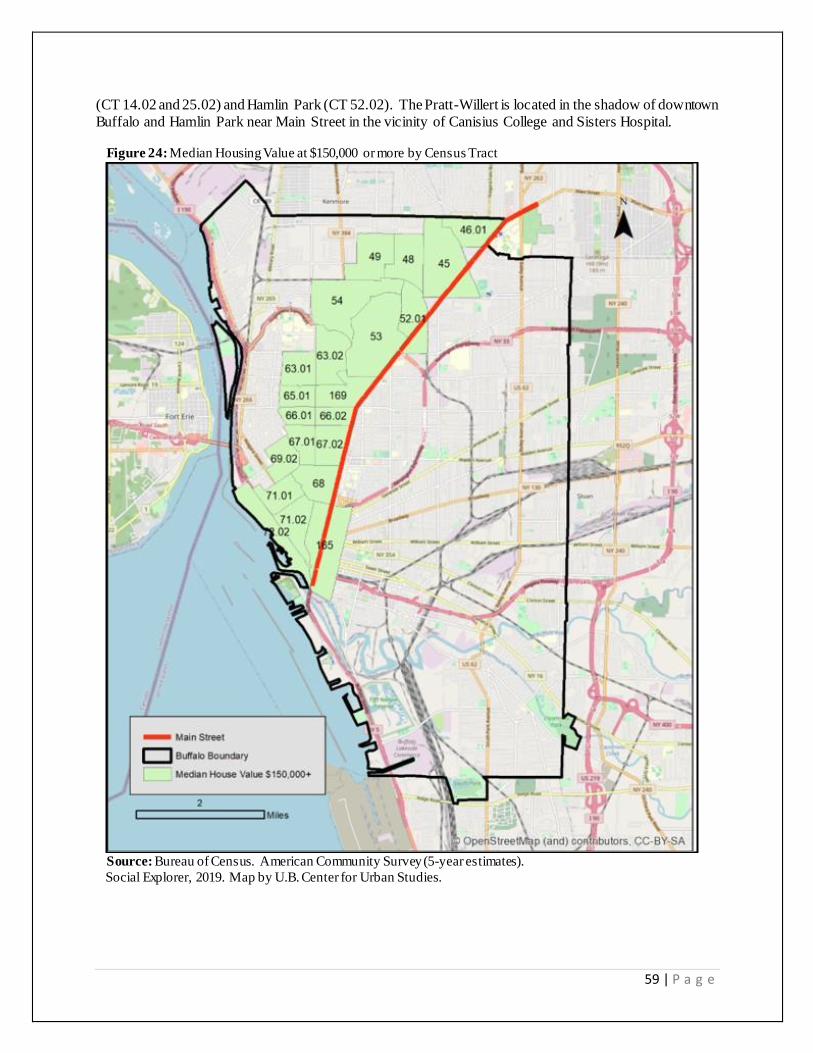
59 | P a g e
(CT 14.02 and 25.02) and Hamlin Park (CT 52.02). The Pratt-Willert is located in the shadow of downtown
Buffalo and Hamlin Park near Main Street in the vicinity of Canisius College and Sisters Hospital. Figure 24: Median Housing Value at $150,000 or more by Census Tract
Source: Bureau of Census. American Community Survey (5-year estimates).
Social Explorer, 2019. Map by U.B. Center for Urban Studies.
60 | P a g e
Health and the Neighborhood
The economic, housing, and neighborhood issues identified in this report matter because poor
health is the top problem facing Black Buffalo. The State of Black Buffalo Project did not discuss the health
status of the African American community. However, it did indicate that a correlation existed between
neighborhood conditions and the unwanted socioeconomic outcomes found in the Black community. It
theorized that the geographic concentration of problems in the Black community represented the institutionalization of social pathologies.
A decade later, in 2000, the U.B. Center for Urban Studies released a landmark study on the Health
Status of the Near East Side Black community. It stressed that a relationship existed between the built
environment and undesirable health outcomes in the Black community. It concluded, "Although the heart
of western New York's health care industry is located on the Near East Side, the neighborhood setting still creates huge obstacles, which makes developing and maintaining a healthy lifestyle extremely difficult. Put
simply, the physical environment places African Americans at a greater risk for morbidity and mortality
than people who live in other locations."viii Fifteen years later, the U.B. Center for Urban Studies in a health
needs assessment of the Black and Latinx communities concluded, “There is a direct connection between
housing and neighborhood conditions and the undesirable health outcomes found in the black and Latino neighborhoods.”ix
Financial insecurity, stressful living, and adverse neighborhood conditions are social determinants
of undesirable health outcomes in the Black community. According to the Robert Woods Johnson
Foundation, neighborhood conditions account for 80% of the health outcomes among people. In comparison, 20% are associated with access to health care and quality of treatment. This theory means that
neighborhoods are significant generators of undesirable health outcomes among Blacks. This perspective
helps to explain Erie County’s unacceptable health outcomes. In 2021, the Robert Wood Johnson County
Health Rankings placed Erie County in the bottom half of a health quadrant, ranking health outcomes in 62
New York counties. The County Health Rankings Model used the length and quality of life variable to determine a county’s placement on the health quadrant. The length of life rankings stressed premature
death, while the quality of life rankings assessed a person’s good and bad health days.52
We posit that Erie County’s low health ranking resulted from the health status of African
Americans. Significant health disparities exist between Blacks and Whites. The reason is that they live in
separate and unequal neighborhoods. In Black Buffalo, deplorable housing and neighborhood conditions combined with economic marginality spawn undesirable health outcomes. The most recent data on the
health status of African Americans support this viewpoint (Table 16). The Erie County Health Indicators
by Race and Ethnicity (2015-2017) lists over forty variables. However, we will highlight only four
indicators to illustrate the severity of the health challenges of African Americans: premature death and
years of potential life lost, low birth weight, infant mortality, and asthma hospitalization rates. We selected these variables because they highlight the health status of Black women and children. Also, they
demonstrate that these deplorable health outcomes represent a social tragedy in Black Buffalo.
The first indicator highlights premature death. The Erie County Health Indicators consider any
death at or before age seventy-five as premature. Premature death is measured by the Years of Potential Life Lost (YPLL). It is the accumulation of years of life annually lost by people who die at or before
viii Center for Urban Studies (2000). The Health Status of the Near East Black Community: A Study of the Wellness and Neighborhood Conditions, Buffalo, N.Y. xxiii ix Center for Urban Studies (2014). Striving for a Healthier Buffalo: A Community Health Needs Assessment for the
Greater Buffalo United Ministeries. Xii.

61 | P a g e
seventy-five years. Thus, if a person dies at age seventy, they contribute five years. In comparison, a person
dying at age twenty contributes fifty-five years.
Table 16: Select Erie County Health Indicators by Race/Ethnicity, 2016-2018
Health Indicators White Black Hispanic Asian
% Premature Death (<75 years) 36.10% 60.30% 70.00% 52.00%
Years of Potential Life Lost per 100,000 pop* 6,371.7 11,940.8 7,382.8 2,198.6
% Low Birthweight Births (<2500 grams) 7.10% 14.20% 10.90% 8.50%
Infant Mortality per 1000 Live Births 4.7 11.3 8.9 1.1
Diseases of Heart Mortality per 100,000* 173.6 208.9 117.5 77.7
(Stroke) Mortality per 100,000* 32.7 47.7 34.4 36.0
Coronary Heart Disease Mortality per 100,000 111.4 137.3 77.7 51.2
Diabetes Mortality per 100,000* 19.6 44.5 24.3 2.6
Diabetes (primary diagnosis) Hospitalization per 10,000* 12.5 49.8 32.4 5.2
Female Late Stage Breast Cancer per 100,000, (2011-2013)* 41.4 61.1 37.2 40.6
Cervical Cancer Incidence per 100,000 (2011-2013)* 6.8 11.5 NA NA
Asthma Hospitalization per 10,000, age 0 -17 10.2 46.9 34.6 14.4
Chronic Lower Respiratory Disease Hospitalization, per 10,000 18.0 54.2 34.4 14.0
* age adjusted
Source: New York State Department of Health
Source: County Health Indicators by Race/Ethnicity, 2016-2018.
In 2016-2018, Blacks lost over 5,000 more years of potential life than Whites. These years of potential life lost are a social tragedy, not simply because someone died before their time, but because these
are stolen years that robbed a community of what might have been. Premature death is a story about
breaking up families, losing mothers and fathers, sons and daughters, boyfriends and girlfriends. It is a
saga about that great leader who died before ever realizing her potential. It is a tale about that fantastic
artist who died before learning how to paint. It is a narrative about a brilliant scientist who would have saved millions had she not died at birth. And it is a chronicle about that prodigal son who never had a
chance at redemption.
The next indicators are low-birth-weight babies, infant mortality, and asthma hospitalizations.
These health indicators are significant because of the long-term health effects they can have on children.
Low-birth rates refer to babies that weigh less than 5.5 pounds when they are born. Birth weight matters
because infants with low birth weights are at risk of having health problems throughout their lives. For this
reason, the County Health Rankings consider low-birth-weight a quality of life issue. In Erie County, the
percent of low-birth-weight babies among Blacks was a staggering 14.2%, significantly higher than the low-birth-weight rate of Whites. Significantly, these are the numbers you would expect to find in a third-
world country. For example, in 2015, in Latin America and the Caribbean, the low-birth-weight per
100,000 live births was 8% in Brazil, 10% in Columbia, and 15% in Jamaica.53
The Erie County infant mortality rate was also at third-world levels. The Black infant mortality rate per 1,000 live births for the 2016-18 period was 11.3, significantly higher than the White infant
mortality rate and similar to rates found in Latin America. For example, according to the World Bank, in
2019, the infant mortality rate per 1,000 live births for Jamaica was 12, Panama 13, Nicaragua 14, Costa

62 | P a g e
Riva 8, and 4 in Cuba.54 The final health indicator is the asthma hospitalization rate per 10,000 from birth
to seventeen years. Asthma is significant because of its relationship to environmental and housing issues and its impact on young people. Among children, asthma drives school absenteeism, social isolation and
reduces the quality of life. There was a 127% difference between the asthma hospitalization rate of Blacks
and Whites.
The hard reality is that Blacks live in a first-world country, but they have the health outcomes of a third-world nation. The economic marginality of Blacks, and their concentration in underdeveloped
neighborhoods, drive their poor health. For example, over 70 % of the Erie County Department of Health
clinic patients come from five East Side zip codes (Figure 25). Thus, the social determinants of health
produce the barriers and challenges to being healthy in the Black community. These social determinants
refer to the conditions in the environment where people are born, live, work, play, and age. They are
reflected in issues such as poor quality of housing and high rents paid by tenants, the food deserts, unkept sidewalks that discourage recreational walking, the lack of access to affordable, healthy foods and health
access difficulties, and the crime and violence spawned by life on the economic edge.55
Figure 25: Concentration of DoH* Clinical Patients
Source: Erie County Community Health Needs Assessment
2019-2022 (*DoH-Department of Health). Map by U.B. Center for Urban Studies.

63 | P a g e
Conclusion
The Root Problems Facing Black Buffalo
The findings of this study indicate that six-root problems are facing Black Buffalo. These are the
root problems that Black Buffalo must solve to make progress over the next thirty-one years.
1. Racial Residential Segregation. The driving force behind the challenges facing Black Buffalo is
racial residential segregation. The Buffalo and Erie County population are segregated based on house value and social class exclusivity, measured by income and educational attainment. House
value, in turn, becomes the hub that catalyzes neighborhood development, including the growth
and development of commercial corridors or neighborhood centers. Segregation traps Blacks in
low-value, marginalized, and underdeveloped neighborhoods. These neighborhoods, in turn,
become the sites of predatory inclusion, public sector underdevelopment, profiteering, and exploitation. To counter racial residential segregation, we must fight to open all neighborhoods
throughout Erie County to low-income residential development while simultaneously transforming
and turning the East Side into an excellent place to live, work, and raise a family.
2. The Underdevelopment of East Side Neighborhoods . The challenges facing Black Buffalo are
inextricably tied to East Side neighborhoods' physical and socioeconomic conditions. These problems stem from the harsh reality that East Side Blacks build their community on lands someone
else owns and controls. Consequently, Black East Siders have no meaningful voice in the
development of their community. Moreover, the failure of local government to prioritize East Side
development and engage in the process of comprehensive planning and development exacerbates
the issue. Seven issues need highlighting: quality of rental units, rent gouging, unkept vacant lot, the lack of a tree canopy, poorly maintained sidewalks, homeownership, and social determinants
of undesirable health. The housing problem is the most challenging neighborhood problem
confronting African Americans. The low quality of housing and rent gouging characterize the
problem. A failed housing market on Buffalo’s East Side is responsible for the existence of these
conditions. Market failure means that the market-driven housing outcomes cannot provide low-income residents with good quality housing at affordable prices, less than 30% of their incomes.
The social critic and Cornell University professor, Noliwe Rooks, coined segrenomics to
conceptualize the profiteering in segregated Black communities, such as the East Side.
a. Quality of Rental Units. Low-quality rental housing is the linchpin in the
underdevelopment of Black Buffalo. More than 60% of East Siders are renters, and rental properties dot the East Side landscape. The quality of many of these units is inferior, and
the conditions inside them are unhealthy. Strategies that focus exclusively on new builds
create illusions of progress when they are nothing but little Band-Aids put a big problem.
The City must tackle the low-income housing problem head-on. It starts with significantly
improving the existing rental housing stock . Such activities will require changes in housing court, aggressive enforcement of existing building codes on rental properties, and the
seizure of rental units from property owners that do not comply. The non-profit sector must
drive the development and management of low-income housing. The City must find a
method of subsidizing low-income rental properties. The incomes of tenants are too low to
support rents sufficiently high to cover maintenance and upgrades. The private sector could
establish a special housing fund to help support his effort. Additional funds could be generated with hospitality taxes and hotel occupancy taxes. The significant point is the

64 | P a g e
City must find a way to develop such a fund. The goal should be to lower rents to 20% of
a low-income person’s income.
b. Rent Gouging. The low quality of rental housing is directly linked to rent gouging. The
housing cost burden is a significant East Side problem. Over 55% of East Side Blacks pay more than 30% of their income on housing, and 36% spend more than 50% of their income
on housing. If these residents paid only 20% of their income on housing, they would have
significantly more disposable income. There are even some census tracts where tenants
spend 70% or more of their income on housing. Moreover, the lower one’s income, the
greater their housing cost burden. Predatory property owners, to intensify their profits,
defer maintenance. Thus, on the East Side, the quality of rental properties goes down, and rents go up. Rent gouging should be outlawed and efforts made to get rents down to 20%
of a low-income person’s income. However, this will not happen without the development
of a public sector subsidy fund. Low-income populations cannot pay rents sufficiently high
to offset maintenance costs. The private sector must participate in such an effort, and the
City needs to examine creative ways to generate taxes to support a fund, such as hospitality and occupancy taxes.
c. Unkept vacant lots. Thousands of vacant lots dot the East Side, demonstrating the massive
unbuilding that has taken place in this community. The problem is that many of these
vacant lots depress property values because owners, including the City, do not develop or
maintain them. Moreover, these parcels represent a disfiguring of the urban environment. In neighborhood after neighborhood, these unkept lots are a big problem that thwarts
community development. Resolving this problem must become a top City priority.
d. The East Side Land Bank . The City turned the East Side into a land bank that took
thousands of vacant parcels out of circulation until they could be sold or developed. The
goal is vacant lot management, not development. However, the City even minimizes vacant
lot management because it aims to sell them at a profit. A casual googling of vacant land for sale in Buffalo illustrates the problem. For example, Zillow lists an unkept vacant lot in
the Fruit Belt at 24 Locust Street, near Odell Street, at $235,000. The owner will hold this
property until sold to the highest bidder, regardless of the community impact. For the same
profit-making reason, the City holds onto its publically owned vacant lots. The
neighborhood planning principle should shift from vacant lot management to vacant lot development. Every neighborhood should be given the opportunity and resources to
develop the vacant land in their community.
e. Lack of a Green Infrastructure. Major thoroughfares crisscross the East Side. Thousands
of cars, trucks, buses and other polluting vehicles move through the neighborhood daily.
The Kensington Expressway (Route 33), Genesee Street, Sycamore Street, Broadway,
Williams, Best, East Ferry, Delavan, and Bailey Avenue bring an endless caravan of polluting vehicles through the East Side daily. The location of many commercial and
industrial establishments in the community adds to its pollution. Yet, the absence of a
green infrastructure gives the East Side no protective covering. Thus, every neighborhood
is subject to the heat island effect and pollution. The population is at increased risk of
respiratory disease. Developing and maintaining an East Side green infrastructure should be a top City priority.
f. Poorly Maintained Sidewalks. The East Side sidewalk infrastructure is poor. On most
streets, the sidewalks are in horrible condition. Most of them do not even have curb ramps

65 | P a g e
and pedestrian crossings. These are important because their absence makes it difficult for
the visually impaired and persons using a wheelchair, scooter, walker, or other mobility devices to cross streets. Most East Side sidewalks are also impassable during winter. This
blockage forces many wheelchair users and pedestrians to use the streets, placing them in
harm’s way. The sidewalk situation also discourages recreational walking, indirectly
contributing to the obesity problem.
g. Low-value Homes. Only approximately 32% of East Siders own their homes, and the
median value of owner-occupied homes is only about $58,000. Many homeowners' challenge is that their dwellings are sandwich betwixt and between poorly maintained
rental properties and unkept vacant lots. Housing values will never appreciate in these
settings. Thus, in many East Side neighborhoods, homeownership is a producer of debt,
not wealth. The City must force property owners to improve their rental housing while
simultaneously developing the unbuilt lots to bolster property values. Also, given the low incomes of many residents, homeownership is not a realistic option. Still, residents should
pursue many other forms of collective ownership, such as condominiums, co-housing, and
similar forms of joint ownership.
h. Social Determinants of Undesirable Health Outcomes. Health challenges are the top issue
facing African Americans, and the social determinants of health are the culprit. Their
concentration inside the East Side Black community turns neighborhoods into producers of unnecessary disease and premature death. Therefore, you cannot address Blacks' health
problems without simultaneously turning the East Side into an excellent place to live and
work.
3. Structural joblessness. The interplay between education and labor market dynamics drives
chronic joblessness and low incomes in Black Buffalo. The knowledge economy produces a high- and low-wage labor market sector. Blacks are locked in the low-wage sector. Concurrently, the
availability of full-time, year-round jobs in the labor market is shrinking. Many Blacks cannot find
full-time work. They become seasonal, part-time, or gig workers. These part-time, gig, and
seasonal workers and those not in the labor force are growing. Concurrently, the number of Blacks
that are employed continues to shrink. It is important to remember that a worker must be searching
for a job to be unemployed. The double-digit unemployment rates mean that many Black workers are searching but not finding jobs. Moreover, even among the employed Blacks, a significant
number cannot find full-time employment. There are not a sufficient number of full-time, year-
round jobs for African Americans. We must find creative ways to expand the existing job base.
These employment challenges facing African Americans result from labor market failure. The
labor market is not producing a sufficient supply of full-time, year-round jobs that pay a living wage.
4. Low-wages. In the Greater Buffalo economy, the battle cry to end poverty is an empty slogan. It
has not and will not happen. Structurally, as previously mentioned, Buffalo’s labor market consists
of high and low-wage sectors. The low-wage sector contains numerous essential jobs. The best
jobs and opportunities require a Bachelor’s degree and higher or specialized training. These
educational requirements bar most Blacks from the road to higher-paying jobs. About 29% of the jobs in Erie County require a Bachelor’s Degree or higher. Only about 16% of Blacks have a
Bachelor’s Degree or higher. Given the correlation between schooling, educational attainment,
and jobs, Black and White schools' quality disparity make African Americans non-competitive in
the labor market. They become stuck in the low-wage sector. The household income of most Blacks
will range between extremely low, very low, and low, and they will remain concentrated in the
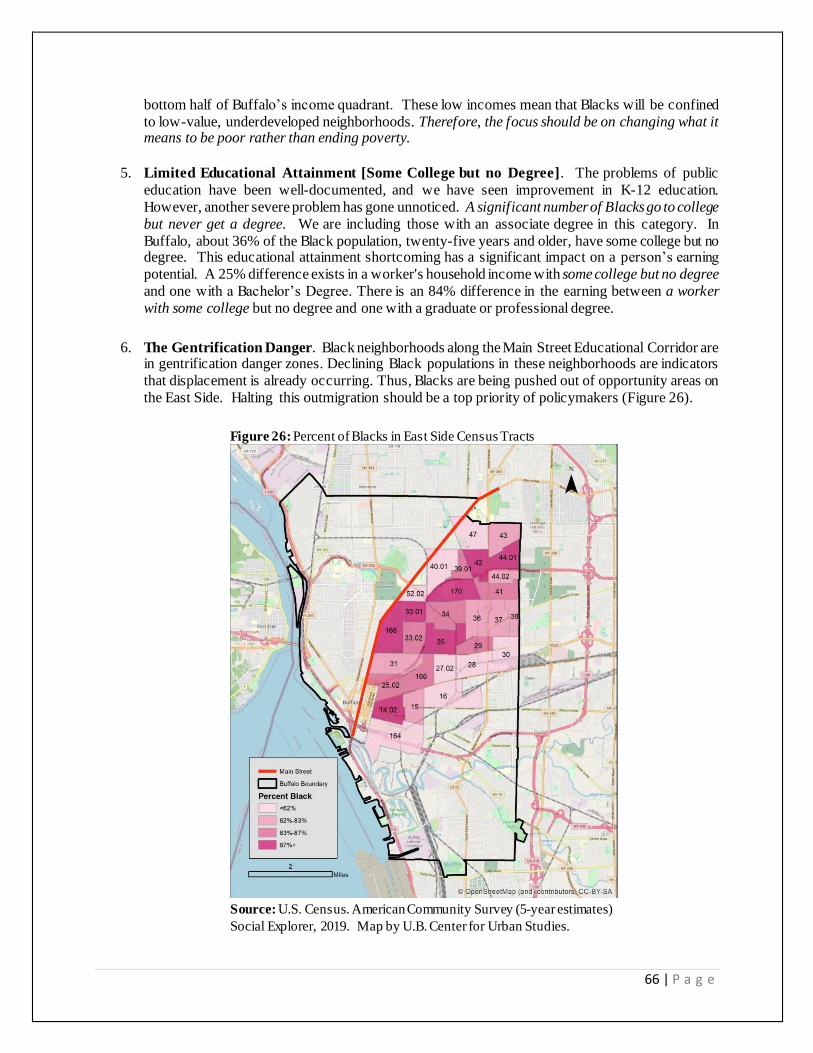
66 | P a g e
bottom half of Buffalo’s income quadrant. These low incomes mean that Blacks will be confined
to low-value, underdeveloped neighborhoods. Therefore, the focus should be on changing what it means to be poor rather than ending poverty.
5. Limited Educational Attainment [Some College but no Degree]. The problems of public
education have been well-documented, and we have seen improvement in K-12 education.
However, another severe problem has gone unnoticed. A significant number of Blacks go to college
but never get a degree. We are including those with an associate degree in this category. In
Buffalo, about 36% of the Black population, twenty-five years and older, have some college but no degree. This educational attainment shortcoming has a significant impact on a person’s earning
potential. A 25% difference exists in a worker's household income with some college but no degree
and one with a Bachelor’s Degree. There is an 84% difference in the earning between a worker
with some college but no degree and one with a graduate or professional degree.
6. The Gentrification Danger. Black neighborhoods along the Main Street Educational Corridor are in gentrification danger zones. Declining Black populations in these neighborhoods are indicators
that displacement is already occurring. Thus, Blacks are being pushed out of opportunity areas on
the East Side. Halting this outmigration should be a top priority of policymakers (Figure 26).
Figure 26: Percent of Blacks in East Side Census Tracts
Source: U.S. Census. American Community Survey (5-year estimates)
Social Explorer, 2019. Map by U.B. Center for Urban Studies.
67 | P a g e
7. Poor Health. The top problem facing African Americans is their poor health. They have
preventable diseases, and live in unhealthy environments, and die prematurely. These conditions result from the intertwining of medical racism with inadequate housing, neighborhood conditions,
and life on the economic margin. Poor health outcomes and neighborhood underdevelopment
march in tandem. The bottom line is that the houses and neighborhoods in which Blacks live are
killing them.

68 | P a g e
Reflections: Where Do We Go From Here?
The Black lament, “The harder we run, the further we fall behind,” seems appropriate for Black
Buffalo. They have not made progress over the past thirty-one years. Everything changed, but everything
remained the same. The State of Black Buffalo project warned that the socioeconomic plight of Blacks was
trending downward. The Black unemployment rate was 18% in 1990, and the average household income was $39,350 (constant dollars). Approximately 38% of Blacks had incomes below the poverty line. There
were more African Americans without a high school diploma than a college degree. About 33% owned
their homes, and the majority resided on Buffalo’s East Side. Against this backdrop, the Black Buffalo
project put forward a framework to guide the development of an action plan to halt the decline.
Thirty-one years later, the portrait of Black Buffalo remains unchanged. The unemployment rate is
in the double digits (11%), and the average household income is $42,000 (constant dollars). Approximately
35 % of Blacks have incomes below the poverty line, and 32% own their homes. There are still more Blacks
without a high school diploma than a college degree, albeit the ratio is tightening. Most Blacks are living
on Buffalo’s East Side, and conditions are worsening in many neighborhoods. The fate of Black Buffalo remains tied to East Side development. Everything changed but remained the same.
Since the release of African Americans and the Rise of Buffalo’s Post-Industrial City, 1940-Present
by the Buffalo Urban League in 1990, the City has had twenty-seven consecutive years of liberal democratic
rule. Both Anthony Masiello (1994-2005) and Byron Brown (2006-present), the City’s first Black mayor,
were immensely popular in the African American community. This reality poses the question, after twenty-seven consecutive years of liberal democratic rule, how could two liberal democratic mayors still leave in
their wake a Black community where African Americans remain stuck in underdeveloped neighborhoods,
trapped in poverty, low-paying jobs, inadequate and unaffordable houses, and have bodies ravaged with
disease and die prematurely?
The answer to this question is complex. We theorize that Blacks did not progress because City
leaders never developed a comprehensive action plan based on the root problems facing Black Buffalo.56
The City was also laxed in the fight against racial residential segregation. They never vigorously enforced
Fair Housing Laws or implemented the State of Black Buffalo action agenda.57 Instead, under successive
administrations, City leaders stressed economic development while marginalizing and underdeveloping the Black Community. Concurrently, their land banking strategy on the East Side essentially blocked
development in the Black community and pushed it to other parts of the city. For example, City leaders
focused on inner and outer waterfront development, downtown, the Buffalo Niagara Medical corridor, the
Main Street knowledge corridor, West Side neighborhood and North Buffalo development, and brownfield
reclamation in South Buffalo.58
This viewpoint does not suggest that the City should have minimized economic development.
Instead, it means that the City could have prioritized economic development and transformation of the
Black community. Doing both was the key to building a great and sustainable city. The City did not do
this. Instead, they marginalized East Side and unofficially declared it a “land bank.” The prime activity on
the East Side would be land clearance and assemblage for future development. Mayor Anthony Masiello created a neighborhood ranking system based on seven socioeconomic
variables to guide the City’s neighborhood development strategy. The ranking system, using a
neighborhood condition index, classified Buffalo communities as “Good,” “Fair,” and “Poor.” The City
targeted neighborhoods ranked as good and fair for reinforcement and revitalization. Leaders considered
them prime neighborhood development sites.59
69 | P a g e
The City ranked most East Side neighborhoods as “poor” and targeted them for reconstruction, a
euphemism for land bank. In these neighborhoods, demolition and land assemblage for future development were the prime activities. This ranking discussion below is the same type of language used to describe
urban renewal in the fifties. The City’s 1999 Master Plans states this strategy explicitly.
Neighborhoods ranked as “Poor” should be targeted for restructuring.
Restructuring entails addressing areas where there has been a significant loss of urban fabric and declining public amenities and infrastructure. Substantial
clearance and a related commitment to the management of vacant property is
necessary. Land assembled will create significant redevelopment opportunities.
The highest priority will be the clearance of vacant and blighting structures
(emphasis added) while emphasizing human service programs and maintenance of
remaining viable housing stock and economic development programs. There are likely to be major changes to the existing development pattern and average
densities.60
In some ways, the Massielo neighborhood ranking system represented a new approach to redlining.
The City literally drew up maps that ranked neighborhoods and then steered development away from the lower-ranked areas. That is repackage redlining. For example, in its land banking strategy, the City
emphasized the management of vacant lots rather than their development. It never tethered demolition to
comprehensive planning and community development, nor did the City implement an effective vacant lot
management program.
Consequently, the unkept vacant lot problem replaced the housing abandonment problem. The
City’s approach to land banking was not “land assembly,” as Massielo suggested. In contrast, the city just
left a moonscape of vacant and abandoned lots. Over the years, hundreds of houses and structures were
demolished, leaving thousands of vacant lots in their wake, most of them concentration on Buffalo’s East
Side. By 2020, there were over sixteen thousand vacant lots, including 13,672 residential, 2,623
commercial, 495 industrial, and 32 urban renewal in Buffalo. About 94% of these sites are on Buffalo’s East Side, or over 15,000 East Side vacant lots (Figure 27). The City of Buffalo owns about 59% of these
vacant properties, including 7,217 residential, 633 commercial, 85, industrial, and 21 urban renewal. Thus,
there are roughly 9,946 lots that the City has the power to decide how to use them. Of course, some of
these city-owned lots are parking lots, parts of parks or trails, or may even include privately-owned lots,
which are side yards for homeowners. However, field surveys and google satellite views of the East Side indicate that the unkept vacant lot issue is a significant problem on Buffalo’s East Side.61
Operating within this demolition and land banking framework, the City forged an East Side
commercial corridor strategy and a series of “cluster” development projectsx under the Masiello and Brown
administrations.62 The City based these projects on an incorrect theory of neighborhood growth and development. For example, they designed the commercial corridor strategy, theorizing that a robust
neighborhood center would catalyze market activities that would trigger the development of the surrounding
neighborhoods. The catalytic project theory purports that a project will cause a corresponding and
complementary development reaction on surrounding properties or communities.63 However, commercial
corridor development did not drive neighborhood development. The reverse happened. Neighborhood
development drives commercial corridor development. Theoretically, the economic dynamics in higher-income residential settings are different from those in low-income, marginalized and underdeveloped
x Cluster development projects is our term for a series of housing initiatives on the East Side, such as Sycamore Village, St. John’s low-income housing developments in the Fruit Belt and True Bethel’s housing initiat ives, along with the Central Park Plaza housing projects. We refer to them as cluster projects because they will not catalyze developments
beyond the cluster. They are symbolic gestures.

70 | P a g e
communities. We know of no underdeveloped community where commercial district development spawned
neighborhood transformation, except in gentrified communities. Pursuing commercial corridor development without first having housing development is putting the cart before the horse. In
neighborhoods developed for the low-income residents living there, the government and non-profit sectors
must drive the revitalization process, including strategic private sector investments. In these
underdeveloped settings, development must be intentionally driven by the non-profit sector and guided by
resident engagement and thoughtful planning. The City should work with the non-profit sector to identify outside planners willing to work under the leadership and direction of local groups.
Figure 27: Vacant Parcels in Buffalo, NY 2020
Source: Open Data. Map by Jason Knight, Buffalo State University, 2020.
The market-based catalytic project scheme does not work in these neighborhoods. There is no evidence to support the viability of the catalytic project theory in low -income, underdeveloped
communities. Even so, the catalytic project idea also informed the City’s “cluster” development strategy.
Across the East Side, the City developed a handful of such projects, including Sycamore Village, the St.

71 | P a g e
John’s Baptist Church projects, Central Park Plaza housing developments, and the True Bethel Baptist
Church projects. These are good projects, but they did not catalyze the surrounding neighborhoods’ development. In this sense, these were symbolic projects designed to generate optimism. The problem is
the projects were just symbols, empty promises the City never meant to be kept. All three projects received
significant support from the City.
The City substituted neighborhood collaboration, thoughtful planning, and neighborhood development for a scattered project and demolition strategy on the East Side. In this scenario, a combination
of demolitions, land banking, and the predatory actions of rental property owners overwhelmed the catalytic
project scheme. A careful look at public sector spending on the East Side over ten years shows the
destructive outcome of this predatory approach to development. The Buffalo Urban Renewal Agency
compiled a detailed database on public sector spending in Buffalo neighborhoods between 2006 and 2016.64
Most significant, this databased continued the street address where the demolitions, housing rehabilitation, and facilities occurred. The database also identified the specific facility that received funding and identified
the site where sidewalk and street improvements occurred. This detailed information made it possible to
precisely map the location of demolitions and other improvements, thereby assessing their impact on
neighborhood development. This database is a cumulative spending list. Thus, we have no idea of the
spending timetable over these ten years. Even so, this highly detailed database makes possible a fine-grain analysis of how the demolition and scattered project approach impacted East Side neighborhoods.
The Brown administration invested approximately $179 million on the East Side between 2006 and
2016. The spending centered on demolitions (33%), housing (28%), streets and sidewalks (13%), parks and
recreation (16%), and community facilities. The City did not use a neighborhood planning or community engagement strategy in making these expenditures. As a consequence, these investments did not spawn
any neighborhood upgrading. In contrast, this approach to East Side development exacerbated conditions
in many locales. A close look at the spending pattern in the Broadway-Fillmore and Martin Luther King,
Jr. neighborhoods will explain why. Martin Luther King, Jr. Park anchors the Martin Luther King, Jr. and
sections of the Broadway-Fillmore Neighborhoods. Between 2006 and 2016, the City spent approximately
$10,075,631 on the park, including one million on the Buffalo Museum of Science. This investment decision was a good one. However, the City did not pursue a strategy to improve residential conditions in
the neighborhoods surrounding the park. Consequently, the City’s bulldozer wreaked havoc in the
community (Figures 28 and 29).
The City did make modest investments in housing and neighborhood facilities. Still, their emphasis on demolitions overwhelmed and canceled out the positive gains from these investments. The abandoned
housing problem was a significant one. Nevertheless, demolitions without neighborhood collaboration,
thoughtful planning, and strategic residential upgrading spawned the underdevelopment of MLK and
Broadway-Fillmore neighborhoods. This approach to solving the housing abandonment problem created
another significant issue—the unkept vacant lot and neighborhood disfiguring problem. Examining the map below provides a visual illustration of the negative impact of this investment strategy on the King
Urban Life neighborhood in Broadway-Fillmore.

72 | P a g e
Figure 28: Public Investments in the King Urban Life Neighborhood: Broadway-Fillmore
Source: Buffalo Urban Renewal Agency, Public Expenditures for 2006-2016. Compiled by
Keith Lucas, 2017. Map by U.B. Center for Urban Studies.

73 | P a g e
Figure 29: Satellite View of the King Urban Life Neighborhood
Source: Google Maps. 2021.
The City used the same approach in the Martin Luther King, Jr. neighborhood, and the results were identical. Examining the expenditures made on Winslow Avenue and Box Street in the Martin Luther King,
Jr. neighborhood will provide additional insight into problems with this approach. The City invested
$416,765 on Winslow Avenue between Humboldt Parkway and Kehr Street, a two-block area.
Approximately 82 % of the funding went for demolitions, 11% for housing, and the City spent 7 % on street
resurfacing. However, thoughtful planning did not guide the investment decisions on Winslow. The City spent $46,000 on the rehabilitation of four houses in the 400 block of Winslow, between Kehr Street and
Fillmore Avenue.
Then, they spent $174,000 on demolishing twelve houses on the block, increasing the number of
unbuilt lots on that section of Winslow to thirty. Ignoring the deplorable condition of sidewalks, the City
spent $28,000 on resurfacing Winslow between Kehr and Moselle. After which, they moved on to the 300 block of Winslow and spent $171,000 on demolishing eleven houses without making any improvements on
the block. Thus, in this two-block area, the City rehabilitated four houses while knocking down twenty-
three. Meanwhile, they left the deplorable sidewalks intact while resurfacing a road.
The investments on Winslow Avenue did not upgrade the community (Figure 30). It was a zero-sum game. The unkept vacant lot problem replaced the abandoned housing problem. This type of
senseless planning did not have to happen. Given available City resources, they could have developed
the 400-block of Winslow before moving to another part of the street. For example, they could have made
additional housing improvements, replaced the sidewalks, and planted trees. However, the City did none
of these.

74 | P a g e
Figure 30: Winslow Avenue, Martin Luther King Neighborhood
Source: Google Earth Pro, 2021.
Winslow was not an anomaly. The situation was even worse on Box Street (figure 31). Between
2006 and 2016, the City knocked down thirty-four houses on Box Street between Moselle and Fillmore
Avenue. Vacant lots already plagued Box, and the City bulldozer exacerbated the problem. The City
demolished thirty-four structures along Box Street, but they made no investments in housing.
Figure 32: Box Avenue, Martin Luther King, Jr. Neighborhood
Source: Google Earth Pro, 2021.
They also expended $131,000 on street resurfacing but made no investments in sidewalks. There
is no reasonable explanation for this decision to resurface the streets rather than fix the sidewalks. The
sidewalks on Box Street are in terrible condition and lack curb ramps and pedestrian crossings. The story
was the same in every neighborhood, random and haphazard investments that did not lead to neighborhood
upgrading. The East Side did not just need demolitions. The East Side needed social and economic development, with demolitions being one component. Such a project required collaboration with
neighborhood residents, thoughtful planning, and strategic investments.
In contrast, the $179,000,000 moved through the East Side like water through a sieve, and the
demolitions wreaked havoc on East Side. These planning and spending decisions did not improve the
Martin Luther King, Jr. and Broadway-Fillmore neighborhoods. Instead, they contributed to these communities becoming the lowest-demand neighborhoods in Buffalo.65

75 | P a g e
Recommendations The findings of this study produced the following recommendations. The City should declare the
East Side a Neighborhood, Social, and Economic Development Zone and designate the Buffalo Center for
Health Equity to lead the effort to transform the East Side. The Center's first task should be establishing an
East Side Development Coordinating Committee (ESDCC) consisting of East Side tenants, homeowners,
business persons, and stakeholders, along with representatives from the City, County, and private sector. The ESDCC should establish a Neighborhood Advisory Board consisting of East Side tenants and
homeowners to oversee its activities. The ESDCC, in collaboration with the community, should formulate
and implement a plan to develop the East Side equitably.
Short-term Goals
1. The ESDCC should divide the East Side into neighborhood planning and development
districts. The coordinating committee should identify and prioritize neighborhood development activities according to each district’s socioeconomic needs. This approach prioritizes those
neighborhood districts with the greatest needs. Concurrently, the ESDCC and its neighborhood
collaborators should formulate development strategies based on each planning districts’
particularities.
2. The ESDCC should develop a plan to significantly improve the quality of existing East Side
rental housing units. The City must reimagine and recreate its existing building codes to dramatically improve the quality of rental housing units' exterior and interior conditions. The rental housing externalities (poor physical appearance, lack of painting, poor lawn and yard maintenance, etc.) depress property values and diminish the visual image of the neighborhood. Concurrently, poorly maintained housing units represent a serious health threat. The City must eliminate this needless danger to Black health. The ESDCC must tackle several critical issues, such as improving housing quality without increasing rents, to make this strategy work. Even so, it must be the ESDCC's top priority. The City must clearly distinguish between code enforcement for owner- and renter-occupied housing units and between rental units owned by people living in the neighborhood and those who reside elsewhere.
3. Rent gouging is the engine that drives the low-quality of rental housing. The ESDCC must
forge a plan to reduce the housing cost burden of East Side residents. This strategy will require developing a system to subsidize the rents of low-income tenants. One possibility is for the private
sector to establish a housing support fund. The City could also establish a hospitality sales tax and
a hotel occupancy tax to generate a public revenue stream dedicated to the housing support fund.
Another strategy is to reduce the property taxes of owners that lower rents on low-income tenants
while improving the quality of their units. The challenge is the incomes of most East Side tenants are too low to generate rents sufficiently high to cover maintenance and upgrades. Reducing the
housing cost burden of low-income residents is a challenging issue that the ESDCC must tackle
head-on.
4. The East Side needs a vacant lot development strategy. The City and County should collaborate
to fund a resident-controlled and administered Erie County Community Land Trust and give all
City-owned residential parcels to the land trust. The ESDCC and Community Land Trust would work with the neighborhood planning and development districts to develop the vacant lots within

76 | P a g e
comprehensive planning. Concurrently, the City should tether its demolition strategy to developing
East Side neighborhoods and have East Side demolitions operate under the ESDCC’s auspices.
5. The ESDCC must develop a green infrastructure to protect the population against vehicular
emissions and other airborne pollutants that create health hazards. There need to be extensive
planting of trees and shrubbery, particularly along the Kensington Expressway and streets with
heavy traffic, to protect residents against pollution and the heat island effect. On certain streets,
especially those with anchor institutions, the City should establish zero-emission corridors that limit
commercial delivery traffic and maximize the use of electric vehicles. Hospitals and other big East Side institutions should commit to electrifying their fleets to reduce the health impacts on their
operations on East Side residents.
6. The sidewalks on many East Side streets are in deplorable condition . Many do not even have
the curb ramps and pedestrian crossings recommended by Title II of the American Disabilities Act.
The City must prioritize East Side sidewalk development and ensure that all neighborhoods have curb ramps and pedestrian crossings.
7. The danger of gentrification exists in East Side neighborhoods situated along the Main Street
Education Corridor and near downtown Buffalo. The Black population is declining in these
neighborhoods of opportunity. Efforts should be made to stop the Black outmigration from these
communities while simultaneously creating opportunities for African Americans to move back into
them.
8. Undesirable health outcomes are the top problem facing East Side Blacks. The implementation
of the above recommendations should lead to improved health outcomes. Additionally, the Buffalo
Health Equity Center should work closely with the U.B. Community Health Equity Research
Institute to formulate and implement strategies to improve access and the quality of care and
treatment among East Side residents.
9. The implementation of the recommendations outlined above will produce significant economic activity on Buffalo's East Side . The City should establish a job training program so
that residents can participate in all phases of East Side development. Residents should be the prime
workers in all development activities, from street paving and sidewalk replacement to housing
rehabilitation and tree planting. This way, East Side residents will participate in rebuilding their
communities as they are rebuilding their lives.
Long-Terms Goals
1. Racial Residential Segregation is the linchpin in the system of Black inequality. Dismantling
racial residential segregation will involve opening the housing markets in Buffalo City and across
Erie County. This activity will require enforcing fair housing laws and building low-income
housing units across the high-income central city neighborhoods and suburban municipalities.
2. The development of neighborhood commercial corridors is critical to the transformation of East Side neighborhoods. Commercial corridor development must proceed in concert with the
development of the surrounding communities. Neighborhood development drives commercial
corridor development. However, these two development processes occur in tandem, not
sequentially. During the early stages of development, commercial corridors must establish regional
niches to service the local neighborhood market and a larger regional market.

77 | P a g e
3. About 36% of Blacks, age twenty-five and older, have some college but no degree. These
workers are structurally locked out of the highest paying jobs, which require a college degree or higher. ESDCC must work with local colleges and universities to forge a more aggressive retention
strategy among Black college students. Concurrently, these colleges and universities should
develop programs that encourage Blacks to return to school and complete their education.

78 | P a g e
References
1 Taylor, H.L. (ed.) (1990). African American and the Rise of Buffalo’s Post-Industrial City: 1940 to Present.
Buffalo: Buffalo Urban League. 2 Wilson, W.J. (1978). The Declining Significance of Race: Blacks and Changing American Institutions. Chicago: University of Chicago Press; Wilson, W.J. (1987). The Truly Disadvantaged: The Inner City, the Underclass, and
Public Policy. Chicago: University of Chicago Press. 3 Pettit, B. (2012). “Black progress? Not when you include the incarcerated. The Washington Post.Online. Accessed, September 12, 2012. 4 Work Division, Emergency Relief Bureau (1934). Slum Area Determination Study. Buffalo Municipal Housing Authority, pg. 7-50. 5 Henry Louis Taylor, Jr. (2011). The Historic Roots of the Crisis in Housing Affordability: The Case of Buffalo, New
York, 1920-1950, in Robert Mark Silverman, Kelly L. Patterson (eds.), Fair and Affordable Housing in the U.S.: Trends, Outcomes and Future Directions. Boston: Brill, 2011. 6 Blatto, A. (2018). A City Divided: A Brief History of Segregation in Buffalo. April. People for the Public Good. 7 Taylor, H. (2011). The Historic Roots of Housing Affordability, 8 Taylor, H. (2021). Land Values and the Enduring Significance of Racial Residential Segregation. M. Haberle, S. House (eds.). Racial Justice in Housing Finance: A Series on New Directions. Poverty & Race Research Action
Council. 19-26. 9 Work Division (1934). Slum Area Determination Study. 9-11. 10 Partnership for the Public Good (2015). From Puerto Rico to Buffalo. Fact Sheet. Partnership for the Public Good.
Online. Accessed September 13, 2021. 11 Silverman, R.M., Yin, L., Patterson, K.L. (2012). Dawn of the Dead City: An Exploratory Analysis of Vacant Addresses In Buffalo, NY 2008-2010. Journal of Urban Affairs. 35/2. 131-152. 12 Blatto (2018). A City Divided. 13 Dr. Brenda Moore, Employment, Economic Opportunity, and Class among Blacks in Buffalo, in Taylor, ed., African Americans and the Rise of Buffalo’s Post-Industrial City. Buffalo: Urban League, 1990. 48-65. 14 Butler, A., Taylor, H.L., Ryu, D.. Work and Black Neighborhood Life in Buffalo, 1930-1980 in Taylor, ed. African Americans and the Rise of Buffalo’s Post-Industrial City. 112-156. 15 U.S. Census Bureau. Census of Population and Housing. 1990. Summary Tape File1 and Summary Tape File F3 Custom Tables. Social Explorer. Washington. 16 Butler, A., Taylor, H.L., Ryu, D. Work and Black Neighborhood Life in Buffalo, 112-156. 17 Moore, B, (2019). Employment and Equal Opportunity. 56 18 Ihenko, U.E. (2003). Constructive Approaches with Contradictory Results: Community Development and the
Dynamics of Housing Demolition in the Inner City of Buffalo, 1960 – 1997. Dissertation. Department of Geography. University at Buffalo. 19 U.S. Census Bureau.1990. SFT1 and SFT3. Social Explorer. 20 Price, A. (1990). Housing Buffalo’s Black Community, in Taylor (ed). African Americans and the Rise of Buffalo’s Post-Industiral City, 93. 21 U.S. Census Bureau. 1990. SFT1 and SFT1; U.S. Census Bureau 22 Taylor, H.L. (1990). African Americans and the Rise of Buffalo’s Post-Industrial City, 1940 – 1990: Vol. 1: An Introduction to a Research Project, p. 15-16. 23 Ture, K., Hamilton, C.V. (1967). Black Power: The Politics of Liberation in America. New York. Vintage Books.,
loc. 89. 24 U.S. Census Bureau. 1990. SFT1 and SFT1; U.S. Census Bureau. American Community Survey (ACS) (5-year
estimates). 2019. Social Explorer. 25 U.S. Census Bureau. ACS (5-year estimates). 2019. Social Explorer. 26 Butler, A., Taylor, H.L., Ryu, D. Work and Black Neighborhood Life in Buffalo, 112-156. 27 Wilson (1987). The Truly Disadvantaged. 28 Taylor, H. (ed). (1990). African Americans and the Rise of Buffalo’s Post Industrial Economy. 217-238 29 Toossi M. and Rolen, E. (2018). Blacks in the Labor Force. U.S. Bureau of Labor Statistics. Online. Accessed on August 17, 2021.

79 | P a g e
30 Wilson, W.J. ((1996-1997). When Work Disappears. Political Science Quarterly. 3//5 (Winder):567-595, 31 Toossi, M. and Rolen, E. (2018). Blacks in the Labor Force. 32 Wilson, W.J (1996-1997). When Work Disappears. Political Science Quarterly. Vol. 3/No. 4 (Winter):567-595. 33 Brandolini, A. (2001). Household Structure and Income Inequality. Working Paper. Bank of Italy. Research Department. Online. Accessed. September 10, 2021. 34 U.S. Bureau of Census. American Community Survey (5-year estimates). Social Explorer. 2019 35 Perry, A., Rothwell, J., Harshbarger, D. (2018). The Devaluation of Assets in Black Neighborhoods: The Case of Residential Property. Metropolitan Policy Program. Brookings Institute. 36 Blatto (2018). A City Divided, p. 2. 37 Taylor (2021). Land Values and the Enduring Significance of Racial Residential Segregation. 10/1. Poverty and
Race. 1-4;13. 38 Taylor, H.L. (2021). Land Values and the Enduring Significance of Racial Residential Segregation. 2 39 Patterson, K.L., Yoo, E.E. (2012). Trapped in Poor Places? An Assessment of the Residential Spatial Patters of
Housing Choice Voucher Holders in 2004 and 2008. Journal of Social Service Research. 1-19. 40 Silverman, R.M., Patterson, K.L., and Lewis, J. (2013). Chasing a Paper Tiger: Evaluating Buffalo’s Analysis of Impediments to Fair Housing Choice. Current Urban Studies. 1/3.1-8. 41 Regional Institute (2014). Fair Housing Equity Assessment: Expanding Opportunity in Buffalo Niagara. Regional Institute, School of Architecture and Planning, University at Buffalo:6. 42 Czv (2017). Buffalo Housing Opportunity Strategy. City of Buffalo, pgs. 6,7. 43 Czv (2017). Buffalo Housing Opportunity Strategy. City of Buffalo, pgs. 6,7. 44 Desmond and Wilmers (2019). Do the Poor Pay More for Housing? Exploitation, Profit, and Risk in Rental Markets. American Journal of Sociology (124/4): 1090-1124. 45 Desmond and Wilmers (2019). Do the Poor Pay More for Housing? 1090-1124 46 Weaver and Knight (2020) Advancing Housing Security: An Analysis of Renting, Rent Burden, and Tenant Exploitation in Erie County, NY. Erie County Poverty Commission. 47 Weaver and Knight (2020). Advancing Housing Security. 130 48 Krieger, J.K., Higgins, D.L. (2002). Housing and Health: Time Again for Public Health Action. American Journal of Public Health. 92/5. 758-768. 49 Schulman, S. (2016). Crew fixing sidewalk on Moselle where care killed baby in stroller. July 22. Buffalo News.
Online. Accessed September. 2021. 50 EPA. Heat Island Effect. Environmental Protection Agency. Online. Accessed September 2021. 51 Taylor, H.L., Jr., Silverman, R.M., Yin, L. (2019). Buffalo turning the corner. University at
Buffalo, Center for Urban Studies. 52 Robert Wood Johnson County Health Rankings, Erie, New York.2021. Online. Accessed. July 2021. 53 UNICEF (2019). Preterm Birth and Low Birth Weight. UNICEF. Online. Accessed June, 2021. 54 World Bank. Mortality Rate, Infant (per 1,000 live Births. Online. Accessed June, 2021. 55 Burstein, G.R. Erie County, New York, Community Health Assessment, 2019-2022. Department of Public Health. 56 Brown, B.(2007) State of the City Address. February 20, 2007.Online. Accessed June, 2021. Hard Copy available in U.B. Center for Urban Studies East Side Development Files. 57 Silverman, Patterson, Lewis (2013). Chasing a Paper Tiger. 1-8. 58 Urban Design Project (2003). The Queen City Hub: Vol. 2. The Work Plan: A Regional Action Plan for Downtown Buffalo. Buffalo Urban Renewal Agency; Office of Strategic Planning (2006). Queen City in the 21
st Century:
Buffalo’s Comprehensive Plan. City of Buffalo. 59 City of Buffalo (1999). Master Plan: Phase 1:Community/Neighborhood Conditions Summary: January. 1-10. 60 City of Buffalo (1999). Master Plan: Phase 1: 1-11. 61 City of Buffalo (2020). Vacant Parcels and Vacant City Parcels. Open Data Buffalo. 62 Smith, P.J. (2005). CARE Area Market Study & Revitalization Strategy. A report to the Buffalo Economic
Renaissance Corporation; Regional Institute (2020). The Start of Some BIG on Buffalo’s East Side. Annual Report. Regional Institute. University at Buffalo; Buffalo Billion (2020). East Side Corridor Economic Development Fund. Online. Accessed September 10, 2021; Empire State Development (2019). The Buffalo Billion II: East Side
Corridor Economic Development Fund. Spring. 63 Bohannon, C.L. (2004). The Urban Catalyst Concept. Thesis. Landscape Architecture. Virginia Polytechnic Institute and State University; Attoe, W.L. (1989). American Urban Architecture: catalysts in the design of cities:
Berkeley. University of California Press.

80 | P a g e
64 Buffalo Urban Renewal Agency (2018). Public Spending between 2006 and 2016. Database compiled by Keith
Lucas . 65 Czb LLC (2017). Buffalo Housing Opportunity Strategy. City of Buffalo:2.

81 | P a g e
Bibliography
Acs, G. (2011). Downward mobility from the middle class: Waking up from the American dream. Pew Charitable Trusts. Online. Accessed July 2021
Attoe, W.L. (1989). American Urban Architecture: catalysts in the design of cities: Berkeley.
University of California Press.
Baker, J.S., Magavern, S. (2018). Low-wage work in Buffalo-Niagara. PPG, Open Buffalo.
Buffalo Urban Renewal Agency (2018). Public spending between 2006 and 2016. Compiled by
Keith Lucas. Blatto, A. (2018). A city divided: A brief history of segregation in Buffalo. Partnership for the
Public Good, Open Buffalo.
Bohannon, C.L. (2004). The urban catalyst concept. Thesis. Landscape Architecture. Virginia
Polytechnic Institute and State University.
Brandolini, A., D’Alessio, G. (2021). Household structure and income inequality. Forthcoming in: D. del Boca and R.G. Repetto (eds.), Women work, family and social policies in Italy. New
York: Peter Lang.
Brown, B. (2007, February 20). State of the city address. Buffalo, NY. Online. Accessed June,
2021. Hard copy available in Center for Urban Studies, East Side Development Files.
Buffalo Urban Renewal Agency. (2016). Northland neighborhood strategy. City of Buffalo. Buffalo Urban Renewal Agency. (2002). The queen city hub: A regional action plan for
downtown Buffalo, volume 1: Overview. City of Buffalo.
Burstein, G.R. (2019) Erie County, New York, Community Health Assessment, 2019-2022.
Department of Public Health.
Butler, A., Taylor, H.L., Ryu, D. (1990). Work and black neighborhood life in Buffalo, 1930- 1980. In H.L. Taylor (ed.), African Americans and the rise of Buffalo’s post-industrial city.
Buffalo, NY: Buffalo Urban League, pp. 112-156.
Center for Urban Studies (2014). Striving for a healthier Buffalo: A
community health needs assessment for the Greater Buffalo United Ministries. U.B. Center for
Urban Studies
Center for Urban Studies. (2000). The health status of the near East Side black community: A study of the wellness and neighborhood conditions, Buffalo, New York. U.B. Center for Urban
Studies
City of Buffalo. (1998). City of Buffalo master plan, phase 1: Community/neighborhood
conditions summary. City of Buffalo.
Clement-Sanders, C., et. al. (2016). Underdeveloped neighborhoods, low-income housing, and the architecture of equity and opportunity in a just metropolis. University at Buffalo, School of
Architecture and Planning.
CZB, LLC. (2017). Buffalo housing opportunity strategy. City of Buffalo.
Department of Urban and Regional Planning Spring Planning Studio. (2011). Celebrating
Buffalo’s cultural diversity: A vision for the Michigan Street heritage corridor. University at Buffalo.
Desmond, M., Wilmers, N. (2019). Do the poor pay more for housing? Exploitation, profit, and
risk in rental markets. American Journal of Sociology 124(4).
Dewey, C. (2021, August 29). Influx of newcomers brings ‘so much energy’ to Buffalo
neighborhoods others once fled. Buffalo News. Online. September 2021.
Economic Development Corporation for Erie County. (2017). Comprehensive economic
development strategy (CEDS) 2016 update. Online. Accessed August 2021.
Empire State Development (2019). The Buffalo Billion II: East Side Corridor Economic

82 | P a g e
Development Fund. Online. Accessed July 2021. Gamble Associates (2010). Buffalo Niagara medical campus master plan update: A scoping
document for the future. Buffalo Niagara Medical Campus.
EPA. Heat Island Effect. Environmental Protection Agency. Online. Accessed September 2021.
Greater Buffalo Racial Equity Roundtable. (2018). The racial equity dividend: Buffalo’s great
opportunity. Community Foundation. Hallet, Nicole. (2018). Workers on the brink: Low-wage employment in Buffalo and Erie County.
Partnership for the Public Good, Open Buffalo.
Ihenko, U.E. (2003). Constructive Approaches with Contradictory Results: Community
Development and the Dynamics of Housing Demolition in the Inner City of Buffalo, 1960 –
1997. Dissertation. Department of Geography. University at Buffalo.
Keeley, B. (2015). What are wealth and income? In Income Inequality: The Gap Between Rich and Poor. Paris: OCED Publishing.
Kochhar, R. (2018). The American middle class is stable in size, but losing ground financially to
upper-income families. Pew Research Center. Online. Accessed July 2021.
Krieger, JK., Higgins, D.L. (2002). Housing and Health: Time Again for Public Health Action. American
Journal of Public Health. 92/5. 758-768. Lyons, S. (2009). Buffalo’s demolition strategy. PPG.
Miller, C.A. (2008). Buffalo neighborhood action plan: Promoting Buffalo’s neighborhoods
through strategic redevelopment. University at Buffalo Law School.
Moore, B. (1990). Employment, Economic Opportunity, and Class among Blacks in Buffalo. In
H.L. Taylor (ed.), African Americans and the Rise of Buffalo’s Post-Industrial City. Buffalo, NY: Urban League, pp. 48-65.
Nussbaumer, Newell. (2021, April 12). The big picture: A plan for Buffalo. Buffalo Rising. Online.
Accessed July 2021.
NYSERDA. (2016). Buffalo bicycle master plan update. City of Buffalo. Urban Development
Corporation. (2011). RiverBend master plan. City of Buffalo.
Office of Strategic Planning (2017). Buffalo river corridor: Brownfield opportunity area. City of Buffalo.
Office of Strategic Planning. (2013). City of Buffalo downtown street infrastructure improvements. City
of Buffalo.
Office of Strategic Planning. (2016). City of Buffalo land use plan. City of Buffalo
Office of Strategic Planning (2006). Queen city in the 21st century: Buffalo’s comprehensive plan. City of Buffalo
Partnership for the Public Good (2015). From Puerto Rico to Buffalo: Fact Sheet. PPG. Online.
Accessed September 13, 2021.
Partnership for the Public Good. (2018). Poverty in Buffalo: Causes, impacts, solutions. PPG.
Partnership for the Public Good. (2018). Poverty in Buffalo-Niagara. PPG. Partnership for the Public Good, PUSH Buffalo. (2020). Evicted in Buffalo: the high costs of
involuntary mobility. PPG.
Patterson, K.L., Enki Yoo, E.H. (2012). Trapped in poor places? An assessment of the residential
spatial patterns of housing choice voucher holders in 2004 and 2008. Journal of Social Service
Research 38(5), pp. 637-655. Peichl, A., Pestel, N., Schneider, H. (2010). Does size matter? The impact of changes in
household structure on income distribution in Germany. IZA, Institute of Labor Economics.
Online. Accessed August 2021.
Perry, A., Rothwell, J., Hershberger, D. (2018). The devaluation of assets in black
neighborhoods: The case of residential property. Metropolitan Policy Program at Brookings.
Peter J. Smith & Company, Inc. (2005). CARE area market study & revitalization strategy. City
83 | P a g e
of Buffalo, Buffalo Economic Renaissance Corporation.
Pettit, B. (2012). Black progress? Not when you include the incarcerated. The Washington Post.
Online. Accessed, September 12, 2012.
Pew Research Center (2008). America’s four middle classes. Online. Accessed July 2021.
Rolen, E., Toosi, M. (2018). Blacks in the labor force. U.S. Bureau of Labor Statistics. Online. Accessed
July 2021. Schulman, S. (2016). Crew fixing sidewalk on Moselle where care killed baby in stroller. July 22. Buffalo
News. Online. Accessed September. 2021.
Silverman, R.M., Patterson, K.L., Lewis, J. (2013). Chasing a paper tiger: Evaluating Buffalo’s
analysis of impediments to fair housing choice. Current Urban Studies 1(3), pp. 28-35.
Silverman, R.M., Yin, L., Patterson, K.L. (2012). Dawn of the dead city: An exploratory analysis
of vacant addresses in Buffalo, NY 2008-2010. Journal of Urban Affairs 0(0), pp. 1-22. Tamir, C. (2021). The growing diversity of black America. Pew Research Center. Online. Accessed July
2021.
Taylor, H.L. (ed.). (1990). African Americans and the rise of Buffalo’s Post-Industrial City: 1940
to present. Buffalo, NY: Buffalo Urban League.
Taylor, H.L. (1990). African Americans and the Rise of Buffalo’s Post Industiral City. Vol. 1: An Introduction to a Research Report. Buffalo: Buffalo Urban League.
Taylor, H.L. (1996). Black in Buffalo: A late-century progress report. Buffalo News. Online. Accessed
July 2002.
Taylor, H.L. (2021). Land values and the enduring significance of racial residential
segregation. In M. Haberle, S. House (eds.). Racial justice in housing finance: A series on new directions. Poverty & Race Research Action Council, pp. 19-26.
Taylor, H.L. (2011). The historic roots of the crisis in housing affordability: The case of
Buffalo, New York, 1920-1950. In Robert Mark Silverman, Kelly L. Patterson (eds.). Fair and
Affordable Housing in the U.S.: Trends, Outcomes and Future Directions. Boston: Brill, 2011.
Taylor, H.L., Jr., Silverman, R.M., Yin, L. (2019). Buffalo turning the corner. University at Buffalo, Center for Urban Studies.
Taylor, K.Y. (2019). Race for Profit: How Banks and the Real Estate Industry Undermined Black
Homeownership. Chapel Hill: The University of North Carolina Press.
Toosi, M., Rolen, E. (2018). Blacks in the labor force. U.S. Bureau of Labor Statistics. Online Accessed
July 2020.
Trudeau, D. (2013). The persistence of segregation in Buffalo, New York: Comer vs. Cisneros and geographies of relocation decisions among low-income black households. Urban Geography
27(1), pp. 20-44.
Ture, K., Hamilton, C.V. (1967). Black Power: The politics of liberation in America. New
York: Vintage Books.
UNICEF (2019). Preterm birth and low birth weight. UNICEF. Online. Accessed June, 2021. U.S. Bureau of Labor Statistics. (n.d.). Concepts and definitions. Online. Accessed August 2021.
U.S. Federal Highway Administration. (2006). Southtowns connector/Buffalo outer
harbor project, Erie County: Environmental impact statement. United States: (n.p.).
University at Buffalo, Regional Institute (2014). Fair Housing Equity Assessment: Expanding
Opportunity in Buffalo Niagara. UBRI. Online. Accessed July 2021. University at Buffalo, Regional Institute. (2020). The start of something big of Buffalo’s East
Side. UBRI. Online. Accessed July 2021.
University at Buffalo, Regional Institute, Buffalo Billion. (2020). East Side corridor economic
development fund. Online. Accessed September 10, 2021.
University at Buffalo, Regional Institute. (2020). UBRI impact report.
Weaver, R. (2020). Chartering an inclusive, sustainable, democratic city. High Road Policy 1(4). December. Online. Accessed July 2021.
Weaver, R., Knight, J. (2020). Advancing housing security: An analysis of renting, rent burden,

84 | P a g e
and tenant exploitation in Erie County, NY. Erie County Commission on Poverty.
Weaver, R., Knight, J. (2018). Can shrinking cities demolish vacancy? An empirical evaluation
of a demolition-first approach to vacancy management in Buffalo, NY, USA. Urban Science
2(69).
Weaver, R., Knight, J. (2021). Erie and Niagara – Analytical brief and preliminary findings
housing profile and needs assessment. Online. Accessed July 2021. WCPerspective. (2014, September 15). Last phase of homes at Sycamore Village is underway.
Buffalo Rising. Online. Accessed July 2021.
Wendel Duchscherer (2008). Elk street corridor redevelopment plan. Buffalo Urban Development
Corporation.
Wilson, W.J. (1978). The declining significance of race: Blacks and changing American
institutions. Chicago: University of Chicago Press. Wilson, W.J. (1987). The truly disadvantaged: The inner city, the underclass, and public
policy. Chicago: University of Chicago Press.
Wilson, W.J. (1996-1997). When work disappears. Political Science Quarterly, 11(4), pp. 567-
595.
Work Division, Emergency Relief Bureau (1934). Slum Area Determination Study. Buffalo Municipal Housing Authority, pp. 7-50.
World Bank. Mortality rate, infant (per 1,000 live Births). Online. Accessed June 2021.
Yin, L. (2009). The dynamics of residential segregation in Buffalo: An agent-based simulation.
Urban Studies, 46(13), pp. 2749-2770.
Yin, L. (2015). Housing abandonment and demolition: Exploring the use of micro-level and multi-year models. ISPRS International Journal of Geo-Information 4(3), pp. 1184-1200.

85 | P a g e
Author Profile
Dr. Henry Louis Taylor, Jr. is a full professor in the University at Buffalo Department of Urban and
Regional Studies and coordinator of the department's neighborhood planning and community
development specialization. Professor Taylor is The Center for Urban Studies' founding director, associate director of the Community Health Equity Research Institute, and a research associate at the
Medical Education and Educational Research Institute at Jacobs School of Medicine and Biomedical
Sciences. He has written numerous articles, technical reports and has authored or edited five books.
Dr. Jin-Kyu Jung is an associate professor of geography in the School of Interdisciplinary Arts & Sciences at the University of Washington, Bothell and a Senior Research Fellow at the Center for Urban Studies,
School of Architecture and Planning and U.B. Community Health Equity Research Institute at the
University at Buffalo. His research focuses on critical urban GIS and he has published a number of articles
on the topic.
Evan Dash is a second-year student in the Master of Urban Planning in the Department of Urban and
Regional Planning, School of Architecture and Planning, University at Buffalo. He is a Graduate Research
Assistant at the U.B. Center for Urban Studies.
Related Documents