Journal of Business Finance & Accounting, 18(6), November 1991, 0306 686X $2.50 THE HAMADA AND CONINE LEVERAGE ADJUSTMENTS AND THE ESTIMATION OE SYSTEMATIC RISK FOR MULTISECMENT EIRMS KIRT C. BUTLER, ROSANNE M. MOHR AND RICHARD R. SIMONDS* INTRODUCTION The Capital Asset Pricing Model (CAPM) identifies beta (or systematic risk) as the only firm-specific determinant of expected return.' The key role of beta within the CAPM has led to a considerable body of theoretical beta decom- position research.'^ In general, this research has used a variety of assumptions to model the corporate determinants of beta. The theoretical research has, of course, been accompanied by related empirical work. Typically, the empirical studies have used publicly-available data to examine the ability of the operationalized models to explain and/or predict beta and equity returns. This study extends the model estimation and beta measurement literature. Using the theoretical work of Hamada (1969 and 1972), Conine (1980), and Rubinstein (1973), this study compares the relative ability of several beta estimates to explain and predict the equity returns of a sample of multis.egment firms.^ The estimation issues associated with the Hamada and Conine finan- cial leverage adjustments are emphasized. As such, this research provides a more complete examination ofthe issues raised by Fuller and Kerr (1981) and Conine and Tamarkin (1985) as to the appropriateness of financial leverage adjustments in the estimation of divisional and multisegment firm risk. The remainder of this paper is organized as follows. The next section describes the related theoretical and empirical research. The estimation issues and measurement procedures are discussed in the third section and the empirical results are presented in the fourth section. The fmal section contains the research conclusions and recommendations. RELATED THEORETICAL AND EMPIRICAL RESEARCH The inaugural decomposition of beta into its corporate determinants was reported by Hamada (1969 and 1972). Using an assumption oi risk-free corporate * The authors are respectively. Assistant Professor of Finance at Michigan State University; Associate Professor of Accounting at Portland State University; and Professor of Finance at Michigan State University. (Paper received July 1989, revised January 1990) 885

Welcome message from author
This document is posted to help you gain knowledge. Please leave a comment to let me know what you think about it! Share it to your friends and learn new things together.
Transcript
Journal of Business Finance & Accounting, 18(6), November 1991, 0306 686X $2.50
THE HAMADA AND CONINE LEVERAGEADJUSTMENTS AND THE ESTIMATION OE
SYSTEMATIC RISK FOR MULTISECMENT EIRMS
KIRT C. BUTLER, ROSANNE M. MOHR AND RICHARD R. SIMONDS*
INTRODUCTION
The Capital Asset Pricing Model (CAPM) identifies beta (or systematic risk)as the only firm-specific determinant of expected return.' The key role of betawithin the CAPM has led to a considerable body of theoretical beta decom-position research.'^ In general, this research has used a variety of assumptionsto model the corporate determinants of beta. The theoretical research has, ofcourse, been accompanied by related empirical work. Typically, the empiricalstudies have used publicly-available data to examine the ability of theoperationalized models to explain and/or predict beta and equity returns.
This study extends the model estimation and beta measurement literature.Using the theoretical work of Hamada (1969 and 1972), Conine (1980), andRubinstein (1973), this study compares the relative ability of several betaestimates to explain and predict the equity returns of a sample of multis.egmentfirms.^ The estimation issues associated with the Hamada and Conine finan-cial leverage adjustments are emphasized. As such, this research provides amore complete examination ofthe issues raised by Fuller and Kerr (1981) andConine and Tamarkin (1985) as to the appropriateness of financial leverageadjustments in the estimation of divisional and multisegment firm risk.
The remainder of this paper is organized as follows. The next section describesthe related theoretical and empirical research. The estimation issues andmeasurement procedures are discussed in the third section and the empiricalresults are presented in the fourth section. The fmal section contains the researchconclusions and recommendations.
RELATED THEORETICAL AND EMPIRICAL RESEARCH
The inaugural decomposition of beta into its corporate determinants wasreported by Hamada (1969 and 1972). Using an assumption oi risk-free corporate
* The authors are respectively. Assistant Professor of Finance at Michigan State University;Associate Professor of Accounting at Portland State University; and Professor of Finance atMichigan State University. (Paper received July 1989, revised January 1990)
885

886 BUTLER, MOHR AND SIMONDS
debt, Hamada derived the following relationship:
PLHAM = /3C/(1 + (1 -T){DJSL)), (1)
where PIHAM = market-based beta of the levered firm L,
^u = market-based beta of the unlevered firm U (an all-equityfirm with the same assets as firm L),
T = corporate tax rate,
Z) = total market value of firm L debt,
Si^ = total market value of firm L common stock.
From expression (1), it is evident that Hamada's analysis divided the firm'smarket-based beta into two components: (1) a financial leverage component,(1 — T){Di^lSi), and (2) an operating or business risk component, jSy. Signi-ficantly, the separateness of these two components follows from Modigliani andMiller's (1958 and 1963) leverage irrelevance result.
Conine (1980) extended Hamada's analysis by incorporating risky corporatedebt into the levered beta relationship. Conine concluded that:
(2)
where PDEBT is a CAPM risky-debt covariability measure. From expression(2), it is apparent that the introduction of risky corporate debt reduces the syste-matic risk of the levered firm's equity securities. This result is intuitivelyplausible since 'the risk in net operating income is now shared by both debtand equity claimants' (Conine, 1980, p. 1035).
Finally, the ;3(/(or business risk) analysis of Rubinstein (1973) can be usedto apply the above results to the multisegment firm. Rubinstein's analysis canbe reduced to:
0USEG = i X,0u,, (3)
where I3USEG = unlevered beta of a multisegment firm,
Xj = relative market value of the multisegment firm's invest-ment in each of/ industries (I!, = i AT, = 1),
j3(y, = covariability or systematic risk of the unlevered returns toindustry i.
Expression (3) highlights the impact of relative industry involvement (x,) andsystematic industry risk (Pui) on the operating beta of a multisegment firm.The expression also clearly indicates that the operating risk of a multisegmentfirm can be viewed as a value-weighted portfolio of the risks associated witheach of its activities.
Substituting the multisegment firm's unlevered beta {0usEc)
LEVERAGE ADJUSTMENTS AND SYSTEMATIG RISK 887
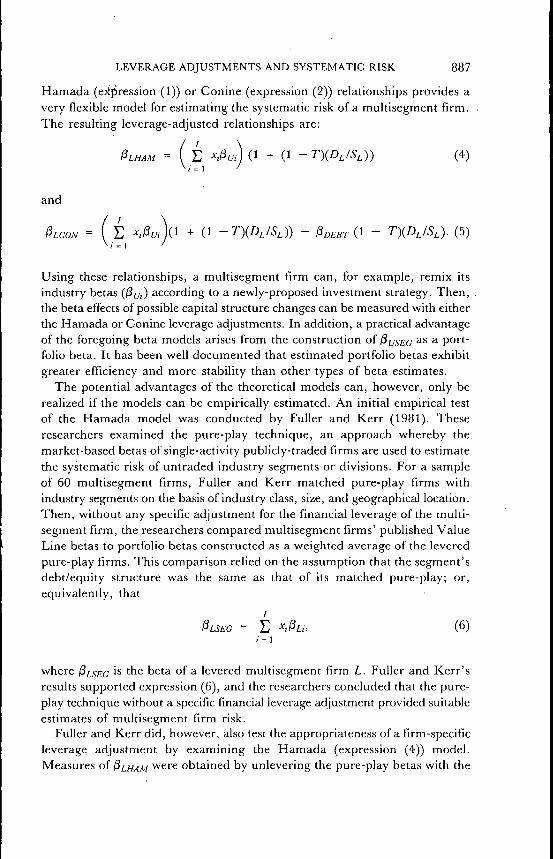
Hamada (exjiression (1)) or Conine (expression (2)) relationships provides avery flexible model for estimating the systematic risk of a multisegment firm.The resulting leverage-adjusted relationships are:
and
/ / \SL)- (5)
Using these relationships, a multisegment firm can, for example, remix itsindustry betas (fim) according to a newly-proposed investment strategy. Then,the beta effects of possible capital structure changes can be measured with eitherthe Hamada or Conine leverage adjustments. In addition, a practical advantageof the foregoing beta models arises from the construction of 0USEG ^^ ^ port-folio beta. It has been well documented that estimated portfolio betas exhibitgreater efficiency and more stability than other types of beta estimates.
The potential advantages of the theoretical models can, however, only berealized if the models can be empirically estimated. An initial empirical testof the Hamada model was conducted by Fuller and Kerr (1981). Theseresearchers examined the pure-play technique, an approach whereby themarket-based betas of single-activity publicly-traded firms are used to estimatethe systematic risk of untraded industry segments or divisions. For a sampleof 60 multisegment firms. Fuller and Kerr matched pure-play firms withindustry segments on the basis of industry class, size, and geographical location.Then, without any specific adjustment for the financial leverage ofthe multi-segment firm, the researchers compared multisegment firms' published ValueLine betas to portfolio betas constructed as a weighted average of the leveredpure-play firms. This comparison relied on the assumption that the segment'sdebt/equity structure was the same as that of its matched pure-play; or,equivalently, that
&LSEG = h ^,0U, (6)i ' - 1
where fiisEG 's the beta of a levered multisegment firm L. Fuller and Kerr'sresults supported expression (6), and the researchers concluded that the pure-play technique without a specific financial leverage adjustment provided suitableestimates of multisegment firm risk.
Fuller and Kerr did, however, also test the appropriateness of a firm-specificleverage adjustment by examining the Hamada (expression (4)) model.Measures of ^LHAM were obtained by unlevering the pure-play betas with the
888 BUTLER, MOHR AND SIMONDS
debt/equity ratios of the pure-play firms, and then relevering'the weightedportfolio betas {^USEG = S , . j Xj^m) according to the tax rate (T) andfinancial leverage {DilSi) of the multisegment firm L. The statistical testscomparing PLHAM (expression (4)) to the published Value Line betas were not,however, as supportive as the expression (6) results, and Fuller and Kerrconcluded that 'the adjusted pure-play betas provided better approximationsof the multidivision firm betas than did the leverage adjusted pure-play betas'(1981, p.1007).
Conine and Tamarkin (1985) provided additional research on the financialleverage adjustment issue. These authors recognized that the risk-free corporatedebt assumption of Hamada could have introduced a systematic upward biasinto the Fuller and Kerr leverage-adjusted betas. Conine and Tamarkin thusproceeded to re-examine the Fuller and Kerr sample by unlevering andrelevering with the Conine (1980) (expression (2)) financial leverage relation-ship. Using somewhat crude estimation techniques, the researchers observed'substantial improvement' in the beta estimates. They still found, however,that Fuller and Kerr's initial unadjusted P^SEG estimates (expression (6)) weremost closely related to the published Value Line betas. In view of this result,the researchers suggested that, 'Further empirical research is warranted' (1985,P-57).
The study reported in this paper provides a more complete examination ofthe beta estimation and leverage adjustment issues raised by Fuller and Kerr(1981) and Conine and Tamarkin (1985). It extends the earlier research byemploying a larger sample of multisegment firms, by using financial leverageand risky debt measures with recent empirical support, and by incorporatingalternative corporate tax rates. In addition, the earlier research suggested thatthe leverage-adjusted betas were more biased and less efficient than theunadjusted estimates. Given this foreknowledge, the error decompositionprocedure of Theil (1966) was used to adjust the beta estimates for statisticalbias and inefficiency. Finally, this study moved beyond the correlation statisticsof the previous studies to an examination of the relative ability of the variousbeta estimates to both explain and predict observed security returns.
VARIABLE MEASUREMENT AND ESTIMATION ISSUES
The performance comparisons of this study required estimates of&LCO,\h 0USEG' and POLS (an ordinary least squares beta) for a sample of multi-segment firms. The procedures used to select the sample and to measure thevarious beta components involved several estimation issues and problems. Thediscussion which follows will highlight those issues and, as such, provide insightinto the practical problems of using real-world data to operationalize thetheoretical beta models. Such insight is an important prelude to a more completeunderstanding of the empirical results reported both in this study and in theprevious empirical research.
LEVERAGE ADJUSTMENTS AND SYSTEMATIC RISK
Table 1
Percentage of Sales in Primary Segment
889
1979198019811982
10%
0000
Multisegment
20%
0000
30%
6101316
Industrial Firms
40%
49586662
50%
8410910195
60%
106138135140
70%
115135139151
80%
101123128125
90%
142162163153
100%
85113103105
TotalIndustrial
Firms
688848848847
Note: Cell entries represent number of firms from the Value Line database.
Sample Selection
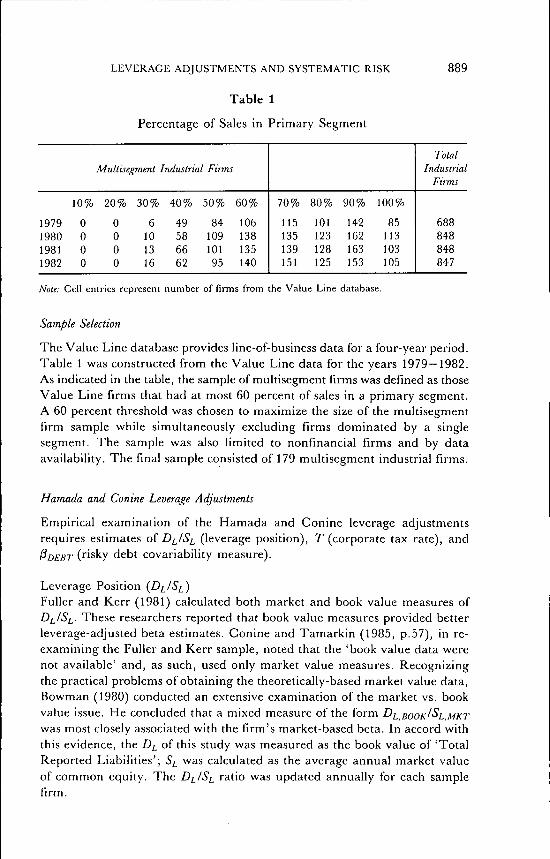
The Value Line database provides line-of-business data for a four-year period.Table 1 was constructed from the Value Line data for the years 1979—1982.As indicated in the table, the sample of multisegment firms was defined as thoseValue Line firms that had at most 60 percent of sales in a primary segment.A 60 percent threshold was chosen to maximize the size of the multisegmentfirm sample while simultaneously excluding firms dominated by a singlesegment. The sample was also limited to nonfinancial firms and by dataavailability. The final sample consisted of 179 multisegment industrial firms.
Hamada and Conine Leverage Adjustments
Empirical examination of the Hamada and Conine leverage adjustmentsrequires estimates of D^/Si (leverage position), T (corporate tax rate), and0OEBT (risky debt covariability measure).
Leverage Position {DJSi)Fuller and Kerr (1981) calculated both market and book value measures ofD^/Si. These researchers reported that book value measures provided betterleverage-adjusted beta estimates. Conine and Tamarkin (1985, p.57), in re-examining the Fuller and Kerr sample, noted that the 'book value data werenot available' and, as such, used only market value measures. Recognizingthe practical problems of obtaining the theoretically-based market value data.Bowman (1980) conducted an extensive examination of the market vs. bookvalue issue. He concluded that a mixed measure of the form D^ BOOK^SI MKT
was most closely associated with the firm's market-based beta. In accord withthis evidence, the Z) of this study was measured as the book value of 'TotalReported Liabilities'; Si was calculated as the average annual market valueof common equity. The D^ISi ratio was updated annually for each samplefirm.
890 BUTLER, MOHR AND SIMONDS
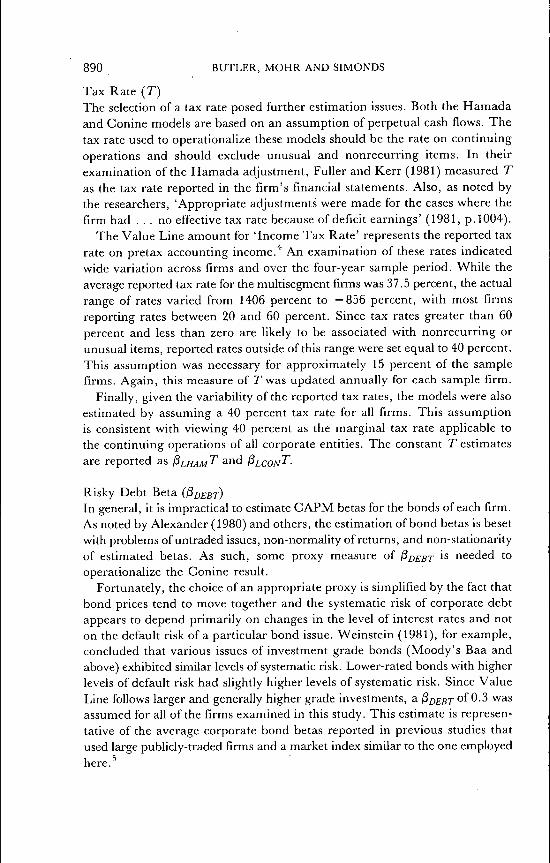
Tax Rate (T)The selection of a tax rate posed further estimation issues. Both the Hamadaand Conine models are based on an assumption of perpetual cash flows. Thetax rate used to operationalize these models should be the rate on continuingoperations and should exclude unusual and nonrecurring items. In theirexamination of the Hamada adjustment, Fuller and Kerr (1981) measured Tas the tax rate reported in the firm's financial statements. Also, as noted bythe researchers, 'Appropriate adjustments were made for the cases where thefirm had . . . no effective tax rate because of deficit earnings' (1981, p. 1004).
The Value Line amount for 'Income Tax Rate' represents the reported taxrate on pretax accounting income.* An examination of these rates indicatedwide variation across firms and over the four-year sample period. While theaverage reported tax rate for the multisegment firms was 37.5 percent, the actualrange of rates varied from 1406 percent to —856 percent, with most firmsreporting rates between 20 and 60 percent. Since tax rates greater than 60percent and less than zero are likely to be associated with nonrecurring orunusual items, reported rates outside of this range were set equal to 40 percent.This assumption was necessary for approximately 15 percent of the samplefirms. Again, this measure of 7 was updated annually for each sample firm.
Finally, given the variability of the reported tax rates, the models were alsoestimated by assuming a 40 percent tax rate for all firms. This assumptionis consistent with viewing 40 percent as the marginal tax rate applicable tothe continuing operations of all corporate entities. The constant 7" estimatesare reported as ^LHAMT and
Risky Debt BetaIn general, it is impractical to estimate CAPM betas for the bonds of each firm.As noted by Alexander (1980) and others, the estimation of bond betas is besetwith problems of untraded issues, non-normality of returns, and non-stationarityof estimated betas. As such, some proxy measure of ^DEBT is needed tooperationalize the Conine result.
Fortunately, the choice of an appropriate proxy is simplified by the fact thatbond prices tend to move together and the systematic risk of corporate debtappears to depend primarily on changes in the level of interest rates and noton the default risk of a particular bond issue. Weinstein (1981), for example,concluded that various issues of investment grade bonds (Moody's Baa andabove) exhibited similar levels of systematic risk. Lower-rated bonds with higherlevels of default risk had slightly higher levels of systematic risk. Since ValueLine follows larger and generally higher grade investments, a POEBT of 0.3 wasassumed for all of the firms examined in this study. This estimate is represen-tative of the average corporate bond betas reported in previous studies thatused large publicly-traded firms and a market index similar to the one employedhere.^
LEVERAGE ADJUSTMENTS AND SYSTEMATIC RISK 891
Unkvered Operating Risk
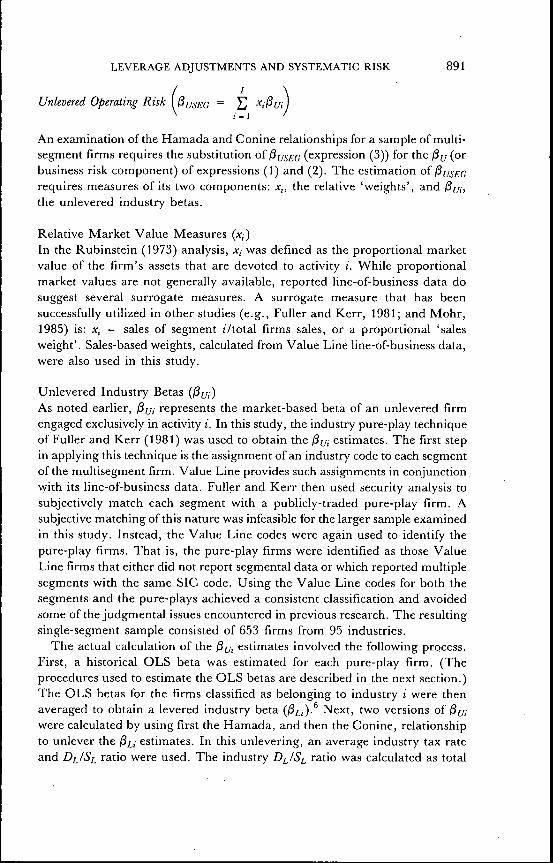
An examination of the Hamada and Conine relationships for a sample of multi-segment firms requires the substitution of fiu^gQ (expression (3)) for the ^^ (orbusiness risk component) of expressions (1) and (2). The estimation of/3[/^£(;requires measures of its two components: AT,, the relative 'weights', and ^uj,the unlevered industry betas.
Relative Market Value Measures (x,)In the Rubinstein (1973) analysis, jr, was defined as the proportional marketvalue of the firm's assets that are devoted to activity i. While proportionalmarket values are not generally available, reported line-of-business data dosuggest several surrogate measures. A surrogate measure that has beensuccessfully utilized in other studies (e.g., Fuller and Kerr, 1981; and Mohr,1985) is: x, = sales of segment iVtotal firms sales, or a proportional 'salesweight'. Sales-based weights, calculated from Value Line line-of-business data,were also used in this study.
Unlevered Industry Betas (13^)As noted earlier, ^m represents the market-based beta of an unlevered firmengaged exclusively in activity i. In this study, the industry pure-play techniqueof Fuller and Kerr (1981) was used to obtain the j3[/, estimates. The first stepin applying this technique is the assignment of an industry code to each segmentof the multisegment firm. Value Line provides such assignments in conjunction,with its line-of-business data. Fuller and Kerr then used security analysis tosubjectively match each segment with a publicly-traded pure-play firm. Asubjective matching of this nature was infeasible for the larger sample examinedin this study. Instead, the Value Line codes were again used to identify thepure-play firms. That is, the pure-play firms were identified as those ValueLine firms that either did not report segmental data or which reported multiplesegments with the same SIC code. Using the Value Line codes for both thesegments and the pure-plays achieved a consistent classification and avoidedsome of the judgmental issues encountered in previous research. The resultingsingle-segment sample consisted of 653 firms from 95 industries.
The actual calculation of the j8[/, estimates involved the following process.First, a historical OLS beta was estimated for each pure-play firm. (Theprocedures used to estimate the OLS betas are described in the next section.)The OLS betas for the firms classified as belonging to industry i were thenaveraged to obtain a levered industry beta (fiu)-^ Next, two versions of /3j/,were calculated by using first the Hamada, and then the Conine, relationshipto unlever the j3^, estimates. In this unlevering, an average industry tax rateand D[^/SL ratio were used. The industry Di/S^ ratio was calculated as total
892 BUTLER, MOHR AND SIMONDS
industry debt divided by total industry equity.' Thus, the ^^ measures wereestimated as unlevered industry portfolio betas.
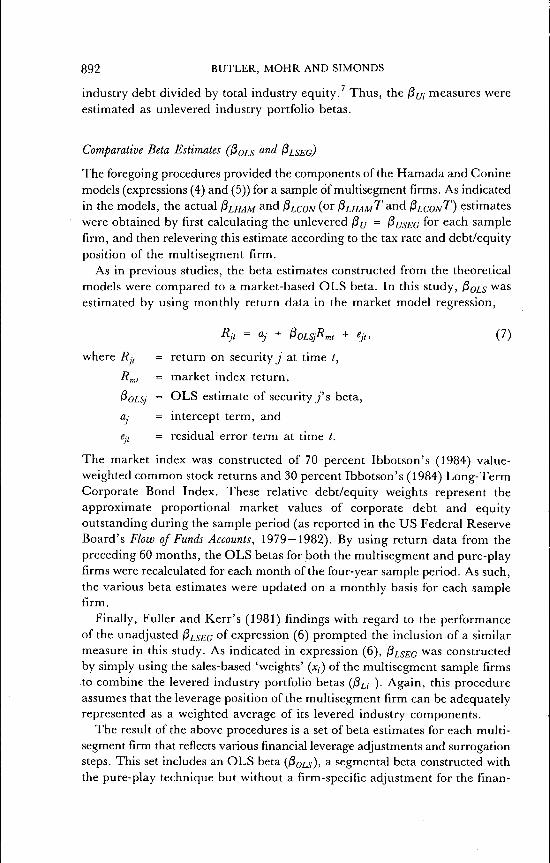
Comparative Beta Estimates (ffoLS ^'^'^ &LSEG)
The foregoing procedures provided the components ofthe Hamada and Coninemodels (expressions (4) and (5)) for a sample of multisegment firms. As indicatedin the models, the actual ^IHAM ^"d fiicoN{or ^nf^i/^T and ^LCONT) estimateswere obtained by first calculating the unlevered i3(/ = PusEG ^or each samplefirm, and then relevering this estimate according to the tax rate and debt/equityposition of the multisegment firm.
As in previous studies, the beta estimates constructed from the theoreticalmodels were compared to a market-based OLS beta. In this study, I3QIS wasestimated by using monthly return data in the market model regression,
Rjt = aj + 0oLSjRmi + eji, (7)
where Rji = return on security j at time /,
R^, = market index return,
^OLSj - OLS estimate of security j ' s beta,
aj = intercept term, and
eji = residual error term at time /.
The market index was constructed of 70 percent Ibbotson's (1984) value-weighted common stock returns and 30 percent Ibbotson's (1984) Long-TermCorporate Bond Index. These relative debt/equity weights represent theapproximate proportional market values of corporate debt and equityoutstanding during the sample period (as reported in the US Federal ReserveBoard's Flow of Funds Accounts, 1979—1982). By using return data from thepreceding 60 months, the OLS betas for both the multisegment and pure-playfirms were recalculated for each month ofthe four-year sample period. As such,the various beta estimates were updated on a monthly basis for each samplefirm.
Finally, Fuller and Kerr's (1981) findings with regard to the performanceof the unadjusted PISEG of expression (6) prompted the inclusion of a similarmeasure in this study. As indicated in expression (6), /S^^^c was constructedby simply using the sales-based 'weights' (x,) ofthe multisegment sample firmsto combine the levered industry portfolio betas (^^ ) . Again, this procedureassumes that the leverage position ofthe multisegment firm can be adequatelyrepresented as a weighted average of its levered industry components.
The result of the above procedures is a set of beta estimates for each multi-segment firm that reflects various financial leverage adjustments and surrogationsteps. This set includes an OLS beta {I3OLS)> ^ segmental beta constructed withthe pure-play technique but without a firm-specific adjustment for the finan-
LEVERAGE ADJUSTMENTS AND SYSTEMATIC RISK 893
cial leverage of the multisegment firm {^ISEG)' ^^^ several segmental betasformed from portfolios of unlevered pure-play firms (fiinAM^ 0LCONy &LHAMT^>
and ^LCONT)- The several forms of the segmental betas were estimated toexamine the relative performance of the more sophisticated models and toaddress the measurement issues associated with the estimation of those models.
PERFORMANCE OF THE BETA ESTIMATES
Characteristics of the Beta Estimates
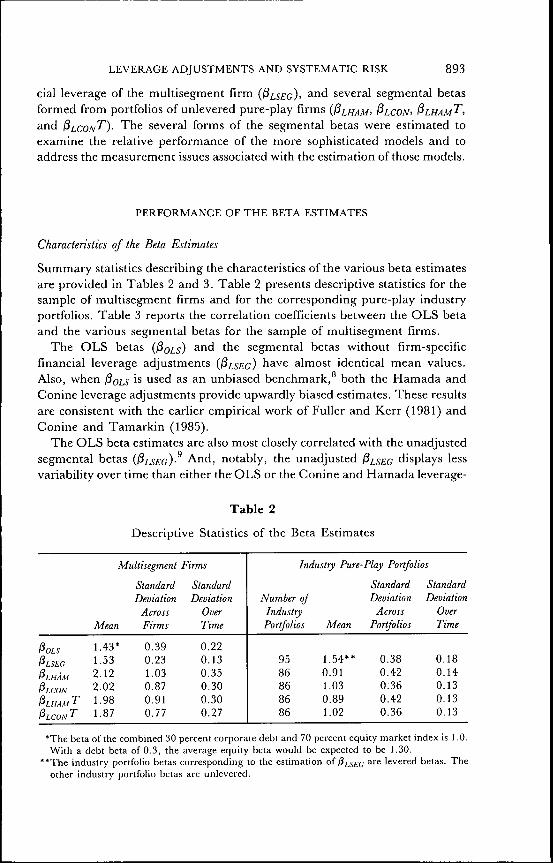
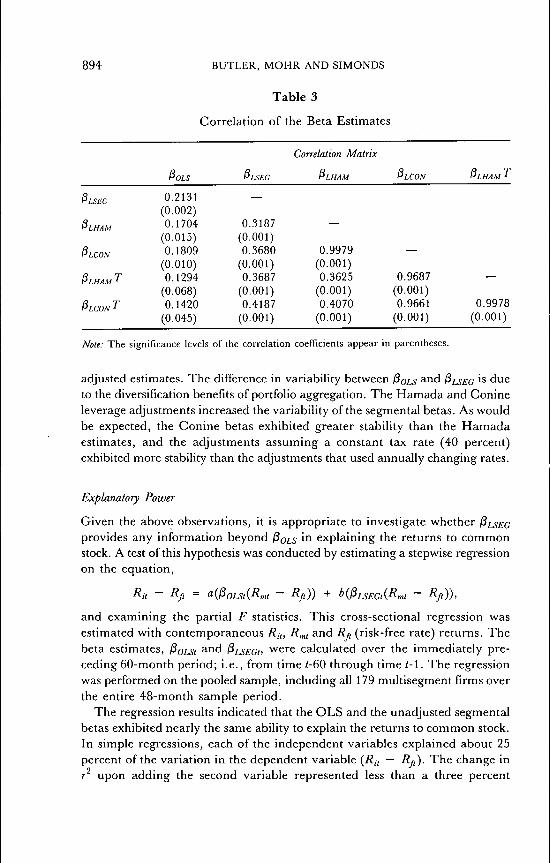
Summary statistics describing the characteristics of the various beta estimatesare provided in Tables 2 and 3. Table 2 presents descriptive statistics for thesample of multisegment firms and for the corresponding pure-play industryportfolios. Table 3 reports the correlation coefficients between the OLS betaand the various segmental betas for the sample of multisegment firms.
The OLS betas ifioLs) ^^^ the segmental betas without firm-specificfinancial leverage adjustments {&ISEG) have almost identical mean values.Also, when ^ois is used as an unbiased benchmark, both the Hamada andConine leverage adjustments provide upwardly biased estimates. These resultsare consistent with the earlier empirical work of Fuller and Kerr (1981) andConine and Tamarkin (1985).
The OLS beta estimates are also most closely correlated with the unadjustedsegmental betas (^LSEG)-^ And, notably, the unadjusted ^isEG displays lessvariability over time than either the OLS or the Conine and Hamada leverage-
Table 2
Descriptive Statistics of the Beta Estimates
CO
'•ri
&LSEC
PLHAM
PLCON
PLHAM ^
PLCON '
Multisegment
Mean
1.43*1.532.122.021.981.87
StandardDeviation
AcrossFirms
0.390.231.030.870.910.77
Firms
StandardDeviation
OverTime
0.220.130.350.300.300.27
Industry Pure-Play Portfolios
Number ofIndustryPortfolios
9586868686
Mean
1.54**0.911.030.891.02
StandardDeviation
AcrossPortfolios
0.380.420.360.420.36
StandardDeviation
OverTime
0.180.140.130.130.13
•The beta of the combined 30 percent corporate debt and 70 percent equity market index is 1.0.With a debt beta of 0.3, the average equity beta would be expected to be 1.30.
**The industry portfolio betas corresponding to the estimation of/3^^£(j are levered betas. Theother industry portfolio betas are unlevered.
894 BUTLER, MOHR AND SIMONDS
Table 3
Correlation of the Beta Estimates
PLSEG
&LHAM
PLCON
PLHAM '
PLCON '
&OLS
0.2131(0.002)0.1704
(0.015)0.1809
(0.010)0.1294
(0.068)0.1420
(0.045)
0LSEG
0.3187(0.001)0.3680
(0.001)0.3687
(0.001)0.4187
(0.001)
Correlation Matrix
PLHAM
—
0.9979(0.001)0.3625
(0.001)0.4070
(0.001)
0LCON
—
0.9687(0.001)0.9661
(0.001)
R TPLHAM '
—
0.9978(0.001)
Nole: The significance levels of the correlation coefficients appear in parentheses.
adjusted estimates. The difference in variability between 0OLS ^"d 0LSEG ' dueto the diversification benefits of portfolio aggregation. The Hamada and Conineleverage adjustments increased the variability of the segmental betas. As wouldbe expected, the Conine betas exhibited greater stability than the Hamadaestimates, and the adjustments assuming a constant tax rate (40 percent)exhibited more stability than the adjustments that used annually changing rates.
Explanatory Power
Given the above observations, it is appropriate to investigate whether 0LSEG
provides any information beyond ^QLS in explaining the returns to commonstock. A test of this hypothesis was conducted by estimating a stepwise regressionon the equation.
Ru - Rfl = a{^OLS,{Rm, - Rfi)) + K^LSEaiRm, - Rfi)),
and examining the partial F statistics. This cross-sectional regression wasestimated with contemporaneous /?,,, R^i and Rji (risk-free rate) returns. Thebeta estimates, ^oLSt ^^d &ISEGI> were calculated over the immediately pre-ceding 60-month period; i.e., from time <-60 through time t-i. The regressionwas performed on the pooled sample, including all 179 multisegment firms overthe entire 48-month sample period.
The regression results indicated that the OLS and the unadjusted segmentalbetas exhibited nearly the same ability to explain the returns to common stock.In simple regressions, each of the independent variables explained about 25percent of the variation in the dependent variable (/?,, — Rjt)- The change inr upon adding the second variable represented less than a three percent
LEVERAGE ADJUSTMENTS AND SYSTEMATIC RISK 895
increase. Unadjusted segmental betas (PISEG) thus appear to reflect much ofthe same systematic risk information as is captured in the market-based OLSestimates.
Predictive Ability
In order to focus on the predictive ability of the OLS and segmental betas,actual security returns (Rji) were compared to forecasted returns {E[Rji])derived from the CAPM Security Market Line,
where (3, represents the firm's estimated beta, and /?„< and Rfl are the actualmarket index and risk-free returns. This framework is similar to a portfolioperformance evaluation wherein performance is measured relative to ex postmarket returns on a risk-adjusted basis.
The predictions were evaluated against several benchmark forecasts. To testthe null hypothesis.
Ho: ej, = Rj, - E[Rj,] = 0,
the following predictions {E[Rji]) were compared to actual returns (Rj,):
(i) a naive forecast of the risk-free rate (i3 = 0),
(ii) a forecast of the average equity return (using the observed mean
1.43),
E[Rfl] = Rfl + 1.43 (
(iii) a forecast using the OLS beta estimate
E[Rj,] = Rfl + PoLSfl-i{Rn.,-Rfl); and
(iv) forecasts using each of the various levered segmental betas estimates
EG' 0LHAM, &LCON, &LHAMT, and ^LCONT), e.g..
Since ^QLS and the segmental betas were updated monthly, the predictive testswere performed on a pooled sample including both cross-sectional and timeseries data.
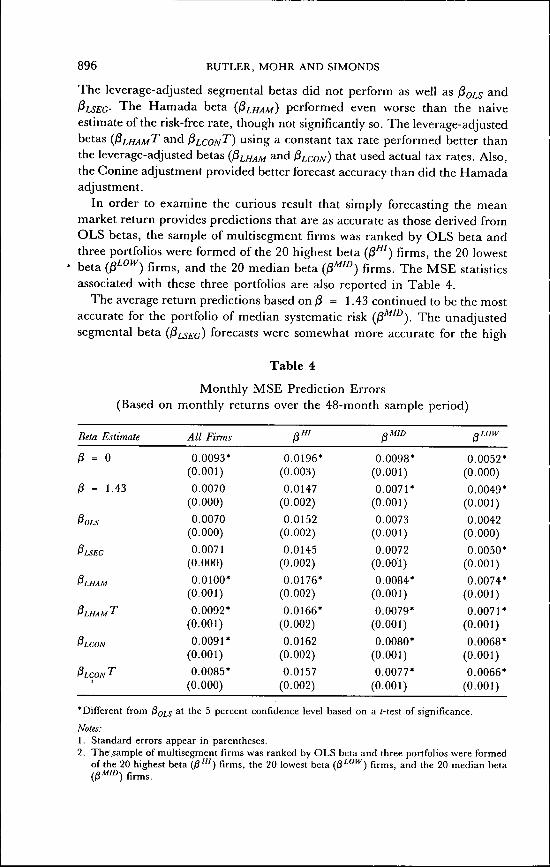
In the predictive comparisons, mean error (ME) was used as a measure ofprediction bias and mean square error (MSE) as a measure of forecast accuracy.A comparison of the MSE statistics at the individual security level is presentedin the first column of Table 4. The average equity return predictions (basedon j3 = 1.43) and the OLS return predictions possessed the best forecastaccuracy. Among the segmental betas, only &ISEG exhibited forecast accuracythat was not significantly worse than the OLS and average return predictions.
896 BUTLER, MOHR AND SIMONDS
The leverage-adjusted segmental betas did not perform as well as /SQ^^ andPLSEG- The Hamada beta (PLHAM) performed even worse than the naiveestimate of the risk-free rate, though not significantly so. The leverage-adjustedbetas {^IHAMT and ^ICONT) using a constant tax rate performed better thanthe leverage-adjusted betas {&LHAM and PICON) that used actual tax rates. Also,the Conine adjustment provided better forecast accuracy than did the Hamadaadjustment.
In order to examine the curious result that simply forecasting the meanmarket return provides predictions that are as accurate as those derived fromOLS betas, the sample of multisegment firms was ranked by OLS beta andthree portfolios were formed of the 20 highest beta {13"') firms, the 20 lowestbeta (^^<'^) firms, and the 20 median beta {fi'^"^) firms. The MSE statisticsassociated with these three portfolios are also reported in Table 4.
The average return predictions based on (3 = 1.43 continued to be the mostaccurate for the portfolio of median systematic risk (P^"^). The unadjustedsegmental beta (PLSEG) forecasts were somewhat more accurate for the high
Table 4
Monthly MSE Prediction Errors(Based on monthly returns over the 48-month sample period)
Beta Estimate
0 = 0
/3 = 1.43
1^0/?
PLSF.G
filHAM
0IHAMT
01 CON
0ICONT
Atl Firms
0.0093*(0.001)
0.0070(0.000)0.0070
(0.000)
0.0071(0.000)
0.0100*(0.001)
0.0092*(0.001)
0.0091*(0.001)
0.0085*(0.000)
0"'0.0196*
(0.003)
0.0147(0.002)
0.0152(0.002)
0.0145(0.002)
0.0176*(0.002)
0.0166*(0.002)
0.0162(0.002)
0.0157(0.002)
0.0098*(0.001)
0.0071*(0.001)
0.0073(0.001)
0.0072(0.001)
0.0084*(0.001)
0.0079*(0.001)
0.0080*(0.001)
0.0077*(0.001)
^LOW
0.0052*(0.000)
0.0049*(O.OOI)
0.0042(0.000)
0.0050*(0.001)
0.0074*(0.001)
0.0071*(0.001)
0.0068*(0.001)
0.0066*(0.001)
*Dirferent from 0g,j at the 5 percent confidence level based on a Mest of significance.
Notes:1. Standard errors appear in parentiieses.2. The sample of multisegment firms was ranked by OLS beta and three portfolios were formed
of the 20 highest beta {0"') firms, the 20 lowest beta {0'-°'^) firms, and the 20 median beta(13' ™) firms.
LEVERAGE ADJUSTMENTS AND SYSTEMATIC RISK 897
beta portfoHo (13"'). And, for the low beta firms, the OLS beta performedbest. Notably, across all three portfolios, the (3 = 1.43, ffoLS> and ^LSEG
predictions continued to significantly outperform the forecasts based on theHamada and Conine leverage adjustments.
It is possible, however, that the Hamada or Conine estimates do capturethe true linear relationship between systematic risk and return, but that thisrelationship is obscured in the MSE measure by bias in the estimates. Theil(1966) decomposed mean square error (MSE) into statistical bias, inefficiency,and error:
MSE = E[{R - E[R]f]= [EiR - E[R])f + (1 - bfal^R^ + (1 - rfal
= bias + inefficiency + error,
where E[R] and R are the predicted and actual returns,
b is the slope coefficient of the regression of i? on E[R],
r is the correlation oi E[R] and R, and
and ff^ are the variances ofthe predicted and actual returns.
Bias in the return predictions represents the tendency ofthe beta estimates toover- or underestimate the true beta. Inefficiency measures whether, afteradjusting for bias, the estimated linear relationship effectively captures the truelinear relationship. Attempts to adjust beta forecasts for bias and inefficiencyhave been reported by Blume (1971) and Vasicek (1973). In a Bayesian sense,if bias and inefficiency are foreseeable or predictable, then perhaps the segmentalbeta estimates can be improved by adjusting for these statistical deficiencies.
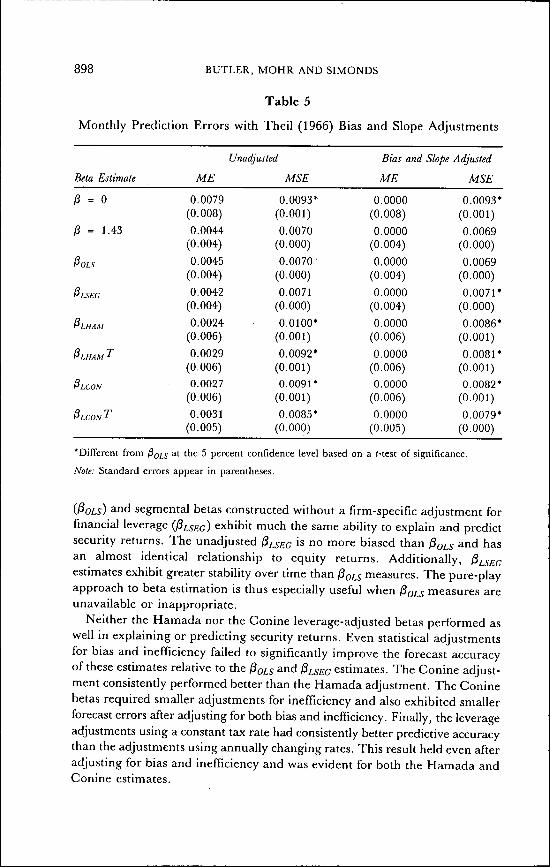
The forecast accuracy ofthe return predictions after adjusting for statisticalbias and inefficiency are presented in Table 5. While the bias and inefficiencyadjustments did not improve the accuracy of the ^QLS or &LSEG predictions,they did, as expected, provide somewhat improved estimates for the Hamadaand Conine leverage-adjusted betas. Nonetheless, the leverage-adjusted betasstill did not perform as well as the betas estimated without a firm-specificleverage adjustment. Again, the Conine betas continued to demonstrate betterforecast accuracy than the Hamada betas, and the levered betas using a constanttax rate outperformed the betas that used actual tax rates.
SUMMARY AND RECOMMENDATIONS
Previous empirical research had provided only limited evidence as to thepractical ability of the theoretical leverage-adjusted betas to explain and predictthe returns to common stock. The tests reported here provide results that aremore complete and yet consistent with the previous work.
In summary, the results of this study indicate that historical OLS betas
898 BUTLER, MOHR AND SIMONDS
Table 5
Monthly Prediction Errors with Theil (1966) Bias and Slope Adjustments
Beta Estimate
0 = 0
/3 = 1.43
^OLS
^LSEG
0LNAM
PLHAM T
PLCON
PLCON '
ME
0.0079(0.008)
0.0044(0.004)
0.0045(0.004)
0.0042(0.004)
0.0024(0.006)
0.0029(0.006)0.0027
(0.006)
0.0031(0.005)
Unadjusted
MSE
0.0093*(0.001)
0.0070(0.000)
0.0070-(0.000)
0.0071(0.000)
0.0100*(0.001)
0.0092*(0.001)0.0091*
(0.001)
0.0085*(0.000)
Bias and
ME
0.0000(0.008)
0.0000(0.004)
0.0000(0.004)
0.0000(0.004)
0.0000(0.006)
0.0000(0.006)0.0000
(0.006)
0.0000(0.005)
Slope Adjusted
MSE
0.0093*(0.001)
0.0069(0.000)
0.0069(0.000)
0.0071*(0.000)
0.0086*(0.001)
0.0081*(0.001)0.0082*
(0.001)
0.0079*(0.000)
•Different from 0oLS 3' the 5 percent confidence level based on a (-test of signifieance.
Nole: Standard errors appear in parentheses.
(.POLS) and segmental betas constructed without a firm-specific adjustment forfinancial leverage (PLSEG) exhibit much the same ability to explain and predictsecurity returns. The unadjusted ^i^sEG is no more biased than 0oLS and hasan almost identical relationship to equity returns. Additionally, P^SEG
estimates exhibit greater stability over time than fiots measures. The pure-playapproach to beta estimation is thus especially useful when ^QLS measures areunavailable or inappropriate.
Neither the Hamada nor the Conine leverage-adjusted betas performed aswell in explaining or predicting security returns. Even statistical adjustmentsfor bias and inefficiency failed to significantly improve the forecast accuracyof these estimates relative to the ^QLS and ffisEG estimates. The Conine adjust-ment consistently performed better than the Hamada adjustment. The Coninebetas required smaller adjustments for inefficiency and also exhibited smallerforecast errors after adjusting for both bias and inefficiency. Finally, the leverageadjustments using a constant tax rate had consistently better predictive accuracythan the adjustments using annually changing rates. This result held even afteradjusting for bias and inefficiency and was evident for both the Hamada andConine estimates.
LEVERAGE ADJUSTMENTS AND SYSTEMATIC RISK 899
There are several estimation issues that may explain the practical inadequacyof the leverage-adjusted betas. As discussed in this study, the estimation ofeach of the theoretical beta components involves measurement problems andassumptions. In particular, financial managers, academic researchers, andothers interested in employing practical estimates of the theoretical beta modelsshould be aware that:
(i) Reported tax rates fluctuate widely across firms and over time. Thesefluctuations arise normally in the course of business and product lifecycles, but may also be due to various nonrecurring income/expenseitems and/or the peculiarities of ever-changing tax and accountingsystems. Smoothing reported tax rates appears to provide betterleverage-adjusted estimates.
(ii) Market values of total debt may, particularly during periods of rapidlychanging interest rates, vary considerably from the more readilyavailable book value amounts. In this regard, Mulford (1985) concludedthat interest rate fluctuations can impair the relationship betweensystematic risk and mixed book/market value measures of debt/equityposition.
(iii) Uncertainty exists as to the method of calculation and firm-specificattributes of the systematic risk of corporate debt (fioEBr)- Someevidence exists, however, that most corporate debt of investment gradehas about the same level of systematic risk.
Thus, the financial manager or researcher should be aware of these issues andmight consider the impact of alternative measures of each of these betacomponents on derived estimates of systematic risk.
Finally, there are other theoretical leverage-related components that mightcontribute to improved beta estimates for the multisegment firm. In a recentarticle, Yagil (1987) suggested that the inclusion of personal taxes andbankruptcy costs might provide better leverage-adjusted segmental betas. Bothof these components are, however, subject to numerous estimation difficulties,and a more complete practical evaluation of such estimates awaits futureresearch.
In conclusion, then, in view of the above estimation difficulties and theexplanatory and predictive results of this study, it appears that the best cross-sectional segmental beta estimate continues to be a weighted average of theindustry pure-plays constructed without a specific adjustment for the debt/equityposition of the multisegment firm. While the Hamada and Conine models mayserve as useful pedagogical tools, they do not, in general, provide better betaestimates for the multisegment firm. These conclusions may provide furtherimpetus for practical evaluation of the mathematical programming techniquesof Boquist and Moore (1983) and Lee and Moore (1986). These techniquesexploit the fact that the beta of a multisegment firm is a linear combinationof the betas of other firms with involvement in the component industries. The
900 BUTLER, MOHR AND SIMONDS
techniques do not adjust for differences in financial leverage. The results ofthis study indicate that such adjustments are probably not needed and, as such,provide added support for practical application ofthe programming approach.
NOTES
Hsia (1981) demonstrated that the CAPM beta can also be viewed as compatible with severalother asset valuation theories; i.e., with the theories commonly known as 'Time State PreferenceTheory', the 'Modigliani and Miller Propositions', and the 'Option Pricing Model'. Hsia'sdemonstration of this theoretical consistency lends increased importance to an understandingof the corporate determinants of beta.For a recent synthesis ofthe theoretical beta decomposition research, see Callahan and Mohr(1989).As used herein, 'segment' refers to a firm's investment in a particular industry or line ofbusiness.The Value Line amount 'Income Tax Rate' is defmed as 'federal, foreign, state and localtaxes, including deferred taxes and tax credits, divided by pretax income'.The following corporate bond betas have been estimated in studies using a combined stockand corporate bond index similar to the market index used in this study: Weinstein (1981),0.190; Sharpe (1973), 0.286; Friend et al. (1978), 0.362; and Alexander (1980), 0.372.If there were less than three pure-play firms with a given industry code, then the firms wereaggregated into the next more general SIC class.Ideally, eaeh OLS pure-play beta estimate should have been unlevered according to that firm'sdebt/equity ratio. Unlevering at the industry level was adopted as a computational convenience.Ordinary least squares estimates of beta are generally considered to be unbiased but inefficientestimates ofthe firm's true beta. In this regard, see Klemkosky and Martin (1975).Some perspective on the magnitude of the correlation between ^Q,J and ft^^g can be gainedby considering the optimistic scenario wherein ;8,j. g is equal to the true underlying beta while&oi^ contains an independent and normally distributed error term. Let the true beta {0i^g(.)be represented by the independent variable X-. The dependent variable Y- = X- + e- thenrepresents (3o,j, where «,- ~ A?(O,VAR(e)) and ^(f,) = ^(s^ , ) = 0 for i^j. The expectedvalue of the r''observation of K is K,. = X- = A", and the mean of W observations is Y = X.The variance of the true beta /3,_s£f; is
VAR(A-) = ^ E {X, - Xf.
Substituting for Y and Y, the expected regression sum of squares is then
£(SSR) = f; ()>. - y')2 = ^ (X, - Xf = N'
In this study, the regression of/3o,, on &,sp,; provided an error sum of squares SSE of27.75. With N = 196 observations, the variance oi X is VAR(A') = (0.263)' = 0.069,implying £(SSR) =(196)(0.069) = 13.52. The expected total sum of squares is then£(SST) = £(SSR) - SSE = 13.52 + 27.75 = 41.27, and the expected r 'of the idealizedregression is; r' = \ - (SSE/SST) = 1 - (27.75/41.27) = 0.33, o r r = (0.33)'" = 0.57.Thus, even \( fii^sEC ' 'he true underlying beta, the expected correlation between 0,^^^ ando,_v is still only 0.57 because of the random error in the dependent variable.
REFERENCES
Alexander, G.J. (1980), 'Applying the Market Model to Long-Term Corporate Bonds',of Financiat and Quanlilalwe Anatysis (December 1980), pp. 1063-1080.
LEVERAGE ADJUSTMENTS AND SYSTEMATIC RISK 901
Blume, M.E. (1971), 'On the Assessment of Risk', youraa/o/H«an« (March 1971), pp. 1-10.Boquist, J.A. and W.T. Moore (1983), 'Estimating the Systematic Risk of an Industry Segment:
A Mathematical Programming Approach', Financial Management (Winter 1983), pp. 11-18.Bowman, R.G. (1980), 'The Importance of a Market-Value Measurement of Debt in Assessing
Leverage', Journal of Accounting Research (Spring 1980), pp. 242-254.Callahen, C M . and R.M. Mohr (1989), 'The Determinants of Systematic Risk: A Synthesis',
The Financial Review (May 1989), pp. 157-181.Conine, T.E., Jr. (1980), 'Corporate Debt and Corporate Taxes: An Extension', Journal of Finance
(September 1980), pp. 1033-1037.and M. Tamarkin (1985), 'Divisional Cost of Capital Estimation: Adjusting for Leverage',
Financial Management (Spring 1985), pp. 54—58.Friend, L, R. Westerfield and M. Granito (1978), 'New Evidence on the Capital Asset Pricing
Model', >ur«a/ of Finance (June 1978), pp. 903-920.Fuller, R.J. and H.S. Kerr (1981), 'Estimating the Divisional Cost of Capital: An Analysis of
the Pure-Play Technique', yourna/ of Finance (December 1981), pp. 997-1009.Hamada, R.S. (1969), 'Portfolio Analysis, Market Equilibrium and Corporation Finance',youma/
of Finance {May 1969), pp. 13-31.(1972), 'The Effect of the Firm's Capital Structure on the Systematic Risk of Common
Stocks', Journal of Finance (May 1972), pp. 435-452.Hsia, C.C. (1981), 'Coherence of the Modern Theories of Finance', The Financial Review (Winter
1981), pp. 27-42.Ibbotson, R.G. (1984), Stocks, Bonds, Bills, and Inflation: 1984 Yearbook {K.G. Ibbotson Associates,
1984).Klemkosky, R.C. andJ.D. Martin (1975), 'The Adjustment of Beta Forecasts',yourna/o/Finance
(September 1975), pp. 1123-1128.Lee, J .H. and W.T. Moore (1986), 'Estimating Industry Betas By Mathematical Programming:
A New Way to Assess Statistical Significance', Discussion Paper No. 315, Graduate Schoolof Business, Indiana University (April 1986).
Modigliani, F. and M.H. Miller (1958), 'The Cost of Capital, Corporation Finance and the Theoryof Investment', American Economic Review (June 1958), pp. 261—297.
(1963), 'Corporate Income Taxes and the Cost of Capital: A Correction', American EconomicReview (June 1963), pp. 433-443.
Mohr, R.M. (1985), 'The Operating Beta of a US Multi-Activity Firm: An Empirical Investigation',Journal of Business Finance & Accounting (Winter 1985), pp. 575-594.
Mulford, C.W. (1985), 'The Importance of a Market Value Measurement of Debt in LeverageRatios: Replication and Extensions',youraa/o//4<;counto^i?McarcA (Autumn 1985), pp. 897—906.
Rubinstein, M.E. (1973), 'A Mean-Variance Synthesis of Corporate Financial Theory', yourna/of Finance (March 1973), pp. 167-181.
Sharpe, W.F. (1973), 'Bonds Versus Stocks: Capital Market Theory', Financial Analysts Journal(November/December 1973), pp. 74-80.
Theil, H. (1966), Applied Economic Forecasting (North Holland Publishing, 1966).US Board of Governors of the Federal Reserve System (1979-1982), Flow of Funds Accounts (\JS
Government Printing Office, 1979-1982).Vasicek, O.A. (1973), 'A Note on Using Cross-Sectional Information in Bayesian Estimation of
Security Betas', yourna/o/Finance (December 1973), pp. 1233 — 1239.Weinstein, M. (1981), 'The Systematic Risk of Corporate Bonds', Journal of Financial and Quantitative
Analysis (September 1981), pp. 257-278.Yagil, J. (1987), 'Divisional Beta Estimation Under the Old and New Tax Laws', Financial
Management (Winter 1987), pp. 16-21.

Related Documents