THE HACK ON JERSEY CITY CONDO PRICES explore trends in public data Yiqun “Yi” Wang / NYC Data Science Academy / Code for JC / March 2015

THE HACK ON JERSEY CITY CONDO PRICES explore trends in public data
Jul 16, 2015
Welcome message from author
This document is posted to help you gain knowledge. Please leave a comment to let me know what you think about it! Share it to your friends and learn new things together.
Transcript

THE HACK ON JERSEY CITY CONDO PRICESexplore trends in public data
Yiqun “Yi” Wang / NYC Data Science Academy / Code for JC / March 2015

THE HACK ON JERSEY CITY CONDO PRICES
Outline of the Project
• Data• Tax assessment data
• Third party data sources to join
• Data janitor and collection works
• Relationship Exploration• Building attributes exploration
• Individual units price exploration
• Model for Prices• 5 competing models
• Cross validation

THE HACK ON JERSEY CITY CONDO PRICES
Tax Assessment Data
NJ MOD IV System
Covers all individual properties
Downloadable in batch in text files
Key columns:
- Property address
- Property class
- Property size
- Year built
- Owner address
- Owner name
- Last sold price
- Last sold date
- Qualifier (can parse out condo floor # and unit #)

THE HACK ON JERSEY CITY CONDO PRICES
Tax Assessment Data
• 62,270 totals property records, as of Feb 2015
-- filter down to --
• 3,867 individual condo units (of 19 selected mid/high-rise buildings)
# step 1.1 tax data load from NJ MOD IV system
url <- "http://tax1.co.monmouth.nj.us/download/0906monm204610.zip"
download.file(url,"0906monm204610.zip",quiet = FALSE)
closeAllConnections()
unzip("0906monm204610.zip")
taxdata <- read.csv(file="0906monm204610.csv")

THE HACK ON JERSEY CITY CONDO PRICES
Tax Assessment Data is Dirty!
# address cleanup
taxdata$Property.Location <- gsub("STREET", "ST", taxdata$Property.Location)
taxdata$Property.Location <- gsub("BOULEVARD", "BLVD", taxdata$Property.Location)
taxdata$Property.Location <- gsub("[[:punct:]]", "", taxdata$Property.Location)
taxdata$Property.Location <- gsub("[[:space:]]", "", taxdata$Property.Location)
# drop bad prices, bad units, bad sf, bad records, retail condos
taxdata <- taxdata[taxdata$Sale.Price>10000,]
taxdata <- taxdata[taxdata$Sale.Price<=10000000,]
taxdata <- taxdata[!(taxdata$Qual=="" | is.null(taxdata$Qual)),]
taxdata <- taxdata[!(taxdata$Sq..Ft.=="" | is.null(taxdata$Sq..Ft.) |
taxdata$Sq..Ft.<=400 | taxdata$Sq..Ft.>=3000),]
taxdata <- taxdata[!(is.na(taxdata$Map.Page)),]
taxdata <- taxdata[!(taxdata$Building.Class=="C"),]
taxdata <- taxdata[!(substr(taxdata$Qual,4,4) %in% c("R","L","U")),]

THE HACK ON JERSEY CITY CONDO PRICES
Tax Assessment Data has Hidden Treasures
• From “Qual” we can parse out floor number and unit number
taxdata$Floor <-
ifelse(taxdata$AddressClean=="389WASHINGTONST"|taxdata$AddressClean=="174WASHINGTONST“
substr(taxdata$Qual,3,4),substr(taxdata$Qual,2,3))
Floor <- ifelse(Floor=="PH",BuildingNumberOfStories,Floor)
taxdata$Unit <-
ifelse(taxdata$AddressClean=="389WASHINGTONST"|taxdata$AddressClean=="174WASHINGTONST“
substr(taxdata$Qual,5,5),substr(taxdata$Qual,4,5))

THE HACK ON JERSEY CITY CONDO PRICES
Third Party Data Sources To Join
• Condo building attributes:• http://livingonthehudson.com• http://www.jcboe.org• http://www.zillow.com• http://www.streeteasy.com• http://buyersadvisors.com
• Location primness:• http://walkscore.com
• Building Geocode / Transit location: • http://maps.google.com/maps/api/geocode/
• Census tract level demographics:• http://geomap.ffiec.gov

THE HACK ON JERSEY CITY CONDO PRICES
Map Out All the Buildings
# step 1.4.3 map the buildings out
bldmaap <- ggmap(get_googlemap(
center='Grove Street, Jersey City, NJ', zoom=14,
maptype='roadmap'),extent='device') +
geom_point(data=bldgeoc, aes(x=lon, y=lat),colour='darkblue',
alpha=0.7,
na.rm=TRUE, size=5)
bldmaap
ggsave(filename="map.png",plot = last_plot(),width=3,height=3)

THE HACK ON JERSEY CITY CONDO PRICES
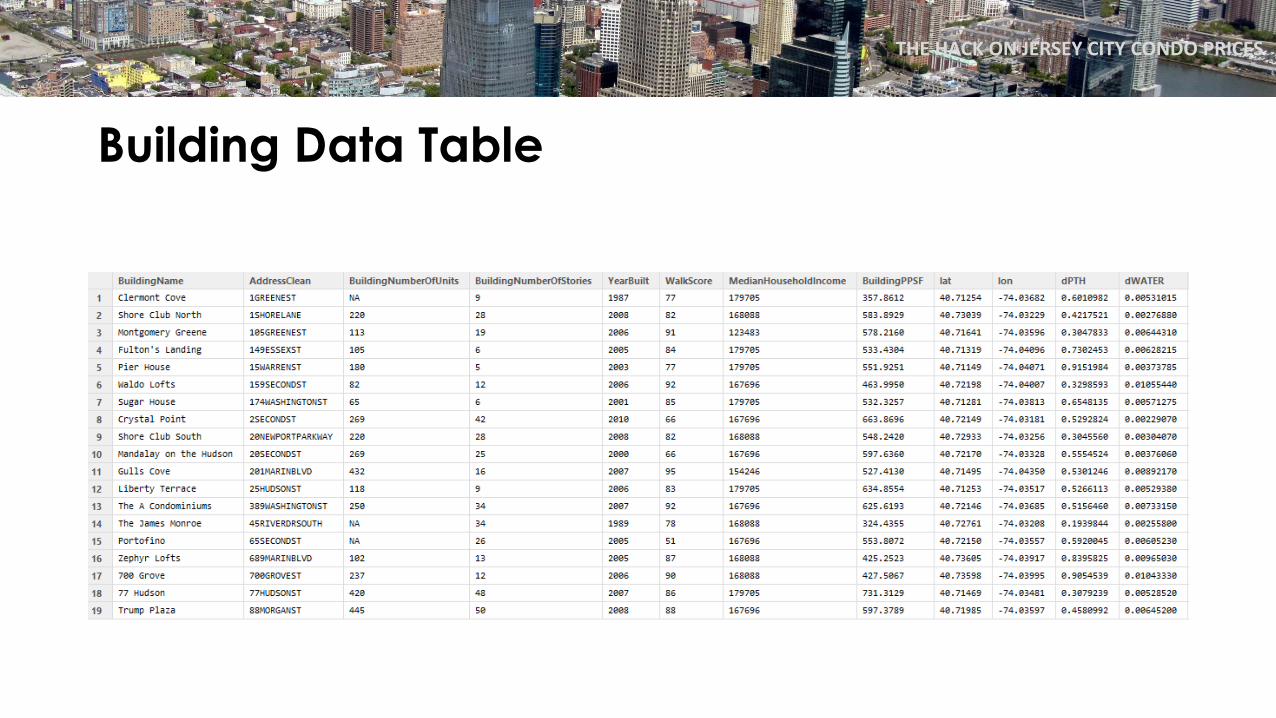
Building Attributes
For each condo building:
• Address / Lat / Lon
• Number of Units
• Number of Stories
• Year Built
• Walk Score
• Census Tract Median Household Income
• Distance to Water
• Distance to PATH (subway) Station
THE HACK ON JERSEY CITY CONDO PRICES
Building Data Table

THE HACK ON JERSEY CITY CONDO PRICES
Building Scoring System – PLSR is superior
# step 1.6 come up with a building primeness score using PCA/PLSR
bld.pcr <- pcr(BuildingPPSF ~
OrderYearBuilt+OrderWalkScore+OrderMedianHouseholdIncome+OrderDPTH+OrderDWATER, 1, data =
blddata, validation = "CV")
bld.pls <- plsr(BuildingPPSF ~
OrderYearBuilt+OrderWalkScore+OrderMedianHouseholdIncome+OrderDPTH+OrderDWATER, 1, data =
blddata, validation = "CV")
blddata$BuildingScore < predict(bld.pls,newdata=blddata)
PCA TRAINING: % variance explained
1 comps
X 35.29
BuildingPPSF 22.10
PLSR TRAINING: % variance explained
1 comps
X 29.58
BuildingPPSF 62.48

THE HACK ON JERSEY CITY CONDO PRICES
Building Scoring System – PLSR is superior

THE HACK ON JERSEY CITY CONDO PRICES
Some Cross Checking on Buildings
BuildingName calc.unit.count stated.unit.count
700 Grove 226 237
77 Hudson 407 420
Clermont Cove 97 NA
Crystal Point 257 269
Fulton's Landing 106 105
Gulls Cove 301 432
Liberty Terrace 116 118
Mandalay on the Hudson 250 269
Montgomery Greene 102 113
Pier House 99 180
Portofino 264 NA
Shore Club North 211 220
Shore Club South 214 220
Sugar House 48 65
The A Condominiums 238 250
The James Monroe 364 NA
Trump Plaza 391 445
Waldo Lofts 80 82
Zephyr Lofts 96 102
among 16 buildings with known units:
3,527 total units
3,142 units covered
89% coverage

THE HACK ON JERSEY CITY CONDO PRICES
Condo Unit Attributes
For each condo unit:
• Square Footage
• Sale Price
• Sale Date
• Floor
• Unit Number
• Building Score

THE HACK ON JERSEY CITY CONDO PRICES
Model the date dimension – price index
# step 2.3 checking condo price per sf over time (price
index)
aggu <- ddply(.data=findata[Sale.YrQtr>="1999 Q1" &
Sale.YrQtr<="2014 Q4" & !is.na(Sale.YrQtr) ,],
.variables='Sale.YrQtr',
summarize,
calc.avg.ppsf=mean(SalePrice/SqFt,na.rm=TRUE)
)
aggu$calc.avg.ppsf.r2q <-
append(rollmean(aggu$calc.avg.ppsf,
2),rep(NA,1),after=0)
aggu$calc.avg.ppsf.r4q <-
append(rollmean(aggu$calc.avg.ppsf,
4),rep(NA,3),after=0)
aggu$calc.avg.ppsf.r8q <-
append(rollmean(aggu$calc.avg.ppsf,
8),rep(NA,7),after=0)

THE HACK ON JERSEY CITY CONDO PRICES
Last Missing Variable: The View from Units
Manually entered:
using public-domain floor plan data and listing data
and consulting broker friends
Three categories:
2 – Great View
1 – Some View
0 – Nothing Special
In the future, can look for text description in listing:
- “Manhattan View”
- “Bay View”
- “Corner”
- etc.

THE HACK ON JERSEY CITY CONDO PRICES
Box Plot: Does View Matter?

THE HACK ON JERSEY CITY CONDO PRICES
Model the Price!
• Simple linear regression – one variable a time
• Multi linear regression
• Model Tree (Weka)
• Generalized Boosted Regression Models (gbm)
• Random Forest
• Cross validation all the models

THE HACK ON JERSEY CITY CONDO PRICES
Simple linear regression
# step 3.1 bi-variate linear model
findata <- read.csv("findata.csv")
modelLMSqFt <- lm(PPSF~SqFt)
summary(modelLMSqFt) #adjR2=0.0010, p<.05 OKAY NOT SIGNIFICANT
modelLMFloor <- lm(PPSF~Floor)
summary(modelLMFloor) #adjR2=0.1709, p<.05 GOOD
modelLMBuildingScore <- lm(PPSF~BuildingScore)
summary(modelLMBuildingScore) #adjR2=0.3584, p<.05 GOOD
modelLMView <- lm(PPSF~View)
summary(modelLMView) #adjR2=0.0959, p<.05 GOOD
modelLMIndex <- lm(PPSF~Index)
summary(modelLMIndex) #adjR2=0.1327, p<.05 GOOD

THE HACK ON JERSEY CITY CONDO PRICES
Multi-linear regression
# step 3.2 multi-variate linear model
modelLM <- lm(PPSF~SqFt+Floor+View+Index+BuildingScore
summary(modelLM) #adjR2=0.4602
PPSFHatLM <- predict(modelLM,findata)
RMSE(PPSFHatLM, PPSF, na.rm=TRUE) #99.17106

THE HACK ON JERSEY CITY CONDO PRICES
Model Tree
# step 3.3 model tree
modelMT <- M5P(PPSF~SqFt+Floor+View+Index+BuildingScore,data=findata)
summary(modelMT)
findata$PPSFHatMT <- predict(modelMT,findata)
RMSE(findata$PPSFHatMT, findata$PPSF, na.rm=TRUE) #86.63803

THE HACK ON JERSEY CITY CONDO PRICES
gbm
# step 3.4 gbm
findata <- read.csv("findata.csv")
modelGBM <- gbm(PPSF~SqFt+Floor+View+Index+BuildingScore,
data=findata,distribution="gaussian",n.trees=10000)
summary(modelGBM)
findata$PPSFHatGBM <- predict(modelGBM,newdata=findata,n.trees=10000)
RMSE(findata$PPSFHatGBM, findata$PPSF) #90.60208

THE HACK ON JERSEY CITY CONDO PRICES
Random Forest
# step 3.5 random forest
findata <- read.csv("findata.csv")
findata <- findata[!is.na(findata$Index),]
modelRF <- randomForest(PPSF~SqFt+Floor+View+Index+BuildingScore,data=findata)
summary(modelRF)
findata$PPSFHatRF <- predict(modelRF,newdata=findata)
RMSE(findata$PPSFHatRF, findata$PPSF) #64.49773

THE HACK ON JERSEY CITY CONDO PRICES
Cross Validation of All Models
# step 4.1 data partition
in_train <- createDataPartition(findata$PPSF, p=0.75, list=FALSE)
findata_train <- findata[in_train,]
findata_test <- findata[-in_train,]
rmse_cv <- function(k,train){
m <- nrow(train)
num <- sample(1:10,m,replace=T)
rmse <- numeric(10)
for (i in 1:10) {
data.t <- train[num!=i, ]
data.v <- train[num==i, ]
model <- <MODEL>(PPSF~SqFt+Floor+View+Index+BuildingScore,data=data.t)
pred <- predict(model,newdata=data.v)
rmse[i] <- RMSE(pred,data.v$PPSF)
}
return(mean(rmse))
}
rmse <- sapply(1:100,rmse_cv,findata_train)

THE HACK ON JERSEY CITY CONDO PRICES
Cross Validation Result
RMSE Total Universe Cross Validation
Multi-linear 99.17 99.55
Model Tree (Weka M5P) 86.63 78.46
GBM 90.60 91.67
RandomForest 64.49 82.19

THE HACK ON JERSEY CITY CONDO PRICES
Wish List Items…
• More rigorous regression diagnostics
• Tuning models better
• Model blending
• Compare with Zestimate

Related Documents