The guadua bamboo forests in the Coffee region of Colombia: beyond of carbon sequestration Juan Carlos Camargo G.

Welcome message from author
This document is posted to help you gain knowledge. Please leave a comment to let me know what you think about it! Share it to your friends and learn new things together.
Transcript
The guadua bamboo forests in the Coffee region of Colombia: beyond of carbon sequestration
Juan Carlos Camargo G.

Some reflections: From research and
possibilities of bamboo to provide ecosystems
services...

Contents
1.
Context and bamboo forests (guadua)
2. Bamboo forests and ecosystems services
3. Bamboo (guadua) and carbon sequestration
4. Final considerations
Camargo, J.C. & Arango, A.M.

1. Context…
Camargo, J.C. & Arango, A.M.

Area•
2.500.000 ha (aprox)
Elevation•
900 -
2000 m.s.m
States•
Quindío•
Risaralda•
Caldas•
Valle•
Tolima
Precipitation (annual average)
1500 -
2500 mm
Temperature (annual average)
18 -
26°C
Soils•
Andisols•
Inceptisols•
Mollisols
/Alfisols
Pac
ific
Oce
an
Pac
ific
Oce
an
PanamPanamáá
Caribbean SeaCaribbean Sea
EcuadorEcuador
PeruPeru BrasilBrasil
VenezuelaVenezuelaCoffee RegionCoffee Region
Camargo, J.C. & Arango, A.M.

The original forest cover was transformed by farmers, first to coffee plantations and thereafter to pastures (with negative consequences).
Camargo, J.C. & Arango, A.M.

Within a matrix of pastures theremnants of forest are dominatedby the bamboo species Guaduaangustifolia....
Camargo, J.C. & Arango, A.M.

Guadua angustifolia in the coffee region of Colombia
Distributed from 900 up to 2000 m
According to the last inventory 28000 ha (Kleinn & Morales 2006)
Mostly (97%) natural
Different in terms of structure and floristic composition (Ospina 2002, Camargo & Cardona 2005)
Camargo, J.C. & Arango, A.M.

Camargo, J.C. & Arango, A.M.
Pattern highly fragmented:
Riparian forests...
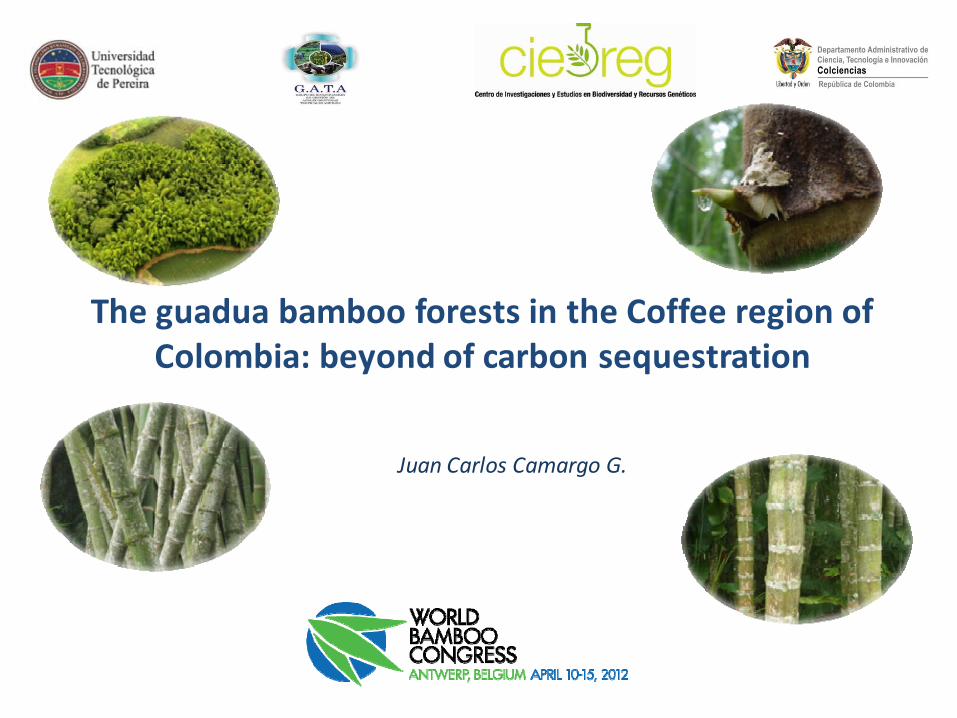
2. Guadua bamboo forests and ecosystems services
Camargo, J.C. & Arango, A.M.
• Remnants of forests
• Fragmented
• Riparian
Contribute to enhance their value

J.C. Camargo
Soil protection

300
305
310
315
320
325
330
Guadua Pasture
SWEC
(m3ha
‐1)
Soil water storage capacity ( m3 ha-1) A) and Hydraulic conductivity (cm hour-1) B) ofsoils under guadua bamboo forests and pastures. Coffee region of Colombia
A) B)
Camargo, J.C. & Arango, A.M.
0
5
10
15
20
25
Guadua Pasture
HC cm
hora
‐1
0‐5 cm
5‐10cm
10‐15 cm
15‐30 cm

05
101520253035404550
0,0 1,0 2,0 3,0
Mpa
Dep
th (c
m)
Soil compaction 2007 Soil compaction 2002
Changes in soil compaction after planting guadua. Coffee region of Colombia
Camargo, J.C. & Arango, A.M.

J.C. Camargo
Biodiversity conservation...

Biodiversity values registered within guadua bamboo forests
Organisms Number of
speciesSource Observations
Vegetation 63 Ospina
(2002) Dbh
> 10 cm
Vegetation 182 Ospina
(2002) Dbh
< 10 cm
Birds 69 Fajardo
et al. (2009)
Bats 5 Perez et al. (2009)
Camargo, J.C. & Arango, A.M.
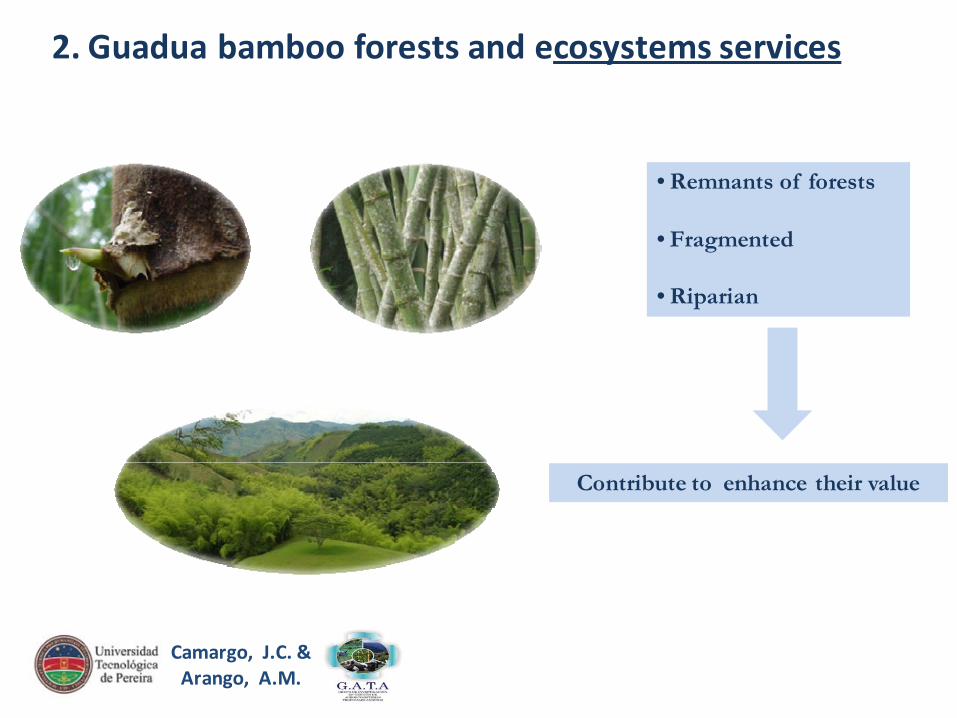
About 70% of plants biodiversityin this area is confined withinguadua bamboo patches .
Organisms fulfil ecologicalfunctions and provide benefits tosurrounding agroecosystems.
Camargo, J.C. & Arango, A.M.

Contribution to the ecological restoration
Camargo, J.C. & Arango, A.M.

Camargo, J.C. & Arango, A.M.
Camargo, J.C. & Arango, A.M.
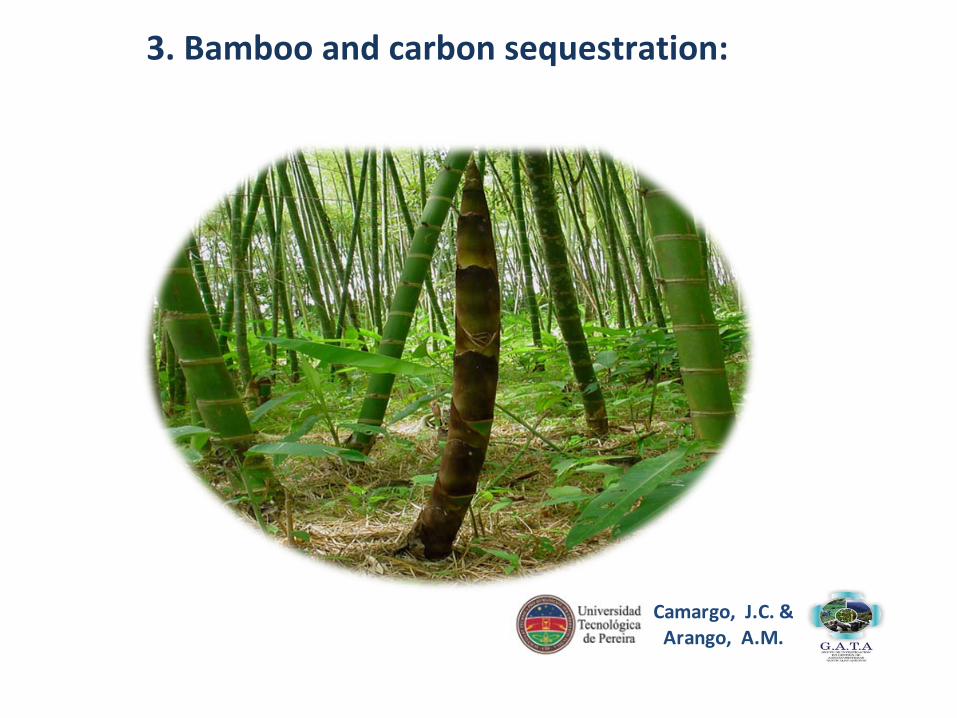
3. Bamboo and carbon sequestration:
Camargo, J.C. & Arango, A.M.
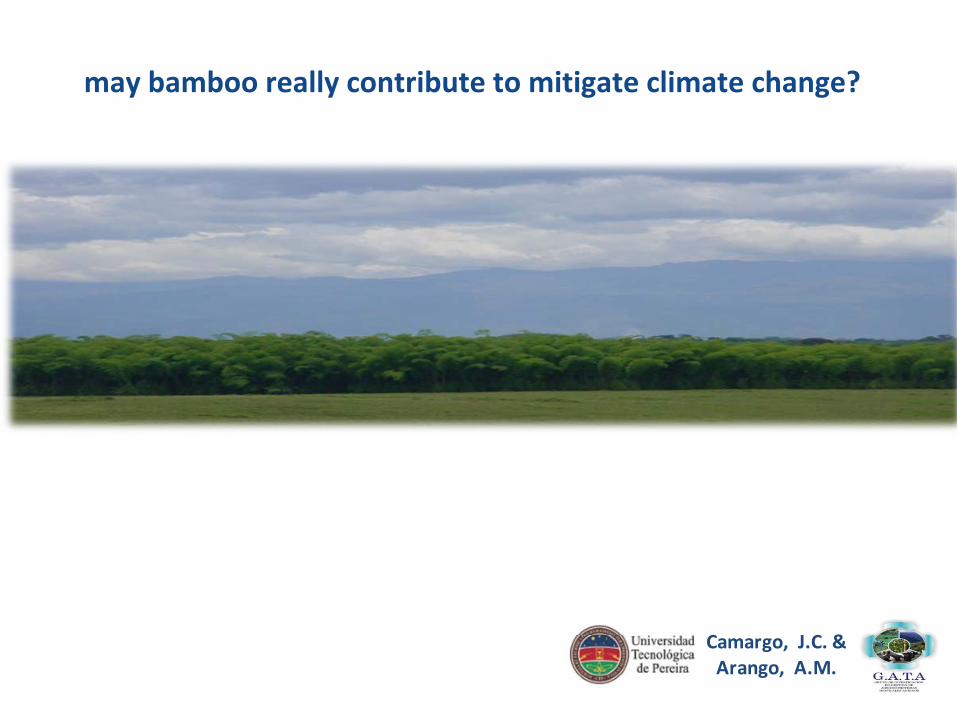
may bamboo really contribute to mitigate climate change?
Camargo, J.C. & Arango, A.M.

Camargo, J.C. & Arango, A.M.
Species Culms ha-1 C t ha-1 Reference
Guadua angustifolia 11827 20,9 (7 años) Camargo 2012Bambusa oldhammi 10101 51,98* (7 años) Castañeda-Mendoza et al. 2005Phyllostachys heterocycla 40.6* Tian-Ming y Joou-Shian. 2011Phyllostachys heterocycla 9,9 - 34.16* Xiaojun X. et al. 2011Phyllostachys heterocycla var. pubescens) 37,1 Huaqiang, et al. 2011
Phyllostachys pubescens 3300 3,1** (10 años) Lou et al. 2010Phyllostachys pubescens 91*(5-8 años) Isagi et al. 1997Bambusa bambos 149* (6 años) Shanmughavel et al. , 2002C = carbon * = Above ground carbon ; ** = Average of net anual carbon ; age in parentheses
“The answer is yes”

As bamboo culms die after 10 or 12 years (G. anstutifolia) and consequently decay.
Camargo, J.C. & Arango, A.M.
However that’s not enough :
CO2 ‐Products‐Durability

Beyond of the bamboo capacity to fix CO2, there is an economical interest...
• Standards •Approaches•Good estimates
Camargo, J.C. & Arango, A.M.

Critical factors of biomass estimates
• Species
• Growth pattern
• Density (culms per ha)
• Maturity or age (plantation vs. natural)
• Losses
• Approaches
Camargo, J.C. & Arango, A.M.

Growth pattern...
Camargo, J.C. & Arango, A.M.

Consequences:
• Mensuration should be adjusted in inventories
• Expression of growth and productivity should be modified
• Specific models and factors should be developed
Camargo, J.C. & Arango, A.M.

Density of culms per ha
Camargo, J.C. & Arango, A.M.
Distribution of stand density of sampled field plots. G.angustifolia inventory coffee region of Colombia.
1300 2500 3700 4900 6100 7300 8500 9700 10900 12100 13300 14500 15700
Density classes (number of culms per ha)
0
2
4
6
8
10
12
14
16
18
20
22
No.
of o
bser
vatio
ns

Density of culms per ha
Camargo, J.C. & Arango, A.M.
Culms per ha within a plantation of G. angustifolia. Coffeeregion of Colombia.
0
5000
10000
15000
20000
25000
0 1 2 3 4 5 6 7 8
culm
s ha
‐1
Years after planting
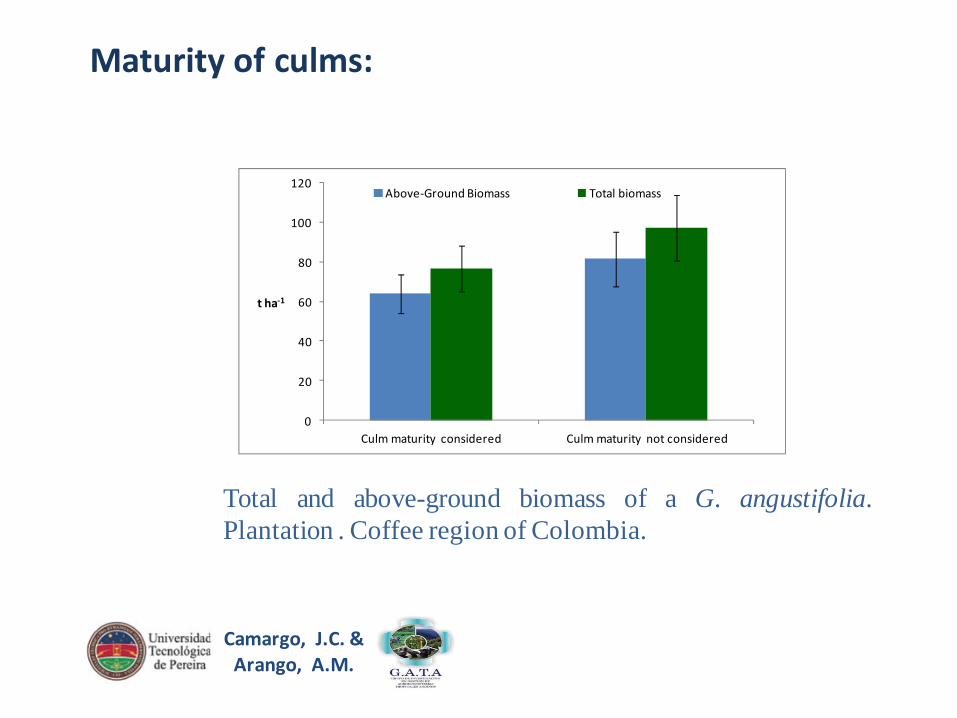
Maturity of culms:
Camargo, J.C. & Arango, A.M.
Total and above-ground biomass of a G. angustifolia.Plantation . Coffee region of Colombia.
0
20
40
60
80
100
120
Culm maturity considered Culm maturity not considered
t ha‐1
Above‐Ground Biomass Total biomass
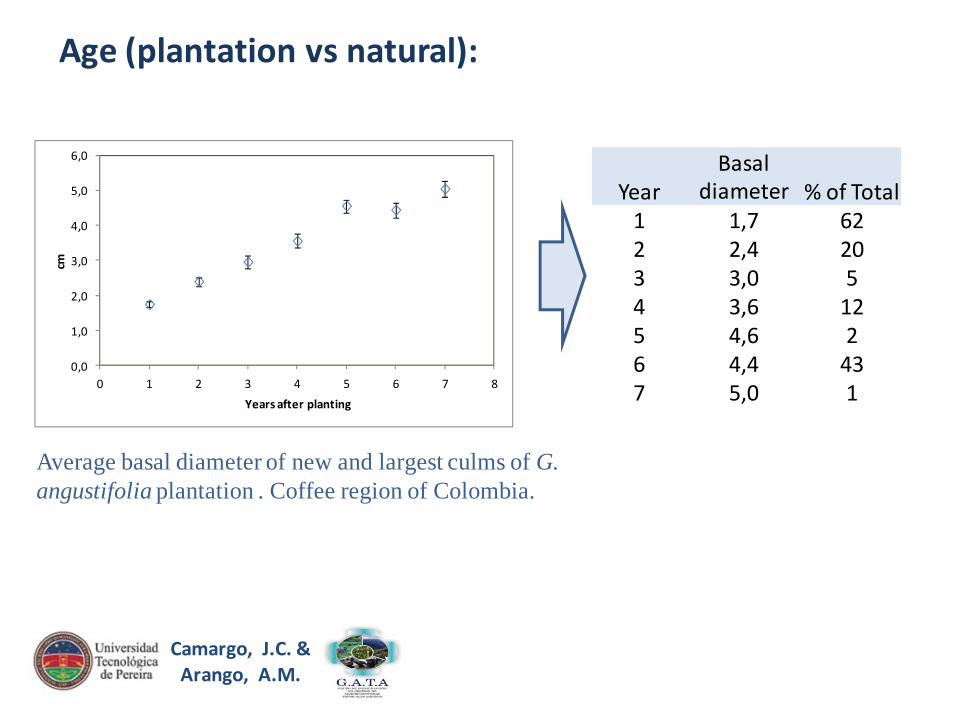
Age (plantation vs natural):
Camargo, J.C. & Arango, A.M.
Average basal diameter of new and largest culms of G. angustifolia plantation . Coffee region of Colombia.
0,0
1,0
2,0
3,0
4,0
5,0
6,0
0 1 2 3 4 5 6 7 8
cm
Years after planting
YearBasal
diameter % of Total1 1,7 622 2,4 203 3,0 54 3,6 125 4,6 26 4,4 437 5,0 1

Age (plantation vs. natural):
Camargo, J.C. & Arango, A.M.
Diameter distribution for the total number of sampled culms. The empiricaldistribution and the fitted Weibull function (n=6242). G. angustifolia. Naturalstands coffee region of Colombia
0.000.020.040.060.080.100.120.140.160.180.20
3 4 5 6 7 8 9 10 11 12 13 14 15 16 17 18 19 20
d (cm)
Rel
ativ
e fr
eque
ncy…
. Empirical distributionEstimated Weibull

Losses:
Camargo, J.C. & Arango, A.M.
New (shoots) and estimated dead culms per clump over time, comparedaccumulated precipitation (mm) during the time prior to data gathering.Vertical bars indicate the standard error
-15
-10
-5
0
5
10
15
0 90 180 270 360 450 540 630
Days after planting
Cul
ms
per c
lum
p.
0
100
200
300
400
500
600
700
800
900
Prec
ipita
tion
(mm
) .
New culms per clump Estimated dead culms per clump Precipitation

Approaches
Camargo, J.C. & Arango, A.M.
Biomass t ha-1 of natural bamboo forestsestimated by difference approaches: Fromdestructive samples, fitting allometric modeland BEF (volume, wood density).
0
50
100
150
200
250
Measured Allometric model Inventory(BEF)
t ha‐1
Remote sensing images...
8,6 m

In the framework of REDD+:Forest degradation and deforestation should be
demonstrated:
Pressure from nearby land uses?
Camargo, J.C. & Arango, A.M.
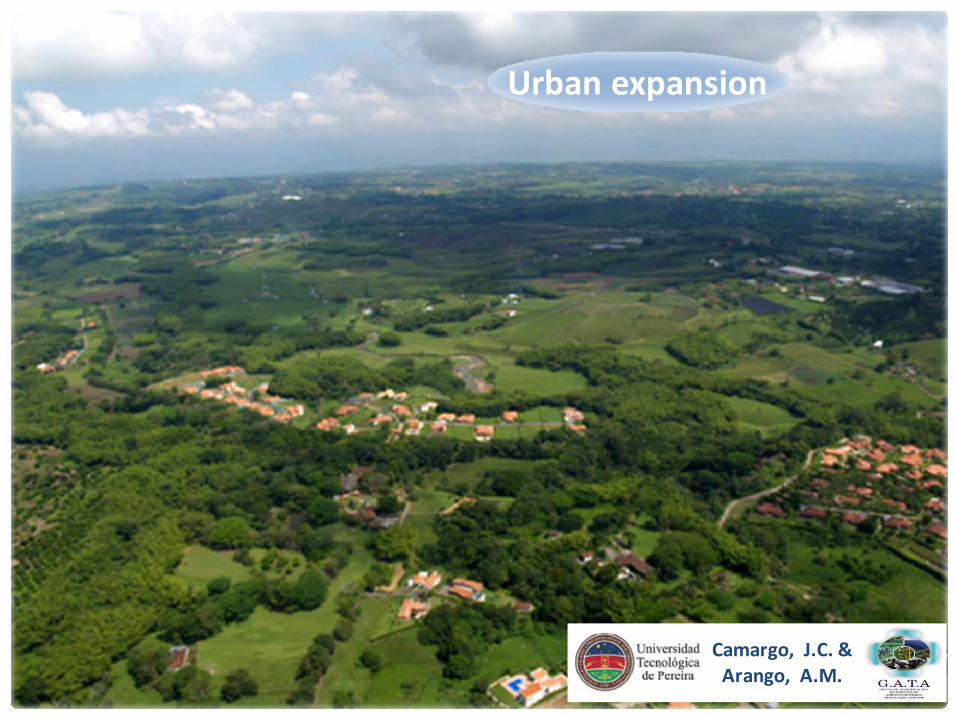
Urban expansion
Camargo, J.C. & Arango, A.M.

Degradation associated with management?
Camargo, J.C. & Arango, A.M.
Harvest is done on selected culms (low
scale)

Opportunities from forest governance and forest planning
Camargo, J.C. & Arango, A.M.

Forest Governance Forest Certification
Experiences with Local
governments
Proper Management
Camargo, J.C. & Arango, A.M.

4. Final considerations• Good estimates = good information= better decisions
• Guadua
forests are more than carbon: other ecosystems services, products.
• Guadua
products are the key for maintaining carbon stored (stable)
•The so called here: critical factors on bamboo carbon estimates, should be studied and analysed. Research should be
addressed to these topics.
• Forest planning and forest governance can contribute with REDD initiatives. Camargo, J.C. &
Arango, A.M.

Thanks¡
Camargo, J.C. & Arango, A.M.
Related Documents