1 The Growth Effectiveness of Fiscal and Monetary Policies: Empirical Analysis in the Case of Pakistan Muhammad Usman and Miraj-ul-Haq 1 ABSTRACT Empirical indication on the growth effectiveness of monetary and fiscal policies is still debatable. Hence, this study aims to investigate this inconclusiveness by illustrating depictions by two major schools of thought in economics that is classical and Keynesian. To meet the objective we have empirically estimated both short run and long run dynamics of fiscal and monetary policies. The Johansson Juselius (1990) approach of co-integration in a VECM setting is used for empirical analysis, which is based on time series data over the period of 1972 to 2015. The results of Trace test and Maximum Eigenvalue validate the existence of co-integration among fiscal policy, monetary policy and economic growth in case of Pakistan. The result of impulse response function shows that both fiscal and monetary policies positively affect the growth of GDP per capita in the long run. Key Words: Monetary policy, Fiscal policy, Economic Growth, Co-integration JEL Classification: ES2, H30, O40, C32 1 Introduction Currently, both monetary and fiscal policies accorded prominent role in the pursuit of macroeconomic stabilization, however the relative importance of these policies have been a serious debate between the two major school of thoughts that Keynesians and the Monetarists. The Monetarists believe that monetary policy exert greater impact on economic activities, whereas the Keynesian believe that fiscal policy rather than the monetary policy exert greater impact on economic activities. 1 Muhammad Usman is MS scholar at International Institute of Islamic Economics, International Islamic University, Islamabad, E-mail: [email protected]. Miraj-ul-Haq is Assistant Professor at International Institute of Islamic Economics, nternational Islamic University, Islamabad, E-mail: [email protected].

Welcome message from author
This document is posted to help you gain knowledge. Please leave a comment to let me know what you think about it! Share it to your friends and learn new things together.
Transcript

1
The Growth Effectiveness of Fiscal and Monetary Policies:
Empirical Analysis in the Case of Pakistan
Muhammad Usman and Miraj-ul-Haq1
ABSTRACT
Empirical indication on the growth effectiveness of monetary and fiscal policies is still
debatable. Hence, this study aims to investigate this inconclusiveness by illustrating depictions
by two major schools of thought in economics that is classical and Keynesian. To meet the
objective we have empirically estimated both short run and long run dynamics of fiscal and
monetary policies. The Johansson Juselius (1990) approach of co-integration in a VECM setting
is used for empirical analysis, which is based on time series data over the period of 1972 to 2015.
The results of Trace test and Maximum Eigenvalue validate the existence of co-integration
among fiscal policy, monetary policy and economic growth in case of Pakistan. The result of
impulse response function shows that both fiscal and monetary policies positively affect the
growth of GDP per capita in the long run.
Key Words: Monetary policy, Fiscal policy, Economic Growth, Co-integration
JEL Classification: ES2, H30, O40, C32
1 Introduction
Currently, both monetary and fiscal policies accorded prominent role in the pursuit of
macroeconomic stabilization, however the relative importance of these policies have been a
serious debate between the two major school of thoughts that Keynesians and the Monetarists.
The Monetarists believe that monetary policy exert greater impact on economic activities,
whereas the Keynesian believe that fiscal policy rather than the monetary policy exert greater
impact on economic activities.
1 Muhammad Usman is MS scholar at International Institute of Islamic Economics, International Islamic University, Islamabad,
E-mail: [email protected]. Miraj-ul-Haq is Assistant Professor at International Institute of Islamic Economics,
nternational Islamic University, Islamabad, E-mail: [email protected].

2
Monetary Policy works under the central bank of an economy that control money supply
by setting exchange rate and interest rate. Monetary policy is concerned with the measures used
to regulate money supply and credit in the economy with aim to achieve outcomes of the higher
economic growth and price stability. Hence, the monetary policy has ability to control the
circulation of money and costs of borrowing money known as interest rate. However, one of the
main goals of monetary policy is to prevent excessive inflation while fostering economic growth
(Noman and Khudri2015).
The Keynesians school of thought pointed out several short comings of monetary policy
especially, when an economy gets stack in liquidity trap and argued that the feasible way out is
the fiscal policy. Keynesian theorists focus on the liquidity trap as extremely special case,
whereas monetary policy becomes inefficient. In the liquidity trap situation, interest rate reaches
its minimum level and further increase in money supply will not lead to the interest rate
reduction. In such situations public investment must be large enough to provide expenditure
equal to the full employment output. As monetary policy will fail to increase investments, hence
to restore full employment, whereas, fiscal policy will increase the output through rising
government expenditures.
According to Keynesian view government’s fiscal policy influences the level of
aggregate demand, price stability, full employment and economic growth. As the central
government has control over fiscal policy, hence government can change it through tax cut or
change in public expenditure, which directly affects economic and business activities. However
some studies not agreed to the Keynesian view, for instance, Buiter (1976) argued that, “fiscal
policy is considered as less effective or ineffective because of the crowding out effect”. The
3
contribution of government on aggregate demand has also been controversial among policy
makers as well as academicians.
Analyzing the monetary policy influence on fiscal policy, interest rates and inflation rates
can be identified as direct tools for communication. Interest rate level and volatility have impact
on fiscal positions as it directly influences servicing costs and sustainability of debt. Similarly,
the level and volatility of inflation rates have impact on public finances. Public finances become
more unpredictable and fiscal planning is extremely difficult, when price inflation contributes to
the public expenditures that are increased through salaries for public employees. Moreover, high
inflation rate reduces the actual value of debt obligations and leads to the increase in real tax
burden. A number of studies have analyzed the impact of monetary policy on fiscal policy in
case of Pakistan for instance Jawaid, et al, 2010; Jawaid, et al. 2011; Chowdhury, et al. 2015
among others.
Fiscal policy also has an impact on monetary policy. If the fiscal policy is expansionary,
which increase the aggregate expenditures and aggregate demand through an increase in
government spending or a decrease in taxes. Increase in government expenditures results in the
reduction of economic growth level and requires a restrictive monetary policy (Rakic B. et al.
2013). Fiscal policy components like unproductive public projects and ineffective tax systems
unfavorably impact the potential level of economic growth and require more restrictive monetary
policy. (Jawaid, S. T. et al. 2010). “Monetary and fiscal policies are interrelated in numerous
ways, and this puts additional pressure on the monetary and fiscal authorities to pool resources in
order to accomplish efficient outcomes” (Jawaid, et al. 2010 and Khan and Qayyum 2007).
The empirical studies using monetarist models suggest that monetary action have a
greater impact on economic activities in both developed and developing countries, where the

4
Keynesian believes that fiscal policy rather than the monetary policy exert greater influence on
economic activities. The empirical research has not reached any conclusion concerning both the
fiscal and monetary policy in case of single economy. In case of Pakistan the existing literature
(Fatima and Iqbal (2003), Alam Ali et al. (2008), Muhammad et al. (2009), Jawaid et al. (2010),
Mahmood and Sial 2011, and Kakar (2011)) emphasized in the effectiveness of fiscal and
monetary policies. However these studies have not analyzed the responses of these policies to
each other. Keeping in view the literature gap, this study investigated the role and relative
growth effectiveness of fiscal and monetary policies. In addition, we analyzed the responses of
monetary policy and fiscal policy to each other.
The rest of the study is organized as follows; Section 2 presents relevant literature on
fiscal and monetary policies and economic growth. Section 3 explores the major channels
through which fiscal and monetary policies response to economic growth in Pakistan. Section 4
presents model specification. Section 5 presents data processing and estimation technique. Study
concluded with section 6, which draws key findings extracting from the study.
2 Review of Literature
Recently, a well established segment of economic literature discussed the interaction
between fiscal and monetary policies. A cascade of literature addressing the issue is on hand and
progress is still continued. A number of studies assert about the positive role of government in
stimulating economic growth, while other challenges government intervention, considering
monetary policy mainly responsible for economic progress. However, emerging group of
economists now purports that a more coordinated and co-operated fiscal and monetary policy can
do better for economic growth. In this association this session of the study is devoted to present
review of existing studies about the subject.
The one comprehensive work have been carried out by Ahmed and Malik (2009).
Generalized Method of Moments (GMM) estimation technique was used for dynamic estimation
of panel data. The study concluded that financial sector development affects per capita GDP;

5
through inefficient resource allocation also estimates that the increase in domestic rather than
foreign capital accumulation is instrumental in increasing per worker output and hence
promoting economic growth in the long run. However the role of government consumption
expenditure on economic growth remains adverse due to its detrimental effects on resource
allocation efficiency.
Fatima and Iqbal (2003) developed a multivariate model and test the effectiveness of
monetary and fiscal policy for the economic growth at five Asian countries (Pakistan, India,
Thailand, Indonesia and Malaysia). Johansen and Juselius method were used and multivariate co-
integration methodology for long-run relationship among variables. In case of Thailand study
found bi-directional causality, while in case of Indonesia, Pakistan, India and Malaysia the study
found the uni-directional causality between the variables. They come with the conclusion that the
effectiveness of policy differs from country to country depending upon the nature of the
economy in question.
Jawaid et al. (2010) investigated the comparative analysis of monetary and fiscal policy
in case of Pakistan’s economy. Johansson Juselius (1990) estimation technique was used for long
run co-integration relationship among economic growth, fiscal and monetary policies. According
to their findings in case of Pakistan monetary policy is more effective as compare to fiscal
policy. In addition, the co-integration test confirms that there is long run positive relationship
among monetary, fiscal policies and economic growth.
Similarly, Alam and Waheed (2006) analyzed the sectoral effects of monetary policy in
Pakistan. Results from the sub-sample estimation indicate that the major changes in the
transmission of monetary shock to variation in real activity. Following monetary tightening,
aggregate output decline and bottoms out after second quarters. The manufacturing wholesale
and retail trade and insurance sector seems to decline more in response to the interest rate
shocks.
Jawaid, et al. (2011) analyzed the nexus among monetary-fiscal-trade policies and
economic growth in case of Pakistan using the time series data. The results of the study indicates
that fiscal and monetary policies have positive and significant impact on economic growth in the
short run, while trade policy have no significant impact on economic growth. The results of co-
integration and error correction model revealed that there is positive and significance relationship

6
between monetary policy, fiscal policy and economic growth in case of Pakistan. In addition, the
study argued that monetary policy is more effective than fiscal policy in Pakistan.
Hussain and Siddiqi (2012) test the fundamental relationship between fiscal, monetary
policies and institutions in Pakistan. The insight of co-integration was narrated with the long run
equilibrium association among variables. According to the study findings monetary policy and
economic institutions are more effective rolled in increased in per capita GDP and revenue but
political and social institutions had no significant role. Based on study findings, it is suggested
that the government of Pakistan should take steps to improve the efficiency among fiscal aspects
and pay special attention to increase the performance efficiency of institutions.
Khan and Qayyum (2007) estimated monetary policy shocks in case of Pakistan. In this
association the study applied the Monetary Condition Index (MCI) for weighted sum of changes
in short term interest rate and exchange rate relative to value in base period [developed by
Bernanke and Mihov (1998)]. An individual Coefficient of estimated results of Monetary
Condition Index (MCI) performs better than both the Summarized MCI coefficient and overall
measure proposed by Bernanke and Mihov (1998). The analysis concluded that MCI (IS-
individual coefficient) plays an important role in determining output and inflation when the
economy is not dominated by supply shocks. In addition, the study found that in case of Pakistan
supply shocks are dominated, and exchange rate channel is more important than interest rate
channel.
Cyrus and Elias (2014) investigated the impact of fiscal and monetary policies by using
variance decomposition and impulse response function and found that fiscal policy has
significance and positive impact on real output growth in Kenya, while monetary policy shocks
have contradiction with fiscal policy shocks.
Akanni and Osinow (2013) analyzed the effect of fiscal instability on economic growth in
Nigeria. According to study findings that both total and capital fiscal spending had negative
relationship with economic growth while recurrent fiscal spending was on the contrary. In
addition, the study found that trade openness and size of labor force had significantly and
positively affected economic growth.
Similarly, Noman and Khudri (2015) estimated the effects of fiscal and monetary policies
on economic growth in case of Bangladesh. The estimated variables of both the policies shows

7
significant impact on Bangladesh’s economic growth which implies that both policies were
balanced and correspondingly contribute in the economic growth of Bangladesh economy.
In similar line Chowdhury and Afzal (2015) investigated the effectiveness of monetary
policy and fiscal policy in Bangladesh. The results of Engle Granger test, Trace Statistics and
Maximum Eigen value test shows that there is positive and significant relationship among fiscal
policy, monetary policy and economic growth in Bangladesh.
Tesfay (2010) investigated the relative effectiveness of fiscal and monetary policies on
economic growth in case of Ethiopia, with the objective of finding out the relative strength of
monetary and fiscal policies on economic growth. According to study findings, both money
supply and government expenditure were found statistically insignificant to influence the real
variables such as GDP and export. However, in the long term, policy variables can only control
nominal variables such as inflation and the exchange rate.
3 Fiscal and Monetary Policies Structure in Pakistan
3.1 Fiscal Policy Structure in Pakistan
In Pakistan federal government budget categorizes in two parts; that is public revenue
and expenditure. The key objective of fiscal policy is to enhance and sustain economic growth
and therefore to reduce unemployment and poverty. By imposing taxes the government receives
revenue from the populace (population). The government spending take in form of wages to
government employees, development expenditure, social security benefits, health, education,
defense etc.
Figure 1: Fiscal Policy Strecture in Pakistan
Source: Government of Pakistan (2015), Finance Devision.
Fiscal Policy
Govt Revenue
Net Taxes = Taxes -(Transfer Payments
+ Subsidy)
Govt Expenditure
Subsidy

8
3.1.1 Government Revenue
Accorging to Federal Borad of Revenue (FBR) there are two basic catagories of revenue
collection in pakistan’s economy. First, Inland revenue which is the major source of revenue, in
fiscal year 2014-15, it hold about 54% of total revenue collection. Inland revenue has three
different classification that is income tax, sales tax and federal excise duties. The share of direct
tax is 39%, share of sales tax is 44%, and share of federal excise duty is 6% in inland revenue.
Second, Customs Wings in fiscal year 2014-15, its collection is 11% of the total revenue
collection.
Figure 2: Protfolio of Public Revenues
Source: Federal Borad of Revenue; Government of Pakistan (2013-2014)
Government of Pakistan gives complete synopsis of fiscal policy 2015-16. Which
provides information on revenues and expenditures budgeted for financial year 2015-16 along
with budget estimates and revised estimates for the outgoing financial year 2014-15. The
budgeting and accounting classification system used in the budget remains the same which was
adopted under the New Accounting Model introduced in financial year 2004-05. The Medium
Term Budgetary Framework (MTBF) process, initiated in the financial year 2009-10 has been
strengthened with experience. Tax revenue in financial year 2014-15 is about 73% of total
revenue and non-tax revenue in same year is 27% of total revenue collected by financial sector of
Pakistan.

9
Table 1: Revenue collected by the Government of Pakistan Year Tax revenue (%) Non-tax revenue (%) Rs in Million
2005-06 66.1 33.9 1,077,000
2006-07 61.26 38.74 1,163,000
2007-08 59.14 40.86 1,545,500
2008-09 66.18 33.82 1,783,602
2009-10 72.28 27.72 2,051,944
2010-11 75.1 24.9 2,235,889
2011-12 79.8 20.2 2,536,752
2012-13 74.9 25.1 2,836,562
2013-14 69.88 30.12 3,597,142
2014-15 73.63 26.37 3,952,472
Source: Government of Pakistan (2015), Finance Devision.
Figure 3: Protfolio of Public Revenues According to Ministry of Finance
Source: Government of Pakistan (2015), Finance Devision.
GOVERNMENT REVENUE
Tax Revenue
Direct Tax
Income Tax
Corporate Tax
Capital Value Tax
Indirect Tax
Sale Tax
customs duties
other taxes
Non-Tax Revenue
Income from Property & Enterprise
Recipts from Civil Administration &
other Function
Miscellaneous Recipts

10
3.1.2 Government Expenditure
The federal government of Pakistan has divided the total expenditure in two main parts
namely current expenditure, and development expenditure. The share of current expenditure in
total public spending is 82.19% and development spending is 17.81 in fiscal year 2014-15. The
major parts of total public spending are general public service which is 59.75%, defense is 17%,
and Public Sector Development Program (PSDP) is 12.79%. However, the two major sectors
(education and health) hold just 2% of total public spending.
Figure 4: Portfolio of Public Expenditure in Pakistan
Public Expenditure
Current Exp(82.19%)
General Public Service(95.75%)
Defence Affairs & Services(17.00%)
Economic Affairs(1.3%)
Public Order and Safety Affairs(2.07)
Education Affairs and Services(1.52%)
Recreation, Culture and Religion(0.17%)
Health Affairs & Services(0.24)
Housing and Community
Amenities(0.05%)
Social Protection(0.06%)
Environment Protection(0.02%)
Development Exp(17.81%)
Federal PSDP(12.79%)
Development Loans & Grants to Provinces(1.89%)
Other Development Expenditure(3.12%)

11
Source: Government of Pakistan (2015), Finance Devision.
3.2 Monetary Policy Structure in Pakistan
Monetary policy is the process by which the monetary authority of a country control the
supply of money, often targeting a rate of interest for the purpose of promoting economic growth
and stability. In Pakistan, the State Bank of Pakistan has the authority to adopt the tight, neutral
or loose monetary policy. The key objectives of a monetary policy in Pakistan are economic
growth, price stability, exchange rate stability, balance of payments (BOP) equilibrium,
employment, neutrality of money, equal income distribution and credit control.
Figure 5: Structure of Monetary Policy in Pakistan
Source: State Bank of Pakistan (2015).
3.2.1 Direct Monetary Policy Tools
Monetary policy tools are used to manage interest rates, credit and lending. These include
direct credit control, direct interest rate control and direct lending to banks as lender of last
resort, but they are rarely used in the implementation of monetary policy by the State Bank of
Pakistan.
Monetary Policy Instruments
Direct Monetary Instrument
Interest Rate Contorls
Credit Controls
Lending to Commercial
Banks
Issue of New Currency
Deficit Financing
Indirect Monetary Instrument
Reserve Requirements
Secondary Reserve Requirement
Cash Reserve Requirement
Securities Requirement
Open market Operations
12
3.2.2 Indirect Monetary Policy Tools
Compare to direct monetary policy tools, indirect monetary policy tools are used more
widely than direct tools, indirect policy tools seek to alter liquidity conditions. While the use of
reserve requirements has been the traditional monetary tool of choice, more recently, the State
Bank of Pakistan shifted towards the use of open market operations to manage liquidity in the
financial system and to signal its policy stance. The main factors included in monetary policy are
money supply, interest rates, exchange rate, open market operation and inflation rate.
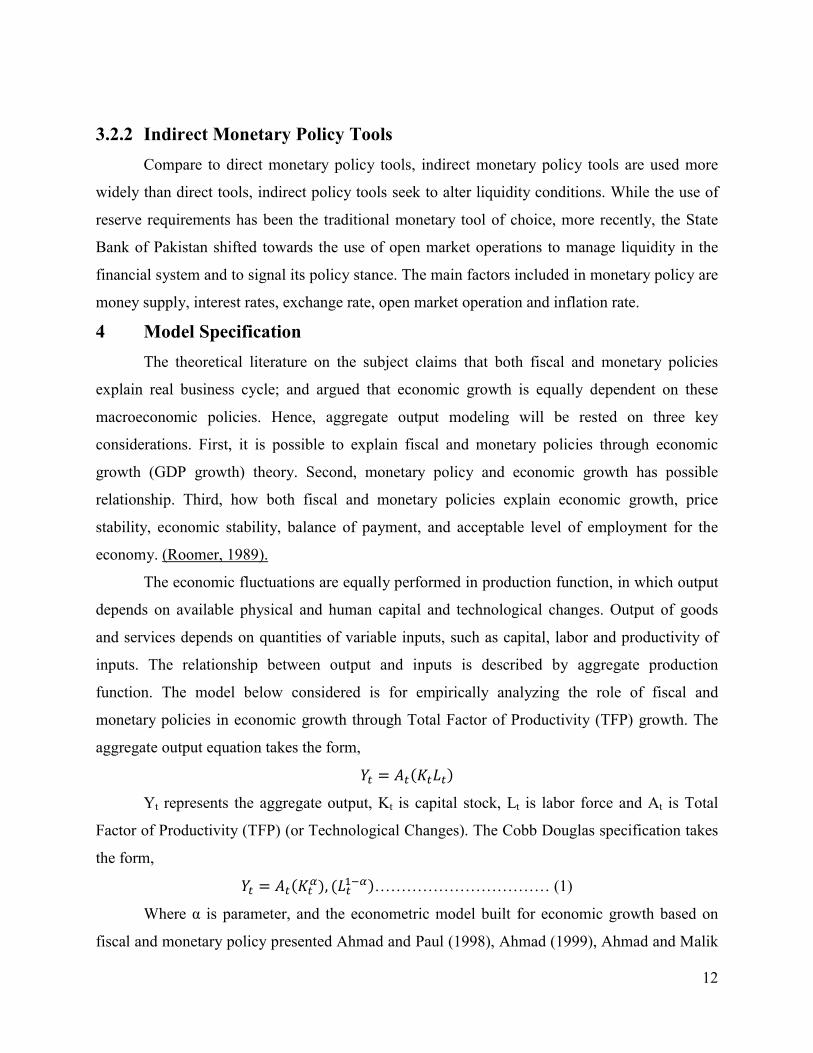
4 Model Specification
The theoretical literature on the subject claims that both fiscal and monetary policies
explain real business cycle; and argued that economic growth is equally dependent on these
macroeconomic policies. Hence, aggregate output modeling will be rested on three key
considerations. First, it is possible to explain fiscal and monetary policies through economic
growth (GDP growth) theory. Second, monetary policy and economic growth has possible
relationship. Third, how both fiscal and monetary policies explain economic growth, price
stability, economic stability, balance of payment, and acceptable level of employment for the
economy. (Roomer, 1989).
The economic fluctuations are equally performed in production function, in which output
depends on available physical and human capital and technological changes. Output of goods
and services depends on quantities of variable inputs, such as capital, labor and productivity of
inputs. The relationship between output and inputs is described by aggregate production
function. The model below considered is for empirically analyzing the role of fiscal and
monetary policies in economic growth through Total Factor of Productivity (TFP) growth. The
aggregate output equation takes the form,
�� = ��(����)
Yt represents the aggregate output, Kt is capital stock, Lt is labor force and At is Total
Factor of Productivity (TFP) (or Technological Changes). The Cobb Douglas specification takes
the form,
�� = ��(���), (��
���)…………………………… (1)
Where α is parameter, and the econometric model built for economic growth based on
fiscal and monetary policy presented Ahmad and Paul (1998), Ahmad (1999), Ahmad and Malik

13
(2009) and Akanni and Osinowo (2013). The intensive form (per worker form) equation 1 is
presented as follows:
��
��= �(
��
��)�………………………. ……………… (2)
Taking log equation 2 can be written as;
���(��
��) = ���� + � log(
��
��). . .. …. . . .. … . .. … . . .. .. …. . . . ... . (3)
Equation 3 indicates that there are two main sources of economic growth namely TFP growth
and capital accumulation. In this study our objective is to investigate the impact of fiscal and
monetary policies, on these sources of economic growth. The government expenditure can
directly intervene into the economy through government investment in public capital (Akanni
and Osinow 2013). Government directly and indirectly influences the way the resources are used
in the economy. Hence, fiscal policy increases the aggregate demand directly through an increase
in public expenditure, which is typically called expansionary fiscal policy. Although, in contrast
fiscal policy is often considered contractionary (tight) if it reduce the demand via lower spending
(Akanni and Osinow 2013). The demand for goods is a decreasing function of real interest rate,
because high interest rates reduce investment demand and increases savings. This model was
used to analyze the effect of changes in monetary policy and fiscal policy on the economic
growth rate. An expansionary fiscal policy increases the interest rate and output in short run,
also an expansionary monetary policy reduces the interest rate and increases the output in short
run( Cyrus and Elias, 2014).
There are two different approaches for constructing the model further to capture the fiscal
and monetary policies influence on economic growth. First approach is to estimate fiscal and
monetary policies variable on each of three variables as appear in equation 3. The TFP, fiscal and
monetary policy accumulations are substitute in the estimated growth equation 3. The limitation
of this equation is that it requires separate estimation of the TFP series before regressing it on
fiscal and monetary structure. The other approach is to substitute the algebraic expression
indicating the relationship of TFP with fiscal and monetary variables in to growth equation as
specified by Ahmad and Malik, 2009. Follow Ahmad and Malik 2009 the linear relationship to
determine TFP.
�� = �� + ����� + ������ + ����� + ����� +∈�. . . . … . . . . . .. … …. . . . . . . (4)

14
Where GEt, TAXt, MSt, ERt, are government expenditure, tax revenue, broad money, and
exchange rate respectively while ɛt is residual term.
Thus both fiscal and monetary policies influence TFP, furthermore government expenditure,
government tax revenue, money supply and exchange rate are an important source of TFP
growth. Because they are direct indicators for influence the price stability of the economy (Cyrus
and Elias, 2014). Other control variables that affect the TFP are government subsidies to private
sector, transfer payment, interest rate, bank reserve ratio, and open market operation. According
to Cyrus and Elias, 2014 these variables are indicate the macroeconomic stability.
The fiscal and monetary policy variables are included in capital equation and determine
the capital accumulation into GDP per capita in Pakistan, which is linear combination of fiscal
and monetary policy and control variables.
�� = �� + ����� + ������ + ����� +����� + ������ + ��. . . . . . .. .. . . . . . . . . (5)
Substitution of equation 4 and 5 into 3 and simplifying collectively fiscal and monetary
policy variables also adding the lagged of output term to capture growth inertia yields the
following estimable equation.
���� = �� + ����� + ������ + ����� + �����+����� + �������� +∈�.. . . .. . ……… (6)
The above equations (equation 5 and 6) provide an integrated framework for
understanding how fiscal and monetary policies influence long-run economic growth TFP and
capital accumulation. This framework capture Schumpeter’s (1934) view of finance and
development that highlights the impact of financial system on productivity growth and
technological change. The framework also incorporates a vast development economics literature
arguing that capital accumulation is the key factor underlying economic growth (Ahmad and
Malik 2009).
5 Data Processing and Estimation Technique
We used annual time series data over the period of 1972 to 2015 collected from the world
development indicators and State bank of Pakistan. We took GDP per capita as proxy of
economic growth, general government final consumption expenditure (% of GDP) and net taxes
on products (current US$) as proxy of fiscal policy and official exchange rate (LCU per US$,
period average), and Broad money (% of GDP) as proxy of monetary policy while gross fixed
capital formation (% of GDP) taken as capital accumulation.

15
Before carrying out a formal analysis, we need to check the initial requirements of time
series annual data for the period of 1972 to 2015. Moreover every time series data has trend and
to find the pattern of trend we applied the unit root test. The results of Augmented Dickey Fuller
(ADF) test are given below in table 2. Based on the Augmented Dickey Fuller (ADF) test, we do
not reject null hypothesis and all variables are non-stationary at level. But in case of first
difference we reject null hypothesis and all variables are integrated at order 1, and order of
integration is I (1).
Table 2: Augmented Dickey Fuller (ADF) Results
Variables Level 1st Difference
Intercept Intercept and
Trend
Intercept Intercept and
Trend
GDPt 2.6542
(1.0000)
0.1752
(0.9971)
-5.0356
(0.0002)*
-5.6271
(0.0002)
GEt -1.5825
(0.4827)
-1.5067
(0.8118)
-5.3811
(0.0001)*
-5.3236
(0.0004)
TAXt 0.8984
(0.9946)
-1.2729
(0.8813)
-6.7148
( 0.0000)*
-6.9529
(0.0000)
MSt -1.8356
(0.6588)
-5.3309
(0.1385)
-6.8936
(0.0000)*
-6.7167
(0.0000)
ERt 0.0237
(0.9555)
-1.7638
(0.7047)
-4.7956
(0.0003)*
-4.7850
(0.0020)
KFt -2.1562
(0.2247)
-2.4563
(0.3471)
-4.9902
(0.0002)*
-5.2903
(0.0005)
*Shows level of significance at 1% level.
5.1 Co-Integration Results
After sighting the behavior of stationarity, results of all variables are integrated at first
order. In order to estimate the equation 6, we use the Johansen and Juselius (1990) co-integration
approach which determine two likelihood ratio tests. Trace test and maximum Eigenvalue test
and it is more reliable for small sample (Mukhtar and Rasheed, 2010). Trace test use for joint co-
integration and null hypothesis is no co-integration (HO: r =0) and alternative hypothesis is co-
integration (H1: r >0). The maximum Eigenvalue test finds a separately co-integration vector. In
16
Johansen approach, the numbers of co-integration vectors are determined for non-stationary time
series and numbers of restrictions are imposed with Vector Autoregressive (VAR) known as a
vector error correction model (VECM).
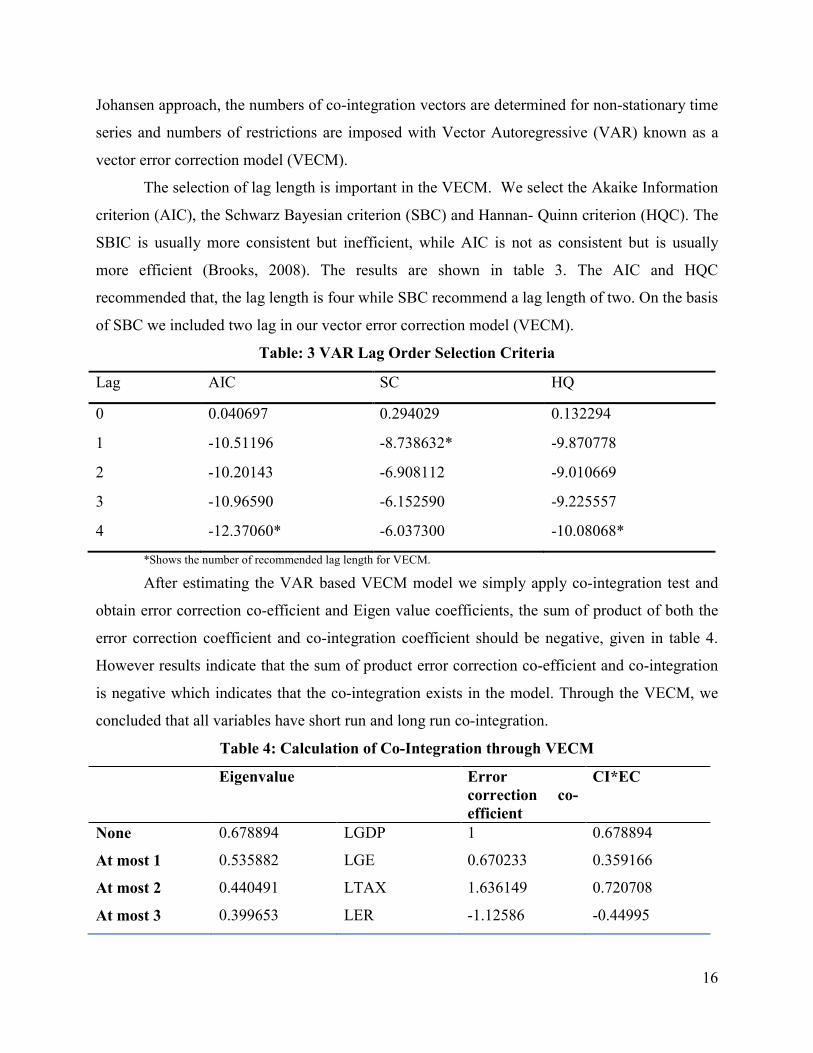
The selection of lag length is important in the VECM. We select the Akaike Information
criterion (AIC), the Schwarz Bayesian criterion (SBC) and Hannan- Quinn criterion (HQC). The
SBIC is usually more consistent but inefficient, while AIC is not as consistent but is usually
more efficient (Brooks, 2008). The results are shown in table 3. The AIC and HQC
recommended that, the lag length is four while SBC recommend a lag length of two. On the basis
of SBC we included two lag in our vector error correction model (VECM).
Table: 3 VAR Lag Order Selection Criteria
*Shows the number of recommended lag length for VECM.
After estimating the VAR based VECM model we simply apply co-integration test and
obtain error correction co-efficient and Eigen value coefficients, the sum of product of both the
error correction coefficient and co-integration coefficient should be negative, given in table 4.
However results indicate that the sum of product error correction co-efficient and co-integration
is negative which indicates that the co-integration exists in the model. Through the VECM, we
concluded that all variables have short run and long run co-integration.
Table 4: Calculation of Co-Integration through VECM
Eigenvalue Error correction co-efficient
CI*EC
None 0.678894 LGDP 1 0.678894
At most 1 0.535882 LGE 0.670233 0.359166
At most 2 0.440491 LTAX 1.636149 0.720708
At most 3 0.399653 LER -1.12586 -0.44995
Lag AIC SC HQ
0 0.040697 0.294029 0.132294
1 -10.51196 -8.738632* -9.870778
2 -10.20143 -6.908112 -9.010669
3 -10.96590 -6.152590 -9.225557
4 -12.37060* -6.037300 -10.08068*

17
At most 4 0.223954 LMS -9.93754 -2.22555
At most 5 0.005562 LKF -6.05247 -0.03366
Sum -0.9504
To support the result that variables in equation 6 have co-integration relationship, we use
the Trace test and maximum Eigenvalue test for short run and long run co-integration. Trace test
indicates that 4 Co-integrating vector at 5 percent level and we significantly reject null hypothesis
at 5 percent level of significance, results are given in table 5. Therefore results from Trace test
statistics show that there exists stable equilibrium relationship among the considered variables.
Table 5: Trace Test Results of VECM
Hypothesized
No. of CE(s)
Eigenvalue Trace statistic 0.05 critical
value
Prob.
None 0.678894 133.4002 95.75366 0.0000*
At most 1 0.535882 86.82485 69.81889 0.0012*
At most 2 0.440491 55.35260 47.85613 0.0084*
At most 3 0.399653 31.54411 29.79707 0.0311*
At most 4 0.223954 10.62393 15.49471 0.2357
At most 5 0.005562 0.228670 3.841466 0.6325
*Shows level of significance at 5%.
Table 6 shows, the Maximum Eigenvalue test which indicates that one equation is co-integrating
at the 1 percent level and two equations are co-integrated at 10 percent level of significance and
we significantly reject null hypothesis at 1 and 10 percent level of significance. Therefore results
from maximum Eigenvalue test statistics show that there exists stable equilibrium relationship among the
variables indicated in equation 6.
Table 6: Unrestricted Co-integration Rank Test (Maximum Eigenvalue)
Hypothesized
No. of CE(s)
Eigenvalue Max- Eigen
statistic
0.05 critical
value
Prob.**
None 0.678894 46.57540 40.07757 0.0081*
At most 1 0.535882 31.47225 33.87687 0.0943***
At most 2 0.440491 23.80849 27.58434 0.1415
At most 3 0.399653 20.92018 21.13162 0.0535***
At most 4 0.223954 10.39526 14.26460 0.1872
At most 5 0.005562 0.228670 3.841466 0.6325
*, ** and *** shows level of significance at 1%, 5% and 10 percent respectively.

18
The co-integration relationship among the GDPt, GEt, TAXt, MSt, ERt and KFt were
investigated by using the Johansen technique. The Trace test and Maximum Eigenvalue test
indicates that there is four co-integration vectors and three equations in our model. It shows that
we reject the null hypothesis of no co-integration and accept the alternative in favor of both
vectors and equations have co-integration. This indicates that there are three co-integration
vectors and three co-integration equations. This implies that in Pakistan both fiscal and
monetary policies have strong co-integration relationship with GDP per capita in long run. This
implies that both government of Pakistan (fiscal policy) and State Bank of Pakistan (monetary
policy) can play important role for stabilizing positive GDP per capita.
5.2 Impulse Response Functions
Figure 6 shows results of the impulse response function of GDP per capita, government
expenditure, tax rate, exchange rate, money supply, and capital formation. The impulse response
function was calculated through VAR model after investigating the co-integration behavior
among the variables by using the Johansen and Juselius (1990) co-integration approach.
Through impulse response function we trace out the responsiveness of the dependent variable to
the shocks to the error term.
These random error shocks are calculated by using the Cholesky (1924) approach which
shows the dependency behavior of the given variables. The interpretation of Cholesky (1924)
approach impulse Response Functions is that if a unit shock has been provided then how much
time is required for it to die and for how much periods the shock has an effect.
It is clear from impulse response function presented in figure 6, which shows the relative
growth effectiveness of fiscal and monetary policies. The results indicate that both fiscal and
monetary policies positively affect GDP per capita (economic growth) in the long run in the case
of Pakistan. However, all these shocks are normalized after 10th period of time. Our results are in
line with the findings of Mahmood and Sial 2011, Fatima and Iqbal 2003, Jawaid et al. 2010.

19
The money supply has significant and positive impact on economic growth in long run
but it responses negatively in the short run, our results are consistent with the findings of Ali et
al. (2008) and Muhammad et al. (2009). The exchange rate has positive impact on economic
growth in the long run however a negative effect in the short run. The findings indicate that both
money supply and exchange rate have a positive effect on economic growth in the long run but
have a negative effect on economic growth in the short run. Similarly, monetary policy has a
negative respond to economic growth in the short run however have positive responses to
economic growth in the long run. The government spending has significant and positive impact
on economic growth in short run as well as in long run. Similarly tax rate also has positive
impact on economic growth in the short run and in the long run.
We also check the influence of fiscal policy to monetary policy; which shows that fiscal
policy have a negative response to monetary policy however the effect of monetary policy is
dying within two periods. The response of fiscal policy into monetary policy is highly negative
because of government expenditure negatively treated both exchange rate and money supply in
the short run as well as in the long run, because the government budget deficit financing through
printing a new currency or borrowing from external resources (IMF or World Bank or Asian
Development Bank, etc). The tax rate affects both the money supply and exchange rate positively
however it has a relatively lower effect than government expenditure effect, such that the fiscal
policy negatively responded to monetary policy. This may be due to unexpected and
unproductive government expenditure that case the government budget deficit which is financing
through borrowing and printing new money, hence negatively affect the exchange rate and
money supply.

20
The monetary policy have no responses to fiscal policy, as of both money supply, and
exchange rate effects are very lower and hold different signs in different time period. The money
supply have a positive impact on tax rate whereas exchange rate have a negative effect on tax
rate which counteracts the both effect and monetary policy is ineffective to response in fiscal
policy.
The capital formation have a positive impact on growth of GDP per capita in the short
run as well as in the long run. The effect of capital formation on monetary policy is positive
however its effect on fiscal policy not significant.
However, the impact of government consumption expenditure on monetary policy
remains negative this may be due to its unfavorable effects on resource allocation. The co-
integration test confirms the long run positive impact of both monetary and fiscal policies on
economic growth. The results of impulse response indicates that the major positive changes in
GDP per capita are due to fiscal policy, which is similar with the findings of Kakar (2011) who
found that fiscal policy is very important for sustainable economic growth in Pakistan and fiscal
measures are the long run phenomena.

21
Figure: 6 VAR Base Multiple Graphs of Impulse Response
-.1
.0
.1
1 2 3 4 5 6 7 8 9 10
Response of LGDP to LGDP
-.1
.0
.1
1 2 3 4 5 6 7 8 9 10
Response of LGDP to LGE
-.1
.0
.1
1 2 3 4 5 6 7 8 9 10
Response of LGDP to LTAX
-.1
.0
.1
1 2 3 4 5 6 7 8 9 10
Response of LGDP to LER
-.1
.0
.1
1 2 3 4 5 6 7 8 9 10
Response of LGDP to LMS1
-.1
.0
.1
1 2 3 4 5 6 7 8 9 10
Response of LGDP to LKF
-.05
.00
.05
.10
1 2 3 4 5 6 7 8 9 10
Response of LGE to LGDP
-.05
.00
.05
.10
1 2 3 4 5 6 7 8 9 10
Response of LGE to LGE
-.05
.00
.05
.10
1 2 3 4 5 6 7 8 9 10
Response of LGE to LTAX
-.05
.00
.05
.10
1 2 3 4 5 6 7 8 9 10
Response of LGE to LER
-.05
.00
.05
.10
1 2 3 4 5 6 7 8 9 10
Response of LGE to LMS1
-.05
.00
.05
.10
1 2 3 4 5 6 7 8 9 10
Response of LGE to LKF
-.2
.0
.2
.4
1 2 3 4 5 6 7 8 9 10
Response of LTAX to LGDP
-.2
.0
.2
.4
1 2 3 4 5 6 7 8 9 10
Response of LTAX to LGE
-.2
.0
.2
.4
1 2 3 4 5 6 7 8 9 10
Response of LTAX to LTAX
-.2
.0
.2
.4
1 2 3 4 5 6 7 8 9 10
Response of LTAX to LER
-.2
.0
.2
.4
1 2 3 4 5 6 7 8 9 10
Response of LTAX to LMS1
-.2
.0
.2
.4
1 2 3 4 5 6 7 8 9 10
Response of LTAX to LKF
-.08
-.04
.00
.04
.08
1 2 3 4 5 6 7 8 9 10
Response of LER to LGDP
-.08
-.04
.00
.04
.08
1 2 3 4 5 6 7 8 9 10
Response of LER to LGE
-.08
-.04
.00
.04
.08
1 2 3 4 5 6 7 8 9 10
Response of LER to LTAX
-.08
-.04
.00
.04
.08
1 2 3 4 5 6 7 8 9 10
Response of LER to LER
-.08
-.04
.00
.04
.08
1 2 3 4 5 6 7 8 9 10
Response of LER to LMS1
-.08
-.04
.00
.04
.08
1 2 3 4 5 6 7 8 9 10
Response of LER to LKF
-.04
.00
.04
.08
1 2 3 4 5 6 7 8 9 10
Response of LMS1 to LGDP
-.04
.00
.04
.08
1 2 3 4 5 6 7 8 9 10
Response of LMS1 to LGE
-.04
.00
.04
.08
1 2 3 4 5 6 7 8 9 10
Response of LMS1 to LTAX
-.04
.00
.04
.08
1 2 3 4 5 6 7 8 9 10
Response of LMS1 to LER
-.04
.00
.04
.08
1 2 3 4 5 6 7 8 9 10
Response of LMS1 to LMS1
-.04
.00
.04
.08
1 2 3 4 5 6 7 8 9 10
Response of LMS1 to LKF
-.04
.00
.04
.08
1 2 3 4 5 6 7 8 9 10
Response of LKF to LGDP
-.04
.00
.04
.08
1 2 3 4 5 6 7 8 9 10
Response of LKF to LGE
-.04
.00
.04
.08
1 2 3 4 5 6 7 8 9 10
Response of LKF to LTAX
-.04
.00
.04
.08
1 2 3 4 5 6 7 8 9 10
Response of LKF to LER
-.04
.00
.04
.08
1 2 3 4 5 6 7 8 9 10
Response of LKF to LMS1
-.04
.00
.04
.08
1 2 3 4 5 6 7 8 9 10
Response of LKF to LKF
Response to Cholesky One S.D. Innovations ± 2 S.E.

22
5.3 Variance Decomposition
Figure 7 shows the variance decomposition based on VAR model, which explained how
unanticipated changes in variables occurs due to the endogenous shocks of the other variables.
The shocks of government expenditure (GE) and tax rate (TAX) are representation of fiscal
policy shocks whereas exchange rate (ER) and money supply (MS) are representing the
monetary policy shocks. All these shocks are normalized after 10th period. Figure 7 indicates that
GEt, TAXt, MSt, ERt and KFt explain the changes in GDP per capita are positive and significant
which implies that both monetary and fiscal policies changes caused by an endogenous policy
are reflected in to GDP per capita. The one noteworthy result is that monetary policy shocks
have lower intensity than fiscal policy shocks in the short run.

23
Figure: 7 VAR Based Graph of Variance Decomposition
0
20
40
60
80
100
1 2 3 4 5 6 7 8 9 10
Percent LGDP variance due to LGDP
0
20
40
60
80
100
1 2 3 4 5 6 7 8 9 10
Percent LGDP variance due to LGE
0
20
40
60
80
100
1 2 3 4 5 6 7 8 9 10
Percent LGDP variance due to LTAX
0
20
40
60
80
100
1 2 3 4 5 6 7 8 9 10
Percent LGDP variance due to LER
0
20
40
60
80
100
1 2 3 4 5 6 7 8 9 10
Percent LGDP variance due to LMS1
0
20
40
60
80
100
1 2 3 4 5 6 7 8 9 10
Percent LGDP variance due to LKF
0
20
40
60
80
100
1 2 3 4 5 6 7 8 9 10
Percent LGE variance due to LGDP
0
20
40
60
80
100
1 2 3 4 5 6 7 8 9 10
Percent LGE variance due to LGE
0
20
40
60
80
100
1 2 3 4 5 6 7 8 9 10
Percent LGE variance due to LTAX
0
20
40
60
80
100
1 2 3 4 5 6 7 8 9 10
Percent LGE variance due to LER
0
20
40
60
80
100
1 2 3 4 5 6 7 8 9 10
Percent LGE variance due to LMS1
0
20
40
60
80
100
1 2 3 4 5 6 7 8 9 10
Percent LGE variance due to LKF
0
20
40
60
80
100
1 2 3 4 5 6 7 8 9 10
Percent LTAX variance due to LGDP
0
20
40
60
80
100
1 2 3 4 5 6 7 8 9 10
Percent LTAX variance due to LGE
0
20
40
60
80
100
1 2 3 4 5 6 7 8 9 10
Percent LTAX variance due to LTAX
0
20
40
60
80
100
1 2 3 4 5 6 7 8 9 10
Percent LTAX variance due to LER
0
20
40
60
80
100
1 2 3 4 5 6 7 8 9 10
Percent LTAX variance due to LMS1
0
20
40
60
80
100
1 2 3 4 5 6 7 8 9 10
Percent LTAX variance due to LKF
0
20
40
60
1 2 3 4 5 6 7 8 9 10
Percent LER variance due to LGDP
0
20
40
60
1 2 3 4 5 6 7 8 9 10
Percent LER variance due to LGE
0
20
40
60
1 2 3 4 5 6 7 8 9 10
Percent LER variance due to LTAX
0
20
40
60
1 2 3 4 5 6 7 8 9 10
Percent LER variance due to LER
0
20
40
60
1 2 3 4 5 6 7 8 9 10
Percent LER variance due to LMS1
0
20
40
60
1 2 3 4 5 6 7 8 9 10
Percent LER variance due to LKF
0
20
40
60
80
1 2 3 4 5 6 7 8 9 10
Percent LMS1 variance due to LGDP
0
20
40
60
80
1 2 3 4 5 6 7 8 9 10
Percent LMS1 variance due to LGE
0
20
40
60
80
1 2 3 4 5 6 7 8 9 10
Percent LMS1 variance due to LTAX
0
20
40
60
80
1 2 3 4 5 6 7 8 9 10
Percent LMS1 variance due to LER
0
20
40
60
80
1 2 3 4 5 6 7 8 9 10
Percent LMS1 variance due to LMS1
0
20
40
60
80
1 2 3 4 5 6 7 8 9 10
Percent LMS1 variance due to LKF
0
20
40
60
80
100
1 2 3 4 5 6 7 8 9 10
Percent LKF variance due to LGDP
0
20
40
60
80
100
1 2 3 4 5 6 7 8 9 10
Percent LKF variance due to LGE
0
20
40
60
80
100
1 2 3 4 5 6 7 8 9 10
Percent LKF variance due to LTAX
0
20
40
60
80
100
1 2 3 4 5 6 7 8 9 10
Percent LKF variance due to LER
0
20
40
60
80
100
1 2 3 4 5 6 7 8 9 10
Percent LKF variance due to LMS1
0
20
40
60
80
100
1 2 3 4 5 6 7 8 9 10
Percent LKF variance due to LKF
Variance Decomposition
24
6 Conclusion
The key objective of the study was to analyze the growth effectiveness of fiscal and
monetary policies. In this association we used the VECM, co-integration and impulse response
function.
To estimate VECM, we use the two lag length that the sum of product of error correction
coefficients and co-integration coefficients is negative which indication for co-integration.) To
support the existence of co-integration relationship we use the trace test and maximum
eigenvalue test for the short run and long run co-integration respectively. The Trace test and
Maximum Eigenvalue test indicates that there is four co-integration vectors and three equations
in our empirical analysis. This implies that in case of Pakistan both fiscal and monetary policies
have strong co-integration relationship with GDP per capita in both short run and in long run.
The impulse response function was used to analyze the relative growth effectiveness of
fiscal and monetary policies. The results of impulse response function indicate that both fiscal
and monetary policies positively affect growth of GDP per capita in the long run. In addition, it
is indicated that all these shocks are normalized after 10th period of time.
The findings of the study also indicate that money supply has significant and positive
impact on economic growth in the long run but it negatively responses in the short run. Similarly,
the exchange rate has positive impact on economic growth in long run but negatively responded
in short run. Hence, it is softly concluded that monetary policy have a negative response to
economic growth in the short run, however in the long run monetary policy have a positive
impact on economic growth. The government spending has significant and positive impact on
economic growth in the short run as well as in the long run. However, tax rate also has positive
impact on economic growth in both short run and in long run.
We also check the responses of fiscal policy to monetary policy; which shows that fiscal
policy have a negative response to monetary policy, however the monetary policy effect is dying
within two lag period.

25
REFERENCES
Ahmad, E. and Malik, A (2009) “Financial Sector Development and Economic Growth: an
Empirical Analysis of Developing Countries”, Journal of Economic Cooperation and
Development, 30.1(2009), 17-40.
Ahmad. E. (1999), The Role of Capital Inflows and the Neoclassical Growth Model, proceeding
of: Reginal Workshop on Return Migration and Long- Term Development Economics
in South Asia, Islamabad, may 26-28.
Akanni. K.A, and Osinowo, O.H (2013), “Effects of fiscal instability on economic growth in
Nigeria” Advances in Economics and Business 1(2): 142-133, 2013.
Alam T. &Waheed M. (2006)” Sect oral Effects of Monetary Policy: Evidence from
Pakistan.”Pakistan Development Review, Volume 45, No.4, Part II winter.
Ali, S. Irum, S and Ali, A. (2008). Wether fiscal stsnce Or monetary policy is effective for
economic growth in case of south asian cuntries. The pakistan development review
47(4,), pp.791-799. http://www.pide.org.pk/pdf/pdp/2008/vplome 4/791-799.pdf
Buiter, W.H. (1976), Crowding Out and the Effectiveness of Fiscal Policy, Econometric
Research Program Princeton University, Research Memorandum, No. 191.
Chowdhury, Abdur R. (1988), Monetary Policy, Fiscal Policy and Aggregate Economic Activity:
some further evidence. Vol 20, No.1.pp.63-71
Chowdhury, L.S and Afzal, M.N.T (2015), “The effectiveness of monetary and fiscal policy in
Bangladesh”, Journal of Applied Business and Economics, vol.17 (1) 2015.
Cyrus, M. and Koech, E. (2014), Monetary and fiscal policy shocks and economic growth in
Kenya: VAR econometric approach” journal of world economic research
2014.3(6):95-108.
Economic Survey of Pakistan (2009- 2010), „Government of Pakistan, Finance Division,
Islamabad.
Fatima, A and Iqbal, A (2003), “The Relative Effectiveness of Monetary Policy and Fiscal
Policy in case of Pakistan” Pakistan economic and social Review, vol.XLI, no. 1 &
2(2003) pp.93-119.

26
Fisher, I. (1922), “The Purchasing Power of Money” (New York: Macmillan, 1922), p. 29.
Fisher, I. (2006). “The Purchasing Power of Money: its Determination and Relation to Credit
Interest and Crises: Cosimo, Inc.
Friedman, M. (1970), “the Counter-Revolution in Monetary theory”, London: Institute of
Economic Affairs. 1970, p. 12.
Friedman, M. and Anna j. Schwartz (1974), “Money and Business Cycles,” Review of
Economics and Statistics, 45 (Feb. 1963), pp. 32-64, respectively.
Friedman, M. and Heller, W. (1969), “Monetary versus Fiscal Policy,” New York: Norton 1969,
p.51.
Gordon, R., ed. Friedman, M. (1974), “Monetary Framework,” University of Chicago Press,
1974, p.27.
Government of Pakistan (2010), “Pakistan Economic Survey 2009-10” Finance Devising
Advisor Wing.
Government of Pakistan 2015; Finance Division, Economic Advisor Wing
Hussain, T. Siddiqi, W.M (2012) “Fiscal, Monetary Policies and Institutions’ Role in Pakistan”
[email protected]&[email protected] Theoretical and Applied
Economics Volume XIX (2012), No. 6(571), pp. 33-50
Jawaid S.T, Qadri, F.S and Ali, N. (2011), “Monetary- Fiscal-Trade Policy Pakistan and
Economic Growth, time series empirical Investigation”, International Journal of
Economics and Financial Issues, vol-1, no. 3, 2011, PP.133-138.
Jawaid, S.T, Arif, I. and Naeemullah, S.M (2010), “Comparative Analysis of Monetary and
Fiscal Policy: a case of Pakistan”. NICE research journal vol.3, PP.58-67.
Johansen, S. and K. Juselius, (1990), “Maximum Likelihood Estimation and Inference on Co-
integration with Applications to the Demand for Money,” Oxford Bulletin
ofEconometrics and Statistics, 52:169-210.
Kakar Z, K. (2011) “Impact of Fiscal Variables on Economic Development of Pakistan”
Romanian Journal of Fiscal Policy. Volume 2, Issue 2, July - December 2011, Pages
1-10

27
Khan, S. and Qayyum, A (2007), “Measure of Monetary Policy Stance: The Case of Pakistan”
PIDE working papers 2007; 39.
Mahmood, T and Sial, M, H. (2011) “The Relative Effectiveness of Monetary and Fiscal Policies
in Economic Growth: A Case Study of Pakistan” Asian Economic and Financial
Review, 2011, vol. 1, issue 4, pages 236-244.
Muhammad, S.D Wasti, S.K. A,Lal, I and hussain, A,(2009) an Empirical investigation between
money supply, government expenditure, output and price: the pakistan eveidence.
European juneral of economics, finance and adminirastive sciecnes, issue 17, 60-68
Noman, S., and Khudri, M. (2015), “the effects of monetary and fiscal policy on economic
growth in Bangladesh”, ELK Asia Pacific Journal of Finance and Risk Management,
4325/EAPJER (2015).
Pakistan Economic Survey (2009- 2010), „Government of Pakistan, Finance Division,
Islamabad.
Rakic, B & Radenovic, T(2013). The effectiveness of Monetary and Fiscal Policy in Serbia:
Industrija, Vol.41 No.2, 103-122.
Tesfay G. B. (2010) Economic Analysis of Smallholder Vegetable Production in Tigary,
Ethiopia. A Case of IPMS’s AlamataWereda Pilot learning Project, Thesis.
Mekelle:MU.
Zaidi S. A, “Issues in Pakistan’s Economy”, A Political Economy Perspective: Third Edition,
ISBN. 978-0-19-940183-3. Oxford University Press www.oup.com/pk.

28
Appendix
Date: 09/11/16 Time: 00:33 Sample (adjusted): 1975 2015
Included observations: 41 after adjustments
Trend assumption: Linear deterministic trend
Series: LGDP LGE LTAX LER LMS1 LKF Lags interval (in first differences): 1 to 2
Unrestricted Cointegration Rank Test (Trace) Hypothesized Trace 0.05
No. of CE(s) Eigenvalue Statistic Critical Value Prob.** None * 0.678894 133.4002 95.75366 0.0000 At most 1 * 0.535882 86.82485 69.81889 0.0012
At most 2 * 0.440491 55.35260 47.85613 0.0084
At most 3 * 0.399653 31.54411 29.79707 0.0311
At most 4 0.223954 10.62393 15.49471 0.2357 At most 5 0.005562 0.228670 3.841466 0.6325 Trace test indicates 4 cointegratingeqn(s) at the 0.05 level
* denotes rejection of the hypothesis at the 0.05 level **MacKinnon-Haug-Michelis (1999) p-values
Unrestricted Cointegration Rank Test (Maximum Eigenvalue) Hypothesized Max-Eigen 0.05
No. of CE(s) Eigenvalue Statistic Critical Value Prob.** None * 0.678894 46.57540 40.07757 0.0081 At most 1 0.535882 31.47225 33.87687 0.0943
At most 2 0.440491 23.80849 27.58434 0.1415
At most 3 0.399653 20.92018 21.13162 0.0535
At most 4 0.223954 10.39526 14.26460 0.1872 At most 5 0.005562 0.228670 3.841466 0.6325 Max-eigenvalue test indicates 1 cointegratingeqn(s) at the 0.05 level
* denotes rejection of the hypothesis at the 0.05 level **MacKinnon-Haug-Michelis (1999) p-values
Unrestricted Cointegrating Coefficients (normalized by b'*S11*b=I): LGDP LGE LTAX LER LMS1 LKF
1.602029 1.073734 2.621159 -1.803658 -15.92024 -9.696232
-9.201356 -2.029489 5.544414 -0.281646 13.15692 -12.09171
-0.106017 2.704243 -2.600264 1.308467 -1.104747 -10.31244 1.367097 -0.934233 2.567028 -5.056764 14.20777 -9.172362
0.868338 -7.451295 1.402539 -1.220604 -5.505786 -3.683656
-1.204553 3.362454 1.538690 0.039998 8.071889 -6.510728
Unrestricted Adjustment Coefficients (alpha): D(LGDP) -0.028444 0.006372 0.003981 0.006399 -0.004301 0.002225 D(LGE) -0.000923 -0.008489 -0.012325 0.033703 0.023682 0.000349
D(LTAX) -0.015782 -0.066601 0.042740 0.031916 -0.018721 0.003100

29
D(LER) 0.014756 0.003549 -0.017157 0.003146 -0.008912 -0.001356 D(LMS1) 0.020988 -0.009389 -0.015802 -0.008568 0.013138 0.001017
D(LKF) 0.025368 0.022293 0.011630 0.007264 -0.000911 0.001110 1 Cointegrating Equation(s): Log likelihood 382.4637 Normalized cointegrating coefficients (standard error in parentheses)
LGDP LGE LTAX LER LMS1 LKF 1.000000 0.670233 1.636149 -1.125858 -9.937544 -6.052469
(0.73677) (0.48467) (0.46239) (1.85798) (1.65249)
Adjustment coefficients (standard error in parentheses) D(LGDP) -0.045568
(0.01222)
D(LGE) -0.001479
(0.02358) D(LTAX) -0.025284
(0.04180)
D(LER) 0.023639
(0.01196) D(LMS1) 0.033624
(0.01406)
D(LKF) 0.040640
(0.01342)
2 Cointegrating Equation(s): Log likelihood 398.1998 Normalized cointegrating coefficients (standard error in parentheses)
LGDP LGE LTAX LER LMS1 LKF
1.000000 0.000000 -1.700660 0.597860 2.743138 4.927457
(0.27204) (0.26246) (1.11467) (0.99592) 0.000000 1.000000 4.978578 -2.571817 -18.91980 -16.38224
(1.03031) (0.99406) (4.22169) (3.77197)
Adjustment coefficients (standard error in parentheses) D(LGDP) -0.104198 -0.043473
(0.07029) (0.01728)
D(LGE) 0.076635 0.016238
(0.13661) (0.03358) D(LTAX) 0.587537 0.118220
(0.21228) (0.05219)
D(LER) -0.009020 0.008640
(0.06943) (0.01707) D(LMS1) 0.120020 0.041592
(0.08022) (0.01972)
D(LKF) -0.164486 -0.018005
(0.06723) (0.01653)
3 Cointegrating Equation(s): Log likelihood 410.1041 Normalized cointegrating coefficients (standard error in parentheses)
LGDP LGE LTAX LER LMS1 LKF
1.000000 0.000000 0.000000 -0.273906 -2.528268 1.314251
(0.08577) (0.67781) (0.49421)

30
0.000000 1.000000 0.000000 -0.019776 -3.488083 -5.804804 (0.20626) (1.62999) (1.18848)
0.000000 0.000000 1.000000 -0.512605 -3.099623 -2.124590
(0.09689) (0.76570) (0.55830)
Adjustment coefficients (standard error in parentheses)
D(LGDP) -0.104620 -0.032709 -0.049579
(0.06993) (0.02656) (0.04987)
D(LGE) 0.077942 -0.017091 -0.017442 (0.13481) (0.05120) (0.09614)
D(LTAX) 0.583006 0.233801 -0.521769
(0.19790) (0.07516) (0.14114)
D(LER) -0.007201 -0.037757 0.102970 (0.06221) (0.02363) (0.04437)
D(LMS1) 0.121695 -0.001141 0.044044
(0.07503) (0.02850) (0.05351)
D(LKF) -0.165719 0.013444 0.159856 (0.06390) (0.02427) (0.04557)
4 Cointegrating Equation(s): Log likelihood 420.5642 Normalized cointegrating coefficients (standard error in parentheses)
LGDP LGE LTAX LER LMS1 LKF
1.000000 0.000000 0.000000 0.000000 -4.337820 2.199371 (0.63760) (0.68867)
0.000000 1.000000 0.000000 0.000000 -3.618731 -5.740899
(1.02398) (1.10600)
0.000000 0.000000 1.000000 0.000000 -6.486125 -0.468125 (0.89690) (0.96874)
0.000000 0.000000 0.000000 1.000000 -6.606461 3.231467
(1.14980) (1.24190)
Adjustment coefficients (standard error in parentheses)
D(LGDP) -0.095872 -0.038687 -0.033153 0.022360
(0.06971) (0.02709) (0.05272) (0.04086)
D(LGE) 0.124017 -0.048578 0.069074 -0.182497 (0.12171) (0.04730) (0.09204) (0.07134)
D(LTAX) 0.626638 0.203984 -0.439840 -0.058242
(0.19142) (0.07439) (0.14476) (0.11220)
D(LER) -0.002900 -0.040696 0.111046 -0.065972 (0.06261) (0.02433) (0.04735) (0.03670)
D(LMS1) 0.109981 0.006864 0.022049 -0.012559
(0.07421) (0.02884) (0.05612) (0.04350)
D(LKF) -0.155789 0.006658 0.178502 -0.073549 (0.06322) (0.02457) (0.04781) (0.03706)
5 Cointegrating Equation(s): Log likelihood 425.7618 Normalized cointegrating coefficients (standard error in parentheses)
LGDP LGE LTAX LER LMS1 LKF
1.000000 0.000000 0.000000 0.000000 0.000000 9.061096 (1.71599)
0.000000 1.000000 0.000000 0.000000 0.000000 -0.016655
(0.62187)
0.000000 0.000000 1.000000 0.000000 0.000000 9.791869

31
(2.33100) 0.000000 0.000000 0.000000 1.000000 0.000000 13.68181
(2.55453)
0.000000 0.000000 0.000000 0.000000 1.000000 1.581837
(0.31120)
Adjustment coefficients (standard error in parentheses)
D(LGDP) -0.099606 -0.006639 -0.039185 0.027609 0.646867
(0.06956) (0.06095) (0.05339) (0.04158) (0.18851) D(LGE) 0.144581 -0.225039 0.102289 -0.211403 0.265076
(0.11433) (0.10017) (0.08774) (0.06834) (0.30983)
D(LTAX) 0.610382 0.343477 -0.466097 -0.035392 -0.115701
(0.18917) (0.16574) (0.14518) (0.11307) (0.51265) D(LER) -0.010639 0.025707 0.098547 -0.055094 -0.075503
(0.06074) (0.05321) (0.04661) (0.03630) (0.16460)
D(LMS1) 0.121389 -0.091032 0.040476 -0.028596 -0.634290
(0.07057) (0.06183) (0.05416) (0.04218) (0.19123) D(LKF) -0.156580 0.013450 0.177224 -0.072436 -0.015185
(0.06346) (0.05560) (0.04871) (0.03793) (0.17198)
Related Documents