ORIGINAL ARTICLE The green–blue swing: plasticity of plankton food-webs in response to coastal oceanographic dynamics Domenico D’Alelio, Maria Grazia Mazzocchi, Marina Montresor, Diana Sarno, Adriana Zingone, Iole Di Capua, Gayantonia Franz e * , Francesca Margiotta, Vincenzo Saggiomo & Maurizio Ribera d’Alcal a Stazione Zoologica Anton Dohrn, Villa Comunale, 80121 Naples, Italy Keywords Climate change; coastal systems; community ecology; long-term ecological research station (LTER); Mediterranean Sea; meta- analysis; networks; plankton; trophic-webs. Correspondence Domenico D’Alelio, Stazione Zoologica Anton Dohrn, Villa Comunale, 80121 Naples, Italy. E-mails: [email protected], dom.dalelio@gmail. com *Present address: Department of Biology, University of Akron, Akron, OH 44325-3908, USA. Accepted: 24 June 2014 doi: 10.1111/maec.12211 Abstract The internal organization of plankton communities plays a key role in biogeo- chemical cycles and in the functioning of aquatic ecosystems. In this study, the structure of a marine plankton community (including both unicellular and multicellular organisms) was inferred by applying an ecological network approach to species abundances observed weekly at the long-term ecological research station MareChiara (LTER-MC) in the Gulf of Naples (Tyrrhenian Sea, Mediterranean Sea) in the summers of 2002–2009. Two distinct condi- tions, characterized by different combination of salinity and chlorophyll values, alternated at the site: one influenced by coastal waters, herein named ‘green’, and the other reflecting more offshore conditions, named ‘blue’. The green and blue ‘phases’ showed different keystone biological elements: namely, large dia- toms and small-sized flagellates, respectively. Several correlations amongst spe- cies belonging to different trophic groups were found in both phases (connectance ~0.30). In the green phase, several links between phytoplankton and mesozooplankton and within the latter were detected, suggesting matter flow from microbes up to carnivorous zooplankton. A microbial-loop-like sub- web, including mixo- and heterotrophic dinoflagellates and ciliates, was present in the green phase, but it was relatively more important in the blue phase. The latter observation suggests a more intense cycling of matter at the microbial trophic level in the blue phase. These results show that different modes of eco- logical organization can emerge from relatively small changes in the composi- tion of aquatic communities coping with environmental variability. This highlights a significant plasticity in the internal structure of plankton webs, which should be taken into account in predictions of the potential effects of climatic oscillations on aquatic ecosystems and biogeochemical cycles therein. Introduction Understanding the structure and functioning of plankton communities is a crucial step in tracking biogeochemical cycles and predicting future responses of aquatic ecosys- tems to environmental changes at different times and spatial scales (de Senerpont Domis et al. 2013; Behrenfeld & Boss 2014). The flux of matter, energy and information in the oceans largely depends on the structure of plankton communities, which are, in turn, characterized by the species present, their abundance and functional roles, and their possible biological inter-connections (Sommer et al. 2012). The clear-cut, paradigmatic formalization of a planktonic tro- phic chain ruled by phytoplankton production and zoo- plankton grazing – dating back to G. A. Riley’s work (Anderson & Gentleman 2012) – and applied to any plank- tonic system, has been progressively questioned by the increasing levels of awareness of the fine-tuned mecha- nisms at the base of plankton ecology (Tett & Wilson 2000; Marine Ecology (2014) 1–16 ª 2014 Blackwell Verlag GmbH 1 Marine Ecology. ISSN 0173-9565

Welcome message from author
This document is posted to help you gain knowledge. Please leave a comment to let me know what you think about it! Share it to your friends and learn new things together.
Transcript
ORIGINAL ARTICLE
The green–blue swing: plasticity of plankton food-webs inresponse to coastal oceanographic dynamicsDomenico D’Alelio, Maria Grazia Mazzocchi, Marina Montresor, Diana Sarno, Adriana Zingone,Iole Di Capua, Gayantonia Franz�e*, Francesca Margiotta, Vincenzo Saggiomo &Maurizio Ribera d’Alcal�a
Stazione Zoologica Anton Dohrn, Villa Comunale, 80121 Naples, Italy
Keywords
Climate change; coastal systems; community
ecology; long-term ecological research
station (LTER); Mediterranean Sea; meta-
analysis; networks; plankton; trophic-webs.
Correspondence
Domenico D’Alelio, Stazione Zoologica Anton
Dohrn, Villa Comunale, 80121 Naples, Italy.
E-mails: [email protected], dom.dalelio@gmail.
com
*Present address: Department of Biology,
University of Akron, Akron, OH 44325-3908,
USA.
Accepted: 24 June 2014
doi: 10.1111/maec.12211
Abstract
The internal organization of plankton communities plays a key role in biogeo-
chemical cycles and in the functioning of aquatic ecosystems. In this study, the
structure of a marine plankton community (including both unicellular and
multicellular organisms) was inferred by applying an ecological network
approach to species abundances observed weekly at the long-term ecological
research station MareChiara (LTER-MC) in the Gulf of Naples (Tyrrhenian
Sea, Mediterranean Sea) in the summers of 2002–2009. Two distinct condi-
tions, characterized by different combination of salinity and chlorophyll values,
alternated at the site: one influenced by coastal waters, herein named ‘green’,
and the other reflecting more offshore conditions, named ‘blue’. The green and
blue ‘phases’ showed different keystone biological elements: namely, large dia-
toms and small-sized flagellates, respectively. Several correlations amongst spe-
cies belonging to different trophic groups were found in both phases
(connectance ~0.30). In the green phase, several links between phytoplankton
and mesozooplankton and within the latter were detected, suggesting matter
flow from microbes up to carnivorous zooplankton. A microbial-loop-like sub-
web, including mixo- and heterotrophic dinoflagellates and ciliates, was present
in the green phase, but it was relatively more important in the blue phase. The
latter observation suggests a more intense cycling of matter at the microbial
trophic level in the blue phase. These results show that different modes of eco-
logical organization can emerge from relatively small changes in the composi-
tion of aquatic communities coping with environmental variability. This
highlights a significant plasticity in the internal structure of plankton webs,
which should be taken into account in predictions of the potential effects of
climatic oscillations on aquatic ecosystems and biogeochemical cycles therein.
Introduction
Understanding the structure and functioning of plankton
communities is a crucial step in tracking biogeochemical
cycles and predicting future responses of aquatic ecosys-
tems to environmental changes at different times and
spatial scales (de Senerpont Domis et al. 2013; Behrenfeld
& Boss 2014).
The flux of matter, energy and information in the oceans
largely depends on the structure of plankton communities,
which are, in turn, characterized by the species present,
their abundance and functional roles, and their possible
biological inter-connections (Sommer et al. 2012). The
clear-cut, paradigmatic formalization of a planktonic tro-
phic chain ruled by phytoplankton production and zoo-
plankton grazing – dating back to G. A. Riley’s work
(Anderson & Gentleman 2012) – and applied to any plank-
tonic system, has been progressively questioned by the
increasing levels of awareness of the fine-tuned mecha-
nisms at the base of plankton ecology (Tett & Wilson 2000;
Marine Ecology (2014) 1–16 ª 2014 Blackwell Verlag GmbH 1
Marine Ecology. ISSN 0173-9565
Strom 2008). Plankton communities show multiple traits
able to influence biogeochemical cycles with cascade
effects. Many microbes can shift their metabolism between
autotrophy and heterotrophy and effectively feed on other
microbes (Sherr & Sherr 2007; Jeong et al. 2010; Schmoker
et al. 2013), planktonic animals can graze selectively and
show niche partitioning (Katechakis 2004; Katechakis &
Stibor 2004; Olson et al. 2006) and unexpectedly complex
trophic cascades can emerge as a consequence of changes
in community structure (Stibor et al. 2004; Caron &
Hutchins 2012).
Depicting the structure of communities and the links
amongst their components encompasses two complemen-
tary analytical steps: (i) the inference of biological links
from empirical data (by describing, comparing and corre-
lating the abundances of species or functional groups)
and (ii) the construction and analysis of ecological net-
works based on pairwise co-variations (Bl€uthgen et al.
2008; Vermaat et al. 2009). In this context, ecological
networks are structured graphs consisting of species as
nodes and biological links as edges; they represent a use-
ful conceptual tool to schematize community structure,
e.g. in terms of food-web relationships or the presence
and relative importance of keystone species (Beckerman
et al. 2006; Jord�an 2009). Such an approach has been
applied successfully to marine food-webs, revealing eco-
logically consistent structures in different systems (Dunne
et al. 2004; de Santana et al. 2013). As for plankton, net-
work approaches have revealed non-random community
organization and suggested crucial biological mechanisms,
such as symbiosis, parasitism, competition and predation
amongst unicellular organisms (Steele et al. 2011).
The present study aimed to (i) infer the structure of
marine plankton communities, including both unicellular
and multicellular organisms, in terms of statistical and
presumably trophic links based on field data of species
composition and abundance and (ii) relate short-term
temporal changes in community structure to differences
in the hosting environment. We applied an ecological
network approach to plankton data collected weekly at
the long-term ecological research station MareChiara
(LTER-MC) in the inner Gulf of Naples (GoN, Tyrrhe-
nian Sea, western Mediterranean). This well-studied sys-
tem shows strong seasonality and resilience in the
succession of plankton communities (Zingone et al. 1995,
2009; Modigh 2001; Modigh & Castaldo 2002; Mazzocchi
et al. 2011, 2012) with strong regularity in the species’ life
histories (D’Alelio et al. 2010). Herein, we describe the
characteristics of two alternative modes of organization in
a plankton community (including phyto-, microzoo- and
mesozooplankton) in this coastal area. We call these
modes the ‘green’ and ‘blue’ phases, occurring in lower
and higher salinity water-masses, respectively, in the sur-
face water-layer at LTER-MC during summer. Based on
the observation of community properties during the
green and blue phases, we present two scenarios of food-
web structure that switch through time in the summer
plankton of the GoN.
Material and Methods
Study site
The sampling station LTER-MC (40°48.50 N, 14°150 E) is
located in the GoN, two nautical miles off the coastline
over the 75-m isobath. Sampling at LTER-MC has been
conducted since 1984, except for a major interruption
from 1991 to 1994. The sampling frequency was fort-
nightly until 1990 and has been weekly since 1995.
The GoN is a relatively deep and wide embayment
(average depth = 170 m, area = ~870 km2) that is rela-
tively open to the offshore Tyrrhenian Sea waters. Land
runoff from a very densely populated region influences
the water typologies in the GoN; yet, in contrast to other
coastal sites, riverine inputs are limited and intermittent,
and salinity rarely goes below 37.5 (Ribera d’Alcal�a et al.
2004; Iermano et al. 2012, 2013). The close proximity of
oligotrophic offshore waters to the coastline results in the
co-existence of two subsystems: a relatively eutrophic
coastal zone and an oligotrophic area similar to the off-
shore Tyrrhenian waters. The position and width of the
boundary between the two subsystems are variable over
the seasons and the exchange between the subsystems at
times can be enhanced by local circulation. Noticeably, in
the coastal GoN, summer is not a period of low phyto-
plankton biomass because of nutrients coming from land.
By contrast with the predictions from Margalef’s Mandala
(Wyatt 2012), the community is dominated by diatoms
despite stratification (Zingone et al. 1990).
Data collection
Conductivity, temperature, and fluorescence profiles
were obtained with a SBE911 mounted on a Rosette
sampler equipped with Niskin bottles (12 l). Chlorophyll
a (chl a) concentrations was determined at 0.5, 2-, 5-,
10-, 20-, 40- and 60-m depths, whereas salinity and
nutrient concentrations were determined at 0.5, 2-, 5-,
10-, 20-, 30-, 40-, 50-, 60- and 70-m depths. Ammonium
(NH4), nitrate (NO3), nitrite (N02), phosphate (PO4)
and silicate (SiO4) concentrations were determined with
a TECHNICON II autoanalyzer up to 2005 and, starting
from 2006, using a FlowSys Systea Autoanalyzer, accord-
ing to Hansen & Grasshoff (1983), modified as described
in Ribera d’Alcal�a et al. (2004). Chl a s was determined
with a spectrofluorometer (Holm-Hansen et al. 1965;
2 Marine Ecology (2014) 1–16 ª 2014 Blackwell Verlag GmbH
The green–blue plankton swing D’Alelio, Mazzocchi, Montresor, Sarno, Zingone, Di Capua, Franz�e, Margiotta, Saggiomo & Ribera d’Alcal�a
Neveux & Panouse 1987). Phytoplankton and microzoo-
plankton samples were collected from the 0.5-m Niskin
bottle and fixed with neutralized formaldehyde (0.8–1.6%final concentration) and acid Lugol’s iodine (2% final
concentration), respectively. Mesozooplankton samples
were collected from 50-m depth to the surface using a
Nansen net (113-cm mouth diameter, 200-lm mesh size)
and fixed with formaldehyde (2–4% final concentration).
Phytoplankton, micro- and mesozooplankton were
counted according to standard procedures as reported by
Ribera d’Alcal�a et al. (2004).
Data analysis
We analysed the physical and ecological variability at
LTER-MC at a weekly time scale from the end of June to
the end of August for 8 years (2002–2009). Salinity and
chl a values in the 0–2-m layer were used to characterize
the superficial water-masses as coastal ‘green’ or offshore
‘blue’. Green and blue phases were identified in each
summer season and the plankton community associated
with each phase was characterized. Within each of the
very large phyto-, microzoo- and mesozooplankton data
sets, taxa were kept as such or assembled in homoge-
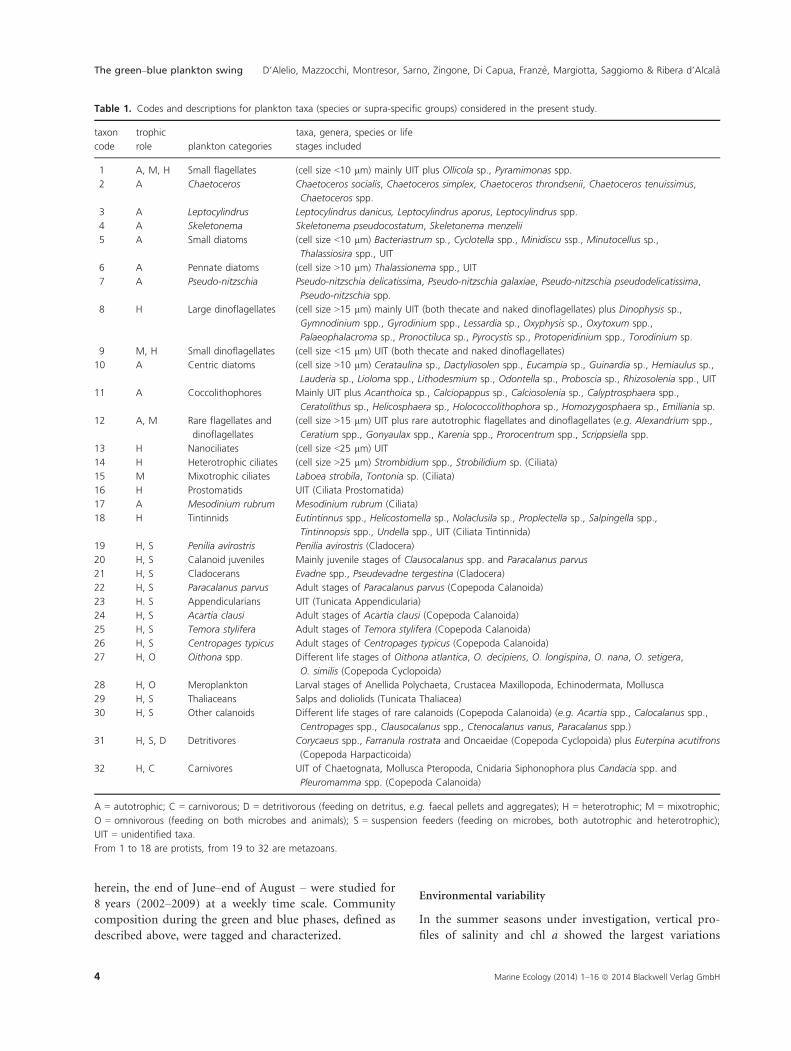
neous groups according to different criteria (Table 1).
The most abundant species were kept separated. Less
abundant taxa were aggregated based on taxonomy (e.g.
congeneric species). Less common species were aggregated
according to size (e.g. dinoflagellates and ciliates smaller
or larger than 15 lm) or trophic level (e.g. carnivorous
mesozooplankton, mixotrophic ciliates), according to
current knowledge. This aggregation allowed zero values
to be limited in the time-series data sets. After grouping,
the whole plankton community was represented by 32
elements (Table 1).
Cluster, correlation and principal component analyses
were carried out with the open-source software PAST
(http://palaeo-electronica.org/2001_1/past/issue1_01.htm).
Hierarchical clustering for environmental and plank-
tonic community data were conducted using the
unweighted pair group method with arithmetic mean
(UPMGA) algorithm and according to Euclidean dis-
tance and Bray–Curtis similarity metrics, respectively
(Legendre & Legendre 2012). Spearman correlations
amongst plankton community elements (Table 1) were
carried out for green and blue phases (see Results)
including a minimum number of five samples, i.e.
across the longer time periods that had a coherent
match between the environmental and planktonic com-
munity data clustering.
All positive and negative correlations with r >0.7 or
<�0.7 were considered. The largest fraction of P-values
(relating to almost 400 correlations) was within the 0.05
threshold, a lower number (almost 200) was within the
0.10 threshold, a limited fraction (almost 60) exceeded
0.10. A histogram showing the frequency of P-values
from all correlations considered in the present study is
shown in Supporting Information Fig. S1. A non-strin-
gent statistical limit was imposed upon our analyses
because the high P-values of some correlations with high
coefficients may have arisen because of the limited num-
ber of samples analysed (number of samples in continu-
ous time-series ranging from five to nine). In order to
visualize in a single elaboration all of the possible links
between community elements, correlations detected in
green (light and dark green) and blue (light and dark
blue) periods in the different years were compiled into
distinct matrices, namely: green positive, green negative,
blue positive and blue negative. Correlation networks
were built and analysed with the open-source software
yED 3.11.1 (yWorks GmbH, http://www.yworks.com).
Network connectance was estimated as the number of
links/node2 (Beckerman et al. 2006). The relative central-
ity of network nodes was estimated in the frame of the
yED software.
To corroborate patterns detected with these first
exploratory analyses, further networks were built includ-
ing only those links detected in at least two summer sea-
sons and having ecological significance. The structure of
plankton communities during the blue and green phases
was reconstructed based on correlation networks amongst
taxa. The ecological significance of correlations amongst
taxa was assessed based on available knowledge from pre-
vious studies, as described in the Results and Discussion
section. Special emphasis was given to potential trophic
links at different levels of the trophic-web, such as
amongst protists, between the latter and zooplankton,
and between carnivores and non-carnivorous mesozoo-
plankton.
Results and Discussion
The main hindrance to the various approaches to com-
munity studies of marine plankton is how to cope with
highly diverse microbial communities floating in unstable
and non-conservative environments. Like other coastal
embayments, the GoN lies at the boundary between off-
shore and coastal waters with different levels of produc-
tivity. To reduce the degrees of freedom, we focused our
analysis on the summer season, when the upper layer (0–2 m) is permanently decoupled from the subsurface layer
because of thermal stratification. This allowed us to focus
on phytoplankton assemblages confined to the surface
layer, and to consider the 0–50 m integrated samples for
more mobile organisms, e.g. mesozooplankton. The phys-
ical–ecological oscillations at LTER-MC during summer –
Marine Ecology (2014) 1–16 ª 2014 Blackwell Verlag GmbH 3
D’Alelio, Mazzocchi, Montresor, Sarno, Zingone, Di Capua, Franz�e, Margiotta, Saggiomo & Ribera d’Alcal�a The green–blue plankton swing
herein, the end of June–end of August – were studied for
8 years (2002–2009) at a weekly time scale. Community
composition during the green and blue phases, defined as
described above, were tagged and characterized.
Environmental variability
In the summer seasons under investigation, vertical pro-
files of salinity and chl a showed the largest variations
Table 1. Codes and descriptions for plankton taxa (species or supra-specific groups) considered in the present study.
taxon
code
trophic
role plankton categories
taxa, genera, species or life
stages included
1 A, M, H Small flagellates (cell size <10 lm) mainly UIT plus Ollicola sp., Pyramimonas spp.
2 A Chaetoceros Chaetoceros socialis, Chaetoceros simplex, Chaetoceros throndsenii, Chaetoceros tenuissimus,
Chaetoceros spp.
3 A Leptocylindrus Leptocylindrus danicus, Leptocylindrus aporus, Leptocylindrus spp.
4 A Skeletonema Skeletonema pseudocostatum, Skeletonema menzelii
5 A Small diatoms (cell size <10 lm) Bacteriastrum sp., Cyclotella spp., Minidiscu ssp., Minutocellus sp.,
Thalassiosira spp., UIT
6 A Pennate diatoms (cell size >10 lm) Thalassionema spp., UIT
7 A Pseudo-nitzschia Pseudo-nitzschia delicatissima, Pseudo-nitzschia galaxiae, Pseudo-nitzschia pseudodelicatissima,
Pseudo-nitzschia spp.
8 H Large dinoflagellates (cell size >15 lm) mainly UIT (both thecate and naked dinoflagellates) plus Dinophysis sp.,
Gymnodinium spp., Gyrodinium spp., Lessardia sp., Oxyphysis sp., Oxytoxum spp.,
Palaeophalacroma sp., Pronoctiluca sp., Pyrocystis sp., Protoperidinium spp., Torodinium sp.
9 M, H Small dinoflagellates (cell size <15 lm) UIT (both thecate and naked dinoflagellates)
10 A Centric diatoms (cell size >10 lm) Cerataulina sp., Dactyliosolen spp., Eucampia sp., Guinardia sp., Hemiaulus sp.,
Lauderia sp., Lioloma spp., Lithodesmium sp., Odontella sp., Proboscia sp., Rhizosolenia spp., UIT
11 A Coccolithophores Mainly UIT plus Acanthoica sp., Calciopappus sp., Calciosolenia sp., Calyptrosphaera spp.,
Ceratolithus sp., Helicosphaera sp., Holococcolithophora sp., Homozygosphaera sp., Emiliania sp.
12 A, M Rare flagellates and
dinoflagellates
(cell size >15 lm) UIT plus rare autotrophic flagellates and dinoflagellates (e.g. Alexandrium spp.,
Ceratium spp., Gonyaulax spp., Karenia spp., Prorocentrum spp., Scrippsiella spp.
13 H Nanociliates (cell size <25 lm) UIT
14 H Heterotrophic ciliates (cell size >25 lm) Strombidium spp., Strobilidium sp. (Ciliata)
15 M Mixotrophic ciliates Laboea strobila, Tontonia sp. (Ciliata)
16 H Prostomatids UIT (Ciliata Prostomatida)
17 A Mesodinium rubrum Mesodinium rubrum (Ciliata)
18 H Tintinnids Eutintinnus spp., Helicostomella sp., Nolaclusila sp., Proplectella sp., Salpingella spp.,
Tintinnopsis spp., Undella spp., UIT (Ciliata Tintinnida)
19 H, S Penilia avirostris Penilia avirostris (Cladocera)
20 H, S Calanoid juveniles Mainly juvenile stages of Clausocalanus spp. and Paracalanus parvus
21 H, S Cladocerans Evadne spp., Pseudevadne tergestina (Cladocera)
22 H, S Paracalanus parvus Adult stages of Paracalanus parvus (Copepoda Calanoida)
23 H. S Appendicularians UIT (Tunicata Appendicularia)
24 H, S Acartia clausi Adult stages of Acartia clausi (Copepoda Calanoida)
25 H, S Temora stylifera Adult stages of Temora stylifera (Copepoda Calanoida)
26 H, S Centropages typicus Adult stages of Centropages typicus (Copepoda Calanoida)
27 H, O Oithona spp. Different life stages of Oithona atlantica, O. decipiens, O. longispina, O. nana, O. setigera,
O. similis (Copepoda Cyclopoida)
28 H, O Meroplankton Larval stages of Anellida Polychaeta, Crustacea Maxillopoda, Echinodermata, Mollusca
29 H, S Thaliaceans Salps and doliolids (Tunicata Thaliacea)
30 H, S Other calanoids Different life stages of rare calanoids (Copepoda Calanoida) (e.g. Acartia spp., Calocalanus spp.,
Centropages spp., Clausocalanus spp., Ctenocalanus vanus, Paracalanus spp.)
31 H, S, D Detritivores Corycaeus spp., Farranula rostrata and Oncaeidae (Copepoda Cyclopoida) plus Euterpina acutifrons
(Copepoda Harpacticoida)
32 H, C Carnivores UIT of Chaetognata, Mollusca Pteropoda, Cnidaria Siphonophora plus Candacia spp. and
Pleuromamma spp. (Copepoda Calanoida)
A = autotrophic; C = carnivorous; D = detritivorous (feeding on detritus, e.g. faecal pellets and aggregates); H = heterotrophic; M = mixotrophic;
O = omnivorous (feeding on both microbes and animals); S = suspension feeders (feeding on microbes, both autotrophic and heterotrophic);
UIT = unidentified taxa.
From 1 to 18 are protists, from 19 to 32 are metazoans.
4 Marine Ecology (2014) 1–16 ª 2014 Blackwell Verlag GmbH
The green–blue plankton swing D’Alelio, Mazzocchi, Montresor, Sarno, Zingone, Di Capua, Franz�e, Margiotta, Saggiomo & Ribera d’Alcal�a
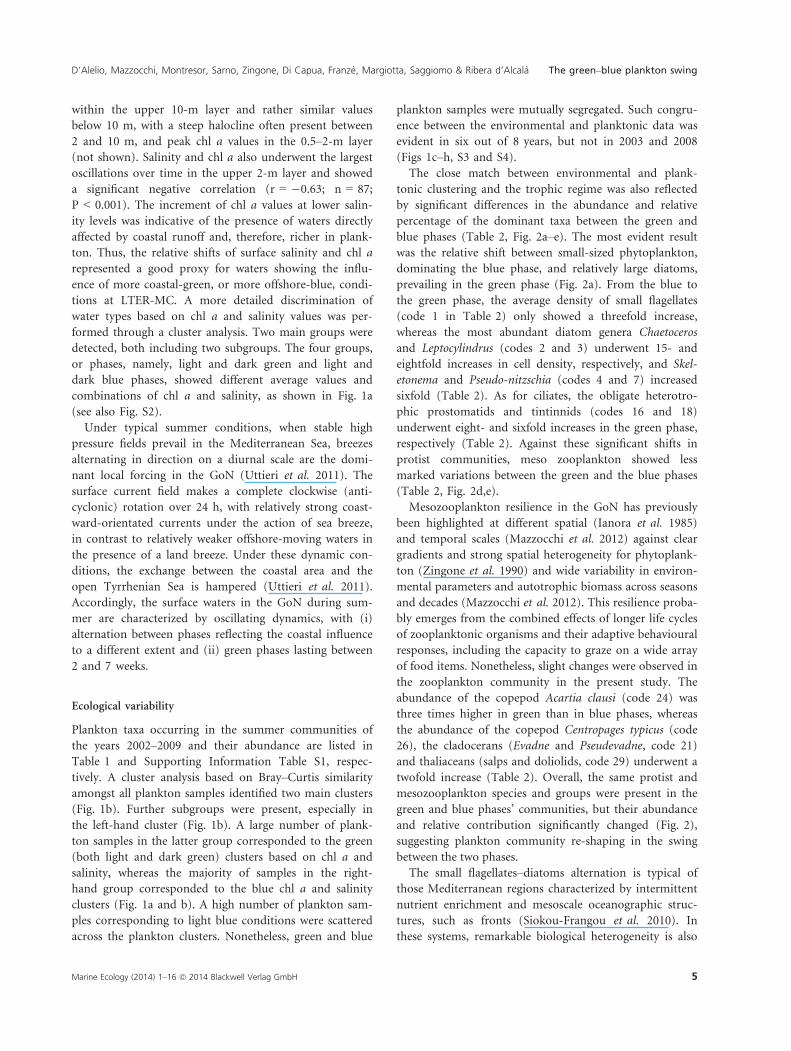
within the upper 10-m layer and rather similar values
below 10 m, with a steep halocline often present between
2 and 10 m, and peak chl a values in the 0.5–2-m layer
(not shown). Salinity and chl a also underwent the largest
oscillations over time in the upper 2-m layer and showed
a significant negative correlation (r = �0.63; n = 87;
P < 0.001). The increment of chl a values at lower salin-
ity levels was indicative of the presence of waters directly
affected by coastal runoff and, therefore, richer in plank-
ton. Thus, the relative shifts of surface salinity and chl a
represented a good proxy for waters showing the influ-
ence of more coastal-green, or more offshore-blue, condi-
tions at LTER-MC. A more detailed discrimination of
water types based on chl a and salinity values was per-
formed through a cluster analysis. Two main groups were
detected, both including two subgroups. The four groups,
or phases, namely, light and dark green and light and
dark blue phases, showed different average values and
combinations of chl a and salinity, as shown in Fig. 1a
(see also Fig. S2).
Under typical summer conditions, when stable high
pressure fields prevail in the Mediterranean Sea, breezes
alternating in direction on a diurnal scale are the domi-
nant local forcing in the GoN (Uttieri et al. 2011). The
surface current field makes a complete clockwise (anti-
cyclonic) rotation over 24 h, with relatively strong coast-
ward-orientated currents under the action of sea breeze,
in contrast to relatively weaker offshore-moving waters in
the presence of a land breeze. Under these dynamic con-
ditions, the exchange between the coastal area and the
open Tyrrhenian Sea is hampered (Uttieri et al. 2011).
Accordingly, the surface waters in the GoN during sum-
mer are characterized by oscillating dynamics, with (i)
alternation between phases reflecting the coastal influence
to a different extent and (ii) green phases lasting between
2 and 7 weeks.
Ecological variability
Plankton taxa occurring in the summer communities of
the years 2002–2009 and their abundance are listed in
Table 1 and Supporting Information Table S1, respec-
tively. A cluster analysis based on Bray–Curtis similarity
amongst all plankton samples identified two main clusters
(Fig. 1b). Further subgroups were present, especially in
the left-hand cluster (Fig. 1b). A large number of plank-
ton samples in the latter group corresponded to the green
(both light and dark green) clusters based on chl a and
salinity, whereas the majority of samples in the right-
hand group corresponded to the blue chl a and salinity
clusters (Fig. 1a and b). A high number of plankton sam-
ples corresponding to light blue conditions were scattered
across the plankton clusters. Nonetheless, green and blue
plankton samples were mutually segregated. Such congru-
ence between the environmental and planktonic data was
evident in six out of 8 years, but not in 2003 and 2008
(Figs 1c–h, S3 and S4).
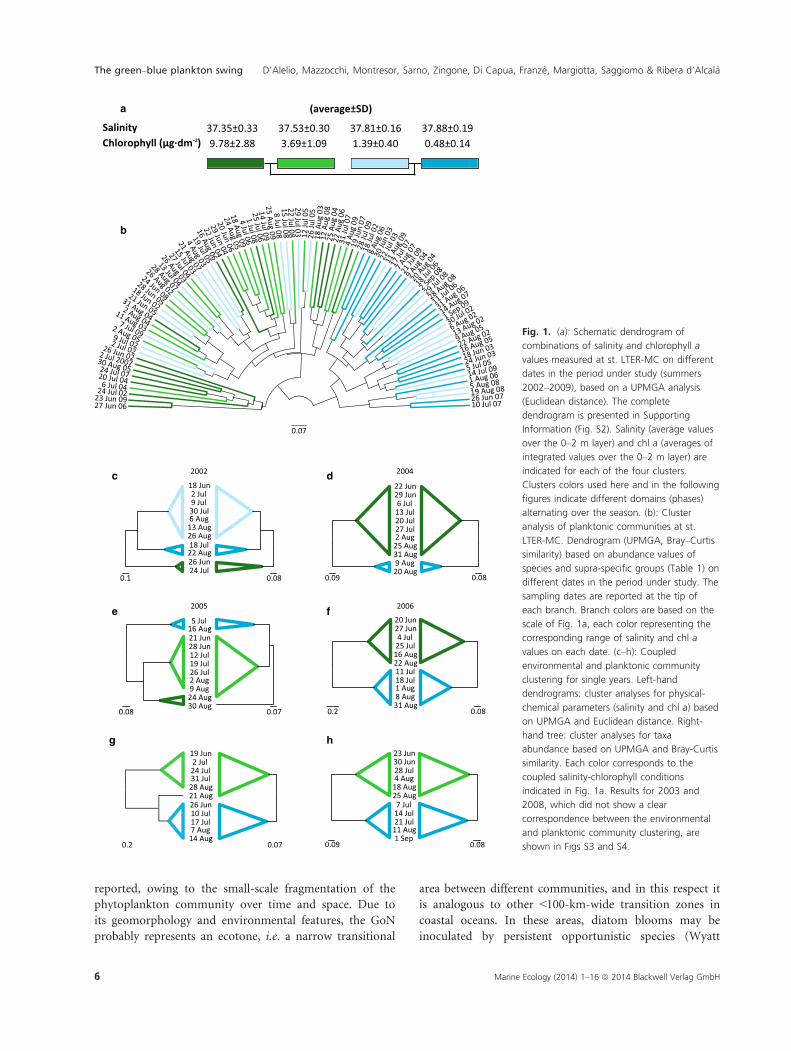
The close match between environmental and plank-
tonic clustering and the trophic regime was also reflected
by significant differences in the abundance and relative
percentage of the dominant taxa between the green and
blue phases (Table 2, Fig. 2a–e). The most evident result
was the relative shift between small-sized phytoplankton,
dominating the blue phase, and relatively large diatoms,
prevailing in the green phase (Fig. 2a). From the blue to
the green phase, the average density of small flagellates
(code 1 in Table 2) only showed a threefold increase,
whereas the most abundant diatom genera Chaetoceros
and Leptocylindrus (codes 2 and 3) underwent 15- and
eightfold increases in cell density, respectively, and Skel-
etonema and Pseudo-nitzschia (codes 4 and 7) increased
sixfold (Table 2). As for ciliates, the obligate heterotro-
phic prostomatids and tintinnids (codes 16 and 18)
underwent eight- and sixfold increases in the green phase,
respectively (Table 2). Against these significant shifts in
protist communities, meso zooplankton showed less
marked variations between the green and the blue phases
(Table 2, Fig. 2d,e).
Mesozooplankton resilience in the GoN has previously
been highlighted at different spatial (Ianora et al. 1985)
and temporal scales (Mazzocchi et al. 2012) against clear
gradients and strong spatial heterogeneity for phytoplank-
ton (Zingone et al. 1990) and wide variability in environ-
mental parameters and autotrophic biomass across seasons
and decades (Mazzocchi et al. 2012). This resilience proba-
bly emerges from the combined effects of longer life cycles
of zooplanktonic organisms and their adaptive behavioural
responses, including the capacity to graze on a wide array
of food items. Nonetheless, slight changes were observed in
the zooplankton community in the present study. The
abundance of the copepod Acartia clausi (code 24) was
three times higher in green than in blue phases, whereas
the abundance of the copepod Centropages typicus (code
26), the cladocerans (Evadne and Pseudevadne, code 21)
and thaliaceans (salps and doliolids, code 29) underwent a
twofold increase (Table 2). Overall, the same protist and
mesozooplankton species and groups were present in the
green and blue phases’ communities, but their abundance
and relative contribution significantly changed (Fig. 2),
suggesting plankton community re-shaping in the swing
between the two phases.
The small flagellates–diatoms alternation is typical of
those Mediterranean regions characterized by intermittent
nutrient enrichment and mesoscale oceanographic struc-
tures, such as fronts (Siokou-Frangou et al. 2010). In
these systems, remarkable biological heterogeneity is also
Marine Ecology (2014) 1–16 ª 2014 Blackwell Verlag GmbH 5
D’Alelio, Mazzocchi, Montresor, Sarno, Zingone, Di Capua, Franz�e, Margiotta, Saggiomo & Ribera d’Alcal�a The green–blue plankton swing
reported, owing to the small-scale fragmentation of the
phytoplankton community over time and space. Due to
its geomorphology and environmental features, the GoN
probably represents an ecotone, i.e. a narrow transitional
area between different communities, and in this respect it
is analogous to other <100-km-wide transition zones in
coastal oceans. In these areas, diatom blooms may be
inoculated by persistent opportunistic species (Wyatt
0.1 0.08
2 Jul
13 Aug
9 Jul30 Jul
26 Aug
18 Jun
6 Aug
18 Jul22 Aug26 Jun24 Jul
16 Aug
19 Jul
21 Jun28 Jun
26 Jul
5 Jul
12 Jul
2 Aug9 Aug24 Aug30 Aug
2 Jul
21 Aug
24 Jul31 Jul
26 Jun
19 Jun
28 Aug
10 Jul17 Jul7 Aug14 Aug
30 Jun
25 Aug
28 Jul4 Aug
7 Jul
23 Jun
18 Aug
14 Jul21 Jul11 Aug1 Sep
0.09
29 Jun
9 Aug
6 Jul13 Jul
20 Aug
22 Jun
20 Jul27 Jul2 Aug25 Aug31 Aug
27 Jun
8 Aug
4 Jul25 Jul
31 Aug
20 Jun
16 Aug22 Aug11 Jul18 Jul1 Aug
2004
7 Jul 09
8 Au
g 06
24 Jul 02
28 Jun 05
7 Aug
0727 Jun 06
28 Aug 07
1 Sep 09
24 Jun 03
30 Ju
n 03
18 Aug 09 12 A
ug 0
8
28 Aug 08
14 Aug 07
30 Jul 02
26 Jun 07
26 Aug 03
24 Aug 05
31 Aug 06
26 Aug 02
1 Jul 08
2 Aug 05
2 Aug 04
17 Ju
l 07
6 Aug 02
9 Aug 05
2 Jul 02
5 Aug 08
18 Jun 03
18 A
ug 0
3
29 Jul 0
8
22 Aug 02
21 Aug 07
28 Ju
l 09
19 Aug 08
31 Aug 04
30 Aug 05
22 Jun 04
23 Jun 099 A
ug 04
20 Jul 04
30lu
J92
4 Au
g 09
19 Ju
n 07
14 Jul 09
50luJ21
24 Jun 08
18 Ju
l 02
13 Jul 04
19 Jul 05
2 Jul 2007
10 Jul 07
26 Jun 02
4 Jul 06
5 Jul 05
4 Aug 03
31 Ju
l 07
15 Jul 03
80lu
J22
20 Aug 0
4
16 Aug 05
11 Jul 06
25 A
ug 0
4
21 Ju
l 09
18 Jul 0
6
29 Jun 04
24 Jul 07
21 Jun 05
2 Sep 08
25 Aug 098 Jul 08
13 Aug 02
27 Jul 04
20 Jun 06
6 Jul 04
15 Jul 08
11 Aug 03
25 Jul 06 26 Ju
l 0514 Jul 09
11 A
ug 09
1 Aug 06
22 A
ug 0
6
18 Jun 02
16 Aug 06 22 Ju
l 03
9 Jul 02
SalinityChlorophyll (µg·dm–2)
37.35±0.33 9.78±2.88
37.53±0.30 3.69±1.09
37.81±0.16 1.39±0.40
37.88±0.19 0.48±0.14
a
b
c d
e f
g h
2002
2005 2006
0.08
0.08 0.07 0.2 0.08
0.2 0.07 0.09 0.08
0.07
(average±SD)
Fig. 1. (a): Schematic dendrogram of
combinations of salinity and chlorophyll a
values measured at st. LTER-MC on different
dates in the period under study (summers
2002–2009), based on a UPMGA analysis
(Euclidean distance). The complete
dendrogram is presented in Supporting
Information (Fig. S2). Salinity (average values
over the 0–2 m layer) and chl a (averages of
integrated values over the 0–2 m layer) are
indicated for each of the four clusters.
Clusters colors used here and in the following
figures indicate different domains (phases)
alternating over the season. (b): Cluster
analysis of planktonic communities at st.
LTER-MC. Dendrogram (UPMGA, Bray–Curtis
similarity) based on abundance values of
species and supra-specific groups (Table 1) on
different dates in the period under study. The
sampling dates are reported at the tip of
each branch. Branch colors are based on the
scale of Fig. 1a, each color representing the
corresponding range of salinity and chl a
values on each date. (c–h): Coupled
environmental and planktonic community
clustering for single years. Left-hand
dendrograms: cluster analyses for physical-
chemical parameters (salinity and chl a) based
on UPMGA and Euclidean distance. Right-
hand tree: cluster analyses for taxa
abundance based on UPMGA and Bray-Curtis
similarity. Each color corresponds to the
coupled salinity-chlorophyll conditions
indicated in Fig. 1a. Results for 2003 and
2008, which did not show a clear
correspondence between the environmental
and planktonic community clustering, are
shown in Figs S3 and S4.
6 Marine Ecology (2014) 1–16 ª 2014 Blackwell Verlag GmbH
The green–blue plankton swing D’Alelio, Mazzocchi, Montresor, Sarno, Zingone, Di Capua, Franz�e, Margiotta, Saggiomo & Ribera d’Alcal�a
2012) and/or sustained by the germination of resting
spores from coastal sediments (Montresor et al. 2013).
The higher proportion of diatoms versus small flagellates
under high nutrient conditions reflects the significantly
higher growth potential of these opportunistic, r-strategist
organisms (Zingone et al. 1990; Wyatt 2012).
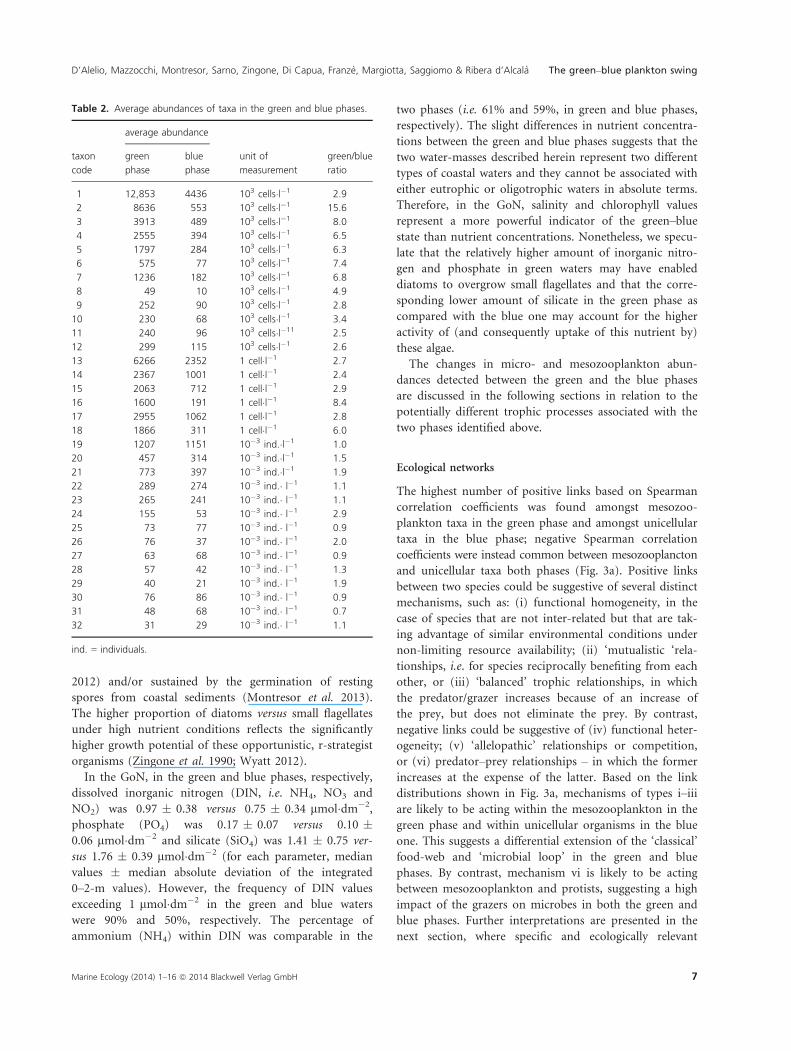
In the GoN, in the green and blue phases, respectively,
dissolved inorganic nitrogen (DIN, i.e. NH4, NO3 and
NO2) was 0.97 � 0.38 versus 0.75 � 0.34 lmol�dm�2,
phosphate (PO4) was 0.17 � 0.07 versus 0.10 �0.06 lmol�dm�2 and silicate (SiO4) was 1.41 � 0.75 ver-
sus 1.76 � 0.39 lmol�dm�2 (for each parameter, median
values � median absolute deviation of the integrated
0–2-m values). However, the frequency of DIN values
exceeding 1 lmol�dm�2 in the green and blue waters
were 90% and 50%, respectively. The percentage of
ammonium (NH4) within DIN was comparable in the
two phases (i.e. 61% and 59%, in green and blue phases,
respectively). The slight differences in nutrient concentra-
tions between the green and blue phases suggests that the
two water-masses described herein represent two different
types of coastal waters and they cannot be associated with
either eutrophic or oligotrophic waters in absolute terms.
Therefore, in the GoN, salinity and chlorophyll values
represent a more powerful indicator of the green–bluestate than nutrient concentrations. Nonetheless, we specu-
late that the relatively higher amount of inorganic nitro-
gen and phosphate in green waters may have enabled
diatoms to overgrow small flagellates and that the corre-
sponding lower amount of silicate in the green phase as
compared with the blue one may account for the higher
activity of (and consequently uptake of this nutrient by)
these algae.
The changes in micro- and mesozooplankton abun-
dances detected between the green and the blue phases
are discussed in the following sections in relation to the
potentially different trophic processes associated with the
two phases identified above.
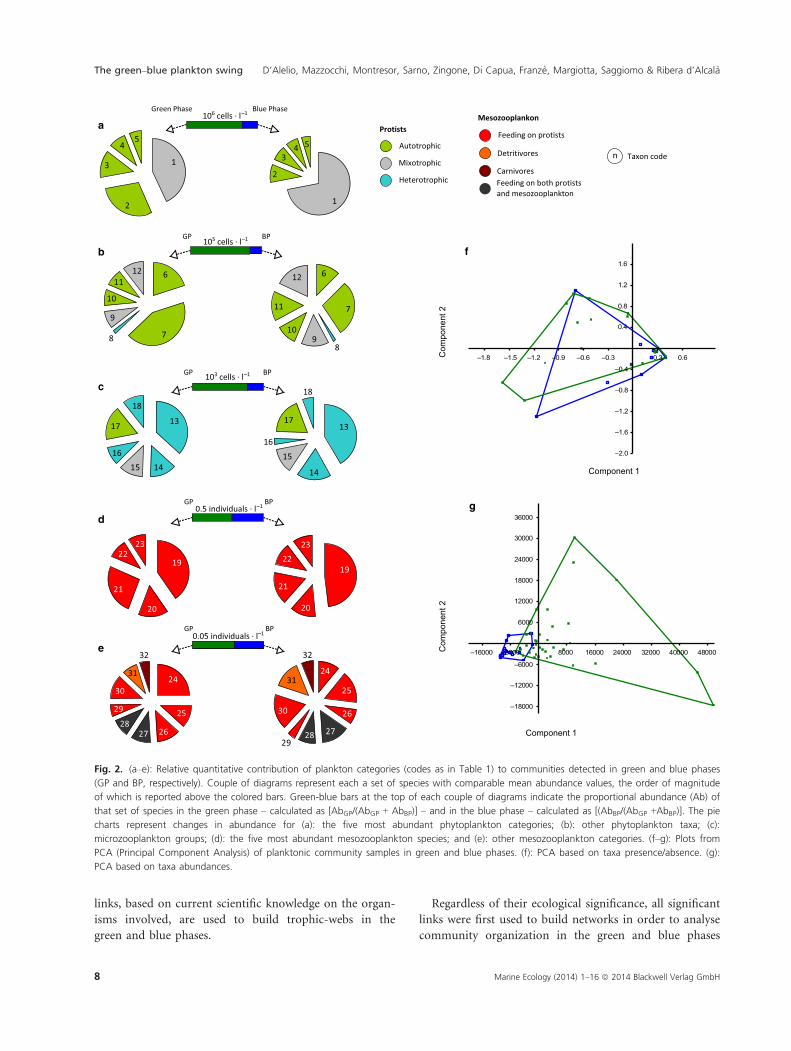
Ecological networks
The highest number of positive links based on Spearman
correlation coefficients was found amongst mesozoo-
plankton taxa in the green phase and amongst unicellular
taxa in the blue phase; negative Spearman correlation
coefficients were instead common between mesozooplancton
and unicellular taxa both phases (Fig. 3a). Positive links
between two species could be suggestive of several distinct
mechanisms, such as: (i) functional homogeneity, in the
case of species that are not inter-related but that are tak-
ing advantage of similar environmental conditions under
non-limiting resource availability; (ii) ‘mutualistic ‘rela-
tionships, i.e. for species reciprocally benefiting from each
other, or (iii) ‘balanced’ trophic relationships, in which
the predator/grazer increases because of an increase of
the prey, but does not eliminate the prey. By contrast,
negative links could be suggestive of (iv) functional heter-
ogeneity; (v) ‘allelopathic’ relationships or competition,
or (vi) predator–prey relationships – in which the former
increases at the expense of the latter. Based on the link
distributions shown in Fig. 3a, mechanisms of types i–iiiare likely to be acting within the mesozooplankton in the
green phase and within unicellular organisms in the blue
one. This suggests a differential extension of the ‘classical’
food-web and ‘microbial loop’ in the green and blue
phases. By contrast, mechanism vi is likely to be acting
between mesozooplankton and protists, suggesting a high
impact of the grazers on microbes in both the green and
blue phases. Further interpretations are presented in the
next section, where specific and ecologically relevant
Table 2. Average abundances of taxa in the green and blue phases.
taxon
code
average abundance
unit of
measurement
green/blue
ratio
green
phase
blue
phase
1 12,853 4436 103 cells�l�1 2.9
2 8636 553 103 cells�l�1 15.6
3 3913 489 103 cells�l�1 8.0
4 2555 394 103 cells�l�1 6.5
5 1797 284 103 cells�l�1 6.3
6 575 77 103 cells�l�1 7.4
7 1236 182 103 cells�l�1 6.8
8 49 10 103 cells�l�1 4.9
9 252 90 103 cells�l�1 2.8
10 230 68 103 cells�l�1 3.4
11 240 96 103 cells�l�11 2.5
12 299 115 103 cells�l�1 2.6
13 6266 2352 1 cell�l�1 2.7
14 2367 1001 1 cell�l�1 2.4
15 2063 712 1 cell�l�1 2.9
16 1600 191 1 cell�l�1 8.4
17 2955 1062 1 cell�l�1 2.8
18 1866 311 1 cell�l�1 6.0
19 1207 1151 10�3 ind.�l�1 1.0
20 457 314 10�3 ind.�l�1 1.5
21 773 397 10�3 ind.�l�1 1.9
22 289 274 10�3 ind.� l�1 1.1
23 265 241 10�3 ind.� l�1 1.1
24 155 53 10�3 ind.� l�1 2.9
25 73 77 10�3 ind.� l�1 0.9
26 76 37 10�3 ind.� l�1 2.0
27 63 68 10�3 ind.� l�1 0.9
28 57 42 10�3 ind.� l�1 1.3
29 40 21 10�3 ind.� l�1 1.9
30 76 86 10�3 ind.� l�1 0.9
31 48 68 10�3 ind.� l�1 0.7
32 31 29 10�3 ind.� l�1 1.1
ind. = individuals.
Marine Ecology (2014) 1–16 ª 2014 Blackwell Verlag GmbH 7
D’Alelio, Mazzocchi, Montresor, Sarno, Zingone, Di Capua, Franz�e, Margiotta, Saggiomo & Ribera d’Alcal�a The green–blue plankton swing
links, based on current scientific knowledge on the organ-
isms involved, are used to build trophic-webs in the
green and blue phases.
Regardless of their ecological significance, all significant
links were first used to build networks in order to analyse
community organization in the green and blue phases
1
2
34 5
1
2
3
45
6
7
89
10
11
126
78
9
10
1112
13
14
15
16
17
18
13
51 4116
17
18
19
20
21
2223
19
20
21
2223
24
25
26
272829
30
31
32
24
25
262728
29
30
31
32
106 cells · l–1
105 cells · l–1
103 cells · l–1
0.5 individuals · l–1
0.05 individuals · l–1
a
b
c
d
e
Green Phase Blue Phase
f
g
GP BP
GP BP
GP BP
GP BP
–1.8 –1.5 –1.2 –0.9 –0.6 –0.3 0.3 0.6
–2.0
–1.6
–1.2
–0.8
–0.4
0.4
0.8
1.2
1.6
Component 1
Com
pone
nt 2
–16000 –8000 8000 16000 24000 32000 40000 48000
–18000
–12000
–6000
6000
12000
18000
24000
30000
36000
Component 1
Com
pone
nt 2
Mesozooplankon
Feeding on protists
Detritivores
CarnivoresFeeding on both protists and mesozooplankton
Autotrophic
Protists
Mixotrophic
Heterotrophic
Taxon coden
Fig. 2. (a–e): Relative quantitative contribution of plankton categories (codes as in Table 1) to communities detected in green and blue phases
(GP and BP, respectively). Couple of diagrams represent each a set of species with comparable mean abundance values, the order of magnitude
of which is reported above the colored bars. Green-blue bars at the top of each couple of diagrams indicate the proportional abundance (Ab) of
that set of species in the green phase – calculated as [AbGP/(AbGP + AbBP)] – and in the blue phase – calculated as [(AbBP/(AbGP +AbBP)]. The pie
charts represent changes in abundance for (a): the five most abundant phytoplankton categories; (b): other phytoplankton taxa; (c):
microzooplankton groups; (d): the five most abundant mesozooplankton species; and (e): other mesozooplankton categories. (f–g): Plots from
PCA (Principal Component Analysis) of planktonic community samples in green and blue phases. (f): PCA based on taxa presence/absence. (g):
PCA based on taxa abundances.
8 Marine Ecology (2014) 1–16 ª 2014 Blackwell Verlag GmbH
The green–blue plankton swing D’Alelio, Mazzocchi, Montresor, Sarno, Zingone, Di Capua, Franz�e, Margiotta, Saggiomo & Ribera d’Alcal�a
32
31
30
29
28
2726
25
24
23
22
21
20
19
18
17
16
15
14
1312
11
10
9
8
7
6
5
4
3
2
1 12
34
5
6
7
8
9
1011
12
13
14
15
1617
18
19
20
21
22
23
2425
26
27 28
29
30
31
32
1
2
3
4
5
6
7
8
9
10
11
12
13
14
15
16 17
1819
20
21
22
23
2425
2627
2829
30
31
32
1
2
3
4
5
6
7
8
9
10
11
12
13
14
15
16
17
18
19
20
21
22
23
24
25
26
27
28
29
30
31
MxMMxUUxU
GP – Positive links (%) GP – Negative links (%) BP – Positive links (%) BP – Negative links (%)
1
4 5
8
9
1011
12
13
14
15
16 17
21
24
25
27
29 30
31 26
26 7
19 22 23
34 7
9
10 11
13
14
1519 2021 2325
27
28
32
117
24
26 30
6
31
a
b c d e
f g
0 20 40 60 0 20 40 60 0 20 40 60 0 20 40 60
Mesozooplankon
Feeding on protists
Detritivores
CarnivoresFeeding on both protists and mesozooplankton
Autotrophic
Protists
Mixotrophic
Heterotrophic
Taxon coden
C+ = 0.20C– = 0.11
C+ = 0.17
C – = 0.13
Ctot = 0.31 Ctot = 0.29
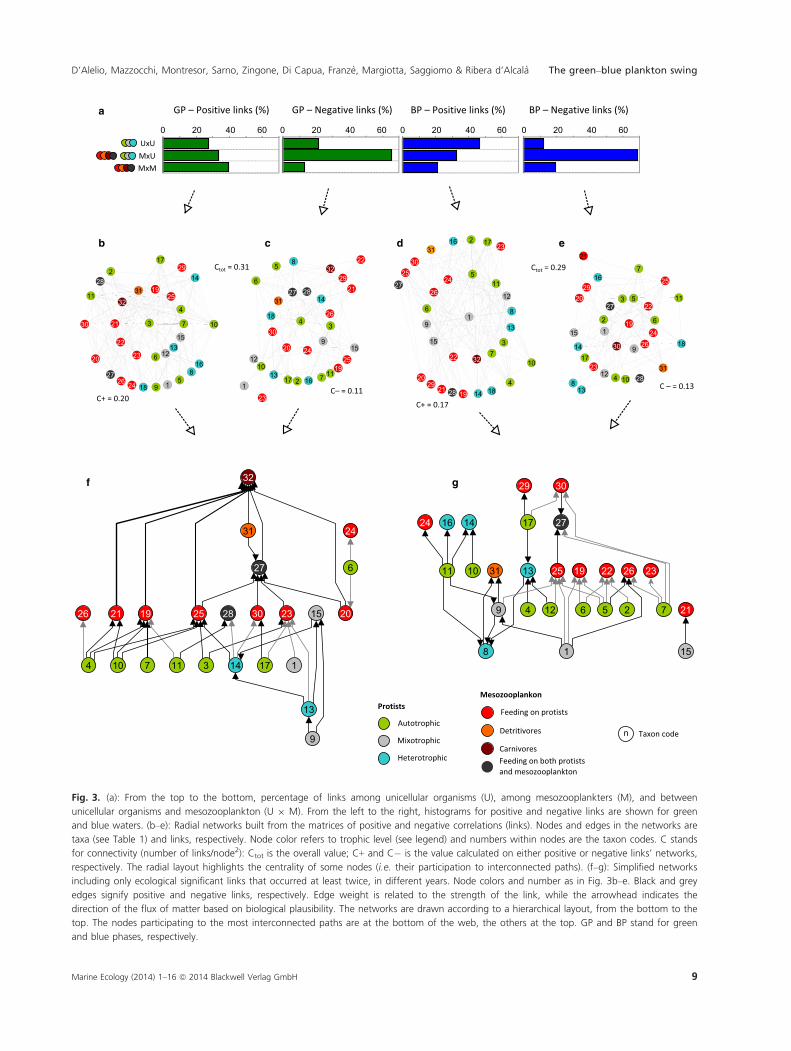
Fig. 3. (a): From the top to the bottom, percentage of links among unicellular organisms (U), among mesozooplankters (M), and between
unicellular organisms and mesozooplankton (U 9 M). From the left to the right, histograms for positive and negative links are shown for green
and blue waters. (b–e): Radial networks built from the matrices of positive and negative correlations (links). Nodes and edges in the networks are
taxa (see Table 1) and links, respectively. Node color refers to trophic level (see legend) and numbers within nodes are the taxon codes. C stands
for connectivity (number of links/node2): Ctot is the overall value; C+ and C� is the value calculated on either positive or negative links’ networks,
respectively. The radial layout highlights the centrality of some nodes (i.e. their participation to interconnected paths). (f–g): Simplified networks
including only ecological significant links that occurred at least twice, in different years. Node colors and number as in Fig. 3b–e. Black and grey
edges signify positive and negative links, respectively. Edge weight is related to the strength of the link, while the arrowhead indicates the
direction of the flux of matter based on biological plausibility. The networks are drawn according to a hierarchical layout, from the bottom to the
top. The nodes participating to the most interconnected paths are at the bottom of the web, the others at the top. GP and BP stand for green
and blue phases, respectively.
Marine Ecology (2014) 1–16 ª 2014 Blackwell Verlag GmbH 9
D’Alelio, Mazzocchi, Montresor, Sarno, Zingone, Di Capua, Franz�e, Margiotta, Saggiomo & Ribera d’Alcal�a The green–blue plankton swing
based on topological properties. To reduce complexity,
positive and negative links were reported for each phase
in distinct networks (Fig. 3b–e). Amongst network prop-
erties, we focused on stability and centrality.
Stability is related to network complexity, which is rep-
resented by the parameter named ‘connectance’, calcu-
lated as the number of links over the total possible
number of links (Beckerman et al. 2006). In this study,
connectance was very high in both green and blue phases
(i.e. 0.31 and 0.29, respectively), challenging the view that
aquatic food-webs are less stable than terrestrial ones.
Connectance values spanning 0.03–0.32 were reported for
different communities of multicellular organisms, the
lowest values being found in aquatic food-webs in stream
ecosystems, which are probably the most unstable ones
(Dunne et al. 2004). Very low connectance values were
also reported for aquatic food-webs in the Arctic (0.05)
and Antarctic (0.01) ecosystems (de Santana et al. 2013),
probably because of stronger environmental oscillations,
mainly in the light regime. However, the microbial and
photosynthetic components were not included in the
analyses by de Santana et al. (2013). Hence, the overall
stability may have been underestimated and should be
further investigated to fully assess the vulnerability of
polar systems to climate variations. Interestingly, in the
green phase in the GoN, connectance in the positive sub-
network (Fig. 3b) was about double that in the negative
one (Fig. 3c). This fact suggests that positive (synergistic)
processes may be more effective than negative (competi-
tive) ones in stabilizing the green phase community. By
contrast, connectance values of positive and negative sub-
networks in the blue phases were not very different from
each other. Taken together, these observations suggest
that, despite the assumed large variability at small scales
of coastal environments, robust biological interactions do
take place in communities living therein. We can thus
speculate that co-evolution processes and life strategies
favouring persistence may have been strong drivers in
these environments.
Another relevant piece of information provided by net-
works is the quantitative assessment of centrality, i.e. how
links are distributed across the system and whether and
to what extent the organization of the latter can rely on a
single or a few species. For instance, centrality assessment
can be used to identify potentially keystone species in
food-webs/ecosystems (Jord�an 2009). Based on the radial
layout used in Fig. 3b–e, the node present in the most
inter-connected paths in the diagram was chosen as the
central node, according to an algorithm that measures
weighted centrality. Furthermore, nodes were assigned to
circles in such a way that edges either connected nodes
on subsequent circles or nodes placed on the same circle.
In our elaborations, each network was characterized by
distinct central nodes and two crown-levels of nodes with
a lower centrality (Fig. 3b–e). In positive-links networks
(Fig. 3b and d), the central nodes were the diatom Lepto-
cylindrus (code 3) in the green phase and a heterogeneous
group composed of small (<10 lm) flagellates (code 1)
in the blue phase. In negative-links networks (Fig. 3c and
e), the diatom genus Skeletonema (code 4) and the cla-
doceran Penilia avirostris (code 19) were central in the
green and blue phases, respectively. Besides differences in
central nodes, distinct motifs characterized the four radial
networks. For instance, considering positive links, in the
green-phase network the first-crown level showed many
links between Leptocylindrus in the central node and me-
sozooplankton. By contrast, in the blue-phase network, a
comparable number of links was detected between flagel-
lates in the central node and mesozooplankton and mixo-
and heterotrophic protists in the first-crown level.
Correlation networks have at times been used as an
exploratory approach to characterize plankton communi-
ties in terms of links amongst their components and to
sort for possible biological mechanisms at the base of
their organization (Steele et al. 2011). Yet, connectance
and centrality have never been estimated for planktonic
communities and no specific comparison with our data
was possible. Our analyses showed that the overall com-
munity organizations according to the possible links
detected amongst the same taxa were significantly differ-
ent between the green and blue phases (Fig. 3b–e). Thesedifferences were only partially explained in terms of the
changes in the abundances of taxa in the green and blue
phases. In fact, a large fraction of links involved commu-
nity elements showing comparable densities in the two
phases.
The green plankton food-web
The ecological networks shown in Fig. 3b–e report all the
links, i.e. co-variations, detected amongst the different
nodes in the plankton community. These links were sta-
tistically relevant – the majority of them significantly so
(Fig. S1) – but not necessarily ecologically relevant. The
latter property was explored by producing sub-networks
including only the links occurring at least twice and hav-
ing trophic significance. Links between species or species-
groups belonging to the same trophic/functional level
were not considered because of the still scarce knowledge
on synergistic or competitive interactions amongst plank-
ton available to date. Two hypothetical trophic-webs were
reconstructed based on Spearman correlations for the
green and blue phases, respectively (Fig. 3f and g). The
networks included only potential trophic links, both posi-
tive and negative, that were detected at least in two of
the 8 years under study. Positive and negative links were
10 Marine Ecology (2014) 1–16 ª 2014 Blackwell Verlag GmbH
The green–blue plankton swing D’Alelio, Mazzocchi, Montresor, Sarno, Zingone, Di Capua, Franz�e, Margiotta, Saggiomo & Ribera d’Alcal�a
interpreted as mechanisms of types ‘iii’ and ‘vi’, namely,
‘balanced’ trophic and predator–prey relationships,
respectively, as indicated in the previous section. Net-
works were arranged according to a hierarchical criterion,
with the nodes participating in the most inter-connected
paths at the bottom.
In the green trophic-network, positive links largely
exceeded negative ones and the elements at the higher
trophic levels were mainly generalists. For instance, the
suspension-feeding copepod Temora stylifera (code 25,
Table 1, Fig. 3f) was one of the most linked zooplankters,
being positively correlated with three categories of
bloom-forming diatoms (namely, codes 3, 4, 10) as well
as with large-celled heterotrophic ciliates (code 14). In
the GoN, T. stylifera was concentrated within the upper
30-m layer during summer (Di Capua & Mazzocchi
2004). Interestingly, the feeding rate of T. stylifera has
been reported to accelerate in the presence of polyunsatu-
rated aldehydes released by diatoms (Ka et al. 2013).
Moreover, this copepod can perform small-scale diel ver-
tical migration and increase nocturnal feeding activity in
the chlorophyll-rich surface waters in the Rhone river
plume area (Northwestern Mediterranean; Pagano et al.
1993). A rapid response of T. stylifera to food availability
through vertical migrations is likely to occur in the GoN
population and could determine the trophic links with
diatoms observed in green waters. Thanks to this
behavioural plasticity, T. stylifera may compete effectively
with other suspension feeders typical of the summer in
the GoN, such as cladocerans, despite a much lower
abundance than the latter.
Unlike copepods, cladocerans reproduce by partheno-
genesis and can rapidly increase their population size over
a short time (Atienza et al. 2008). Thus, high reproduc-
tion rates rather than migration are most likely to be the
cause of short-term changes in population size in this
case. Amongst cladocerans, Penilia avirostris (code 19)
showed multiple links with phytoplankton, i.e. three dia-
tom taxa (Skeletonema, Pseudo-nitzschia and centric dia-
toms >10 lm, codes 4, 7, 10; positive correlations) and
coccolithophores (code 11, negative correlation), in the
green phase (Fig. 3f). Under experimental conditions, the
suspension-feeding P. avirostris showed relatively lower
grazing pressure on colonial diatoms than on single-celled
diatoms, dinoflagellates and ciliates (Atienza et al. 2006).
As diatoms have shown a limited tendency to form colo-
nies during summer in the GoN (Zingone et al. 1990),
they might indeed represent suitable food items for
P. avirostris. Interestingly, a relatively stronger positive
link, shown in three out of 5 years, was detected between
P. avirostris and Pseudo-nitzschia, a genus including sev-
eral potentially toxic species in the GoN (Zingone et al.
2006). The rapid increase in abundance of cladocerans
through parthenogenesis requires a contemporary
increase in grazing rate by females and juveniles. Pseudo-
nitzschia species, reported to be either selected against or
not-preferred by copepods in a multi-diet experiment
(Olson et al. 2006), could be an available prey to cladoc-
erans, with no need to compete with copepods. Accord-
ingly, the robust and exclusive link of Pseudo-nitzschia
spp. to P. avirostris in our study corroborates the idea
that food selectivity in mesozooplankton could be a way
to pursue niche partitioning and reduce competition
amongst suspension feeders (Katechakis 2004).
At the same trophic level, the relatively abundant and
effective filter-feeders appendicularians (code 23) were
related positively with the bloom-forming diatom Lepto-
cylindrus (code 3, Fig. 3f) and negatively with small uni-
cellular organisms, such as <10-lm-flagellates (code 1),
and ciliates (codes 13 and 17). Evidence of multifaceted
interactions between these tunicates and ciliates has been
obtained previously (Lombard et al. 2010). Our observa-
tions suggest an active role of appendicularians in the
microbial loop as a main mortality factor for slow-grow-
ing or non-photosynthetic microbes. Amongst microbial-
loop-like interactions, a pathway involving four categories
of mixo-and heterotrophic unicellular organisms (codes
9, 13, 14 and 15) was worthy of notice. Small dinoflagel-
lates <15 lm (code 9) were directly linked to larger
(≤25 lm) mixo- and heterotrophic ciliates (codes 13 and
15), whereas the latter were linked to even larger (above
25 lm) heterotrophic ciliates (code 14). This result is in
line with earlier empirical evidence of intra-guild preda-
tion amongst microzooplankton in the GoN at LTER-MC
(Franz�e & Modigh 2013). Yet, microbial-loop-like links
in green waters were far less common than those associ-
ated with a classical trophic-web, whereas no relevant
links were detected between phytoplankton and micro-
zooplankton.
At a higher trophic level in the green food-web, the
ambush-feeding copepods Oithona spp. (code 27) were
positively correlated with four mesozooplankters– namely,
three categories of copepods and appendicularians (codes
20, 23, 25 and 30). Oithona spp. are omnivorous cyclo-
poid copepods feeding on both living (microbes and
other animals) and inert (detritus and faecal pellets)
organic matter (Gonzalez & Smetacek 1994) by means of
raptorial behaviour towards remotely detected preys
(Svensen & Kiørboe 2000). In the summertime green
phase in GoN, the increasing in abundance of Oithona
spp. could be caused by the increased fluxes of some of
their food, e.g. both faecal pellets of T. stylifera and detri-
tus from discharged appendicularian houses. Finally, at
the top of the web, carnivorous zooplankters (code 32)
showed six positive links with herbivorous or omnivorous
zooplankton. In particular, a very strong link, present in
Marine Ecology (2014) 1–16 ª 2014 Blackwell Verlag GmbH 11
D’Alelio, Mazzocchi, Montresor, Sarno, Zingone, Di Capua, Franz�e, Margiotta, Saggiomo & Ribera d’Alcal�a The green–blue plankton swing
four out of the 5 years, was detected amongst carnivores
and the cladocerans, including the genera Evadne and
Pseudevadne (code 21). Nonetheless cladocerans were still
abundant over the summer, as they probably are able to
counteract the effect of predatory pressures by means of
parthenogenetic reproduction.
The blue plankton food-web
In the blue trophic network, a large amount of negative
links potentially associated with trophic relationships was
detected (Fig. 3g), suggesting a higher impact of animal
grazing on microbial populations in the blue than in green
phases. This result was predictable to some extent, based
on limited resources in the blue phase. Small flagellates
and diatoms (codes 1 and 5) in particular appeared to be
highly impacted by many grazers. Noticeably, the general-
ist mesozooplankters Penilia avirostris and Temora stylifera
(codes 19 and 25) kept that trophic status in blue waters,
establishing only negative links with unicellular organisms.
By contrast, carnivores did not play a significant role in
the blue-phase food-web, indicating a relatively low trans-
fer of organic matter to higher trophic levels. Carnivore
zooplankton in this study included mainly chaetognaths,
which occurred with low abundance, having their annual
peak later in the autumn (Mazzocchi et al. 2011). These
secondary consumers, which prey mainly on copepods,
generally have low feeding rates (e.g. Feigenbaum 1991;
Dur�o & Saiz 2000), which may have been even negligible
during low-biomass conditions at the sampling site, mak-
ing them disappear from the food-web in the blue phases.
The different strategies in the primary and secondary con-
sumers may account for the stability in mesozooplankton
composition across the green–blue swing.Indeed, even though the composition and relative
abundance of grazers were similar between the green and
blue communities, different links among grazers and their
potential food were detected in the two phases. Interest-
ingly, two categories of grazers were only present in one
of the two food-webs: juvenile copepods (code 20, co-
pepodites) in the green, and thaliacean salps and doliolids
(code 29) in the blue phases. The more relevant feeding
activity of juvenile copepods may be related to the larger
autotrophic biomass in coastal waters during the green
phase, whereas the presence of thaliaceans in the blue
food-web may hint at the predominance of a microbial
trophic-web sustained by small-sized species. Gelatinous
filter-feeders such as salps and doliolids represent impor-
tant contributors to biogeochemical cycles, with the for-
mer more effective than the latter in poorly productive
waters (Deibel & Paffenhofer 2009). In the putative blue
food-web in the GoN these filter-feeders were linked only
to the photosynthetic ciliate Mesodinium rubrum (code
17), but it cannot be excluded that they may feed on
other ciliates and microbes in general. Thaliaceans feed
over a size-window larger than that of copepods, from
bacteria to other metazoans (Bone 1998). They are
reported to produce large and somewhat unpredictable
outbreaks along Italian coasts (Boero et al. 2013) and can
potentially compete with mesozooplankton and impact
food-webs (Atkinson et al. 2004). Moreover, outbreaks of
the salp Thalia democratica have been linked to positive
anomalies in temperature in the Bay of Villefranche-sur-
mer (Northwestern Mediterranean; Licandro et al. 2006).
The stable presence of thaliaceans in the GoN during the
summer blue phase, emerging also at the level of trophic
links, calls for further investigations on the ecological role
of these organisms in this area. Changes in the oceano-
graphic regime related to climatic oscillations might per-
turbate the green–blue swing described herein, e.g.
causing the predominance of the blue over the green
phases and inducing positive effects on the trophic
impact of filter-feeding gelatinous plankton.
The extent of inter-connected pathways potentially asso-
ciated with microbial grazing was higher in blue than in
green waters. Interestingly, several potentially trophic links
between mixo-heterotrophic ciliates (codes 13, 14 and 16)
and photoautotrophic unicellular organisms were detected,
whereas larger (code 8) and smaller (code 9) dinoflagel-
lates were well integrated in the (mainly microbial) puta-
tive trophic-web (Fig. 3g). Many authors have already
suggested that microzooplankton are major consumers of
diatoms and ciliates and that dinoflagellates can represent
non-univocal trophic levels, being both predator and prey
within the same food-web (Calbet & Landry 2004; Sherr &
Sherr 2007; Modigh & Franz�e 2009; Jeong et al. 2010;
Franz�e & Modigh 2013; Schmoker et al. 2013). Our obser-
vations of apparently convoluted trophic cascades amongst
microzooplankters corroborate the suggestion that a major
part of microbial production may be consumed by
microbes themselves under conditions of relatively low
primary production, as already suggested for the GoN
(Modigh & Franz�e 2009; Franz�e & Modigh 2013).
Despite the lack of observation of links between cope-
pods and ciliates, we cannot exclude that such trophic
relationships do exist in the GoN, especially in the blue
phase. In fact, microzooplankters are presumably an
important element in copepod diet in oligotrophic sys-
tems, where autotrophic production is low and carried
out by small cells, which are rarely consumed by copepods
(Paffenh€ofer et al. 2006; Saiz & Calbet 2010). Amongst co-
pepods, the species Paracalanus parvus (code 22), which is
apparently adapted to low-biomass food environments
with a relatively low phytoplankton/microzooplankton
ratio (Paffenh€ofer & Stearns 1988; Sautour & Castel 1993,
1999), was active only in the blue phase in the GoN,
12 Marine Ecology (2014) 1–16 ª 2014 Blackwell Verlag GmbH
The green–blue plankton swing D’Alelio, Mazzocchi, Montresor, Sarno, Zingone, Di Capua, Franz�e, Margiotta, Saggiomo & Ribera d’Alcal�a
giving further strength to our observations and leading to
the hypothesis of a role played by this species in the com-
munity’s adjustment following the green–blue swing.
Synthesis
The dissection of the internal mechanisms driving the
structure of plankton communities is the key to the
understanding and prediction of its influence on biogeo-
chemical cycles over a wide range of time scales (Tett &
Wilson 2000; Strom 2008; de Senerpont Domis et al.
2013; Behrenfeld & Boss 2014). Limited knowledge on
marine plankton biology and ecology means that this
task is not yet in reach. However, we believe that a
robust characterization of structural patterns going
beyond the paradigmatic divide between the ‘classical
food-web’ and the ‘microbial loop’ is an important step
in that direction. Two approaches seem particularly sui-
ted to that aim: perturbation experiments (Smetacek &
Naqvi 2008) and analysis of time series (Ducklow et al.
2009). In this study we explored the latter using a coastal
time series for which crucial biological information, i.e.
taxonomic characterization of the community, is avail-
able. In this approach perturbations are driven by natural
processes and responses are recorded while processes are
occurring.
During summer, changes in the planktonic system in
the GoN were clearly coupled with horizontal circulation,
which may act as a perturbing force. Indeed fluxes at the
interfaces of the system resulting from lateral mixing and/
or external inputs (terrestrial inputs, exchange with off-
shore waters) alter the environmental conditions and
result in two prevalent patterns, characterizing two envi-
ronmental and trophic domains, the green and the blue
one. This very schematic representation captures an
important feature of the planktonic system at our site: in
summer it appears to swing between the green and blue
phases, which have different organization patterns. An
important feature emerging from our analysis is that the
two community phases are characterized by the same spe-
cies/group composition, although the relative weights of
individual taxa, and hence the community structure,
markedly vary between the domains. This is not unex-
pected and may be attributed to the plasticity of different
players in response to variations in energy and matter
fluxes. It also suggests that the internal homogenization,
probably resulting from lateral mixing, depends upon the
exchange between the coastal and offshore Tyrrhenian
waters, which host a totally different community (e.g. Sio-
kou-Frangou et al. 2010). What is worth noting is that
these changes in community structure are associated with
changes in the functional links amongst the players, obvi-
ously within the assumptions of the network approach.
This re-design of the functional links suggests a biological
plasticity at a higher level, i.e. at the level pertaining to the
community.
The overall picture emerging from our study highlights
that in a coastal ecosystem, in spite of rather stable and
predictable conditions such as those typical of summer in
the GoN, different modes of organization of plankton
communities can emerge even from relatively low levels
of environmental variability. As stated above, the time
scale of these readjustments is difficult to assess with our
data. However, considering the time scales of lateral mix-
ing of the fluxes at the boundaries of the area and the
biological response to this, the community can possibly
re-adjust on a time scale in the order of days, which is
shorter than our sampling resolution. At the inter-annual
scale, the persistence and spatial extension of a green or a
blue phase may vary in relation to the wet or dry climatic
regime during summer, and the same variability probably
affects many other coastal Mediterranean sites. We did
not focus on large perturbations and therefore cannot
provide insight on the impact of extreme climatic events,
such as ‘heat waves’, on these communities. In fact, even
though physiological plasticity can help single species to
overcome temperature perturbations, the plasticity of the
overall community could lead to substantial changes in
its structure and function.
In conclusion, our study demonstrates that long-term
time series can provide useful information on the functional
response of plankton communities to variable environmen-
tal conditions, provided that data are available for a suffi-
cient number of ecologically relevant taxa, and calls for
further analyses based on the community approach. This
approach would enable the decryption of the ensemble of
responses of marine ecosystems to environmental changes
at the interannual scale. In addition, evidence of switching
responses by planktonic organisms should strongly encour-
age the formulation of models, both conceptual and numer-
ical, which should include such responses in order to
improve the representation of the plankton webs in terms
of convolution, stability and relative robustness to environ-
mental oscillations (Wyatt et al. 2001).
Acknowledgements
The authors are very grateful to Augusto Passarelli, Ciro
Chiaese and Ferdinando Tramontano for the regular sam-
pling effort and chlorophyll analysis and to the crew of
the research vessel Vettoria for their assistance. We thank
all colleagues involved in the LTER-MC programme for
their collaboration and fruitful discussions. The work at
LTER-MC is entirely supported by the Stazione Zoologica
Anton Dohrn. The authors thank the Flagship RITMARE
– The Italian Research for the Sea – co-ordinated by the
Marine Ecology (2014) 1–16 ª 2014 Blackwell Verlag GmbH 13
D’Alelio, Mazzocchi, Montresor, Sarno, Zingone, Di Capua, Franz�e, Margiotta, Saggiomo & Ribera d’Alcal�a The green–blue plankton swing
Italian National Research Council and funded by the Ital-
ian Ministry of Education, University and Research
within the National Research Program 2011–2013.
References
Anderson T.R., Gentleman W.C. (2012) The legacy of Gordon
Arthur Riley (1911–1985) and the development of
mathematical models in biological oceanography. Journal of
Marine Research, 70, 30.
Atienza D., Saiz E., Calbet A. (2006) Feeding ecology of the
marine cladoceran Penilia avirostris: natural diet, prey
selectivity and daily ration. Marine Ecology Progress Series,
315, 211–220.
Atienza D., Saiz E., Skovgaard A., Trepat I., Calbet A. (2008)
Life history and population dynamics of the marine
cladoceran Penilia avirostris (Branchiopoda: Cladocera) in
the Catalan Sea (NW Mediterranean). Journal of Plankton
Research, 30, 345–357.
Atkinson A., Siegel V., Pakhomov E., Rothery P. (2004)
Long-term decline in krill stock and increase in salps within
the Southern Ocean. Nature, 432, 100–103.
Beckerman A.P., Petchey O.L., Warren P.H. (2006) Foraging
biology predicts food web complexity. Proceedings of the
National Academy of Sciences of the United States of America,
103, 13745–13759.
Behrenfeld M.J., Boss E.S. (2014) Resurrecting the ecological
underpinnings of ocean plankton blooms. Annual Review of
Marine Science, 6, 167–194.
Bl€uthgen N., Fr€und J., V�azquez D.P., Menzel F. (2008) What
do interaction network metrics tell us about specialization
and biological traits? Ecology, 89, 3387–3399.
Boero F., Belmonte G., Bracale R., Fraschetti S., Piraino S.,
Zampardi S. (2013) A salp bloom (Tunicata, Thaliacea)
along the Apulian coast and in the Otranto Channel
between March–May 2013. F1000 Research, 2, 181. doi: 10.
12688/f1000research.2-181.v1
Bone Q. (1998) The Biology of Pelagic Tunicates. Oxford
University Press, Oxford: 362 pp.
Calbet A., Landry M.R. (2004) Phytoplankton growth,
microzooplankton grazing, and carbon cycling in
marine systems. Limnology and Oceanography, 49, 51–57.
Caron D.A., Hutchins D.A. (2012) The effects of changing
climate on microzooplankton grazing and community
structure: drivers, predictions and knowledge gaps. Journal
of Plankton Research, 35, 235–252.
D’Alelio D., Ribera d’Alcal�a M., Dubroca L., Sarno D.,
Zingone A., Montresor M. (2010) The time for sex: a
biennial life cycle in a marine planktonic diatom. Limnology
and Oceanography, 55, 106–114.
Deibel D., Paffenhofer G.-A. (2009) Predictability of patches of
neritic salps and doliolids (Tunicata, Thaliacea). Journal of
Plankton Research, 31, 1571–1579.
Di Capua I., Mazzocchi M. (2004) Population structure of the
copepods Centropages typicus and Temora stylifera in
different environmental conditions. ICES Journal of Marine
Science, 61, 632–644.
Ducklow H.W., Doney S.C., Steinberg D.K. (2009)
Contributions of long-term research and time-series
observations to marine ecology and biogeochemistry.
Annual Review of Marine Science, 1, 279–302.
Dunne J., Williams R., Martinez N. (2004) Network structure
and robustness of marine food webs. Marine Ecology
Progress Series, 273, 291–302.
Dur�o A., Saiz E. (2000) Distribution and trophic ecology of
chaetognaths in the western Mediterranean in relation to an
inshore-offshore gradient. Journal of Plankton Research, 22,
339–361.
Feigenbaum D. (1991) Food and feeding behavior. In: Bone
Q., Kaap H., Pierrot-Bults A.C. (Eds), The Biology of
the Chaetognaths. Oxford University Press, New York:
45–60.
Franz�e G., Modigh M. (2013) Experimental evidence for
internal predation in microzooplankton communities.
Marine Biology, 160, 3103–3112.
Gonzalez H.E., Smetacek V. (1994) The possible role of the
cyclopoid copepod Oithona in retarding vertical flux of
zooplankton faecal material. Marine Ecology Progress Series,
113, 233–246.
Hansen H.P., Grasshoff K. (1983) Automated chemical
analysis. In: Grasshof K., Ehrhart M., Kremlin K. (Eds),
Methods of Seawater Analysis. Chemie, Weinheim: 347–379.
Holm-Hansen O., Lorenzen C.J., Holmes R.W., Strickland
J.D.H. (1965) Fluorimetric determination of chlorophyll.
Journal du Conseil/Conseil Permanent International pour
l’Exploration de la Mer, 30, 3–15.
Ianora A., Mazzocchi M.G., Scotto Di Carlo B. (1985)
Zooplankton community structure for coastal waters of the
Gulf of Naples summer of 1983. Rapports et Proc�es-Verbaux
des R�eunions – Commission Internationale pour l’Exploration
Scientifique de la Mer M�editerran�ee, 29, 299–300.
Iermano I., Liguori G., Iudicone D., Buongiorno Nardelli B.,
Colella S., Zingone A., Saggiomo V., Ribera d’Alcal�a M.
(2012) Filament formation and evolution in buoyant coastal
waters: observation and modelling. Progress in
Oceanography, 106, 118–137.
Iermano I., Cianelli D., Falco P., Uttieri M., Zambianchi E.
(2013) Characterizing the coastal dynamics behaviour
within the Gulf of Naples using modelling, HF radar and in
situ measurements. EGU General Assembly Conference
Abstracts, 4587 pp.
Jeong H.J., Du Yoo Y., Kim J.S., Seong K.A., Kang N.S., Kim
T.H. (2010) Growth, feeding and ecological roles of the
mixotrophic and heterotrophic dinoflagellates in marine
planktonic food webs. Ocean Science Journal, 45, 65–91.
Jord�an F. (2009) Keystone species and food webs. Philosophical
Transactions of the Royal Society of London. Series B,
Biological Sciences, 364, 1733–1741.
Ka S., Carotenuto Y., Romano G., Hwang J.-S., Buttino I.,
Ianora A. (2013) Impact of the diatom-derived
14 Marine Ecology (2014) 1–16 ª 2014 Blackwell Verlag GmbH
The green–blue plankton swing D’Alelio, Mazzocchi, Montresor, Sarno, Zingone, Di Capua, Franz�e, Margiotta, Saggiomo & Ribera d’Alcal�a
polyunsaturated aldehyde 2-trans,4-trans decadienal on the
feeding, survivorship and reproductive success of the
calanoid copepod Temora stylifera. Marine Environmental
Research, 93, 31–37.
Katechakis A. (2004) Feeding selectivities and food niche
separation of Acartia clausi, Penilia avirostris (Crustacea)
and Doliolum denticulatum (Thaliacea) in Blanes Bay
(Catalan Sea, NW Mediterranean). Journal of Plankton
Research, 26, 589–603.
Katechakis A., Stibor H. (2004) Feeding selectivities of the
marine cladocerans Penilia avirostris, Podon intermedius and
Evadne nordmanni. Marine Biology, 145, 529–539.
Legendre P., Legendre L. (2012) Numerical Ecology. Elsevier,
Amsterdam: 1006 pp.
Licandro P., Ibanez F., Etienne M. (2006) Long-term
fluctuations (1974-1999) of the salps Thalia democratica and
Salpa fusiformis in the northwestern Mediterranean Sea:
relationships with hydroclimatic variability. Limnology and
Oceanography, 51, 1832–1848.
Lombard F., Eloire D., Gobet A., Stemmann L., Dolan J.R.,
Sciandra A., Gorsky G. (2010) Experimental and modeling
evidence of appendicularian-ciliate interactions. Limnology
and Oceanography, 55, 77–90.
Mazzocchi M.G., Licandro P., Dubroca L., Di Capua I.,
Saggiomo V. (2011) Zooplankton associations in a
Mediterranean long-term time-series. Journal of Plankton
Research, 33, 1163–1181.
Mazzocchi M.G., Dubroca L., Garc�ıa-Comas C., Di Capua I.,
Ribera d’Alcal�a M. (2012) Stability and resilience in coastal
copepod assemblages: the case of the Mediterranean
long-term ecological research at Station MC (LTER-MC).
Progress in Oceanography, 97–100, 135–151.
Modigh M. (2001) Seasonal variations of photosynthetic
ciliates at a Mediterranean coastal site. Aquatic Microbial
Ecology, 23, 163–175.
Modigh M., Castaldo S. (2002) Variability and persistence in
tintinnid assemblages at a Mediterranean coastal site.
Aquatic Microbial Ecology, 28, 299–311.
Modigh M., Franz�e G. (2009) Changes in phytoplankton and
microzooplankton populations during grazing experiments
at a Mediterranean coastal site. Journal of Plankton Research,
31, 853–864.
Montresor M., Di Prisco C., Sarno D., Margiotta F., Zingone
A. (2013) Diversity and germination patterns of diatom
resting stages at a coastal Mediterranean site. Marine Ecology
Progress Series, 484, 79–95.
Neveux J., Panouse M. (1987) Spectrofluorometric
determination of chlorophylls and phaeophytins. Archiv f€ur
Hydrobiologie, 109, 567–581.
Olson M., Lessard E., Wong C., Bernhardt M. (2006)
Copepod feeding selectivity on microplankton, including
the toxigenic diatoms Pseudo-nitzschia spp., in the coastal
Pacific Northwest. Marine Ecology Progress Series, 326, 207–
220.
Paffenh€ofer G.-A., Stearns D.E. (1988) Why is Acartia tonsa
(Copepoda: Calanoida) restricted to nearshore
environments? Marine Ecology Progress Series, 42, 33–38.
Paffenh€ofer G.-A., Mazzocchi M.G., Tzeng M.W. (2006) Living
on the edge: feeding of subtropical open ocean copepods.
Marine Ecology, 27, 99–108.
Pagano M., Gaudy R., Thibault D., Lochet F. (1993) Vertical
migrations and feeding rhythms of mesozooplanktonic
organisms in the Rhone River plume area (North-West
Mediterranean Sea). Estuarine, Coastal and Shelf Science, 37,
251–269.
Ribera d’Alcal�a M., Conversano F., Corato F., Licandro P.,
Mangoni O., Marino D., Mazzocchi M.G., Modigh M.,
Montresor M., Nardella M., Saggiomo V., Sarno D.,
Zingone A. (2004) Seasonal patterns in plankton
communities in a pluriannual time series at a coastal
Mediterranean site (Gulf of Naples): an attempt to discern
recurrences and trends. Scientia Marina, 68, 65–83.
Saiz E., Calbet A. (2010) Copepod feeding in the ocean:
scaling patterns, composition of their diet and the bias of
estimates due to microzooplankton grazing during
incubations. Hydrobiologia, 666, 181–196.
de Santana C., Rozenfeld A., Marquet P., Duarte C.M. (2013)
Topological properties of polar food webs. Marine Ecology
Progress Series, 474, 15–26.
Sautour B., Castel J. (1993) Distribution of zooplankton
populations in Marennes-Ol�eron Bay (France), structure and
grazing impact of copepod communities. Oceanologica Acta,
16, 279–290.
Sautour B., Castel J. (1999) Grazing activity of mesoplanktonic
copepods in a shallow bay during an algal spring bloom
(Marennes-Ol�eron Bay, France). Journal of the Marine
Biological Association of the United Kingdom, 79, 73–84.
Schmoker C., Hernandez-Leon S., Calbet A. (2013)
Microzooplankton grazing in the oceans: impacts, data
variability, knowledge gaps and future directions. Journal of
Plankton Research, 35, 691–706.
de Senerpont Domis L.N., Elser J.J., Gsell A.S., Huszar V.L.M.,
Ibelings B.W., Jeppesen E., Kosten S., Mooij W.M., Roland
F., Sommer U., Van Donk E., Winder M., L€urling M. (2013)
Plankton dynamics under different climatic conditions in
space and time. Freshwater Biology, 58, 463–482.
Sherr E., Sherr B. (2007) Heterotrophic dinoflagellates: a
significant component of microzooplankton biomass and
major grazers of diatoms in the sea. Marine Ecology Progress
Series, 352, 187–197.
Siokou-Frangou I., Christaki U., Mazzocchi M.G., Montresor
M., Ribera d’Alcal�a M., Vaqu�e D., Zingone A. (2010)
Plankton in the open Mediterranean Sea: a review.
Biogeosciences, 7, 1543–1586.
Smetacek V., Naqvi S.W.A. (2008) The next generation of iron
fertilization experiments in the Southern Ocean. Philosophical
Transactions of the Royal Society A: Mathematical, Physical
and Engineering Sciences, 366, 3947–3967.
Marine Ecology (2014) 1–16 ª 2014 Blackwell Verlag GmbH 15
D’Alelio, Mazzocchi, Montresor, Sarno, Zingone, Di Capua, Franz�e, Margiotta, Saggiomo & Ribera d’Alcal�a The green–blue plankton swing
Sommer U., Adrian R., de Senerpont Domis L., Elser J.J.,
Gaedke U., Ibelings B., Jeppesen E., L€urling M., Molinero
J.C., Mooij W.M., van Donk E., Winder M. (2012) Beyond
the Plankton Ecology Group (PEG) model: mechanisms
driving plankton succession. Annual Review of Ecology,
Evolution, and Systematics, 43, 429–448.
Steele J.A., Countway P.D., Xia L., Vigil P.D., Beman J.M.,
Kim D.Y., Chow C.-E.T., Sachdeva R., Jones A.C.,
Schwalbach M.S., Rose J.M., Hewson I., Patel A., Sun F.,
Caron D.A., Fuhrman J.A. (2011) Marine bacterial, archaeal
and protistan association networks reveal ecological
linkages. The ISME Journal, 5, 1414–1425.
Stibor H., Vadstein O., Hansen T., Lippert B., Løseth K.,
Peters C. (2004) Copepods act as a switch between
alternative trophic cascades in marine pelagic food webs.
Ecology Letters, 7, 321–328.
Strom S.L. (2008) Microbial ecology of ocean biogeochemistry:
a community perspective. Science, 320, 1043–1045.
Svensen C., Kiørboe T. (2000) Remote prey detection in
Oithona similis: hydromechanical versus chemical cues.
Journal of Plankton Research, 22, 1155–1166.
Tett P., Wilson H. (2000) From biogeochemical to ecological
models of marine microplankton. Journal of Marine Systems,
25, 431–446.
Uttieri M., Cianelli D., Buongiorno Nardelli B., Buonocore B.,
Falco P., Colella S., Zambianchi E. (2011) Multiplatform
observation of the surface circulation in the Gulf of Naples
(Southern Tyrrhenian Sea). Ocean Dynamics, 61, 779–796.
Vermaat J.E., Dunne J.A., Gilbert A.J. (2009) Major
dimensions in food-web structure properties. Ecology, 90,
278–282.
Wyatt T. (2012) Margalef’s mandala and phytoplankton bloom
strategies. Deep Sea Research Part II: Topical Studies in
Oceanography, in press, online available (http://dx.doi.org/
10.1016/j.dsr2.2012.12.006).
Wyatt T., Ribera d’Alcal�a M., Jord�an F. (2001) Topology and
dynamics of plankton networks: are pelagic ecosystems
robust? In: CIESM (Ed.), Gelatinous Zooplankton Outbreaks:
Theory and Practice: Theory and Practice. CIESM Workshop
Series, no 14. CIESM, Monaco: 29–31.
Zingone A., Montresor M., Marino D. (1990) Summer
phytoplankton physiognomy in coastal water of the Gulf of
Naples. Marine Ecology, 11, 157–172.
Zingone A., Casotti R., Ribera d’Alcal�a M., Scardi M., Marino
D. (1995) ‘St Martin’s Summer’: the case of an autumn
phytoplankton bloom in the Gulf of Naples (Mediterranean
Sea). Journal of Plankton Research, 17, 575–593.
Zingone A., Siano R., D’Alelio D., Sarno D. (2006) Potentially
toxic and harmful microalgae from coastal waters of the
Campania region (Tyrrhenian Sea, Mediterranean Sea).
Harmful Algae, 5, 321–337.
Zingone A., Dubroca L., Iudicone D., Margiotta F., Corato F.,
Ribera d’Alcal�a M., Saggiomo V., Sarno D. (2009) Coastal
phytoplankton do not rest in winter. Estuaries and Coasts,
33, 342–361.
Supporting Information
Additional Supporting Information may be found in the
online version of this article:
Fig. S1. Frequency distribution for P-values of correla-
tions with r >0.7 or <�0.7 considered in the present
study.
Fig. S2. Circular dendrogram of average salinity and
integrated chlorophyll a values in the 0–2 m layer at st.
LTER-MC during summers 2002-2009. Numbers repre-
sent samples collected on the dates listed on the right.
Hierarchical clustering based on a UPGMA algorithm for
a Euclidean distance matrix.
Fig. S3. Coupled hierarchical clustering of salinity and
chlorophyll a (left) and plankton data (right) based for a
UPGMA algorithm for, respectively, Euclidean distance
and Bray–Curtis similarity matrices.
Fig. S4. Coupled hierarchical clustering of salinity and
chlorophyll a (left) and plankton data (right) based on a
UPGMA algorithm for, respectively, Euclidean distance
and Bray–Curtis similarity matrices.
Table. S1. Taxa abundance data.
16 Marine Ecology (2014) 1–16 ª 2014 Blackwell Verlag GmbH
The green–blue plankton swing D’Alelio, Mazzocchi, Montresor, Sarno, Zingone, Di Capua, Franz�e, Margiotta, Saggiomo & Ribera d’Alcal�a
Related Documents