The Great Escape Escaping the lower for longer environment For Professional Clients only UBS Asset Management April 2017

Welcome message from author
This document is posted to help you gain knowledge. Please leave a comment to let me know what you think about it! Share it to your friends and learn new things together.
Transcript

The Great EscapeEscaping the lower for longer environment
For Professional Clients onlyUBS Asset Management April 2017


1
Executive summary
Since the Global Financial Crisis (GFC), developed economies have been stuck in a lower for longer environment – lower demand, lower profits growth, lower inflation and lower interest rates. With lower expected returns, companies have been discouraged from investing in their businesses, perpetuating the low growth environment in the process. The impact has been pervasive in the world of economics and markets, but also on the political and social landscape.
Now, some ten years on, with signs of inflation emerging and with a growing realisation that monetary policy must be supported by pro-growth fiscal policy and structural reform, the question must be asked, are we at the beginning of the great escape from lower for longer?
We believe we are. After almost a decade of operating under a blanket of central bank sponsored liquidity that artificially suppressed the fundamental drivers of the market, leaving
Since the Global Financial Crisis (GFC), developed economies have been stuck in a lower for longer environment – lower demand, lower profits growth, lower inflation and lower interest rates. With lower expected returns, companies have been discouraged from investing in their businesses, perpetuating the low growth environment in the process. The impact has been pervasive in the world of economics and markets, but also on the political and social landscape.
them secondary to technical factors. As a result, markets have finally started to price in the end of the unconventional policies that were at the heart of the lower for longer environment.
The catalyst for the move was the election of Donald Trump in November 2016. But Donald Trump is no Steve McQueen. A quick motorcycle jump over a barbed-wire fence will not be part of this escape. Just as it took several years for the environment of lower for longer to become as entrenched as it did, it will take many to escape it. Structural damage has been done to the economy that will take time to heal.
The process has begun. Financial markets, being forward-looking, will start to adapt to life without financial engineering from central banks. In this environment, correlations will fall, fundamental value investing will reassert, and diversification opportunities will rise for multi-asset investors.
Tracey McNaughton Executive Director Head of Investment Strategy

2
2017 marks the 10 year anniversary of the beginning of the Global Financial Crisis. Between February and March of that year, more than 25 sub-prime funds filed for bankruptcy, opening the flood gates for many more.
By August, the interbank lending market froze and Britain experienced its first bank run since 1866. Developed market central banks began cutting interest rates and financial markets collapsed. And so began the period of “lower for longer”.
“Lower for longer” has had a pervasive influence affecting everything from inflation and monetary policy settings, to political outcomes, fiscal policy balances, risk and return expectations, and cross asset class correlations.
Now, nearly a decade on, with inflation creeping higher, the US Federal Reserve about to tighten monetary policy further, and the Trump administration poised to implement a very expansionary fiscal policy, the question must be asked: Is this the beginning of the end for “lower for longer”?
3
What is “lower for longer”?
“Lower for longer” is what happens to growth, inflation and interest rates in an economy when the most severe financial crisis since the Great Depression hits it. The situation was arguably prolonged by an over-reliance on expansionary monetary policy while fiscal policy, for the most part, was being constrained.
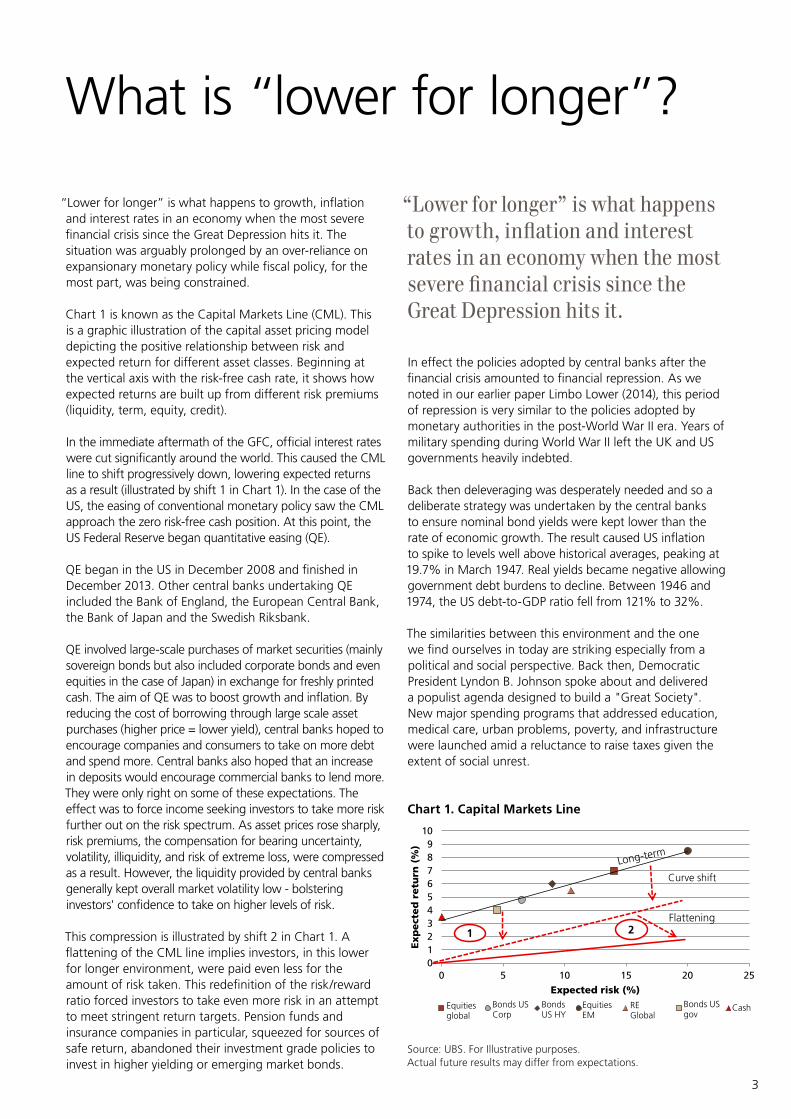
Chart 1 is known as the Capital Markets Line (CML). This is a graphic illustration of the capital asset pricing model depicting the positive relationship between risk and expected return for different asset classes. Beginning at the vertical axis with the risk-free cash rate, it shows how expected returns are built up from different risk premiums (liquidity, term, equity, credit).
In the immediate aftermath of the GFC, official interest rates were cut significantly around the world. This caused the CML line to shift progressively down, lowering expected returns as a result (illustrated by shift 1 in Chart 1). In the case of the US, the easing of conventional monetary policy saw the CML approach the zero risk-free cash position. At this point, the US Federal Reserve began quantitative easing (QE).
QE began in the US in December 2008 and finished in December 2013. Other central banks undertaking QE included the Bank of England, the European Central Bank, the Bank of Japan and the Swedish Riksbank.
QE involved large-scale purchases of market securities (mainly sovereign bonds but also included corporate bonds and even equities in the case of Japan) in exchange for freshly printed cash. The aim of QE was to boost growth and inflation. By reducing the cost of borrowing through large scale asset purchases (higher price = lower yield), central banks hoped to encourage companies and consumers to take on more debt and spend more. Central banks also hoped that an increase in deposits would encourage commercial banks to lend more. They were only right on some of these expectations. The effect was to force income seeking investors to take more risk further out on the risk spectrum. As asset prices rose sharply, risk premiums, the compensation for bearing uncertainty, volatility, illiquidity, and risk of extreme loss, were compressed as a result. However, the liquidity provided by central banks generally kept overall market volatility low - bolstering investors' confidence to take on higher levels of risk.
This compression is illustrated by shift 2 in Chart 1. A flattening of the CML line implies investors, in this lower for longer environment, were paid even less for the amount of risk taken. This redefinition of the risk/reward ratio forced investors to take even more risk in an attempt to meet stringent return targets. Pension funds and insurance companies in particular, squeezed for sources of safe return, abandoned their investment grade policies to invest in higher yielding or emerging market bonds.
Source: UBS. For Illustrative purposes. Actual future results may differ from expectations.
Chart 1. Capital Markets Line
0123456789
10
0 5 10 15 20 25
Ex
pe
cte
d r
etu
rn (
%)
Expected risk (%)
14 6.5 9 20 10.5 4.5 0RE GlobalRE GlobalRE Global
Equities global
Bonds US Corp
Bonds US HY
Equities EM
RE Global
Bonds US gov
Cash
Curve shift
Flattening1 2
In effect the policies adopted by central banks after the financial crisis amounted to financial repression. As we noted in our earlier paper Limbo Lower (2014), this period of repression is very similar to the policies adopted by monetary authorities in the post-World War II era. Years of military spending during World War II left the UK and US governments heavily indebted.
Back then deleveraging was desperately needed and so a deliberate strategy was undertaken by the central banks to ensure nominal bond yields were kept lower than the rate of economic growth. The result caused US inflation to spike to levels well above historical averages, peaking at 19.7% in March 1947. Real yields became negative allowing government debt burdens to decline. Between 1946 and 1974, the US debt-to-GDP ratio fell from 121% to 32%.
The similarities between this environment and the one we find ourselves in today are striking especially from a political and social perspective. Back then, Democratic President Lyndon B. Johnson spoke about and delivered a populist agenda designed to build a "Great Society". New major spending programs that addressed education, medical care, urban problems, poverty, and infrastructure were launched amid a reluctance to raise taxes given the extent of social unrest.
“Lower for longer” is what happens to growth, inflation and interest rates in an economy when the most severe financial crisis since the Great Depression hits it.

By increasing the role and influence of central banks, overtly inserting them in the pricing function of financial assets, the lower for longer environment has had a significant effect on how financial markets operate. In addition to the compression of risk premiums already mentioned, below are some of the changes that have taken place in the lower for longer environment:
Higher correlations: Lower for longer raised correlations within and between asset classes. The blanket of liquidity laid over markets as a result of QE meant investor behaviour was primarily driven by a single factor – central bank financial engineering. This led to herd behaviour in markets and over-crowded positioning that in our view remain susceptible to violent corrections.
Fundamental investing took a backseat: The downward spiral of lower interest rates, driving expected returns lower, spurring an even greater demand for risk assets had the final effect of making every asset class more expensively priced. Fundamental analysis was pushed aside, instead sentiment and momentum investing came to the fore.
Like the witches of Macbeth, this was an environment where “fair is foul, and foul is fair” as bad economic news implied greater central bank support.
Fatter tail risk: Central bank behaviour during the period of lower for longer was like a drug dulling the senses of market participants and artificially suppressing volatility. As Hyman Minsky, the famous US economist said, prolonged periods of economic stability breeds complacency, and complacency leads to excessive risk taking which ultimately leads to vulnerability. This vulnerability revealed itself in tail risk events. Between the original taper tantrum in May/June 2013 and January 2016, financial markets globally experienced no fewer than six tantrums. Markets fell and compressed risk premia widened, leaving investors relying on central banks to step in and stabilise the market – which they did.
Traditional risk systems less reliable: The increase in correlations meant traditional risk systems could no longer be solely trusted to determine the amount of risk in a portfolio. Qualitative risk mapping, whereby each trade in a portfolio was assessed on how it would perform under different scenarios and tail risk events, became an important adjunct.
How has lower for longer affected the functioning of financial markets?

5
Escaping from lower for longer Escaping from lower for longer is not easy, just look at Japan, a country that is now well into its third decade of lower for longer.
Escaping requires the market to re-price three fundamental risks:
• Duration risk • Inflation risk, and • Higher potential growth risk
1. Duration risk The first step needed in escaping lower for longer is for risk premiums that were reduced as a result of quantitative easing to be priced back into asset markets. This clearly requires longer-dated bond yields to rise and prices to fall. This would cause the Capital Markets Line to steepen and give investors more return for each additional unit of risk taken.
Whilst QE ended in the US in December 2013, exactly five years after it began, it took a further two years for the first conventional rate hike and another year after that for the second. The bond market only began to raise the term risk premium, the additional yield required to hold longer duration assets, after it was clear expansionary fiscal policy was on its way following the election of Donald Trump as President in November 2016.
Since around the middle of last year, 10-year bond yields in the US have risen by 100 basis points, from 1.4% to 2.4% currently (as measured by Bloomberg LLP). Around 70% of that move came from a lift in term premium while the remaining came from a lift in interest rate expectations as a result of higher growth coming from fiscal stimulus.
This contrasts with the sell-off in yields that resulted from the ‘taper-tantrum’ in May/June 2013. Back then, all of the 100 basis points rise in the 10-year bond yield was driven by a rise in the term premium. Even though QE was about to be tapered, the bond market had low expectations for future growth. This is why the sell-off in yields in 2013 coincided with a sell-off in equities whereas the most recent sell-off in yields saw equity markets rally.
The term premia has not yet fully backed up to historic levels, however. This is, in part, a reflection of the market's expectation that the Federal Reserve’s balance sheet will not be unwound anytime soon. In fact, the Fed has explicitly reserved balance sheet reduction (selling the bonds bought during QE) for a more advanced stage of the tightening cycle. At this point we can expect bond yields to rise, further steepening the CML curve as yield seeking investors return to their preferred risk habitats.
2. Higher inflation riskThe most crucial ingredient for a self-sustaining recovery is inflation. Inflation is one of those features of an economy where you want it to be not too low, but not too high. Inflation needs to be just high enough to encourage corporate investment but not too high that it causes the central bank to choke off growth.
Inflation is moving higher across most developed market economies (Chart 2). This is partly due to the bottoming of oil prices. But even among core rates of inflation (ex food and energy), pressures are slowly creeping higher. By reducing its real value, higher inflation will help alleviate the constraint on growth caused by the build-up of public debt levels in the post-crisis period.
Higher inflation shifts the CML line higher as conventional monetary policy kicks in with higher official interest rates.
Output gaps have gradually been closing across developed markets. In the US, wage pressures are emerging as full employment approaches. The ranks of the unemployed have largely been drawn down by job gains since the GFC. Unemployment totalled almost 15 million in the US in 2010 compared to less than 8 million today. It managed to slip below 7 million at the peak of the last cycle which would imply a remaining reserve of unemployed people of around 1 million. Add to that the number of underemployed or discouraged workers (those workers who are either part-time but have potential to work full-time, or are absent from the paid workforce through choice), estimated to be around 1 million, means there is a reserve of around 2 million potential workers yet to be employed. Given the US economy adds around 2.4 million jobs per year this suggests the economy will be at full employment by year-end.
Chart 2. Inflation in the ascent (alternative measures yoy %)
0.0
0.5
1.0
1.5
2.0
2.5
3.0
Euro CPI USHeadline
CPI
US CorePCE
GermanCPI
China CPI US 5y5yfwd
inflation
US AHE
1yr ago 3mths ago Now
Source: Bloomberg, as at 28 February 2017

6
3. Higher potential growth Higher inflation and a re-pricing of duration risk are necessary but not sufficient conditions for an economy to fully escape lower for longer. The final, most critical step is to lift potential growth.
Potential output growth is the maximum speed the economy can grow at before inflation begins to fire up. Over the past 10 years or so potential growth has declined across most developed markets.
According to standard economic theory, lower potential growth pushes down the neutral rate of interest by decreasing the returns on investment and lowering future household earnings thereby raising the desire to save. The combination of lower investment and higher savings decreases the neutral interest rate.
The neutral rate is the interest rate that allows the economy to grow at its trend rate while leaving inflation stable. It is the “not too hot, not too cold” level of interest and is the line in the sand that distinguishes expansionary from contractionary monetary policy.
Depending on how far away the actual official interest rate is from neutral dictates how expansionary or otherwise monetary policy is.
Given current interest rate settings in the US, a lower potential growth rate implies a lower neutral interest rate which implies a less expansionary monetary policy (and therefore a shorter than average tightening cycle). The less expansionary monetary policy is, the less stimulatory it will be for growth in the economy.
This explains why the US economy is experiencing the weakest recovery in the post-World War II era. The average rate of growth in GDP during the current expansion (now in its 7th year) has been just 2.1%. This compares with the average of the previous ten expansions since 1949 of 4.7%.
This is the very issue plaguing Japan at the moment. Potential economic growth has fallen so far in Japan (see Chart 7) that it is very difficult to get a sufficiently expansionary setting for monetary policy. This is known as the liquidity trap and explains why raising potential growth is so critical to the effective operation of monetary policy and to escaping lower for longer.
The effect of raising potential growth will be to shift the CML line higher (a reversal of shift 1 in Chart 1) as interest rates and monetary policy adjust to the associated increase in the neutral interest rate.
“Higher inflation and a re-pricing of duration risk are necessary but not sufficient conditions for an economy to fully escape lower for longer. The final, most critical step, is to lift potential growth.”

“Given current interest rate settings in the US, a lower potential growth rate implies a lower neutral interest rate which implies a less expansionary monetary policy.”

8
How bad is the damage to potential growth since the crisis?
Potential growth is not directly observable in the wild but can be estimated using the identity known as Okun’s Law. Okun’s Law captures the empirically observed relationship between GDP growth and the unemployment rate. A rise (fall) in GDP growth is associated with a fall (rise) in the unemployment rate.
Eq 1. Okun’s Law can be expressed algebraically as:
ΔGDP = α + β(ΔUR)
where:
ΔGDP = annual percentage change in real GDPΔUR = annual difference in the unemployment rateα = constantβ = Okun’s Law coefficient
The magnitude of β varies from country to country but is always negative in sign.
A low β coefficient would be consistent with a flatter relationship between economic growth and unemployment and therefore would imply lower labour productivity. That is, a large fall in the unemployment rate would be associated with only a small increase in GDP growth.
Chart 3 is a scatter plot of US GDP growth versus annual change in the unemployment rate using quarterly data for the period between March 1979 and December 2016. The negative relationship between growth and unemployment is clear but as Table 1 illustrates the strength of the relationship is not stable.
The overall decline in the Okun coefficient suggests productivity has been in decline in Australia and the US for the better part of 30 years. The decline, however, has been particularly evident since the GFC.
Potential growth is the rate of growth that is consistent with a steady unemployment rate. In Okun’s Law terms, this is the value of α in Equation 1. Chart 4 shows how this estimate of potential growth in the US has declined in the past decade, particularly since the GFC.
-6
-4
-2
0
2
4
6
8
10
-4 -2 0 2 4 6
GD
P (y
oy%
)
Unemployment (annual change)
R2=0.62
Chart 3. US GDP vs Unemployment rate
Source: Bloomberg, as at 28 February 2017
Table 1. Rolling 10-year Okun coefficient
Okun coefficient (rolling 10-years) US Australia
Dec-89 -2.04 -1.66
Dec-99 -1.62 -1.25
Dec-09 -1.70 -1.00
Dec-16 -1.15 -0.56
Source: Bloomberg, UBS, as at 28 February 2017
While ageing demographics have had a role to play, the timing and pace of decline in potential growth suggests it has more to do with the consequences of the GFC. For the better part of a decade, developed market economies have failed to invest in the productive care and maintenance of their economies. Post – GFC business confidence collapsed, business investment collapsed and government spending collapsed. The combination of all three resulted in potential growth rates falling.
By way of comparison, Charts 5, 6, and 7 show the estimate of potential growth for Australia, Germany and Japan. A similar picture is evident, whereby potential growth has slowed, particularly since the financial crisis.

9
If the neutral rate is a measure of the level of interest rates that are broadly consistent with output at potential and price stability, then:
Eq 2. r* = β(y*)
where:
r* = neutral interest rate
y* = potential economic growth
A simple regression of the neutral rate (as estimated by the Atlanta Federal Reserve in Chart 8) against potential growth reveals a β value of 0.7. This means for every one percentage point rise/fall in potential growth, the neutral rate rises/falls by 0.7 percentage points, or 70 basis points.
This means lifting the potential growth rate in the economy will raise the neutral level of interest rates. All else unchanged, this would have the effect of leaving monetary policy in a more expansionary state thereby leaving the Federal Reserve with more work to do in bringing monetary policy back to a neutral setting.
For investors this means returning the CML back to its original starting position, raising expected returns as a result.
To understand how it will be possible to raise potential growth we must first understand why it declined following the financial crisis.
Chart 5. Australia potential growth rate (%)
Source: Bloomberg, UBS, as at 28 February 2017
2.5
2.7
2.9
3.1
3.3
3.5
3.7
3.9
1989 1992 1995 1998 2001 2004 2007 2010 2013 2016
Chart 4. US potential growth rate (%)
Source: Bloomberg, UBS, as at 28 February 2017
1.0
1.5
2.0
2.5
3.0
3.5
1989 1992 1995 1998 2001 2004 2007 2010 2013 2016
Chart 6. Germany potential growth rate (%)
Source: Bloomberg, UBS, as at 28 February 2017
0.0
0.2
0.4
0.6
0.8
1.0
1.2
1.4
1.6
1.8
2004 2006 2008 2010 2012 2014 2016
Chart 7. Japan potential growth rate (%)
Source: Bloomberg, UBS, as at 28 February 2017
0.0
0.2
0.4
0.6
0.8
1.0
1.2
1.4
1.6
2006 2007 2008 2009 2010 2011 2012 2013 2014 2015 2016
Chart 8. Atlanta Federal Reserve estimate of neutral US interest rate (%)
Source: Atlanta Federal Reserve, as at 28 February 2017
-1.0
-0.5
0.0
0.5
1.0
1.5
2.0
2.5
3.0
3.5
4.0
1989 1992 1995 1998 2001 2004 2007 2010 2013 2016


11
One way of discerning the causes of the decline in potential growth is to break down long-run trend economic growth into its five components according to the following identity:
Real GDP Real GDP Hours worked Employed persons Labour force Population aged 15+
Population Hours worked Employed persons Labour force Population aged 15+ Population = × × × ×
What has driven the decline in potential growth?
Table 2.
Component of US GDP per capita (%) 1996-06 2006-16 Difference
Real GDP/Hours worked (labour productivity) 2.9 1.2 -1.7
Hours worked/Employed persons (average hours worked) -0.8 -0.4 0.4
Employed persons/Labour force (employment rate) 0.2 0.1 -0.1
Labour force/Population aged 15 and over (participation rate) -0.1 -0.5 -0.4
Population aged 15 and over/Population 0.2 0.2 0.0
Real GDP / Population 2.3 0.5 -1.8
Source: UBS, as at 28 February 2017
Certainly demographics have had a role to play. The participation rate fell more over the last ten years than previously but the negative effect this had on trend growth (-0.4 ppts) was equally offset by the fact that people worked longer hours (+0.4 ppts).
US labour productivity was clearly the major driver of the decline in average growth having fallen from an average annual rate of 2.9% between 1996 and 2006 to an annual average of 1.2% in the last ten years (source: Bloomberg LLP). This component alone is responsible for 90% of the fall in growth per person, consistent with Paul Krugman's claim that: “productivity isn’t everything, but in the long run it is almost everything.”
This conclusion is consistent with the decline in the Okun coefficient shown in Table 1.
While ageing populations is an important issue, it is important to understand that the effects of ageing on labour productivity are not clear-cut because the old of today will be different to the old of tomorrow. Moreover, the effect on productivity depends on whether the gains to productivity from a reduced share of inexperienced (less productive) workers are outweighed by losses to productivity from a growing share of older workers.
Looking at it from this perspective, it is possible to boost per capita growth through a number of different channels:
• by working more hours, • increasing the size of the labour force, • employing more people,• growing the working age population, or• by being more efficient.
Only the latter is a sustainable way of lifting a country's economic wellbeing, however. Japan's “death from overwork” or "karoshi" culture is testament to this. According to official data, 200 Japanese workers die every year from overwork. The Japanese Government's answer to this serious issue is to introduce "Premium Friday" – an initiative to encourage companies to send their overworked, sleep-deprived workers home by 3pm on the last Friday of the month.
Table 2 shows which of the above components is most responsible for driving a decline in US trend growth over the last decade.
In the last ten years, real GDP per person has averaged just 0.5% annually in the US. This compares to an average of 2.3% in the ten years prior. The components analysis above shows where most of the decline has come from.

“Currently, global spending on research and development as a share of GDP is at its highest level ever – surpassing even the technology boom in the 1990s.”
Why has labour productivity growth slowed?The fall in business investment since the GFC has been dramatic (Chart 9). According to the World Bank, US gross capital formation as a share of GDP fell from 23.3% in 2006 to a low of 17.5% in 2009. It has since recovered slightly to 20.3% but still remains well below pre-crisis levels. A similar picture is evident across most developed economies.
It is possible we are on the cusp of an uplift in productivity, we just don’t see it yet. This was the case in the early 1990s just before we got a surge in productivity. The growth economist Robert Solow said in 1987 “You can see the computer age everywhere but in the productivity statistics.” This makes sense. Time, money and labour must be spent on developing new technologies and innovations before they can be deployed into productive use in the economy.
Currently, global spending on research and development as a share of GDP is at its highest level ever – surpassing even the technology boom in the 1990s. Think of the
Chart 9. US gross capital formation (% GDP)
Source: World Bank, as at 28 February 2017
17
18
19
20
21
22
23
24
2005 2006 2007 2008 2009 2010 2011 2012 2013 2014 2015
hours spent developing autonomous vehicles, 3D printing, drone technology, electric cars, robotics, the internet of things, blockchain, or artificial intelligence. All have the potential to revolutionise the way we work in the economy unleashing a
“fourth industrial revolution”.

13
Where are we currently?
The journey of escaping from the bounds of lower for longer has begun. There is growing recognition that monetary policy as the sole tool of macroeconomic management has become less effective.
Fiscal policy is now stepping in and will be the primary driver of stimulus going forward, at least in the US if not in a growing number of developed economies. The rise in anti-establishment sentiment now underway will likely give this shift toward pro-growth fiscal management more momentum.
Term premiums have increased, directly in the US and indirectly elsewhere, and higher inflation is being priced in. But we are not yet at the stage where the Fed can revert to an average 300 basis point tightening cycle.
For the most part, President Trump's policies around increased infrastructure spending, tax reform and deregulation will help boost productivity and lift potential growth. The US is currently in the best position of almost any developed market to implement the policies required to raise the productive potential of its economy. Most other developed economy governments still lack the political capital needed to implement reforms.
The most recent survey of the members of the Federal Reserve’s FOMC shows the Fed expects the long run neutral nominal cash rate to be 3%. Based on their historical relationship, achieving a 3% neutral rate will require a 1.4 percentage point lift in potential growth. This would take it back to its pre-crisis level. Much of this will have to come from a rise in productivity.
This seems like a tall order, but consider the rise in productivity that occurred in the second half of the 1990s. Driven by a rise in technology, productivity in the US rose from 0.7% to 3.3% over the second half of the 1990s1. Rising wage costs will encourage even greater investment in new technology as will the lift in confidence a cut in corporate taxes and red-tape will provide.
“The United States is currently in the best position of almost any developed market to implement the policies required to raise the productive potential of its economy.”
1 “Productivity Growth in the 1990s: Technology, Utilization, or Adjustment”, NBER Working Paper No. 8359.

14
Investment implications
Beyond the impact it will have on risk premiums and embedded growth assumptions, the main implication for investors of escaping from lower for longer is how the role and influence of the central bank will change.
For almost a decade, central banks (the US Federal Reserve in particular) have been hostages to the market. A reflexive relationship between the market and central bank was formed whereby the central bank was responding to the market that in turn was responding to the central bank.
Even in the face of diminished returns for their effort, the central bank was the sole steward responsible for generating sustainable growth. The ability to pre-empt, interpret and respond to central bank moves was key for market participants.
This had the effect of diminishing the role of fundamental analysis; increasing the herd mentality of the market as investors moved to the beat of a single drum; and exposing the market to fat tail tantrum events as crowded positioning was unwound quickly and violently.
Adapting to this environment, investors needed to incorporate more momentum or sentiment factors into their analysis, reduce the investment horizon of positioning, incorporate tail risk hedges into portfolios, and supplement traditional risk modelling that relied on historic relationships with qualitative risk mapping that looked beyond the period of high correlations in the market.
Escaping from lower for longer implies a reversion to more conventional monetary policy operations and means a more traditional role in the market for the central bank. It means a very significant non-economic buyer of the market is no longer active.
Monetary authorities will once again influence market behaviour rather than being held hostage by it. Fundamental analysis will reassert itself as markets once again move to the beat of several drums. This will allow investors to lengthen investment horizons and take more directional risk rather than just relative value positions.
Correlations will decline as a result and investors become less herd-like. This is likely to reduce the probability of fat tail tantrum events in the market. Opportunities for diversification will increase and risk models based on long term relationships will become more reliable again.
As the two charts show, market behaviour is already adapting to life without central bank injections of liquidity. Correlations between global equity markets have declined since the November US election particularly among developed markets (Chart 10 & 11).

15
S &
P 5
00
Do
w J
on
esN
asd
aqR
uss
ell 2
00
0M
SCI W
orl
dN
ikke
iTO
PIX
CA
C 4
0D
AX
Sto
xx 5
0SM
IO
MX
ASX
20
0IB
EX 3
5M
IB 3
0C
anad
a (T
SEI)
TWSE
FTSE
10
0K
LCI
SET
Bo
lsa
USD
Han
g S
eng
Sin
gap
ore
Ko
rea
MSC
I EM
B
ove
spa
S & P 500 Positively Dow Jones correlatedNasdaq Russell 2000 MSCI World Nikkei TOPIX CAC 40 DAX Stoxx 50 SMI OMX ASX 200 IBEX 35 MIB 30 Canada (TSEI) TWSE FTSE 100 KLCI SET Bolsa USD Hang Seng Singapore Korea MSCI EM NegativelyBovespa correlated
Chart 10. Equity correlations (pre-US election)
Source: Bloomberg, UBS, as at 28 February 2017
ASX
20
0S
& P
50
0D
ow
Jo
nes
Nas
daq
Ru
ssel
l 20
00
Can
ada
(TSE
I)FT
SE 1
00
CA
C 4
0D
AX
MIB
30
Sto
xx 5
0SM
IIB
EX 3
5M
SCI W
orl
dO
MX
Nik
kei
TOPI
XTW
SESi
ng
apo
reSE
TK
LCI
Bo
vesp
aM
SCI E
M
Bo
lsa
USD
Han
g S
eng
Ko
rea
ASX 200 Positively S & P 500 correlatedDow Jones Nasdaq Russell 2000 Canada (TSEI) FTSE 100 CAC 40 DAX MIB 30 Stoxx 50 SMI IBEX 35 MSCI World OMX Nikkei TOPIX TWSE Singapore SET KLCI Bovespa MSCI EM Bolsa USD Hang Seng NegativelyKorea correlated
Chart 11. Equity correlations (post-US election)
Source: Bloomberg, UBS, as at 28 February 2017

16
Conclusion
For the better part of a decade, the efficient operation of developed economies has been compromised.
At this stage, few other developed governments have the political capital that the US has under Trump to reinvest in, rebalance, and reform the economy. Unstable governments with a weak mandate are still very much the norm. Spain spent ten months last year without a government while Ireland spent two months with no one in charge. Today, both are left with weak minority governments.
That may change however. A number of important elections are coming up in Europe; even if mainstream parties are not voted out, their policy stance is necessarily being re-positioned.
In the meantime, the awakening of ‘animal spirits’ in the US could well spill over into the private sector of other markets. There is evidence that global growth is increasingly being led by the business sector, rather than by injection after injection of central bank liquidity.
The great escape from lower for longer may not happen overnight without Steve McQueen in the seat but it will happen. Indeed, it may take years for this escape to fully eventuate.
But the process has begun.
References
Carlstrom, C. and Fuerst, T. 2016. “The natural rate of interest in Taylor Rules.” Federal Reserve Bank of Cleveland, Economic Commentary (March).
Feinman, J. 2016. “A lower neutral rate: causes and consequences.” Deutsche Asset Management (August).
Garnier, J. and Wilhelmsen, B. 2005. “The natural real interest rate and the output gap in the Euro area: A joint estimation.” European Central Bank, Working Paper Series (November).
Lancaster, D. and Tulip, P. 2015. “Okun's Law and Potential Output.” Reserve Bank of Australia, Research Discussion Paper (December).
Lauback, T. and Williams, J. 2015. “Measuring the Natural Rate of Interest Redux.” Federal Reserve Bank of San Francisco, Working Paper Series (October).
Pescatori, A. and Turunen, J. 2015. “Lower for Longer: Neutral rates in the United States.” IMF, Working Paper Series (June).
Williams, J. 2016. “Monetary policy in a low r-star world.” Federal Reserve Bank of San Francisco, Economic Letter (August).

17

For marketing and information purposes by UBS. For professional clients / qualified / institutional investors only.
This document does not replace portfolio and fund-specific materials. Commentary is at a macro or strategy level and is not with reference to any registered or other mutual fund.
AmericasThe views expressed are a general guide to the views of UBS Asset Management as of April 2017 The information contained herein should not be considered a recommendation to purchase or sell securities or any particular strategy or fund. Commentary is at a macro level and is not with reference to any investment strategy, product or fund offered by UBS Asset Management. The information contained herein does not constitute investment research, has not been prepared in line with the requirements of any jurisdiction designed to promote the independence of investment research and is not subject to any prohibition on dealing ahead of the dissemination of investment research. The information and opinions contained in this document have been compiled or arrived at based upon information obtained from sources believed to be reliable and in good faith. All such information and opinions are subject to change without notice. Care has been taken to ensure its accuracy but no responsibility is accepted for any errors or omissions herein. A number of the comments in this document are based on current expectations and are considered “forward-looking statements.” Actual future results, however, may prove to be different from expectations. The opinions expressed are a reflection of UBS Asset Management’s best judgment at the time this document was compiled, and any obligation to update or alter forward-looking statements as a result of new information, future events or otherwise is disclaimed. Furthermore, these views are not intended to predict or guarantee the future performance of any individual security, asset class or market generally, nor are they intended to predict the future performance of any UBS Asset Management account, portfolio or fund.
EMEAThe information and opinions contained in this document have been compiled or arrived at based upon information obtained from sources believed to be reliable and in good faith, but is not guaranteed as being accurate, nor is it a complete statement or summary of the securities, markets or developments referred to in the document. UBS AG and / or other members of the UBS Group may have a position in and may make a purchase and / or sale of any of the securities or other financial instruments mentioned in this document.
Before investing in a product please read the latest prospectus carefully and thoroughly. Units of UBS funds mentioned herein may not be eligible for sale in all jurisdictions or to certain categories of investors and may not be offered, sold or delivered in the United States. The information mentioned herein is not intended to be construed as a solicitation or an offer to buy or sell any securities or related financial instruments. Past performance is not a reliable indicator of future results. The performance shown does not take account of any commissions and costs charged when subscribing to and redeeming units. Commissions and costs have a negative impact on performance. If the currency of a financial product or financial service is different from your reference currency, the return can increase or decrease as a result of currency fluctuations. This information pays no regard to the specific or future investment objectives, financial or tax situation or particular needs of any specific recipient.
The details and opinions contained in this document are provided by UBS without any guarantee or warranty and are for the recipient's personal use and information purposes only. This document may not be reproduced, redistributed or republished for any purpose without the written permission of UBS AG.
This document contains statements that constitute “forward-looking statements”, including, but not limited to, statements relating to our future business development. While these forward-looking statements represent our judgments and future expectations concerning the development of our business, a number of risks, uncertainties and other important factors could cause actual developments and results to differ materially from our expectations.
UKIssued in the UK by UBS Asset Management (UK) Ltd. Authorised and regulated by the Financial Conduct Authority.
APACThis document and its contents have not been reviewed by, delivered to or registered with any regulatory or other relevant authority in APAC. This document is for informational purposes and should not be construed as an offer or invitation to the public, direct or indirect, to buy or sell securities. This document is intended for limited distribution and only to the extent permitted under applicable laws in your jurisdiction. No representations are made with respect to the eligibility of any recipients of this document to acquire interests in securities under the laws of your jurisdiction.
Using, copying, redistributing or republishing any part of this document without prior written permission from UBS Asset Management is prohibited. Any statements made regarding investment performance objectives, risk and/or return targets shall not constitute a representation or warranty that such objectives or expectations will be achieved or risks are fully disclosed. The information and opinions contained in this document is based upon information obtained from sources believed to be reliable and in good faith but no responsibility is accepted for any misrepresentation, errors or omissions. All such information and opinions are subject to change without notice. A number of comments in this document are based on current expectations and are considered “forward-looking statements”. Actual future results may prove to be different from expectations and any unforeseen risk or event may arise in the future. The opinions expressed are a reflection of UBS Asset Management’s
judgment at the time this document is compiled and any obligation to update or alter forward-looking statements as a result of new information, future events, or otherwise is disclaimed.
You are advised to exercise caution in relation to this document. The information in this document does not constitute advice and does not take into consideration your investment objectives, legal, financial or tax situation or particular needs in any other respect. Investors should be aware that past performance of investment is not necessarily indicative of future performance. Potential for profit is accompanied by possibility of loss. If you are in any doubt about any of the contents of this document, you should obtain independent professional advice.
Australia This document is provided by UBS Asset Management (Australia) Ltd, ABN 31 003 146 290 and AFS License No. 222605.
China The securities may not be offered or sold directly or indirectly in the People's Republic of China (the "PRC"). Neither this document or information contained or incorporated by reference herein relating to the securities, which have not been and will not be submitted to or approved/verified by or registered with the China Securities Regulatory Commission ("CSRC") or other relevant governmental authorities in the PRC pursuant to relevant laws and regulations, may be supplied to the public in the PRC or used in connection with any offer for the subscription or sale of the Securities in the PRC. The securities may only be offered or sold to the PRC investors that are authorized to engage in the purchase of Securities of the type being offered or sold. PRC investors are responsible for obtaining all relevant government regulatory approvals/licenses, verification and/or registrations themselves, including, but not limited to, any which may be required from the CSRC, the State Administration of Foreign Exchange and/or the China Banking Regulatory Commission, and complying with all relevant PRC regulations, including, but not limited to, all relevant foreign exchange regulations and/or foreign investment regulations.
Hong Kong This document and its contents have not been reviewed by any regulatory authority in Hong Kong. No person may issue any invitation, advertisement or other document relating to the Interests whether in Hong Kong or elsewhere, which is directed at, or the contents of which are likely to be accessed or read by, the public in Hong Kong (except if permitted to do so under the securities laws of Hong Kong) other than with respect to the Interests which are or are intended to be disposed of only to persons outside Hong Kong or only to "professional investors" within the meaning of the Securities and Futures Ordinance (Cap. 571) and the Securities and Futures (Professional Investor) Rules made thereunder.
JapanThis document is for informational purposes only and is not intended as an offer or a solicitation to buy or sell any specific financial products, or to provide any investment advisory/management services.
KoreaThe securities may not be offered, sold and delivered directly or indirectly, or offered or sold to any person for re-offering or resale, directly or indirectly, in Korea or to any resident of Korea except pursuant to the applicable laws and regulations of Korea, including the Capital Market and Financial Investment Business Act and the Foreign Exchange Transaction Law of Korea, the presidential decrees and regulations thereunder and any other applicable laws, regulations or rules of Korea. UBS Asset Management has not been registered with the Financial Services Commission of Korea for a public offering in Korea nor has it been registered with the Financial Services Commission for distribution to non-qualified investors in Korea.
Malaysia This document is sent to you, at your request, merely for information purposes only. No invitation or offer to subscribe or purchase securities is made by UBS Asset Management as the prior approval of the Securities Commission of Malaysia or other regulatory authorities of Malaysia have not been obtained. No prospectus has or will be filed or registered with the Securities Commission of Malaysia.
SingaporeThis document has not been registered with the Monetary Authority of Singapore pursuant to the exemption under Section 304 of the SFA. Accordingly, this document may not be circulated or distributed, nor may the Securities be offered or sold, whether directly or indirectly, to any person in Singapore other than (i) to an institutional investor pursuant to Section 304 of the SFA.
TaiwanThis document and its contents have not been reviewed by, delivered to or registered with any regulatory or other relevant authority in the Republic of China (R.O.C.). This document is for informational purposes and should not be construed as an offer or invitation to the public, direct or indirect, to buy or sell securities. This document is intended for limited distribution and only to the extent permitted under applicable laws in the Republic of China (R.O.C.). No representations are made with respect to the eligibility of any recipients of this document to acquire interests in securities under the laws of the Republic of China (R.O.C.).
Source for all data and charts (if not indicated otherwise): UBS Asset Management
© UBS 2017. The key symbol and UBS are among the registered and unregistered trademarks of UBS. All rights reserved.
If you would like further information, please contact your usual client relationship manager.
www.ubs.com/am
Related Documents