University of Konstanz Department of Economics The Globalization-welfare State Nexus Reconsidered Stephanie Meinhard and Niklas Potrafke http://www.wiwi.uni-konstanz.de/workingpaperseries Working Paper Series 2011-27

Welcome message from author
This document is posted to help you gain knowledge. Please leave a comment to let me know what you think about it! Share it to your friends and learn new things together.
Transcript

Un i ve r s i t y o f Kons t an z Depa r tmen t o f E c onom i c s
The Globalization-welfare State
Nexus Reconsidered
Stephanie Meinhard and Niklas Potrafke
http://www.wiwi.uni-konstanz.de/workingpaperseries
Working Paper Series 2011-27

The globalization-welfare state nexus reconsidered
Stephanie Meinhard∗ University of Konstanz
Niklas Potrafke∗∗ University of Konstanz
July 28, 2011
Abstract
Two hypotheses relate to the globalization-welfare state nexus: the efficiency hypothesis predicts
that globalization reduces government sector size and governments’ capacity to finance the
welfare state. The compensation hypothesis, in contrast, predicts that globalization induces a
higher demand for social insurance which results in an extended welfare state. Empirical
evidence on the globalization-welfare state nexus is mixed. We re-examine the evidence by
investigating a yearly panel dataset of 186 countries for the 1970-2004 period. We use data
compiled by the Penn World Tables on government sector size and employ the KOF index of
globalization. The results show that globalization increased government sectors around the
world. Social globalization especially had a positive influence. Globalization-induced effects
were stronger in OECD countries. Overall globalization and economic globalization reduced the
relative price of government expenditures. These findings suggest that globalization does not
jeopardize the welfare state at all.
Keywords: globalization, size of government, welfare state
JEL Classification: F57, I38, O11, O57, C23
∗ University of Konstanz, Department of Economics, Box 138, D-78457 Konstanz, Germany, Phone: + 49 7531 88 2137, Fax: + 49 7531 88 3130. Email: [email protected] ∗∗ University of Konstanz, Department of Economics, Box 138, D-78457 Konstanz, Germany, Phone: + 49 7531 88 2137, Fax: + 49 7531 88 3130. Email: [email protected] We thank Robert Hofmeister, Winfried Pohlmeier, Heinrich Ursprung and two anonymous referees for helpful comments and suggestions. Felix Weber has provided excellent research assistance.
1
1. Introduction
Scholars have different views on how globalization may influence the size of government and
the welfare state. For several years the established opinion was that trade liberalization and factor
mobility create competition between national governments, leading to a downward pressure on
tax rates and therefore to a reduction of fiscal power. As a consequence, a smaller size of
government and a retrenchment of the welfare state were predicted (via the supply side or
efficiency effect). In contrast, Rodrik (1998) found a positive relationship between the openness
of an economy and the extent of government expenditures, contradicting the former opinion of a
globalization-induced retrenchment of the government sector and the welfare state. He argued
that global economic integration leads to a higher external risk which has to be compensated by
higher government spending working as a social insurance device (via the demand side or
compensation effect). Schulze and Ursprung (1999) and Ursprung (2008), for example, provide
encompassing surveys on the globalization-welfare state nexus.1
Many scholars have investigated the globalization-welfare state nexus empirically by
using various measures for the size of government, the welfare state, and globalization. The
results are mixed. The existing studies do, however, suffer from fairly small sample sizes and –
except Dreher 2006a, Dreher et al. 2008a, 2008b – focus on sub aspects of globalization.
Economic aspects of globalization are believed to have an especially strong influence on the size
of government and welfare state activities. However, globalization is a multi-faceted concept that
cannot be captured by single economic indicators such as trade-openness or foreign direct
investment. For this reason, the KOF index of globalization was introduced (KOF means
“Konjunkturforschungsstelle” - Swiss Economic Institute).
1
See Dreher and Gaston (2008), Bergh and Nilsson (2010), Anwar (2010) and Hellier and Chusseau (2010) on the influence of globalization on income and wage inequality and Bjørnskov (2009) on the influence of globalization on human rights.

2
In this paper, we reconsider the globalization-welfare state nexus empirically. We employ data
compiled by the Penn World Tables on the government sector size and the KOF indices of
globalization. The sample covers 186 countries over the 1970-2004 period. Using this large
dataset, we deal with three issues: (1) whether overall globalization influences the size of
government, (2) whether different aspects of globalization have different effects on the size of
government, and (3) whether potential globalization-induced effects on the size of government
differ in democracies and autocracies, OECD and non-OECD countries, in high and low income
countries and before and after the end of the Cold War in 1990. The results show that
globalization had a positive influence on government sector size around the world. Social
globalization, in particular, had a positive influence. Globalization-induced effects were stronger
in OECD countries. Overall globalization and economic globalization reduced the relative price
of government expenditures. These findings suggest that globalization does not jeopardize the
welfare state at all.
The paper is organized as follows: section 2 presents the background on the two
competing hypotheses describing the globalization-welfare state nexus and discusses the related
empirical literature. Section 3 presents the data and specifies the empirical model. Section 4
reports and discusses the estimation results, and investigates their robustness. Section 5
concludes.
2. The globalization welfare-state nexus: competing hypotheses and related
empirical evidence
2.1 Competing hypotheses
Trade openness and financial liberalization are believed to increase competition between national
governments. In the course of globalization, national governments interact strategically with

3
other governments to attract firms, investors and highly-skilled labor.2 Globalization thus
restricts national fiscal autonomy, i.e. government spending, budget composition and tax policy.
The main prediction of the efficiency hypothesis is that globalization reduces the size of
government: lower taxes, and lower government expenditures imply a retrenchment of the
welfare state. Global economic integration results in an impressive growth of economic mobility
and erodes the national autonomy of tax policy in developed countries, since it induces tax
avoidance for investors and firms. Fiscal consequences of globalization in large countries might
be very similar to those already experienced earlier in small open economies (Hines and
Summers 2009). Globalization is expected to render all countries smaller. Small open economies
face greater international competition than large countries and therefore rely much less on taxes
from capital income and corporations. The tax competition literature therefore often predicts a
global tax race to the bottom (e.g. Bretschger and Hettich 2002, Devereux et al. 2008).3
In a nutshell, the efficiency hypothesis suggests two trends: first, tax competition puts a
downward pressure on tax rates on mobile factors, and second, governments have to reduce
public spending, especially the social welfare state expenditures due to this tightened budget
constraint. The concept is also called disciplining hypothesis, since depending on the point of
view, either the efficiency of benevolent governments is reduced or egoistic governments are
disciplined (Ursprung 2008).
While the “…efficiency effect captures the influence of globalisation on the supply side
of the political market” (Schulze and Ursprung 1999: 300), it neglects its demand side. The
compensation hypothesis (or embedded liberalism thesis) – introduced by Rodrik – makes up for
this absence. Rodrik's view on the globalization-welfare state nexus is based on two observable
2
Harms and Ursprung (2002) show that multinational enterprises are attracted by countries in which civil and political freedom is respected. 3
See Lai (2010) on the political economy of capital market integration and tax competition. Patriotism may prevent a race to the bottom in tax competition because it generates a base of loyal citizens that makes the tax base less elastic with respect to tax rate changes and thus keeps taxes high. In OECD countries, patriotism indeed had a positive influence on tax burden (Qari et al. 2011).

4
trends: the rising trade openness of Western Europe and the US since the 1950s on the one hand
and the growth of governments (especially in social insurance programs) in particular in small
open economies on the other hand (Rodrik 1997a, 2007). Rodrik (1998) shows that the scope of
government in the most open economies is larger than in economies that are less integrated in the
world market. The positive relationship between globalization and the size of government is no
coincidence because growing internationalization yields a higher demand for social stability.
Governments thus increase social welfare expenditures (Rodrik 1998). The reason is that
international trade and financial integration lead to an increase in external risk. For example,
fluctuations in trade and finance, and specialization in production give rise to uncertainty and
income volatility. People therefore experience instability and employment fluctuations. Some
people gain while others lose. This redistribution generates a higher demand for social insurance
and compensation for the losers of globalization by means of unemployment insurance, benefit
payments, etc. (Kim 2009: 211-212, Rodrik 1998: 998-999). Politicians satisfy their citizens'
(and therefore also their voters') demand for higher social welfare expenditures to become
reelected (Dreher et al. 2008b, Ursprung 2008).
To be sure, both, the efficiency and the compensation hypothesis imply that governments
use fiscal and social policies to react to globalization. Governments may also use industrial
policies such as (de)regulating labor and product markets or privatize state owned companies to
react to globalization. Industrial policies are however not associated with the pure efficiency and
compensation hypotheses. We will briefly discuss globalization-induced effects on labor market
institutions and product markets in the conclusion.
Although the efficiency and the compensation hypotheses appear to contradict each other,
it is not necessarily correct that only one of them applies. Globalization could evoke a reduction
in tax revenues as proposed by the efficiency hypothesis. Yet, the conclusion of a welfare state
retrenchment is not necessarily correct. Social spending might nonetheless rise due to the higher

5
demand for social insurance as proposed by the compensation hypothesis (Rodrik 1997a). Lower
revenues and higher expenditures could give rise to serious governance problems. Hines and
Summers (2009: 2) arrive at the following conclusion: “One of the potential challenges for
governments that are eager to maintain and possibly strengthen their spending programs is that
the same forces that are responsible for recent economic changes might also raise the cost of
financing government programs with certain types of taxes.”
Another interpretation of a coexistence of the two effects is the following: the efficiency
effect is in fact reducing the scope of government, while the compensation effect is counteracting
by raising it. The question consequently should rather be to which degree these two effects offset
each other than which of the hypotheses is true (Schulze and Ursprung 1999). From a theoretical
point of view, we cannot predict which effect dominates and which amount of total effect
remains. This certainly calls for an empirical analysis.
2.2 Related empirical literature
The empirical evidence on the globalization-welfare-state nexus is mixed. Scholars have used
several variables to measure the size of government and globalization. Size of government has
been measured, for example, by tax rates, overall revenues including tax income and
contributions to the social security system, overall government expenditures and social
expenditures. Globalization has been measured, for example, by trade openness, foreign direct
investment, capital account restrictions and globalization indices. The studies also cover different
countries and consider different time periods. The variety of measures, countries included and
time periods considered appears to be an important reason for the mixed empirical evidence.
The first-generation literature of the globalization-welfare state nexus has appeared in the
1990s and mainly investigated the net effect of globalization on the welfare state using
aggregated data. The results have been ambiguous. The second-generation literature adopts

6
improved empirical techniques in order to handle the analysis of this complex topic and to
receive more convincing results. Scholars use more disaggregated data and new proxies for the
size of the welfare state and for globalization. But still no definite consensus about the relation of
globalization and the size of the welfare state is reached. For encompassing surveys of the
literature see, for example, Schulze and Ursprung (1999), Ursprung (2008) and Gemmell et al.
(2008).4
Among the most prominent studies supporting the compensation hypothesis are Rodrik
(1998) and Cameron (1978). Rodrik (1998) employs a three and five year average of real
government consumption as dependent variable and lagged trade openness (import plus export
as a share of GDP averaged over the prior decade) as a measure for globalization. The results
suggest a positive and highly significant influence of trade openness on government
consumption for 125 countries over the 1985-1989 period and for 103 countries over the 1990-
1992 period. Cameron (1978) already explored five possible reasons for the expansion of the
public economy in 18 industrialized countries from 1960 to 1975, such as the higher trade
dependence to other countries. He uses imports and exports as a share of GDP for measuring
openness and total public revenues (taxes, contributions to social insurance etc.) as a share of
GDP for measuring the public sector size and finds that nations “…with open economies were
far more likely to experience an increase in the scope of public funding than were nations with
relatively closed economies...” (Cameron 1978: 1253). The results by Vaubel (2000, 2005) also
report a positive relationship between globalization and social expenditures.
The positive influence of globalization on social expenditures has been shown to depend
on political-economic determinants. In OECD countries, for example, the increase in public
spending appears to be weaker, the higher the number of veto players (Ha 2008). Leftwing
4
On the relationship between globalization and economic growth see, for example, Dreher (2006b). A related strand of the literature investigates how globalization influences labor market performance and labor market institutions. See Koskela and Schöb (2010) on trade and outsourcing, Gaston and Nelson (2004) and Potrafke (2010) on globalization and labor market institutions, on trade and unemployment Yotov (2011).

7
governments tended to spend more on social welfare than rightwing governments when
globalization was proceeding rapidly. When globalization was proceeding moderately, however,
government ideology did not influence social expenditures (Potrafke 2009).
Most previous studies concentrate on OECD countries. For Latin American countries, the
results by Avelino et al. (2005), for example, suggest that (1) trade openness expands social
spending, (2) financial openness has no significant influence on social expenditures and (3)
democratic regimes spend more on welfare state programs than authoritarian regimes. In
Western Europe, globalization as measured by the KOF index of globalization had a positive
influence on social expenditures over the 1990-2006 period, whereas it had a negative influence
on social expenditures in Eastern Europe (Leibrecht et al. 2011).
Other studies support the efficiency hypothesis, find evidence for a coexistence of the
compensation as well as the efficiency effect, give contradicting results or state that there is no
significant influence of globalization on the welfare state at all (e.g., Dreher 2006a). Rodrik
(1997b), for example, employs annual panel data from OECD countries over the 1966-1991
period and finds a negative correlation between trade openness (lagged) and social spending as
well as to government consumption. His results also suggest that in countries and periods with
totally free capital accounts, openness has a considerably higher negative influence on social
spending and government consumption than in countries with capital restrictions. Bretschger and
Hettich (2002), for example, analyze 14 OECD countries from 1967 to 1996 and conclude that
the efficiency hypothesis is able to explain taxation patterns, while the compensation hypothesis
is able to explain government expenditures patterns. Busemeyer (2009) finds a negative
association between trade-openness and public spending in OECD countries.
Garrett and Mitchell (2001) use data from 18 OECD countries over the 1961-1993 period
and find that trade openness negatively influences government spending, but not government
consumption and social security transfers. Kittel and Winner (2005) re-estimate the model by

8
Garrett and Mitchell (2001) using more sophisticated empirical techniques and find neither
evidence for the efficiency nor for the compensation hypothesis. Instead, they conclude that
public expenditures are predominately influenced by domestic economic and demographic
variables such as unemployment and the dependency ratio. Recent empirical evidence also does
not suggest a global tax race to the bottom (Plümper et al. 2009).
Globalization may not have influenced overall government expenditures because the
compensation and the efficiency effect neutralize each other. Globalization, however, could
influence the composition of public expenditures. Dreher et al. (2008b) investigate whether
globalization influenced budget composition and employ two datasets – one containing 60
countries over the 1971-2001 period and another one covering 10 OECD countries over the
1991-2000 period. Dreher et al. (2008b) apply four different proxies for globalization: the sum of
imports and exports, the sum of in- and outflows of foreign direct investment (both of them as a
share of GDP), restrictions on capital account transactions and the KOF globalization index.
Their results suggest that globalization has not influenced budget composition.
The empirical studies on the globalization-welfare state nexus show that so far “a robust
impact of globalization on government expenditures does not appear to exist.'' (Dreher et al.
2008b: 264). We re-examine the globalization-welfare state nexus employing a larger dataset
than used before.
3. Data and empirical strategy
3.1 Data
We employ the 2009 KOF globalization indices that are available for the 1970-2006 period and
annual panel data from the Penn World Tables 6.2 (Heston et al. 2006) containing the dependent
variable and some of the control variables that are available for the 1950-2004 period. The

9
combined dataset includes data from 186 countries over the 1970-2004 period.5 Tables A1 and
A2 show the list of included countries and descriptive statistics of the variables. The annual
panel dataset is unbalanced, since the variables have missing values for some countries or years.
In the base-line model, we employ five year averages of the variables to exploit variation across
countries and time. When all observations in a five year interval are missing, we assign the five
year average also as missing. When one, two, three or four observations are present, we use the
average of the available data in every five year time interval.
The size of government measure
We use the government share as a percentage of real GDP per capita (CG) compiled by the Penn
World Tables as the measure of government size. The most important reason for our choice is
the large sample. The disadvantage is that CG measure does not include transfer payments. We
thus acknowledge that by using the CG measure one implicitly focuses on how globalization
influences the size of government and not on globalization-induced effects on welfare state
activities. Higher social expenditures are usually associated with a larger size of government as
measured by our CG indicator.
Data on social expenditures are not available for such a large sample. Rodrik (1998: 1012)
argues that social welfare spending is appropriate only for advanced countries, since less
developed countries often do not have “…the establishment of a safety net.” They rather “…rely
on a broader set of instrumentalities.” These instrumentalities may therefore be captured better
by a widespread government measure such as the government share of real GDP per capita.
Figure 1 shows that the government share as a percentage of real GDP per capita increased
on average from 19.51% in 1970 to 24.36% in 2003. The size of the government sector thus
rather increased than decreased. Growth of the government sector was the strongest in the 1970s
5
The dependent variable has many missing values in for the year 2004. We therefore do not consider the year 2004 in Figure 1.

10
and the beginning of the 1980s. From 1987 to 1989 the government share significantly
decreased. From 1991 on, government grew much more slowly and in some years government
size even slightly decreased.
The KOF index of globalization
The 2009 KOF index assembles 24 variables to an overall index and three sub-indices covering
the economic, social and political dimensions of globalization. The 24 variables are aggregated
in six groups: (1) actual flows of trade, investment and income payments to foreign nationals, (2)
restrictions on international trade and capital account, (3) data on personal contact with people
living in foreign countries, (4) data on information flows, (5) data on international cultural
integration, and (6) data on international political integration.
The first two groups form the economic globalization sub-index. The following three
groups form the social globalization sub-index and the last group the political globalization sub-
index. All of them together define the overall index. Table A3 lists all the variables and weights
in detail. The overall index is available for 158 countries, the political globalization sub-index
for 207 countries, the economic globalization sub-index for 139 countries and the social
globalization sub-index for 161 countries. The original KOF index was published in 2002 (see
Dreher et al. 2008a for details).
The overall index and the sub indices assume values scaled from 1 (minimum of
globalization) to 100 (maximum of globalization). Globalization was high in countries such as
the Netherlands (82.7), Luxembourg (82.7) and Canada (80.4) and quite low in countries such as
Rwanda (22.1), Congo (23.4) and Nepal (25.2).
Figure 2 illustrates the development of the different KOF globalization indices over the
1970-2004 period. The indices substantially increased from about 38 to 61 (only the political
sub-index starts at about 34 and the social one stops at 58). While the overall KOF index and the

11
sub indices on economic and social globalization rose quite monotonically, the sub index on
political globalization shows more fluctuation. This sub-index decreased in the end of the 1980s
and increased steeper than the others in the beginning of the 1990s. An explanation for this
pattern is the influence of the Cold War that restricted global political integration. After 1990
political cooperation significantly increased.
3.2 Correlation between globalization and size of government
To illustrate the association between globalization and size of government around the world, we
present correlations between the size of government measure and the KOF globalization indices
(five year averages). Figure 3 suggests that overall globalization was not associated with size of
government around the world. The correlation coefficient between the overall KOF index of
globalization and size of government is -0.05. In a similar vein, the correlation between the KOF
index of economic globalization and size of government is 0.03 (Figure 4) and 0.01 between the
KOF index of social globalization and size of government (Figure 5). By contrast, political
globalization is somewhat negatively associated with size of government: the correlation
coefficient between the KOF index of political globalization and size of government is -0.30
(Figure 6). The correlations do, however, not take into account the development over time,
individual country effects and other covariates, which we consider in the econometric panel data
model.

12
3.3 The empirical model
The base-line econometric panel data model has the following form:
log Size of governmentit = αj log Globalizationijt + Σk ζk log xikt + µi + λt + uit
with i = 1,...,186; j=1,..,4; k=1,...,3; t=1,…,7 (1)
The dependent variable log Size of governmentit is the logarithm of government expenditures as a
share of GDP in country i in the five year period t. Log Globalizationitj denotes the logarithm of
the jth dimension of the KOF globalization index (overall, economic, social, and political
dimension). The vector log xikt contains the logarithms of our economic control variables.
Following Dreher et al. (2008b), Alesina and Wacziarg (1998) and Potrafke (2009) we include
real GDP per capita, the age dependency ratio (ratio of people younger than 15 and older than 65
to the working-age population of the age 15-64 in %) and total population (in thousands).6 Real
GDP per capita captures the general economic situation. The dependency ratio controls for the
age structure and the demographic development. We include total population as a measure for
country size following Alesina and Wacziarg (1998), because a smaller population is likely to
have a larger share of government in GDP. µi describes a fixed country effect, λt describes a
fixed period effect and uit is an error term. In the base-line model, we use logarithms of the
dependent and explanatory variables to better account for outliers and smooth the distributions of
the variables and also to interpret the coefficients of the explanatory variables as elasticities. In
the robustness tests section, we discuss results using levels of the five year averages instead of
logarithms and results with annual data in growth rates.7 We estimate the model with feasible
6 It is important to note that we cannot include a government ideology index because there is no government ideology index available for the entire sample. Reliable government ideology indices are available for OECD countries and only some developing countries. See, for example, Bjørnskov (2005, 2008) and Potrafke (2009). 7
The results are available in the appendix

13
generalized least squares and with heteroskedastic and autocorrelation consistent (HAC) Newey-
West type standard errors (Newey and West 1987, Stock and Watson 2008).
4. Results
4.1 Basic results
Table 1 shows our base-line regression results. Column (1) shows the results when only the
overall KOF index of globalization is included to illustrate that the inferences regarding
globalization are not driven by including/excluding the economic control variables. Per capita
income is statistically significant at the 5% level in columns (3) and (4), yet lacks statistical
significance at conventional levels in columns (2) and (5) and has in these estimates a negative
sign. The numerical meaning of the estimated coefficients is that when GDP per capita increased
by 1%, government expenditures as a share of GDP decreased by about 0.13%. On the one hand,
the influence of GDP per capita on government sector size is purely mechanical because when
GDP increases, the government sector size ceteris paribus decreases. On the other hand, the
finding suggests that governments tend to react to recessions by somewhat raising expenditures.
The dependency ratio and total population do not turn out to be statistically significant. The null
hypotheses of F-tests that the fixed country effects and the fixed period effects do not turn out to
be jointly significant can be rejected at the 1% level in each case.
Most importantly, the results reported in Table 1 show that globalization has had a
positive influence on government sector size around the world. The coefficients of the overall
KOF index of globalization have positive signs and are statistically significant at the 5% level in
columns (1) and (2). The numerical meaning of the estimated coefficients is that when the
overall KOF index of globalization increased by 1%, government expenditures as a share of
GDP increased by about 0.3%; that is an increase of the overall KOF index of globalization by
one standard deviation (16 points on a scale from 1 to 100) increases government expenditures as

14
a share of GDP by about two percentage points; for example, from 23% (mean value) to about
25%. The globalization-induced effect on government sector size is driven by social
globalization: the coefficient of the KOF index of social globalization is statistically significant
at the 1% level (column 4) and indicates that government expenditures as a share of GDP
increased by about 0.28% when the KOF index of social globalization increased by 1%. By
contrast, the coefficient of the KOF index of economic globalization does not turn out to be
statistically significant (column 3). The coefficient of the KOF index of political globalization is
statistically significant at the 10% level and indicates that government expenditures as a share of
GDP increased by about 0.10% when the KOF index of political globalization increased by 1%.
(column 5). The results thus do not support the conjecture that economic globalization has
generated a higher demand for social insurance and governments compensate the losers of
globalization (Rodrik). The positive influence of social globalization on the size of government
rather suggests a catch-up effect: the more people have been globally interconnected and
observed government sector size in other countries, the more government expenditures they have
demanded in their home countries.
4.2 Results for sub samples
We have tested the robustness of the results in several ways. First, we have tested whether the
results differ in sub samples. We have therefore investigated globalization-induced effects before
and after the end of the Cold War in 1990, in democracies and autocracies, in OECD and non-
OECD countries, and in high and low income countries. To do so, we have included interaction
terms and calculated marginal effects on how globalization influences size of government before
and after the end of the Cold War in 1990 and given that a country was a high or low income
country, democratic or autocratic, OECD or no OECD member country.

15
We have tested whether the results are sensitive to the time period considered. In
particular, to the 1970-1989 period, which was dominated by the Cold War, and the 1990-2004
period after the end of the Cold War. In the 1990-2004 period, Europe experienced a recession
caused by sharply increasing interest rates. The economic circumstances and the Gulf War in
1991 led to instability of the world market. Economic growth was strong over the 1970-1989
period and much slower or even negative over the 1990-2004 period.8 Since circumstances in
these two periods were different we have examined potential globalization-induced effects on the
size of government in both periods separately.
To address this issue, we have included a dummy variable that takes on the value 1 for
the 1970-1989 period and 0 for the 1990-2004 period. Moreover, we have included the
interaction of the globalization variables and this Cold War dummy to identify potential
differences between globalization-induced effects on the size of government in both periods. We
have normalized (mean zero, variance one) the globalization variables and the Cold War dummy
before interacting (and will also do so with other variables to interact with globalization – see
below).
As can be seen from Table 2, the coefficients of the overall KOF index of globalization
and the KOF index of social globalization still have a positive sign and are statistically
significant. The Cold War dummy indicates a negative and statistically significant effect on
government sector size. The marginal effects of the globalization variables have to be interpreted
conditionally on the interaction with the Cold War dummy (see Friedrich 1982). In principle,
there are two sensible ways to evaluate the marginal effects. We follow Dreher and Gassebner
(2011), evaluating the marginal effects at the minimum as well as the maximum of the interacted
variable, i.e., before or after 1990 (Table 3). Using this method one can distinguish between the
impacts of globalization on size of government before and after 1990. If one chooses to evaluate
8
The role of international organizations in the world economy has also changed after the end of the Cold War (e.g., Moser and Sturm 2011).

16
the marginal effects at the average level of the Cold War dummy, the numerical meaning and the
statistical significance of these average effects corresponds to the coefficients and t-statistics of
the globalization variable. Table 3 indicates that there were significant marginal effects before
and after 1990.
The marginal effects presented in Table 3 can be interpreted as follows: over the 1970-
1989 period, an increase in the overall KOF index of globalization by 1% increased government
expenditures as a share of GDP by about 0.1%. But also over the 1990-2004 period, an increase
in the overall KOF index of globalization by 1% increased government expenditures as a share
of GDP by about 0.1%. The influence of social globalization was slightly larger over the 1990-
2004 period than the 1970-1989 period: over the 1970-1989 period, an increase in the KOF
index of social globalization by 1% increased government expenditures as a share of GDP by
about 0.17%; while over the 1990-2004 period, an increase in the KOF index of social
globalization by 1% increased government expenditures as a share of GDP by about 0.15%.
Political globalization had a weak effect on size of government over the 1970-1989 period, but
no effect after 1990: the marginal effect of the KOF index of political globalization is
statistically significant at the 10% level for the 1970-1989 period.
We have tested whether inferences are sensitive to political institutions. To deal with this
issue, we have used the Democracy-Dictatorship variables by Cheibub et al. (2010). The
Democracy-Dictatorship dummy variable distinguishes between regimes in which executive and
legislative offices are allocated in contested elections and those regimes in which this is not the
case. The variable assumes the value one for democracies and zero otherwise.9 We have included
five year averages of the Democracy-Dictatorship variable and interacted them with the
globalization variables. Table 4 shows the regression results and Table 5 shows the marginal
9
See Cheibub et al. (2010) for a more encompassing discussion on classifying democracies and dictatorships. The more traditional measures of democracy are the POLITY IV and the Freedom House indices. These indices have, however, been criticized on several grounds (Munk and Verkuilen 2002, Vreeland 2008, Cheibub et al. 2010).

17
effects: globalization-induced effects (overall globalization and social globalization) on the size
of government did not differ in democracies versus dictatorships.
Distinguishing between OECD and non-OECD countries shows, in contrast to the results
discussed above, that globalization had a stronger influence on the size of government in OECD
countries than in non-OECD countries (Tables 6 and 7). The results in Table 6 show that the
coefficient of the overall KOF index of globalization has a positive sign and is statistically
significant at the 5% level in columns (1) and (2). The coefficient of the KOF index of social
globalization is statistically significant at the 1% level (column 4). The coefficient of the KOF
index of political globalization is statistically significant at the 5% level (column 5). The
marginal effects presented in Table 7 show that an increase in the overall KOF index of
globalization by 1% increased government expenditures as a share of GDP by about 0.17% in
OECD countries but only by about 0.10% in Non-OECD countries. An increase in the KOF
index of social globalization by 1% increased government expenditures as a share of GDP by
about 0.19% in OECD countries, and about 0.14% in Non-OECD countries. An increase in the
KOF index of political globalization by 1% increased government expenditures as a share of
GDP by about 0.29% in OECD countries, but only by about 0.08% in Non-OECD countries. The
marginal effects with respect to the KOF index of economic globalization do not turn out to be
statistically significant. The globalization-induced increase in the size of government in OECD
countries corresponds with the related studies that have reported evidence for the compensation
hypothesis especially in OECD countries. We propose that this effect is because, first, OECD
countries possess well-established economic and political institutions to better react to any
exogenous shocks. For example, tax bases are well-established (e.g., Aidt and Jensen 2009).
Freedom of the press and media coverage are encompassing and ensure that the population is
informed and observes government sector size in other countries. Second, the OECD regularly
keeps track of the economic policy of its member states. It is conceivable that this monitoring

18
induces the member states to keep in line with the generally acknowledged patterns of policy
response recommended by the OECD.
We have tested whether inferences are sensitive to real GDP per capita. The results by
Rudra (2002) suggest that weak labor power combined with trade openness has a negative effect
on social expenditures in LDCs. Whereas workers of developed countries have a strong
organization helping to accomplish their benefits in form of higher welfare spending. Hence, the
positive effect in developed countries could be offset by the negative effect in less developed
ones. To deal with this issue we have interacted the globalization variables (logs) with real GDP
per capita (logs). The results in Table 8 show that overall, social and political globalization had a
positive influence on the size of government at average income levels. The marginal effects in
Table 9 show that the positive effect appears to be driven by low income countries: the marginal
effects are only statistically significant at minimum income levels and do not turn out to be
statistically significant at maximum income levels at conventional levels. It is important to note,
however, that the size of the marginal effects at minimum income levels which are statistically
significant (overall globalization and social globalization) hardly differs from the size of the
marginal effects at maximum income levels. In contrast, to the OECD dummy variable, the Cold
War dummy variable and the democracy variable, real GDP per capita is a continuous variable
and Table 9 shows marginal effects evaluated at the minimum and maximum level of real GDP
per capita. Distinguishing between real GDP per capita differs from distinguishing between
OECD and Non-OECD members because some high income countries and Non-OECD members
such as Israel and Singapore are highly globalized but have a rather small size of government,
and also some low income countries and Non-OECD members such as Maldives, Lesotho and
Mauritania are fairly high globalized and also have a quite big size of government.10
10
Israel became an OECD member state on September 7, 2010.

19
In the base-line model, we use logarithms of the dependent and explanatory variables to
better account for outliers and smooth the distributions of the variables. For robustness tests, we
have estimated the model in levels of the five year averages and have not used logarithms.
Taking logs transforms the model in a non-linear way. The results using the variables in levels
show that only social globalization has a positive influence on the size of government. The
overall KOF index of globalization and the sub indices of economic and political globalization
do not turn out to be statistically significant. Using levels instead of logs of levels does not
change the inference that globalization-induced effects (1) hardly differ before and after 1990,
(2) between democracies and dictatorships and (3) that globalization had a positive influence on
size of government in OECD countries. The results in levels do however not indicate any
differences in globalization-induced effects between high and low income countries. The results
thus show that accounting for outliers and smoothing the distributions of the variables renders
overall globalization to have a significantly positive influence on the size of government. The
positive influence of social globalization and globalization in general in OECD countries on the
size of government is shown to be robust.
In a similar vein, we have estimated the model with annual data in growth rates. The
disadvantage of a model with annual data in growth rates is that it ignores variation in the level
of government size across countries. In any event, the results using annual data in growth rates
show that the globalization indices had a weakly positive influence on size of government or do
not turn out to be statistically significant. We therefore conclude that globalization did not
negatively influence the size of government.
An alternative test for globalization-induced effects on the size of government is to
investigate how globalization influences the relative price of government expenditures (costs).
We have therefore used the price level of government divided by total prices as dependent
variable (the data are also taken from the Penn World Tables). Following our previous

20
specification we have chosen five year averages in logs. The results in Table 10 show that
overall globalization and economic globalization had a negative influence on the relative price of
government size. The coefficients of the overall KOF index of globalization and the sub indices
on economic globalization (columns 2 and 3) are statistically significant at the 5% level and
indicate that the relative price of government size decreased by about 0.23% or 0.12% when the
overall KOF index and the KOF index of economic globalization increased by 1%. The KOF
indices on social and political globalization do not turn out to be statistically significant. These
findings show that costs of government expenditures decreased in the course of economic
globalization. Expanding government size thus became less costly and easier to achieve.11
We have also examined whether globalization-induced effects on the relative price of
government expenditures differed before and after the end of the Cold War in 1990, in
democracies and autocracies, in OECD and non-OECD countries, and in high and low income
countries. The results show that the negative influence of globalization on the relative price of
government expenditures is driven by dictatorships, non-OECD and low income countries and
was stronger over the 1970-1989 period compared to the 1990-2004 period. The negative
influence of globalization on the price of government expenditures vanishes when we estimate
the model in levels instead of logs of levels.12
5. Conclusion
We have re-examined the globalization-welfare state nexus in a large panel of 186 countries over
the 1970-2004 period: the results show that globalization has had a positive influence on
government sector size around the world. Social globalization has had an especially strong
effect. Globalization-induced effects were stronger in OECD countries. Overall globalization and
11
To be sure, the relative price of government expenditures does not measure traditional “public sector efficiency” (e.g., Afonso et al. 2005, Adam et al. 2011a,, 2011b). Future research may well investigate how globalization has influenced public sector efficiency. 12
The results are available in the appendix.

21
economic globalization reduced the relative price of government expenditures. These findings
suggest that globalization does not induce a collapse of the welfare state at all.
The results help to explain the mixed evidence of previous studies. For example,
government has indeed been larger (and social expenditures higher) in OECD countries when
globalization was proceeding rapidly. The different aspects of globalization also have had
different effects on the size of government. Some scholars believe that economic globalization
tends to decrease the size of government and social expenditures. Our results show that
economic globalization did not have these alleged effects.
To measure government size, we have chosen the government share of real per capita
GDP (CG) compiled by the Penn World Tables. The advantage of this measure is that it is
available for a large sample of countries. The disadvantage is that it does not include transfer
payments. We thus acknowledge that by using the CG measure one implicitly focuses on how
globalization influences the size of government and not on globalization-induced effects on
welfare state activities. Notice, however, that the CG measure includes the cost of public
administration that is necessary for a well functioning welfare state. Higher social expenditures
are usually associated with a larger size of government as measured by our CG indicator.
Arguably more important is that the CG measure does not include regulation policies. In East
Asia, for example, social programs are provided as a combination of regulated markets, a
systematic approach to international integration, and practices of enterprises such as lifetime
employment and social benefits for company employees (Rodrik 2007). It is conceivable that
governments not greatly increase social expenditures when globalization is proceeding rapidly,
but instead regulate the labor market or particular industries in such a way as to prevent high
unemployment.13 Empirical studies however show that globalization as measured by the KOF
13
Boulhol’s (2009) model suggests the opposite: increasing globalization will induce labor market deregulation.

22
indices did not influence labor market institutions in OECD countries (Potrafke 2010) and
around the world (Potrafke 2011).
We also acknowledge that the efficiency effect might neutralize the compensation effect
“…implying that the marginal increase in political support deriving from extending the size and
scope of compensation programs is offset by the marginal loss in political support associated
with raising the requisite additional funds” (Dreher et al. 2008b: 284). Governments do not profit
from raising or reducing welfare spending and consequently do not react to higher levels of
global integration.
In any event, there is neither an objective foundation to fear that nation states will lose
their fiscal autonomy and the welfare state collapses in the context of globalization. Nor is there
any sign that governments need to compensate exposure to external risk by a drastic
enhancement of welfare spending.

23
References
Adam, A., Delis, M.D., & Kammas, P. (2011a). Public sector efficiency: leveling the playing
field between OECD countries. Public Choice 146, 163-183.
Adam, A., Delis, M.D., & Kammas, P. (2011b). Are democratic governments more efficient?
European Journal of Political Economy 27, 75-86.
Afonso, A., Schuknecht, L. & Tanzi, V. (2005). Public sector efficiency: An international
comparison. Public Choice 16, 362-394.
Aidt, T.S., & Jensen, P.S. (2009). Tax structure, size of government, and the extension of the
voting franchise in Western Europe, 1860-1938.
International Tax and Public Finance 16, 362-394.
Alesina, A., & Wacziarg, R. (1998). Openness, country size and the government.
Journal of Public Economics 69, 305-322.
Anwar, S. (2010). Wage inequality, increased competition and trade liberalization: short run
versus long run. Review of International Economics 18, 574-581.
Avelino, G., Brown, D.S., & Hunter, W. (2005). The effects of capital mobility, trade
openness, and democracy on social spending in Latin America, 1980-1999.
American Journal of Political Science 49, 625-641.
Bergh, A., & Nilsson, T. (2010). Do liberalization and globalization increase income
inequality? European Journal of Political Economy 26, 488-505.
Bjørnskov, C. (2005). Does political ideology affect economic growth?
Public Choice 123, 133-146.
Bjørnskov, C. (2008). The growth-inequality association: government ideology matters.
Journal of Development Economics 87, 300-308.
Bjørnskov, C. (2009). On globalization and human rights: the importance of types of
globalization. University of Aarhus, Working Paper.
Boulhol, H. (2009). Do capital markets and trade liberalization trigger labor market
deregulation. Journal of International Economics 77, 223-233.
Bretschger, L. & Hettich, F. (2002). Globalisation, capital mobility and tax competition:
theory and evidence for OECD countries. European Journal of Political Economy
18, 695-716.
Busemeyer, M.R. (2009). From myth to reality: globalization and public spending in OECD
countries revisited. European Journal of Political Research 48, 455-482.

24
Cameron, D.R. (1978). The expansion of the public economy: A comparative analysis.
American Political Science Review 72, 1243-1261.
Cheibub, J., Gandhi, J., & Vreeland, J.R. (2010). Democracy and dictatorship revisited.
Public Choice 143, 67-101.
Devereux, M.P, Lockwood, B., & Redoano, M. (2008). Do countries compete over corporate tax
rates? Journal of Public Economics 92, 1210-1235.
Dreher, A. (2006a). The influence of globalization on taxes and social policy: An empirical
analysis for OECD countries.
European Journal of Political Economy 22, 179-201.
Dreher, A. (2006b). Does globalization affect growth? Empirical evidence from a new index.
Applied Economics 38, 1091-1110.
Dreher, A., Gassebner, M. (2011). Greasing the wheels of entrepreneurship? The impact of
regulations and corruption on firm entry. Public Choice, forthcoming.
Dreher, A., & Gaston, N (2008). Has globalisation increased inequality?
Review of International Economics 16, 516-536.
Dreher, A., Gaston, N. & Martens, P. (2008a): Measuring globalisation - gauging its con-
sequences, Berlin (Springer).
Dreher, A., Sturm, J.-E. & Ursprung H. W. (2008b). The impact of globalization on
the composition of government expenditures: Evidence from panel data.
Public Choice 134, 263-292.
Friedrich, R.J. (1982). In defence of multiplicative terms in multiple regression equations.
American Journal of Political Science 26, 797-833
Garrett, G. & Mitchell, D. (2001). Globalization, government spending and taxation in
the OECD. European Journal of Political Research 39, 145-177.
Gaston, N., & Nelson, D. (2004). Structural change and the labor-market effects of
globalization. Review of International Economics 12, 769-792.
Gemmell, N., Kneller R., & Sanz I. (2008). Foreign investment, international trade and
the size and structure of public expenditures.
European Journal of Political Economy 24, 151-171.
Ha, E. (2008). Globalization, veto players, and welfare spending.
Comparative Political Studies 41, 783-813.
Harms, P., & Ursprung, H.W. (2002). Do civil and political repression really boost foreign
direct investments? Economic Inquiry 40, 651-663.

25
Hellier, J., & Chusseau, N. (2010). Globalization and the inequality-unemployment tradeoff.
Review of International Economics 18, 1028-1045.
Heston, A., Summers, R., & Aten B. (2006). Penn World Table Version 6.2. Center
for International Comparisons of Production, Income and Prices at the University
of Pennsylvania.
Hines, Jr.J.R., & Summers, L.H. (2009). How globalization affects tax design. NBER
Working Paper 14664, Cambridge.
Kim, T.K. (2009). Globalization and state-supported welfare. A test of the curve-linear
hypothesis in OECD countries. International Social Work 52, 209-222.
Kittel, B., & Winner, H. (2005). How reliable is pooled analysis in political economy? The
globalization-welfare state nexus revisited. European Journal of Political Research,
44, 269-293.
Koskela, E., & Schöb, R. (2010). Outsourcing of unionized firms and the impact of labor
market policy reforms. Review of International Economics 18, 769-792.
Lai, Y.-B. (2010). The political economy of capital market integration and tax competition.
European Journal of Political Economy 26, 475-487.
Leibrecht, M., Klien, M., & Onaran, O. (2011). Globalization, welfare regimes and social
protection expenditures in Western and Eastern European countries.
Public Choice, forthcoming.
Moser, C., & Sturm, J.-E. (2011). Explaining IMF lending decisions after the Cold War.
Review of International Organizations, forthcoming.
Munck, G., & Verkuilen, J. (2002). Conceptualizing and measuring democracy: Evaluating
alternative indices. Comparative Political Studies 55, 5-34.
Newey,W.K., & West, K.D. (1987). A simple, positive semi-definite, heteroskedasticity
and autocorrelation consistent covariance matrix. Econometrica 55, 703-708.
Plümper, T., Troeger, V. E., & Winner, H. (2009). Why is there no race to the bottom
in capital taxation? Tax competition among countries of unequal size, different levels
of budget rigidities and heterogeneous fairness norms.
International Studies Quarterly 53, 761-786.
Potrafke, N. (2009). Did globalization restrict partisan politics? An empirical evaluation
of social expenditures in a panel of OECD countries. Public Choice 140, 105-124.
Potrafke, N. (2010). Labor market deregulation and globalization: Empirical evidence from
OECD countries. Review of World Economics 146, 545-571.

26
Potrafke, N. (2011). Globalization and labor market deregulation: International empirical
evidence. Working paper, University of Konstanz.
Qari, S., Konrad, K.A., & Geys, B. (2011). Patriotism, taxation and international mobility.
Public Choice, forthcoming.
Rodrik, D. (1997a). Trade, social insurance, and the limits to globalization.
NBER Working Paper 5905, Cambridge.
Rodrik, D. (1997b). Has globalisation gone too far? Institute for International Economics
(Washington D.C.).
Rodrik, D. (1998). Why do more open Economies have bigger governments?
Journal of Political Economy 106, 997-1032.
Rodrik, D. (2007): One economics, many recipes. Globalization, institutions, and economic
growth, Princeton University Press (New Jersey).
Rudra N. (2002). Globalization and the decline of the welfare state in less-developed ountries.
International Organization 56, 411-445.
Schulze, G.G., & Ursprung, H.W. (1999). Globalisation of the economy and the nation state.
World Economy 22, 295–352.
Stock, J.H., & Watson, M.W. (2008). Heteroskedasticity-robust standard errors for fixed
effect panel data regression. Econometrica 76, 155-174.
Ursprung, H. W. (2008): Globalization and the welfare state. In Durlauf, S. N., and Blume,
L.E. (Eds.) The New Palgrave Dictionary of Economics. Second Edition. Palgrave
Macmillan (Köln).
Vaubel, R. (2000). Internationaler politischer Wettbewerb: Eine europäische
Wettbewerbsaufsicht für Regierungen und die empirische Evidenz. In Schenk, K.-E.,
Schmidtchen, D., Streit, M. E. and Vanberg,V. (Eds.) Jahrbuch für Neue Politische
Ökonomie (pp.280-309). Tübingen: Mohr-Siebeck.
Vaubel, R. (2005). Sozialpolitische Konsequenzen der Globalisierung-Theorie und Empirie.
In Freytag, A. (Ed.) Wirtschaftlicher Strukturwandel, nationale Wirtschaftspolitik und
politische Rationalität (pp. 143-158). Köln: Kölner Universitätsverlag GmbH.
Vreeland, J.R. (2008). The effect of political regime on civil war: Unpacking anocracy.
Journal of Conflict Resolution 52, 401-425.
Yotov, Y.V. (2010). Trade-induced unemployment: how much do we care?
Review of International Economics 18, 972-989.

27
Figure 1: Government expenditures as a share of GDP (CG measure). 186 countries. 1970-2003. 18
2022
2426
Gov
ernm
ent e
xpen
ditu
res
as a
sha
re o
f GD
P
1970 1975 1980 1985 1990 1995 2000 2005Year
Source: Penn World Tables 6.2 Figure 2: KOF indices of globalization. 186 countries.1970-2004.
3035
4045
5055
6065
KO
F in
dice
s of
glo
baliz
atio
n
1970 1975 1980 1985 1990 1995 2000 2005Year
overall economicsocial political
Source: Penn World Tables 6.2 and Dreher (2006) and Dreher et al. (2008a)

28
Figure 3: Size of government and overall KOF index of globalization 1970-2004 (five year averages).
020
4060
80G
over
nmen
t exp
endi
ture
s as
a s
hare
of G
DP
20 40 60 80 100overall KOF index of globalization
Correlation coefficient: -0.05. Source: Penn World Tables 6.2 and Dreher (2006) and Dreher et al. (2008a) Figure 4: Size of government and KOF index of economic globalization 1970-2004 (five year averages).
020
4060
80G
over
nmen
t exp
endi
ture
s as
a s
hare
of G
DP
0 20 40 60 80 100KOF index of economic globalization
Correlation coefficient: 0.03. Source: Penn World Tables 6.2 and Dreher (2006) and Dreher et al. (2008a)

29
Figure 5: Size of government and KOF index of social globalization 1970-2004 (five year averages).
020
4060
80G
over
nmen
t exp
endi
ture
s as
a s
hare
of G
DP
0 20 40 60 80 100KOF index of social globalization
Correlation coefficient: 0.01. Source: Penn World Tables 6.2 and Dreher (2006) and Dreher et al. (2008a) Figure 6: Size of government and KOF index of political globalization 1970-2004 (five year averages).
020
4060
80G
over
nmen
t exp
endi
ture
s as
a s
hare
of G
DP
0 20 40 60 80 100KOF index of political globalization
Correlation coefficient: -0.30. Source: Penn World Tables 6.2 and Dreher (2006) and Dreher et al. (2008a)

30
Table 1: Regression Results. Dependent variable: log Government expenditures as a share of GDP FGLS with heteroskedastic and autocorrelation consistent (HAC) Newey-West type standard errors. 1970-2004 (five year averages)
(1) (2) (3) (4) (5)
log KOF index of globalization (overall) 0.2635** 0.2921** [2.01] [2.15] log KOF index of globalization (economic) 0.0453 [0.48] log KOF index of globalization (social) 0.2782*** [3.06] log KOF index of globalization (political) 0.1009* [1.92] log real GDP per capita -0.0957 -0.1381** -0.1322** -0.0918 [1.55] [2.03] [2.14] [1.60] log Dependency ratio 0.286 0.4116 0.0023 0.3358 [0.92] [1.23] [0.01] [1.05] log Population -0.0300 -0.1682 0.0159 -0.0475 [0.36] [1.62] [0.20] [0.54] Fixed country effects Yes Yes Yes Yes Yes Fixed period effects Yes Yes Yes Yes Yes Observations 980 966 876 981 1121 Number of countries 155 153 139 156 179 R-squared (within) 0.09 0.10 0.09 0.11 0.08 R-squared (between) 0.00 0.06 0.08 0.10 0.07 Notes: Absolute value of t statistics in brackets; * significant at 10%; ** significant at 5%; *** significant at 1%

31
Table 2: Regression Results. Dependent variable: log Government expenditures as a share of GDP FGLS with heteroskedastic and autocorrelation consistent (HAC) Newey-West type standard errors. 1970-2004 (five year averages) Cold War dummy variable included (1970-1989 period).
(1) (2) (3) (4) (5)
log KOF index of globalization (overall) 0.0926* 0.1045** [1.92] [2.07] log KOF index of globalization (economic) -0.0012 [0.03] log KOF index of globalization (social) 0.1593*** [3.33] log KOF index of globalization (political) 0.0668 [1.58] Cold War dummy variable -0.0059 -0.1132** -0.2066*** -0.1448*** -0.1246** [0.16] [2.37] [2.81] [3.07] [2.52] log KOF index of globalization (overall)* Cold War dummy variable 0.0019 -0.0005 [0.16] [0.04] log KOF index of globalization (economic)* Cold War dummy variable 0.019 [1.35] log KOF index of globalization (social)* Cold War dummy variable -0.0127 [1.15] log KOF index of globalization (political)* Cold War dummy variable 0.0098 [0.76] log real GDP per capita -0.0959 -0.1293* -0.1398** -0.0944 [1.54] [1.88] [2.30] [1.64] log Dependency ratio 0.2841 0.4693 -0.0689 0.3355 [0.96] [1.46] [0.23] [1.05] log Population -0.0288 -0.2238** 0.0433 -0.0566 [0.32] [1.99] [0.53] [0.63] Fixed country effects Yes Yes Yes Yes Yes Fixed period effects Yes Yes Yes Yes Yes Observations 980 966 876 981 1121 Number of countries 155 153 139 156 179 R-squared (within) 0.09 0.10 0.10 0.11 0.08 R-squared (between) 0.00 0.06 0.07 0.05 0.10 Notes: Absolute value of t statistics in brackets; * significant at 10%; ** significant at 5%; *** significant at 1% Table 3: Marginal effects (min and max). Cold War dummy variable included (1970-1989 period).
(1) (2) (3) (4) (5)
overall
globalization overall
globalization economic
globalization social
globalization political
globalization 0.094** 0.104** 0.015 0.148*** 0.075* 1970-1989 period [2.02] [2.15] [0.37] [3.16] [1.86] 0.090* 0.105* -0.023 0.174*** 0.056 1990-2004 period [1.70] [1.87] [0.45] [3.34] [1.14]
Notes: Absolute value of t statistics in brackets; * significant at 10%; ** significant at 5%; *** significant at 1%

32
Table 4: Regression Results. Dependent variable: log Government expenditures as a share of GDP FGLS with heteroskedastic and autocorrelation consistent (HAC) Newey-West type standard errors. 1970-2004 (five year averages) Democracy-Dictatorship dummy variable included.
(1) (2) (3) (4) (5)
log KOF index of globalization (overall) 0.1053** 0.1202** [2.20] [2.44] log KOF index of globalization (economic) 0.0136 [0.32] log KOF index of globalization (social) 0.1590*** [3.27] log KOF index of globalization (political) 0.0785* [1.68] Democracy -0.0006 -0.0002 0.0055 -0.0029 0.0277 [0.03] [0.01] [0.27] [0.15] [0.99] log KOF index of globalization (overall)* Democracy -0.0055 -0.0026 [0.31] [0.13] log KOF index of globalization (economic)* Democracy -0.0175 [0.85] log KOF index of globalization (social)* Democracy -0.0053 [0.27] log KOF index of globalization (political)* Democracy -0.0096 [0.28] log real GDP per capita -0.1143* -0.1299* -0.1531** -0.1009* [1.89] [1.91] [2.52] [1.71] log Dependency ratio 0.2862 0.4156 0.018 0.4462 [0.88] [1.22] [0.06] [1.28] log Population -0.0402 -0.2056* 0.0102 -0.0634 [0.42] [1.78] [0.11] [0.65] Fixed country effects Yes Yes Yes Yes Yes Fixed period effects Yes Yes Yes Yes Yes Observations 952 941 864 949 1071 Number of countries 154 152 139 154 176 R-squared (within) 0.10 0.11 0.10 0.12 0.08 R-squared (between) 0.00 0.08 0.08 0.11 0.07 Notes: Absolute value of t statistics in brackets; * significant at 10%; ** significant at 5%; *** significant at 1% Table 5: Marginal effects (min and max). Democracy-Dictatorship dummy variable included.
(1) (2) (3) (4) (5)
overall
globalization overall
globalization economic
globalization social
globalization political
globalization 0.099* 0.117** -0.007 0.153*** 0.067 Democracy [1.83] [2.07] [0.13] [2.91] [1.07]
0.110** 0.123** 0.029 0.164*** 0.087 Dictatorship [2.26] [2.43] [0.28] [3.11] [1.60]
Notes: Absolute value of t statistics in brackets; * significant at 10%; ** significant at 5%; *** significant at 1%

33
Table 6: Regression Results. Dependent variable: log Government expenditures as a share of GDP FGLS with heteroskedastic and autocorrelation consistent (HAC) Newey-West type standard errors. 1970-2004 (five year averages) OECD country dummy variable included.
(1) (2) (3) (4) (5)
log KOF index of globalization (overall) 0.1017** 0.1156** [2.22] [2.39] log KOF index of globalization (economic) 0.0254 [0.63] log KOF index of globalization (social) 0.1498*** [3.12] log KOF index of globalization (political) 0.1057** [2.42] OECD country -0.0376 -0.0475** -0.0285* -0.0242 -0.0753* [1.55] [2.18] [1.78] [1.17] [1.76] log KOF index of globalization (overall)* OECD country 0.0194 0.0312* [1.27] [1.94] log KOF index of globalization (economic)* OECD country 0.0176 [1.07] log KOF index of globalization (social)* OECD country 0.0148 [0.71] log KOF index of globalization (political)* OECD country 0.0736* [1.71] log real GDP per capita -0.0973 -0.1386** -0.1316** -0.0929 [1.58] [2.06] [2.14] [1.62] log Dependency ratio 0.3303 0.4428 0.0263 0.3537 [1.05] [1.32] [0.09] [1.10] log Population 0.0164 -0.1334 0.0325 -0.0302 [0.19] [1.18] [0.37] [0.34] Fixed country effects Yes Yes Yes Yes Yes Fixed period effects Yes Yes Yes Yes Yes Observations 980 966 876 981 1121 Number of countries 155 153 139 156 179 R-squared (within) 0.09 0.11 0.10 0.11 0.08 R-squared (between) 0.00 0.01 0.09 0.08 0.05 Notes: Absolute value of t statistics in brackets; * significant at 10%; ** significant at 5%; *** significant at 1% Table 7: Marginal effects (min and max). OECD country dummy variable included.
(1) (2) (3) (4) (5)
overall
globalization overall
globalization economic
globalization social
globalization political
globalization 0.150** 0.194*** 0.070 0.187*** 0.290** OECD [2.50] [2.96] [1.29] [2.73] [2.22]
0.094** 0.103** 0.018 0.144*** 0.076* Non-OECD [2.03] [2.13] [0.44] [2.93] [1.88]
Notes: Absolute value of t statistics in brackets; * significant at 10%; ** significant at 5%; *** significant at 1%

34
Table 8: Regression Results. Dependent variable: log Government expenditures as a share of GDP FGLS with heteroskedastic and autocorrelation consistent (HAC) Newey-West type standard errors. 1970-2004 (five year averages) Globalization and real GDP per capita interacted.
(1) (2) (3) (4) (5)
log KOF index of globalization (overall) 0.1042* 0.0985* [1.95] [1.84] log KOF index of globalization (economic) -0.0129 [0.27] log KOF index of globalization (social) 0.1391*** [2.69] log KOF index of globalization (political) 0.0698* [1.85] log real GDP per capita -0.0950 -0.1169 -0.1634* -0.1613** -0.1162 [1.35] [1.53] [1.92] [2.12] [1.63] log KOF index of globalization (overall)* log real GDP per capita 0.0013 -0.0045 [0.08] [0.25] log KOF index of globalization (economic)* log real GDP per capita -0.0271 [1.25] log KOF index of globalization (social)* log real GDP per capita -0.0075 [0.40] log KOF index of globalization (political)* log real GDP per capita -0.0102 [0.52] log Dependency ratio 0.3069 0.5214* 0.0268 0.359 [1.06] [1.67] [0.09] [1.13] log Population -0.0403 -0.2612** 0.001 -0.0547 [0.42] [2.05] [0.01] [0.60] Fixed country effects Yes Yes Yes Yes Yes Fixed period effects Yes Yes Yes Yes Yes Observations 980 966 876 981 1121 Number of countries 155 153 139 156 179 R-squared (within) 0.10 0.10 0.10 0.11 0.08 R-squared (between) 0.04 0.07 0.07 0.09 0.09 Notes: Absolute value of t statistics in brackets; * significant at 10%; ** significant at 5%; *** significant at 1% Table 9: Marginal effects (min and max). Globalization and real GDP per capita interacted.
(1) (2) (3) (4) (5)
overall
globalization overall
globalization economic
globalization social
globalization political
globalization 0.100* 0.112* 0.068 0.162*** 0.100 Low income (min) [1.83] [1.95] [1.16] [2.60] [1.40] 0.107 0.088 -0.076 0.121 0.046 High income (max) [1.37] [1.10] [0.90] [1.55] [0.80]
Notes: Absolute value of t statistics in brackets; * significant at 10%; ** significant at 5%; *** significant at 1%

35
Table 10: Regression Results. Dependent variable: log Price level of Government divided by price level of GDP FGLS with heteroskedastic and autocorrelation consistent (HAC) Newey-West type standard errors. 1970-2004 (five year averages)
(1) (2) (3) (4) (5)
log KOF index of globalization (overall) -0.1614 -0.2344** [1.48] [2.37] log KOF index of globalization (economic) -0.1247** [2.02] log KOF index of globalization (social) -0.0901 [1.36] log KOF index of globalization (political) -0.0571 [1.41] log real GDP per capita 0.2139*** 0.2277*** 0.2032*** 0.1213** [3.46] [3.15] [3.41] [2.06] log Dependency ratio 0.1994 0.0773 0.3151 0.3529 [0.67] [0.24] [1.05] [1.17] log Population -0.0608 -0.1215 -0.0868 -0.1085 [0.76] [1.08] [1.08] [1.35] Fixed country effects Yes Yes Yes Yes Yes Fixed period effects Yes Yes Yes Yes Yes Observations 980 966 876 981 1121 Number of countries 155 153 139 156 179 R-squared (within) 0.03 0.1 0.12 0.09 0.08 R-squared (between) 0.17 0.16 0.18 0.10 0.12 Notes: Absolute value of t statistics in brackets; * significant at 10%; ** significant at 5%; *** significant at 1%

36
Table A1. List of countries included. Afghanistan Denmark Albania Djibouti Algeria Dominica Angola Dominican Republic Antigua and Barbuda Ecuador Argentina Egypt, Arab Rep. Armenia El Salvador Australia Equatorial Guinea Austria Eritrea Azerbaijan Estonia Bahamas, The Ethiopia Bahrain Fiji Bangladesh Finland Barbados France Belarus Gabon Belgium Gambia, The Belize Georgia Benin Germany Bermuda Ghana Bhutan Greece Bolivia Grenada Bosnia and Herzegovina Guatemala Botswana Guinea Brazil Guinea-Bissau Brunei Darussalam Guyana Bulgaria Haiti Burkina Faso Honduras Burundi Hungary Cambodia Iceland Cameroon India Canada Indonesia Cape Verde Iran, Islamic Rep. Central African Republic Iraq Chad Ireland Chile Israel China Italy Colombia Jamaica Comoros Japan Congo, Dem. Rep. Jordan Congo, Rep. Kazakhstan Costa Rica Kenya Cote d'Ivoire Kiribati Croatia Korea, Dem. Rep. Cuba Korea, Rep. Cyprus Kuwait Czech Republic Kyrgyz Republic Lao PDR Rwanda Latvia Samoa Lebanon Sao Tome and Principe

37
Lesotho Saudi Arabia Liberia Senegal Libya Serbia Lithuania Seychelles Luxembourg Sierra Leone Macao, China Singapore Macedonia, FYR Slovak Republic Madagascar Slovenia Malawi Solomon Islands Malaysia Somalia Maldives South Africa Mali Spain Malta Sri Lanka Mauritania St. Kitts and Nevis Mauritius St. Lucia Mexico St. Vincent and the Grenadines Micronesia, Fed. Sts. Sudan Moldova Suriname Mongolia Swaziland Morocco Sweden Mozambique Switzerland Namibia Syrian Arab Republic Nepal Tajikistan Netherlands Tanzania Netherlands Antilles Thailand New Zealand Togo Nicaragua Tonga Niger Trinidad and Tobago Nigeria Tunisia Norway Turkey Oman Turkmenistan Pakistan Uganda Palau Ukraine Panama United Arab Emirates Papua New Guinea United Kingdom Paraguay United States Peru Uruguay Philippines Uzbekistan Poland Vanuatu Portugal Venezuela, RB Puerto Rico Vietnam Qatar Yemen, Rep. Romania Zambia Russian Federation Zimbabwe

38
Table A2. Data description and sources Variable Observations Mean Std. Dev. Min Max Source
Government sector size 5710 22.94 11.22 2.12 106.60 Penn World Tables 6.2 Summers and Heston (1991)
KOF index of globalization (overall) 5210 47.91 16.51 13.22 93.46
Dreher (2006) and Dreher et al. (2008)
KOF index of globalization (economic) 4650 48.19 18.57 8.68 98.72
Dreher (2006) and Dreher et al. (2008)
KOF index of globalization (social) 5315 45.50 20.72 7.23 94.44
Dreher (2006) and Dreher et al. (2008)
KOF index of globalization (political) 6295 47.40 24.93 1 98.78
Dreher (2006) and Dreher et al. (2008)
GDP per capita (real) 5710 5742.86 7002.58 61.06 54285.46 Penn World Tables 6.2 Summers and Heston (1991)
Dependency ratio 6225 58.17 6.69 45.22 78.56 Worldbank (2009) Population (total) in thousands 6509 26823.59 103104.90 12.01 1294846
Penn World Tables 6.2 Summers and Heston (1991)
Cold War dummy variable 6510 0.57 0.50 0 1 Own calculation Democracy 5605 0.43 0.50 0 1 Cheibub et al. (2010) OECD dummy variable 6510 0.14 0.34 0 1 Own calculation
Relative price of Government 5710 0.83 0.43 0.15 5.77 Penn World Tables 6.2 Summers and Heston (1991)

39
Table A3. Construction of the KOF index of globalization Indices and Variables Weights
I) Economic Globalization 38 %
i) Actual Flows 50 % Trade (percent of GDP) 19 % Foreign Direct Investment, flows (percent of GDP) 20 % Foreign Direct Investment, stocks (percent of GDP) 23 % Portfolio Investment (percent of GDP) 17 % Income Payments to Foreign Nationals (percent of GDP) 21 % ii) Restrictions 50 % Hidden Import Barriers 21 % Mean Tariff Rate 29 % Taxes on International Trade (percent of current revenue) 25 % Capital Account Restrictions 25 %
II) Social Globalization 39 %
i) Data on Personal Contact 34 % Telephone Traffic 26 % Transfers (percent of GDP) 3 % International Tourism 26 % Foreign Population (percent of total population) 20 % International letters (per capita) 26 % ii) Data on Information Flows 34 % Internet Users (per 1000 people) 36 % Television (per 1000 people) 36 % Trade in Newspapers (percent of GDP) 28 % iii) Data on Cultural Proximity 32 % Number of McDonald's Restaurants (per capita) 37 % Number of Ikea (per capita) 39 % Trade in books (percent of GDP) 24 %
III) Political Globalization 23 %
Embassies in Country 25 % Membership in International Organizations 28 % Participation in U.N. Security Council Missions 22 % International Treaties 25 %

40
Additional Tables and Figures
41
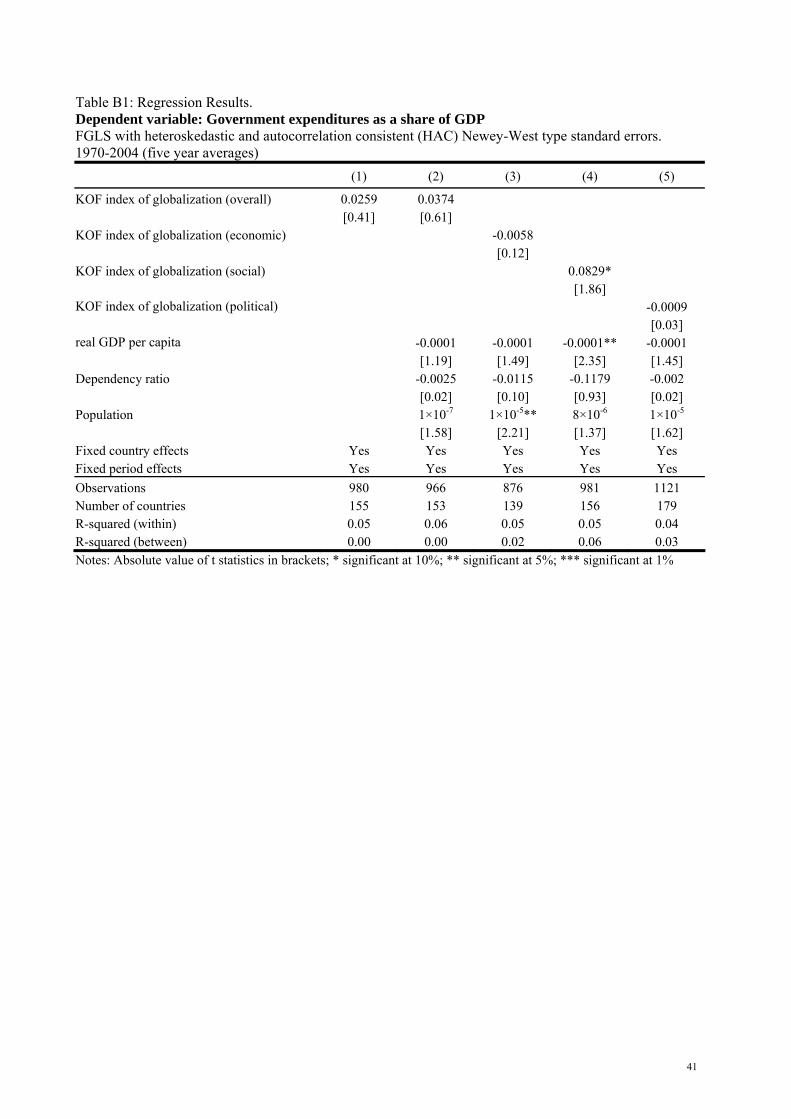
Table B1: Regression Results. Dependent variable: Government expenditures as a share of GDP FGLS with heteroskedastic and autocorrelation consistent (HAC) Newey-West type standard errors. 1970-2004 (five year averages)
(1) (2) (3) (4) (5)
KOF index of globalization (overall) 0.0259 0.0374 [0.41] [0.61] KOF index of globalization (economic) -0.0058 [0.12] KOF index of globalization (social) 0.0829* [1.86] KOF index of globalization (political) -0.0009 [0.03] real GDP per capita -0.0001 -0.0001 -0.0001** -0.0001 [1.19] [1.49] [2.35] [1.45] Dependency ratio -0.0025 -0.0115 -0.1179 -0.002 [0.02] [0.10] [0.93] [0.02] Population 1×10⁻⁷ 1×10⁻⁵** 8×10⁻⁶ 1×10⁻⁵ [1.58] [2.21] [1.37] [1.62] Fixed country effects Yes Yes Yes Yes Yes Fixed period effects Yes Yes Yes Yes Yes Observations 980 966 876 981 1121 Number of countries 155 153 139 156 179 R-squared (within) 0.05 0.06 0.05 0.05 0.04 R-squared (between) 0.00 0.00 0.02 0.06 0.03 Notes: Absolute value of t statistics in brackets; * significant at 10%; ** significant at 5%; *** significant at 1%

42
Table B2: Regression Results. Dependent variable: Government expenditures as a share of GDP FGLS with heteroskedastic and autocorrelation consistent (HAC) Newey-West type standard errors. 1970-2004 (five year averages) Cold War dummy variable included (1970-1989 period).
(1) (2) (3) (4) (5)
KOF index of globalization (overall) 0.6437 0.6359 [0.62] [0.61] KOF index of globalization (economic) -0.0926 [0.10] KOF index of globalization (social) 1.6066* [1.80] KOF index of globalization (political) 0.0802 [0.10] Cold War dummy variable -0.7082 -1.3919*** -1.2677 -1.8166*** -1.4158*** [0.94] [2.74] [1.53] [4.39] [3.07] KOF index of globalization (overall)* Cold War dummy variable 0.1781 0.0276 [0.90] [0.11] KOF index of globalization (economic)* Cold War dummy variable 0.1758 [0.62] KOF index of globalization (social)* Cold War dummy variable -0.3883 [1.51] KOF index of globalization (political)* Cold War dummy variable 0.1858 [0.67] real GDP per capita -0.0001 -0.0001 -0.0002*** -0.0001 [0.84] [0.78] [2.80] [1.09] Dependency ratio -0.0021 -0.0047 -0.1364 -0.0101 [0.02] [0.04] [1.10] [0.08] Population 9×10⁻⁶ 1×10⁻⁵** 1×10⁻⁵** 1×10⁻⁵** [1.56] [2.03] [2.23] [1.99] Fixed country effects Yes Yes Yes Yes Yes Fixed period effects Yes Yes Yes Yes Yes Observations 980 966 876 981 1121 Number of countries 155 153 139 156 179 R-squared (within) 0.05 0.06 0.06 0.05 0.04 R-squared (between) 0.00 0.00 0.01 0.07 0.01 Notes: Absolute value of t statistics in brackets; * significant at 10%; ** significant at 5%; *** significant at 1% Table B3: Marginal effects (min and max). Cold War dummy variable included (1970-1989 period).
(1) (2) (3) (4) (5)
overall
globalization overall
globalization economic
globalization social
globalization political
globalization 0.798 0.660 0.060 1.270 -0.134 1970-1989 period [0.75] [0.59] [0.06] [1.40] [0.17] 0.438 0.604 -0.295 2.055** 0.241 1990-2004 period [0.42] [0.60] [0.32] [2.14] [0.29]
Notes: Absolute value of t statistics in brackets; * significant at 10%; ** significant at 5%; *** significant at 1%

43
Table B4: Regression Results. Dependent variable: Government expenditures as a share of GDP FGLS with heteroskedastic and autocorrelation consistent (HAC) Newey-West type standard errors. 1970-2004 (five year averages) Democracy-Dictatorship dummy variable included.
(1) (2) (3) (4) (5)
KOF index of globalization (overall) 0.8369 0.9449 [0.73] [0.82] KOF index of globalization (economic) -0.0887 [0.09] KOF index of globalization (social) 2.1960** [2.05] KOF index of globalization (political) -0.0874 [0.11] Democracy 0.0869 0.0728 0.2327 -0.1169 0.6265 [0.19] [0.16] [0.44] [0.24] [0.92] KOF index of globalization (overall)* Democracy -0.1647 0.023 [0.40] [0.05] log KOF index of globalization (economic)* Democracy 0.0577 [0.11] KOF index of globalization (social)* Democracy -0.2372 [0.53] KOF index of globalization (political)* Democracy -0.0957 [0.15] real GDP per capita -0.0001 -0.0001 -0.0001** -0.0001 [1.33] [1.33] [2.36] [1.23] Dependency ratio -0.0138 -0.0238 -0.1365 0.0197 [0.13] [0.21] [1.05] [0.14] Population 9×10⁻⁶ 1×10-5* 8×10-6 1×10-5* [1.48] [1.98] [1.24] [1.95] Fixed country effects Yes Yes Yes Yes Yes Fixed period effects Yes Yes Yes Yes Yes Observations 952 941 864 949 1071 Number of countries 154 152 139 154 176 R-squared (within) 0.05 0.06 0.06 0.05 0.04 R-squared (between) 0.00 0.00 0.01 0.05 0.00 Notes: Absolute value of t statistics in brackets; * significant at 10%; ** significant at 5%; *** significant at 1% Table B5: Marginal effects (min and max). Democracy-Dictatorship dummy variable included.
(1) (2) (3) (4) (5)
overall
globalization overall
globalization economic
globalization social
globalization political
globalization 0.644 0.972 -0.021 1.918** -0.199 Democracy [0.63] [0.97] [0.02] [2.14] [0.17] 0.985 0.123** -0.140 2.408* -0.001 Dictatorship [0.72] [2.43] [0.11] [1.81] [0.00]
Notes: Absolute value of t statistics in brackets; * significant at 10%; ** significant at 5%; *** significant at 1%

44
Table B6: Regression Results. Dependent variable: Government expenditures as a share of GDP FGLS with heteroskedastic and autocorrelation consistent (HAC) Newey-West type standard errors. 1970-2004 (five year averages) OECD country dummy variable included.
(1) (2) (3) (4) (5)
KOF index of globalization (overall) 0.3547 0.3385 [0.32] [0.31] KOF index of globalization (economic) -0.5597 [0.56] KOF index of globalization (social) 1.5300 [1.50] KOF index of globalization (political) 0.0232 [0.03] OECD country -0.2976 -0.7774** -0.6635** -0.568 -0.9732* [0.86] [2.05] [2.20] [1.55] [1.90] KOF index of globalization (overall)* OECD country 0.1634 0.6446* [0.62] [1.75] KOF index of globalization (economic)* OECD country 0.9479** [2.41] KOF index of globalization (social)* OECD country 0.4593 [1.07] KOF index of globalization (political)* OECD country 0.7381** [2.04] real GDP per capita -0.0001* -0.0002** -0.0002** -0.0001* [1.72] [2.34] [2.27] [1.68] Dependency ratio 0.0347 0.0377 -0.0897 0.0065 [0.34] [0.35] [0.70] [0.05] Population 1×10-5* 1×10-5** 9×10⁻⁶ 1×10-5* [1.74] [2.45] [1.43] [1.70] Fixed country effects Yes Yes Yes Yes Yes Fixed period effects Yes Yes Yes Yes Yes Observations 980 966 876 981 1121 Number of countries 155 153 139 156 179 R-squared (within) 0.05 0.06 0.07 0.05 0.04 R-squared (between) 0.01 0.02 0.01 0.09 0.05 Notes: Absolute value of t statistics in brackets; * significant at 10%; ** significant at 5%; *** significant at 1% Table B7: Marginal effects (min and max). OECD country dummy variable included.
(1) (2) (3) (4) (5)
overall
globalization overall
globalization economic
globalization social
globalization political
globalization 0.765 1.958* 1.821** 2.684** 1.877* OECD [0.76] [1.89] [2.17] [2.46] [1.84] 0.290 0.082 -0.937 1.347 -0.270 Non-OECD [0.25] [0.07] [0.84] [1.21] [0.33]
Notes: Absolute value of t statistics in brackets; * significant at 10%; ** significant at 5%; *** significant at 1%

45
Table B8: Regression Results. Dependent variable: Government expenditures as a share of GDP FGLS with heteroskedastic and autocorrelation consistent (HAC) Newey-West type standard errors. 1970-2004 (five year averages) Globalization and real GDP per capita interacted.
(1) (2) (3) (4) (5)
log KOF index of globalization (overall) 0.6186 0.6186 [0.60] [0.61] log KOF index of globalization (economic) -0.0576 [0.06] log KOF index of globalization (social) 1.9613** [2.02] log KOF index of globalization (political) 0.0195 [0.03] log real GDP per capita -0.7293 -0.9422 -1.2713 -2.3269* -0.9879 [0.73] [0.82] [1.25] [1.82] [1.33] log KOF index of globalization (overall)* log real GDP per capita 0.1293 0.2252 [0.36] [0.52] log KOF index of globalization (economic)* log real GDP per capita 0.3103 [0.75] log KOF index of globalization (social)* log real GDP per capita 0.6886 [1.24] log KOF index of globalization (political)* log real GDP per capita 0.2597 [0.72] log Dependency ratio 0.0149 0.0084 -0.0836 0.0138 [0.13] [0.07] [0.64] [0.10] log Population 1×10-5* 1×10-5** 1×10-5* 1×10-7 [1.73] [2.56] [1.84] [1.53] Fixed country effects Yes Yes Yes Yes Yes Fixed period effects Yes Yes Yes Yes Yes Observations 980 966 876 981 1121 Number of countries 155 153 139 156 179 R-squared (within) 0.06 0.06 0.06 0.05 0.04 R-squared (between) 0.07 0.01 0.02 0.06 0.03 Notes: Absolute value of t statistics in brackets; * significant at 10%; ** significant at 5%; *** significant at 1% Table B9: Marginal effects (min and max). Globalization and real GDP per capita interacted.
(1) (2) (3) (4) (5)
overall
globalization overall
globalization economic
globalization social
globalization political
globalization 0.513 0.435 -0.311 1.399 -0.193 Low income (min) [0.50] [0.42] [0.34] [1.52] [0.23] 1.451 2.068 1.939 6.392 1.690 High income (max) [0.54] [0.67] [0.67] [1.60] [0.69]
Notes: Absolute value of t statistics in brackets; * significant at 10%; ** significant at 5%; *** significant at 1%
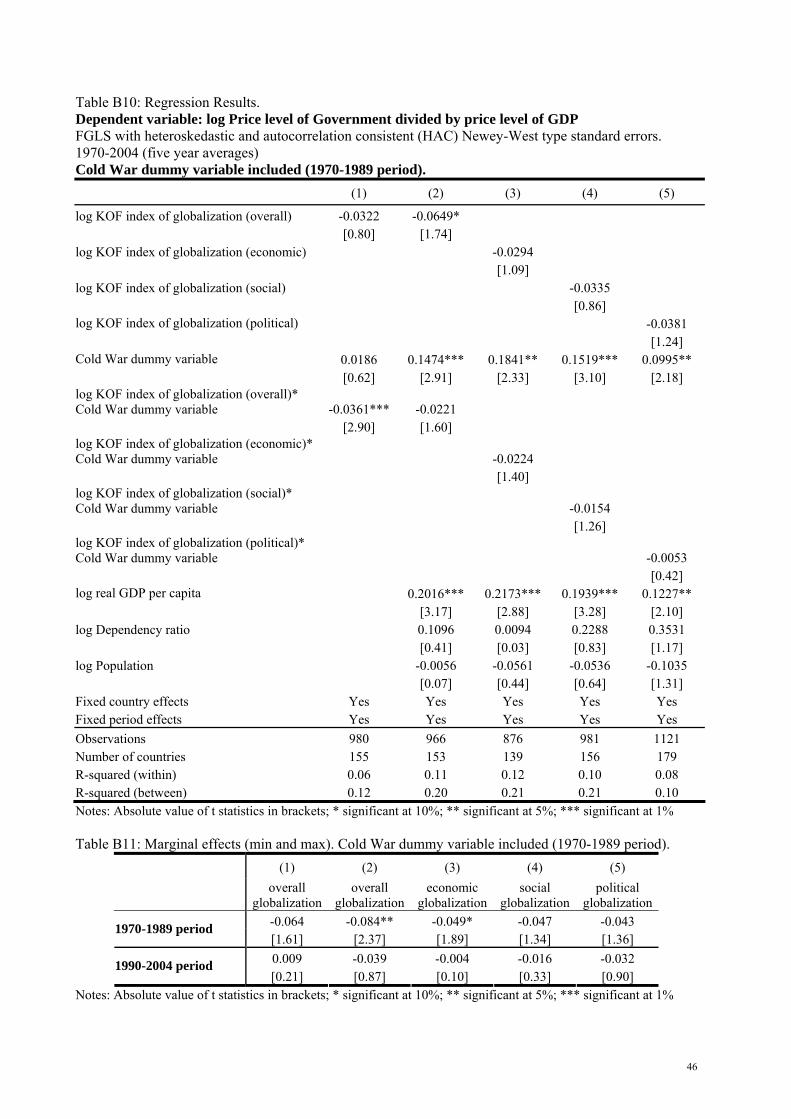
46
Table B10: Regression Results. Dependent variable: log Price level of Government divided by price level of GDP FGLS with heteroskedastic and autocorrelation consistent (HAC) Newey-West type standard errors. 1970-2004 (five year averages) Cold War dummy variable included (1970-1989 period).
(1) (2) (3) (4) (5)
log KOF index of globalization (overall) -0.0322 -0.0649* [0.80] [1.74] log KOF index of globalization (economic) -0.0294 [1.09] log KOF index of globalization (social) -0.0335 [0.86] log KOF index of globalization (political) -0.0381 [1.24] Cold War dummy variable 0.0186 0.1474*** 0.1841** 0.1519*** 0.0995** [0.62] [2.91] [2.33] [3.10] [2.18] log KOF index of globalization (overall)* Cold War dummy variable -0.0361*** -0.0221 [2.90] [1.60] log KOF index of globalization (economic)* Cold War dummy variable -0.0224 [1.40] log KOF index of globalization (social)* Cold War dummy variable -0.0154 [1.26] log KOF index of globalization (political)* Cold War dummy variable -0.0053 [0.42] log real GDP per capita 0.2016*** 0.2173*** 0.1939*** 0.1227** [3.17] [2.88] [3.28] [2.10] log Dependency ratio 0.1096 0.0094 0.2288 0.3531 [0.41] [0.03] [0.83] [1.17] log Population -0.0056 -0.0561 -0.0536 -0.1035 [0.07] [0.44] [0.64] [1.31] Fixed country effects Yes Yes Yes Yes Yes Fixed period effects Yes Yes Yes Yes Yes Observations 980 966 876 981 1121 Number of countries 155 153 139 156 179 R-squared (within) 0.06 0.11 0.12 0.10 0.08 R-squared (between) 0.12 0.20 0.21 0.21 0.10 Notes: Absolute value of t statistics in brackets; * significant at 10%; ** significant at 5%; *** significant at 1% Table B11: Marginal effects (min and max). Cold War dummy variable included (1970-1989 period).
(1) (2) (3) (4) (5)
overall
globalization overall
globalization economic
globalization social
globalization political
globalization -0.064 -0.084** -0.049* -0.047 -0.043 1970-1989 period [1.61] [2.37] [1.89] [1.34] [1.36] 0.009 -0.039 -0.004 -0.016 -0.032 1990-2004 period [0.21] [0.87] [0.10] [0.33] [0.90]
Notes: Absolute value of t statistics in brackets; * significant at 10%; ** significant at 5%; *** significant at 1%

47
Table B12: Regression Results. Dependent variable: log Price level of Government divided by price level of GDP FGLS with heteroskedastic and autocorrelation consistent (HAC) Newey-West type standard errors. 1970-2004 (five year averages) Democracy-Dictatorship dummy variable included.
(1) (2) (3) (4) (5)
log KOF index of globalization (overall) -0.0368 -0.0707** [0.96] [2.09] log KOF index of globalization (economic) -0.0481* [1.85] log KOF index of globalization (social) -0.0461 [1.38] log KOF index of globalization (political) -0.0540* [1.89] Democracy 0.0385* 0.0387* 0.0427* 0.0389* -0.0177 [1.73] [1.90] [1.95] [1.81] [0.66] log KOF index of globalization (overall)* Democracy 0.0535*** 0.0400** [2.82] [2.35] log KOF index of globalization (economic)* Democracy 0.0333** [2.13] log KOF index of globalization (social)* Democracy 0.0291* [1.76] log KOF index of globalization (political)* Democracy 0.0634** [2.03] log real GDP per capita 0.1965*** 0.2251*** 0.1932*** 0.1108* [3.23] [3.21] [3.24] [1.90] log Dependency ratio 0.1968 0.0396 0.3663 0.3511 [0.64] [0.12] [1.16] [1.08] log Population 0.0094 -0.0561 -0.0539 -0.0677 [0.12] [0.50] [0.65] [0.82] Fixed country effects Yes Yes Yes Yes Yes Fixed period effects Yes Yes Yes Yes Yes Observations 952 941 864 949 1071 Number of countries 154 152 139 154 176 R-squared (within) 0.06 0.11 0.13 0.10 0.10 R-squared (between) 0.01 0.21 0.17 0.21 0.13 Notes: Absolute value of t statistics in brackets; * significant at 10%; ** significant at 5%; *** significant at 1% Table B13: Marginal effects (min and max). Democracy-Dictatorship dummy variable included.
(1) (2) (3) (4) (5)
overall
globalization overall
globalization economic
globalization social
globalization political
globalization 0.026 -0.024 -0.009 -0.012 0.020 Democracy [0.59] [0.62] [0.32] [0.30] [0.38]
-0.084** -0.084** -0.078** -0.072** -0.111*** Dictatorship [1.99] [2.37] [2.44] [2.09] [3.26]
Notes: Absolute value of t statistics in brackets; * significant at 10%; ** significant at 5%; *** significant at 1%

48
Table B14: Regression Results. Dependent variable: log Price level of Government divided by price level of GDP FGLS with heteroskedastic and autocorrelation consistent (HAC) Newey-West type standard errors. 1970-2004 (five year averages) OECD country dummy variable included.
(1) (2) (3) (4) (5)
log KOF index of globalization (overall) -0.0483 -0.0753** [1.29] [2.18] log KOF index of globalization (economic) -0.0494* [1.91] log KOF index of globalization (social) -0.0444 [1.30] log KOF index of globalization (political) -0.0158 [0.48] OECD country 0.0091 0.0096 0.0300 0.0046 -0.0213 [0.24] [0.28] [0.90] [0.13] [0.65] log KOF index of globalization (overall)* OECD country 0.0484*** 0.0386** [3.37] [2.58] log KOF index of globalization (economic)* OECD country 0.0255 [1.65] log KOF index of globalization (social)* OECD country 0.0522*** [2.69] log KOF index of globalization (political)* OECD country 0.0711** [2.56] log real GDP per capita 0.2108*** 0.2247*** 0.2040*** 0.1191** [3.46] [3.14] [3.46] [2.04] log Dependency ratio 0.2256 0.0821 0.3663 0.3508 [0.76] [0.26] [1.22] [1.16] log Population 0.0157 -0.0437 -0.0051 -0.0795 [0.19] [0.34] [0.06] [1.01] Fixed country effects Yes Yes Yes Yes Yes Fixed period effects Yes Yes Yes Yes Yes Observations 980 966 876 981 1121 Number of countries 155 153 139 156 179 R-squared (within) 0.05 0.11 0.12 0.11 0.09 R-squared (between) 0.00 0.20 0.25 0.23 0.16 Notes: Absolute value of t statistics in brackets; * significant at 10%; ** significant at 5%; *** significant at 1% Table B15: Marginal effects (min and max). OECD country dummy variable included.
(1) (2) (3) (4) (5)
overall
globalization overall
globalization economic
globalization social
globalization political
globalization 0.073 0.022 0.015 0.087 0.163* OECD [1.43] [0.41] [0.33] [1.43] [1.92]
-0.066* -0.091*** -0.060** -0.065* -0.044 Non-OECD [1.77] [2.62] [2.21] [1.88] [1.39]
Notes: Absolute value of t statistics in brackets; * significant at 10%; ** significant at 5%; *** significant at 1%

49
Table B16: Regression Results. Dependent variable: log Price level of Government divided by price level of GDP FGLS with heteroskedastic and autocorrelation consistent (HAC) Newey-West type standard errors. 1970-2004 (five year averages) Globalization and real GDP per capita interacted.
(1) (2) (3) (4) (5)
log KOF index of globalization (overall) -0.0233 -0.0155 [0.64] [0.44] log KOF index of globalization (economic) 0.0085 [0.29] log KOF index of globalization (social) 0.0139 [0.37] log KOF index of globalization (political) -0.012 [0.45] log real GDP per capita 0.2435*** 0.2524*** 0.2676*** 0.2390*** 0.1617** [3.32] [3.31] [2.92] [3.29] [2.22] log KOF index of globalization (overall)* log real GDP per capita 0.0498*** 0.0545*** [3.31] [3.40] log KOF index of globalization (economic)* log real GDP per capita 0.0522** [2.45] log KOF index of globalization (social)* log real GDP per capita 0.0555*** [3.30] log KOF index of globalization (political)* log real GDP per capita 0.0409* [1.95] log Dependency ratio -0.0549 -0.1339 0.1349 0.26 [0.21] [0.51] [0.48] [0.90] log Population 0.0643 0.0572 0.0235 -0.0798 [0.78] [0.41] [0.28] [1.04] Fixed country effects Yes Yes Yes Yes Yes Fixed period effects Yes Yes Yes Yes Yes Observations 980 966 876 981 1121 Number of countries 155 153 139 156 179 R-squared (within) 0.13 0.13 0.14 0.12 0.09 R-squared (between) 0.23 0.16 0.19 0.22 0.16 Notes: Absolute value of t statistics in brackets; * significant at 10%; ** significant at 5%; *** significant at 1% Table B17: Marginal effects (min and max). Globalization and real GDP per capita interacted.
(1) (2) (3) (4) (5)
overall
globalization overall
globalization economic
globalization social
globalization political
globalization -0.172*** -0.179**** -0.148*** -0.152*** -0.134** Low income (min)
[3.77] [3.61] [2.72] [3.52] [1.98] 0.092 0.111* 0.130* 0.143** 0.083 High income (max) [1.55] [1.88] [1.86] [2.19] [1.49]
Notes: Absolute value of t statistics in brackets; * significant at 10%; ** significant at 5%; *** significant at 1%

50
Table B18: Regression Results. Dependent variable: Price level of Government divided by prive level of GDP FGLS with heteroskedastic and autocorrelation consistent (HAC) Newey-West type standard errors. 1970-2004 (five year averages)
(1) (2) (3) (4) (5)
KOF index of globalization (overall) 0.0032 0.0002 [1.61] [0.09] KOF index of globalization (economic) 0.0007 [0.57] KOF index of globalization (social) 0.0032** [2.07] KOF index of globalization (political) -0.0023 [1.46] real GDP per capita 1×10⁻⁵*** 1×10⁻⁵*** 1×10⁻⁵*** 1×10⁻⁵*** [4.05] [3.99] [3.94] [4.30] Dependency ratio 0.0048 0.0044 0.0044 0.0064 [1.15] [0.98] [1.08] [1.56] Population 5×10⁻⁷** 5×10⁻⁷** 4×10⁻⁷** 6×10⁻⁷*** [2.42] [2.56] [2.21] [2.78] Fixed country effects Yes Yes Yes Yes Yes Fixed period effects Yes Yes Yes Yes Yes Observations 980 966 876 981 1121 Number of countries 155 153 139 156 179 R-squared (within) 0.03 0.08 0.10 0.08 0.08 R-squared (between) 0.21 0.10 0.00 0.15 0.03 Notes: Absolute value of t statistics in brackets; * significant at 10%; ** significant at 5%; *** significant at 1%

51
Table B19: Regression Results. Dependent variable: Price level of Government divided by price level of GDP FGLS with heteroskedastic and autocorrelation consistent (HAC) Newey-West type standard errors. 1970-2004 (five year averages) Cold War dummy variable included (1970-1989 period).
(1) (2) (3) (4) (5)
KOF index of globalization (overall) 0.0151 0.0021 [0.47] [0.07] KOF index of globalization (economic) 0.0138 [0.58] KOF index of globalization (social) 0.0656** [2.05] KOF index of globalization (political) -0.0609 [1.61] Cold War dummy variable 0.0476* 0.0906*** 0.1281** 0.0904*** 0.0735*** [1.70] [3.17] [2.52] [3.59] [3.45] KOF index of globalization (overall)* Cold War dummy variable -0.0302*** -0.0009 [3.98] [0.07] KOF index of globalization (economic)* Cold War dummy variable 0.0018 [0.11] KOF index of globalization (social)* Cold War dummy variable -0.003 [0.36] KOF index of globalization (political)* Cold War dummy variable -0.0061 [0.62] real GDP per capita 1×10⁻⁵*** 2×10⁻⁵*** 1×10⁻⁵*** 1×10⁻⁵*** [2.89] [2.64] [3.37] [3.63] Dependency ratio 0.0048 0.0045 0.0043 0.0066* [1.13] [0.95] [1.04] [1.66] Population 5×10⁻⁷*** 5×10⁻⁷*** 4×10⁻⁷** 6×10⁻⁷** [2.70] [2.93] [2.35] [2.49] Fixed country effects Yes Yes Yes Yes Yes Fixed period effects Yes Yes Yes Yes Yes Observations 980 966 876 981 1121 Number of countries 155 153 139 156 179 R-squared (within) 0.05 0.08 0.10 0.08 0.08 R-squared (between) 0.00 0.09 0.12 0.14 0.03 Notes: Absolute value of t statistics in brackets; * significant at 10%; ** significant at 5%; *** significant at 1% Table B20: Marginal effects (min and max). Cold War dummy variable included (1970-1989 period).
(1) (2) (3) (4) (5)
overall
globalization overall
globalization economic
globalization social
globalization political
globalization -0.011 0.001 0.015 0.069** -0.066* 1970-1989 period [0.33] [0.04] [0.55] [2.03] [1.77] 0.050 0.003 0.012 0.063* -0.054 1990-2004 period [1.56] [0.10] [0.40] [1.96] [1.30]
Notes: Absolute value of t statistics in brackets; * significant at 10%; ** significant at 5%; *** significant at 1%

52
Table B21: Regression Results. Dependent variable: Price level of Government divided by price level of GDP FGLS with heteroskedastic and autocorrelation consistent (HAC) Newey-West type standard errors. 1970-2004 (five year averages) Democracy-Dictatorship dummy variable included.
(1) (2) (3) (4) (5)
KOF index of globalization (overall) 0.0188 -0.0188 [0.54] [0.55] KOF index of globalization (economic) -0.0017 [0.06] KOF index of globalization (social) 0.0517* [1.77] KOF index of globalization (political) -0.0606 [1.54] Democracy 0.0294 0.0401* 0.0453* 0.0351 -0.0086 [1.30] [1.71] [1.76] [1.57] [0.38] KOF index of globalization (overall)* Democracy 0.0539** 0.031 [2.52] [1.60] log KOF index of globalization (economic)* Democracy 0.0267 [1.39] KOF index of globalization (social)* Democracy 0.013 [0.81] KOF index of globalization (political)* Democracy 0.0518** [2.19] real GDP per capita 1×10⁻⁵*** 1×10⁻⁵*** 1×10⁻⁵*** 1×10⁻⁵*** [3.71] [3.78] [3.49] [4.15] Dependency ratio 0.0058 0.0047 0.0057 0.0065 [1.27] [1.02] [1.31] [1.49] Population 6×10⁻⁵** 6×10⁻⁷*** 5×10⁻⁷** 6×10⁻⁷** [2.46] [2.67] [2.44] [2.44] Fixed country effects Yes Yes Yes Yes Yes Fixed period effects Yes Yes Yes Yes Yes Observations 952 941 864 949 1071 Number of countries 154 152 139 154 176 R-squared (within) 0.05 0.09 0.11 0.09 0.10 R-squared (between) 0.05 0.05 0.07 0.12 0.03 Notes: Absolute value of t statistics in brackets; * significant at 10%; ** significant at 5%; *** significant at 1% Table B22: Marginal effects (min and max). Democracy-Dictatorship dummy variable included.
(1) (2) (3) (4) (5)
overall
globalization overall
globalization economic
globalization social
globalization political
globalization 0.082** 0.017 0.030 0.067** -1×10⁻⁵ Democracy [2.33] [0.57] [1.09] [2.02] [0.00] -0.030 -0.047 -0.026 0.040 -0.107** Dictatorship [0.66] [1.03] [1.08] [1.19] [2.16]
Notes: Absolute value of t statistics in brackets; * significant at 10%; ** significant at 5%; *** significant at 1%
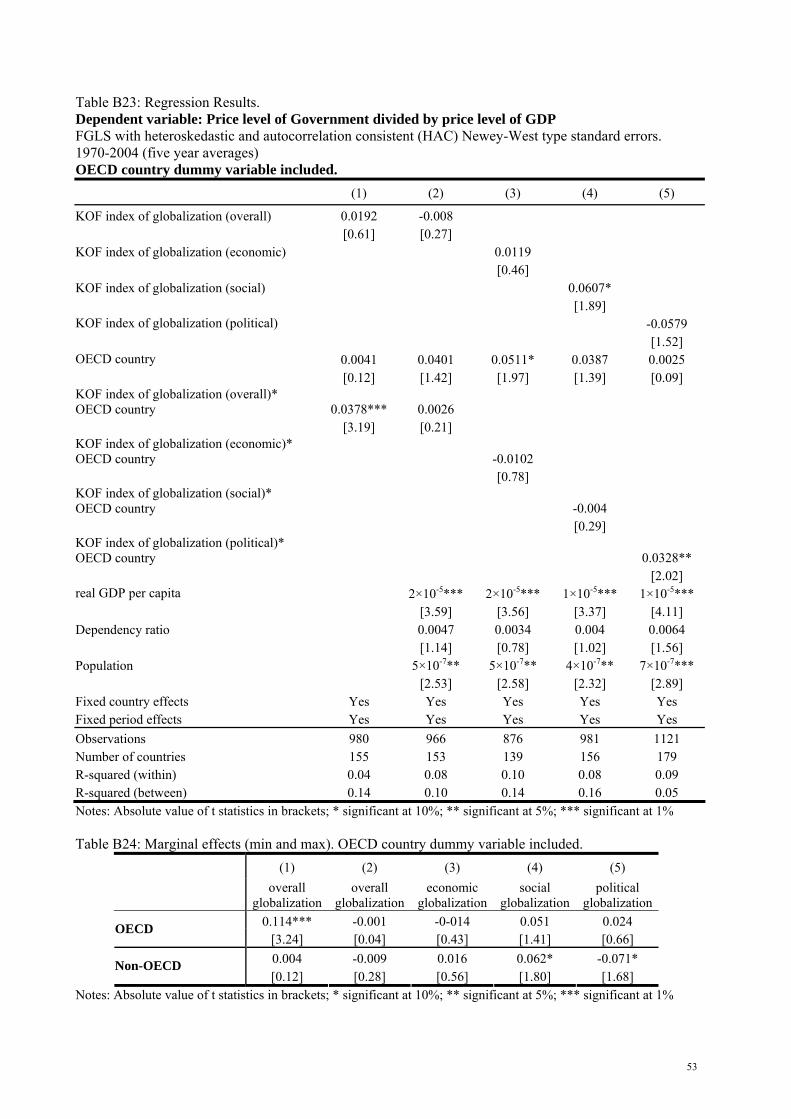
53
Table B23: Regression Results. Dependent variable: Price level of Government divided by price level of GDP FGLS with heteroskedastic and autocorrelation consistent (HAC) Newey-West type standard errors. 1970-2004 (five year averages) OECD country dummy variable included.
(1) (2) (3) (4) (5)
KOF index of globalization (overall) 0.0192 -0.008 [0.61] [0.27] KOF index of globalization (economic) 0.0119 [0.46] KOF index of globalization (social) 0.0607* [1.89] KOF index of globalization (political) -0.0579 [1.52] OECD country 0.0041 0.0401 0.0511* 0.0387 0.0025 [0.12] [1.42] [1.97] [1.39] [0.09] KOF index of globalization (overall)* OECD country 0.0378*** 0.0026 [3.19] [0.21] KOF index of globalization (economic)* OECD country -0.0102 [0.78] KOF index of globalization (social)* OECD country -0.004 [0.29] KOF index of globalization (political)* OECD country 0.0328** [2.02] real GDP per capita 2×10⁻⁵*** 2×10⁻⁵*** 1×10⁻⁵*** 1×10⁻⁵*** [3.59] [3.56] [3.37] [4.11] Dependency ratio 0.0047 0.0034 0.004 0.0064 [1.14] [0.78] [1.02] [1.56] Population 5×10⁻⁷** 5×10⁻⁷** 4×10⁻⁷** 7×10⁻⁷*** [2.53] [2.58] [2.32] [2.89] Fixed country effects Yes Yes Yes Yes Yes Fixed period effects Yes Yes Yes Yes Yes Observations 980 966 876 981 1121 Number of countries 155 153 139 156 179 R-squared (within) 0.04 0.08 0.10 0.08 0.09 R-squared (between) 0.14 0.10 0.14 0.16 0.05 Notes: Absolute value of t statistics in brackets; * significant at 10%; ** significant at 5%; *** significant at 1% Table B24: Marginal effects (min and max). OECD country dummy variable included.
(1) (2) (3) (4) (5)
overall
globalization overall
globalization economic
globalization social
globalization political
globalization 0.114*** -0.001 -0-014 0.051 0.024 OECD
[3.24] [0.04] [0.43] [1.41] [0.66] 0.004 -0.009 0.016 0.062* -0.071* Non-OECD [0.12] [0.28] [0.56] [1.80] [1.68]
Notes: Absolute value of t statistics in brackets; * significant at 10%; ** significant at 5%; *** significant at 1%
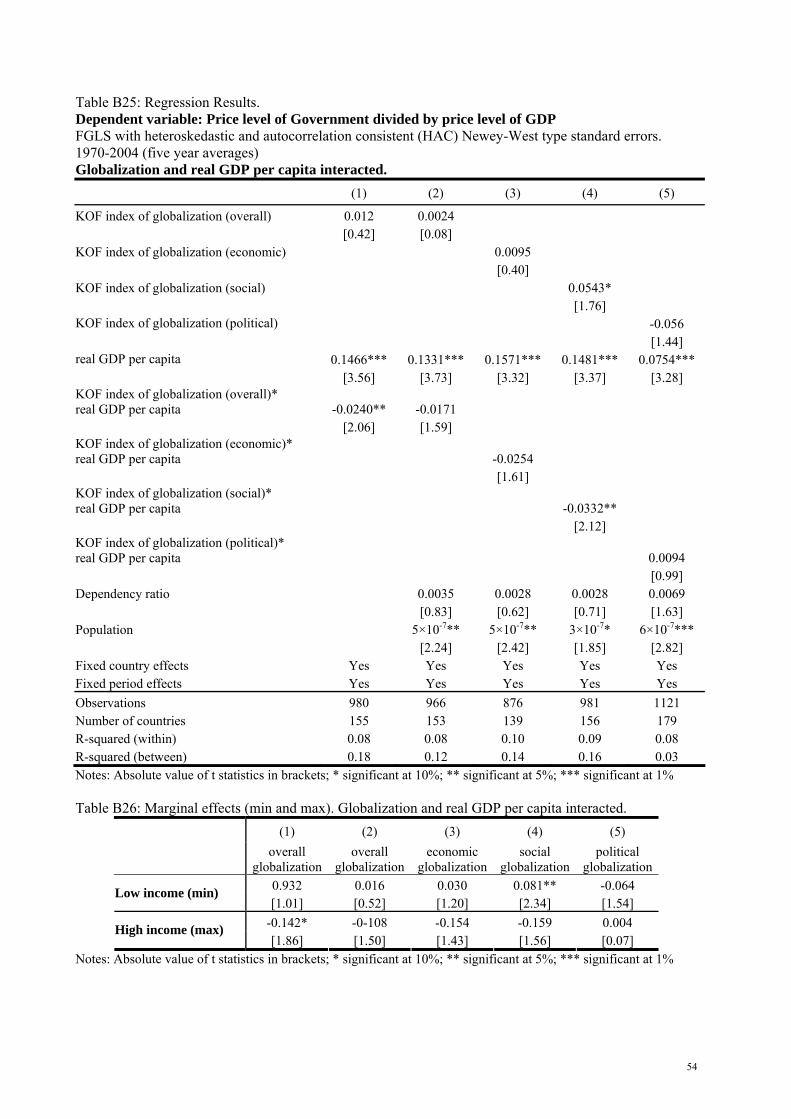
54
Table B25: Regression Results. Dependent variable: Price level of Government divided by price level of GDP FGLS with heteroskedastic and autocorrelation consistent (HAC) Newey-West type standard errors. 1970-2004 (five year averages) Globalization and real GDP per capita interacted.
(1) (2) (3) (4) (5)
KOF index of globalization (overall) 0.012 0.0024 [0.42] [0.08] KOF index of globalization (economic) 0.0095 [0.40] KOF index of globalization (social) 0.0543* [1.76] KOF index of globalization (political) -0.056 [1.44] real GDP per capita 0.1466*** 0.1331*** 0.1571*** 0.1481*** 0.0754*** [3.56] [3.73] [3.32] [3.37] [3.28] KOF index of globalization (overall)* real GDP per capita -0.0240** -0.0171 [2.06] [1.59] KOF index of globalization (economic)* real GDP per capita -0.0254 [1.61] KOF index of globalization (social)* real GDP per capita -0.0332** [2.12] KOF index of globalization (political)* real GDP per capita 0.0094 [0.99] Dependency ratio 0.0035 0.0028 0.0028 0.0069 [0.83] [0.62] [0.71] [1.63] Population 5×10⁻⁷** 5×10⁻⁷** 3×10-7* 6×10-7*** [2.24] [2.42] [1.85] [2.82] Fixed country effects Yes Yes Yes Yes Yes Fixed period effects Yes Yes Yes Yes Yes Observations 980 966 876 981 1121 Number of countries 155 153 139 156 179 R-squared (within) 0.08 0.08 0.10 0.09 0.08 R-squared (between) 0.18 0.12 0.14 0.16 0.03 Notes: Absolute value of t statistics in brackets; * significant at 10%; ** significant at 5%; *** significant at 1% Table B26: Marginal effects (min and max). Globalization and real GDP per capita interacted.
(1) (2) (3) (4) (5)
overall
globalization overall
globalization economic
globalization social
globalization political
globalization 0.932 0.016 0.030 0.081** -0.064 Low income (min) [1.01] [0.52] [1.20] [2.34] [1.54]
-0.142* -0-108 -0.154 -0.159 0.004 High income (max) [1.86] [1.50] [1.43] [1.56] [0.07]
Notes: Absolute value of t statistics in brackets; * significant at 10%; ** significant at 5%; *** significant at 1%

55
Figure B1: log Size of government and log overall KOF index of globalization 1970-2004 (five year averages).
12
34
5lo
g G
over
nmen
t exp
endi
ture
s as
a s
hare
of G
DP
2.5 3 3.5 4 4.5log overall KOF index of globalization
Correlation coefficient: 0.01. Source: Penn World Tables 6.2 and Dreher (2006) and Dreher et al. (2008a) Figure B2: log Size of government and log KOF index of economic globalization 1970-2004 (five year averages).
12
34
5lo
g G
over
nmen
t exp
endi
ture
s as
a s
hare
of G
DP
2 2.5 3 3.5 4 4.5log KOF index of economic globalization
Correlation coefficient: 0.07. Source: Penn World Tables 6.2 and Dreher (2006) and Dreher et al. (2008a)

56
Figure B3: log Size of government and log KOF index of social globalization 1970-2004 (five year averages).
12
34
5lo
g G
over
nmen
t exp
endi
ture
s as
a s
hare
of G
DP
2 2.5 3 3.5 4 4.5log KOF index of social globalization
Correlation coefficient: 0.03. Source: Penn World Tables 6.2 and Dreher (2006) and Dreher et al. (2008a) Figure B4: log Size of government and log KOF index of political globalization 1970-2004 (five year averages).
12
34
5lo
g G
over
nmen
t exp
endi
ture
s as
a s
hare
of G
DP
0 1 2 3 4 5log KOF index of political globalization
Correlation coefficient: -0.18. Source: Penn World Tables 6.2 and Dreher (2006) and Dreher et al. (2008a)

57
Figure B5: log Price level of Government divided by price level of GDP and log overall KOF index of globalization 1970-2004 (five year averages).
-2-1
01
2lo
g R
elat
ive
pric
e of
gov
ernm
ent e
xpen
ditu
res
2.5 3 3.5 4 4.5log overall KOF index of globalization
Correlation coefficient: 0.38. Source: Penn World Tables 6.2 and Dreher (2006) and Dreher et al. (2008a) Figure B6: log Price level of Government divided by price level of GDP and log KOF index of economic globalization 1970-2004 (five year averages).
-2-1
01
2lo
g R
elat
ive
pric
e of
gov
ernm
ent e
xpen
ditu
res
2 2.5 3 3.5 4 4.5log KOF index of economic globalization
Correlation coefficient: 0.32. Source: Penn World Tables 6.2 and Dreher (2006) and Dreher et al. (2008a)

58
Figure B7: log Price level of Government divided by price level of GDP and log KOF index of social globalization 1970-2004 (five year averages).
-2-1
01
2lo
g R
elat
ive
pric
e of
gov
ernm
ent e
xpen
ditu
res
2 2.5 3 3.5 4 4.5log KOF index of social globalization
Correlation coefficient: 0.36. Source: Penn World Tables 6.2 and Dreher (2006) and Dreher et al. (2008a) Figure B8: log Price level of Government divided by price level of GDP and log KOF index of political globalization 1970-2004 (five year averages).
-2-1
01
2lo
g R
elat
ive
pric
e of
gov
ernm
ent e
xpen
ditu
res
0 1 2 3 4 5log KOF index of political globalization
Correlation coefficient: 0.13. Source: Penn World Tables 6.2 and Dreher (2006) and Dreher et al. (2008a)

59
Figure B9: Price level of Government divided by price level of GDP and overall KOF index of globalization 1970-2004 (five year averages).
01
23
4R
elat
ive
pric
e of
gov
ernm
ent e
xpen
ditu
res
20 40 60 80 100overall KOF index of globalization
Correlation coefficient: 0.31. Source: Penn World Tables 6.2 and Dreher (2006) and Dreher et al. (2008a) Figure B10: Price level of Government divided by price level of GDP and KOF index of economic globalization 1970-2004 (five year averages).
01
23
4R
elat
ive
pric
e of
gov
ernm
ent e
xpen
ditu
res
0 20 40 60 80 100KOF index of economic globalization
Correlation coefficient: 0.28. Source: Penn World Tables 6.2 and Dreher (2006) and Dreher et al. (2008a)

60
Figure B11: Price level of Government divided by price level of GDP and KOF index of social globalization 1970-2004 (five year averages).
01
23
4R
elat
ive
pric
e of
gov
ernm
ent e
xpen
ditu
res
0 20 40 60 80 100KOF index of social globalization
Correlation coefficient: 0.28. Source: Penn World Tables 6.2 and Dreher (2006) and Dreher et al. (2008a) Figure B12: Price level of Government divided by price level of GDP and KOF index of political globalization 1970-2004 (five year averages).
01
23
4R
elat
ive
pric
e of
gov
ernm
ent e
xpen
ditu
res
0 20 40 60 80 100KOF index of political globalization
Correlation coefficient: 0.16. Source: Penn World Tables 6.2 and Dreher (2006) and Dreher et al. (2008a)


Related Documents