Veterinaria Italiana, 45 (4), 491‐499 © IZS A&M 2009 www.izs.it/vet_italiana Vol. 45 (4), Vet Ital 491 The Global Livestock Impact Mapping System (GLIMS) as a tool for animal health applications Gianluca Franceschini (1) , Timothy P. Robinson (1) , Karl Morteo (1) , Dario Dentale (1) , William Wint (2) & Joachim Otte (1) Summary Recent concerns expressed by various national and international organisations about global livestock sector development and its consequences on the environment and on human and animal health suggest the need to reinforce efforts to monitor and collect more accurate and detailed statistics on livestock. Modern technologies for the organisation, analysis, dissemination and presentation of data and results enhance the contribution that these statistics can make towards the planning of efficient and sustainable animal production and health interventions. To this end, the Food and Agriculture Organization Animal Production and Health Division (FAO‐AGA) has developed the Global Livestock Impact Mapping System (GLIMS). GLIMS provides a repository for sub‐national data pertaining to the livestock sector and produces and distributes, through various channels and formats, a number of global public products, namely: the Gridded Livestock of the World (GLW), mapping the spatial distribution of the main livestock species, the Global Livestock Production and Health Atlas (GLiPHA), disseminating sub‐national geo‐referenced statistics, and the AGA Livestock Sector Briefs, which are concise national reports on the livestock sector. These products have a variety of applications. The authors focus attention on applications in the field of animal health, both to increase knowledge of the occurrence of livestock diseases and to assess their impact. Keywords Animal health, Application, FAO, Food and Agriculture Organization, Geographic information system, GIS, GLIMS, GLiPHA, Global Livestock Impact Mapping System, Livestock, Modelling, Global Livestock Production and Health Atlas, Livestock distribution modelling. Il Sistema di Mappatura Globale dell’Impatto del Bestiame (GLIMS) come strumento per applicazioni sulla salute animale Riassunto Le recenti preoccupazioni espresse da varie organiz‐ zazioni nazionali e internazionali sullo sviluppo globale del settore zootecnico e le sue conseguenze sull’ambiente e sulla salute umana e animale, suggeriscono la necessitá di raddoppiare gli sforzi per monitorare e raccogliere statistiche accurate e dettagliate sul bestiame. Le recenti tecnologie per l’organizzazione, l’analisi, la disseminazione e la presentazione di dati e risultati aumentano il contributo che queste statistiche possono dare per la pianificazione di interventi, efficienti e duraturi, in favore della produzione e salute animale. Per questo scopo la Divisione della Produzione e Salute Animale dell’Organizzazione delle Nazioni Unite per l’Alimentazione e l’Agricoltura (FAO‐AGA) ha sviluppato il Sistema di Mappatura Globale dell’Impatto del Bestiame (GLIMS). Il Sistema (1) Food and Agriculture Organization of the United Nations, Via delle Terme di Caracalla, 00153 Rome, Italy [email protected] (2) Environmental Research Group Oxford, Department of Zoology, University of Oxford, South Parks Road, Oxford OX1 3PS, United Kingdom

Welcome message from author
This document is posted to help you gain knowledge. Please leave a comment to let me know what you think about it! Share it to your friends and learn new things together.
Transcript
Veterinaria Italiana, 45 (4), 491‐499
© IZS A&M 2009 www.izs.it/vet_italiana Vol. 45 (4), Vet Ital 491
The Global Livestock Impact Mapping System
(GLIMS) as a tool for animal health applications
Gianluca Franceschini(1), Timothy P. Robinson(1), Karl Morteo(1), Dario Dentale(1), William Wint(2) & Joachim Otte(1)
Summary Recent concerns expressed by various national and international organisations about global livestock sector development and its consequences on the environment and on human and animal health suggest the need to reinforce efforts to monitor and collect more accurate and detailed statistics on livestock. Modern technologies for the organisation, analysis, dissemination and presentation of data and results enhance the contribution that these statistics can make towards the planning of efficient and sustainable animal production and health interventions. To this end, the Food and Agriculture Organization Animal Production and Health Division (FAO‐AGA) has developed the Global Livestock Impact Mapping System (GLIMS). GLIMS provides a repository for sub‐national data pertaining to the livestock sector and produces and distributes, through various channels and formats, a number of global public products, namely: the Gridded Livestock of the World (GLW), mapping the spatial distribution of the main livestock species, the Global Livestock Production and Health Atlas (GLiPHA), disseminating sub‐national geo‐referenced statistics, and the AGA Livestock Sector Briefs, which are concise national reports on the livestock sector. These products have a variety of applications. The authors focus attention on applications in the field of animal health, both to increase knowledge of the occurrence of livestock diseases and to assess their impact.
Keywords Animal health, Application, FAO, Food and Agriculture Organization, Geographic information system, GIS, GLIMS, GLiPHA, Global Livestock Impact Mapping System, Livestock, Modelling, Global Livestock Production and Health Atlas, Livestock distribution modelling.
Il Sistema di Mappatura Globale dell’Impatto del Bestiame (GLIMS) come strumento per applicazioni sulla salute animale Riassunto Le recenti preoccupazioni espresse da varie organiz‐zazioni nazionali e internazionali sullo sviluppo globale del settore zootecnico e le sue conseguenze sull’ambiente e sulla salute umana e animale, suggeriscono la necessitá di raddoppiare gli sforzi per monitorare e raccogliere statistiche accurate e dettagliate sul bestiame. Le recenti tecnologie per l’organizzazione, l’analisi, la disseminazione e la presentazione di dati e risultati aumentano il contributo che queste statistiche possono dare per la pianificazione di interventi, efficienti e duraturi, in favore della produzione e salute animale. Per questo scopo la Divisione della Produzione e Salute Animale dell’Organizzazione delle Nazioni Unite per l’Alimentazione e l’Agricoltura (FAO‐AGA) ha sviluppato il Sistema di Mappatura Globale dell’Impatto del Bestiame (GLIMS). Il Sistema
(1) Food and Agriculture Organization of the United Nations, Via delle Terme di Caracalla, 00153 Rome, Italy
[email protected] (2) Environmental Research Group Oxford, Department of Zoology, University of Oxford, South Parks Road,
Oxford OX1 3PS, United Kingdom
The Global Livestock Impact Mapping System (GLIMS) Gianluca Franceschini, Timothy P. Robinson, Karl Morteo, as a tool for animal health applications Dario Dentale, William Wint & Joachim Otte
492 Vol. 45 (4), Vet Ital www.izs.it/vet_italiana © IZS A&M 2009
fornisce un archivio per dati a livello sub‐nazionale relativi al settore del bestiame. GLIMS produce e distribuisce, attraverso vari canali e formati, un numero di prodotti pubblici globali: il Gridded Livestock of the World (GLW) che mappa la distribuzione spaziale delle principali specie di bestiame; l’Atlante Globale della Produzione e Salute del Bestiame (GLiPHA) che distribuisce statistiche georiferite e sub‐nazionali; i Fascicoli sul Settore Animale che rappresentano rapporti nazionali concisi sul settore del bestiame. Questi prodotti sono soggetti a varie applicazioni, l’articolo si concentra su quelle inerenti la salute animale, sia per migliorare la conoscenza della presenza delle malattie zootecniche che per determinare il loro impatto.
Parole chiave Atlante Globale della Produzione e Salute del Bestiame, FAO, GLIMS, GLiPHA, Modello di distribuzione del bestiame, Organizzazione delle Nazioni Unite per l’Alimentazione e l’Agricoltura, Salute animale, Sistema di Mappatura Globale dell’Impatto del Bestiame.
Scope and content of the Global Livestock Impact Mapping System Monitoring and understanding the dynamics of the distribution of livestock, in relation to production systems and people and at various geographic scales, is essential for designing interventions to ensure the sustainability of livestock production which includes the management of animal diseases. Scarcity and inaccuracy of basic information poses severe limitations to the effectiveness and sustainability of any targeted intervention. The Global Livestock Impact Mapping System (GLIMS), hosted within the Food and Agriculture Organization (FAO) Livestock Production and Health Division (AGA), aims to fill this gap by compiling and disseminating statistical information on livestock distribution and related topics through a number of different channels. Geo‐referenced data, collated from a diverse range of sources, are validated and uploaded into the GLIMS data warehouse in a standard format. Derived
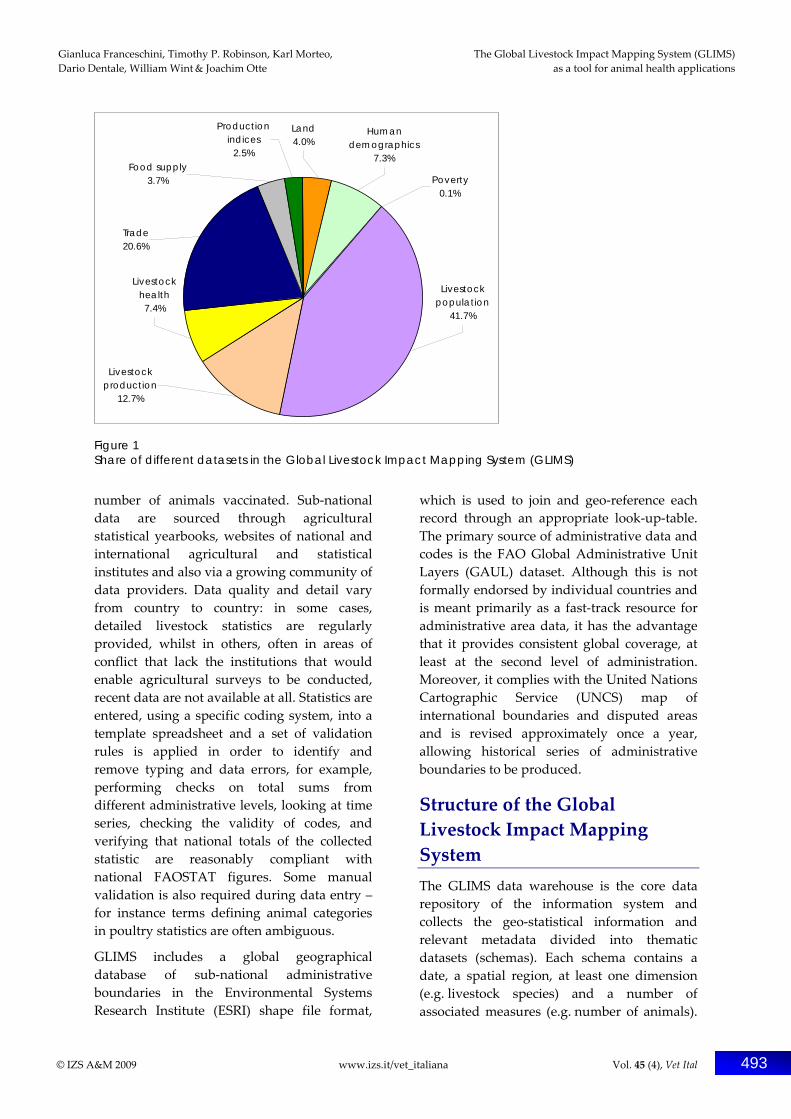
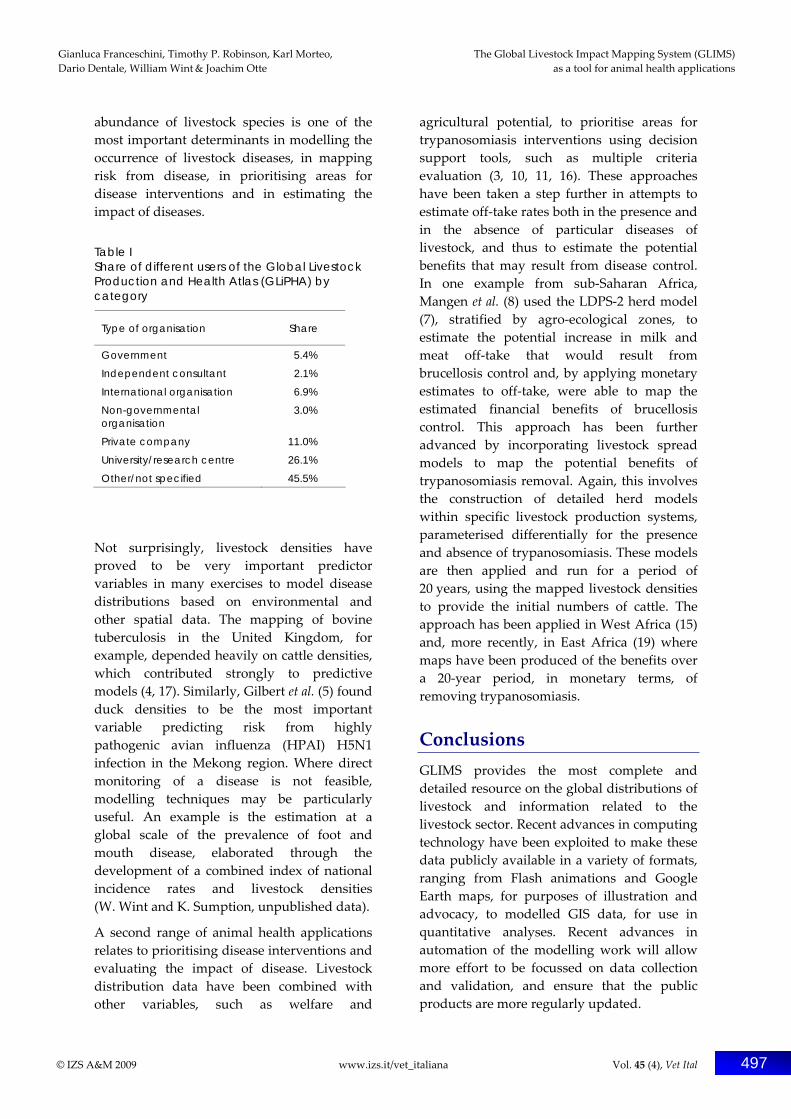
statistics are calculated and can then be visualised and distributed as tabular data, charts and digital maps in graphic and geographic information system (GIS) formats. GLIMS is thematically divided into a number of datasets for individual countries at national and sub‐national levels of detail, GIS files of administrative boundaries, references to data providers and sources of data and a community of users. Statistical data cover the following topics: land human demographics poverty livestock population livestock products health trade food supply production indices. Data sets now comprise sub‐national statistics on 125 countries dating from 1980 to the present. Among these statistics, livestock population figures (numbers per administrative region) are best represented (Fig. 1). Livestock species are further divided into sub‐groups (e.g. cattle are subdivided into those used for dairy, beef and draught purposes). Trade, food supply and production indices are only reported at national level, while the other statistics may be reported both at national and sub‐national levels.
Data acquisition and input Data input requires a number of steps to be executed sequentially. The first stage involves data acquisition from available official sources. For national livestock statistics, an automatic link is established with FAOSTAT (A), the FAO corporate statistical database, through which data are harvested yearly and uploaded directly into GLIMS. The main source of animal disease data is the World Organisation for Animal Health (Office International des Épizooties: OIE) World Animal Health Information System (WAHIS) – formerly ‘Handistatus II’. This provides information for each country on reported disease occurrence: numbers of outbreaks, cases and deaths and
Gianluca Franceschini, Timothy P. Robinson, Karl Morteo, The Global Livestock Impact Mapping System (GLIMS) Dario Dentale, William Wint & Joachim Otte as a tool for animal health applications
© IZS A&M 2009 www.izs.it/vet_italiana Vol. 45 (4), Vet Ital 493
Human demographics
7.3%Food supply
3.7%
Production indices
2.5%
Land4.0%
Poverty0.1%
Livestock production
12.7%
Livestock health7.4%
Livestock population
41.7%
Trade20.6%
Figure 1 Share of different datasets in the Global Livestock Impact Mapping System (GLIMS)
number of animals vaccinated. Sub‐national data are sourced through agricultural statistical yearbooks, websites of national and international agricultural and statistical institutes and also via a growing community of data providers. Data quality and detail vary from country to country: in some cases, detailed livestock statistics are regularly provided, whilst in others, often in areas of conflict that lack the institutions that would enable agricultural surveys to be conducted, recent data are not available at all. Statistics are entered, using a specific coding system, into a template spreadsheet and a set of validation rules is applied in order to identify and remove typing and data errors, for example, performing checks on total sums from different administrative levels, looking at time series, checking the validity of codes, and verifying that national totals of the collected statistic are reasonably compliant with national FAOSTAT figures. Some manual validation is also required during data entry – for instance terms defining animal categories in poultry statistics are often ambiguous.
GLIMS includes a global geographical database of sub‐national administrative boundaries in the Environmental Systems Research Institute (ESRI) shape file format,
which is used to join and geo‐reference each record through an appropriate look‐up‐table. The primary source of administrative data and codes is the FAO Global Administrative Unit Layers (GAUL) dataset. Although this is not formally endorsed by individual countries and is meant primarily as a fast‐track resource for administrative area data, it has the advantage that it provides consistent global coverage, at least at the second level of administration. Moreover, it complies with the United Nations Cartographic Service (UNCS) map of international boundaries and disputed areas and is revised approximately once a year, allowing historical series of administrative boundaries to be produced.
Structure of the Global Livestock Impact Mapping System The GLIMS data warehouse is the core data repository of the information system and collects the geo‐statistical information and relevant metadata divided into thematic datasets (schemas). Each schema contains a date, a spatial region, at least one dimension (e.g. livestock species) and a number of associated measures (e.g. number of animals).
The Global Livestock Impact Mapping System (GLIMS) Gianluca Franceschini, Timothy P. Robinson, Karl Morteo, as a tool for animal health applications Dario Dentale, William Wint & Joachim Otte
494 Vol. 45 (4), Vet Ital www.izs.it/vet_italiana © IZS A&M 2009
A set of rules is implemented to calculate densities, growth rates etc. every time new data are uploaded into the system. The content of the data warehouse is managed through a back‐end application that provides all the necessary services to store, calculate, search, analyse and retrieve data. It is based on KIDS‐3g, the third generation key indicator data system (KIDS) (B) technology, a scalable framework developed by the FAO for the management of thematic information. This new version of KIDS comprises a radical departure from previous releases since it allows individual users and applications to access only those services and features needed, without knowledge of the underlying technology. KIDS3g integrates several open‐source products and technologies such as: PostgreSQL: a sophisticated open‐source object‐relational database management system
PostGIS: a spatial database extension for PostgreSQL
JBoss AS: a free software/open‐source Java EE‐based application server
Geoserver: an open source software server written in Java for sharing and editing geospatial data
Apache Jackrabbit: a fully conforming implementation of the Content Repository for Java Technology API (Java content repository: JCR).
Public products The GLIMS data warehouse is not available for public access because the FAO does not have the authority freely to disseminate all the data held. In addition, the warehouse is under continuous development. However, detailed and regularly updated views into the database are made available for public access via a number of specialist products.
Global Livestock Production and Health Atlas The Global Livestock Production and Health Atlas (GLiPHA) (C) is a highly interactive electronic atlas that provides a scaleable overview of spatial and temporal variation in
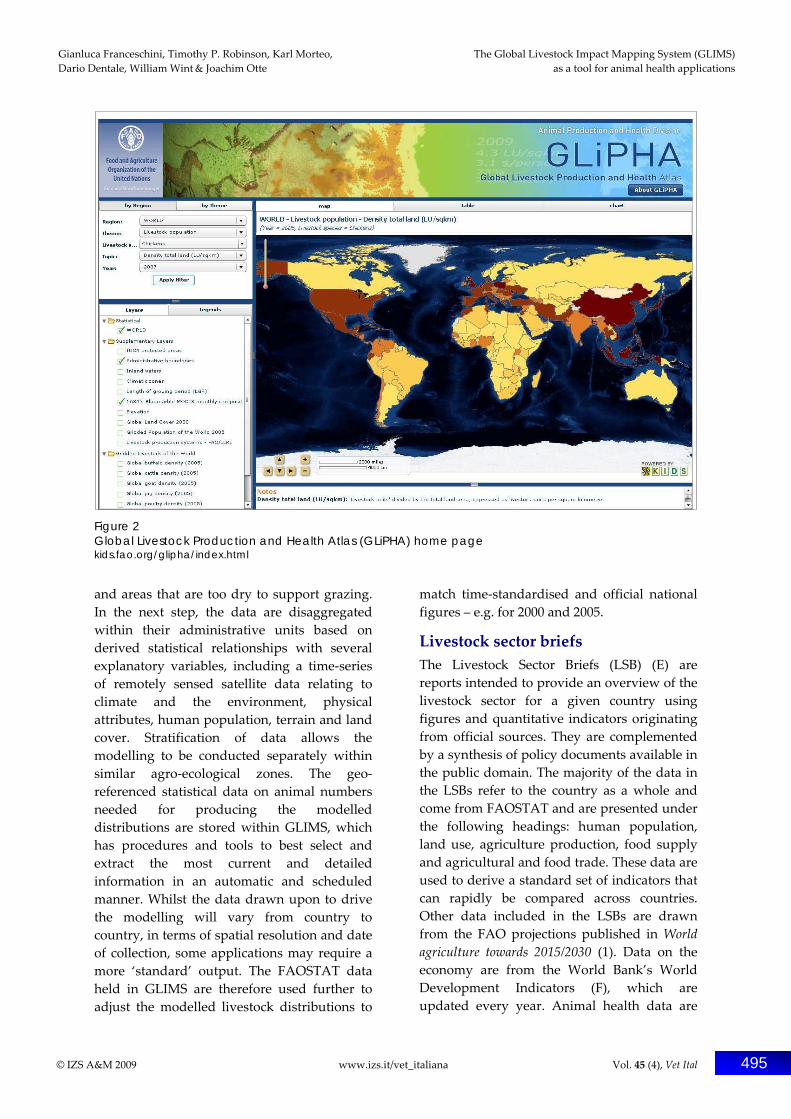
quantitative information related to animal production and health. It shows a selected set of the GLIMS data content which consists mainly of information at the first sub‐national administrative level. It uses the Adobe Flex technology, a software development kit released by Adobe Systems for the development and deployment of cross‐platform rich internet applications (RIA) based on Adobe Flash. With this technology, it is possible to realise highly interactive Web applications, similar to desktop applications, and to combine the different services provided by the KIDS framework in multiple workflows that support specific user activities. Data in GLiPHA are visually represented in a map window through the selection of a number of menus that filter the results hierarchically (Fig. 2). The user can start browsing either from a specific region or from a specific theme. A world project showing country‐level information is available by default, whilst national projects, presenting data at sub‐national level, can also be selected. Data presented in the map window can be enhanced by adding thematic back‐drops and overlays such as administrative boundaries, climate, population, land cover, livestock production systems and modelled livestock distributions. Data can be also displayed in tabular and chart formats.
Gridded Livestock of the World The Gridded Livestock of the World (GLW) (D) is a set of GIS data of the global distribution of the main livestock species (13, 18). It is currently produced at a spatial resolution of 3 minutes of arc, but is in the process of being upgraded to 30 seconds (approximately 1 km) and units are expressed in animal densities per square kilometre. The first step in the production of GLW is the collection and geo‐referencing of statistical data on animal numbers by administrative units, at the highest level of detail available. The data are then converted to densities based on areas within the administrative units that are deemed suitable for livestock of each type to occur. Ruminant livestock, for example, are excluded from water bodies, cities, deep forest
Gianluca Franceschini, Timothy P. Robinson, Karl Morteo, The Global Livestock Impact Mapping System (GLIMS) Dario Dentale, William Wint & Joachim Otte as a tool for animal health applications
© IZS A&M 2009 www.izs.it/vet_italiana Vol. 45 (4), Vet Ital 495
Figure 2 Global Livestock Production and Health Atlas (GLiPHA) home page kids.fao.org/glipha/index.html
and areas that are too dry to support grazing. In the next step, the data are disaggregated within their administrative units based on derived statistical relationships with several explanatory variables, including a time‐series of remotely sensed satellite data relating to climate and the environment, physical attributes, human population, terrain and land cover. Stratification of data allows the modelling to be conducted separately within similar agro‐ecological zones. The geo‐referenced statistical data on animal numbers needed for producing the modelled distributions are stored within GLIMS, which has procedures and tools to best select and extract the most current and detailed information in an automatic and scheduled manner. Whilst the data drawn upon to drive the modelling will vary from country to country, in terms of spatial resolution and date of collection, some applications may require a more ‘standard’ output. The FAOSTAT data held in GLIMS are therefore used further to adjust the modelled livestock distributions to
match time‐standardised and official national figures – e.g. for 2000 and 2005.
Livestock sector briefs The Livestock Sector Briefs (LSB) (E) are reports intended to provide an overview of the livestock sector for a given country using figures and quantitative indicators originating from official sources. They are complemented by a synthesis of policy documents available in the public domain. The majority of the data in the LSBs refer to the country as a whole and come from FAOSTAT and are presented under the following headings: human population, land use, agriculture production, food supply and agricultural and food trade. These data are used to derive a standard set of indicators that can rapidly be compared across countries. Other data included in the LSBs are drawn from the FAO projections published in World agriculture towards 2015/2030 (1). Data on the economy are from the World Bank’s World Development Indicators (F), which are updated every year. Animal health data are
The Global Livestock Impact Mapping System (GLIMS) Gianluca Franceschini, Timothy P. Robinson, Karl Morteo, as a tool for animal health applications Dario Dentale, William Wint & Joachim Otte
496 Vol. 45 (4), Vet Ital www.izs.it/vet_italiana © IZS A&M 2009
taken from the OIE. These are official data supplied by member nations.
Data dissemination GLIMS products are distributed via various routes and in various formats. Statistical information at national level and at the first level of administration (province, in many cases) is available and exportable in the form of Excel spreadsheets through the GLiPHA application. GLW outputs are disseminated in several formats to meet diverse requirements for visualisation and analysis. The main channel for distribution is the ’GeoNetwork opensource’ application, which integrates, in a free environment, the management of spatially referenced resources and their related metadata. The FAO, with a view to improving access to and use of spatial data and information, manages its own GeoNetwork node (G). GIS data on livestock distributions can be downloaded directly from FAO GeoNetwork, at a spatial resolution of 3 minutes of arc, in ESRI grid format for each of the main livestock species. Available data include reported livestock densities and predicted livestock densities, adjusted to match: the original sub‐national totals national totals for the years 2000 and 2005, as reported in FAOSTAT; supplementary layers (water bodies, administrative boundaries, mask of areas deemed unsuitable for livestock) and metadata information, compliant with the ISO‐19115 standard format.
FAO GeoNetwork provides additional tools allowing data managers to distribute the GLW datasets as Web Map Services (WMS). WMS is an OpenGis standard of the Open Geospatial Consortium (OGC) for managing requests from one or more Internet Map Server to a client application. The client receives a static image when addressing a request to the map server that can be displayed and overlaid on other layers within dedicated browser applications or GIS software. In this way, the GIS data are not directly distributed but may
still be used as geo‐referenced backdrop images. A similar concept is applied to the distribution of GLW maps in a ‘.kml’ format, which can then be opened in Google Earth. These functionalities, which have only recently become available, allow not only a wider range of choices for displaying maps but further improve data sharing, enhancing the possibility for validation of the results. Finally, the GLW maps are also distributed as Flash animation files – mainly for graphic design and presentation purposes. LSBs for individual countries are accessible as ‘.pdf’ documents through the divisional AGA Website.
Users and applications Users accessing GLIMS products may come with very different purposes in mind, and the diversity of potential applications is reflected in the number of different output formats, such as high resolution maps, tables, charts, multimedia presentations and GIS data. Table I categorises the 1 700 users who registered an expression of interest in livestock‐related statistics from the home page of GLiPHA in 2007. Apart the ‘unspecified’ group, universities and research centres account for the largest share – about a quarter of all users – followed by private companies and international organisations. Currently, from a Web traffic analysis, more than a thousand of external users access GLiPHA monthly. GLIMS livestock and related information have been widely used in a number of fields. Production applications include the use of gridded cattle data to estimate milk and meat off‐take and draught power output in sub‐Saharan Africa (9). Environmental applications include the use of these livestock distributions in Asia to estimate nutrient loading in the environment that result from livestock (2) and the contribution of methane emissions to climatic changes in African livestock (6). The livestock maps have even been used as an input variable in environmental poverty mapping in Uganda (12, 14), but by far the largest number of applications is in the field of livestock health. The spatial distribution and
Gianluca Franceschini, Timothy P. Robinson, Karl Morteo, The Global Livestock Impact Mapping System (GLIMS) Dario Dentale, William Wint & Joachim Otte as a tool for animal health applications
© IZS A&M 2009 www.izs.it/vet_italiana Vol. 45 (4), Vet Ital 497
abundance of livestock species is one of the most important determinants in modelling the occurrence of livestock diseases, in mapping risk from disease, in prioritising areas for disease interventions and in estimating the impact of diseases.
Table I Share of different users of the Global Livestock Production and Health Atlas (GLiPHA) by category
Type of organisation Share
Government 5.4%
Independent consultant 2.1%
International organisation 6.9%
Non-governmental organisation
3.0%
Private company 11.0%
University/research centre 26.1%
Other/not specified 45.5%
Not surprisingly, livestock densities have proved to be very important predictor variables in many exercises to model disease distributions based on environmental and other spatial data. The mapping of bovine tuberculosis in the United Kingdom, for example, depended heavily on cattle densities, which contributed strongly to predictive models (4, 17). Similarly, Gilbert et al. (5) found duck densities to be the most important variable predicting risk from highly pathogenic avian influenza (HPAI) H5N1 infection in the Mekong region. Where direct monitoring of a disease is not feasible, modelling techniques may be particularly useful. An example is the estimation at a global scale of the prevalence of foot and mouth disease, elaborated through the development of a combined index of national incidence rates and livestock densities (W. Wint and K. Sumption, unpublished data).
A second range of animal health applications relates to prioritising disease interventions and evaluating the impact of disease. Livestock distribution data have been combined with other variables, such as welfare and
agricultural potential, to prioritise areas for trypanosomiasis interventions using decision support tools, such as multiple criteria evaluation (3, 10, 11, 16). These approaches have been taken a step further in attempts to estimate off‐take rates both in the presence and in the absence of particular diseases of livestock, and thus to estimate the potential benefits that may result from disease control. In one example from sub‐Saharan Africa, Mangen et al. (8) used the LDPS‐2 herd model (7), stratified by agro‐ecological zones, to estimate the potential increase in milk and meat off‐take that would result from brucellosis control and, by applying monetary estimates to off‐take, were able to map the estimated financial benefits of brucellosis control. This approach has been further advanced by incorporating livestock spread models to map the potential benefits of trypanosomiasis removal. Again, this involves the construction of detailed herd models within specific livestock production systems, parameterised differentially for the presence and absence of trypanosomiasis. These models are then applied and run for a period of 20 years, using the mapped livestock densities to provide the initial numbers of cattle. The approach has been applied in West Africa (15) and, more recently, in East Africa (19) where maps have been produced of the benefits over a 20‐year period, in monetary terms, of removing trypanosomiasis.
Conclusions GLIMS provides the most complete and detailed resource on the global distributions of livestock and information related to the livestock sector. Recent advances in computing technology have been exploited to make these data publicly available in a variety of formats, ranging from Flash animations and Google Earth maps, for purposes of illustration and advocacy, to modelled GIS data, for use in quantitative analyses. Recent advances in automation of the modelling work will allow more effort to be focussed on data collection and validation, and ensure that the public products are more regularly updated.

The Global Livestock Impact Mapping System (GLIMS) Gianluca Franceschini, Timothy P. Robinson, Karl Morteo, as a tool for animal health applications Dario Dentale, William Wint & Joachim Otte
498 Vol. 45 (4), Vet Ital www.izs.it/vet_italiana © IZS A&M 2009
Diseases of livestock and interventions for their control, affect different groups of livestock keepers in different ways, and this highlights two closely related areas for further development in GLIMS. Firstly, virtually all quantitative applications of the livestock distributions have used some kind of farming systems map by which to stratify the analyses. More explicit links between the livestock population data and the specific farming systems in which the livestock are kept are needed to sharpen these analyses. Secondly, and in the particular context of the FAO, it is not livestock diseases per se that are of interest
but their impacts and the impact of interventions on national economies and, more importantly, on livelihoods. An accurate assessment of the impacts of animal diseases on people’s livelihoods calls for a better understanding of the roles livestock plays in people’s livelihoods portfolios.
Acknowledgements The authors would like to thank Federica Chiozza, Valentina Ercoli, Valentina Dellabella and Gino Sarnieri for their contribution to data acquisition and development of GLIMS.
References 1. Food and Agriculture Organization of the United Nations (FAO) 2002. World agriculture: towards
2015/2030 (J. Bruinsma, ed.). FAO, Rome, 432 pp (www.fao.org/docrep/004/Y3557E/y3557e00.HTM accessed on 3 December 2009).
2. Gerber P., Chilonda P., Franceschini G. & Menzi H. 2005. Geographical determinants and environmental implications of livestock production intensification in Asia. Bioresour Technol, 96, 263-276.
3. Gerber P.J., Carsjens G.J., Pak-uthai T. & Robinson T.P. 2008. Decision support for spatially targeted livestock policies: diverse examples from Uganda and Thailand. Agr Syst, 96, 37-51.
4. Gilbert M., Mitchell A., Bourn D., Mawdsley J., Clifton-Hadley R. & Wint W. 2005. Cattle movements and bovine tuberculosis in Great Britain. Nature, 435, 491-496.
5. Gilbert M., Xiao X., Pfeiffer D.U., Epprecht M., Boles S., Czarnecki C., Chaitaweesub P., Kalpravidh W., Minh P.Q., Otte J., Martin V. & Slingenbergh J. 2008. Mapping H5N1 highly pathogenic avian influenza risk in Southeast Asia. Proc Natl Acad Sci USA, 105 (12), 4769-4774.
6. Herrero M., Thornton P.K., Kruska R. & Reid R.S. 2008. Systems dynamics and the spatial distribution of methane emissions from African domestic ruminants to 2030. Agr Ecosyst, Environ, 126, 122-137.
7. Lalonde L.-G. & Sukigara T. 1997. LDPS-2 User’s guide. Food and Agriculture Organization of the United Nations (FAO), Animal Production and Health Division, Rome (www.fao.org/docrep/X5878E/ x5878e00.htm accessed on 3 December 2009).
8. Mangen M.-J., Otte J., Pfeiffer D. & Chilonda P. 2002. Bovine brucellosis in sub-Saharan Africa: estimation of sero-prevalence and impact on meat and milk offtake potential. Food and Agriculture Organization of the United Nations (FAO), Livestock Information and Policy Branch, Rome, Livestock Policy Discussion Paper No. 8, 53 pp (ftp.fao.org/docrep/fao/009/ag274e/ ag274e00.pdf accessed on 3 December 2009).
9. Otte J. & Chilonda P. 2002. Cattle and small ruminant production systems in sub-Saharan Africa: a systematic review. Food and Agriculture Organization of the United Nations (FAO), Livestock Information Sector Analysis and Policy Branch, FAO Agriculture Department, Rome, 98 pp (www.fao.org/docrep/005/y4176e/y4176e00.HTM accessed on 3 December 2009).
10. Robinson T.P. 1998. Geographic information systems and the selection of priority areas for control of tsetse-transmitted trypanosomiasis in Africa. Parasitol Today, 14, 457-461.
11. Robinson T.P., Harris R.S., Hopkins J.S. & Williams B.G. 2002. An example of decision support for trypanosomiasis control using a geographic information system in eastern Zambia. Int J Geogr Inf Sci, 16, 345-360.
12. Robinson T.P., Emwanu T. & Rogers D. 2007. Environmental approaches to poverty mapping: an example from Uganda. Inf Dev, 23, 205-215.
13. Robinson T.P., Franceschini G. & Wint W. 2007. The Food and Agriculture Organization’s Gridded Livestock of the World. Vet Ital 43 (3), 745-751 (www.izs.it/vet_italiana/2007/43_3/745_751.pdf accessed on 3 December 2009).
Gianluca Franceschini, Timothy P. Robinson, Karl Morteo, The Global Livestock Impact Mapping System (GLIMS) Dario Dentale, William Wint & Joachim Otte as a tool for animal health applications
© IZS A&M 2009 www.izs.it/vet_italiana Vol. 45 (4), Vet Ital 499
14. Rogers D., Emwanu T. & Robinson T. 2006. Poverty mapping in Uganda: an analysis using remotely sensed and other environmental data. Food and Agriculture Organization of the United Nations (FAO), Pro-Poor Livestock Policy Initiative Working Paper 36, 67 pp (www.fao.org/ag/againfo/ programmes/en/pplpi/docarc/wp36.pdf accessed on 3 December 2009).
15. Shaw A., Hendrickx G., Gilbert M., Mattioli R., Codjia V., Dao B., Diall O., Mahama C., Sidibé I. & Wint W. 2006. Mapping the benefits: a new decision tool for tsetse and trypanosomosis interventions. Research Report. Department for International Development (DFID), Animal Health Programme, Centre for Tropical Veterinary Medicine, University of Edinburgh and Food and Agriculture Organization (FAO) Programme Against African Trypanosomiasis. FAO, Rome, 154 pp.
16. Symeonakis E., Robinson T. & Drake N. 2006. GIS and multiple-criteria evaluation for the optimisation of tsetse fly eradication programmes. Environ Monit Assess 124, 89-103.
17. Wint G.R.W., Robinson T.P., Bourn D.M., Durr P.A., Hay S.I., Randolph S.E. & Rogers D.J. 2002. Mapping bovine tuberculosis in Great Britain using environmental data. Trends Microbiol, 19, 441-444.
18. Wint W. & Robinson T. 2007. Gridded livestock of the world, 2007. Food and Agriculture Organization of the United Nations (FAO), Animal Production and Health Division, Rome, 131 pp (www.fao.org/ docrep/010/a1259e/a1259e00.HTM accessed on 3 December 2009).
19. Wint G.R.W., Shaw A., Cecchi G., Mattioli R., Alemu T., Eregae M., Mugasi S., Abdi A.M., Munyua S.J.M. & Robinson T.P. 2011. Mapping the benefits. II. Extending the concept of monetary maps of trypanosomiasis losses from western to eastern Africa. In Proc. 30th Meeting of the International Scientific Council for Trypanosomiasis Research and Control (ISCTRC), 21-25 September 2009, Kampala. African Union, Department of Rural Economy and Agriculture, Nairobi (in press).
Websites A. FAOSTAT: faostat.fao.org B. Key indicator data system (KIDS): kids.fao.org C Global Livestock Production and Health Atlas (GLiPHA): kids.fao.org/glipha/index.html D. The Gridded Livestock of the World (GLW): www.fao.org/ag/againfo/resources/en/glw/home.html E. Livestock Sector Briefs (LSB): www.fao.org/ag/againfo/resources/en/pubs_sap.html F. World Bank’s World Development Indicators: www.worldbank.org/data G. GeoNetwork: www.fao.org/geonetwork/srv/en/main.home
Related Documents