Electronic copy available at: http://ssrn.com/abstract=1958833 1 THE GLOBAL INNOVATION SCOREBOARD 2008: THE DYNAMICS OF THE INNOVATIVE PERFORMANCES OF COUNTRIES This report was prepared by Daniele Archibugi, Mario Denni* and Andrea Filippetti (Italian National Research Council, CNR-IRPPS) Measuring Innovation Thematic Paper March, 2009 Disclaimer: the views expressed in this report do not necessarily reflect the opinion of the European Commission and in no way commit the institution. *The first part of this Thematic Paper has been prepared with the contribution of Mario Denni.

Welcome message from author
This document is posted to help you gain knowledge. Please leave a comment to let me know what you think about it! Share it to your friends and learn new things together.
Transcript
Electronic copy available at: http://ssrn.com/abstract=1958833
1
THE GLOBAL INNOVATION SCOREBOARD 2008:
THE DYNAMICS OF THE INNOVATIVE
PERFORMANCES OF COUNTRIES
This report was prepared by
Daniele Archibugi, Mario Denni* and Andrea Filippetti
(Italian National Research Council, CNR-IRPPS)
Measuring Innovation Thematic Paper
March, 2009
Disclaimer: the views expressed in this report do not necessarily reflect the opinion of the European Commission and in no way commit the institution.
*The first part of this Thematic Paper has been prepared with the contribution of Mario Denni.

Electronic copy available at: http://ssrn.com/abstract=1958833
2
Contents
Executive summary
FIRST PART – THE TECHNOLOGICAL CAPABILITIES OF NATIONS: THE STATE OF
THE ART OF THE SYNTHETIC INDICATORS
1. Introduction 6
2. In search of the theory underlying the measurement of technological
capabilities 7
3. An analysis of the most used indicators 12
4. Indicators in comparison: do they tell the same story? 18
5. Comparing national composite indicators with R&D intensity 23
6. Instead of a conclusion: uses and abuses of macro-indicators of
technological capabilities 25
References 28
SECOND PART – THE GLOBAL INNOVATION SCOREBOARD 2008: THE DYNAMICS
OF THE INNOVATIVE PERFORMANCES OF COUNTRIES
1. Introduction 32
2. Global Innovation Scoreboard: aims and methodology 32
3. Global Innovation Scoreboard: main findings 34
4. The dynamic of the innovative performances of countries 41
5. Innovation and economic performances 45
6. The innovative performances of the BRIC countries 46
7. Conclusions: beyond the triadic framework 46
Annex 50

3
Executive summary
The Thematic Paper is divided into two main parts. The first, methodological in nature, is an attempt to carry out a comparison between nine different exercise of measuring technological capabilities at country level using composite indicators. The second develops the new Global Innovation Scoreboard with a revised methodology aiming at providing an overview on the main trends, results and determinants of the innovative performance of countries across the world.
Composite synthetic indicators of the technological capabilities of nations have been used more frequently over the last years becoming a sort of Olympic medal table of the innovation race. The European Commission, specialised United Nations agencies, the World Bank, the World Economic Forum, and individual scholars have developed several of these measurement tools at macroeconomic level. All these indicators are based on a variety of statistical sources in order to capture the multidimensional nature of technological change. This part of the Thematic Paper reviews these various exercises and: i) it brings into light the explicit and implicit assumptions on the nature of technological change; ii) it discusses their pros and cons; iii) explores the consistency among the results achieved.
Our results show that the final rankings at the country level are fairly consistent, but significant discrepancies for some nations emerge. Also when compared with R&D expenses, composite indicators are better able to capture some relevant differences across countries in terms of technological capabilities.
In the second part the new Global Innovation Scoreboard 2008 (GIS 2008) is developed. It aims at providing an overview on the main trends, results and determinants of the innovative performance of countries across the world. Compared to the 2008 European Innovation Scoreboard, the GIS 2008 uses older data (1995 – 2005 compared with 2002-07 in the EIS) and a reduced set of indicators (9 indicators compared to 29 in the EIS). One of the main results obtained in the First Part of the Thematic Paper is the fact that the accumulation of technological capabilities is a structural phenomenon within the economic systems. Consequently, to address the dynamics of this process a ten-year period of time is taken in consideration in the GIS 2008.
The results show that over the last decade there is a stable group of countries which are firmly within the top performers, which includes Sweden, Switzerland, Finland, Israel and Japan. These countries base their innovative performance mainly on the innovative activities of their business sector. However, behind the leaders, there is a large group of countries which has been remarkably narrowing the gap with respect to the leaders, and it includes emerging countries like the Republic of Korea and Singapore. At the bottom of the ranking there are emerging countries, such as three of the four BRIC countries, Brazil, China and India, which have undertaken a catching-up process by considerably increasing their innovative performances.
Regarding EU countries, they perform at all the levels of performance across the GIS, i.e. there are Member States at the top and bottom of the rankings. However, although there is clearly a strong structural component to innovation performance, we do observe transitions over time. In particular several of the EU15 have moved from the 3rd to the 2nd group (UK, Austria, Belgium) and a number of lower performing EU Member States have moved from the 4th to 3rd groupings (Spain, Italy, Czech Republic, Estonia, Portugal, Greece, Lithuania, Hungary). On the other hand, some of the EU countries have shown the slowest rate of growth in the GIS index (e.g. Romania, Slovak Republic, Latvia, Bulgaria, Poland) (cf. Figure 7) although this analysis precedes the effects of the EU enlargements in 2004 and 2007.

4
Overall, the GIS 2008 findings confirm the need for policy makers to start thinking beyond the triadic division – the United States, Europe and Japan - also when they deal with technological capabilities and innovative performances.

5
FIRST PART
THE TECHNOLOGICAL CAPABILITIES OF NATIONS:
THE STATE OF THE ART OF SYNTHETIC INDICATORS
6
1. Introduction
There are at least three good reasons which justify the efforts to collecting systematic statistical data on national technological capabilities and innovation performances [1]:
1. Theoretical analysis: indicators of technological capabilities can be used to increase and broaden our knowledge of technological change and to test innovation theories. There is a large consensus within economic and social theories about the fact that technological change represents the engine of development and even of progress. More specifically, technological capabilities are considered the determinant of economic growth, productivity, competitiveness, and employment. Appropriate measurement tools are needed to test and quantify these hypotheses.
2. Source of information for public policies: policy makers need to locate their country position in the global landscape to identify national strengths and weaknesses, to secure technological opportunities, and to assess the effectiveness of the policies adopted [2,3]. Reading and interpreting statistics of technological change provides a fundamental source of information to design and carry out an effective innovation policy.
3. Input for firms’ strategies: managers use innovation studies to have a deeper understanding about technological advance, especially in a period of fierce internal and international competition. Data on the technological capability of different countries allow a better understanding about geographical contexts in which firms can develop and establish their innovative activities.
We will focus on a specific instrument for measuring technological capabilities: synthetic indicators at the country level. The production of technological capabilities indicators has recently been spreading both at micro and macroeconomic levels: data collection and surveys are systematically developed at firm, industry, technological field and country level (for reviews, see [4,5]). Within this renovated effort a larger attention has been paid to compare the technological activities of different nations. Various United Nations specialised agencies, including UNDP, UNIDO and UNCTAD, the World Bank, business associations, like the World Economic Forum, and individual scholars have collected data about technological capabilities at national level. Also the European Commission has provided appropriate tools such as the European Innovation Scoreboard and the Global Innovation Scoreboard, in particular for evaluating the progresses of the Lisbon Strategy, focusing on a smaller and less diverse group of countries (see European Commission [6,7,8]).
What are the features of these synthetic indicators? They take into account the various aspects which constitute the technological capability of a country and aggregate them into a single figure. They are typical macroeconomic indicators aiming at comparing the positions of different countries and their changes. Their merit is to provide a clear and immediate image of a country’s ranking, while the drawback is to sacrifice the inherent complexity of the process of knowledge production and distribution.
Mass media, economists, politicians and managers are the main users of these indicators. The media use them since the public opinion is captured by the direct ranking of countries: these rankings are often seen as a sort of technological Olympic medal table which ignites the spirits of supporters. The economists use them to scrutinize the relationship between technological capabilities and other economic phenomena such as competitiveness, trade, growth and productivity. Policy makers and managers are also keen to read and comment on these data, but they are less able to guide their actions on the ground of these indicators, perhaps because they are too aggregate to be connected to specific policies and strategies.
The objectives of the first part of the Thematic Paper are:

7
a. to provide a comprehensive exposition of the main exercises of measurement of technological capabilities based on composite indicators;
b. to gather evidence about the results of these exercises;
c. to test the consistency of the results achieved by these exercises and to assess their usefulness and limits.
The next section will discuss the theoretical assumptions on which the synthetic indicators of technological capabilities are grounded. Section 2 will describe the data sources, methodologies, and statistics used by each approach. We will then analyse in section 3 the results obtained, comparing the positions of different countries according to each synthetic indicator, seeking and discussing the causes of any significant difference. Section 4 contains a comparison between the ranking provided by the various composite indicators and the most widely used simple indicator, namely the ratio R&D to GDP. In Section 5 we compare composite indicators with R&D expenditures. Section 6 concludes.
2. In search of the theory underlying the measurement of technological capabilities
2.1 Uncovering the implicit assumptions
The theoretical assumptions underlying these macroeconomic measures of technological capabilities are not always explicit. What are the implicit assumptions encountered in the majority of the exercises here reviewed?
The first methodological assumption is related to entrusting the use of “countries” as unit of analysis: countries are made of differentiated areas and regions and they are far from being homogeneous. Using one single figure to capture the overall technological capabilities of such different entities hides several simplifications. Macroeconomic analysis is used to this type of simplifications: the GDP is used daily even if its real economic meaning is often questioned because it aggregates very heterogeneous phenomena. When we consider the aggregate rate of unemployment, we disregard the fact that in some regions there can be full employment, while in others unemployment rate can be far higher than the national average. Similar problems are encountered when technological capabilities are measured: there are important differences across regions, industries and companies within the same country. The possibility of inter-country comparisons is based on the implicit assumption that a national system of innovation is somehow capable to distribute knowledge across the whole country [9,10].
The second assumption regards the usefulness of international comparisons. Differences in technological capabilities are very broad [2,11]. Thus one can doubt about the usefulness to comparing such different countries like Sweden and India, United States and Ghana because each of these countries is characterized by technological capabilities that are so different to be often disparate. James [12] stresses that the selection of data to calculate composite indicators is often biased and it does not reflect adequately national differences in development stages. Comparisons became more significant if they are carried out between more similar national systems of innovation, like Sweden and Denmark, Ghana and Togo.1 These international comparisons also allow us to identify convergences or divergences across countries. The analysis of convergence is of particular interest for the European Union: given the objectives of cohesion policy and
1 For an exercise regarding Africa, and using a more appropriate set of indicators, see [13].
8
the development of innovation policy at EU level, it gains relevance to identify the contribution provided by each member state.
The two assumptions above are related to both simple and composite technological capability indicators. Composite indicators raise a third additional problem: they present a typical problem of aggregation between apples and oranges. When a composite indicator is obtained as the arithmetic mean of single statistics, we are assuming that a unit of an indicator can be substituted by a unit of another indicator and vice versa. This leads to a third implicit assumption, namely the substitutability among ingredients. Considering the fundamental differences between the aspects gauged by different indicators, this assumption is questionable [14]. Thus it is not surprising that some scholars [15,16] have criticized this measurement instrument given its questionable foundations.
The various components included in the making of a composite indicator also need to be weighted. But when we impose ex-ante a weight to each indicator, we provide a subjective value judgment [17]. Moreover, the aggregation methodology and the choice of indicators can largely affect the results of comparative analysis between different units of analysis [15,16].2
Finally, the different factors which contribute to the development of composite indicators often show high correlation among them: countries with a high share of graduates have at the same time a high rate of scientific publications, patents and so on. In order to capture the differences it is sometimes needed to look at more homogeneous groups of countries [19].
Many of the exercises considered here are not seeking to highlight similarities and differences among countries, but rather to put forward a sort of ranking. The significance of developing such a classification lies implicitly on the idea that a country which shows a good position in two areas is two times better off than one having twice a bad position. Likewise, a person who eats an apple and an orange receives double doses of vitamins compared to a person who only eats an apple or an orange. These empirical exercises do not aim at classifying countries within homogeneous groups; different statistical tools would be needed to do that. They rather aim at ordering countries depending on their capabilities related to technologies and innovation activities.
With respect to previous studies [20], this study aims at broadening the spectrum of the analysis using up-to-date data. Moreover, it takes into account a greater number of exercises including, among others, the European Innovation Scoreboard. Finally, it compares the results provided by the various composite indicators with the most used simple indicator, namely the ratio R&D to GDP.
2.2 Which theory of technological change?
We have already noted that the number of benchmarking studies has considerably grown over the last decade. A first glance at these exercises might give the impression that several of them undertake some of the famous walks of “measurement without theory”, to cite a well-known expression by Koopmans [21]. It might be useful to make explicit what in many of these analyses is only implicit, namely what these indexes intend to measure and on the ground of which theory.
First of all, it is worth reminding that technological capability reflects a heterogeneous phenomenon, composed by several elements. Were that not the case, composite indicators would be useless. The need of using different sources derives from the awareness that a single statistical source – as for example the resources devoted to R&D, the number of patent applications, data on high-technology trade etc. – can shed
2 A complete and detailed analysis of the most used techniques to develop synthetic indicators and of related problems can be found in [18].
9
light on specific aspects about technological competences but are incomplete. These statistics usually underestimate others aspects of knowledge, like those “minor” or incremental forms of innovation as stressed by Rosenberg in particular [22]. Technological capabilities must indeed be considered in a broader sense, including both the creation of new knowledge and their applications to real economic and social problems [23].
In most cases, the exercises taken into account in this Thematic Paper do not include statistics about production. This needs to be justified since there is an established consensus in considering technological and productive capabilities strictly interwoven. On the one hand, technological capability is preparatory to production; on the other hand, the production process generates new competences via learning by doing and learning by using. One could consequently argue that it is impossible to measure technological developments separately from the production processes. In fact, the UNIDO exercise here reviewed also includes some indicators of productive capacity. Nevertheless, there are good reasons to measure technology and production separately, as it is done in the majority of the exercises reviewed here, since this allows identifying how the two sets are dynamically linked. Inserting indicators of production into measures of technological capability will not allow any longer exploring the effects of innovation on production and vice versa.
The nexus between technology and production calls for a fundamental feature of the innovation process: it has both an embodied and disembodied nature. We can for example refer to an embodied technology considering capital goods, equipment or infrastructures. But it is equally important what is embodied in human competences which make workers able to effectively use capital goods. In fact, any innovation system requires both disembodied knowledge and capital equipment to work effectively: on a desert island, a group of Nobel prize winners would have a hard life as much as a group of illiterates endowed with the most updated infrastructures. An innovation system needs an appropriate balance of the two components to prosper.
From a cognitive perspective, knowledge is composed of codified elements (like those available in scientific and technical literature, in patents, manuals, or blueprints), and tacit elements embodied in an expert and qualified labour force [24]. Tacit knowledge is today recognized as a fundamental element of the innovative process, but this does not make things easier for measurement. Given its “tacit nature”, it is difficult to quantify it: if it becomes quantifiable it also becomes explicit and no longer tacit. As we will see, some analyses tend to address the problem by using indicators related to the educational qualifications of employees, under the assumption that education and work experience contain and contribute to develop the tacit knowledge of the labour force.
We devote some attention to the different phases of the innovative activity. Innovation can be understood as a long path including generation of new ideas, design, development, industrialization, commercialization, transmission and diffusion. Contrary to what is assumed in the linear model of innovation, these phases are not sequential but interrelated. But expertise and competences on the various phases are not at all uniformly distributed within the economic space. Thus, some countries show a greater capability to generating new ideas, for example because they have reliable public research centres, good universities and efficient industrial labs; others are more capable at exploiting them commercially; others are more inclined to absorb knowledge acquired externally and diffuse it internally, although most diffusion processes entail the generation of incremental adaptive innovations.
Finally, the indicators here considered deal with “technological capabilities” more than with “innovative capabilities”. Innovations are the direct and indirect outcomes of different activities: basic research carried out in universities, research in firms R&D labs, production. Additionally, innovations can have different nature, i.e. technological and non-technological, tangible and intangible. It is still difficult to gather quantitative

10
information on all these aspects, and even more to get them in a comparable standard for a large number of countries. One of the justifications to using technological capabilities indicators only is that the latter represent the condition sine qua non to create, absorb and diffuse technological innovations across an economic system. The limit of this approach is that it may not be able to gauge other forms of innovation such as non-technological innovations, organizational innovations, marketing innovations and others. Since these forms of innovation are gaining importance in countries’ competitiveness, composite indicators should also address this challenge in the near future.
An attempt to build an indicator based on innovative performance, and also taking into account new forms of innovation, comes from the Summary Innovation Index developed within the European Innovation Scoreboard, and here discussed in Section 4.1. But the other composite indicators cannot be taken as a direct measure of innovative performance. They rather represent the current endowment of a country to base its current and future competitiveness and growth on the creation, use and diffusion of technological innovations.
The exercises considered here are mostly devoted to assess the past and current state of national technological capabilities, but there are a few exceptions. Some of them have also the ambitious task of forecasting the economic performance likely to be achieved on the ground of the current technological capabilities. This is the case of the HTI Index employed by the National Science Foundation and, to a lesser extent, also of the World Economic Forums’ Global Competitiveness Index.
This brief overview already suggests that we are asking a lot of information to technological indicators. To sum up, we desire indicators that will be able to capture at least:
• disembodied and embodied knowledge;
• codified and tacit knowledge;
• the generation and the imitation of innovation.
Is it possible to compare such a different group of national systems of innovation? The ways to technological capabilities, even if not infinite, are certainly more than one. We can seek comfort in reflecting on the fact that today there are more similarities than two decades ago. Until the 1980s, the so-called “First”, “Second” and “Third” world (corresponding, respectively, to the advanced capitalist nations, the planned economies and the less developed nations) also had distinctive differences in technological capabilities. Planned economies, for example, did not have a business sector which developed innovations on a competitive base and the lack of a proper intellectual property rights system did not allow to use patents as a technological indicator. At the same time, planned economies combined a high investment in R&D, a well educated population and a high level of workforce qualification. The planned economies were similar to underdeveloped countries in terms of patents, but closer to the most advanced capitalist nations in terms of years of education and number of engineers. It was therefore difficult to rank countries on the ground of a single line.3 The disappearance of planned economies has made it easier to rank countries since all of them can today be ordered according to similar criteria.
We will consider nine different exercises to measure the technological capabilities of a country: the Summary Innovation Index and the Global Innovation Index, both of the European Commission; the Technology Index, the Technological Readiness Index and the Technological Innovation Index of the World Economic Forum; the Knowledge Index of the World Bank; the Technological Activity Index of UNIDO; the Technological Advance Index of the UNCTAD; and finally, the ArCo [26].
3 For an attempt to map statistically the various clubs in the world economy, see for example [25].
11
2.3. Exercises not considered here
Apart from the indicators considered here, there are others attempts to measure technological capabilities at country level. Among others, the Technology Achievement Index, developed by UNDP and reported in the Human Development Report 2001 [27] and the S&T Capacity Index (STCI) proposed by the RAND Corporation [28,29]. These two attempts, already reviewed in [17], have been carried out for one period only and have been discontinued. The Technology Infrastructure and Scientific Infrastructure included in the World Competitiveness Yearbook (WCY) of IMD [30] is also excluded as more business oriented.
A special attention should be devoted to the High-Tech Indicators (HTI) developed at the Georgia Tech Technology Policy and Assessment Center and reported by the National Science Foundation’s Science & Engineering Indicators [31,32]. This attempt is designed not just to measure the current technological capabilities, but to forecast how the present capabilities can lead to secure quotas of high-tech exports. The HTI is composed of four input indicators which reflect national propensity for future technology-based competitiveness, and three output indicators. These indicators are built through a combination of an expert opinion survey and hard data.
The HTI’s four inputs indicators are: a. technological infrastructure referring to the social and economic institutions that help a nation develop, produce, and market new technology; b. socioeconomic infrastructure referring to the social and economic institutions necessary to sustain and advance technology-based development; c. productive capacity referring to the physical and human resources devoted to manufacturing products and the efficiency with which these resources are used; d. national orientation referring to national policies, institutions, and public opinion that help a nation become technologically competitive. These indicators are designed to forecast long-term changes in national high-technology competitiveness in terms of future high-tech exports potential. Output indicators are: a. technological standing in manufacturing and exports capabilities for high-tech products; b. technological emphasis in export mix; c. rate of technical change. These indicators gauge current competitiveness. The HTI’s input indicators are used by the NSF [33] for comparing perspective nations’ competitiveness in high tech trade.
The HTI is not strictly comparable with the other surveys since: a) it covers a lower number of countries (about 30); b) it has a distinctive focus on foresight; c) it employs a combination of hard and soft data, a characteristic shared by the World Economic Forums’ Global Competitiveness Report only. For this reason, it will not be further discussed herewith.4
4 The most relevant finding of the HTI exercise is that China displaces the United States as the top-ranking economy as of 2007. As we will see later, this is in contrast with the results of most of the other measuring attempts. The majority of indicators shows that China has experienced a dramatic increase in technology-based economic competitiveness, but it is still lagging behind compared to the more advanced countries. The main difference between HTI and the other exercises considered here is that the former uses absolute values whereas the latter use data normalized by the size of the economy. In absolute terms China scores highly on most indicators, while on the base of a size-dependent metrics it is far from the top. For a comparison between the methodologies employed by the Technology Policy and Assessment Center and the World Economic Forum, see [34].
12
3. An analysis of the most used indicators
3.1 The Summary Innovation Index (European Commission)
Since 2000 the European Commission (Directorate-General Enterprise and Industry) has published every year the European Innovation Scoreboard (EIS) [6,7,8] aiming at assessing the progress of the objectives concerning innovation set by the Lisbon Strategy of March 2000. The EIS sixth edition, released in 2006, includes 25 indicators and develops an articulated structure to measure the strengths and weaknesses of the various national systems of innovation.5
The 25 indicators have been divided, according to a rationale well-established in the literature [35], within two groups: Innovation inputs and Innovation outputs. These, in turn, include five subgroups: Innovation driver, Knowledge creation, Innovation & entrepreneurship are classified as innovation inputs; Application and Intellectual property are regarded as innovation outputs.
The 25 indicators are aggregated in a synthetic index named Summary Innovation Index (SII). For each country, SII is estimated as the arithmetic mean of the 25 indicators’ normalized values. Then the same weight is attributed to all the indicators composing the SII. Normalization has been carried out with respect to the EU-25 value (or alternately to the EU-15 value when the former is not available) of the same year. Finally, the resulting time series has been re-estimated on a scale ranging from 0 (which corresponds to the country showing the minimum value), to 1 (which identifies the country with the maximum value). Thus, the obtained SII summarizes an aggregate and comparative value for the innovative performance of each country. In the 2006 EIS, SII is calculated for 34 countries: two new EU member states (Bulgaria and Romania), and seven extra-UE countries (Croatia, Turkey, Island, Norway, Switzerland, United States, and Japan) have been added to the 25 EU member states.
Since SII is more oriented towards the assessment of the innovative performances of countries, it also includes some measures related to the innovative activities of firms derived from the Community Innovation Survey (CIS), a periodical survey carried out on European firms to scrutinize their innovative performance and strategy. In spite of the improvements obtained over the four CIS ventures, the comparability across countries of the indicators is still imperfect, and EIS inherits from CIS some bias. Moreover, EIS seeks to take into account the new forms of innovation by including trademarks and design registrations in addition to patents.6
5 For the EIS 2008 [46] the methodology has been revised and the number of dimensions increased to 7 - Human resources, Finance and support, Firm investments, Linkages & entrepreneurship, Throughputs, Innovators, Economic effects - and grouped into 3 main blocks covering enablers, firm activities and outputs 6 The 2008-2010 SII will also include two indicators derived from the CIS: firms’ non-R&D innovation expenditures (as a percentage of turnover), and the share of small and medium enterprises which carried out organizational and marketing innovations.

13
3.2 The Global Summary Innovation Index (European Commission)
The Global Summary Innovation Index (GSII) is a composite indicator included in the Global Innovation Scoreboard (GIS) [8] which compares the EU-27 member states innovative performance with respect to their major international partners. GSII was constructed for the first time in 2006 [8], and it was calculated for 48 countries. Besides the 34 countries included in SII and EIS (see previous section), GIIS also considers the other 14 major R&D performing countries in the world.7
Many of the 25 indicators used in EIS for building SII, in particular those based on the Community Innovation Survey, are not available for non European countries. Thus, GSII includes 12 indicators, chosen on the basis of their availability for most of the examined countries: adding more countries imply a reduction of the set of indicators and vice versa. As SII, GSII is also divided into five composite sub-indicators, each of them measuring a key dimension of innovative capabilities: Innovation drivers, Knowledge creation, Diffusion, Application, and Intellectual property.
A 2008 Global Innovation Scoreboard is provided in Part 2 of this report, with some changes in the methodology and set of countries included. Full details are provided in Part 2. The comparative analysis in this Part is based on the 2006 GIS.
3.3 The Technology Index (World Economic Forum)
The most comprehensive attempt to rank countries’ position on the ground of economic and technological indicators comes from the World Economic Forum (WEF). Thanks to the availability of research resources and promotional capacities, the indexes developed by the WEF have become regular guests of international mass media. While the WEF generates a wealth of indexes for a variety of economic aspects, we will concentrate here on those related to technological change only.
The main indicator developed by the WEF is the Growth Competitiveness Index (GroCI). The index was developed to analyse the growth potentials of an economic system in the medium run through the evaluation of its competitiveness macroeconomic factors.8 GroCI is composed by three pillars, each reflecting a critical element of the growth process of a national economic system. They are: 1) quality of the macroeconomic setting, 2) robustness of the public institutions and 3) technological innovation capabilities. To each of them is associated a different sub-indicator, calculated considering a combination of data coming both from data banks belonging to institutional bodies (hard data), and from the results of the WEF’s Executive Opinion Survey (EOS, soft data).9 We will focus here on the Technology Index (Tech) only since it is the GroCI sub-indicator dealing with technological capabilities. Tech includes three principal categories of technology: Innovative capability, Technology transfer and Diffusion of new information and communications technologies.
Tech has been calculated for the first time in 2001/2002 for 75 countries. In the 2006/2007 GCR edition, Tech considered 125 countries, divided in two groups: core economies and non-core economies, according to the number of granted patents.10 Concerning core economies, the first two Tech sub-indicators, innovative capability and ICT diffusion, are considered adequate to assess the development and competitive capabilities of their competitive systems. That is because these countries, according to
7 Countries have been included according to the share of global R&D expenditures in 2002 (at least equal to 0.1 per cent of the world total). The countries included are: China, Republic of Korea, Canada, Brazil, Australia, Israel, India, Russian Federation, Mexico, Singapore, Hong Kong, Argentina, South Africa, and New Zealand. 8 For a critical analysis of the WEF methodology, see [36]. 9 The Executive Opinion Survey is a panel composed by manager and experts who give an evaluation (on a scale ranging from 0 – the lowest level – to 7 – the highest level) on general aspects affecting the competitive environment of an economic system for which official data (hard data) are not available. 10 Economies having more than 15 patents per million population granted at the USPTO have been classified as core economies, while those with less than 15 US patents per million population as non-core economies.

14
the WEF view, are in a development stage in which they can take few advantages from the imitation of technologies already developed abroad. In order to grow and compete, core economies need to innovate. Therefore, for the most advanced economies, Tech is calculated as the arithmetic mean of the two sub-indicators, Innovative capability and ICT diffusion. For non-core economies, Tech is calculated also taking in consideration a third sub-indicator relative to technology transfer, and assigning a lower weight to the innovative capability index.
3.4 The Technological Readiness Index and the Technological Innovation Index (World Economic Forum)
The Global Competitiveness Index (GloCI) was published for the first time in the 2004/2005 edition of the Global Competitiveness Report (GCR) [37,38,39]. GloCI is a composite indicator developed by the WEF which evaluates the competitive capacity of economic systems, both for advanced and developing countries. The main GloCI objective is to synthesise in a single indicator both the economic drivers of productivity and the microeconomic components of growth capabilities. Up until 2004, these were analysed through two different synthetic indexes included in the GCR: GloCI (described in the previous section) and the Business Competitiveness Index (BCI, calculated since 1998 to analyse the microeconomic aspects of countries’ competitive capability). In the 2006/2007 GCR edition, GloCI has been calculated for 125 countries, divided in 5 groups according to the stage of development measured by per capita GDP.
GloCI groups the considered variables by pillars which reflect different aspects of economic systems. Each sub-group includes both hard and soft data. GloCI is composed by nine categories. These are further sub-divided into three groups, Basic requirements, Efficiency enhancers, Innovation and sophistication factors which have different importance according to each country’s stage of development.11 This reflects the idea that their contributions vary depending on the development and growth process of an economic system, and have a relative importance being a function of a country’s endowments and level of development. Among the nine categories, those considering the various dimensions characterizing innovative capabilities are the seventh and the ninth.
The seventh pillar, the Technological Readiness Index, measures the capacity of firms to adopt new technology, the reliability of the judicial system concerning the ICTs, the amount of foreign direct investments, and the ICTs diffusion. The ninth group, the Technological Innovation Index, includes variables related to R&D investments made both from public and business institutions, human capital, legal protection of intellectual property rights and patents.
3.5 The Knowledge Index (World Bank)
The World Bank has created a comprehensive data bank of internationally comparable economic and social indicators. Data can be consulted and downloaded from the web site, giving to anyone the possibility to make his own elaboration on-line. Thanks to the ICT, it is even possible to build tailor-made composite indicators. Besides providing a very user-friendly data base, the World Bank has also developed its own synthetic indicators. In particular, the Knowledge Index (KI) is an indicator developed within the Knowledge Assessment Methodology (KAM). The latter was conceived in 2006 aiming at measuring countries capacity in competing within the knowledge economy. KAM collects data about 132 countries on 81 qualitative and structural variables. These are chosen in order to represent four main categories related to national competitiveness: the 11 In particular, there are three different aggregation schemes. According to countries development stage – initial, intermediate or advanced, as measured by level of per capita GDP - the normalized weight attributed to Basic requirements, Efficiency enhancers and Innovation factors will be respectively equal to 0.5, 0.4 and 0.1; 0.4, 0.5 and 0.1; and 0.3, 0.4 and 0.3.

15
accountability of the economic and institutional system, the educational level of the population, the innovative capability of the economic system, and the ICTs diffusion. KI takes in consideration only human capital, the innovation system and ICTs.
3.6 The Technological-Advance Index (UNIDO)
The Technological-Advance Index (Tech-Adv) is one of the two sub-indicators composing the Industrial-cum-Technological-Advance Index (ITA). ITA was included in the 2005 Industrial Development Report edited by the UNIDO (United Nations Industrial Development Office) [40]. It has been calculated for 161 countries for 1990 and 2002. This indicator, inspired by Sanyaya Lall [13,38] and his colleagues, is the result of two sub-indicators: the Industrial-advance indicator (Ind-Adv) and the Tech-Adv. We will focus on the latter. The Tech-Adv sub-indicator is defined as the arithmetic mean of the share of the medium- and high-tech added value industry on the total added value, and on the total of manufacturing exports. The former represents a measure of the concentration degree of the countries’ productive structure in the medium- and high-tech industries, whereas the latter the capability of a national economic system to compete on international markets in advanced sectors.
3.7 The Technological Activity Index (UNCTAD)
The Technological Activity Index (TAI) is one of the two sub-indicators of the Innovation Capability Index (UNICI), developed by the UNCTAD (United Nations Conference on Trade and Development) and included in the 2005 World Investment Report [41]. The UNICI has been calculated relatively to the years 1995 and 2001 using social-economic data for 117 countries. It is constructed as the arithmetic mean of TAI and the Human Capital Index (HCI). Each of the two sub-indexes is, in turn, calculated as an aggregation of three variables. While HCI synthesizes the availability of skills related to the innovative activity, we will focus on TAI. This measures the technological activity using both input and output measures, respectively represented by labour force employed in R&D related activities, and the amount of patents and scientific publications.
3.8 ArCo
ArCo is a composite indicator which takes in consideration variables relative to three different dimensions of technological change for 162 countries and two years, 1990 and 2000 [26]. The first category is represented by the innovative activity of a country’s economic system measured in terms of number of patents and scientific publications. The second dimension concerns the diffusion of old and new technologies (Internet, land lines and mobile phones), while the third concerns the quality of human capital. Lastly, the ArCo aggregation scheme is the arithmetic mean of the three described sub-indicators, constructed in turn as the arithmetic mean of the variables composing them.
16
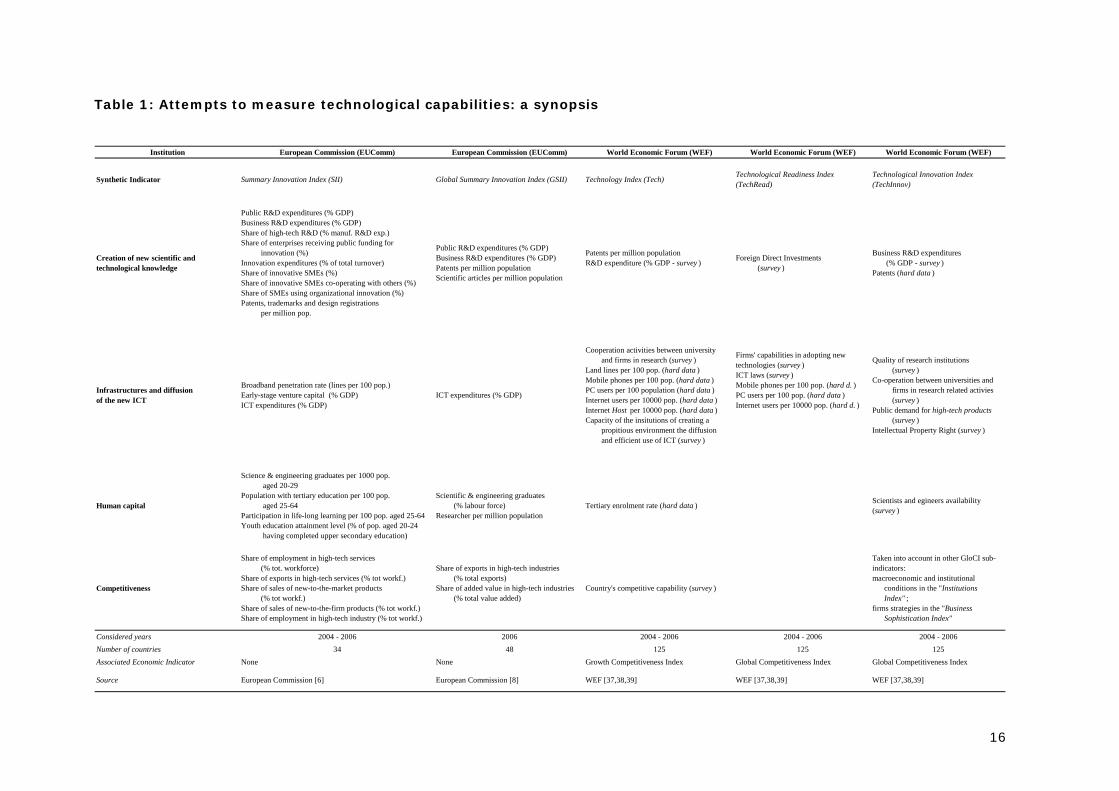
Table 1: Attempts to measure technological capabilities: a synopsis
Institution European Commission (EUComm) European Commission (EUComm) World Economic Forum (WEF) World Economic Forum (WEF) World Economic Forum (WEF)
Synthetic Indicator Summary Innovation Index (SII) Global Summary Innovation Index (GSII) Technology Index (Tech) Technological Readiness Index(TechRead)
Technological Innovation Index(TechInnov)
Creation of new scientific and technological knowledge
Public R&D expenditures (% GDP)Business R&D expenditures (% GDP)Share of high-tech R&D (% manuf. R&D exp.)Share of enterprises receiving public funding for innovation (%)Innovation expenditures (% of total turnover)Share of innovative SMEs (%)Share of innovative SMEs co-operating with others (%)Share of SMEs using organizational innovation (%)Patents, trademarks and design registrations per million pop.
Public R&D expenditures (% GDP) Business R&D expenditures (% GDP) Patents per million population Scientific articles per million population
Patents per million populationR&D expenditure (% GDP - survey ) Foreign Direct Investments
(survey )
Business R&D expenditures (% GDP - survey ) Patents (hard data )
Infrastructures and diffusion of the new ICT
Broadband penetration rate (lines per 100 pop.) Early-stage venture capital (% GDP) ICT expenditures (% GDP)
ICT expenditures (% GDP)
Cooperation activities between university and firms in research (survey )Land lines per 100 pop. (hard data ) Mobile phones per 100 pop. (hard data ) PC users per 100 population (hard data )Internet users per 10000 pop. (hard data ) Internet Host per 10000 pop. (hard data )Capacity of the insitutions of creating a propitious environment the diffusion and efficient use of ICT (survey )
Firms' capabilities in adopting new technologies (survey )ICT laws (survey )Mobile phones per 100 pop. (hard d. ) PC users per 100 pop. (hard data )Internet users per 10000 pop. (hard d. )
Quality of research institutions (survey ) Co-operation between universities and firms in research related activies (survey ) Public demand for high-tech products (survey ) Intellectual Property Right (survey )
Human capital
Science & engineering graduates per 1000 pop. aged 20-29Population with tertiary education per 100 pop. aged 25-64Participation in life-long learning per 100 pop. aged 25-64Youth education attainment level (% of pop. aged 20-24 having completed upper secondary education)
Scientific & engineering graduates (% labour force)Researcher per million population
Tertiary enrolment rate (hard data ) Scientists and egineers availability (survey )
Competitiveness
Share of employment in high-tech services (% tot. workforce)Share of exports in high-tech services (% tot workf.)Share of sales of new-to-the-market products (% tot workf.)Share of sales of new-to-the-firm products (% tot workf.)Share of employment in high-tech industry (% tot workf.)
Share of exports in high-tech industries (% total exports)Share of added value in high-tech industries (% total value added)
Country's competitive capability (survey )
Taken into account in other GloCI sub-indicators:macroeconomic and institutional conditions in the "Institutions Index" ; firms strategies in the "Business Sophistication Index"
Considered years 2004 - 2006 2006 2004 - 2006 2004 - 2006 2004 - 2006Number of countries 34 48 125 125 125Associated Economic Indicator None None Growth Competitiveness Index Global Competitiveness Index Global Competitiveness Index
Source European Commission [6] European Commission [8] WEF [37,38,39] WEF [37,38,39] WEF [37,38,39]
17
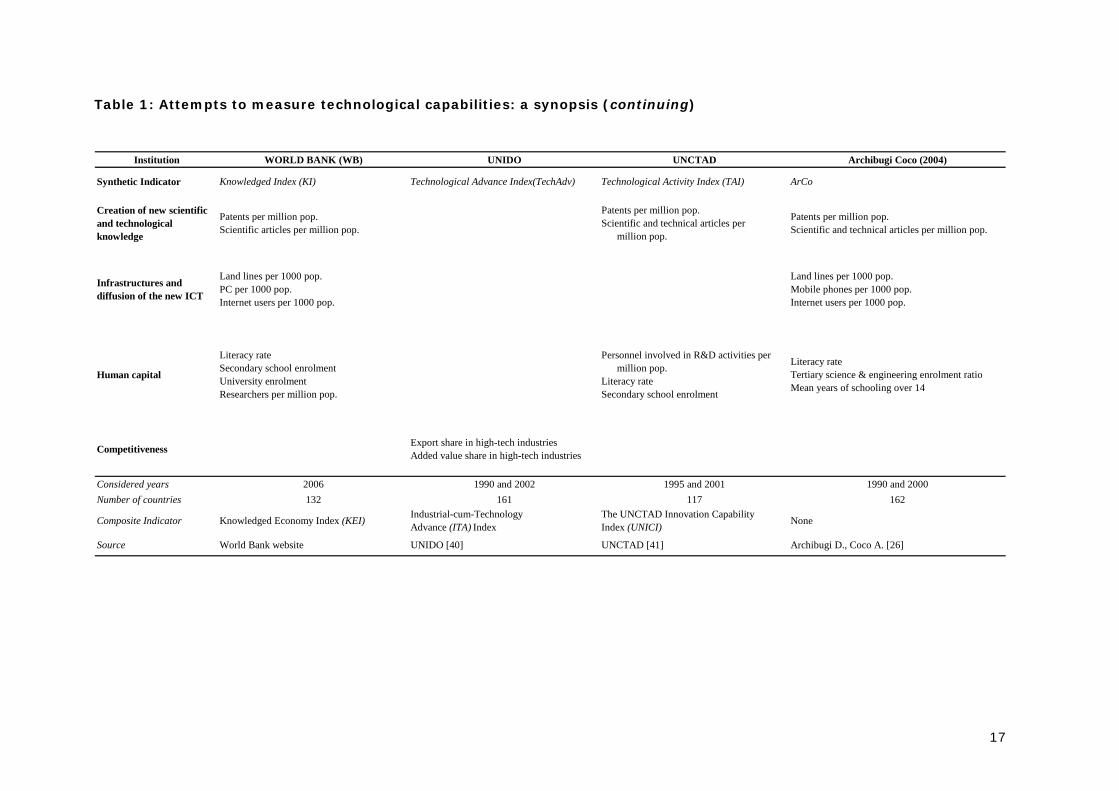
Table 1: Attempts to measure technological capabilities: a synopsis (continuing)
Institution WORLD BANK (WB) UNIDO UNCTAD Archibugi Coco (2004)
Synthetic Indicator Knowledged Index (KI) Technological Advance Index(TechAdv) Technological Activity Index (TAI) ArCo
Creation of new scientific and technological knowledge
Patents per million pop. Scientific articles per million pop.
Patents per million pop. Scientific and technical articles per million pop.
Patents per million pop. Scientific and technical articles per million pop.
Infrastructures and diffusion of the new ICT
Land lines per 1000 pop. PC per 1000 pop. Internet users per 1000 pop.
Land lines per 1000 pop. Mobile phones per 1000 pop. Internet users per 1000 pop.
Human capital
Literacy rate Secondary school enrolment University enrolment Researchers per million pop.
Personnel involved in R&D activities per million pop.
Literacy rate Secondary school enrolment
Literacy rateTertiary science & engineering enrolment ratioMean years of schooling over 14
CompetitivenessExport share in high-tech industries Added value share in high-tech industries
Considered years 2006 1990 and 2002 1995 and 2001 1990 and 2000Number of countries 132 161 117 162
Composite Indicator Knowledged Economy Index (KEI) Industrial-cum-Technology Advance (ITA) Index
The UNCTAD Innovation Capability Index (UNICI) None
Source World Bank website UNIDO [40] UNCTAD [41] Archibugi D., Coco A. [26]
18
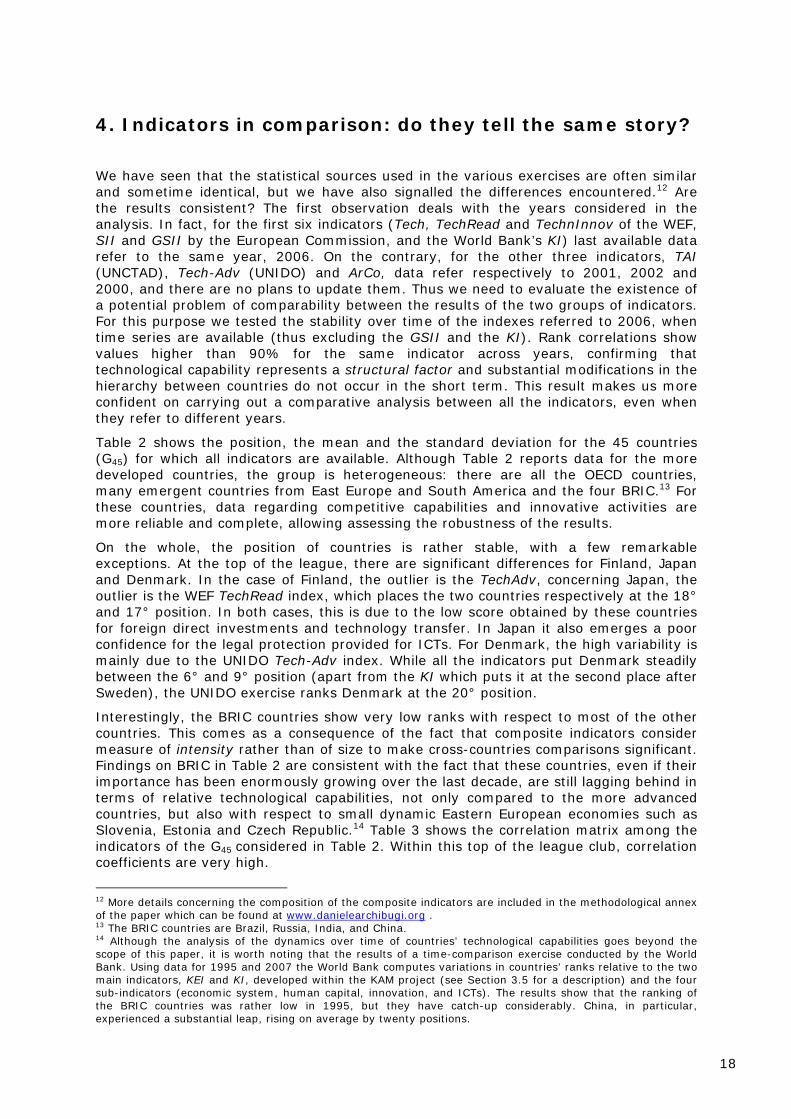
4. Indicators in comparison: do they tell the same story?
We have seen that the statistical sources used in the various exercises are often similar and sometime identical, but we have also signalled the differences encountered.12 Are the results consistent? The first observation deals with the years considered in the analysis. In fact, for the first six indicators (Tech, TechRead and TechnInnov of the WEF, SII and GSII by the European Commission, and the World Bank’s KI) last available data refer to the same year, 2006. On the contrary, for the other three indicators, TAI (UNCTAD), Tech-Adv (UNIDO) and ArCo, data refer respectively to 2001, 2002 and 2000, and there are no plans to update them. Thus we need to evaluate the existence of a potential problem of comparability between the results of the two groups of indicators. For this purpose we tested the stability over time of the indexes referred to 2006, when time series are available (thus excluding the GSII and the KI). Rank correlations show values higher than 90% for the same indicator across years, confirming that technological capability represents a structural factor and substantial modifications in the hierarchy between countries do not occur in the short term. This result makes us more confident on carrying out a comparative analysis between all the indicators, even when they refer to different years.
Table 2 shows the position, the mean and the standard deviation for the 45 countries (G45) for which all indicators are available. Although Table 2 reports data for the more developed countries, the group is heterogeneous: there are all the OECD countries, many emergent countries from East Europe and South America and the four BRIC.13 For these countries, data regarding competitive capabilities and innovative activities are more reliable and complete, allowing assessing the robustness of the results.
On the whole, the position of countries is rather stable, with a few remarkable exceptions. At the top of the league, there are significant differences for Finland, Japan and Denmark. In the case of Finland, the outlier is the TechAdv, concerning Japan, the outlier is the WEF TechRead index, which places the two countries respectively at the 18° and 17° position. In both cases, this is due to the low score obtained by these countries for foreign direct investments and technology transfer. In Japan it also emerges a poor confidence for the legal protection provided for ICTs. For Denmark, the high variability is mainly due to the UNIDO Tech-Adv index. While all the indicators put Denmark steadily between the 6° and 9° position (apart from the KI which puts it at the second place after Sweden), the UNIDO exercise ranks Denmark at the 20° position.
Interestingly, the BRIC countries show very low ranks with respect to most of the other countries. This comes as a consequence of the fact that composite indicators consider measure of intensity rather than of size to make cross-countries comparisons significant. Findings on BRIC in Table 2 are consistent with the fact that these countries, even if their importance has been enormously growing over the last decade, are still lagging behind in terms of relative technological capabilities, not only compared to the more advanced countries, but also with respect to small dynamic Eastern European economies such as Slovenia, Estonia and Czech Republic.14 Table 3 shows the correlation matrix among the indicators of the G45 considered in Table 2. Within this top of the league club, correlation coefficients are very high.
12 More details concerning the composition of the composite indicators are included in the methodological annex of the paper which can be found at www.danielearchibugi.org . 13 The BRIC countries are Brazil, Russia, India, and China. 14 Although the analysis of the dynamics over time of countries’ technological capabilities goes beyond the scope of this paper, it is worth noting that the results of a time-comparison exercise conducted by the World Bank. Using data for 1995 and 2007 the World Bank computes variations in countries’ ranks relative to the two main indicators, KEI and KI, developed within the KAM project (see Section 3.5 for a description) and the four sub-indicators (economic system, human capital, innovation, and ICTs). The results show that the ranking of the BRIC countries was rather low in 1995, but they have catch-up considerably. China, in particular, experienced a substantial leap, rising on average by twenty positions.

19
Table 2: Ranking of the G45 countries included in all the considered indicators (last available year for each indicator)
CountryTechWEF
TechReadWEF
TechInnovWEF
GSIIEUComm
KIWB
ArCoTAI
UNCTADTechAdvUNIDO
MediaRank
St. Dev.Rank
SIIEUComm
Sweden 2 1 6 2 1 1 1 8 2.75 2.71 1
United States 1 8 3 7 6 5 4 3 4.63 2.33 7
Switzerlan 8 5 2 3 12 3 3 9 5.63 3.62 2
Finland 3 12 4 1 3 2 2 18 5.63 6.07 3
Japan 4 17 1 4 13 8 5 2 6.75 5.60 5
Denmark 6 9 8 9 2 9 6 20 8.63 5.18 4
Netherland 10 10 10 11 8 11 12 12 10.50 1.31 10
United Kingdom 16 6 11 12 9 13 15 4 10.75 4.20 8
Germany 17 18 5 8 14 12 9 5 11.00 5.07 6
Singapore 15 2 9 5 25 20 11 1 11.00 8.57 .
Canada 14 15 12 10 11 6 7 14 11.13 3.31 .
Israel 9 3 7 6 22 4 17 22 11.25 7.89 .
Iceland 7 4 18 15 4 14 8 33 12.88 9.66 9
Korea, Rep. 5 16 14 13 20 18 19 6 13.88 5.69 .
Norway 11 13 17 17 7 7 10 29 13.88 7.24 15
Australia 12 7 21 18 5 10 13 30 14.50 8.19 .
France 27 22 13 14 17 19 16 11 17.38 5.21 11
Austria 18 19 16 19 16 17 18 17 17.50 1.20 12
Belgium 28 24 15 16 15 16 14 19 18.38 5.04 13
Ireland 29 21 19 20 19 22 21 7 19.75 6.07 14
New Zealand 23 20 22 21 10 15 20 41 21.50 8.96 .
Honk Kong 22 11 20 22 28 21 32 28 23.00 6.44 .
Slovenia 24 25 29 24 18 25 22 23 23.75 3.11 16
Spain 21 28 30 26 23 24 24 15 23.88 4.58 20
Estonia 13 14 26 28 21 30 25 34 23.88 7.43 18
Czech Republic 20 23 24 27 26 29 29 16 24.25 4.53 17
Hungary 25 30 27 29 29 31 27 10 26.00 6.74 23
Italy 34 27 33 25 24 23 26 25 27.13 4.12 19
Slovak Republic 26 26 32 33 34 27 37 21 29.50 5.32 24
Portugal 19 29 28 34 32 33 30 38 30.38 5.58 25
Greece 30 36 36 31 33 26 28 42 32.75 5.15 28
Lithuania 31 32 37 30 27 38 31 40 33.25 4.53 22Russian Federation 44 44 41 23 35 28 23 31 33.63 8.75 .
South Africa 35 34 25 35 42 40 33 27 33.88 5.77 .
Poland 41 38 34 42 31 32 36 32 35.75 4.23 27
Brazil 32 33 42 39 30 36 38 44 36.75 4.92 26
Latvia 36 41 31 38 40 43 41 24 36.75 6.36 .
Mexico 39 40 40 40 41 41 42 13 37.00 9.74 .
Cyprus 33 31 39 44 36 35 39 45 37.75 4.98 21
Bulgaria 43 42 45 36 37 34 35 36 38.50 4.17 29
Argentina 42 43 44 41 38 37 34 35 39.25 3.77 .
China 45 45 35 32 44 44 44 26 39.38 7.37 .
India 38 39 23 43 45 45 45 37 39.38 7.41 .
Turkey 40 37 38 37 43 42 43 39 39.88 2.53 31
Romania 37 35 43 45 39 39 40 43 40.13 3.36 30
Source and acronyms: see Table 1

20
Table 3: Coefficients correlation matrix between the G45 positions present in all indicators (last available year for each indicator)
G45TechWEF
TechReadWEF
TechInnovWEF
GSIIEUComm
KIWB
ArCoTAI
UNCTADTechAdvUNIDO
TechWEF
1
TechReadWEF
0.9112 1
TechInnovWEF
0.8515 0.8436 1
GSIIEUComm
0.8352 0.8474 0.9059 1
KIWB
0.8519 0.8474 0.7769 0.8451 1
ArCo 0.8567 0.8648 0.8435 0.9219 0.9174 1
TAIUNCTAD
0.8519 0.8304 0.8538 0.9424 0.9245 0.9441 1
TechAdvUNIDO
0.5415 0.5278 0.7221 0.7057 0.4788 0.5561 0.6075 1
Source and acronyms: see Table 1
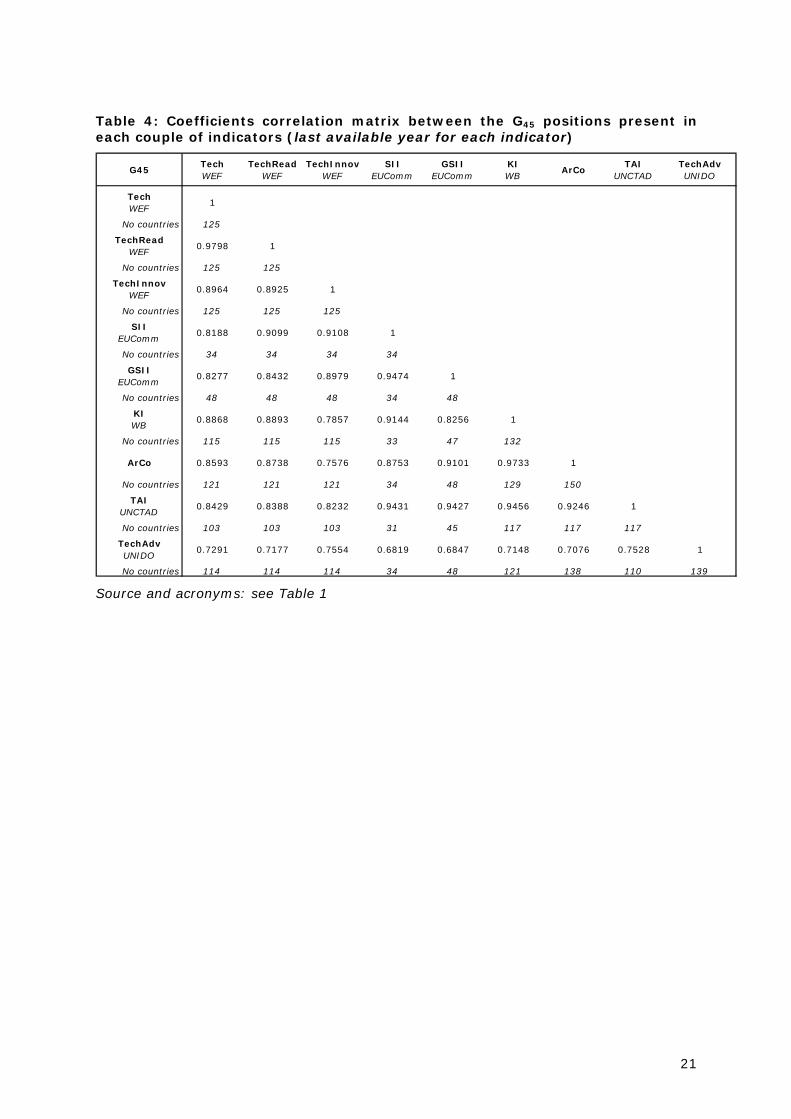
ArCo is strongly correlated with TAI (0.94), GSII (0.92) and KI (0.92). The lower correlations are those between Tech-Adv and the others, in particular with KI (0.48). Tech-Adv measures different aspects than the other synthetic indicators; the UNIDO indicator takes into account national production and exports, while it does not address fundamental aspects of countries’ technological capabilities. To increase the number of observations in each comparison, Table 4 shows the pairwise correlations between all the indicators taking into consideration the whole set of countries for which data related to every measurement exercise are available.
Overall, a consistent picture emerges, with the notable exception of UNIDO’s Tech-Adv. The UNIDO indicator is calculated on the share of high-tech industry on the added value and the exports. Finally, it is worth stressing that SII, not reported in Table 3 because it has been calculated for 34 countries only, also shows strong correlations with the other technological measures. Such a correlation between groups of so variegated countries can provide misleading results just for their different development level, so as hiding the real differences between similar countries. We have therefore divided the sample in two groups, taking the first 22 (G1- 22)15 and the last 23 (G23-45)16 countries separately. Tables 5 and 6 show the correlations between the indicators in these two subgroups: figures are generally lower compared with those calculated on the entire set of countries. In particular, remarkable differences emerge concerning the TechRead in the first group of countries and for the TechInnov in the second. Moreover, in the G1-22 Tech-Adv shows very low correlation with Tech and with TAI, approximately zero with TechRead and ArCo, and even a negative one with KI.
15 G1-22 includes the first 22 countries according to the ranking for all the considered indicators (see Table 2). 16 G23-45 includes the last 23 countries according to the ranking for all the considered indicators (see Table 2).
21
Table 4: Coefficients correlation matrix between the G45 positions present in each couple of indicators (last available year for each indicator)
G45TechWEF
TechReadWEF
TechInnovWEF
SIIEUComm
GSIIEUComm
KIWB
ArCoTAI
UNCTADTechAdvUNIDO
TechWEF
1
No countries 125
TechReadWEF
0.9798 1
No countries 125 125
TechInnovWEF
0.8964 0.8925 1
No countries 125 125 125
SIIEUComm
0.8188 0.9099 0.9108 1
No countries 34 34 34 34
GSIIEUComm
0.8277 0.8432 0.8979 0.9474 1
No countries 48 48 48 34 48
KIWB
0.8868 0.8893 0.7857 0.9144 0.8256 1
No countries 115 115 115 33 47 132
ArCo 0.8593 0.8738 0.7576 0.8753 0.9101 0.9733 1
No countries 121 121 121 34 48 129 150
TAIUNCTAD
0.8429 0.8388 0.8232 0.9431 0.9427 0.9456 0.9246 1
No countries 103 103 103 31 45 117 117 117
TechAdvUNIDO
0.7291 0.7177 0.7554 0.6819 0.6847 0.7148 0.7076 0.7528 1
No countries 114 114 114 34 48 121 138 110 139
Source and acronyms: see Table 1

22
Table 5: Coefficients correlation matrix between the G1-22 countries in the ranking (last available year for each indicator)
G1-22TechWEF
TechReadWEF
TechInnovWEF
GSIIEUComm
KIWB
ArCoTAI
UNCTADTechAdvUNIDO
TechWEF
1
TechReadWEF
0.6303 1
TechInnovWEF
0.6056 0.3145 1
GSIIEUComm
0.6821 0.4851 0.9322 1
KIWB
0.5201 0.2394 0.1917 0.2664 1
ArCo 0.7323 0.4621 0.6307 0.6928 0.6382 1
TAIUNCTAD
0.6802 0.3582 0.7113 0.7853 0.709 0.7698 1
TechAdvUNIDO
0.1788 0.0466 0.6669 0.5669 -0.1783 0.0335 0.3145 1
Source and acronyms: see Table 1
Table 6: Coefficients correlation matrix between the G23-45countries in the ranking (last available year for each indicator)
G23-45TechWEF
TechReadWEF
TechInnovWEF
GSIIEUComm
KIWB
ArCoTAI
UNCTADTechAdvUNIDO
TechWEF
1
TechReadWEF
0.9113 1
TechInnovWEF
0.6164 0.552 1
GSIIEUComm
0.4561 0.4355 0.3538 1
KIWB
0.7232 0.7643 0.2795 0.6614 1
ArCo 0.534 0.5694 0.1492 0.6828 0.8055 1
TAIUNCTAD
0.5663 0.5344 0.2617 0.8156 0.8191 0.8425 1
TechAdvUNIDO
0.2375 0.1791 0.4441 0.4625 0.2259 0.2625 0.2636 1
Source and acronyms: see Table 1

23
5. Comparing national composite indicators with R&D intensity
The main advantage of composite indicators is to synthesise all the information about technological capabilities in a number. However, there are other measures able to establish countries rankings based on some innovative capability dimension, and one of the most frequently used is R&D intensity. R&D plays two complementary roles in enhancing countries’ technological capabilities. The first is in generating innovation, and has received most attention in the existing empirical literature. The second is in facilitating the adoption of innovations developed elsewhere through the development of a certain absorptive capacity [42].
Do R&D intensity measures (such as expenditures as a percentage of GDP) provide similar ranking to composite indicators? In other words, is R&D intensity a proxy of innovative capabilities able to “capture” the same reality as the composite indicators? Were the one-dimensional R&D measure able to synthesise a country’s innovative capability as well as multidimensional composite indicators, then the Occam razor principle would suggest using the simple and not the complex indicator [15,16]. Intra-countries scores are based on a single number which comes out from synthetic indicators, independently from the fact that these indicators are based on a battery of statistics. Hence, if R&D based rankings ended up to be identical to synthetic indicators rankings, all this fuss about synthetic indicators would be useless.17 Table 7 reports the R&D intensity of the most advanced countries and the rankings is rather consistent with those reported in Table 2. The comparison between R&D intensity and synthetic indicators is carried out in Table 8 firstly considering all G45, and then the two sub-groups G1-22 and G23-45. Table 8 shows the correlation rates between each composite indicator and R&D intensity. Not surprisingly, the indicators which incorporate R&D data (SII, GSII and TechInnov) show the highest correlations with R&D intensity. TechInd and TAI also include R&D-based statistics and, in fact, correlations indexes are around 0.89. As to the other indicators, correlation rates are also fairly high. The UNIDO’s Tech-Adv as well as the World Bank’s KI have lower correlation indexes.
When we consider the two subgroups of countries, G1-22 and G23-45, correlation rates decrease significantly. R&D intensity is fairly able to capture differences in the G45 but when we look within more homogenous groups of countries, R&D intensity is less capable of grasping differences. G1-22 countries are characterized by similar levels of R&D intensity, apart from the heavy R&D spenders like Israel, Sweden, Finland and Japan (all above 3% of GDP).
17 One can observe that these benchmarking exercises are not only about benchmarking countries, but also about identifying strengths and weaknesses. However, our focus in this paper is on rankings.

24
Table 7: R&D intensity (as a percentage of GDP). Year 2005
Country R&D/GDP Country R&D/GDP
Argentina 0.46 Japan 3.32
Australia 1.78 Korea, Rep. 2.98
Austria 2.41 Latvia 0.57
Belgium 1.84 Lithuania 0.76
Brazil 0.91 Mexico 0.5
Bulgaria 0.5 Netherlands* 1.74
Canada 2.01 New Zealand 1.16
China 1.33 Norway 1.52
Cyprus 0.4 Poland 0.57
Czech Republic 1.41 Portugal 0.81
Denmark 2.45 Romania 0.41
Estonia 0.94 Russian Federation 1.07
Finland 3.48 Singapore 2.3
France 2.13 Slovak Republic 0.51
Germany 2.48 Slovenia 1.46
Greece 0.58 South Africa 0.92
Honk Kong 0.8 Spain 1.12
Hungary 0.94 Sweden 3.80
Iceland 2.78 Switzerland 2.9
India 0.69 Turkey 0.79
Ireland* 1.26 United Kingdom 1.76
Israel 4.51 United States* 2.62
Italy 1.09
* provisional
Source: OECD [43,44]
Thus, focusing on the G1-22, R&D intensity is less capable of explaining differences in innovative performance because non-R&D factors play an important role in differentiating national paths of innovation and performances. In particular, Tech-Adv and KI show very low correlations with R&D intensity. The former is a peculiar indicator shaped by exports and value added in high-tech industries. As to the KI, it measures mainly those structural factors which represent the competitiveness and innovative capacities of an economic system, also based on non-R&D components. When we take in consideration the G23-45
countries, correlations significantly drop: the average correlation rate is equal to 0.42. The fact that R&D intensity is not suitable to highlight differences in technological capabilities of this sub-group of countries was somehow expected since it is problematic to distinguish countries’ characteristics through activities that they do not perform or perform at a very limited extent.

25
Table 8: Correlations rates between composite indicators' scores and R&D intensity*
Indicator G45 G1-22 G23-45
Tech 0.81 0.64 0.21
TechRead 0.77 0.48 0.32
TechInnov 0.89 0.74 0.66
SII** 0.93 0.86 0.55
GSII 0.91 0.82 0.78
KI 0.61 0.27 0.22
ArCo 0.81 0.63 0.15
TAI 0.77 0.60 0.35
TechAdv 0.62 0.33 0.59
Mean 0.79 0.60 0.42
* R&D data refer to 2005 (or 2004 when not available).
** The SII correlations have been calculated only for the available 34 countries.
Source and acronyms: see Tables 1 and 7
What can we conclude? R&D is able to explain differences in innovative capabilities in the case of a large and heterogeneous number of countries. The coefficient of variation in the G45 is equal to 0.66, while it ranges from a maximum of 0.45 to a minimum of 0.18 for the composite indicators. This reflects the fact that when we deal with the G45, differences between countries in R&D intensity are extremely large, ranging from 4.5% of Israel to 0.4% of Cyprus. Nevertheless, R&D intensity measure is not able to grasping differences in technological capabilities across more homogeneous countries. Composite indicators are therefore useful, especially to single out the differences within homogeneous groups of countries.
6. Instead of a conclusion: uses and abuses of macro-indicators of technological capabilities
Synthetic indicators give quite a faithful and uniform picture on national relative positions in innovative activities. The most relevant divergences can be attributed to different interpretations of technological change (as in the case of the UNIDO approach), or to an overlapping of qualitative and quantitative methodologies (as is the case of the WEF indexes). In spite of a few significant outliers, a certain convergence about the methodologies to measure technological change at country level has been achieved which is faithfully reflected also in the results achieved by the empirical analyses.
What is the real meaning of a macroeconomic indicator of technological change? Technological capabilities are a stock and not a flow, and they are less suitable to be described by aggregate values as it is done with other macroeconomic variables such as GDP, unemployment, investments and consumption.18 Annual variations are much less significant since technological capabilities are generated (and destroyed) slowly over time, even during periods of rapid expansion or social upheavals.
18 See [45] for an exercise limited to ICTs.

26
Measurement exercises need to take into consideration the evolution of countries over the medium-long run, having in mind that radical accelerations can turn out ephemeral events. It is not surprising that we have recorded few variations in the national rankings in the short run. But long-run variations become more relevant: some countries have managed to undertake virtuous circles, in which the process of creating competences enhances the creation of new competencies. At the same manner, a momentary decline can rapidly turn into a structural phenomenon and can trigger a vicious circle hard to break off. To reverse a technological decline requires a lot of time and huge amounts of resources.
Aggregate indicators also provide preliminary information for policy action. Taking into consideration the various factors, it is possible to identify what distinguishes each country, and how it compares with partners and competitors. It should be kept in mind that the implicit assumption of perfect substitution between the various components holds only for the statistical construction, but not for public policies. For example, if a country is lacking electricity, it is not possible to compensate it with an increase in academic production (measured by bibliometric indicators). But a battery of indicators can allow identifying the main obstacles to national development and leading appropriate public policies. Those who intend to ground their choices of public policies also on statistical information, have to take care of distinguishing properly the indicators from the related phenomena. The policy aim is not, of course, to increase the value of the indicators, but the far more difficult problem of improving the economic and social conditions that the indicators are expected to capture. Scientific publications and patents, for example, are means and not ends. But there is a danger that some policy makers will concentrate on actions that have an effect on the indicator even when it is unclear if they have also an effect on the economic and social reality. For example, some governments distribute the resources devoted to academia on the ground of bibliometric indicators, giving an incentive to researchers to increase their publishable output rather than the knowledge generated. The outcome could be to transform scholars in scientific-articles maximizers rather than in generators of knowledge.
When used in the right perspective, aggregate indicators can help to take important decisions concerning international co-operation agreements, choosing partners according to their competences. Since groups of countries establish common objectives, the statistical tools can help verifying in which measure each nation is contributing to their achievement. We have already mentioned that the European Innovation Scoreboard was conceived also as a tool to monitor the Lisbon Strategy objectives. This recalls what happened with the European Monetary Union: once the Maastricht parameters had been established, EU member states had also to develop an informative system able to monitor if the financial parameters were respected by each country.
Aggregate indicators can be extremely useful for business strategies, especially in order to make decisions about localization of innovative activities and recruitment of qualified staff. It is not surprising that firms need both structural and conjuntural data. The WEF, which is very close to the business community, gathered a lot of data on firms’ expectations about countries technological capabilities. Similarly, also the exercise of the Georgia Tech Technology Policy and Assessment Center looks at predicting high-tech trade shares. Expectations play an important part in decision making, and often today’s expectations affect tomorrow’s ones. Notwithstanding, we preferred to keep hard data separated from soft data (i.e. based on opinions).
Probably, the greater users of aggregate indicators are members of academe. In their heroic attempt to explain and interpret the process of economic development, scholars must be able to measure the differences in technological capabilities across countries. The assumption, often implicit but nevertheless largely shared, is that current technology lays the foundations for tomorrow’s prosperity. Innovation and technological capabilities are considered the engine of productivity, international competitiveness, growth, employment, human capital and well-being. These assumptions need also to be
27
grounded on an empirical base. Taking into account a battery of statistical sources helps at identifying the technological components which are more closely associated with the development process. We do not expect that the same causal links between technology from the one side, and growth from the other side will affect in the same way countries that are so different in terms of size, income, infrastructures and human resources. An analysis of the different elements composing the synthetic indicators can help to quantify the crucial elements which contribute to trigger a process of growth for homogenous groups of countries.
We would take the liberty to conclude with a suggestion, mostly for young scholars. Information technologies have drastically reduced time, efforts and costs necessary to develop tools for measuring technological capabilities. We have seen that the World Bank, the provider of the more complex data source, provides a large number of statistics on-line,. Moreover, it is now possible to elaborate and manipulate these data also on-line. Indicators associated to technological capabilities can today become more complex and with lower efforts. Such easiness in computational elaboration has many advantages, but also the risk to induce scholars to manipulate numbers before having reflected about the nature of technological change and the appropriate methods to measure it. The danger of measurement without a theory is coming back. It is then useful to have first a good picture of which aspects of the technological change we want to deal with, and then start to develop and manipulate the increasingly sophisticated measurement tools.
28
References
[1] A. Arundel, R. Garrelfs, Innovation Measurement and Policies, European Commission, Brussels, EIMS publication no. 50, 1997.
[2] J.L. Furman, M.E. Porter, S. Stern, The determinants of national innovative capacity, Research Policy 31 (6) (2002) 899-933.
[3] M. Pianta, G. Sirilli, The Use of Innovation Surveys for Policy Evaluation, in: OECD, Policy Evaluation in Innovation and Technology, OECD, Paris, 1997.
[4] G. Sirilli, Science and Technology Indicators: The State of the Art and Prospects for the Future, in: G. Antonelli, N. De Liso (Eds), Economics of Structural and Technological Change, Routledge, London 1997.
[5] K. Smith, Measuring Innovation, in: J. Fagerberg, D. Mowery, R. Nelson, The Oxford Handbook of Innovation, Oxford University Press, Oxford, 2005.
[6] European Commission, Directorate-General for Enterprise and Industry, European Innovation Scoreboard Report 2006, Brussels, 2007.
[7] European Commission, Directorate-General for Enterprise and Industry, European Innovation Scoreboard Report 2007, Brussels, 2008.
[8] European Commission, Directorate-General for Enterprise and Industry, Global Innovation Scoreboard 2006 Report, Brussels, 2007.
[9] P. Patel, K. Pavitt, The international distribution and determinants of technological activities, Oxford Review of Economic Policy 4 (1) (1988) 35-55.
[10] P. Patel, K. Pavitt, Uneven (and divergent) technological accumulation among advanced countries: evidence and a framework of explanation. In: D. Archibugi, J. Michie, Trade, Growth and Technical Change, Cambridge University Press, Cambridge, 1998.
[11] D. Archibugi, M. Pianta, The Technological Specialization of Advanced Countries. A Report to the EEC on International Science and Technology Activities, Kluwer, Boston, 1992.
[12] J. James, An institutional critique of recent attempts to measure technological capabilities across countries, Journal of Economic Issues 40 (3) (2006) 743-766.
[13] S. Lall, C. Pietrobelli, Failing to Compete: Technology Development and Technology Systems in Africa, Edward Elgar, Cheltenham, 2002.
[14] C. Antonelli, The Economics of Innovation, New Technologies and Structural Change, Routledge, London, 2003.
[15] H. Grupp, M.E. Mogee, Indicators for national science and technology policy: How robust are composite indicators? Research Policy 33 (9) (2004) 1373-1384.
[16] H. Grupp, How Robust are Composite Innovation Indicators for Evaluating the Performance of National Innovation Systems?, paper presented at the “SPRU 40th Anniversary Conference - The Future of Science, Technology and Innovation Policy”, Brighton, 11-13 September 2006.
[17] H.S. Moon, J. D. Lee, A fuzzy set theory approach to national composite S&T indices, Scientometrics 64 (1) (2005) 67-83.
29
[18] M. Nardo, M. Saisana, A Saltelli, S. Tarantola, A. Hoffman., E. Giovannini, Handbook on Constructing Composite Indicators: Methodology and User Guide, OECD Statistics Working Paper, Paris, 2005.
[19] F. Castellacci, D. Archibugi, The technology clubs: The distribution of knowledge across nations, Research Policy 37 (10) (2008) 1659-1673.
[20] D. Archibugi, A. Coco, Measuring Technological Capabilities at the Country Level: A Survey and a Menu for Choice, Research Policy 34 (2) (2005) 175-194.
[21] T.C. Koopmans, Measurement without Theory, Review of Economics and Statistics, 29 (3) (1947) 161-172.
[22] N. Rosenberg, Perspective on Technology, Cambridge University Press, Cambridge 1976.
[23] C. Freeman, L. Soete, Science, Technology and Innovation Indicators: The Twenty-first Century Challenges, in: OECD, Science, Technology and Innovation Indicators in a Changing World: Responding to Policy Needs, OECD, Paris, 2007.
[24] M. Polanyi, The Tacit Dimension, Routledge & Kegan Paul, London, 1966.
[25] S.N. Durlauf, P.A. Johnson, Multiple regimes and cross-country growth behaviour, Journal of Applied Econometrics 10 (4) (1995) 365-384.
[26] D. Archibugi, A. Coco, A New Indicator of Technological Capabilities for Developed and Developing Countries (ArCo), World Development 32 (4) (2004) 629-654.
[27] UNDP, Human Development Report. Making New Technologies Work for Human Development, Oxford University Press, New York, 2001.
[28] Rand Corporation, Science and Technology Collaboration: Building Capacity in Developing Countries?, Rand Corporation, Santa Monica (CA), 2002.
[29] C.S. Wagner E Horlings. A Dutta, Can Science and Technology Capacity be Measured?, Rand Corporation, Santa Monica, California, 2002.
[30] IMD, World Competitiveness Yearbook, IMD, Lausanne, 2007.
[31] J.D. Roessner, A.L. Porter, N. Newman, D. Cauffiel, Anticipating the future high-tech competitiveness of nations: Indicators for twenty-eight countries, Technological Forecasting and Social Change 51 (2) (1996) 133-149.
[32] A.L. Porter, J.D. Roessner, J. Xiao-Yin, N. Newman, Changes in national technological competitiveness: 1990, 1993, 1996 and 1999, Technology Analysis & Strategic Management 13 (4) (2001) 477-496.
[33] National Science Foundation, Science and Engineering Indicators 2008, NSF, Washington DC, 2008.
[34] E. Yglesias, Porter vs. Porter: Modelling the technological competitiveness of nations, Scientometrics 57 (2) (2003) 281-293.
[35] B. Godin, Science, accounting and statistics: The Input–Output framework, Research Policy 36 (2007) 1388-1403.
[36] S. Lall, Competitiveness indices and developing countries: An economic evaluation of the global competitiveness report, World Development 29 (9) (2001) 1501-1525.
[37] World Economic Forum, The Global Competitiveness Report, Palgrave Macmillan, Houndmills, 2004.
[38] World Economic Forum, The Global Competitiveness Report, Palgrave Macmillan, Houndmills, 2005.
[39] World Economic Forum, The Global Competitiveness Report, Palgrave Macmillan, Houndmills, 2006.

30
[40] UNIDO, Industrial Development Report. Capability Building for Catching-Up. Historical, Empirical and Policy Dimensions, UNIDO, Vienna, 2005.
[41] UNCTAD, World Investment Report. Transnational Corporations and the Internationalization of R&D, UNCTAD, Geneve, 2005.
[42] W.M. Cohen, D.A. Levinthal, Innovation and earning: The two faces of R&D, Economic Journal 99 (397) (1989) 569-596
[43] OECD, Science, Technology and Industry Scoreboard 2007, Paris, 2008.
[44] OECD, Main Science Technology Indicators 2008, Paris, 2008.
[45] I. Álvarez, G. Magaña, ICT and development: A new indicator for international comparisons, International Journal of Technology and Globalisation 4 (2) (2008) 170-185.
[46] European Commission, Directorate-General for Enterprise and Industry, European Innovation Scoreboard Report 2008, Brussels, 2009.

31
SECOND PART
THE GLOBAL INNOVATION SCOREBOARD 2008:
THE DYNAMICS OF THE INNOVATIVE PERFORMANCES OF COUNTRIES
32
1. Introduction
The new Global Innovation Scoreboard 2008 (GIS 2008) aims at providing an overview on the main trends, results and determinants of the innovative performance of countries across the world.
The results show that over the last decade there is a stable group of countries which are firmly within the top performers, which includes Sweden, Switzerland, Finland, Israel and Japan. These countries base their innovative performance mainly on the innovative activities of their business sector. However, behind the leaders, there is a large group of countries which has been remarkably narrowing the gap with respect to the leaders, and it includes emerging countries like the Republic of Korea and Singapore. At the bottom of the ranking there are emerging countries, such as three of the four BRIC countries, Brazil, China and India, which have undertaken a catching-up process by considerably increasing their innovative performances.
Regarding EU countries, they perform at all the levels of performance across the GIS, i.e. there are Member States at the top and bottom of the rankings. However, although there is clearly a strong structural component to innovation performance, we do observe transitions over time. In particular several of the EU15 have moved from the 3rd to the 2nd group (UK, Austria, Belgium) and a number of lower performing EU Member States have moved from the 4th to 3rd groupings (Spain, Italy, Czech Republic, Estonia, Portugal, Greece, Lithuania, Hungary). On the other hand, some of the EU countries have shown the slowest rate of growth in the GIS index (e.g. Romania, Slovak Republic, Latvia, Bulgaria, Poland) (cf. Figure 7).
Overall, the GIS 2008 findings confirm the need for policy makers to start thinking beyond the triadic division – the United States, Europe and Japan - also when they deal with technological capabilities and innovative performances. This is likely leading to a rising need and room for innovative policy carried out at regional level.
2. Global Innovation Scoreboard: aims and methodology
2.1 Aim and objectives
The new Global Innovation Scoreboard 2008 (GIS 2008) represents a complementary tool with respect to the European Innovation Scoreboard. The GIS 2008 is focused on the medium-term dynamics and it aims at providing an overview on the main trends, results and determinants of the innovative performance of countries across the world.
The GIS 2008 explores the innovation performance of the EU27 countries and other major R&D spenders in the world: Argentina, Australia, Brazil, Canada, China, Hong Kong, India, Israel, Japan, New Zealand, Republic of Korea, Mexico, Russian Federation, Singapore, South Africa and the United States.
2.2 The methodology and the indicators
The GIS 2008 methodology includes 9 indicators of innovation and technological capabilities (see Table 1)19. They are grouped in three main dimensions (pillars): Firm
19 See the Appendix for a detailed list of the indicators.
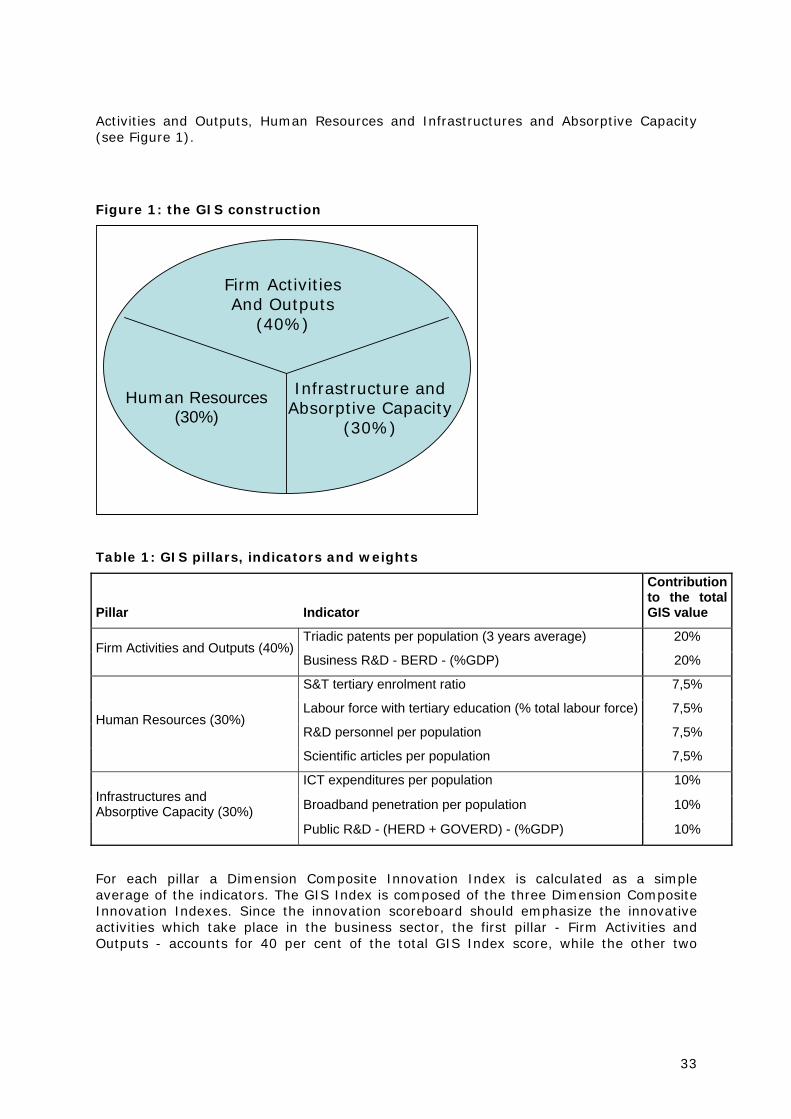
33
Activities and Outputs, Human Resources and Infrastructures and Absorptive Capacity (see Figure 1).
Figure 1: the GIS construction
Table 1: GIS pillars, indicators and weights
Pillar Indicator
Contribution to the total GIS value
Triadic patents per population (3 years average) 20% Firm Activities and Outputs (40%)
Business R&D - BERD - (%GDP) 20%
S&T tertiary enrolment ratio 7,5%
Labour force with tertiary education (% total labour force) 7,5%
R&D personnel per population 7,5% Human Resources (30%)
Scientific articles per population 7,5%
ICT expenditures per population 10%
Broadband penetration per population 10% Infrastructures and Absorptive Capacity (30%)
Public R&D - (HERD + GOVERD) - (%GDP) 10%
For each pillar a Dimension Composite Innovation Index is calculated as a simple average of the indicators. The GIS Index is composed of the three Dimension Composite Innovation Indexes. Since the innovation scoreboard should emphasize the innovative activities which take place in the business sector, the first pillar - Firm Activities and Outputs - accounts for 40 per cent of the total GIS Index score, while the other two
Firm ActivitiesAnd Outputs
(40%)
Human Resources(30%)
Infrastructure andAbsorptive Capacity
(30%)
34
pillars - Human Resources and Infrastructures and Absorptive Capacity - account for 30 per cent each (cf. Figure 1)20.
As with the EIS (European Innovation Scoreboard) and previous GIS, the GIS Index 2008 is an indicator of intensity: all values are weighted to account for the different size of nations. Accordingly, the GIS index measures the relative performance of countries. All variables are normalized on a scale from 0 to 1, and countries are ranked on an ordinary scale. The GIS index 2008 is calculated relative to two different years – 1995 and 2005 – to explore the dynamics of national innovative performance21.
3. Global Innovation Scoreboard: main findings
3.1 The GIS Index
In Table 2 the global innovation performance of countries is summarized by showing their ranks for the GIS and each of the three pillars relative to years 1995 and 2005.22 Concerning 2005, the top ten countries perform differently across the three pillars. Switzerland, Japan, Republic of Korea and Germany show excellent relative performance in Business innovative activities. Finland, Israel and Canada are particularly strong in Human Resources. Finally, Sweden and Denmark are well-positioned regarding their Infrastructures and Absorptive Capacity. By comparing the 2005 GIS ranks to 1995 as a whole, it emerges the structural stability of innovation performance and technological capabilities: countries rank in fact fairly stably over ten years both in terms of GIS Index and single pillars23. However, although the structural component of the innovation performance, some remarkable transitions over time do occur as it is shown in the following. There is a stable group of countries within the top performers over the last decade: Sweden, Switzerland, Finland, Israel and Japan (while the United States drops out from the leaders in 2005). The fastest improving countries are China, which climbs eight positions (+8), Singapore (+7), Portugal (+7), Spain (+6), Cyprus (+5), Turkey (+5) and Brazil (+5). Singapore bases its increase mainly on Firm Activities and Human Resources, and Spain and Portugal particularly on Human Resources. China shows its best performance relative to Firm Activities and Infrastructures and Absorptive Capacity, while it looses three positions on Human Resources. Brazil shows strong increases in Firm activities and Infrastructures and Absorptive Capacity and a moderate increase in Human Resources. As for the other BRIC countries, India improves one position and the Russian Federation looses two positions.
The EU27 reaches the twentieth position, showing a good performance particularly on Firm Activities. The balanced innovation performance of the EU27 emerges from Figure 2 where it is worth-observing how the three pillars have the same importance. The Unites States shows a composition similar to that of the EU27, while Japan’s innovation performance is more based on business activities.
20 Accordingly, the GIS Index scores are calculates as follows: (pillar_1 * 0.4) + (pillar_2 * 0.3) + (pillar_3 * 0.3). 21 One of the main results of the first part of the Thematic Paper is the fact that the accumulation of technological capabilities is a structural phenomenon of the economic systems. Consequently, to address the dynamics of this process a span of ten years has been chosen. For some countries and the EU27 block the GIS is not calculated relative to 1995 due to a lack of data availability. Much of the data is not available on a comparative basis for years after 2005. 22 See Table A in the Annex for GIS index scores, pillars scores and 1995-2005 variations. 23 GIS rank correlation relatively to 1995 and 2005 is equal to 0.94, while it is around 0.90 for the three pillars.

35
Figure 2: Global Innovation Performance
0.00 0.10 0.20 0.30 0.40 0.50 0.60 0.70 0.80
RomaniaLatvia
IndiaArgentina
South AfricaMexico
BrazilPolandTurkey
MaltaBulgaria
Slovak Rep.CyprusCroatia
ChinaHungaryLithuania
GreecePortugal
Russian Fed.Estonia
Czech Rep.Italy
SloveniaSpain
IrelandNew Zealand
Hong KongEU27
LuxembourgAustraliaBelgium
United KingdomNorw ayAustriaFrance
SingaporeNetherlands
GermanyCanada
Korea, Rep.Denmark
United StatesJapanIsrael
FinlandSw itzerland
Sw eden
Firm activities and outputs Human Resources Infrastructure and Absorptive Capacity

36
Table 2: GIS: ranks and ranks variations24 for each pillar, 1995 and 2005
GIS Index Firm Activities Human Resources Infrastructures and Absorptive Capacity
Country rank 2005
rank variation
rank 2005
rank variation
rank 2005
rank variation
rank 2005
rank variation
Sweden 1 0 4 -3 4 -2 1 1 Switzerland 2 0 2 0 5 -2 3 6 Finland 3 3 5 -1 1 3 2 12 Israel 4 1 3 4 3 -2 11 -7 Japan 5 -1 1 2 13 -3 9 -4 United States 6 -3 8 -2 6 -1 7 -6 Denmark 7 3 10 3 8 1 4 7 Korea, Rep. 8 4 7 5 7 10 14 -4 Canada 9 0 18 0 2 5 8 -1 Germany 10 -2 6 -1 17 -1 17 3 Netherlands 11 -4 9 1 20 -1 6 0 Singapore 12 7 15 6 10 11 10 2 France 13 -2 13 -4 18 -7 12 3 Austria 14 4 12 4 25 1 16 -8 Norway 15 2 20 -3 14 4 5 8 United Kingdom 16 -2 17 -3 12 2 13 9 Belgium 17 -4 14 -3 23 -11 18 3 Australia 18 -3 19 0 9 n/a 19 -3 Luxembourg 19 n/a 11 -3 21 19 n/a n/a EU-27 20 -3 16 -1 19 -4 21 -2 Hong Kong 21 n/a 32 2 n/a n/a 15 -12 New Zealand 22 0 23 6 26 -18 20 3 Ireland 23 1 21 -1 16 7 23 1 Spain 24 6 28 0 15 10 24 4 Slovenia 25 -2 22 0 28 -4 25 -8 Italy 26 2 26 -3 32 -4 22 3 Czech Republic 27 4 24 0 29 0 28 6 Estonia 28 -2 33 4 27 0 27 -9 Russian Fed. 29 -2 27 -1 11 2 42 -3 Portugal 30 7 35 3 31 8 26 3 Greece 31 4 43 -8 24 8 35 -2 Lithuania 32 -3 41 5 30 -8 29 -3 Hungary 33 1 31 -1 38 -4 30 1 China 34 8 25 7 48 -3 31 9 Croatia 35 n/a n/a n/a 36 -5 43 0 Cyprus 36 5 42 2 37 0 33 5 Slovak Republic 37 -11 39 -12 34 -14 39 -12 Bulgaria 38 -5 47 -11 33 -3 37 -7 Malta 39 n/a 29 13 47 -1 n/a n/a Turkey 40 5 38 3 44 3 34 3 Poland 41 -3 45 -12 39 -1 36 -4 Brazil 42 5 34 11 46 2 32 10 Mexico 43 -2 40 3 35 0 44 -3 South Africa 44 n/a 30 1 45 -1 n/a n/a Argentina 45 -1 46 -7 40 3 41 -6 India 46 1 36 11 42 0 38 7 Latvia 47 -6 37 3 43 -7 40 -4 Romania 48 -12 44 -19 41 -8 45 -1
24 Rank variations are calculated using the scores for those countries for which both 1995 and 2005 data are available. Rank variations are thus not obscured by the entrance of countries in 2005 for which data were not available for 1995.
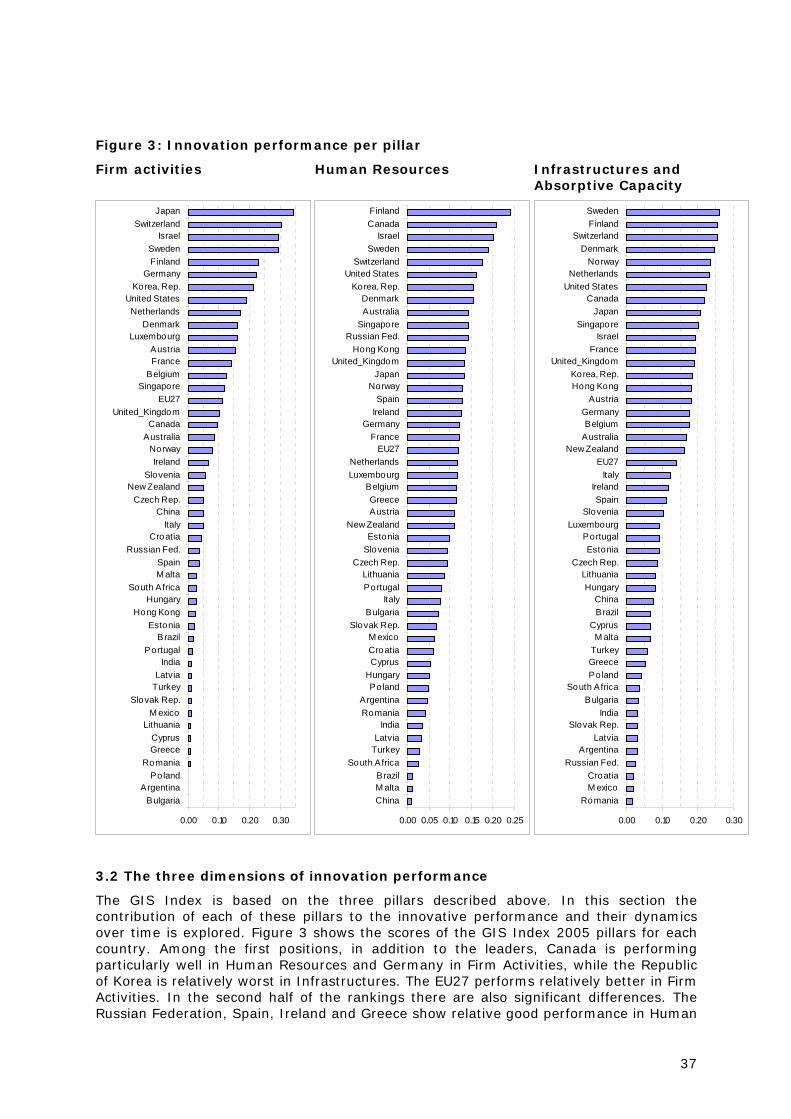
37
Figure 3: Innovation performance per pillar
Firm activities
0.00 0.10 0.20 0.30
BulgariaArgentina
PolandRomania
GreeceCyprus
LithuaniaM exico
Slovak Rep.TurkeyLatvia
IndiaPortugal
BrazilEstonia
Hong KongHungary
South AfricaM altaSpain
Russian Fed.Croatia
ItalyChina
Czech Rep.New Zealand
SloveniaIreland
NorwayAustraliaCanada
United_KingdomEU27
SingaporeBelgiumFranceAustria
LuxembourgDenmark
NetherlandsUnited States
Korea, Rep.Germany
FinlandSweden
IsraelSwitzerland
Japan
Human Resources
0.00 0.05 0.10 0.15 0.20 0.25
ChinaM altaBrazil
South AfricaTurkeyLatvia
IndiaRomaniaArgentina
PolandHungaryCyprusCroatiaM exico
Slovak Rep.Bulgaria
ItalyPortugalLithuania
Czech Rep.SloveniaEstonia
New ZealandAustriaGreece
BelgiumLuxembourgNetherlands
EU27France
GermanyIrelandSpain
NorwayJapan
United_KingdomHong Kong
Russian Fed.SingaporeAustraliaDenmark
Korea, Rep.United States
SwitzerlandSweden
IsraelCanadaFinland
Infrastructures and Absorptive Capacity
0.00 0.10 0.20 0.30
RomaniaM exicoCroatia
Russian Fed.Argentina
LatviaSlovak Rep.
IndiaBulgaria
South AfricaPolandGreeceTurkeyM alta
CyprusBrazilChina
HungaryLithuania
Czech Rep.Estonia
PortugalLuxembourg
SloveniaSpain
IrelandItaly
EU27New Zealand
AustraliaBelgium
GermanyAustria
Hong KongKorea, Rep.
United_KingdomFrance
IsraelSingapore
JapanCanada
United StatesNetherlands
NorwayDenmark
SwitzerlandFinlandSweden
3.2 The three dimensions of innovation performance
The GIS Index is based on the three pillars described above. In this section the contribution of each of these pillars to the innovative performance and their dynamics over time is explored. Figure 3 shows the scores of the GIS Index 2005 pillars for each country. Among the first positions, in addition to the leaders, Canada is performing particularly well in Human Resources and Germany in Firm Activities, while the Republic of Korea is relatively worst in Infrastructures. The EU27 performs relatively better in Firm Activities. In the second half of the rankings there are also significant differences. The Russian Federation, Spain, Ireland and Greece show relative good performance in Human

38
Resources, while China, Malta and South Africa perform relatively better in Firm Activities.
Figure 4: Global Innovation Scoreboard, ranking variations 1995-2005 for each pillar
Firm activities
-20 -10 0 10
RomaniaSlovak Republic
PolandBulgariaGreece
ArgentinaFrance
SwedenNorway
United_KingdomBelgium
LuxembourgItaly
United StatesFinland
GermanyEU-27Ireland
Russian Fed.Hungary
SwitzerlandCanada
AustraliaSpain
SloveniaCzech Republic
NetherlandsSouth Africa
JapanHong Kong
CyprusDenmarkPortugal
TurkeyM exico
LatviaIsrael
AustriaEstonia
Korea, Rep.Lithuania
SingaporeNew Zealand
ChinaBrazilIndia
M alta
Human Resources
-15 -10 -5 0 5 10 15
Hong KongSlovak Republic
EstoniaAustria
SloveniaIsrael
BulgariaUnited States
ArgentinaJapan
Korea, Rep.PolandLatvia
AustraliaRussian Fed.
LithuaniaM exico
EU-27GreeceCanada
RomaniaNetherlands
CroatiaSwedenIreland
HungarySingaporeGermany
FranceBelgium
New ZealandItaly
PortugalTurkeySpain
CyprusSwitzerland
Czech RepublicDenmark
IndiaNorway
United_KingdomChinaBrazil
Finland
Infrastructures and Absorptive Capacity
-15 -10 -5 0 5 10 15
Hong KongSlovak Republic
EstoniaAustria
SloveniaIsrael
BulgariaUnited States
ArgentinaJapan
Korea, Rep.PolandLatvia
AustraliaRussian Fed.
LithuaniaM exico
EU-27GreeceCanada
RomaniaNetherlands
CroatiaSwedenIreland
HungarySingaporeGermany
FranceBelgium
New ZealandItaly
PortugalTurkeySpain
CyprusSwitzerland
Czech RepublicDenmark
IndiaNorway
United_KingdomChinaBrazil
Finland
Figure 4 reports the ranking variations over the period 1995-2005 for each of the tree pillars. The 1995-2005 rank variations relative to the pillar Firm Activities and Outputs reflect the major dynamism of three BRIC countries, namely Brazil, China and India – in addition to Malta - concerning their business innovative performances as measured by patenting activity and business R&D expenditures. Among the top performers, some have been losing ground relative to the other countries, i.e. the United States, Sweden, Norway, United Kingdom, Germany and France. On the other hand, some top performers

39
have been increasing their position: Singapore, Japan, Republic of Korea, Israel and Denmark. The 1995-2005 rank variations relative to the pillar Human Resources show that Luxembourg, Greece, Republic of Korea, Ireland, Singapore, Portugal and Spain are the best gainers. China looses some positions; India holds its position while Brazil and the Russian Federation moderately improve. It is worth noting that among the countries loosing positions relatively to the others there are some advanced economies, i.e. the United States, Switzerland, Sweden, Japan, Italy, France, Belgium, Germany and the EU27 as a whole. The 1995-2005 rank variations relative to the pillar Infrastructures and Absorptive Capacity show that the more dynamic countries include three BRIC countries, Brazil, China and India, in addition to the Czech Republic, Denmark, Finland, Norway, Switzerland and the United Kingdom.
In Figure 5 the relative contributions of the three pillars relatively to the GIS 2005 are reported. The relative contribution of the innovative performance of the business sector - Firm Activities and Outputs – is particularly important for the first 19 countries’, with the exception of Canada, Norway and Australia including Luxembourg. Interestingly, also China shows a relative high score in innovative activities taking place in the business sector. Among the BRIC countries, Human Resources play an important role relatively to the Russian Federation and India, while Brazil and China show higher contributions concerning Infrastructures and Absorptive Capacity. The Human Resources pillar seems to play a fundamental role for the countries at the middle of the ranking, in addition to Mexico and Romania. Finally, the relative importance of the pillar Infrastructures and Absorptive Capacity is more heterogeneously distributed along the ranking.

40
Figure 5: Global Innovation Performance, pillar composition, (total=1)
0.00 0.10 0.20 0.30 0.40 0.50 0.60 0.70 0.80 0.90 1.00
RomaniaLatvia
IndiaArgentina
South AfricaMexico
BrazilPolandTurkey
MaltaBulgaria
Slovak Rep.CyprusCroatia
ChinaHungaryLithuania
GreecePortugal
Russian Fed.Estonia
Czech Rep.Italy
SloveniaSpain
IrelandNew Zealand
Hong KongEU-27
LuxembourgAustraliaBelgium
United KingdomNorw ayAustriaFrance
SingaporeNetherlands
GermanyCanada
Korea, Rep.Denmark
United StatesJapanIsrael
FinlandSw itzerland
Sw eden
Firm Activities and Outputs Human Resources Infrastructures and Absorptive Capacity

41
4. The dynamic of the innovative performances of countries
4.1 The dynamic of the innovative performances
The countries are divided into groups25 depending on their innovative performance as measure by the GIS Index both in 1995 and 2005. Based on the ranking of their GIS Index 1995 scores the countries can be divided into the following four groups of countries:
• Group 1: Sweden, Switzerland, United States, Finland, Israel and Japan;
• Group 2: Netherlands, Germany, Denmark, Republic of Korea, Canada and France;
• Group 3: Singapore, Austria, Norway, United Kingdom, Belgium, Australia, EU27, New Zealand, Ireland and Slovenia;
• Group 4: Spain, Italy, Czech Republic, Estonia, Russian Federation, Portugal, Greece, Lithuania, Hungary, China, Cyprus, Slovak Republic, Bulgaria, Turkey, Poland, Brazil, Mexico, Argentina, India, Latvia and Romania.
Based on the ranking of their GIS Index 2005 scores the countries can be divided into the following four groups of countries:
• Group 1: Sweden, Switzerland, Finland, Israel and Japan;
• Group 2: United States, Denmark, Republic of Korea, Canada, Germany, Netherlands, Singapore, France, Austria, Norway, United Kingdom, Belgium, Australia and EU27;
• Group 3: New Zealand, Ireland, Spain, Slovenia, Italy, Czech Republic, Estonia and Russian Federation, Portugal, Greece, Lithuania and Hungary;
• Group 4: China, Cyprus, Slovak Republic, Bulgaria, Turkey, Poland, Brazil, Mexico, Argentina, India, Latvia and Romania.
25 In this section we exclude those countries for which we were not able to calculate the GIS index relative to 1995.
The group classification is based on hierarchical cluster analysis using complete linkage between groups.
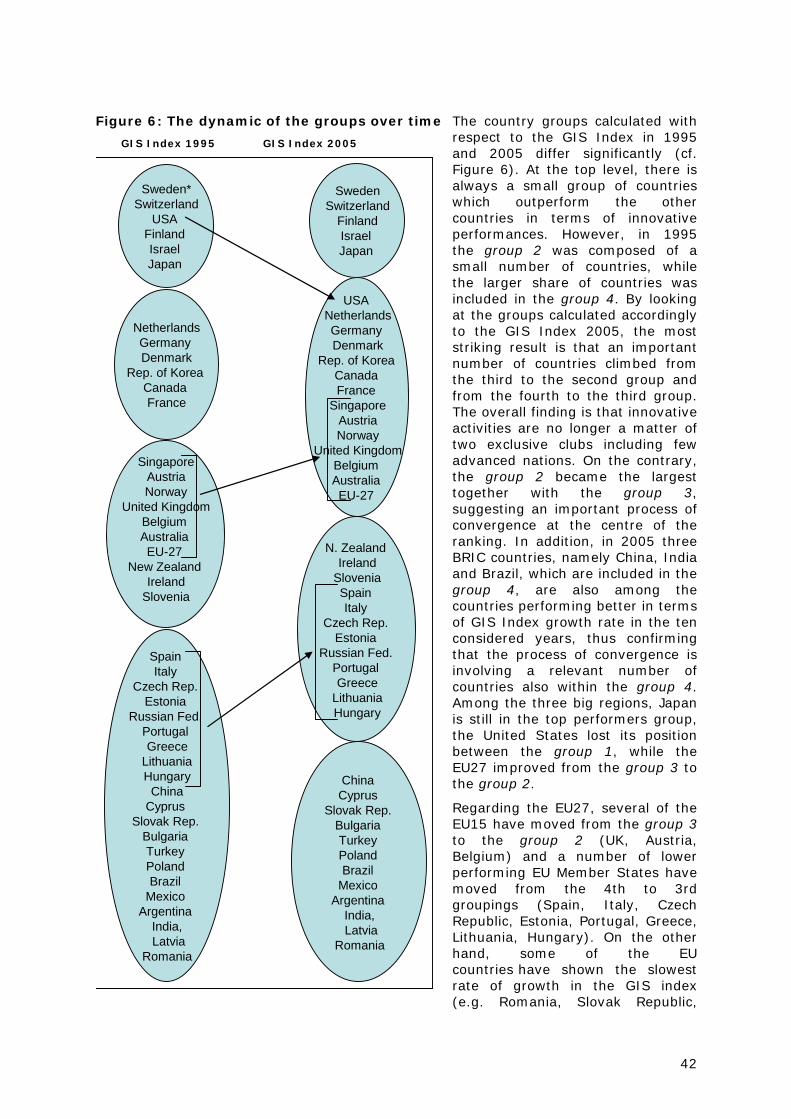
42
The country groups calculated with respect to the GIS Index in 1995 and 2005 differ significantly (cf. Figure 6). At the top level, there is always a small group of countries which outperform the other countries in terms of innovative performances. However, in 1995 the group 2 was composed of a small number of countries, while the larger share of countries was included in the group 4. By looking at the groups calculated accordingly to the GIS Index 2005, the most striking result is that an important number of countries climbed from the third to the second group and from the fourth to the third group. The overall finding is that innovative activities are no longer a matter of two exclusive clubs including few advanced nations. On the contrary, the group 2 became the largest together with the group 3, suggesting an important process of convergence at the centre of the ranking. In addition, in 2005 three BRIC countries, namely China, India and Brazil, which are included in the group 4, are also among the countries performing better in terms of GIS Index growth rate in the ten considered years, thus confirming that the process of convergence is involving a relevant number of countries also within the group 4. Among the three big regions, Japan is still in the top performers group, the United States lost its position between the group 1, while the EU27 improved from the group 3 to the group 2.
Regarding the EU27, several of the EU15 have moved from the group 3 to the group 2 (UK, Austria, Belgium) and a number of lower performing EU Member States have moved from the 4th to 3rd groupings (Spain, Italy, Czech Republic, Estonia, Portugal, Greece, Lithuania, Hungary). On the other hand, some of the EU countries have shown the slowest rate of growth in the GIS index (e.g. Romania, Slovak Republic,
Figure 6: The dynamic of the groups over time
GIS Index 1995 GIS Index 2005
Sweden*Switzerland
USA Finland Israel Japan
NetherlandsGermany Denmark
Rep. of Korea Canada France
SingaporeAustriaNorway
United KingdomBelgiumAustralia EU-27
New Zealand Ireland
Slovenia
Spain Italy
Czech Rep. Estonia
Russian Fed.Portugal Greece
Lithuania Hungary
China Cyprus
Slovak Rep.Bulgaria Turkey Poland Brazil
Mexico Argentina
India,Latvia
Romania
SwedenSwitzerland
Finland Israel Japan
USA NetherlandsGermany Denmark
Rep. of Korea Canada France
SingaporeAustriaNorway
United KingdomBelgiumAustralia EU-27
N. Zealand Ireland
SloveniaSpain Italy
Czech Rep. Estonia
Russian Fed.Portugal Greece
Lithuania Hungary
China Cyprus
Slovak Rep.Bulgaria Turkey Poland Brazil
Mexico Argentina
India,Latvia
Romania

43
Latvia, Bulgaria, Poland) (cf. Figure 7).
4.2 Convergence analysis
In Figure 7 the GIS 95 Index and the GIS index growth26 over the period 1995-2005 are plotted. Although it is not possible to observe a general process of convergence, some interesting evidence emerges. First, all the countries on the right side, which are those performing above the average relative to the GIS Index 95, perform moderately under the average growth performance, with the exception of Singapore, Republic of Korea and Finland. Concerning the group 3 there exists a process of convergence within the group. Those countries which performed worst such as Portugal, Greece, Spain and the Czech Republic show a higher performance with respect to the other countries belonging to the same group. Finally, the group 4 have shown the strongest growth over the last decade and the largest variability. Here a marked process of divergence within this group is evident: a sub-group of countries, i.e. Brazil, India, China and Turkey, show growth rates of innovative performance well above the average. On the contrary, another sub-group of countries, in particular Bulgaria, Romania and Slovak Republic, are increasingly loosing ground.
Figure 7: Convergence per groups of countries*
Note: axes cross at average values
* Countries are grouped according to GIS Index 2005
Overall, the process of convergence does not involve all the countries. In particular, both within the group 3 and the group 4 there are countries which show very high average
26 The GIS index growth is calculated relative to the GIS index scores of countries (see also Table A in the Annex).
Switzerland
FinlandIsrael
Japan
United States
DenmarkCanada
Singapore
Belgium
Spain
Italy
Russian Fed.
Portugal
Greece
Lithuania
Hungary
China
BulgariaPoland
Mexico
India
Latvia
Romania
Sweden
Korea, Rep.
GermanyNetherlandsFrance
AustriaNorway
UKAustralia
EU27New Zealand
Ireland
Slovenia
Czech Rep.
Estonia
Cyprus
Slovak Rep.
Turkey
Brazil
Argentina
GIS Index 95
GIS
Inde
x gr
owth
(95-
2005
)
group 4
group 3
group 2 group 1

44
growth rates over the decade 1995-2005 and which are reducing progressively the gap with the group 1 and group 2. On the other hand, there is a group of countries which is not involved in this catching-up process and which has seen a widening of the innovative gap with respect to the leaders.
4.3 The drivers of the innovative performances
In this section the drivers of the innovative performances of countries are analysed in terms of the three GIS Index pillars, from a cross-countries and over-time perspective. The analysis is based on the four groups calculated relative to the GIS Index 2005 scores.
Table 3 reports some economic figures and innovative performances divided per groups relative to 2005. As expected, the long-term relationship between GDP and technological capabilities is confirmed by the fact that GDP per capita declines across the four groups according to the innovative performance. However, by observing the GDP growth rates, the relationship is exactly the opposite.
Table 3: Economic and innovation performance per group*
Group 1 Group 2 Group 3 Group 4
Economic performance
GDP per capita (average 2004-2006) 22,468 21,216 18,618 9,673
GDP per capita (growth 2004-2006) 1.83 1.47 2.83 4.10
GDP per capita (growth 1995 – 2006) 1.75 2.23 3.90 3.92
Innovation performance
GIS Index (growth 1995 – 2005) 1.10 0.67 2.15 4.83
Firm Activities and Outputs (growth 1995 – 2005) 1.15 -0.21 5.30 16.7
Human Resources (growth 1995 – 2005) 0.34 0.21 2.09 4.1
Infrastructures and Absorptive Capacity (growth 1995 – 2005) 1.81 1.80 3.6 12.2
* Groups are based on the 2005 GIS Index scores (see Figure 6)
Table 3 also shows the innovative performances of countries in terms of 1995-2005 growth rates relatively to the GIS Index and the three pillars (see also Table A in the Annex). The dynamic characterizing the GIS Index confirms the findings pointed out above. The group 4 are those showing a GIS Index growth rate equal on average to 4.83%, the group 3 2.15%, while the two groups of the top performers around 1%27. Important differences also emerge between countries at pillar level. In general, the most dynamic pillar is Firm Activities, while the most static one is Human Resources. By looking at a group level, the group 3 and the group 4 show remarkable growth rates especially for Firm Activities and Infrastructures. The Human Resources factor plays an important role mainly for the low-performers countries – groups 3 and 4. Both Firm Activities and Infrastructures and Absorptive Capacity play an important role both for top performers and lagging countries. Concerning Human Resources, it is likely that there is little room for increases in the advanced countries, while there seems to be a good deal of room for improvement for group 3 and group 4 which are at a lower stage of development. However, it also emerges how between the 3 pillars Human Resources is the more “structural” relative to any stage of development.
27 It must also be noted that the standard deviation of the GIS Index growth rates is progressively higher for groups 3 and 4 as compared to groups 1 and 2 (Cf. Figure 7 and the related discussion).
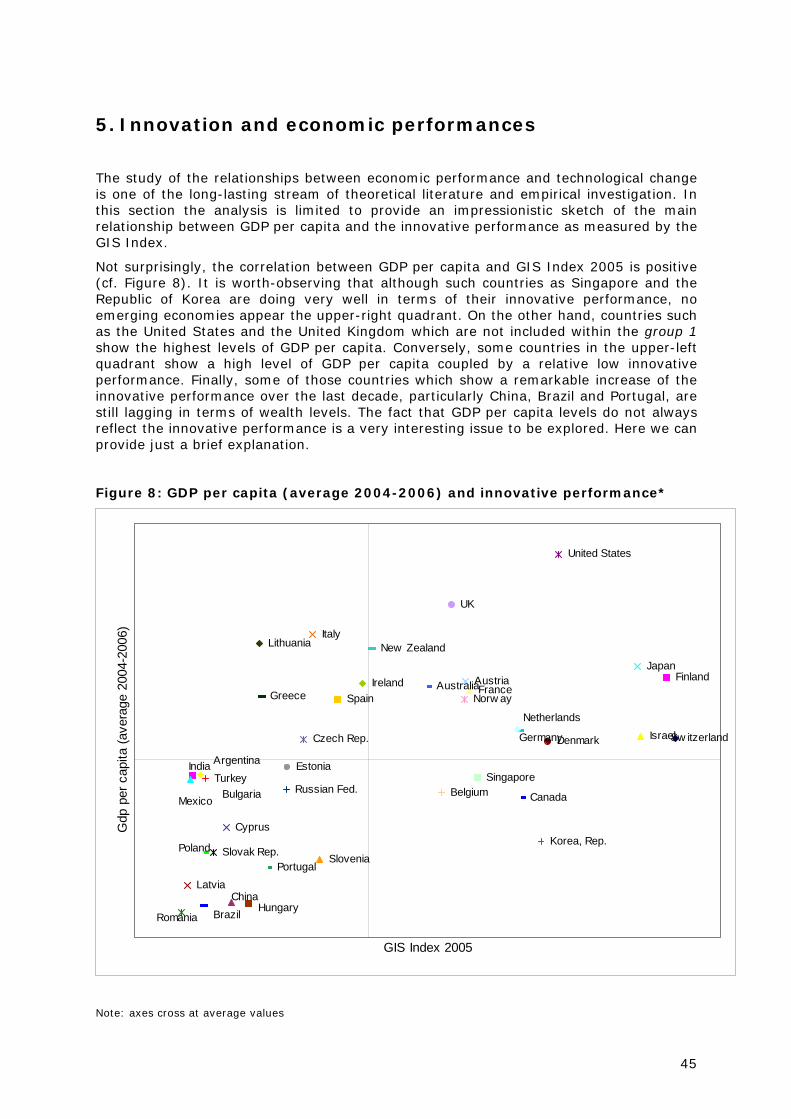
45
5. Innovation and economic performances The study of the relationships between economic performance and technological change is one of the long-lasting stream of theoretical literature and empirical investigation. In this section the analysis is limited to provide an impressionistic sketch of the main relationship between GDP per capita and the innovative performance as measured by the GIS Index.
Not surprisingly, the correlation between GDP per capita and GIS Index 2005 is positive (cf. Figure 8). It is worth-observing that although such countries as Singapore and the Republic of Korea are doing very well in terms of their innovative performance, no emerging economies appear the upper-right quadrant. On the other hand, countries such as the United States and the United Kingdom which are not included within the group 1 show the highest levels of GDP per capita. Conversely, some countries in the upper-left quadrant show a high level of GDP per capita coupled by a relative low innovative performance. Finally, some of those countries which show a remarkable increase of the innovative performance over the last decade, particularly China, Brazil and Portugal, are still lagging in terms of wealth levels. The fact that GDP per capita levels do not always reflect the innovative performance is a very interesting issue to be explored. Here we can provide just a brief explanation.
Figure 8: GDP per capita (average 2004-2006) and innovative performance*
Sw itzerland
Finland
Israel
Japan
United States
Denmark
Korea, Rep.
Canada
Singapore
FranceAustriaNorw ay
UK
Belgium
Australia
New Zealand
IrelandSpain
Slovenia
Italy
Czech Rep.
Estonia
Russian Fed.
Portugal
Greece
Lithuania
Cyprus
Slovak Rep.
BulgariaTurkey
Latvia
Germany
Netherlands
HungaryChina
Poland
Brazil
Mexico
ArgentinaIndia
Romania
GIS Index 2005
Gdp
per
cap
ita (a
vera
ge 2
004-
2006
)
Note: axes cross at average values

46
Firstly, the GIS measures both innovative performances and technological capabilities. The latter represent the condition sine qua non to create, absorb and diffuse technological innovations across an economic system, which in turn spur economic growth in the long term. Secondly, the processes of the economic systems which “transpose” the stock of the acquired technological capabilities and knowledge into long-term growth do not occur instantaneously but rather can take a long time. Lastly, innovation does not take place in isolation. Although the GIS takes into account several dimensions of the innovative activities, several other factors affect the way in which innovation performance spurs long-term growth, such as institutions, market structure and industrial policies.
6. The innovative performances of the BRIC countries
Over the last decades, among the emerging nations, the BRIC countries – Brazil, Russian Federation, India and China – have emerged at the centre of the economic and political stage, also for the considerable size of their economies. However, as far as the innovative performance is concerned, the GIS Index is inherently an intensity methodology and hence it is not affected by the size of the considered economic systems. Relatively to the GIS Index 2005, the Russian Federation is the only one among the BRIC countries included within the group 3, while the others are included in the group 4. This reflects the fact that all the measures are re-scaled to some indicator of dimension, mainly population and GDP. However, when the dynamics of the innovative performances are considered, the BRIC countries are among the top performers. Figure 7 clearly confirms this fact: Brazil, India and China show the higher GIS growth rates over the period 1995-2005. In terms of pillars’ rankings variation (cf. Figure 4 and Figure 10), India, Brazil and China are the best performers (in addition to Malta) relative to Firm Activities. Concerning Human Resources, only the Russian Federation and Brazil gain some positions. Finally, Brazil, China and India are again among the top performers in terms of Infrastructures and Absorptive Capacity. As far as their performance structure is concerned (cf. Figure 5), China shows a relative focus on Firm Activities and Infrastructures and Absorptive Capacity, the Russian Federation is particularly strong in Human Resources. The innovative performance of Brazil is heavily based on Infrastructures and Absorptive Capacity while it lacks both Firm Activities and Human Resources. Finally, India’s performance is mainly grounded on Human Resources and Infrastructures and Absorptive Capacity. To summarize, the dynamism which have characterized the BRIC countries over the last decade is also reflected in the dynamics of their innovative performance. However, significant differences emerge in their structure.
7. Conclusions: beyond the triadic framework The innovative performance of countries and its main determinants has become a key issue of national and regional policy. The importance of this issue is based on the fact that there exists a close relationship between technological capabilities and innovative performance on the one hand, and long-term growth and competitiveness on the other hand. Additionally, the National System of Innovation stream of literature has strongly emphasized the systemic nature of the innovative activities and their crucial linkages with the environment in which they take place at national and regional level, in terms of infrastructures, institutions, knowledge and learning environment. In a period in which
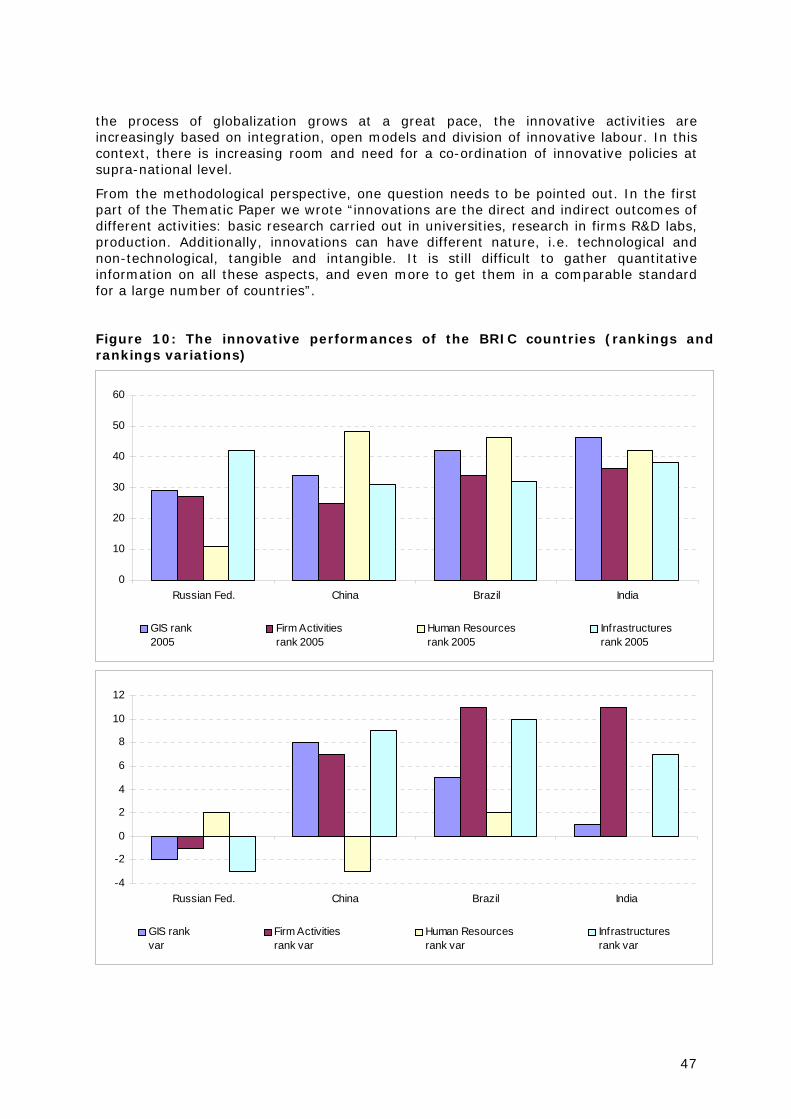
47
the process of globalization grows at a great pace, the innovative activities are increasingly based on integration, open models and division of innovative labour. In this context, there is increasing room and need for a co-ordination of innovative policies at supra-national level.
From the methodological perspective, one question needs to be pointed out. In the first part of the Thematic Paper we wrote “innovations are the direct and indirect outcomes of different activities: basic research carried out in universities, research in firms R&D labs, production. Additionally, innovations can have different nature, i.e. technological and non-technological, tangible and intangible. It is still difficult to gather quantitative information on all these aspects, and even more to get them in a comparable standard for a large number of countries”.
Figure 10: The innovative performances of the BRIC countries (rankings and rankings variations)
0
10
20
30
40
50
60
Russian Fed. China Brazil India
GIS rank2005
Firm Activitiesrank 2005
Human Resourcesrank 2005
Infrastructuresrank 2005
-4
-2
0
2
4
6
8
10
12
Russian Fed. China Brazil India
GIS rankvar
Firm Activitiesrank var
Human Resourcesrank var
Infrastructuresrank var

48
The weight of the non-technological and non-R&D factors is gaining importance in both manufacturing and services, as well as in emerging sectors like the creative industry. Consequently, the use of composite indicators which are mainly based on technological capabilities and technological innovation raises an important question: are we underestimating a relevant part of the innovative activities and capabilities in some countries? This is something one has to bear in mind when analysing the innovative performances. The development of new indicators should take into account these new forms and modes of innovation and it is a challenge which deserves a priority effort in the research agenda in this field.
The main aim of the GIS 2008 is to explore the long-term dynamics and to provide an overview on the main trends, results and determinants of the innovative performances of countries across the world. The main findings can be summarized in the following points:
1. The exclusive club of innovative leaders. There is a stable group of countries which are firmly within the top performers, it includes: Sweden, Switzerland, Finland, Israel and Japan (while the United States drops out from the leaders and moves to the group 2 in 2005). The innovative performance of these countries is particularly based on business activities (cf. Figure 2, 3 and 5).
2. The convergence of the followers. From the comparison of the groups based on the GIS Index on 1995 and 2005 a process of convergence in the middle of the ranking emerges (cf. Figure 6). Behind the innovative leaders, the group 2 has become the larger cluster and it includes emerging countries like the Republic of Korea and Singapore. At the same time, a considerable group of countries climbed from the group 4 to the group 3 in 2005, i.e. Spain, Italy, Czech Republic, Estonia, Russian Federation, Portugal, Greece, Lithuania and Hungary.
3. The great divide of the group 4. The other main finding which emerged from the exploration of the dynamics of the innovative performances over the decade 1995-2005 is related to the bottom of the ranking. Figure 7 shows how the group 4 (based on the GIS Index 2005) are characterized by the largest variability in terms of innovative performance growth rate over the decade 1995-2005. Within this group, one sub-group performs above the average GIS growth rate while another sub-group shows the lowest performances. In particular, the three BRIC countries, Brazil, China and India, in addition to Turkey, have undertaken a catching-up process with respect to the other countries, in particular with regards to the first two groups. The fact that three of the largest emerging economies in the world are the best performers in terms of innovative performance growth deserves attention.
Regarding EU countries, they perform at all the levels of performance across the GIS, i.e. there are Member States at the top and bottom of the rankings. However, although there is clearly a strong structural component to innovation performance, we do observe transitions over time. In particular several of the EU15 have moved from the group 3 to the group 2 (UK, Austria, Belgium) and a number of lower performing EU Member States have moved from the 4th to 3rd groupings (Spain, Italy, Czech Republic, Estonia, Portugal, Greece, Lithuania, Hungary). On the other hand, some of the EU countries in the group 4 (cf. Figure 7) have shown the slowest rate of growth in the GIS index (e.g. Romania, Slovak Republic, Latvia, Bulgaria, Poland). It is important to point out that the data from 2005 is unlikely to capture any effects of EU enlargement which only happened in May 2004 (and January 2007 for Bulgaria and Romania). The new Member States have significantly increased their spending on innovation support since 2004 due to the Structural Fund programmes. However the effects of this are beyond the time period included in the analysis.
From the EU perspective, there are at least three implications which can be taken in consideration regarding the dynamics of the innovative performances at global level. Firstly, innovation does not always occur in the same way. The importance of the different determinants of the innovative performance and their effects on growth can

49
depend on the national industrial structure and on the stage of development. The study of this relationship is crucial for designing effective policies to sustain innovation and long-term growth. Secondly the GIS 2008 findings confirm the need for policy makers to start thinking beyond the triadic division – the United States, Europe and Japan - also when they deal with technological capabilities and innovative performances.
Acknowledgements
This Thematic Paper is part of a research project on Measuring Innovation promoted by the European Commission, Directorate-General Enterprises and Industry and coordinated by MERIT. The first part of the Thematic Paper has been prepared with the contribution of Mario Denni. We wish to thank Keith Sequeira, Hugo Hollanders, Minna Kanerva, Giorgio Sirilli, Anna Giunta and Antonello Zanfei for their comments and suggestions. We would also like to remember here our friend and colleague Hariolf Grupp, who provided scrupulous reading regarding the issue of technological composite indicators, and fundamental contributions to the economics of innovation.

50
Annex
The GIS Index indicators
Triadic patents: number of triadic patents per population. A patent is defined triadic when it is filed at the European Patent Office and the Japanese Office, and granted at the US Patent and Trademark Office. (data from OECD’s MSTI)
BERD: business R&D expenditures as a percentage of GDP. (Data from OECD and Eurostat)
S&T tertiary enrolment ratio: the share of university students enrolled in Science and Engineering related subjects. (data from the UNESCO)
Labour force with tertiary education (% total labour force): share of the labour force with a completed tertiary education. (data from World Bank – World Development Indicators)
R&D personnel per population: researcher and technicians employed in R&D activities. (data from World Bank – World Development Indicators)
Scientific articles per population: scientific and technical articles. (data from World Bank – World Development Indicators)
ICT expenditures per population: Information and Communication Technologies expenditures per capita. (data from World Bank – World Development Indicators, Eurostat and WITSA/IDC’s Digital Planet Report)
Broadband penetration per population: number of broadband subscribers. (data from World Bank – World Development Indicators and Eurostat)
Public R&D (HERD + GOVERD) - (%GDP): public R&D is defined as Higher Education Expenditures on R&D – HERD, plus Government Expenditures on R&D, GOVERD. (data from OECD’s MSTI)

51
Table A
Country GIS 1995 GIS 2005
GDP per capita
(average 2004-2006)
GIS growth
rate 1995-2005
Firm activitiesgrowth
rate 1995-2005
Human resources
growth rate 1995-2005
Infrastructures growth rate 1995-2005
Sweden 0.8171 0.7463 32634 -0.0090 -0.0210 -0.0067 0.0047 Switzerland 0.7200 0.7382 19228 0.0025 -0.0143 -0.0034 0.0335 Finland 0.5760 0.7268 25111 0.0235 -0.0044 0.0277 0.0531 Israel 0.6089 0.6912 19385 0.0128 0.0497 -0.0044 -0.0107 Japan 0.6549 0.6866 26148 0.0047 0.0150 -0.0062 -0.0034 United States 0.6752 0.5794 37050 -0.0152 -0.0175 -0.0112 -0.0160 Denmark 0.4771 0.5641 18930 0.0169 0.0053 0.0049 0.0347 Korea, Rep. 0.4603 0.5556 9189 0.0190 0.0321 0.0197 0.0054 Canada 0.4871 0.5274 13449 0.0080 -0.0059 0.0206 0.0037 Germany 0.4955 0.5257 20017 0.0059 -0.0027 -0.0088 0.0319 Netherlands 0.5137 0.5221 20104 0.0016 -0.0015 -0.0064 0.0085 Singapore 0.3590 0.4677 15394 0.0268 0.0515 0.0244 0.0162 France 0.4664 0.4575 23805 -0.0019 -0.0222 -0.0143 0.0275 Austria 0.3934 0.4511 24682 0.0138 0.0319 0.0344 -0.0087 Norway 0.3978 0.4504 22944 0.0125 -0.0304 0.0020 0.0418 United Kingdom 0.4142 0.4329 32085 0.0044 -0.0368 -0.0009 0.0443 Belgium 0.4262 0.4188 13961 -0.0018 -0.0258 -0.0154 0.0335 Australia 0.4133 0.3994 24201 -0.0034 -0.0049 -0.0197 0.0144 New Zealand 0.3016 0.3233 27853 0.0070 0.0453 -0.0298 0.0313 Ireland 0.2908 0.3119 24540 0.0070 -0.0243 0.0219 0.0137 Spain 0.1730 0.2769 22966 0.0481 0.0085 0.0417 0.0754 Slovenia 0.2956 0.2527 7454 -0.0156 -0.0113 0.0073 -0.0347 Italy 0.2019 0.2436 29262 0.0189 -0.0271 0.0108 0.0531 Czech Republic 0.1506 0.2308 19140 0.0436 -0.0002 0.0341 0.1015 Estonia 0.2197 0.2088 16403 -0.0051 0.1016 0.0369 -0.0453 Russian Fed. 0.2024 0.2072 14232 0.0023 -0.0214 0.0058 0.0250 Portugal 0.0876 0.1826 6707 0.0763 0.0617 0.0866 0.0701 Greece 0.1059 0.1731 23237 0.0504 -0.0520 0.0624 0.0454 Lithuania 0.1819 0.1707 28400 -0.0063 0.5666 -0.0271 0.0133 Hungary 0.1136 0.1553 3229 0.0317 -0.0115 0.0005 0.0854 China 0.0424 0.1320 3354 0.1202 0.1006 0.0343 0.1548 Cyprus 0.0632 0.1256 10559 0.0710 0.1630 0.0281 0.1203 Slovak Republic 0.2219 0.1081 8125 -0.0693 -0.1353 -0.0600 -0.0585 Bulgaria 0.1185 0.1069 13775 -0.0103 -0.2025 0.0090 -0.0278 Turkey 0.0318 0.0959 15267 0.1167 0.0685 0.1891 0.1034 Poland 0.0914 0.0948 8199 0.0037 -0.1267 0.0220 0.0190 Brazil 0.0136 0.0935 3036 0.2127 0.4948 0.1985 0.1929 Mexico 0.0674 0.0901 15660 0.0295 0.1224 0.0211 0.0323 Argentina 0.0560 0.0787 15544 0.0346 -0.0944 0.0823 0.0061 India 0.0222 0.0768 15209 0.1319 1.7564 0.0472 0.6744 Latvia 0.0757 0.0726 4984 -0.0042 0.0601 -0.0350 0.0223 Romania 0.1143 0.0637 2368 -0.0567 -0.1990 -0.0403 0.2305
Related Documents