INTERNATIONAL JOURNAL OF CLIMATOLOGY Int. J. Climatol. (2008) Published online in Wiley InterScience (www.interscience.wiley.com) DOI: 10.1002/joc.1590 The global footprint of persistent extra-tropical drought in the instrumental era Celine Herweijer 1 * and Richard Seager 2 1 Risk Management Solutions, London, UK 2 Lamont Doherty Earth Observatory, Columbia University, USA ABSTRACT: The major North American droughts as per instrumental records are shown to be part of a larger, global pattern of low-frequency drought variability. Drought in western North America during the 1850s–1860s, 1870s, 1890s, 1930s and 1950s, is shown to coincide with the occurrence of prolonged dry spells in parts of Europe, southern South America and western Australia. Tropical land regions are mostly wet during these periods, with the exception of central east Africa, southern India and Sri Lanka, which are dry. The recent 1998–2003 period of drought in western North America reveals a similar global hydroclimatic ‘footprint’ with the exception of a wet southern South America and continued dry conditions in the Sahel. Common to each of the six droughts is the persistence of anomalously cool east central tropical Pacific sea surface temperatures (SSTs). For the 1998–2003 case, the warming of SSTs everywhere outside of the east central tropical Pacific may be influencing precipitation and masking the influence of persistent precipitation anomalies driven from the tropical Pacific alone. In general, examination of these major historical extra-tropical droughts reveals a hemispherically and, in the extra-tropics, a zonally symmetric pattern consistent with forcing from the Tropics. Ensembles of model simulations forced by observed SSTs globally (Global Ocean Global Atmosphere, GOGA) and only within the tropical Pacific (Pacific Ocean Global Atmosphere-Mixed Layer, POGA-ML) are both able to capture the global pattern of the persistent extra-tropical drought regimes since the mid-nineteenth century. This implies that the recently demonstrated link between SST forcing and drought in North America is in fact only one part of a global hydroclimatic response to the persistence of cool SST anomalies in the tropical Pacific. Indian Ocean SST forcing is required to capture the droughts in central east Africa. Over Europe, the modelled, low-frequency precipitation signal is unrealistically ENSO dominated, as the model does not faithfully reproduce the observed history of low-frequency NAO variability. Overall, our results suggest that the global pattern of persistent drought appears to be a low-frequency version of interannual ENSO-forced variability. Copyright 2008 Royal Meteorological Society Received 20 December 2005; Revised 30 May 2007; Accepted 3 June 2007 1. Introduction Multi-year droughts are a devastating, complex and staggeringly expensive natural hazard. In North America, the most severe multi-year droughts of the last 150 years were the ‘Civil War’ drought (1856–1865), the 1870s and 1890s droughts, the infamous Dust Bowl drought of the 1930s, the late 1940s–mid 1950s southwestern drought and the present-day drought that has gripped the West since 1998 (Woodhouse and Overpeck, 1998; Cole et al., 2002; Fye et al., 2003; Herweijer et al., 2006; Seager et al., 2005a). In the southern part of South America, in a semi-arid area that encompasses the Andean foothills, the Sierra Cordoba and the Pampas in Argentina, along with Uruguay and southern Brazil, extended dry spells have also been noted in the 1930s and 1950s (Mechoso and Iribarren, 1992; Scian and Donnari, 1997; Robertson and Mechoso, 1998; Compagnucci et al., 2002), and inferred from tree-ring data in the 1860s and 1870s (Villalba et al., 1998). In addition, widespread drought * Correspondence to: Celine Herweijer, 30 Monument Street, London EC3R 8NB, UK. E-mail: [email protected] conditions have been documented over much of central and eastern northern Europe during the 1860s (Hulme and Jones, 1994), 1890s, 1930s and the late 1940s/early 1950s (Briffa et al., 1994) and over the European part of the Former Soviet Union (FSU) during the 1890s and 1930s (Meshcherskaya and Blazhevich, 1997). Hoerling and Kumar (2003) noted that the most recent drought (which began in 1998) stretched from North America to Asia, but the in-phase relationship of global historical droughts with North American drought has, until now, been overlooked. Much recent attention has been focussed on under- standing the nature, extent and forcing of drought in the western United States (Hoerling and Kumar, 2003; Fye et al., 2004; Schubert et al., 2004a; Herweijer et al., 2005; Seager et al., 2005a). Cole et al. (2002) and Fye et al. (2004) noted that persistently cold tropical Pacific sea surface temperature (SST) anomalies have co-occurred with the major North American droughts since the mid-nineteenth century. It is well known that on interannual timescales, La Ni˜ na winters are characterized by reduced precipitation over much of the northern sub- tropics and mid-latitudes, particularly over western North Copyright 2008 Royal Meteorological Society

Welcome message from author
This document is posted to help you gain knowledge. Please leave a comment to let me know what you think about it! Share it to your friends and learn new things together.
Transcript

INTERNATIONAL JOURNAL OF CLIMATOLOGYInt. J. Climatol. (2008)Published online in Wiley InterScience(www.interscience.wiley.com) DOI: 10.1002/joc.1590
The global footprint of persistent extra-tropical drought inthe instrumental era
Celine Herweijer1* and Richard Seager2
1 Risk Management Solutions, London, UK2 Lamont Doherty Earth Observatory, Columbia University, USA
ABSTRACT: The major North American droughts as per instrumental records are shown to be part of a larger, globalpattern of low-frequency drought variability. Drought in western North America during the 1850s–1860s, 1870s, 1890s,1930s and 1950s, is shown to coincide with the occurrence of prolonged dry spells in parts of Europe, southern SouthAmerica and western Australia. Tropical land regions are mostly wet during these periods, with the exception of central eastAfrica, southern India and Sri Lanka, which are dry. The recent 1998–2003 period of drought in western North Americareveals a similar global hydroclimatic ‘footprint’ with the exception of a wet southern South America and continued dryconditions in the Sahel. Common to each of the six droughts is the persistence of anomalously cool east central tropicalPacific sea surface temperatures (SSTs). For the 1998–2003 case, the warming of SSTs everywhere outside of the eastcentral tropical Pacific may be influencing precipitation and masking the influence of persistent precipitation anomaliesdriven from the tropical Pacific alone. In general, examination of these major historical extra-tropical droughts reveals ahemispherically and, in the extra-tropics, a zonally symmetric pattern consistent with forcing from the Tropics.
Ensembles of model simulations forced by observed SSTs globally (Global Ocean Global Atmosphere, GOGA) and onlywithin the tropical Pacific (Pacific Ocean Global Atmosphere-Mixed Layer, POGA-ML) are both able to capture the globalpattern of the persistent extra-tropical drought regimes since the mid-nineteenth century. This implies that the recentlydemonstrated link between SST forcing and drought in North America is in fact only one part of a global hydroclimaticresponse to the persistence of cool SST anomalies in the tropical Pacific. Indian Ocean SST forcing is required to capturethe droughts in central east Africa. Over Europe, the modelled, low-frequency precipitation signal is unrealistically ENSOdominated, as the model does not faithfully reproduce the observed history of low-frequency NAO variability. Overall,our results suggest that the global pattern of persistent drought appears to be a low-frequency version of interannualENSO-forced variability. Copyright ! 2008 Royal Meteorological Society
Received 20 December 2005; Revised 30 May 2007; Accepted 3 June 2007
1. Introduction
Multi-year droughts are a devastating, complex andstaggeringly expensive natural hazard. In North America,the most severe multi-year droughts of the last 150 yearswere the ‘Civil War’ drought (1856–1865), the 1870s and1890s droughts, the infamous Dust Bowl drought of the1930s, the late 1940s–mid 1950s southwestern droughtand the present-day drought that has gripped the Westsince 1998 (Woodhouse and Overpeck, 1998; Cole et al.,2002; Fye et al., 2003; Herweijer et al., 2006; Seageret al., 2005a). In the southern part of South America, ina semi-arid area that encompasses the Andean foothills,the Sierra Cordoba and the Pampas in Argentina, alongwith Uruguay and southern Brazil, extended dry spellshave also been noted in the 1930s and 1950s (Mechosoand Iribarren, 1992; Scian and Donnari, 1997; Robertsonand Mechoso, 1998; Compagnucci et al., 2002), andinferred from tree-ring data in the 1860s and 1870s(Villalba et al., 1998). In addition, widespread drought
* Correspondence to: Celine Herweijer, 30 Monument Street, LondonEC3R 8NB, UK. E-mail: [email protected]
conditions have been documented over much of centraland eastern northern Europe during the 1860s (Hulmeand Jones, 1994), 1890s, 1930s and the late 1940s/early1950s (Briffa et al., 1994) and over the European partof the Former Soviet Union (FSU) during the 1890s and1930s (Meshcherskaya and Blazhevich, 1997). Hoerlingand Kumar (2003) noted that the most recent drought(which began in 1998) stretched from North America toAsia, but the in-phase relationship of global historicaldroughts with North American drought has, until now,been overlooked.
Much recent attention has been focussed on under-standing the nature, extent and forcing of drought inthe western United States (Hoerling and Kumar, 2003;Fye et al., 2004; Schubert et al., 2004a; Herweijer et al.,2005; Seager et al., 2005a). Cole et al. (2002) andFye et al. (2004) noted that persistently cold tropicalPacific sea surface temperature (SST) anomalies haveco-occurred with the major North American droughtssince the mid-nineteenth century. It is well known that oninterannual timescales, La Nina winters are characterizedby reduced precipitation over much of the northern sub-tropics and mid-latitudes, particularly over western North
Copyright ! 2008 Royal Meteorological Society

C. HERWEIJER AND R. SEAGER
America (Trenberth and Branstator, 1992; Trenberth andGuillemot, 1996; Cole et al., 2002; Seager et al., 2005b).Recently, it has also been demonstrated that over longertimescales, a persistently cool tropical Pacific can providethe steady atmospheric forcing necessary for North Amer-ican drought: each persistent North American droughtsince the 1850s has been simulated in an ensemble ofclimate model simulations forced by the observed his-tory of tropical Pacific SSTs alone (Seager et al., 2005a;Herweijer et al., 2005; Huang et al., 2005). In the extrat-ropics, alongside zonal asymmetries produced by Rossbywave propagation from the cooler equatorial Pacific, azonally and hemispherically symmetric component to theforcing is observed. This pattern is a lower frequencyrealization of the subtropical jet – transient eddy – meanmeridional circulation interaction mechanism (the Trop-ical Modulation of Mid-latitude Eddies, TMME, mecha-nism) that works throughout the year to promote eddy-driven descent in mid-latitudes when the tropical Pacificis cool (Seager et al., 2003, 2005a,b; Robinson, 2005).The existence of this mechanism suggests that droughtover North America should appear as part of a larger,global pattern of mid-latitude drought. However, whethersuch a global pattern of persistent extra-tropical droughtoccurs in nature has thus far not been demonstrated.
Here we extend this recent work, which was largelyfocussed on North American drought, and examine theglobal hydroclimatic context of the major extra-tropicaldrought regimes (Here we us the dictionary definitionof regime: ‘the characteristic behaviour or orderly pro-cedure of a natural phenomenon or process’ (Webster’sNinth New Collegiate Dictionary) and do not mean toimply a non-linear process) of the past 150 years. Usinghistorical precipitation data, and proxy data for the ear-liest drought, we make the case that each of the famousNorth American dry events can be considered as part of aglobal, hemispherically symmetric hydroclimatic regime.To demonstrate the extent to which these hemispheri-cally symmetric droughts are tropically forced, and toidentify regions in which SSTs from outside the trop-ical Pacific play an important role, the two ensemblesof simulations with an atmosphere general circulationmodel (AGCM) that have been previously analysed bythe authors are further examined. The first ensembleforces an atmospheric model with observed SSTs every-where; the second forces the atmosphere model only withtropical Pacific SSTs. We will show that the models sim-ulate each of the major multi-year extra-tropical droughtregimes since the mid-nineteenth century, including theobserved coincident dryness in much of Europe and cen-tral Asia and western North America in the northernhemisphere, and southern South America in the south-ern hemisphere. The hydroclimate regime throughout theglobal tropics includes wet conditions in the Sahel, anddrought in central east Africa, features that are also cap-tured by the models. Meanwhile, the coincident droughtsin western Australia are less well captured by the models.Furthermore, we will demonstrate that this global hydro-climatic pattern is largely reproduced when the forcing is
limited to the tropical Pacific region. We will also showthat the spatial pattern of extreme and persistent droughtis a low-frequency component of the large-scale climatevariability associated with the El Nino southern oscilla-tion (ENSO).
2. Synchronous large-scale extra-tropical droughts
2.1. Observed history
The global context of six well-known periods of severeand prolonged drought in North America is examined:the droughts of the 1850s–1860s, 1870s, 1890s, 1930sand 1950s (Fye et al., 2004) and the recent droughtfrom 1998 to 2003 (The period since 1998 marks themost recent occurrence of multi-year drought in NorthAmerica. Drought conditions returned to the NorthernRocky Mountains and the Pacific northwest as of Autumn2005, but were interrupted in the central mid-west and thePacific coast in early 2004 and late 2004 respectively.As such, we focus here on the 1998–2003 period ofwidespread drought in western North America).
2.1.1. SSTs
The average observed SST anomaly for each interval ofpersistent drought is shown in Figure 1. The SST data(Kaplan et al., 1998; Rayner et al., 2003) is that used toforce the model experiments outlined in Section 2.2 (fordetails see Herweijer et al., 2005; Seager et al., 2005a).Each of the dry episodes coincides with the persistenceof anomalously cool tropical Pacific SSTs. A cool IndianOcean, typical of La Nina conditions, accompanies eachdrought with the notable exception of the most recentevent. For the 1998–2003 period, SSTs everywhereoutside of the tropical Pacific are anomalously warm,consistent with the global warming trend relative to the1856–2004 mean. During the 1930s and 1950s droughts,while the tropical Pacific was cool, the north AtlanticOcean was warm. Such a warm north Atlantic has beensuggested to be important for simulating the Dust Bowldrought in several recent model studies (Schubert et al.,2004b; Sutton and Hodson, 2005). While that is possible,it is noteworthy that during the three nineteenth centurydroughts, the north Atlantic was not notably warmer thanthe Pacific.
2.1.2. Station precipitation data
Averages of the global precipitation anomaly from theGlobal Historical Climate Network (GHCN) data-set(described by Eischeid et al., 1991) for each of thesedrought events are shown in Figure 2. The stationdata is binned into boxes of four degrees of latitudeand longitude and must be interpreted with cautionin the mid-nineteenth century as data is scarce out-side of Europe. The recent drought aside, persistentdrought in North America is consistently accompaniedby extra-tropical drought in the South American regionencompassing north and central Argentina, Uruguay and
Copyright ! 2008 Royal Meteorological Society Int. J. Climatol. (2008)DOI: 10.1002/joc

GLOBAL PERSISTENT EXTRA-TROPICAL DROUGHT
Figure 1. Observed SST anomalies during selected major North American drought regimes of the instrumental period. Temperature units are K.The SST field is that used in the GOGA ensemble mean. (N.B. The POGA-ML model is only forced by tropical Pacific SSTs between 20 °N
and 20 °S). All anomalies are relative to the 1856–2004 mean.
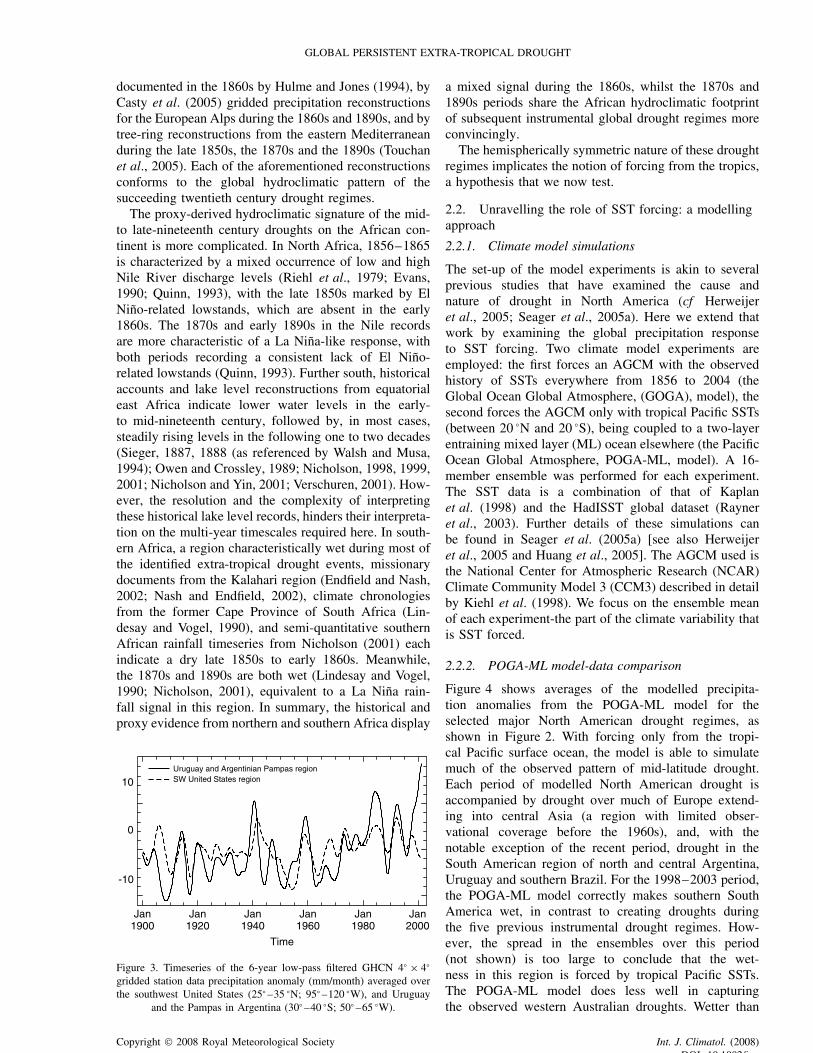
southern Brazil. The in-phase relationship between low-frequency drought/wetness in the Americas is furtherhighlighted by the high correlation (r = 0.57 at p <0.01) between the 6-year low-pass filtered precipitationanomalies averaged over the southwestern United States(25 °N–35 °N; 95 °W–120 °W) and over Uruguay and thePampas in Argentina (35 °S–45 °S; 50 °W–65 °W) since1900 (Figure 3). The 6-year low-pass filter is appliedto remove the effects of interannual variability, retain-ing variability on timescales of just under a decade andlonger. The 1998–2003 period is an exception: southernSouth America was anomalously wet (Figure 2).
There is a clear tendency for drought to occur overlarge parts of Europe at the same time there is drought inNorth America (Figure 2). In the 1998–2003 case, dryconditions are restricted to southern and central Europe.The 1930s are a clear exception, with most of Europerecording wetter than normal conditions. Australia tendsto be dry in the west during these times and wet in theeast, with the 1930s again being an exception when theentire continent was dry and the most recent pattern beingindistinct. Tropical land regions including central Amer-ica, tropical South America, north Africa including the
Sahel (except for the recent drought), southern Africa, themaritime continent and eastern Australia (except for the1930s) are mostly wet during these persistent mid-latitudedry spells. In contrast, equatorial east Africa (Tanza-nia, Kenya and Somalia), and the region encompassingsouthernmost India and Sri Lanka, are consistently dryduring mid-latitude droughts. Precipitation over northeastBrazil is greatly influenced by both tropical Atlantic SSTsand tropical Pacific SSTs (Hastenrath and Heller, 1977;Moura and Shukla, 1981) and does not fall easily intothe global pattern.
Apart from southern South America, the obviousdifference between the global footprint of the mostrecent drought and its nineteenth and twentieth centurypredecessors is the Sahel. Precipitation here does respondto ENSO (Giannini et al., 2003), and the persistent LaNinas of the 1930s and 1950s could be responsible forwet conditions during this time, but there has also beena multidecadal drying since the middle of the century,that has been related to warming of the tropical oceans(Giannini et al., 2003). Consequently, the Sahel has beendry during the most recent mid-latitude drought regime,unlike during prior regimes.
Copyright ! 2008 Royal Meteorological Society Int. J. Climatol. (2008)DOI: 10.1002/joc

C. HERWEIJER AND R. SEAGER
Figure 2. The observed Global Historical Climatological Network (GHCN) 4° ! 4° gridded station data precipitation anomaly (mm/month) forselected major North American drought regimes of the instrumental period. All anomalies are relative to the 1856–2004 mean.
For the entire instrumental period, precipitation reduc-tions during the persistent drought regimes amount toapproximately 10% of the mean annual precipitation,with slightly greater deficits of up to 20% in the south-west United States. While these percentage reductions aresmall they are persistent and sufficient to cause hydrolog-ical drought.
2.1.3. Historical and proxy data
Beyond North America, Europe and parts of the Indiansubcontinent, the GHCN instrumental record for the late-to mid-nineteenth century droughts becomes increasinglysparse. The global footprint of these drought regimes
can be reconstructed further using historical referencesand proxy indicators. For the southern South Americaregion, evidence from tree-ring data (Villalba et al., 1998)and stream flow data (Preito et al., 1999) point to drierthan normal conditions in the late 1850s to early 1860s,the 1870s and the early 1890s. To the north, tree ringrecords from the Amazonian floodplains indicate wetterthan normal conditions at these times (Schoengart et al.,2004), while Allan and D’Arrigo (1999), as an extensionto the study by Quinn (1993), register a lack of El Ninorelated northeast Brazil droughts or ‘Secas’ in the 1860s(Quinn and Neal, 1992). Drought in Europe, thoughfairly well represented by the GHCN data, is further
Copyright ! 2008 Royal Meteorological Society Int. J. Climatol. (2008)DOI: 10.1002/joc
GLOBAL PERSISTENT EXTRA-TROPICAL DROUGHT
documented in the 1860s by Hulme and Jones (1994), byCasty et al. (2005) gridded precipitation reconstructionsfor the European Alps during the 1860s and 1890s, and bytree-ring reconstructions from the eastern Mediterraneanduring the late 1850s, the 1870s and the 1890s (Touchanet al., 2005). Each of the aforementioned reconstructionsconforms to the global hydroclimatic pattern of thesucceeding twentieth century drought regimes.
The proxy-derived hydroclimatic signature of the mid-to late-nineteenth century droughts on the African con-tinent is more complicated. In North Africa, 1856–1865is characterized by a mixed occurrence of low and highNile River discharge levels (Riehl et al., 1979; Evans,1990; Quinn, 1993), with the late 1850s marked by ElNino-related lowstands, which are absent in the early1860s. The 1870s and early 1890s in the Nile recordsare more characteristic of a La Nina-like response, withboth periods recording a consistent lack of El Nino-related lowstands (Quinn, 1993). Further south, historicalaccounts and lake level reconstructions from equatorialeast Africa indicate lower water levels in the early-to mid-nineteenth century, followed by, in most cases,steadily rising levels in the following one to two decades(Sieger, 1887, 1888 (as referenced by Walsh and Musa,1994); Owen and Crossley, 1989; Nicholson, 1998, 1999,2001; Nicholson and Yin, 2001; Verschuren, 2001). How-ever, the resolution and the complexity of interpretingthese historical lake level records, hinders their interpreta-tion on the multi-year timescales required here. In south-ern Africa, a region characteristically wet during most ofthe identified extra-tropical drought events, missionarydocuments from the Kalahari region (Endfield and Nash,2002; Nash and Endfield, 2002), climate chronologiesfrom the former Cape Province of South Africa (Lin-desay and Vogel, 1990), and semi-quantitative southernAfrican rainfall timeseries from Nicholson (2001) eachindicate a dry late 1850s to early 1860s. Meanwhile,the 1870s and 1890s are both wet (Lindesay and Vogel,1990; Nicholson, 2001), equivalent to a La Nina rain-fall signal in this region. In summary, the historical andproxy evidence from northern and southern Africa display
Jan1900
Jan1920
Jan1940
Jan1960
Jan1980
Jan2000
Time
-10
0
10Uruguay and Argentinian Pampas regionSW United States region
Figure 3. Timeseries of the 6-year low-pass filtered GHCN 4° ! 4°
gridded station data precipitation anomaly (mm/month) averaged overthe southwest United States (25° –35 °N; 95° –120 °W), and Uruguay
and the Pampas in Argentina (30° –40 °S; 50° –65 °W).
a mixed signal during the 1860s, whilst the 1870s and1890s periods share the African hydroclimatic footprintof subsequent instrumental global drought regimes moreconvincingly.
The hemispherically symmetric nature of these droughtregimes implicates the notion of forcing from the tropics,a hypothesis that we now test.
2.2. Unravelling the role of SST forcing: a modellingapproach
2.2.1. Climate model simulations
The set-up of the model experiments is akin to severalprevious studies that have examined the cause andnature of drought in North America (cf Herweijeret al., 2005; Seager et al., 2005a). Here we extend thatwork by examining the global precipitation responseto SST forcing. Two climate model experiments areemployed: the first forces an AGCM with the observedhistory of SSTs everywhere from 1856 to 2004 (theGlobal Ocean Global Atmosphere, (GOGA), model), thesecond forces the AGCM only with tropical Pacific SSTs(between 20 °N and 20 °S), being coupled to a two-layerentraining mixed layer (ML) ocean elsewhere (the PacificOcean Global Atmosphere, POGA-ML, model). A 16-member ensemble was performed for each experiment.The SST data is a combination of that of Kaplanet al. (1998) and the HadISST global dataset (Rayneret al., 2003). Further details of these simulations canbe found in Seager et al. (2005a) [see also Herweijeret al., 2005 and Huang et al., 2005]. The AGCM used isthe National Center for Atmospheric Research (NCAR)Climate Community Model 3 (CCM3) described in detailby Kiehl et al. (1998). We focus on the ensemble meanof each experiment-the part of the climate variability thatis SST forced.
2.2.2. POGA-ML model-data comparison
Figure 4 shows averages of the modelled precipita-tion anomalies from the POGA-ML model for theselected major North American drought regimes, asshown in Figure 2. With forcing only from the tropi-cal Pacific surface ocean, the model is able to simulatemuch of the observed pattern of mid-latitude drought.Each period of modelled North American drought isaccompanied by drought over much of Europe extend-ing into central Asia (a region with limited obser-vational coverage before the 1960s), and, with thenotable exception of the recent period, drought in theSouth American region of north and central Argentina,Uruguay and southern Brazil. For the 1998–2003 period,the POGA-ML model correctly makes southern SouthAmerica wet, in contrast to creating droughts duringthe five previous instrumental drought regimes. How-ever, the spread in the ensembles over this period(not shown) is too large to conclude that the wet-ness in this region is forced by tropical Pacific SSTs.The POGA-ML model does less well in capturingthe observed western Australian droughts. Wetter than
Copyright ! 2008 Royal Meteorological Society Int. J. Climatol. (2008)DOI: 10.1002/joc

C. HERWEIJER AND R. SEAGER
Figure 4. The POGA-ML modelled global precipitation anomaly (mm/month) for selected major North American drought regimes of theinstrumental period. All anomalies are relative to the 1856–2004 mean.
normal conditions are simulated in central America, theSahel (except for the recent period, as explained in Sec-tion 2.1), south Africa, and the southern Mediterranean,as observed.
2.2.3. GOGA model-data comparison
Including the forcing from the global ocean generallygives a comparable picture (Figure 5). It is noted thatfor the 1998–2003 period, wet anomalies are more fre-quent than dry anomalies in most places-representative ofthe rather clear global mean global warming signal. Asfor the POGA-ML experiment, the western Australiandroughts are poorly simulated. SSTs from outside thetropical Pacific are required to capture the droughts inequatorial east Africa, consistent with prior work on the
impact of Indian Ocean SSTs (Goddard and Graham,1999). Here, cooler SSTs and diminished convective heat-ing in the west central Indian Ocean leads to anomalousmoisture flux divergence and reduced rainfall over equa-torial east Africa. These findings are consistent with ours,in that the observed central east African droughts are onlycaptured when forcing from a cool west central Indianocean is included (i.e. in the GOGA model, Figure 5).During the 1930s the Indian Ocean SST anomaliesare muted, as is the corresponding east central Africandrought in both the model and in the observations. Sim-ilarly, during the 1998–2003 period the Indian Ocean,like all surface waters outside of the cool eastern tropi-cal Pacific, is anomalously warm and the model does notproduce a drought while the observed record was itselfindistinct.
Copyright ! 2008 Royal Meteorological Society Int. J. Climatol. (2008)DOI: 10.1002/joc

GLOBAL PERSISTENT EXTRA-TROPICAL DROUGHT
Figure 5. The GOGA modelled global precipitation anomaly (mm/month) for selected major North American drought regimes of the instrumentalperiod. All anomalies are relative to the 1856–2004 mean.
A potential flaw of the GOGA experiment concernsthe impact of specified SSTs on annular mode variabil-ity, and the associated component of extra-tropical pre-cipitation variability (e.g. Hurrell, 1995; Hurrell et al.,2003). Annular modes are internal atmospheric modesthat drive extra-tropical SST anomalies (e.g. Seager et al.,2000; Visbeck et al., 2003). A long-standing questionhas been the extent to which anomalous extra-tropicalSSTs feed back to affect the atmosphere (e.g. Rodwellet al., 1999; Robinson, 2000; Kushnir et al., 2002). Ithas been shown that AGCMs forced with observed SSTanomalies can reproduce the annular mode behaviourthat induced these extra-tropical SST anomalies (Rod-well et al., 1999). However, almost by construction, thesurface flux anomalies are the wrong sign-i.e. out of the
ocean in a region where the annular mode makes theSST warm and the flux should in reality be into theocean. As such, it is unclear whether the atmosphericresponse represents a real response to the SST anoma-lies, or whether it is an artifact of the misrepresentationof the atmosphere-ocean coupling in the model (Barsugliand Battisti, 1998; Bretherton and Battisti, 2000), withthe potential to introduce errors in the precipitation sig-nal. If, as argued by Hoerling et al. (2001), annular modevariability is forced from the tropical oceans, the AGCMexperiments presented here may be able to simulate theobserved changes. On the other hand, if annular modevariability is driven primarily by internal atmosphericvariability, or if it responds to external factors such aschanging atmospheric trace gas composition (Shindell
Copyright ! 2008 Royal Meteorological Society Int. J. Climatol. (2008)DOI: 10.1002/joc

C. HERWEIJER AND R. SEAGER
et al., 1999) that we neglected in the model experiments,it is likely that there is a component of extra-tropicalprecipitation variability that the models will not capture.
The above factor is likely to be important overthe European sector, where precipitation variability isstrongly influenced by the North Atlantic oscillation(NAO) (Hurrell, 1995; Dai et al., 1997), and to a lesserextent by the remote tropical Pacific climate (Dai et al.,1997; Merkel and Latif, 2002; Seager et al., 2005b;Mariotti et al., 2005). A multivariate regression of theGHCN precipitation anomalies onto the 6-year low-passfiltered NAO index (Hurrell, 1995) and NINO3 index(Kaplan et al., 2003) highlights the relative impact oflow-frequency NAO- and ENSO-related climate variabil-ity on this region (Figure 6). This is done for the monthsof December through March, from 1863 to 1995, cor-responding to the NAO index of Hurrell (1996). Thecorrelation between NAO variability and European pre-cipitation is in general higher than for low-frequency
ENSO variability (Figure 6(b) and (d)) which is decid-edly weak.
Overall, approximately 20% of the low-frequencyprecipitation variability over Europe is explained by thecombined influence of low-frequency ENSO- and NAO-related climate variability. During the mid- to late-1930s,(Hurrell, 1996) the winter NAO index was persistentlynegative, a factor that may explain the observed wetcentral and southern Europe at that time (Figure 2). Themodel does not faithfully reproduce the low-frequencyvariations of the NAO. As such, the European low-frequency precipitation in the model is ENSO-dominatedand creates a spurious drought in the 1930s. Although therelationship between tropical Pacific SSTs and Europeanrainfall is weak the model simulations quite consistentlymake parts of Europe dry during protracted La Nina-like states. In agreement, parts or nearly all of Europewere struck by drought in the 1850s, 1870s, 1890s and1950s. The south European and Mediterranean drought
Figure 6. Multivariate regression of the observed GHCN 4° ! 4° gridded station data precipitation anomaly on to the 6-year low-pass filtered:(a) NAO index (mm/month/mb); (c) NINO3 index (mm/month/K). Corresponding correlation coefficients are shown in (b) and (d). Correlation
coefficients greater than or equal to 0.23 are significant at p < 0.2.
Copyright ! 2008 Royal Meteorological Society Int. J. Climatol. (2008)DOI: 10.1002/joc

GLOBAL PERSISTENT EXTRA-TROPICAL DROUGHT
of the 1998–2003 period is reproduced by the modelsand was also likely forced from the tropics as suggestedby Hoerling and Kumar (2003). The results add somesupport to the contention that, in addition to the NAOinfluence, and amidst considerable internal variability,there is a modest tropical Pacific SST influence onprecipitation in this region (Mariotti et al., 2005).
The wetness of southern South America during themost recent mid-latitude drought regime is clearly verydifferent to the global footprint of the five precedingmajor mid-latitude droughts since 1856. Liebmann et al.(2004) also note a recent positive trend in South Amer-ican precipitation centred over southern Brazil, whichthey relate to a positive trend in SST in the nearbyAtlantic Ocean, although not causally. The inability ofthe GOGA model to capture the observed southern SouthAmerican wetness could potentially arise, as for theEuropean sector, from the model’s inability to faithfullycapture annular mode variability. The southern annular
mode (SAM) is often defined as the leading mode of700 mb heights south of 20 °S and describes a basi-cally zonal mean oscillation of mass between the mid-latitudes and the Polar ice cap together with associatedchanges in winds and temperature, and arises from inter-actions between transient eddies and the zonal meanflow (L’Heureux and Thompson, 2005, and referencestherein). As shown by L’Heureux and Thompson (2005),over the post-1979 period, the SAM during southern sum-mer is highly correlated with the inverted index of SSTsin the eastern tropical Pacific Ocean i.e. La Nina condi-tions excite the positive phase of the SAM.
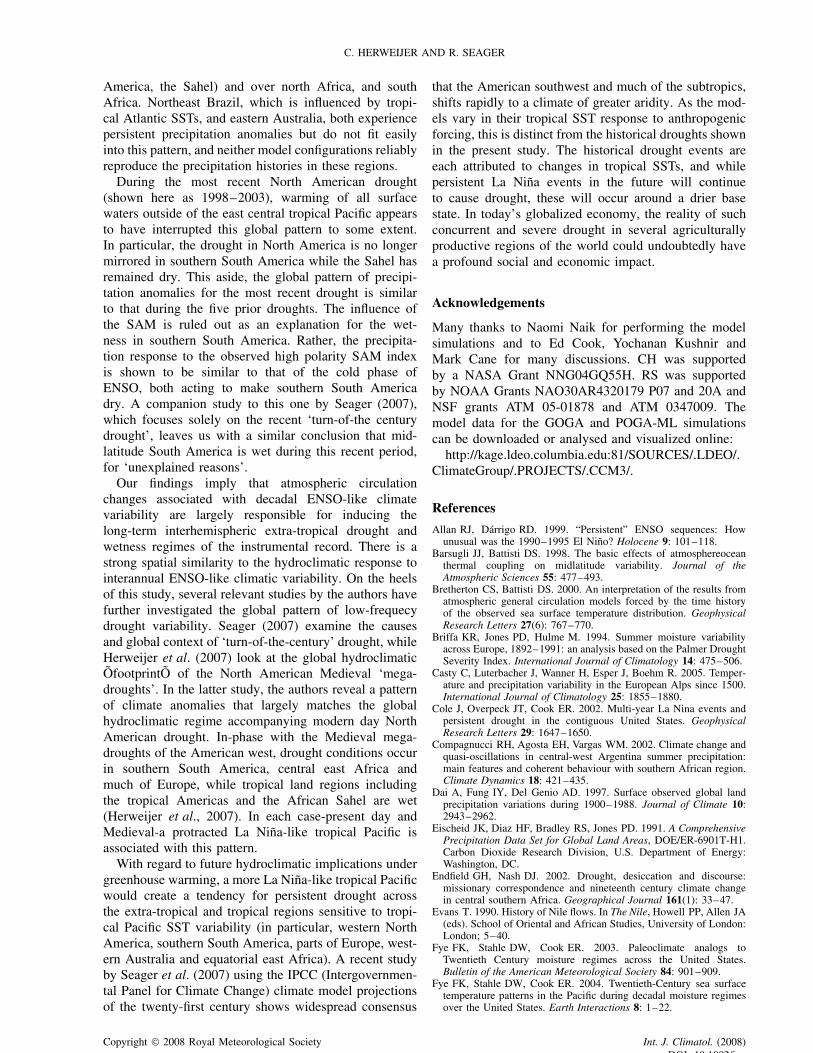
Figure 7(a) shows the Global Precipitation Climatol-ogy Project (GPCP) satellite and station data precipitationregressed on the SAM index, as defined above, usingNCEP-NCAR Reanalyis data. This result confirms thelink between SAM and ENSO in that the global patternof precipitation associated with the SAM (Figure 7(a))is essentially the same as that associated with La Nina
(b) SAM index 1998-2003
Jan 1998 Jan 1999 Jan 2000 Jan 2001 Jan 2002 Jan 2003 Jan 2004Time
-2-1
0S
AM
inde
x1
Figure 7. (a) The monthly mean GPCP v2 satellite-gauge precipitation anomaly regressed onto the SAM index from January 1979 to December2004. (b) The SAM index from 1998 to 2003.
Copyright ! 2008 Royal Meteorological Society Int. J. Climatol. (2008)DOI: 10.1002/joc

C. HERWEIJER AND R. SEAGER
(Figure 8(a), discussed in detail in Section 3). Like LaNina, the SAM tends to make southern South Amer-ica dry. In the 1998–2003 period, the SAM was pos-itive (Figure 7(b)), consistent with the coincident LaNina. Therefore the SAM provides no explanatory powerbeyond ENSO and the wetness in southern South Amer-ica in recent years must have other causes. For the record,the POGA-ML and GOGA models both reliably producethe post-1979 behaviour of the SAM during southernsummer (not shown), confirming dominance of ENSO-forcing of the SAM.
2.2.4. Summary
In summary, the spurious drought in Europe in the 1930s,and the recent wetness in southern South America aside,the GOGA and POGA-ML models do an impressive job
at capturing the large-scale footprint of the persistentdrought regimes of the last 150 years. Each of the sixdroughts is marked by the persistence of anomalouslycool east central tropical Pacific SSTs, despite differencesin the SSTAs of the Indian Ocean, Atlantic Ocean andnorth Pacific Ocean. The similarity of the POGA-MLand GOGA models cements the contention that thecomponent of persistent extra-tropical drought/wetnessthat is SST forced, is forced from the tropical Pacific-aLa Nina-like tropical Pacific.
3. The low-frequency ENSO/mid-latitude droughtsignal
By regressing the GHCN precipitation data onto the six-year low-pass filtered NINO 3 (NINO 3 is an index that
Figure 8. The Dec-May GHCN precipitation anomaly regressed on to the (a) 6-year low-pass, or (c) 6-year high-pass filtered Kaplan NINO 3index. The corresponding correlation coefficients are shown in panels (b) and (d). The Dec-May POGA-ML precipitation anomaly regressedonto the low pass filtered Kaplan NINO 3 index (e) and the respective correlation coefficients (f). Each calculated over the period from 1857 to
2004.
Copyright ! 2008 Royal Meteorological Society Int. J. Climatol. (2008)DOI: 10.1002/joc

GLOBAL PERSISTENT EXTRA-TROPICAL DROUGHT
measures the strength of an ENSO event: it is the SSTaveraged over a region in the eastern equatorial Pacific(90° –150 °W, 5 °N–5 °S)) index (Kaplan et al., 2003) wecan directly isolate the precipitation variability that arisesas part of the low-frequency ENSO signal (Figure 8(a).This is done for the months of December throughMay (the months of greatest NINO3 variability) from1857 to 2004. The corresponding correlation coefficientsare shown in Figure 8(b). Analogous figures of the 6-year high-pass filtered case, representative of interannualENSO variability, are also shown (Figure 8(c) and (d)).For the high-pass filtered case, a correlation coefficientof 0.16 is required for significance at the 95% level.Low-pass filtering of the data necessitates a higher degreeof correlation for statistical significance. The pattern oflow-frequency ENSO-related precipitation variability isstrikingly similar to the interannual case. On interannualtimescales, a cold eastern tropical Pacific correspondsto a dry southwestern United States, southern SouthAmerica (Uruguay, north and central Argentina andsouthern Brazil), central and eastern Europe, centralwestern Asia, equatorial eastern Africa (Kenya, Tanzaniaand Somalia), southern India and Sri Lanka, and wetareas in southern Africa, Mediterranean north Africa,eastern Australia, northeast South America and parts ofthe eastern United States. Due to the limited length ofthe observational record, only the extra-tropical droughtregions in the southwestern United States, southern SouthAmerica and (marginally) parts of central Europe andcentral western Asia have correlation coefficients thatqualify as statistically significant at the 80% level.
Whilst these correlations are low, the model simu-lations add weight to the argument that the tropicalPacific-extra-tropical precipitation relationships on multi-year timescales are real: the POGA-ML model producesa pattern of precipitation variations noticeably similar tothat observed, but with statistically significant correla-tions across North America, Europe, Asia as well as in thesouthern hemisphere mid-latitudes (Figure 8(f)). Lowercorrelations between tropical Pacific SSTs and precipita-tion observations are expected because the observationsare an incomplete record of a single realization and henceinclude both sampling error and a sizable component dueto internal atmospheric variability. In contrast, the modelsimulations near-perfectly isolate the SST-forced com-ponent and make clear that, amidst much precipitationvariability generated by internal atmospheric variability,tropical Pacific SSTs do have a discernible impact onprecipitation across the mid-latitudes.
On the basis of these arguments it seems fair to statethat the large-scale relationships between regions of per-sistent extra-tropical drought/wetness outlined in Section2, arise as part of a global response to low-frequencyENSO varibility. A La Nina-like tropical Pacific ondecadal timescales, causes mid-latitude drought in Northand South America, as well as drought in much of cen-tral Europe, central east Africa, southern India and SriLanka, and parts of western Australia. Noticeably, low-frequency precipitation variability in the northeast Brazil
region (Figure 2) does not always fit into this patternof global hemispheric and zonal symmetry (Figure 8).Precipitation in this region is strongly influenced by themeridional gradient of tropical Atlantic SST (e.g. Ser-vain, 1991; Uvo et al., 1998), which is in part controlledby ENSO variability but also has a local Atlantic ori-gin (Saravanan and Chang, 2000; Pezzi and Cavalcanti,2001; Giannini et al., 2004). As both, ENSO and tropicalAtlantic variability (TAV), add up to force precipitationanomalies in northeast Brazil, variability local to the trop-ical Atlantic can at times disrupt the hemisphericallysymmetric pattern.
4. Conclusions
Analysis of historical station precipitation data indicatesthat each major North American drought of the last150 years appears as part of a larger, global patternof low-frequency precipitation variability. There is aclear hemispherically and, in the extra-tropics, zonallysymmetric component to this variability, such that whenthe tropical eastern Pacific and tropical troposphere arecooler than normal, much of the mid-latitudes are warmand dry. This feature is related to a low-frequencyrealization of the TMMEs mechanism described in detailby Seager et al. (2003, 2005a,b). Zonal asymmetriesarise due to Rossby wave propagation from the coolertropical Pacific, which regionally enhance or diminishthe tendency for mid-latitude drought (Seager et al.,2005b). That this global pattern of multi-year extra-tropical drought regimes occurs in nature is demonstratedhere for the first time. In particular, regions of enhancedand in-phase extra-tropical drought include western NorthAmerica and southern South America, each under thedownstream influence of Rossby wave propagation froma colder than normal tropical Pacific. Other regions of in-phase drought include western Australia, parts of Europe,and central east Africa, whilst other tropical land regionstend to be wet.
Model ensemble simulations forced by observed SSTs,globally (GOGA), and only from within the tropicalPacific (POGA-ML), were both able to capture the large-scale footprint of the global drought regimes since 1856,including the hemispheric symmetry and the zonal sym-metry in the extra-tropics. The implication is that, asdemonstrated for the western North American sector(Schubert et al., 2004b; Herweijer et al., 2005; Seageret al., 2005a), the major extra-tropical droughts of thisperiod are primarily forced by tropical Pacific SSTs.In particular, sustained La Nina-like conditions corre-spond to persistent drought in southern South Amer-ica (Uruguay, southern Brazil and north and centralArgentina), and much of Europe, as observed. Contempo-raneous drought in western Australia also occurs in theobservations, but is not captured by the model simula-tions. In agreement with the instrumental record, rainfallanomalies of the opposite sign occur over most of thetropics (i.e. in particular over tropical central and South
Copyright ! 2008 Royal Meteorological Society Int. J. Climatol. (2008)DOI: 10.1002/joc
C. HERWEIJER AND R. SEAGER
America, the Sahel) and over north Africa, and southAfrica. Northeast Brazil, which is influenced by tropi-cal Atlantic SSTs, and eastern Australia, both experiencepersistent precipitation anomalies but do not fit easilyinto this pattern, and neither model configurations reliablyreproduce the precipitation histories in these regions.
During the most recent North American drought(shown here as 1998–2003), warming of all surfacewaters outside of the east central tropical Pacific appearsto have interrupted this global pattern to some extent.In particular, the drought in North America is no longermirrored in southern South America while the Sahel hasremained dry. This aside, the global pattern of precipi-tation anomalies for the most recent drought is similarto that during the five prior droughts. The influence ofthe SAM is ruled out as an explanation for the wet-ness in southern South America. Rather, the precipita-tion response to the observed high polarity SAM indexis shown to be similar to that of the cold phase ofENSO, both acting to make southern South Americadry. A companion study to this one by Seager (2007),which focuses solely on the recent ‘turn-of-the centurydrought’, leaves us with a similar conclusion that mid-latitude South America is wet during this recent period,for ‘unexplained reasons’.
Our findings imply that atmospheric circulationchanges associated with decadal ENSO-like climatevariability are largely responsible for inducing thelong-term interhemispheric extra-tropical drought andwetness regimes of the instrumental record. There is astrong spatial similarity to the hydroclimatic response tointerannual ENSO-like climatic variability. On the heelsof this study, several relevant studies by the authors havefurther investigated the global pattern of low-frequecydrought variability. Seager (2007) examine the causesand global context of ‘turn-of-the-century’ drought, whileHerweijer et al. (2007) look at the global hydroclimaticOfootprintO of the North American Medieval ‘mega-droughts’. In the latter study, the authors reveal a patternof climate anomalies that largely matches the globalhydroclimatic regime accompanying modern day NorthAmerican drought. In-phase with the Medieval mega-droughts of the American west, drought conditions occurin southern South America, central east Africa andmuch of Europe, while tropical land regions includingthe tropical Americas and the African Sahel are wet(Herweijer et al., 2007). In each case-present day andMedieval-a protracted La Nina-like tropical Pacific isassociated with this pattern.
With regard to future hydroclimatic implications undergreenhouse warming, a more La Nina-like tropical Pacificwould create a tendency for persistent drought acrossthe extra-tropical and tropical regions sensitive to tropi-cal Pacific SST variability (in particular, western NorthAmerica, southern South America, parts of Europe, west-ern Australia and equatorial east Africa). A recent studyby Seager et al. (2007) using the IPCC (Intergovernmen-tal Panel for Climate Change) climate model projectionsof the twenty-first century shows widespread consensus
that the American southwest and much of the subtropics,shifts rapidly to a climate of greater aridity. As the mod-els vary in their tropical SST response to anthropogenicforcing, this is distinct from the historical droughts shownin the present study. The historical drought events areeach attributed to changes in tropical SSTs, and whilepersistent La Nina events in the future will continueto cause drought, these will occur around a drier basestate. In today’s globalized economy, the reality of suchconcurrent and severe drought in several agriculturallyproductive regions of the world could undoubtedly havea profound social and economic impact.
Acknowledgements
Many thanks to Naomi Naik for performing the modelsimulations and to Ed Cook, Yochanan Kushnir andMark Cane for many discussions. CH was supportedby a NASA Grant NNG04GQ55H. RS was supportedby NOAA Grants NAO30AR4320179 P07 and 20A andNSF grants ATM 05-01878 and ATM 0347009. Themodel data for the GOGA and POGA-ML simulationscan be downloaded or analysed and visualized online:
http://kage.ldeo.columbia.edu:81/SOURCES/.LDEO/.ClimateGroup/.PROJECTS/.CCM3/.
ReferencesAllan RJ, Darrigo RD. 1999. “Persistent” ENSO sequences: How
unusual was the 1990–1995 El Nino? Holocene 9: 101–118.Barsugli JJ, Battisti DS. 1998. The basic effects of atmosphereocean
thermal coupling on midlatitude variability. Journal of theAtmospheric Sciences 55: 477–493.
Bretherton CS, Battisti DS. 2000. An interpretation of the results fromatmospheric general circulation models forced by the time historyof the observed sea surface temperature distribution. GeophysicalResearch Letters 27(6): 767–770.
Briffa KR, Jones PD, Hulme M. 1994. Summer moisture variabilityacross Europe, 1892–1991: an analysis based on the Palmer DroughtSeverity Index. International Journal of Climatology 14: 475–506.
Casty C, Luterbacher J, Wanner H, Esper J, Boehm R. 2005. Temper-ature and precipitation variability in the European Alps since 1500.International Journal of Climatology 25: 1855–1880.
Cole J, Overpeck JT, Cook ER. 2002. Multi-year La Nina events andpersistent drought in the contiguous United States. GeophysicalResearch Letters 29: 1647–1650.
Compagnucci RH, Agosta EH, Vargas WM. 2002. Climate change andquasi-oscillations in central-west Argentina summer precipitation:main features and coherent behaviour with southern African region.Climate Dynamics 18: 421–435.
Dai A, Fung IY, Del Genio AD. 1997. Surface observed global landprecipitation variations during 1900–1988. Journal of Climate 10:2943–2962.
Eischeid JK, Diaz HF, Bradley RS, Jones PD. 1991. A ComprehensivePrecipitation Data Set for Global Land Areas, DOE/ER-6901T-H1.Carbon Dioxide Research Division, U.S. Department of Energy:Washington, DC.
Endfield GH, Nash DJ. 2002. Drought, desiccation and discourse:missionary correspondence and nineteenth century climate changein central southern Africa. Geographical Journal 161(1): 33–47.
Evans T. 1990. History of Nile flows. In The Nile, Howell PP, Allen JA(eds). School of Oriental and African Studies, University of London:London; 5–40.
Fye FK, Stahle DW, Cook ER. 2003. Paleoclimate analogs toTwentieth Century moisture regimes across the United States.Bulletin of the American Meteorological Society 84: 901–909.
Fye FK, Stahle DW, Cook ER. 2004. Twentieth-Century sea surfacetemperature patterns in the Pacific during decadal moisture regimesover the United States. Earth Interactions 8: 1–22.
Copyright ! 2008 Royal Meteorological Society Int. J. Climatol. (2008)DOI: 10.1002/joc

GLOBAL PERSISTENT EXTRA-TROPICAL DROUGHT
Giannini A, Saravanan R, Chang P. 2003. Oceanic forcing of Sahelrainfall on interannual to interdecadal time scales. Science 302:1027–1030.
Giannini A, Saravanan R, Chang P. 2004. The preconditioning oftropical Atlantic variability in the development of the ENSOteleconnection: Implications for the prediction of Nordeste rainfall.Climate Dynamics 22: 839–855.
Goddard L, Graham NE. 1999. Importance of the Indian Ocean forsimulating rainfall anomalies over eastern and southern Africa.Journal of Geophysical Research 104: 19099–19116.
Hastenrath S, Heller L. 1977. Dynamics of climate hazards in northeastBrazil. Quarterly Journal of the Royal Meteorological Society 103:77–92.
Herweijer C, Seager R, Cook ER. 2006. North American Droughtsof the mid-to-late Nineteenth Century: a history, simulation andimplication for Medieval drought. Holocene 16: 159–171.
Herweijer C, Seager R, Cook ER, Emile-Geay J. 2007. NorthAmerican Droughts of the last Millennium from a Gridded Networkof Tree-ring Data. Journal of Climate 20: 1353–1376.
Hoerling MP, Kumar A. 2003. The perfect ocean for drought. Science299: 691–699.
Hoerling MP, Hurrell JW, Xu T. 2001. Tropical origins for recentNorth Atlantic climate change. Science 292: 90–92.
Huang H-P, Seager R, Kushnir Y. 2005. The 1976/77 transition inprecipitation over the Americas and the influence of tropical seasurface temperature. Climate Dynamics 24: 721–740.
Hulme M, Jones PD. 1994. Global climate change in the instrumentalperiod. Environmental Pollution 83: 23–36.
Hurrell JW. 1995. Decadal trends in the North Atlantic Oscillationregion temperatures and precipitation. Science 269: 676–679.
Hurrell JW. 1996. Influence of variations in extratropical wintertimeteleconnections on Northern Hemisphere temperature. GeophysicalResearch Letters 23: 665–668.
Hurrell JW, Kushnir Y, Visbeck M, Ottersen G. 2003. In An Overviewof the North Atlantic Oscillation. The North Atlantic Oscillation:Climate Significance and Environmental Impact, GeophysicalMonograph Series, 134, American Geophys Union; 1–35.
Kaplan A, Cane MA, Kushnir Y. 2003. Reduced space approach tothe optimal analysis interpolation of historical marine observations:accomplishments, difficulties, and prospects. In Advances in theApplicationsof Marine Climatology: The Dynamic Part of the WMOGuide to the Applications of Marine Climatology, WMO/TD-1081.World Meteorological Organization: Geneva; 199–216.
Kaplan A, Cane MA, Kushnir Y, Clement AC, Blumenthal MB,Rajagopalan B. 1998. Analyses of global sea surface temperature:1856–1991. Journal of Geophysical Research 103: 18567–18589.
Kiehl JT, Hack JJ, Bonan GB, Bovile BA, Williamson DL, Rasch PJ.1998. The national center for atmospheric research communityclimate model: CCM3. Journal of Climate 11: 1131–1149.
Kushnir Y, Robinson WA, Blade I, Hall NMJ, Peng S, Sutton RT.2002. Atmospheric GCM response to extratropical SST anomalies:synthesis and evaluation. Journal of Climate 15: 2233–2256.
L’Heureux ML, Thompson DWJ. 2005. Observed relationshipsbetween the El Nino/Southern Oscillation and the extratropicalzonal-mean circulation. Journal of Climate 19: 276–277.
Liebmann B, Vera CS, Carvalho LMV, Camilloni IA, Hoerling MP,Allured D, Barros VR, Baez J, Bidegain M. 2004. An observedtrend in central South American precipitation. Journal of Climate17: 4357–4367.
Lindesay JA, Vogel CH. 1990. Historical evidence for SouthernOscillation-southern African rainfall relationships. InternationalJournal of Climatology 10: 679–689.
Mariotti A, Ballabrera-Poy J, Zeng N. 2005. Tropical influence onEuro-Asian autumn rainfall variability. Climate Dynamics 24:511–521.
Mechoso CR, Iribarren GP. 1992. Streamflow in Southeastern SouthAmerica and the Southern Oscillation. J Climate 5: 1535–1539.
Merkel U, Latif M. 2002. A high-resolution AGCM study of the ElNino impact on the North Atlantic/European sector. GeophysicalResearch Letters 29: 1291–1294.
Meshcherskaya AV, Blazhevich VG. 1997. The drought and excessivemoisture indices in a historical perspective in the principal grain-producing regions of the Former Soviet Union. Journal of Climate10: 2670–2682.
Moura AD, Shukla J. 1981. On the dynamics of drought in northeastBrazil: observations, theory and numerical experiments with ageneral circulation model. Journal of the Atmospheric Sciences 38:2653–2675.
Nash DJ, Endfield GH. 2002. A 19th Century climate chronologyfor the Kalahari region of central southern Africa derived fromMissionary correspondance. International Journal of Climatology 22:821–841.
Nicholson SE. 1998. Fluctuations of rift valley lakes malawi and chilwaduring historical times: a synthesis of geological, archaeological andhistorical information. In Environmental Change and Response inEast African Lakes, Lehman JT (ed.). Kluwer Academic Publishers:Dordrecht; 207–231.
Nicholson SE. 1999. Historical and modern fluctuations of lakestanganyika and rukwa and their relationship to rainfall variability.Climatic Change 41: 43–71.
Nicholson SE. 2001. Climatic and environmental change in Africaduring the last two centuries. Climate Research 17: 123–144.
Nicholson SE, Yin X. 2001. Rainfall conditions in equatorial EastAfrica during the nineteenth century as inferred from the recordof lake victoria. Climatic Change 48: 387–398.
Owen RB, Crossley R. 1989. Recent sedimentation in lakes Chilwaand Chiuta, Malawi. Palaeoecology of Africa 20: 109–117.
Pezzi LP, Cavalcanti IFA. 2001. The relative importance of ENSOand tropical Atlantic sea surface temperature anomalies for seasonalprecipitation over South America: a numerical study. ClimateDynamics 15: 205–212.
Preito MR, Herrera R, Dussel P. 1999. Historical evidences ofstreamflow fluctuations in the Mendoza river, Argentina, and theirrelationships with ENSO. Holocene 9: 473–481.
Quinn WH. 1993. The large-scale ENSO event, the El Ni no and otherimportant regional features. Bulletin d’Institut Francais d’EtudesAndines 22: 13–34.
Quinn WH, Neal VT. 1992. The historical record of El Nino events.In Climate Since 1500, Bradley RS, Jones PD (eds). Routledge,Chapman and Hall: London; 623–648.
Rayner N, Parker D, Horton E, Folland C, Alexander L, Rowell D,Kent E, Kaplan A. 2003. Global analyses of sea surface temperature,sea ice, and night marine air temperature since the late nineteenthcentury. Journal of Geophysical Research 108: 4407–4437.10.1029/2002JD002670.
Riehl H, El-Bakry M, Meitin J. 1979. Nile river discharge. MonthlyWeather Review 107: 1546–1553.
Robertson AW, Mechoso CR. 1998. Interannual and decadal cycles inriver flows in Southeastern South America. Journal of Climate 11:2570–2581.
Robinson WA. 2000. Review of WETS – the workshop on extra-tropical SST anomalies. Bulletin of the American MeteorologicalSociety 81(3): 567–577.
Robinson WA. 2005. Eddy-mediated interactions between low latitudesand the extratropics. In The Global Circulation of the Atmosphere,Schneider T, Sobel A (eds). Princeton University Press: Princton,NJ.
Rodwell MJ, Rodwell DP, Folland KC. 1999. Oceanic Forcing of thewintertime North Atlantic Oscillation and European Climate. Nature398: 320–323.
Saravanan R, Chang P. 2000. Interaction between tropical Atlanticvariability and El Nino-Southern Oscillation. Journal of Climate 13:2177–2194.
Schoengart J, Junk WJ, Piedade MTF, Ayres JM, Huttermann A,Worbes M. 2004. Teleconnection between tree growth in theAmazonian floodplains and the Ni no-Southern Oscillation effect.Global Change Biology 10: 683–692.
Schubert SD, Suarez MJ, Region PJ, Koster RD, Bacmeister JT.2004a. Causes of long-term drought in the United States Great Plains.Journal of Climate 17: 485–503.
Schubert SD, Suarez MJ, Pegion PJ, Randal RD, Bacmeister JT.2004b. On the cause of the 1930s Dust Bowl. Science 303:1855–1859.
Scian B, Donnari M. 1997. Retrospective analysis of the PalmerDrought Severity Index in the semi-arid Pampas region, Argentina.International Journal of Climatology 17: 313–322.
Seager R. 2007. The Turn of the Century drought across NorthAmerica: global context, dynamics and past analogues. Journal ofClimate 20: 5527–5552.
Seager R, Harnik N, Kushnir Y, Robinson W, Miller J. 2003.Mechanisms of hemispherically symmetric climate variability.Journal of Climate 16: 2960–2978.
Seager R, Kushnir Y, Herweijer C, Naik N, Miller J. 2005a. Modelingof tropical forcing of persistent droughts and pluvials over westernNorth America: 1856–2000. Journal of Climate 18: 4068–4091.
Seager R, Harnik N, Robinson WA, Kushnir Y, Ting M, Huang JVHP.2005b. Mechanisms of ENSO-forcing of hemispherically symmetric
Copyright ! 2008 Royal Meteorological Society Int. J. Climatol. (2008)DOI: 10.1002/joc

C. HERWEIJER AND R. SEAGER
precipitation variability. Quarterly Journal of the Royal Meteorolog-ical Society 131: 1501–1527.
Seager R, Kushnir Y, Visbeck MH, Naik N, Miller J, Krahmann G,Cullen HM. 2000. Causes of Atlantic Ocean climate variabilitybetween 1958 and 1998. Journal of Climate 13: 2845–2862.
Seager R, Ting MF, Held IM, Kushnir Y, Lu J, Vecchi G, Huang H-P, Harnik N, Leetmaa A, Lau N-C, Li C, Velez J, Naik N. 2007.Model projections of an imminent transition to a more arid climatein Southwestern North America. Science 316: 1181–1184.
Servain J. 1991. Simple climatic indices for the tropical Atlanticocean and some applications. Journal of Geophysical Research 96:15137–15146.
Shindell DT, Miller RL, Schmidt G, Pandolfo L. 1999. Simulation ofrecent northern winter climate trends by greenhouse-gas forcing.Nature 399: 452–455.
Sieger R. 1887. Schwankungen der Innerafrikanischen Seen, Bericht,XIII, Vereinsjahr. Vereine der Geographen an der Universitaet Wien,Vienna; Austria; 41–60.
Sieger R. 1888. Neue Beitraege zur Statistik der Seespiegelschwankun-gen. Bericht, XIV, Vereinsjahr. Vereine der Geographen an der Uni-versitaet Wien, Vienna; Austria; 11–24.
Sutton RT, Hodson DLR. 2005. Atlantic ocean forcing of NorthAmerican and European summer climate. Science 309: 115–118.
Touchan R, Xoplaki E, Funkhouser G, Luterbacher J, Hughes MK,Erkan N, Akkemik U, Stephan J. 2005. Reconstructions ofspring/summer precipitation for the Eastern Mediterranean from tree-ring widths and its connection to large-scale atmospheric circulation.Climate Dynamics 25: 75–98.
Trenberth K, Branstator GW. 1992. Issues in establishing causes of the1988 drought over North America. Journal of Climate 5: 159–172.
Trenberth K, Guillemot CJ. 1996. Physical processes involved in the1988 drought and 1993 floods in North America. Journal of Climate9: 1288–1298.
Uvo CB, Repelli CA, Zebiak SE, Kushnir Y. 1998. The relationshipsbetween tropical Pacific and Atlantic SST and Northeast Brazilmonthly precipitation. Journal of Climate 11: 551–561.
Verschuren D. 2001. Reconstructing fluctuations of a shallow EastAfrican lake during the past 1800 yrs from sediment stratigraphy ina submerged crater basin. Journal of Paleolimnology 25: 297–311.
Villalba R, Grau HR, Boninsegna JA, Jacoby GC, Ripalta A. 1998.Tree-ring evidence for longterm precipitation changes in sub-tropical South America. International Journal of Climatology 18:1463–1478.
Visbeck MH, Chassignet E, Curry R, Delworth T, Dickson B, Krah-mann G. 2003. The Ocean’s response to North Atlantic Oscillationvariability. In The North Atlantic Oscillation, Geophysical Mono-graph Series, 134, Hurrell JW, Kushnir Y, Ottersen G, Visbeck M(eds), American Geophys Union; 113–146.
Walsh RPD, Musa HRJ. 1994. Flood frequency and impacts atKhartoum since the early nineteenth century. Geographical Journal160: 266–274.
Woodhouse CA, Overpeck JT. 1998. 2000 years of drought variabilityin the central United States. Bulletin of the American MeteorologicalSociety 79: 2693–2714.
Copyright ! 2008 Royal Meteorological Society Int. J. Climatol. (2008)DOI: 10.1002/joc
Related Documents