The Global Economy Business Cycles and Their Properties © NYU Stern School of Business

The Global Economy Business Cycles and Their Properties © NYU Stern School of Business.
Dec 24, 2015
Welcome message from author
This document is posted to help you gain knowledge. Please leave a comment to let me know what you think about it! Share it to your friends and learn new things together.
Transcript

The Global Economy
Business Cycles and Their Properties
© NYU Stern School of Business

Today’s plan of attack
• Midterm
• Group Presentation
• Where we’re headed
• Pictures
• Business cycles
• Questions
• More pictures

Mercedes USA
• ..

Midterm
• Good overall performance
• Grades from 70 to 100
• Answers posted

Group Presentation
• Now is a good time to think about topics
• Due dates:
– Proposal: April 5
– Draft slides: April 12

Where we’re headed
Long-Run Performance
Saving and Investment, Productivity, Institutions, Labor Markets, International Trade, Taxes
Short-Run Performance
Inflation, Interest Rates, Exchange Rates, Indicators, Monetary Policy,
Govt Deficits, Capital Flows, Emerging Market Crises
First half:
Second half:

Where we’re headed
• Today– Properties of business cycles
– Business cycle indicators
• Thursday – Making sense of business cycles
– Aggregate supply and demand
• Next Tuesday– Current economic conditions
– Starring (9am): Ish McLaughlin and Brian Jones, Citigroup
– Starring (3pm): Richard Berner, Morgan Stanley

Current issues
• Citigroup, Bond Market Monthly, Mar 12, 2007
– We've lowered our 2007 U.S. growth outlook to about 3.0% (from 3.3%), recognizing that the inventory correction in the housing and motor vehicle areas may stretch out just a bit.
– We still think a "token" easing is possible during the second half, but expect to see very little change in monetary policy over the course of the year.
Current issues
• Lehman Brothers, US Daily Economic Comment, Mar 19, 2007:
– March 20: We look for February housing starts to rise 5% to a 1.475 million annualized rate after plunging 14.3% in January. The risk is that tightening lending standards in the subprime sector undercuts the incipient recovery in sales.
– March 21: The market is pricing in no chance of a Fed rate cut or hike at the March FOMC meeting, and we agree. Chairman Bernanke hinted at the Fed’s wait and see attitude in a recent testimony. With no expectation of a rate move, the focus will once again be on the statement and the inflation bias in particular.

US GDP
24
68
10
12
Rea
l GD
P (
Tril
lion
s o
f 20
00 D
olla
rs)
1960 1970 1980 1990 2000 2010

US GDP growth (quarterly, annual rate)
-10
-50
51
01
5Q
uart
erly
Gro
wth
Ra
te (
An
nual
Pe
rcen
t)
1960 1970 1980 1990 2000 2010

US GDP growth (yoy)
-20
24
68
An
nual
Gro
wth
Rat
e (P
erce
nt)
1960 1970 1980 1990 2000 2010
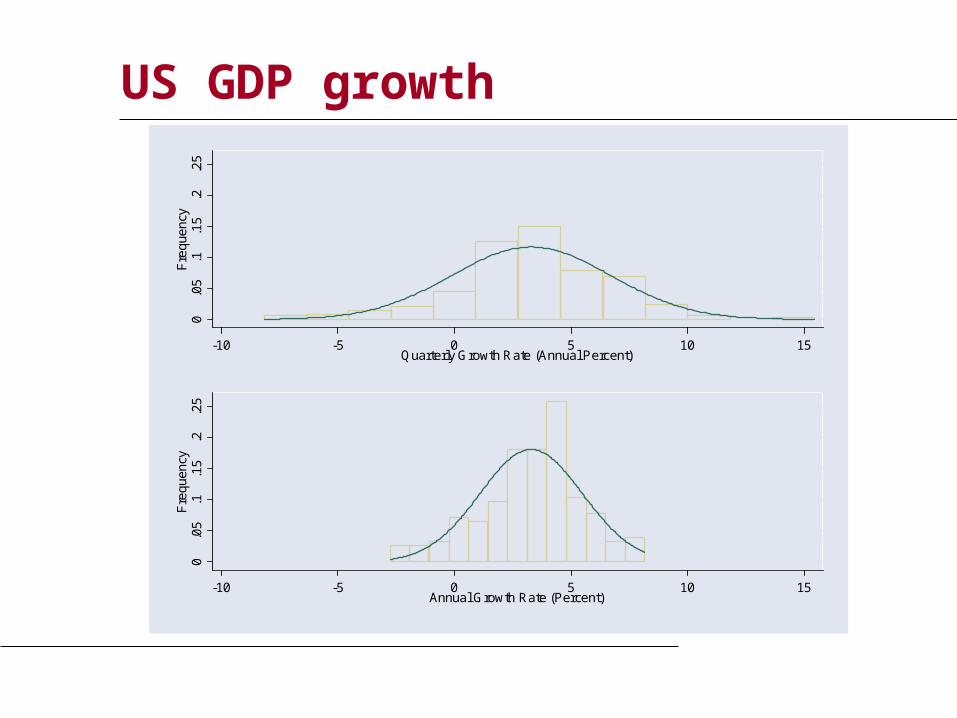
US GDP growth
0.0
5.1
.15
.2.2
5F
requ
ency
-10 -5 0 5 10 15Quarterly Growth Rate (Annual Percent)
0.0
5.1
.15
.2.2
5F
requ
ency
-10 -5 0 5 10 15Annual Growth Rate (Percent)

Volatility (std dev of annual growth rate %)
0.00
0.50
1.00
1.50
2.00
2.50
3.00
3.50
US France China India Korea Brazil Mexico
Source: World Bank, World Development Indicators, GDP per capita, 1975-2005.

More on other countries??
0.00
0.50
1.00
1.50
2.00
2.50
3.00
3.50
US France China India Korea Brazil Mexico
Source: World Bank, World Development Indicators, GDP per capita, 1975-2005.

Business cycles
• Definitions
– Short-term economic fluctuations (“high frequency”)
– Arthur Burns and Wesley Mitchell: “Business cycles are a type of fluctuation found in the aggregate economic activity of nations.... A cycle consists of expansions occurring at about the same time in many economic activities, followed by similarly general recessions, contractions and revivals which merge into the expansion phases of the next cycle.”

Questions
• What are business cycles?
– Short-term fluctuations in output
• What do we need to know about them?– What businesses are most sensitive to fluctuations? – Can we see a downturn coming? How?
• What if I’m in finance? – Interest rates are a macroeconomic phenomenon – So are equity markets as a whole– Even more so for emerging markets
• What if I’m not? – Fluctuations will still affect your business and career

Which is more cyclical?
• Toyota
• Unilever
• Pfizer
• Intel
• New York Times
• American Airlines
• McKinsey

Terminology
• An indicator is procyclical if it moves up and down with GDP, countercyclical if it moves in the opposite direction
• An indicator leads GDP if its ups and downs precede those in GDP, lags if its movements come after

Consumption of nondurables
-20
24
68
An
nual
Gro
wth
Rat
e (P
erce
nt)
1960 1970 1980 1990 2000 2010
US GDP and Nondurable Consumption Growth

Consumption of durables
-20
-10
01
02
0A
nnu
al G
row
th R
ate
(Per
cent
)
1960 1970 1980 1990 2000 2010
US GDP and Durable Consumption Growth

Investment (“producer durables”)
-20
-10
01
02
0A
nnu
al G
row
th R
ate
(Per
cent
)
1960 1970 1980 1990 2000 2010
US GDP and Private Investment Growth

Employment
-20
24
68
An
nual
Gro
wth
Rat
e (P
erce
nt)
1960 1970 1980 1990 2000 2010
US GDP and Employment Growth

Unemployment
-50
51
0R
ate
or G
row
th R
ate
(P
erc
ent)
1960 1970 1980 1990 2000 2010
US GDP Growth and Unemployment

New unemployment claims
-40
-20
02
04
06
0A
nnu
al G
row
th R
ate
(Per
cent
)
1960 1970 1980 1990 2000 2010
US GDP and New Unemployment Claims Growth

Housing starts
-100
-50
05
0A
nnu
al G
row
th R
ate
(Per
cent
)
1960 1970 1980 1990 2000 2010
US GDP and Housing Starts Growth

S&P 500
-40
-20
02
04
0A
nnu
al G
row
th R
ate
(Per
cent
)
1960 1970 1980 1990 2000 2010
US GDP and S&P 500 Growth

Inflation
-50
51
0R
ate
or G
row
th R
ate
(P
erc
ent)
1960 1970 1980 1990 2000 2010
US GDP Growth and Inflation

Inflation
02
46
81
0In
flatio
n
-2 0 2 4 6 8GDP Growth

Fed funds rate
-50
51
01
52
0R
ate
or G
row
th R
ate
(P
erc
ent)
1960 1970 1980 1990 2000 2010
US GDP Growth and Fed Funds Rate

Yield spread
-50
51
0R
ate
or G
row
th R
ate
(P
erc
ent)
1960 1970 1980 1990 2000 2010
US GDP Growth and Yield Spread

Takeaways
• GDP growth is volatile
• Lots of things move up and down with GDP
• Durable goods production is more volatile than nondurable goods
• More coming…

Citigroup Global Markets
• Brian M Jones
– Stern MBA 1989
– Previously: Lloyds Bank, Salomon Brothers
– Currently: Director, Citigroup Global Markets
• Briefs traders, investment bankers, and customers on domestic economic developments and their impact on markets
• Ish McLaughlin
– Stern MBA 1995
– Previously: Salomon Brothers
– Currently: Managing Director, Citigroup Global Markets• Investment grade syndicate desk

Questions
• How did you get to your current position? What advice would you give us?
• How do economic fluctuations affect your business?
• How do you see the US economy over the next 3-12 months? Are there any trouble spots on the horizon?
• What indicators do you find to be most reliable?
• What indicators do you see as positive right now? Negative?
• Do you have a theoretical perspective on the current situation?
Related Documents


