www.afnic.fr | [email protected] Twitter: @AFNIC | Facebook: afnic.fr The Global Domain Name Market in 2021 Afnic Studies June 2022

Welcome message from author
This document is posted to help you gain knowledge. Please leave a comment to let me know what you think about it! Share it to your friends and learn new things together.
Transcript
www.afnic.fr | [email protected] Twitter: @AFNIC | Facebook: afnic.fr
The Global Domain Name Market in 2021
Afnic Studies June 2022
2
Afnic -The Global Domain Name Market in 2021
CONTENTS
1. Introduction ................................................................................................................. 4
2. Executive summary ............................................................................................... 6
3. Global trends ............................................................................................................. 10
3.1. A return to normality? ...................................................................................................... 10
3.2. Persistently contrasting performances ................................................................ 11 3.3. nTLDs: surface tumult and baseline development ...................................... 12
3.4. Strengthening of .COM positions in 2021 as in 2020 ...................................... 13
4. Legacy TLDs in 2021 ................................................................................................ 15
4.1. The .COM domain versus Other Legacy TLDs: persistently contrasting situations ..................................................................................................... 16
4.2. Legacy TLD creations during the post-COVID phase .................................. 16
4.3. Retention rates up sometimes significantly .................................................... 18
4.4. Implications in terms of naming strategies .................................................... 20
5. ccTLDs (country-code Top-Level Domains) ...................................... 22
5.1. ccTLD creations during the post-COVID phase ............................................. 22
5.2. The regional dynamics of ccTLDs ........................................................................... 23
5.3. Weight of quasi-TLDs and Penny ccTLDs ............................................................ 27
6. nTLDs .............................................................................................................................. 30
6.1. Global change in the stock of “new TLDs” .......................................................... 30
6.2. Definition of “new TLD” “segments” ......................................................................... 31 6.3. Performance of “new TLD” “segments” ................................................................ 33
6.4. Distribution of new TLDs in volumes of domain name registrations .......................................................................................................................... 35
6.5. Change in retention rates per segment ............................................................. 39
6.6. The “Penny nTLD” phenomenon ............................................................................... 40
6.6.1. Retention Rate ....................................................................................................................... 41 6.6.2. Creation Rate ........................................................................................................................ 43
6.6.3. Identification of Penny nTLDs in 2021 ..................................................................... 43
6.7. Reflections on the business models of the nTLDs ......................................... 47
6.7.1. Unequal business models ............................................................................................ 48
6.7.2. The consequences in terms of marketing strategies ............................... 50
6.7.3. Exclusive TLDs vs. mass TLDs ...................................................................................... 50
6.7.4. Bad pricing never pays ................................................................................................... 51 6.7.5. Rights holders and domainers, two false friends .......................................... 51 6.7.6. Convincing investors ....................................................................................................... 51 6.7.7. Success or failure is linked not to volume but to the pertinence of
the strategy with respect to market conditions. .......................................... 52
6.8. “Leaders” still fragile ......................................................................................................... 52
3
Afnic -The Global Domain Name Market in 2021
6.9. Market share of the main back-end registry operators.......................... 55
7. The distribution of domain names in the world at year-end 2021 ............................................................................................................................. 58
7.1. Overview .................................................................................................................................. 58
7.2. Weight of segments in Africa .................................................................................... 59
7.3. Weight of segments in Latin America .................................................................. 59
7.4. Weight of segments in Asia-Pacific ....................................................................... 61 7.5. Weight of segments in Europe .................................................................................. 62
7.6. Weight of segments in North America ................................................................ 63
7.7. Summary tables ................................................................................................................. 64
7.8. Topology of ICANN registrars ..................................................................................... 65
7.9. Lessons learned ...................................................................................................................73
8. Highlights of 2021 and early 2022 ............................................................... 75
8.1. A TLD market that is still active ................................................................................. 75
8.1.1. Changes in registries ...................................................................................................... 75
8.1.2. Back-end operators ......................................................................................................... 76
8.2. Mergers and acquisitions: continuous consolidation, accompanied by financiers .......................................................................................................................... 77
8.3. New services ......................................................................................................................... 78
8.3.1. Data, Security and Monitoring .................................................................................. 78
8.3.2. Innovations brought to market or in preparation ....................................... 79
8.3.3. Infrastructures ..................................................................................................................... 79
9. Conclusions and outlooks .............................................................................. 80
4
Afnic -The Global Domain Name Market in 2021
1. Introduction The publication of ICANN statistics as at 31/12/2021 allows a quantified assessment of 2021, a period marked by the post-COVID-19 situation.
The data on which this study is based come from ICANN reports (Transactions - registries), from information provided by registries in certain frameworks such as the Council of European National Top-Level Domain Registries (CENTR) or the Asia-Pacific Top-Level Domain Association (APTLD) or via their websites, and research conducted by Afnic. In some cases, we have also relied on specialised sites such as https://ntldstats.com.
Our figures may vary slightly from those reported by other sources, in particular due to the lack of precise data for certain country code Top-Level Domains (ccTLDs).
A supplement to the annual review of the market for domain names in France
This study supplements our Annual review of the French domain name market published at the beginning of each year. It helps put into perspective the specific trends of the French market by comparing local data with global data.
By way of reminder:
growth of the French market as a whole was 3.6% in 2021 compared with 6.2% in 2020 (for the .FR TLD the respective figures were 5.8% and 6.2%);
the market shares of the various segments in France were, at the end of 2021, 39% for .FR, 45% for .COM, 11% for “Other Legacy” TLDs, 3% for French-owned foreign ccTLDs and 2% for “new TLDs”.
We refer the reader to this document for more information on the French market. It can be downloaded free of charge from the Afnic website:
In French:
https://www.afnic.fr/wp-media/uploads/2022/03/Le-.FR-en-2021.pdf
In English:
https://www.afnic.fr/wp-media/uploads/2022/03/The-.FR-in-2021.pdf
5
Afnic -The Global Domain Name Market in 2021
Definitions
APTLD: Asia Pacific Top-Level Domain Association. CENTR: Council of European National Top-Level Domain Registries ICANN: Internet Corporation for Assigned Names and Numbers. TLD (Top-Level Domain): a domain at the highest level in the hierarchical Domain Name System of the Internet after the root domain. .FR and .ORG are top-level domains. ccTLD (country-code Top-Level Domain): top-level domain corresponding to a territory or country. The ccTLD for France is .FR, but there are other French ccTLDs such as .RE (Réunion), .PM (Saint Pierre and Miquelon), etc. gTLD (generic Top-Level Domain): a generic TLD, not attached to a particular country or territory. .COM, .NET and .ORG are gTLDs. Legacy gTLD: a generic TLD created before 2014. These are “legacy” TLDs, such as .COM, .NET, .ORG or more recently (2001-2004) .INFO, .BIZ, .MOBI, etc. nTLD (new Top-Level Domain): generic TLD created after 2014. nTLDs are divided into several sub-segments such as geoTLDs (regions, cities, etc.), community TLDs (community-based), .brand (TLDs corresponding to major brands) or generic nTLDs (common dictionary terms). Penny TLD: TLD that is free or sold at a very low price and/or with a very high creation rate combined with a very low renewal rate. Annualised creation rate: total number of create operations over the last 12 months/stock end of period Annualised retention rate: (Stock end of period – creations over the last 12 months) / Stock start of period (12 months earlier)
6
Afnic -The Global Domain Name Market in 2021
2. Executive summary
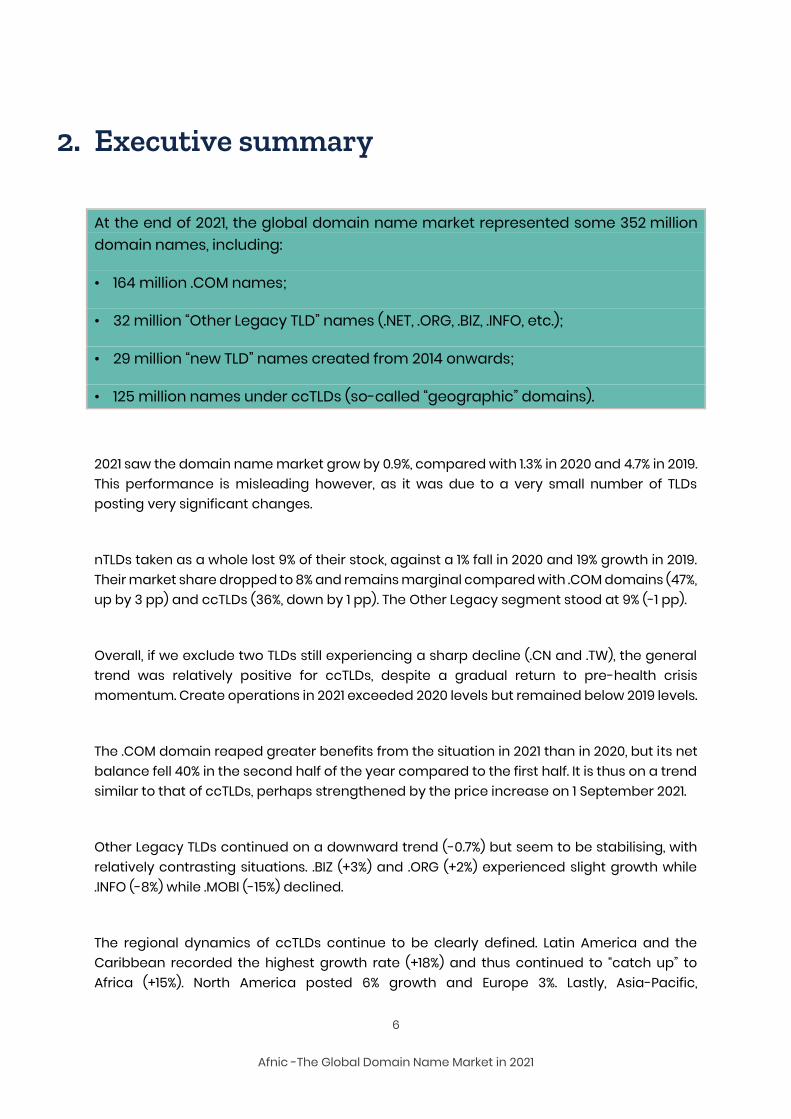
At the end of 2021, the global domain name market represented some 352 million domain names, including:
• 164 million .COM names;
• 32 million “Other Legacy TLD” names (.NET, .ORG, .BIZ, .INFO, etc.);
• 29 million “new TLD” names created from 2014 onwards;
• 125 million names under ccTLDs (so-called “geographic” domains).
2021 saw the domain name market grow by 0.9%, compared with 1.3% in 2020 and 4.7% in 2019. This performance is misleading however, as it was due to a very small number of TLDs posting very significant changes.
nTLDs taken as a whole lost 9% of their stock, against a 1% fall in 2020 and 19% growth in 2019. Their market share dropped to 8% and remains marginal compared with .COM domains (47%, up by 3 pp) and ccTLDs (36%, down by 1 pp). The Other Legacy segment stood at 9% (-1 pp).
Overall, if we exclude two TLDs still experiencing a sharp decline (.CN and .TW), the general trend was relatively positive for ccTLDs, despite a gradual return to pre-health crisis momentum. Create operations in 2021 exceeded 2020 levels but remained below 2019 levels.
The .COM domain reaped greater benefits from the situation in 2021 than in 2020, but its net balance fell 40% in the second half of the year compared to the first half. It is thus on a trend similar to that of ccTLDs, perhaps strengthened by the price increase on 1 September 2021.
Other Legacy TLDs continued on a downward trend (-0.7%) but seem to be stabilising, with relatively contrasting situations. .BIZ (+3%) and .ORG (+2%) experienced slight growth while .INFO (-8%) while .MOBI (-15%) declined.
The regional dynamics of ccTLDs continue to be clearly defined. Latin America and the Caribbean recorded the highest growth rate (+18%) and thus continued to “catch up” to Africa (+15%). North America posted 6% growth and Europe 3%. Lastly, Asia-Pacific,
7
Afnic -The Global Domain Name Market in 2021
constrained by the .CN and .TW domains, lost stocks of 14%. In two years (2020 - 2021), Asia-Pacific has lost 8 points of market share in the ccTLD segment in favour of Europe (+4.5%), Latin America and the Caribbean (+2.5), North America (+0.5) and Africa (+0.5).
ccTLDs continue to thrive best in Europe: out of 31 ccTLDs with over a million names, 18 are in Europe, 7 in Asia-Pacific, 3 in Latin America and the Caribbean, 2 in North America, and 1 in Africa.
Among the nTLD segments, Generic nTLDs fell 12% in stock and 8% in create operations (end of the .ICU purge and other “Penny nTLDs) and Community TLDs 21% (-24% create operations). Geographic TLDs were up 12% in stock and 41% in create operations, .BRANDs 7% (-23% create operations) and “open” .BRANDs 5% (+67% create operations). The regular deletion process of .BRAND TLDs and/or their conversion to generic domains has continued: 4 in 2019, 6 in 2020, 2 in 2021.
Retention rates are particularly high among .BRANDs (91%), relatively good for Geographic TLDs (75%) and Community TLDs (74%), moderate for open .BRANDs (50%) and relatively low for Generic TLDs (38%).
62% of new TLDs other than .BRAND had fewer than 10,000 names in portfolio, while 2% had more than 500,000. For many of them (other than the .BRAND domains), these low volumes constitute a serious impediment to breaking even and financing their development.
“Penny nTLDs” represent 25 TLDs and 16 million domain names (compared with 21 TLDs and 15 million names in 2020), i.e. 2% of nTLDs and 55% of the overall nTLD stock. However, the composition of this very specific category is far from constant, with only 3 domains considered “Penny TLDs” since 2019 (.ONLINE, .PRESS and .STORE).
The market of back-end registry operators acting on their own account or on behalf of third parties is dominated by a few players, the three biggest of which are Ethos Capital (Afilias+Donuts), CentralNic and GoDaddy with 35%, 17% and 8% of nTLDs managed respectively for name volumes representing 19%, 44% and 9% of all the names registered as nTLDs.
The study of the distribution of domain names in the various ICANN regions (by holders’ countries) shows that ccTLDs are still leaders in every region except North America, which is dominated by the .COM domain. .COM gained ground overall in 2021 but with varied success
8
Afnic -The Global Domain Name Market in 2021
depending on the region. North America remains its focus region and the region in which it is the undisputed leader.
Other Legacy TLDs and nTLDs are still very much in the minority, even in North America where their market shares are most significant.
These data underline how difficult it is for new entrants to make their mark in the face of cultural prisms that in one case prize notions of territory and proximity, and in the other case (North America) favour a global approach and are wary of any reductive specific feature induced by the TLD chosen.
The other major determinant of the market is location, the most powerful registrars being located in North America (50% of registrars managing more than 1 million domain names, but above all the world leader GoDaddy which manages 71 million alone). Their counterparts in other regions are smaller, and sell ccTLDs just as well as, if not better than, gTLDs and nTLDs in order to respond to local demand and to the competition to which it leads. The distribution of Legacy TLDs and nTLDs by countries of groups of registrars shows North America leading by a long way, with Europe lagging badly in terms of distribution by holders’ countries.
An analysis of the strategies of ICANN registrars demonstrates that most are positioned on Legacy TLDs and nTLDs (64%), that 30% only sell Legacy TLDs and 6% only sell nTLDs.
The dynamics of ICANN registrars consolidated by region shows that North America and Europe are more mature markets than Latin America and the Caribbean and Asia-Pacific, which are more dynamic but also more volatile.
The concentration process continued in 2021 both horizontally and vertically. The major players are also looking to position themselves on markets related to domain names, while players that have developed outside of this market are successfully making their mark (Google and Wix are among the top 10 global registrars, for example).
The still distant deadline for the 2nd ICANN round is causing uncertainty in the market and adding impetus to the process of concentration insofar as players can solely envisage buyouts of existing TLD to grow quickly instead of investing in the creation of new markets.
The development of commercial nTLDs continues to be a source of concern, as most have not reached a size that allows them to exceed their break-even point. Their financial
9
Afnic -The Global Domain Name Market in 2021
situation and the difficulties in accessing the market caused by registrars unwilling to take risks for new entrants also contribute to this concentration. This leads to sales of nTLDs to big players able to obtain economies of scale and have their own registrars to reach target audiences. Nevertheless, these players’ registrar networks seem to work in the same way as those of their competitors, that is to say as “wholesalers” without targeting specific user groups that could be directly interested in the TLDs held in the portfolio.
For these reasons combined, and as already commented in previous years, the registry-registrar system will no doubt have to change in the future, by increasingly favouring the emergence of specialised or proximity resellers who will market nTLDs to the relevant niche.
As regards the registries, services linked to data (including monitoring and security), the improvement of DNS infrastructures and cybersecurity have remained the main avenues of development and diversification alongside new services aimed at boosting sales (suggesting attractive names, etc.). We are not, however, seeing fundamentally innovative offerings emerge resulting from R&D initiatives, except for systems to detect potential abuse of domain names and processes to identify holders using digital identity certificates which are already used by some European ccTLDs. Yet despite the interest of this progress when it comes to increasing the reliability of WHOIS bases, they are not strictly speaking commercial offers.
The IoT (Internet of Things), on the subject of which an Afnic engineer recently published an article1, could prove to be an important growth driver for registries in the medium term.
1 BALAKRICHENAN Sandoche. Evolving From an Internet Registry to IoT Registry, CircleID, 13/04/2022.
https://circleid.com/posts/20220413-evolving-from-an-internet-registry-to-iot-registry
10
Afnic -The Global Domain Name Market in 2021
3. Global trends The domain name market (excluding Penny TLDs) represented approximately 352 million names worldwide at end 2021, up by 0.9% from 2020 (349 million). Although the growth trend shows a constant slowdown (+4.7M in 2019, +1.3% in 2020, +0.9% in 2021), an analysis of monthly variations reveals that in reality, 2021 was the “trough” year and that the market was once again on an upward trend at the end of year.
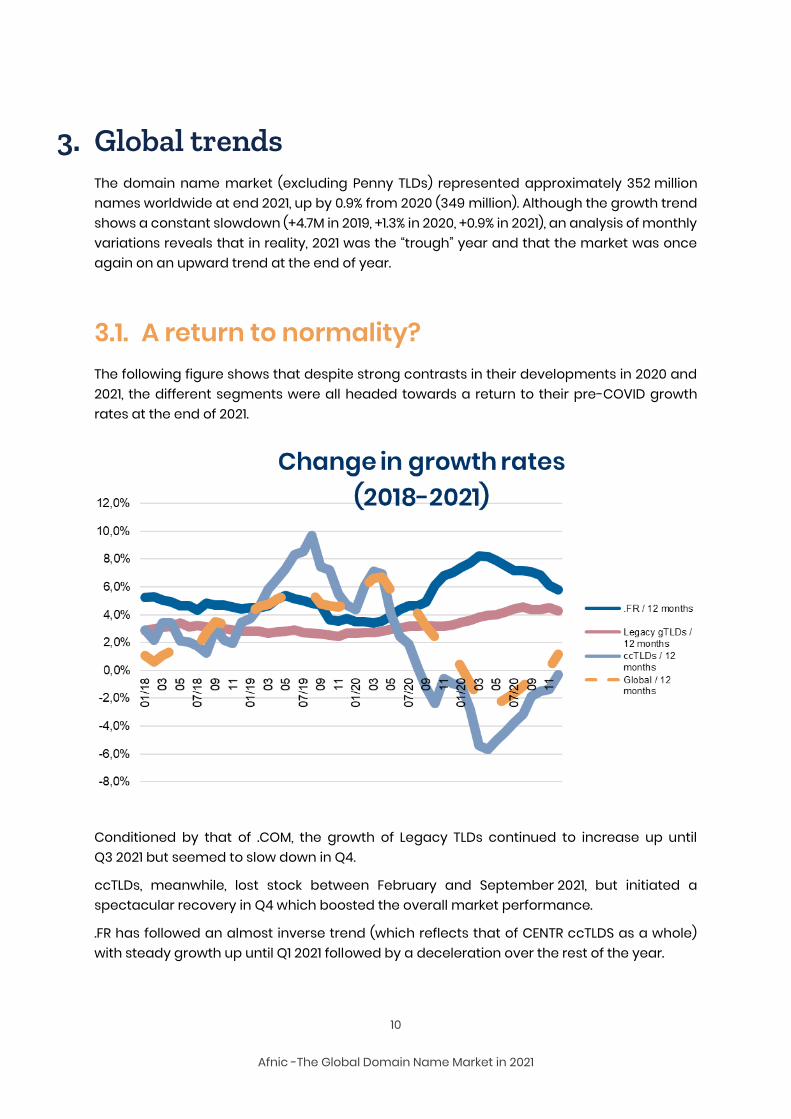
3.1. A return to normality? The following figure shows that despite strong contrasts in their developments in 2020 and 2021, the different segments were all headed towards a return to their pre-COVID growth rates at the end of 2021.
Conditioned by that of .COM, the growth of Legacy TLDs continued to increase up until Q3 2021 but seemed to slow down in Q4.
ccTLDs, meanwhile, lost stock between February and September 2021, but initiated a spectacular recovery in Q4 which boosted the overall market performance.
.FR has followed an almost inverse trend (which reflects that of CENTR ccTLDS as a whole) with steady growth up until Q1 2021 followed by a deceleration over the rest of the year.
11
Afnic -The Global Domain Name Market in 2021
In this report, we will explain the causes of these developments which may sometimes be misleading, covering numerous distinct phenomena.
The new TLDs are not included in this figure because their large variations would overwrite the other curves. These represented +15% in 2018 and +20% in 2019 but -1% in 2020 and -9% in 2021. These negative performances can be largely attributed to the after-effects of the “purge” of the .ICU domain begun in 2021; they do not reflect the real dynamics of this market segment.
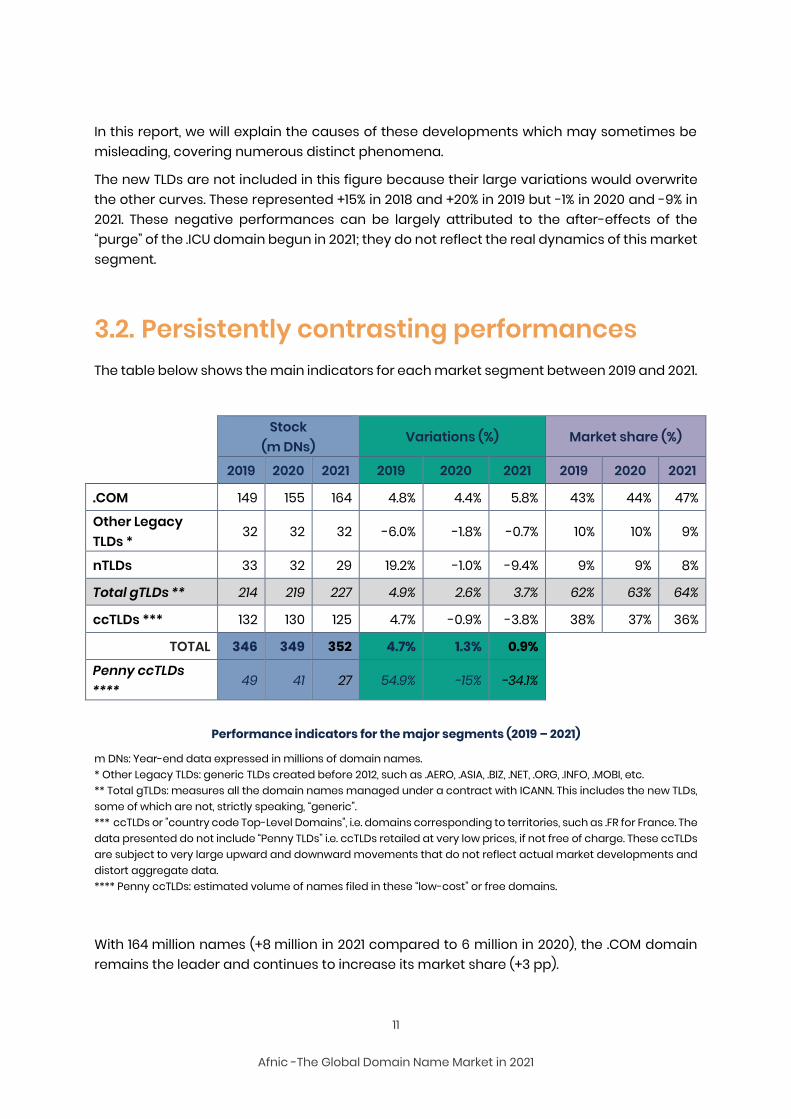
3.2. Persistently contrasting performances The table below shows the main indicators for each market segment between 2019 and 2021.
Stock
(m DNs) Variations (%) Market share (%)
2019 2020 2021 2019 2020 2021 2019 2020 2021
.COM 149 155 164 4.8% 4.4% 5.8% 43% 44% 47%
Other Legacy TLDs *
32 32 32 -6.0% -1.8% -0.7% 10% 10% 9%
nTLDs 33 32 29 19.2% -1.0% -9.4% 9% 9% 8%
Total gTLDs ** 214 219 227 4.9% 2.6% 3.7% 62% 63% 64%
ccTLDs *** 132 130 125 4.7% -0.9% -3.8% 38% 37% 36%
TOTAL 346 349 352 4.7% 1.3% 0.9%
Penny ccTLDs ****
49 41 27 54.9% -15% -34.1%
Performance indicators for the major segments (2019 – 2021)
m DNs: Year-end data expressed in millions of domain names. * Other Legacy TLDs: generic TLDs created before 2012, such as .AERO, .ASIA, .BIZ, .NET, .ORG, .INFO, .MOBI, etc. ** Total gTLDs: measures all the domain names managed under a contract with ICANN. This includes the new TLDs, some of which are not, strictly speaking, “generic”. *** ccTLDs or "country code Top-Level Domains", i.e. domains corresponding to territories, such as .FR for France. The data presented do not include “Penny TLDs” i.e. ccTLDs retailed at very low prices, if not free of charge. These ccTLDs are subject to very large upward and downward movements that do not reflect actual market developments and distort aggregate data. **** Penny ccTLDs: estimated volume of names filed in these “low-cost” or free domains.
With 164 million names (+8 million in 2021 compared to 6 million in 2020), the .COM domain remains the leader and continues to increase its market share (+3 pp).
12
Afnic -The Global Domain Name Market in 2021
The “Other Legacy” TLDs continued to lose stock in 2021, but less markedly than since 2018. The trend towards stabilisation is continuing.
New TLDs posted a stock decline (-9%) despite being in a “recovery” phase since summer 2021.
Country TLDs (ccTLDs) ended the year in the red overall (-4%) although they experienced regrowth since Q2 2021. This below-average performance is in reality determined by a small number of ccTLDs.
This contrasting behaviour has impacted market share with the rise of .COM (+3 pp) to the detriment of Other Legacy TLDs (-1 point), nTLDs (-1 pp) and ccTLDs (-1 pp).
We will be looking in more detail at how each segment experienced 2021, which marked the transition towards a “post-COVID” world where the achievements of the acceleration of the digital transition still made themselves felt.
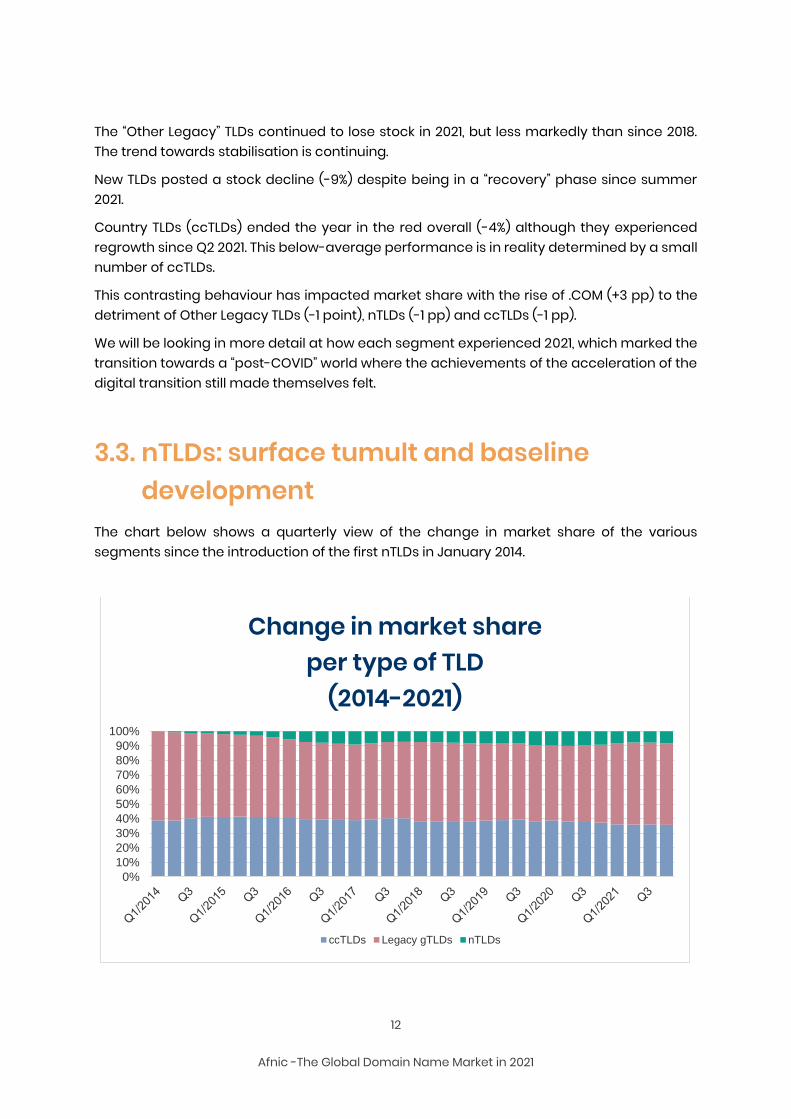
3.3. nTLDs: surface tumult and baseline development
The chart below shows a quarterly view of the change in market share of the various segments since the introduction of the first nTLDs in January 2014.
0%
10%
20%
30%
40%
50%
60%
70%
80%
90%
100%
Change in market shareper type of TLD
(2014-2021)
ccTLDs Legacy gTLDs nTLDs
13
Afnic -The Global Domain Name Market in 2021
Note the sustained growth of nTLDs up to Q1 2017, followed by a period of decline in Q2 and Q3 2017 and stabilisation up to Q3 2019. At the end of 2019 there was a new uptick due to the .ICU domain, but not enough to pass the 10% market share mark. A decline can be observed in Q3 and Q4 2020. The situation subsequently remained stable overall in 2021.
Trends in nTLDs are often reflected in those in ccTLDs, with gTLDs remaining stable or increasing their share only marginally. This finding confirmed in 2014 – 2020 was not confirmed in 2021 with a fall in nTLDs and ccTLDs combined with the strong growth of .COM which more than offset the decline in Other Legacy TLDs.
This pattern may be specific to 2021 but does not negate the observation made in previous editions of the Observatory. The 20/80 rule (and even the 5/95 rule) still applies: a small number of TLDs account for the bulk of the net balance (positive or negative), thus masking the performances of the other TLDs.
3.4. Strengthening of .COM positions in 2021 as in 2020
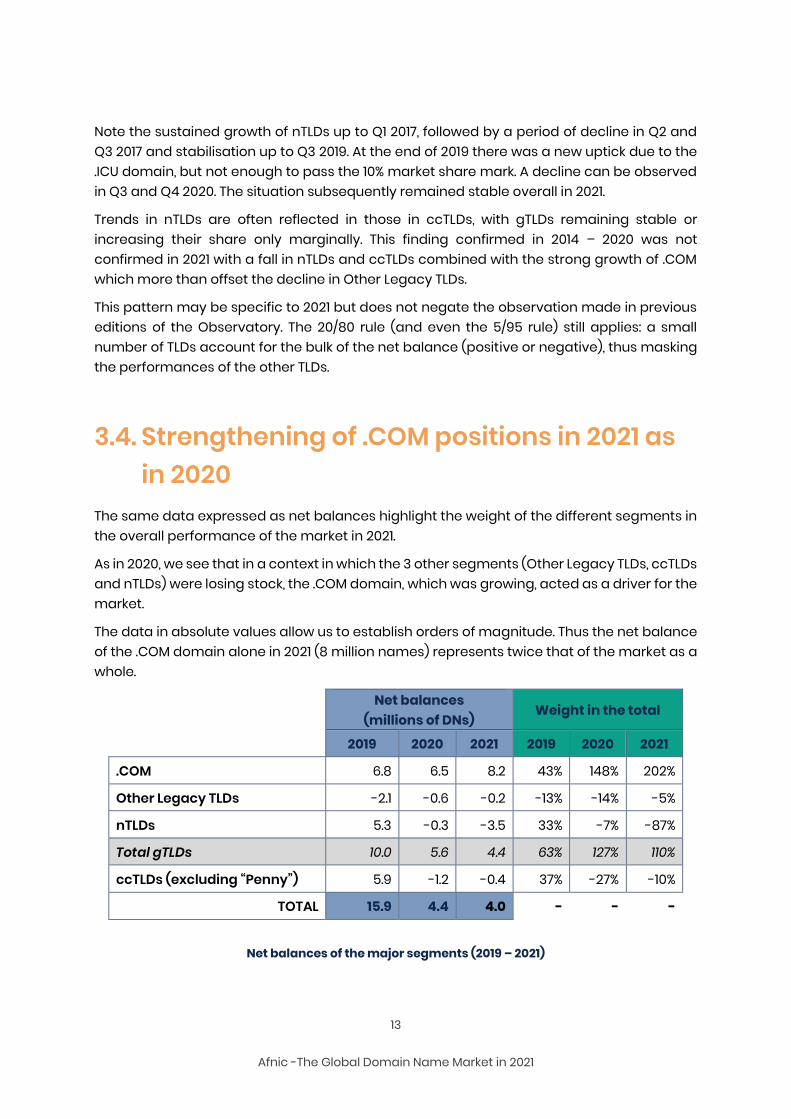
The same data expressed as net balances highlight the weight of the different segments in the overall performance of the market in 2021.
As in 2020, we see that in a context in which the 3 other segments (Other Legacy TLDs, ccTLDs and nTLDs) were losing stock, the .COM domain, which was growing, acted as a driver for the market.
The data in absolute values allow us to establish orders of magnitude. Thus the net balance of the .COM domain alone in 2021 (8 million names) represents twice that of the market as a whole.
Net balances
(millions of DNs) Weight in the total
2019 2020 2021 2019 2020 2021
.COM 6.8 6.5 8.2 43% 148% 202%
Other Legacy TLDs -2.1 -0.6 -0.2 -13% -14% -5%
nTLDs 5.3 -0.3 -3.5 33% -7% -87%
Total gTLDs 10.0 5.6 4.4 63% 127% 110%
ccTLDs (excluding “Penny”) 5.9 -1.2 -0.4 37% -27% -10%
TOTAL 15.9 4.4 4.0 - - -
Net balances of the major segments (2019 – 2021)
14
Afnic -The Global Domain Name Market in 2021
These data give us some idea of the relative positions and dynamics of the major market segments - Legacy TLDs, ccTLDs and nTLDs - but they do not explain them. Now let us take a closer look at each of these three segments to try to better understand the phenomena at work in 2021.
15
Afnic -The Global Domain Name Market in 2021
4. Legacy TLDs in 2021 There are now 18 “Legacy TLDs”, or “traditional” domains created before 2012: AERO, ASIA, BIZ, CAT, COM, COOP, INFO, JOBS, MOBI, MUSEUM, NAME, NET, ORG, POST, PRO, TEL, TRAVEL and XXX.
The stocks of these Legacy TLDs vary enormously, from the handful of names in the .POST domain to the 164 million of the .COM domain.
In order to present relevant summary tables and indicators, we shall distinguish only the six biggest in volume terms, aggregating the other 12 under “Others”.
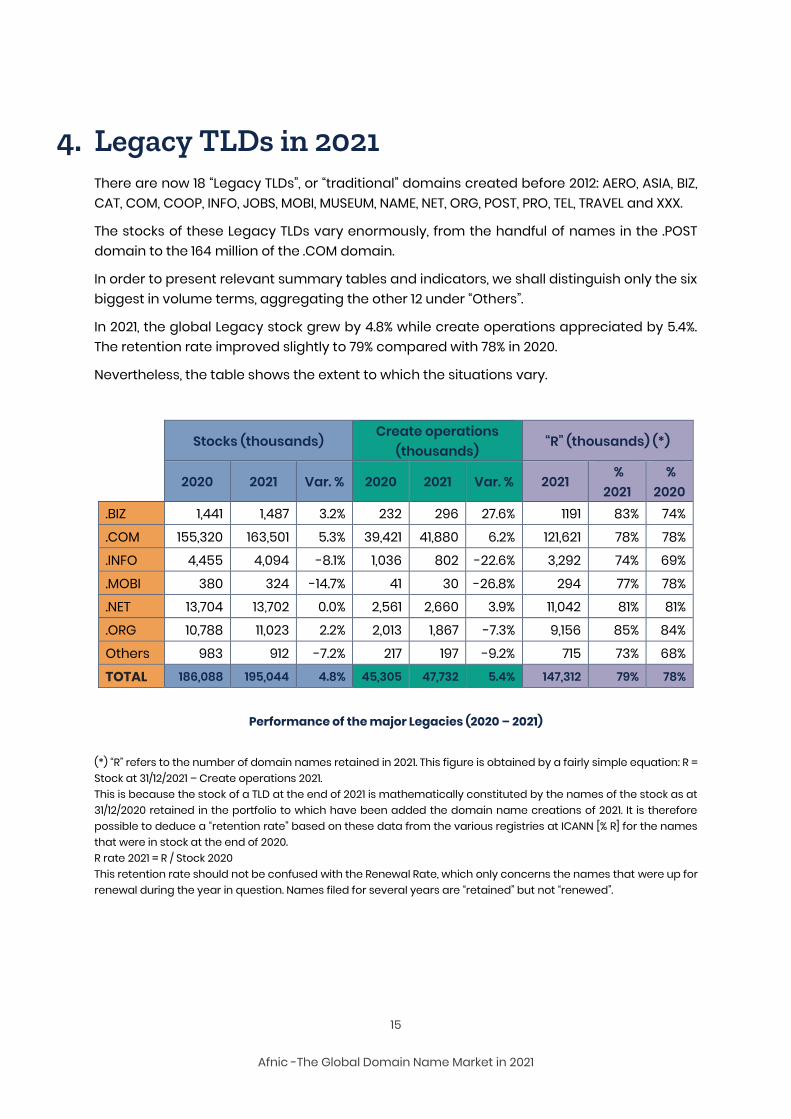
In 2021, the global Legacy stock grew by 4.8% while create operations appreciated by 5.4%. The retention rate improved slightly to 79% compared with 78% in 2020.
Nevertheless, the table shows the extent to which the situations vary.
Stocks (thousands) Create operations
(thousands) “R” (thousands) (*)
2020 2021 Var. % 2020 2021 Var. % 2021 %
2021 %
2020 .BIZ 1,441 1,487 3.2% 232 296 27.6% 1191 83% 74%
.COM 155,320 163,501 5.3% 39,421 41,880 6.2% 121,621 78% 78%
.INFO 4,455 4,094 -8.1% 1,036 802 -22.6% 3,292 74% 69%
.MOBI 380 324 -14.7% 41 30 -26.8% 294 77% 78%
.NET 13,704 13,702 0.0% 2,561 2,660 3.9% 11,042 81% 81%
.ORG 10,788 11,023 2.2% 2,013 1,867 -7.3% 9,156 85% 84%
Others 983 912 -7.2% 217 197 -9.2% 715 73% 68%
TOTAL 186,088 195,044 4.8% 45,305 47,732 5.4% 147,312 79% 78%
Performance of the major Legacies (2020 – 2021)
(*) “R” refers to the number of domain names retained in 2021. This figure is obtained by a fairly simple equation: R = Stock at 31/12/2021 – Create operations 2021. This is because the stock of a TLD at the end of 2021 is mathematically constituted by the names of the stock as at 31/12/2020 retained in the portfolio to which have been added the domain name creations of 2021. It is therefore possible to deduce a “retention rate” based on these data from the various registries at ICANN [% R] for the names that were in stock at the end of 2020. R rate 2021 = R / Stock 2020 This retention rate should not be confused with the Renewal Rate, which only concerns the names that were up for renewal during the year in question. Names filed for several years are “retained” but not “renewed”.
16
Afnic -The Global Domain Name Market in 2021
4.1. The .COM domain versus Other Legacy TLDs: persistently contrasting situations
The data presented above show that the situations of the main Legacy TLDs differ profoundly.
.COM dominates in terms of volume (it accounts for 84% of all Legacy TLDs) and growth, which outstrips that of Other Legacy TLDs thanks to rising create operations with a stable retention rate.
Of the Other Legacy TLDs, .BIZ (+3.2%) and .ORG (+2.2%) are expanding, .NET has reached a balance, and the others are losing stock: -14.7% for .MOBI, -8.1% for .INFO and -7.2% overall for the others.
.BIZ seems to be getting back on its feet after a purge with a retention rate of 83% following a poor year in 2020. .ORG had a high rate slightly up which offset the fall in its create operations (-7.3%).
Generally speaking, retention rates are rising, but the Legacy TLDs most penalised in terms of stocks are those that have seen their create operations plummet: -26.8% for .MOBI, -22.6% for .INFO and -9.2% for the others.
It is as if users were less and less interested in these domains which were presented, at the time of their creation in 2001, as alternatives to the near “saturation” of the .COM domain.
4.2. Legacy TLD creations during the post-COVID phase
As already mentioned above, .COM saw its create operations increase by 6% in 2021 following a 4% increase in 2020. The acceleration of the digital transformation was felt more acutely for this TLD with a 6-month lag compared to ccTLDs.
In the 2020 Observatory, we attributed this phenomenon to the decline in create operations carried out in 2020 by the major domainers which offset the create operations that resulted from the lockdowns.
In 2021, the same causes worked in reverse at an interval generating a boom in the domain: return of domaining and slowdown in post-COVID creations in a context of a 7% price rise as of 1 September 2021.
This formative data could result in a serious drop in growth of the .COM TLD in 2022, forcing domainers to rid their portfolios of “loss-making” names under the new price conditions.
17
Afnic -The Global Domain Name Market in 2021
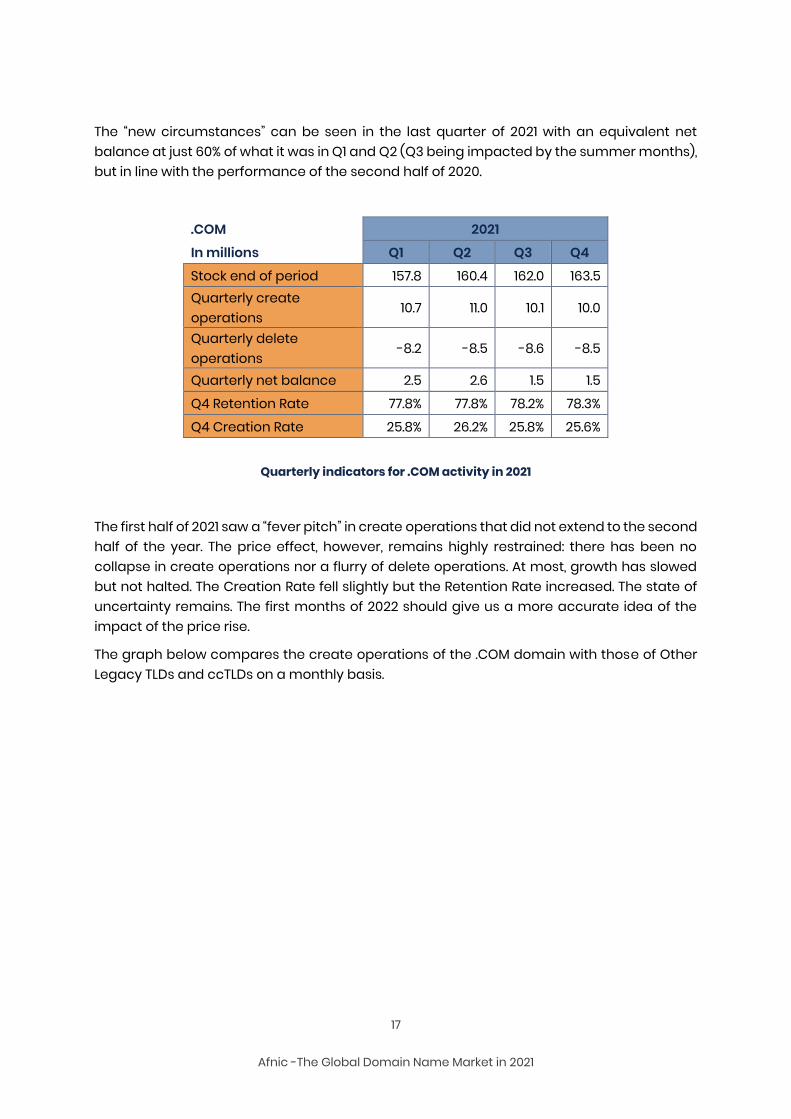
The “new circumstances” can be seen in the last quarter of 2021 with an equivalent net balance at just 60% of what it was in Q1 and Q2 (Q3 being impacted by the summer months), but in line with the performance of the second half of 2020.
.COM 2021
In millions Q1 Q2 Q3 Q4
Stock end of period 157.8 160.4 162.0 163.5 Quarterly create operations
10.7 11.0 10.1 10.0
Quarterly delete operations
-8.2 -8.5 -8.6 -8.5
Quarterly net balance 2.5 2.6 1.5 1.5
Q4 Retention Rate 77.8% 77.8% 78.2% 78.3%
Q4 Creation Rate 25.8% 26.2% 25.8% 25.6%
Quarterly indicators for .COM activity in 2021
The first half of 2021 saw a “fever pitch” in create operations that did not extend to the second half of the year. The price effect, however, remains highly restrained: there has been no collapse in create operations nor a flurry of delete operations. At most, growth has slowed but not halted. The Creation Rate fell slightly but the Retention Rate increased. The state of uncertainty remains. The first months of 2022 should give us a more accurate idea of the impact of the price rise.
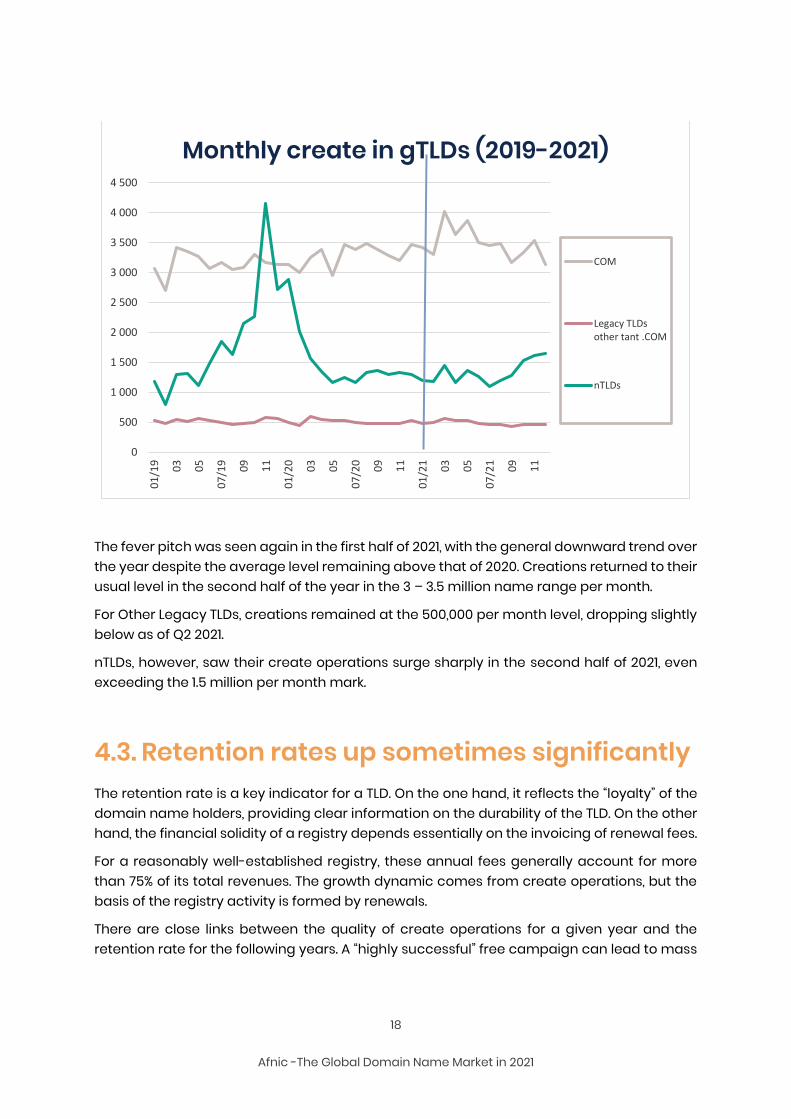
The graph below compares the create operations of the .COM domain with those of Other Legacy TLDs and ccTLDs on a monthly basis.
18
Afnic -The Global Domain Name Market in 2021
The fever pitch was seen again in the first half of 2021, with the general downward trend over the year despite the average level remaining above that of 2020. Creations returned to their usual level in the second half of the year in the 3 – 3.5 million name range per month.
For Other Legacy TLDs, creations remained at the 500,000 per month level, dropping slightly below as of Q2 2021.
nTLDs, however, saw their create operations surge sharply in the second half of 2021, even exceeding the 1.5 million per month mark.
4.3. Retention rates up sometimes significantly The retention rate is a key indicator for a TLD. On the one hand, it reflects the “loyalty” of the domain name holders, providing clear information on the durability of the TLD. On the other hand, the financial solidity of a registry depends essentially on the invoicing of renewal fees.
For a reasonably well-established registry, these annual fees generally account for more than 75% of its total revenues. The growth dynamic comes from create operations, but the basis of the registry activity is formed by renewals.
There are close links between the quality of create operations for a given year and the retention rate for the following years. A “highly successful” free campaign can lead to mass
0
500
1 000
1 500
2 000
2 500
3 000
3 500
4 000
4 500
01
/19
03
05
07
/19
09
11
01
/20
03
05
07
/20
09
11
01
/21
03
05
07
/21
09
11
Monthly create in gTLDs (2019-2021)
COM
Legacy TLDsother tant .COM
nTLDs
19
Afnic -The Global Domain Name Market in 2021
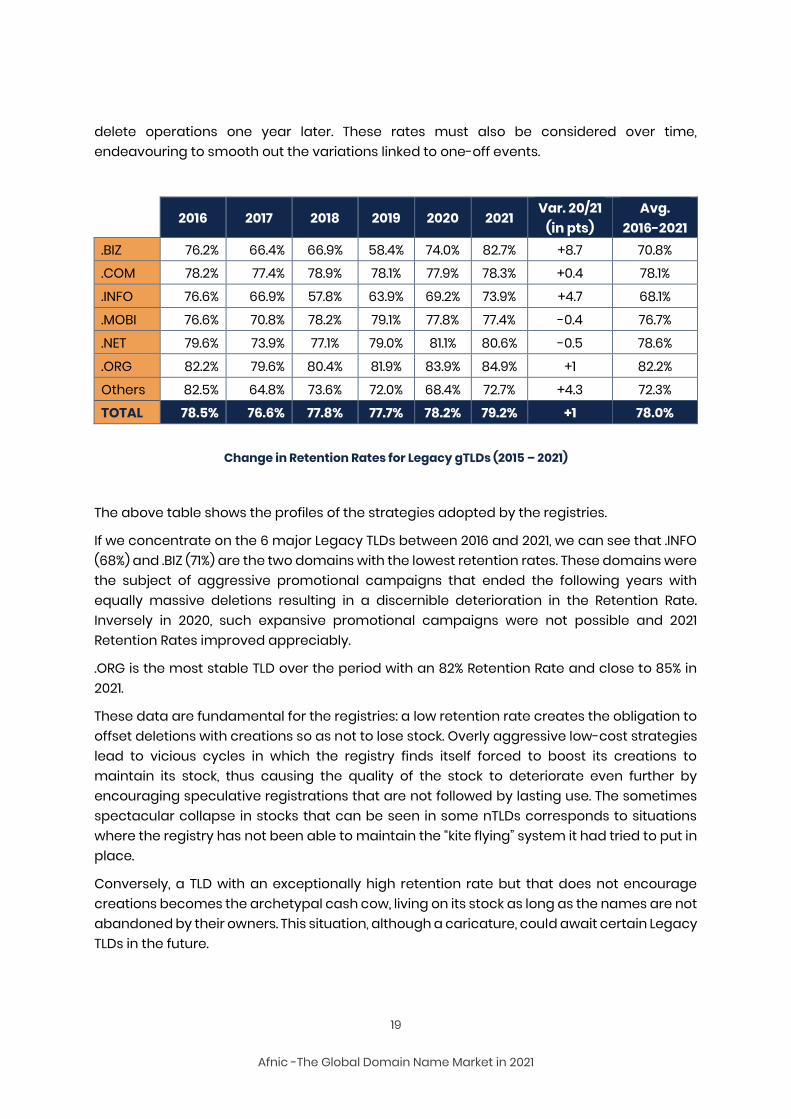
delete operations one year later. These rates must also be considered over time, endeavouring to smooth out the variations linked to one-off events.
2016 2017 2018 2019 2020 2021 Var. 20/21
(in pts) Avg.
2016-2021 .BIZ 76.2% 66.4% 66.9% 58.4% 74.0% 82.7% +8.7 70.8% .COM 78.2% 77.4% 78.9% 78.1% 77.9% 78.3% +0.4 78.1%
.INFO 76.6% 66.9% 57.8% 63.9% 69.2% 73.9% +4.7 68.1%
.MOBI 76.6% 70.8% 78.2% 79.1% 77.8% 77.4% -0.4 76.7%
.NET 79.6% 73.9% 77.1% 79.0% 81.1% 80.6% -0.5 78.6%
.ORG 82.2% 79.6% 80.4% 81.9% 83.9% 84.9% +1 82.2%
Others 82.5% 64.8% 73.6% 72.0% 68.4% 72.7% +4.3 72.3% TOTAL 78.5% 76.6% 77.8% 77.7% 78.2% 79.2% +1 78.0%
Change in Retention Rates for Legacy gTLDs (2015 – 2021)
The above table shows the profiles of the strategies adopted by the registries.
If we concentrate on the 6 major Legacy TLDs between 2016 and 2021, we can see that .INFO (68%) and .BIZ (71%) are the two domains with the lowest retention rates. These domains were the subject of aggressive promotional campaigns that ended the following years with equally massive deletions resulting in a discernible deterioration in the Retention Rate. Inversely in 2020, such expansive promotional campaigns were not possible and 2021 Retention Rates improved appreciably.
.ORG is the most stable TLD over the period with an 82% Retention Rate and close to 85% in 2021.
These data are fundamental for the registries: a low retention rate creates the obligation to offset deletions with creations so as not to lose stock. Overly aggressive low-cost strategies lead to vicious cycles in which the registry finds itself forced to boost its creations to maintain its stock, thus causing the quality of the stock to deteriorate even further by encouraging speculative registrations that are not followed by lasting use. The sometimes spectacular collapse in stocks that can be seen in some nTLDs corresponds to situations where the registry has not been able to maintain the “kite flying” system it had tried to put in place.
Conversely, a TLD with an exceptionally high retention rate but that does not encourage creations becomes the archetypal cash cow, living on its stock as long as the names are not abandoned by their owners. This situation, although a caricature, could await certain Legacy TLDs in the future.
20
Afnic -The Global Domain Name Market in 2021
4.4. Implications in terms of naming strategies We have already noted that the improvement in retention rates of certain TLDs could be linked to the end of the “purges”, that is to say that the names remaining in the portfolio are intended to be kept in increasing proportions.
There are four main reasons for keeping a domain name:
1. (a) because it is used and therefore important for its holder; 2. (b) because the holder wants to keep the name even if they are not using it at present
(ongoing project, conviction that the name will gain value, etc.); 3. (c) because it corresponds to a brand that the holder wants to protect (defensive
domain registration) 4. (d) because the holders are lacklustre in the management of their domain names
and renew the names without questioning the merits of the operation.
Of these reasons, (a) and (b) are the strongest as they are related to uses or to a perception of value. (c) and (d) are the weakest and very sensitive to price changes and to the appearance of new TLDs that may need to be registered. This leads to disposals in a context where budgets are not infinitely expandable. The sums spent on defensive registrations in Legacy TLDs are allocated to other defensive registrations in the nTLDs, and the holders who have managed their portfolios in a poorly optimised manner are forced to adopt optimisation strategies. It seems indeed necessary, to reduce costs, to limit creations in relatively unattractive and/or low-risk domains since they are less and less well known to users.
It is more than likely that the Legacy TLDs (except .COM) suffer from these disposal strategies that dry up their create operations and force them either to practice aggressive promotional campaigns to temporarily maintain their stocks, or to assume a certain decline while looking for ways to retain their current holders.
The good health of the .COM domain in terms of create operations (+6% in 2018, +7% in 2019, +4% in 2020, +6 in 2021) is likely due to a refocusing of users in 2020 and 2021 on the TLDs they know best. New entrants forced to register names to develop their online presence are effectively less mature than their predecessors and are even less knowledgeable of domain names. They choose what they know, that is to say primarily their national ccTLDs (except for Americans) and .COM.
These different phenomena (the refocusing of create operations, the disposals of retained names, a relative loss of interest in defensive registrations and speculative operations) largely explain the decline of the "Other Legacy TLDs", the difficulties of many nTLDs in finding their market, and the relative good health of .COM and the main ccTLDs. The slowdown in domaining and the acceleration of the digital transition, which have contrary effects on creations, are two new factors that have been grafted on to the pre-2020 context.
21
Afnic -The Global Domain Name Market in 2021
The end of the “crisis” in 2021 led to a return to pre-COVID levels in the second half of the year, without any gain in terms of the acceleration of the digital transition. We shall now examine whether the same is true of ccTLDs.
22
Afnic -The Global Domain Name Market in 2021
5. ccTLDs (country-code Top-Level Domains) Taken as a whole, ccTLDs lost 3.8% in stock in 2021 compared to -0.9% in 2020. But the overall figure does not reflect the reality experienced by most ccTLD registries in 2021, which was that of sustained activity although less intense than in 2020.
5.1. ccTLD creations during the post-COVID phase
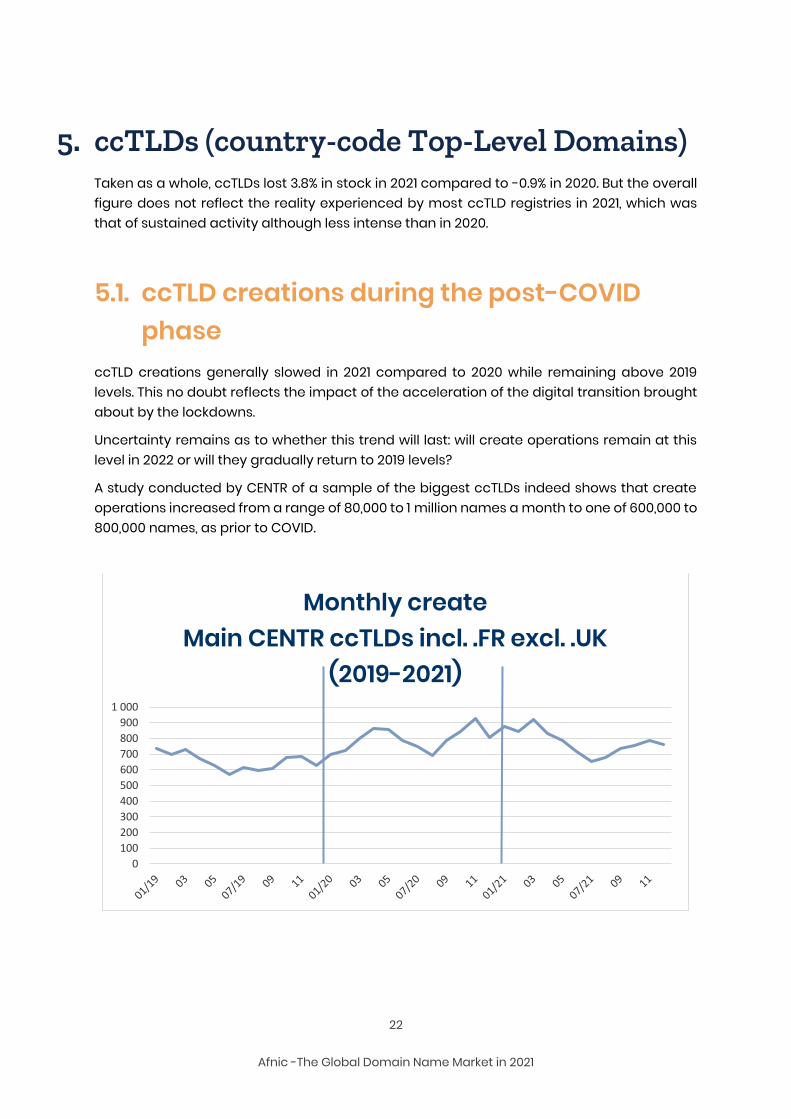
ccTLD creations generally slowed in 2021 compared to 2020 while remaining above 2019 levels. This no doubt reflects the impact of the acceleration of the digital transition brought about by the lockdowns.
Uncertainty remains as to whether this trend will last: will create operations remain at this level in 2022 or will they gradually return to 2019 levels?
A study conducted by CENTR of a sample of the biggest ccTLDs indeed shows that create operations increased from a range of 80,000 to 1 million names a month to one of 600,000 to 800,000 names, as prior to COVID.
0
100
200
300
400
500
600
700
800
900
1 000
Monthly create Main CENTR ccTLDs incl. .FR excl. .UK
(2019-2021)
23
Afnic -The Global Domain Name Market in 2021
If we look more closely at the data, we can see that the “stall” began in Q2 2021 compared to 2020 performances. The situation stabilised and improved in the second half of the year, but the state of uncertainty remains.
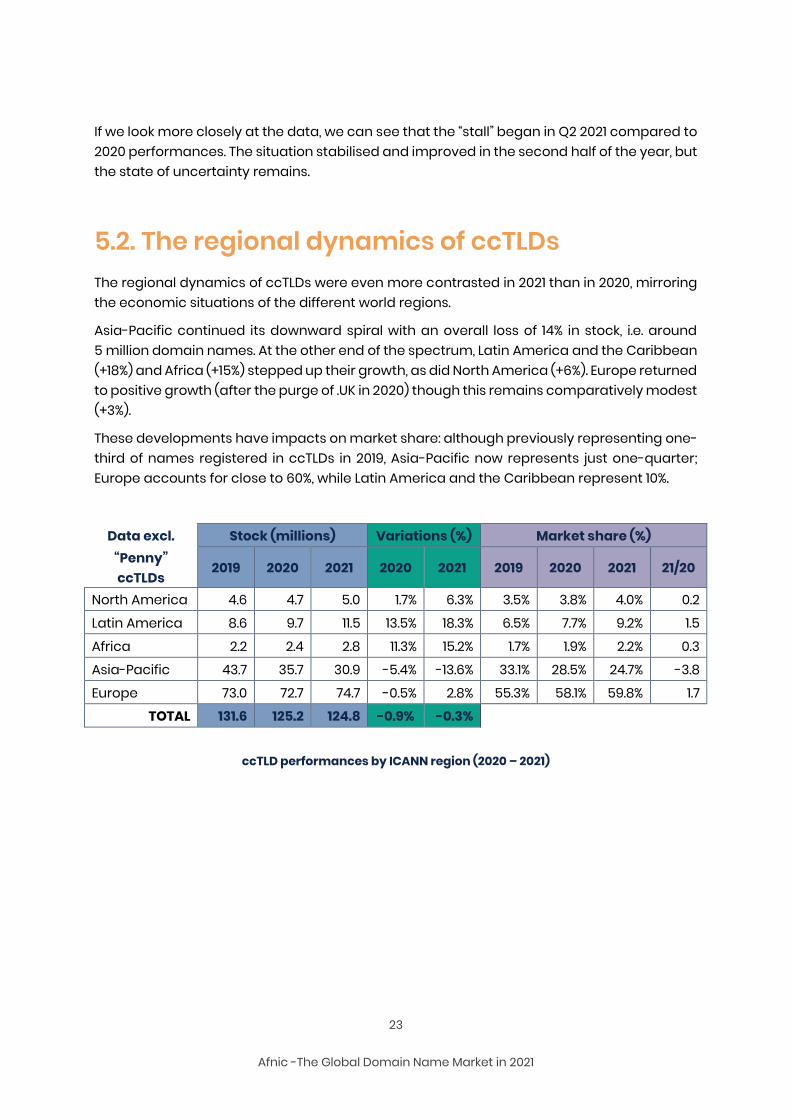
5.2. The regional dynamics of ccTLDs The regional dynamics of ccTLDs were even more contrasted in 2021 than in 2020, mirroring the economic situations of the different world regions.
Asia-Pacific continued its downward spiral with an overall loss of 14% in stock, i.e. around 5 million domain names. At the other end of the spectrum, Latin America and the Caribbean (+18%) and Africa (+15%) stepped up their growth, as did North America (+6%). Europe returned to positive growth (after the purge of .UK in 2020) though this remains comparatively modest (+3%).
These developments have impacts on market share: although previously representing one-third of names registered in ccTLDs in 2019, Asia-Pacific now represents just one-quarter; Europe accounts for close to 60%, while Latin America and the Caribbean represent 10%.
Data excl. Stock (millions) Variations (%) Market share (%) “Penny” ccTLDs
2019 2020 2021 2020 2021 2019 2020 2021 21/20
North America 4.6 4.7 5.0 1.7% 6.3% 3.5% 3.8% 4.0% 0.2
Latin America 8.6 9.7 11.5 13.5% 18.3% 6.5% 7.7% 9.2% 1.5
Africa 2.2 2.4 2.8 11.3% 15.2% 1.7% 1.9% 2.2% 0.3
Asia-Pacific 43.7 35.7 30.9 -5.4% -13.6% 33.1% 28.5% 24.7% -3.8
Europe 73.0 72.7 74.7 -0.5% 2.8% 55.3% 58.1% 59.8% 1.7 TOTAL 131.6 125.2 124.8 -0.9% -0.3%
ccTLD performances by ICANN region (2020 – 2021)
24
Afnic -The Global Domain Name Market in 2021
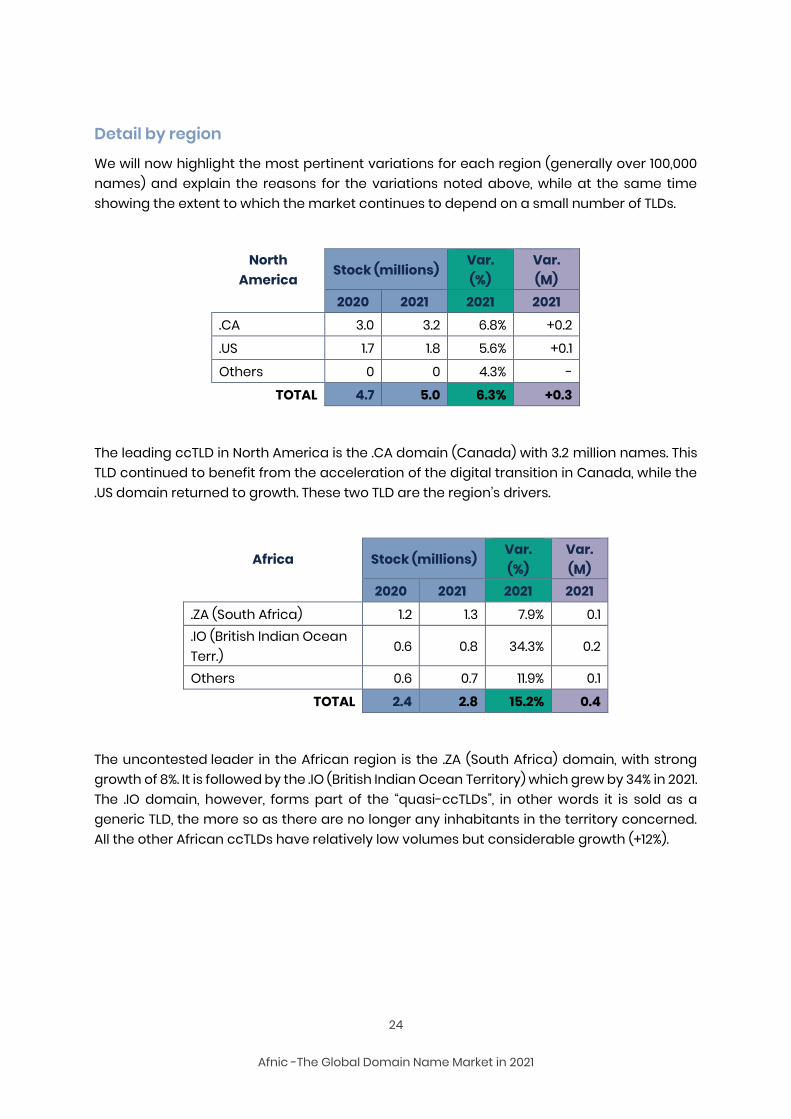
Detail by region
We will now highlight the most pertinent variations for each region (generally over 100,000 names) and explain the reasons for the variations noted above, while at the same time showing the extent to which the market continues to depend on a small number of TLDs.
North America
Stock (millions) Var. (%)
Var. (M)
2020 2021 2021 2021 .CA 3.0 3.2 6.8% +0.2
.US 1.7 1.8 5.6% +0.1
Others 0 0 4.3% -
TOTAL 4.7 5.0 6.3% +0.3
The leading ccTLD in North America is the .CA domain (Canada) with 3.2 million names. This TLD continued to benefit from the acceleration of the digital transition in Canada, while the .US domain returned to growth. These two TLD are the region’s drivers.
Africa Stock (millions) Var. (%)
Var. (M)
2020 2021 2021 2021
.ZA (South Africa) 1.2 1.3 7.9% 0.1
.IO (British Indian Ocean Terr.)
0.6 0.8 34.3% 0.2
Others 0.6 0.7 11.9% 0.1
TOTAL 2.4 2.8 15.2% 0.4
The uncontested leader in the African region is the .ZA (South Africa) domain, with strong growth of 8%. It is followed by the .IO (British Indian Ocean Territory) which grew by 34% in 2021. The .IO domain, however, forms part of the “quasi-ccTLDs”, in other words it is sold as a generic TLD, the more so as there are no longer any inhabitants in the territory concerned. All the other African ccTLDs have relatively low volumes but considerable growth (+12%).
25
Afnic -The Global Domain Name Market in 2021
Latin America Stock (millions) Var. (%)
Var. (M)
& Caribbean 2020 2021 2021 2021 .BR (Brazil) 3.8 4.8 26.1% 1.0 .CO (Colombia)
2.9 3.2 11.2% 0.3
.MX (Mexico) 1.4 1.3 -5.0% -0.1
Others 1.6 2.1 32.0% 0.5
TOTAL 9.7 11.5 18.3% 1.8
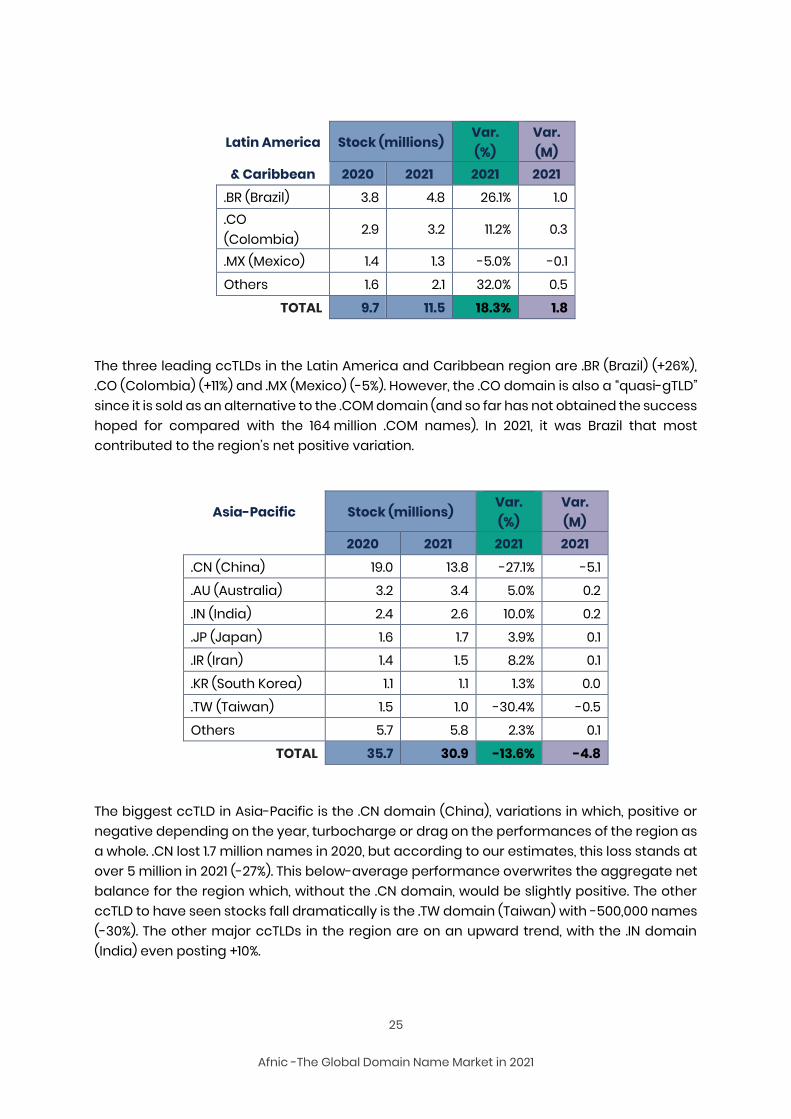
The three leading ccTLDs in the Latin America and Caribbean region are .BR (Brazil) (+26%), .CO (Colombia) (+11%) and .MX (Mexico) (-5%). However, the .CO domain is also a “quasi-gTLD” since it is sold as an alternative to the .COM domain (and so far has not obtained the success hoped for compared with the 164 million .COM names). In 2021, it was Brazil that most contributed to the region’s net positive variation.
Asia-Pacific Stock (millions) Var. (%)
Var. (M)
2020 2021 2021 2021
.CN (China) 19.0 13.8 -27.1% -5.1
.AU (Australia) 3.2 3.4 5.0% 0.2
.IN (India) 2.4 2.6 10.0% 0.2
.JP (Japan) 1.6 1.7 3.9% 0.1
.IR (Iran) 1.4 1.5 8.2% 0.1
.KR (South Korea) 1.1 1.1 1.3% 0.0
.TW (Taiwan) 1.5 1.0 -30.4% -0.5
Others 5.7 5.8 2.3% 0.1
TOTAL 35.7 30.9 -13.6% -4.8
The biggest ccTLD in Asia-Pacific is the .CN domain (China), variations in which, positive or negative depending on the year, turbocharge or drag on the performances of the region as a whole. .CN lost 1.7 million names in 2020, but according to our estimates, this loss stands at over 5 million in 2021 (-27%). This below-average performance overwrites the aggregate net balance for the region which, without the .CN domain, would be slightly positive. The other ccTLD to have seen stocks fall dramatically is the .TW domain (Taiwan) with -500,000 names (-30%). The other major ccTLDs in the region are on an upward trend, with the .IN domain (India) even posting +10%.
26
Afnic -The Global Domain Name Market in 2021
Europe Stock (millions) Var. (%)
Var. (M)
TLD > 2M DNs 2020 2021 2021 2021 .DE (Germany) 16.7 17.2 2.8% 0.5 .UK (United Kingdom)
10.9 11.1 2.1% 0.2
.NL (Netherlands)
6.1 6.2 2.0% 0.1
.RU (Russia) 5.0 5.0 1.1% 0.0
.FR (France) 3.7 3.9 5.8% 0.2
.EU (European Union)
3.7 3.7 0.9% 0.0
.IT (Italy) 3.4 3.5 2.2% 0.1
.PL (Poland) 2.5 2.6 2.2% 0.1
.CH (Switzerland)
2.4 2.5 4.1% 0.1
Others 18.5 19.2 3.7% 0.7
TOTAL 72.7 74.7 2.8% 2.0
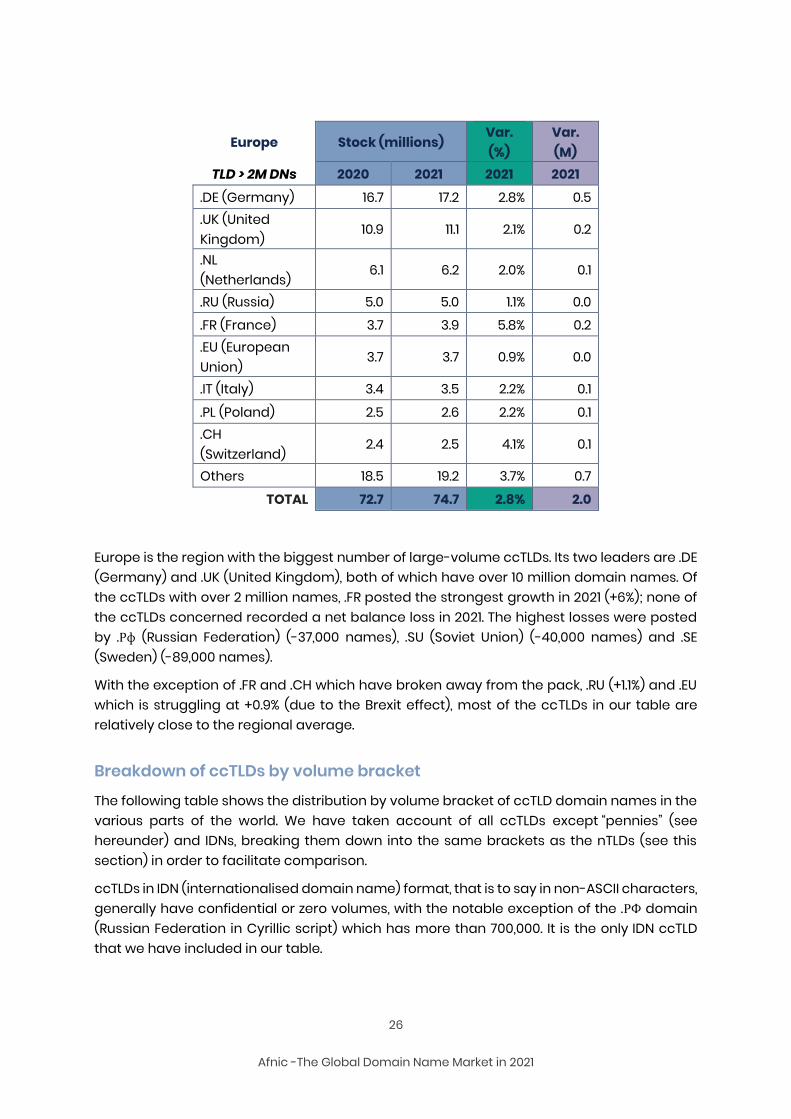
Europe is the region with the biggest number of large-volume ccTLDs. Its two leaders are .DE (Germany) and .UK (United Kingdom), both of which have over 10 million domain names. Of the ccTLDs with over 2 million names, .FR posted the strongest growth in 2021 (+6%); none of the ccTLDs concerned recorded a net balance loss in 2021. The highest losses were posted by .Рф (Russian Federation) (-37,000 names), .SU (Soviet Union) (-40,000 names) and .SE (Sweden) (-89,000 names).
With the exception of .FR and .CH which have broken away from the pack, .RU (+1.1%) and .EU which is struggling at +0.9% (due to the Brexit effect), most of the ccTLDs in our table are relatively close to the regional average.
Breakdown of ccTLDs by volume bracket
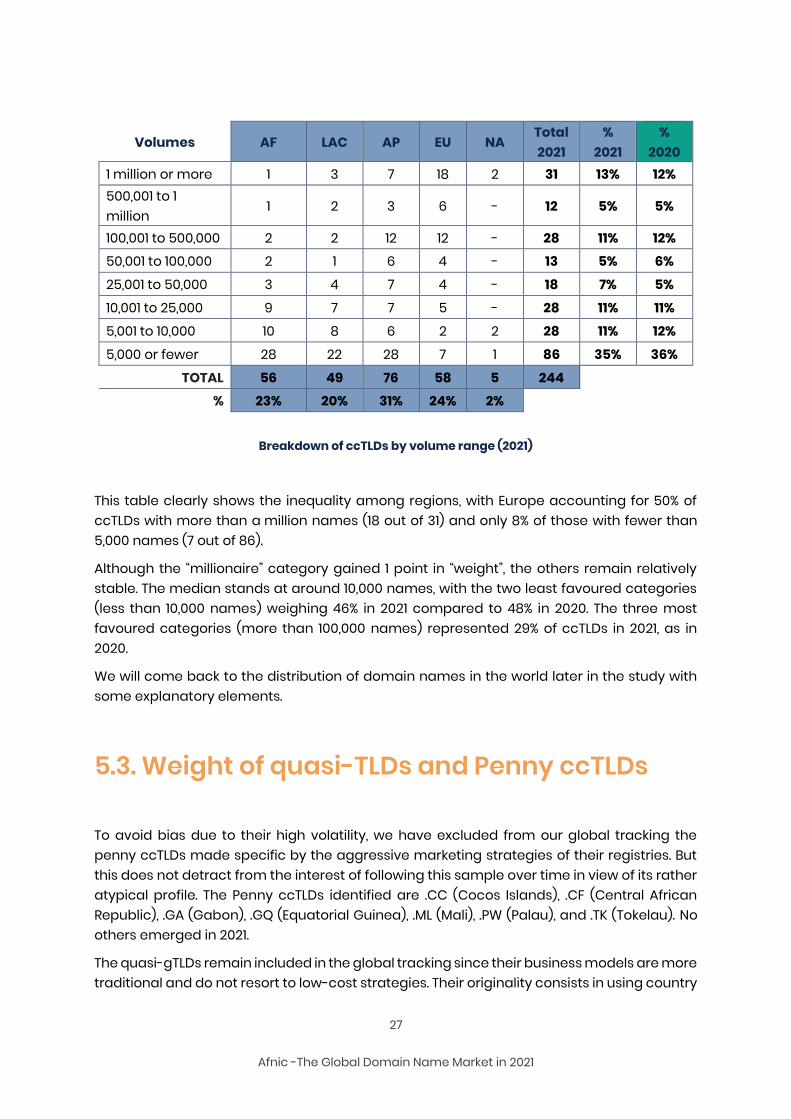
The following table shows the distribution by volume bracket of ccTLD domain names in the various parts of the world. We have taken account of all ccTLDs except “pennies” (see hereunder) and IDNs, breaking them down into the same brackets as the nTLDs (see this section) in order to facilitate comparison.
ccTLDs in IDN (internationalised domain name) format, that is to say in non-ASCII characters, generally have confidential or zero volumes, with the notable exception of the .РФ domain (Russian Federation in Cyrillic script) which has more than 700,000. It is the only IDN ccTLD that we have included in our table.
27
Afnic -The Global Domain Name Market in 2021
Volumes AF LAC AP EU NA Total 2021
% 2021
% 2020
1 million or more 1 3 7 18 2 31 13% 12% 500,001 to 1 million
1 2 3 6 - 12 5% 5%
100,001 to 500,000 2 2 12 12 - 28 11% 12% 50,001 to 100,000 2 1 6 4 - 13 5% 6%
25,001 to 50,000 3 4 7 4 - 18 7% 5%
10,001 to 25,000 9 7 7 5 - 28 11% 11%
5,001 to 10,000 10 8 6 2 2 28 11% 12%
5,000 or fewer 28 22 28 7 1 86 35% 36%
TOTAL 56 49 76 58 5 244 % 23% 20% 31% 24% 2%
Breakdown of ccTLDs by volume range (2021)
This table clearly shows the inequality among regions, with Europe accounting for 50% of ccTLDs with more than a million names (18 out of 31) and only 8% of those with fewer than 5,000 names (7 out of 86).
Although the “millionaire” category gained 1 point in “weight”, the others remain relatively stable. The median stands at around 10,000 names, with the two least favoured categories (less than 10,000 names) weighing 46% in 2021 compared to 48% in 2020. The three most favoured categories (more than 100,000 names) represented 29% of ccTLDs in 2021, as in 2020.
We will come back to the distribution of domain names in the world later in the study with some explanatory elements.
5.3. Weight of quasi-TLDs and Penny ccTLDs
To avoid bias due to their high volatility, we have excluded from our global tracking the penny ccTLDs made specific by the aggressive marketing strategies of their registries. But this does not detract from the interest of following this sample over time in view of its rather atypical profile. The Penny ccTLDs identified are .CC (Cocos Islands), .CF (Central African Republic), .GA (Gabon), .GQ (Equatorial Guinea), .ML (Mali), .PW (Palau), and .TK (Tokelau). No others emerged in 2021.
The quasi-gTLDs remain included in the global tracking since their business models are more traditional and do not resort to low-cost strategies. Their originality consists in using country
28
Afnic -The Global Domain Name Market in 2021
codes for generic purposes. In this study we consider the following domains as quasi-gTLDs: .TV (Tuvalu - “Television”), .ME (Montenegro - “Me / Myself”), .CO (Colombia– “Commercial”), .NU (Niue Island– “New” in Swedish), .IO (British Indian Ocean Territory), and .LA (Laos - “Los Angeles”). We have added .VC (Saint Vincent and the Grenadines - “Venture Capitalist”).
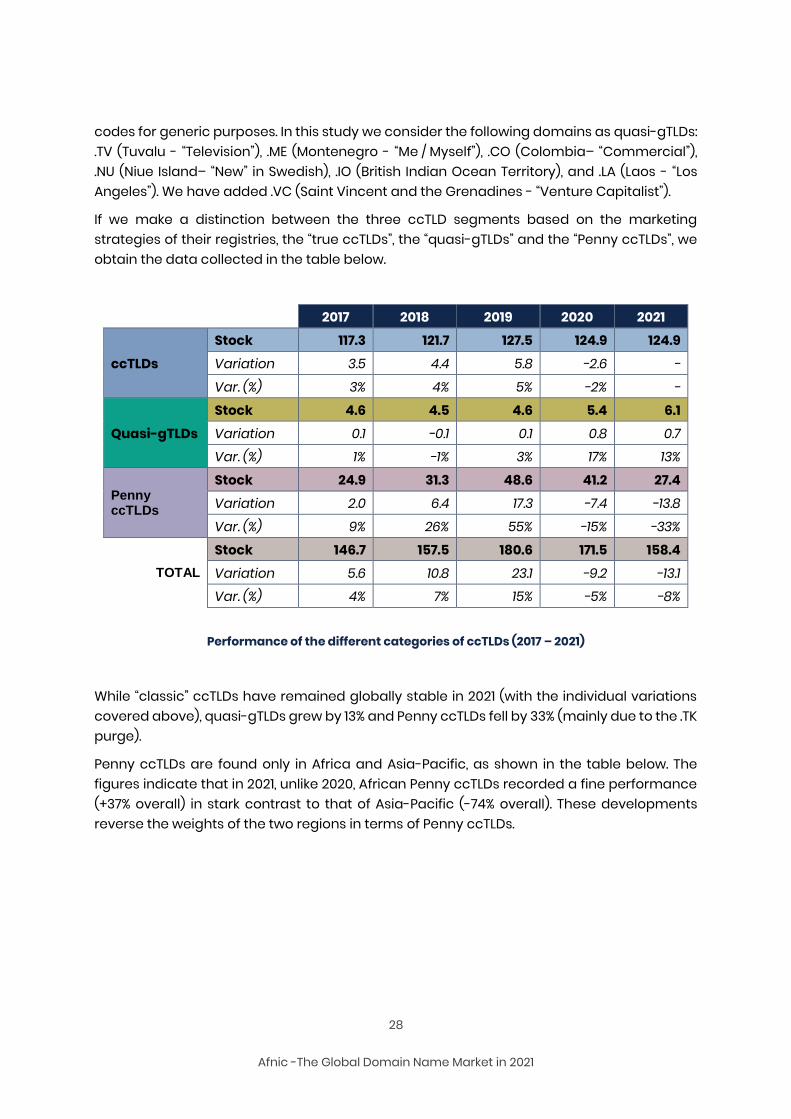
If we make a distinction between the three ccTLD segments based on the marketing strategies of their registries, the “true ccTLDs”, the “quasi-gTLDs” and the “Penny ccTLDs”, we obtain the data collected in the table below.
2017 2018 2019 2020 2021
ccTLDs
Stock 117.3 121.7 127.5 124.9 124.9
Variation 3.5 4.4 5.8 -2.6 -
Var. (%) 3% 4% 5% -2% -
Quasi-gTLDs
Stock 4.6 4.5 4.6 5.4 6.1
Variation 0.1 -0.1 0.1 0.8 0.7 Var. (%) 1% -1% 3% 17% 13%
Penny ccTLDs
Stock 24.9 31.3 48.6 41.2 27.4
Variation 2.0 6.4 17.3 -7.4 -13.8
Var. (%) 9% 26% 55% -15% -33%
TOTAL
Stock 146.7 157.5 180.6 171.5 158.4
Variation 5.6 10.8 23.1 -9.2 -13.1 Var. (%) 4% 7% 15% -5% -8%
Performance of the different categories of ccTLDs (2017 – 2021)
While “classic” ccTLDs have remained globally stable in 2021 (with the individual variations covered above), quasi-gTLDs grew by 13% and Penny ccTLDs fell by 33% (mainly due to the .TK purge).
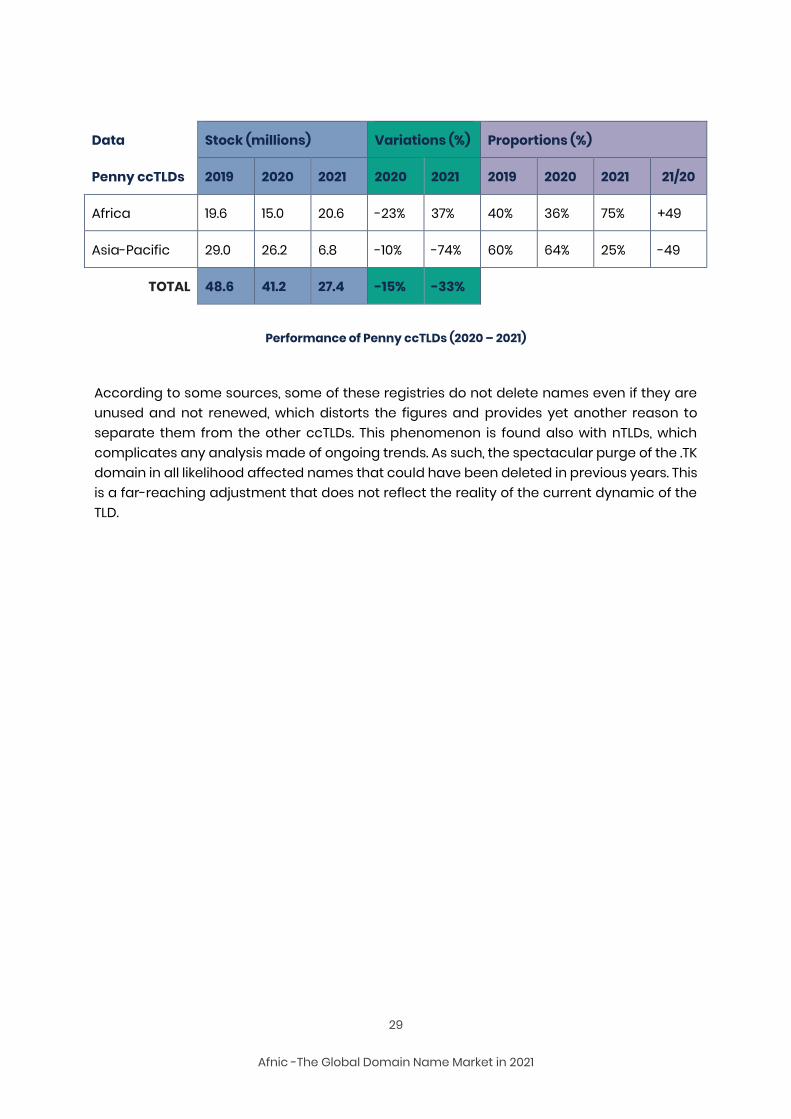
Penny ccTLDs are found only in Africa and Asia-Pacific, as shown in the table below. The figures indicate that in 2021, unlike 2020, African Penny ccTLDs recorded a fine performance (+37% overall) in stark contrast to that of Asia-Pacific (-74% overall). These developments reverse the weights of the two regions in terms of Penny ccTLDs.
29
Afnic -The Global Domain Name Market in 2021
Data Stock (millions) Variations (%) Proportions (%)
Penny ccTLDs 2019 2020 2021 2020 2021 2019 2020 2021 21/20
Africa 19.6 15.0 20.6 -23% 37% 40% 36% 75% +49
Asia-Pacific 29.0 26.2 6.8 -10% -74% 60% 64% 25% -49
TOTAL 48.6 41.2 27.4 -15% -33% - - - -
Performance of Penny ccTLDs (2020 – 2021)
According to some sources, some of these registries do not delete names even if they are unused and not renewed, which distorts the figures and provides yet another reason to separate them from the other ccTLDs. This phenomenon is found also with nTLDs, which complicates any analysis made of ongoing trends. As such, the spectacular purge of the .TK domain in all likelihood affected names that could have been deleted in previous years. This is a far-reaching adjustment that does not reflect the reality of the current dynamic of the TLD.
30
Afnic -The Global Domain Name Market in 2021
6. nTLDs It should be recalled that in many cases the only thing new TLDs have in common is the fact that they are “new”… post-2012. This is not enough to classify them, since this characteristic is disappearing as time goes by (and will disappear definitively at the time of the next ICANN round).
All too often, observers refer to the success or failure of new TLDs without taking time to group them into segments that make sense and allow for a more nuanced approach, criteria for assessing performances being quite different from one segment to another.
That is why, having presented the overall trends in nTLDs, we will study each of these segments in detail in order to gain a better understanding of their dynamics.
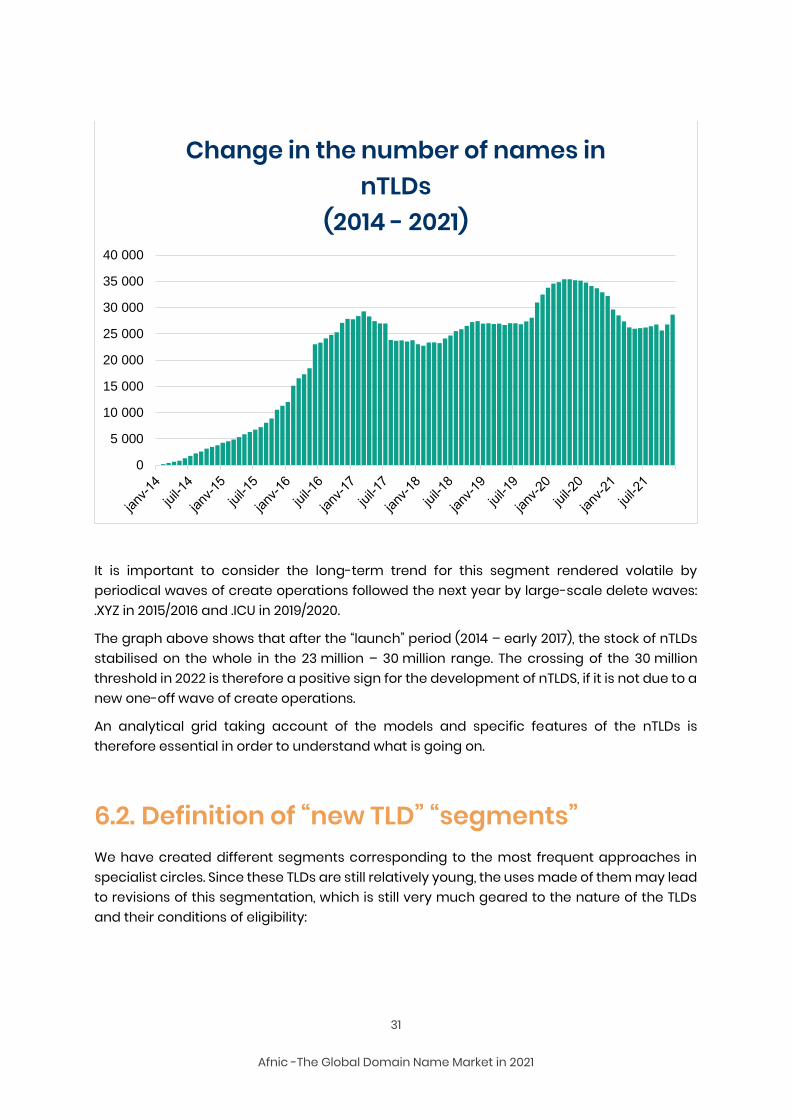
6.1. Global change in the stock of “new TLDs” The historic peak in nTLDs reached in March 2017 at around 30 million names, following a period of uninterrupted growth since January 2014, was exceeded in November 2019.
This upward movement was interrupted in 2020 following a high of 35 million names in April/May. The decline accelerated from October with the start of the purge of the .ICU domain. At the end of 2020, the number of nTLDs was essentially unchanged from the beginning of the year. It also corresponded to the long-term trend that started in 2014/2015 and was resumed in October 2019 after the dislocations that followed the waves of mass filings in 2016 and early 2017.
2021 was marked by a continued decline in the first half of the year, with a stabilisation over the summer and a rebound in growth as of the autumn.
31
Afnic -The Global Domain Name Market in 2021
It is important to consider the long-term trend for this segment rendered volatile by periodical waves of create operations followed the next year by large-scale delete waves: .XYZ in 2015/2016 and .ICU in 2019/2020.
The graph above shows that after the “launch” period (2014 – early 2017), the stock of nTLDs stabilised on the whole in the 23 million – 30 million range. The crossing of the 30 million threshold in 2022 is therefore a positive sign for the development of nTLDS, if it is not due to a new one-off wave of create operations.
An analytical grid taking account of the models and specific features of the nTLDs is therefore essential in order to understand what is going on.
6.2. Definition of “new TLD” “segments” We have created different segments corresponding to the most frequent approaches in specialist circles. Since these TLDs are still relatively young, the uses made of them may lead to revisions of this segmentation, which is still very much geared to the nature of the TLDs and their conditions of eligibility:
0
5 000
10 000
15 000
20 000
25 000
30 000
35 000
40 000
Change in the number of names in nTLDs
(2014 - 2021)
32
Afnic -The Global Domain Name Market in 2021
Community: domain name filings reserved to members of a community, use being community-centric.
Geographic: nTLDs of a geographical character designating a city or region.
Generic: nTLDs consisting of generic terms.
Brands: TLDs corresponding in general to flagship brands, registered by private entities for internal use or extended to their customers and partners.
“Open” brands: TLDs corresponding to brands, registered by businesses owning these brands and open to holders other than the business, its subsidiaries or partners. These TLDs are few in number (two after revision of the list in 2021: .CPA and .OVH) but the volumes registered make this a fully fledged segment, comparable with that of generic TLDs.
Our nTLD segmentation attempts to reflect the purpose of TLDs rather than their ICANN status, since these are difficult to classify and have sometimes been adopted for tactical reasons (such as to obtain the privileges granted to Community nTLDs). There is currently no “official” nTLD nomenclature, so our segmentation is subject to change based on information made public by the registries or ICANN.
An additional complicating factor is the degree of restriction required by each registry. Access to a .BRAND domain can be relatively “open” (if the only condition to be met is, for example, being a client of the delegatee) while the registration of a Generic TLD may also be subject to conditions. https://ntldstats.com, which proposes a nomenclature, relies on a framework that ranges from “Unrestricted” through “Semi-restricted” and “Brand” to “Restricted”. However, while this approach may explain the volumes (or their absence) by reference to eligibility conditions, it tells us nothing about the purpose and the marketing positioning of nTLDs.
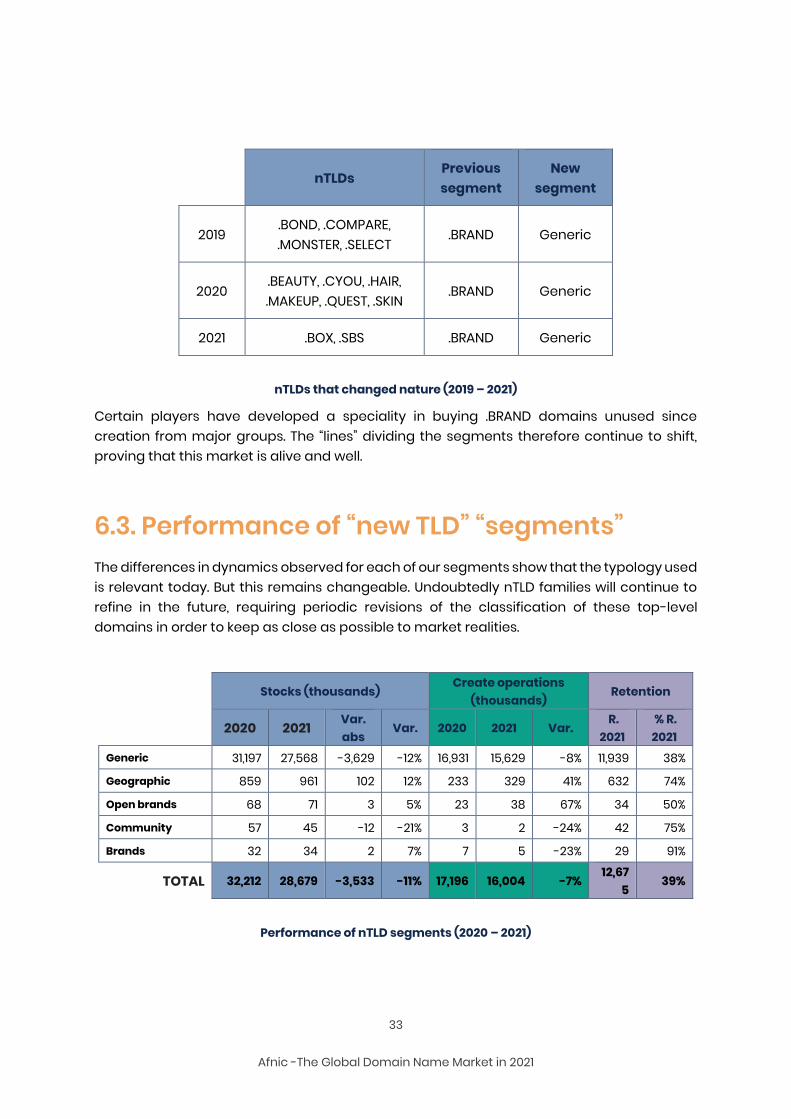
The .Brands converted in 2019 – 2021.
Moreover, since 2019, some nTLDS that were originally .BRANDs were altered in nature to become generic TLDs. Below is the list of those we have had to reclassify, subject to modifications if new information comes to our attention:
33
Afnic -The Global Domain Name Market in 2021
nTLDs Previous segment
New segment
2019 .BOND, .COMPARE, .MONSTER, .SELECT
.BRAND Generic
2020 .BEAUTY, .CYOU, .HAIR, .MAKEUP, .QUEST, .SKIN
.BRAND Generic
2021 .BOX, .SBS .BRAND Generic
nTLDs that changed nature (2019 – 2021)
Certain players have developed a speciality in buying .BRAND domains unused since creation from major groups. The “lines” dividing the segments therefore continue to shift, proving that this market is alive and well.
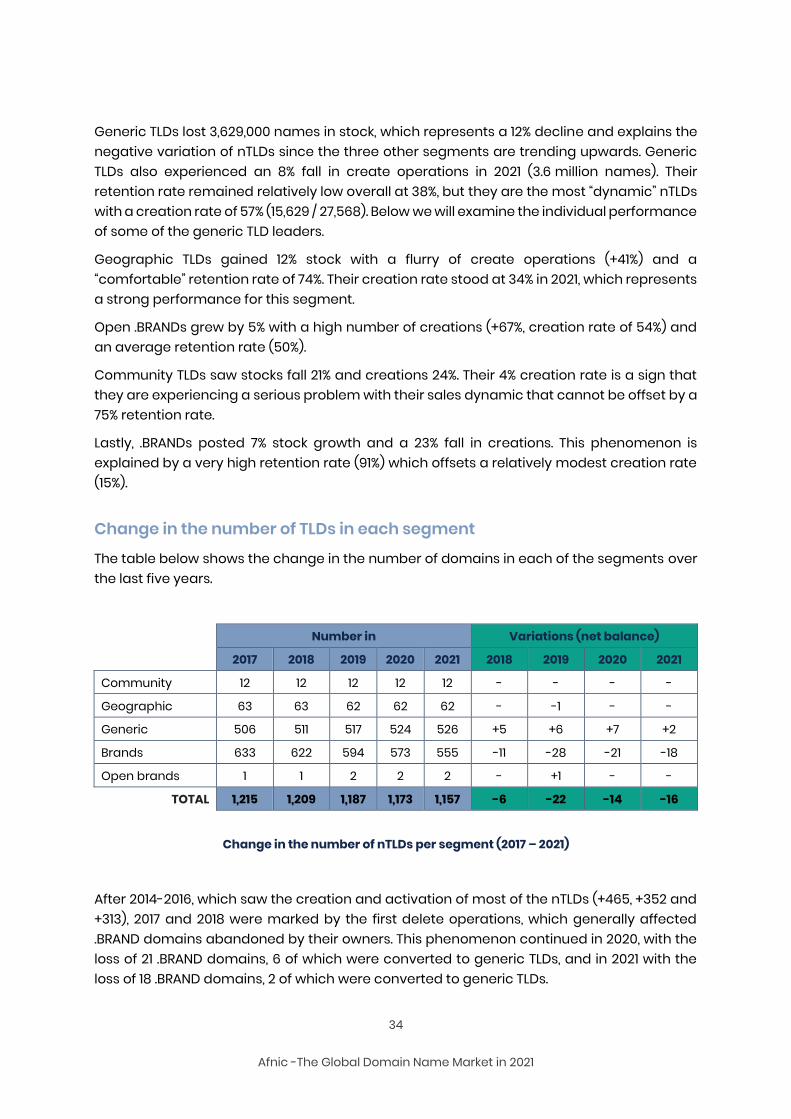
6.3. Performance of “new TLD” “segments” The differences in dynamics observed for each of our segments show that the typology used is relevant today. But this remains changeable. Undoubtedly nTLD families will continue to refine in the future, requiring periodic revisions of the classification of these top-level domains in order to keep as close as possible to market realities.
Stocks (thousands) Create operations
(thousands) Retention
2020 2021 Var. abs
Var. 2020 2021 Var. R.
2021 % R. 2021
Generic 31,197 27,568 -3,629 -12% 16,931 15,629 -8% 11,939 38%
Geographic 859 961 102 12% 233 329 41% 632 74%
Open brands 68 71 3 5% 23 38 67% 34 50%
Community 57 45 -12 -21% 3 2 -24% 42 75%
Brands 32 34 2 7% 7 5 -23% 29 91%
TOTAL 32,212 28,679 -3,533 -11% 17,196 16,004 -7% 12,67
5 39%
Performance of nTLD segments (2020 – 2021)
34
Afnic -The Global Domain Name Market in 2021
Generic TLDs lost 3,629,000 names in stock, which represents a 12% decline and explains the negative variation of nTLDs since the three other segments are trending upwards. Generic TLDs also experienced an 8% fall in create operations in 2021 (3.6 million names). Their retention rate remained relatively low overall at 38%, but they are the most “dynamic” nTLDs with a creation rate of 57% (15,629 / 27,568). Below we will examine the individual performance of some of the generic TLD leaders.
Geographic TLDs gained 12% stock with a flurry of create operations (+41%) and a “comfortable” retention rate of 74%. Their creation rate stood at 34% in 2021, which represents a strong performance for this segment.
Open .BRANDs grew by 5% with a high number of creations (+67%, creation rate of 54%) and an average retention rate (50%).
Community TLDs saw stocks fall 21% and creations 24%. Their 4% creation rate is a sign that they are experiencing a serious problem with their sales dynamic that cannot be offset by a 75% retention rate.
Lastly, .BRANDs posted 7% stock growth and a 23% fall in creations. This phenomenon is explained by a very high retention rate (91%) which offsets a relatively modest creation rate (15%).
Change in the number of TLDs in each segment
The table below shows the change in the number of domains in each of the segments over the last five years.
Number in Variations (net balance)
2017 2018 2019 2020 2021 2018 2019 2020 2021
Community 12 12 12 12 12 - - - -
Geographic 63 63 62 62 62 - -1 - -
Generic 506 511 517 524 526 +5 +6 +7 +2
Brands 633 622 594 573 555 -11 -28 -21 -18
Open brands 1 1 2 2 2 - +1 - -
TOTAL 1,215 1,209 1,187 1,173 1,157 -6 -22 -14 -16
Change in the number of nTLDs per segment (2017 – 2021)
After 2014-2016, which saw the creation and activation of most of the nTLDs (+465, +352 and +313), 2017 and 2018 were marked by the first delete operations, which generally affected .BRAND domains abandoned by their owners. This phenomenon continued in 2020, with the loss of 21 .BRAND domains, 6 of which were converted to generic TLDs, and in 2021 with the loss of 18 .BRAND domains, 2 of which were converted to generic TLDs.
35
Afnic -The Global Domain Name Market in 2021
The deletion of .BRAND domains follows a rationale specific to their registries reorientations in the digital strategies of the groups concerned, changes of flagship brands making the .BRAND domains concerned obsolete, or simply defensive create operations from the outset, which their registries are unwilling to continue to pay for since they are at a loss as to what use to make of them. The notion of “commercial failure” is not relevant to this “private” segment.
The trend in conversions from .BRAND to generic TLDs is likely to continue, for two reasons:
on the one hand, the proportion of .BRAND names still not used is fairly large, which offers prospects of acquisition/reconversion for a certain number, while others will be simply abandoned;
and on the other hand, a significant percentage of generic TLDs have stocks of insufficient volume to ensure the economic viability of their registries, which spurs the latter to practice external growth strategies by buying the nTLDs available for sale.
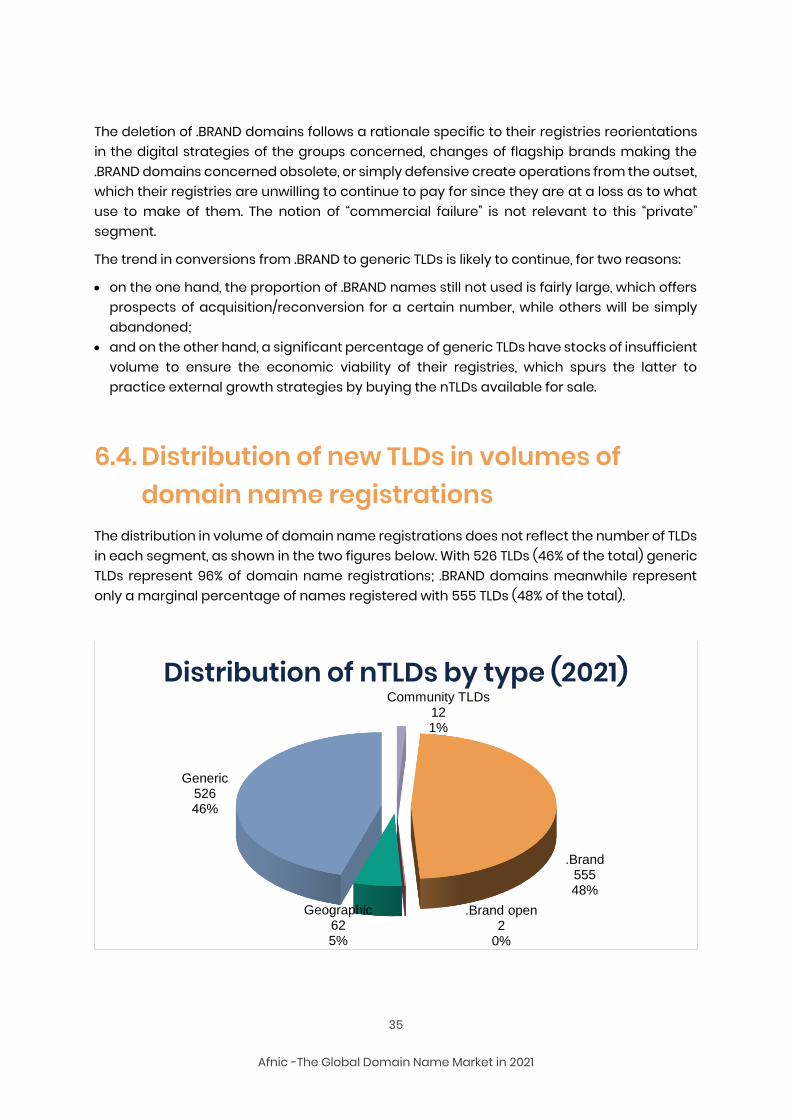
6.4. Distribution of new TLDs in volumes of domain name registrations
The distribution in volume of domain name registrations does not reflect the number of TLDs in each segment, as shown in the two figures below. With 526 TLDs (46% of the total) generic TLDs represent 96% of domain name registrations; .BRAND domains meanwhile represent only a marginal percentage of names registered with 555 TLDs (48% of the total).
Community TLDs121%
.Brand55548%
.Brand open2
0%
Geographic625%
Generic52646%
Distribution of nTLDs by type (2021)
36
Afnic -The Global Domain Name Market in 2021
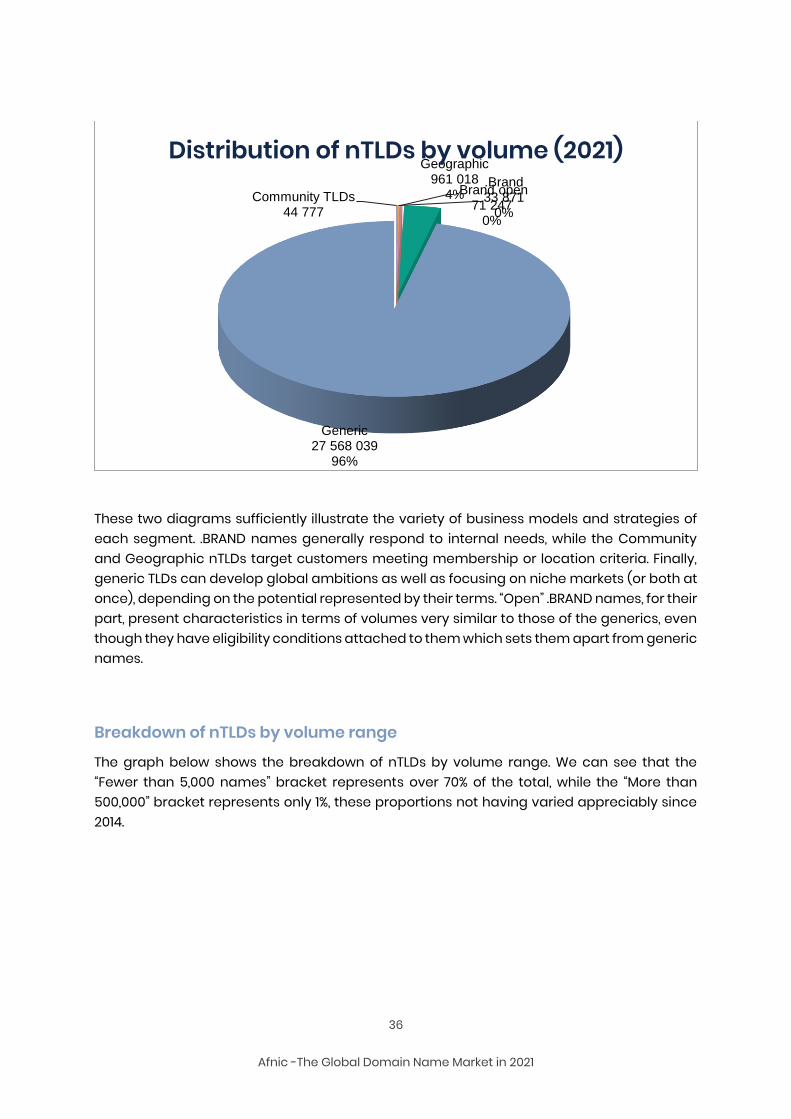
These two diagrams sufficiently illustrate the variety of business models and strategies of each segment. .BRAND names generally respond to internal needs, while the Community and Geographic nTLDs target customers meeting membership or location criteria. Finally, generic TLDs can develop global ambitions as well as focusing on niche markets (or both at once), depending on the potential represented by their terms. “Open” .BRAND names, for their part, present characteristics in terms of volumes very similar to those of the generics, even though they have eligibility conditions attached to them which sets them apart from generic names.
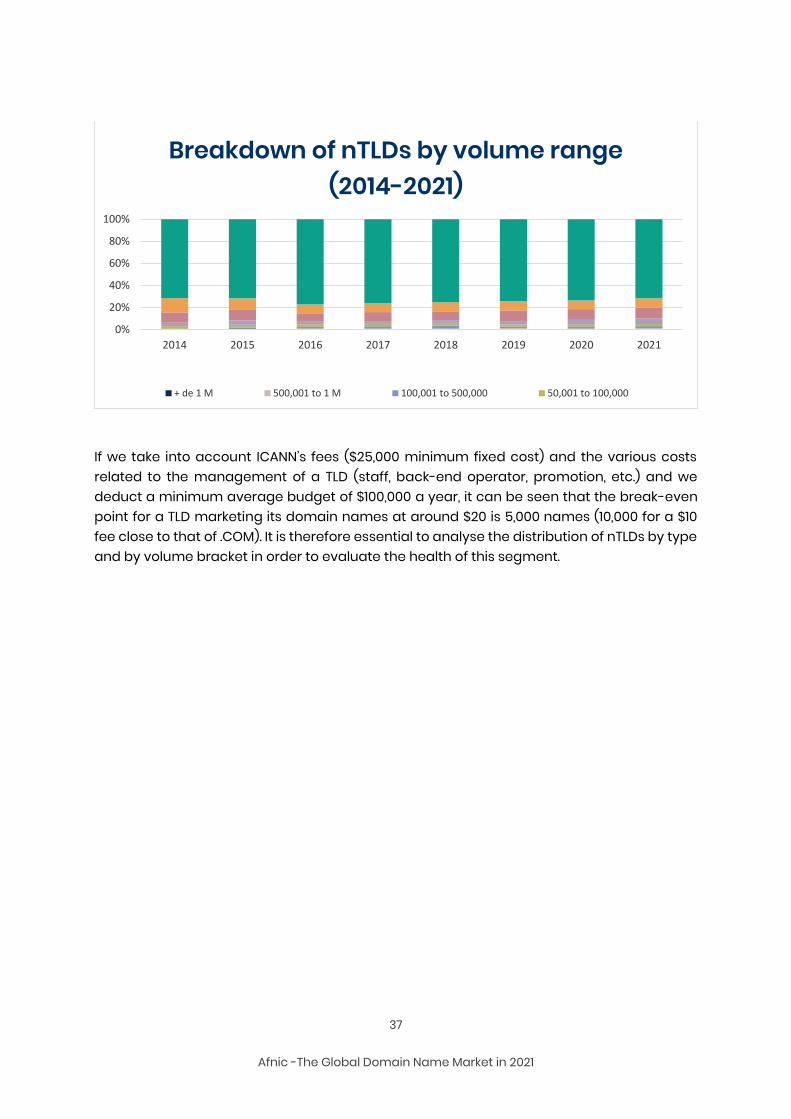
Breakdown of nTLDs by volume range
The graph below shows the breakdown of nTLDs by volume range. We can see that the “Fewer than 5,000 names” bracket represents over 70% of the total, while the “More than 500,000” bracket represents only 1%, these proportions not having varied appreciably since 2014.
Community TLDs44 777
.Brand33 871
0%
.Brand open71 247
0%
Geographic961 018
4%
Generic27 568 039
96%
Distribution of nTLDs by volume (2021)
37
Afnic -The Global Domain Name Market in 2021
If we take into account ICANN’s fees ($25,000 minimum fixed cost) and the various costs related to the management of a TLD (staff, back-end operator, promotion, etc.) and we deduct a minimum average budget of $100,000 a year, it can be seen that the break-even point for a TLD marketing its domain names at around $20 is 5,000 names (10,000 for a $10 fee close to that of .COM). It is therefore essential to analyse the distribution of nTLDs by type and by volume bracket in order to evaluate the health of this segment.
0%
20%
40%
60%
80%
100%
2014 2015 2016 2017 2018 2019 2020 2021
Breakdown of nTLDs by volume range(2014-2021)
+ de 1 M 500,001 to 1 M 100,001 to 500,000 50,001 to 100,000
38
Afnic -The Global Domain Name Market in 2021
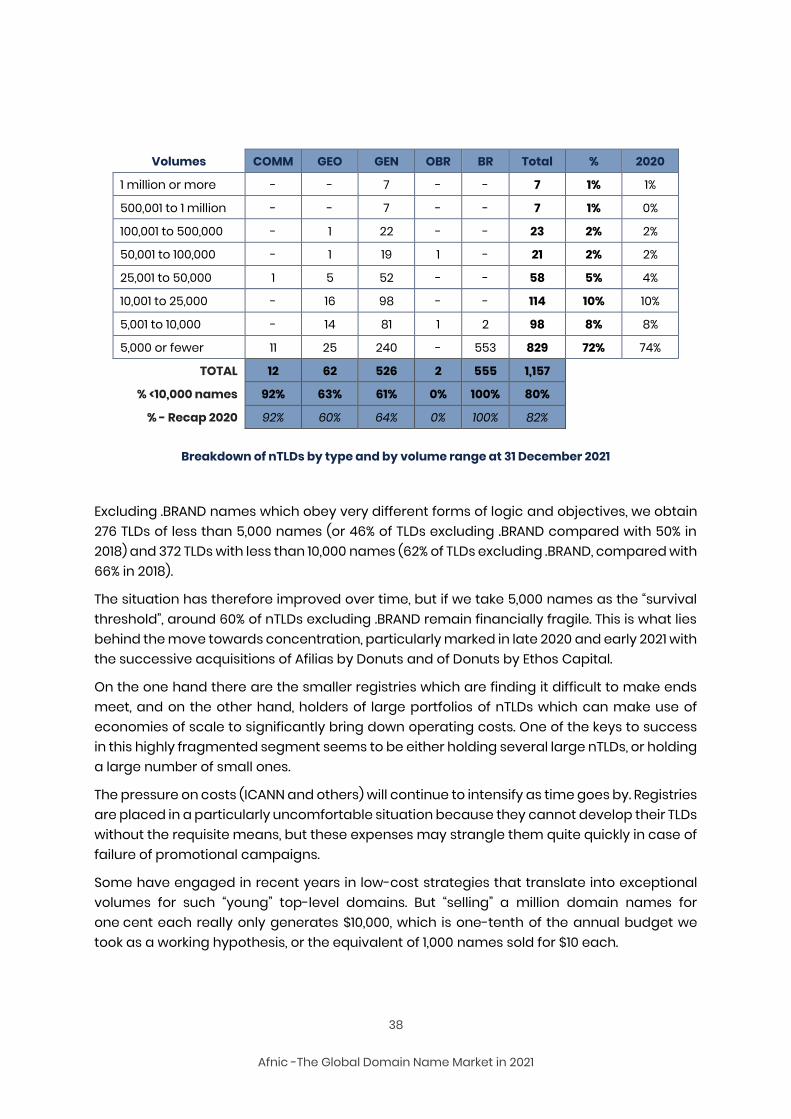
Volumes COMM GEO GEN OBR BR Total % 2020
1 million or more - - 7 - - 7 1% 1%
500,001 to 1 million - - 7 - - 7 1% 0%
100,001 to 500,000 - 1 22 - - 23 2% 2%
50,001 to 100,000 - 1 19 1 - 21 2% 2%
25,001 to 50,000 1 5 52 - - 58 5% 4%
10,001 to 25,000 - 16 98 - - 114 10% 10%
5,001 to 10,000 - 14 81 1 2 98 8% 8%
5,000 or fewer 11 25 240 - 553 829 72% 74%
TOTAL 12 62 526 2 555 1,157
% <10,000 names 92% 63% 61% 0% 100% 80%
% - Recap 2020 92% 60% 64% 0% 100% 82%
Breakdown of nTLDs by type and by volume range at 31 December 2021
Excluding .BRAND names which obey very different forms of logic and objectives, we obtain 276 TLDs of less than 5,000 names (or 46% of TLDs excluding .BRAND compared with 50% in 2018) and 372 TLDs with less than 10,000 names (62% of TLDs excluding .BRAND, compared with 66% in 2018).
The situation has therefore improved over time, but if we take 5,000 names as the “survival threshold”, around 60% of nTLDs excluding .BRAND remain financially fragile. This is what lies behind the move towards concentration, particularly marked in late 2020 and early 2021 with the successive acquisitions of Afilias by Donuts and of Donuts by Ethos Capital.
On the one hand there are the smaller registries which are finding it difficult to make ends meet, and on the other hand, holders of large portfolios of nTLDs which can make use of economies of scale to significantly bring down operating costs. One of the keys to success in this highly fragmented segment seems to be either holding several large nTLDs, or holding a large number of small ones.
The pressure on costs (ICANN and others) will continue to intensify as time goes by. Registries are placed in a particularly uncomfortable situation because they cannot develop their TLDs without the requisite means, but these expenses may strangle them quite quickly in case of failure of promotional campaigns.
Some have engaged in recent years in low-cost strategies that translate into exceptional volumes for such “young” top-level domains. But “selling” a million domain names for one cent each really only generates $10,000, which is one-tenth of the annual budget we took as a working hypothesis, or the equivalent of 1,000 names sold for $10 each.
39
Afnic -The Global Domain Name Market in 2021
High volumes can therefore be indicators of success, but also the reflection of particularly “kite-flying” strategies based on the assumption that holders attracted by very low prices at the time of creation will agree to renew their names at more “normal” prices in the following years. The case of .ICU, with its 3% renewal rate in 2021, is an almost exaggerated illustration of this phenomenon.
These elements should encourage ICANN to rethink its pricing policy with regard to registries of new TLDs, especially with regard to a second round. For most nTLDs excluding .BRAND domains, its fixed fees of $25,000 constitute too heavy a burden, which prevents them from developing and sometimes even causes them to suffocate by thus forming a barrier to entry which benefits incumbents.
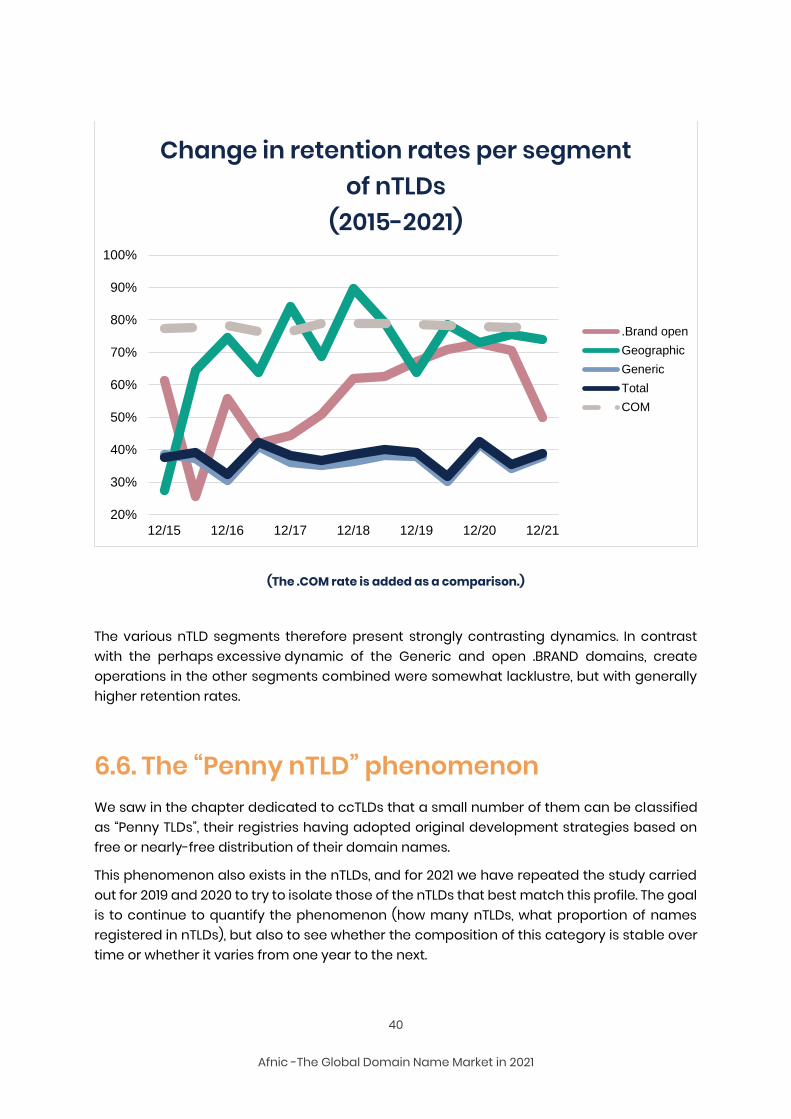
6.5. Change in retention rates per segment Retention rates are a key element for analysing the success of a TLD and its chances of lasting, the more so as a growing number of nTLDs rely on this parameter more than on their create operations to ensure their survival.
Unsurprisingly, we see that the Generic TLDs have the lowest rate, with a deterioration in 2021 (38% compared to 43% in 2020 and 39% in 2019). But this rate remains a moving average.
The rate for open .BRANDs significantly declined in 2021 (from over 70% to 50%).
Geographic TLDs saw their retention rate stabilise in 2021 at close to 75%.
.BRANDs (not represented on the graph due to anomalies in the ICANN data for 2020) posted a retention rate of 91% in 2021.
40
Afnic -The Global Domain Name Market in 2021
(The .COM rate is added as a comparison.)
The various nTLD segments therefore present strongly contrasting dynamics. In contrast with the perhaps excessive dynamic of the Generic and open .BRAND domains, create operations in the other segments combined were somewhat lacklustre, but with generally higher retention rates.
6.6. The “Penny nTLD” phenomenon We saw in the chapter dedicated to ccTLDs that a small number of them can be classified as “Penny TLDs”, their registries having adopted original development strategies based on free or nearly-free distribution of their domain names.
This phenomenon also exists in the nTLDs, and for 2021 we have repeated the study carried out for 2019 and 2020 to try to isolate those of the nTLDs that best match this profile. The goal is to continue to quantify the phenomenon (how many nTLDs, what proportion of names registered in nTLDs), but also to see whether the composition of this category is stable over time or whether it varies from one year to the next.
20%
30%
40%
50%
60%
70%
80%
90%
100%
12/15 12/16 12/17 12/18 12/19 12/20 12/21
Change in retention rates per segment of nTLDs
(2015-2021)
.Brand open
Geographic
Generic
Total
COM
41
Afnic -The Global Domain Name Market in 2021
The characteristics of these TLDs are well known: after one year, the high volumes of creations resulting from low or symbolic prices translate into high volumes of deletions, either because renewal charges are much higher than creation charges or because holders who registered large numbers of “almost-free” names have not achieved their goals (sales or monetisation of traffic) and let them lapse when they expire.
How to identify them among the nTLDs?
The methodology used consists in selecting the generic nTLDs with at least three years of activity at 31 December 2021 (launched before 31/12/18 and still in existence at 31/12/21) so as to avoid as far as possible the “side effects” associated with the opening phases, which usually see high creation rates combined with rather low retention rates in the following year.
This approach also excludes .BRAND domain names, which follow specific dynamics.
In order not to have data biased by TLDs with only a few names in stock and with no commercial activity, we have also eliminated from our sample group all TLDs whose stock was fewer than 200 names at 31/12/18. Some of them have since seen successful launches, but still too recent to be able to be taken into account without the risk of distorting the results.
The usual life cycle of a TLD sees its creation rate decrease as stock increases and the retention rate increase in line with how long ago the names were registered. These values will stabilise after a certain time if no isolated incidents (promotional campaigns, waves of “domaining”, etc.) occur to disrupt them.
The pertinent thresholds for classifying the situation of a TLD were defined by the quantitative analysis carried out in 2019 of all the nTLDs meeting our criteria. We have retained them in 2021 so as to allow comparisons over time.
6.6.1. Retention Rate
The analysis of retention rates of nTLDs in our sample allows us to obtain the following table.
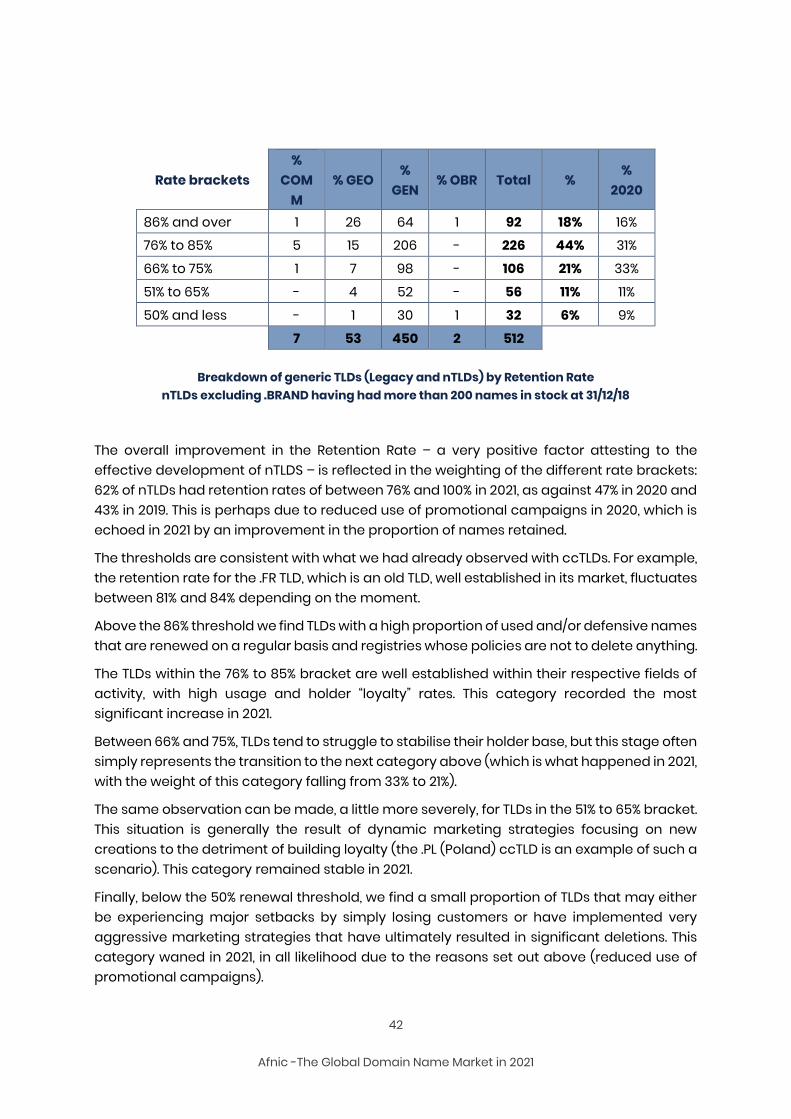
This grid can allow registries to compare themselves with TLDs of the same type, while positioning their category of nTLD relative to the whole. Thus, 77% of Geographic TLDs (41/53) have a retention rate of 76% or more, as against 60% for Generic TLDs (270/450) (and this taking account of the TLDs themselves, not of the volume of domain names registered in each of them).
42
Afnic -The Global Domain Name Market in 2021
Rate brackets %
COMM
% GEO %
GEN % OBR Total %
% 2020
86% and over 1 26 64 1 92 18% 16% 76% to 85% 5 15 206 - 226 44% 31%
66% to 75% 1 7 98 - 106 21% 33%
51% to 65% - 4 52 - 56 11% 11%
50% and less - 1 30 1 32 6% 9%
TOTAL 7 53 450 2 512
Breakdown of generic TLDs (Legacy and nTLDs) by Retention Rate nTLDs excluding .BRAND having had more than 200 names in stock at 31/12/18
The overall improvement in the Retention Rate – a very positive factor attesting to the effective development of nTLDS – is reflected in the weighting of the different rate brackets: 62% of nTLDs had retention rates of between 76% and 100% in 2021, as against 47% in 2020 and 43% in 2019. This is perhaps due to reduced use of promotional campaigns in 2020, which is echoed in 2021 by an improvement in the proportion of names retained.
The thresholds are consistent with what we had already observed with ccTLDs. For example, the retention rate for the .FR TLD, which is an old TLD, well established in its market, fluctuates between 81% and 84% depending on the moment.
Above the 86% threshold we find TLDs with a high proportion of used and/or defensive names that are renewed on a regular basis and registries whose policies are not to delete anything.
The TLDs within the 76% to 85% bracket are well established within their respective fields of activity, with high usage and holder “loyalty” rates. This category recorded the most significant increase in 2021.
Between 66% and 75%, TLDs tend to struggle to stabilise their holder base, but this stage often simply represents the transition to the next category above (which is what happened in 2021, with the weight of this category falling from 33% to 21%).
The same observation can be made, a little more severely, for TLDs in the 51% to 65% bracket. This situation is generally the result of dynamic marketing strategies focusing on new creations to the detriment of building loyalty (the .PL (Poland) ccTLD is an example of such a scenario). This category remained stable in 2021.
Finally, below the 50% renewal threshold, we find a small proportion of TLDs that may either be experiencing major setbacks by simply losing customers or have implemented very aggressive marketing strategies that have ultimately resulted in significant deletions. This category waned in 2021, in all likelihood due to the reasons set out above (reduced use of promotional campaigns).
43
Afnic -The Global Domain Name Market in 2021
Our Penny nTLDs are among the 32 TLDs in this last category.
6.6.2. Creation Rate
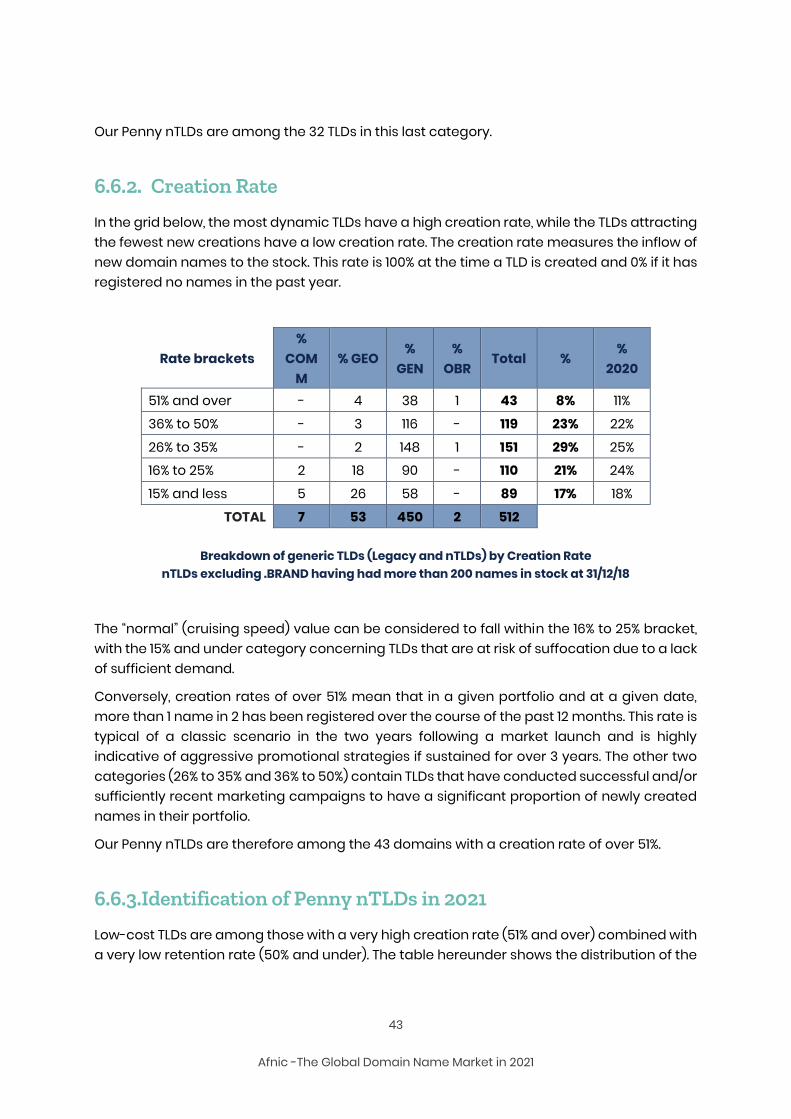
In the grid below, the most dynamic TLDs have a high creation rate, while the TLDs attracting the fewest new creations have a low creation rate. The creation rate measures the inflow of new domain names to the stock. This rate is 100% at the time a TLD is created and 0% if it has registered no names in the past year.
Rate brackets %
COMM
% GEO %
GEN %
OBR Total %
% 2020
51% and over - 4 38 1 43 8% 11%
36% to 50% - 3 116 - 119 23% 22%
26% to 35% - 2 148 1 151 29% 25% 16% to 25% 2 18 90 - 110 21% 24%
15% and less 5 26 58 - 89 17% 18%
TOTAL 7 53 450 2 512
Breakdown of generic TLDs (Legacy and nTLDs) by Creation Rate nTLDs excluding .BRAND having had more than 200 names in stock at 31/12/18
The “normal” (cruising speed) value can be considered to fall within the 16% to 25% bracket, with the 15% and under category concerning TLDs that are at risk of suffocation due to a lack of sufficient demand.
Conversely, creation rates of over 51% mean that in a given portfolio and at a given date, more than 1 name in 2 has been registered over the course of the past 12 months. This rate is typical of a classic scenario in the two years following a market launch and is highly indicative of aggressive promotional strategies if sustained for over 3 years. The other two categories (26% to 35% and 36% to 50%) contain TLDs that have conducted successful and/or sufficiently recent marketing campaigns to have a significant proportion of newly created names in their portfolio.
Our Penny nTLDs are therefore among the 43 domains with a creation rate of over 51%.
6.6.3.Identification of Penny nTLDs in 2021
Low-cost TLDs are among those with a very high creation rate (51% and over) combined with a very low retention rate (50% and under). The table hereunder shows the distribution of the
44
Afnic -The Global Domain Name Market in 2021
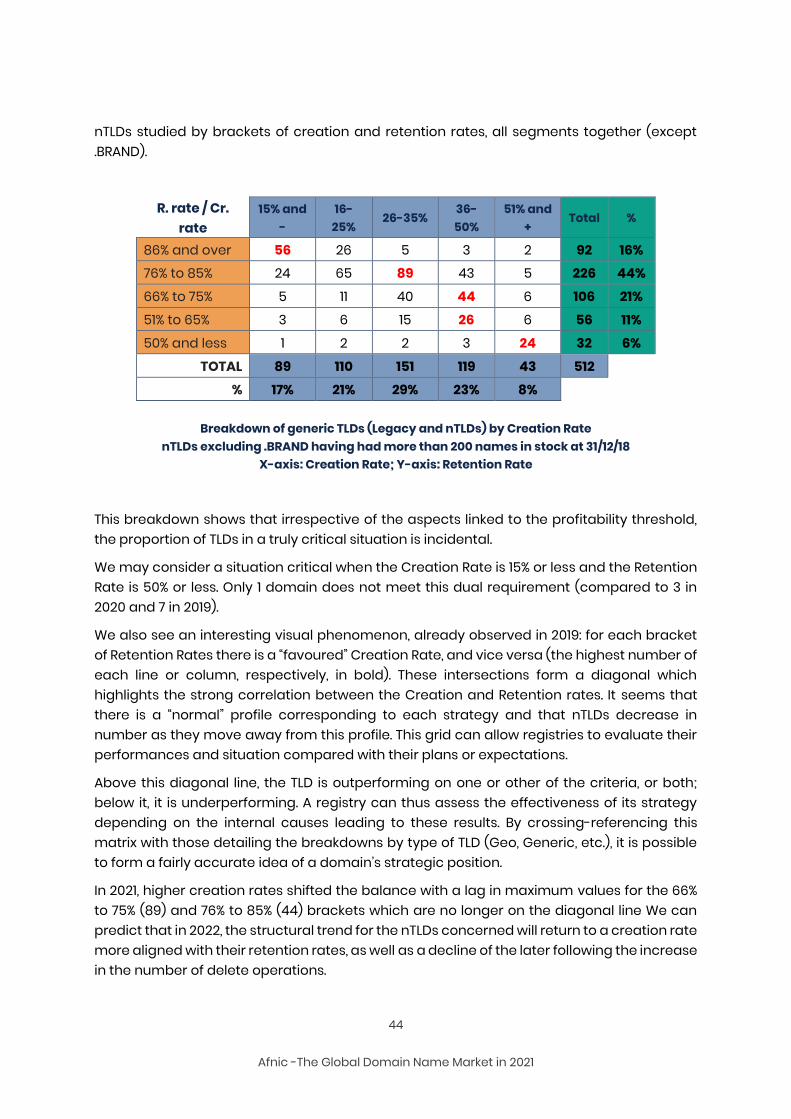
nTLDs studied by brackets of creation and retention rates, all segments together (except .BRAND).
R. rate / Cr. rate
15% and -
16-25%
26-35% 36-50%
51% and +
Total %
86% and over 56 26 5 3 2 92 16% 76% to 85% 24 65 89 43 5 226 44%
66% to 75% 5 11 40 44 6 106 21%
51% to 65% 3 6 15 26 6 56 11%
50% and less 1 2 2 3 24 32 6%
TOTAL 89 110 151 119 43 512
% 17% 21% 29% 23% 8%
Breakdown of generic TLDs (Legacy and nTLDs) by Creation Rate nTLDs excluding .BRAND having had more than 200 names in stock at 31/12/18
X-axis: Creation Rate; Y-axis: Retention Rate
This breakdown shows that irrespective of the aspects linked to the profitability threshold, the proportion of TLDs in a truly critical situation is incidental.
We may consider a situation critical when the Creation Rate is 15% or less and the Retention Rate is 50% or less. Only 1 domain does not meet this dual requirement (compared to 3 in 2020 and 7 in 2019).
We also see an interesting visual phenomenon, already observed in 2019: for each bracket of Retention Rates there is a “favoured” Creation Rate, and vice versa (the highest number of each line or column, respectively, in bold). These intersections form a diagonal which highlights the strong correlation between the Creation and Retention rates. It seems that there is a “normal” profile corresponding to each strategy and that nTLDs decrease in number as they move away from this profile. This grid can allow registries to evaluate their performances and situation compared with their plans or expectations.
Above this diagonal line, the TLD is outperforming on one or other of the criteria, or both; below it, it is underperforming. A registry can thus assess the effectiveness of its strategy depending on the internal causes leading to these results. By crossing-referencing this matrix with those detailing the breakdowns by type of TLD (Geo, Generic, etc.), it is possible to form a fairly accurate idea of a domain’s strategic position.
In 2021, higher creation rates shifted the balance with a lag in maximum values for the 66% to 75% (89) and 76% to 85% (44) brackets which are no longer on the diagonal line We can predict that in 2022, the structural trend for the nTLDs concerned will return to a creation rate more aligned with their retention rates, as well as a decline of the later following the increase in the number of delete operations.
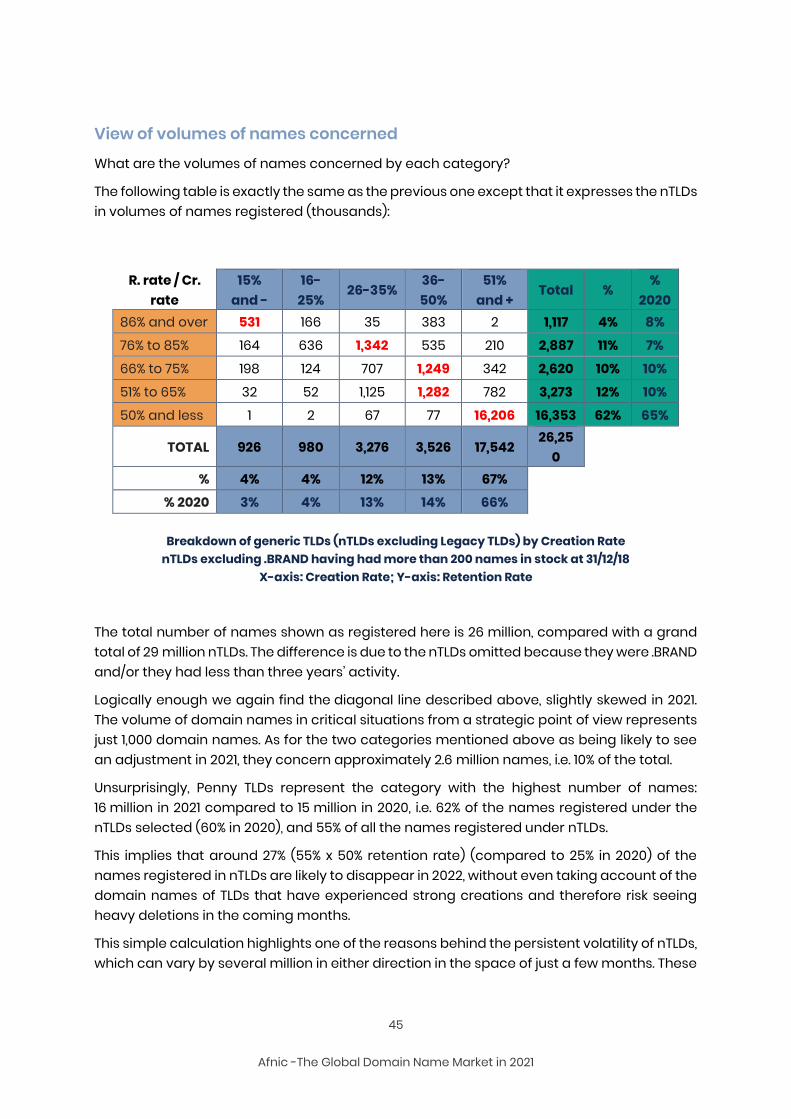
45
Afnic -The Global Domain Name Market in 2021
View of volumes of names concerned
What are the volumes of names concerned by each category?
The following table is exactly the same as the previous one except that it expresses the nTLDs in volumes of names registered (thousands):
R. rate / Cr. rate
15% and -
16-25%
26-35% 36-50%
51% and +
Total % %
2020 86% and over 531 166 35 383 2 1,117 4% 8%
76% to 85% 164 636 1,342 535 210 2,887 11% 7%
66% to 75% 198 124 707 1,249 342 2,620 10% 10%
51% to 65% 32 52 1,125 1,282 782 3,273 12% 10%
50% and less 1 2 67 77 16,206 16,353 62% 65%
TOTAL 926 980 3,276 3,526 17,542 26,25
0
% 4% 4% 12% 13% 67%
% 2020 3% 4% 13% 14% 66%
Breakdown of generic TLDs (nTLDs excluding Legacy TLDs) by Creation Rate nTLDs excluding .BRAND having had more than 200 names in stock at 31/12/18
X-axis: Creation Rate; Y-axis: Retention Rate
The total number of names shown as registered here is 26 million, compared with a grand total of 29 million nTLDs. The difference is due to the nTLDs omitted because they were .BRAND and/or they had less than three years’ activity.
Logically enough we again find the diagonal line described above, slightly skewed in 2021. The volume of domain names in critical situations from a strategic point of view represents just 1,000 domain names. As for the two categories mentioned above as being likely to see an adjustment in 2021, they concern approximately 2.6 million names, i.e. 10% of the total.
Unsurprisingly, Penny TLDs represent the category with the highest number of names: 16 million in 2021 compared to 15 million in 2020, i.e. 62% of the names registered under the nTLDs selected (60% in 2020), and 55% of all the names registered under nTLDs.
This implies that around 27% (55% x 50% retention rate) (compared to 25% in 2020) of the names registered in nTLDs are likely to disappear in 2022, without even taking account of the domain names of TLDs that have experienced strong creations and therefore risk seeing heavy deletions in the coming months.
This simple calculation highlights one of the reasons behind the persistent volatility of nTLDs, which can vary by several million in either direction in the space of just a few months. These
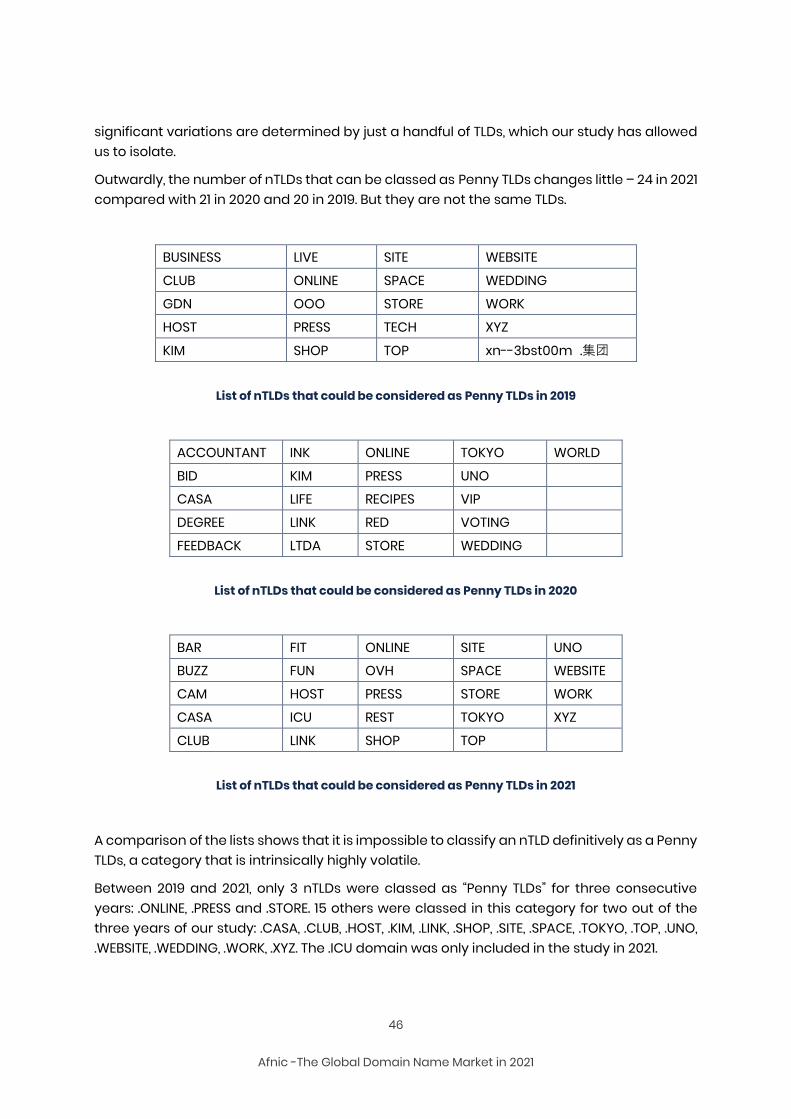
46
Afnic -The Global Domain Name Market in 2021
significant variations are determined by just a handful of TLDs, which our study has allowed us to isolate.
Outwardly, the number of nTLDs that can be classed as Penny TLDs changes little – 24 in 2021 compared with 21 in 2020 and 20 in 2019. But they are not the same TLDs.
BUSINESS LIVE SITE WEBSITE
CLUB ONLINE SPACE WEDDING
GDN OOO STORE WORK
HOST PRESS TECH XYZ
KIM SHOP TOP xn--3bst00m .集团
List of nTLDs that could be considered as Penny TLDs in 2019
ACCOUNTANT INK ONLINE TOKYO WORLD
BID KIM PRESS UNO CASA LIFE RECIPES VIP
DEGREE LINK RED VOTING
FEEDBACK LTDA STORE WEDDING
List of nTLDs that could be considered as Penny TLDs in 2020
BAR FIT ONLINE SITE UNO BUZZ FUN OVH SPACE WEBSITE
CAM HOST PRESS STORE WORK
CASA ICU REST TOKYO XYZ
CLUB LINK SHOP TOP
List of nTLDs that could be considered as Penny TLDs in 2021
A comparison of the lists shows that it is impossible to classify an nTLD definitively as a Penny TLDs, a category that is intrinsically highly volatile.
Between 2019 and 2021, only 3 nTLDs were classed as “Penny TLDs” for three consecutive years: .ONLINE, .PRESS and .STORE. 15 others were classed in this category for two out of the three years of our study: .CASA, .CLUB, .HOST, .KIM, .LINK, .SHOP, .SITE, .SPACE, .TOKYO, .TOP, .UNO, .WEBSITE, .WEDDING, .WORK, .XYZ. The .ICU domain was only included in the study in 2021.
47
Afnic -The Global Domain Name Market in 2021
This ranking is clearly not static as it evolves according to the strategies adopted by the players concerned and the natural constraints imposed by both the market and the life cycle of the domain names.
This being the case, a growing TLD will automatically find it increasingly difficult to maintain a high creation rate. Likewise, an increasing retention rate for a TLD that is achieving zero growth or even in decline can only reflect the fact that there are very few new creations and that the stock is based increasingly on names that have been used and/or defensively registered in the past, which is not necessarily a good sign. It all revolves around balance and the context in which the TLD is operated.
The main issue for new registries is often that of the volume of names managed, which, where third parties (and indeed investors!) are concerned, is indicative of a domain’s success. After a few years, however, these same registries realise that the true key to success is the profitability of their activity.
It is for this reason that we considered it useful to maintain in this 2021 edition a few reflections on the business models of the nTLDs, for the attention of both current registries and those envisaging applying in future ICANN rounds.
6.7. Reflections on the business models of the nTLDs
There is a degree of confusion surrounding talk of the “new TLDs”. Some commentators sound an optimistic note, while others churn out only bad news. How can we know who is right? The objective of this section is to lay the bases for a reflection on the dynamics and constraints inherent in each business model, and to put forward a few keys to understanding that seem to us pertinent at the present time.
A secondary objective is to show that the key success factors of these different types of TLDs – factors likely to ensure their long-term survival – are not entirely based on volume, at least for some of them. It is only for the “merchant” nTLDs, whose durability relies on selling domain names to third parties, that the notion of volume has any real meaning. The success of a TLD in fact depends more on its ability to unlock value for its registry and the target online community, and the way this value is measured differs from one segment to another.
On the other hand, the costs are the same for all registries, and this burning topic cannot be ignored, since it is far from being neutral: on top of the back-end operator’s charges, the US$25,000 a year demanded by ICANN (for nTLDs with fewer than 50,000 names in stock) represent a rather heavy burden.
As already mentioned above, for a commercial TLD with 5,000 names in stock, these ICANN fees are equivalent to a $5 fixed cost per domain name. If we add the back-end operator’s charges, these internal operating costs and the promotional and development expenses,
48
Afnic -The Global Domain Name Market in 2021
we see straight away that such registries are forced to charge high, relatively uncompetitive rates compared with those of major competitors already solidly entrenched in the market, enjoying the double advantage of volume and user acceptance.
6.7.1. Unequal business models
Not all new TLDs are equal as regards business models. Let us consider each of the major segments or “families” existing at present.
.BRAND TLDs are created by major groups for their own use. Their benefits are expressed in terms of contribution to their owners’ digital strategies. Expected volumes are low and the cost per domain name is therefore high, albeit compensated for by the added value created for the business. Use is internal so the notion of “tariff” does not apply, and profitability has to be addressed in the context of a major group. While substantial for a start-up business, the budget needed to obtain a domain and make it work is fairly modest relative to the investments made to establish and develop the online presence of a major group and its components, not to mention the budgets linked to communication.
“Open” .BRAND names are .BRAND names that can be registered by third parties subject to certain conditions. So far cases are few and far between so we do not have the necessary perspective to be able to assess the dynamics of this segment. For the moment, the salient point is that most of these TLDs attract significant, and in some cases very significant, volumes which means they resemble generic TLDs more than .BRANDs.
“Community” TLDs are reserved to targeted communities, which by their very nature are fairly limited. Expected volumes are therefore rather low, sometimes reaching “average” for large communities or if the TLD is universally acclaimed. In order to balance their accounts, these TLDs are forced to sell their domain names at high prices, but which can become moderate if successful.
“Geo” TLDs correspond to names of regions or cities. Their catchment areas are often greater than those of Community TLDs, while targeting relatively small audiences. Their problem is very similar to that of the Community TLDs, although less severe. Their spectrum is broader, ranging from a few thousand domain names to several hundreds of thousands in the long run. But initially and for several years, volumes remain low or average and prices must be aligned accordingly, from high to moderate. However, volume-specific prices allow these players to expect a quick return on their investments, with renewal rates generally high and create operations growing as the reputation of the TLDs increases.
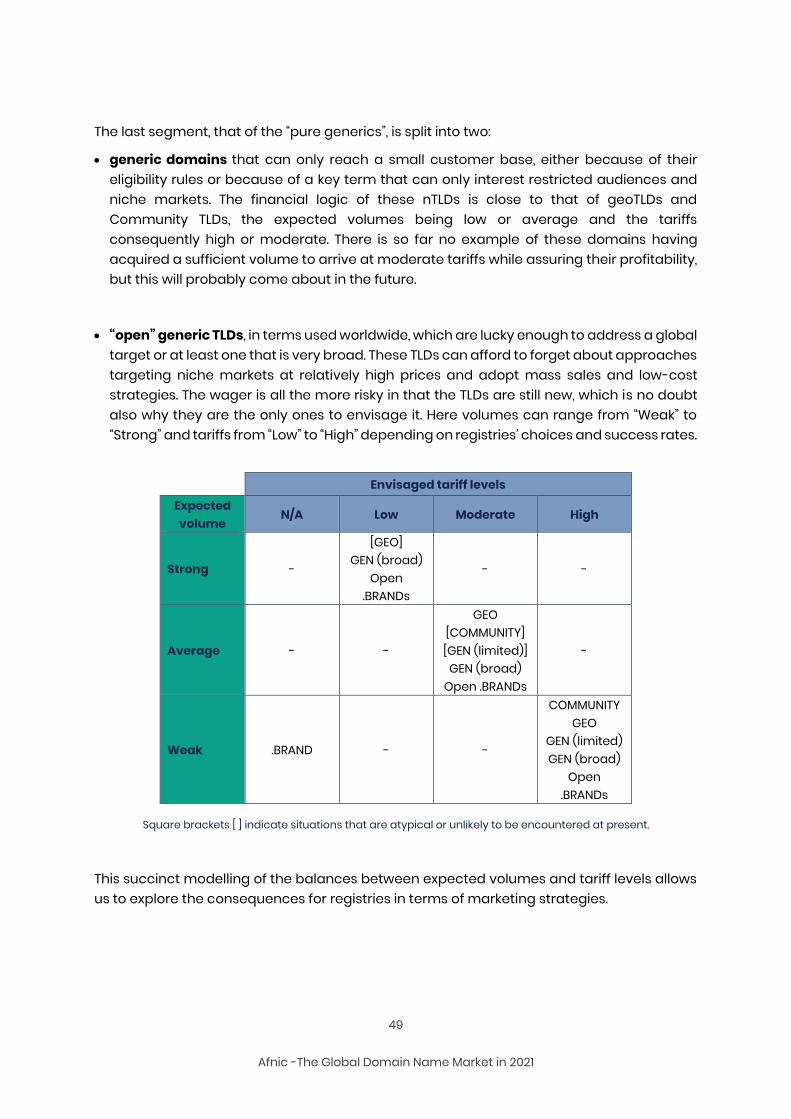
49
Afnic -The Global Domain Name Market in 2021
The last segment, that of the “pure generics”, is split into two:
generic domains that can only reach a small customer base, either because of their eligibility rules or because of a key term that can only interest restricted audiences and niche markets. The financial logic of these nTLDs is close to that of geoTLDs and Community TLDs, the expected volumes being low or average and the tariffs consequently high or moderate. There is so far no example of these domains having acquired a sufficient volume to arrive at moderate tariffs while assuring their profitability, but this will probably come about in the future.
“open” generic TLDs, in terms used worldwide, which are lucky enough to address a global target or at least one that is very broad. These TLDs can afford to forget about approaches targeting niche markets at relatively high prices and adopt mass sales and low-cost strategies. The wager is all the more risky in that the TLDs are still new, which is no doubt also why they are the only ones to envisage it. Here volumes can range from “Weak” to “Strong” and tariffs from “Low” to “High” depending on registries’ choices and success rates.
Envisaged tariff levels
Expected volume
N/A Low Moderate High
Strong -
[GEO] GEN (broad)
Open .BRANDs
- -
Average - -
GEO [COMMUNITY] [GEN (limited)]
GEN (broad) Open .BRANDs
-
Weak .BRAND - -
COMMUNITY GEO
GEN (limited) GEN (broad)
Open .BRANDs
Square brackets [ ] indicate situations that are atypical or unlikely to be encountered at present.
This succinct modelling of the balances between expected volumes and tariff levels allows us to explore the consequences for registries in terms of marketing strategies.
50
Afnic -The Global Domain Name Market in 2021
6.7.2. The consequences in terms of marketing strategies
Due to the particularities of each, the nTLDs are not evenly matched and have to develop marketing strategies to suit their strengths and weaknesses.
The lower the expected volumes, with high tariffs, the more the registry is forced to look to the added value of its TLD and/or the sentiments it may be able to arouse among its target audience. .BRAND names will therefore seek added value linked to their digital strategy. COMMUNITY and GEO domains can convey notions of belonging and recognition between their owners and their visitors or prospects. In numerous cases, this will concern “love-TLDs”, which owners are prepared to pay more for because they make particular sense in their view, for reasons that are most often sentimental and linked to identity, such as belonging to a city, region or community. Restricted generic TLDs may seek to develop original service models that provide them with the key success factors they may have initially lacked.
Conversely, the “pure generic TLDs” will be able to charge low tariffs, and even wager on TLDs that are virtually free of charge, hoping that the proportion (generally very low) of renewed names will eventually enable them to balance the books. Renewal rates are all the more critical for TLDs that have chosen a virtually free approach for create operations, hoping to make up their losses with renewal rates. So far these innovative models have achieved tangible results in terms of volumes in the short term, but without guaranteeing the long-term sustainability of the TLDs concerned.
6.7.3. Exclusive TLDs vs. mass TLDs
These are two philosophies that coexist without ever coming together: the successful “love-TLDs” tend to claim to be exclusive or selective, while the “mass-TLDs” in contrast seek the widest range of targets possible.
Both approaches, however, are exposed to miscalculation. Users attracted by a “love-TLD” can be put off by conditions of eligibility that are too drastic, making the TLD cumbersome (checks, etc.) and all the more dissuasive in that their selective nature does not necessarily engender feelings of attachment or any perception of added value. “Mass-TLDs”, on the other hand, by their construction, suffer from significant volatility and must maintain high levels of create operations if they do not want to see their stocks collapse. This strategy can end up looking like a Ponzi operation if it escapes the control of the registry.
The logical result is that, since 2018, we have been witnessing the changes expected among some of the registries, with “love-TLDs” disappointed by the volumes seeking to ease their eligibility conditions, and some “mass-TLDs”, after having their fingers burnt by their disastrous renewal rates, paradoxically revising their prices upwards.
51
Afnic -The Global Domain Name Market in 2021
6.7.4. Bad pricing never pays
This remark is not gratuitous: it should be remembered by future applicants for TLDs in the coming years, when ICANN organises the next rounds.
In a world as competitive as that of domain names, bad pricing can lead a registry to ruin simply because the tariff turns out to be dissuasive (negative effect on volumes) or dilutive (negative effect on the perception of value).
Registrars and users alike are very hostile to rate increases, so it is probably best for a low-to-moderate TLD to start with reasonable rates and allow for the possibility of downward adjustments, as volumes increase.
6.7.5. Rights holders and domainers, two false friends
A fairly large number of new top-level domains have built their short-term models on the hope of reaching two particularly promising markets: rights holders and domainers.
Anxious to protect their brands against cybersquatting, rights holders have long been a cash cow in the domain name market. The “sunrise period” which is designed to allow them to protect their names has sometimes even been transformed into something not far short of racketeering, organised by registries more or less created for this purpose. But the rights holders have often been very disappointing. Once they are conscious of the fact that they can no longer eliminate the risk, they increasingly content themselves with managing it and no longer take part in sunrise periods with the same enthusiasm (or the same anxiety) as before. Similarly, their defensive domain registration strategies have become increasingly parsimonious. The abundance of TLDs has helped kill the golden calf.
The domainers for their part have also been sources of disappointment for some registries. Many refuse to take the risk of investing in TLDs of questionable longevity, or which are so poorly known to the public that the chances of reselling them with a profit are slim. The policy of “premium” names sold by auction or billed more expensively has also sometimes proven fruitless, because domainers cannot afford to invest much in a single name, and the more “natural” holders are not sufficiently aware of the potential returns to accept the level of expenditure required.
6.7.6. Convincing investors
All these considerations are important for applicants wishing to obtain a TLD (and for those who already have one!) vis-à-vis their investors or principals. It is important to understand the situation of each TLD profile in order to adjust the business model and the marketing strategy accordingly, and not to make “false promises” to backers, even in good faith.
The first precaution to take is to explain to them that volume alone is not an absolute criterion of success.
52
Afnic -The Global Domain Name Market in 2021
6.7.7. Success or failure is linked not to volume but to the pertinence of the strategy with respect to market conditions.
Volume is only the tip of the iceberg – certainly the most visible, but perhaps not the most relevant. A TLD that achieves profitability with low volumes but which reaches its targets and wins their loyalty will logically be more sustainable than a TLD with high volumes but which is unprofitable and has to base its development on permanently gaining new customers to compensate for a very low renewal rate.
Even if the domain name market sometimes presents absurd situations, the principle of reality always wins over in the end. The first ICANN round resulted in a proliferation of projects that were sometimes brilliant, but often unrealistic in terms of expectations and disconnect among targets, eligibility conditions, business models and marketing strategies. It is to be hoped that applicants in the next round will do a better job of linking these various parameters so as to give their entrepreneurial venture the best chance of success.
6.8. “Leaders” still fragile Having looked at the dynamics at work in the nTLD segment, it is interesting to study in more detail the performances of the leaders, since their variations largely determine those of the segment as a whole.
These leaders were of necessity selected on the basis of volume: the reference sample group includes all nTLDs with 500,000 or more domain names in stock at the 31 December 2020 and/or 31 December 2021.
Some leaders in past years have seen their stocks melt like snow in the sun and can no longer be considered leaders. They thus vanish if they do not meet our criteria.
As shown in the table below, these “leaders” are largely TLDs marketed using aggressive or low-cost marketing strategies, which explains why some of them have collapsed after surpassing 500,000 names. These cases are interesting to follow in order to identify possible strategies for regaining lost ground.
The table highlights the fact that the 15 TLDs selected alone accounted for 56% of the 1,157 nTLD names registered at 31 December 2021 and 70% of the names created in these same TLDs during the past year (against 71% in 2020).
The stocks of the two categories, whether in the sample group or not, followed sharply different trends in 2021. Whereas the leaders lost 28% (due in particular to .TOP and .SITE), the other nTLDs gained 26% in stock. The contrast is less stark for create operations, with changes of -13% and -7% respectively.
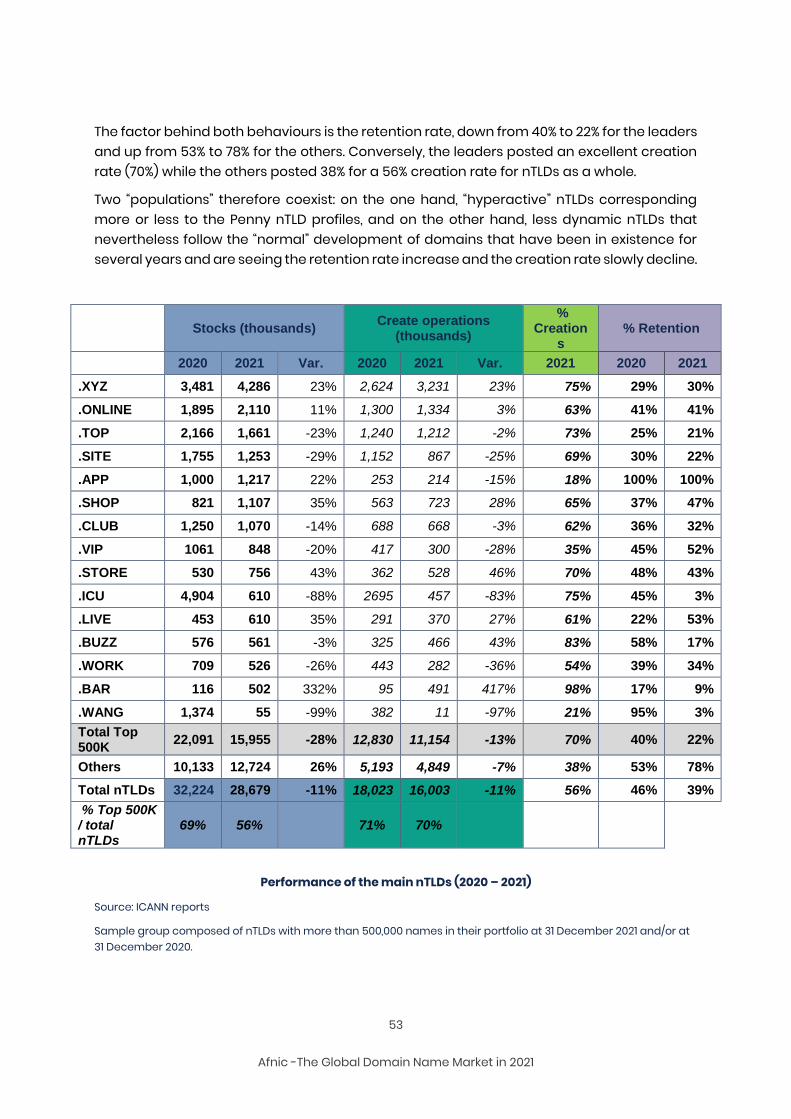
53
Afnic -The Global Domain Name Market in 2021
The factor behind both behaviours is the retention rate, down from 40% to 22% for the leaders and up from 53% to 78% for the others. Conversely, the leaders posted an excellent creation rate (70%) while the others posted 38% for a 56% creation rate for nTLDs as a whole.
Two “populations” therefore coexist: on the one hand, “hyperactive” nTLDs corresponding more or less to the Penny nTLD profiles, and on the other hand, less dynamic nTLDs that nevertheless follow the “normal” development of domains that have been in existence for several years and are seeing the retention rate increase and the creation rate slowly decline.
Stocks (thousands) Create operations
(thousands)
% Creation
s % Retention
2020 2021 Var. 2020 2021 Var. 2021 2020 2021
.XYZ 3,481 4,286 23% 2,624 3,231 23% 75% 29% 30%
.ONLINE 1,895 2,110 11% 1,300 1,334 3% 63% 41% 41%
.TOP 2,166 1,661 -23% 1,240 1,212 -2% 73% 25% 21%
.SITE 1,755 1,253 -29% 1,152 867 -25% 69% 30% 22%
.APP 1,000 1,217 22% 253 214 -15% 18% 100% 100%
.SHOP 821 1,107 35% 563 723 28% 65% 37% 47%
.CLUB 1,250 1,070 -14% 688 668 -3% 62% 36% 32%
.VIP 1061 848 -20% 417 300 -28% 35% 45% 52%
.STORE 530 756 43% 362 528 46% 70% 48% 43%
.ICU 4,904 610 -88% 2695 457 -83% 75% 45% 3%
.LIVE 453 610 35% 291 370 27% 61% 22% 53%
.BUZZ 576 561 -3% 325 466 43% 83% 58% 17%
.WORK 709 526 -26% 443 282 -36% 54% 39% 34%
.BAR 116 502 332% 95 491 417% 98% 17% 9%
.WANG 1,374 55 -99% 382 11 -97% 21% 95% 3%
Total Top 500K
22,091 15,955 -28% 12,830 11,154 -13% 70% 40% 22%
Others 10,133 12,724 26% 5,193 4,849 -7% 38% 53% 78%
Total nTLDs 32,224 28,679 -11% 18,023 16,003 -11% 56% 46% 39%
% Top 500K / total nTLDs
69% 56% 71% 70%
Performance of the main nTLDs (2020 – 2021)
Source: ICANN reports
Sample group composed of nTLDs with more than 500,000 names in their portfolio at 31 December 2021 and/or at 31 December 2020.
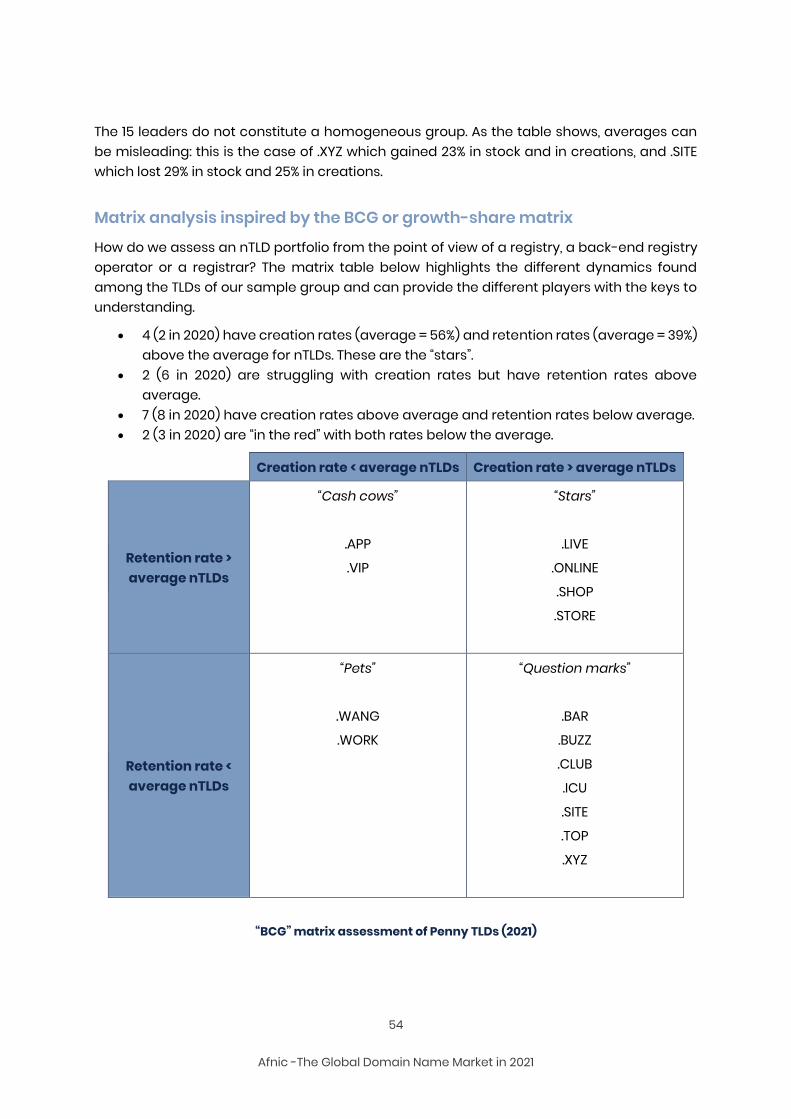
54
Afnic -The Global Domain Name Market in 2021
The 15 leaders do not constitute a homogeneous group. As the table shows, averages can be misleading: this is the case of .XYZ which gained 23% in stock and in creations, and .SITE which lost 29% in stock and 25% in creations.
Matrix analysis inspired by the BCG or growth-share matrix
How do we assess an nTLD portfolio from the point of view of a registry, a back-end registry operator or a registrar? The matrix table below highlights the different dynamics found among the TLDs of our sample group and can provide the different players with the keys to understanding.
4 (2 in 2020) have creation rates (average = 56%) and retention rates (average = 39%) above the average for nTLDs. These are the “stars”.
2 (6 in 2020) are struggling with creation rates but have retention rates above average.
7 (8 in 2020) have creation rates above average and retention rates below average. 2 (3 in 2020) are “in the red” with both rates below the average.
Creation rate < average nTLDs Creation rate > average nTLDs
Retention rate > average nTLDs
“Cash cows”
.APP
.VIP
“Stars”
.LIVE
.ONLINE
.SHOP
.STORE
Retention rate < average nTLDs
“Pets”
.WANG
.WORK
“Question marks”
.BAR
.BUZZ
.CLUB
.ICU
.SITE
.TOP
.XYZ
“BCG” matrix assessment of Penny TLDs (2021)
55
Afnic -The Global Domain Name Market in 2021
We have used the BCG matrix terminology to determine the position of an nTLD at a given moment. This position is naturally not static and can change. There is a high proportion of “Pets” with good commercial momentum yet with difficulties retaining holders. The 4 “stars” were those with the best attributes in 2021. Conversely, .XYZ, one of the main growth drivers in recent months, could be at the origin of a weakening of the segment with one of the lowest retention rates.
The nTLD segment needs to be analysed by putting into proper perspective the impact of the leaders, which are subject to strong fluctuations due to their marketing strategies, just as ccTLDs should be considered without the Penny ccTLDs that distort the overall performance characteristics.
The finding revealed by the above tables contradicts the gloom or pessimism that can be seen in certain specialised publications about new TLDs. In reality, this segment is highly concentrated, and its leaders are not representative of all these new entrants, in their periods of exuberance and of depression.
6.9. Market share of the main back-end registry operators
Back-end registry operators, or “BEROs”, have developed with the mass emergence of new TLDs during the first ICANN round in 2012 – 2014. We felt it would be interesting to present a progress report on these little-known players who work in the shadows and are responsible for the back-end management of TLDs on behalf of their registries. The market shares given above solely concern nTLDs, although some back-end registries are also active in the ccTLD and Legacy TLD segments.
The following tables show the 11 back-end registries in the world top 10 in terms of the number of nTLDs managed and/or volumes of names under these domains. The breakdown corresponds to the nature of the nTLDs in order to highlight the different back-end registry strategies. nTLD allocations are as known at 31 December 2021. Some transactions that may have been published since 1 January 2022 have not been included if they entered into force beyond that date.
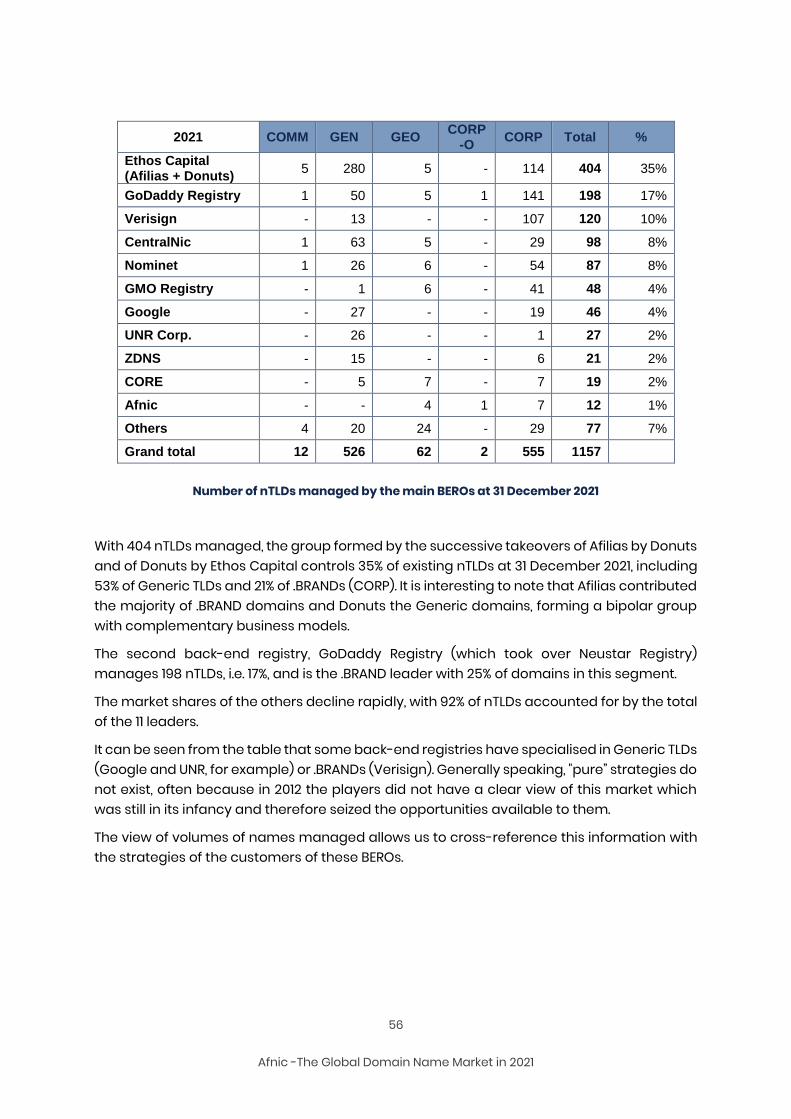
56
Afnic -The Global Domain Name Market in 2021
2021 COMM GEN GEO CORP
-O CORP Total %
Ethos Capital (Afilias + Donuts)
5 280 5 - 114 404 35%
GoDaddy Registry 1 50 5 1 141 198 17%
Verisign - 13 - - 107 120 10%
CentralNic 1 63 5 - 29 98 8%
Nominet 1 26 6 - 54 87 8%
GMO Registry - 1 6 - 41 48 4%
Google - 27 - - 19 46 4%
UNR Corp. - 26 - - 1 27 2%
ZDNS - 15 - - 6 21 2%
CORE - 5 7 - 7 19 2%
Afnic - - 4 1 7 12 1%
Others 4 20 24 - 29 77 7%
Grand total 12 526 62 2 555 1157
Number of nTLDs managed by the main BEROs at 31 December 2021
With 404 nTLDs managed, the group formed by the successive takeovers of Afilias by Donuts and of Donuts by Ethos Capital controls 35% of existing nTLDs at 31 December 2021, including 53% of Generic TLDs and 21% of .BRANDs (CORP). It is interesting to note that Afilias contributed the majority of .BRAND domains and Donuts the Generic domains, forming a bipolar group with complementary business models.
The second back-end registry, GoDaddy Registry (which took over Neustar Registry) manages 198 nTLDs, i.e. 17%, and is the .BRAND leader with 25% of domains in this segment.
The market shares of the others decline rapidly, with 92% of nTLDs accounted for by the total of the 11 leaders.
It can be seen from the table that some back-end registries have specialised in Generic TLDs (Google and UNR, for example) or .BRANDs (Verisign). Generally speaking, "pure” strategies do not exist, often because in 2012 the players did not have a clear view of this market which was still in its infancy and therefore seized the opportunities available to them.
The view of volumes of names managed allows us to cross-reference this information with the strategies of the customers of these BEROs.
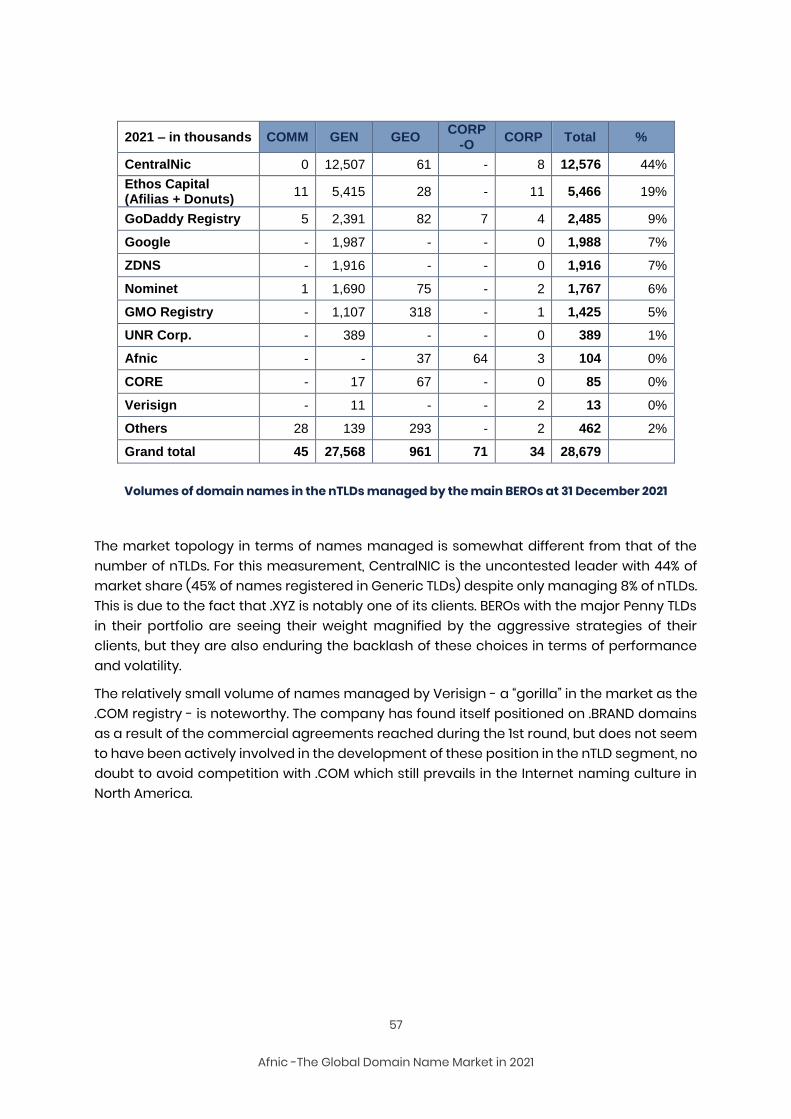
57
Afnic -The Global Domain Name Market in 2021
2021 – in thousands COMM GEN GEO CORP
-O CORP Total %
CentralNic 0 12,507 61 - 8 12,576 44%
Ethos Capital (Afilias + Donuts)
11 5,415 28 - 11 5,466 19%
GoDaddy Registry 5 2,391 82 7 4 2,485 9%
Google - 1,987 - - 0 1,988 7%
ZDNS - 1,916 - - 0 1,916 7%
Nominet 1 1,690 75 - 2 1,767 6%
GMO Registry - 1,107 318 - 1 1,425 5%
UNR Corp. - 389 - - 0 389 1%
Afnic - - 37 64 3 104 0%
CORE - 17 67 - 0 85 0%
Verisign - 11 - - 2 13 0%
Others 28 139 293 - 2 462 2%
Grand total 45 27,568 961 71 34 28,679
Volumes of domain names in the nTLDs managed by the main BEROs at 31 December 2021
The market topology in terms of names managed is somewhat different from that of the number of nTLDs. For this measurement, CentralNIC is the uncontested leader with 44% of market share (45% of names registered in Generic TLDs) despite only managing 8% of nTLDs. This is due to the fact that .XYZ is notably one of its clients. BEROs with the major Penny TLDs in their portfolio are seeing their weight magnified by the aggressive strategies of their clients, but they are also enduring the backlash of these choices in terms of performance and volatility.
The relatively small volume of names managed by Verisign - a “gorilla” in the market as the .COM registry - is noteworthy. The company has found itself positioned on .BRAND domains as a result of the commercial agreements reached during the 1st round, but does not seem to have been actively involved in the development of these position in the nTLD segment, no doubt to avoid competition with .COM which still prevails in the Internet naming culture in North America.
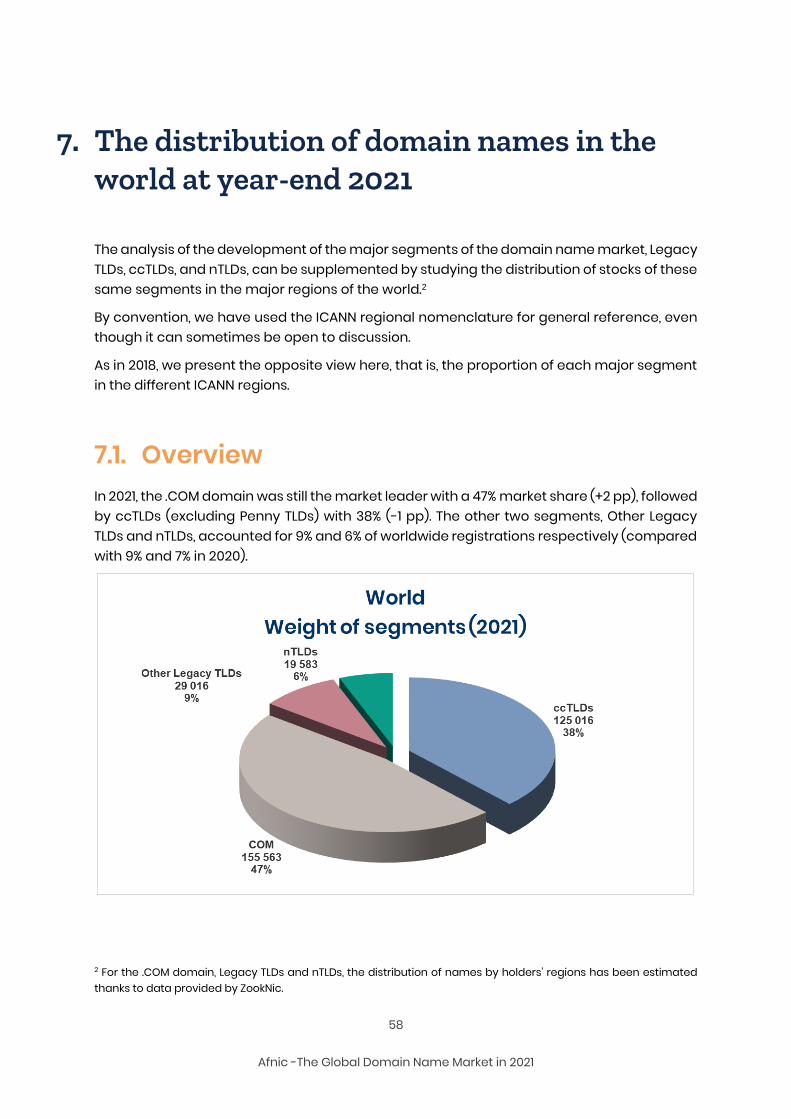
58
Afnic -The Global Domain Name Market in 2021
7. The distribution of domain names in the world at year-end 2021
The analysis of the development of the major segments of the domain name market, Legacy TLDs, ccTLDs, and nTLDs, can be supplemented by studying the distribution of stocks of these same segments in the major regions of the world.2
By convention, we have used the ICANN regional nomenclature for general reference, even though it can sometimes be open to discussion.
As in 2018, we present the opposite view here, that is, the proportion of each major segment in the different ICANN regions.
7.1. Overview In 2021, the .COM domain was still the market leader with a 47% market share (+2 pp), followed by ccTLDs (excluding Penny TLDs) with 38% (-1 pp). The other two segments, Other Legacy TLDs and nTLDs, accounted for 9% and 6% of worldwide registrations respectively (compared with 9% and 7% in 2020).
2 For the .COM domain, Legacy TLDs and nTLDs, the distribution of names by holders’ regions has been estimated thanks to data provided by ZookNic.
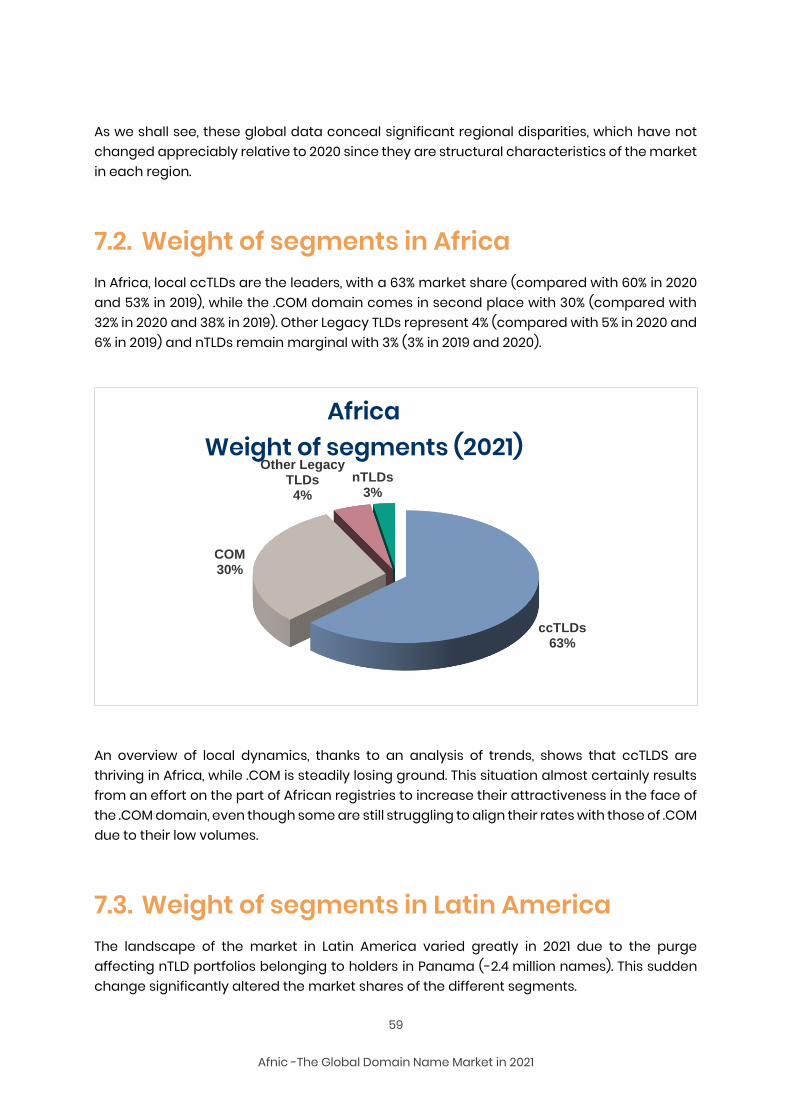
59
Afnic -The Global Domain Name Market in 2021
As we shall see, these global data conceal significant regional disparities, which have not changed appreciably relative to 2020 since they are structural characteristics of the market in each region.
7.2. Weight of segments in Africa In Africa, local ccTLDs are the leaders, with a 63% market share (compared with 60% in 2020 and 53% in 2019), while the .COM domain comes in second place with 30% (compared with 32% in 2020 and 38% in 2019). Other Legacy TLDs represent 4% (compared with 5% in 2020 and 6% in 2019) and nTLDs remain marginal with 3% (3% in 2019 and 2020).
An overview of local dynamics, thanks to an analysis of trends, shows that ccTLDS are thriving in Africa, while .COM is steadily losing ground. This situation almost certainly results from an effort on the part of African registries to increase their attractiveness in the face of the .COM domain, even though some are still struggling to align their rates with those of .COM due to their low volumes.
7.3. Weight of segments in Latin America The landscape of the market in Latin America varied greatly in 2021 due to the purge affecting nTLD portfolios belonging to holders in Panama (-2.4 million names). This sudden change significantly altered the market shares of the different segments.
ccTLDs63%
COM30%
Other Legacy TLDs4%
nTLDs3%
AfricaWeight of segments (2021)
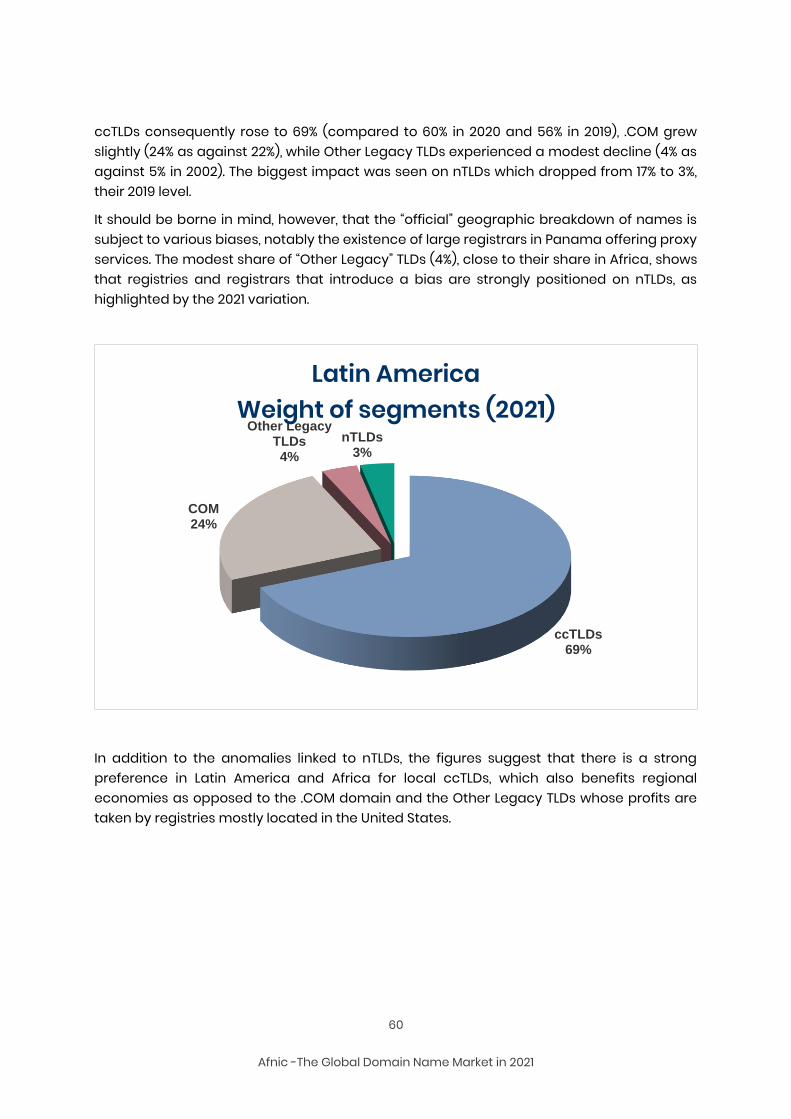
60
Afnic -The Global Domain Name Market in 2021
ccTLDs consequently rose to 69% (compared to 60% in 2020 and 56% in 2019), .COM grew slightly (24% as against 22%), while Other Legacy TLDs experienced a modest decline (4% as against 5% in 2002). The biggest impact was seen on nTLDs which dropped from 17% to 3%, their 2019 level.
It should be borne in mind, however, that the “official” geographic breakdown of names is subject to various biases, notably the existence of large registrars in Panama offering proxy services. The modest share of “Other Legacy” TLDs (4%), close to their share in Africa, shows that registries and registrars that introduce a bias are strongly positioned on nTLDs, as highlighted by the 2021 variation.
In addition to the anomalies linked to nTLDs, the figures suggest that there is a strong preference in Latin America and Africa for local ccTLDs, which also benefits regional economies as opposed to the .COM domain and the Other Legacy TLDs whose profits are taken by registries mostly located in the United States.
ccTLDs69%
COM24%
Other Legacy TLDs4%
nTLDs3%
Latin AmericaWeight of segments (2021)
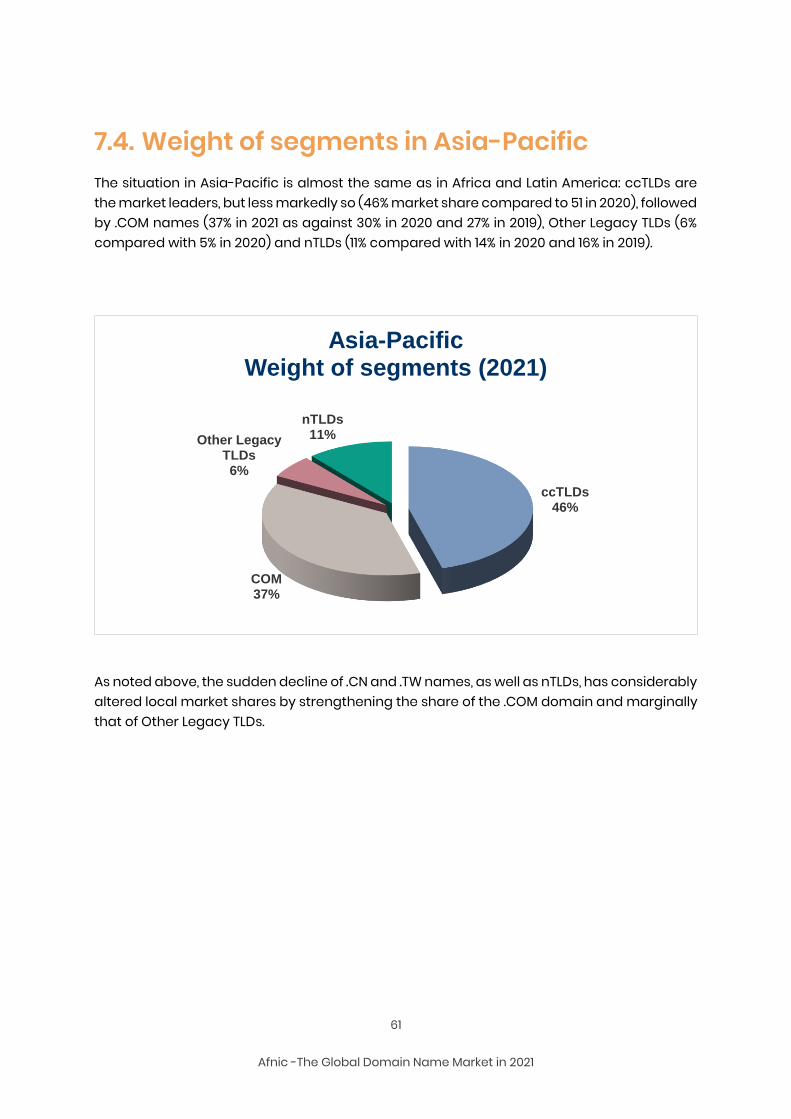
61
Afnic -The Global Domain Name Market in 2021
7.4. Weight of segments in Asia-Pacific The situation in Asia-Pacific is almost the same as in Africa and Latin America: ccTLDs are the market leaders, but less markedly so (46% market share compared to 51 in 2020), followed by .COM names (37% in 2021 as against 30% in 2020 and 27% in 2019), Other Legacy TLDs (6% compared with 5% in 2020) and nTLDs (11% compared with 14% in 2020 and 16% in 2019).
As noted above, the sudden decline of .CN and .TW names, as well as nTLDs, has considerably altered local market shares by strengthening the share of the .COM domain and marginally that of Other Legacy TLDs.
ccTLDs46%
COM37%
Other Legacy TLDs6%
nTLDs11%
Asia-PacificWeight of segments (2021)
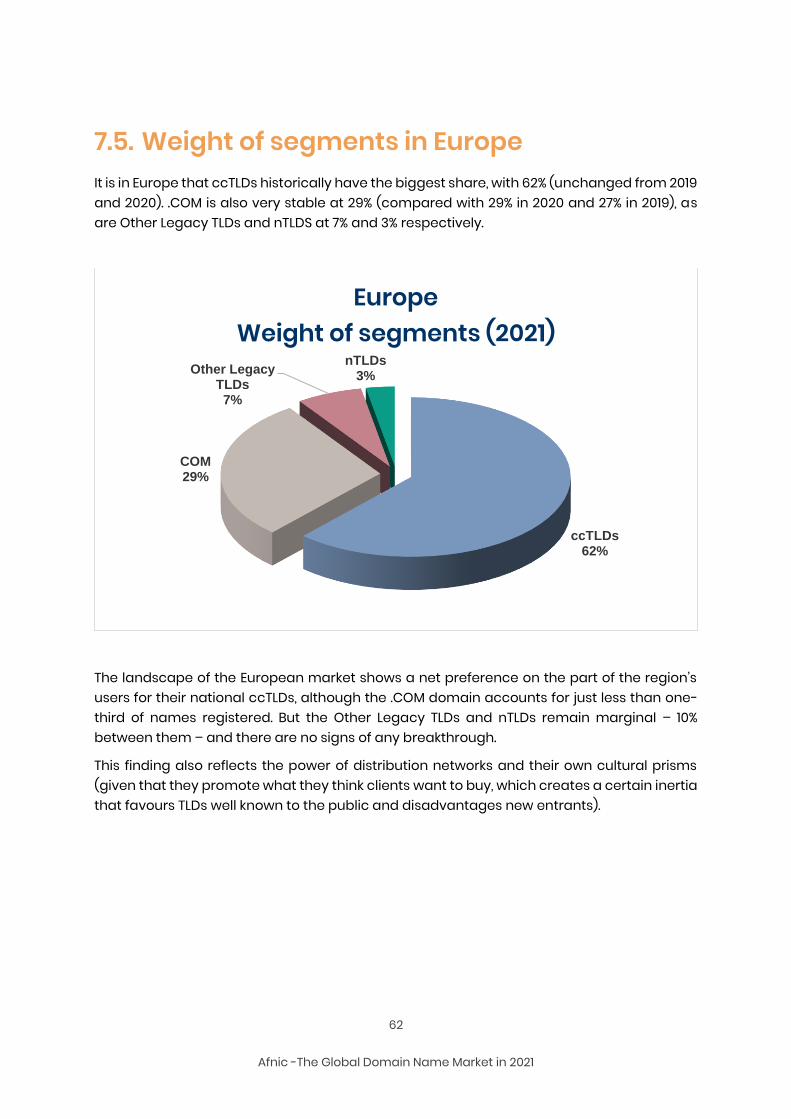
62
Afnic -The Global Domain Name Market in 2021
7.5. Weight of segments in Europe It is in Europe that ccTLDs historically have the biggest share, with 62% (unchanged from 2019 and 2020). .COM is also very stable at 29% (compared with 29% in 2020 and 27% in 2019), as are Other Legacy TLDs and nTLDS at 7% and 3% respectively.
The landscape of the European market shows a net preference on the part of the region’s users for their national ccTLDs, although the .COM domain accounts for just less than one-third of names registered. But the Other Legacy TLDs and nTLDs remain marginal – 10% between them – and there are no signs of any breakthrough.
This finding also reflects the power of distribution networks and their own cultural prisms (given that they promote what they think clients want to buy, which creates a certain inertia that favours TLDs well known to the public and disadvantages new entrants).
ccTLDs62%
COM29%
Other Legacy TLDs7%
nTLDs3%
EuropeWeight of segments (2021)
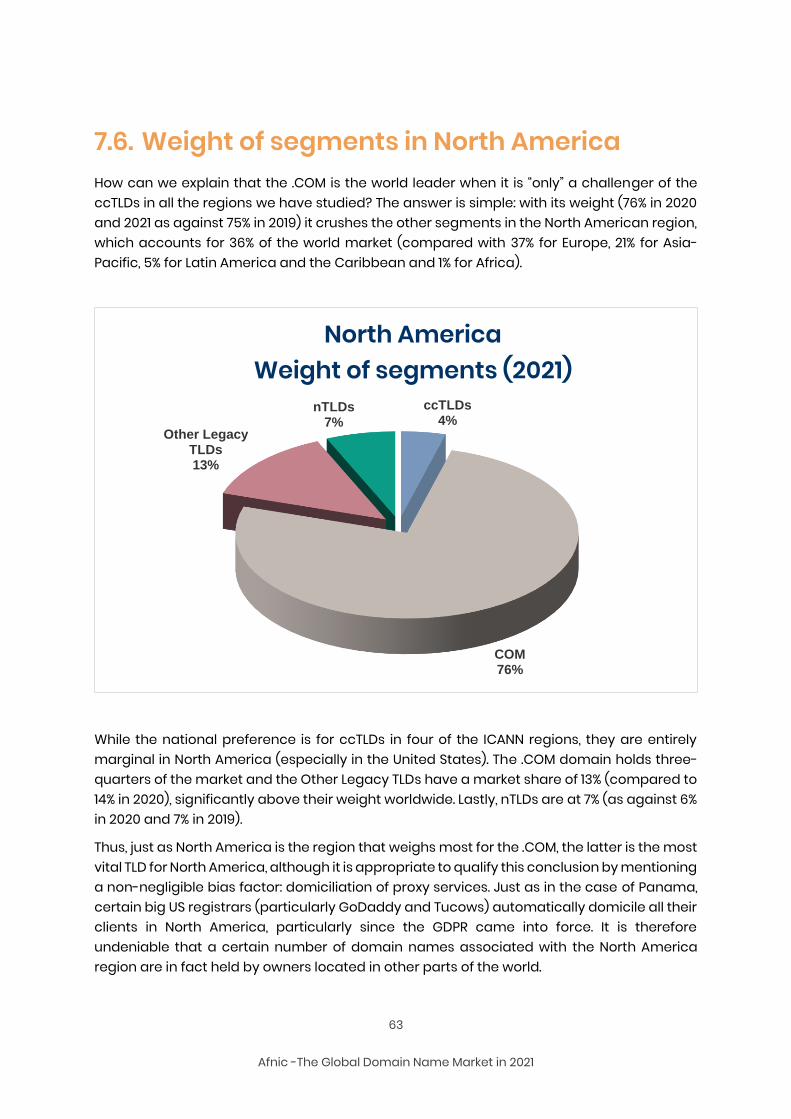
63
Afnic -The Global Domain Name Market in 2021
7.6. Weight of segments in North America How can we explain that the .COM is the world leader when it is “only” a challenger of the ccTLDs in all the regions we have studied? The answer is simple: with its weight (76% in 2020 and 2021 as against 75% in 2019) it crushes the other segments in the North American region, which accounts for 36% of the world market (compared with 37% for Europe, 21% for Asia-Pacific, 5% for Latin America and the Caribbean and 1% for Africa).
While the national preference is for ccTLDs in four of the ICANN regions, they are entirely marginal in North America (especially in the United States). The .COM domain holds three-quarters of the market and the Other Legacy TLDs have a market share of 13% (compared to 14% in 2020), significantly above their weight worldwide. Lastly, nTLDs are at 7% (as against 6% in 2020 and 7% in 2019).
Thus, just as North America is the region that weighs most for the .COM, the latter is the most vital TLD for North America, although it is appropriate to qualify this conclusion by mentioning a non-negligible bias factor: domiciliation of proxy services. Just as in the case of Panama, certain big US registrars (particularly GoDaddy and Tucows) automatically domicile all their clients in North America, particularly since the GDPR came into force. It is therefore undeniable that a certain number of domain names associated with the North America region are in fact held by owners located in other parts of the world.
ccTLDs4%
COM76%
Other Legacy TLDs13%
nTLDs7%
North AmericaWeight of segments (2021)
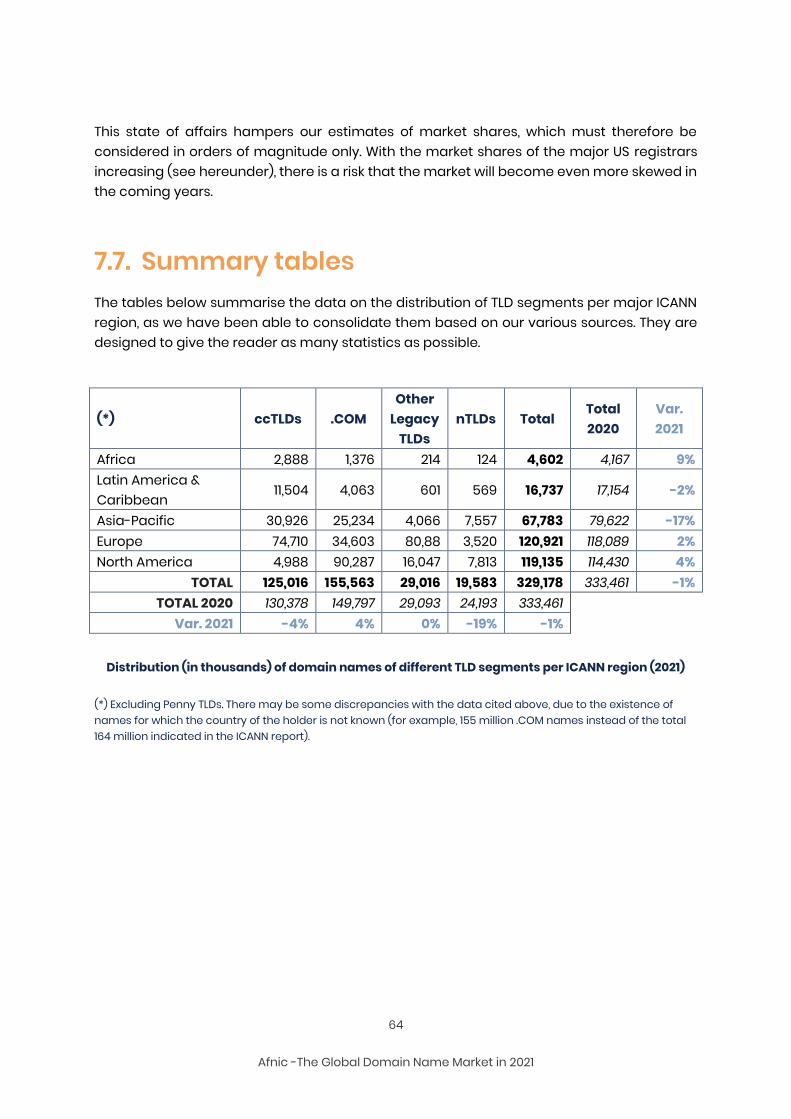
64
Afnic -The Global Domain Name Market in 2021
This state of affairs hampers our estimates of market shares, which must therefore be considered in orders of magnitude only. With the market shares of the major US registrars increasing (see hereunder), there is a risk that the market will become even more skewed in the coming years.
7.7. Summary tables The tables below summarise the data on the distribution of TLD segments per major ICANN region, as we have been able to consolidate them based on our various sources. They are designed to give the reader as many statistics as possible.
(*) ccTLDs .COM Other
Legacy TLDs
nTLDs Total Total 2020
Var. 2021
Africa 2,888 1,376 214 124 4,602 4,167 9% Latin America & Caribbean
11,504 4,063 601 569 16,737 17,154 -2%
Asia-Pacific 30,926 25,234 4,066 7,557 67,783 79,622 -17% Europe 74,710 34,603 80,88 3,520 120,921 118,089 2% North America 4,988 90,287 16,047 7,813 119,135 114,430 4%
TOTAL 125,016 155,563 29,016 19,583 329,178 333,461 -1% TOTAL 2020 130,378 149,797 29,093 24,193 333,461
Var. 2021 -4% 4% 0% -19% -1%
Distribution (in thousands) of domain names of different TLD segments per ICANN region (2021)
(*) Excluding Penny TLDs. There may be some discrepancies with the data cited above, due to the existence of names for which the country of the holder is not known (for example, 155 million .COM names instead of the total 164 million indicated in the ICANN report).
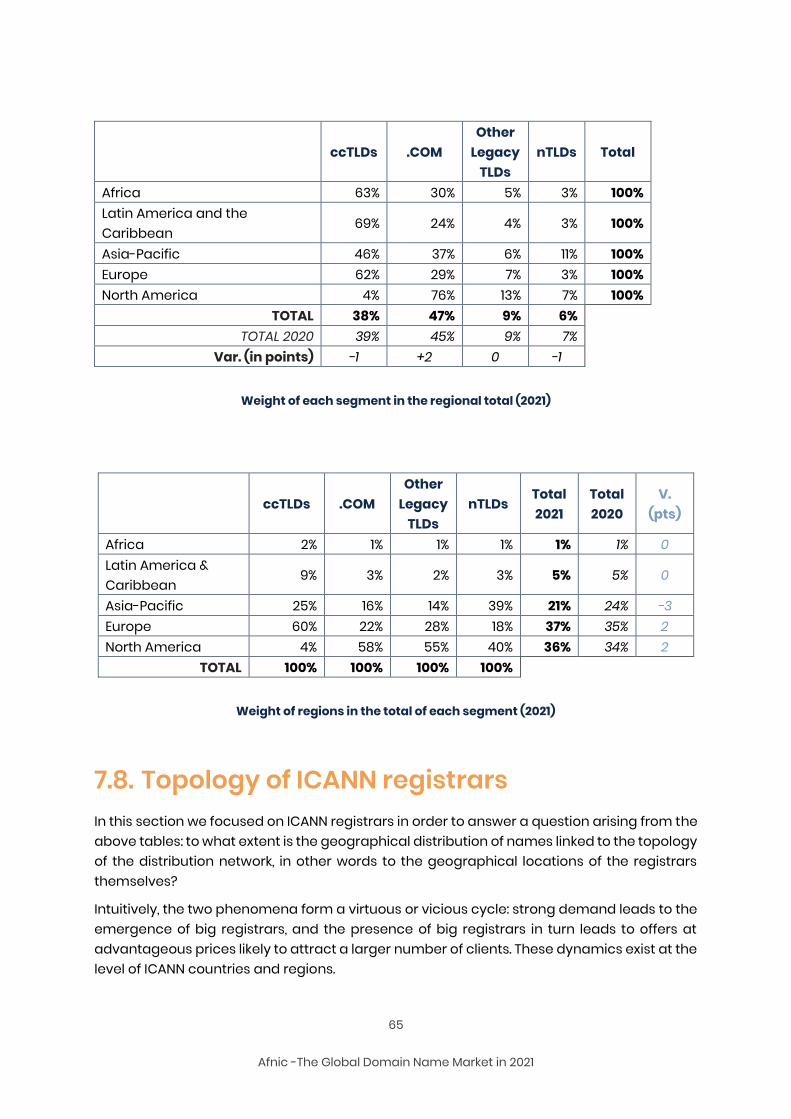
65
Afnic -The Global Domain Name Market in 2021
ccTLDs .COM Other
Legacy TLDs
nTLDs Total
Africa 63% 30% 5% 3% 100% Latin America and the Caribbean
69% 24% 4% 3% 100%
Asia-Pacific 46% 37% 6% 11% 100% Europe 62% 29% 7% 3% 100% North America 4% 76% 13% 7% 100%
TOTAL 38% 47% 9% 6% TOTAL 2020 39% 45% 9% 7%
Var. (in points) -1 +2 0 -1
Weight of each segment in the regional total (2021)
ccTLDs .COM Other
Legacy TLDs
nTLDs Total 2021
Total 2020
V. (pts)
Africa 2% 1% 1% 1% 1% 1% 0 Latin America & Caribbean
9% 3% 2% 3% 5% 5% 0
Asia-Pacific 25% 16% 14% 39% 21% 24% -3 Europe 60% 22% 28% 18% 37% 35% 2 North America 4% 58% 55% 40% 36% 34% 2
TOTAL 100% 100% 100% 100%
Weight of regions in the total of each segment (2021)
7.8. Topology of ICANN registrars In this section we focused on ICANN registrars in order to answer a question arising from the above tables: to what extent is the geographical distribution of names linked to the topology of the distribution network, in other words to the geographical locations of the registrars themselves?
Intuitively, the two phenomena form a virtuous or vicious cycle: strong demand leads to the emergence of big registrars, and the presence of big registrars in turn leads to offers at advantageous prices likely to attract a larger number of clients. These dynamics exist at the level of ICANN countries and regions.
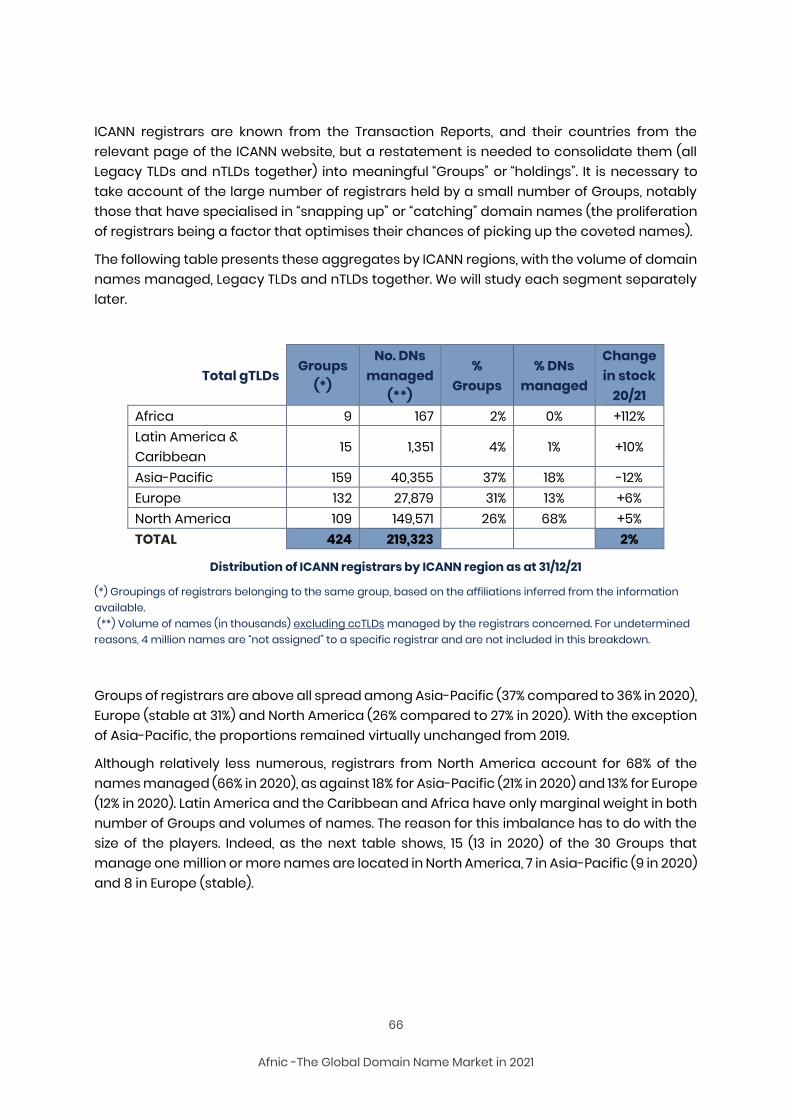
66
Afnic -The Global Domain Name Market in 2021
ICANN registrars are known from the Transaction Reports, and their countries from the relevant page of the ICANN website, but a restatement is needed to consolidate them (all Legacy TLDs and nTLDs together) into meaningful “Groups” or “holdings”. It is necessary to take account of the large number of registrars held by a small number of Groups, notably those that have specialised in “snapping up” or “catching” domain names (the proliferation of registrars being a factor that optimises their chances of picking up the coveted names).
The following table presents these aggregates by ICANN regions, with the volume of domain names managed, Legacy TLDs and nTLDs together. We will study each segment separately later.
Total gTLDs Groups
(*)
No. DNs managed
(**)
% Groups
% DNs managed
Change in stock
20/21 Africa 9 167 2% 0% +112% Latin America & Caribbean
15 1,351 4% 1% +10%
Asia-Pacific 159 40,355 37% 18% -12% Europe 132 27,879 31% 13% +6% North America 109 149,571 26% 68% +5% TOTAL 424 219,323 2%
Distribution of ICANN registrars by ICANN region as at 31/12/21
(*) Groupings of registrars belonging to the same group, based on the affiliations inferred from the information available. (**) Volume of names (in thousands) excluding ccTLDs managed by the registrars concerned. For undetermined reasons, 4 million names are “not assigned” to a specific registrar and are not included in this breakdown.
Groups of registrars are above all spread among Asia-Pacific (37% compared to 36% in 2020), Europe (stable at 31%) and North America (26% compared to 27% in 2020). With the exception of Asia-Pacific, the proportions remained virtually unchanged from 2019.
Although relatively less numerous, registrars from North America account for 68% of the names managed (66% in 2020), as against 18% for Asia-Pacific (21% in 2020) and 13% for Europe (12% in 2020). Latin America and the Caribbean and Africa have only marginal weight in both number of Groups and volumes of names. The reason for this imbalance has to do with the size of the players. Indeed, as the next table shows, 15 (13 in 2020) of the 30 Groups that manage one million or more names are located in North America, 7 in Asia-Pacific (9 in 2020) and 8 in Europe (stable).
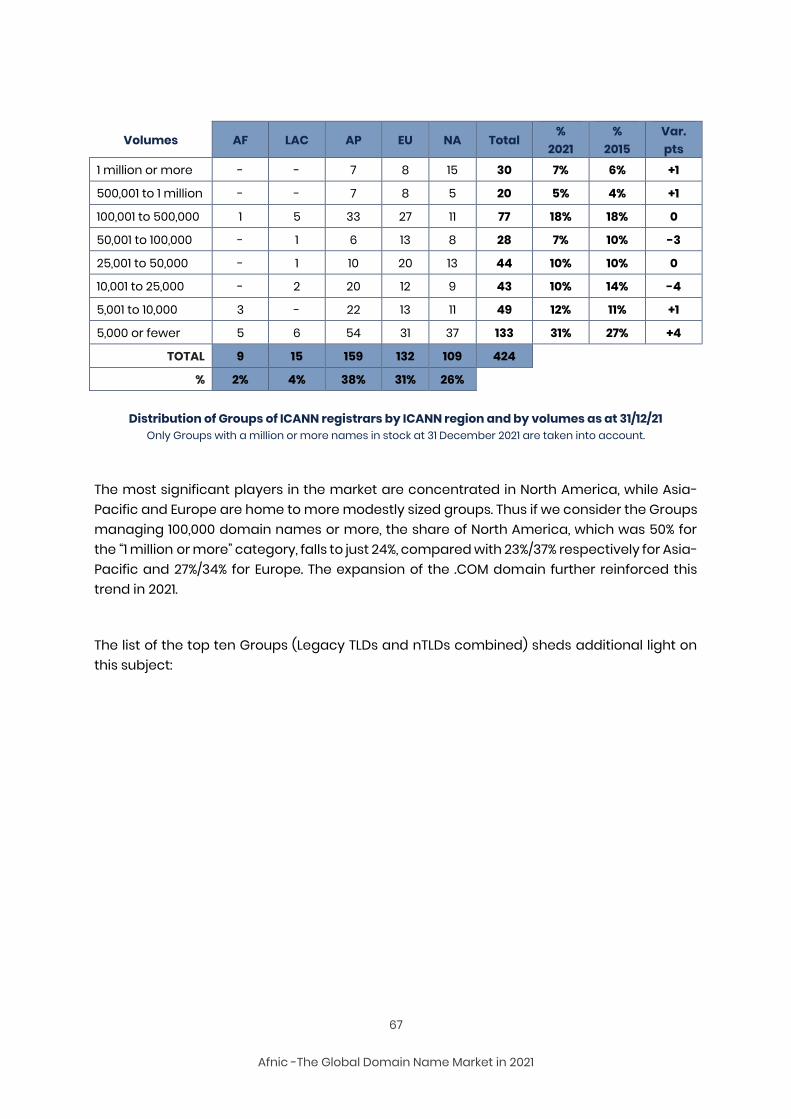
67
Afnic -The Global Domain Name Market in 2021
Volumes AF LAC AP EU NA Total %
2021 %
2015 Var. pts
1 million or more - - 7 8 15 30 7% 6% +1
500,001 to 1 million - - 7 8 5 20 5% 4% +1
100,001 to 500,000 1 5 33 27 11 77 18% 18% 0
50,001 to 100,000 - 1 6 13 8 28 7% 10% -3
25,001 to 50,000 - 1 10 20 13 44 10% 10% 0
10,001 to 25,000 - 2 20 12 9 43 10% 14% -4
5,001 to 10,000 3 - 22 13 11 49 12% 11% +1
5,000 or fewer 5 6 54 31 37 133 31% 27% +4
TOTAL 9 15 159 132 109 424
% 2% 4% 38% 31% 26%
Distribution of Groups of ICANN registrars by ICANN region and by volumes as at 31/12/21 Only Groups with a million or more names in stock at 31 December 2021 are taken into account.
The most significant players in the market are concentrated in North America, while Asia-Pacific and Europe are home to more modestly sized groups. Thus if we consider the Groups managing 100,000 domain names or more, the share of North America, which was 50% for the “1 million or more” category, falls to just 24%, compared with 23%/37% respectively for Asia-Pacific and 27%/34% for Europe. The expansion of the .COM domain further reinforced this trend in 2021.
The list of the top ten Groups (Legacy TLDs and nTLDs combined) sheds additional light on this subject:
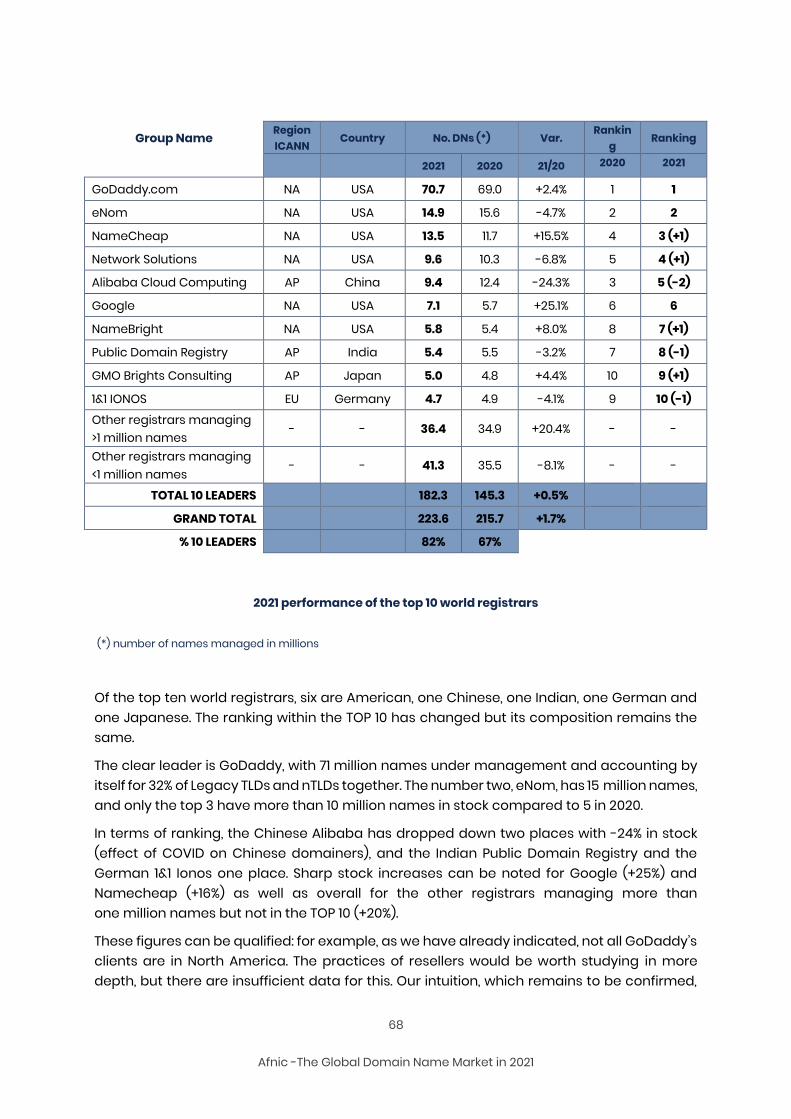
68
Afnic -The Global Domain Name Market in 2021
Group Name Region ICANN Country No. DNs (*) Var.
Ranking
Ranking
2021 2020 21/20 2020 2021
GoDaddy.com NA USA 70.7 69.0 +2.4% 1 1
eNom NA USA 14.9 15.6 -4.7% 2 2
NameCheap NA USA 13.5 11.7 +15.5% 4 3 (+1)
Network Solutions NA USA 9.6 10.3 -6.8% 5 4 (+1)
Alibaba Cloud Computing AP China 9.4 12.4 -24.3% 3 5 (-2)
Google NA USA 7.1 5.7 +25.1% 6 6
NameBright NA USA 5.8 5.4 +8.0% 8 7 (+1)
Public Domain Registry AP India 5.4 5.5 -3.2% 7 8 (-1)
GMO Brights Consulting AP Japan 5.0 4.8 +4.4% 10 9 (+1)
1&1 IONOS EU Germany 4.7 4.9 -4.1% 9 10 (-1) Other registrars managing >1 million names
- - 36.4 34.9 +20.4% - -
Other registrars managing <1 million names
- - 41.3 35.5 -8.1% - -
TOTAL 10 LEADERS 182.3 145.3 +0.5%
GRAND TOTAL 223.6 215.7 +1.7%
% 10 LEADERS 82% 67%
2021 performance of the top 10 world registrars
(*) number of names managed in millions
Of the top ten world registrars, six are American, one Chinese, one Indian, one German and one Japanese. The ranking within the TOP 10 has changed but its composition remains the same.
The clear leader is GoDaddy, with 71 million names under management and accounting by itself for 32% of Legacy TLDs and nTLDs together. The number two, eNom, has 15 million names, and only the top 3 have more than 10 million names in stock compared to 5 in 2020.
In terms of ranking, the Chinese Alibaba has dropped down two places with -24% in stock (effect of COVID on Chinese domainers), and the Indian Public Domain Registry and the German 1&1 Ionos one place. Sharp stock increases can be noted for Google (+25%) and Namecheap (+16%) as well as overall for the other registrars managing more than one million names but not in the TOP 10 (+20%).
These figures can be qualified: for example, as we have already indicated, not all GoDaddy’s clients are in North America. The practices of resellers would be worth studying in more depth, but there are insufficient data for this. Our intuition, which remains to be confirmed,
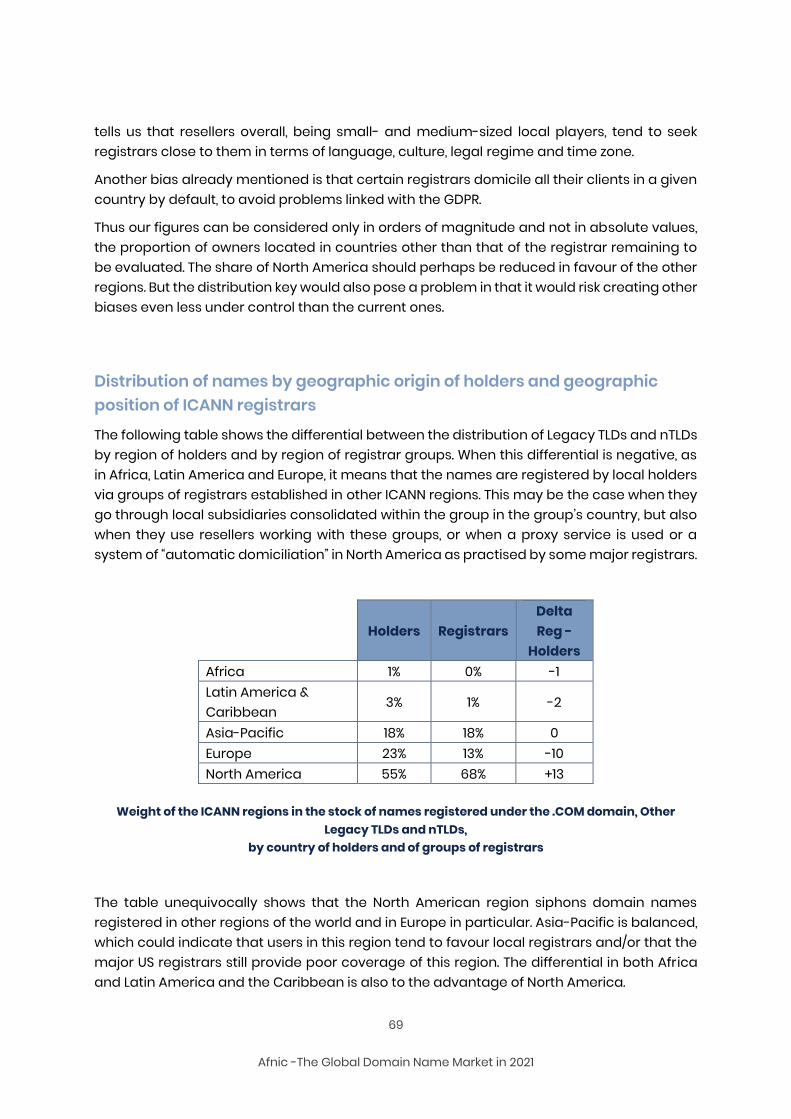
69
Afnic -The Global Domain Name Market in 2021
tells us that resellers overall, being small- and medium-sized local players, tend to seek registrars close to them in terms of language, culture, legal regime and time zone.
Another bias already mentioned is that certain registrars domicile all their clients in a given country by default, to avoid problems linked with the GDPR.
Thus our figures can be considered only in orders of magnitude and not in absolute values, the proportion of owners located in countries other than that of the registrar remaining to be evaluated. The share of North America should perhaps be reduced in favour of the other regions. But the distribution key would also pose a problem in that it would risk creating other biases even less under control than the current ones.
Distribution of names by geographic origin of holders and geographic position of ICANN registrars
The following table shows the differential between the distribution of Legacy TLDs and nTLDs by region of holders and by region of registrar groups. When this differential is negative, as in Africa, Latin America and Europe, it means that the names are registered by local holders via groups of registrars established in other ICANN regions. This may be the case when they go through local subsidiaries consolidated within the group in the group’s country, but also when they use resellers working with these groups, or when a proxy service is used or a system of “automatic domiciliation” in North America as practised by some major registrars.
Holders Registrars Delta Reg -
Holders Africa 1% 0% -1 Latin America & Caribbean
3% 1% -2
Asia-Pacific 18% 18% 0 Europe 23% 13% -10 North America 55% 68% +13
Weight of the ICANN regions in the stock of names registered under the .COM domain, Other
Legacy TLDs and nTLDs, by country of holders and of groups of registrars
The table unequivocally shows that the North American region siphons domain names registered in other regions of the world and in Europe in particular. Asia-Pacific is balanced, which could indicate that users in this region tend to favour local registrars and/or that the major US registrars still provide poor coverage of this region. The differential in both Africa and Latin America and the Caribbean is also to the advantage of North America.
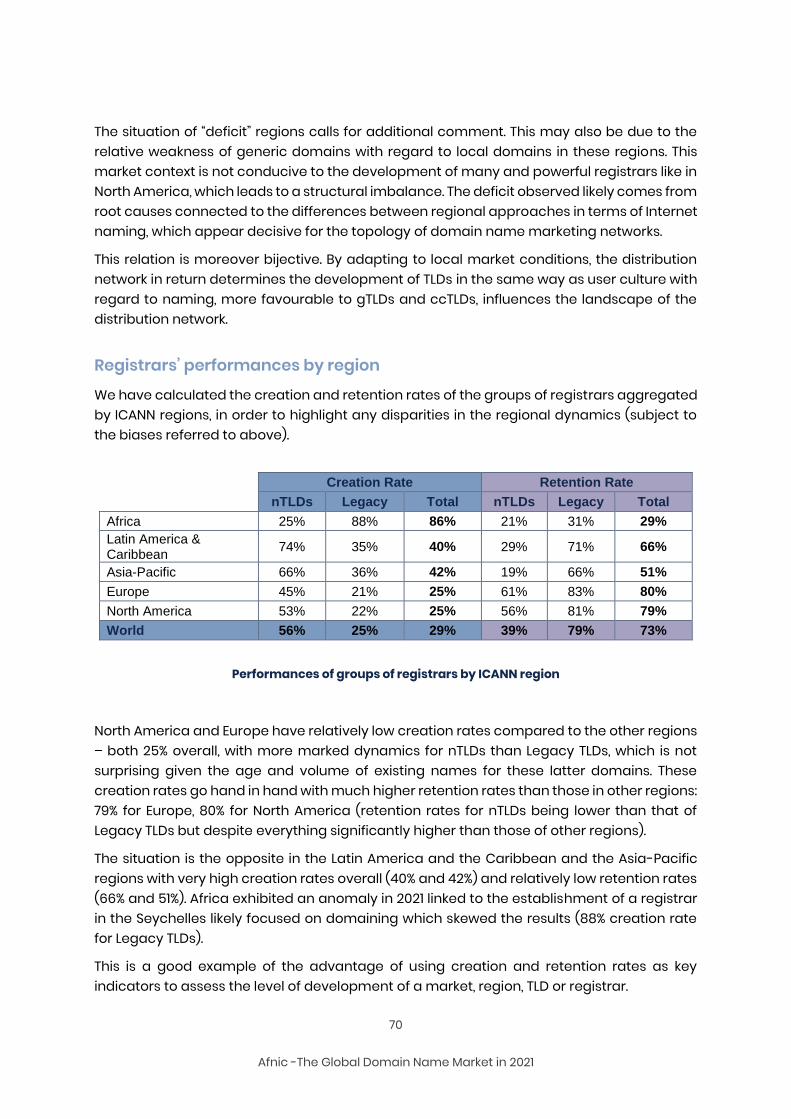
70
Afnic -The Global Domain Name Market in 2021
The situation of “deficit” regions calls for additional comment. This may also be due to the relative weakness of generic domains with regard to local domains in these regions. This market context is not conducive to the development of many and powerful registrars like in North America, which leads to a structural imbalance. The deficit observed likely comes from root causes connected to the differences between regional approaches in terms of Internet naming, which appear decisive for the topology of domain name marketing networks.
This relation is moreover bijective. By adapting to local market conditions, the distribution network in return determines the development of TLDs in the same way as user culture with regard to naming, more favourable to gTLDs and ccTLDs, influences the landscape of the distribution network.
Registrars’ performances by region
We have calculated the creation and retention rates of the groups of registrars aggregated by ICANN regions, in order to highlight any disparities in the regional dynamics (subject to the biases referred to above).
Creation Rate Retention Rate
nTLDs Legacy Total nTLDs Legacy Total
Africa 25% 88% 86% 21% 31% 29%
Latin America & Caribbean
74% 35% 40% 29% 71% 66%
Asia-Pacific 66% 36% 42% 19% 66% 51%
Europe 45% 21% 25% 61% 83% 80%
North America 53% 22% 25% 56% 81% 79%
World 56% 25% 29% 39% 79% 73%
Performances of groups of registrars by ICANN region
North America and Europe have relatively low creation rates compared to the other regions – both 25% overall, with more marked dynamics for nTLDs than Legacy TLDs, which is not surprising given the age and volume of existing names for these latter domains. These creation rates go hand in hand with much higher retention rates than those in other regions: 79% for Europe, 80% for North America (retention rates for nTLDs being lower than that of Legacy TLDs but despite everything significantly higher than those of other regions).
The situation is the opposite in the Latin America and the Caribbean and the Asia-Pacific regions with very high creation rates overall (40% and 42%) and relatively low retention rates (66% and 51%). Africa exhibited an anomaly in 2021 linked to the establishment of a registrar in the Seychelles likely focused on domaining which skewed the results (88% creation rate for Legacy TLDs).
This is a good example of the advantage of using creation and retention rates as key indicators to assess the level of development of a market, region, TLD or registrar.
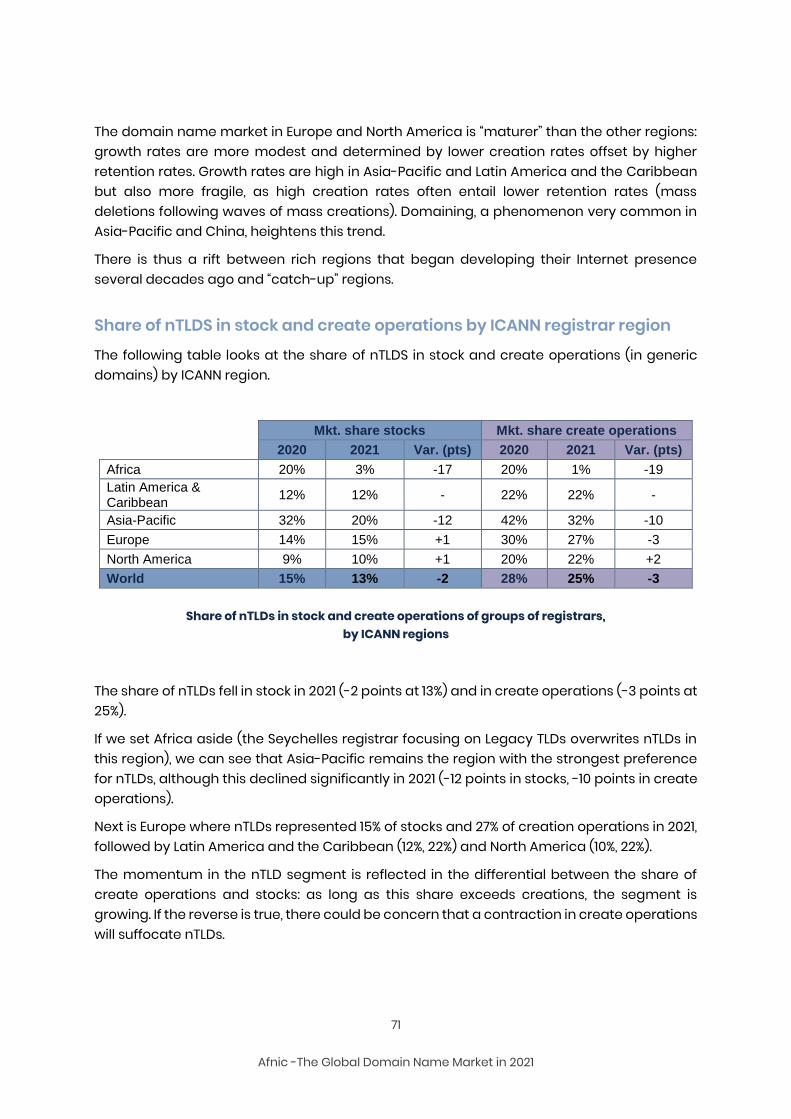
71
Afnic -The Global Domain Name Market in 2021
The domain name market in Europe and North America is “maturer” than the other regions: growth rates are more modest and determined by lower creation rates offset by higher retention rates. Growth rates are high in Asia-Pacific and Latin America and the Caribbean but also more fragile, as high creation rates often entail lower retention rates (mass deletions following waves of mass creations). Domaining, a phenomenon very common in Asia-Pacific and China, heightens this trend.
There is thus a rift between rich regions that began developing their Internet presence several decades ago and “catch-up” regions.
Share of nTLDS in stock and create operations by ICANN registrar region
The following table looks at the share of nTLDS in stock and create operations (in generic domains) by ICANN region.
Mkt. share stocks Mkt. share create operations
2020 2021 Var. (pts) 2020 2021 Var. (pts)
Africa 20% 3% -17 20% 1% -19
Latin America & Caribbean
12% 12% - 22% 22% -
Asia-Pacific 32% 20% -12 42% 32% -10
Europe 14% 15% +1 30% 27% -3
North America 9% 10% +1 20% 22% +2
World 15% 13% -2 28% 25% -3
Share of nTLDs in stock and create operations of groups of registrars,
by ICANN regions
The share of nTLDs fell in stock in 2021 (-2 points at 13%) and in create operations (-3 points at 25%).
If we set Africa aside (the Seychelles registrar focusing on Legacy TLDs overwrites nTLDs in this region), we can see that Asia-Pacific remains the region with the strongest preference for nTLDs, although this declined significantly in 2021 (-12 points in stocks, -10 points in create operations).
Next is Europe where nTLDs represented 15% of stocks and 27% of creation operations in 2021, followed by Latin America and the Caribbean (12%, 22%) and North America (10%, 22%).
The momentum in the nTLD segment is reflected in the differential between the share of create operations and stocks: as long as this share exceeds creations, the segment is growing. If the reverse is true, there could be concern that a contraction in create operations will suffocate nTLDs.
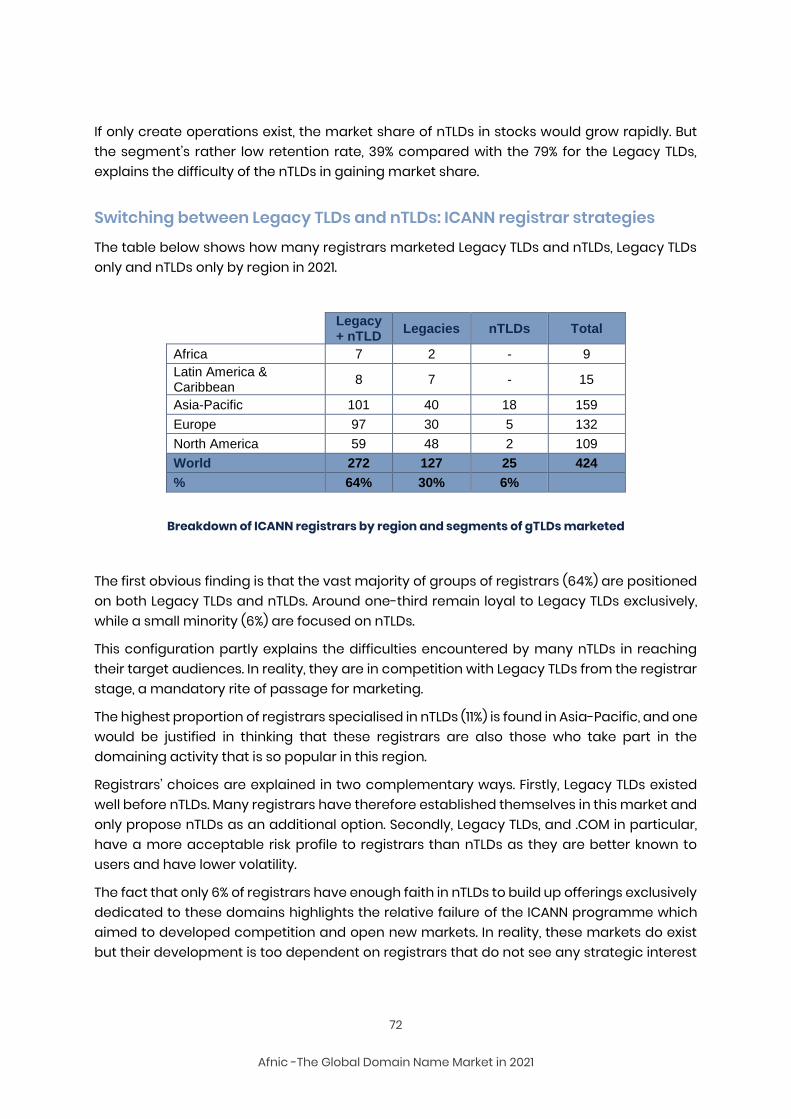
72
Afnic -The Global Domain Name Market in 2021
If only create operations exist, the market share of nTLDs in stocks would grow rapidly. But the segment’s rather low retention rate, 39% compared with the 79% for the Legacy TLDs, explains the difficulty of the nTLDs in gaining market share.
Switching between Legacy TLDs and nTLDs: ICANN registrar strategies
The table below shows how many registrars marketed Legacy TLDs and nTLDs, Legacy TLDs only and nTLDs only by region in 2021.
Legacy + nTLD
Legacies nTLDs Total
Africa 7 2 - 9
Latin America & Caribbean
8 7 - 15
Asia-Pacific 101 40 18 159
Europe 97 30 5 132
North America 59 48 2 109
World 272 127 25 424
% 64% 30% 6%
Breakdown of ICANN registrars by region and segments of gTLDs marketed
The first obvious finding is that the vast majority of groups of registrars (64%) are positioned on both Legacy TLDs and nTLDs. Around one-third remain loyal to Legacy TLDs exclusively, while a small minority (6%) are focused on nTLDs.
This configuration partly explains the difficulties encountered by many nTLDs in reaching their target audiences. In reality, they are in competition with Legacy TLDs from the registrar stage, a mandatory rite of passage for marketing.
The highest proportion of registrars specialised in nTLDs (11%) is found in Asia-Pacific, and one would be justified in thinking that these registrars are also those who take part in the domaining activity that is so popular in this region.
Registrars’ choices are explained in two complementary ways. Firstly, Legacy TLDs existed well before nTLDs. Many registrars have therefore established themselves in this market and only propose nTLDs as an additional option. Secondly, Legacy TLDs, and .COM in particular, have a more acceptable risk profile to registrars than nTLDs as they are better known to users and have lower volatility.
The fact that only 6% of registrars have enough faith in nTLDs to build up offerings exclusively dedicated to these domains highlights the relative failure of the ICANN programme which aimed to developed competition and open new markets. In reality, these markets do exist but their development is too dependent on registrars that do not see any strategic interest
73
Afnic -The Global Domain Name Market in 2021
in cooperating with them and that prefer to limit their risks by continuing to maintain the .COM momentum.
The scheduled price increase of the .COM domain could alter this state of affairs in the long term. But the differential between the $8.39 of the .COM and the prices charged by many nTLD registries to balance their books is such that this evolution will likely be very slow in coming about. In the short term, the increase in .COM prices will benefit ccTLDs to a much greater extent than nTLDs.
7.9. Lessons learned Among the lessons drawn from this 2021 study of the regional dynamics of all TLDs combined, we would highlight the following:
The nature of the biases identified (proxies) is revealing in itself. Due to the dematerialisation of the market, the country of origin is difficult to discern precisely, especially for gTLDs (Legacy, Others and nTLDs).
The Asia-Pacific region suffered the most in 2021 (-17%), impacted by the .CN and .TW losses and by the purges of the main speculative nTLDs that were popular with Asian domainers prior to the COVID crisis.
Europe (+2%) and North America, buoyed by the .COM domain (+4%), have returned to positive growth.
Latin America and the Caribbean have seen a slight decline (-2%), but this is due to the deletion of numerous names by one or more holders in Panama (likely domainers positioned on the nTLDs). This negative turnaround therefore does not reflect the actual positive dynamic of the region.
ccTLDs remain dominant in all of the world’s regions with the exception of North America where the .COM domain is the uncontested leader.
The regional differences are reflected by creation rates and retention rates echoing varying dynamics and levels of maturity as well as distinct preferences for ccTLDs, Legacy TLDs and nTLDs.
The topology of the registrar networks is based around user preferences, which it tends to cement in return; the difficulties experienced by many nTLDs are the consequence of this lack of market fluidity.
The .COM domain has complex facets. On the one hand, it is thriving and continues to siphon the crux of demand to the detriment of its generic “competitors” relegated to the shadows. And on the other hand, it is struggling to assert itself in the face of ccTLDs, either
74
Afnic -The Global Domain Name Market in 2021
because local preferences favour the latter or because the distribution network with few large registrars does not allow it to gain sufficient market power to “inundate” some countries. The .COM domain therefore depends largely on the North American market, which is itself reaching maturity and remains subject to the US economic climate. Too many analysts have predicted the “saturation” of the .COM domain in vain for the past twenty years for it to be possible to call it “an idol with feet of clay”, but its situation may be less optimistic, strategically speaking, than it seems. What’s more, the price increases initiated in 2021 will shift the lines, even though this is a slow process.
Indeed, the impact of the “topology” of the distribution network can be felt in all segments
and all regions. In North America, in Asia-Pacific, in Europe to a somewhat lesser extent and in Latin America and Africa to a much lesser extent, the presence of major ICANN registrars favours the dissemination of generic TLDs. In places where these registrars are less present, or smaller, the market power of the generic TLDs is comparable with or less than that of the local TLDs offered by registrars that are too small to be ICANN registrars but more numerous and providing better territorial coverage. Here we can see just how important it is for registrars to develop their networks of resellers.
These “market topology” factors were indeed added to cultural factors. Generic TLDs dominate in North America, which is what led to the emergence of very large ICANN registrars. In the other regions, preferences are fairly clearly for ccTLDs, which favours the local registrars though at the same time it forces them to offer local TLDs themselves.
The nTLD segment, and especially the “Penny TLDs” with their very specific dynamics, are turning the trend in Asia-Pacific. This region is slightly atypical as it combines user preferences for ccTLDs and the appetence of major domainers for nTLDs. Like 2020, 2021 saw this segment and this region particularly affected, but this was linked to the circumstances. The underlying trend was not called into question.
75
Afnic -The Global Domain Name Market in 2021
8. Highlights of 2021 and early 2022 The shifts in the market observed since 2015 continued in 2021 at the same intensity particularly for buyouts of nTLDs.
The fundamentals remain unchanged:
Renewed growth but uncertainty as to the future leading to external growth strategies (achieving a critical mass, spreading risks, acquiring new key success factors) and innovation (new key success factors, diversification)
The role of financiers as external equity providers on the market remains vital: in comparison with Verisign and its handsome profit margins, the main registrars sometimes struggle and are only able to finance acquisitions by resorting to the market.
One example is CentralNic, whose dazzling development (revenue doubling practically every year) is due to its stock market listing, the regular issuance of bonds and debt representing 70% of its total assets (figures at 30 September 2021), which is still modest with regard to the situation of GoDaddy (global debt of 99% of total assets) and Tucows (79%). With 49%, United Internet AG is the least in debt of the major players listed on stock market.
The lack of a clear outlook regarding the second ICANN round prevents players from envisaging a situation where the market is structurally expansionary, which no doubt increases the attraction of buying out domains.
Added to these contextual factors are the constant efforts being made as regards innovations, structured around some promising pathways but which have not as of yet resulted in truly “disruptive” offerings.
8.1. A TLD market that is still active The movements identified in 2021 and in the first quarter of 2022 are referred to hereunder. They do not constitute an exhaustive list of sales and changes of back-end operators, since we report here only such transactions as were published or that we have detected through our monitoring.
8.1.1. Changes in registries
Buyouts of nTLDs were particularly vigorous in 2021. We noted the following transactions that were published:
76
Afnic -The Global Domain Name Market in 2021
UNR (formerly Uniregistry) sold 23 nTLDs at auction in April 2021 for over $40 million. The nTLDs concerned are: .AUDIO, .BLACKFRIDAY, .CHRISTMAS, .CLICK, .COUNTRY, .DIET, .FLOWERS, .GAME, .GUITARS, .HELP, .HIPHOP, .HIV, .HOSTING, .JUEGOS, .LINK, .LLP, .LOL, .MOM, .PHOTO, .PICS, .PROPERTY, .SEXY, .TATTOO. Of these, 10 were acquired by DotXYZ (transaction approved by ICANN in Q1 2022): .AUDIO, .CHRISTMAS, .DIET, .FLOWERS, .GAME, .GUITARS, .HOSTING, .LOL, .MOM and .PICS.
DotXYZ also acquired .TICKETS ShortDot acquired .SBS. This company is also the holder of .ICU, .BOND, .CYOU and .CFD
Donuts (Ethos Capital) acquired .MARKETS, .TRADING, .FOREX, .BROKER.
CentralNic acquired .CASE and .RUHR
PIR (the .ORG registry) acquired .CHARITY, .FOUNDATION and .GIVES from Donuts and
.GIVING from an outside party.
8.1.2. Back-end operators
Changes in back-end registry operators (excluding transactions) were rarer than in 2020:
InternetNZ announced that the .NZ domain is now managed by the CIRA Fury
platform
CentralNic is now the back-end operator of .LONDON (outgoing operator: Nominet)
GoDaddy has obtained the back-end contract for .TV (Tuvalu) up till now managed by Verisign, under financial conditions that were deemed unacceptable by the Tuvalu authorities.
The domain profiles in comparison with this delegated management market for top-level domains remain unchanged with regard to those described in the previous editions of this Observatory:
the major generic TLDs like .COM, .NET, .ORG, .BIZ and .INFO are practically unmovable, although their management is covered by contracts between ICANN and the registries which periodically come up for renewal;
the major ccTLDs are in a stable situation fairly comparable to the domains of the previous category, but being more closely controlled by their governments, mostly follow
77
Afnic -The Global Domain Name Market in 2021
the principles of a cost management approach. The price differential between Legacy TLDs and ccTLDs will therefore probably continue to widen in the coming years, benefiting the ccTLDs;
geo-TLDs remain attached to the regions or cities that they designate. They are therefore unlikely to be sold or transferred, but may well change back-end operator;
.BRAND names are also linked to their registries when they are used, but they may also be sold and transformed into generic TLDs if their initial registries have not used them;
Generic nTLDs, regardless of size, are the most “volatile” in terms of both the level of sales/disposals and their back-end operation.
This segmentation can result in fairly differentiated profiles of back-end operating offerings, while we see a certain number of players attentive to the opportunities that could be presented in terms of straight acquisitions. The fragile financial position of many registries adds to this volatility.
8.2. Mergers and acquisitions: continuous consolidation, accompanied by financiers
Mergers and acquisitions, which have proliferated in our market for some years, are largely made possible by the flow of capital resulting from financial groups taking equity interests. This phenomenon continued in 2021/2022.
In Q1 2022, CentralNic issued €15 million of bonds to finance future acquisitions. Over the course of the year and in early 2022, it acquired the Chilean registrar NameAction and the German search engine Fireball, in addition to the TLDs previously mentioned.
GoDaddy raised $800 million to finance future acquisitions and acquired MMX (formerly Minds+Machines) and its 28 TLDs for $120 million, as well as .CLUB and .DESIGN. It is the first ICANN registrar to generate over $1 billion in revenues in a single quarter, a performance achieved in Q4 2021. In total, the 2021 revenues of GoDaddy stood at $3.8 billion, up 15% on 2020. At the end of 2021, the company’s market capitalisation was approximately $14 billion compared to $28 billion for Verisign. The company generated 67% of its turnover in the US. The Domain Name segment represented 46% of its revenues, the Hosting and Online Presence segment 36%, and the Business Applications segment 18%, steadily growing since 2013.
The Starboard investment fund acquired a 6.5% stake in GoDaddy (December 2021).
78
Afnic -The Global Domain Name Market in 2021
The Clearlake investment fund acquired the Endurance International group (Domain.com, Hostgator, BlueHost, Constant Contact, Reseller Club and Big Rock) for $3 million
SquareSpace (ICANN registrar) was listed on the New York stock market (code SQSP).
The remainder of Afilias after the transfer of the registry and BO activities to Donuts has been renamed Altanovo. The structure comprises the registrar 101Domain, DeviceAtlas (mobile phone software publishing) and Afilias Domains N°3 Ltd which made the application for the .IRISH domain.
The registrar TUCOWS acquired the BO technology of UNR (ex-Uniregistry).
DomainTools acquired Farsight Security, specialised in the collection and
monitoring of DNS traffic data.
MMX decided to opt out of listing and to abandon the .BUDAPEST domain.
DAN.com launched a network (Open Domain Distribution Network) designed to amass a potential stock of 30 million domains available for sale on the Second Marché. DAN.com will act as the integrator for this base to which partners interested in the resell of these names can connect: registrars, registries, market places, etc.
8.3. New services Confronted by a certain sluggishness in their environment, players in the domain name market have continued their efforts in terms of innovations and the search for diversification paths. Communication actions and launches of new solutions appear to have slowed in 2021, a likely consequence of the disruptions caused by the 2020 lockdowns.
We have endeavoured to group these burgeoning initiatives into a few major themes, mentioning various examples without claiming to be exhaustive.
8.3.1. Data, Security and Monitoring
We are increasingly seeing the development of offerings positioned at the confluence of issues surrounding Data (particularly WHOIS), Security and (Brand) Monitoring.
SIDN describes a new hacking technique, “smishing”, consisting in conducting phishing campaigns by SMS
79
Afnic -The Global Domain Name Market in 2021
8.3.2.Innovations brought to market or in preparation
2021 saw the emergence of certain innovations or developments in the organisation of the main players:
GoDaddy launched its GoDaddy Corporate Domains division for key accounts. The
group is clearly positioning itself as a major 2nd round player since it also has a back-end division, GoDaddy Registry, created a few months ago from Neustar Registry.
CZ.NIC launched a new mobile application named “MojeID Klic”. This application is designed to enable MojeID users to access the public services accessible via the NIA (National Identification Authority) and replace the “mojeID Authenticator”.
8.3.3. Infrastructures
Google Cloud launched Cloud Domains, a centralised domain name management service via the Google Cloud Platform.
80
Afnic -The Global Domain Name Market in 2021
9. Conclusions and outlooks 2021 was marked by the end of the most acute period of the health crisis that overshadowed 2020. This “exit” was noticeable in the domain name industry as of mid-year for the majority of segments: as of Q2 for ccTLDs and Q3 for Legacy TLDs and nTLDs.
This return to normal can also be seen in annual growth rates, which are returning to their 2019 levels. Will the acceleration of the digital transition have a lasting effect on the market or will it turn out to be a sudden surge dictated by circumstances? The current impression is that it remains visible in ccTLDs more than Generic TLDs, but this phenomenon could fade out once and for all in 2022.
The health crisis acted as an “eye-opener” for certain aspects of the market. The downward spiral of the .CN and .TW domains, for example, has revealed their fragility and the fact that their volumes were caused by speculative practices rather than actual uses. Adjustments of this type are common, also affecting “Penny TLDs”, whether ccTLDs or nTLDs. As spectacular as these purges may be, they do not impact the actual market dynamics.
Strategic presence options
An analysis of market shares, whether at the level of TLDs, registrars or back-end operators, reveals that the domain name sector is divided between a handful of major players accounting for the majority of market shares and a spattering of small players which have four choices:
Implementing aggressive development strategies financed by financiers (debt, fundraising, stock market listing)
Staying in a niche market to protect their profitability Surviving until they are absorbed by a larger player Diversifying their revenue sources by developing new technologies, by “leaving” the
market or by partnering with external players
These different strategic choices are incidentally the same for the major players. In a slightly caricatural way perhaps, CentralNic is emblematic of the first, Verisign the second, and GoDaddy the fourth. A large number of small- and medium-sized players are forced to consider the third option whether they like it or not.
The process of concentration is set to continue
The process of concentration is thus set to continue at the TLD, back-end operator and registrar levels. Although it is supposed to promote competition, ICANN did not oppose the formation of the Donuts/Afilias group taken over by Ethos Capital, even though it currently manages or holds more than 50% of the nTLDs created since 2012.
This concentration phenomenon is likely the result of two worrying causes: on the one hand, the market is gradually suffocating due to a lack of fresh blood (which would be represented
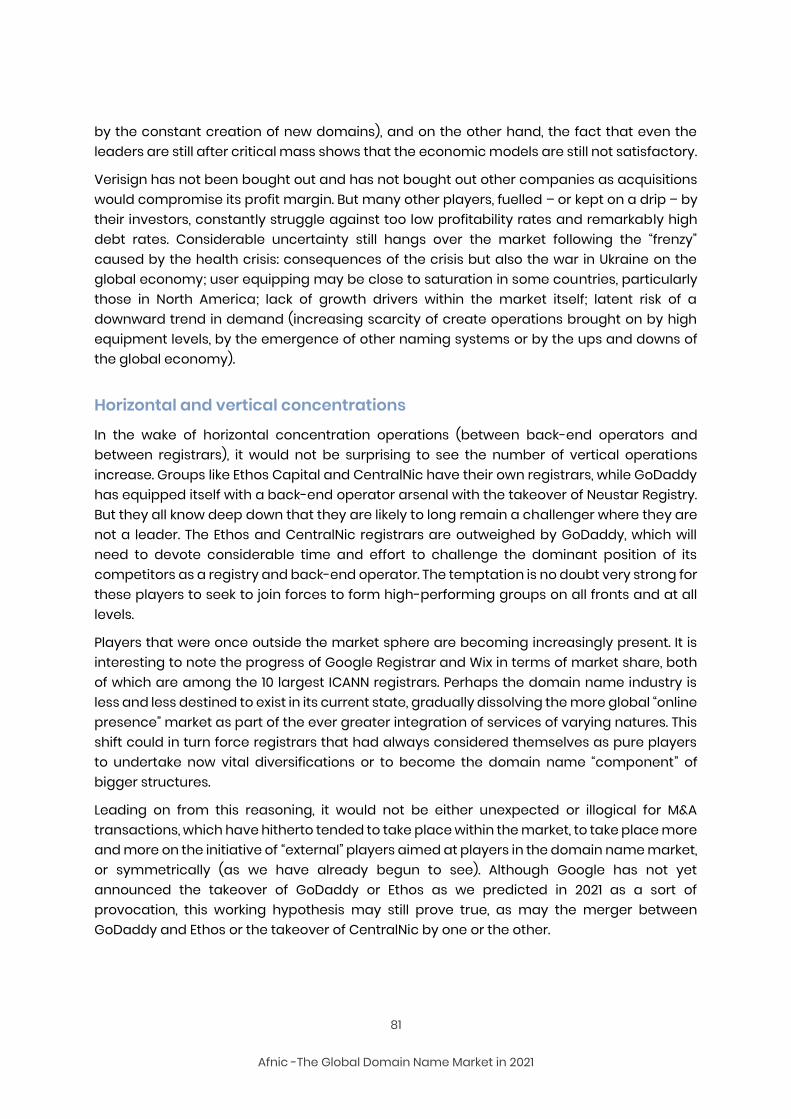
81
Afnic -The Global Domain Name Market in 2021
by the constant creation of new domains), and on the other hand, the fact that even the leaders are still after critical mass shows that the economic models are still not satisfactory.
Verisign has not been bought out and has not bought out other companies as acquisitions would compromise its profit margin. But many other players, fuelled – or kept on a drip – by their investors, constantly struggle against too low profitability rates and remarkably high debt rates. Considerable uncertainty still hangs over the market following the “frenzy” caused by the health crisis: consequences of the crisis but also the war in Ukraine on the global economy; user equipping may be close to saturation in some countries, particularly those in North America; lack of growth drivers within the market itself; latent risk of a downward trend in demand (increasing scarcity of create operations brought on by high equipment levels, by the emergence of other naming systems or by the ups and downs of the global economy).
Horizontal and vertical concentrations
In the wake of horizontal concentration operations (between back-end operators and between registrars), it would not be surprising to see the number of vertical operations increase. Groups like Ethos Capital and CentralNic have their own registrars, while GoDaddy has equipped itself with a back-end operator arsenal with the takeover of Neustar Registry. But they all know deep down that they are likely to long remain a challenger where they are not a leader. The Ethos and CentralNic registrars are outweighed by GoDaddy, which will need to devote considerable time and effort to challenge the dominant position of its competitors as a registry and back-end operator. The temptation is no doubt very strong for these players to seek to join forces to form high-performing groups on all fronts and at all levels.
Players that were once outside the market sphere are becoming increasingly present. It is interesting to note the progress of Google Registrar and Wix in terms of market share, both of which are among the 10 largest ICANN registrars. Perhaps the domain name industry is less and less destined to exist in its current state, gradually dissolving the more global “online presence” market as part of the ever greater integration of services of varying natures. This shift could in turn force registrars that had always considered themselves as pure players to undertake now vital diversifications or to become the domain name “component” of bigger structures.
Leading on from this reasoning, it would not be either unexpected or illogical for M&A transactions, which have hitherto tended to take place within the market, to take place more and more on the initiative of “external” players aimed at players in the domain name market, or symmetrically (as we have already begun to see). Although Google has not yet announced the takeover of GoDaddy or Ethos as we predicted in 2021 as a sort of provocation, this working hypothesis may still prove true, as may the merger between GoDaddy and Ethos or the takeover of CentralNic by one or the other.
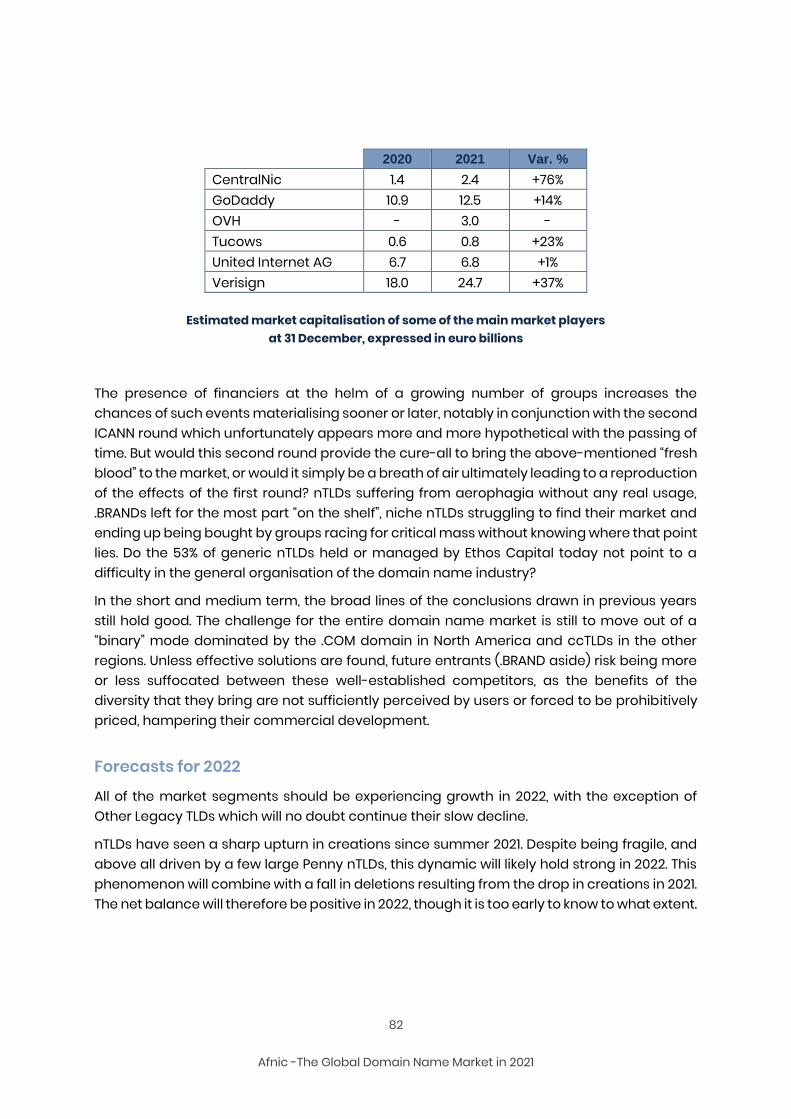
82
Afnic -The Global Domain Name Market in 2021
2020 2021 Var. %
CentralNic 1.4 2.4 +76% GoDaddy 10.9 12.5 +14% OVH - 3.0 - Tucows 0.6 0.8 +23% United Internet AG 6.7 6.8 +1% Verisign 18.0 24.7 +37%
Estimated market capitalisation of some of the main market players
at 31 December, expressed in euro billions
The presence of financiers at the helm of a growing number of groups increases the chances of such events materialising sooner or later, notably in conjunction with the second ICANN round which unfortunately appears more and more hypothetical with the passing of time. But would this second round provide the cure-all to bring the above-mentioned “fresh blood” to the market, or would it simply be a breath of air ultimately leading to a reproduction of the effects of the first round? nTLDs suffering from aerophagia without any real usage, .BRANDs left for the most part “on the shelf”, niche nTLDs struggling to find their market and ending up being bought by groups racing for critical mass without knowing where that point lies. Do the 53% of generic nTLDs held or managed by Ethos Capital today not point to a difficulty in the general organisation of the domain name industry?
In the short and medium term, the broad lines of the conclusions drawn in previous years still hold good. The challenge for the entire domain name market is still to move out of a “binary” mode dominated by the .COM domain in North America and ccTLDs in the other regions. Unless effective solutions are found, future entrants (.BRAND aside) risk being more or less suffocated between these well-established competitors, as the benefits of the diversity that they bring are not sufficiently perceived by users or forced to be prohibitively priced, hampering their commercial development.
Forecasts for 2022
All of the market segments should be experiencing growth in 2022, with the exception of Other Legacy TLDs which will no doubt continue their slow decline.
nTLDs have seen a sharp upturn in creations since summer 2021. Despite being fragile, and above all driven by a few large Penny nTLDs, this dynamic will likely hold strong in 2022. This phenomenon will combine with a fall in deletions resulting from the drop in creations in 2021. The net balance will therefore be positive in 2022, though it is too early to know to what extent.
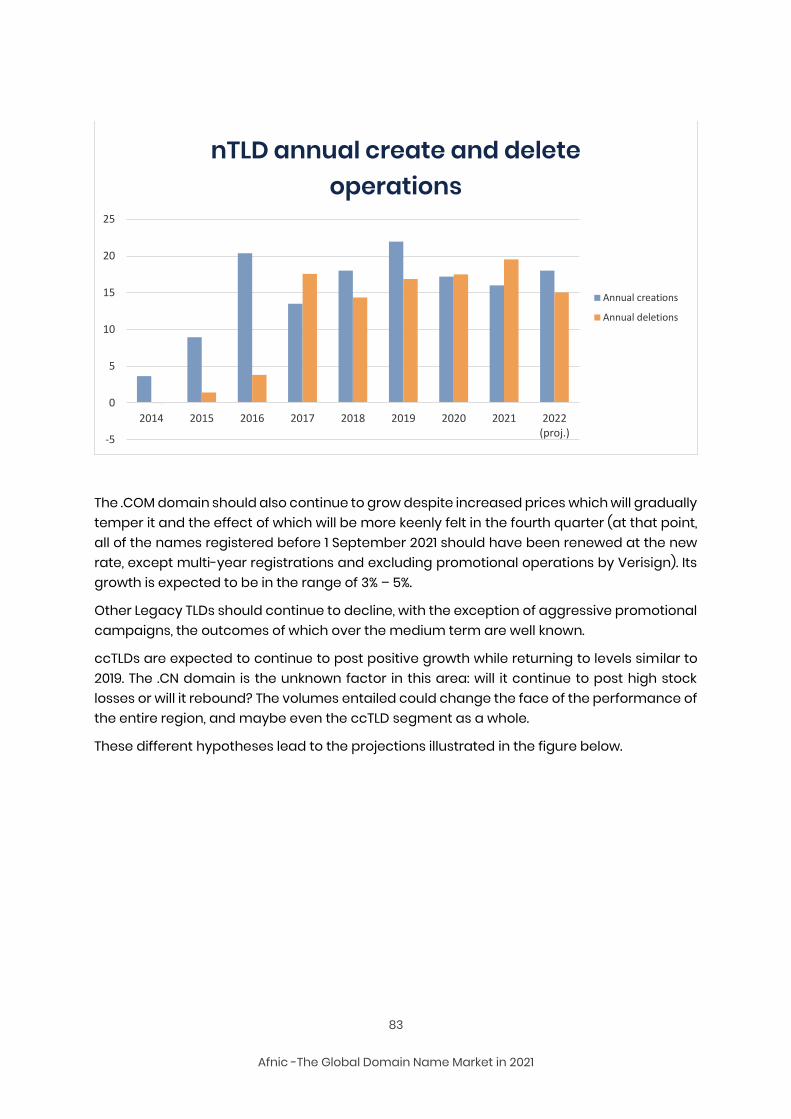
83
Afnic -The Global Domain Name Market in 2021
The .COM domain should also continue to grow despite increased prices which will gradually temper it and the effect of which will be more keenly felt in the fourth quarter (at that point, all of the names registered before 1 September 2021 should have been renewed at the new rate, except multi-year registrations and excluding promotional operations by Verisign). Its growth is expected to be in the range of 3% – 5%.
Other Legacy TLDs should continue to decline, with the exception of aggressive promotional campaigns, the outcomes of which over the medium term are well known.
ccTLDs are expected to continue to post positive growth while returning to levels similar to 2019. The .CN domain is the unknown factor in this area: will it continue to post high stock losses or will it rebound? The volumes entailed could change the face of the performance of the entire region, and maybe even the ccTLD segment as a whole.
These different hypotheses lead to the projections illustrated in the figure below.
-5
0
5
10
15
20
25
2014 2015 2016 2017 2018 2019 2020 2021 2022(proj.)
nTLD annual create and delete operations
Annual creations
Annual deletions
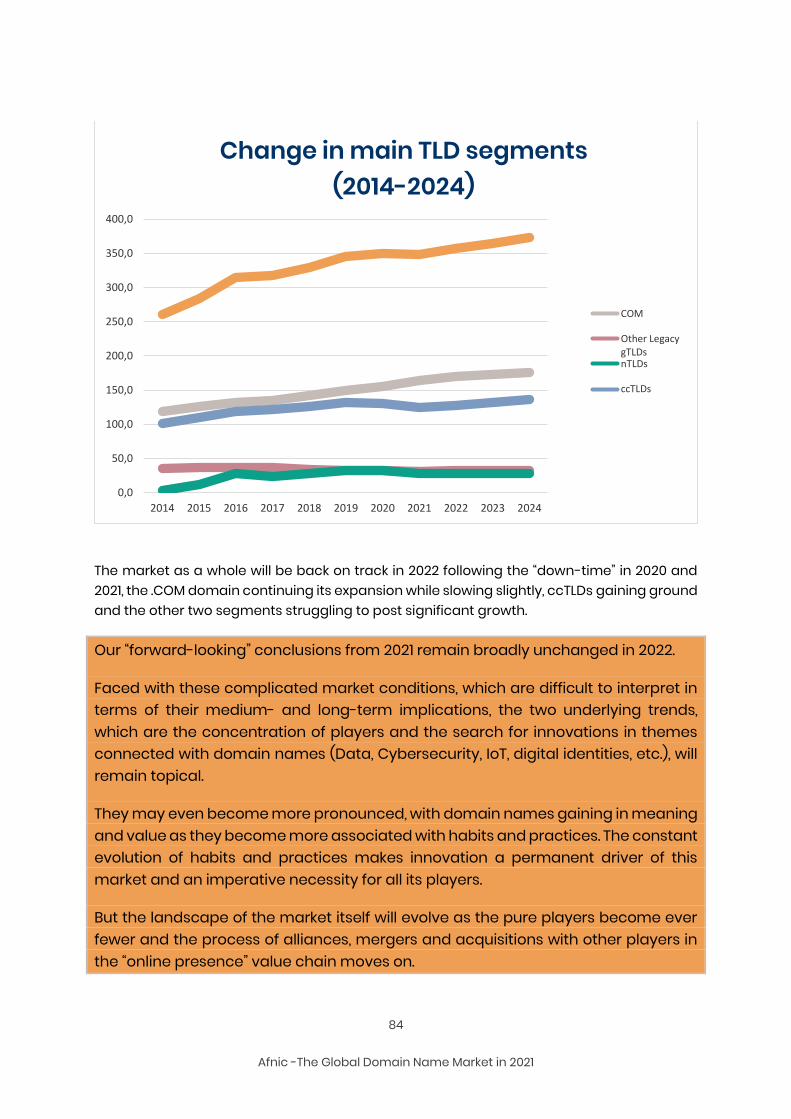
84
Afnic -The Global Domain Name Market in 2021
The market as a whole will be back on track in 2022 following the “down-time” in 2020 and 2021, the .COM domain continuing its expansion while slowing slightly, ccTLDs gaining ground and the other two segments struggling to post significant growth.
Our “forward-looking” conclusions from 2021 remain broadly unchanged in 2022.
Faced with these complicated market conditions, which are difficult to interpret in terms of their medium- and long-term implications, the two underlying trends, which are the concentration of players and the search for innovations in themes connected with domain names (Data, Cybersecurity, IoT, digital identities, etc.), will remain topical.
They may even become more pronounced, with domain names gaining in meaning and value as they become more associated with habits and practices. The constant evolution of habits and practices makes innovation a permanent driver of this market and an imperative necessity for all its players.
But the landscape of the market itself will evolve as the pure players become ever fewer and the process of alliances, mergers and acquisitions with other players in the “online presence” value chain moves on.
0,0
50,0
100,0
150,0
200,0
250,0
300,0
350,0
400,0
2014 2015 2016 2017 2018 2019 2020 2021 2022 2023 2024
Change in main TLD segments (2014-2024)
COM
Other LegacygTLDsnTLDs
ccTLDs
Related Documents