The Global Diamond Industry 2020–21 Brilliant under pressure

Welcome message from author
This document is posted to help you gain knowledge. Please leave a comment to let me know what you think about it! Share it to your friends and learn new things together.
Transcript

The Global Diamond Industry 2020–21
Brilliant under pressure

Copyright © 2021 Bain & Company, Inc. and AWDC. All rights reserved.
About the authors and acknowledgments
Olya Linde is a partner with Bain & Company’s Energy & Natural Resources practice and is based in Moscow. You can contact her at [email protected].
Sophia Kravchenko is a senior manager with Bain & Company’s Energy & Natural Resources practice and is based in Moscow. You can contact her at [email protected].
Ari Epstein is CEO at AWDC and is based in Antwerp. You can contact him at [email protected].
Karen Rentmeesters is a senior manager of communications at AWDC and is based in Antwerp. You can contact her at [email protected].
This report is a joint effort between Bain & Company and AWDC. The authors extend their gratitude to all those who contributed to it, especially to the global Bain team, including Viktor Subbotin, Egor Fetisov, Arina Lapina, Anton Matalygin, Julia Gavrilova, Masha Shiroyan, and Bain’s Mining and Luxury Goods practices.
This work was commissioned by AWDC and prepared by Bain & Company and AWDC. It is based on secondary market research, analysis of financial information available or provided to Bain & Company and AWDC, and a range of interviews with industry participants. Bain & Company and AWDC have not independently verified any such information provided or available to Bain and AWDC and make no representation or warranty, express or implied, that such information is accurate or complete. Projected market and financial information, analyses and conclusions contained herein are based (unless sourced otherwise) on the information described above and on Bain & Company’s and AWDC’s judgment, and should not be construed as definitive forecasts or guarantees of future performance or results. The information and analysis herein does not constitute advice of any kind and is not intended to be used for investment purposes. Neither Bain & Company nor AWDC nor any of their subsidiaries or their respective officers, directors, shareholders, employees or agents accept any responsibility or liability with respect to the use of or reliance on any information or analysis contained in this document. This document is copyright of Bain & Company, Inc., and AWDC and may not be published, copied or duplicated, in whole or in part, without the written permission of Bain & Company and AWDC.
Media contacts
Dan PinkneyBain & CompanyPhone: +1 646 562 [email protected]
Karen RentmeestersAWDCPhone: +32 49 783 [email protected]
The Global Diamond Report 2020–21
3
Contents
Note to readers . . . . . . . . . . . . . . . . . . . . . . . . . . . . . . . . . . . . . . . . . . pg. 4
1. Recent developments in the diamond industry . . . . . . . . . . . . . . . . . . . . . pg. 8
2. Rough diamond production . . . . . . . . . . . . . . . . . . . . . . . . . . . . . . . . . pg. 14
3. Cutting and polishing . . . . . . . . . . . . . . . . . . . . . . . . . . . . . . . . . . . . . pg. 20
4. Diamond jewelry retail . . . . . . . . . . . . . . . . . . . . . . . . . . . . . . . . . . . . pg. 24
5. Key industry trends and effects of Covid-19 . . . . . . . . . . . . . . . . . . . . . . pg. 30
6. Updated supply and demand model . . . . . . . . . . . . . . . . . . . . . . . . . . . pg. 48

The Global Diamond Report 2020–21
4
Note to readers
Welcome to the tenth annual report on the global diamond industry, prepared by the Antwerp World Diamond Centre (AWDC) and Bain & Company. This year’s edition covers industry performance in 2019, effects of the Covid-19 pandemic in 2020 and an update on consumer preferences and attitudes. We also assess potential re-covery scenarios in 2021 and beyond.
The report begins with key developments along the value chain, including industry trends that were accentuat-ed or accelerated by the global pandemic. We review factors that influenced rough diamond production and sales, midstream performance, and global diamond jewelry demand in major markets.
We updated our long-term outlook for the diamond industry through 2030. The 2030 supply-demand forecast considers announced production plans, recent changes in mining operations, potential additional sources of supply, expected changes in global and regional macroeconomic parameters, and potential impacts from lab-grown diamonds.
Key points are summarized below:
The diamond industry suffered during the Covid-19 crisis but fared better than the personal luxury market overall. Across the value chain, revenues decreased by 15% to 33%. Operating margins followed with a de-cline of 1 p.p. to 22 p.p. Despite the significant drops, $64 billion diamond jewelry retail performed better than the personal luxury market, which contracted by 22% at current exchange rates in US dollars.
Rough diamond production continued its downward trend, falling to 111 million carats. After peaking at 152 million carats in 2017, rough diamond production has declined by about 5% per year. In 2020, produc-tion decreased by 20% compared to 2019 levels. Notwithstanding changes, the mix of diamonds remained largely constant, with medium and large diamonds accounting for 25% of production volume in carats but around 70% to 80% in value in US dollars.
The mining response at the start of the Covid-19 crisis helped midstream players weather the worst of the storm. Major miners canceled sales in the first half of 2020 and allowed clients to postpone purchases. Up-stream inventories of rough diamonds grew to 65 million carats by the end of third quarter, before decreas-ing on the strength of the fourth-quarter sales to 52 million carats (+17% to end of 2019 inventory level).
Despite challenges in 2019, midstream players finished the year on a strong note. The midstream started 2020 with 9% less inventory, healthier financial balance sheets and a more consolidated market structure. In 2020, midstream players cleared existing stockpiles even further and reduced inventories by 22%.
The midstream segment lowered its debt by half compared to its peak level in 2013; debt levels decreased to $8 billion in 2020. Financing decreased because of lower trading levels and a higher reliance on self- financing. Larger midstream companies with transparent operations continued to access financing from big banks, while alternative financing options (e.g., peer-to-peer financing) emerged for smaller players. Large midstream companies, banks in the Middle East and specialized funds were set up to provide addi-tional financing in the sector. Deleveraging is expected to speed up restructuring and consolidation of the midstream and to create long-term benefits across the pipeline.
The Global Diamond Report 2020–21
5
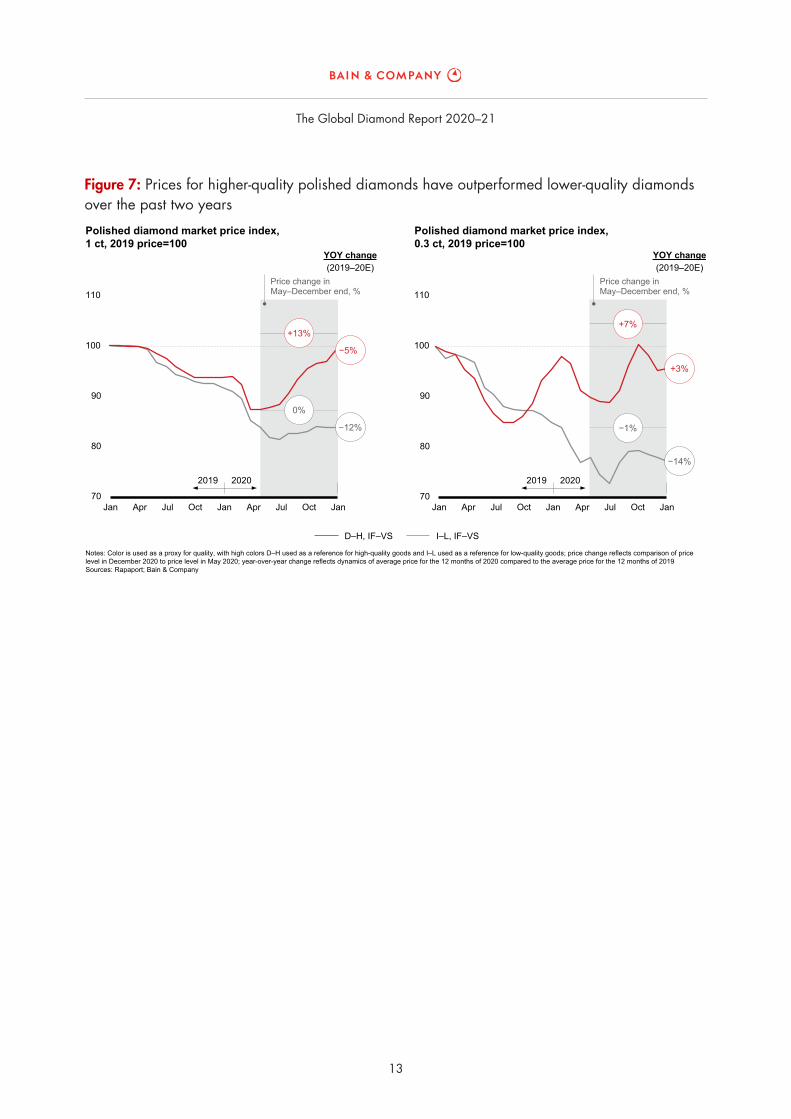
Prices for rough and polished diamonds continued to feel pressure. Rough and polished diamond prices began trending downward in 2018, then decreased by 7% and 4%, respectively, in 2019, as a result of over-stocking in the midstream. In 2020, rough and polished prices fell by 11% and 3%, respectively. Divergence between rough and polished price dynamics helped midstream players post record-high operating margins in 2020. Higher-quality diamonds recovered faster, ending in positive territory compared to the start of 2020 and recovering most of their price drop from the past two years.
Lockdowns, travel restrictions and economic uncertainty contributed to lower diamond jewelry sales. Sales were −15% in 2020, with most of the decline happening in the first and second quarters. In addition, de-mand for diamond jewelry became more localized due to travel restrictions. Demand returned during the fourth quarter, culminating in a strong holiday season across the globe. Once fully tallied, we expect 2020 sales to be better than analysts predicted based on the first three quarters. Preliminary estimates show growing consumer confidence and an increase in pre-holiday retail activities.
Consumers continue to value diamond jewelry as a desirable gift and a key element of marriage. In a cus-tomer sentiment survey issued by Bain in 2020, US consumers said jewelry and watches are among the top four gifts they would like to receive; consumers in China and India ranked them in the top two. In the US, China and India, 60% to 70% of respondents believe diamonds are an essential part of a marriage en-gagement. After the pandemic, 75% to 80% of consumers said they intend to spend the same amount or more on diamond jewelry than they would have before the crisis. This indicates a strong, ongoing emotion-al connection with the diamond story.
Covid-19-related travel restrictions localized jewelry consumption in 2020. The biggest winner was China. Because Chinese consumers had limited opportunities to travel, they turned to local retailers and Hainan duty-free stores for luxury and premium purchases. Major local chains reported double-digit growth in sales in the second half of the year. In addition, major retailers are expanding their retail footprints, partic-ularly into lower-tier cities where the middle class and wealth are growing. The repatriation trend is expect-ed to subside in the long term, once global travel resumes, but new consumers in lower-tier cities will pro-vide continued demand for jewelry and drive further growth in China.
Covid-19 accelerated preexisting trends that have been shaping the diamond industry:
The diamond value chain is becoming more digital, although brick-and-mortar stores still have value. A digital pipeline for business-to-business (B2B) commerce emerged during the pandemic as several plat-forms (e.g., UNI diamonds, Get-Diamonds, Clara Diamond Solutions) started or expanded trading of rough and polished diamonds. Business-to-consumer e-commerce also grew in 2020, with about 20% of retail sales occurring online. Major diamond jewelry retailers posted up to 60% to 70% year-over-year sales growth in their online channels. Despite the increase in online sales and a strong preference for online re-search before making purchases, nearly all consumers (90%−95%) still prefer to buy diamonds in brick-and-mortar stores. Consumers value the opportunity to see and touch jewelry, and they benefit from in-person advice and other personal services. The online share of diamond jewelry sales is still low com-pared to other luxury and consumer products. To create a meaningful shift toward digital channels, the in-dustry needs to address several consumer concerns. It needs to improve trust (e.g., by providing diamond certificates, warranties, reviews), enhance convenience (e.g., implementing free delivery and returns or “try before paying” programs) and provide additional discounts and promotions for online purchases.

The Global Diamond Report 2020–21
6
Diamond jewelry marketing needs to evolve to meet new challenges, like generational shifts and increased competition for consumers’ share of wallet. Future marketing campaigns should connect diamonds to ad-ditional life moments, expanding the market (and consumers’ emotional connection to diamonds) beyond marriage. The diamond story needs to become more personal and engaging, which marketers can accom-plish through storytelling, social media and customization (e.g., products, offers and pricing). Retailers need to invest in omnichannel and phygital* capabilities to match new purchasing preferences, and manu-facturers should promote sustainability practices that consumers care about. Industrywide, marketing ef-forts need to be reinvented and increased. Despite current efforts, diamond marketing spend is roughly 1% to 2% of industry revenue, which lags the average luxury goods marketing spend of 6% to 8%.
Continued advances in technology contributed to double-digit growth in production and lower retail prices for lab-grown diamonds in 2019 and 2020. The price differential between natural and lab-grown fancy color dia-monds is particularly striking—up to 10 times. In addition to independent lab-grown manufacturers, major fashion jewelry retailers are adding lab-grown diamonds to their product offerings, further positioning the cat-egory into the fashion jewelry segment and making it accessible to a wider range of price-sensitive consumers.
Sustainability, transparency and social welfare are priority issues for consumers, investors and the value chain. Social welfare and sustainability were growing issues in previous years. Now they are firmly top-of-mind for mining, trading and retail companies. In the US, and especially in China and India, younger consumers say sustainability is part of their decision-making process and could influence whether they buy diamond jewelry. Companies across the value chain are responding with a range of initiatives to tackle emissions and water con-sumption, increase diversity and support for local communities, and improve diamond traceability.
Covid-19 prompted structural changes in the diamond industry that will help it recover from the recession. Because of the crisis, midstream inventories are at healthy levels and better aligned with consumer de-mand. There are more partnerships between upstream and midstream players in regard to technology, go-to-market strategies and marketing. A more transparent and digitally enabled supply chain was created in the rough and polished diamond segments, and we see innovative new approaches to customer engage-ment. We are optimistic these changes will help the industry exit the crisis in a stronger position.
2020 ended with strong sales across the whole value chain. The boost was driven by successful holiday jewelry sales, particularly in the US and Chinese markets, where players reported a 5%–10% and 15%–20% rise in the fourth quarter, respectively, compared to the same period of 2019. The retail sales growth was feeding through to rising demand for polished diamonds. In the fourth quarter of 2020, the cutting and polishing segment demonstrated ~20% growth of net export of polished diamonds and net import of rough diamonds compared to the same period in 2019. In the last three months of the year, miners man-aged to release ~13 million carats of rough diamond inventories, increase rough prices by 2%–3% and show 10% sales growth compared to the fourth quarter of 2019.
2021 started on a strong trajectory and growing market confidence. Most miners reported 5%–8% rough diamond price and sales improvement in January, while in addition major miners kept a flexible sales poli-cy, which all combined set up a good start to the year. If that trajectory continues, we could see faster recov-ery to a historic trajectory than anticipated in our optimistic scenario.
* Note: Phygital (physical plus digital) is a concept of blending digital experiences with physical experiences in brick-and-mortar store, taking the best aspects from each space to create the optimal customer experience.

The Global Diamond Report 2020–21
7
There is still a lot of economic uncertainty ahead. The current crisis could be more severe than 2009, and a double-dip recession is possible. Full recovery and a return to historic growth trajectory isn’t expected until 2022–24. Three factors will impact the pace and shape of the recovery: epidemiology, government policy response and consumer response.
Encouraged by the year-end performance, the long-term outlook for the diamond market remains positive. In volume terms, rough diamond supply growth is projected to be −2% or 2% annually at best. Following accelerated short-term recovery growth, demand for rough diamonds is expected to fall back into historic trajectory, growing at 1% to 3% annually. Demand dynamics will match the trends in GDP and disposable income growth for affluent and high-net-worth individuals globally. Expanded retail jewelry footprints into lower-tier cities across key emerging economies will also support demand growth. Generation Z will be both a growth engine and a change agent for the industry, with its evolving preferences, purchasing behav-iors and sustainability agenda.

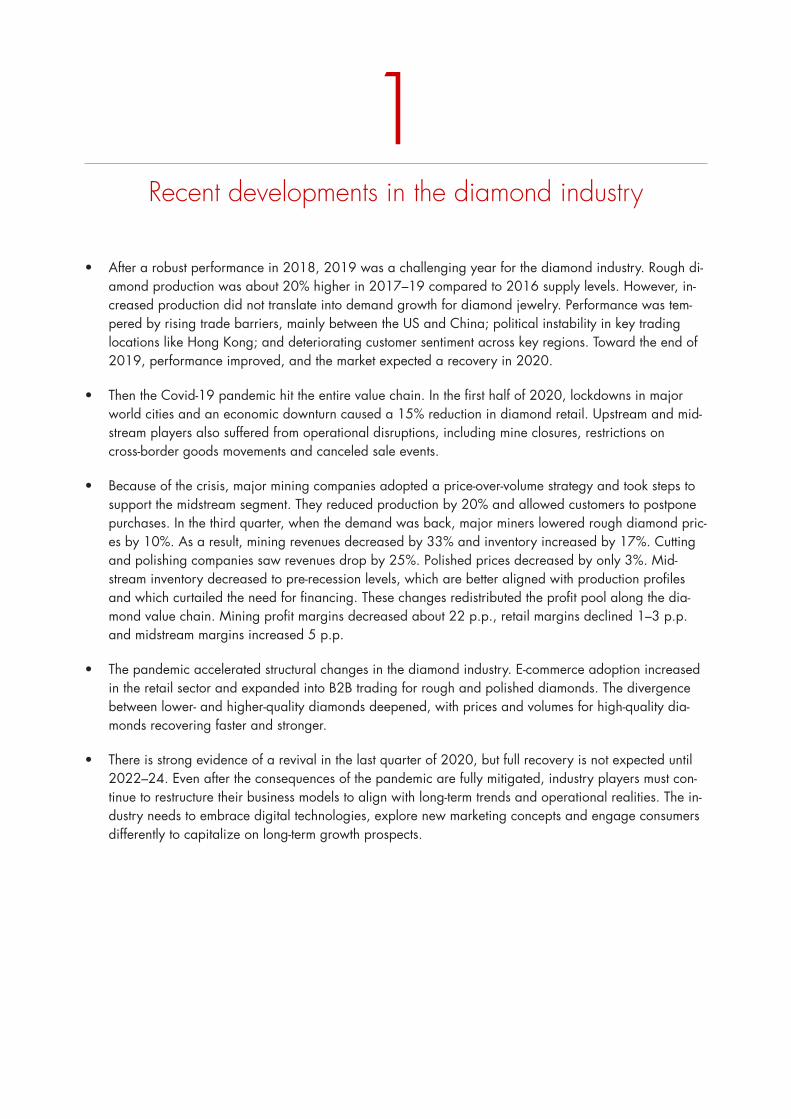
1Recent developments in the diamond industry
• After a robust performance in 2018, 2019 was a challenging year for the diamond industry. Rough di-amond production was about 20% higher in 2017–19 compared to 2016 supply levels. However, in-creased production did not translate into demand growth for diamond jewelry. Performance was tem-pered by rising trade barriers, mainly between the US and China; political instability in key trading locations like Hong Kong; and deteriorating customer sentiment across key regions. Toward the end of 2019, performance improved, and the market expected a recovery in 2020.
• Then the Covid-19 pandemic hit the entire value chain. In the first half of 2020, lockdowns in major world cities and an economic downturn caused a 15% reduction in diamond retail. Upstream and mid-stream players also suffered from operational disruptions, including mine closures, restrictions on cross-border goods movements and canceled sale events.
• Because of the crisis, major mining companies adopted a price-over-volume strategy and took steps to support the midstream segment. They reduced production by 20% and allowed customers to postpone purchases. In the third quarter, when the demand was back, major miners lowered rough diamond pric-es by 10%. As a result, mining revenues decreased by 33% and inventory increased by 17%. Cutting and polishing companies saw revenues drop by 25%. Polished prices decreased by only 3%. Mid-stream inventory decreased to pre-recession levels, which are better aligned with production profiles and which curtailed the need for financing. These changes redistributed the profit pool along the dia-mond value chain. Mining profit margins decreased about 22 p.p., retail margins declined 1–3 p.p. and midstream margins increased 5 p.p.
• The pandemic accelerated structural changes in the diamond industry. E-commerce adoption increased in the retail sector and expanded into B2B trading for rough and polished diamonds. The divergence between lower- and higher-quality diamonds deepened, with prices and volumes for high-quality dia-monds recovering faster and stronger.
• There is strong evidence of a revival in the last quarter of 2020, but full recovery is not expected until 2022–24. Even after the consequences of the pandemic are fully mitigated, industry players must con-tinue to restructure their business models to align with long-term trends and operational realities. The in-dustry needs to embrace digital technologies, explore new marketing concepts and engage consumers differently to capitalize on long-term growth prospects.

The Global Diamond Report 2020–21
10
Figure 2: Covid-19 had major implications across the value chain, but repositioned the industry for long-term growth
Rough diamond sales Cutting and polishing sales Retail sales
Short-termimplications
• Most mines lowered production plans or initiated care and maintenance
• Marginal mines stopped operations
• Rough sales expanded into online platforms and auctions, using 3D scanning technology
• Rough diamond sellers started to use data analytics to improve pricing expertise
• Miners launched select partnerships with midstream players to sell polished diamonds and share profits
• Major mining companies continued client portfolio optimization to limit speculative behavior in the market
• Traditional sales models and supply chains were disrupted
• Operating margins and balance sheets improved
• Manufacturers moved to demand-driven purchasing decisions
• Cutting and polishing automation technology was deployed to diversify manufacturing footprints and increase efficiency
• More conservative financing policies were applied among midstream, with peer-to-peer financing and specialized funds gaining share
• Online channels gained momentum and experienced double-digit growth in several markets
• High affinity for diamonds and an emotional response to the crisis drove consumer interest and helped the segment recover
Long-termimplications
• Marketing started to evolve through data analytics, customization and digital tools
• With omnichannel strategies and tools, retailers started reinventing the purchase experience in stores and online
Sources: Publication analysis; company data; expert interviews; Bain & Company
Rough diamonds Polished diamonds Diamond jewelry
Figure 1: Revenues across the value chain trended downward in 2019 and 2020
192018 YOY change 2018–19 YOY change 2019–20E20E
−18%−33%
−11% −25%
0% −15%
Global revenues by value chain segment, $ billions
Rough diamond sales Cutting and polishing sales Retail sales
Note here and after: E indicates estimated value throughout the report; YOY indicates average year-over-year changeSources: Kimberley Process; Gem & Jewellery Export Promotion Council; Euromonitor; publication analysis; company data; expert interviews; Bain & Company
Rough diamonds Polished diamonds Diamond jewelry
The Global Diamond Report 2020–21
11
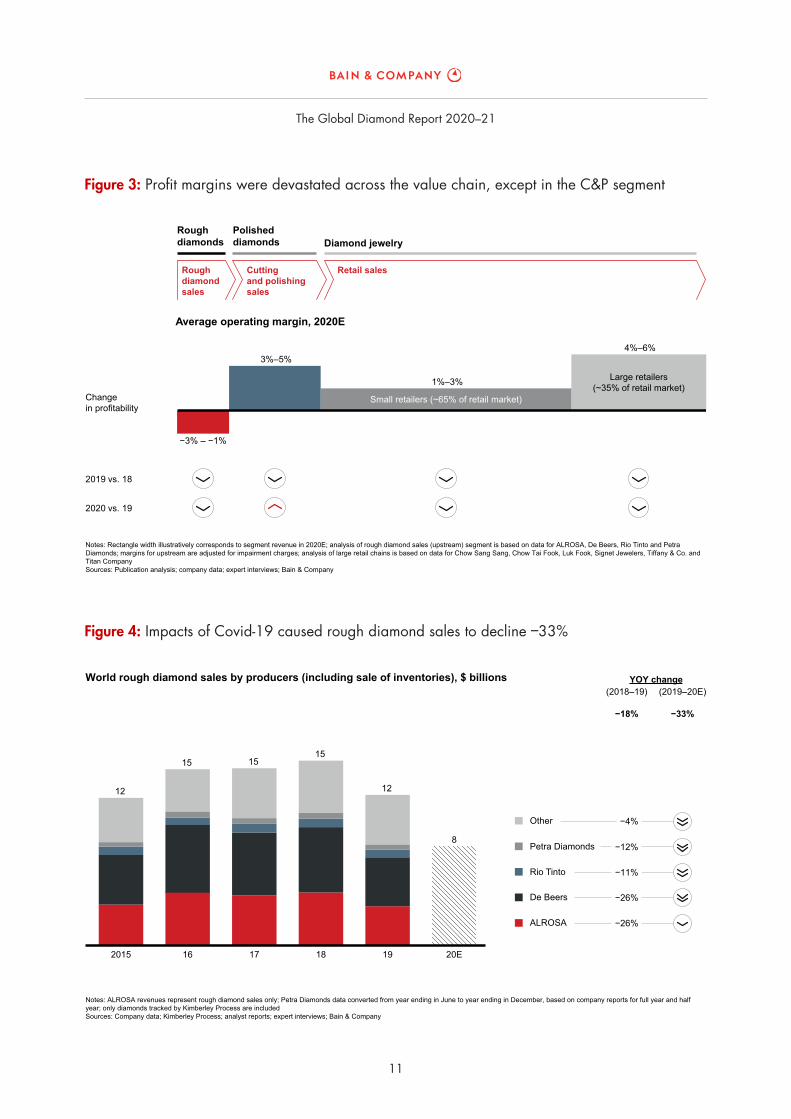
Figure 4: Impacts of Covid-19 caused rough diamond sales to decline –33%
World rough diamond sales by producers (including sale of inventories), $ billions
Notes: ALROSA revenues represent rough diamond sales only; Petra Diamonds data converted from year ending in June to year ending in December, based on company reports for full year and half year; only diamonds tracked by Kimberley Process are includedSources: Company data; Kimberley Process; analyst reports; expert interviews; Bain & Company
YOY change(2018–19) (2019–20E)
−18% −33%
Other
Rio Tinto
Petra Diamonds
De Beers
ALROSA
−4%
−12%
−11%
−26%
−26%
2015
12
16
15
17
15
18
15
19
12
20E
8
Figure 3: Profit margins were devastated across the value chain, except in the C&P segment
2019 vs. 18
2020 vs. 19
Change in profitability
Notes: Rectangle width illustratively corresponds to segment revenue in 2020E; analysis of rough diamond sales (upstream) segment is based on data for ALROSA, De Beers, Rio Tinto and Petra Diamonds; margins for upstream are adjusted for impairment charges; analysis of large retail chains is based on data for Chow Sang Sang, Chow Tai Fook, Luk Fook, Signet Jewelers, Tiffany & Co. and Titan CompanySources: Publication analysis; company data; expert interviews; Bain & Company
Average operating margin, 2020E
Rough diamond sales
Rough diamonds
Polished diamonds Diamond jewelry
Cutting and polishing sales
Retail sales
Small retailers (~65% of retail market)
Large retailers(~35% of retail market)
−3% – −1%
3%–5%
1%–3%
4%–6%
The Global Diamond Report 2020–21
12
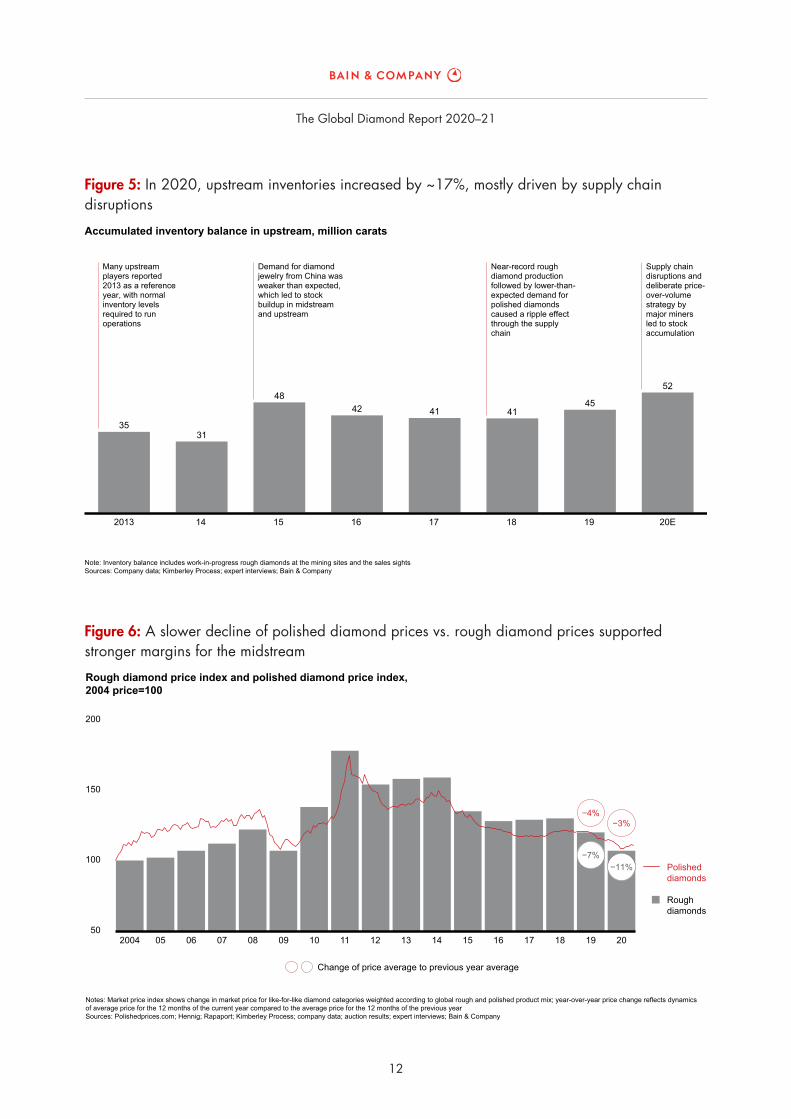
Figure 6: A slower decline of polished diamond prices vs. rough diamond prices supported stronger margins for the midstream
Notes: Market price index shows change in market price for like-for-like diamond categories weighted according to global rough and polished product mix; year-over-year price change reflects dynamics of average price for the 12 months of the current year compared to the average price for the 12 months of the previous yearSources: Polishedprices.com; Hennig; Rapaport; Kimberley Process; company data; auction results; expert interviews; Bain & Company
Change of price average to previous year average
Rough diamond price index and polished diamond price index,2004 price=100
Polished diamonds
Rough diamonds
50
100
150
200
2004 05 06 07 08 09 10 11 12 13 14 15 16 17 18 19 20
−4%−3%
−7%−11%
Figure 5: In 2020, upstream inventories increased by ~17%, mostly driven by supply chain disruptions
Many upstream players reported 2013 as a reference year, with normal inventory levels required to run operations
Demand for diamond jewelry from China was weaker than expected, which led to stock buildup in midstream and upstream
Near-record rough diamond production followed by lower-than-expected demand for polished diamonds caused a ripple effect through the supply chain
Supply chain disruptions and deliberate price-over-volume strategy by major miners led to stock accumulation
Note: Inventory balance includes work-in-progress rough diamonds at the mining sites and the sales sightsSources: Company data; Kimberley Process; expert interviews; Bain & Company
Accumulated inventory balance in upstream, million carats
2013
35
14
31
15
48
16
42
17
41
18
41
19
45
20E
52
The Global Diamond Report 2020–21
13
Figure 7: Prices for higher-quality polished diamonds have outperformed lower-quality diamonds over the past two years
Price change in May–December end, %
Notes: Color is used as a proxy for quality, with high colors D–H used as a reference for high-quality goods and I–L used as a reference for low-quality goods; price change reflects comparison of price level in December 2020 to price level in May 2020; year-over-year change reflects dynamics of average price for the 12 months of 2020 compared to the average price for the 12 months of 2019Sources: Rapaport; Bain & Company
I–L, IF–VSD–H, IF–VS
Polished diamond market price index, 1 ct, 2019 price=100
YOY change(2019–20E)
70
80
90
100
110
20202019
Jan Apr Jul Oct Jan Apr Jul Oct Jan
−12%
+13%
−5%
0%
Price change in May–December end, %
YOY change(2019–20E)
Polished diamond market price index, 0.3 ct, 2019 price=100
70
80
90
100
110
20202019
Jan Apr Jul Oct Jan Apr Jul Oct Jan
−1%
−14%
+3%
+7%
2Rough diamond production
• Following peak levels in 2017 and 2018, rough diamond production declined by 5% in 2019, hitting 139 million carats (+10% over 2016). Rough diamond sales decreased 18%, reflecting both volume and price changes, and leading to a 10% increase in mining company inventories. Toward the end of 2019, the market was improving significantly. Strong holiday demand positioned the industry for a better 2020.
• Then the Covid-19 pandemic severely disrupted mining operations and logistics, causing mine closures and restricting cross-border movements. Major mining companies adopted a price-over-volume strategy and took actions to keep the value chain in balance. They canceled major sales events between March and July, allowed customers to defer purchases, introduced a zero buyout obligation on goods allocation, and discounted rough diamond prices by 10% in the third quarter. Smaller players continued selling their diamonds from March through May to generate cash flow, even though prices were 25% to 30% lower than pre-pandemic levels. Several mining companies suspended operations for more than six months. Overall, rough diamond sales decreased by ~30 million carats ($4.1 billion) and rough inventory in-creased by 7 million carats.
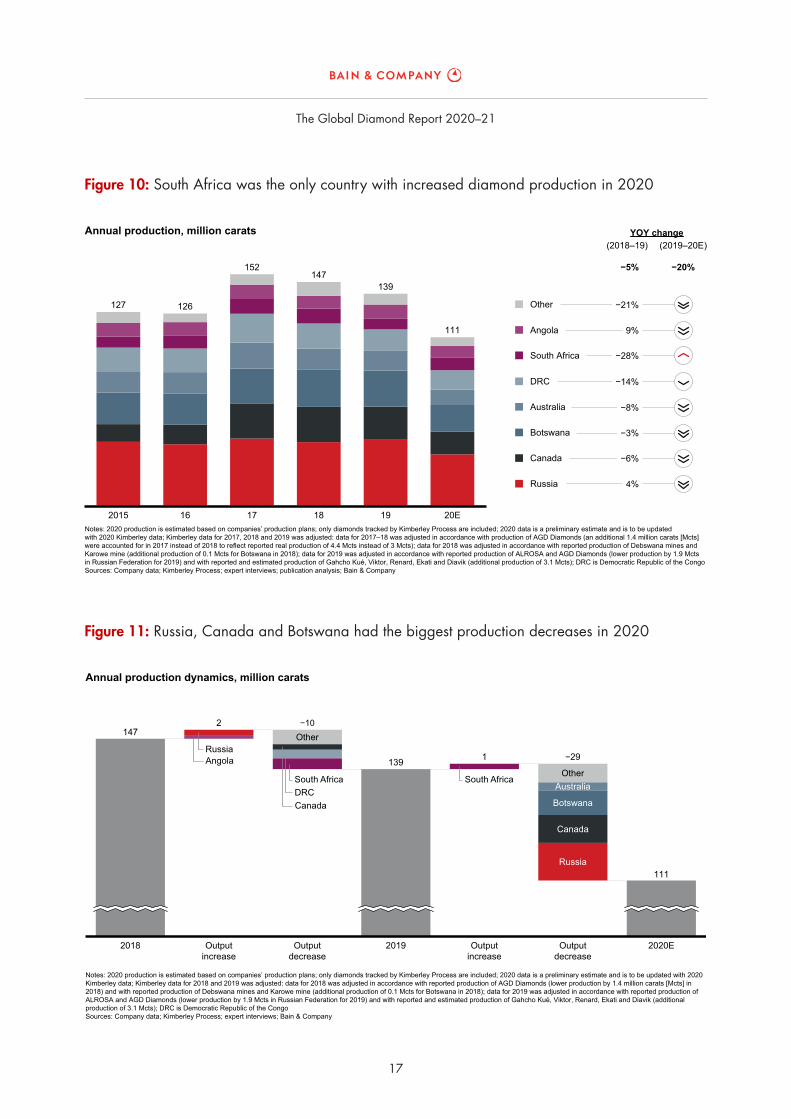
• Production dropped by 28 million carats (20%) in 2020. The biggest decreases came from Russia, Canada, Botswana and Australia. In Russia, production levels were lowered at Botuobinskaya, Almazy Anabara, Jubilee and other smaller mines. Production in Canada declined due to suspended mining ope rations at Ekati* and Renard* in March. In Botswana, Jwaneng and Orapa decreased production by 26%. As planned, Rio Tinto shut the Argyle mine in Australia in November 2020. The only mines to increase production were Venetia in South Africa and the Udachny underground mine and Nyurba Al-luvial deposits in Russia. The distribution of diamond assortment by size remained relatively constant, with medium and large diamonds accounting for 70% to 80% or more of production values.
• Except for ALROSA, all mining companies reported negative earnings before interest and taxes (EBIT) margins during the first half of 2020. Mining activities and sales started to normalize over the summer, so we expect better profitability in the second half of the year once the results are reported.
• In the rough diamond market, new sales platforms were deployed to overcome travel constraints and streamline the journey from miner to jeweler. Online auctions gained a higher share of rough diamond sales and offset deficits in traditional sales channels. Miners also created profit-sharing partnerships with midstream players to diversify rough-to-polished outcome risk and polished price volatility for mid-stream players and to gain additional margins on polished diamond sales. Such partnerships were formed between miner Lucapa Diamond Company and manufacturer Safdico International, and be-tween miner Lucara Diamond Corp. and manufacturer HB Antwerp.
• Production is expected to remain stable in 2021, driven by the reopening of profitable mines that were suspended in 2020, however the increase will be offset by closure of Argyle. During the next 3–5 years, production will likely grow by 0% to 2% p.a. to allow the value chain to fully rebalance.
* Note: Both Ekati and Renard restarted mining operations by the release date of the current report

The Global Diamond Report 2020–21
16
Figure 9: Production value decreased by ~30% in 2020, driven by declines in rough prices and production
Annual production by value, $ billions
Notes: 2020 production is estimated based on companies’ production plans; only diamonds tracked by Kimberley Process are included; 2020 data is a preliminary estimate and is to be updated with 2020 Kimberley data; Kimberley data for 2017, 2018 and 2019 was adjusted: data for 2017–18 was adjusted in accordance with production of AGD Diamonds (an additional 1.4 million carats [Mcts] were accounted for in 2017 instead of 2018 to reflect reported real production of 4.4 Mcts instead of 3 Mcts); data for 2018 was adjusted in accordance with reported production of Debswana mines and Karowe mine (additional production of 0.1 Mcts for Botswana in 2018); data for 2019 was adjusted in accordance with reported production of ALROSA and AGD Diamonds (lower production by 1.9 Mcts in Russian Federation for 2019) and with reported and estimated production of Gahcho Kué, Viktor, Renard, Ekati and Diavik (additional production of 3.1 Mcts)Sources: Company data; Kimberley Process; expert interviews; Bain & Company
2015 16 17 18 19 20E
15
13
16 15
13
9–9.5
Other
Rio Tinto
Petra Diamonds
−4%
−20%
−20%
−23%
−5%
YOY change(2018–19)
−13%
(2019–20E)
−30%
De Beers
ALROSA
Figure 8: Diamond production has been decreasing by ~5% since it peaked in 2017, with a drop of ~20% in 2020
Annual production, million carats
Notes: 2020 production is estimated based on companies’ production plans; only diamonds tracked by Kimberley Process are included; 2020 data is a preliminary estimate and is to be updated with 2020 Kimberley data; Kimberley data for 2017, 2018 and 2019 was adjusted: data for 2017–18 was adjusted in accordance with production of AGD Diamonds (an additional 1.4 million carats [Mcts] were accounted for in 2017 instead of 2018 to reflect reported real production of 4.4 Mcts instead of 3 Mcts); data for 2018 was adjusted in accordance with reported production of Debswana mines and Karowe mine (additional production of 0.1 Mcts for Botswana in 2018); data for 2019 was adjusted in accordance with reported production of ALROSA and AGD Diamonds (lower production by 1.9 Mcts in Russian Federation for 2019) and with reported and estimated production of Gahcho Kué, Viktor, Renard, Ekati and Diavik (additional production of 3.1 Mcts)Sources: Company data; Kimberley Process; expert interviews; Bain & Company
Other
Rio Tinto
Petra Diamonds
De Beers
ALROSA
−5%
−5%
−18%
−8%
−13%
5%
YOY change(2018–19) (2019–20E)
−20%
2015 16 17 18 19 20E
127 126
152147
139
111
The Global Diamond Report 2020–21
17
Figure 11: Russia, Canada and Botswana had the biggest production decreases in 2020
2018 Outputincrease
Outputdecrease
2019 Outputincrease
Outputdecrease
2020E
Annual production dynamics, million carats
Notes: 2020 production is estimated based on companies’ production plans; only diamonds tracked by Kimberley Process are included; 2020 data is a preliminary estimate and is to be updated with 2020 Kimberley data; Kimberley data for 2018 and 2019 was adjusted: data for 2018 was adjusted in accordance with reported production of AGD Diamonds (lower production by 1.4 million carats [Mcts] in 2018) and with reported production of Debswana mines and Karowe mine (additional production of 0.1 Mcts for Botswana in 2018); data for 2019 was adjusted in accordance with reported production of ALROSA and AGD Diamonds (lower production by 1.9 Mcts in Russian Federation for 2019) and with reported and estimated production of Gahcho Kué, Viktor, Renard, Ekati and Diavik (additional production of 3.1 Mcts); DRC is Democratic Republic of the CongoSources: Company data; Kimberley Process; expert interviews; Bain & Company
147 Other
139
Australia
Russia
Botswana
Other
Canada
111
RussiaAngola
2 −10
1 −29
Canada
South AfricaDRC
South Africa
Figure 10: South Africa was the only country with increased diamond production in 2020
Notes: 2020 production is estimated based on companies’ production plans; only diamonds tracked by Kimberley Process are included; 2020 data is a preliminary estimate and is to be updated with 2020 Kimberley data; Kimberley data for 2017, 2018 and 2019 was adjusted: data for 2017–18 was adjusted in accordance with production of AGD Diamonds (an additional 1.4 million carats [Mcts] were accounted for in 2017 instead of 2018 to reflect reported real production of 4.4 Mcts instead of 3 Mcts); data for 2018 was adjusted in accordance with reported production of Debswana mines and Karowe mine (additional production of 0.1 Mcts for Botswana in 2018); data for 2019 was adjusted in accordance with reported production of ALROSA and AGD Diamonds (lower production by 1.9 Mcts in Russian Federation for 2019) and with reported and estimated production of Gahcho Kué, Viktor, Renard, Ekati and Diavik (additional production of 3.1 Mcts); DRC is Democratic Republic of the CongoSources: Company data; Kimberley Process; expert interviews; publication analysis; Bain & Company
2015 16 17 18 19 20E
127 126
152147
139
111
Annual production, million carats
DRC
Botswana
Australia
Canada
Russia
Angola
Other
South Africa
−14%
−8%
−3%
−6%
−21%
9%
−28%
4%
YOY change(2018–19) (2019–20E)
−20%−5%

The Global Diamond Report 2020–21
18
Figure 13: Reduced sales activity in the first half of 2020 put significant pressure on profitability, which is expected to improve by year end
172016 18 19 H1 20
Adjusted EBIT margin (gains and losses not connected to continuing operations are excluded), %
Notes: EBIT is earnings before interest and taxes; EBITDA is earnings before interest, taxes, depreciation and amortization; Rio Tinto revenues and EBIT include diamond mining only; Petra Diamonds data converted from year ending in June to year ending in December based on company reports for full year and reports for half yearSources: Company data; Bain & Company
4638
46
34
2417 15 13
4
−15
12
2226
1
−50
29
1710 9
−33
54 47 53 44 41 23 25 22 12 0 39 41 43 24 −9 40 38 37 32 −2
PetraDiamonds
Adjusted EBITDA margin (gains and losses not connected to continuing operations are excluded), %
ALROSA De Beers Rio Tinto
Figure 12: Medium and large diamonds accounted for ~25% of production in carats but nearly 70%–80% in value in US dollars
Production volume2020E
Production value2020E
Industrial
Small (<0.4 ct)
Medium (0.4–2.0 ct)
Large (≥2.0 ct)
Rough diamond production by size groups in volume and in value, 2020E
Notes: Industrial-quality diamonds are used for non-jewelry purposes; quality examples: bort, dressers, drillingSources: Company data; Kimberley Process; expert interviews; publication analysis; Bain & Company
41%
34%
18%
7%111 million carats
20%–25%
30%–35%
40%–45%
$9–$9.5 billion
<3%
Gem- or near-gem- quality diamonds
Industrial-quality diamonds

The Global Diamond Report 2020–21
19


Cutting and polishing
3• In 2019, cutting and polishing revenue fell by 11% for three reasons: demand for polished diamonds
declined, financing shrank and polished prices fell by 4%. Nonetheless, midstream players de-levered 10% of excess inventory, lowered rough purchases by 18% and finished 2019 on positive trajectory. Manufacturing sales were robust in November and December, driven by stronger-than-expected holiday retail sales. Holiday demand caused downstream inventory replenishment and improved polished dia-mond pricing. Lower rough diamond prices enabled additional margins in trading and manufacturing.
• The pandemic disrupted operations and logistics along the segment. Sales of polished diamonds fell by 25%, and net imports of rough diamonds to key cutting and polishing countries dropped by 26% year over year in 2020.
• In India, net rough diamond imports decreased by 23% yet the country retained about 95% market share of global polished diamond manufacturing. India’s decrease in trading and manufacturing was a consequence of strict lockdowns, import moratoriums, restrictions at production sites and customs pro-cessing delays. Smaller factories suffered the most, with limited access to trading centers and higher costs to implement pandemic-related health requirements.
• Chinese manufacturers were among the first to restart operations; they resumed production in March and April and managed to keep 3% market share in global polished diamond manufacturing. Guangzhou Diamond Exchange and customs officials enabled fast import clearance to support an early recovery.
• Antwerp demonstrated resilience throughout 2020 since it had stable access to rough diamond supply and solid demand for high-end goods, which are the focus of Belgian manufacturers.
• Despite disruptions, the midstream finished the year in good shape. Demand for polished diamonds in-creased in the second half of 2020, leading to a polished price recovery and only a 3% decrease year over year. Inventory levels decreased by 22%, which is healthy for the segment. Profitability moved from near breakeven in prior years to 3% to 5% margins. Cutters and polishers of high-quality dia-monds benefited the most; demand for such diamonds was strong in the second half of 2020.
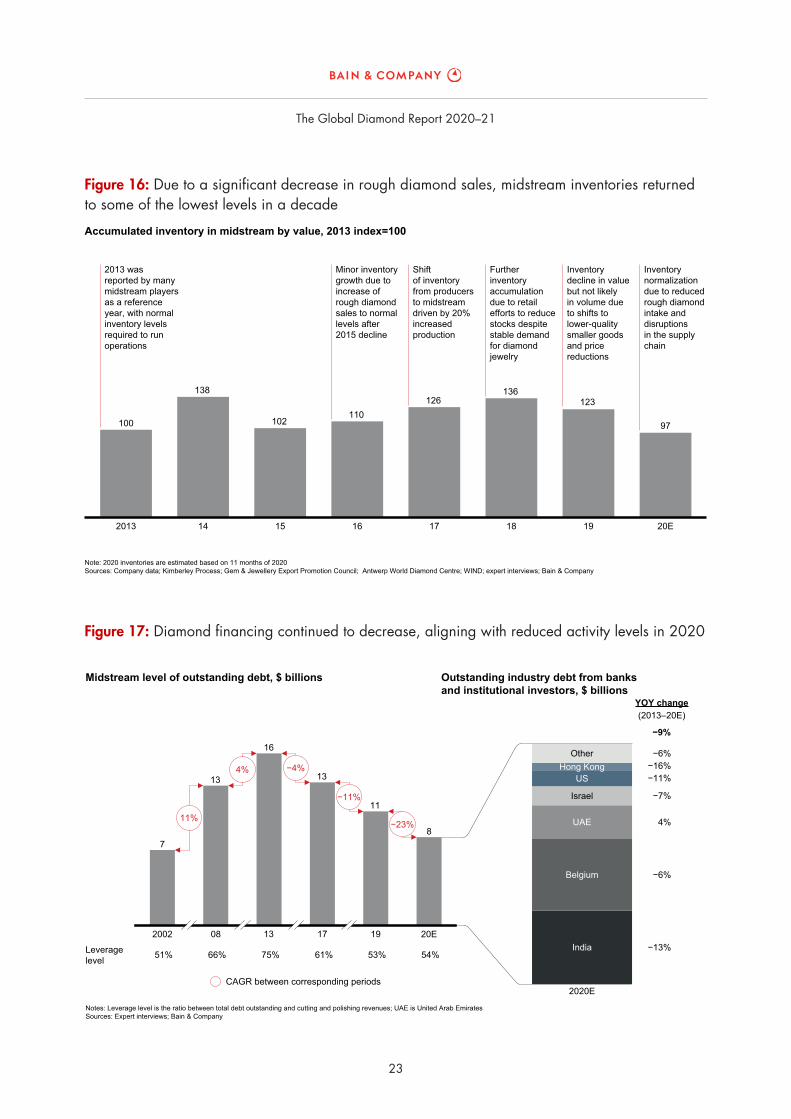
• Outstanding debt in the midstream decreased by 23% year over year, which aligned with reduced activity levels in 2020. Financing institutions extended due dates and canceled credit facility fees during the pan-demic. New sources of financing also became available from specialized funds and peer-to-peer lenders.
• Short-term pressures sped up restructuring and consolidation trends, which will continue. Progressive players adjusted their business models in several ways: they started making purchasing decisions based on retail demand versus manufacturing capacity, and they entered partnerships with mining companies to share risk on polished price volatility. In addition, they used analytics to predict polished output and prices based on rough diamond parameters, started testing automatic cutting and polishing machines (e.g., Synova DaVinci Diamond Factory or Fenix machine), and shifted more purchasing and sales activities to digital channels.
• In 2021, performance will depend on how the midstream collectively responds to two factors: down-stream demand for polished diamonds after the holiday season, and new sales agreements and rough price policies developed by major miners.

The Global Diamond Report 2020–21
22
Figure 15: In India, net imports of rough diamonds decreased by 27% in 2019 and 23% in 2020; recovery began in Q3 2020
Sources: Gem & Jewellery Export Promotion Council; Bain & Company
Net import of rough diamonds in India and net export of polished diamonds from India, $ millions
Net rough import Net polished export Average yearly net polished exportAverage yearly net rough import
−200
600
1,400
2,200
3,000
Jan
Feb Mar Apr May Jun
Jul
Aug Sep Oct Nov Dec Jan
Feb Mar Apr May Jun
Jul
Aug Sep Oct Nov Dec Jan
Feb Mar Apr May Jun
Jul
Aug Sep Oct Nov Dec
202020192018
Pandemic drop
Figure 14: Covid-19-related restrictions resulted in ~26% reduction of C&P activities globally, with India recovering the fastest
Note: 2020 net imports are estimated based on 12 months of 2020 for India and Belgium, and on 11 months of 2020 for all other countriesSources: Gem & Jewellery Export Promotion Council; Antwerp World Diamond Centre; WIND; Israel Central Bureau of Statistics; Bain & Company
Net import of rough diamonds to cutting and polishing countries, % YOY change(2018–19)
−26%(2019–20E)
−26%
−14% −62%−31% −38%
−27% −23%
0
20
40
60
80
100%
2015 16 17 18 19 20E
India 95%
China 3%Other 2%
The Global Diamond Report 2020–21
23
Figure 17: Diamond financing continued to decrease, aligning with reduced activity levels in 2020
Notes: Leverage level is the ratio between total debt outstanding and cutting and polishing revenues; UAE is United Arab EmiratesSources: Expert interviews; Bain & Company
Midstream level of outstanding debt, $ billions
YOY change(2013–20E)
−9%
−6%−16%−11%
−7%
−6%
−13%
4%
2020E
India
Hong Kong
Belgium
Israel
US
UAE
Other
2002
7
08
13
13
16
17
13
19
11
20E
8
51% 66% 75% 61% 53% 54%Leverage level
CAGR between corresponding periods
−23%
−11%
−4%4%
11%
Outstanding industry debt from banks and institutional investors, $ billions
Figure 16: Due to a significant decrease in rough diamond sales, midstream inventories returned to some of the lowest levels in a decade
Note: 2020 inventories are estimated based on 11 months of 2020Sources: Company data; Kimberley Process; Gem & Jewellery Export Promotion Council; Antwerp World Diamond Centre; WIND; expert interviews; Bain & Company
Accumulated inventory in midstream by value, 2013 index=100
Minor inventory growth due to increase of rough diamond sales to normal levels after 2015 decline
Shift of inventory from producers to midstream driven by 20% increased production
Further inventory accumulation due to retail efforts to reduce stocks despite stable demand for diamond jewelry
Inventory decline in value but not likely in volume due to shifts to lower-quality smaller goods and price reductions
Inventory normalization due to reduced rough diamond intake and disruptions in the supply chain
2013 was reported by many midstream players as a reference year, with normal inventory levels required to run operations
100
138
102110
126136
123
97
2013 14 15 16 17 18 19 20E
Diamond jewelry retail
4• Diamond jewelry retail was flat in 2019, with corrections to exchange rate movements. The US retail
market rose 1% after a strong holiday season. It declined 5% in China, where accelerated local spend-ing was depreciated by a weaker yuan. Trade wars between the US and China dragged down con-sumer sentiment and negatively influenced both markets in 2019.
• Store closures, wedding cancellations and travel restrictions to traditional shopping destinations all hurt the market in the short term and undermined consumer financials and confidence in the medium term. These negative effects were offset by “emotional hunger” during lockdowns, decreased competition from typical luxury rivals (e.g., travel , experiences, and apparel) and the quick expansion of online channels. Local consumption grew due to global travel restrictions. Diamond jewelry is expected to perform better than the global personal luxury market in 2020, with only a 15% drop compared to a 22% decline in luxury.
• China’s diamond jewelry market suffered during the pandemic, but recovered quickly once lockdowns were released. The bridal segment suffered the most due to wedding delays in February and May (two of the three main wedding seasons in China). Local purchasing rose significantly thanks to government repatriation policies (e.g., reduced import duties), price harmonization among brands and international travel bans. New sales channels like podcasting and other social media (e.g., Weibo, TikTok, Red, Bilibili, WeChat), online store sales (e.g., Taobao), and VIP membership sales allowed retailers to reach customers in a more interactive manner and also contributed to double-digit growth in China. Retailers engaged with new brand ambassadors, Key Opinion Leaders (KOLs) and Consumers (KOCs) that are popular among Generation Z to promote products and influence sales. Hainan, China’s holiday island, became a substitute destination for international travel and saw duty-free diamond jewelry sales surge. Key jewelers expanded their retail footprints into lower-tier cities, which also supported sales growth. One notable exception: Hong Kong. The pandemic slammed the brakes on tourism, spending and dia-mond jewelry retail in the city. In total, Greater China is expected to decrease by 6% year over year.
• The US postponed and limited lockdowns and has not yet experienced a full or definitive recovery from the pandemic. In the second quarter, jewelry sales dropped more than 40% after the stock market crashed and unemployment rose to 15%. The US jewelry market felt the decline in international tourism and related spending on luxury and premium products. However, significant government support, em-ployment rate improvement, positive vaccine news and a pre-holiday marketing push helped turn things around. A resurgence in diamond jewelry demand began with Black Friday and held through the holi-day season. We expect a 15% decrease in year-over-year retail results in the US.
• European markets, which rely heavily on brick-and-mortar diamond sales, were less resilient. Key mar-kets across Europe experienced a second wave of strict lockdowns, which hurt Christmas sales. Once sales are fully tallied, we expect a 20% decline in retail in Europe in 2020.
• In India, we expect total lockdowns, economic fallout and deferred weddings to have caused a 26% decrease in retail sales in 2020.
• Demand recovery is unlikely to be linear or equally distributed due to differences in lockdown policies and lengths, government support mechanisms, and online sales adoption. We believe the Chinese dia-mond jewelry retail market will recover in early 2021, while other developed countries will reach pre-pandemic levels in 2022–23. Retail recovery in emerging countries will follow a year later.

The Global Diamond Report 2020–21
26
Figure 19: After single-digit growth in recent years, the global diamond market was materially impacted by the pandemic and economic downturn in 2020
Worldwide diamond jewelry retail sales YOY growth rate, $
Worldwide personal luxury goods market YOY growth rate, $
Note: Constant exchange rates in comparison with the previous yearSources: Bain & Company Luxury Goods Worldwide Market Studies 2015–20; publication analysis; Euromonitor; company data; expert interviews; Bain & Company
2015 16 17 18 19 20Е
Revival Moderation Covid-19 decline
−2%
Constant exchange rates
Constant exchange rates
Current exchange rates
Current exchange rates
0%‒1%
0%‒1%
2%
2%
2%
2% 0%
1%
−15%
−1%−6%
−22%
0%3%
2%
6%
4%8%
7%
−16%
−23%
Figure 18: Consumers delayed discretionary spending during the pandemic, but diamond jewelry retail was less affected than the personal luxury market
Global nominal GDP Personal luxury sales Diamond jewelry sales
Notes: Personal luxury goods includes luxury jewelry, watches, beauty goods, apparel and accessories; personal luxury is converted from euros to dollarsSources: The Economist Intelligence Unit; Bain & Company Luxury Goods Worldwide Market Studies 2015–20; publication analysis; company data; expert interviews; Bain & Company
0
−30
−20
−10
10%
Global nominal GDP, personal luxury goods and diamond jewelry markets YOY % change, $
2009 2010–19 2020E
−13%
−22%
−15%
−9%
4% 4%3%
−5% −5%
The Global Diamond Report 2020–21
27
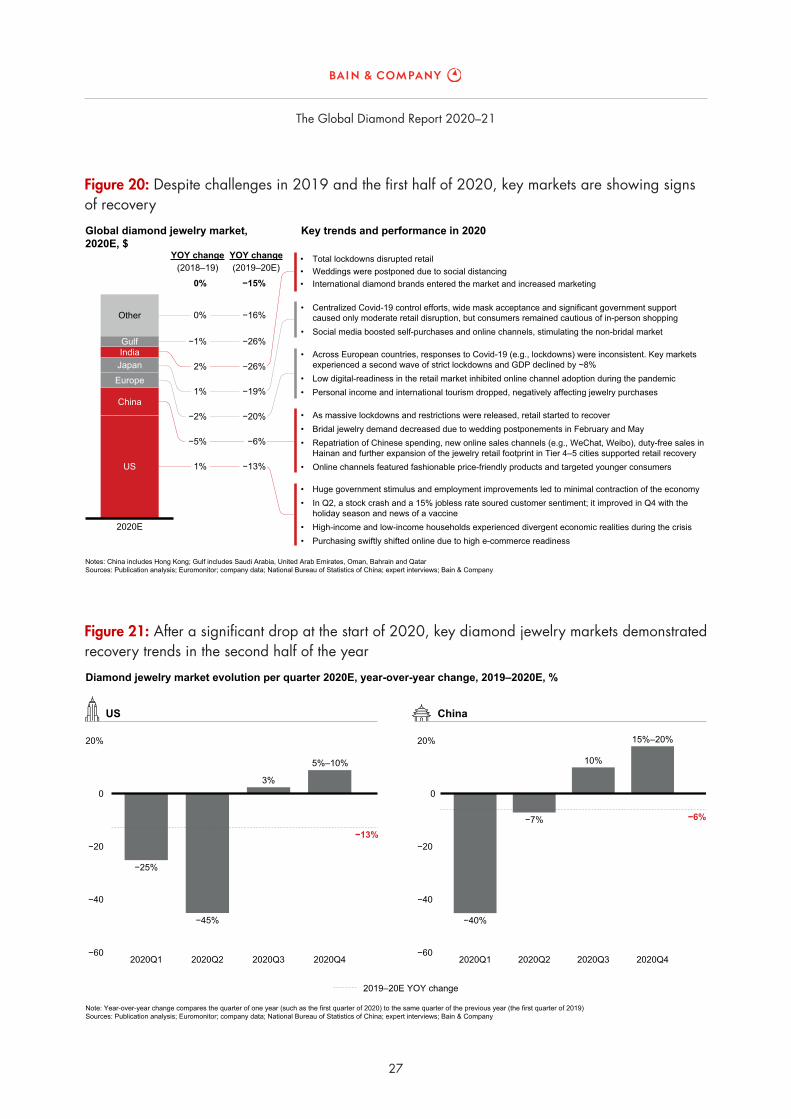
Figure 21: After a significant drop at the start of 2020, key diamond jewelry markets demonstrated recovery trends in the second half of the year
Note: Year-over-year change compares the quarter of one year (such as the first quarter of 2020) to the same quarter of the previous year (the first quarter of 2019)Sources: Publication analysis; Euromonitor; company data; National Bureau of Statistics of China; expert interviews; Bain & Company
2019–20E YOY change
Diamond jewelry market evolution per quarter 2020E, year-over-year change, 2019–2020E, %
US
−13%
−6%
China
2020Q1
−25%
2020Q2
−45%
2020Q3
3%
2020Q4
5%‒10%
−60
−40
−20
0
20%
−60
−40
−20
0
20%
2020Q1
−40%
2020Q2
−7%
2020Q3
10%
2020Q4
15%‒20%
Figure 20: Despite challenges in 2019 and the first half of 2020, key markets are showing signs of recovery
Notes: China includes Hong Kong; Gulf includes Saudi Arabia, United Arab Emirates, Oman, Bahrain and QatarSources: Publication analysis; Euromonitor; company data; National Bureau of Statistics of China; expert interviews; Bain & Company
Global diamond jewelry market, 2020E, $
Key trends and performance in 2020
2020E
US
JapanEurope
China
IndiaGulf
Other
YOY change(2019–20E)
YOY change(2018–19)
−15%0%
−1%
−2%
−5%
2%
0%
1%
1%
−26%
−20%
−6%
−26%
−16%
−19%
−13%
• Huge government stimulus and employment improvements led to minimal contraction of the economy• In Q2, a stock crash and a 15% jobless rate soured customer sentiment; it improved in Q4 with the
holiday season and news of a vaccine • High-income and low-income households experienced divergent economic realities during the crisis• Purchasing swiftly shifted online due to high e-commerce readiness
• As massive lockdowns and restrictions were released, retail started to recover• Bridal jewelry demand decreased due to wedding postponements in February and May• Repatriation of Chinese spending, new online sales channels (e.g., WeChat, Weibo), duty-free sales in
Hainan and further expansion of the jewelry retail footprint in Tier 4–5 cities supported retail recovery• Online channels featured fashionable price-friendly products and targeted younger consumers
• Across European countries, responses to Covid-19 (e.g., lockdowns) were inconsistent. Key markets experienced a second wave of strict lockdowns and GDP declined by ~8%
• Low digital-readiness in the retail market inhibited online channel adoption during the pandemic• Personal income and international tourism dropped, negatively affecting jewelry purchases
• Centralized Covid-19 control efforts, wide mask acceptance and significant government support caused only moderate retail disruption, but consumers remained cautious of in-person shopping
• Social media boosted self-purchases and online channels, stimulating the non-bridal market
• Total lockdowns disrupted retail• Weddings were postponed due to social distancing• International diamond brands entered the market and increased marketing

The Global Diamond Report 2020–21
28
Figure 23: Luxury bridal and luxury non-bridal diamond jewelry were the top-performing categories in the diamond jewelry market
Note: The size of each area in the triangle corresponds to the estimated segment share in 2020Sources: Publication analysis; Euromonitor; company data; National Bureau of Statistics of China; expert interviews; Bain & Company
Diamond jewelry market composition, 2020E,% share of the total diamond jewelry market
~5% of diamond jewelryLuxury bridal diamond jewelry
~32% of diamond jewelry
Premium bridal diamond jewelry
~48% of diamond jewelry
Premium non-bridal diamond jewelry
~15% of diamond jewelryLuxury non-bridal diamond jewelry
~$64 billionTotal diamond jewelry market
2019–20E YOY change
Figure 22: In 2020, diamond jewelry outpaced other jewelry segments due to the relatively strong performance of luxury jewelry in Asia
Note: The size of each shaded area in the triangle corresponds to the estimated market size in 2020Sources: Publication analysis; Euromonitor; company data; National Bureau of Statistics of China; expert interviews; Bain & Company
Jewelry market composition, 2020E
~$64 billionDiamond jewelry
~$264 billionTotal jewelry market
2019–20E YOY change
~$80 billionMass jewelry
~$164 billionPremium jewelry
~$20 billionLuxury jewelry

The Global Diamond Report 2020–21
29

Key industry trends and effects of Covid-19
5• The pandemic simultaneously disrupted the supply and demand sides of the diamond market. Logistical
collapses, lockdowns and business closures rocked supply chains. On the demand side, loss of income from morbidity, quarantine and unemployment weakened economic prospects and lowered household consumption. Consumer interest in the diamond category remained strong, but consumer behavior and preferences changed. Diamond industry players and marketers need to respond to four important shifts:
• Online shopping increased. In 2020, up to ~20% of diamond retail sales occurred online (up from ~13% in 2019). Most consumers (70%) use digital tools to research and choose jewelry before they make in-store purchases. Since this trend is unlikely to fully reverse after the pandemic, retailers must in-vest in digital capabilities, delightful online shopping experiences and seamless omnichannel or phygi-tal interactions. Marketers can also apply data analytics to develop more personalized campaigns, products and services for online shoppers. To encourage online demand, the industry can support dia-mond certificate initiatives, warranty programs and customer reviews. Generous delivery and return policies will also increase the convenience of online shopping.
• Sustainability and social consumerism became more influential to purchase decisions, and the pandem-ic heightened attention to global health and safety concerns. Regarding diamond jewelry, social impact is the top sustainability concern for US consumers; in China and India, consumers care most about envi-ronmental preservation, conflict-free supply chains, and carbon footprint. Governments, professional groups and local communities are pressuring the industry, too. Companies along the value chain are re-sponding with a wide range of initiatives, including capital projects to reduce emissions and diversity and traceability programs. Going forward, industry players should integrate ambitious Environmental, Social and Governance (ESG) targets in their asset plans and internal incentive schemes to demonstrate their commitment. They should also communicate their progress to society.
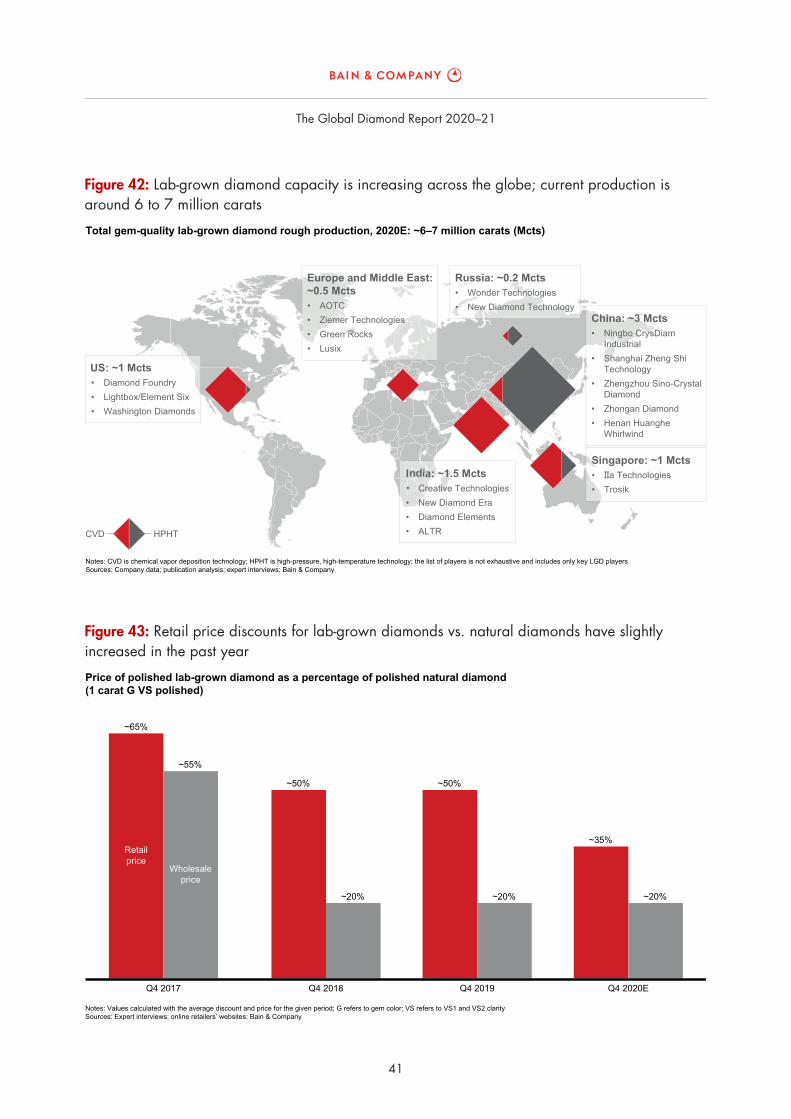
• In 2020, lab-grown diamond production reached 6 to 7 million carats, with 50% to 60% of it manufac-tured in China using high-pressure, high-temperature technology. Chemical vapor deposition technology is gaining share, with India and the US emerging as major production centers. As expected, retail pric-es for lab-grown diamonds fell in 2020 while wholesale prices remained stable. That led to a margin contraction for traders and jewelry manufacturers. We believe additional price drops will make lab-grown diamonds accessible to broader groups of price-sensitive consumers and push them further into the fashion category, where they have growth potential. Most of the retail lab-grown market is currently concentrated in the US; China is a distant second.
• Although most consumers say the pandemic will not affect their long-term interest in diamond jewelry, Covid-19 accelerated emerging trends in marketing. Diamond marketing is becoming more complex, accentuated by fierce competition for share of wallet, diamonds’ low purchase frequency per consumer and changing product requirements for new generations. And the diamond industry is not investing enough in marketing compared to other premium and luxury segments. The era of one-size-fits-all mar-keting is over. Developing customized, analytics-based strategies will become a key competitive advan-tage going forward. To succeed in a post-crisis world, marketers need tools to closely monitor shifting customer sentiments and priorities, leverage data analytics and ramp up personalization.
The Global Diamond Report 2020–21
32
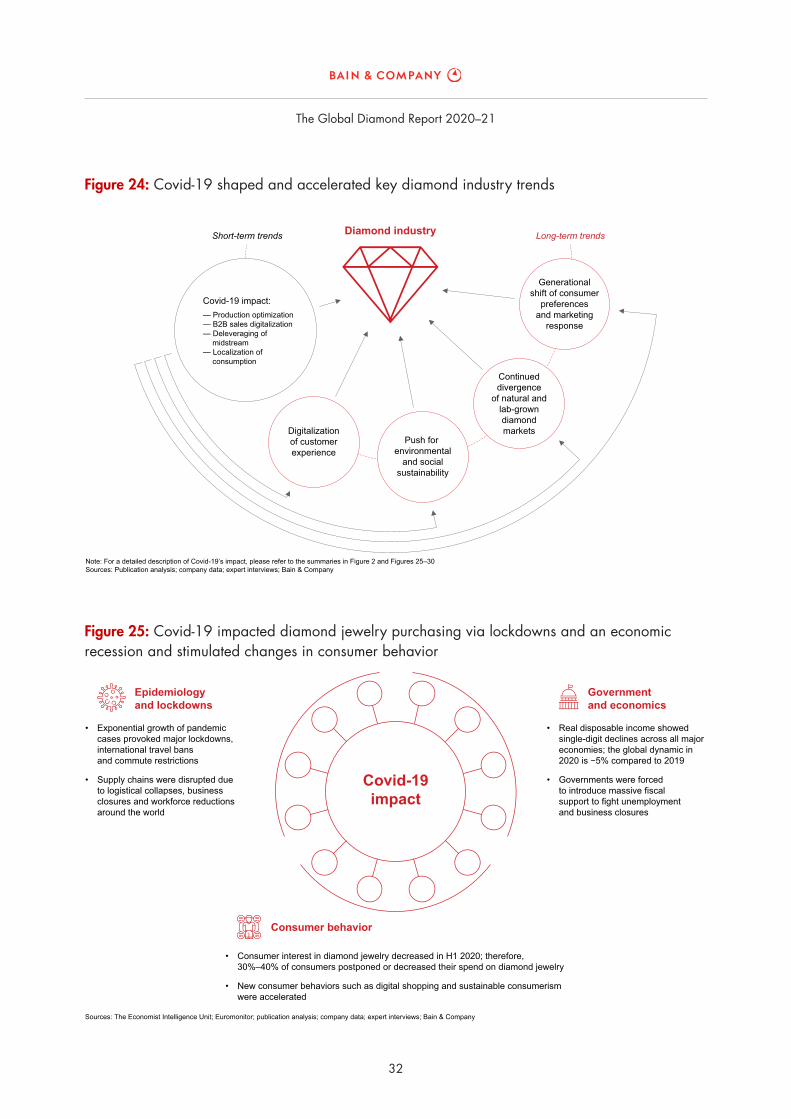
Figure 25: Covid-19 impacted diamond jewelry purchasing via lockdowns and an economic recession and stimulated changes in consumer behavior
Sources: The Economist Intelligence Unit; Euromonitor; publication analysis; company data; expert interviews; Bain & Company
Epidemiology and lockdowns
Covid-19impact
• Exponential growth of pandemic cases provoked major lockdowns, international travel bans and commute restrictions
• Supply chains were disrupted due to logistical collapses, business closures and workforce reductions around the world
Governmentand economics
• Real disposable income showed single-digit declines across all major economies; the global dynamic in 2020 is −5% compared to 2019
• Governments were forced to introduce massive fiscal support to fight unemployment and business closures
Consumer behavior
• Consumer interest in diamond jewelry decreased in H1 2020; therefore, 30%–40% of consumers postponed or decreased their spend on diamond jewelry
• New consumer behaviors such as digital shopping and sustainable consumerism were accelerated
Figure 24: Covid-19 shaped and accelerated key diamond industry trends
Note: For a detailed description of Covid-19’s impact, please refer to the summaries in Figure 2 and Figures 25–30Sources: Publication analysis; company data; expert interviews; Bain & Company
Short-term trends Long-term trendsDiamond industry
Covid-19 impact:— Production optimization— B2B sales digitalization— Deleveraging of
midstream— Localization of
consumption
Digitalizationof customerexperience
Push for environmental
and socialsustainability
Continueddivergence
of natural andlab-growndiamondmarkets
Generationalshift of consumer
preferencesand marketing
response

The Global Diamond Report 2020–21
33
Figure 27: Interest in diamond jewelry dropped for three months, then reverted to 2019 levels in July
Sources: Google Trends; Baidu; Bain & Company
Popularity dynamics of “Diamond jewelry” searches in Google globally and in Baidu for China,2019 January index=100
40
60
80
100
120
140
Jan Feb Mar Apr May Jun Jul Aug Sep Oct Nov Dec
2019 2020
Figure 26: The current economic crisis is expected to be deeper than the one in 2009
Notes: China includes Hong Kong; Gulf includes Saudi Arabia, United Arab Emirates, Oman, Bahrain and QatarSources: The Economist Intelligence Unit; Bain & Company
Real GDP of the key diamond jewelry markets, constant exchange rates,YOY % change
2009 2010–19 2020E−10
−5
0
5
10%
US China Europe Japan India Gulf Other Global average dynamics
2%
7%
2%1%
7%
3%3%
2%
−7%
−5%
−8%
−4%−5%
−5%
−3%
9%
−4%−5%
8%
−1% −1% −2%
−5%
3%
The Global Diamond Report 2020–21
34
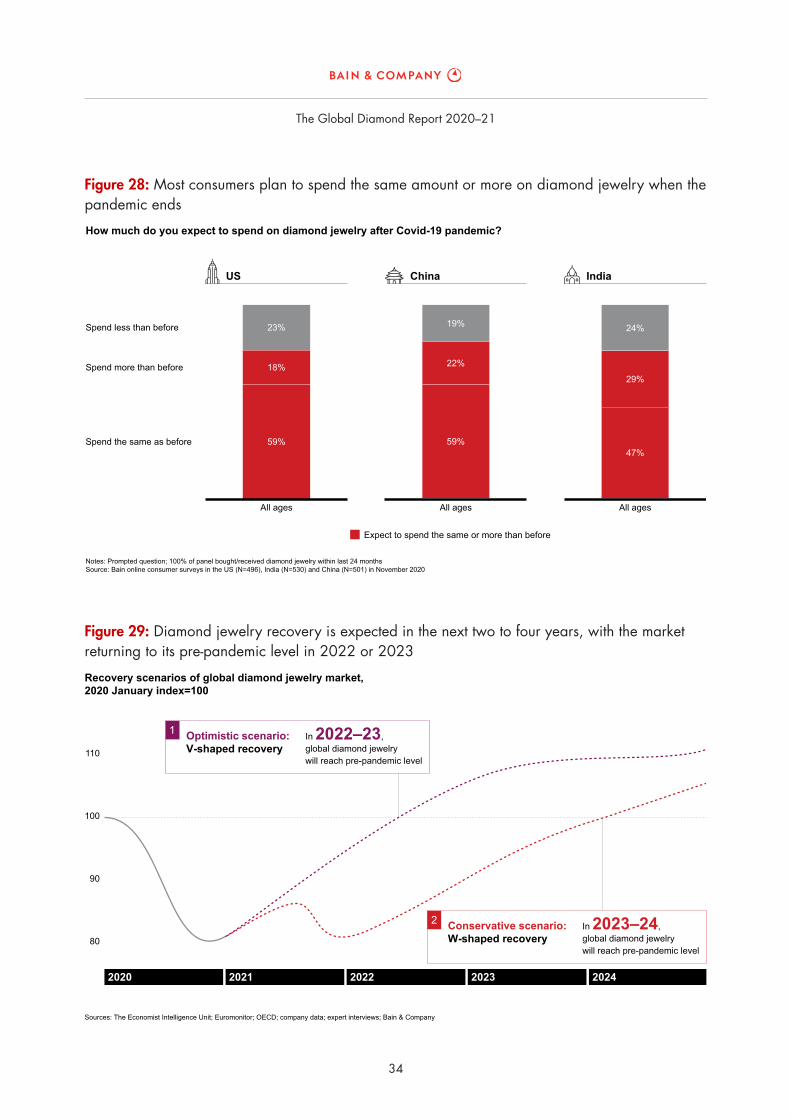
Figure 29: Diamond jewelry recovery is expected in the next two to four years, with the market returning to its pre-pandemic level in 2022 or 2023
Sources: The Economist Intelligence Unit; Euromonitor; OECD; company data; expert interviews; Bain & Company
Recovery scenarios of global diamond jewelry market,2020 January index=100
90
100
110
80
2020 2021 2022 2023 2024
Optimistic scenario:V-shaped recovery
In 2022–23,global diamond jewelry will reach pre-pandemic level
Conservative scenario:W-shaped recovery
In 2023–24,global diamond jewelry will reach pre-pandemic level
2
1
Figure 28: Most consumers plan to spend the same amount or more on diamond jewelry when the pandemic ends
Notes: Prompted question; 100% of panel bought/received diamond jewelry within last 24 monthsSource: Bain online consumer surveys in the US (N=496), India (N=530) and China (N=501) in November 2020
How much do you expect to spend on diamond jewelry after Covid-19 pandemic?
Spend less than before
Spend more than before
Spend the same as before
US
All ages
23%
59%
18%
India
All ages
24%
29%
47%
Expect to spend the same or more than before
China
All ages
19%
22%
59%

The Global Diamond Report 2020–21
35
Figure 31: E-commerce experienced a major boost in 2020
Notes: 2020 online share is estimated based on nine months of 2020; leading players include Tiffany, Signet, Blue Nile, Chow Tai Fook, Luk Fook, Chow Sang Sang and CHJ Sources: Company data; Bain & Company
Online diamond jewelry sales of leading players,% share of the diamond jewelry sales for leading players
2013
9%
2%
16
10%
4%
19
14%
12%
20E
22%
16%
US China
Figure 30: Diamond jewelry recovery depends on the epidemiology of Covid-19, government actions and consumer behavior
• Widespread vaccination takes place in the developed world from January to June 2021
• Governments loosen restrictions quickly and fully by mid-2021
• Downside risks such as trade wars, major cuts to fiscal support and increased taxation do not materialize
• Most economies recover to their pre-pandemic levels by the end of 2021 or beginning of 2022
• Vaccines are difficult to scale and herd immunity isn’t developed until the beginning of 2022
• Restrictions gradually loosen in most countries by the end of 2022; new strains of the virus emerge between 2021–23
• Fiscal support is significantly cut; taxation increases to offset budget deficits
• Most economies recover to their pre-pandemic levels by the end of 2022 or beginning of 2023; there’s substantial risk of a double-dip recession
• Consumer fears about health and finances fall quickly in response to vaccine implementation, and consumer confidence recovers fast
• As in previous crises, appreciation for self and others leads to increased jewelry purchases
• Demand for diamond jewelry recovers by the end of 2022 or beginning of 2023
• Consumers’ health fears remain high despite the availability of vaccines; new strains of the virus hit consumer confidence again, slowing recovery
• Demand for diamond jewelry recovers by the end of 2023 or beginning of 2024, but faces “revenge buying” competition from other luxury goods categories (e.g., travel)
Sources: The Economist Intelligence Unit; Euromonitor; OECD; company data; expert interviews; Bain & Company
Consumer behavior
Epidemiology and lockdowns
Government and economics
Optimistic recovery scenario Conservative recovery scenario21
The Global Diamond Report 2020–21
36
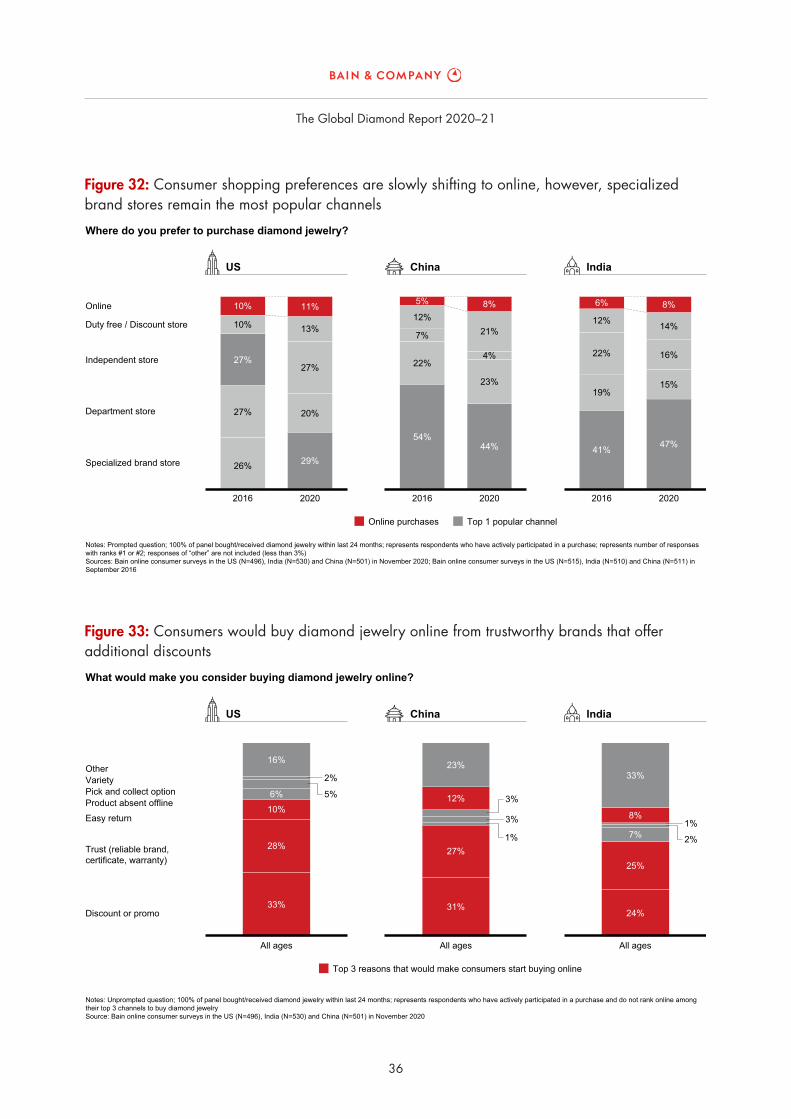
Figure 33: Consumers would buy diamond jewelry online from trustworthy brands that offer additional discounts
Notes: Unprompted question; 100% of panel bought/received diamond jewelry within last 24 months; represents respondents who have actively participated in a purchase and do not rank online among their top 3 channels to buy diamond jewelrySource: Bain online consumer surveys in the US (N=496), India (N=530) and China (N=501) in November 2020
What would make you consider buying diamond jewelry online?
OtherVarietyPick and collect optionProduct absent offlineEasy return
Trust (reliable brand,certificate, warranty)
Discount or promo
Top 3 reasons that would make consumers start buying online
31%
27%
12%
23%
1%
3%
3%
24%
25%
7%
8%
33%
2%
1%
33%
28%
10%6%
16%
5%
2%
US
All ages
India
All ages
China
All ages
Figure 32: Consumer shopping preferences are slowly shifting to online, however, specialized brand stores remain the most popular channels
Notes: Prompted question; 100% of panel bought/received diamond jewelry within last 24 months; represents respondents who have actively participated in a purchase; represents number of responses with ranks #1 or #2; responses of “other” are not included (less than 3%)Sources: Bain online consumer surveys in the US (N=496), India (N=530) and China (N=501) in November 2020; Bain online consumer surveys in the US (N=515), India (N=510) and China (N=511) in September 2016
Where do you prefer to purchase diamond jewelry?
Online
Independent store
Duty free / Discount store
Specialized brand store
Department store
Online purchases Top 1 popular channel
2016 2020
19%
41%
22%
12%
6%
15%
47%
16%
14%
8%
2016 2020
22%
54%
7%
12%
5%
23%
44%
4%
21%
8%
2016 2020
27%
26%
27%
10%
10%
20%
29%
27%
13%
11%
US IndiaChina

The Global Diamond Report 2020–21
37
Figure 35: Covid-19 accelerated the convergence of online and offline channels, forcing retailers to retool the customer engagement experience for the new normal
Sources: Publication analysis; expert interviews; Bain & Company
Enriched experiences
— Storytelling content, integrated into the shopping experience
— Livestreaming from jewelry stores through streaming and social media
— Jewelry cafés as part of point of sales
Enhanced discovery
— Integration of mobile applications to enable seamless customer journeys
— Facial recognition in offline stores to connect online profiles
Customerengagement
Hyper-convenience
— Augmented reality try-on of jewelry in virtual showrooms
— Online stores supported by offline showrooms to try on jewelry items
Hyper-individuality
— Jewelry customization and a do-it-yourself approach
— Big data analysis of online customer-store communications
— Personalized offers and promotions
Figure 34: Digital is part of the purchasing experience for more than half of buyers; only 25%–35% of younger consumers make in-store purchases without it
Note here and after: Millennials (Generation Y) were born between 1981 and 1995; Generation Z is the newest generation to be named and was born after 1996Notes: Prompted question; 100% of panel bought/received diamond jewelry within last 24 months; represents respondents who have actively participated in a purchaseSource: Bain online consumer surveys in the US (N=496), India (N=530) and China (N=501) in November 2020
How did you buy your last diamond jewelry?
Chose and paid online
Chose online,but picked up at the store
Researched online, but went to the store to choose and buy
Just bought in store and didn’t research online
Millennials &Generation Z
Eldergenerations
Eldergenerations
Eldergenerations
Millennials &Generation Z
Millennials &Generation Z
Purchasing involved online
43%
16%
25%
16%
40%
10%
44%
6%
39%
16%
25%
20%
34%
15%
29%
22%
24%
18%
33%
25%
24%
6%
53%
17%
US IndiaChina
The Global Diamond Report 2020–21
38
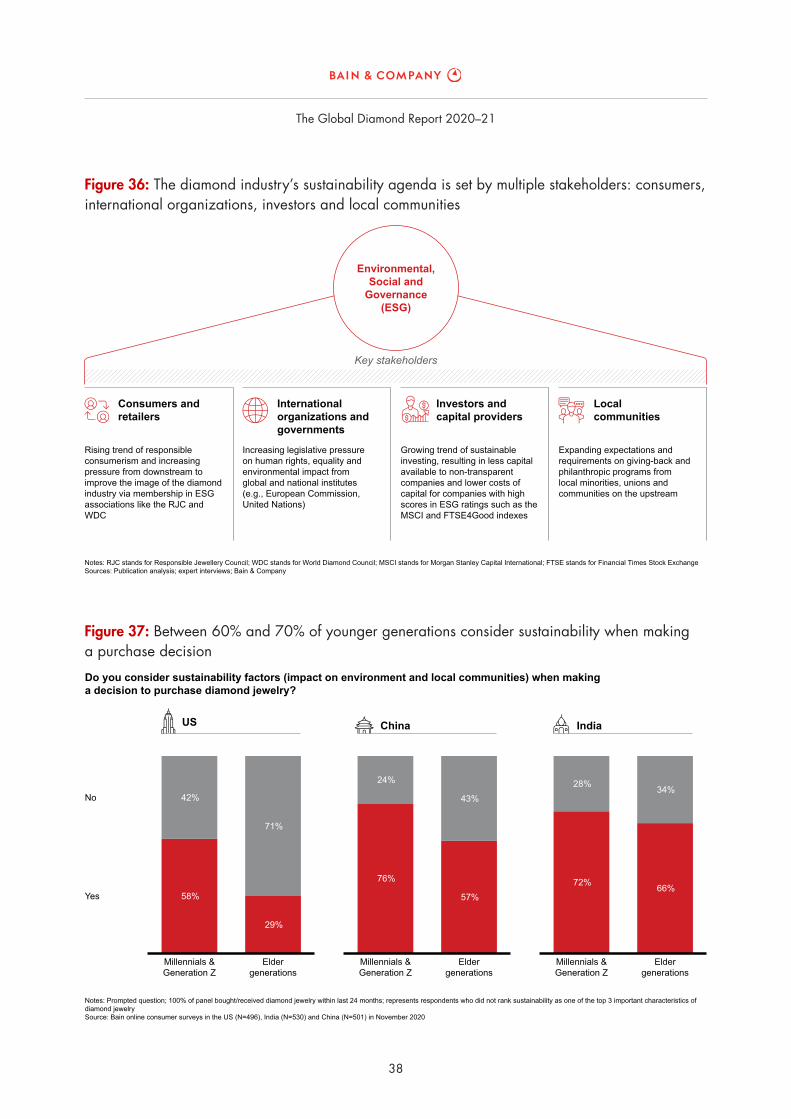
Figure 37: Between 60% and 70% of younger generations consider sustainability when making a purchase decision
Notes: Prompted question; 100% of panel bought/received diamond jewelry within last 24 months; represents respondents who did not rank sustainability as one of the top 3 important characteristics of diamond jewelrySource: Bain online consumer surveys in the US (N=496), India (N=530) and China (N=501) in November 2020
Do you consider sustainability factors (impact on environment and local communities) when makinga decision to purchase diamond jewelry?
No
Yes
Millennials &Generation Z
Eldergenerations
Eldergenerations
Eldergenerations
Millennials &Generation Z
Millennials &Generation Z
US China India
58%
42%
29%
71%
76%
24%
57%
43%
72%
28%
66%
34%
Figure 36: The diamond industry’s sustainability agenda is set by multiple stakeholders: consumers, international organizations, investors and local communities
Notes: RJC stands for Responsible Jewellery Council; WDC stands for World Diamond Council; MSCI stands for Morgan Stanley Capital International; FTSE stands for Financial Times Stock Exchange Sources: Publication analysis; expert interviews; Bain & Company
Key stakeholders
Consumers and retailers
International organizations and governments
Rising trend of responsible consumerism and increasing pressure from downstream to improve the image of the diamond industry via membership in ESG associations like the RJC and WDC
Increasing legislative pressure on human rights, equality and environmental impact from global and national institutes (e.g., European Commission, United Nations)
Growing trend of sustainable investing, resulting in less capital available to non-transparent companies and lower costs of capital for companies with high scores in ESG ratings such as the MSCI and FTSE4Good indexes
Expanding expectations and requirements on giving-back and philanthropic programs from local minorities, unions and communities on the upstream
Investors and capital providers
Environmental,Social and
Governance(ESG)
Localcommunities
The Global Diamond Report 2020–21
39
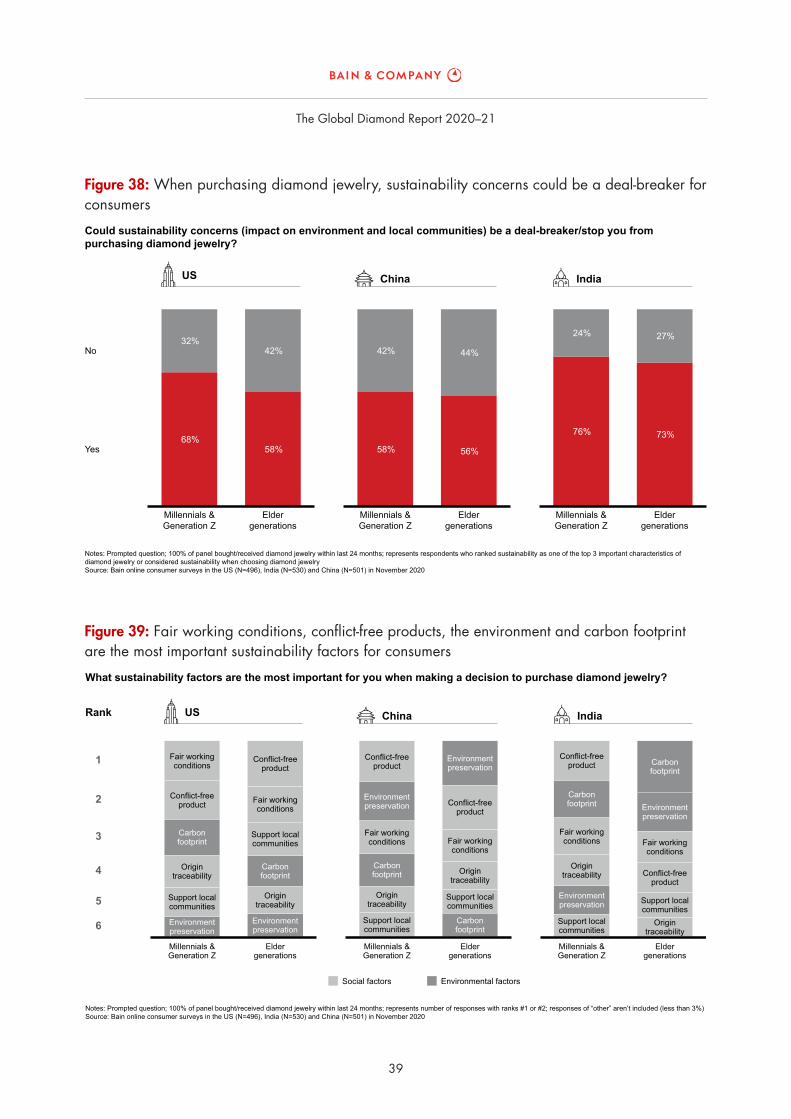
Figure 39: Fair working conditions, conflict-free products, the environment and carbon footprint are the most important sustainability factors for consumers
Notes: Prompted question; 100% of panel bought/received diamond jewelry within last 24 months; represents number of responses with ranks #1 or #2; responses of “other” aren’t included (less than 3%)Source: Bain online consumer surveys in the US (N=496), India (N=530) and China (N=501) in November 2020
What sustainability factors are the most important for you when making a decision to purchase diamond jewelry?
Rank
4
6
5
3
2
1
Social factors Environmental factors
Millennials &Generation Z
Eldergenerations
Eldergenerations
Eldergenerations
Millennials &Generation Z
Millennials &Generation Z
US China India
Fair workingconditions
Fair workingconditions
Fair workingconditions Fair working
conditions
Fair workingconditions Fair working
conditions
Conflict-freeproduct
Conflict-freeproduct
Conflict-freeproduct
Conflict-freeproduct
Conflict-freeproduct
Conflict-freeproduct
Origintraceability
Origintraceability
Origintraceability
Origintraceability
Origintraceability
Origintraceability
Support localcommunities
Support localcommunities
Support localcommunities
Support localcommunities
Support localcommunities
Support localcommunities
Environmentpreservation
Environmentpreservation
Environmentpreservation
Environmentpreservation
Environmentpreservation
Environmentpreservation
Carbonfootprint
Carbonfootprint
Carbonfootprint
Carbonfootprint
Carbonfootprint
Carbonfootprint
Figure 38: When purchasing diamond jewelry, sustainability concerns could be a deal-breaker for consumers
68%
32%
58%
42%
58%
42%
56%
44%
76%
24%
73%
27%
Notes: Prompted question; 100% of panel bought/received diamond jewelry within last 24 months; represents respondents who ranked sustainability as one of the top 3 important characteristics of diamond jewelry or considered sustainability when choosing diamond jewelrySource: Bain online consumer surveys in the US (N=496), India (N=530) and China (N=501) in November 2020
Could sustainability concerns (impact on environment and local communities) be a deal-breaker/stop you from purchasing diamond jewelry?
No
Yes
Millennials &Generation Z
Millennials &Generation Z
Millennials &Generation Z
US India
Eldergenerations
Eldergenerations
Eldergenerations
China
The Global Diamond Report 2020–21
40
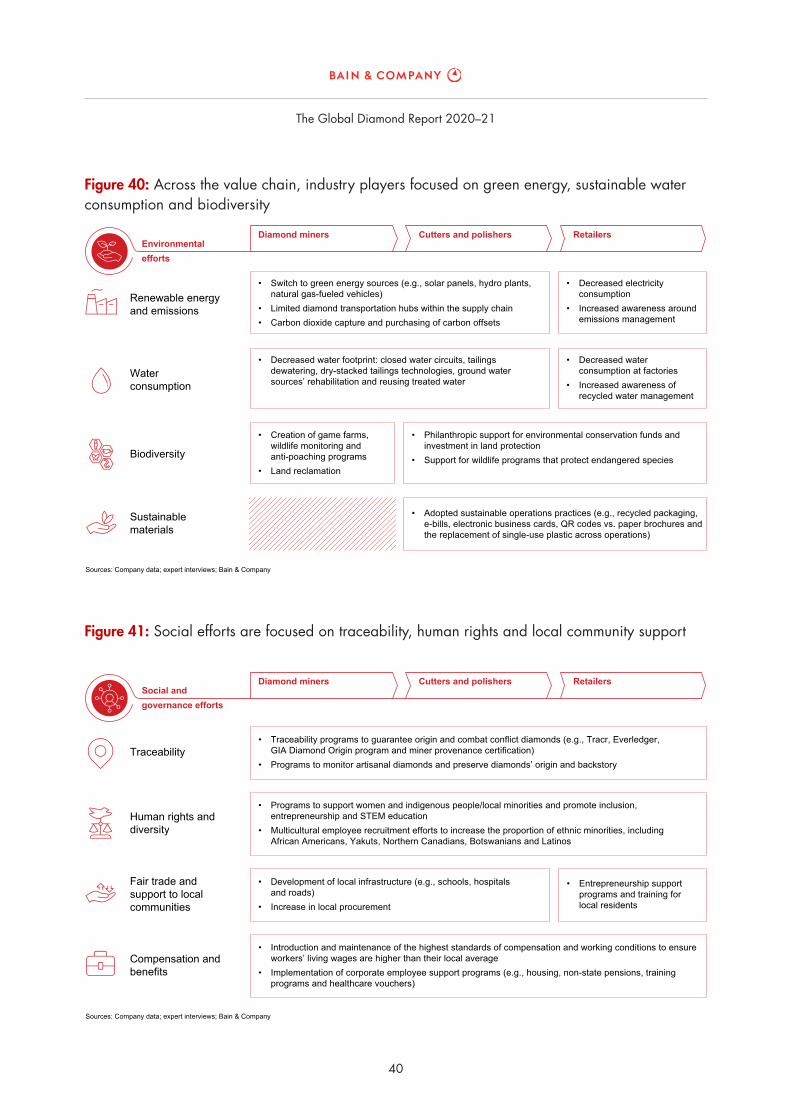
Figure 41: Social efforts are focused on traceability, human rights and local community support
Sources: Company data; expert interviews; Bain & Company
Diamond miners Cutters and polishers RetailersSocial andgovernance efforts
• Entrepreneurship support programs and training for local residents
Fair trade and support to local communities
• Development of local infrastructure (e.g., schools, hospitals and roads)
• Increase in local procurement
Compensation and benefits
• Introduction and maintenance of the highest standards of compensation and working conditions to ensure workers’ living wages are higher than their local average
• Implementation of corporate employee support programs (e.g., housing, non-state pensions, training programs and healthcare vouchers)
Traceability• Traceability programs to guarantee origin and combat conflict diamonds (e.g., Tracr, Everledger,
GIA Diamond Origin program and miner provenance certification)• Programs to monitor artisanal diamonds and preserve diamonds’ origin and backstory
Human rights and diversity
• Programs to support women and indigenous people/local minorities and promote inclusion, entrepreneurship and STEM education
• Multicultural employee recruitment efforts to increase the proportion of ethnic minorities, including African Americans, Yakuts, Northern Canadians, Botswanians and Latinos
Figure 40: Across the value chain, industry players focused on green energy, sustainable water consumption and biodiversity
Sources: Company data; expert interviews; Bain & Company
Diamond miners Cutters and polishers RetailersEnvironmentalefforts
Renewable energy and emissions
Water consumption
Biodiversity
Sustainable materials
• Switch to green energy sources (e.g., solar panels, hydro plants, natural gas-fueled vehicles)
• Limited diamond transportation hubs within the supply chain• Carbon dioxide capture and purchasing of carbon offsets
• Decreased electricity consumption
• Increased awareness around emissions management
• Creation of game farms, wildlife monitoring and anti-poaching programs
• Land reclamation
• Philanthropic support for environmental conservation funds and investment in land protection
• Support for wildlife programs that protect endangered species
• Decreased water footprint: closed water circuits, tailings dewatering, dry-stacked tailings technologies, ground water sources’ rehabilitation and reusing treated water
• Decreased water consumption at factories
• Increased awareness of recycled water management
• Adopted sustainable operations practices (e.g., recycled packaging, e-bills, electronic business cards, QR codes vs. paper brochures and the replacement of single-use plastic across operations)
The Global Diamond Report 2020–21
41
Figure 43: Retail price discounts for lab-grown diamonds vs. natural diamonds have slightly increased in the past year
Notes: Values calculated with the average discount and price for the given period; G refers to gem color; VS refers to VS1 and VS2 claritySources: Expert interviews; online retailers’ websites; Bain & Company
Price of polished lab-grown diamond as a percentage of polished natural diamond(1 carat G VS polished)
Q4 2017 Q4 2018 Q4 2019 Q4 2020E
~50%
~20%
~50%
~20%
~35%
~20%
Wholesaleprice
~65%
~55%
Retailprice
Figure 42: Lab-grown diamond capacity is increasing across the globe; current production is around 6 to 7 million carats
Notes: CVD is chemical vapor deposition technology; HPHT is high-pressure, high-temperature technology; the list of players is not exhaustive and includes only key LGD playersSources: Company data; publication analysis; expert interviews; Bain & Company
Total gem-quality lab-grown diamond rough production, 2020E: ~6–7 million carats (Mcts)
HPHTCVD
US: ~1 Mcts• Diamond Foundry• Lightbox/Element Six• Washington Diamonds
Europe and Middle East: ~0.5 Mcts• AOTC• Ziemer Technologies• Green Rocks• Lusix
Russia: ~0.2 Mcts• Wonder Technologies• New Diamond Technology
China: ~3 Mcts• Ningbo CrysDiam
Industrial• Shanghai Zheng Shi
Technology• Zhengzhou Sino-Crystal
Diamond• Zhongan Diamond• Henan Huanghe
Whirlwind
Singapore: ~1 Mcts• IIa Technologies • Trosik
India: ~1.5 Mcts• Creative Technologies• New Diamond Era• Diamond Elements• ALTR
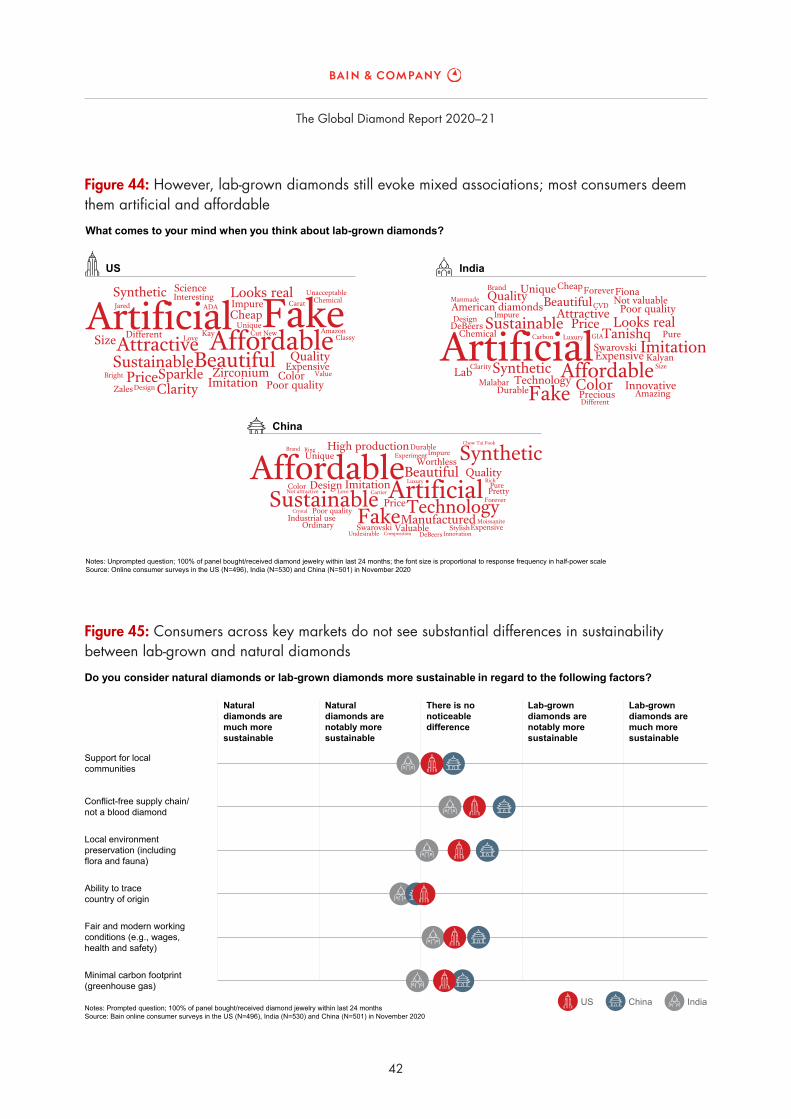
The Global Diamond Report 2020–21
42
Figure 45: Consumers across key markets do not see substantial differences in sustainability between lab-grown and natural diamonds
Notes: Prompted question; 100% of panel bought/received diamond jewelry within last 24 monthsSource: Bain online consumer surveys in the US (N=496), India (N=530) and China (N=501) in November 2020
Do you consider natural diamonds or lab-grown diamonds more sustainable in regard to the following factors?
Support for local communities
Conflict-free supply chain/ not a blood diamond
Local environment preservation (including flora and fauna)
Ability to trace country of origin
Fair and modern working conditions (e.g., wages, health and safety)
Minimal carbon footprint (greenhouse gas)
Natural diamonds are much more sustainable
Natural diamonds are notably more sustainable
There is no noticeable difference
Lab-grown diamonds are notably more sustainable
Lab-grown diamonds are much more sustainable
IndiaChinaUS
Figure 44: However, lab-grown diamonds still evoke mixed associations; most consumers deem them artificial and affordable
Notes: Unprompted question; 100% of panel bought/received diamond jewelry within last 24 months; the font size is proportional to response frequency in half-power scaleSource: Online consumer surveys in the US (N=496), India (N=530) and China (N=501) in November 2020
What comes to your mind when you think about lab-grown diamonds?
US India
China

The Global Diamond Report 2020–21
43
Figure 47: “Diamond engagement ring” searches show stability despite downward-trending marriage rates; however, overall interest in “diamond jewelry” is declining
Note: Includes Jan–Dec data globallySources: Google trends; Baidu; Euromonitor; Bain & Company
Popularity dynamics of “Diamond jewelry” and “Diamond engagement ring” searches in Google globally and in Baidu for China, 2011 January index=100
Global marriages, millions
Diamond jewelry Diamond engagement ring Global marriage rate
20
210
100
28
30
32
34
12 13 14 15 16 17 18 192011 20E
Figure 46: The lab-grown segment is developing rapidly due to technological advancements and rising acceptance across the value chain
Technological advancements led to larger yields and higher production levels; profitability expectations shifted CVD and HPHT producers toward larger stones
Prices of larger lab-grown stones are moving away from being pegged to natural diamond prices to a cost-plus model; price declines for smaller goods are slowing; midstream and retail LGD margins are starting to contract
LGDs are edging into the fashion category as interest is rising among price-conscious consumers who may not have considered buying natural diamond jewelry of relative size/quality; several leading fashion jewelry houses started to offer LGDs
Notes: Other mostly comprises UK, Canada, Australia, New Zealand and European countries; CVD is chemical vapor deposition technology; HPHT is high-pressure, high-temperature technologySources: Expert interviews; company data; Bain & Company
Lab-grown diamond retail market split by regions, 2020E
Key lab-grown diamond trends in 2020
YOY change(2019–20E)
2020E
US
China
Other
3
2
1India

The Global Diamond Report 2020–21
44
Figure 49: Self-purchase emerged as a top reason to buy diamond jewelry in the US and China
Notes: Prompted question; 100% of panel bought/received diamond jewelry within last 24 months; represents respondents who have bought/received jewelry with natural diamonds other than an engagement ring; response “Other” includes Christmas, Valentine’s Day and holidays Source: Bain online consumer surveys in the US (N=496), India (N=530) and China (N=501) in November 2020
For what reasons/events did you buy/receive jewelry (other than an engagement ring) with natural diamonds?
Top 3 mentioned events
For yourself as a treat (self-purchase) As an appreciation gift for someoneWedding, marriage, engagement or other relationship eventFamily event (e.g., childbirth, pregnancy)
Investment
Social event (e.g., party)
Job-related success
Other
54%
India
1%
6%
12%
15%
37%
33%
27%
US
12%
3%
5%
10%
24%
25%
27%
29%
1%
9%
14%
10%
24%
36%
24%
46%
China
Figure 48: In India and China, jewelry remains one of the most desirable presents
Notes: Prompted question; 100% of panel bought/received diamond jewelry within last 24 months Sources: Bain online consumer surveys in the US (N=496), India (N=530) and China (N=501) in November 2020; Bain online consumer surveys in the US (N=515), India (N=510) and China (N=511) in September 2016; Bain online consumer surveys in the US (N=542), India (N=544) and China (N=507) in July–September 2012
Rank
4
65
3
2
1
US China India
What kind of presents do you prefer to receive?
Cosmetics/PerfumesMoney/Cash Electronics Holidays/TripsClothes/Handbags/ShoesJewelry/Watches
2012 2016 2020 2012 2016 2020 2012 2016 2020
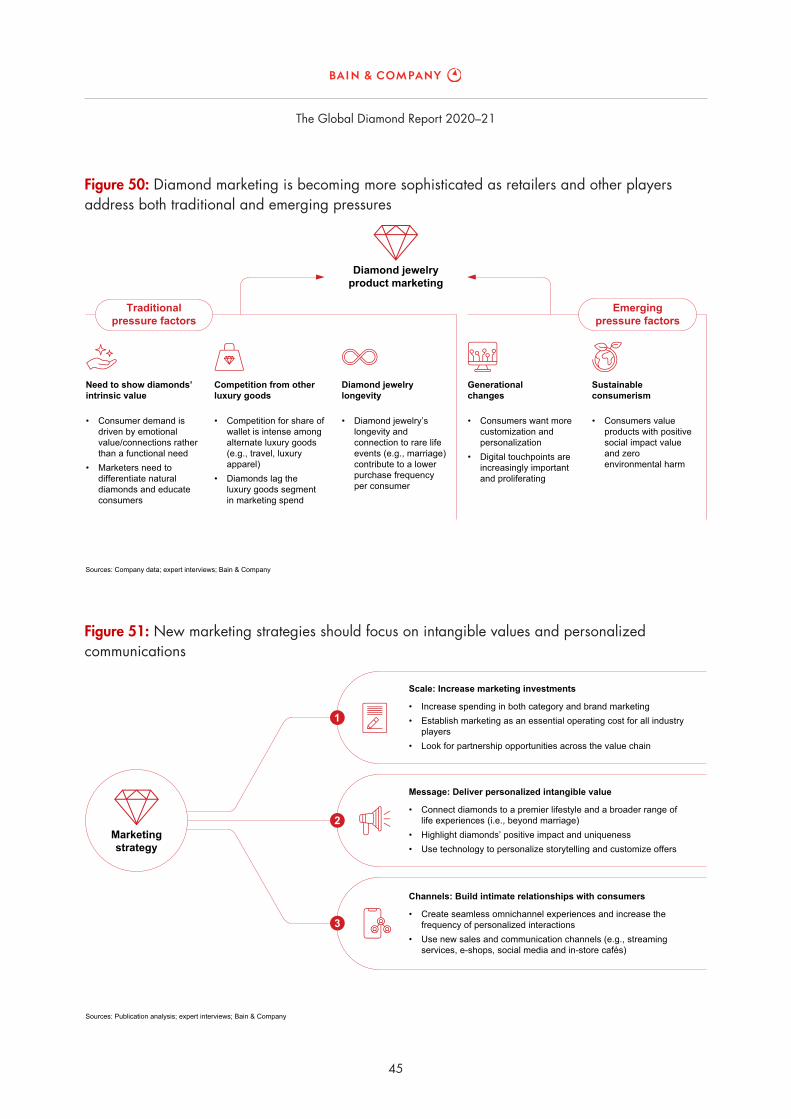
The Global Diamond Report 2020–21
45
Figure 51: New marketing strategies should focus on intangible values and personalized communications
Sources: Publication analysis; expert interviews; Bain & Company
Marketingstrategy
2
1
3
Scale: Increase marketing investments
• Increase spending in both category and brand marketing• Establish marketing as an essential operating cost for all industry
players• Look for partnership opportunities across the value chain
Message: Deliver personalized intangible value
• Connect diamonds to a premier lifestyle and a broader range of life experiences (i.e., beyond marriage)
• Highlight diamonds’ positive impact and uniqueness • Use technology to personalize storytelling and customize offers
Channels: Build intimate relationships with consumers
• Create seamless omnichannel experiences and increase the frequency of personalized interactions
• Use new sales and communication channels (e.g., streaming services, e-shops, social media and in-store cafés)
Figure 50: Diamond marketing is becoming more sophisticated as retailers and other players address both traditional and emerging pressures
Sources: Company data; expert interviews; Bain & Company
Diamond jewelryproduct marketing
Traditionalpressure factors
Emergingpressure factors
Need to show diamonds’ intrinsic value
• Consumer demand is driven by emotional value/connections rather than a functional need
• Marketers need to differentiate natural diamonds and educate consumers
Competition from other luxury goods
• Competition for share of wallet is intense among alternate luxury goods (e.g., travel, luxury apparel)
• Diamonds lag the luxury goods segment in marketing spend
Diamond jewelry longevity
• Diamond jewelry’s longevity and connection to rare life events (e.g., marriage) contribute to a lower purchase frequency per consumer
Generational changes
• Consumers want more customization and personalization
• Digital touchpoints are increasingly important and proliferating
Sustainable consumerism
• Consumers value products with positive social impact value and zero environmental harm
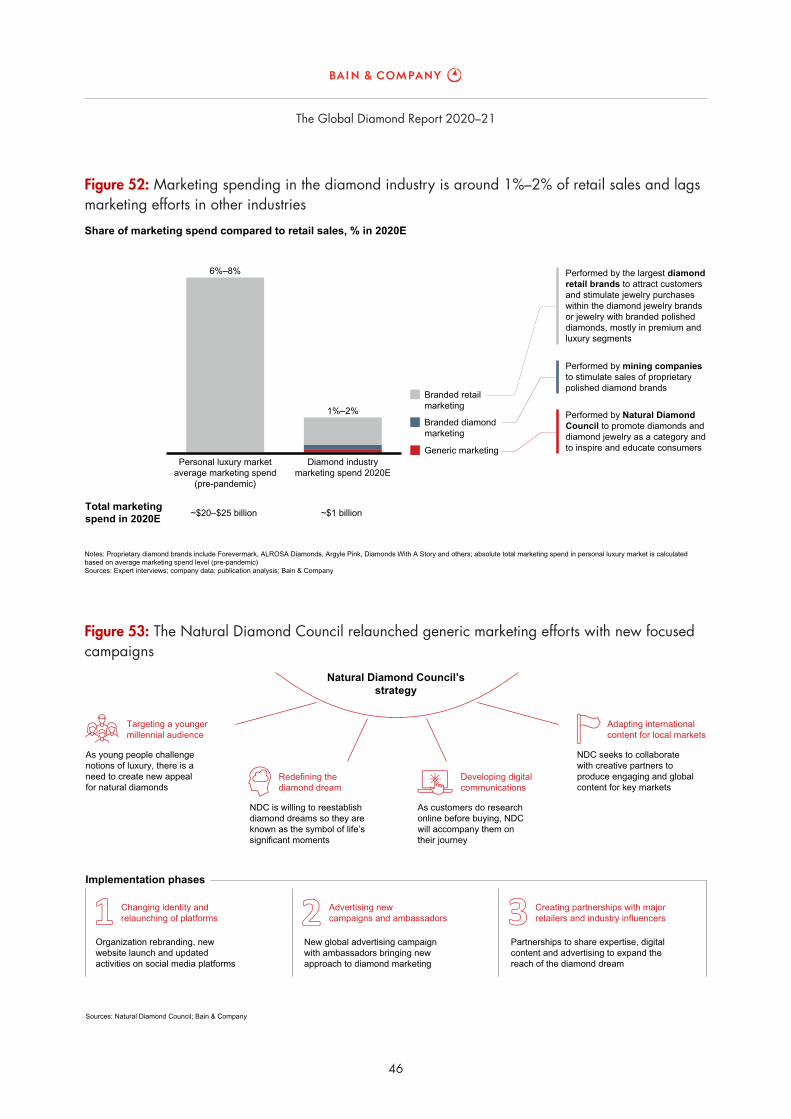
The Global Diamond Report 2020–21
46
Figure 53: The Natural Diamond Council relaunched generic marketing efforts with new focused campaigns
Sources: Natural Diamond Council; Bain & Company
Changing identity and relaunching of platforms
Advertising new campaigns and ambassadors
Creating partnerships with major retailers and industry influencers
Organization rebranding, new website launch and updated activities on social media platforms
New global advertising campaign with ambassadors bringing new approach to diamond marketing
Partnerships to share expertise, digital content and advertising to expand the reach of the diamond dream
Natural Diamond Council’sstrategy
Implementation phases
NDC seeks to collaborate with creative partners to produce engaging and global content for key markets
Adapting international content for local markets
As customers do research online before buying, NDC will accompany them on their journey
Developing digital communications
NDC is willing to reestablish diamond dreams so they are known as the symbol of life’s significant moments
Redefining the diamond dream
Targeting a youngermillennial audience
As young people challenge notions of luxury, there is a need to create new appeal for natural diamonds
Figure 52: Marketing spending in the diamond industry is around 1%–2% of retail sales and lags marketing efforts in other industries
Share of marketing spend compared to retail sales, % in 2020E
Total marketingspend in 2020E
6%–8%
1%–2%
Personal luxury marketaverage marketing spend
(pre-pandemic)
Diamond industry
marketing spend 2020E
~$20–$25 billion ~$1 billion
Branded retailmarketing
Branded diamondmarketing
Generic marketing
Performed by the largest diamondretail brands to attract customers and stimulate jewelry purchases within the diamond jewelry brands or jewelry with branded polished diamonds, mostly in premium and luxury segments
Performed by mining companies to stimulate sales of proprietary polished diamond brands
Performed by Natural Diamond Council to promote diamonds and diamond jewelry as a category andto inspire and educate consumers
Notes: Proprietary diamond brands include Forevermark, ALROSA Diamonds, Argyle Pink, Diamonds With A Story and others; absolute total marketing spend in personal luxury market is calculated based on average marketing spend level (pre-pandemic) Sources: Expert interviews; company data; publication analysis; Bain & Company
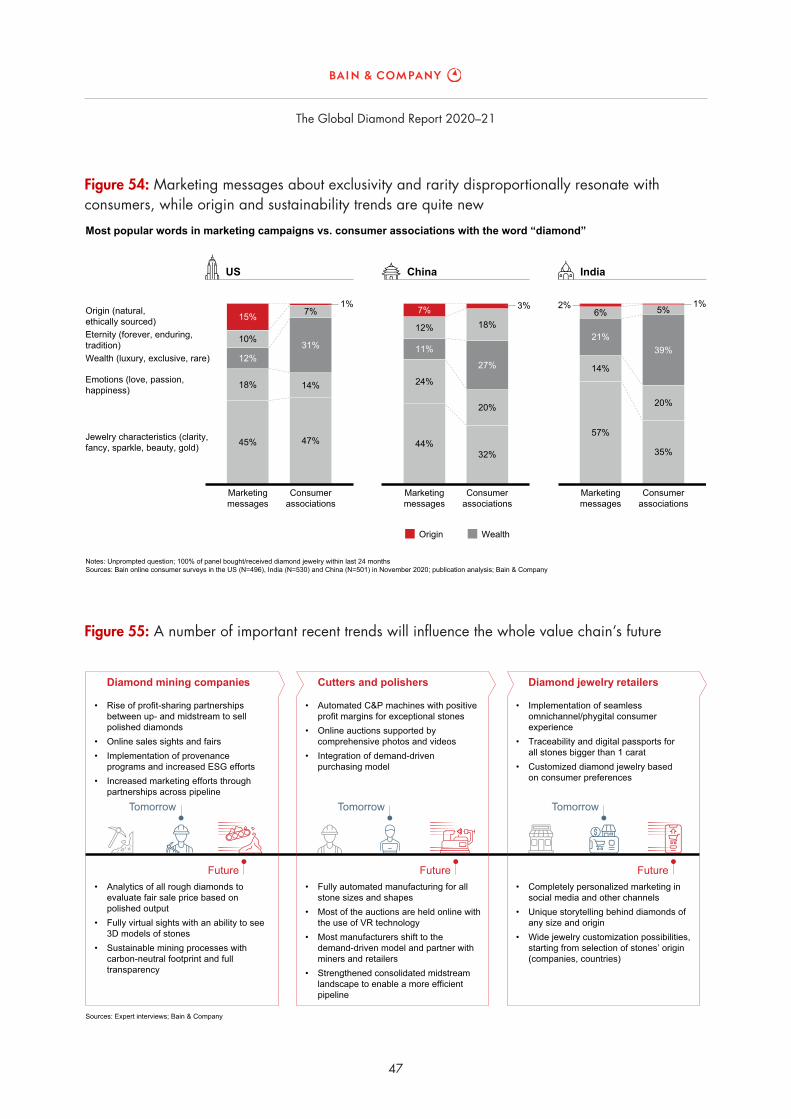
The Global Diamond Report 2020–21
47
Figure 55: A number of important recent trends will influence the whole value chain’s future
Future
Sources: Expert interviews; Bain & Company
• Rise of profit-sharing partnerships between up- and midstream to sell polished diamonds
• Online sales sights and fairs• Implementation of provenance
programs and increased ESG efforts• Increased marketing efforts through
partnerships across pipeline
• Automated C&P machines with positive profit margins for exceptional stones
• Online auctions supported by comprehensive photos and videos
• Integration of demand-driven purchasing model
• Implementation of seamless omnichannel/phygital consumer experience
• Traceability and digital passports for all stones bigger than 1 carat
• Customized diamond jewelry based on consumer preferences
• Analytics of all rough diamonds to evaluate fair sale price based on polished output
• Fully virtual sights with an ability to see 3D models of stones
• Sustainable mining processes with carbon-neutral footprint and full transparency
• Fully automated manufacturing for all stone sizes and shapes
• Most of the auctions are held online with the use of VR technology
• Most manufacturers shift to the demand-driven model and partner with miners and retailers
• Strengthened consolidated midstream landscape to enable a more efficient pipeline
• Completely personalized marketing in social media and other channels
• Unique storytelling behind diamonds of any size and origin
• Wide jewelry customization possibilities, starting from selection of stones’ origin (companies, countries)
Future Future
Tomorrow Tomorrow Tomorrow
Diamond mining companies Cutters and polishers Diamond jewelry retailers
Figure 54: Marketing messages about exclusivity and rarity disproportionally resonate with consumers, while origin and sustainability trends are quite new
Notes: Unprompted question; 100% of panel bought/received diamond jewelry within last 24 monthsSources: Bain online consumer surveys in the US (N=496), India (N=530) and China (N=501) in November 2020; publication analysis; Bain & Company
Most popular words in marketing campaigns vs. consumer associations with the word “diamond”
Origin (natural, ethically sourced)Eternity (forever, enduring, tradition) Wealth (luxury, exclusive, rare)
Emotions (love, passion, happiness)
Jewelry characteristics (clarity, fancy, sparkle, beauty, gold)
Origin Wealth
45%
18%
12%
10%
15%
47%
14%
31%
7%1%
44%
24%
11%
12%
7%
32%
20%
27%
18%
3%
Marketingmessages
Consumerassociations
Marketingmessages
Consumerassociations
Marketingmessages
Consumerassociations
57%
14%
21%
6%
35%
20%
39%
5%2% 1%
US IndiaChina


Updated supply and demand model
6• The Covid-19 recession is likely to be more severe than the 2009 recession. In developed countries, eco-
nomic recovery to pre-pandemic levels is expected in 2021–23, if Covid-19 vaccines are deployed in 2021 as anticipated. Rough diamond production is projected to recover to the “new normal” in the next two to three years and remain stable from 2023–30. Excess rough diamond stock will gradually enter the pipeline within the next one to two years to ensure smooth supply. Demand for diamond jewelry is expected to recover to pre-pandemic levels in 2022–24. If fundamental factors such as GDP and middle- and high-net-worth class growth are as strong as projected, and there’s sufficient marketing support, then long-term demand is expected to grow at an average annual rate up to 2% to 3% from 2023–30.
• The US is expected to reach pre-pandemic economic levels by 2021–22, ahead of most of other coun-tries, because of increased government spending. GDP growth was positive in China in 2020; econom-ic recovery across all Chinese industries is expected in 2021. India’s recovery will come later, in 2023–24. Recoveries could be affected by new strains of the virus or government policies to stop its spread. Such circumstances could lead to a double-dip recession and another downturn before the economy is revitalized.
• In the long term, the global economy is projected to grow at an annual rate of 3%. The US, China and India will continue to lead the growth in diamond jewelry purchasing. We expect the US economy and personal disposable income to grow around 2% annually. In China, diamond jewelry demand will be driven by 4% growth in affluent and high-net-worth individuals and from expanded retail footprints in lower-tier cities. In India, diamond jewelry demand will follow middle-class growth (10% annually) and be reinforced by the country’s affinity for jewelry and the expansion of internationally branded retailers. These factors provide a strong foundation for growth beyond 2023.
• In the lab-grown market, consolidation, production capacity growth in China and technological ad-vancements are causing unit costs and prices to drop. If that continues, lab-grown diamonds could ex-pand into the wider mass jewelry segment, targeting a different audience than natural diamonds. Alter-natively, if the trend of product differentiation reverses, we could see more lab-grown diamonds in the premium jewelry segment, compensating for the decreased supply of natural diamonds.
• This forecast does not consider several factors that could disrupt the supply-demand balance in the short term or slow down the longer-term global trajectory. A number of risks may cause a double-dip reces-sion: the US failing to agree on new stimulus programs; escalating trade wars between the US and Chi-na; European debt or currency crises; India’s increased vulnerability to oil prices; or increased taxation to cope with budget deficits. Sustained consumer fears about Covid-19 and new restrictions to stop its spread are additional risks that could impede recovery. Elevated competition from alternative luxury goods is another potential risk. If materialized, these risks could decrease consumer spending on dia-mond jewelry considerably and lead to longer recovery periods in key markets.

The Global Diamond Report 2020–21
50
Figure 57: Long-term scenarios for natural rough diamond demand and supply rely on key assumptions
Sources: Euromonitor; The Economist Intelligence Unit; company data; expert interviews; Bain & Company
• Economic recovery from the global recession is relatively fast; return to pre-pandemic levels occurs in 2021–22 in developed markets and in 2022–23 in emerging markets (except for China, which recovered from the effects of Covid-19 and reached 2% real GDP growth in 2020)
• Widespread vaccination across developed countries in 2021 improves consumer confidence and supports further economic recovery
• Global GDP long-term growth is 3% or higher• Effective marketing campaigns (brand and generic) cause
Millennials and Generation Z consumers to prefer natural diamond jewelry to celebrate special moments
• Mines that continued to operate in 2020 will reach pre-pandemic production levels by 2021–22. Junior miners that put operations on care and maintenance in 2020 will reopen promptly/return to planned capacity (increase of ~4–5 Mcts). Accumulated excess inventories will gradually sell out in a year
• The diamond value chain will be transparent and efficient, and companies across all segments will have sufficient access to debt or equity financing
• Lab-grown diamonds will mostly concentrate on the mass jewelry segment and a different target audience than natural stones
• A prolonged global recession delays the return to pre-pandemic levels until 2022–23 in developed markets and until 2023–24 in emerging markets
• Vaccines prove more difficult to scale than anticipated. Governments gradually loosen restrictions in the beginning of 2022
• Global GDP long-term growth is between 1% and 2%• Lack of sufficient marketing support causes an affinity for natural
diamond jewelry to decrease among Millennials and Generation Z• Junior miners that halted operations in 2020 will not reopen or will
not scale up operations to pre-pandemic levels in the near future. Major miners’ production will stabilize at a new normal level. Accumulated inventories will sell out in 1–2 years
• Inefficiencies will persist in the diamond pipeline, with hindered access to debt or equity financing options
• The trend of product differentiation will reverse and lab-grown diamonds will focus on both mass and premium segments and a less-distinct target audience
Optimistic scenario Conservative scenario
Figure 56: Covid-19 impacted key markets in the short term, but the industry’s long-term macroeconomic and consumption outlooks remain positive
Sources: Euromonitor; The Economist Intelligence Unit; expert interviews; Bain & Company
• Economic recovery began in H2 2020 and is expected to reach the pre-pandemic level by the end of 2021 or beginning of 2022 as a result of anticipated widespread immunization and government spending policies
• Long-term GDP growth is expected to be 2%, driven by automation and robotization
• Average personal disposable income is expected to grow at the same annual rate as GDP from 2022–30
• In the diamond jewelry market, recovery to the pre-pandemic level is anticipated by 2022–23, with long-term annual growth of 1%–2% in 2023–30
• Overall, the US will contribute ~50%–60% of the total jewelry market growth during the next 10 years
• Economic recovery began toward the end of H1 2020, and the economy posted low single-digit growth already in 2020. China was first to enter a Covid-19 recession and took effective measures to control the spread of the disease
• Long-term GDP growth of 5% will be driven by middle class, mass affluent and high-net-worth population expansion, income growth, a rise in domestic consumption and retail expansion into smaller cities
• The middle and higher income strata is expected to grow by 4% per annum on average
• The diamond jewelry market is expected to recover fully in early 2021, with long-term growth of 2%–3% annually in 2023–30
• Overall, China will contribute ~10%–20% of the total jewelry market growth during the next 10 years
• Economic recovery began at the end of 2020 and is subject to comprehensive fiscal and monetary policies. Due to significant exposure of the economy during the pandemic, the path to the pre-pandemic level is expected to be U-shaped, ending in 2022–23
• Long-term GDP growth of 7% will be largely supported by a rapidly expanding middle class and enhanced technological and digital capabilities
• Driven by urbanization, middle- and high-income households are expected to double, subject to 10% growth per annum
• The diamond jewelry market is expected to recover to the pre-pandemic level by the end of 2023–24, with long-term growth of the diamond jewelry market at 2%–4% per annum
• Overall, India will contribute ~5%–10% of the total jewelry market growth during the next 10 years
US China India
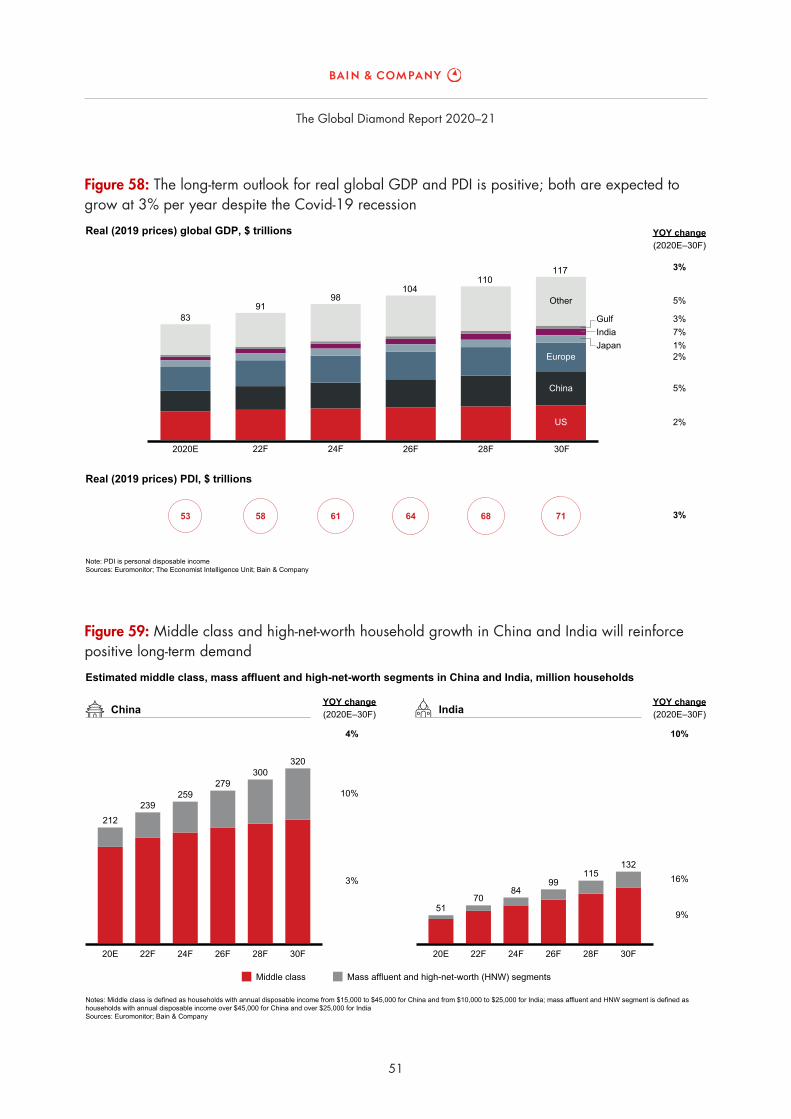
The Global Diamond Report 2020–21
51
Figure 59: Middle class and high-net-worth household growth in China and India will reinforce positive long-term demand
Notes: Middle class is defined as households with annual disposable income from $15,000 to $45,000 for China and from $10,000 to $25,000 for India; mass affluent and HNW segment is defined as households with annual disposable income over $45,000 for China and over $25,000 for IndiaSources: Euromonitor; Bain & Company
Estimated middle class, mass affluent and high-net-worth segments in China and India, million households
YOY change(2020E–30F)
3%
10%
20E 22F 24F 26F 28F 30F
212239
259279
300320
YOY change(2020E–30F)
10%
132
9%
16%
51
20E
70
22F
84
24F
99
26F
115
28F 30F
IndiaChina
Middle class Mass affluent and high-net-worth (HNW) segments
4%
Figure 58: The long-term outlook for real global GDP and PDI is positive; both are expected to grow at 3% per year despite the Covid-19 recession
Note: PDI is personal disposable incomeSources: Euromonitor; The Economist Intelligence Unit; Bain & Company
Real (2019 prices) global GDP, $ trillions
Real (2019 prices) PDI, $ trillions
2020E
83
22F
91
24F
98
26F
104
28F
110
30F
China
US
Europe
IndiaJapan
Gulf
Other
117
YOY change(2020E–30F)
3%
5%
2%
5%
2%
7%1%
3%
3%53 58 61 64 68 71

The Global Diamond Report 2020–21
52
Figure 61: The supply-demand outlook is moderately optimistic
Notes: The gray line represents rough diamond sales dynamics for 2000–20E; forecast of supply and demand is performed in real terms, 2020 prices and constant exchange rates; rough diamond demand has been converted from polished diamond demand using a historical ratio of rough diamond and polished diamond valuesSources: Kimberley Process; The Economist Intelligence Unit; Euromonitor; company data; publication analysis; expert interviews; Bain & Company
Rough natural diamond supply and demand, $ billions, optimistic and conservative scenarios
5
10
15
20
2000 05 10 15 20E 25F 30F
Long-termgrowth trend(1%–2% p.a.)
Forecast
Optimistic natural rough diamond demand
Conservative natural rough diamond demand
Optimistic natural rough diamond supply
Conservative natural rough diamond supply
10% to 11%
6% to 7%
12% to 13%
15% to 16%
1% to 2%
−2% to −1%
0% to 1%
2% to 3%
YOY change(2020E–23F) (2023F–30F)
Figure 60: Supply is expected to be almost flat over the next 10 years, with very few new projects coming online
Notes: New mines: Luaxe, Chidliak, Star-Orion South, Zarya, Maiskaya and Tongo-Tonguma Diamond Project; new projects could include potential projects that are not yet in development, but which may become viable should rough prices increaseSources: Company data; Kimberley Process; expert interviews; publication analysis; Bain & Company
Rough diamond supply, million carats, optimistic scenario
Existing mines New mines/projects
60
90
120
150
180
YOY change(2020E–30F)
1% to 2%
0
30
2018 20E 23F 26F 30F
Forecast
Rough diamond supply, million carats, conservative scenario
60
90
120
150
180
YOY change(2020E–30F)
−2% to −1%
0
30
2018 20E 23F 26F 30F
Forecast
The Global Diamond Report 2020–21
53

Bold ideas. Bold teams. Extraordinary results.
Bain & Company is a global consultancy that helps the world’s most ambitious change makers define the future.
Across 59 offices in 37 countries, we work alongside our clients as one team with a shared ambition to achieve extraordinary results, outperform the competition and redefine industries. We complement our tailored, integrated expertise with a vibrant ecosystem of digital innovators to deliver better, faster and more enduring outcomes. Our 10-year commitment to invest more than $1 billion in pro bono services brings our talent, expertise and insight to organizations tackling today’s urgent challenges in education, racial equity, social justice, economic development and the environment. Since our founding in 1973, we have measured our success by the success of our clients, and we proudly maintain the highest level of client advocacy in the industry.
For more information, visit www.bain.com
Amsterdam • Atlanta • Bangkok • Beijing • Bengaluru • Berlin • Bogotá • Boston • Brussels • Buenos Aires • Chicago Copenhagen • Dallas • Doha • Dubai • Düsseldorf • Frankfurt • Helsinki • Hong Kong • Houston • Istanbul • Jakarta Johannesburg • Kuala Lumpur • Kyiv • Lagos • London • Los Angeles • Madrid • Melbourne • Mexico City • Milan Minneapolis • Moscow • Mumbai • Munich • New Delhi • New York • Oslo • Palo Alto • Paris • Perth • Rio de Janeiro Riyadh • Rome • San Francisco • Santiago • São Paulo • Seattle • Seoul • Shanghai • Singapore • Stockholm • Sydney Tokyo • Toronto • Warsaw • Washington, DC • Zurich
AWDC (Antwerp World Diamond Centre)
AWDC is a public-private partnership, officially representing and coordinating the Antwerp diamond industry. Its mission is twofold: to reinforce Antwerp’s position as the world’s leading diamond trade center and promote the image of diamonds to a general audience. AWDC does this through Diamond Office, where AWDC streamlines the vast import and export flow of diamonds in and out of Antwerp, and through a wide variety of dedicated marketing campaigns, services, conferences, trade fairs, eco-nomic missions and much more. AWDC’s goal is to service all those involved or interested in our fasci-nating stones, from professional players like the mining giants to the bride-to-be looking for her perfect wedding ring.
For more information, visit www.awdc.be/en/
Related Documents