The Glenmore Improving Sustaina Dr. Gordon L Prof. Bernard Momer, C Elle Da This project was funded by a National Sciences an i ComPASS Research Study – Pha ability Options for the Glenmore Com Final Draft 9/30/2011 Lovegrove, UBCO School of Engineering, PI Community, Culture and Global Studies, UBCO en Morrison, UBCO MASc Student avid Sonmor, UBCO BASc Student UBC Okanagan Sustainable Community Resear nd Engineering Research Council (NSERC) Gra ase 1 mmunity O, Co PI rch Grant and ants.

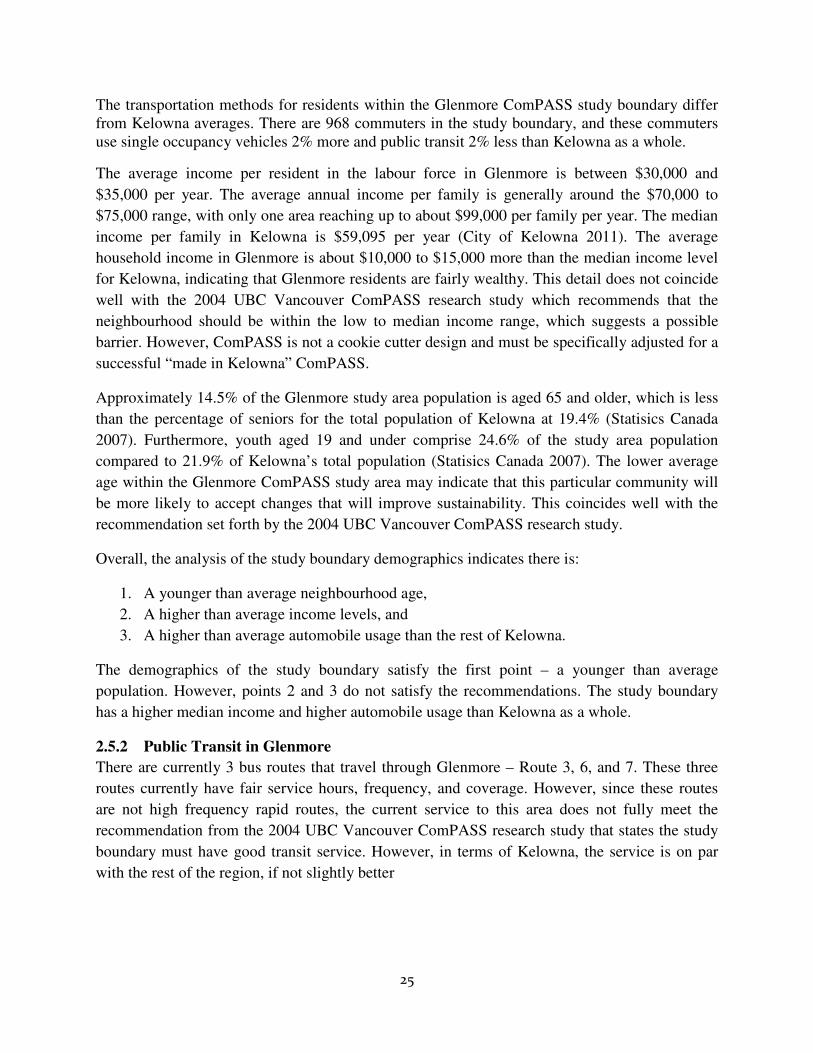
Welcome message from author
This document is posted to help you gain knowledge. Please leave a comment to let me know what you think about it! Share it to your friends and learn new things together.
Transcript
The Glenmore ComPASS Research StudyImproving Sustainability Options for the Glenmore Community
Dr. Gordon Lovegrove, UBCO School of Engineering, PI
Prof. Bernard Momer, Community, Culture and Global Studies, UBCO, Co PI
Ellen Morrison, UBCO MASc Student
David Sonmor, UBCO BASc Student
This project was funded by a National Sciences and Engineering
i
The Glenmore ComPASS Research Study – Phase 1Improving Sustainability Options for the Glenmore Community
Final Draft
9/30/2011
Dr. Gordon Lovegrove, UBCO School of Engineering, PI
Prof. Bernard Momer, Community, Culture and Global Studies, UBCO, Co PI
Ellen Morrison, UBCO MASc Student
David Sonmor, UBCO BASc Student
UBC Okanagan Sustainable Community Research Grant andNational Sciences and Engineering Research Council (NSERC) Grants.
Phase 1 Improving Sustainability Options for the Glenmore Community
Prof. Bernard Momer, Community, Culture and Global Studies, UBCO, Co PI
ity Research Grant and (NSERC) Grants.

i
Acknowledgements
The Glenmore ComPASS Steering Committee provided valuable local expertise without which this project would not have been possible.
Leanne Bilodeau, Director of Sustainability Operations, UBC Okanagan
Valary Chidwick, Central Okanagan Parent Advisory Committee (PAC) Representative, Glenmore Elementary School PAC
Joanne de Vries, Fresh Outlook Foundation Jerry Dombowsky, Transportation Demand Supervisor, City of Kelowna
Bruce Gillon, Secretary, Glenmore Valley Community Association John Harling, President, Glenmore Valley Community Association
Michelle Kam, Sustainability Coordinator, City of Kelowna Susan Kasper, Financial Advisor, Edward Jones
Nicole Kleemaier, President, Glenmore Elementary School PAC Pam Moore, Environmental Health Officer, Healthy Community Environment, Interior Health Louise Roberts-Taylor, Manager of Community & Neighbourhood Programs, City of Kelowna Harold Schock, Energy & Sustainability Manager, School District No. 23 (Central Okanagan)
Janine Taylor, Marketing & Communications Advisor, City of Kelowna Erika van Oyen, Teacher, Glenmore Elementary School
Brad Letkeman, Owner & Manager, Union Cycle
Local businesses who donated items to the project to encourage community engagement.
Union Cycle Brandt’s Neighbourhood Pub
Pizza Hut Wedge Artisan Pizza
Parkinson Recreation Centre Sculpt Yoga & Pilates
Lululemon Zaru Sushi
East Side Marios Nature’s Fare
Cineplex Entertainment Orchard Plaza 5 Yamato Japanese Restaurant
David Sonmor Red Robins
O-Ka Japanese Restaurant Sunrype
A special thanks to the City of Kelowna Park & Play and the School District for allowing us to
host events at their facilities.
Funding for this study has been generously provided by a UBC Okanagan Sustainable Community Research Grant, an NSERC Undergraduate Student Research Award (USRA), and
an NSERC Discovery Grant.
ii
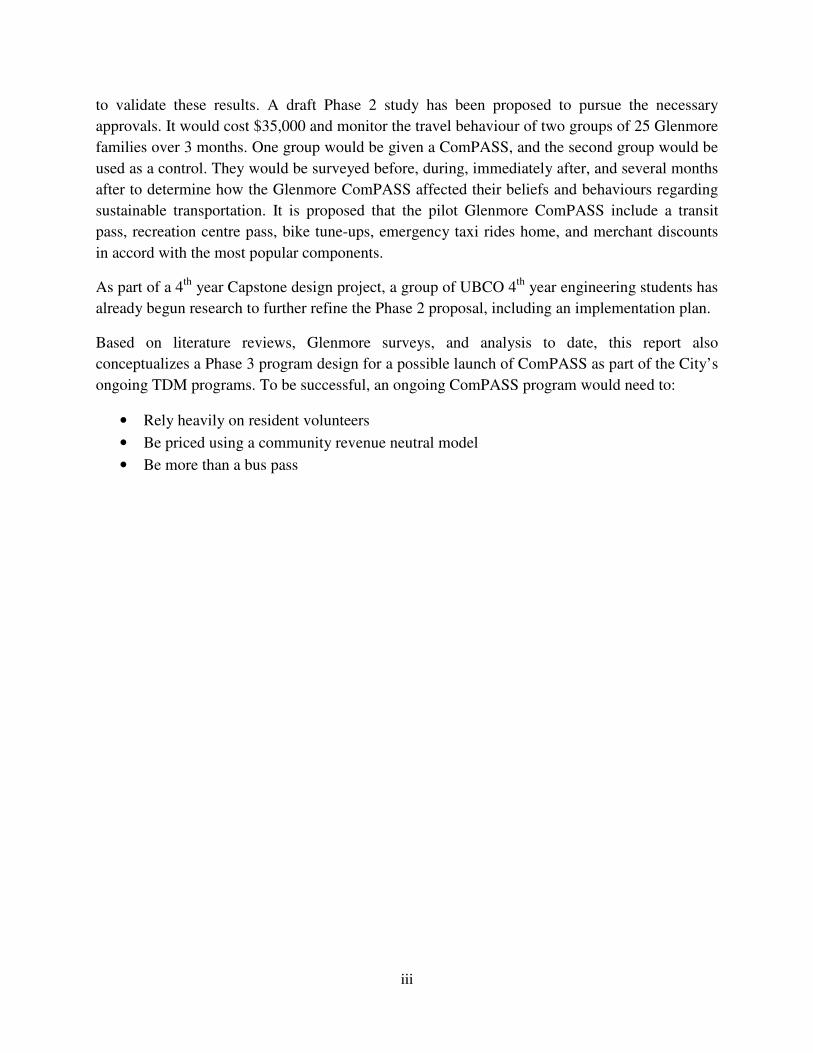
Executive Summary ComPASS is a Community unlimited access transportation pass, similar to the Universal
transportation pass (U-Pass) for UBC students (www.upass.ubc.ca), but is different in that
ComPASS is for residents. ComPASS, in one form or another, has been successfully run for
years in several communities across North America, with the most famous, the NECO Pass
Program in Boulder, Colorado (www.bouldercolorado.gov). Typically, ComPASS is applied to
all or part of a neighbourhood where each household pays a monthly fee. The ComPASS allows
unlimited local transit use and additional sustainable transportation related privileges. It has been
most successful where it is not limited to just a transit pass. A successful ComPASS will also
promote walking, cycling, carpooling, and additional low energy transportation modes, hence the
title “transportation pass” and not just “transit pass”. The main objective of the ComPASS
program is to reduce automobile use and its associated congestion, pollution, and road safety
problems.
The Sustainable Glenmore ComPASS Research Study Phase 1 objectives were to assess whether
a ComPASS program would work in Glenmore, and if so, under what conditions. Within the
Glenmore study boundary, there are approximately 1,900 residents within about 730 households.
Three public design workshops were held at Glenmore Elementary School on July 16, August
19, and September 20 to educate residents on the benefits of using sustainable transportation and
to gather their input specifically on the Glenmore ComPASS design and pricing. An online
community survey was also conducted regarding current transportation beliefs and habits and
about desired components and pricing of a potential Glenmore ComPASS.
In total, 99 online survey responses were collected with 49 responses directly from within the
Glenmore study boundary - roughly Clement, Spall, High and Clifton, which was a statistically
valid sample with a 90% confidence level and 11.4% confidence interval. Generally, survey
results indicated that residents are in favour of the implementation of a Glenmore ComPASS,
with 73% support. The most popular ComPASS components (in addition to a bus pass),
included: Parkinson Recreation Centre family pass, merchant discounts, bike tune-ups,
emergency taxi rides home, and a Glenmore community event shuttle. Survey responses also
indicated residents were willing to pay on average, $30.50 per household per month for a
Glenmore ComPASS.
A price analysis bundling the most popular Glenmore ComPASS components using the
community revenue neutral model revealed that the actual cost for a Glenmore ComPASS
program would be in the range of $15 to $20 per month per household at 100% participation.
This is a favourable outcome as willingness to pay significantly exceeds the cost.
Although Phase 1 results indicate positive feedback regarding the program, it is important to note
that Phase 1 was essentially a stated preference survey. As such, it is recommended that a 3
month Phase 2 Glenmore ComPASS revealed preference pilot program take place in spring 2012
iii
to validate these results. A draft Phase 2 study has been proposed to pursue the necessary
approvals. It would cost $35,000 and monitor the travel behaviour of two groups of 25 Glenmore
families over 3 months. One group would be given a ComPASS, and the second group would be
used as a control. They would be surveyed before, during, immediately after, and several months
after to determine how the Glenmore ComPASS affected their beliefs and behaviours regarding
sustainable transportation. It is proposed that the pilot Glenmore ComPASS include a transit
pass, recreation centre pass, bike tune-ups, emergency taxi rides home, and merchant discounts
in accord with the most popular components.
As part of a 4th year Capstone design project, a group of UBCO 4th year engineering students has
already begun research to further refine the Phase 2 proposal, including an implementation plan.
Based on literature reviews, Glenmore surveys, and analysis to date, this report also
conceptualizes a Phase 3 program design for a possible launch of ComPASS as part of the City’s
ongoing TDM programs. To be successful, an ongoing ComPASS program would need to:
• Rely heavily on resident volunteers
• Be priced using a community revenue neutral model
• Be more than a bus pass

iv
Table of Contents
1 Introduction ............................................................................................................................. 1
1.1 What is ComPASS? ......................................................................................................... 1
1.2 Objectives of the Glenmore ComPASS Project (Phase 1) ............................................... 2
1.3 Why Glenmore? ............................................................................................................... 3
1.4 Why should you care about ComPASS? .......................................................................... 4
2 Literature Review .................................................................................................................... 7
2.1 Neighbourhood Eco Pass (Boulder, Colorado) ................................................................ 7
2.2 ComPASS (Vancouver, British Columbia) .................................................................... 15
2.3 UniverCity Community Transit Pass (Burnaby, British Columbia) .............................. 17
2.4 UBC U-Pass ................................................................................................................... 20
2.5 Glenmore (Kelowna, BC) .............................................................................................. 22
2.6 Survey Design ................................................................................................................ 29
2.7 Social Marketing ............................................................................................................ 31
3 Methodology .......................................................................................................................... 36
3.1 Data Collection ............................................................................................................... 36
3.2 Stated Preference Survey ............................................................................................... 38
4 Phase 1 Results and Discussion ............................................................................................. 40
4.1 Data Description ............................................................................................................. 40
4.2 Level of Community Engagement ................................................................................. 40
4.3 Public Design Workshop Results ................................................................................... 42
4.4 Survey Data Analysis ..................................................................................................... 42
4.5 Preferred Design ............................................................................................................. 58
4.6 Preferred Price ................................................................................................................ 59
5 Conclusions, Recommendations & Future Research ............................................................ 62
5.1 Phase 1: Conclusions ...................................................................................................... 62
5.2 Recommendations for Phase 2: 3 Month Revealed Preference Pilot Study .................. 62
5.3 Phase 3: Permanent ComPASS TDM Program Design ................................................. 65
6 References ............................................................................................................................. 72
v
List of Figures
Figure 1: Glenmore ComPASS study area ..................................................................................... 3
Figure 2: 2007 Greenhouse gas emissions sources in Kelowna, BC (City of Kelowna 2011) ....... 5
Figure 3: Total collisions per 1,000 people for the RDCO and BC (Alam 2010) .......................... 6
Figure 4: Mean temperatures for Boulder, CO and Kelowna, BC (The Weather Network 2011) . 8
Figure 5: Example of the Hop Bus in Boulder, Colorado (City of Boulder 2011) ....................... 10
Figure 6: Percent change from 1990 to 2009 transportation mode ............................................... 13
Figure 7: Study Boundary Age Distribution (2006 Census) ......................................................... 23
Figure 8: Kelowna Age Distribution (2006 Census) .................................................................... 23
Figure 9: Study Area Transportation Mode Split to Work (2006 Census) ................................... 24
Figure 10: Kelowna Transportation Mode Split to Work (2006 Census) ..................................... 24
Figure 11: Study Boundary Males and Females (2006 Census) ................................................... 24
Figure 12: Study Boundary Males and Females (2006 Census) ................................................... 24
Figure 13: Individual Income in the Glenmore Study Boundary (2006 Census) ......................... 24
Figure 14: Individual Income in Kelowna (2006 Census) ............................................................ 24
Figure 15: Routes 3, 6, and 7 Servicing the Glenmore Community ............................................. 26
Figure 16: Bike Lanes within the Study Area (City of Kelowna 2009) ....................................... 28
Figure 17: Five Steps to Develop a Successful Community-Based Social Marketing Strategy .. 33
Figure 18: General Locations of Survey Respondents based on Postal Code (points are weighted
based on number of responses from each postal code) ................................................................. 41
Figure 19: Resident Age Distribution (ComPASS 2011) ............................................................. 43
Figure 20: Resident Age Distribution (2006 Glenmore Census) .................................................. 43
Figure 21: Transportation Mode to and from Work Only (ComPASS 2011) .............................. 43
Figure 22: Transportation Mode Split to Work Only (2006 Glenmore Census) .......................... 43
Figure 23: Transportation mode splits between vehicle, carpool, bus, bike, and walk for work,
shopping, recreation, and school trips. (ComPASS 2011)............................................................ 45
Figure 24: Trip departure times from home to work/school and from work/school to home
(ComPASS 2011).......................................................................................................................... 46
Figure 25: Trip durations for work, shopping, recreation, and school trips in minutes (ComPASS
2011) ............................................................................................................................................. 47
Figure 26: Travel distance for work and school trips (ComPASS 2011) ..................................... 48
Figure 27: Measured versus reported trip durations for work and school (ComPASS 2011) ...... 48
Figure 28: Frequency of bus use in the study area (ComPASS 2011) .......................................... 49
Figure 29: Frequency of bike use for work commutes only (ComPASS 2011) ........................... 49
Figure 30: Frequency of bike trips for shopping related trips only (ComPASS 2011) ................ 50
Figure 31: Frequency of bike trips for recreation only (ComPASS 2011) ................................... 50
Figure 32: Frequency of bike use for trips to and from school only (ComPASS 2011) ............... 51
Figure 33: Reasons why residents moved to the Glenmore community (ComPASS 2011) ........ 52
Figure 34: My household would be more likely to ride a bike to businesses if those businesses
were more cyclist friendly (ComPASS 2011) .............................................................................. 53
vi
Figure 35: My household would be more likely to walk to businesses if those businesses were
more pedestrian friendly (ComPASS 2011) ................................................................................. 53
Figure 36: I would consider riding the bus (ComPASS 2011) ..................................................... 54
Figure 37: My household rides the bus because it is the most affordable option (ComPASS 2011)
....................................................................................................................................................... 54
Figure 38: Would you ride the bus if there were improvements to the service? (ComPASS 2011)
....................................................................................................................................................... 55
Figure 39: How would you rate traffic congestion in Kelowna on a scale of 1(good) to 5 (bad)?
(ComPASS 2011).......................................................................................................................... 55
Figure 40: How would you rate transit service in Kelowna on a scale of 1 (good) to 5 (bad)?
(ComPASS 2011).......................................................................................................................... 56
Figure 41: Percentages for preferred Glenmore ComPASS price (ComPASS 2011) .................. 60
Figure 42: Weighted results for “Would you use a ComPASS?” (ComPASS 2011) ................... 61
Figure 43: If you would not use a ComPASS, would you be willing to support a ComPASS
program? (ComPASS 2011) ......................................................................................................... 61
Figure 44: Weighted results for those who would use or support a ComPASS program
(ComPASS 2011).......................................................................................................................... 62
Figure 45: Map of Route 7 that Services the Glenmore Community ........................................... 67
Figure 46: Frequency of bike tune-ups in Glenmore study area (ComPASS 2011) ..................... 69

vii
List of Tables
Table 1: Similarities and Differences between Boulder, CO and Kelowna, BC ............................ 8
Table 2: Timeline of Events leading to a Permanent NECO Pass (Go Boulder 2006) .................. 9
Table 3: 2011 Household Costs for Each Pricing Zone in Boulder (Go Boulder 2010) .............. 12
Table 4: NECO Pass Savings ........................................................................................................ 13
Table 5: Percent Change in Travel Mode between 1990 and 2009 in Boulder, Colorado for all
Trips (National Research Center, Inc. 2010) ................................................................................ 14
Table 6: 1997 versus 2010 Weekday Person Trips Across UBC/UEL Screenline (UBC TREK
Program 2011) (UBC TREK Program 2004) ............................................................................... 21
Table 7: Glenmore Routes 3, 6, and 7 Hours of Operation .......................................................... 26
Table 8: Glenmore Routes 3, 6, and 7 Transit Service Headway ................................................. 27
Table 9: List of Prizes included in the Glenmore ComPASS Prize Draw .................................... 36
Table 10: Outline of the Glenmore ComPASS Public Design Workshops .................................. 37
Table 11: Costs of the Potential Glenmore ComPASS Components ........................................... 39
Table 12: Glenmore ComPASS Public Engagement Summary ................................................... 40
Table 13: What would influence your household to reduce car use one extra day a week?
(ComPASS 2011).......................................................................................................................... 56
Table 14: Why does your household ride the bus? (ComPASS 2011) ......................................... 57
Table 15: What would influence you to use public transit more often? (ComPASS 2011) ......... 57
Table 16: The five most popular Glenmore ComPASS components ........................................... 58
Table 17: ComPASS Price Preferences ........................................................................................ 59
Table 18: ComPASS Price Preferences (including unlimited transit pass) .................................. 59
Table 19: Proposed Budget for the 3 Month Revealed Preference Study .................................... 63
Table 20: Estimated Cost for the Transit Pass Component Per Household Per Month ................ 65
Table 21: Phase 3 Cost of Each Glenmore ComPASS Component* ........................................... 69
1
1 Introduction
1.1 What is ComPASS?
ComPASS is a Community unlimited access transportation pass, similar to the Universal
transportation pass (U-Pass) for UBC students (www.upass.ubc.ca), but is different in that it is
intended for residents. ComPASS, in one form or another, has been successfully run for years in
several communities across North America, with the most famous, the NECO Pass Program in
Boulder, Colorado (www.bouldercolorado.gov). Typically, ComPASS is applied to all or part of
a neighbourhood where each household pays a monthly fee. The ComPASS allows unlimited
local transit use and additional sustainable transportation related privileges. ComPASS has been
most successful where it is not limited to just a transit pass. A successful ComPASS will also
promote walking, cycling, carpooling, and additional low energy transportation modes, hence the
title “transportation pass” and not just “transit pass”. The main objective of the ComPASS
program is to reduce automobile use and its associated congestion, pollution, and road safety
problems.
How can a ComPASS be affordable if it includes a transit pass and added benefits? ComPASS is
affordable due to the application of the community revenue neutral (CRN) model. The CRN
model ensures that the ComPASS generates at least as much revenue as ComPASS participants
previously paid for included services, such as for transit passes, recreation services, etc. For
example, consider a neighbourhood of 150 residents living in 50 households. Assume that 5
residents of that neighbourhood regularly buy $53 transit passes per month, which means that the
local transit system generates $265 per month from that neighbourhood as a whole. With the
implementation of ComPASS, the CRN model spreads that $265 over all 50 households, to give
each household member a transit pass for $5.30 per month per household. Therefore, the local
transit system would still generate the same revenue as before the ComPASS program, but
hopefully with an increase in ridership on otherwise underutilized buses thus improving transit
cost effectiveness. This CRN model can also be applied to the additional benefits in a ComPASS
package, such as recreation centre passes, therefore giving each household multiple privileges at
an affordable price. Please see below for a sample calculation.
2
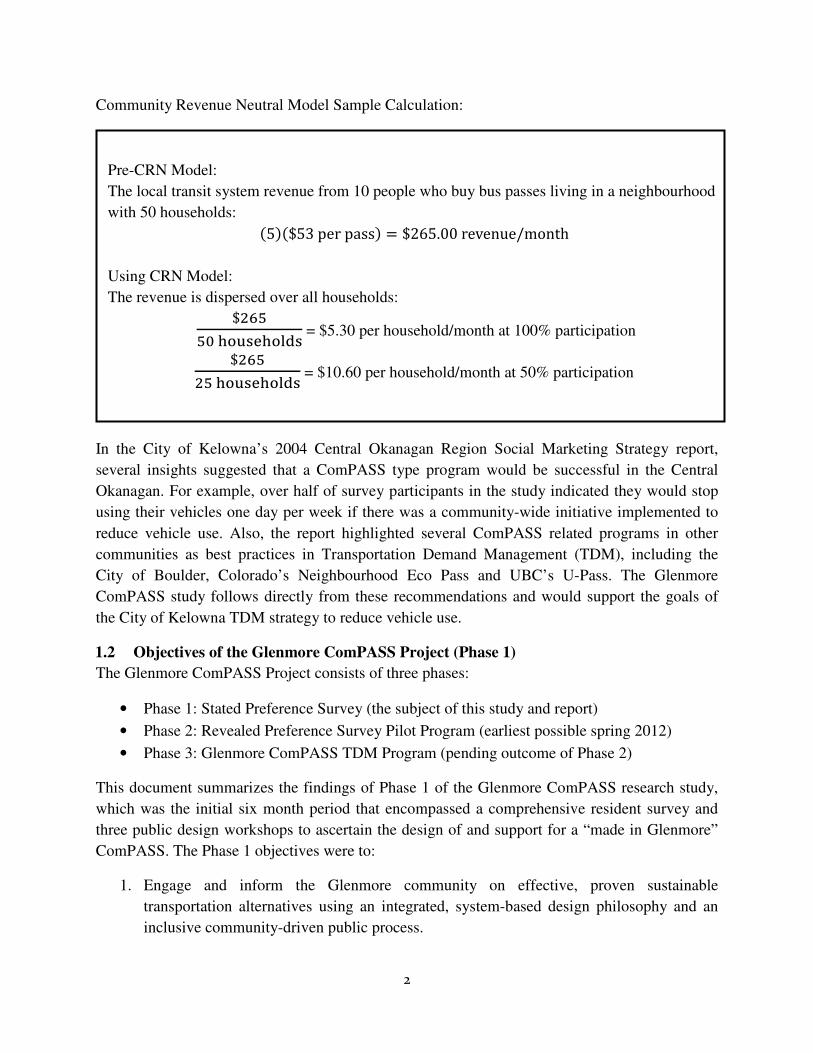
Community Revenue Neutral Model Sample Calculation:
In the City of Kelowna’s 2004 Central Okanagan Region Social Marketing Strategy report,
several insights suggested that a ComPASS type program would be successful in the Central
Okanagan. For example, over half of survey participants in the study indicated they would stop
using their vehicles one day per week if there was a community-wide initiative implemented to
reduce vehicle use. Also, the report highlighted several ComPASS related programs in other
communities as best practices in Transportation Demand Management (TDM), including the
City of Boulder, Colorado’s Neighbourhood Eco Pass and UBC’s U-Pass. The Glenmore
ComPASS study follows directly from these recommendations and would support the goals of
the City of Kelowna TDM strategy to reduce vehicle use.
1.2 Objectives of the Glenmore ComPASS Project (Phase 1)
The Glenmore ComPASS Project consists of three phases:
• Phase 1: Stated Preference Survey (the subject of this study and report)
• Phase 2: Revealed Preference Survey Pilot Program (earliest possible spring 2012)
• Phase 3: Glenmore ComPASS TDM Program (pending outcome of Phase 2)
This document summarizes the findings of Phase 1 of the Glenmore ComPASS research study,
which was the initial six month period that encompassed a comprehensive resident survey and
three public design workshops to ascertain the design of and support for a “made in Glenmore”
ComPASS. The Phase 1 objectives were to:
1. Engage and inform the Glenmore community on effective, proven sustainable
transportation alternatives using an integrated, system-based design philosophy and an
inclusive community-driven public process.
�5��$53perpass� = $265.00revenue/month
Pre-CRN Model:
The local transit system revenue from 10 people who buy bus passes living in a neighbourhood
with 50 households:
Using CRN Model:
The revenue is dispersed over all households:
$���
����� !��"# = $5.30 per household/month at 100% participation
$�������� !��"# = $10.60 per household/month at 50% participation
3
2. Through literature review findings, and public design workshops, create a recommended
Glenmore ComPASS design to compete with and significantly reduce auto use.
3. Conduct an online stated preference survey to gauge resident support for the
recommended Glenmore ComPASS design.
4. Based on objectives 1 – 3, recommend the next steps, including a budget for Phase 2
implementation.
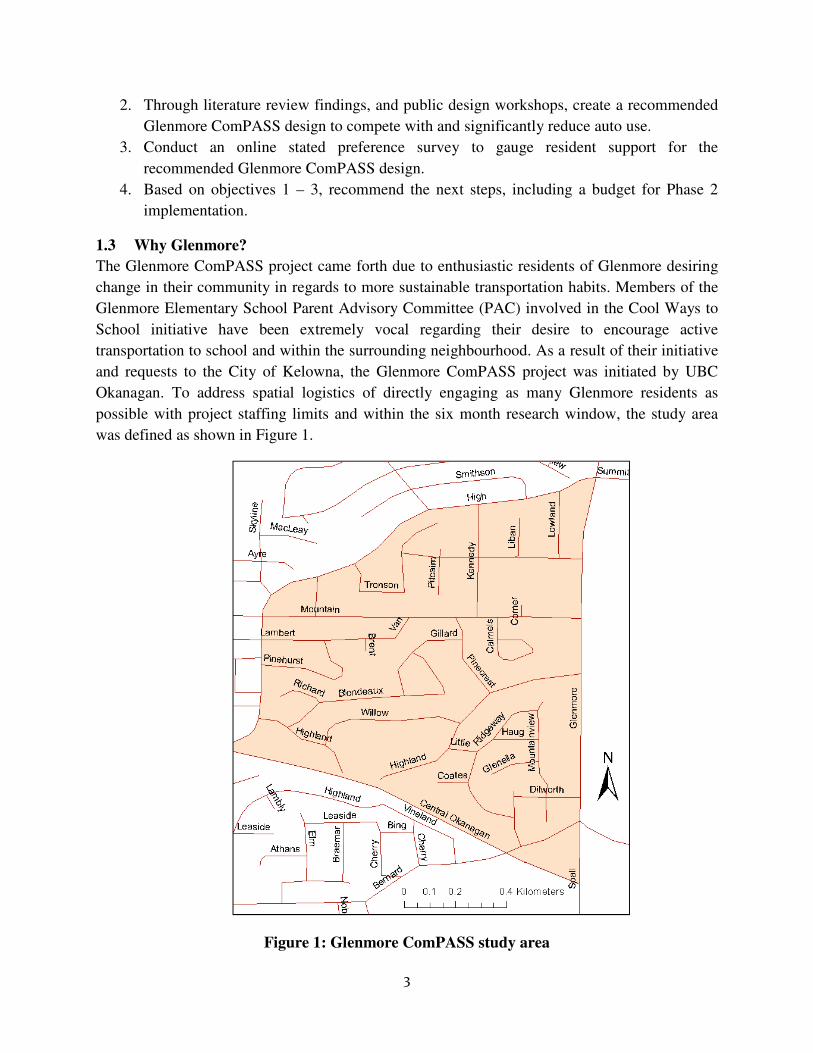
1.3 Why Glenmore?
The Glenmore ComPASS project came forth due to enthusiastic residents of Glenmore desiring
change in their community in regards to more sustainable transportation habits. Members of the
Glenmore Elementary School Parent Advisory Committee (PAC) involved in the Cool Ways to
School initiative have been extremely vocal regarding their desire to encourage active
transportation to school and within the surrounding neighbourhood. As a result of their initiative
and requests to the City of Kelowna, the Glenmore ComPASS project was initiated by UBC
Okanagan. To address spatial logistics of directly engaging as many Glenmore residents as
possible with project staffing limits and within the six month research window, the study area
was defined as shown in Figure 1.
Figure 1: Glenmore ComPASS study area

4
1.4 Why should you care about ComPASS?
Results from the 2006 Census indicate that on average, less than 3 out of every 100 commuters
in Kelowna use public transit as their main mode of transportation, compared to 10 out of 100 for
the rest of BC, and 11 out of 100 for all of Canada (City of Kelowna 2006). For cycling and
walking, however, Kelowna is on the same level as the province and country with 9% of the
labour force either walking or cycling to and from work (City of Kelowna 2006). 79% of
Kelowna commuters drive their vehicle to and from work, compared to 72% for both BC and
Canada (City of Kelowna 2006). According to the Transportation Association of Canada’s 2010
Urban Transportation Indicators survey, Kelowna has the highest car ownership per capita and
one of the highest daily vehicle-kilometres travelled per capita in Canada (Hollingworth, et al.
2010). Reducing automobile use has been shown to result in several community-wide
sustainability benefits, such as reduced traffic congestion, improved road safety, improved air
quality, and enhanced community health.
1.4.1 Community Sustainability
Kelowna has been endorsed with extraordinary natural beauty and a favourable climate making it
an attractive place to live and visit. However, the natural beauty of Kelowna may be
compromised by pollution and widespread congestion resulting from the community’s current
automobile dependency.
The Province of British Columbia developed a target to reduce GHG emissions by 33% from
2007 levels by the year 2020, and has legislated that all provincial public sector organizations be
required to reduce their GHG emissions as well (City of Kelowna 2011). In November, 2009, the
City of Kelowna adopted the Province’s climate action plan to also reduce GHG emissions by
33% by 2020. Consequently, the City of Kelowna is looking to establish various initiatives to
reduce GHG emissions within the community.
In 2007, Kelowna emitted 794,539 tonnes of CO2 (City of Kelowna 2011). Motor vehicles
accounted for 65% of the total emissions in 2007, compared to 25% from buildings and 7% from
solid waste. If the City of Kelowna trends were to continue, CO2 emissions would grow to
932,510 tonnes per year by 2020.

5
Figure 2: 2007 Greenhouse gas emissions sources in Kelowna, BC (City of Kelowna 2011)
With 65% of CO2 emissions coming from motor vehicles in Kelowna, reducing auto use has
become a priority. The City of Kelowna has suggested “transit pass programs like U-Pass” as an
initiative to help decrease vehicle kilometres travelled in Kelowna (City of Kelowna 2011).
1.4.2 Quality of Life
Research conducted in The Central Okanagan Region Social Marketing Strategy report found
that overall, Kelowna residents are strongly connected to the climate, lifestyle and community of
Kelowna (City of Kelowna 2004). Following are some common beliefs among Kelowna
residents about their community:
• Perfect balance between a rural and an urban lifestyle,
• Feeling of neighbourliness,
• A place that is easy to get around in,
• Close to everything,
• Everything is available in terms of shopping and cultural/artistic events,
• Balanced life without the anxiety of living in a big city,
• Live a balanced healthy life with a mild stress level, and
• There is nowhere else like Kelowna.
Essentially, residents strongly value and believe they live with a high quality of life. However, at
the same time, Kelowna is one of Canada’s fastest growing municipalities with an average
annual population growth rate of 2.6% since 1976 (City of Kelowna 2009). While the population
grows, however, the number of vehicles on the road increases at an even higher rate, leading to
excessive congestion. Traffic congestion has been an ongoing issue with residents in Kelowna,
Buildings28%
Solid Waste7%
Motor Vehicles65%
6
especially with vehicles on Highway 97 (City of Kelowna 2004). In fact, the average speed in the
worst congested area in Kelowna is only about 28 km/h during the day (HDR Decision
Economics 2009). Furthermore, excessive traffic delays amount to large costs incurred due to
personal time wasted, additional vehicle wear, lost business revenue, and increased industry
costs, which all amounted to about $341 million for 2007 (HDR Decision Economics 2009). If
no mitigation strategies are implemented, this cost is expected to increase by 80% to $613.8
million per year by 2030 (HDR Decision Economics 2009). Moreover, 40,000 residents’ health
issues are aggravated due to air pollution in Kelowna, which is mostly attributed to pollution
from vehicle use (City of Kelowna 2004). Kelowna residents cannot continue practicing
unsustainable transportation behaviour without causing significant negative impacts on their
overall quality of life, and the desirability of their City as a growing tourist destination.
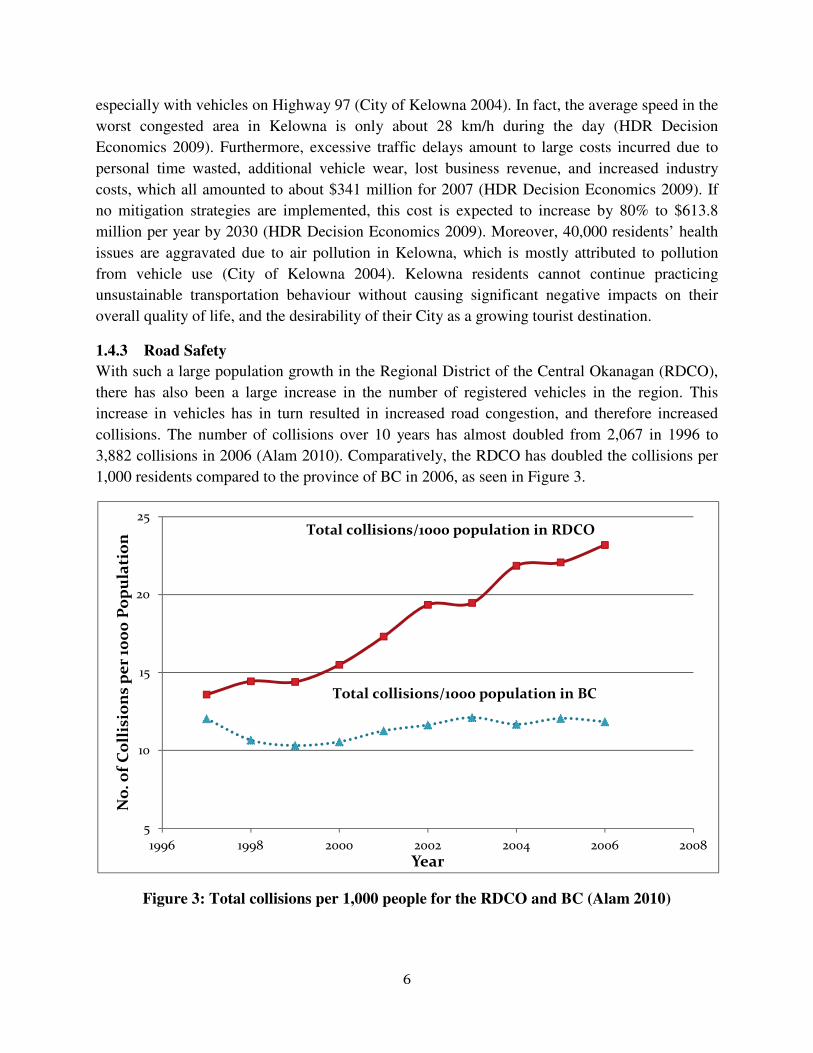
1.4.3 Road Safety
With such a large population growth in the Regional District of the Central Okanagan (RDCO),
there has also been a large increase in the number of registered vehicles in the region. This
increase in vehicles has in turn resulted in increased road congestion, and therefore increased
collisions. The number of collisions over 10 years has almost doubled from 2,067 in 1996 to
3,882 collisions in 2006 (Alam 2010). Comparatively, the RDCO has doubled the collisions per
1,000 residents compared to the province of BC in 2006, as seen in Figure 3.
Figure 3: Total collisions per 1,000 people for the RDCO and BC (Alam 2010)
5
10
15
20
25
1996 1998 2000 2002 2004 2006 2008
No
. of
Co
llis
ion
s p
er
100
0 P
op
ula
tio
n
Year
Total collisions/1000 population in BC
Total collisions/1000 population in RDCO

7
It can also be seen from Figure 3 that the collisions rate is continuously increasing in the RDCO
while the collision rate for BC is remaining generally constant. Therefore, the RDCO is not on
par with the rest of the province, and needs to find ways to reduce collisions within the region.
With fewer collisions, it is reasonable to expect beneficial improvements to quality of life, less
stress on the health care system, and lower overall costs. Since 96% of collisions are attributed to
driver error (Sayed, Abdelwahab and Navin 1995), the best solution is to simply get drivers out
of their cars and off of the road, thus reducing auto use. The Glenmore ComPASS would aid to
reduce the number of motorists on the road to improve associated road safety issues.
2 Literature Review
Similar successful ComPASS programs in North America were analyzed to determine methods
for extracting and analyzing data to introduce a similar program in Kelowna.
2.1 Neighbourhood Eco Pass (Boulder, Colorado)
Boulder, Colorado is home to the most successful and well known community transportation
pass programs in North America. Located 25 miles northwest of Denver, Boulder covers an area
of 66 square kilometres and has a population of about 97,385 (City of Boulder 2009). Founded in
1859 (City of Boulder 2009), Boulder acts as a sub-regional centre to Denver, and is home of the
University of Colorado Boulder campus and other business industries, such as the high tech
industry and federal laboratories, which all draw people to the community (Winfree 2002).
Boulder is a progressive city, having won countless awards for its sustainability initiatives, such
as their cycling, pedestrian, and transit programs and infrastructure. The City of Boulder strongly
values preserving its natural setting, and therefore has many sustainable land use and
transportation initiatives set in place.
2.1.1 Comparison of Boulder, CO and Kelowna, BC
Similarly, Kelowna acts as major hub within the Okanagan, and is a centre for retail,
commercial, and industrial industries, as well as being a centre for post-secondary education
(City of Kelowna 2004). Furthermore, Boulder and Kelowna share similar climate, terrain,
layout, and socio-demographics.
Boulder is located at the foot of the Rocky Mountain range, while Kelowna is located in the
Okanagan Valley between the Monashee Mountain Range to the West and the Coastal and
Cascade Mountains to the East. Both locations are dry with about 400 mm of precipitation on
average per year. The median temperature for each month is also very similar between Kelowna
and Boulder, as can be seen in Figure 4.

8
Figure 4: Mean temperatures for Boulder, CO and Kelowna, BC (The Weather Network 2011)
Furthermore, both cities have a population around 100,000 people and a median household
income of about $50,000 per year. Table 1 outlines the general similarities and differences
between Kelowna and Boulder.
Table 1: Similarities and Differences between Boulder, CO and Kelowna, BC
Boulder, Colorado (U.S. Census Bureau 2010)
Kelowna, BC (City of Kelowna 2009)
Population 97,385 106,707
Median Family Income $49,920 $48,859
Average Total precipitation per year
393 mm (The Weather Network 2011)
410 mm (The Weather Network 2011)
Median Age 29 years 42.8 years
Population Aged 65+ 8.9 % 19.4 %
Area 66 km2 211 km2
Average Population Density
1475.5 people/km2 505.7 people/km2
Despite these similarities, Kelowna and Boulder do have some differences, such as median age
and population density. Kelowna is an older community with a median age of 42.8 years (City of
Kelowna 2009), while Boulder’s median age is 29 years (U.S. Census Bureau 2010). Those aged
65 years and older make up 19.4% of Kelowna’s population, while they make up only 8.9% of
Boulder’s population. Furthermore, Boulder has a higher population density of about 1475.5
-5
0
5
10
15
20
25M
ea
n T
em
pe
ratu
re (
°C)
Month
Boulder
Kelowna
9
people per square kilometre, while Kelowna’s average population density is 505.7 people per
square kilometre. Therefore, a simple cookie cutter approach for a community transportation
pass would not be wise; hence, the need for a “made in Kelowna” ComPASS.
2.1.1.1 What is the Neighbourhood Eco Pass?
There are two main types of Eco Passes available in Boulder: the regular Eco Pass for
commuters and the Neighbourhood Eco (NECO) Pass for residents. The NECO pass is an annual
transit pass that can be given to community members of Boulder. It includes a Regional
Transportation District of Denver (RTD) transit pass that can be used for all RTD services
including Boulder’s own city run route called the “Hop”. The NECO Pass also includes free
emergency taxi rides home, and the option to pick up an “Eco Pass Extra” sticker at no additional
cost. This sticker can be placed on users’ cards to obtain merchant discounts at participating
businesses. There are about 50 merchants involved with the program who all provide the
discounts themselves, without payment from RTD (City of Boulder 2011).
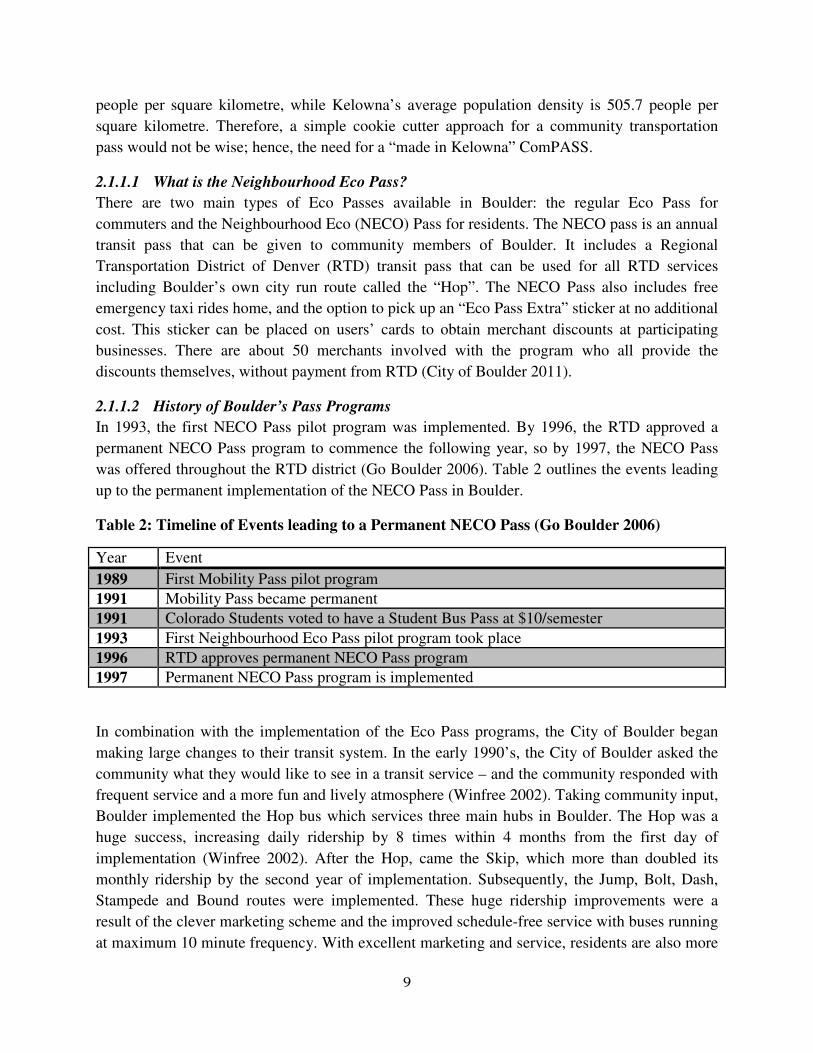
2.1.1.2 History of Boulder’s Pass Programs
In 1993, the first NECO Pass pilot program was implemented. By 1996, the RTD approved a
permanent NECO Pass program to commence the following year, so by 1997, the NECO Pass
was offered throughout the RTD district (Go Boulder 2006). Table 2 outlines the events leading
up to the permanent implementation of the NECO Pass in Boulder.
Table 2: Timeline of Events leading to a Permanent NECO Pass (Go Boulder 2006)
Year Event
1989 First Mobility Pass pilot program
1991 Mobility Pass became permanent
1991 Colorado Students voted to have a Student Bus Pass at $10/semester
1993 First Neighbourhood Eco Pass pilot program took place
1996 RTD approves permanent NECO Pass program
1997 Permanent NECO Pass program is implemented
In combination with the implementation of the Eco Pass programs, the City of Boulder began
making large changes to their transit system. In the early 1990’s, the City of Boulder asked the
community what they would like to see in a transit service – and the community responded with
frequent service and a more fun and lively atmosphere (Winfree 2002). Taking community input,
Boulder implemented the Hop bus which services three main hubs in Boulder. The Hop was a
huge success, increasing daily ridership by 8 times within 4 months from the first day of
implementation (Winfree 2002). After the Hop, came the Skip, which more than doubled its
monthly ridership by the second year of implementation. Subsequently, the Jump, Bolt, Dash,
Stampede and Bound routes were implemented. These huge ridership improvements were a
result of the clever marketing scheme and the improved schedule-free service with buses running
at maximum 10 minute frequency. With excellent marketing and service, residents are also more

10
likely to become avid transit users at an early age, which increases the probability that they will
continue using transit as they grow older. Today, Boulder has about 5.4% of their community
regularly taking transit, while 9.7% of the labour force regularly uses transit for their work
commute (National Research Center, Inc. 2010). Figure 5 shows the design of the Hop Bus
exterior.
Figure 5: Example of the Hop Bus in Boulder, Colorado (City of Boulder 2011)
As of 2011, there are 42 neighbourhoods involved with the NECO Pass Program. Of these 42
neighbourhoods, there are 6,520 households eligible to receive NECO Passes, with 11,010 decals
distributed (Hagelin, NECO Pass Data 2011 2011). Each distributed decal represents each person
who is eligible to use their NECO Pass card. Not everyone in a NECO Pass community will pick
up a NECO Pass decal as not everyone who is eligible contributes to the neighbourhood fund. As
of 2010 the participating NECO Pass neighbourhood sizes ranged from 27 households to 679
households (GO Boulder 2011). In general, 55% of households in a NECO Pass neighbourhood
participate and contribute to the program. The lowest participation rate is about 20%, with a high
of 100%. Furthermore, some Home Owner Association developments include a NECO Pass as
part of their monthly fees (Hagelin 2011). (Hagelin, NECO Pass Participation Rate 2011)
2.1.1.3 How the NECO Pass Works
There are three main requirements for a neighbourhood to be eligible to participate in the NECO
Pass program.
1. The neighbourhood must a) belong within RTD boundaries and b) be represented by either a
registered neighbourhood association or a city/county government entity. For Boulder, the
city/county government entity would be GO Boulder, which is a section within the City of
Boulder.
2. The neighbourhood requires a resident volunteer called a neighbourhood coordinator to
represent the community to canvass their neighbourhood and to collect funding from the
community. Enough money must be raised from the neighbourhood to meet the full RTD 12
month contract payment.

11
3. The neighbourhood must meet a minimum contract payment, which is $7,497 for 2011 (GO
Boulder 2011). To determine the required contract amount, a survey is conducted to determine
how much money RTD is currently making from the neighbourhood’s transit use. If the actual
usage currently generates less revenue than the minimum required contract payment, then the
community will be asked to pay the minimum contract payment of $7,497.
For example, to determine the average payment required in a Boulder community, consider a
neighbourhood with 150 residents which make up 50 households. If 3% of residents in that
community purchase a yearly regional transit pass from RTD for $1,936 per year, then RTD is
making $8,712 per year from that community. Since this revenue of $8,712 is more than the
minimum required payment of $7,497 for a year, the community must raise $8,712 for the year
to be eligible for the NECO Pass Program. Following is a sample calculation to demonstrate this
concept.
NECO Pass Household Price Sample Calculation (A Variant of the CRN Model):
GO Boulder relies heavily on neighbourhood coordinators to organize neighbourhoods and
encourage them to participate in the NECO Pass Program. Originally, GO Boulder had a full
time employee to manage and organize neighbourhoods but budget cuts reduced this position to
part time, August to January (Hagelin 2011). As a result, GO Boulder must now rely on
neighbourhood coordinators for the success of the program. To support neighbourhood
coordinators, GO Boulder’s website provides ample instruction and advice on how to get a
NECO Pass Program started (www.bouldercolorado.gov).
�3%��150� &$1,936per passyear* = $8,712revenue
Suppose 3% of a neighbourhood with 50 homes (assume 150 residents) take transit.
The local transit system revenue from that neighbourhood each year:
Since $8,712 per year is more than the minimum required contract payment of $7,497
per year, the community will need to pay at least $8,712 per year.
The cost per household in the neighbourhood:
$-,./�/0!12����� !��"# ∗ 4
/0!12/�5�67� 8 = $14.52 per household per month at 100% participation
$-,./�/0!12����� !��"# ∗ 4
/0!12/�5�67� 8 = $29.04 per household per month at 50% participation

12
2.1.1.4 Price of the NECO Pass
There are three pricing zones within Boulder to estimate the general price per household required
to obtain a NECO Pass. These price zones are established based on transit level of service (LOS)
in the area, which was determined through resident travel diaries and surveys conducted by the
City of Boulder. Therefore, areas with a higher transit LOS will have a higher average annual
household cost. Table 3 shows the 2011 average annual and monthly household prices for the
NECO Pass.
Table 3: 2011 Household Costs for Each Pricing Zone in Boulder (Go Boulder 2010)
Pricing Zone 2011 Average Annual
Household Cost 2011 Average Monthly
Household Cost
Zone 1 $113/household/year $9.42/household/month Zone 2 $85/household/year $7.08/household/month Zone 3 $192/household/year $16.00/household/month
The costs described in Table 3 are simply estimates based on current transit usage, location,
number of households, and available service. In reality, the price of the NECO Pass varies
greatly from household to household, as described in the previous sample calculation. The
neighbourhood must raise enough money to meet the contract requirement set out by RTD,
regardless of how much each household contributes. Therefore, one household could contribute
$80 for the year knowing that they will not make much use of the pass, while another household
could contribute $500 if they know they will use the pass frequently (GO Boulder 2011). Some
households simply make a payment to benefit the community as a whole, even if they will not
use a NECO Pass. Alternatively, some households do not contribute at all. In fact, only about
60% of residents in a neighbourhood actually contribute a dollar amount to the program (GO
Boulder 2011). Overall, as long as the community meets the contract requirement, the
neighbourhood will be able to participate in the NECO Pass Program. Once a neighbourhood is
approved, those who wish can obtain a NECO Pass Card with their name and photo, and must
pick up a decal to place on the back of their card. The decal indicates that they belong to an
approved neighbourhood that has paid the contract amount. Each year has a decal of a different
colour, so communities who have not paid for a particular year cannot continue using their card
without the proper decal.
It is not just the community members paying for the NECO Pass, however. The City of Boulder
will subsidize 50% of the contract price for the neighbourhood’s first year (GO Boulder 2011).
After the first year, the City of Boulder will contribute 30% of the price for Zones 1 and 2, and
35% for Zone 3 (GO Boulder 2011). These subsidies, which come from a 0.6% dedicated sales
tax that goes directly to the Boulder Transportation Division, significantly reduce NECO Pass
payments required by residents (GO Boulder, 2011)..

13
2.1.1.5 NECO Pass Savings
Whether NECO Pass users are travelling locally, regionally, or both, adults are saving up to
$1,899.60 per year and students and seniors are saving up to $931.61 by participating in the
NECO Pass Program. This translates to as much as a 96.7% discount off of an adult annual
regional transit pass, all despite being a community revenue neutral program. The City of
Boulder continues to subsidize the NECO Pass Program since these subsidies are the most
powerful tool they have to meet their Transportation and Climate Action Plan goals of reducing
total daily vehicle kilometres travelled and private auto use (GO Boulder 2011).
Table 4: NECO Pass Savings
Age Group NECO Pass Cost per year
Actual RTD Cost (Local Service) per year
Actual RTD Costs (Regional Service) per year
% Local Savings per year
% Regional Savings per year
Student/Senior $63.24 $474 $968 86.7 93.5
Adult $63.24 $869 $1,936 92.7 96.7
2.1.1.6 How the NECO Pass has Affected Boulder
Since 1990, a transportation survey has been conducted in Boulder every 2 to 3 years to
understand how transportation habits are changing. The most recent survey was conducted in
2009. According to this survey (with over 1000 respondents), transportation mode splits of all
trips have generally shifted away from automobile use, carpooling, and walking, and toward
cycling and transit use. Figure 6 displays how transportation shifts have changed from 1990 to
2009.
Figure 6: Percent change from 1990 to 2009 transportation mode
0
5
10
15
20
25
30
35
40
45
50
Pe
rce
nt
of
Tri
ps
Year
Auto
Carpool/Vanpool
Pedestrian
Bike
Transit

14
Table 5 displays the percent changes from the program start in 1990 to the latest available data in
2009 for all transportation trips, such as work, tourism, and errands.
Table 5: Percent Change in Travel Mode between 1990 and 2009 in Boulder, Colorado for all Trips (National Research Center, Inc. 2010)
Transportation Modes
1990 Mode Shares 2009 Mode Shares Change from 1990 to
2009
Percentage
# of People
Percentage # of
People Percent Change
Change # of
People
Vehicle (Driver) 44.2% 36,824 37.1% 36,029 -16% -795
Carpool & Vanpool
26.3% 21,911 23.7% 23,016 -10% +1,105
Transit 1.6% 1,333 5.4% 5,244 238% +3,911
Bicycle 9.1% 7,581 15.9% 15,441 75% +7,860
Foot 18.2% 15,163 17.9% 17,383 -2% +2,221
Note: Population of Boulder in 1990 was 83,312 (U.S. Census Bureau 1990) and the population in 2009 was estimated at 97,114. These significant shifts away from automobile use towards more sustainable transportation
options have been attributed to the City of Boulder’s innovative and forward thinking Eco Pass
(Business and Neighbourhood) programs in combination with significant transit service
improvements and managed parking in the downtown area. Moreover, the increase in cycling is
likely due to more bike storage on buses (almost all buses are equipped with 2 bike racks, or if
they are full, riders have the option to bring the bike onboard or to store it in luggage
compartments), more ground mounted bike racks at bus stations, and the popularity of outdoor
activities in the Boulder community. Furthermore, the City of Boulder has made major
improvements to cycling infrastructure, such as bicycling lanes, a multi-use path system with 76
underpasses (GO Boulder 2011), designated bicycle routes, and community programs.
These shifts from automobile use towards more sustainable transportation options also greatly
reduce the amount of GHG emissions in Boulder. The average Eco Pass cardholder creates 1.02
metric tons of CO2 less than a non-Eco Pass holder per year (National Research Center, Inc.
2010). The NECO Pass alone saved about 12,000 metric tons of CO2 in 2009.
15
According to GO Boulder, the NECO Pass program strongly encourages more sustainable
behaviour. Based on data, a resident owning a NECO Pass is 9 times more likely to take the bus
than a resident without a NECO Pass (GO Boulder 2011). This translates to a reduction in GHG
emissions and overall positively impacts the community of Boulder and the environment.
2.1.1.7 Future Considerations for Boulder’s NECO Pass
GO Boulder will also be implementing a smart card to be used for the NECO Passes. The smart
card will be able to track actual usage for each NECO Pass holder. With this information, RTD
will be able to price NECO Passes to ensure community revenue neutrality.
Another future consideration for the NECO Pass program is to add additional privileges such as
bike sharing, and car sharing to further enhance its attractiveness to more neighbours (GO
Boulder 2011).
2.2 ComPASS (Vancouver, British Columbia)
Due to the popularity of the student U-Pass program at UBC and the Boulder NECO Pass
Program, UBC researchers became interested in instituting a similar pass for residents in
Vancouver. As a result, a Vancouver ComPASS study was performed, where a demonstration
study was completed, surveys were conducted, and a pilot study was conducted. A
comprehensive research report and ComPASS video was produced by the UBC TREK Program
in partnership with TransLink and the City of Vancouver (Lin 2003). The ComPASS
Demonstration Study was funded in part with a $100,000 research grant from the Federation of
Canadian Municipalities and $50,000 from TransLink, the regional transportation authority.
2.2.1.1 Phase 1: Demonstration Study – Transit Passes
The demonstration study involved giving monthly transit passes to 140 families for 2 months. If
any household members were current transit users, students, or did not own a vehicle, these
households were excluded from the study. This was done to prevent the skewing of data as
existing transit users and U-Pass holders would likely use transit more often without the aid of a
ComPASS (UBC TREK Program 2004). During the study, the 140 families were given monthly
transit passes and their transportation habits were monitored through multiple surveys. The
surveys were completed before, during, immediately after, and 6 months after the demonstration
study ended. A control group also consisting of 140 families were not given transit passes but
were still surveyed parallel to the 140 families that did receive a transit pass. The survey results
between the control group and the test group were then compared.
At the end of the study, 65% more people with transit passes used transit more than people in the
control group. A slight reduction in automobile use for work trips was noticed, however this was
not accompanied by an increase in transit use for work related trips. 30% of participants in the
demonstration study viewed transit more favourably compared with before the demonstration
study began. 18% of participants also reported viewing automobile travel less favourably.
However, six months after the study ended, transit use dropped back down to previous levels.
16
The study concluded that, if implemented, a ComPASS program would have potential to
increase transit use within a given community. (UBC TREK Program 2004, www.trek.ubc.ca)
2.2.1.2 Phase 2: Greater Vancouver Regional District (GVRD) Survey
A telephone survey of 1000 participants within the greater Vancouver region revealed that about
two thirds of respondents demonstrated an interest in participating in a local ComPASS program.
Interest was highest among respondents who 1) rated transit service as “very good” or
“excellent”, 2) were low to mid income families and 3) were within the younger demographic.
Among survey respondents, 50% stated they would be interested in purchasing a ComPASS at
the suggested price of $20 to $30 per month per household. On average, residents stated a
willingness to pay $33 per month per household for a ComPASS. Results of the survey suggest
that a ComPASS neighbourhood should be carefully selected based on four main factors,
including:
1. A younger than average population,
2. A lower income neighbourhood,
3. Good transit service with fast and frequent trips,
4. Lower than average automobile ownership.
The respondents suggested a ComPASS price of under $30 dollars per month per household as
being ideal to ensure the participation of more residents in the program. (UBC TREK Program
2004)
2.2.1.3 Phase 3: Pilot Study - ComPASS
From the initial two phases, a third phase included a more comprehensive ComPASS design.
Fourteen households were chosen for the 3 month pilot study under the stipulation that they must
own at least one vehicle. The pilot program included the additional privileges listed below.
• Transit pass,
• Emergency taxi ride home service,
• Car sharing membership,
• Local school bus service,
• Local shopping shuttle bus service,
• Carpool ride matching service,
• Bike safety training,
• Bike trailer/handcart loaner system,
• Family pass to the local recreation centre, and
• Local merchant discounts.
Upon completion of the pilot study, all of the above privileges were rated high among the
participants, except for the bike safety training, the shuttle service, and the ride matching service.
Additional discounts and improved transit information were among the suggestions put forward
17
by participants to improve the ComPASS program upon completion of the pilot study. As a
result of the pilot study, three variables were identified to promote the success of a future
ComPASS program, as follows (UBC TREK Program 2004):
1. Clearly identify the benefits of being a ComPASS member: this included stating the
benefits of using alternative modes of transportation as well as stating the discounts
versus full prices and other benefits included as privileges.
2. Help people to use the ComPASS: this included guidance on how one can make use of
the privileges granted by ComPASS as well as encouraging members to make use of
public transit.
3. Add value to ComPASS: it was clear from pilot program participants that a ComPASS
system would need to include additional privileges and not be limited to a simple bus
pass.
Overall, the pilot study and survey results indicated that the Vancouver ComPASS had the
potential to be very successful and positively influence communities and the environment (UBC
TREK Program 2004).
2.3 UniverCity Community Transit Pass (Burnaby, British Columbia)
Based on the Vancouver ComPASS study results, a community transit pass program was
launched in 2006 at UniverCity, a residential development neighbouring Simon Fraser
University (SFU) in Burnaby, BC. UniverCity currently houses 3,000 residents, but will
accommodate 10,000 residents once development is fully complete (UniverCity 2011).
UniverCity was built upon principles of sustainability and employs mixed-use housing, transit
oriented planning, green building requirements, and sustainable transportation options including
their Community Transit Pass (UniverCity 2011).
2.3.1.1 What is the UniverCity Community Transit Pass?
UniverCity’s Community Transit Pass is a 3 zone transit pass available to all residents of the
UniverCity community, but differs from ComPASS and the NECO Pass in 4 ways: 1) everyone
in the UniverCity neighbourhood is automatically eligible for a Community Transit Pass, 2) the
pass is partially subsidized and is applied to individuals rather than households, 3) the
neighbourhood does not necessarily need to raise money to meet a minimum contract
requirement for the local transit company, and, most importantly, 4) additional required costs are
currently covered by the SFU Community Trust and TransLink.
Although there are no additional privileges directly associated with the pass, there are various
benefits available to UniverCity residents which essentially create a sustainable transportation
pass bundle. Such benefits include:
• Community Card,
• Car sharing, and
• An extensive pedestrian and biking network.
18
The community card comes at no additional cost, and gives residents of UniverCity free or
discounted access to various amenities at SFU. Such amenities include: access to the SFU library
collections, discounted access to SFU’s athletic and recreational facilities and programs,
discounted access to SFU events (such as theatre productions and sporting events), and summer
camps for UniverCity children.
Car sharing in the UniverCity community is available through membership in the Modo Car Co-
op (www.modo.coop). This membership with Modo Car Co-op does require an additional fee for
UniverCity residents.
Furthermore, UniverCity has provided extensive pedestrian and cycling paths to provide safe
routes to parks and amenities in and around the community to encourage more residents to take
more sustainable transportation modes within the community.
Although these amenities are not necessarily combined into a single transportation pass, they
complement each other to essentially create a sustainable transportation pass package.
2.3.1.2 History of the UniverCity Community Transit Pass
The Community Transit Pass was implemented in 2006 to encourage transit use among
UniverCity residents. The Community Transit Pass was partially subsidized by the SFU
Community Trust, VanCity Financial Services, and TransLink. In 2008, however, VanCity
Financial Services dropped out of the program, no longer contributing funds to the program.
Consequently, the subsidies were left to the SFU Community Trust and TransLink.
According to a 2005 press release published just before the launch of the Community Transit
Pass program, the program was made possible because the SFU Community Trust agreed to pay
TransLink annually to cover the revenue TransLink was already receiving from the UniverCity
community through fare collection and monthly passes (Translink 2005). This was similar to the
revenue neutral model planned to be applied to the Glenmore ComPASS. Also, the Community
Transit Pass would fill up buses that would otherwise be underutilized leaving SFU in the
morning and returning in the afternoons (Translink 2005). Overall, the goal of the program was
to increase transit ridership in the UniverCity community by providing a cost effective
alternative to driving (Translink 2011). The 2005 press release also indicated that this
Community Transit Pass was the first of its kind in Canada, and if the program at UniverCity
was successful, similar programs could be applied to various other communities in the region
(Translink 2005).
2.3.1.3 Price of the UniverCity Community Transit Pass
Since 2006, the Community Transit Pass has been priced at $29.67 per participating resident per
month, or about $90 per month per 3 person household, (Translink 2011) plus a $50 first time
application fee for each pass (Translink 2005). As the 2011 three zone adult transit pass costs
$151 per month, the Community Transit Pass is discounted about 80%. When the program
19
began, the 2006 cost of a three zone adult transit pass cost about $130, translating to a 77%
discount for UniverCity residents.
2.3.1.4 How has the Community Pass Affected the UniverCity Community
25% of UniverCity residents are enrolled in the Community Transit Pass program (SFU
Community Trust 2011). Furthermore, 40% of all UniverCity residents use transit, whether they
are enrolled in the program or not, which is three times the regional average (SFU Community
Trust 2011). Surveys have not been conducted in the UniverCity community regarding
transportation trends, therefore, it is difficult to accurately determine how often sustainable
transportation options are used in this community.
2.3.1.5 Future Considerations of the UniverCity Community Pass
On June 1, 2011, SFU Community Trust sent a letter to UniverCity residents indicating there
would be two stages in price increases. The letter indicated that the SFU Community Trust could
no longer subsidize the pass but would be able to continue administering it. On September 1,
2011 the pass would rise from about $90 per household per month to about $140 per household
per month (assuming 3 people per household). The price would again rise in April 2012 to $240
per month per household, which would still be about 46% less than the cost for 3 three-zone
adult monthly passes.
On June 22, 2011, TransLink distributed another letter to UniverCity residents stating that they
could no longer subsidize the program and would be ending the program on December 31, 2011.
Although TransLink was originally going to increase fees, due to limited funding, the discounted
community transit pass could no longer be maintained.
2.3.1.6 Lessons Learned from the UniverCity Community Transit Pass
Given 25% participation, while it lasted, the UniverCity Community Transit Pass program was
very effective in encouraging a greener community. Although the program will be discontinued,
with more members of the community using sustainable transportation methods, it is expected
that those residents will continue to do so.
The major flaw with the program seemed to be the funding model. The Community Transit Pass
was built on subsidies from TransLink, the SFU Community Trust, and the corporate partner,
VanCity. With only a few supporters each funding a large sum of money towards the program,
there was a high risk of failure of the program. If only one of the three supporters ceased to
contribute funding, the entire program was jeopardized. When VanCity discontinued their
funding, a heavier financial burden was placed upon TransLink and the SFU Community Trust.
The Community Transit Pass program would likely have continued for much longer if it had
been based on a community revenue neutral model, with residents subsidizing fellow residents.
20
2.4 UBC U-Pass
Since the 2004 ComPASS study was based on the UBC U-Pass concept, it is also important to
understand the factors that made the U-Pass successful. In September of 2003, UBC Vancouver
implemented its U-Pass program as part of a larger transportation demand management strategy.
The U-Pass program involved a community revenue neutral model to fund the student transit
pass that would be implemented following a self-imposed student fee referendum. This initiative
evolved out of UBC’s Official Community Plan (OCP) goals to increase transit ridership by
20%, to decrease automobile use by 20%, and to launch a U-Pass program for UBC students by
2002 (UBC TREK Program 2004, www.trek.ubc.ca).
In conjunction with the introduction of U-Pass, a number of other changes were implemented at
UBC to ensure its success, including:
• Bike racks on buses,
• Bike lanes,
• Campus bike racks,
• Campus bike garage,
• Campus showers,
• Improved transit service to and from campus, and
• Restructured UBC course start times to smooth out peak morning transit use and to
reduce conflict with the GVRD morning peak use.
The U-Pass includes the following benefits for students:
• Unlimited access to TransLink Bus, SkyTrain, and SeaBus services in all zones,
• Discounted West Coast Express fares,
• Increased service and capacity on UBC routes,
• Discounts at participating merchants through the ValU-Pass program,
• Ride-matching services,
• End-of-trip facility improvements for cyclists,
• Emergency Ride Home Program, and
• Community Shuttles at UBC.
Between 1997 and 2003 there was a 30% increase in bus service to and from the UBC campus.
Measurements of transportation use have been taken since 1997 and used as a base to which
future measurements could be compared. (UBC TREK Program 2004, www.trek.ubc.ca)
Initially, the U-Pass cost $20 per month per student in 2003 with a $3/month subsidy from UBC,
and was raised to $23.75 in 2010. However, in March 2011 a referendum was held to ask
students if they would like to continue participating in the U-Pass program despite a cost
increase from $23.75 per month to $30 per month. 13,574 students participated in the
referendum, and 95% of them voted in favour of continuing the program despite the cost
21
increase. This is an indicator of the success of the program, as students were willing to pay over
25% more for their passes to keep the program.
In the fall of 2002, one year before the introduction of the U-Pass program, 19% of all trips to
and from campus were via public transit. In the fall of 2003, the year that U-Pass was introduced,
transit use doubled, and the portion of transit trips to and from campus leaped to 39%. In
comparison, transit ridership had only increased by 10,700 total trips over the 5 years between
1997 and 2002. In 2002, one year before U-Pass was implemented, 42.6% of all trips were by
automobile, making it the most popular mode of travel by far. However, with the introduction of
the U-Pass in 2003, public transit had become the preferred method of travel. Consequently,
there are several benefits to the U-Pass program at UBC Vancouver. As of 2003, the program
was saving an estimated 16,000 tonnes of GHG emissions per year, and was deferring the
construction of over 1,500 commuter parking stalls by at least two years.
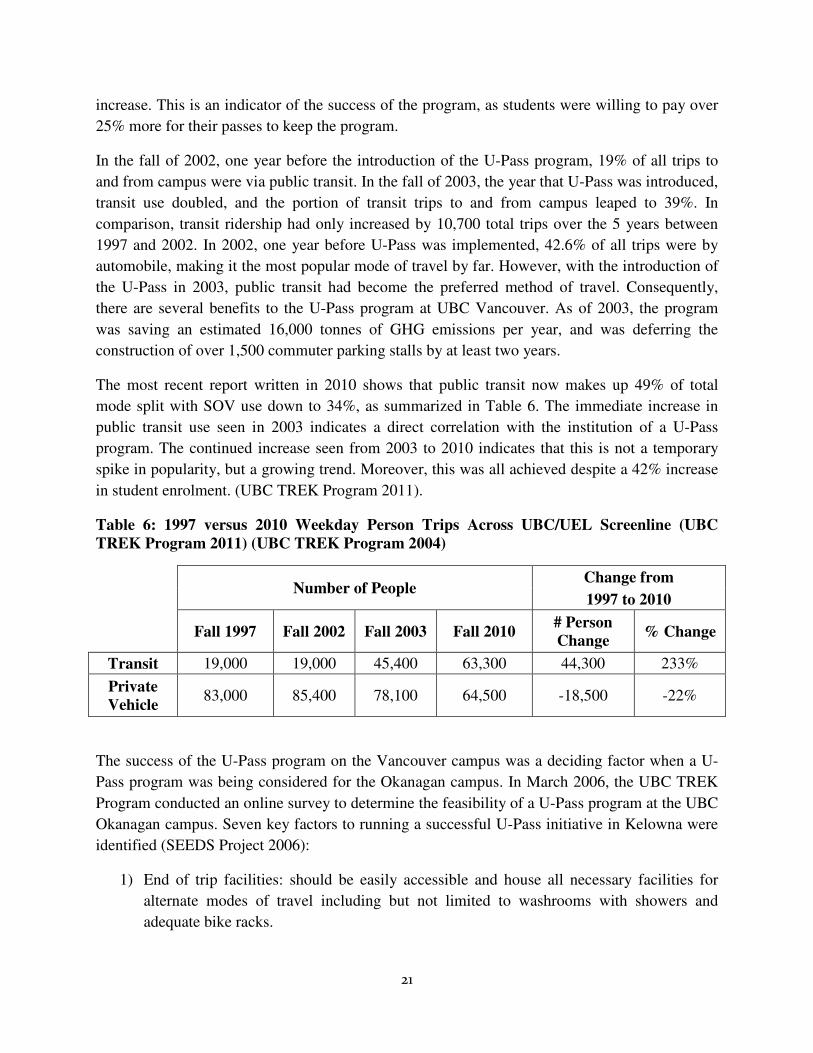
The most recent report written in 2010 shows that public transit now makes up 49% of total
mode split with SOV use down to 34%, as summarized in Table 6. The immediate increase in
public transit use seen in 2003 indicates a direct correlation with the institution of a U-Pass
program. The continued increase seen from 2003 to 2010 indicates that this is not a temporary
spike in popularity, but a growing trend. Moreover, this was all achieved despite a 42% increase
in student enrolment. (UBC TREK Program 2011).
Table 6: 1997 versus 2010 Weekday Person Trips Across UBC/UEL Screenline (UBC TREK Program 2011) (UBC TREK Program 2004)
Number of People Change from
1997 to 2010
Fall 1997 Fall 2002 Fall 2003 Fall 2010
# Person Change
% Change
Transit 19,000 19,000 45,400 63,300 44,300 233%
Private Vehicle
83,000 85,400 78,100 64,500 -18,500 -22%
The success of the U-Pass program on the Vancouver campus was a deciding factor when a U-
Pass program was being considered for the Okanagan campus. In March 2006, the UBC TREK
Program conducted an online survey to determine the feasibility of a U-Pass program at the UBC
Okanagan campus. Seven key factors to running a successful U-Pass initiative in Kelowna were
identified (SEEDS Project 2006):
1) End of trip facilities: should be easily accessible and house all necessary facilities for
alternate modes of travel including but not limited to washrooms with showers and
adequate bike racks.
22
2) Merchant Discounts: 67% of students responded that they would find a U-Pass program
more desirable if it offered merchant discounts.
3) Emergency ride home: to address fears of being stranded in the case of an emergency.
4) Recreational partnerships: Offering discounted rates to a local recreation center to
improve fitness and health of participants.
5) Combination of U-Pass and campus parking permits: Combining the U-Pass with a
parking pass helps to promote carpooling for students who live in areas with inadequate
transit service.
6) Infrastructure improvements: improved and increased bus stops.
7) Transit service improvements: increased service to and from campus. An increase in bus
frequency and the addition of an express route to and from the UBCO campus have since
been implemented.
In response to these requested improvements, the City of Kelowna and BC Transit have
improved transit service through additional routes and increased frequency. The 97 Express
Rapid Bus Route travelling from UBC Okanagan to Downtown was added in September 2010
which greatly improved transit service. The campus is also serviced by Route 8 through Rutland
and Route 6 through Glenmore. Furthermore, Route 90 to Vernon was implemented, which
encourages students from farther North to use their U-Passes.
A referendum was held at the UBC Okanagan campus in November 2006, regarding the
implementation of a Kelowna U-Pass program. 34% of the student body voted and 53% of
participants voted in favour of implementing a Kelowna U-Pass (The University of British
Columbia 2010). The UBC Okanagan U-Pass is a decal that can be mounted on a student card
which must be flashed to a bus driver to gain local transit access. A new decal colour is offered
each year to ensure that each student has paid for that year. The UBC Okanagan U-Pass costs
$50 per semester and is subsidized 10% by the school for a final cost of $45 per student per
semester (The University of British Columbia 2010). The U-Pass program was instituted at UBC
Okanagan in 2007 and as a result, transit usage went up by 50% after the first year (Pavlich
2010).
Both UBC Vancouver and UBC Okanagan U-Pass programs have demonstrated that the
implementation of the community transportation pass model has a positive effect on transit
usage, and that a transit pass with added benefits helps ensure a successful transportation pass.
2.5 Glenmore (Kelowna, BC)
To implement a successful community transportation pass, it is important to understand
characteristics of the area in which it could be implemented. Consequently, the Glenmore study
area demographics, and transit service were analyzed. Ideally the study boundary characteristics
should fit the four criteria for a successful ComPASS program previously discussed, which are
repeated below:
23
1. A younger than average population,
2. A lower income neighbourhood,
3. Good transit service with fast and frequent trips,
4. Lower than average automobile ownership.
2.5.1 Study Area Demographics
The latest available census data was analyzed to determine the demographics of the Glenmore
community within the study boundary using 2006 Census data, GIS software and Statistics
Canada Tabulation Tables. It was determined that the study area included:
• 728 households
• 1904 people
This equates to an average of 2.6 residents per household. The size of the study area is
approximately 0.9 square kilometres, with a slight incline from South to North. The area is zoned
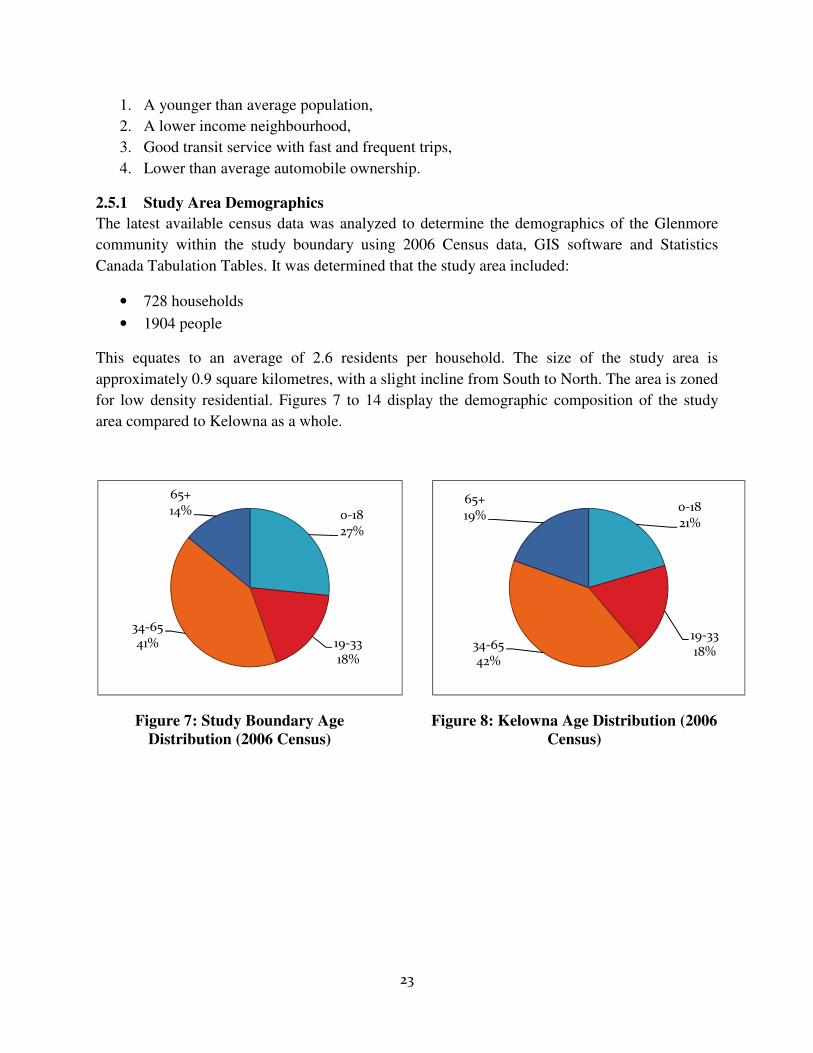
for low density residential. Figures 7 to 14 display the demographic composition of the study
area compared to Kelowna as a whole.
Figure 7: Study Boundary Age Distribution (2006 Census)
Figure 8: Kelowna Age Distribution (2006 Census)
0-1827%
19-3318%
34-6541%
65+14% 0-18
21%
19-3318%
34-6542%
65+19%

24
Figure 9: Study Area Transportation Mode Split to Work (2006 Census)
Figure 10: Kelowna Transportation Mode Split to Work (2006 Census)
Figure 11: Study Boundary Males and Females (2006 Census)
Figure 12: Study Boundary Males and Females (2006 Census)
Figure 13: Individual Income in the Glenmore Study Boundary (2006 Census)
Figure 14: Individual Income in Kelowna (2006 Census)
Vehicle81%
Carpool9%
Bus1%
Bike5%
Walk4%
Vehicle79%
Carpool8%
Bus3%
Bike5%
Walk4%
Other1%
Male48%
Female52%
Male48%
Female52%
< $25,000
46%
$25,000 -$45,000
21%
$45,000 -$60,000
19%
> $60,000
14%< $25,000
50%
$25,000 -$45,000
27%
$45,000 -$60,000
10%
> $60,000
13%
25
The transportation methods for residents within the Glenmore ComPASS study boundary differ from Kelowna averages. There are 968 commuters in the study boundary, and these commuters use single occupancy vehicles 2% more and public transit 2% less than Kelowna as a whole.
The average income per resident in the labour force in Glenmore is between $30,000 and
$35,000 per year. The average annual income per family is generally around the $70,000 to
$75,000 range, with only one area reaching up to about $99,000 per family per year. The median
income per family in Kelowna is $59,095 per year (City of Kelowna 2011). The average
household income in Glenmore is about $10,000 to $15,000 more than the median income level
for Kelowna, indicating that Glenmore residents are fairly wealthy. This detail does not coincide
well with the 2004 UBC Vancouver ComPASS research study which recommends that the
neighbourhood should be within the low to median income range, which suggests a possible
barrier. However, ComPASS is not a cookie cutter design and must be specifically adjusted for a
successful “made in Kelowna” ComPASS.
Approximately 14.5% of the Glenmore study area population is aged 65 and older, which is less
than the percentage of seniors for the total population of Kelowna at 19.4% (Statisics Canada
2007). Furthermore, youth aged 19 and under comprise 24.6% of the study area population
compared to 21.9% of Kelowna’s total population (Statisics Canada 2007). The lower average
age within the Glenmore ComPASS study area may indicate that this particular community will
be more likely to accept changes that will improve sustainability. This coincides well with the
recommendation set forth by the 2004 UBC Vancouver ComPASS research study.
Overall, the analysis of the study boundary demographics indicates there is:
1. A younger than average neighbourhood age,
2. A higher than average income levels, and
3. A higher than average automobile usage than the rest of Kelowna.
The demographics of the study boundary satisfy the first point – a younger than average
population. However, points 2 and 3 do not satisfy the recommendations. The study boundary
has a higher median income and higher automobile usage than Kelowna as a whole.
2.5.2 Public Transit in Glenmore
There are currently 3 bus routes that travel through Glenmore – Route 3, 6, and 7. These three
routes currently have fair service hours, frequency, and coverage. However, since these routes
are not high frequency rapid routes, the current service to this area does not fully meet the
recommendation from the 2004 UBC Vancouver ComPASS research study that states the study
boundary must have good transit service. However, in terms of Kelowna, the service is on par
with the rest of the region, if not slightly better
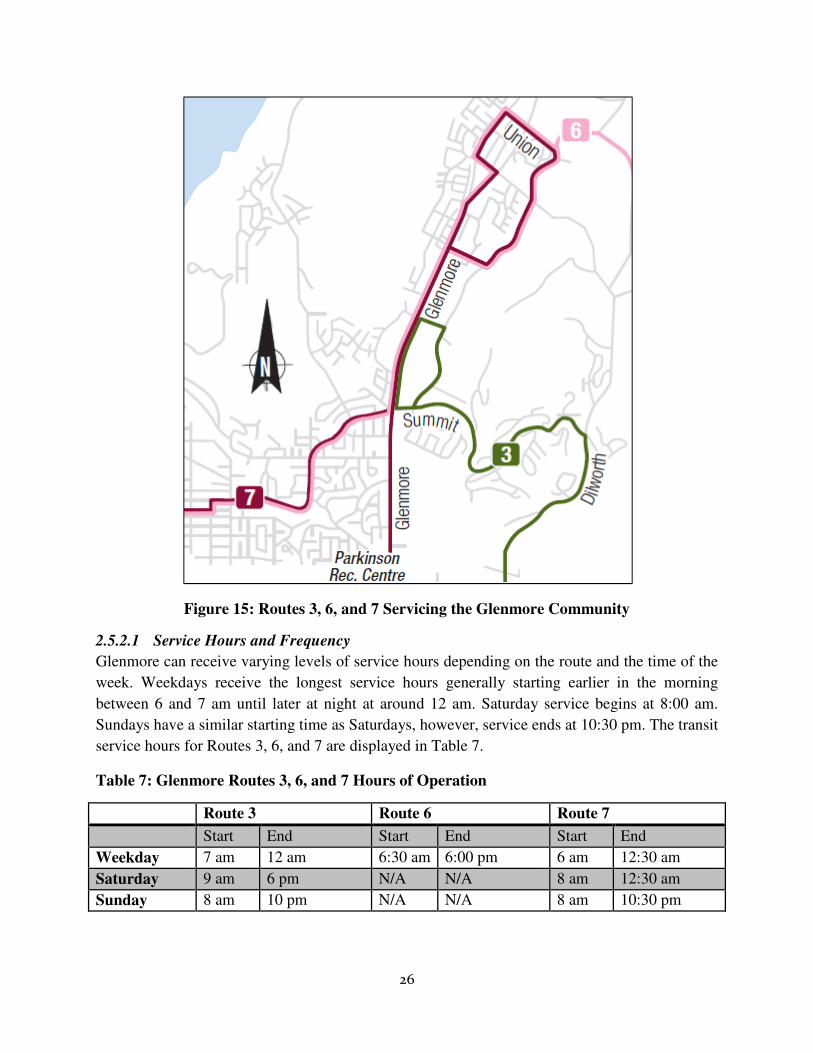
26
Figure 15: Routes 3, 6, and 7 Servicing the Glenmore Community
2.5.2.1 Service Hours and Frequency
Glenmore can receive varying levels of service hours depending on the route and the time of the
week. Weekdays receive the longest service hours generally starting earlier in the morning
between 6 and 7 am until later at night at around 12 am. Saturday service begins at 8:00 am.
Sundays have a similar starting time as Saturdays, however, service ends at 10:30 pm. The transit
service hours for Routes 3, 6, and 7 are displayed in Table 7.
Table 7: Glenmore Routes 3, 6, and 7 Hours of Operation
Route 3 Route 6 Route 7
Start End Start End Start End
Weekday 7 am 12 am 6:30 am 6:00 pm 6 am 12:30 am
Saturday 9 am 6 pm N/A N/A 8 am 12:30 am
Sunday 8 am 10 pm N/A N/A 8 am 10:30 pm
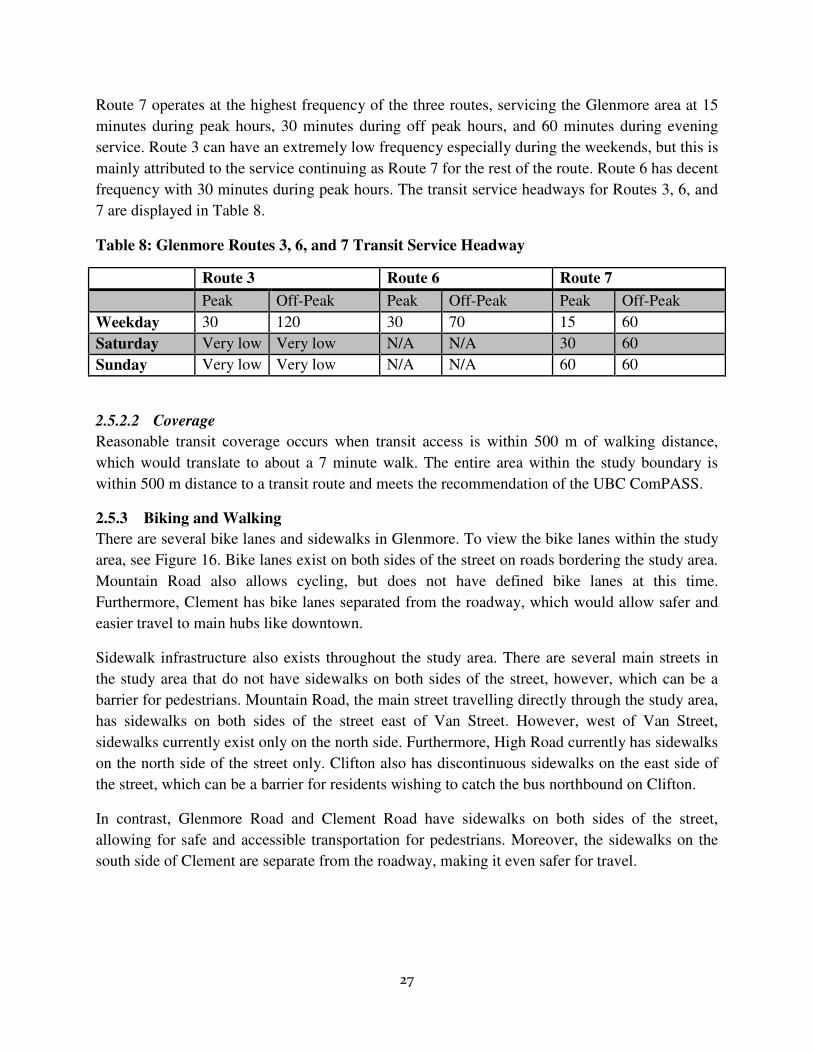
27
Route 7 operates at the highest frequency of the three routes, servicing the Glenmore area at 15
minutes during peak hours, 30 minutes during off peak hours, and 60 minutes during evening
service. Route 3 can have an extremely low frequency especially during the weekends, but this is
mainly attributed to the service continuing as Route 7 for the rest of the route. Route 6 has decent
frequency with 30 minutes during peak hours. The transit service headways for Routes 3, 6, and
7 are displayed in Table 8.
Table 8: Glenmore Routes 3, 6, and 7 Transit Service Headway
Route 3 Route 6 Route 7
Peak Off-Peak Peak Off-Peak Peak Off-Peak
Weekday 30 120 30 70 15 60
Saturday Very low Very low N/A N/A 30 60
Sunday Very low Very low N/A N/A 60 60
2.5.2.2 Coverage
Reasonable transit coverage occurs when transit access is within 500 m of walking distance,
which would translate to about a 7 minute walk. The entire area within the study boundary is
within 500 m distance to a transit route and meets the recommendation of the UBC ComPASS.
2.5.3 Biking and Walking
There are several bike lanes and sidewalks in Glenmore. To view the bike lanes within the study
area, see Figure 16. Bike lanes exist on both sides of the street on roads bordering the study area.
Mountain Road also allows cycling, but does not have defined bike lanes at this time.
Furthermore, Clement has bike lanes separated from the roadway, which would allow safer and
easier travel to main hubs like downtown.
Sidewalk infrastructure also exists throughout the study area. There are several main streets in
the study area that do not have sidewalks on both sides of the street, however, which can be a
barrier for pedestrians. Mountain Road, the main street travelling directly through the study area,
has sidewalks on both sides of the street east of Van Street. However, west of Van Street,
sidewalks currently exist only on the north side. Furthermore, High Road currently has sidewalks
on the north side of the street only. Clifton also has discontinuous sidewalks on the east side of
the street, which can be a barrier for residents wishing to catch the bus northbound on Clifton.
In contrast, Glenmore Road and Clement Road have sidewalks on both sides of the street,
allowing for safe and accessible transportation for pedestrians. Moreover, the sidewalks on the
south side of Clement are separate from the roadway, making it even safer for travel.
28
Figure 16: Bike Lanes within the Study Area (City of Kelowna 2009)
Note: Red lines indicate roads with bike lanes on both sides, dark red indicates shared bicycle use with vehicles, and green lines indicate bike paths separated from the road.
2.5.4 Study Area Businesses
There are several businesses located within the study area, including a convenience store, hair
studios, flower shop, restaurants, day care centres, and adventure outfits. Furthermore, Glenmore
Elementary School and Grace Baptist Church are also located within the study area.
29
2.6 Survey Design
In order to create an effective survey, a review of the literature was conducted to determine the
main factors that contribute to a successful survey. Critical survey factors regarding survey
design were noted from the book “Successful Surveys: Research Methods and Practice” written
in 1994 by UBC Professor Neil Guppy and George Gray, including:
• Ensure the wording of the question is precise,
• Allow the respondent the option to select “I do not know the answer”,
• Acknowledge respondent “blind spots” (anything the respondent may not know or may
not be willing to accept about themselves),
• Be careful of self deception (e.g.: most people will answer “no” to the question “are you
an ethical person?” regardless of how ethical or unethical their actions are)
Essentially, the design team was aware that everyone has an inherent bias as each person has
their own values, beliefs and attitudes (e.g. anti-transit and pro-transit). For example, the design
team was conscious of the fact that most respondents within the steering committee would be
biased in favour of the ComPASS initiative. Consequently, the majority of surveys were
completed by Glenmore residents who were not part of the steering committee.
Each question on the survey was directed towards measuring an individual’s “perception,
opinion, belief, norm, value, characteristic, or behaviour” (Guppy and Gray 1994). In the case of
the Glenmore ComPASS project, behaviour, perception, and opinion were the major factors
which were addressed. Current travel habits, current perception of public transit, and opinions on
what could increase transit use were key components to the survey design.
2.6.1 Required Sample Sizes
When analyzing survey data, it was important to ensure that the results were valid and could be
used to accurately determine the average opinion of the community as a whole. To accomplish
this, a minimum sample size had to be obtained. The exact size of the sample was based on an
acceptable level of error in any conclusions made using the data obtained. The two main factors
that had to be accounted for when calculating accuracy were confidence level and confidence
interval.
The confidence interval is a measure of a variance from the mean in which the parameter of
interest will be included if the experiment is repeated a number of times. This is often referred to
as the margin of error. The confidence level is the frequency with which the parameter of interest
will appear within the stated confidence interval. A confidence level of 90% with a confidence
interval of 15% means that 90% of the time, the results will lie within ±15% of the mean. Using
a confidence interval and confidence level does not allow for the prediction of any individual
response, however it does allow for the prediction of where the mean value could reasonably lie.
For the purposes of the Glenmore ComPASS survey, the research team was most interested in
determining the mean value as this would represent the average opinion of the survey area
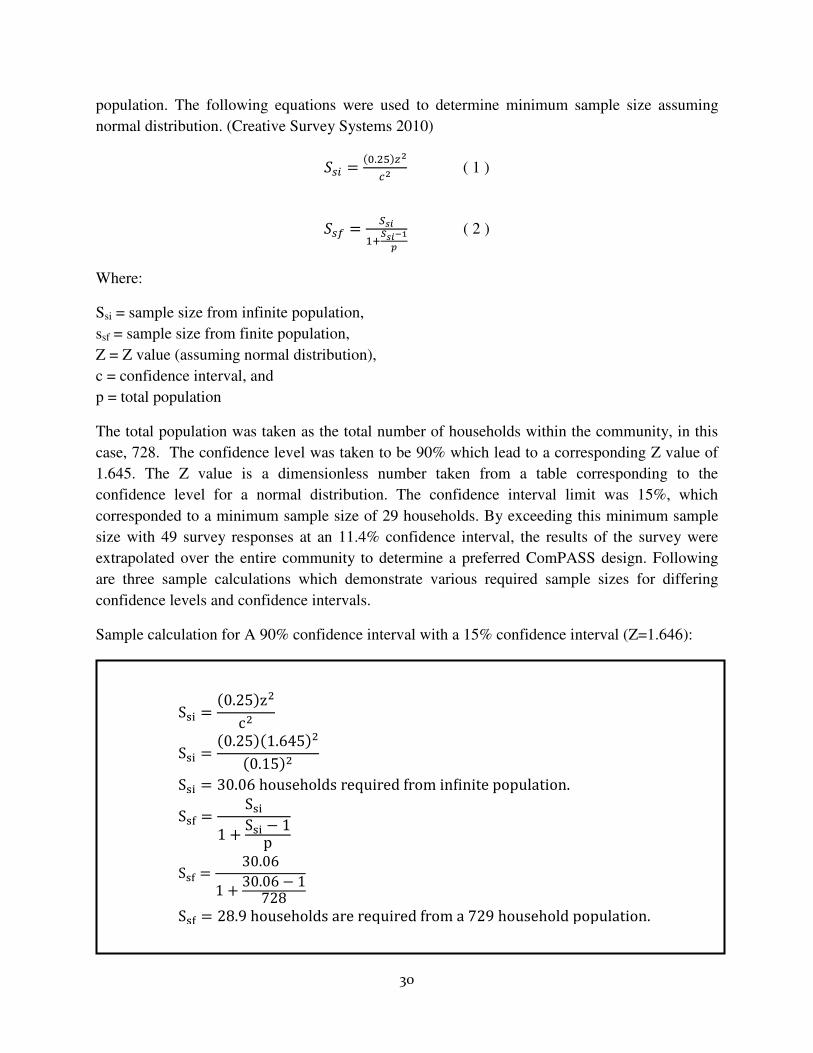
30
population. The following equations were used to determine minimum sample size assuming
normal distribution. (Creative Survey Systems 2010)
9:; = ��.���<=>= ( 1 )
9:? = @AB/CDABEF
G ( 2 )
Where:
Ssi = sample size from infinite population,
ssf = sample size from finite population,
Z = Z value (assuming normal distribution),
c = confidence interval, and
p = total population
The total population was taken as the total number of households within the community, in this
case, 728. The confidence level was taken to be 90% which lead to a corresponding Z value of
1.645. The Z value is a dimensionless number taken from a table corresponding to the
confidence level for a normal distribution. The confidence interval limit was 15%, which
corresponded to a minimum sample size of 29 households. By exceeding this minimum sample
size with 49 survey responses at an 11.4% confidence interval, the results of the survey were
extrapolated over the entire community to determine a preferred ComPASS design. Following
are three sample calculations which demonstrate various required sample sizes for differing
confidence levels and confidence intervals.
Sample calculation for A 90% confidence interval with a 15% confidence interval (Z=1.646):
S I =�0.25�z�
c�
S I =�0.25��1.645��
�0.15��
S I = 30.06householdsrequiredfrominRinitepopulation.S S = S I
1 + S I − 1p
S S = 30.061 + 30.06 − 1
728
S S = 28.9householdsarerequiredfroma729householdpopulation.

31
Sample calculation for a 95% confidence level and 10% confidence interval (Z=1.960):
Sample calculation of the confidence interval for the actual Glenmore ComPASS survey results:
2.7 Social Marketing
Social marketing is essential for understanding how to successfully promote behavioural
changes, such as encouraging more sustainable transportation and less automobile use, which are
essential for the success of the Glenmore ComPASS.
S S = S I1 + S I − 1
p
49 = S I1 + S I − 1
728
S I = 52.4residentsfrominRinitepopulation.52.4 = �0.25��1.645��
c� c = 11.4%
For 90% confidence level and 49 household responses, the confidence interval is:
S I =�0.25�z�
c�
S I =�0.25��1.960��
�0.10��
S I = 96.04householdsrequiredfrominRinitepopulation.S S = S I
1 + S I − 1p
S S = 96.041 + 96.04 − 1
728
S S = 84.9householdsarerequiredfroma728householdpopulation.

32
2.7.1 Community-Based Social Marketing
Information-based marketing campaigns have often been used to attempt to influence community
behaviour. There are two main types of information-based campaigns: 1) the Attitude-Behaviour
approach and 2) the Economic Self-Interest approach.
1. The Attitude-Behaviour approach assumes that providing information and increasing
awareness of an issue will stimulate changes in behaviour. However, even though
attitudes towards a subject may change, this strategy is unsuccessful at actually
influencing people to act differently. For example, one may have extensive knowledge of
public transportation, but this does not necessarily encourage them to use the transit
system. There may still be too many barriers that discourage use despite their awareness.
2. The Economic Self-Interest approach believes that individuals will evaluate various
options, and choose the option that best suits their economic self-interest. According to
various studies, informing residents of the economic benefits of choosing a more
sustainable option has been overall unsuccessful. Therefore, even if residents are
informed that using public transit is far less expensive than owning their own vehicle;
they will rarely act upon their economic self-interest. This is believed to be because this
approach includes a very simplistic look at the “human side of sustainable behaviour”.
Communities are extremely diversified and what may change the behaviour of one
individual may not influence the behaviour of another.
Overall, information-based social marketing campaigns are common since the campaign strategy
is relatively simple – advertise and distribute pamphlets. However, this strategy can be extremely
expensive, especially if it results in minimal success. An effective emerging alternative to these
two traditional information-based approaches has come to be termed “community-based social
marketing”.
“Fostering Sustainable Behaviour: An Introduction to Community-Based Social Marketing” by
Doug McKenzie-Mohr was used to determine how this concept could be applied to the Glenmore
ComPASS Research Study. McKenzie-Mohr outlined five main steps to develop a successful
community-based social marketing strategy that results in sustainable behaviour changes as
summarized in Figure 17.

Figure 17: Five Steps to Develop a Successful Community
2.7.1.1 Step 1: Select Behaviours to Encourage
Behaviours that want to be changed
desired behaviour to a non-divisible and end
specific and cannot be broken down further. For example, one could choose “
emissions”, but this behaviour can be broken down further to
use”, “buy from local merchants
produce the desired outcome. For e
you could attempt to reduce the
7% of the CO2 emissions this would
changing. In contrast, 79% of the community uses their personal vehicles
and since these vehicles account for
automobile use should be the goal.
2.7.1.2 Step 2: Identify Barriers and Benefits Associated with Sustainable Behaviours
To develop an effective community
what barriers hinder community members from taking part in an activity, and what incentives
will encourage them to take part. Although researchers may often be
what these barriers and incentives are, it can be different for specific communities. There may
also be barriers and incentives that a researcher may never have though
important to take the appropriate steps to
for a particular community. Barriers and incentives can be determined through an extensive
literature review, observations, focus groups, and surveys.
Step 1: Select Behaviours to Encourage
Step 2: Identify Barriers and Benefits Associated with Sustainable Behaviours
Step 3: Develop Strategies to Encourage Behaviour Changes
Step 4: Develop a Pilot Program
Step 5: Implement a BroadProgram and Evaluate
33
: Five Steps to Develop a Successful Community-Based Social Marketing Strategy
Step 1: Select Behaviours to Encourage
Behaviours that want to be changed should be chosen carefully. One must narrow down the
divisible and end-state behaviour. Non-divisible behaviours are
specific and cannot be broken down further. For example, one could choose “
haviour can be broken down further to behaviours such as “reduce vehicle
from local merchants”, and much more. End-state behaviours are behaviours
produce the desired outcome. For example, if you want to reduce CO2 emissions
you could attempt to reduce the solid waste production, but since solid waste accounts for
this would not be a behaviour that you would want to focus on
% of the community uses their personal vehicles for work commutes
these vehicles account for 65% of the CO2 emissions in Kelowna,
automobile use should be the goal.
Step 2: Identify Barriers and Benefits Associated with Sustainable Behaviours
To develop an effective community-based social marketing strategy, it is important to understand
what barriers hinder community members from taking part in an activity, and what incentives
will encourage them to take part. Although researchers may often believe they already know
what these barriers and incentives are, it can be different for specific communities. There may
be barriers and incentives that a researcher may never have thought of. Therefore, it is
important to take the appropriate steps to determine exactly what the barriers and incentives are
Barriers and incentives can be determined through an extensive
literature review, observations, focus groups, and surveys.
Step 1: Select Behaviours to Encourage
Step 2: Identify Barriers and Benefits Associated with Sustainable Behaviours
Step 3: Develop Strategies to Encourage Behaviour Changes
Step 4: Develop a Pilot Program
Step 5: Implement a Broad-Scale Program and Evaluate
Based Social Marketing Strategy
should be chosen carefully. One must narrow down the
divisible behaviours are
specific and cannot be broken down further. For example, one could choose “reduce carbon
behaviours such as “reduce vehicle
are behaviours that
emissions in Kelowna,
accounts for only
not be a behaviour that you would want to focus on
for work commutes,
, then decreasing
Step 2: Identify Barriers and Benefits Associated with Sustainable Behaviours
based social marketing strategy, it is important to understand
what barriers hinder community members from taking part in an activity, and what incentives
lieve they already know
what these barriers and incentives are, it can be different for specific communities. There may
of. Therefore, it is
determine exactly what the barriers and incentives are
Barriers and incentives can be determined through an extensive
34
There are two types of barriers: internal and external. Internal barriers involve a lack of
knowledge on how to engage in an activity, for example, how to follow a bus schedule. External
barriers are more physical and involve what makes that activity inconvenient, such as
infrastructure and services, for example, distance to the nearest bus stop. Once the barriers are
determined, methods for minimizing or eliminating these barriers, as well as enhancing the
incentives, can be explored.
2.7.1.3 Step 3: Develop Strategies to Encourage Behaviour Changes
Once barriers and the appropriate incentives are known, then strategies to influence community
behaviours must be developed. Social science research indicates that people are more likely to
change behaviour in response to direct appeals from others. Consequently, direct personal
contact with community members is essential, for example, door-to-door transit schedule drop-
offs and communicating how it is used. Another example is to have transit booths available for
answering questions, rather than an impersonal telephone recording when attempting to call the
transit company. The design team employed this strategy to encourage community engagement
through knocking on doors, public design workshops, and participating in community events to
raise awareness about the Glenmore ComPASS.
2.7.1.4 Step 4: Develop a Pilot Program
A pilot program utilizing the proposed community-based social marketing strategy should be
implemented involving a small sample of community members. For example, Phase 2 of the
Glenmore ComPASS study will involve giving a Glenmore ComPASS to 20 to 30 households
for three months to pilot the program. This allows researchers to investigate which portions of
the strategy are effective and which are ineffective, thus promoting the development of a
successful overall strategy. The pilot program can also demonstrate to potential funders that the
strategy is worthwhile in a broader scale.
2.7.1.5 Step 5: Implement a Broad-Scale Program and Evaluate
Once the pilot is completed and proven successful, then the plan can be applied to a larger
portion of the community. Even though this step is applied to a large scale, it is still important to
continuously evaluate the program and refine it. This allows researchers to monitor the
effectiveness of the program and to continuously improve it.
2.7.2 Social Marketing in the Central Okanagan Region
In 2004, Karyo Communications submitted a report to the City of Kelowna titled “Central
Okanagan Region Social Marketing Strategy” (City of Kelowna 2004). Through literature
reviews, focus groups, random telephone surveys, and an Open Space Technology session,
Karyo Communications developed a social marketing strategy to encourage residents to reduce
their use of personal vehicles. Karyo Communications listed the barriers specific to the Central
Okanagan along with several recommendations to create a successful social marketing strategy
to promote more sustainable transportation.
35
There were five main barriers identified by Karyo Communications which discourage active
transportation use in Kelowna. They are as follows:
• Only recently have the Central Okanagan and City of Kelowna begun following smart
growth policies and practices, and in the past failed to consider the implications of
developing communities that heavily rely on automobiles.
• One of the main reasons people move to Kelowna is for the lifestyle which often requires
the use of an automobile.
• Automobile usage has become embedded in the Central Okanagan way of life in
residents’ values, beliefs and attitudes.
• The geographic features of the Central Okanagan vary drastically from steep hills to flat
areas, which can make active transportation difficult for some residents.
• In the past, the Central Okanagan has heavily invested in infrastructure to accommodate
personal vehicle use with relatively small investments for transit, biking, and pedestrian
infrastructure.
Although these barriers exist, Karyo Communications identified various trends and
characteristics of the community which may work in favour of positive changes in the Central
Okanagan. Some of these characteristics are as follows:
• There is a large connection between residents and their love for their way of life in the
Central Okanagan thorough its climate, lifestyle, and sense of community. This love of
their location can work in favour of transportation mode shifts by emphasizing that their
highly desirable way of life will be compromised with the continuation of current
transportation behaviours.
• Over half of survey respondents indicated that they would be willing to stop using their
vehicle one day per week if there was a community-wide initiative in place. This shows
potential for programs such as the Glenmore ComPASS, which involves community
members.
• Residents do not respond positively to being told their actions are incorrect, therefore it is
important to emphasize the benefits involved with changing behaviours. It is beneficial to
outline benefits that might relate to a specific community, and for the Central Okanagan,
such a benefit would be improved fitness with taking active transportation.
• The Central Okanagan’s social marketing program must address the fundamental human
needs (physiological needs, safety and security needs, belonging and love needs, and
esteem needs) that may prevent participation in active transportation.
• There are many residents of the Central Okanagan who are willing to take on a leadership
role and devote their time to encourage active transportation change in their
neighbourhoods, workplaces and networks.
• According to the telephone survey, there is a large segment of people in the Central
Okanagan who would be open to changing their transportation habits.
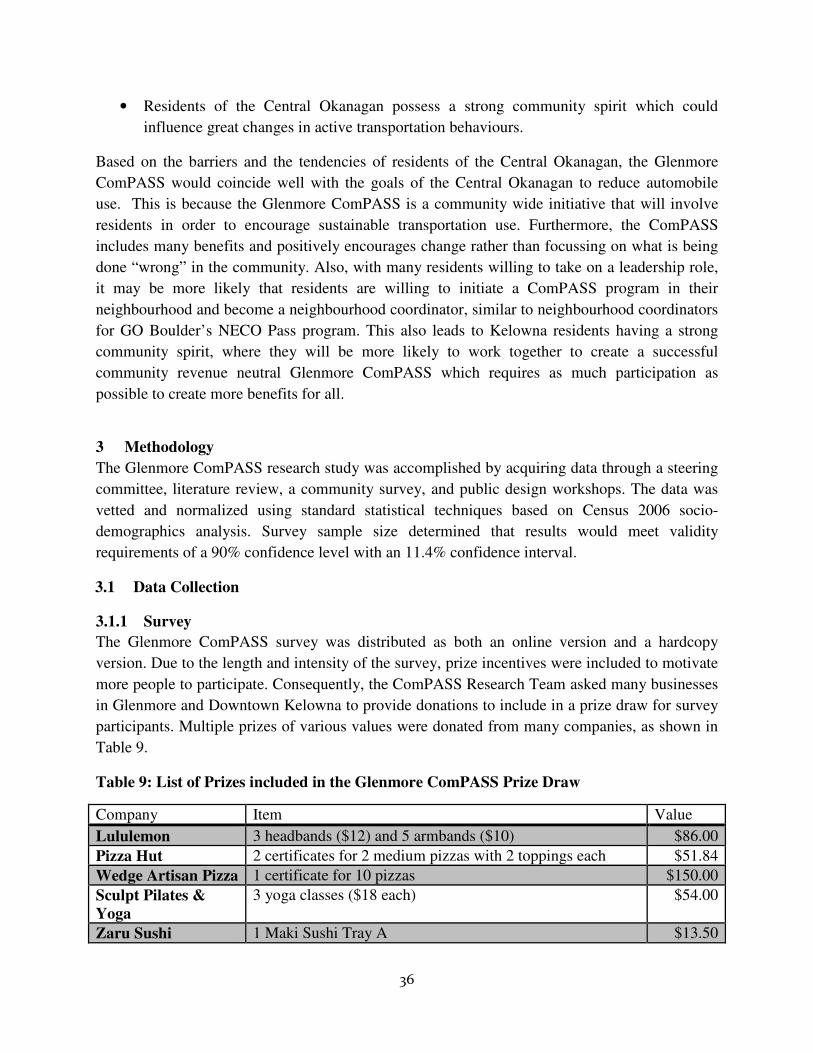
36
• Residents of the Central Okanagan possess a strong community spirit which could
influence great changes in active transportation behaviours.
Based on the barriers and the tendencies of residents of the Central Okanagan, the Glenmore
ComPASS would coincide well with the goals of the Central Okanagan to reduce automobile
use. This is because the Glenmore ComPASS is a community wide initiative that will involve
residents in order to encourage sustainable transportation use. Furthermore, the ComPASS
includes many benefits and positively encourages change rather than focussing on what is being
done “wrong” in the community. Also, with many residents willing to take on a leadership role,
it may be more likely that residents are willing to initiate a ComPASS program in their
neighbourhood and become a neighbourhood coordinator, similar to neighbourhood coordinators
for GO Boulder’s NECO Pass program. This also leads to Kelowna residents having a strong
community spirit, where they will be more likely to work together to create a successful
community revenue neutral Glenmore ComPASS which requires as much participation as
possible to create more benefits for all.
3 Methodology
The Glenmore ComPASS research study was accomplished by acquiring data through a steering
committee, literature review, a community survey, and public design workshops. The data was
vetted and normalized using standard statistical techniques based on Census 2006 socio-
demographics analysis. Survey sample size determined that results would meet validity
requirements of a 90% confidence level with an 11.4% confidence interval.
3.1 Data Collection
3.1.1 Survey
The Glenmore ComPASS survey was distributed as both an online version and a hardcopy
version. Due to the length and intensity of the survey, prize incentives were included to motivate
more people to participate. Consequently, the ComPASS Research Team asked many businesses
in Glenmore and Downtown Kelowna to provide donations to include in a prize draw for survey
participants. Multiple prizes of various values were donated from many companies, as shown in
Table 9.
Table 9: List of Prizes included in the Glenmore ComPASS Prize Draw
Company Item Value
Lululemon 3 headbands ($12) and 5 armbands ($10) $86.00
Pizza Hut 2 certificates for 2 medium pizzas with 2 toppings each $51.84
Wedge Artisan Pizza 1 certificate for 10 pizzas $150.00
Sculpt Pilates & Yoga
3 yoga classes ($18 each) $54.00
Zaru Sushi 1 Maki Sushi Tray A $13.50
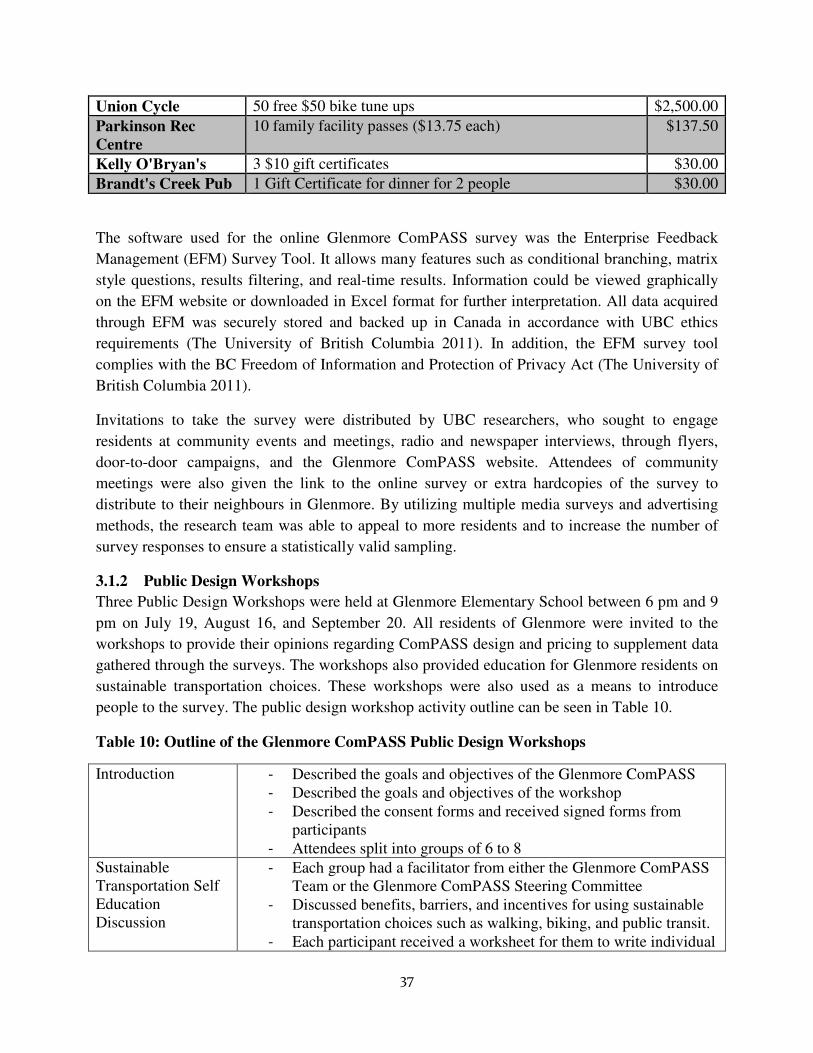
37
Union Cycle 50 free $50 bike tune ups $2,500.00
Parkinson Rec Centre
10 family facility passes ($13.75 each) $137.50
Kelly O'Bryan's 3 $10 gift certificates $30.00
Brandt's Creek Pub 1 Gift Certificate for dinner for 2 people $30.00
The software used for the online Glenmore ComPASS survey was the Enterprise Feedback
Management (EFM) Survey Tool. It allows many features such as conditional branching, matrix
style questions, results filtering, and real-time results. Information could be viewed graphically
on the EFM website or downloaded in Excel format for further interpretation. All data acquired
through EFM was securely stored and backed up in Canada in accordance with UBC ethics
requirements (The University of British Columbia 2011). In addition, the EFM survey tool
complies with the BC Freedom of Information and Protection of Privacy Act (The University of
British Columbia 2011).
Invitations to take the survey were distributed by UBC researchers, who sought to engage
residents at community events and meetings, radio and newspaper interviews, through flyers,
door-to-door campaigns, and the Glenmore ComPASS website. Attendees of community
meetings were also given the link to the online survey or extra hardcopies of the survey to
distribute to their neighbours in Glenmore. By utilizing multiple media surveys and advertising
methods, the research team was able to appeal to more residents and to increase the number of
survey responses to ensure a statistically valid sampling.
3.1.2 Public Design Workshops
Three Public Design Workshops were held at Glenmore Elementary School between 6 pm and 9
pm on July 19, August 16, and September 20. All residents of Glenmore were invited to the
workshops to provide their opinions regarding ComPASS design and pricing to supplement data
gathered through the surveys. The workshops also provided education for Glenmore residents on
sustainable transportation choices. These workshops were also used as a means to introduce
people to the survey. The public design workshop activity outline can be seen in Table 10.
Table 10: Outline of the Glenmore ComPASS Public Design Workshops
Introduction - Described the goals and objectives of the Glenmore ComPASS - Described the goals and objectives of the workshop - Described the consent forms and received signed forms from
participants - Attendees split into groups of 6 to 8
Sustainable Transportation Self Education Discussion
- Each group had a facilitator from either the Glenmore ComPASS Team or the Glenmore ComPASS Steering Committee
- Discussed benefits, barriers, and incentives for using sustainable transportation choices such as walking, biking, and public transit.
- Each participant received a worksheet for them to write individual
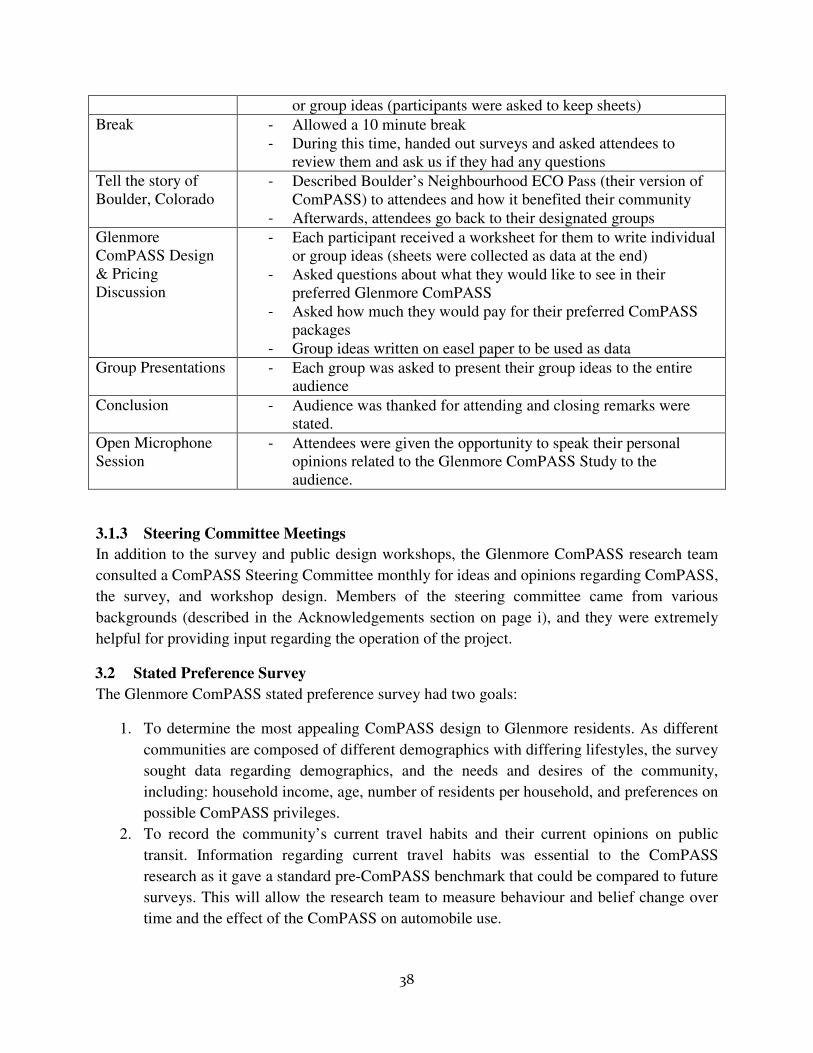
38
or group ideas (participants were asked to keep sheets)
Break - Allowed a 10 minute break - During this time, handed out surveys and asked attendees to
review them and ask us if they had any questions
Tell the story of Boulder, Colorado
- Described Boulder’s Neighbourhood ECO Pass (their version of ComPASS) to attendees and how it benefited their community
- Afterwards, attendees go back to their designated groups
Glenmore ComPASS Design & Pricing Discussion
- Each participant received a worksheet for them to write individual or group ideas (sheets were collected as data at the end)
- Asked questions about what they would like to see in their preferred Glenmore ComPASS
- Asked how much they would pay for their preferred ComPASS packages
- Group ideas written on easel paper to be used as data
Group Presentations - Each group was asked to present their group ideas to the entire audience
Conclusion - Audience was thanked for attending and closing remarks were stated.
Open Microphone Session
- Attendees were given the opportunity to speak their personal opinions related to the Glenmore ComPASS Study to the audience.
3.1.3 Steering Committee Meetings
In addition to the survey and public design workshops, the Glenmore ComPASS research team
consulted a ComPASS Steering Committee monthly for ideas and opinions regarding ComPASS,
the survey, and workshop design. Members of the steering committee came from various
backgrounds (described in the Acknowledgements section on page i), and they were extremely
helpful for providing input regarding the operation of the project.
3.2 Stated Preference Survey
The Glenmore ComPASS stated preference survey had two goals:
1. To determine the most appealing ComPASS design to Glenmore residents. As different
communities are composed of different demographics with differing lifestyles, the survey
sought data regarding demographics, and the needs and desires of the community,
including: household income, age, number of residents per household, and preferences on
possible ComPASS privileges.
2. To record the community’s current travel habits and their current opinions on public
transit. Information regarding current travel habits was essential to the ComPASS
research as it gave a standard pre-ComPASS benchmark that could be compared to future
surveys. This will allow the research team to measure behaviour and belief change over
time and the effect of the ComPASS on automobile use.

39
3.2.1 Survey Design
To facilitate analysis of the data and minimize multiple unique answers, the Glenmore
ComPASS survey relied more on multiple choice questions and less on open ended questions.
This ensured that the answers given by participants were not subject to interpretation. It was
important not only to have clear and concise questions, but also well defined multiple choice
answers so respondents were completely aware of what they were answering. The survey was
pre-tested via the steering committee to ensure multiple choice answers enveloped all possible
answers. This style of questioning allowed for easier data entry and a more direct and accurate
analysis of the data. When answers were quantized into a set number of options, it made
calculating percentages much easier during analysis. In this way the research team attempted to
optimize the accuracy in determining the community’s opinion on a variety of issues. One open
ended question was included near the end of the survey where residents could fill in any
opinions, needs, or issues that the researchers may have overlooked when designing the survey.
By including this question, the research team was be able to retain the quantized data for simpler
analysis, while also allowing participants the ability to submit any other comments they felt were
also important.
3.2.2 ComPASS Design
Based on the literature review, numerous possible Glenmore ComPASS components were
identified for consideration. Table 11 outlines each possible ComPASS component and their full
cost. Each was included in the survey to gauge public preferences.
Table 11: Costs of the Potential Glenmore ComPASS Components
Possible Component Full Cost
Transit Pass
Adult: $53.00/month Secondary Students:$34/month Seniors:$37/month College Students:$43/month ProPass:$45/month
Parkinson Recreation Centre Pool Pass $82.28/family/month
Parkinson Recreation Centre Facility Pass $45.60/person/month
Bicycle Training Classes Approx. $100/person/class
Bike Tune-ups $50.00 + per tune-up
Bus Mounted Bike Racks Approx. $900/rack
Ground Mounted Bike Racks $858.00/rack (includes installation)
Bicycle Winery Tours $150.00/person/tour
Pedicab Art Gallery Tours $40.00/person/tour
Bike Sharing $4,000.00 per bike
Emergency Taxi Rides Home Approx $50.00 per ride.
Community Shuttle (community purchased)
1. Approx. $80/hour to operate (maintenance, fuel, driver wage) 2. Approx. $3,000 per month ($250,000 bus with
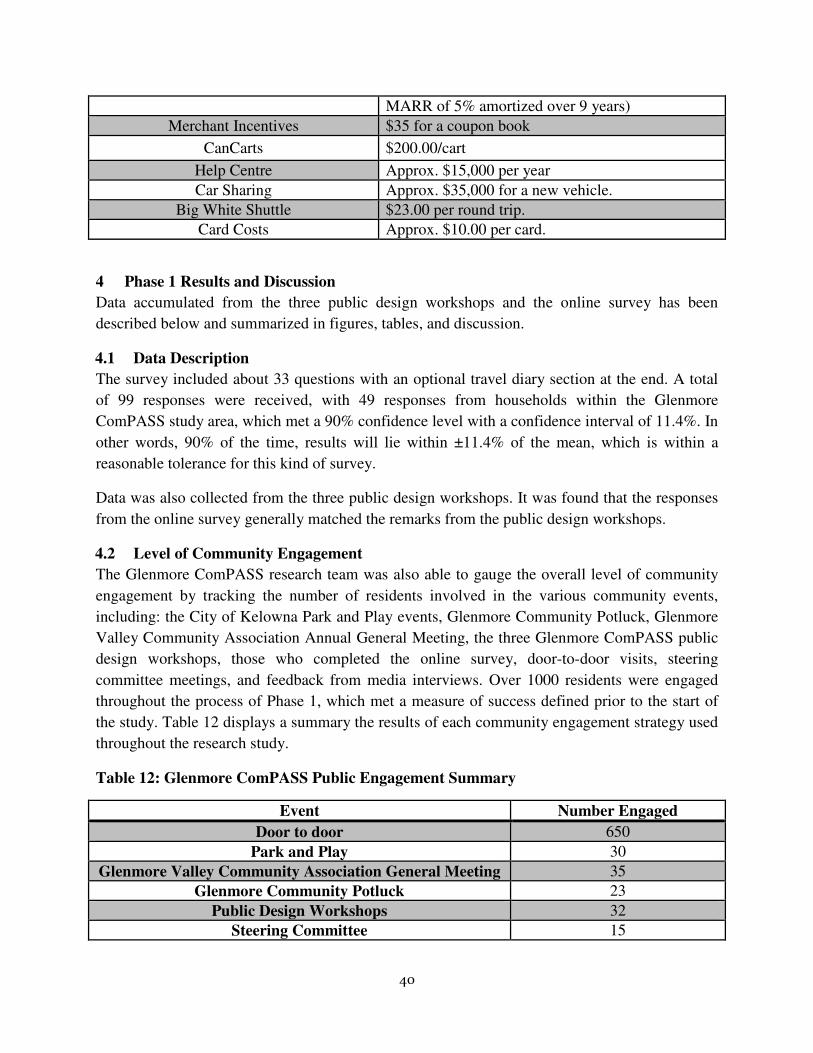
40
MARR of 5% amortized over 9 years)
Merchant Incentives $35 for a coupon book
CanCarts $200.00/cart
Help Centre Approx. $15,000 per year
Car Sharing Approx. $35,000 for a new vehicle.
Big White Shuttle $23.00 per round trip.
Card Costs Approx. $10.00 per card.
4 Phase 1 Results and Discussion
Data accumulated from the three public design workshops and the online survey has been
described below and summarized in figures, tables, and discussion.
4.1 Data Description
The survey included about 33 questions with an optional travel diary section at the end. A total
of 99 responses were received, with 49 responses from households within the Glenmore
ComPASS study area, which met a 90% confidence level with a confidence interval of 11.4%. In
other words, 90% of the time, results will lie within ±11.4% of the mean, which is within a
reasonable tolerance for this kind of survey.
Data was also collected from the three public design workshops. It was found that the responses
from the online survey generally matched the remarks from the public design workshops.
4.2 Level of Community Engagement
The Glenmore ComPASS research team was also able to gauge the overall level of community
engagement by tracking the number of residents involved in the various community events,
including: the City of Kelowna Park and Play events, Glenmore Community Potluck, Glenmore
Valley Community Association Annual General Meeting, the three Glenmore ComPASS public
design workshops, those who completed the online survey, door-to-door visits, steering
committee meetings, and feedback from media interviews. Over 1000 residents were engaged
throughout the process of Phase 1, which met a measure of success defined prior to the start of
the study. Table 12 displays a summary the results of each community engagement strategy used
throughout the research study.
Table 12: Glenmore ComPASS Public Engagement Summary
Event Number Engaged
Door to door 650
Park and Play 30
Glenmore Valley Community Association General Meeting 35
Glenmore Community Potluck 23
Public Design Workshops 32
Steering Committee 15
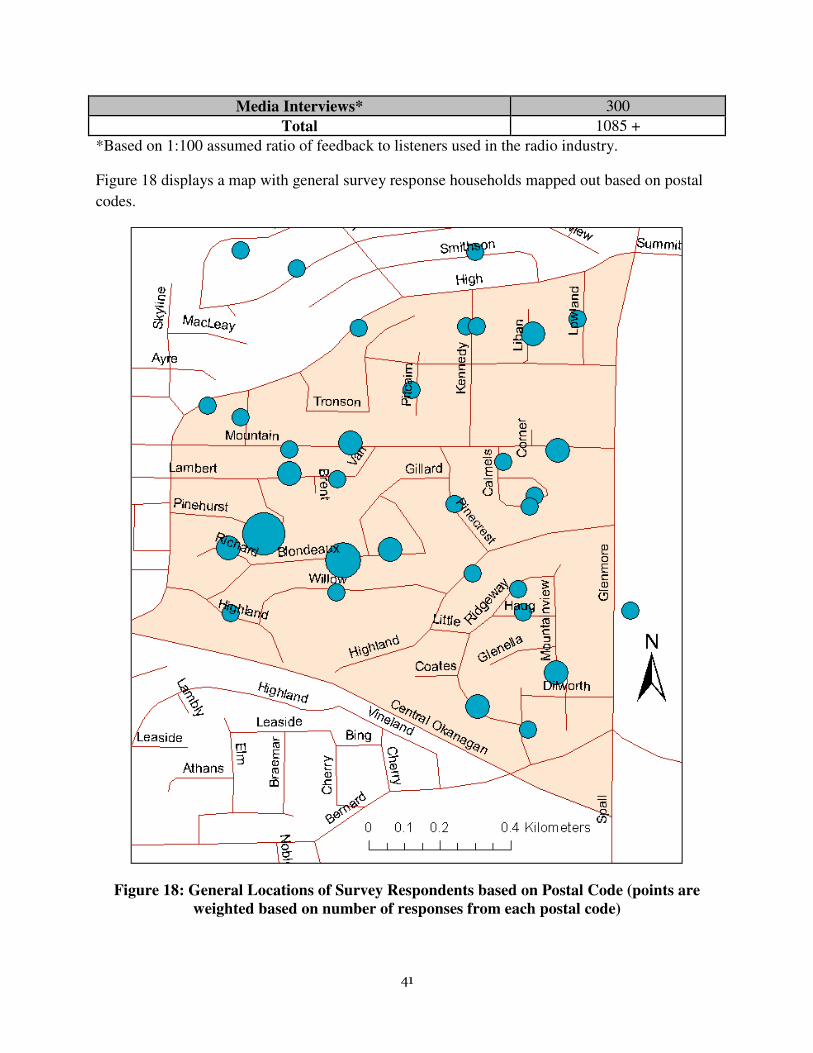
41
Media Interviews* 300
Total 1085 +
*Based on 1:100 assumed ratio of feedback to listeners used in the radio industry.
Figure 18 displays a map with general survey response households mapped out based on postal
codes.
Figure 18: General Locations of Survey Respondents based on Postal Code (points are weighted based on number of responses from each postal code)
42
There were several agglomerations of households who were interested in a Glenmore ComPASS
both within and outside the study boundary. Clusters of high interest households within the study
boundary were located along Pinehurst Drive and Blondeaux Crescent. Outside of the study
boundary, there were several high interest households near the intersections of Union and
Glenmore, and Kane and Glenmore.
4.3 Public Design Workshop Results
Although there was less than ideal attendance for the public design workshops, the research team
still received significant input. Furthermore, the public design workshops gave the research team
an opportunity to educate residents further on the barriers, benefits, and incentives associated
with using sustainable transportation as well as the Glenmore ComPASS in more detail.
The most popular ComPASS design components discussed at workshops included (in addition to
a bus pass):
• Improved transit service (increased headway, later service hours, more bus stops,
improved coverage),
• Recreation centre pass,
• Emergency taxi rides home,
• Bike tune-ups or repairs,
• Glenmore community shuttle, and
• Merchant discounts or incentives.
Residents were willing to pay a wide range for their preferred Glenmore ComPASS package,
with as little as $10 per month per household to over $100 per month per household, depending
on what was included. The general consensus between residents was that for the Glenmore
ComPASS to be attractive and successful, it was essential that 1) it be more than a bus pass, and
2) the transit service to the study area be improved.
4.4 Survey Data Analysis
Sample demographic averages were slightly skewed when compared to the 100% population
data obtained from the 2006 Census. Therefore, to remove bias, survey responses were
normalized using the 2006 Census averages in three categories: 1) age ranges, 2) mode share for
work commutes, and 3) location. Age ranges and transportation mode to and from work were
asked in the Glenmore ComPASS survey and could be directly compared with 2006 Census data.
The home postal code of respondents was also requested to determine whether or not survey
households were located within the study boundary. This was used to filter only respondents
within the study area (Figure 1) for the purposes of this analysis.
Figure 19 displays the survey respondents’ age ranges while Figure 20 displays the 2006 Census
age ranges for Glenmore. Furthermore, Figure 20 displays respondents’ current transportation

43
mode split to and from work in the study area, while Figure 23 displays the 2006 Census
transportation mode split for work commutes within the community.
Figure 19: Resident Age Distribution (ComPASS 2011)
Figure 20: Resident Age Distribution (2006 Glenmore Census)
Figure 21: Transportation Mode to and from Work Only (ComPASS 2011)
Figure 22: Transportation Mode Split to Work Only (2006 Glenmore Census)
When compared with 2006 Census data, there was a lower percentage of those aged 65 and up.
In contrast, those aged 33 to 65 were over represented within the survey sample. Furthermore,
pedestrians and cyclists within the survey sample were over represented, while car use by survey
respondents was less than the 2006 Census.
The weights generated from age range, transportation mode to work, and survey location were
combined to determine a final weight per household. Therefore, all subjective survey answers
related to Glenmore ComPASS pricing and design were normalized according to Census data to
0-1832%
19-339%
34-6551%
65+8%
0-1827%
19-3318%
34-6541%
65+14%
Vehicle67%
Carpool8%
Bus0%
Bike15%
Walk10%
Vehicle81%
Carpool9%
Bus1%
Bike5%
Walk4%
44
ensure they were statistically representative of the entire study boundary. Furthermore, it was
found that the average number of residents per household for survey respondents was 3.1, while
the 2006 Census indicates the average is 2.6 residents per household.
4.4.1 Glenmore ComPASS Benchmarks
To analyze ongoing Glenmore travel behaviour, it was important that the survey also be used to
benchmark current transportation behaviour and belief changes.
4.4.1.1 Transportation Behaviours
Transportation modes within the study area were analyzed including trip characteristics such as
trip departure times, duration, and distance. The frequencies of cycling and transit use were also
analyzed.
The survey asked residents which transportation mode they predominantly used for work, school,
shopping, and recreation, as summarized in Figure 23. However, transportation modes to school
are more equally shared. This is likely because the majority of students are below the legal
driving age and live a closer distance to their schools. Furthermore, it is apparent that students
are the main bus users within the study boundary.
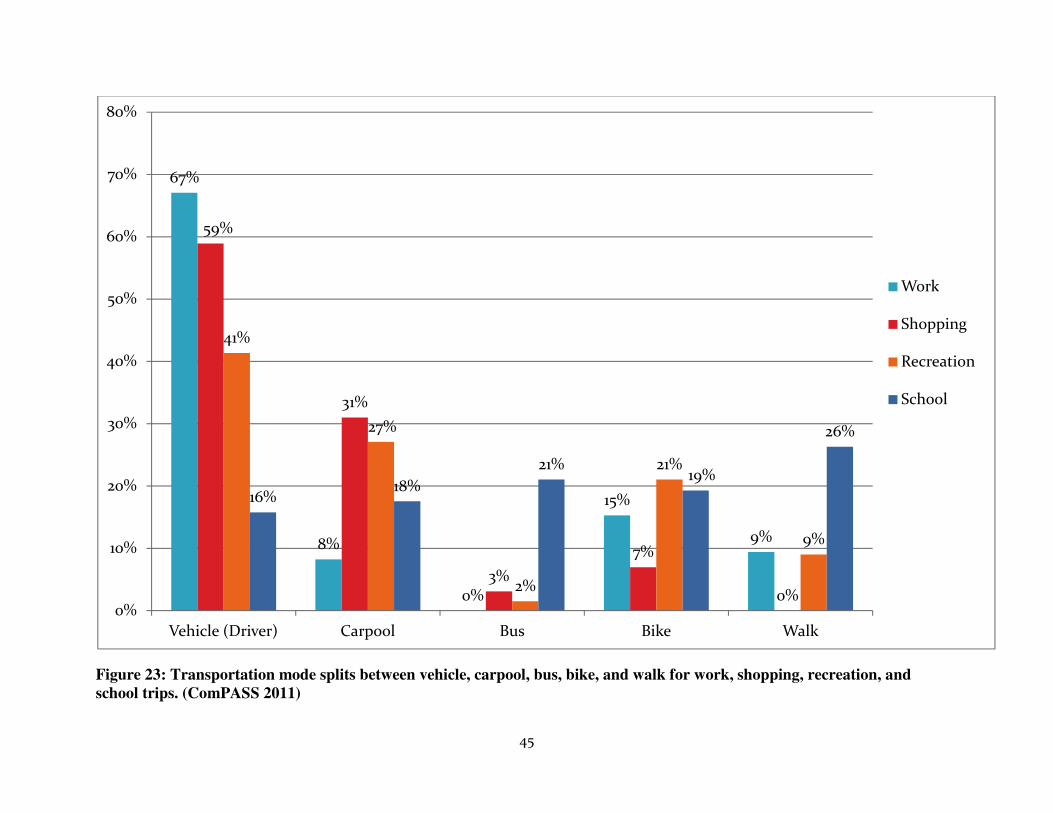
45
Figure 23: Transportation mode splits between vehicle, carpool, bus, bike, and walk for work, shopping, recreation, and school trips. (ComPASS 2011)
67%
8%
0%
15%
9%
59%
31%
3%
7%
0%
41%
27%
2%
21%
9%
16%18%
21%19%
26%
0%
10%
20%
30%
40%
50%
60%
70%
80%
Vehicle (Driver) Carpool Bus Bike Walk
Work
Shopping
Recreation
School

46
Survey participants were also asked during which time intervals members of their household left
home to work or school, as well as the time interval they leave work or school to return home.
Figure 24 represents the percentages of survey respondents that commuted during various time
intervals of the day. The majority of residents leave for work or school between 8 am and 9 am,
while the majority of residents leave work or school between 3 pm to 6 pm.
Figure 24: Trip departure times from home to work/school and from work/school to home (ComPASS 2011)
The survey also asked participants their travel duration (in minutes) to work, shopping,
recreation, and school. The results are summarized in Figure 25. The majority of travel times are
below 20 minutes, which indicates that residents tend to travel closer to home for work,
shopping, recreation, and school. Further analysis of survey results indicated that the weighted
average trip distance between home and work or school is about 6.5 kilometres.
Home to Work/School
Work/School to Home
0%
10%
20%
30%
40%
50%
60%
Pe
rce
nta
ge
Time Interval

47
Figure 25: Trip durations for work, shopping, recreation, and school trips in minutes (ComPASS 2011)
24%26%
7%
1% 2% 2%
39% 40%
7%
2%0% 1%
31%33%
12%
1%
6%
9%
50%
31%
12%
6%
2%0%
0%
10%
20%
30%
40%
50%
60%
0-10 10 - 20 20 - 30 30 - 45 45 - 60 Greater than 60 minutes
Pe
rce
nta
ge
Trip Duration (minutes)
Work
Shopping
Recreation
School

48
Figure 26 shows the travel distance distribution of survey respondents’ commutes to work and
school. One third of residents’ trip distances were below 3 km, which is the ideal trip distance for
cycling in terms of travel time, speed, and energy efficiency (Feng and Lovegrove 1995).
Figure 26: Travel distance for work and school trips (ComPASS 2011)
Furthermore, calculated trip duration according to reported trip distances were compared with
self reported trip durations for work or school trips, as shown in Figure 27. Measured and
reported trip durations are fairly similar, which indicates that resident perception of time is fairly
accurate.
Figure 27: Measured versus reported trip durations for work and school (ComPASS 2011)
33%
21%
17%
7%
16%
5%
2%
0%
5%
10%
15%
20%
25%
30%
35%
0-3 3-5 5-7 7-10 10-15 15-20 20+
Pe
rce
nta
ge
Kilometres
52%
35%
10%
0%3%
44%
39%
11%
3% 2%
0%
10%
20%
30%
40%
50%
60%
0-10 10-20 20-30 30-45 45+
Pe
rce
nta
ge
Trip Duration to Work or School (Minutes)
Measured Duration
Reported Duration
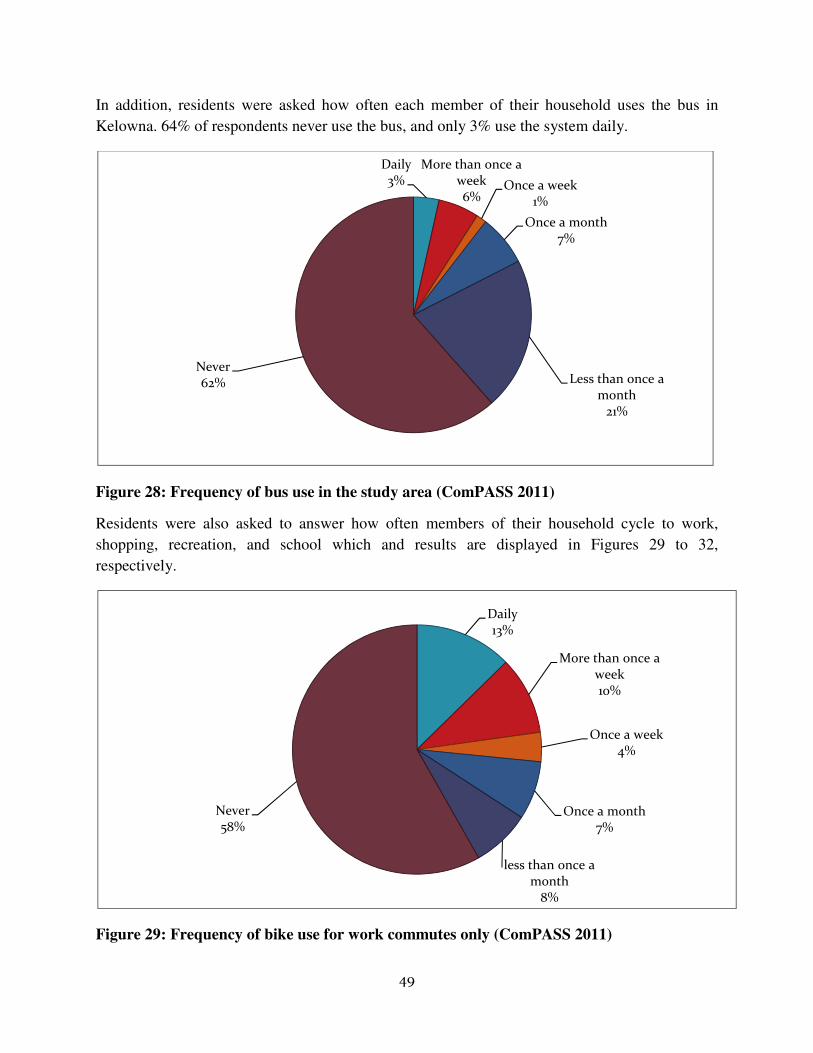
49
In addition, residents were asked how often each member of their household uses the bus in
Kelowna. 64% of respondents never use the bus, and only 3% use the system daily.
Figure 28: Frequency of bus use in the study area (ComPASS 2011)
Residents were also asked to answer how often members of their household cycle to work,
shopping, recreation, and school which and results are displayed in Figures 29 to 32,
respectively.
Figure 29: Frequency of bike use for work commutes only (ComPASS 2011)
Daily3%
More than once a week6%
Once a week1%
Once a month7%
Less than once a month
21%
Never62%
Daily13%
More than once a week10%
Once a week4%
Once a month7%
less than once a month
8%
Never58%
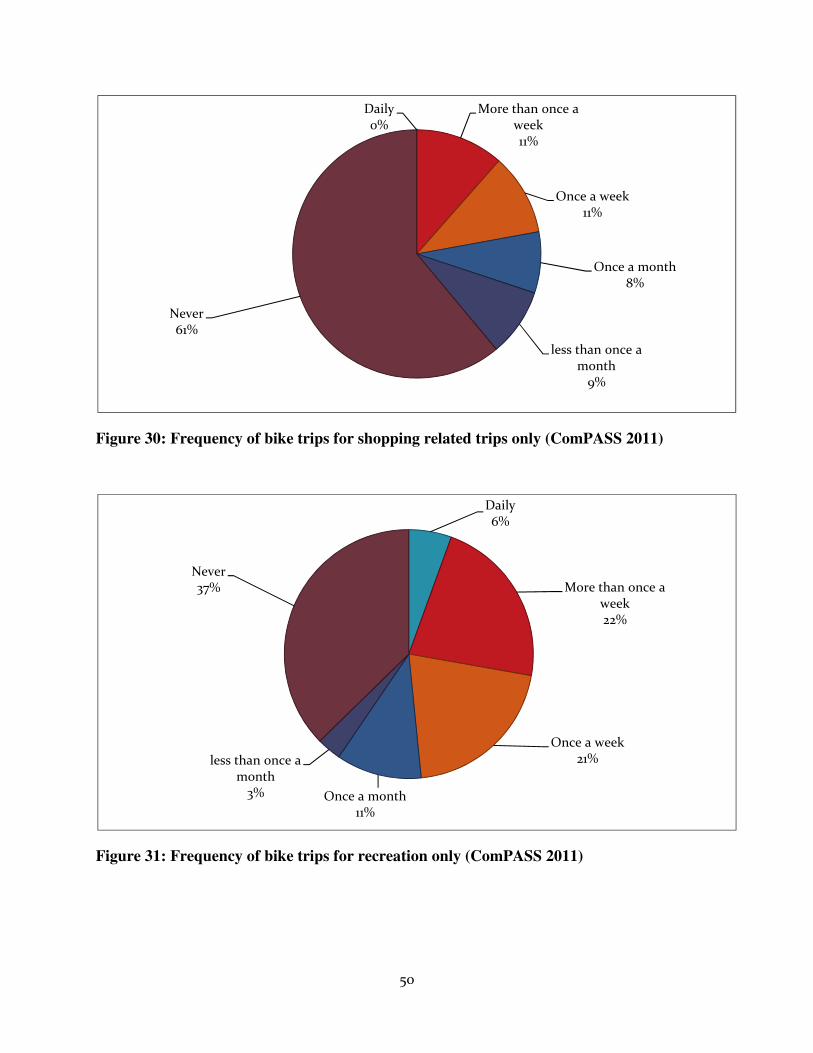
50
Figure 30: Frequency of bike trips for shopping related trips only (ComPASS 2011)
Figure 31: Frequency of bike trips for recreation only (ComPASS 2011)
Daily0%
More than once a week11%
Once a week11%
Once a month8%
less than once a month
9%
Never61%
Daily6%
More than once a week22%
Once a week21%
Once a month11%
less than once a month
3%
Never37%
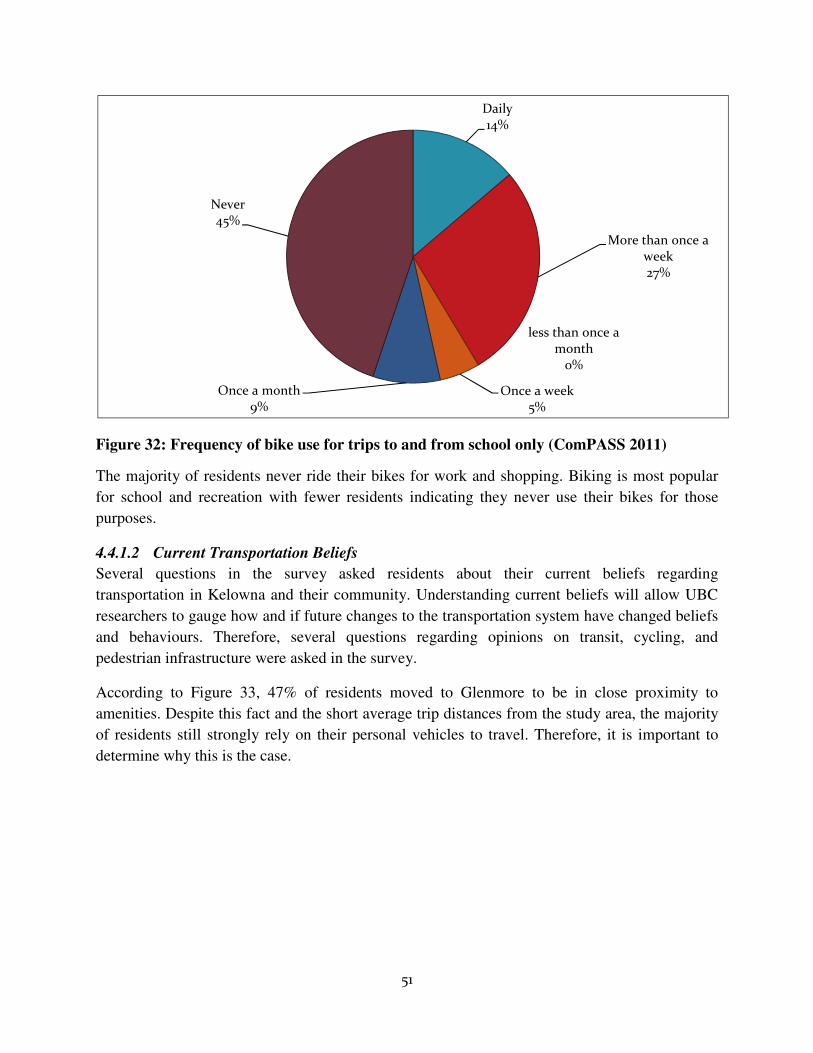
51
Figure 32: Frequency of bike use for trips to and from school only (ComPASS 2011)
The majority of residents never ride their bikes for work and shopping. Biking is most popular
for school and recreation with fewer residents indicating they never use their bikes for those
purposes.
4.4.1.2 Current Transportation Beliefs
Several questions in the survey asked residents about their current beliefs regarding
transportation in Kelowna and their community. Understanding current beliefs will allow UBC
researchers to gauge how and if future changes to the transportation system have changed beliefs
and behaviours. Therefore, several questions regarding opinions on transit, cycling, and
pedestrian infrastructure were asked in the survey.
According to Figure 33, 47% of residents moved to Glenmore to be in close proximity to
amenities. Despite this fact and the short average trip distances from the study area, the majority
of residents still strongly rely on their personal vehicles to travel. Therefore, it is important to
determine why this is the case.
Daily14%
More than once a week27%
Once a week5%
Once a month9%
less than once a month
0%
Never45%
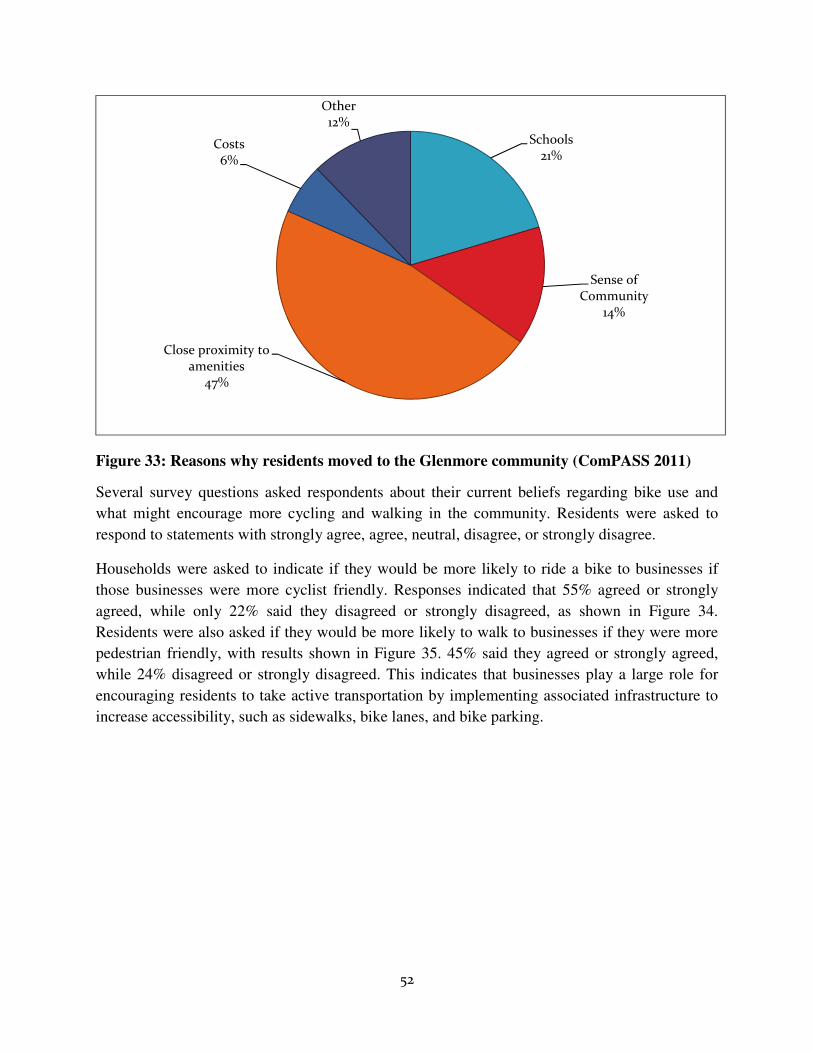
52
Figure 33: Reasons why residents moved to the Glenmore community (ComPASS 2011)
Several survey questions asked respondents about their current beliefs regarding bike use and
what might encourage more cycling and walking in the community. Residents were asked to
respond to statements with strongly agree, agree, neutral, disagree, or strongly disagree.
Households were asked to indicate if they would be more likely to ride a bike to businesses if
those businesses were more cyclist friendly. Responses indicated that 55% agreed or strongly
agreed, while only 22% said they disagreed or strongly disagreed, as shown in Figure 34.
Residents were also asked if they would be more likely to walk to businesses if they were more
pedestrian friendly, with results shown in Figure 35. 45% said they agreed or strongly agreed,
while 24% disagreed or strongly disagreed. This indicates that businesses play a large role for
encouraging residents to take active transportation by implementing associated infrastructure to
increase accessibility, such as sidewalks, bike lanes, and bike parking.
Schools21%
Sense of Community
14%
Close proximity to amenities
47%
Costs6%
Other12%
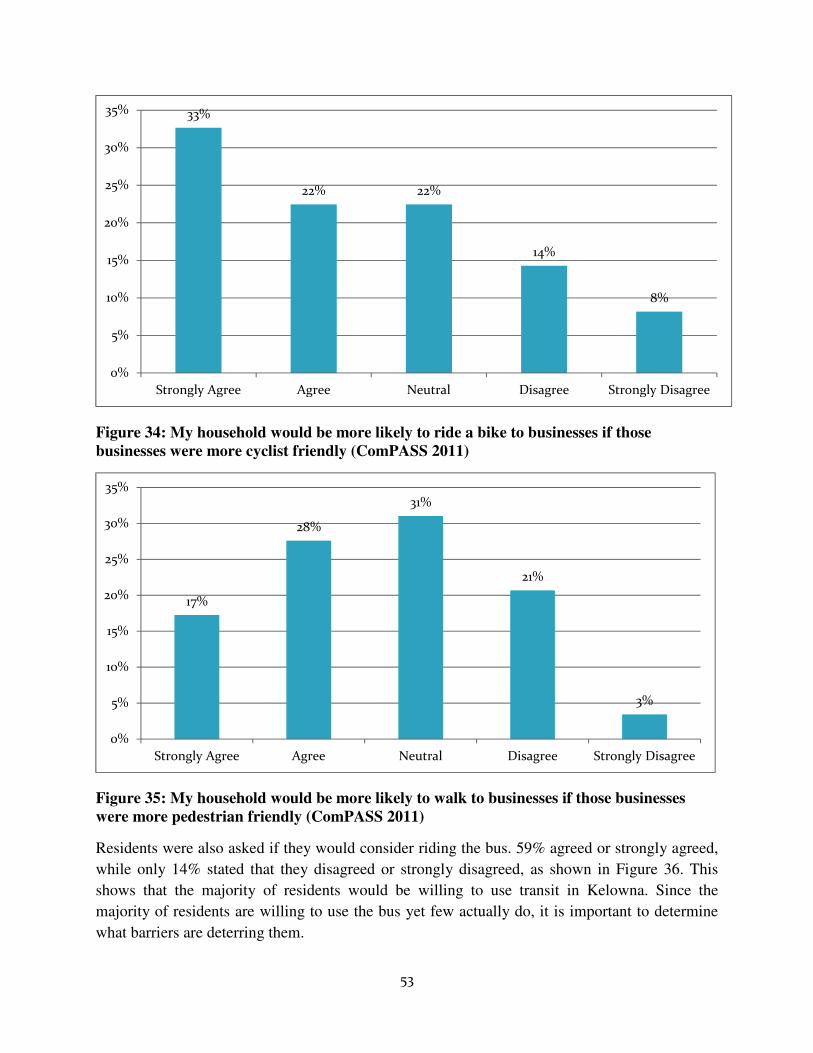
53
Figure 34: My household would be more likely to ride a bike to businesses if those businesses were more cyclist friendly (ComPASS 2011)
Figure 35: My household would be more likely to walk to businesses if those businesses were more pedestrian friendly (ComPASS 2011)
Residents were also asked if they would consider riding the bus. 59% agreed or strongly agreed,
while only 14% stated that they disagreed or strongly disagreed, as shown in Figure 36. This
shows that the majority of residents would be willing to use transit in Kelowna. Since the
majority of residents are willing to use the bus yet few actually do, it is important to determine
what barriers are deterring them.
33%
22% 22%
14%
8%
0%
5%
10%
15%
20%
25%
30%
35%
Strongly Agree Agree Neutral Disagree Strongly Disagree
17%
28%
31%
21%
3%
0%
5%
10%
15%
20%
25%
30%
35%
Strongly Agree Agree Neutral Disagree Strongly Disagree
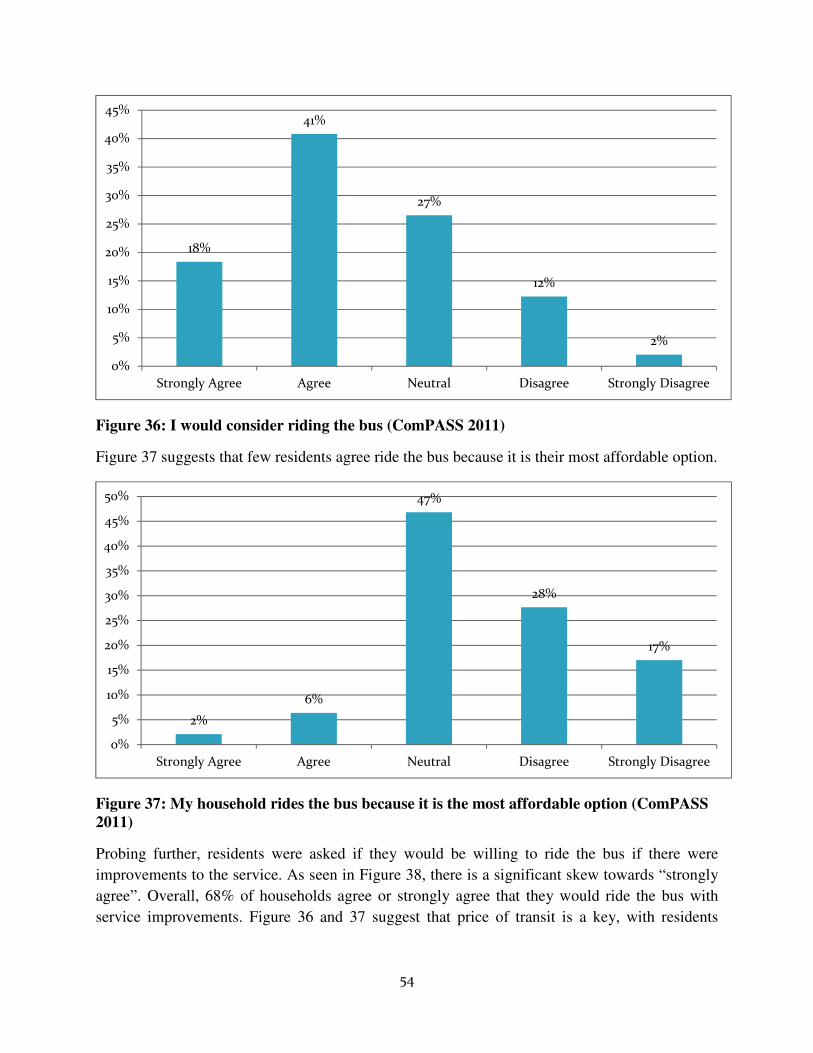
54
Figure 36: I would consider riding the bus (ComPASS 2011)
Figure 37 suggests that few residents agree ride the bus because it is their most affordable option.
Figure 37: My household rides the bus because it is the most affordable option (ComPASS 2011)
Probing further, residents were asked if they would be willing to ride the bus if there were
improvements to the service. As seen in Figure 38, there is a significant skew towards “strongly
agree”. Overall, 68% of households agree or strongly agree that they would ride the bus with
service improvements. Figure 36 and 37 suggest that price of transit is a key, with residents
18%
41%
27%
12%
2%
0%
5%
10%
15%
20%
25%
30%
35%
40%
45%
Strongly Agree Agree Neutral Disagree Strongly Disagree
2%
6%
47%
28%
17%
0%
5%
10%
15%
20%
25%
30%
35%
40%
45%
50%
Strongly Agree Agree Neutral Disagree Strongly Disagree

55
having the opinion that transit fares are too high for the current service (or lack thereof) received.
The good news is that they would be willing to pay if service was improved.
Figure 38: Would you ride the bus if there were improvements to the service? (ComPASS 2011)
Figure 39 shows how residents rate traffic congestion in Kelowna on a scale of 1 (good, or not
that bad at all) to 5 (bad, or too congested). It can be seen that results are skewed towards 37% of
residents believing congestion is bad, while 21% believe it is not that bad at all. However, 42%
are neutral on the subject, indicating that many residents do not feel strongly about traffic
congestion in Kelowna as it may not be a large issue for residents within the study area.
Figure 39: How would you rate traffic congestion in Kelowna on a scale of 1(good) to 5 (bad)? (ComPASS 2011)
37%
31%
18%
8%6%
0%
5%
10%
15%
20%
25%
30%
35%
40%
Strongly Agree Agree Neutral Disagree Strongly Disagree
6%
15%
42%
29%
8%
0.00%
5.00%
10.00%
15.00%
20.00%
25.00%
30.00%
35.00%
40.00%
45.00%
1 (Good) 2 3 4 5 (Bad)
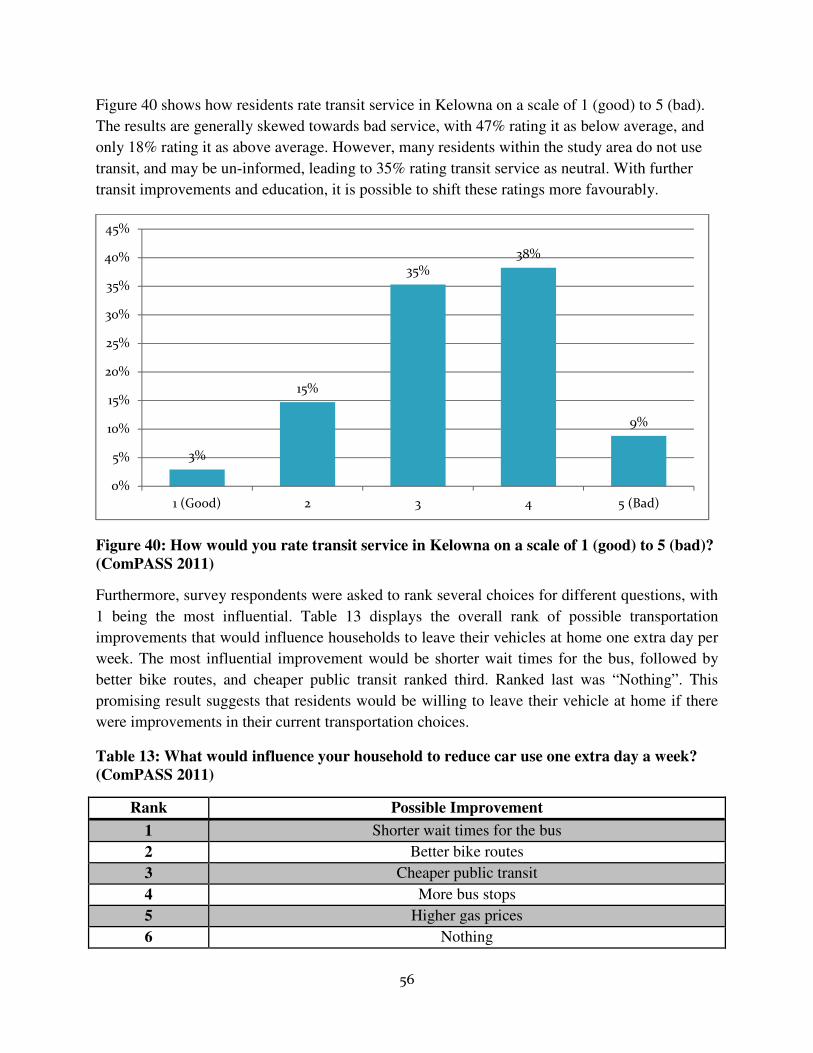
56
Figure 40 shows how residents rate transit service in Kelowna on a scale of 1 (good) to 5 (bad).
The results are generally skewed towards bad service, with 47% rating it as below average, and
only 18% rating it as above average. However, many residents within the study area do not use
transit, and may be un-informed, leading to 35% rating transit service as neutral. With further
transit improvements and education, it is possible to shift these ratings more favourably.
Figure 40: How would you rate transit service in Kelowna on a scale of 1 (good) to 5 (bad)? (ComPASS 2011)
Furthermore, survey respondents were asked to rank several choices for different questions, with
1 being the most influential. Table 13 displays the overall rank of possible transportation
improvements that would influence households to leave their vehicles at home one extra day per
week. The most influential improvement would be shorter wait times for the bus, followed by
better bike routes, and cheaper public transit ranked third. Ranked last was “Nothing”. This
promising result suggests that residents would be willing to leave their vehicle at home if there
were improvements in their current transportation choices.
Table 13: What would influence your household to reduce car use one extra day a week? (ComPASS 2011)
Rank Possible Improvement
1 Shorter wait times for the bus
2 Better bike routes
3 Cheaper public transit
4 More bus stops
5 Higher gas prices
6 Nothing
3%
15%
35%
38%
9%
0%
5%
10%
15%
20%
25%
30%
35%
40%
45%
1 (Good) 2 3 4 5 (Bad)
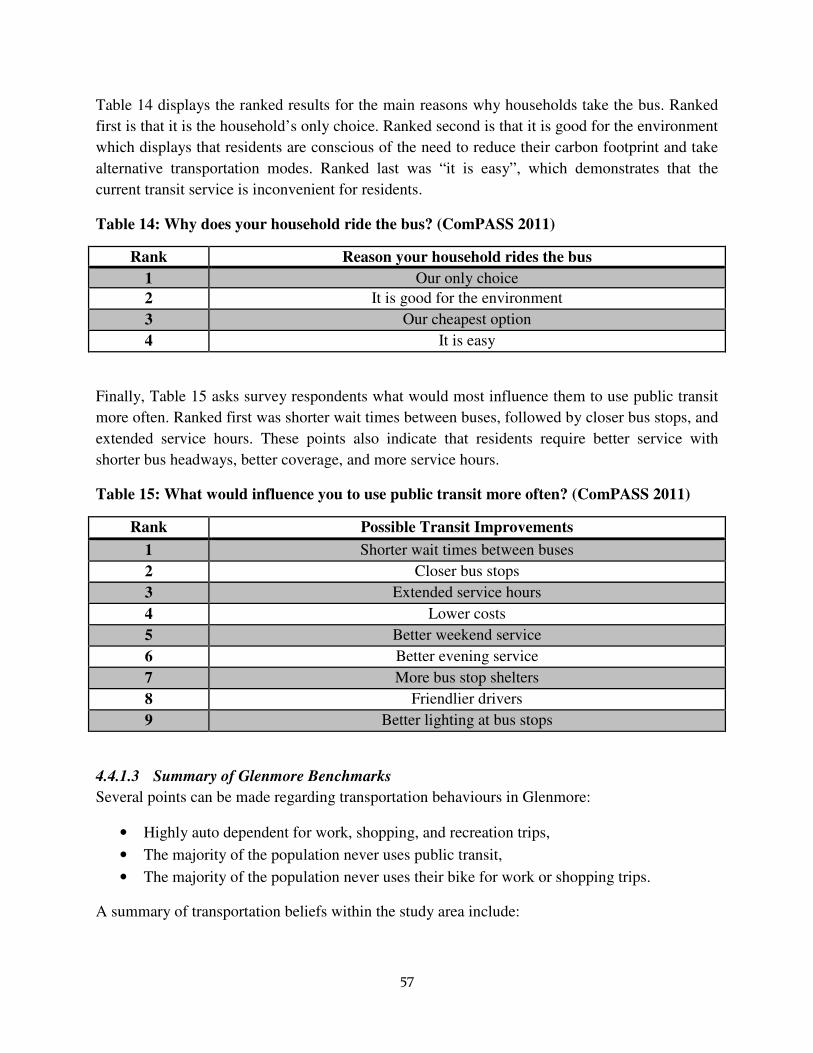
57
Table 14 displays the ranked results for the main reasons why households take the bus. Ranked
first is that it is the household’s only choice. Ranked second is that it is good for the environment
which displays that residents are conscious of the need to reduce their carbon footprint and take
alternative transportation modes. Ranked last was “it is easy”, which demonstrates that the
current transit service is inconvenient for residents.
Table 14: Why does your household ride the bus? (ComPASS 2011)
Rank Reason your household rides the bus
1 Our only choice
2 It is good for the environment
3 Our cheapest option
4 It is easy
Finally, Table 15 asks survey respondents what would most influence them to use public transit
more often. Ranked first was shorter wait times between buses, followed by closer bus stops, and
extended service hours. These points also indicate that residents require better service with
shorter bus headways, better coverage, and more service hours.
Table 15: What would influence you to use public transit more often? (ComPASS 2011)
Rank Possible Transit Improvements
1 Shorter wait times between buses
2 Closer bus stops
3 Extended service hours
4 Lower costs
5 Better weekend service
6 Better evening service
7 More bus stop shelters
8 Friendlier drivers
9 Better lighting at bus stops
4.4.1.3 Summary of Glenmore Benchmarks
Several points can be made regarding transportation behaviours in Glenmore:
• Highly auto dependent for work, shopping, and recreation trips,
• The majority of the population never uses public transit,
• The majority of the population never uses their bike for work or shopping trips.
A summary of transportation beliefs within the study area include:

58
• Residents are aware of the impact vehicles have on the environment and desire to reduce
their emissions given a safe and convenient opportunity, and
• Residents are generally willing to reduce vehicle use given improvements to alternative
transportation infrastructure (transit, cycling, and pedestrian).
Therefore, general consensus indicates that there must be improvements to the transit service in
the study area and businesses must also do their part to make their locations safe and convenient
for pedestrians and cyclists.
4.5 Preferred Design
The Glenmore ComPASS survey asked participants to indicate if they would use various
Glenmore ComPASS components to determine which privileges would be used, as follows:
24) Please indicate yes or no for each of the following possible ComPASS components to tell us
which possible ComPASS privileges your household would make use of.
Yes No
a) Parkinson Rec Centre pool and/or facilities [ ] [ ]
b) Capital News Centre (CNC) [ ] [ ]
c) H2O Centre pool facilities [ ] [ ]
d) Bike safety training [ ] [ ]
e) Winery bicycle tours [ ] [ ]
f) Local merchant discounts [ ] [ ]
g) Emergency taxi rides home [ ] [ ]
h) Bike tune-ups [ ] [ ]
i) Glenmore community shuttle [ ] [ ]
j) More bike rack capacity on buses [ ] [ ]
k) More bike racks at bus stops [ ] [ ]
l) More bike racks in commercial areas [ ] [ ]
m) Glenmore car sharing program [ ] [ ]
n) Bike sharing program [ ] [ ]
o) CanCarts [ ] [ ]
p) Ski hill shuttle [ ] [ ]
q) I do not understand the question [ ]
Of all of these possible Glenmore ComPASS components, Table 16 displays the six most
popular components in order of highest popularity.
Table 16: The five most popular Glenmore ComPASS components
Rank Component Percent Who Would Use it
1 Glenmore Community Shuttle 81%
2 Local Merchant Discounts 79%
3 Parkinson Recreation Centre Pass 70%
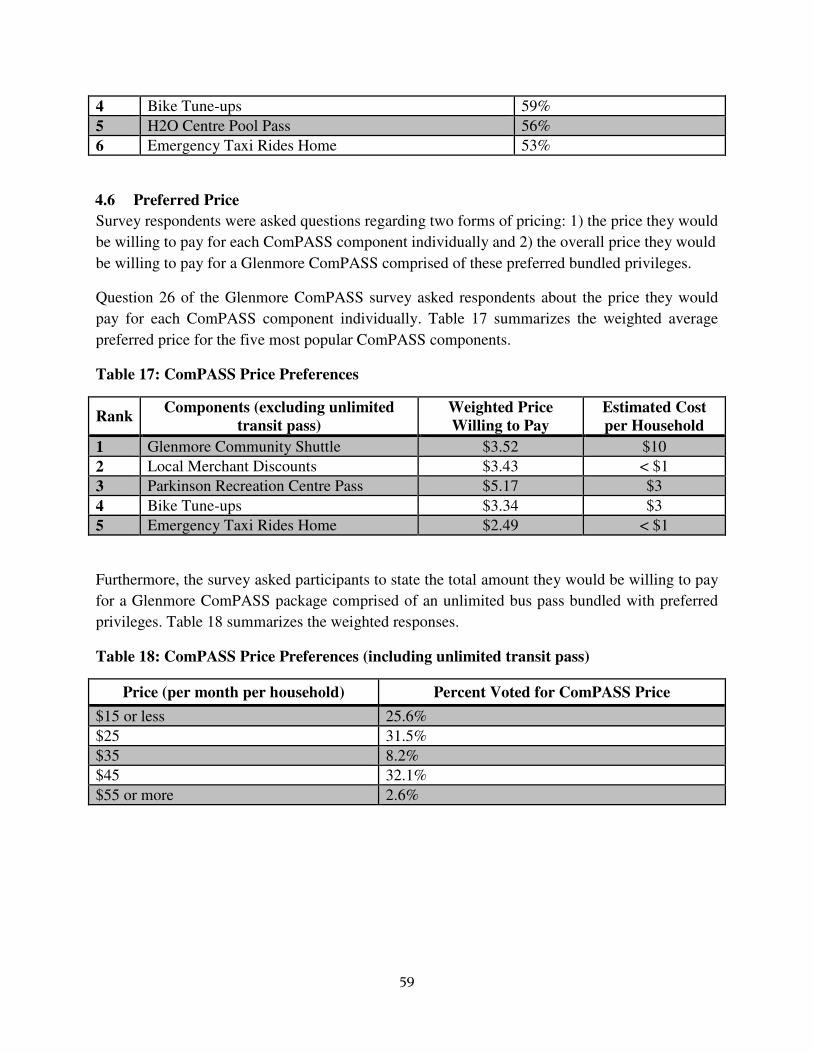
59
4 Bike Tune-ups 59%
5 H2O Centre Pool Pass 56%
6 Emergency Taxi Rides Home 53%
4.6 Preferred Price
Survey respondents were asked questions regarding two forms of pricing: 1) the price they would
be willing to pay for each ComPASS component individually and 2) the overall price they would
be willing to pay for a Glenmore ComPASS comprised of these preferred bundled privileges.
Question 26 of the Glenmore ComPASS survey asked respondents about the price they would
pay for each ComPASS component individually. Table 17 summarizes the weighted average
preferred price for the five most popular ComPASS components.
Table 17: ComPASS Price Preferences
Rank Components (excluding unlimited
transit pass) Weighted Price Willing to Pay
Estimated Cost per Household
1 Glenmore Community Shuttle $3.52 $10
2 Local Merchant Discounts $3.43 < $1
3 Parkinson Recreation Centre Pass $5.17 $3
4 Bike Tune-ups $3.34 $3
5 Emergency Taxi Rides Home $2.49 < $1
Furthermore, the survey asked participants to state the total amount they would be willing to pay
for a Glenmore ComPASS package comprised of an unlimited bus pass bundled with preferred
privileges. Table 18 summarizes the weighted responses.
Table 18: ComPASS Price Preferences (including unlimited transit pass)
Price (per month per household) Percent Voted for ComPASS Price
$15 or less 25.6%
$25 31.5%
$35 8.2%
$45 32.1%
$55 or more 2.6%

60
Figure 41: Percentages for preferred Glenmore ComPASS price (ComPASS 2011)
This equates to a weighted average of a willingness to pay (WTP) of $30.48 per household per
month to hold a Glenmore ComPASS. The lower price estimation is $25.75 per household per
month, while the high estimation is $34.50 per household per month. This is a very favourable
result as it suggests that the CRN model would work to fuel the Glenmore ComPASS, as the
WTP overall price for a Glenmore ComPASS package is higher than the sum of the preferred
prices for individual components.
Survey participants were also asked to indicate whether they would use a Glenmore ComPASS,
as follows:
28) Would you use a ComPASS if given the opportunity?
� Yes � No � Not Sure
The results of question 28 are summarized in Figure 42, with 47% of residents indicating they
would use a Glenmore ComPASS.
26%
31%
8%
32%
3%
0.0%
5.0%
10.0%
15.0%
20.0%
25.0%
30.0%
35.0%
$15 $25 $35 $45 $55
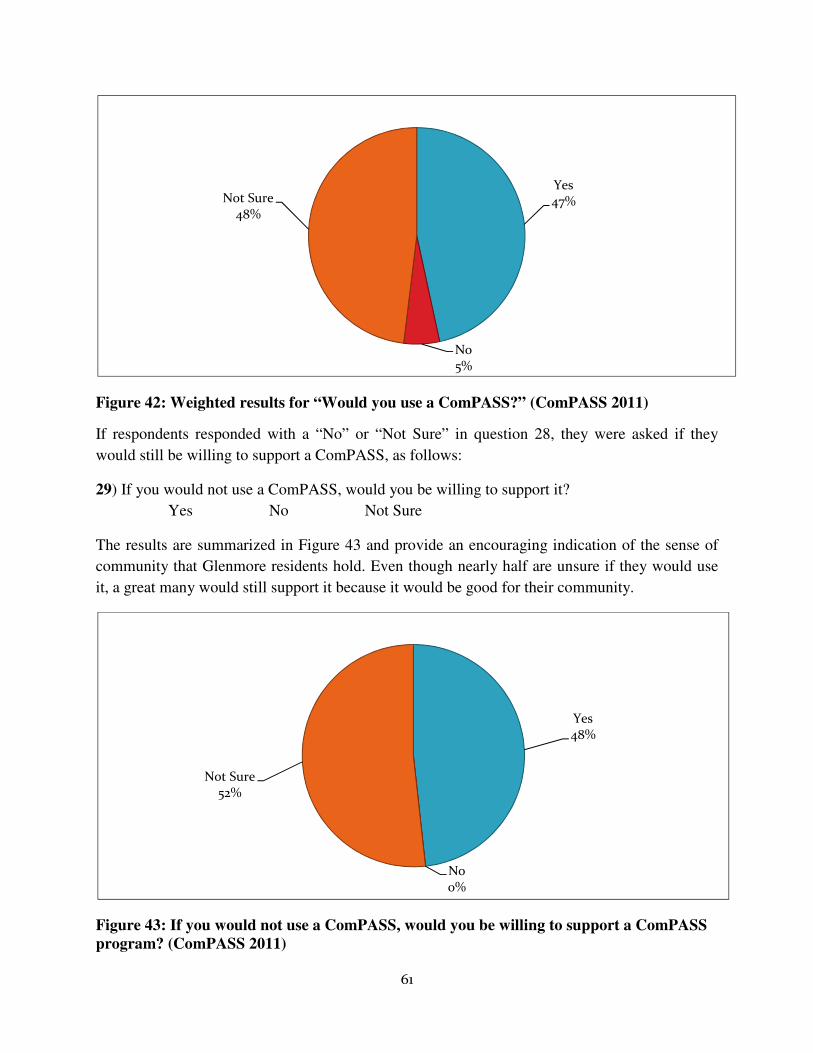
61
Figure 42: Weighted results for “Would you use a ComPASS?” (ComPASS 2011)
If respondents responded with a “No” or “Not Sure” in question 28, they were asked if they
would still be willing to support a ComPASS, as follows:
29) If you would not use a ComPASS, would you be willing to support it?
� Yes � No � Not Sure
The results are summarized in Figure 43 and provide an encouraging indication of the sense of
community that Glenmore residents hold. Even though nearly half are unsure if they would use
it, a great many would still support it because it would be good for their community.
Figure 43: If you would not use a ComPASS, would you be willing to support a ComPASS program? (ComPASS 2011)
Yes47%
No5%
Not Sure48%
Yes48%
No0%
Not Sure52%
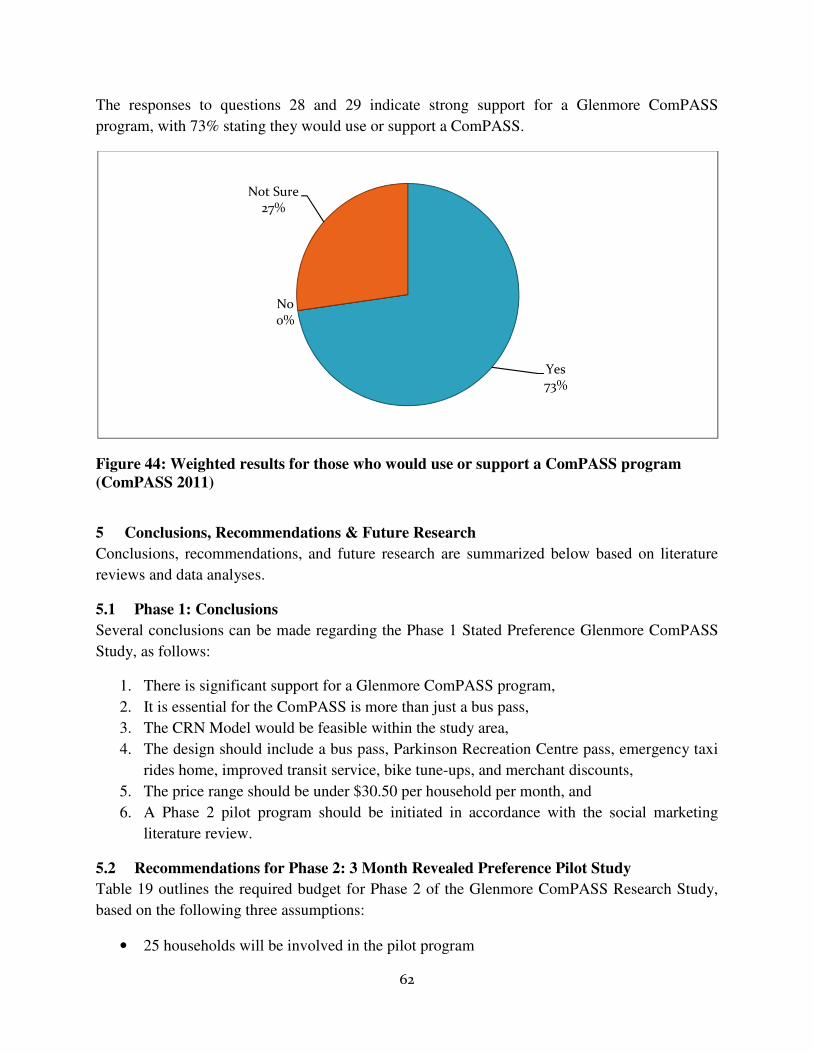
62
The responses to questions 28 and 29 indicate strong support for a Glenmore ComPASS
program, with 73% stating they would use or support a ComPASS.
Figure 44: Weighted results for those who would use or support a ComPASS program (ComPASS 2011)
5 Conclusions, Recommendations & Future Research
Conclusions, recommendations, and future research are summarized below based on literature
reviews and data analyses.
5.1 Phase 1: Conclusions
Several conclusions can be made regarding the Phase 1 Stated Preference Glenmore ComPASS
Study, as follows:
1. There is significant support for a Glenmore ComPASS program,
2. It is essential for the ComPASS is more than just a bus pass,
3. The CRN Model would be feasible within the study area,
4. The design should include a bus pass, Parkinson Recreation Centre pass, emergency taxi
rides home, improved transit service, bike tune-ups, and merchant discounts,
5. The price range should be under $30.50 per household per month, and
6. A Phase 2 pilot program should be initiated in accordance with the social marketing
literature review.
5.2 Recommendations for Phase 2: 3 Month Revealed Preference Pilot Study
Table 19 outlines the required budget for Phase 2 of the Glenmore ComPASS Research Study,
based on the following three assumptions:
• 25 households will be involved in the pilot program
Yes73%
No0%
Not Sure27%

63
• 2.6 people per household (the Glenmore average)
• 3 month duration of the pilot program With strong support of the ComPASS program within Glenmore, it is recommended that the
Phase 2 Revealed Preference Study be initiated for spring of 2012. 25 households would be
selected to participate in the 3 month pilot program, with another 25 households used as a control
group, and it is recommended that the pilot Glenmore ComPASS package include a transit pass,
Parkinson Recreation Centre Pass, bike tune-ups, emergency taxi rides home, and local merchant
incentives. A three month duration was chosen to give enough time to monitor how
transportation beliefs and behaviours equalize after holding a ComPASS for some time. It is
expected that the ComPASS will be excessively used by residents in the beginning of the pilot,
so it is important allow time for the novelty of a ComPASS to wear off. Further analysis on
Phase 2 household selection and survey design will be pending results from the ENGR 499
Glenmore ComPASS Phase 2 Research Study along with further analysis from Ellen Morrison,
MASc student, and Dr. Gordon Lovegrove, professor of engineering. A Phase 2 Glenmore
ComPASS Research Study report would also include more detailed recommendations for the
Phase 3 permanent Glenmore ComPASS program.
Table 19: Proposed Budget for the 3 Month Revealed Preference Study
Item Number
Item Estimated Unit Cost Cost
Estimate
1 Student Researchers* $10,000 /year $10,000.00
2 Adult Monthly Bus Pass $53/person/month $14,000.00
3 Emergency Taxi Rides Home $50/month $1,000.00
4 3 Month Parkinson Recreation Centre
Family Facility Pass $276.41/household $8,000.00
5 Bike Tune-Ups $50/bike tune-up $1,000.00
6 Administration & Merchant Discounts N/A $1,000.00
Total: $35,000.00
*One MASc student with one BASc summer student assisting.
5.2.1 Item 1: Student Researchers ($10,000)
Item 1 is required to ensure that Ellen Morrison can continue working as team leader on the
Glenmore ComPASS into Phase 2 of the project with assistance from an undergraduate student
in the same field. The Glenmore ComPASS research will be her MASc thesis.
5.2.2 Item 2: Monthly Bus Pass ($14,000.00)
Monthly bus passes will allow for unlimited transit use within the Kelowna Regional Transit
System boundary for each ComPASS holder, which is the backbone of the Glenmore ComPASS.
A cost of $53.00 for an adult monthly bus pass was assumed for each person in each household.
Since children, seniors, and students receive monthly passes for a lower price, the final cost may
64
be lower depending on the actual age split among the 25 households chosen for the pilot study.
The final cost of $11,925.00 was calculated. Additional leeway was provided should there be
more residents within the households than expected and for a possible transit service increase
during that time period (through improved headways on existing Route 7 or a community
shuttle).
5.2.3 Item 3: Emergency Taxi Rides Home ($1,000)
Emergency taxi rides home are important for addressing the risk of not using a personal vehicle.
If a ComPASS holder uses a sustainable transportation option to travel to their destination, and
an unexpected emergency arises, the ComPASS holder would be entitled to a free taxi ride
home. Although this item is a very important component to the Glenmore ComPASS, this benefit
is rarely used. For example, in Vancouver about 2 emergency taxi rides were used among 40,000
U-Pass holders in one year. Therefore, since this item is essential but may not be used often,
$1,000 for three months would be required to provide emergency taxi rides home for the
Glenmore ComPASS pilot program.
5.2.4 Item 4: Parkinson Recreation Centre Facility Family Pass ($8,000.00)
The Parkinson Recreation Centre component of the Glenmore ComPASS is important as it
promotes a healthier community and adds an extra incentive for owning a ComPASS.
It is undetermined at this time whether the Parkinson Recreation Centre will be able to allow
ComPASS users to hold pool or facility passes. Therefore, the family facility pass cost was used
to calculate the total cost for Item 4, at $276.41 per family for a 3 month pass. This equates to
$6,191.58 for the three month pilot program. Again, to provide leeway, $8,000 is required should
there be more residents than anticipated.
5.2.5 Item 5: Bike Tune-ups ($1,000.00)
Each member in participating households will be given the opportunity to obtain a free bike
tune-up through the pilot program. According to bike specialists at Union Cycle, each bicycle
they sell comes with free maintenance for an entire year, however, only 10% of those who have
purchased a bike actually come back to take advantage of their free maintenance (Letkeman
2011). Therefore, it can be assumed that 10% of pilot program participants will actually use their
free bike tune-ups.
The average bike tune-up costs $120 per bike, which includes inspection, parts, and repairs.
Therefore, if 10% of participants receive a bike tune-up, this equates to about $1000 for the three
month period.
5.2.6 Item 6: Local Merchant Incentives ($1,000.00)
Since it will be a challenge to arrange merchant discounts over a 3 month period, it is proposed
that each household receives a “made in Glenmore” coupon book with discounts from local
merchants and through collaboration with the Glenmore Valley Business Association. Each
coupon book would cost about $35, so for 25 families, this equates to just under $1,000 for the 3
65
month period. This is an added benefit to the Glenmore ComPASS and makes it a more
attractive package for all users.
5.2.7 Phase 2 Performance Measures
Should a phase 2 revealed preference ComPASS program be implemented, it is vital that
performance measures are implemented. Several possible measurements to determine the success
of the program include:
• Utilize ridership counters on buses,
• Conduct resident surveys on transportation behaviours, beliefs and quality of life,
• Perform neighbourhood traffic counts, and
• Keep track of household participation rates.
Combined, these measurements will allow for a thorough study on the effects of the Glenmore
ComPASS on transportation beliefs and habits.
5.3 Phase 3: Permanent ComPASS TDM Program Design
Recommended costs, components, and implementation process for a permanent ComPASS TDM
program are summarized below.
5.3.1 Recommended Costs
For the permanent ComPASS program, costs are recommended below for the six main Glenmore
ComPASS components: 1) transit pass, 2) Glenmore community shuttle, 3) local merchant
discounts, 4) bike tune-ups, 5) Parkinson Recreation Centre pool pass, and 6) emergency taxi
rides home.
5.3.1.1 Transit Pass
According to survey results, the majority of transit users in the Glenmore ComPASS study
boundary are students or infrequent users, which is not reflected in Census data. Survey results
indicated that the transit revenue generated from the Glenmore ComPASS study boundary is
about $4925 per month. Using the CRN model, this equates to about $6.75 per month per
household for a transit pass. However, with a 15% price increase on transit passes expected in
January 2012, this cost will increase to about $7.75 per month per household.
Table 20: Estimated Cost for the Transit Pass Component per Household per Month
Cost per Household per Month
Low $4.00
High $10.00
Expected $7.75
66
5.3.1.2 Emergency Taxi Rides Home
The Glenmore ComPASS survey indicated that 55% of residents would use the emergency taxi
ride service. As the requirement of such a component greatly varies, most who indicated they
would use the service said they would use it infrequently. However, this component is necessary
for peace of mind as a barrier to taking sustainable transportation modes is how one would be
able to react in the event of an emergency. Including free emergency taxi rides home in the
Glenmore ComPASS will help to reduce the effects of this barrier and encourage more residents
to leave their vehicles at home.
Since it is expected that emergency taxi rides home will be used infrequently, $100 is allotted to
this component per month. This equates to $0.14 per month per household in the Glenmore
ComPASS package. However, since the use of this component can be unpredictable, there
should be room left to adjust this component as required.
Even if actual usage is higher than predicted, the actual price would still much lower than the
average price that residents are willing to pay ($2.49 per month per household).
5.3.1.3 Parkinson Recreation Centre Pass
Costing information was collected from the Parkinson Recreation Centre. The Glenmore
ComPASS research team provided the Parkinson Recreation Centre to determine the monthly
revenue generated from the study area. In total, the Parkinson Recreation Centre makes about
$530 per month from the Glenmore ComPASS study area for their pool passes. This translates to
an average cost of $0.74 per household per month based on the CRN model.
5.3.1.4 Glenmore Community Shuttle
About 82% of survey respondents rated transit service in Kelowna as average or below average
which can be seen in Figure 40, while 68% of survey respondents indicated they would use
transit more if the service improved (see Figure 38). This indicates that the current transit level
of service is a barrier for residents within the Glenmore study area. Moreover, when respondents
were asked to rank the most influential changes that would encourage them to use transit, the
highest ranking improvement was to decrease wait times between buses, followed by closer bus
stops, and extended service hours.
Furthermore, the Glenmore community shuttle was the most popular component of all possible
additions to a Glenmore ComPASS package. The most popular shuttle destination for residents
was public events, such as Mardis Gras, Canada Day, New Year’s Eve, Fat Cat Festival, etc,
with 67% who indicated they would use a shuttle for that purpose. The Farmers’ Market came
second in popularity with 41% saying they would use it. Tied for third were holiday shopping
and Prospera Place (i.e. hockey games) with about 35% saying they would use them. Other
suggested destinations by residents were the Parkinson Recreation Centre, local Glenmore
restaurants, the Kelowna General Hospital, the H2O Centre, the Airport, Rutland, and Mission.
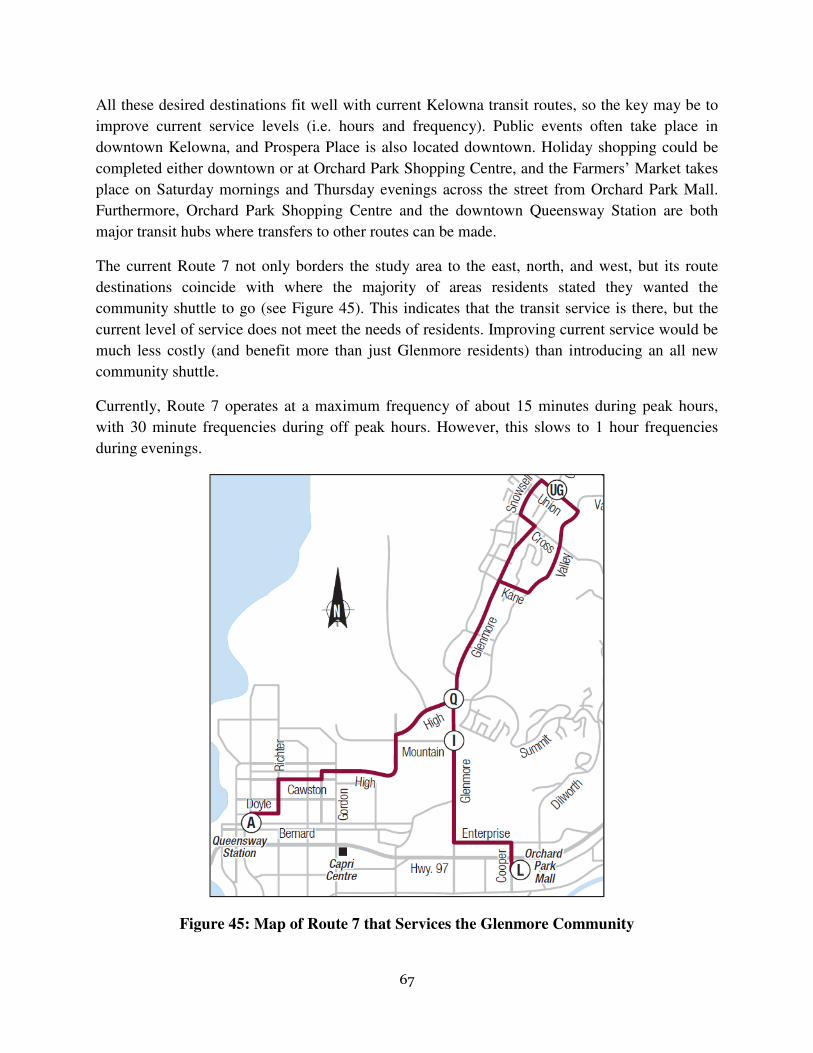
67
All these desired destinations fit well with current Kelowna transit routes, so the key may be to
improve current service levels (i.e. hours and frequency). Public events often take place in
downtown Kelowna, and Prospera Place is also located downtown. Holiday shopping could be
completed either downtown or at Orchard Park Shopping Centre, and the Farmers’ Market takes
place on Saturday mornings and Thursday evenings across the street from Orchard Park Mall.
Furthermore, Orchard Park Shopping Centre and the downtown Queensway Station are both
major transit hubs where transfers to other routes can be made.
The current Route 7 not only borders the study area to the east, north, and west, but its route
destinations coincide with where the majority of areas residents stated they wanted the
community shuttle to go (see Figure 45). This indicates that the transit service is there, but the
current level of service does not meet the needs of residents. Improving current service would be
much less costly (and benefit more than just Glenmore residents) than introducing an all new
community shuttle.
Currently, Route 7 operates at a maximum frequency of about 15 minutes during peak hours,
with 30 minute frequencies during off peak hours. However, this slows to 1 hour frequencies
during evenings.
Figure 45: Map of Route 7 that Services the Glenmore Community
68
To encourage more ridership within the Glenmore ComPASS study area, it is recommended that
rather than a community shuttle, it would be more cost efficient to improve existing Glenmore
transit by:
1. Increase evening service headway from 60 minutes to 30 minutes on weekdays,
Saturdays, and Sunday,
2. Extend late night service hours from 12:30 am to 2:30 am on Friday and Saturday nights,
and from 10:30 pm to 12:30 am on Sunday nights,
3. Ensure there is adequate transportation infrastructure (i.e. sidewalks, lighting, etc) to and
from bus stops along Route 7 near the study area,
4. On a trial basis during off peak early morning (Saturdays) and late night (Fridays and
Saturdays) divert Route 7 into the study area to improve transit coverage in the
neighbourhood (e.g. Mountain Avenue, Highland Road, Pinehurst Crescent), and
5. Divert Route 7 into the Parkinson Recreation Centre turnaround to feed passengers into
the 97 Express Route, to allow quick and direct routes along Highway 97.
To improve Route 7 service, it is recommended that ComPASS users contribute $3.50 per
household per month since it is the weighted average residents are willing to spend for a
Glenmore community shuttle. The money raised from the community will contribute to
increased service levels and for redesigning the route within the study area. Residents would not
be expected to pay for the entire service upgrades since Route 7 would serve all residents of
Kelowna and not just ComPASS users.
5.3.1.5 Bike Tune-Ups
Survey results indicated that 85.7% of households own at least one bike, with an average of 3.4
bikes per household. Assuming that this number can be applied to all households within the
study boundary, that equates to 2,475 bikes owned within the study area. The majority of
residents ensure their bikes are tuned seasonally (see Figure 46), which ensures safer bike
transportation.
According to bike specialists (Letkeman 2011), each bicycle they sell comes with free
maintenance for an entire year, however, only 10% of those who purchased a bike actually come
back to take advantage of their free maintenance and repairs (Letkeman 2011). Therefore, it can
be assumed that 10% of Glenmore ComPASS holders would actually use their free bike tune-
ups.
Furthermore, the average bike tune-up costs $120 +/- $40 per bike, which on average includes
$50 in labour to inspect and maintain the bicycle, and $45 new parts, and another $25 for labour
to install the new parts.
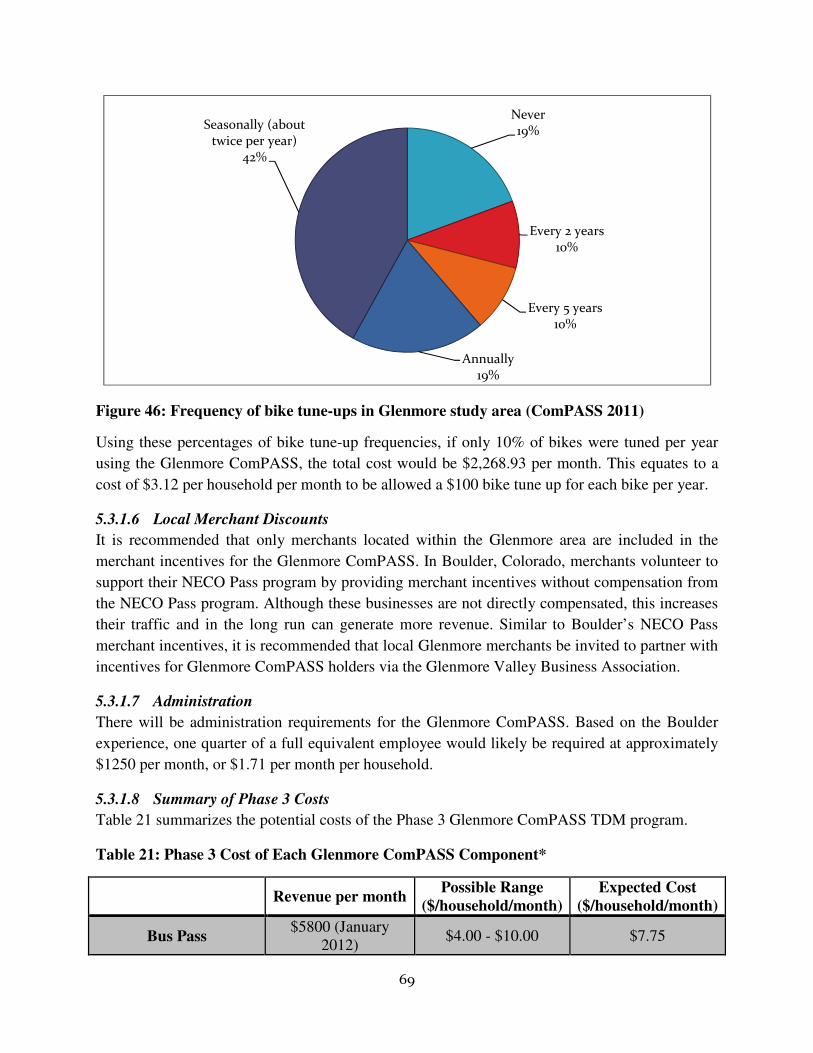
69
Figure 46: Frequency of bike tune-ups in Glenmore study area (ComPASS 2011)
Using these percentages of bike tune-up frequencies, if only 10% of bikes were tuned per year
using the Glenmore ComPASS, the total cost would be $2,268.93 per month. This equates to a
cost of $3.12 per household per month to be allowed a $100 bike tune up for each bike per year.
5.3.1.6 Local Merchant Discounts
It is recommended that only merchants located within the Glenmore area are included in the
merchant incentives for the Glenmore ComPASS. In Boulder, Colorado, merchants volunteer to
support their NECO Pass program by providing merchant incentives without compensation from
the NECO Pass program. Although these businesses are not directly compensated, this increases
their traffic and in the long run can generate more revenue. Similar to Boulder’s NECO Pass
merchant incentives, it is recommended that local Glenmore merchants be invited to partner with
incentives for Glenmore ComPASS holders via the Glenmore Valley Business Association.
5.3.1.7 Administration
There will be administration requirements for the Glenmore ComPASS. Based on the Boulder
experience, one quarter of a full equivalent employee would likely be required at approximately
$1250 per month, or $1.71 per month per household.
5.3.1.8 Summary of Phase 3 Costs
Table 21 summarizes the potential costs of the Phase 3 Glenmore ComPASS TDM program.
Table 21: Phase 3 Cost of Each Glenmore ComPASS Component*
Revenue per month Possible Range
($/household/month) Expected Cost
($/household/month)
Bus Pass $5800 (January
2012) $4.00 - $10.00 $7.75
Never19%
Every 2 years10%
Every 5 years10%
Annually19%
Seasonally (about twice per year)
42%
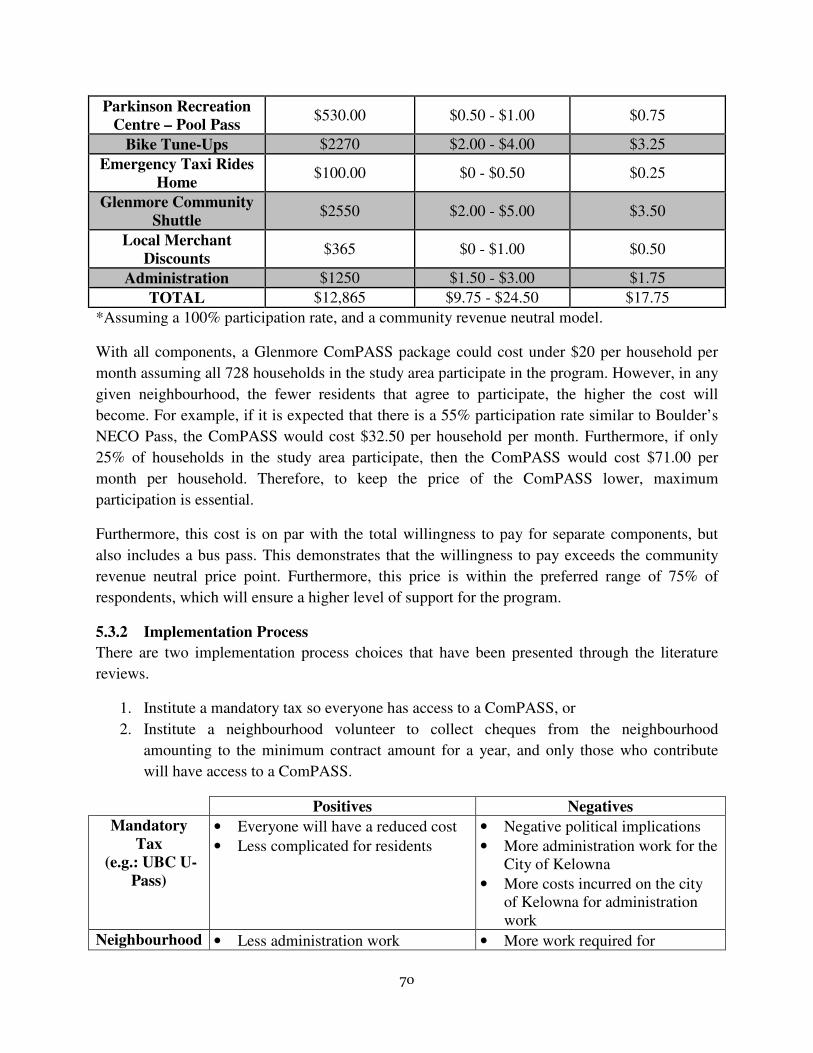
70
Parkinson Recreation Centre – Pool Pass
$530.00 $0.50 - $1.00 $0.75
Bike Tune-Ups $2270 $2.00 - $4.00 $3.25
Emergency Taxi Rides Home
$100.00 $0 - $0.50 $0.25
Glenmore Community Shuttle
$2550 $2.00 - $5.00 $3.50
Local Merchant Discounts
$365 $0 - $1.00 $0.50
Administration $1250 $1.50 - $3.00 $1.75
TOTAL $12,865 $9.75 - $24.50 $17.75
*Assuming a 100% participation rate, and a community revenue neutral model.
With all components, a Glenmore ComPASS package could cost under $20 per household per
month assuming all 728 households in the study area participate in the program. However, in any
given neighbourhood, the fewer residents that agree to participate, the higher the cost will
become. For example, if it is expected that there is a 55% participation rate similar to Boulder’s
NECO Pass, the ComPASS would cost $32.50 per household per month. Furthermore, if only
25% of households in the study area participate, then the ComPASS would cost $71.00 per
month per household. Therefore, to keep the price of the ComPASS lower, maximum
participation is essential.
Furthermore, this cost is on par with the total willingness to pay for separate components, but
also includes a bus pass. This demonstrates that the willingness to pay exceeds the community
revenue neutral price point. Furthermore, this price is within the preferred range of 75% of
respondents, which will ensure a higher level of support for the program.
5.3.2 Implementation Process
There are two implementation process choices that have been presented through the literature
reviews.
1. Institute a mandatory tax so everyone has access to a ComPASS, or
2. Institute a neighbourhood volunteer to collect cheques from the neighbourhood
amounting to the minimum contract amount for a year, and only those who contribute
will have access to a ComPASS.
Positives Negatives Mandatory
Tax (e.g.: UBC U-
Pass)
• Everyone will have a reduced cost
• Less complicated for residents
• Negative political implications
• More administration work for the City of Kelowna
• More costs incurred on the city of Kelowna for administration work
Neighbourhood • Less administration work • More work required for
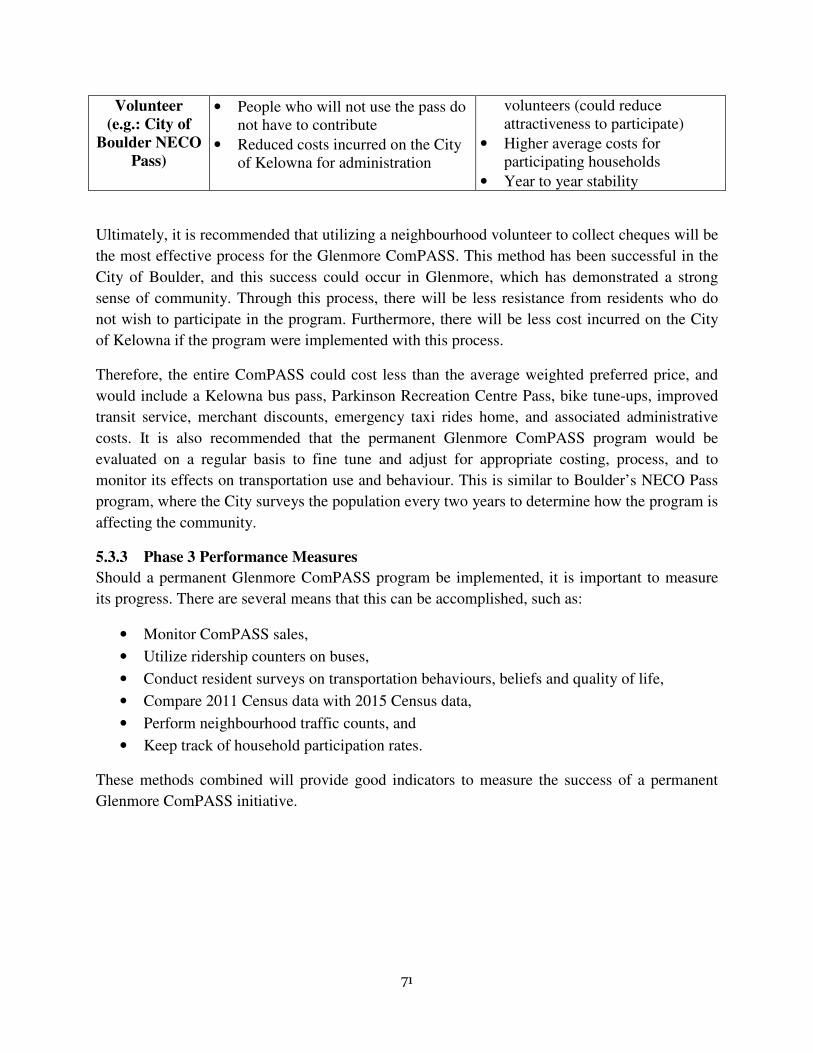
71
Volunteer (e.g.: City of
Boulder NECO Pass)
• People who will not use the pass do not have to contribute
• Reduced costs incurred on the City of Kelowna for administration
volunteers (could reduce attractiveness to participate)
• Higher average costs for participating households
• Year to year stability
Ultimately, it is recommended that utilizing a neighbourhood volunteer to collect cheques will be
the most effective process for the Glenmore ComPASS. This method has been successful in the
City of Boulder, and this success could occur in Glenmore, which has demonstrated a strong
sense of community. Through this process, there will be less resistance from residents who do
not wish to participate in the program. Furthermore, there will be less cost incurred on the City
of Kelowna if the program were implemented with this process.
Therefore, the entire ComPASS could cost less than the average weighted preferred price, and
would include a Kelowna bus pass, Parkinson Recreation Centre Pass, bike tune-ups, improved
transit service, merchant discounts, emergency taxi rides home, and associated administrative
costs. It is also recommended that the permanent Glenmore ComPASS program would be
evaluated on a regular basis to fine tune and adjust for appropriate costing, process, and to
monitor its effects on transportation use and behaviour. This is similar to Boulder’s NECO Pass
program, where the City surveys the population every two years to determine how the program is
affecting the community.
5.3.3 Phase 3 Performance Measures
Should a permanent Glenmore ComPASS program be implemented, it is important to measure
its progress. There are several means that this can be accomplished, such as:
• Monitor ComPASS sales,
• Utilize ridership counters on buses,
• Conduct resident surveys on transportation behaviours, beliefs and quality of life,
• Compare 2011 Census data with 2015 Census data,
• Perform neighbourhood traffic counts, and
• Keep track of household participation rates.
These methods combined will provide good indicators to measure the success of a permanent
Glenmore ComPASS initiative.
72
6 References
Alam, Ahsan. Quantifying the Road Safety Benefits of Sustainable Transportation: Transit.
Masters Thesis, Kelowna: The University of British Columbia, 2010.
BC Transit. Fare Payment. 2009. http://www.transitbc.com/regions/kel/fares/default.cfm
(accessed 08 20, 2011).
—. Rapidbus. http://www.bctransit.com/transitfuture/rapidbus.cfm (accessed August 5, 2011).
Bergen, Kate, interview by Ellen Morrison. Kelowna Regional Transit System Pro Pass Program
Statistics (08 05, 2011).
Big White Ski Resort. Express Bus Schedule 11/12 Season. 2011.
http://www.bigwhite.com/plan-your-trip/how-to-get-here/express-bus-to-big-white/
(accessed 08 25, 2011).
City Data. City Data. 2011. http://www.city-data.com/city/Boulder-Colorado.html (accessed 08
26, 2011).
City of Boulder. 2009 Community Data Report. Planning Department Report, Boulder: City of
Boulder, 2009.
—. Eco Pass Extra. 02 25, 2011.
http://www.bouldercolorado.gov/index.php?option=com_content&view=article&id=8877
&Itemid=4645 (accessed 07 06, 2011).
—. Go Boulder. 2011.
http://www.bouldercolorado.gov/index.php?Itemid=2973&id=8774&option=com_conten
t&task=view (accessed 07 09, 2011).
City of Kelowna. 2009 Demographic Profile. May 2009.
http://www.investkelowna.com/documents/CityofKelownaProfile-EDCFinal_000.pdf
(accessed 08 26, 2011).
City of Kelowna. Central Okanagan Region Social Marketing Strategy. Final Report, Kelowna:
City of Kelowna, 2004.
—. "City of Kelowna." iGO Central Okanagan. August 2009.
http://www.kelowna.ca/CityPage/Docs/PDFs/iGo/2009%20Bike%20Route%20Map.pdf
(accessed October 13, 2011).
City of Kelowna. Community Climate Action Discussion Paper: Working towards a 33%
reduction in greenhouse gases. Discussion Paper, Kelowna: City of Kelowna, 2011.
73
City of Kelowna. Housing Resources Handbook. Policy and Planning Report, Kelowna: City of
Kelowna, 2011.
—. i-Go Central Okanagan. 2003. http://www.city.kelowna.bc.ca/CM/Page1059.aspx (accessed
08 15, 2011).
City of Kelowna. Kelowna Population Statistics. Planning and Development Services
Department Report, Kelowna: City of Kelowna, 2006.
City of Kelowna. Official Community Plan: Population and Housing Projections Discussion
Paper. Discussion Paper, Kelowna: City of Kelowna, 2009,
http://www.city.kelowna.bc.ca/CityPage/Docs/PDFs//Community%20Planning/kelowna2
030/2009Population&HousingProjectionsDiscussionPaper.pdf.
—. Parkinson Rec Center Pool and Facility Admission Rates. 05 1, 2011.
http://www.kelowna.ca/CityPage/Docs/PDFs%5C%5CSport%20and%20Recreation%5C
Parkinson%20Rec%20Centre%20Pool%20and%20Facility%20Adminssion%20Rates.pdf
(accessed 08 25, 2011).
Couture, Béatrice, interview by Ellen Morrison. BIXI Bike Sharing System (07 07, 2011).
Creative Survey Systems. Sample Size Formulas for our Sample Size Calculator. 2010.
http://www.surveysystem.com/sample-size-formula.htm (accessed August 24, 2011).
Entertainment Savings Offers. Okanagan Entertainment Book. 08 2011.
http://www.entertainment-savings-offers.com/okanagan/book/ (accessed 08 24, 2011).
Feng, Vicky Wei, and Gord Lovegrove. "Sustainable road safety: A new neighbouhood road
pattern that saves VRU lives." Elsevier, 1995: 7-9.
GO Boulder. "2010 Neighbourhood Eco Pass Household Count for Boulder." 01 07, 2011. (Lin
2003) (accessed 08 29, 2011).
Go Boulder. 2011 NECO Pass Pricing and City of Boulder Subsidy. Boulder, Colorado,
November 2010.
GO Boulder. Getting started: an overview. 2011.
http://www.bouldercolorado.gov/index.php?option=com_content&task=view&id=8906&
Itemid=3323 (accessed 08 26, 2011).
—. Getting Started: An Overview. 01 23, 2011.
http://www.bouldercolorado.gov/index.php?option=com_content&view=article&id=8906
&Itemid=3323 (accessed 07 06, 2011).
Go Boulder. "History and Analysis of RTD Pass Programs." Boulder, Colorado, 2006.
74
Guppy, Neil, and George Gray. Successful Surveys: Research Method and Practice. Toronto:
Harcourt Brace and Company, 1994.
Hagelin, Chris, interview by Ellen Morrison. Boulder, Colorado's Transit System and NECO
Pass (06 07, 2011).
Hagelin, Chris. NECO Pass Data 2011. Powerpoint Presentation, Boulder, Colorado: Go
Boulder, 2011.
Hagelin, Chris, interview by Ellen Morrison. NECO Pass Participation Rate (September 21,
2011).
Hagelin, Chris, interview by Ellen Morrison. The GO Boulder NECO Pass Program (September
12, 2011).
HDR Decision Economics. Economic Development Commission of the Central Okanagan:
Central Okanagan Traffic Congestion Assessment. Final Report, Kelowna: City of
Kelowna, 2009.
Hollingworth, Brian, Anna Mori, Laura Cham, Dylan Passmore, and Neil Irwin. Urban
Transportation Indicators: Fourth Survey. Urban Transportation Indicators Survey,
Ottawa: Transportation Association of Canada, 2010.
Kittmer, Mike, interview by Ellen Morrison. Kelowna Regional Transit Pro Pass Program
Process (07 28, 2011).
Letkeman, Dale, interview by Dr. Gordon Lovegrove. Bicycle Maintenance and Repairs
(September 29, 2011).
Lin, Brian. First ComPASS Study Begins. 09 04, 2003.
http://www.publicaffairs.ubc.ca/ubcreports/2003/03sep04/compass.html (accessed 08 27,
2011).
Monashee Adventure Tours. Orchard to Winery. 2011.
http://www.monasheeadventuretours.com/ (accessed 08 15, 2011).
National Research Center, Inc. "Modal Shift in the Boulder Valley: 1990 to 2009."
Transportation Survey Analysis, Boulder, Colorado, 2010.
Pavlich, Dennis. Managing Environmental Justice. rodopi, 2010.
Regional Transportation District. Passes and Ticket Books. 2011 . http://www.rtd-
denver.com/Passes_Ticketbooks.shtml (accessed 07 06, 2011 ).

75
Sayed, Tarek, Walid Abdelwahab, and Frank Navin. "Identifying Accident-Prone Locations
Using Fuzzy Pattern Recognition." Journal of Transportation Engineering, 1995: 352-
358.
SEEDS Project. A Strategic Plan to Increase Transit Use through the U-Pass Program at UBC
Okanagan. Kelowna: UBC, 2006.
SFU Community Trust. "UniverCity on Burnaby Mountain." Community Ammenities. 06 24,
2011.
http://www.univercity.ca/upload/Transit%20Pass%20Letter_June%2024%20final.pdf
(accessed 07 08, 2011).
Statisics Canada. 2006 Community Profile. March 16, 2007. http://www12.statcan.gc.ca/census-
recensement/2006/dp-pd/prof/92-
591/details/page.cfm?Lang=E&Geo1=CSD&Code1=5935010&Geo2=PR&Code2=59&
Data=Count&SearchText=kelowna&SearchType=Begins&SearchPR=01&B1=All&Cust
om= (accessed 08 29, 2011).
Student Society of UBC. U-Pass. 2011. http://www.ams.ubc.ca/services/u-pass/ (accessed
August 8, 2011).
The University of British Columbia. Okanagan U-Pass. September 30, 2010.
http://www.upass.ubc.ca/okanagan/u-pass/ (accessed August 8, 2011).
—. Survey Tool. 05 24, 2011.
http://www.it.ubc.ca/service_catalogue/social_media_collaboration/survey_tool.html
(accessed 07 04, 2011).
—. UBCO U-Pass FAQ. October 7, 2010. http://trek.ubc.ca/okanagan-campus/ubco-upass-faq/
(accessed August 5, 2011).
The Weather Network. Statistics: Denver/Stapleton, CO, United States of America. 2011.
http://www.theweathernetwork.com/statistics/c02808 (accessed 08 26, 2011).
—. Statistics: Kelowna, BC, Canada. 2011.
http://www.theweathernetwork.com/statistics/summary/cl11239r0 (accessed 26 08,
2011).
Translink. TransLink and Simon Fraser University to implement Canada’s first Community
Transit Pass. December 20, 2005. http://www.translink.ca/en/About-
TransLink/Media/2005/December/TransLink-and-Simon-Fraser-University-to-
implement.aspx (accessed 07 08, 2011).
76
—. "UniverCity on Burnaby Mountain." Amenities for Residents. 06 22, 2011.
http://www.univercity.ca/upload/Letter%20from%20TransLink.pdf (accessed 07 08,
2011).
U.S. Census Bureau. 2005-2009 American Community Survey 5-Year Estimates. 2010.
http://factfinder.census.gov/servlet/ACSSAFFFacts?_event=&ActiveGeoDiv=geoSelect
&pctxt=fph&_lang=en&_sse=on&geo_id=16000US0807850&_state=04000US08
(accessed 08 26, 2011).
—. GCT-Pa. Age, Sex, and Group Quarters: 1990. 1990.
http://factfinder.census.gov/servlet/GCTTable?_bm=y&-context=gct&-
ds_name=DEC_1990_STF1_&-CONTEXT=gct&-
mt_name=DEC_1990_STF1_GCTPA_US8&-tree_id=100&-redoLog=true&-
_caller=geoselect&-geo_id=04000US08&-format=ST-3&-_lang=en (accessed 08 25,
2011).
—. Profile of General Population and Housing Characteristics: 2010. 2010.
http://factfinder2.census.gov/faces/tableservices/jsf/pages/productview.xhtml?src=bkmk
(accessed 08 26, 2011).
UBC TREK Program. ComPASS Demonstration Report. Final Report, Vancouver: UBC TREK
Program, 2004.
UBC TREK Program. Fall 2010 Transsportation Status Report. Vancouver: The Universeity of
British Columbia, 2011.
UBC TREK Program. UBC TREK Program Center Transportation Status Report Fall 1997 to
Fall 2003. Vancouver: UBC, 2004.
—. U-Pass FAQ. August 17, 2011. http://www.upass.ubc.ca/frequently-asked-questions/
(accessed August 8, 2011).
UBC. u-pass. http://www.ams.ubc.ca/services/u-pass/ (accessed august 8, 2011).
UniverCity. Overview. 2011. http://www.univercity.ca/about_us/overview.2.html (accessed 07
08, 2011).
—. Overview. 2011. http://www.univercity.ca/about_us/sustainability.46.html (accessed 07 08,
2011).
Urban Systems. UBC TREK Program Center Transportation Status Report 1997 to 2003 .
Vancouver: UBC, 2003.
Urban Systems. "U-Pass Review Final Report." vancouver, 2005.
77
Urban Systems, Mustel Group, and Karyo Communications. ComPASS Demonstration Report.
Final Report, Vancouver: TREK Program UBC, 2004.
Urban Systyms. UBC TREK Program Center Transportation Status Report Fall 1997 to Fall
2002. vancouver: UBC, 2002.
Winfree, Tracey. "The Many Transit "Connections" in Boulder, Colorado." Smart Growth and
Transportation: Issues and Lessons Learned. Baltimore: Transportation Research Board,
2002. 144-147.
Related Documents