The Geostationary Earth Radiation Budget (GERB) Project J. E. Harries, J. E. Russell, J. A. Hanafin, H. Brindley, J. Futyan, J. Rufus, S. Kellock, G. Matthews 1 , R. Wrigley 2 , A. Last, J. Mueller 3 , R. Mossavati 3 , J. Ashmall 4 , Blackett Laboratory, Imperial College London, UK E. Sawyer, D. Parker, M. Caldwell, P. M. Allan, A. Smith, M. J. Bates, B. Coan, B. C. Stewart, D. R. Lepine, L. A. Cornwall, D. R. Corney, M. J. Ricketts, D. Drummond, D. Smart, R. Cutler, Rutherford Appleton Laboratory, UK S. Dewitte, N. Clerbaux, L. Gonzalez, A. Ipe, C. Bertrand, A. Joukoff, D. Crommelynck Royal Meteorological Institute, Brussels, Belgium N. Nelms, D. T. Llewellyn-Jones, G. Butcher University of Leicester, UK G. L. Smith, National Institute of Aerospace, Hampton, Virginia, USA Z. P. Szewczyk, P. E. Mlynczak Space Applications International Corporation, Hampton, Virginia, USA A. Slingo, R. P. Allan Environmental Systems Science Centre, University of Reading, UK M. A. Ringer Met Office, Hadley Centre for Climate Prediction and Research, Exeter, UK 1 Now at Analytical Services and Materials, Inc., Hampton, VA, USA 2 Now at Surface Measurement Systems Ltd., London, UK 3 Now at EUMETSAT, Darmstadt, Germany 4 Now at Center for Space Research, MIT, MA, USA 1

Welcome message from author
This document is posted to help you gain knowledge. Please leave a comment to let me know what you think about it! Share it to your friends and learn new things together.
Transcript

The Geostationary Earth Radiation Budget (GERB) Project
J. E. Harries, J. E. Russell, J. A. Hanafin, H. Brindley, J. Futyan, J. Rufus, S. Kellock,
G. Matthews1, R. Wrigley2, A. Last, J. Mueller3, R. Mossavati3, J. Ashmall4,
Blackett Laboratory, Imperial College London, UK
E. Sawyer, D. Parker, M. Caldwell, P. M. Allan, A. Smith, M. J. Bates, B. Coan, B. C.
Stewart, D. R. Lepine, L. A. Cornwall, D. R. Corney, M. J. Ricketts, D. Drummond,
D. Smart, R. Cutler,
Rutherford Appleton Laboratory, UK
S. Dewitte, N. Clerbaux, L. Gonzalez, A. Ipe, C. Bertrand, A. Joukoff, D.
Crommelynck
Royal Meteorological Institute, Brussels, Belgium
N. Nelms, D. T. Llewellyn-Jones, G. Butcher
University of Leicester, UK
G. L. Smith,
National Institute of Aerospace, Hampton, Virginia, USA
Z. P. Szewczyk, P. E. Mlynczak
Space Applications International Corporation, Hampton, Virginia, USA
A. Slingo, R. P. Allan
Environmental Systems Science Centre, University of Reading, UK
M. A. Ringer
Met Office, Hadley Centre for Climate Prediction and Research, Exeter, UK
1 Now at Analytical Services and Materials, Inc., Hampton, VA, USA 2 Now at Surface Measurement Systems Ltd., London, UK 3 Now at EUMETSAT, Darmstadt, Germany 4 Now at Center for Space Research, MIT, MA, USA
1
Submitted to Bulletin of the American Meterological Society: August 11th 2004.
Accepted for publication: December 21st 2004
Revised version submitted: 31st January 2005
Corresponding Author:
J. A. Hanafin,
Space and Atmospheric Physics,
Imperial College,
London SW7 2BZ, UK.
Email: [email protected]
Tel: +44-(0)207-594-7665
2

Abstract
This paper reports on a new satellite sensor, the Geostationary Earth Radiation
Budget (GERB) experiment. GERB is designed to make the first measurements of the
Earth’s radiation budget from geostationary orbit. Measurements at high absolute
accuracy of the reflected sunlight from the Earth, and the thermal radiation emitted by
the Earth are made every 15 minutes, with a spatial resolution at the sub-satellite point
of 44.6 km (N-S) by 39.3 km (E-W). With knowledge of the incoming solar constant,
this gives the primary forcing and response components of the top of atmosphere
radiation. The first GERB instrument is an instrument of opportunity on Meteosat-8, a
new spin-stabilised spacecraft platform also carrying the Scanning Enhanced Visible
and Infrared (SEVIRI) sensor which is currently positioned over the equator at 3.5ºW.
This overview of the project includes a description of the instrument design and its
pre-flight and in-flight calibration. An evaluation of the instrument performance after
its first year in orbit, including comparisons with data from the Clouds and the Earth’s
Radiant Energy System (CERES) satellite sensors, and with output from numerical
models are also presented. After a brief summary of the data processing system and
data products, some of the scientific studies which are being undertaken using these
early data are described. This marks the beginning of a decade or more of
observations from GERB, as subsequent models will fly on each of the four Meteosat
Second Generation satellites.
Capsule
A new satellite instrument, GERB, is now operating on the European
Meteosat-8 spacecraft, making unique, accurate, high time resolution measurements
of the Earth’s radiation budget from geostationary orbit, for atmospheric physics and
climate studies.
3
1. Introduction
This paper describes a new Earth Radiation Budget (ERB) sensor which is in
operation on the first Meteosat Second Generation satellite. The Geostationary Earth
Radiation Budget (GERB) experiment is providing the first dedicated measurements
of the ERB components from geostationary orbit. The paper describes the science
background, the instrument and operations, and presents some of the first data. GERB
has been performing very successfully since launch.
Anthropogenic changes to our Earth’s climate may already be occurring, as
greenhouse gas concentrations in the atmosphere increase above natural levels, and as
the temperature at the Earth’s surface shows a significant and rapid rise in the past
two decades, compared with the past two millennia (Houghton et al. 2001; Stott et al.
2000). Ascribing these known changes to specific mechanisms is, however, a very
challenging problem, e.g. see Allen et al. (2000). Furthermore, the complex feedback
processes which can amplify or dampen these increases are not fully understood:
among the most important feedbacks are those due to water vapour (e.g. Harries
1997), clouds (e.g. Senior and Mitchell 1993), and aerosol particles (e.g. Charlson et
al. 1992). Accurate observations of the system are required to develop and test models
and improve their predictions. ERB experiments have proved invaluable in this
regard, providing measurements of the reflected sunlight from the Earth and the
thermal IR radiation emitted by the planet (e.g. Wielicki et al. 2002). This gives the
net top of atmosphere (TOA) response of the Earth-atmosphere system to the
incoming solar energy (e.g. Gueymard 2004). ERB observations to date have been
made from instruments flown in low Earth orbit, which provide good spatial
resolution because of the proximity to the surface, but are limited in their temporal
sampling. This limits their usefulness for studying events and features such as
4

convective clouds, frontal systems and aerosol variability from dust storms, or from
volcanoes.
The aim of the GERB project is to provide the accurate, rapid measurements
required to study the forcing and feedback mechanisms on the short time scales that
are important in many cases, and in turn to use improved understanding of these
mechanisms to determine inter-annual and longer term climate variability. The
Meteosat Second Generation (MSG) satellite series is planned to extend over at least a
decade, with each satellite carrying a GERB instrument.
A team of European scientists and engineers, led by Imperial College and
managed technically by the Rutherford Appleton Laboratory (RAL), has developed
this new instrument, the first ever to accurately measure the full spectrum ERB (rather
than a series of narrow spectral bands) from geostationary orbit, and its variation with
time. Four GERB instruments have been designed and built by RAL, in partnership
with European and UK institutes and industry, and calibrated at Imperial College. The
first GERB was launched as an instrument of opportunity onboard the MSG-1 satellite
(now renamed Meteosat-8) in August 2002. This satellite is currently orbiting above a
longitude of 3.5W, but this may change in the course of the platform lifetime,
according to the requirements of the operational mission. It has been operating almost
continuously since December 2002, providing near-real time (NRT) shortwave and
longwave TOA radiances and fluxes every 15 minutes. These are co-located with the
data from another instrument on the satellite, the Scanning Enhanced Visible and
Infrared Imager (SEVIRI) described in more detail in Schmetz et al. (2002) and
Munro et al. (2002). SEVIRI is the primary European operational geostationary
weather satellite sensor and provides NRT data in 12 narrowband channels every 15
minutes. Meteosat-8 is operated by the EUropean organisation for exploitation of
5
METeorological SATellites (EUMETSAT), and will provide over a decade of vital
new operational and scientific observations of our Earth.
2. Instrument principles and design
The GERB instrument (Harries and Crommelynck 1999; Sandford et al. 2003)
consists of two units: the optics unit (shown in Figure 1) and the electronics unit, both
manufactured at RAL. The optics unit (see Figure 2 for a schematic layout) measures
0.45 m x 0.2 m x 0.2 m and contains the imaging optics and detector system, a de-spin
mirror and a quartz filter, along with two on-board calibration targets, the thermal
blackbody source (BB) and the shortwave calibration monitor (table 1). The
electronics unit controls the instrument and provides data handling.
The overall design specifications for GERB are given in table 2. These
parameters represent the design aims of the instrument. The absolute radiometric and
the spatial co-registration accuracies are currently being established in validation
activities.
As the 3 m diameter satellite platform spins at 100 rpm, the despin mirror is
key in GERB’s sampling procedure. It counteracts the spacecraft rotation by spinning
in the opposite direction, directing a shuttered ‘frozen’ beam of incoming radiation,
via the telescope optics, onto the detector array for 40 ms during each spacecraft
rotation. The linear, 256-element detector array is aligned north-south (parallel to the
satellite’s axis of rotation), and the mirror pointing direction is moved by one pixel in
the east-west direction after every spacecraft rotation, building up a complete scan of
the Earth in 256 x 282 pixels. This takes approximately three minutes.
The blackened detector array is sensitive to radiation at all wavelengths,
though only wavelengths longer than about 0.32 µm carry significant energy in the
6
reflected sunlight, due to absorption by ozone. Alternate scans observe either the total
spectrum of radiation from the Earth (TOTAL channel) or are measured through a
quartz shortwave (SW) filter, which transmits only wavelengths shorter than 4.0 µm
(SW channel). The longwave (LW) measurement is obtained by the subtraction of
adjacent TOTAL and SW measurements during ground processing.
The output from the detector array is sampled for 40 ms three times during
every spacecraft rotation: when the input beam is coming from the Earth view, the
SW calibration monitor and the BB. Pairs of adjacent TOTAL and SW Earth viewing
scans are calibrated and converted to radiance using the BB scans and views of space
obtained before and after each scan of the Earth. These ‘Level 0’ SW and TOTAL
calibrated radiance scans are geolocated, rectified, converted to fluxes, and then
binned or averaged in ground processing. As the same telescope and detector are used
to make measurements in the two spectral bands, pairs of scans can be precisely
spatially co-registered, but may be separated in time by up to 6 minutes.
3. Ground segment systems and data processing
a) Data processing, access and archive systems
The GERB ground segment is distributed between several institutions, as
illustrated in Figure 3. EUMETSAT provides the primary ground station for
Meteosat-8, handling all communications including transmission of commands to the
GERB instrument and reception of GERB raw data. The RAL GERB Ground
Segment Processing System (GGSPS) receives raw GERB data packets from the
primary ground station approximately every 0.6 seconds and buffers these packets
into Level 0 (raw telemetry data) product files spanning one TOTAL or SW scan.
These Level 0 files are calibrated and geolocated to produce Level 1.5 (filtered
7

TOTAL and SW radiances) data in NRT, which are then forwarded to the RMIB
(Royal Meteorological Institute of Belgium) in Brussels. At RMIB the Level 1.5
radiance products are converted to Level 2 SW and LW radiances and fluxes,
incorporating additional information from SEVIRI. The main elements of the
processing are shown in Figure 4 and are described in more detail below. The data
products are summarised in Table 3.
The GGSPS product archive consists of a 2.3 terabyte disk storage system, in
which the entire current version of the data set is available online at all times. A
searchable catalogue of data products is continually updated and users may search and
download data products via the GGSPS website (http://ggsps.rl.ac.uk) as soon as they
become available. Level 1.5 products are typically available approximately 35
minutes after the first packet of the file is transmitted from the instrument. Level 2
flux products are generated by the RMIB and are available from there for 40 days
after their generation, when they are sent to the GGSPS for access and long-term
archive. Potential users are encouraged to register at the GGSPS website for
timely notification of official data release in 2005.
Re-processing exercises will be undertaken in response to the availability of
improved calibration data or algorithms for calibration, improved geolocation, or
other aspects of science processing, and of course subject to funding. Versions of data
and all information pertaining to processing changes will be available from the
GGSPS website.
b) Level 1.5 radiance processing
(i) Conversion of raw data to calibrated radiances
The output from the digital signal processing system from each detector
element is used to estimate the steady state voltage output from each element,
8
accounting for the relevant detector time constant. This is done for the BB, Earth and
Calibration Monitor (CM) views. The Earth view readings are then converted into
filtered radiances, using gains and offsets computed from data from the BB and views
of space.
These are currently updated for each pair of scans, at approximately 6 minute
intervals. Analysis of the instrument performance to date shows that these calibration
parameters do not show significant variation with time, as seen in the instrument in-
flight evaluation. This update frequency may therefore be reduced in future
processing versions to prevent spurious variation introduced by the in-flight features
discussed in section 5.
(ii) Geolocation and rectification
Each view of the Earth is geolocated, meaning that a longitude and latitude is
determined for the point where the line of sight of each pixel intersects the surface of
the Earth. This requires knowledge of the satellite position and timing information to
determine GERB’s pointing direction. The satellite position and orientation is
determined to high accuracy by SEVIRI processing using landmark and horizon
information. The SEVIRI header files containing this information are routed via the
RMIB ground segment. Timing information in the GERB data is used to determine
the phase of the despin mirror and hence the east-west position of the GERB detector
column relative to the Earth. The relative pointing directions of the 256 GERB
detector elements have been determined from pre-flight calibration point spread
function (PSF) measurements, with corrections for post-launch misalignments.
Deviations of the satellite platform from an ideal geostationary orbit and a
small non-repeatability in the motion of the scan mirror mean that the points measured
by successive scans are in slightly different positions on the Earth’s surface. In order
9
to average different scans together, the data is first rectified, i.e. interpolated onto an
equiangular geocentric grid as viewed from the ideal satellite position and orientation.
The instrument spatial sampling resolution gives a sub-satellite pixel of 44.6 km (N-S)
x 39.9 km (E-W), which becomes 50 x 50 km in the rectified grid. Instrument PSF is
not corrected for in Level 1 rectification. Target geolocation accuracy is 0.1 pixel and
the actual accuracy is being established in validation activities.
c) Level 2 radiance and flux processing
(i) Radiance unfiltering
Variations of the instrument sensitivity with wavelength are removed in the
unfiltering process. Accurate estimation of the unfiltered reflected solar and emitted
thermal radiances from the filtered radiances requires information about the spectral
signature of the incoming radiation. This information is provided by the SEVIRI
imager’s narrowband measurements. The unfiltered and filtered radiances, LufSEV and
LfSEV, are estimated from the imager through narrowband-to-broadband conversions
and convolution with the GERB PSF and spectral response. The unfiltered radiances
Luf are then calculated from the filtered GERB measurements LfGERB using:
⎟⎟⎠
⎞⎜⎜⎝
⎛= f
SEV
fGERBuf
SEVuf
LL
LL (1)
Using a data base of top-of-atmosphere (TOA) spectral radiance curves
(Clerbaux et al. 2003), the 1 σ error introduced by the unfiltering process has been
determined to be about ±0.3 % for solar and ±0.1 % for thermal radiation.
(ii) Scene identification and cloud masking
To convert radiance (L) into flux (F), the scene in each pixel is characterized
in terms of surface type and cloud cover properties, retrieved from SEVIRI. This takes
10
advantage of accurate clear-sky reflectance in the 0.6 µm and 0.8 µm visible SEVIRI
channels (Ipe et al. 2003). For each SEVIRI pixel, the cloud optical depth (τ) is
retrieved from the reflectance using lookup tables, described in Ipe et al. (2004).
Using the STREAMER radiative transfer model (Key and Schweiger 1998), 24
lookup tables have been built: for the two SEVIRI visible channels; ice and water
clouds; and for 6 surface types. The cloud phase is retrieved from the 12.0 µm
brightness temperature and from the 1.6 µm reflectance using a method similar to
Nakajima and King (1990). A cloud mask is derived at the SEVIRI pixel resolution by
thresholding the cloud optical depth, and the cloud fraction over the GERB footprint
is then estimated from this mask. The threshold (τ = 0.9) was chosen for consistency
with the CERES cloud fraction retrieval (Ipe et al. 2004).
(iii) Radiance to flux conversion
The flux is estimated from the unfiltered radiance using models of the angular
distribution of the radiant energy at the TOA. Models from the CERES instrument on
board the Tropical Rainfall Measuring Mission satellite (Loeb et al. 2003) are used in
the SW, while for the LW a method based on the SEVIRI thermal channels has been
developed (Clerbaux et al. 2003). Like the unfiltered radiance, the fluxes are first
estimated from SEVIRI (FSEV), are then convolved to the GERB footprint and finally
corrected using the radiance unfiltering correction factor LfGERB/Lf
SEV.
(iv) Resolution enhancement
During resolution enhancement, the quantities Lf, Luf and F are transformed
from the GERB resolution, nominally 50 km at nadir, to a 3x3 SEVIRI pixel
resolution, nominally 9 km at nadir (Gonzalez et al. 2000). Resolution enhanced
unfiltered radiances and fluxes are produced every 15 minutes.
d) Monthly means
11
Monthly mean products are of value in allowing direct comparison with the
monthly mean data from polar orbiting instruments. These will be generated from
Level 2 all-sky and clear-sky fluxes. Two products are planned: first, the monthly
mean itself; and secondly, a mean of 15 minute bins from each day, i.e. a monthly
mean of the diurnal cycle. Monthly mean products are not yet available, though once
routine processing capability has been established, average products will be generated
from the start of the science data record.
4. Instrument calibration
a) Pre-flight calibration
Knowledge of the GERB TOTAL and SW channel spectral response (the
product of instrument throughput and detector responsivity) is required for converting
the measured detector voltages into radiances for the TOTAL, SW and LW channels
(Mossavati et al. 1998). The measurements necessary to formulate this spectral
response were made during the pre-flight ground calibration undertaken in the Earth
Observation Characterisation Facility at Imperial College. The BB used for in-flight
calibration was characterised as a function of temperature and linked via a transfer
standard to the national absolute standard. Also, the PSF, a measure of the angular
response, was measured for each individual detector element. These measurements
were made consistent with the target in-flight measurement accuracies of ±1 % in SW
and LW radiances (see table 2).
The spectral responses of the TOTAL and SW channels were determined by
combining spectral measurements of each individual component of the optical system:
mirror reflectance, quartz filter transmission and detector responsivity. The mirror and
filter data were combined to produce a telescope optical model giving the
12
transmittance per channel per detector element. These transmittances were multiplied
by the detector data to produce a final spectral response for each channel and each
detector element. The telescope measurements were made over the wavelength range
0.3 - 140 µm. The detector measurements were made using band pass filters to isolate
different narrow spectral ranges over the range 0.3 – 25 µm, and were combined with
measurements from 2.5 – 55 µm of the reflectivity of witness samples (metal
substrates with similar black coatings). These were then extrapolated to produce a
detector response from 0.3 – 140 µm. Further details of the instrument calibration will
form the basis of a subsequent publication.
The calibration algorithms assume a linear relationship between detector
output and filtered radiance. This assumption was tested for a subset of detector
elements using a visible light source and a narrowband filter over the full instrument
dynamic range in both channels. Additionally, all detector elements were checked in
the TOTAL channel using a variable temperature BB for a subset of the instrument
dynamic range. Figure 5 demonstrates the highly linear nature of the instrument
response, showing the correlation coefficient between incoming radiance and
response per detector element of between 0.99997 and 1.00000 (except for one
element at 0.999965). The spectral characterisation used three calibration sources,
supplied by the UK National Physical Laboratory, with calibrations traceable to
national absolute standards. Two BB sources were used, one at about 300 K
representing an Earth-like source, the other at liquid nitrogen temperatures
approximating an in-flight deep-space view. The third source was a lamp-illuminated
integrating sphere, with an effective temperature of 310K representing the visible and
near-IR solar spectrum region. The internal BB was also calibrated for all detector
13
elements using the two BB sources and over the range of predicted in-flight
temperatures.
The SW channel point spread function for each detector element was
measured using a highly-collimated incident beam from a HeNe laser (wavelength
633 nm) to produce a focussed spot at the detector. The spot was stepped in small
increments in two orthogonal axes in the detector plane to obtain a grid of width +/-3
pixels around each detector element. These data were adjusted for predicted optical
distortions due to the satellite spin rate and combined with the system optical model to
derive a LW channel PSF for each detector element.
b) In-flight calibration updates
The instrument is continually calibrated in-flight using BB and space views, as
described in the data processing section. This provides an accurate, absolute
calibration of the thermal response of the instrument throughout the infrared.
Maintaining the required measurement accuracy in the SW spectral range is, however,
more of a problem, well known in ERB experiments. This problem arises primarily
because of the impracticality of using a calibration target that is close in brightness
temperature to that of the Sun. However, an integrating sphere, illuminated at certain
geometries by the Sun, can be used as a monitor of spectral response changes in the
SW channel. Such changes can arise from degradation of the quartz filter or the
mirrors, as well as the detector response.
The on-board CM consists of an integrating sphere, whose output aperture is
scanned once every satellite rotation, after the Earth view. A specific scan mode is
also run 4-6 times a year under optimal illumination conditions. This mode is used to
determine changes in the filter response over the lifetime of the mission and as input
to update calibration parameters.
14

The spectral reflection properties of the CM may also change throughout the
course of the mission due to degradation of the aluminium surface, primarily in the
UV. Changes in this response are monitored using 3 photodiodes mounted close to the
output aperture, measuring continuously in the UV, visible and near-infrared.
Combining the daily CM illuminated scan data with photodiode spectral information
will allow characterisation of any spectral changes occurring within the CM itself.
Results after a year of operation show that the CM is spectrally stable to date.
Checks of the ground measurements of detector PSF are made in-flight, since
post-launch distortion of the optics and satellite spin axis changes due to spacecraft
manoeuvres may affect the PSF. The instrument linearity is also checked at regular
intervals in-flight, by changing the BB temperature while scanning deep space.
5. Instrument in-flight performance
GERB has been operating and under validation for 2 years and has been
performing very successfully. Figure 6 shows the ‘first light’ filtered radiance images
from GERB, collected on December 12, 2002. The high quality of the images, and the
correct performance of the scanning and calibration procedures were immediately
evident from these early data.
a) Mirror pointing accuracy
In order to meet the scientific goals of GERB the mirror pointing position
should be known to 0.8 arcmin. The position of each successive scan line is measured
by GERB with respect to a signal provided by the spacecraft platform which is used to
derive information on the position of the Earth relative to the spacecraft, known as the
start of line pulse (SOL), for every rotation. There are two main components to
instrument pointing accuracy: the error in the GERB mirror position measurement,
15
and the error in the spacecraft SOL signal. The mirror measurement has been verified
to have a repeatability of better than 0.4 arcmin (0.1 step size or pixel width).
Currently, however, the SOL pulse has systematic errors of up to 6 arcmin (1.5 steps).
A temporary solution has been implemented in the GGSPS processing and
considerable effort is being expended to understand and correct for these errors so that
they can be reduced even further to meet the overall pointing requirement.
Both sides of the mirror are used to acquire data. During instrument
commissioning activities an angular offset of 0.3 arcmin between the two mirror faces
was detected. This has been corrected for in onboard software and the effect on the
measurement is now negligible.
b) Stability of instrument in flight
Analysis of calibration data collected to date has shown that both the SW and
the LW responses of the instrument have been stable in the initial year of operation.
These parameters are continually monitored and any drift in sensor response can be
characterised and accounted for in the processing. The thermal environment of the
instrument is within the predicted range of temperatures and shows only very small
variations from day to day outside the equinox season. During equinoxes, and for a
period of 3-4 weeks before and after, the instrument cools rapidly when the sun is
eclipsed by the Earth at midnight. External temperatures can change by up to 15 ºC
over two hours. Temperatures inside the instrument are controlled by heaters,
however, with a maximum variation of 1 ºC in the same time frame. Power supply
from the satellite platform and distribution within the instrument has also been very
stable and within specification to date.
c) Detector noise
16
A deep space scanning mode considerably extends the amount of space data
acquired during each scan. These data allow evaluation of the stability of the
instrument gain under conditions of varying BB temperature and determination of the
instrument noise level. Although the gain is calculated every five minutes, so that gain
stability over a twelve hour period is not a requirement for accurate calibration, in fact
the gain is stable over this time. For all detector elements, the distributions of gain
with time are narrow and sharply peaked with standard deviations around 0.3 %. This
indicates that instrument noise is very low, and within budget.
d) Straylight features
The above-mentioned eclipse of the sun at equinoxes has unavoidable
consequences for GERB operation. Direct illumination of the detectors would cause
permanent damage, and the instrument must be safeguarded from such events. As the
instrument pointing can only be controlled in the east-west direction, data collection
must be shut down during periods when the solar declination brings it within the FOV
in order to ensure the instrument safety. This results in loss of data for 4-5 hours every
night centred around local midnight for 5-6 weeks before and after spring and autumn
equinoxes. For two weeks before and after these periods, the data around midnight are
affected by reflection of stray solar illumination within the instrument cavity as the
sun approaches the FOV. This straylight is a significant fraction of the radiance
measured for two hours, again centred around local midnight.
Internal reflection of solar illumination has also been shown to affect the BB
radiances, for approximately 1.5 hours around 11:30 UTC every day. The BB
radiances are currently used continuously for calibration of the measured Earth
radiances, so this in turn affects the accuracy of the data products. Solutions to both of
17
these stray light problems are currently being investigated and the data affected will
be flagged.
6. Validation and science plans
(a) Validation Plan
It is planned to validate as many of the GERB data processing steps and
intermediate products as possible and to evaluate the final unfiltered radiance and flux
products, by intercomparison with other observations and models, internal consistency
checks and the use of ground measurements.
Special instrument scanning modes have been designed to: monitor pixel noise
and SW sensitivity; validate ground calibration measurements of PSF and time
response; and evaluate the accuracy of particular processing steps, e.g. interpolation
and averaging.
The radiance mode of the UK Met Office Unified Model, which simulates the
measurements made by different instruments, will be used to provide a transfer
standard between GERB detectors and other sensors. Time series comparisons
between model and GERB fluxes over well understood scenes, for example clear
ocean, can also be used to highlight changes in the instrument performance (Allan et
al. 2004, submitted manuscript).
Measurements of broadband LW and SW radiances and fluxes made by the
CERES instruments can also be employed for validation. Special programmable
scanning modes enable CERES to vary its scanning pattern to increase the number of
observations which match the GERB viewing geometry (Smith et al. 2003). This is
particularly important for the comparison of the highly anisotropic SW radiances.
GERB and CERES unfiltered radiances and scene identification can be compared for
18
co-located and co-angular observations. Additionally, fluxes can be compared for co-
located observations for different viewing angles, as a function of observation angle.
Such comparisons can provide a transfer standard between GERB detectors; more
detailed comparisons, at well-characterised sites and involving other instruments, can
provide a simultaneous and independent measure of the accuracy of both instruments.
The validity of the theoretical basis and algorithms used for radiance
unfiltering and radiance to flux conversion (described in section 3c) can also be
confirmed by directly applying these algorithms to the broadband filtered radiances
measured by CERES and comparing the results with the previously validated CERES
products.
Whilst broadband measurements from CERES provide the most direct
comparison, narrowband measurements made by other satellites can also be used for
validation. Through modelling, broadband radiances and fluxes can be derived from
narrowband radiance measurements. Comparing these to CERES measured radiances,
as well as GERB measurements, allows separation of differences due to GERB
calibration from those due to spectral modelling. Repetition of the comparison for
GERB products at different spatial resolutions and for varying temporal interpolation
allows the errors in resolution enhancement and temporal interpolation to be
investigated. Additionally, day-night variability in the comparisons can be used to
evaluate the accuracy of the total-SW subtraction, used in calculation of the daytime
longwave products.
Well-characterised sites will be used for long term monitoring and for
intercomparisons with different instruments and models. In the SW, stable desert sites
will be used. In the LW, high clouds can be used as they lie above much of the
atmosphere and their signal is close to that of a blackbody which simplifies the
19
modelling required. Comparisons will also be made for clear-sky ocean scenes,
particularly where nearby atmospheric profiles and surface temperature estimates are
available. Large scale calibration sites such as those in the Valencia and Castilla-La
Mancha regions will be used in conjunction with ground measurements for detailed
intercomparison exercises. Participation in field campaigns measuring atmospheric
radiation and state will also be part of the validation process.
(b) Initial results
The validation processes is ongoing, and here we report the preliminary results
of intercomparisons between the GERB and CERES unfiltered reflected solar and
emitted thermal radiances matched for time, space and viewing geometry.
Comparisons have been made over all detectors separated by SW scene type, and
individually for each of the 256 GERB detectors.
The comparison for all GERB detectors found a GERB/CERES LW radiance
ratio of 0.997 +/- 0.007 (all results quoted at a 95% confidence interval). The reflected
SW data were separated according to five scene types with distinct spectral radiance
distributions and brightness levels. The best correspondence was found for clear-sky
bright deserts, for which the GERB/CERES ratio was 1.001 +/- 0.010 and the clear-
sky ocean was the worst case with a ratio of 0.931 +/- 0.009. The instrument spectral
characterisation is the most likely cause of these scene-dependent differences and
these data are currently being re-analysed.
To further investigate the SW radiance discrepancies a comparison was made
separated by GERB detector rather than scene type. The GERB detector array is
oriented roughly North-South with respect to the Earth; each GERB pixel therefore
views a large range of longitudes but only a small range of latitudes. Figure 7 shows
the detector based SW results for data obtained around the northern hemisphere
20
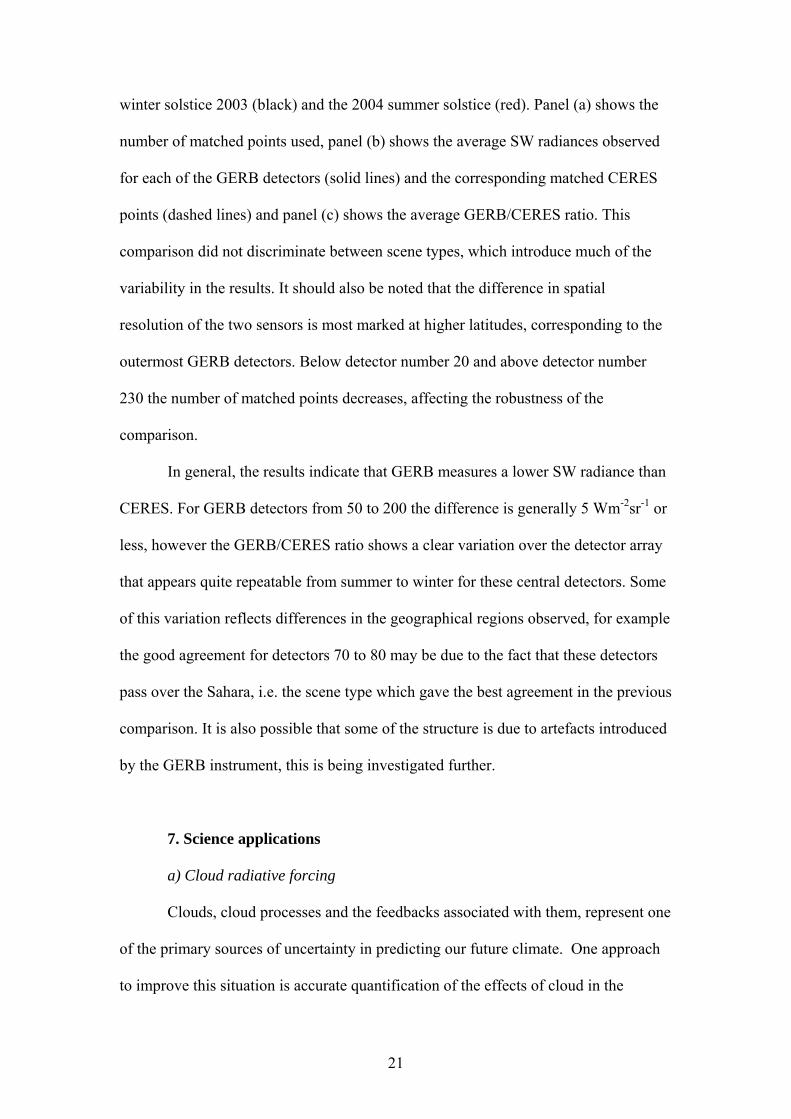
winter solstice 2003 (black) and the 2004 summer solstice (red). Panel (a) shows the
number of matched points used, panel (b) shows the average SW radiances observed
for each of the GERB detectors (solid lines) and the corresponding matched CERES
points (dashed lines) and panel (c) shows the average GERB/CERES ratio. This
comparison did not discriminate between scene types, which introduce much of the
variability in the results. It should also be noted that the difference in spatial
resolution of the two sensors is most marked at higher latitudes, corresponding to the
outermost GERB detectors. Below detector number 20 and above detector number
230 the number of matched points decreases, affecting the robustness of the
comparison.
In general, the results indicate that GERB measures a lower SW radiance than
CERES. For GERB detectors from 50 to 200 the difference is generally 5 Wm-2sr-1 or
less, however the GERB/CERES ratio shows a clear variation over the detector array
that appears quite repeatable from summer to winter for these central detectors. Some
of this variation reflects differences in the geographical regions observed, for example
the good agreement for detectors 70 to 80 may be due to the fact that these detectors
pass over the Sahara, i.e. the scene type which gave the best agreement in the previous
comparison. It is also possible that some of the structure is due to artefacts introduced
by the GERB instrument, this is being investigated further.
7. Science applications
a) Cloud radiative forcing
Clouds, cloud processes and the feedbacks associated with them, represent one
of the primary sources of uncertainty in predicting our future climate. One approach
to improve this situation is accurate quantification of the effects of cloud in the
21
current climate. Cloud radiative forcing, calculated as the difference in the energy
balance between clear sky and cloudy conditions, is a commonly used tool. Results
from ERBE enabled estimation of the global mean cooling effect of clouds to be
around 15 Wm-2 (Ramanathan et al. 1989), with substantial regional variations related
to differences in cloud type and large scale dynamics. The use of traditional monthly
mean cloud forcing data to study a particular cloud or dynamical regime, such as
tropical convection, is limited by averaging over all weather systems and cloud types
occurring during a month, however. In a comparison of the Pacific warm pool and
African/Atlantic tropical regions (Futyan et al. 2004), differences in monthly mean
behaviour could not be attributed to differences in convective cloud properties, as low
non-convective cloud was present on some days during the month in parts of the
African ‘convective’ region.
Combining high resolution ERB data from GERB with cloud classifications
based on co-registered SEVIRI data provides information on the radiative impacts of
cloud systems at timescales comparable to those on which they develop. By
averaging only observations for a particular cloud type or other condition, the
behaviour associated with different regimes occurring during a month can be
separated (Futyan et al., submitted manuscript 2005). This approach will enable
differences between regions to be more fully understood and provides valuable
additional information for the validation of climate and NWP models.
b) Aerosol radiative forcing
Quantifying both the direct and indirect impact of aerosols is one of the major
challenges facing climate scientists today. Uncertainties in concentrations and the
radiative and chemical properties of the various aerosol types hinder estimates of both
effects. In addition, their relatively short lifetimes and complex geographical
22
distributions put stringent requirements on the sampling rate and coverage required to
monitor their presence effectively.
The combination of GERB and SEVIRI on Meteosat-8 provides a powerful
tool for detecting aerosols and estimating their radiative effect at high temporal and
spatial resolution. Although climatologies of aerosol properties do exist for the area
viewed by the satellite, these are based on data from polar orbiting platforms and
hence suffer from poor diurnal sampling. GERB and SEVIRI data will provide the
first opportunity to measure the effect that short-term aerosol variability has on the
Earth’s radiation budget over the Meteosat-8 field of view. The rapidity of
observations should also permit investigations into the impact of aerosol on cloud
development and radiative properties.
According to the 2001 Intergovernmental Panel on Climate Change report
(Houghton et al. 2001), the largest uncertainties in aerosol direct radiative forcing are
associated with mineral dust. On a global scale, the Sahara is the most important
source of desert dust (Washington et al. 2003). A methodology for detecting dust
aerosol using SEVIRI LW channels is being developed at Imperial College (Brindley,
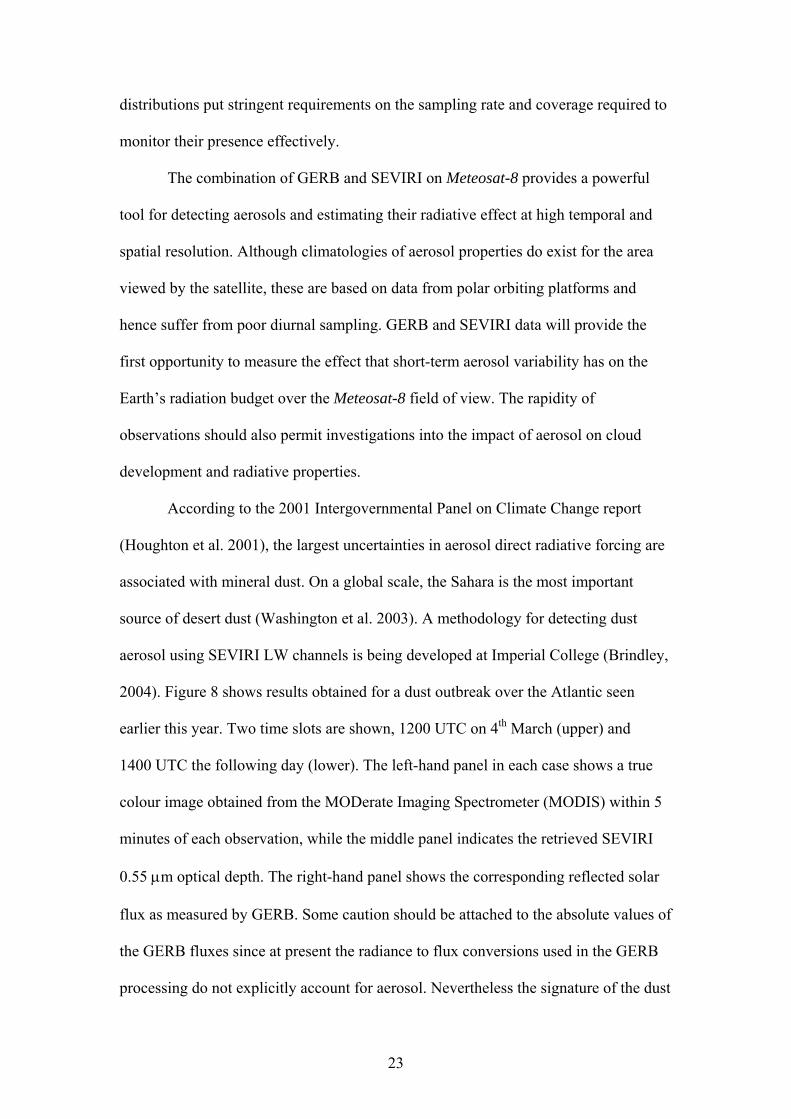
2004). Figure 8 shows results obtained for a dust outbreak over the Atlantic seen
earlier this year. Two time slots are shown, 1200 UTC on 4th March (upper) and
1400 UTC the following day (lower). The left-hand panel in each case shows a true
colour image obtained from the MODerate Imaging Spectrometer (MODIS) within 5
minutes of each observation, while the middle panel indicates the retrieved SEVIRI
0.55 µm optical depth. The right-hand panel shows the corresponding reflected solar
flux as measured by GERB. Some caution should be attached to the absolute values of
the GERB fluxes since at present the radiance to flux conversions used in the GERB
processing do not explicitly account for aerosol. Nevertheless the signature of the dust
23

plume is apparent in the observations, and the potential for improving radiative
forcing estimates is clear. A separate algorithm using the visible and near-infrared
SEVIRI channels is currently under development and will be employed both as a
check on the LW methodology for dust detection, and, in concert with the GERB
observations, to evaluate the impact of other aerosol types, such as those produced as
a result of biomass burning, on the radiation budget.
c) Diurnal effects
A major source of uncertainty in the estimation of even monthly average ERB
quantities is the limited temporal sampling possible from low earth orbiting satellites.
Even under clear-sky conditions, models have to account for the diurnal variations of
albedo and outgoing LW radiation (OLR) associated with changing solar zenith angle
and surface temperatures through the day. In cloudy conditions, accounting for the
often coherent diurnal variations in meteorology is even more challenging. For
existing ERB datasets a range of assumptions have been made (Young et al. 1998),
introducing uncertainty in the mean flux estimates. GERB’s unique ability to fully
resolve these diurnal variations removes the need for such assumptions, at least in the
all-sky case.
GERB monthly average flux products (planned for future release) will
therefore be the most accurate and least model-dependant diurnally averaged fluxes
available. A monthly mean diurnal cycle product will also provide unique
information on the coherent diurnal variations found across the GERB field of view.
This information provides a valuable validation, and potential means of improvement,
of the models currently in use. Development of clear-sky interpolation algorithms
indicates the possibility of improvements to the half-sine model used for interpolation
24
of clear-sky LW fluxes over land in ERBE and CERES processing (Futyan and
Russell, submitted manuscript 2004).
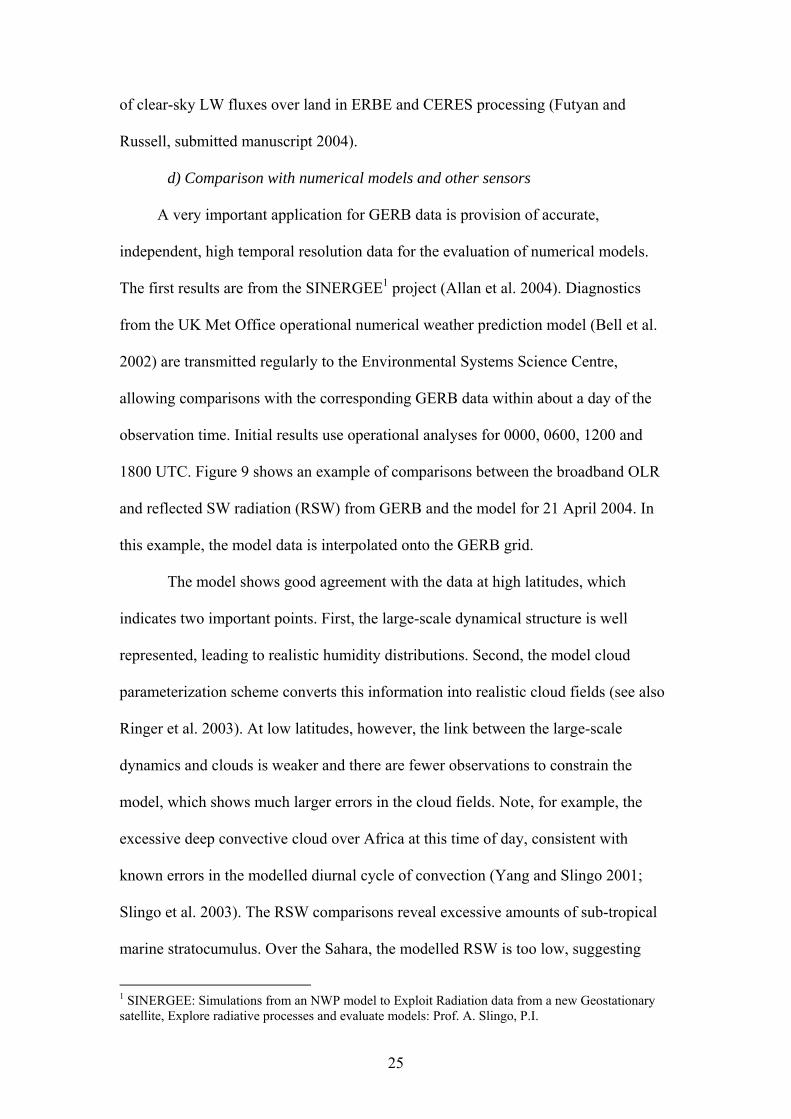
d) Comparison with numerical models and other sensors
A very important application for GERB data is provision of accurate,
independent, high temporal resolution data for the evaluation of numerical models.
The first results are from the SINERGEE1 project (Allan et al. 2004). Diagnostics
from the UK Met Office operational numerical weather prediction model (Bell et al.
2002) are transmitted regularly to the Environmental Systems Science Centre,
allowing comparisons with the corresponding GERB data within about a day of the
observation time. Initial results use operational analyses for 0000, 0600, 1200 and
1800 UTC. Figure 9 shows an example of comparisons between the broadband OLR
and reflected SW radiation (RSW) from GERB and the model for 21 April 2004. In
this example, the model data is interpolated onto the GERB grid.
The model shows good agreement with the data at high latitudes, which
indicates two important points. First, the large-scale dynamical structure is well
represented, leading to realistic humidity distributions. Second, the model cloud
parameterization scheme converts this information into realistic cloud fields (see also
Ringer et al. 2003). At low latitudes, however, the link between the large-scale
dynamics and clouds is weaker and there are fewer observations to constrain the
model, which shows much larger errors in the cloud fields. Note, for example, the
excessive deep convective cloud over Africa at this time of day, consistent with
known errors in the modelled diurnal cycle of convection (Yang and Slingo 2001;
Slingo et al. 2003). The RSW comparisons reveal excessive amounts of sub-tropical
marine stratocumulus. Over the Sahara, the modelled RSW is too low, suggesting
1 SINERGEE: Simulations from an NWP model to Exploit Radiation data from a new Geostationary satellite, Explore radiative processes and evaluate models: Prof. A. Slingo, P.I.
25
errors in the surface radiative properties. These results illustrate the potential of such
analyses for revealing systematic errors in the model. It is planned extend this analysis
to include model forecasts and comparisons with radiances from the SEVIRI imager.
Figure 10 shows a comparison of the monthly mean OLR from GERB with
earlier data for the July period (though in different years) from the Earth Radiation
Budget Experiment (Harrison et al. 1990), with the Scanning Radiation Budget sensor
(Kandel et al. 1998), and with simulations by version HadAM4 of the Hadley Centre
climate model (Pope et al. 2000; Webb et al. 2001). The GERB data do not cover the
whole of July 2003 as the instrument was turned off for some of this period,
nevertheless the results compare favourably with the earlier data and some of the
differences may be due to inter-annual variability. The model reproduces the broad
features of the observations, although some systematic model errors are also apparent,
such as the excessive emission in the sub-tropics, suggesting not enough cloud and/or
too dry an atmosphere.
e) Water vapour feedback
Atmospheric water vapour feedback (WVF) is a matter of some controversy.
The majority of studies (but not all) have concluded that this feedback process is
positive, increasing the warming initially caused by growth in greenhouse gases. For
example, Rind et al., (1991) found clear evidence of positive WVF using new
satellite-generated water vapour data to investigate this question, concluding that the
water vapour feedback is not overestimated in models. More recently, Soden et al.
(2002) used the natural experiment offered by the eruption of Mt Pinatubo to show
that the observed thermal and humidity responses to this eruption could not be
explained without a strong positive WVF. However, some authors, e.g. Lindzen
26
(1990), have argued in a variety of ways that the WVF can, at least in some
circumstances, act in a negative sense, to reduce an initial greenhouse gas warming.
Recently, Minschwaner and Dessler (2004) used satellite observations and models to
suggest that the fixed relative humidity assumption usually applied in models is not
valid, and that the WVF, though positive, is not as strong as in the models.
Since the OLR is sensitive to water vapour and to temperature, observations of
OLR by GERB and SEVIRI, plus measurements of water vapour and temperature
from polar orbiters will be used to study the WVF, by modelling the effect of
observed water and temperature profiles on the OLR and comparing these with
modelled and observed OLR. The high time resolution of GERB and SEVIRI will
allow study of the WVF variability.
7. Conclusions
The first GERB instrument has been in operation since December 2002 on
board the Meteosat-8 spacecraft, positioned over 3.5° W and the equator. Further
GERB instruments, funded by EUMETSAT, are being developed for the subsequent
series of Meteosat Second Generation spacecraft, with the second due for launch in
2005.
Considerable effort went into the unique design and pre-launch calibration of
this series of instruments to ensure the high stability and accuracy of the LW and SW
flux measurement required for climate and atmospheric processes research. An
overview of that design has been given here, and further details on different aspects of
the design and development of GERB will be published in subsequent papers.
Validation activities started in December 2002 and the results show the
instrument to be performing extremely well. Initial analyses show the instrument
27

performance in terms of function, calibration, scanning and synchronisation with the
spinning spacecraft, electronic and data systems, and most of all in the quality and
accuracy of the data produced, is excellent. The validation process will continue for
some time yet, as a deeper understanding of the instrument operation is developed. A
dedicated team of scientists and engineers are working to ensure that the best
scientific results will be obtained.
The paper has also presented examples of early scientific studies being
undertaken by the GERB team. While these studies are being used initially to validate
and calibrate these new data, they also demonstrate their potential to establish a wide
range of exciting new climate and process science. This is becoming possible with the
advent of this new observational tool in our array of instruments with which to study
how the Earth’s climate system works and how it is developing.
Acknowledgements
The members of the GERB International Science Team have made
considerable contributions to the successful development of this project at all stages,
and their activities and continued involvement are greatly appreciated. Many thanks
also to the NASA CERES team, whose generosity in sharing their experiences has
been most helpful: we value their continuing collaboration.
The UK design, development, building and testing of the first GERB
instrument was funded by the Natural Environment Research Council (NERC), with
grants to Imperial College, the Rutherford Appleton Laboratory and Leicester
University. NERC also funded the development of the Earth Observation
Characterisation Facility, a clean, high vacuum calibration facility at Imperial. The
28

team is deeply grateful for the support from NERC and its officials, especially Dr
Steven Briggs in its formative stages.
A.Slingo and R. P. Allan's contributions were funded by a joint NERC/Met
Office Connect-B grant. M. A. Ringer of the UK Met Office was funded by the UK
Department of Environment, Food and Rural Affairs under contract PECD 7/12/37
The telescope development at AMOS/OIP and part of the Belgian ground
segment development at RMIB was funded by the Belgian science policy office
through the PRODEX program. Engineers and scientists at Officine Gallileo, Italy,
made important contributions, funded by their government. Also, the UK National
Physical Laboratory provided equipment and expertise for the absolute calibration of
GERB.
Finally, the roles of EUMETSAT and ESA in the provision of flight space on
board Meteosat-8, assisting the GERB project during development, and in post-launch
operations have been crucial. EUMETSAT has provided funding for building and
operating GERB-2, -3 and –4.
29
References
Allan, R. P., A. Slingo, S. Milton and I. Culverwell, 2004: SINERGEE: simulation
and exploitation of data from Meteosat-8 using an NWP model. Proc., EUMETSAT
Meteorological Satellite Conf., Prague, Czech Republic, EUMETSAT, p. 121-129.
Allen, M. R., P. Stott, J. Mitchell, R. Schnur and T. Delworth, 2000: Quantifying the
uncertainty in forecasts of anthropogenic climate change. Nature, 407, 617-620.
Bell, S., S. Milton, C. Wilson and T. Davies, 2002: A new Unified Model. NWP
Gazette, June 2002, 3-7.
Brindley, H. E., 2004: Estimation of the radiative effects of aerosol using GERB and
SEVIRI. Proc. EUMETSAT Meteorological Satellite Conf., Prague, Czech Republic,
EUMETSAT, 512-517.
Charlson, R. J., S. E. Schwartz, J. M. Hales, R. D. Cess, J. A. Coakley, Jr., J. E.
Hansen, and D. J. Hoffman, 1992: Climate forcing by anthropogenic aerosols.
Science, 255, 423-430.
Clerbaux, N., S. Dewitte, L. Gonzalez, C. Bertrand, B. Nicula, A. Ipe, 2003: Outgoing
longwave flux estimation: improvement of angular modelling using spectral
information. Remote Sens. Environ., 85, 389-395.
Futyan, J. M., J. E. Russell, and J. E. Harries, 2004: Cloud Radiative Forcing in
Pacific, African and Atlantic Tropical Convective Regions. J. Climate, 17, 3192-
3202.
Futyan, J. M. and J. E. Russell, 2005: Developing clear sky flux products for the
Geostationary Earth Radiation Budget (GERB) experiment, submitted to J. Appl.
Meteor.
30
Gonzalez, L., A. Hermans, S. Dewitte, A. Ipe, G. Sadowski, N. Clerbaux, 2000:
Resolution enhancement of GERB data. Proc. EUMETSAT Meteorological Satellite
Data User's Conf., Bologna, Italy, EUMETSAT, 619-625.
Gueymard, C. A., 2004: The sun's total and spectral irradiance for solar energy
applications and solar radiation models. Solar Energy, 76 (4), 423-453.
Harries, J. E. and D. Crommelynck, 1999: The Geostationary Earth Radiation Budget
experiment on MSG-1 and its potential application. Adv. in Space Res., 24, 915-919.
Harries, J. E., Atmospheric radiation and atmospheric humidity, 1997: Quart. J. Roy.
Meteor. Soc., 123, 2173-2186.
Harrison, E. F., P. Minnis, B. R. Barkstrom, V. Ramanathan, R. D. Cess, and G. G.
Gibson, 1990: Seasonal variation of cloud radiative forcing derived from the Earth
Radiation Budget Experiment. J. Geophys. Res., 95, 18687-18703.
Houghton, J.T., Y. Ding, D.J. Griggs, M. Noguer, P.J. van der Linden, X. Dai, K.
Makskell, and C.A. Johnson, Climate Change 2001: The Scientific Basis,
Contribution of Working Group I to the Third Assessment Report of the
Intergovernmental Panel on Climate Change, 2001. Cambridge University Press.
Ipe, A., N. Clerbaux, C. Bertrand, S. Dewitte, L. Gonzalez, 2003: Pixel-scale
composite top-of-the-atmosphere clear-sky reflectances for Meteosat-7 visible data. J.
Geophys. Res., 108 (D19), 4612, doi:10.1029/2002JD002771.
Ipe A., C. Bertrand, N. Clerbaux, S. Dewitte, L. Gonzalez, 2004: Validation and
homogenisation of cloud optical depth and cloud fraction retrievals for
GERB/SEVIRI scene identification using Meteosat-7 data. Atmospheric Research, 72,
17-37.
31
Kandel, R., M. Viollier, P. Raberanto, J.-P. Duvel, L. A. Pakhomov, V. A. Golovko,
A. P. Trishchenko, J. Mueller, E. Raschke, R. Stuhlmann, and the International
ScaRaB Scientific Working group (ISSWG), 1998: The ScaRaB Earth radiation
budget dataset. Bull. Amer. Meteor. Soc., 79, 765-783.
Key, J., and A. J. Schweiger, 1998: Tools for atmospheric radiative transfer: Streamer
and Fluxnet. Computers & Geosciences, 24, 443-451.
Lindzen R. S., 1990: Some coolness concerning global warming. Bull. of the Amer.
Meteor. Soc., 71, 288-299.
Loeb, N.G., N. M. Smith, S. Kato, W. F. Miller, S. K. Gupta, P. Minnis and B. A.
Wielicki, 2003: Angular distribution models for top-of-atmosphere radiative flux
estimation from the Clouds and the Earth's Radiant Energy System instrument on the
Tropical Rainfall Measuring Mission Satellite. Part I: Methodology. J. Appl. Meteor.,
42, 240-265.
Minschwaner K. and A. E. Dessler, 2004: Water vapor feedback in the tropical upper
troposphere: Model results and observations, J. Climate, 17, 1272-1282.
Mossavati, R., J. E. Harries, S. Kellock, R. T. Wrigley, J. Mueller, and N. P. Fox,
1998: Radiometric calibration of the GERB instrument. Metrologia, 35(4), 603-607.
Munro R., A. Ratier, J. Schmetz, D. Klaes, 2002: Atmospheric measurements from
the MSG and EPS systems. Adv. in Space Res., 29 (11), 1609-1618.
Nakajima, T., and M. D. King, 1990: Determination of the optical thickness and
effective particle radius of clouds from reflected solar radiation measurements. Part I:
Theory. J. Atmos. Sci., 47(15), 1878-1893.
32
Pope, V. D., M. Gallani, P. R. Rowntree, and R. A. Stratton, 2000: The impact of new
physical parametrizations in the Hadley Centre climate model - HadAM3. Climate
Dyn., 16, 123-146.
Ramanthan, V., R. D. Cess, E. F. Harrison, P. Minnis, B. R. Barkstrom, E. Ahmad,
and D. Hartmann, 1989: Cloud-Radiative Forcing and Climate: Results from the Earth
Radiation Budget Experiment. Science, 243, 57-62.
Rind D., E. W. Chiou, W. Chu, J. Larsen, S. Oltmans, J. Lerner, M. P. McCormick, L.
McMaster, 1991: Positive water-vapor feedback in climate models confirmed by
satellite data. Nature, 349, 500-503.
Ringer, M. A., J. M. Edwards and A. Slingo, 2003. Simulation of satellite channel
radiances in the Met Office Unified Model, Quart. J. Roy. Meteor. Soc., 129,1169-
1190.
Sandford, M. C. W., P. M. Allan, M. E. Caldwell, J. Delderfield, M. B. Oliver, E.
Sawyer, J. E. Harries, J. Ashmall, H. Brindley, S. Kellock, R. Mossavati, R. Wrigley,
D. Llewellyn-Jones, O. Blake, G. Butcher, R. Cole, N. Nelms, S. DeWitte, P.
Gloesener, F. Fabbrizzi, 2003: The geostationary Earth radiation budget (GERB)
instrument on EUMETSAT’s MSG satellite. Acta Astronautica, 53 (11), 909-915.
Schmetz. J. P. Pili, S. Tjemkes, D. Just, J. Kerkmann, S. Rota, A. Ratier, 2002: An
introduction to Meteosat Second Generation (MSG). Bull. Amer. Meteor. Soc., 83 (7),
977-994.
Senior, C. A. and J. F. B. Mitchell, 1993: CO2 and climate: the impact of cloud
parameterisation. J. Climate, 6, 393-418.
33

Slingo, A., K. I. Hodges, and G. J. Robinson, 2004: Simulation of the diurnal cycle in
a climate model and its evaluation using data from Meteosat 7. Quart. J. Roy. Meteor.
Soc., 130, 1449-1467.
Smith, G. L., Z. P. Szewczyk, P. E. Mlynczak, R. B. Lee III, B. A. Wielicki, K. J.
Priestley, J. E. Harries, S. Dewitt and N. Clerbaux, 2003: Method for comparison of
GERB and CERES radiances, Proc. 10th Int. Symp. Remote Sensing, Barcelona,
Spain, Soc. Photo-Optical Instrumentation Engineers, 5234.
Stott, P. A., S. F. Tett, G. S. Jones, M. R. Allen, J. F. Mitchell, G. J. Jenkins, 2000:
External control of 20th century temperature by natural and anthropogenic forcings.
Science, 290, 2133-2137.
Soden B. J., R. T. Wetherald, G. L. Stenchikov, A. Robock, 2002: Global cooling
after the eruption of Mount Pinatubo: A test of climate feedback by water vapor.
Science, 296, 727-730.
Washington R., M. Todd, N. J. Middleton and A. S. Goudie, 2003: Dust-storm source
areas determined by the Total Ozone Monitoring Spectrometer and surface
observations, Annals of the Association of American Geographers, 93(2), 297-313.
Webb, M. J., C. A. Senior, S. Bony, and J.-J. Morcrette, 2001: Combining ERBE and
ISCCP data to assess clouds in the Hadley Centre, ECMWF and LMD atmospheric
models. Climate Dyn., 17, 905-922.
Wielicki, B. A., T. M. Wong, R. P. Allan, A. Slingo, J. T. Kiehl, B. J. Soden, C. T.
Gordon, A. J. Miller, S. K. Yang, D. A. Randall, F. Robertson, J. Susskind and H.
Jacobowitz, 2002: Evidence for large decadal variability in the tropical mean radiative
energy budget. Science, 295, 841-844.
34

Yang, G.-Y. and J.M. Slingo, 2001: The diurnal cycle in the tropics. Mon. Wea. Rev.
129, 784-801.
Young, D. F., P. Minnis, D. R. Doelling, G. G. Gibson, and T.Wong, 1998: Temporal
Interpolation Methods for the Clouds and the Earth’s Radiant Energy System
(CERES) Experiment. J. Appl. Meteor., 37, 572–590.
35
LIST OF ACRONYMS
BB BlackBody
CERES Clouds and the Earth’s Radiant Energy System
CM Calibration Monitor
ERB Earth Radiation Budget
EUMETSAT European Organisation for Exploitation of Meteorological Satellites
FOV Field of view
GERB Geostationary Earth Radiation Budget
GGSPS GERB Ground Segment Processing System
LW Long-wave
MODIS Moderate Resolution Imaging Spectrometer
MSG Meteosat Second Generation
NERC Natural Environment Research Council
NRT Near real-time
OLR Outgoing longwave radiation
PSF Point spread function
RAL Rutherford Appleton Laboratory
RMIB Royal Meteorological Institute of Belgium
RSW Reflected shortwave radiation
SEVIRI Scanning Enhanced Visible and InfraRed Imager
SINERGEE Simulations from an NWP model to Exploit Radiation data from a
Geostationary satellite, Explore radiative processes and evaluate
models
SOL Start of Line
SW Shortwave
36

TOA Top of atmosphere
WVF Water vapour feedback
37
Table Captions
Table 1. Suppliers and manufacturers of instrument components
Table 2. GERB design specifications
Table 3. Primary scientific data products available from the GERB Ground Segment
Processing System (GGSPS) at RAL and the RMIB Online Short-term Services
(ROLSS). All products are in Hierarchical Data Format and include geolocation
information. Data products at Level 2 BARG and above are corrected for the
instrument PSF, giving ‘exact’ 50km resolution.
38
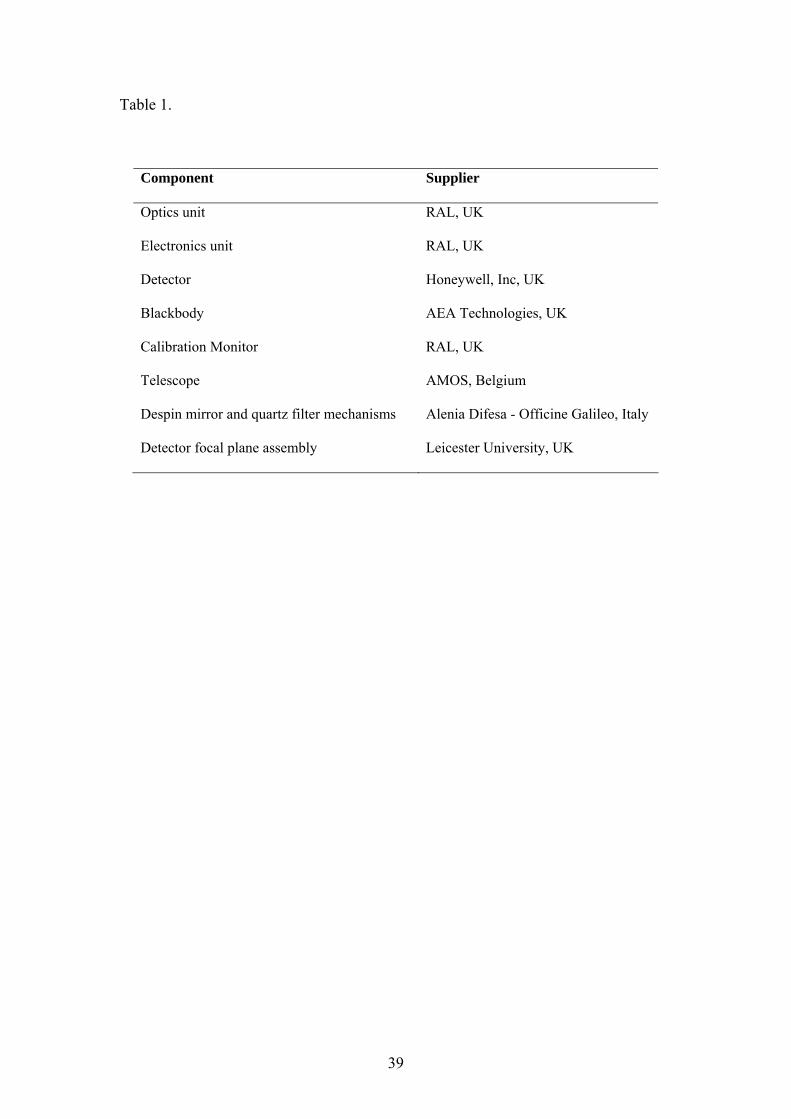
Table 1.
Component Supplier
Optics unit RAL, UK
Electronics unit RAL, UK
Detector Honeywell, Inc, UK
Blackbody AEA Technologies, UK
Calibration Monitor RAL, UK
Telescope AMOS, Belgium
Despin mirror and quartz filter mechanisms Alenia Difesa - Officine Galileo, Italy
Detector focal plane assembly Leicester University, UK
39

Table 2.
WAVEBANDS Total: 0.32 µm ->100.0 µm
Shortwave, SW: 0.32 µm - 4.0 µm
Longwave, LW (by subtraction): 4.0 µm ->100.0 µm
RADIOMETRY SW LW
Absolute Accuracy: < 1.0 % < 1.0 %
Signal/Noise: 1250 400
Dynamic Range: 0-380 W m-2 sr-1 0-90 W m-2 sr-1
SPATIAL SAMPLING 44.6 km (N-S) X 39.3 km (E-W) at nadir
TEMPORAL SAMPLING 15 minute SW and LW fluxes
CYCLE TIME Full Earth disc, both channels in 6 minutes
CO-REGISTRATION Spatial: 3 km wrt SEVIRI at satellite sub-point
Temporal: Within 15 min of SEVIRI at each pixel
INSTRUMENT MASS 25 kg
POWER 35 W
DIMENSIONS 0.45 m x 0.2m X 0.2m
40
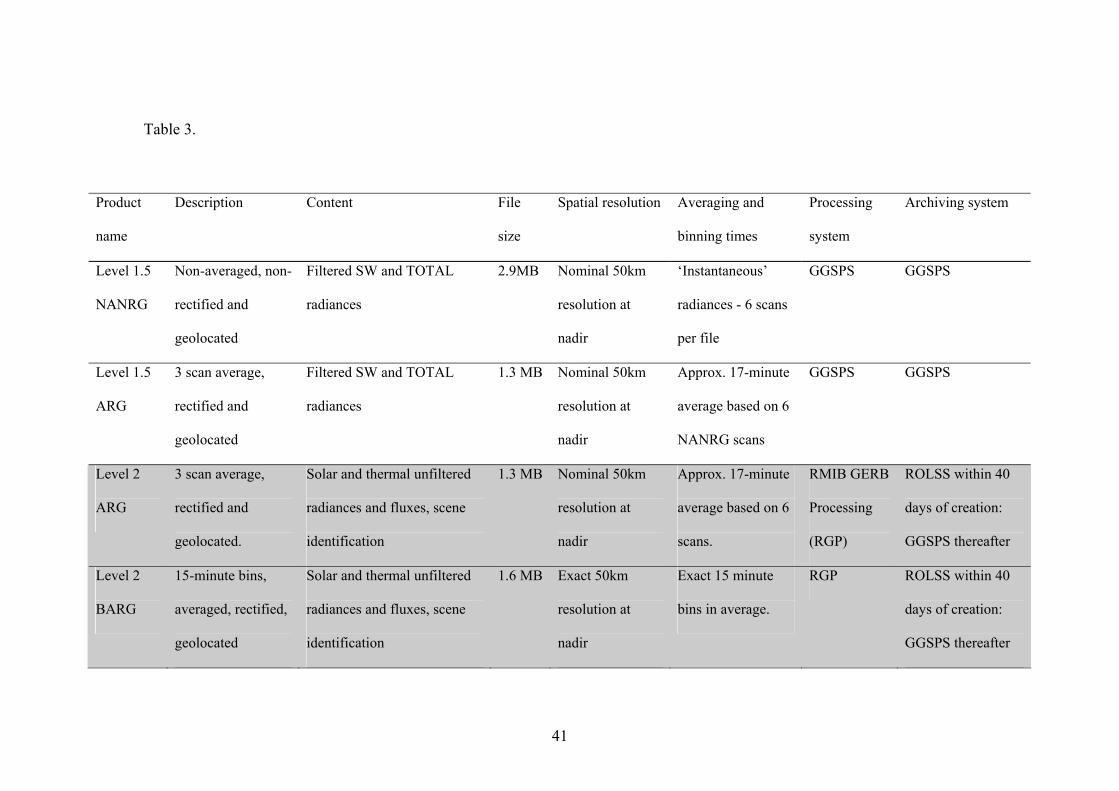
Table 3.
Product
name
Description Content File
size
Spatial resolution Averaging and
binning times
Processing
system
Archiving system
Level 1.5
NANRG
Non-averaged, non-
rectified and
geolocated
Filtered SW and TOTAL
radiances
2.9MB Nominal 50km
resolution at
nadir
‘Instantaneous’
radiances - 6 scans
per file
GGSPS GGSPS
Level 1.5
ARG
3 scan average,
rectified and
geolocated
Filtered SW and TOTAL
radiances
1.3 MB Nominal 50km
resolution at
nadir
Approx. 17-minute
average based on 6
NANRG scans
GGSPS GGSPS
Level 2
ARG
3 scan average,
rectified and
geolocated.
Solar and thermal unfiltered
radiances and fluxes, scene
identification
1.3 MB Nominal 50km
resolution at
nadir
Approx. 17-minute
average based on 6
scans.
RMIB GERB
Processing
(RGP)
ROLSS within 40
days of creation:
GGSPS thereafter
Level 2
BARG
15-minute bins,
averaged, rectified,
geolocated
Solar and thermal unfiltered
radiances and fluxes, scene
identification
1.6 MB Exact 50km
resolution at
nadir
Exact 15 minute
bins in average.
RGP ROLSS within 40
days of creation:
GGSPS thereafter
41
Level 2
SHI
Snapshot high-
resolution image
Solar and thermal unfiltered
radiances and fluxes, scene
identification
37 MB 3 X 3 SEVIRI
pixel resolution
15-minute
snapshot, at
SEVIRI times.
RGP ROLSS within 40
days of creation: no
long-term archive
Level 2
Monthly
means
Monthly average,
rectified,
geolocated
Solar and thermal clear and
all sky fluxes
Exact 50km
resolution at
nadir
Averages over one
calendar month
GGSPS GGSPS
Level 2
Binned
monthly
means
15-minute binned
monthly average,
rectified,
geolocated
Solar and thermal clear and
all sky fluxes
Exact 50km
resolution at
nadir
Exact 15 minute
bins over one
calendar month in
average.
GGSPS GGSPS
42

Figure Captions
Figure 1. Photograph of a GERB optics unit, showing the reflective outer coating, the
Earth-viewing port in the centre and the SW calibration monitor port to the left.
Figure 2. Layout of the GERB optics unit, as seen from above. Input from the Earth-
viewing port, calibration monitor and blackbody is directed towards the detector array
via the de-spin mirror and telescope optics. Rotating the quartz filter into the path of
the beam prevents LW radiation (with wavelength > 4 µm) from reaching the
detector.
Figure 3. Near real time data flow between the satellite platform, ground station and
processing systems at the Rutherford Appleton Laboratory, UK and the Royal
Meteorological Institute of Belgium.
Figure 4 Summary of data processing from Level 0 telemetry data to Level 2 fluxes,
showing processing steps and auxiliary data required at each step.
Figure 5. Correlation coefficient between LW input signal and instrument response, as
measured during pre-flight calibration, showing high degree of linearity.
Figure 6. GERB first light images from December 12th 2002 in TOTAL (left) and SW
(right) channels. Cloud and weather systems and the underlying land and ocean
surfaces are clearly visible in the illuminated part of the SW image. Western North
Africa is visible under the terminator and eastern south America at the left hand side
of the disc. The features visible in the illuminated part of the TOTAL channel image
43
are very similar to the SW channel, but with less contrast due to the addition of the
LW signal. The signal in the night-time part of the TOTAL channel is due to
broadband LW radiation, and is dominated by the thermal emission from atmospheric
water vapour.
Figure 7. Results of SW radiance comparison for GERB and CERES data co-located
in time and space and matched for viewing geometry obtained during northern
hemisphere 2003 winter solstice (black) and 2004 summer solstice (red)
intercomparison campaigns. Panel (a) shows the number of points matched for each of
the GERB detectors. Panel (b) shows the average GERB (solid line) and CERES
(dashed line) observed for each of the GERB pixels. Panel (c) shows the mean
GERB/CERES SW radiance ratio for each of the GERB detectors.
Figure 8. Saharan dust outbreak over the Atlantic Ocean as seen at 1155 UTC,
04/03/04 (upper), and 1405 UTC, 05/03/04 (lower). Panels (a) and (d) are true colour
MODIS images from the TERRA and AQUA satellites respectively. Panels (b) and
(e) illustrate the retrieved 0.55 µm aerosol optical depth from SEVIRI for the nearest
available time-slot. Panels (c) and (f) show the corresponding GERB reflected TOA
shortwave flux.
Figure 9. Outgoing longwave radiation (upper) and shortwave reflected radiation
(lower) for the UK Met Office numerical weather prediction model (left) and GERB
(right) for 1200 UTC, 21 April 2004.
44

Figure 10. Monthly mean outgoing longwave radiation (OLR) for July (different
years) from GERB, the Earth Radiation Budget Experiment, Scanning Radiation
Budget sensor and simulations by the Hadley Centre climate model, HadAM4.
45
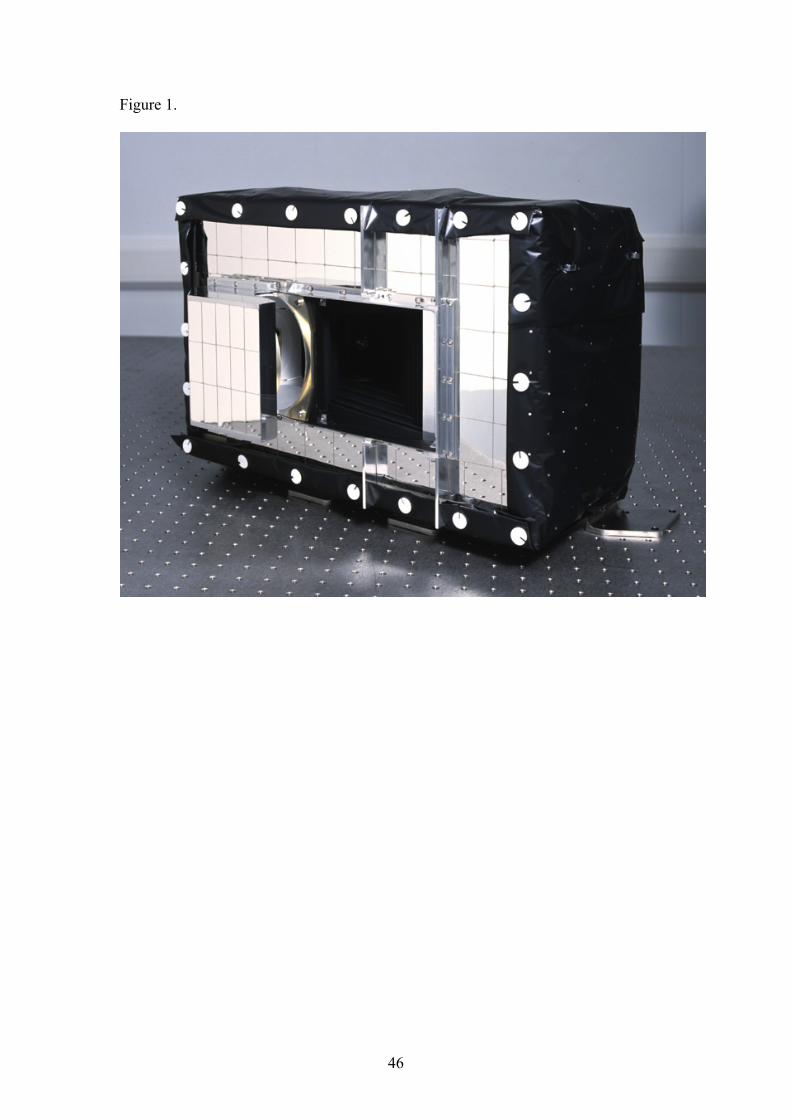
Figure 1.
46
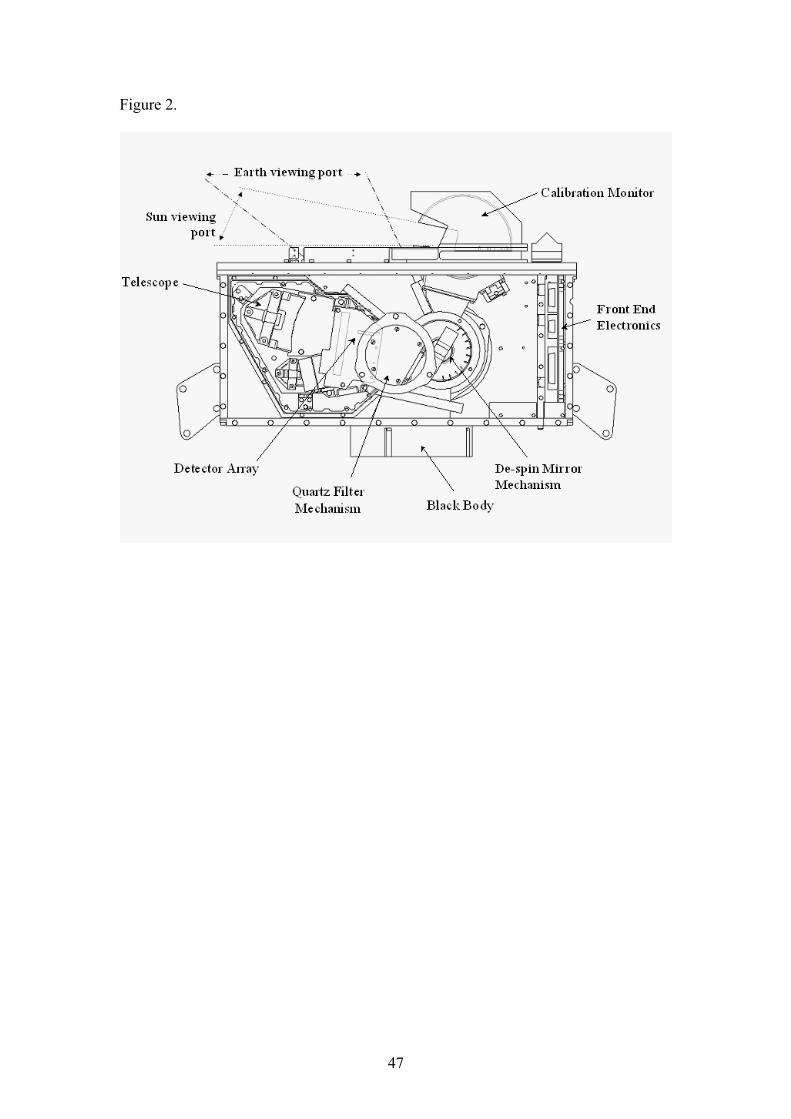
Figure 2.
47
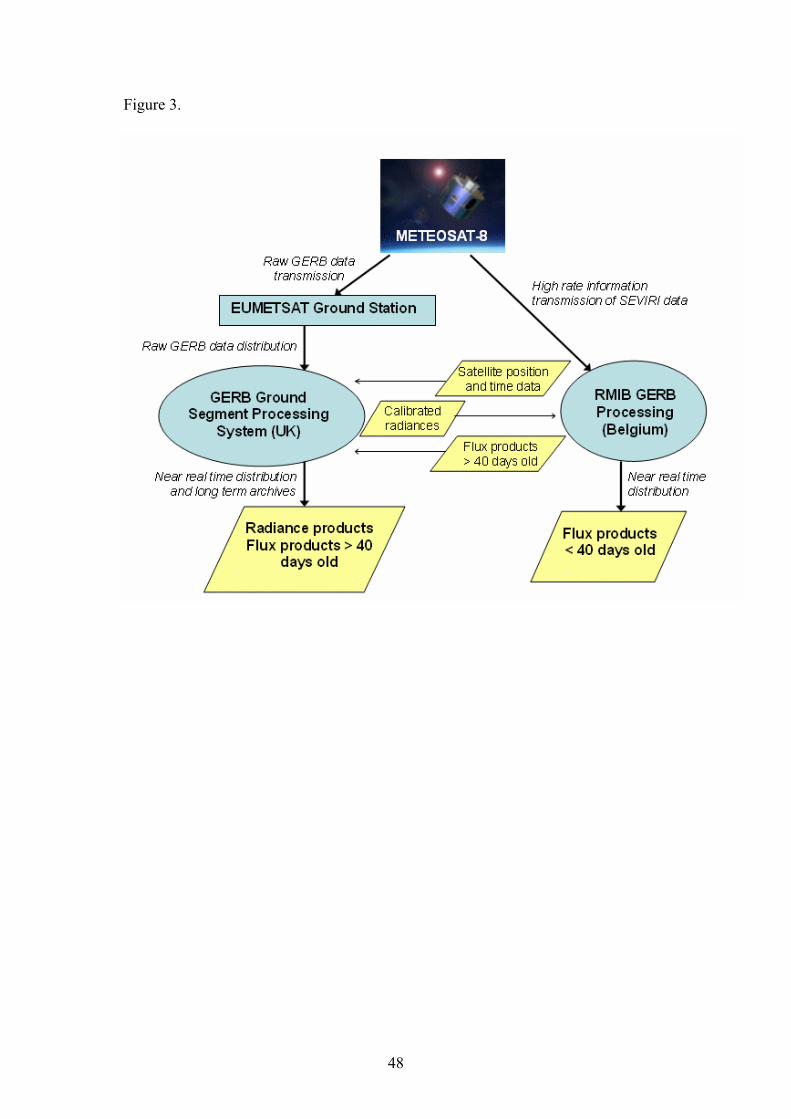
Figure 3.
48
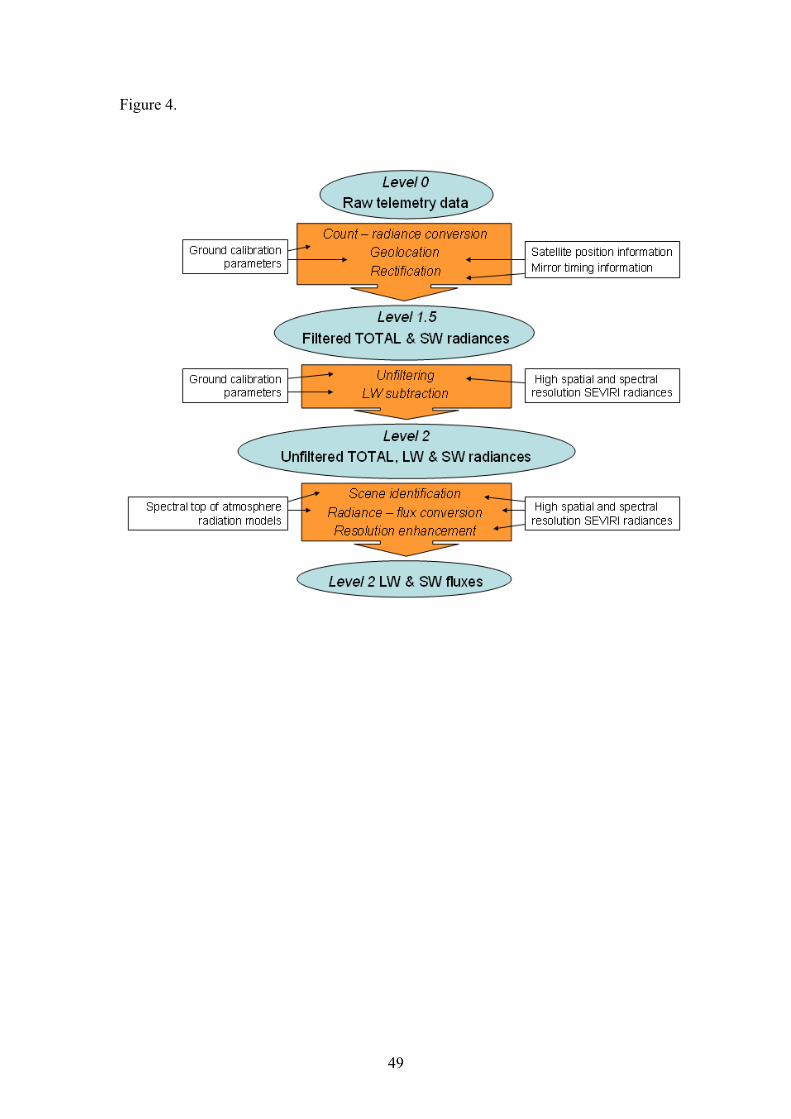
Figure 4.
49
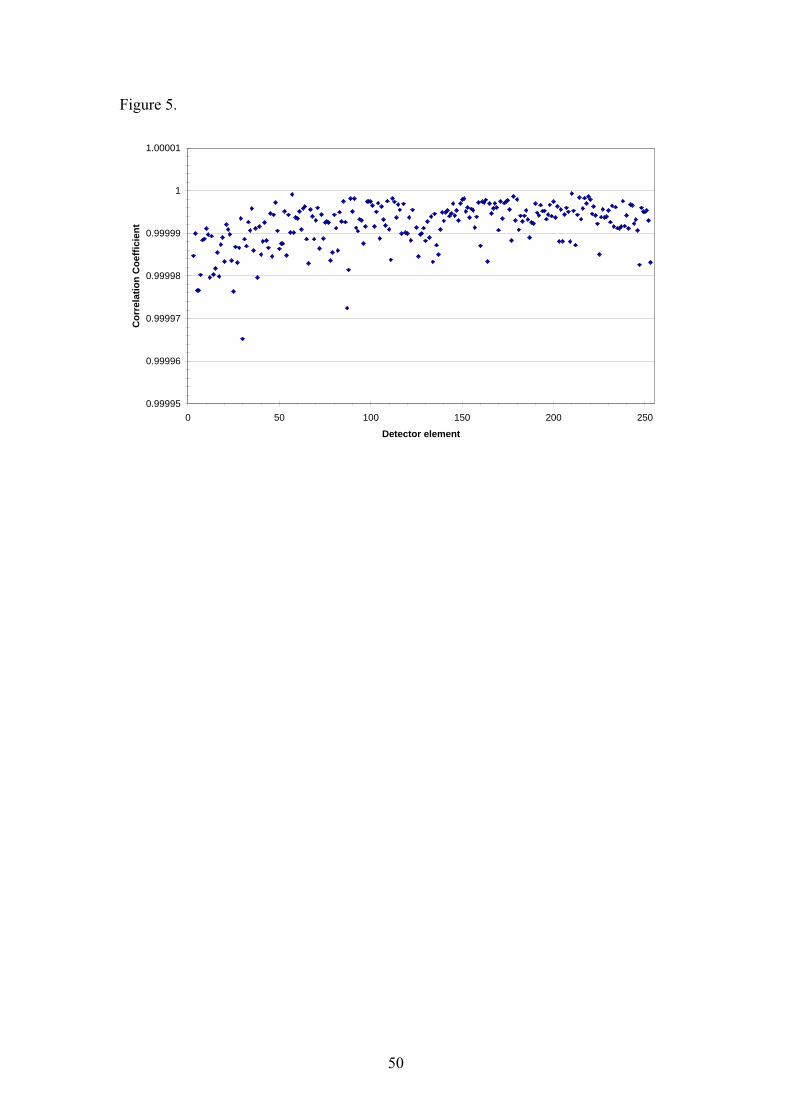
Figure 5.
0.99995
0.99996
0.99997
0.99998
0.99999
1
1.00001
0 50 100 150 200 250
Detector element
Cor
rela
tion
Coe
ffici
ent
50
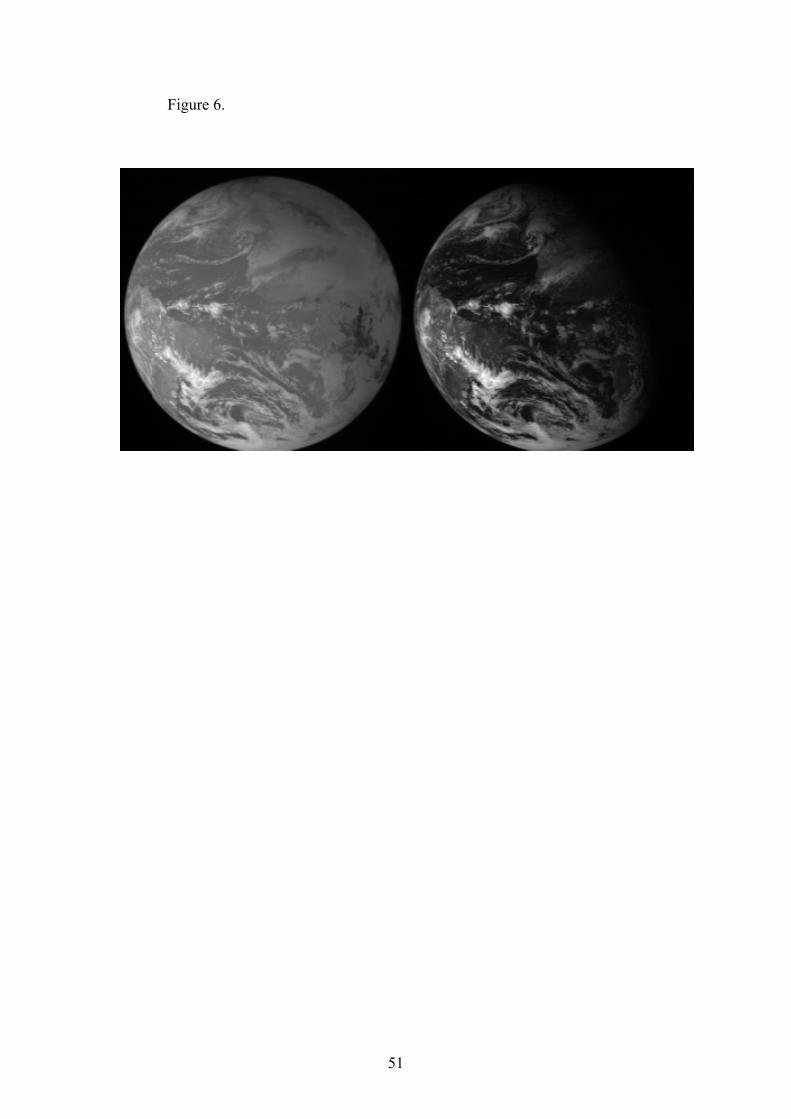
Figure 6.
51

Figure 7.
52
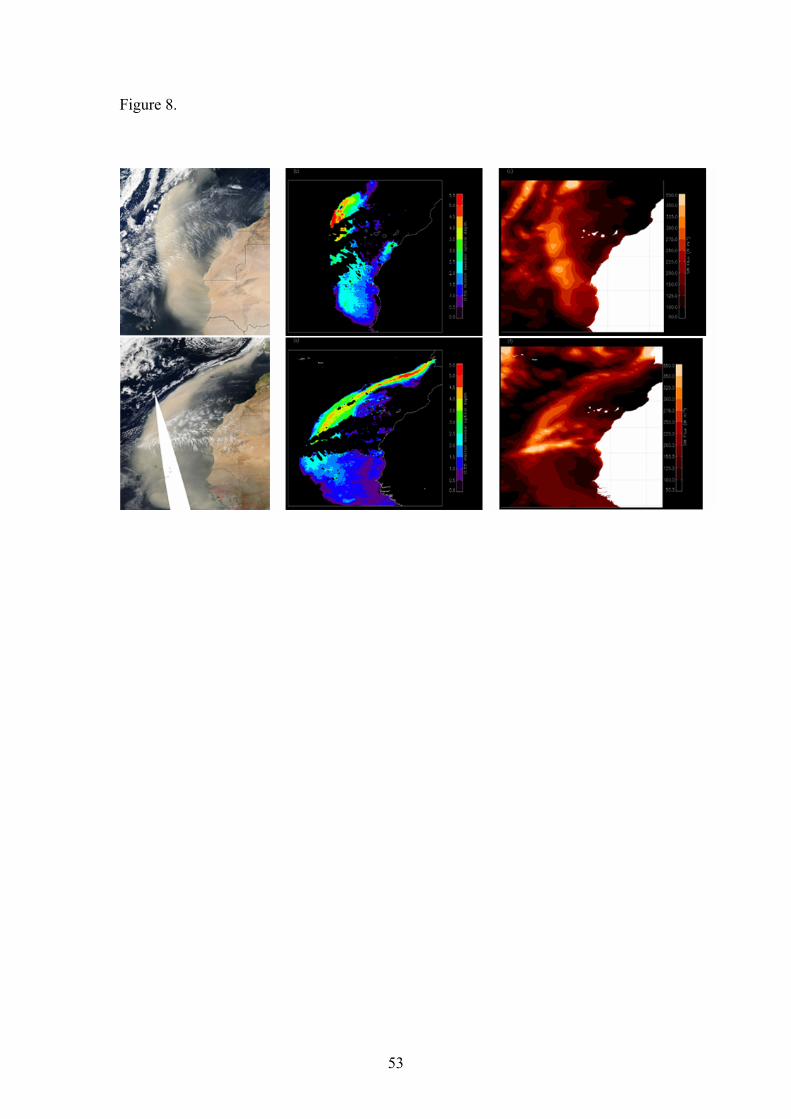
Figure 8.
53

Figure 9.
54

Figure 10.
55
Related Documents