The Geography of Urban Intelligence PETER NIJKAMP in cooperation with Karima Kourtit Tinbergen Institute, Amsterdam, The Netherlands KTH Royal Institute of Technology, Stockholm, Sweden Adam Mickiewicz University, Poznan, Poland

Welcome message from author
This document is posted to help you gain knowledge. Please leave a comment to let me know what you think about it! Share it to your friends and learn new things together.
Transcript
The Geography of Urban Intelligence
PETER NIJKAMP
in cooperation with
Karima Kourtit
Tinbergen Institute, Amsterdam, The NetherlandsKTH Royal Institute of Technology, Stockholm, Sweden
Adam Mickiewicz University, Poznan, Poland
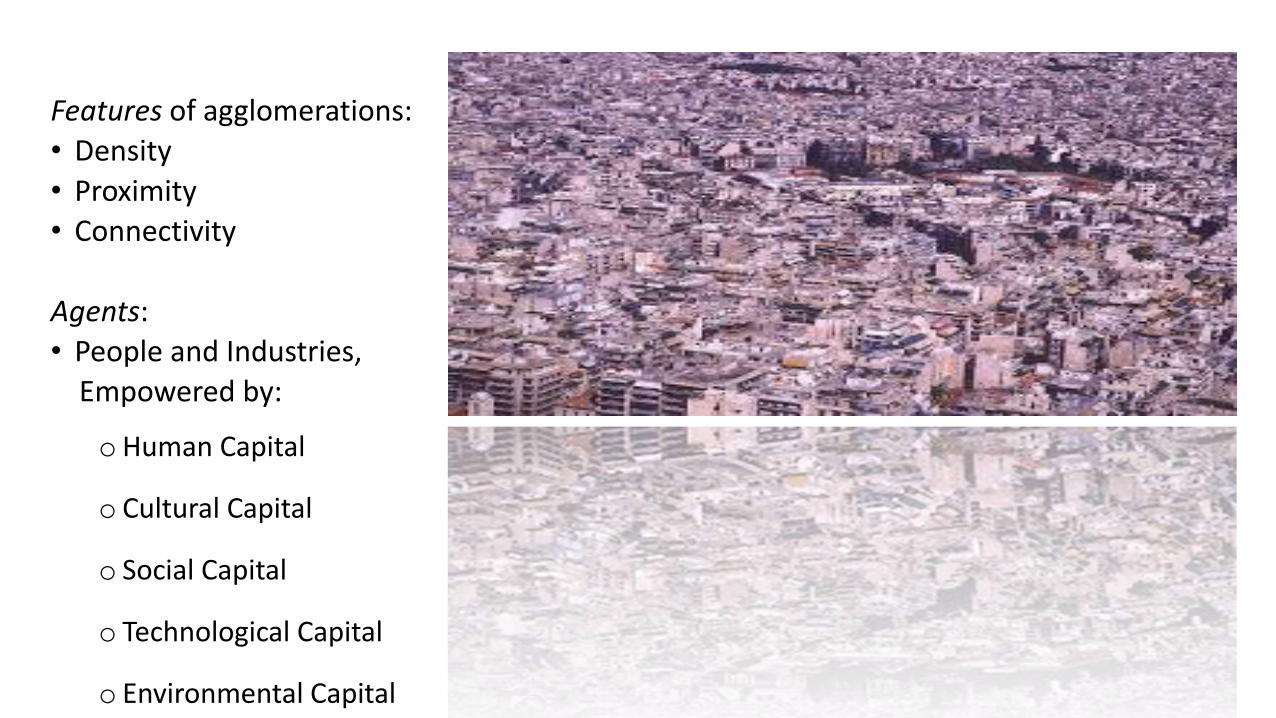
Features of agglomerations:
• Density
• Proximity
• Connectivity
Agents:
• People and Industries,
Empowered by:
oHuman Capital
o Cultural Capital
o Social Capital
o Technological Capital
o Environmental Capital

Motto:“interaction (often involuntary) among economic agents made possible by the lesser amount of spatial frictions that occur in concentrated location” (Capello)
Categories:MARJacobsPorter
Aim: to present a panorama on:
The Geography of Creative Industries and Cultural Heritage
THE GEOGRAPHY OF CREATIVE
INDUSTRIES AND CULTURAL HERITAGE
PETER NIJKAMP
in cooperation with
Karima Kourtit
Tinbergen Institute, Amsterdam, The NetherlandsKTH Royal Institute of Technology, Stockholm, Sweden
Adam Mickiewicz University, Poznan, Poland
AIM
To investigate the presence of creative industries in theNetherlands in relation to the presence of culturalheritage
• to analyze shares of the creative sectors and the growth rates of these shares in the national economy and in the largest cities
• to analyze its relationships with cultural heritage
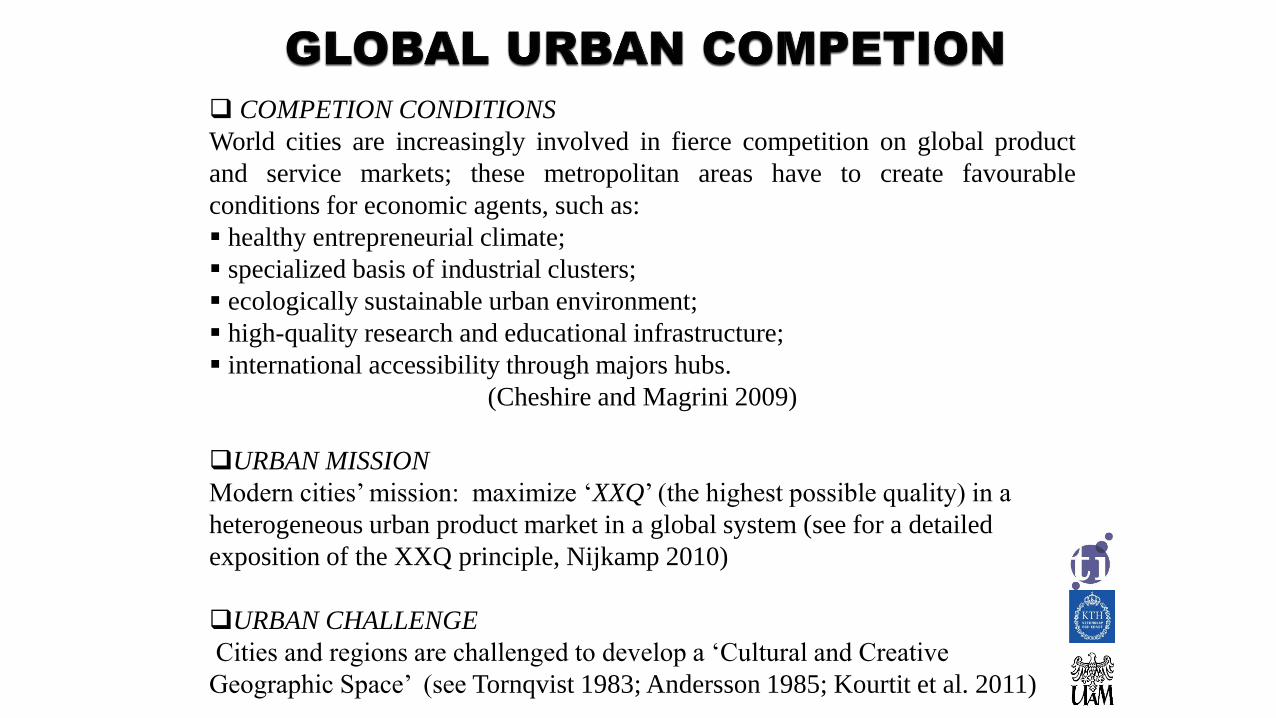
COMPETION CONDITIONS
World cities are increasingly involved in fierce competition on global product
and service markets; these metropolitan areas have to create favourable
conditions for economic agents, such as:
healthy entrepreneurial climate;
specialized basis of industrial clusters;
ecologically sustainable urban environment;
high-quality research and educational infrastructure;
international accessibility through majors hubs.
(Cheshire and Magrini 2009)
URBAN MISSION
Modern cities’ mission: maximize ‘XXQ’ (the highest possible quality) in a
heterogeneous urban product market in a global system (see for a detailed
exposition of the XXQ principle, Nijkamp 2010)
URBAN CHALLENGE
Cities and regions are challenged to develop a ‘Cultural and Creative
Geographic Space’ (see Tornqvist 1983; Andersson 1985; Kourtit et al. 2011)
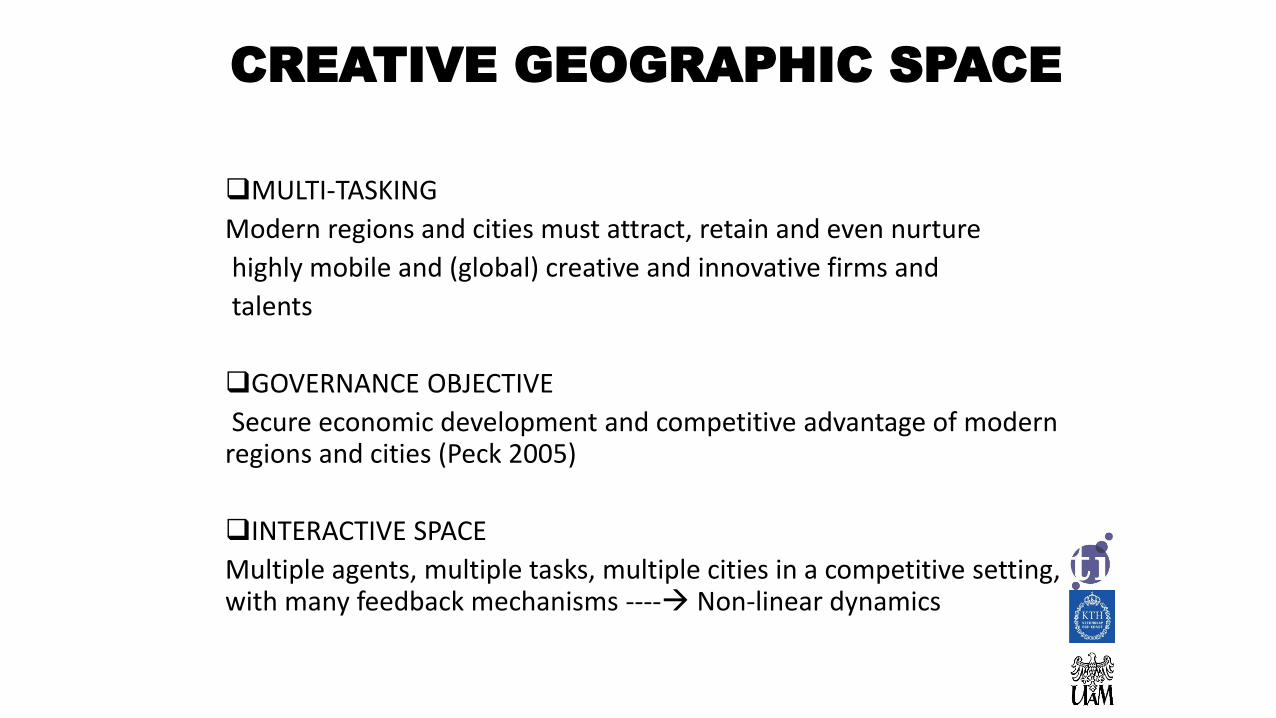
CREATIVE GEOGRAPHIC SPACE
MULTI-TASKING
Modern regions and cities must attract, retain and even nurture
highly mobile and (global) creative and innovative firms and
talents
GOVERNANCE OBJECTIVE
Secure economic development and competitive advantage of modern regions and cities (Peck 2005)
INTERACTIVE SPACE
Multiple agents, multiple tasks, multiple cities in a competitive setting, with many feedback mechanisms ---- Non-linear dynamics
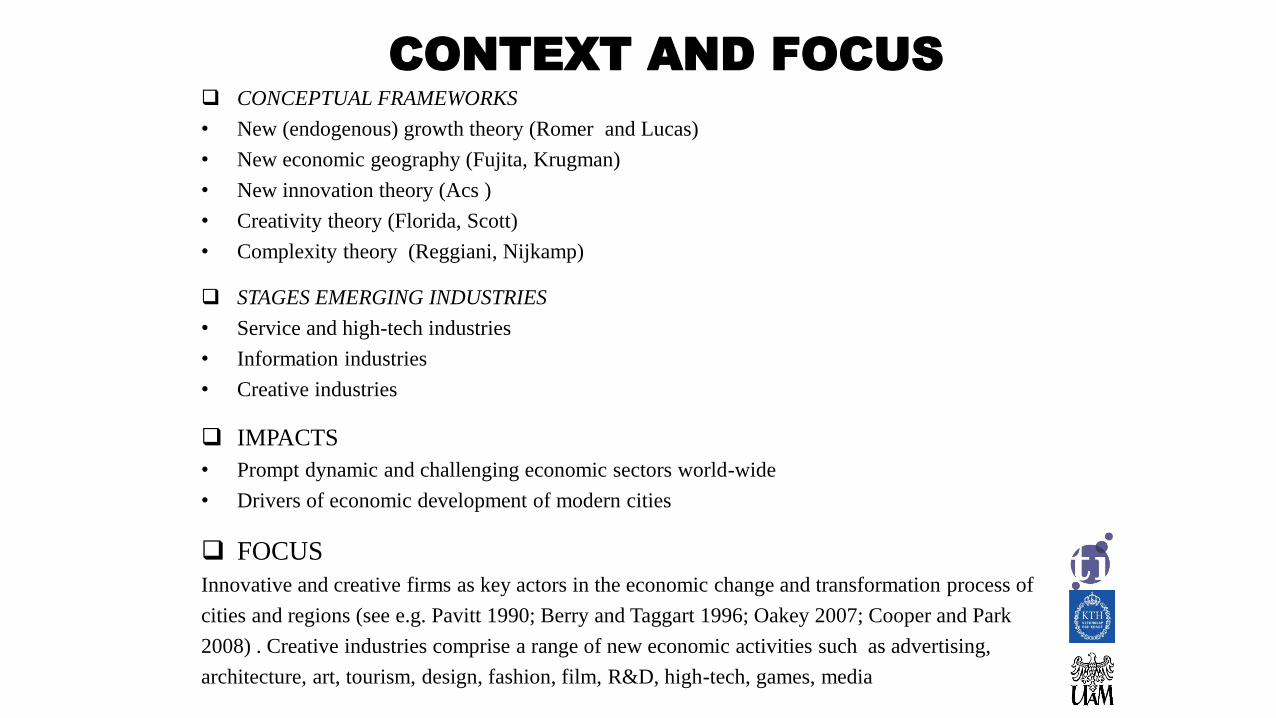
CONTEXT AND FOCUS
CONCEPTUAL FRAMEWORKS
• New (endogenous) growth theory (Romer and Lucas)
• New economic geography (Fujita, Krugman)
• New innovation theory (Acs )
• Creativity theory (Florida, Scott)
• Complexity theory (Reggiani, Nijkamp)
STAGES EMERGING INDUSTRIES
• Service and high-tech industries
• Information industries
• Creative industries
IMPACTS
• Prompt dynamic and challenging economic sectors world-wide
• Drivers of economic development of modern cities
FOCUS
Innovative and creative firms as key actors in the economic change and transformation process of
cities and regions (see e.g. Pavitt 1990; Berry and Taggart 1996; Oakey 2007; Cooper and Park
2008) . Creative industries comprise a range of new economic activities such as advertising,
architecture, art, tourism, design, fashion, film, R&D, high-tech, games, media

Geographical market and environmental changes put
emphasis on:
• entrepreneurship
• locational decision-making (business growth
strategies; Ansoff’s model 1957)
• spatial strategies (market and spatial
segmentation)
Need for efficient and effective management
techniques; with a geographic location dimension
9

CITIES: A WEALTH OF CULTURAL HERITAGE
BERN
BUDAPEST
Rotterdam
BUCHAREST
Napels
10

THE NEXUS OF CREATIVITY AND CULTURAL HERITAGE
A wealth of cultural heritage assets can be found in many European cities, and worldwide (Africa, Asia, etc)
Cities have a wealth of cultural facilities that may attract all kind of stakeholders (visitors, residents, business sectors), in particular creative minds
Creative minds have an exceptional innovation potential in terms of both innovative ideas and practices (diversification / specialization segmentation, Ansoff 1957) creative industries
Cultural heritage is frequently used as a strategic development tool for urban policies, many current cities (Paris, Florence, Athens, Amsterdam, Marrakesh, Acapulco, etc.) derive their wealth from the abundant presence of a great diversity of cultural heritage
But which people, businesses and (economic) activities are particularly attracted by the presence of and access
to urban cultural heritage capital?
12
CREATIVE MINDS IN THE CREATIVE INDUSTRIES The creative industry (heterogeneous group) contains an extensive set of industrial
branches of the Dutch sectoral economic system, in particular :
(i) arts (e.g., performing arts, theatres, music, art galleries, museums etc.)
(ii) media and entertainment (e.g., publishing, photography, broadcasting,
amusement and entertainment, press) and
(iii) creative business services (e.g., architecture, design, fashion,
advertisement)
The definition of all these branches is based on the standard industrial classification (SBI) used by the Central Bureau of Statistics (CBS) in the Netherlands
Creative minds are supposed:• to develop innovative ideas, to design new forms of technology or architecture• to experiment with new business models, to suggest new roads to sustainable
development, to act as fireplaces for many young people seeking for original concepts in a globalizing world
• Etc.
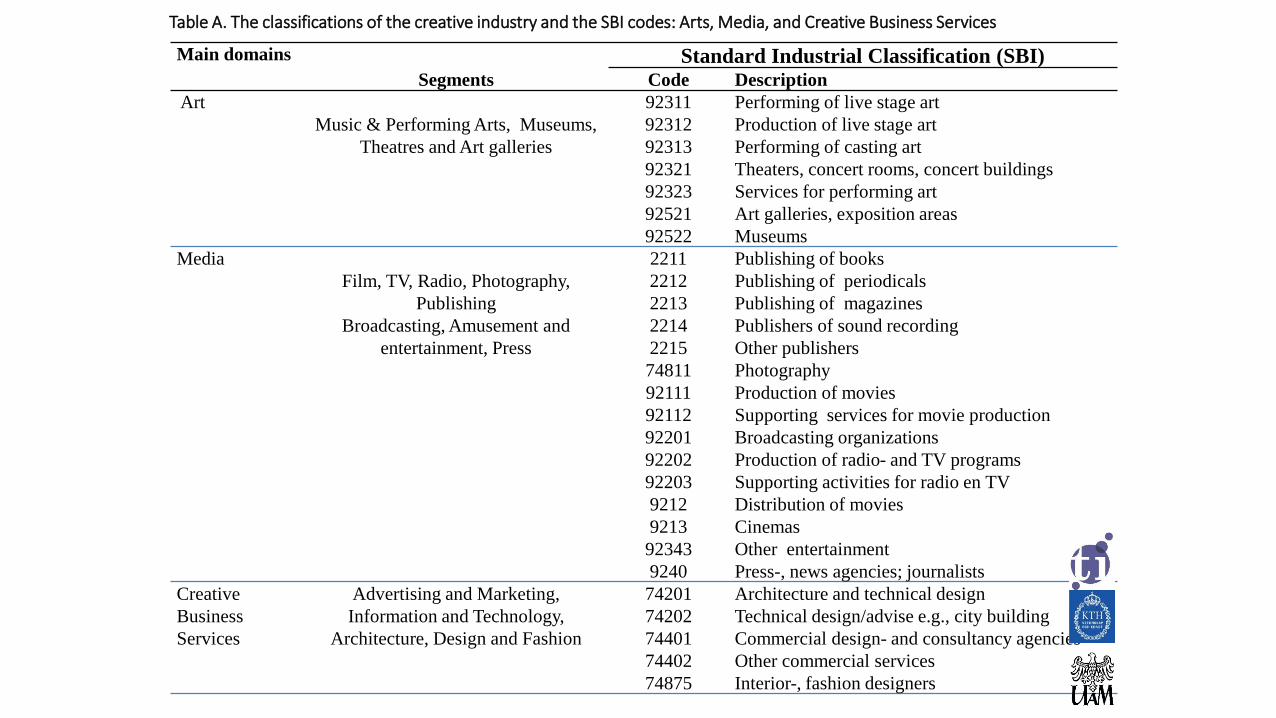
Table A. The classifications of the creative industry and the SBI codes: Arts, Media, and Creative Business Services
Main domains Standard Industrial Classification (SBI)Segments Code Description
Art
Music & Performing Arts, Museums,
Theatres and Art galleries
92311
92312
92313
92321
92323
92521
92522
Performing of live stage art
Production of live stage art
Performing of casting art
Theaters, concert rooms, concert buildings
Services for performing art
Art galleries, exposition areas
Museums
Media
Film, TV, Radio, Photography,
Publishing
Broadcasting, Amusement and
entertainment, Press
2211
2212
2213
2214
2215
74811
92111
92112
92201
92202
92203
9212
9213
92343
9240
Publishing of books
Publishing of periodicals
Publishing of magazines
Publishers of sound recording
Other publishers
Photography
Production of movies
Supporting services for movie production
Broadcasting organizations
Production of radio- and TV programs
Supporting activities for radio en TV
Distribution of movies
Cinemas
Other entertainment
Press-, news agencies; journalists
Creative
Business
Services
Advertising and Marketing,
Information and Technology,
Architecture, Design and Fashion
74201
74202
74401
74402
74875
Architecture and technical design
Technical design/advise e.g., city building
Commercial design- and consultancy agencies
Other commercial services
Interior-, fashion designers

RESEARCH QUESTIONS
Hypothesis:
Cities attract relatively more creative talent in creative industries, especially if these cities have a wealth of
cultural heritageRelated questions:
• What is the spatial distribution of firms in the creative industries?
• Is there a relationship with cultural heritage?
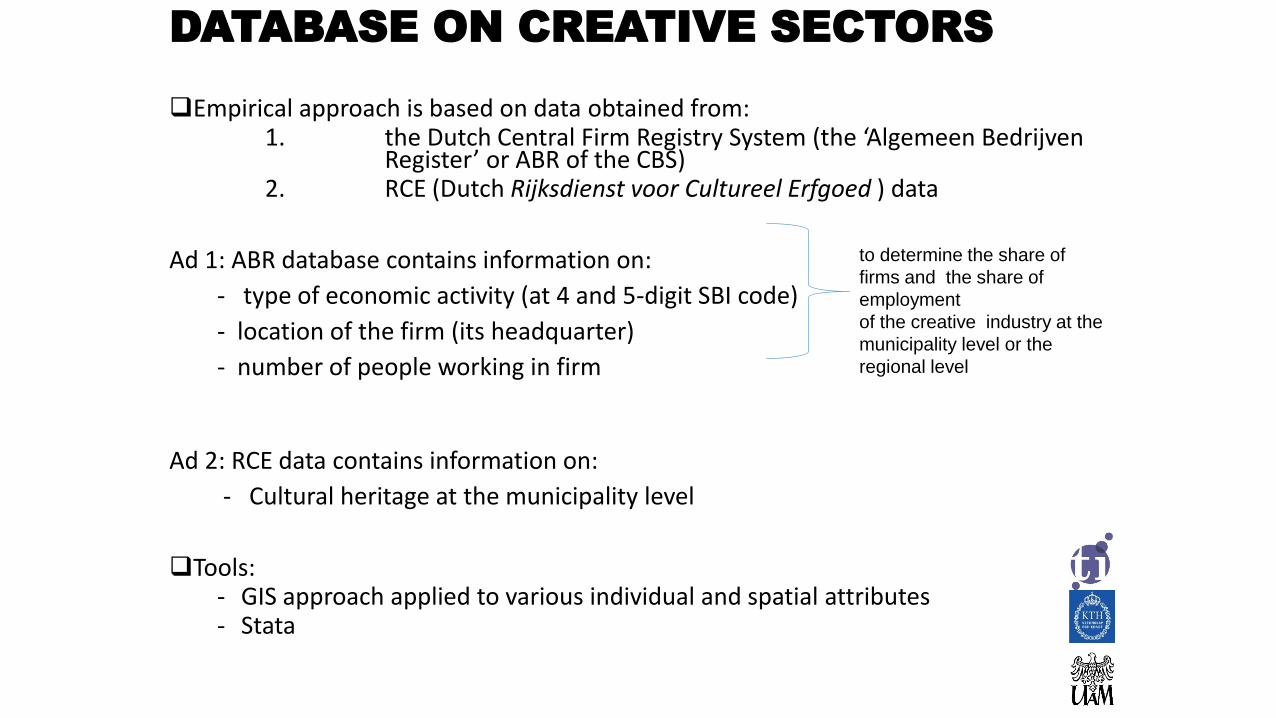
DATABASE ON CREATIVE SECTORS
Empirical approach is based on data obtained from:1. the Dutch Central Firm Registry System (the ‘Algemeen Bedrijven
Register’ or ABR of the CBS)2. RCE (Dutch Rijksdienst voor Cultureel Erfgoed ) data
Ad 1: ABR database contains information on:
- type of economic activity (at 4 and 5-digit SBI code)
- location of the firm (its headquarter)
- number of people working in firm
Ad 2: RCE data contains information on:
- Cultural heritage at the municipality level
Tools:- GIS approach applied to various individual and spatial attributes- Stata
to determine the share of
firms and the share of
employment
of the creative industry at the
municipality level or the
regional level
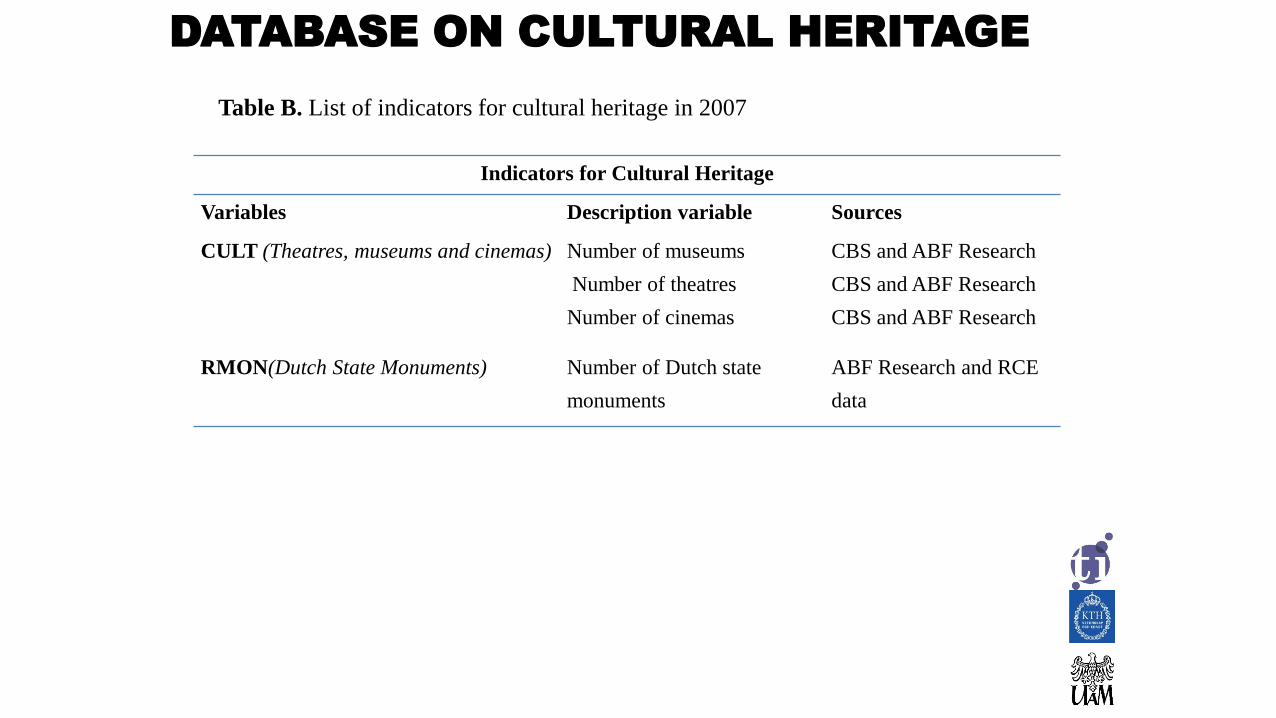
DATABASE ON CULTURAL HERITAGE
Indicators for Cultural Heritage
Variables Description variable Sources
CULT (Theatres, museums and cinemas) Number of museums
Number of theatres
Number of cinemas
CBS and ABF Research
CBS and ABF Research
CBS and ABF Research
RMON(Dutch State Monuments) Number of Dutch state
monuments
ABF Research and RCE
data
Table B. List of indicators for cultural heritage in 2007
MAP OF THE SPATIAL-CULTURAL PROFILE OF THE
NETHERLANDS
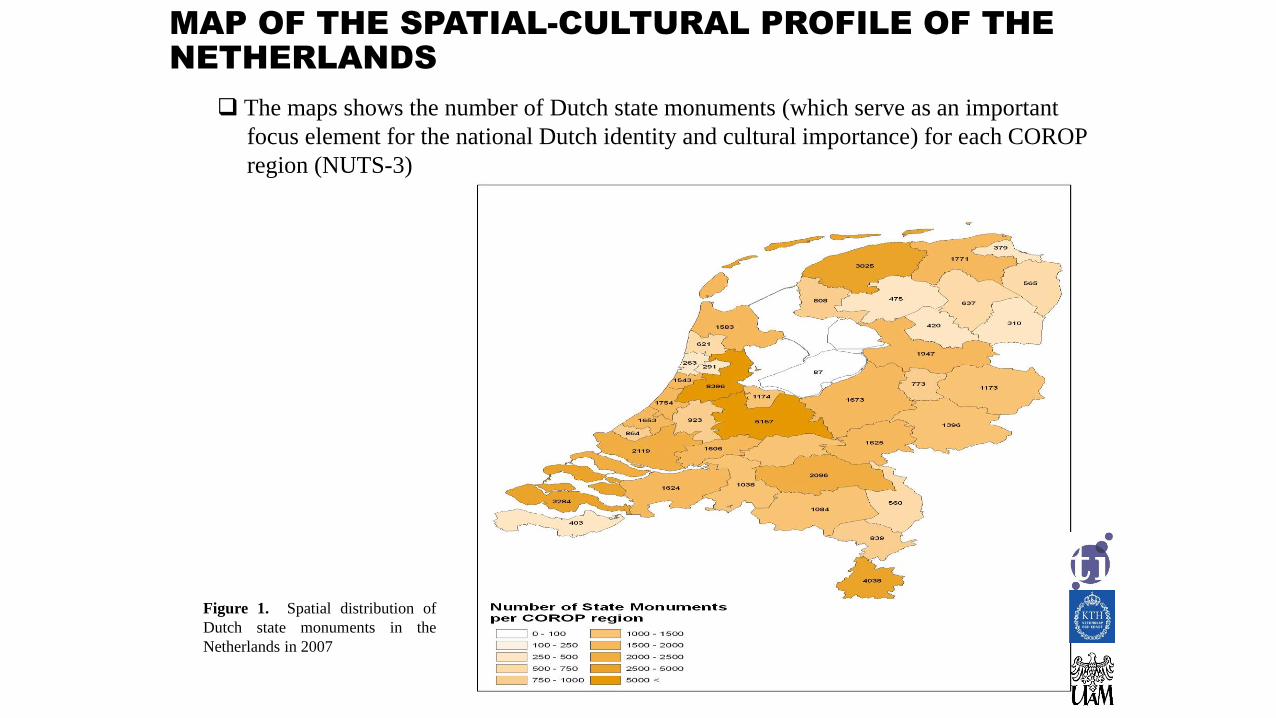
The maps shows the number of Dutch state monuments (which serve as an important
focus element for the national Dutch identity and cultural importance) for each COROP
region (NUTS-3)
Figure 1. Spatial distribution of
Dutch state monuments in the
Netherlands in 2007

RESULTS
STEP 1

RESULTS:
Shares of the creative industries in the total economy of the Netherlands, in terms of the number of firms and the number of fte’s
Arts
(i)
Media
(ii)
Creative
business
services
(iii)
Creative
industries total
(%)
Share in number of firms (1994) 0.9% 1.4% 2.2% 4.5%
Share in number of firms (2009) 3.1% 2.3% 3.9% 9.2%
Share in fte’s (1994) 0.2% 0.9% 0.9% 2.0%
Share in fte’s (2009) 0.8% 1.0% 1.6% 3.4%
Table 1. Growth in importance of the creative sector (1994 and 2009)
1. The relative importance of the creative industries is rapidly rising over the period
considered (both the size of this sector and the employment in this sector)
2. Firms in the creative sector are on average smaller than firms in other sectors for
1994 as well as 2009 (the growth of the creative industry is mainly driven by the
entry of new firms)
RESULTS:
growth of the creative industry relative to that of other industries
All other
sectors
Creative
industry
total
Arts
(i)
Media
(ii)
Creative business
services
(iii)
The Netherlands 1.9 7.3 11.3 5.5 6.2
Amsterdam 0.2 10.4 14.5 7.8 9.7
Rotterdam 0.1 9.0 14.5 6.6 7.2
The Hague 1.8 7.8 13.1 5.0 6.2
Utrecht 3.3 10.9 13.4 10.0 9.6
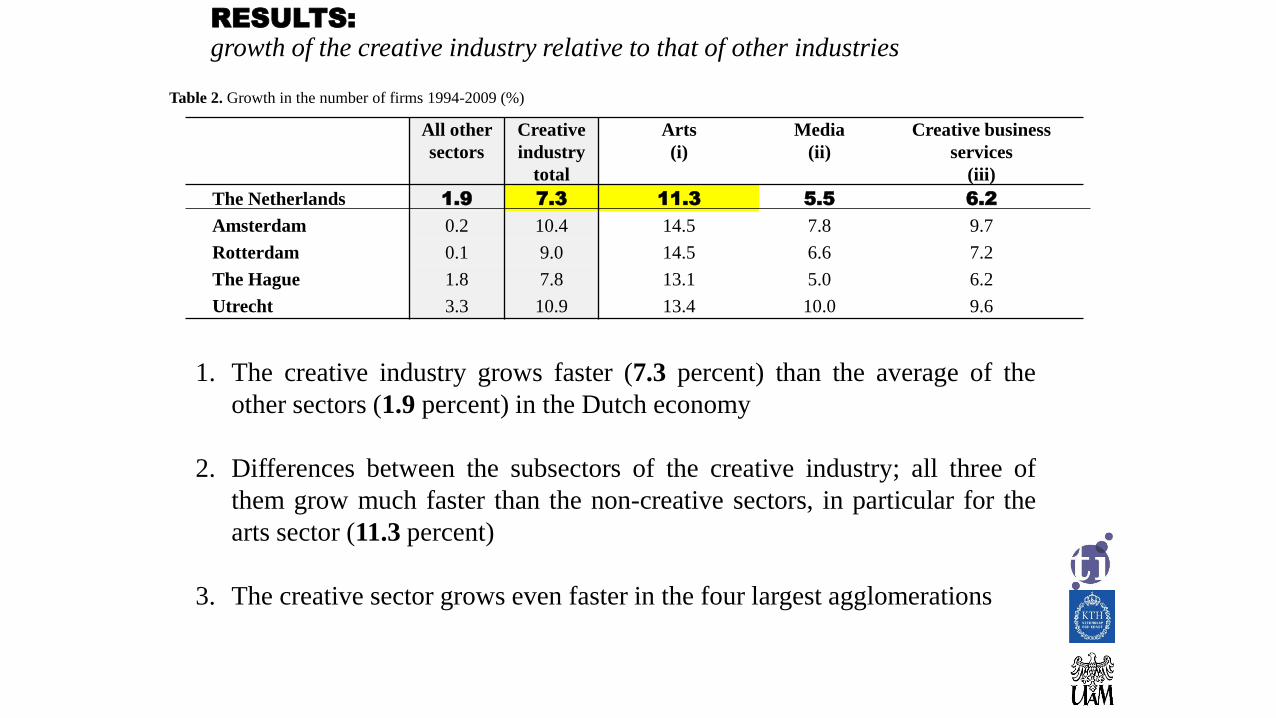
Table 2. Growth in the number of firms 1994-2009 (%)
1. The creative industry grows faster (7.3 percent) than the average of the
other sectors (1.9 percent) in the Dutch economy
2. Differences between the subsectors of the creative industry; all three of
them grow much faster than the non-creative sectors, in particular for the
arts sector (11.3 percent)
3. The creative sector grows even faster in the four largest agglomerations
RESULTS:
Development of employment
All
other
sectors
Creative
industry
Arts
(i)
Media
(ii)
Creative business
services
(iii)
The Netherlands 2.2 6.1 10.8 3.3 6.6
Amsterdam 3.0 6.9 10.9 5.2 6.6
Rotterdam 1.1 7.3 15.6 2.4 6.1
The Hague 2.5 6.3 8.9 4.4 5.7
Utrecht 2.8 10.6 16.4 6.6 10.6
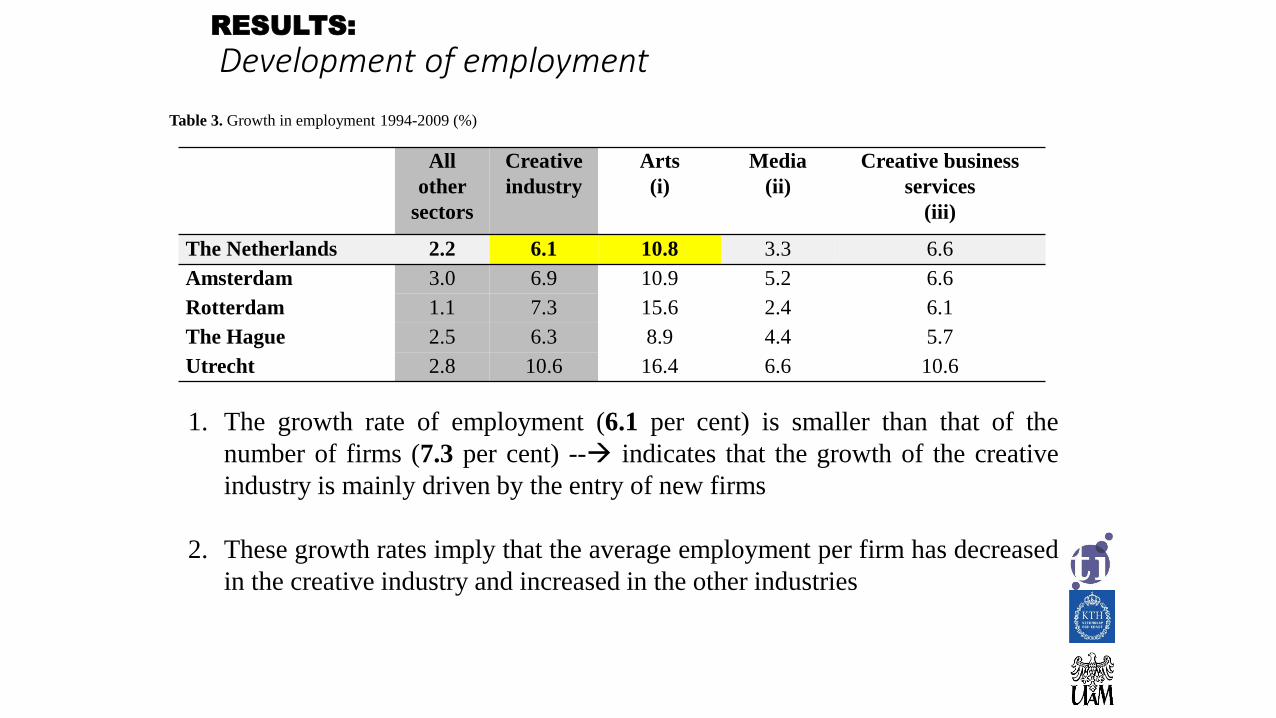
Table 3. Growth in employment 1994-2009 (%)
1. The growth rate of employment (6.1 per cent) is smaller than that of the
number of firms (7.3 per cent) -- indicates that the growth of the creative
industry is mainly driven by the entry of new firms
2. These growth rates imply that the average employment per firm has decreased
in the creative industry and increased in the other industries

RESULTS:
Evolution of employment growth and the increase in the number of firms in the creative sector
Figure 2. Number of firms (left axis, 1994 = 100) and fte’s per firm (right axis)
1. In the period 1994 – 2009, the number of firms in the creative industry has almost
tripled, while the increase in the number of firms in the other sectors was modest
2. The average employment generated by firms in the creative industry is about 3 fte,
while firms in other sectors employ on average 7 fte
3. Firms in the creative industry are on average much smaller than firms in other sectors

RESULTS
STEP 2
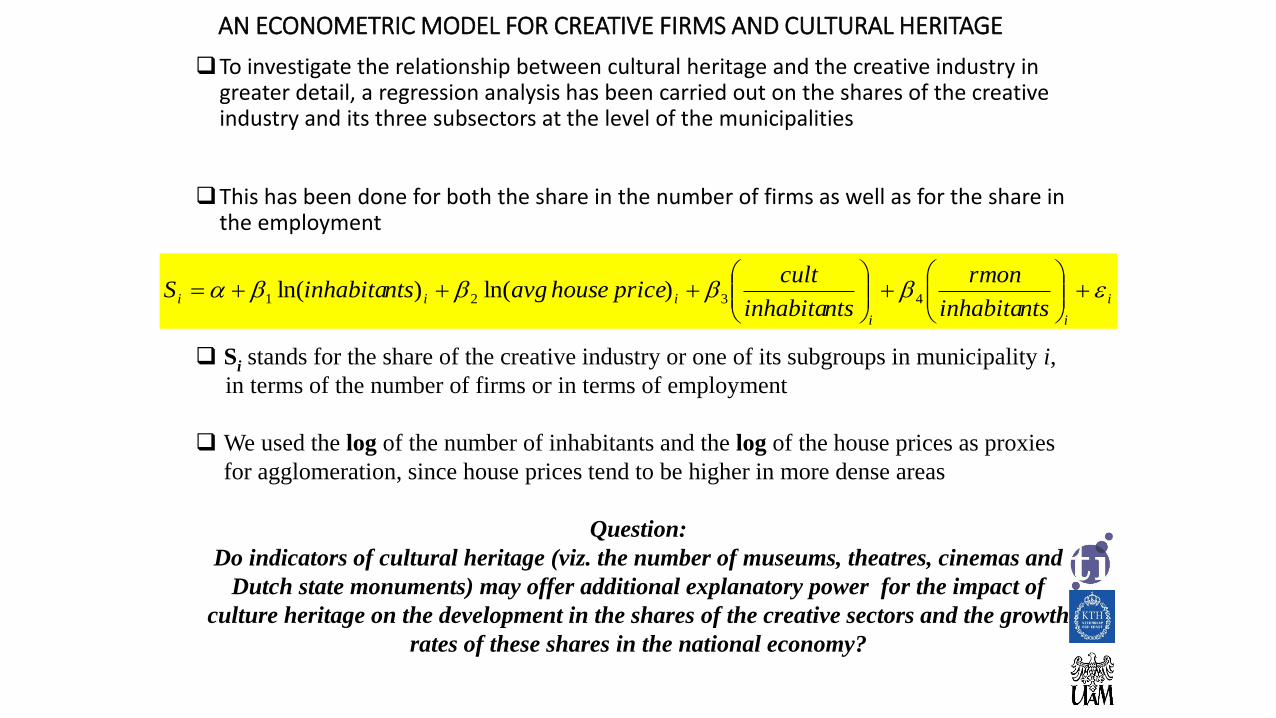
AN ECONOMETRIC MODEL FOR CREATIVE FIRMS AND CULTURAL HERITAGE
To investigate the relationship between cultural heritage and the creative industry in greater detail, a regression analysis has been carried out on the shares of the creative industry and its three subsectors at the level of the municipalities
This has been done for both the share in the number of firms as well as for the share in the employment
i
ii
iiintsinhabita
rmon
ntsinhabita
cultpricehouseavgntsinhabitaS
4321 )ln()ln(
Si stands for the share of the creative industry or one of its subgroups in municipality i,
in terms of the number of firms or in terms of employment
We used the log of the number of inhabitants and the log of the house prices as proxies
for agglomeration, since house prices tend to be higher in more dense areas
Question:
Do indicators of cultural heritage (viz. the number of museums, theatres, cinemas and
Dutch state monuments) may offer additional explanatory power for the impact of
culture heritage on the development in the shares of the creative sectors and the growth
rates of these shares in the national economy?
Creative industry
Coef. (Std. Err)
Arts
(i)
Coef. (Std. Err)
Media
(ii)
Coef. (Std. Err)
Creative Business
Services (iii)
Coef. (Std. Err)
Const -.496 (.054) -.108 (.024) -.169 (.019) -.219 (.021)
Log (#inhabitants) .015*** (.001) .006*** (.001) .004*** (.001) .005*** (.001)
Log (house price) .034*** (.004) .006*** (.002) .012*** (.002) .016*** (.002)
Theatres etc. per inhabitant 10.106 (9.511) 12.327*** (4.263) 3.183 (3.232) -5.404 (3.700)
Monuments per inhabitant 1.283*** (.220) .683*** ( .0987) .356*** (.0748) .244*** (.086)
Observations 436 436 436 436
R2 0.33 0.26 0.27 0.34
Method OLS OLS OLS OLS
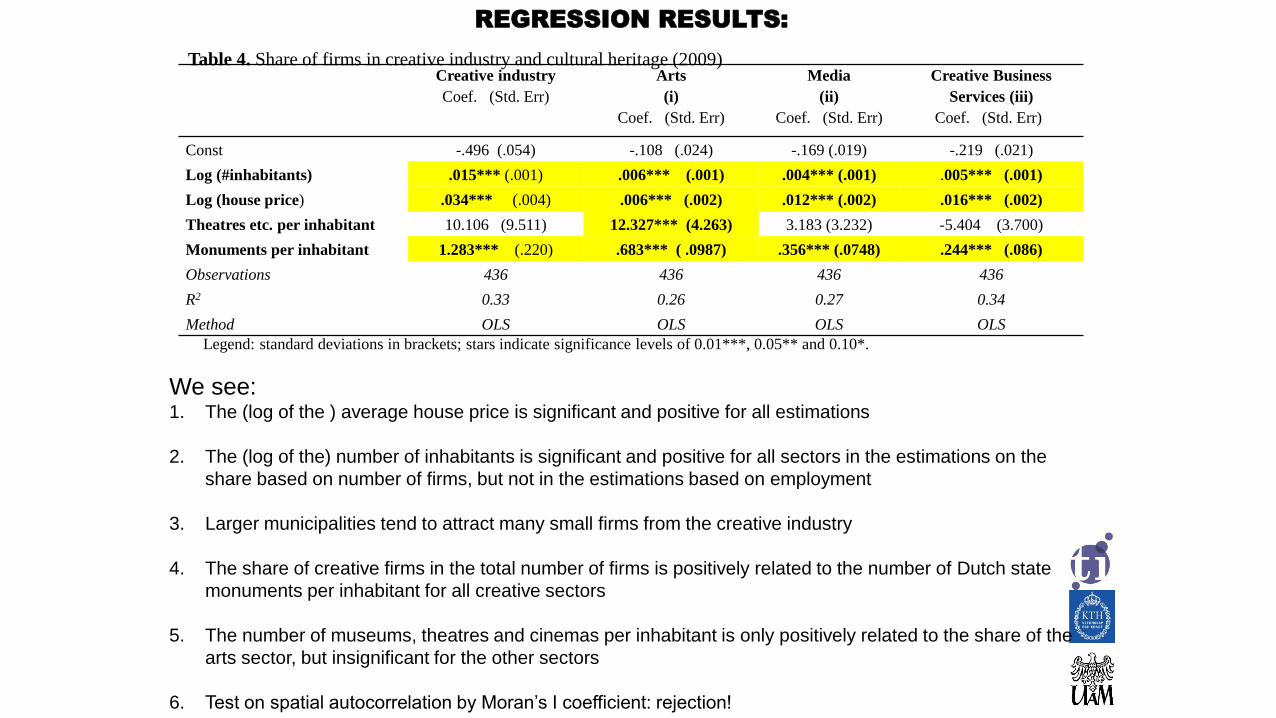
Table 4. Share of firms in creative industry and cultural heritage (2009)
Legend: standard deviations in brackets; stars indicate significance levels of 0.01***, 0.05** and 0.10*.
REGRESSION RESULTS:
We see:1. The (log of the ) average house price is significant and positive for all estimations
2. The (log of the) number of inhabitants is significant and positive for all sectors in the estimations on the
share based on number of firms, but not in the estimations based on employment
3. Larger municipalities tend to attract many small firms from the creative industry
4. The share of creative firms in the total number of firms is positively related to the number of Dutch state
monuments per inhabitant for all creative sectors
5. The number of museums, theatres and cinemas per inhabitant is only positively related to the share of the
arts sector, but insignificant for the other sectors
6. Test on spatial autocorrelation by Moran’s I coefficient: rejection!
Creative industry
Coef. (Std. Err)
Arts
(i)
Coef. (Std. Err)
Media
(ii)
Coef. (Std. Err)
Creative Business
Services (iii)
Coef. (Std. Err)
Const -.324 (.051) -.046 (.013) -.121 (.025) -.157 (.036)
Log (#inhabitants) -.000 (.001) -.000 (.000) .001** (.001) -.001 (.001)
Log (house price) .0290*** (.004) .004*** (.001) .010*** (.002) .015*** (.003)
Theatres etc. per inhabitant 8.143 (9.025) 9.813*** (2.349) 4.360 (4.500) -6.029 ( 6.406)
Monuments per inhabitant .369* (.209) .257*** (.054) .139 (.104) -.025 (.148)
Observations 436 436 436 436
R2 0.12 0.18 0.06 0.07
Method OLS OLS OLS OLS
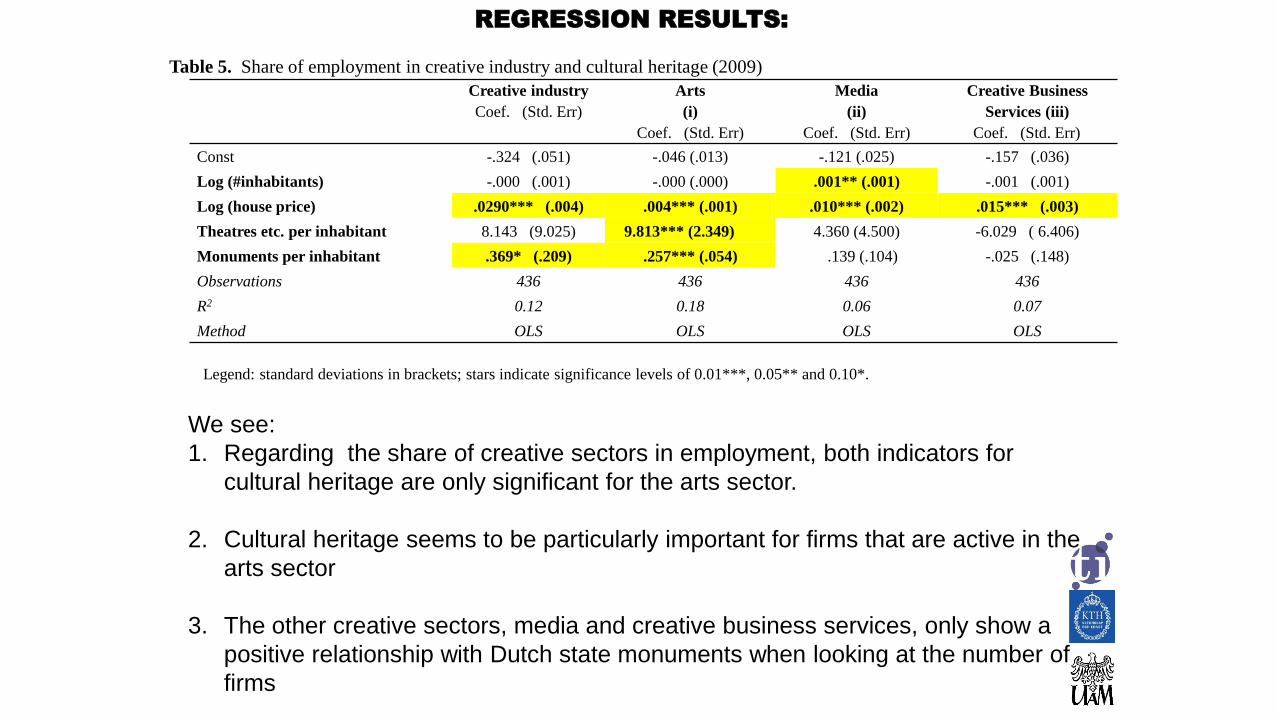
Table 5. Share of employment in creative industry and cultural heritage (2009)
REGRESSION RESULTS:
Legend: standard deviations in brackets; stars indicate significance levels of 0.01***, 0.05** and 0.10*.
We see:
1. Regarding the share of creative sectors in employment, both indicators for
cultural heritage are only significant for the arts sector.
2. Cultural heritage seems to be particularly important for firms that are active in the
arts sector
3. The other creative sectors, media and creative business services, only show a
positive relationship with Dutch state monuments when looking at the number of
firms
FURTHERMORE
• In order to investigate the relationship between the annual change in the creative sector and the presence of cultural heritage, we also regressed the change in the share of firms in the creative sector and the three subsectors on the same set of explanatory variables (Table 6)
• This allows us to assess whether the creative sector will grow faster than the non-creative sector in municipalities with a relatively high density of cultural heritage
Creative industry
Coef. (Std. Err)
Arts
(i)
Coef. (Std. Err)
Media
(ii)
Coef. (Std. Err)
Creative Business Services
(iii)
Coef. (Std. Err)
Const -.224 (.044) -.074 (.023) -.052 (.015) -.0981 (.0196865)
Log (#inhabitants) .011*** (.001) .005*** (.001) .002*** ( .000) .004*** (.0004645
Log (house price) .012*** (.004) .003 (.002) .003*** (.001) .010*** (.0015964)
Theatres etc. per inhabitant 25.098*** (8.922) 14.496*** (4.634) 4.544 (2.967) 6.058 (3.993378)
Monuments per inhabitant .689*** (.179) .476*** (.093) .091 (.060) .122 (.0800254)
Observations 370 370 370 370
R2 0.26 0.25 0.08 0.17
Method OLS OLS OLS OLS
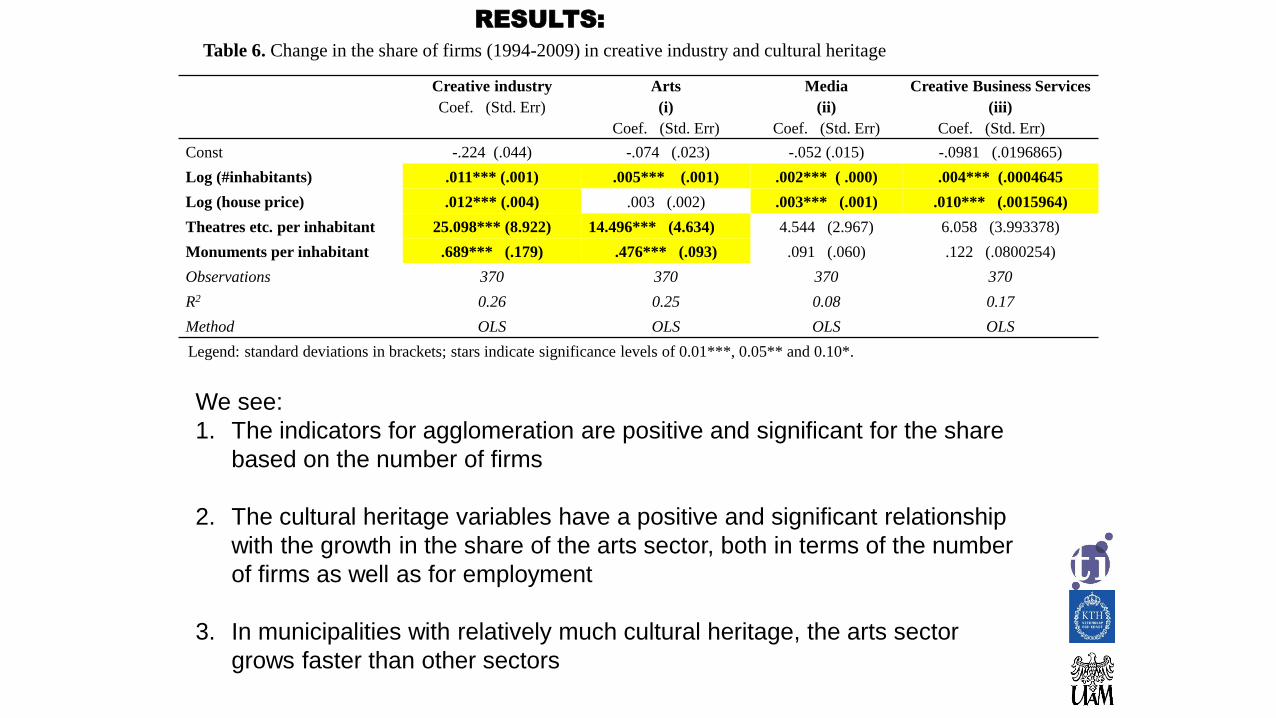
Table 6. Change in the share of firms (1994-2009) in creative industry and cultural heritage
Legend: standard deviations in brackets; stars indicate significance levels of 0.01***, 0.05** and 0.10*.
We see:
1. The indicators for agglomeration are positive and significant for the share
based on the number of firms
2. The cultural heritage variables have a positive and significant relationship
with the growth in the share of the arts sector, both in terms of the number
of firms as well as for employment
3. In municipalities with relatively much cultural heritage, the arts sector
grows faster than other sectors
RESULTS:
Creative industry
Coef. (Std. Err)
Arts
(i)
Coef. (Std. Err)
Media
(ii)
Coef. (Std. Err)
Creative Business
Services (iii)
Coef. (Std. Err)
Const -.116 (.048) -.031 (.0132) -.042 (.020) -.044 (.037)
Log (#inhabitants) -.002** (.001) -.001 (.000) -.002*** (.001) -.001 (.001)
Log (house price) .012*** (.004) .003*** (.001) .005*** (.002) .005 (.003)
Theatres etc. per inhabitant 14.968 (9.781) 6.584** (2.666) 8.860** (3.993) -.476 (7.510)
Monuments per inhabitant .291 (.1963) .190*** (.054) .097 (.080) .004 (.151)
Observations 370 370 370 370
R2 0.06 0.10 0.08 0.08
Method OLS OLS OLS OLS
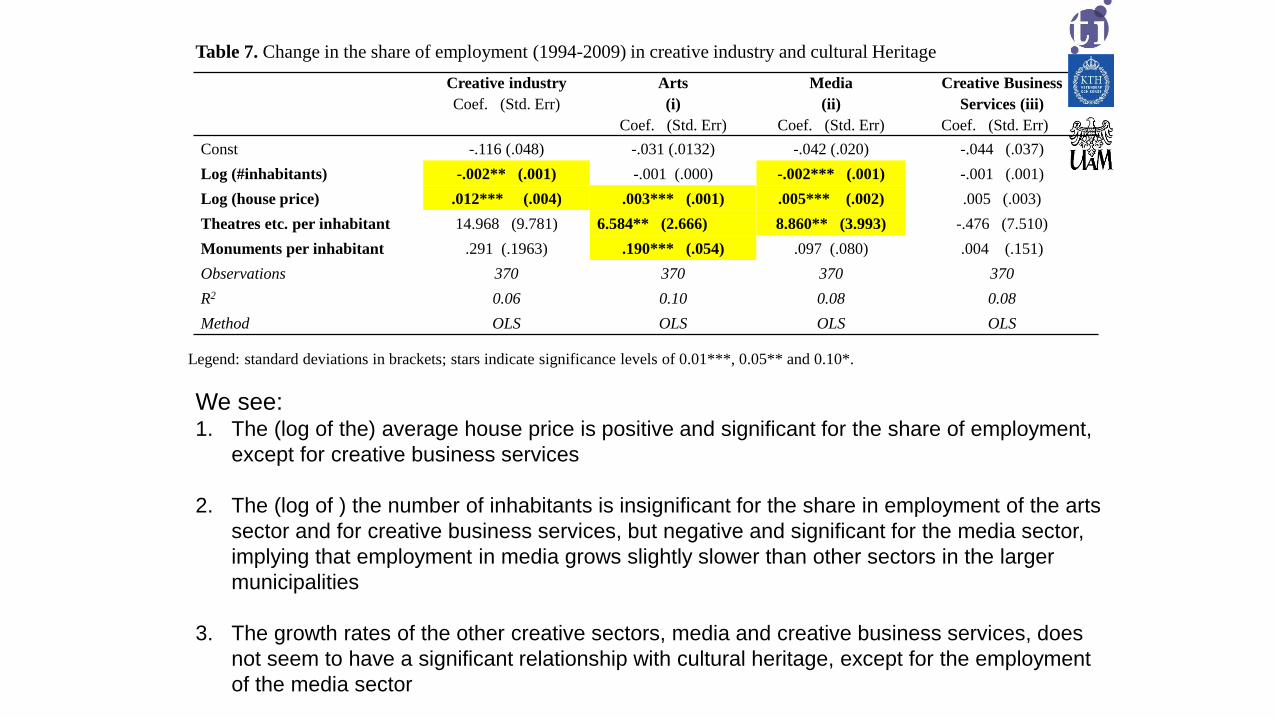
Table 7. Change in the share of employment (1994-2009) in creative industry and cultural Heritage
Legend: standard deviations in brackets; stars indicate significance levels of 0.01***, 0.05** and 0.10*.
We see: 1. The (log of the) average house price is positive and significant for the share of employment,
except for creative business services
2. The (log of ) the number of inhabitants is insignificant for the share in employment of the arts
sector and for creative business services, but negative and significant for the media sector,
implying that employment in media grows slightly slower than other sectors in the larger
municipalities
3. The growth rates of the other creative sectors, media and creative business services, does
not seem to have a significant relationship with cultural heritage, except for the employment
of the media sector

OVERAL CONCLUSION
1. Our results demonstrate that at the level of the municipality, cultural heritage such as Dutch state monuments can play a role in both the level as well as the change of the share of creative firms and employment in creative firms
2. This relationship is mainly caused by the arts sector, and is less prominent in the other creative sectors
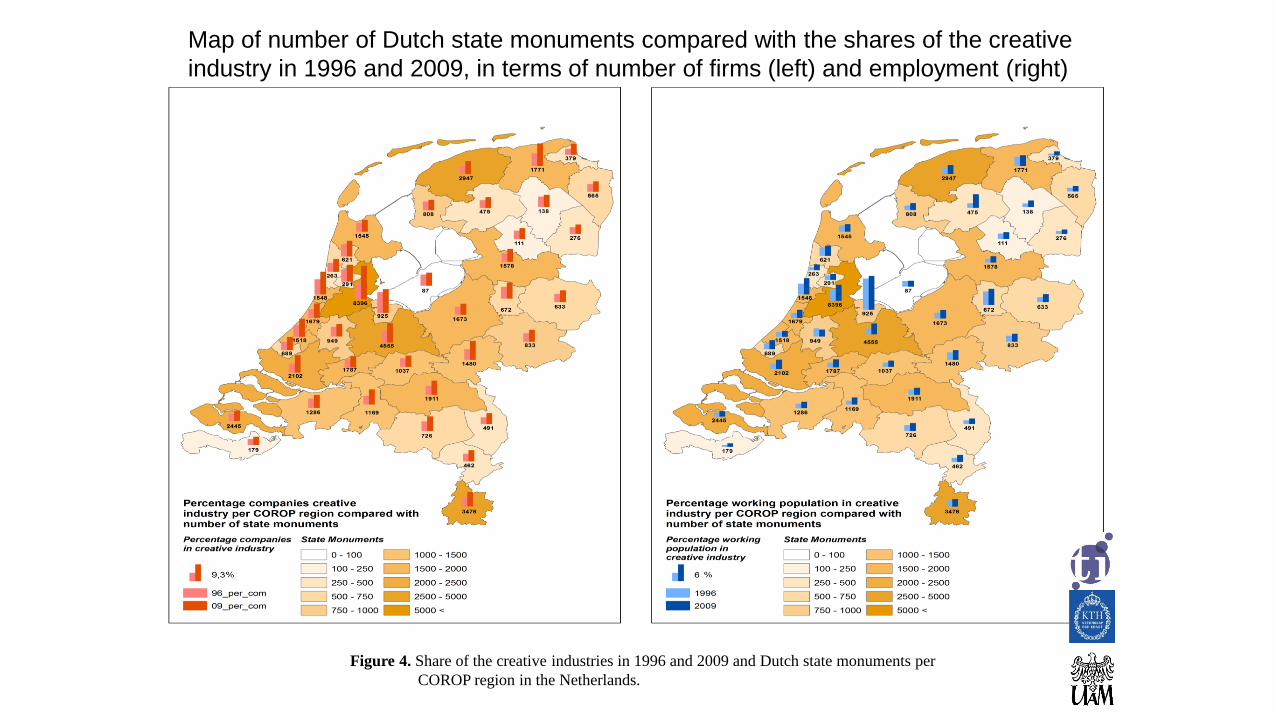
Figure 4. Share of the creative industries in 1996 and 2009 and Dutch state monuments per
COROP region in the Netherlands.
Map of number of Dutch state monuments compared with the shares of the creative
industry in 1996 and 2009, in terms of number of firms (left) and employment (right)

Concluding RemarksOur research has explored the relationship between urban cultural heritage and the level and
growth of various branches of the creative sector, with a particular view to urban agglomerations in the Netherlands:
1. The creative sector in the Netherlands appears to grow – in terms of both the number of firms and the number of jobs – significantly faster than other industries over the period 1994-2009; especially the high entry rates of new firms plays a critical role here
2. The creative industry appears to be mainly concentrated - and to have the highest growth rates – in urban areas. Agglomeration externalities are apparently an essential element here. Especially Amsterdam appears to have a strong creativity profile
3. The four urban agglomerations in the Netherlands turn out to offer favourableseedbed conditions for a strongly operating creative industry , especially when there is abundant presence of cultural capital, and more in particular cultural heritage (monuments, performing arts etc.). This holds in particular for the arts sector, and less for the media sector and the creative business services
Our results suggest a clear relationship between cultural heritage and creative industries, but further research is necessary to determine whether there is a causal relationship

Thank you for your attention
Related Documents


