Welcome message from author
This document is posted to help you gain knowledge. Please leave a comment to let me know what you think about it! Share it to your friends and learn new things together.
Transcript
THE GEOGRAPHY OF THE WORLD ECONOMY
The Geography of the World Economy provides an in-depth and stimulating introduction tothe globalization of the world economy. The book offers a consideration of local, regional,national and global economic development over the long historical term. The theory and practiceof economic and political geography provide a basis for understanding the interactions withinand among the developed and developing countries of the world. Illustrated in colourthroughout, this new edition has been completely reworked and updated to take account ofrecent significant changes in the world economy.
A new companion website also accompanies the book, with additional resources for eachchapter including multiple choice and short essay questions and links to relevant websites.Figures and tables are also available for download located at www.routledge.com/cw/knox
The text is signposted throughout with an glossary of key terms, and is richly illustratedwith full-colour maps, diagrams and illustrations. It is ideal for upper level universityundergraduates and for post-graduates in a variety of specializations including geography,economics, political science, international relations and global studies.
Paul Knox, University Distinguished Professor and Senior Fellow for International Advance-ment, Virginia Polytechnic Institute and State University, USA.
John Agnew, Distinguished Professor, University of California, Los Angeles, USA.
Linda McCarthy, Associate Professor, University of Wisconsin-Milwaukee, USA.
6063 GEOGRAPHY WORLD ECON_PT_246x189 mm 22/01/2014 15:09 Page i

6063 GEOGRAPHY WORLD ECON_PT_246x189 mm 22/01/2014 15:09 Page ii
This page intentionally left blank
THE GEOGRAPHYOF THE WORLDECONOMYSixth Edition
Paul Knox, John Agnew and Linda McCarthy
6063 GEOGRAPHY WORLD ECON_PT_246x189 mm 22/01/2014 15:09 Page iii
RoutledgeTaylor & Francis Croup
LO ND O N A N D NEW YORK
First edition published in 1989 by Edward ArnoldFifth edition published in 2008 by Hodder Education
Sixth edition published in 2014by Routledge2 Park Square, Milton Park, Abingdon, Oxon OX14 4RN
and by Routledge711 Third Avenue, New York, NY 10017
Routledge is an imprint of the Taylor & Francis Group, an informa business
© 2014 Paul Knox, John Agnew and Linda McCarthy
The right of Paul Knox, John Agnew and Linda McCarthy to be identified as authors of this work has been asserted by them in accordance with sections 77 and 78 of the Copyright, Designs and Patents Act 1988.
All rights reserved. No part of this book may be reprinted or reproduced or utilised in any form or by any electronic, mechanical, or other means, now known or hereafter invented, including photocopying and recording, or in any information storage or retrieval system, without permission in writing from the publishers.
Trademark notice: Product or corporate names may be trademarks or registered trademarks, and are used only for identification and explanation without intent to infringe.
British Library Cataloguing in Publication DataA catalogue record for this book is available from the British Library
Library of Congress Cataloging in Publication DataKnox, Paul L.The geography of the world economy/Paul Knox, John Agnew and Linda McCarthy.
pages cmIncludes bibliographical references and index.1. Economic geography. 2. Economic history. I. Agnew, John A. II. McCarthy, Linda (Linda Mary) III. Title.HF1025.K573 2014330.9–dc23 2013027243
ISBN: 978-0-415-83128-4 (hbk)ISBN: 978-1-44-418470-9 (pbk)ISBN: 978-0-203-77518-9 (ebk)
Typeset in Gill Sans and Sabon by Florence Production Ltd, Stoodleigh, Devon, UK
6063 GEOGRAPHY WORLD ECON_PT_246x189 mm 22/01/2014 15:09 Page iv
List of figures viii
List of tables xi
List of boxes xiii
Acknowledgements xiv
PART 1ECONOMIC PATTERNS AND THE SEARCH FOR EXPLANATION 1
1 The changing world economy 3
1.1 Studying the world economy 51.2 Economic organization and spatial change 61.3 Spatial divisions of labor 12
Key sources and suggested reading 19
2 Global patterns and trends 20
2.1 What “economic development” means 232.2 International patterns of resources and population 292.3 International patterns of industry and finance 45
Summary 59Key sources and suggested reading 60
3 Geographical dynamics of the world economy 61
3.1 History of the world economy 623.2 States and the world economy 663.3 “Market access” and the regional motors of the world
economy 79Summary 91Key sources and suggested reading 91
PART 2RISE OF THE CORE ECONOMIES 93
4 Preindustrial foundations 95
4.1 Beginnings 954.2 Emerging imperatives of economic organization 1004.3 Emergence of the European world-system 100
Summary 113Key sources and suggested reading 115
Contents
6063 GEOGRAPHY WORLD ECON_PT_246x189 mm 22/01/2014 15:09 Page v
5 Evolution of the core regions 116
5.1 The Industrial Revolution and spatial change 1165.2 Machinofacture and the spread of industrialization in Europe 1175.3 Fordism and North American industrialization 1255.4 Japanese industrialization: Two economic miracles 1305.5 Emergence of “organized” capitalism 1375.6 Principles of economic geography: Summarizing lessons from the
industrial era 142Summary 144Key sources and suggested reading 144
6 Globalization of economic activities 145
6.1 Transition to advanced capitalism 1456.2 Patterns and processes of globalization 159
Summary 174Key sources and suggested reading 174
PART 3SPATIAL TRANSFORMATION OF CORE AND PERIPHERY 177
7 Spatial reorganization of the core economies 179
7.1 The context for urban and regional change 1807.2 Spatial reorganization of the core economies 1827.3 Old industrial spaces 1947.4 New industrial spaces 1967.5 Regional inequality in core economies 205
Summary 211Key sources and suggested reading 212
8 Dynamics of interdependence: Transformation of the periphery 213
8.1 Colonial economies and the transformation of global space 2138.2 Economic mechanisms of enmeshment and maintenance
in the colonial world economy 2188.3 Influence of colonial administration on interdependence 2268.4 Mechanisms of cultural integration 2288.5 Changing global context of interdependence 2308.6 Alternative models of development? 242
Summary 243Key sources and suggested reading 244
9 Agriculture: The primary concern? 245
9.1 Agriculture in the periphery 2469.2 Land, labor, and capital 2519.3 Rural land reform 2609.4 Capitalization of agriculture 2629.5 Science and technology in agriculture 270
Summary 272Key sources and suggested reading 273
CONTENTSvi
6063 GEOGRAPHY WORLD ECON_PT_246x189 mm 22/01/2014 15:09 Page vi
10 Industrialization: The path to progress? 274
10.1 National and global stimuli to industrialization 27510.2 Limits to industrialization in the periphery 28010.3 Geography of industrialization in the periphery 28510.4 Rise and fall of the Soviet model of industrialization 29910.5 China’s rise in the world economy 304
Summary 310Key sources and suggested reading 312
11 Services: Going global? 313
11.1 Defining and theorizing services 31511.2 National and global stimuli to the growth of services 31811.3 Services outsourcing: Benefits and drawbacks for all? 31911.4 Limits to service export growth in the semi-periphery and periphery? 32211.5 Geography of services 32511.6 Variety in the internationalization of services 332
Summary 347Key sources and suggested reading 349
PART 4ADJUSTING TO THE WORLD ECONOMY 351
12 International and supranational institutionalized integration 353
12.1 Economic change and geopolitics 35312.2 International and supranational institutionalized integration 35612.3 Spatial outcomes of economic integration 362
Summary 377Key sources and suggested reading 378
13 Reassertion of the local in the age of the global: Regions and localities within the world economy 379
13.1 Regionalism and regional policy 38013.2 Nationalist separatism 38613.3 Grassroots reactions 391
Summary 396Key sources and suggested reading 397
14 Conclusion 398
Key sources and suggested reading 401
Glossary 403
Bibliography 423
Index 453
CONTENTS vii
6063 GEOGRAPHY WORLD ECON_PT_246x189 mm 22/01/2014 15:09 Page vii
1.1 The inter-relationships surrounding economic organization and spatial change 6
1.2 Major features of economic change in the world’s developed economies 81.3 Employment outsourcing and insourcing, United States 141.4 Basic elements of commodity chains 152.1 The world-system: core, semi-periphery and periphery 222.2 GDP per capita (PPP, constant 2005 international dollars) 222.3 Gap in growth of GDP per capita (PPP, constant 2005 international dollars) 232.4 Happy planet index, 2012 272.5 Change in human development index (HDI) in regions as a percentage
of potential 272.6 Human development index (HDI) 282.7 Human development index (HDI), 2011 282.8 North American shale plays 312.9 Estimated shale gas resources in 14 regions 312.10 Marine “dead zones” 312.11 World energy consumption by fuel, historical and projected 352.12 The world’s cultivable land 372.13 Stress on freshwater supplies, 1995 and 2025 382.14 Ecological footprint 392.15 Share of agricultural products in world merchandise exports, 1950–2009 402.16 The demographic transition 412.17 Demographic transition map of the world 422.18 Remittance flows 432.19 Remittance flows, top countries, 2010 442.20 Share of a country’s nationals with a university degree living in an(other)
OECD country 452.21 Growth in volume of world merchandise trade and GDP, 2005–13
(annual % change) 502.22 Trade, imports and exports 512.23 Intra- vs. inter-regional connectedness of major exporters 522.24 Index of commodity concentration of exports, 2011 532.25 Government debt of euro-zone countries, 2011 (Maastricht limit: 60%) 552.26 Iceland and the global financial crisis 573.1 Shifting fortunes in the world economy (after Maddison) 623.2 Corruption perceptions index, 2011 633.3 The increasing pace of the world economy 693.4 F.D.I. inflows, developed, developing, and transitioning* countries
(*includes South-East Europe and Commonwealth of Independent States) 693.5 United States military expenditure 76
Figures
6063 GEOGRAPHY WORLD ECON_PT_246x189 mm 22/01/2014 15:09 Page viii
3.6 The product life cycle model and possible effects on U.S. production and trade (after Vernon, 1966) 83
3.7 Cheaper transport and communications costs on the global highway 884.1 The urbanization of the classical world 994.2 Plan of a medieval manor 1034.3 The rise of merchant capitalism and the changing space-economy 1054.4 Towns and cities of the Hanseatic League 1054.5 The emergence of a European-based world-system 1084.6 Transoceanic rim settlements of the mercantile era 1104.7 Colonialism and urban settlement patterns 1145.1 Output growth in Western Europe, 500–1990 1185.2 Europe in 1875 1215.3 Core and periphery in Europe 1245.4 The American Manufacturing Belt in 1919 (after Conzen, 1981: 340,
Figure 9.13) 1285.5 Index of manufacturing production for selected countries 1346.1 Forces in the deindustrialization of the United Kingdom: dramatic loss of
competitiveness (1978–83) and consequent import penetration 1486.2 Internet users 1496.3 Boeing’s 787 Dreamliner global production system 1656.4 The changing global geography of clothing manufacturing 1687.1 The foreign automobile industry in the United States 1847.2 Research and development (R&D) in the USA by U.S. affiliates of
foreign companies and R&D performed abroad by foreign affiliates of U.S. TNCs 185
7.3 Geography of an Indian offshore services provider 1877.4 The system of world cities 1917.5 Employment by sector in the United Kingdom 1957.6 Employment shares, by economic sector, USA 1967.7 French competitiveness clusters 2007.8 Regional inequality across the European Union 2067.9 An index of deprivation in England in 2010, by district level
(average score) 2077.10 The relationship between interregional inequality and levels of economic
development, as posited by Williamson (1965) 2087.11 Regional trends in per capita incomes in the United States 2097.12 Myrdal’s model of regional cumulative causation 2108.1 Geographical extent of European political control, 1500–1950 2148.2 Long waves and colonization: the two long waves of colonial expansion
and contraction 2168.3 The Atlantic system, 1650–1850 2198.4 Geographical distribution of British foreign investment, 1860–1959 2208.5 Colonization of Africa: (A) 1850; (B) 1914 2208.6 World steamship routes, by volume of trade, 1913 2218.7 Telegraph system in Asia and Africa, 1897 2228.8 Development of roads and railways in the River Plate region of South
America, 1885–1978 2238.9 New states of the world since the Second World War 231
FIGURES ix
6063 GEOGRAPHY WORLD ECON_PT_246x189 mm 22/01/2014 15:09 Page ix
8.10 Exports between and from developed and less developed countries, 2001–2010 236
8.11 Soviet and U.S. spheres of influence, 1982 2389.1 External migration flows in Sub-Saharan Africa 257
10.1 Manufacturing as a percentage of GDP, 2010 28610.2 Three “tests” of industrialization, 1975 and 2004 28710.3 The geography of growth in manufacturing output, 1995–2005 28910.4 Share of certain NIEs in total LDC exports, 2005–06 by value 28910.5 Labour processes in three manufacturing industries 29010.6 Locally owned electronics industry plants in Malaysia, 1999 29110.7 Share of U.S. and European companies’ outsourcing contracts with
an offshore element, 2003–12 29310.8 Manufacturing establishments of the Japanese electronics industry
in Asia, 1995 29710.9 Economic and demographic growth in China 30510.10 Percentage of China’s GDP from industry and services 30711.1 Changing share of employment in primary, secondary and tertiary
sectors of the economy 31411.2 Service employment and GDP per capita, selected countries 31411.3 The world’s largest service providers 31511.4 Service encapsulation 31811.5 Submarine fiber-optic cable network 32311.6 Percentage of workers in services 32711.7 Informal economy and level of development 327 11.8 Average annual percentage growth in services 32811.9 Service production 32811.10 Exports and imports of services, 2010 33011.11 International tourist arrivals and receipts, 2006 33711.12 The world’s major stock markets 34311.13 Major world areas of offshore banking 34311.14 Global R&D service providers, 2012 34712.1 Selected supranational integration agreements 35812.2 Enlargement of the European Union 36812.3 Regional policy in the European Union, 2007–2013 37413.1 The Thatcher government’s rolling back of regional aid, 1979–84 38513.2 Governmental decentralization of Russia, 1993 38913.3 Geographical clustering of export shares in Italy, by province, 1985–1999 39213.4 How plant size in the United States has shrunk 393
FIGURESx
6063 GEOGRAPHY WORLD ECON_PT_246x189 mm 22/01/2014 15:09 Page x
1.1 Technology systems and the evolution of the world economy 111.2 Global foreign exchange market turnover (daily averages, US$ billions) 172.1 World manufacturing 462.2 World’s top non-financial TNCs ranked by foreign assets, 2010 472.3 Types of special economic zone 483.1 The continuum of geographical incorporation into the world economy 653.2 The geographical development of the world economy in the nineteenth
century 663.3 The institutions and ideological basis of the world’s dominant capitalisms 723.4 The old and the new pillars of world trade 813.5 “Hymer’s stereotype”, in which the space–process relationship takes
the form A→B→C 873.6 Spatial transaction costs versus externalities: six scenarios 885.1 Growth rates in Europe 1236.1 Percentage of value of shipments accounted for by the four largest
companies in selected manufacturing industries in the USA 1566.2 Inter- and intra-regional merchandise trade, 2011 (US$ billions) 1606.3 United States trade in goods and services with the European Union
(US$ billions) 1616.4 Contrasts in production and labor: Fordism versus flexible production 1637.1 Contrasts in governance: Fordism versus flexible production 1827.2 World Internet users 1997.3 Propulsive industries and new industrial spaces 2038.1 Stock of foreign capital investment held by Europe, 1825–1915
(US$ billion) 2208.2 World exports by region, 1876–1937, percent of total 2248.3 World imports by region, 1876–1937, percent of total 2248.4 Barter terms of trade and world prices for primary product commodity
groups 2328.5 Adaptations to global capitalism 2439.1 Food production per capita for selected countries (2004–2006 = 100) 2499.2 Land, labor, capital, and markets: haciendas and plantations 2529.3 Index of total (and per capita) gross agricultural production: selected
African countries (2004–2006 = 100) 2559.4 Average farm size, 2010 2589.5 A typology of land reforms 2619.6 Selected export crops in some Latin American countries (metric tons) 266
10.1 Labor conditions in global manufacturing 27810.2 Changing geography of manufacturing employment: paid employment in
manufacturing (millions of people) 279
Tables
6063 GEOGRAPHY WORLD ECON_PT_246x189 mm 22/01/2014 15:09 Page xi
10.3 International variations in the concentration of incomes (higher figures indicate greater inequality) 284
10.4 Manufacturing plants outside the USA owned or leased by top US electronics corporations, 2013 292
10.5 Stages in South Korea’s export-oriented industrial development 29610.6 China Mobile Limited’s cellphone global production system 29810.7 The BRIC road to economic growth 30911.1 Deciphering the outsourcing terminology 32111.2 Changing employment in services as a percentage of total employment 32611.3 EPZs targeting services 33111.4 Wal-Mart retail stores 33411.5 World’s largest financial TNCs, 2011 34111.6 E-finance, 2009 34211.7 Major international business process outsourcing (BPO) corporations 34512.1 Average tariff levels (percent) for selected countries, 1988 and 2009–2011 359
TABLESxii
6063 GEOGRAPHY WORLD ECON_PT_246x189 mm 22/01/2014 15:09 Page xii
1.1 Outsourcing and global commodity chains 141.2 Barbie: American icon and global product 162.1 HIV/AIDS and the impact on development in Sub-Saharan Africa 242.2 Indicators of well-being 262.3 E-waste and the digital divide 332.4 Migrant workers’ remittances 432.5 From darling to disaster: Iceland and the global financial crisis 563.1 Neoliberalism 773.2 The semiconductor industry and the workings of the market-access regime 845.1 Core and periphery in Europe 1245.2 The growth of the U.S. manufacturing belt 1275.3 Regional dimensions of Japanese industrialization 1356.1 Technological breakthroughs and the information economy 1506.2 Fast fashion and IT: Zara responds rapidly to changing customer demand 1546.3 The changing geography of the clothing industry 1676.4 The myth of the new industrial districts of the Third Italy? 1706.5 Coming to America? 1737.1 The Sunbelt 1887.2 Agglomeration and the “relational turn” in economic geography:
Motorsport Valley 1897.3 The digital divide 1987.4 The demise of the Celtic Tiger 2027.5 Hollywood and the cultural economy of cities 2047.6 National economic development and regional inequality 2088.1 The Asian financial crisis 2409.1 The coffee commodity chain 2489.2 From free trade to fair trade? 2509.3 Agribusiness and the developed countries 2639.4 The great land grab? 2659.5 Science and rice 271
10.1 Dreaming the BRIC future 30811.1 Bucking the Fisher-Clark thesis in China? Concurrent growth of
manufacturing and services 32011.2 A day in the life of a call center worker in India 32511.3 Wal-Mart® 33411.4 Abu Dhabi, a tourist Mecca? 33811.5 India’s competitive advantage in BPO 34612.1 Genetically modified foods and U.S.–EU trade 37513.1 International terrorism 389
Boxes
6063 GEOGRAPHY WORLD ECON_PT_246x189 mm 22/01/2014 15:09 Page xiii
The authors would like to thank the following organizations for permission to use the materiallisted:
Figure 1.4 from “Shifting governance structures in global commodity chains, with specialreference to the Internet,” by Gereffi, published in American Behavioral Scientist 44, 2001,with permission of Sage Publications.
Figure 2.8 from Energy in Brief: What is shale gas and why is it important? by E.I.A. (U.S.Energy Information Administration, U.S. Department of Energy) 2012.
Figure 2.9 from Analysis and Projections: World shale gas resources: An initial assessment of14 regions outside the United States by E.I.A. (U.S. Energy Information Administration,U.S. Department of Energy) 2011.
Figure 2.10 from Aquatic Dead Zones by NASA, Earth Observatory, 2008.Figure 2.13 from Vital Water Graphics: An overview of the state of the world’s fresh and
marine waters by UNEP (United Nations Environment Program) 2002.Figure 2.14 from Living Planet Report 2010: Biodiversity, biocapacity and development by
WWF (World Wide Fund for Nature) 2010.Figure 2.18 from Human Development Report 2009: Overcoming barriers: Human mobility
and development by UNDP (United Nations Development Program) 2009.Figure 2.20 from Poverty Reduction and Social Development: Migration and the brain drain
phenomenon by OECD (Organization for Economic Cooperation and Development) nd.Figure 2.21 from World Trade 2011, Prospects for 2012: Trade growth to slow in 2012 after
strong deceleration in 2011 by WTO (World Trade Organization) 2012.Figure 3.2 from Corruption Perceptions Index 2011 by Transparency International, 2012.Figure 4.1 from An Introduction to Urban Historical Geography, 1983, by Carter, with
permission from Routledge.Figure 4.2 from the Historical Atlas, 1923, by Shepherd, with permission from the Perry-
Castañeda Library Map Collection, University of Texas at Austin.Figure 5.2 from Peaceful Conquest: The industrialization of Europe, 1760–1970, 1981, by
Pollard, with permission of Oxford University Press.Figure 6.1 from “Industrial restructuring: an international problem,” by Hamilton, published
in Geoforum 15, 1984, with permission of Elsevier.Figure 6.3 from “Boeing’s outsourcing for the 787 Dreamliner,” published in Seattle Times,
2006, 29 September, with permission of Seattle Times.Figure 7.2 from Science and Engineering Indicators 2012, 2012, by National Science Board,
with permission of National Science Foundation.Figure 7.3 from The Offshore Services Value Chain, 2010, by G. Gereffi and K. Fernandez-
Stark, with permission of G. Gereffi, Duke University, North Carolina, Center onGlobalization, Governance, and Competitiveness (CGGC) http://www.cggc.duke.edu/pdfs/CGGC CORFO_The_Offshore_Services_Global_Value_Chain_March_1_2010.pdf
Acknowledgements
6063 GEOGRAPHY WORLD ECON_PT_246x189 mm 22/01/2014 15:09 Page xiv
Figure 8.8 from “The River Plate countries,” by Crossley, published in Blakemoor and Smith(eds) Latin America: Geographical perspectives, 2nd edition, 1983, with permission ofRoutledge.
Figure 12.3 from Regional Policy—Inforegio: Cohesion policy 2007–2013 by the EuropeanCommission.
Every effort has been made to trace copyright holders of material reproduced in this book.Any rights not acknowledged here will be acknowledged in subsequent printings if notice isgiven to the publisher.
We are indebted to many of our colleagues for their advice at various stages in the conceptionand preparation of this book, and in its current revision. We would particularly like to recognizeStuart Corbridge, Raymundo Cota, Bob Dyck, Richard Grant, Larry Grossman, NaeemInayatullah, D. Michael Kirchoff, Soo-Seong Lee, Andrew Leyshon, Ragnhild Lund, SallieMarston, Ezzeddine Moudoud, Pritti Ramamurthy, Bon Richardson, Susan Roberts, David J.Robinson, Freddy Robles, Mark Rupert, David Short, Barney Warf, and Colin Warren fortheir contributions.
ACKNOWLEDGEMENTS xv
6063 GEOGRAPHY WORLD ECON_PT_246x189 mm 22/01/2014 15:09 Page xv

6063 GEOGRAPHY WORLD ECON_PT_246x189 mm 22/01/2014 15:09 Page xvi
This page intentionally left blank
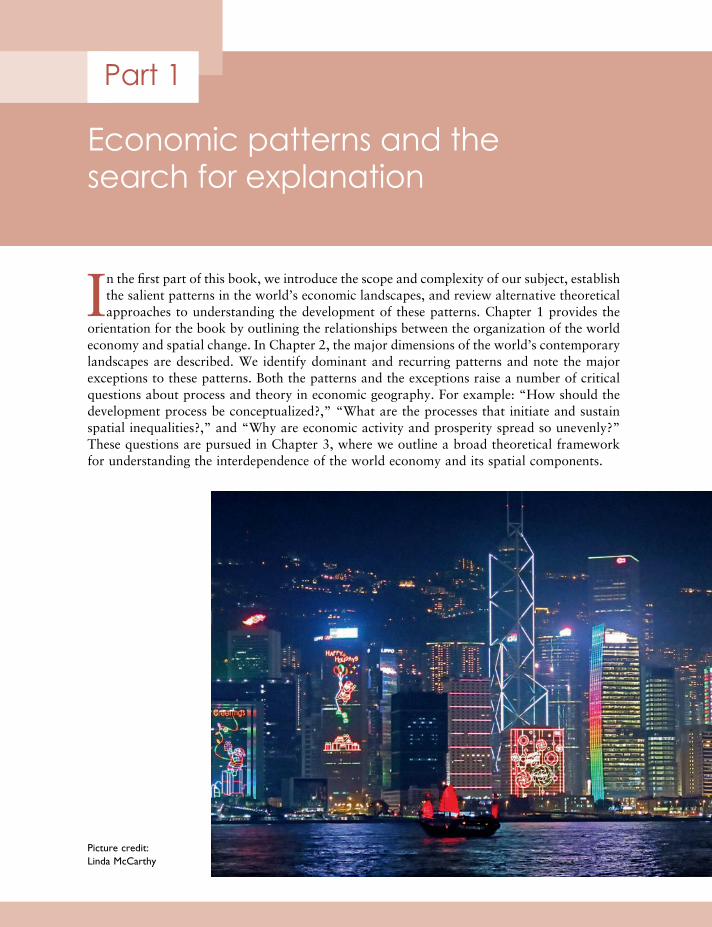
Part 1
Economic patterns and thesearch for explanation
Picture credit: Linda McCarthy
In the first part of this book, we introduce the scope and complexity of our subject, establishthe salient patterns in the world’s economic landscapes, and review alternative theoreticalapproaches to understanding the development of these patterns. Chapter 1 provides the
orientation for the book by outlining the relationships between the organization of the worldeconomy and spatial change. In Chapter 2, the major dimensions of the world’s contemporarylandscapes are described. We identify dominant and recurring patterns and note the majorexceptions to these patterns. Both the patterns and the exceptions raise a number of criticalquestions about process and theory in economic geography. For example: “How should thedevelopment process be conceptualized?,” “What are the processes that initiate and sustainspatial inequalities?,” and “Why are economic activity and prosperity spread so unevenly?”These questions are pursued in Chapter 3, where we outline a broad theoretical frameworkfor under standing the interdependence of the world economy and its spatial components.
6063 GEOGRAPHY WORLD ECON_PT_246x189 mm 22/01/2014 15:09 Page 1

6063 GEOGRAPHY WORLD ECON_PT_246x189 mm 22/01/2014 15:09 Page 2
This page intentionally left blank
The perspective of this book is global. Although local, regional, and national circum -stances remain important, what happens in any given locale is increasingly influencedby its role in and relationship to systems of production, trade, and consumption that
are global in scope.In the 1970s, only a few less developed countries (LDCs) had opened their borders to trade
and investment. About one-third of the world’s labor force lived in countries with centrallyplanned economies. Another third lived in countries insulated from international markets byprotective trade barriers and currency controls.
Today, more than 7 billion people populate our planet, and most live in countries that havebeen integrated into global markets. Three population blocs—China, India, and the republicsof the former Soviet Union—account for more than 40 percent of the world’s labor force andare important participants in the global market. Many other countries such as the newlyindustrializing economies (NIEs) of Brazil, Hong Kong, Singapore, South Korea, and Taiwanhave also become vital contributors to the world economy.
More than two decades ago, Robert Reich, former U.S. Secretary of Labor, underscoredthe significance of the rapid pace of globalization:
We are living through a transformation that will rearrange the politics and economics of the comingcentury. There will be no national products or technologies, no national corporations, no nationalindustries. There will no longer be national economies, at least as we have come to understandthat concept. . . . As almost every factor of production—money, technology, factories, andequipment—moves effortlessly across borders, the very idea of a U.S. economy is becomingmeaning less, as are the notions of a U.S. corporation, U.S. capital, U.S. products, and U.S.technology.
(Reich, 1991: 3, 8)
Picture credit: Linda McCarthy
Chapter 1
The changingworld economy
6063 GEOGRAPHY WORLD ECON_PT_246x189 mm 22/01/2014 15:09 Page 3
People are not only increasingly interconnected; they are interdependent as the followingnarratives generated by the World Bank illustrate:
Joe lives in a small town in southern Texas. His old job as an accounts clerk in a textile firm,where he had worked for many years, was not very secure. He earned $50 a day, but promisesof promotion never came through, and the firm eventually went out of business as cheap importsfrom Mexico forced textile prices down. Joe went back to college to study business administrationand was recently hired by one of the new banks in the area. He enjoys a comfortable living evenafter making the monthly payments on his government-subsidized student loan.
Maria recently moved from her central Mexican village and now works in a U.S.-owned factoryin Mexico’s maquiladora sector. Her husband, Juan, runs a small car upholstery business andsometimes crosses the border during the harvest season to work illegally on farms in California.Maria, Juan, and their son have improved their standard of living since moving out of subsistenceagriculture, but Maria’s wage has not increased in years; she still earns about $10 a day but doesnot complain because she has heard rumors that the company is considering moving the factoryto China.
Xiao Zhi is an industrial worker in Shenzhen, a Special Economic Zone in China. After three difficultyears on the road as part of China’s floating population, fleeing the poverty of nearby Sichuanprovince, he has finally settled with a new firm from Hong Kong that produces garments for theU.S. market. He can now afford more than a bowl of rice for his daily meal. He makes $2 a dayand is hopeful for the future.
The complex relationships revealed in this anecdote would have been unthinkable 30 yearsago.
Although the outcomes in this tale are positive—Joe secured a position at a bank and earnsa comfortable living; Maria and her family improved their standards of living; and Xiao Zhiescaped poverty—not everyone benefits from globalization. Although the world is increasinglyflat with capital crossing borders in nanoseconds in the pursuit of the highest rate of returnand corporations locating operations where labor markets, tax codes, and regulatory regimesare most favorable, it is not necessarily increasingly fair.
In a hypothetical sequel to the World Bank narratives, the bank where Joe worked leveragedits portfolio with uncollateralized debt and had to close its doors at the height of the globalfinancial crisis. With no income and a mortgage that exceeded the value of his house, Joe wasforced to file for bankruptcy, but he still owes $830 per month on his student loans. He wasfortunate enough to find a part-time job at a Wal-Mart warehouse, but with a one-way commuteof 56 miles and gas prices nearing $4 per gallon, he cannot afford health insurance.
Juan was detained by border patrol and has joined approximately 390,000 other illegalimmigrants incarcerated indefinitely in U.S. detention centers. The recession bloated inventoriesand decreased the demand for textiles produced in the factory where Maria worked. Whenshe was laid off, she was forced to withdraw her son from school, move in with relatives, andreturn to subsistence farming.
And poor Xiao Zhi contracted a skin infection when he was forced to handle chemicals inthe factory without protective gloves. The floor manager fired him when he could no longermaintain the required pace of production. After many failed attempts to secure another jobin Shenzhen, he returned to Sichuan province but remains hopeful that the herbal remediesprescribed by the village doctor will heal him sufficiently so, one day, he will be able to earn$2 per day again.
ECONOMIC PATTERNS AND THE SEARCH FOR EXPLANATION4
6063 GEOGRAPHY WORLD ECON_PT_246x189 mm 22/01/2014 15:09 Page 4
1.1 STUDYING THE WORLD ECONOMYHow can one make sense of these stories? On the surface, cause-and-effect seem straight-forward—the demand for textiles declined; Maria lost her job—but in the undercurrent onediscovers a complex array of forces that have broad and dramatic effects that can often producesurprising and unexpected results. Deciphering the impact of those forces, interpreting theirlocal, regional, and national implications and how they alter the contours of the economiclandscape is the job of the economic geographer.
What are the implications of the Arab Spring; persistently high unemployment rates in EUcountries such as Italy and Spain; the AIDS pandemic in Africa; continued environmentaldegradation in China; increased immigration to the EU from countries in North Africa and theMiddle East; growing income inequality and increasingly polarized political landscape in theUnited States; technological advances such as fracking that enable the extraction of previouslyunprofitable carbon fuels; and the greater magnitude and frequency of natural disasters?
In addition to these headline-grabbing phenomena, what are the local, regional, andnational implications of less newsworthy but equally profound changes in the world economysuch as resource grabbing in Africa by developed countries, the rapid spread of geneticallymodified organisms (GMOs) in agricultural production, and technological advances that haveenabled cost-effective 3-D printing?
How can we interpret the significance of specific changes that have been occurring in theworld’s economic landscapes: The deindustrialization of traditional manufacturing regions (for example, the Rustbelt around the Great Lakes in the United States, northern England,the Ruhr region in Germany), the economic revival of formerly “lagging” regions (for example,New England, Bavaria), the spread of branch plants in the towns and cities of some NIEs (forexample, Taipei, Seoul), the emergence of high-technology complexes (for example, SiliconValley in California, the Research Triangle in North Carolina), the consolidation of globalfinancial and corporate control functions in a few cities (London, New York, Tokyo), and theunprecedented rates of urbanization in China’s coastal regions?
Our task is to develop an understanding of the general economic forces and socioeconomicrelationships within the world economy and of the unique features that represent local andhistorical variability.
But first we need to clarify the use of the terms “general” and “unique” as well as a thirdterm, “singular”:
• General: Widespread phenomena, such as migration or colonialism.• Unique: Distinctive phenomena—where there are no other instances of it—but its distinctive-
ness can be explained by a particular combination of general processes and individualresponses. An example of this would be the migration streams prompted by the famine in Ireland in the mid-1800s. The general processes that precipitated the famine wereenvironmental (potato blight) and governmental (laissez-faire policy); in response, manypeople emigrated, including to the United States.
• Singular: Distinctive phenomena that cannot be accounted for by combinations of generalprocesses and individual responses. An example would be the growth of the automobileindustry in Detroit. With no established pattern of manufacturing, automobile manufacturecould have developed in any number of cities; but Detroit was Henry Ford’s home town(his father had emigrated to Michigan from Ireland to flee the famine), and he put his ideasinto practice there.
With these concepts in hand, we can begin to map some of the interrelationships betweeneconomic organization and spatial change.
1. THE CHANGING WORLD ECONOMY 5
6063 GEOGRAPHY WORLD ECON_PT_246x189 mm 22/01/2014 15:09 Page 5
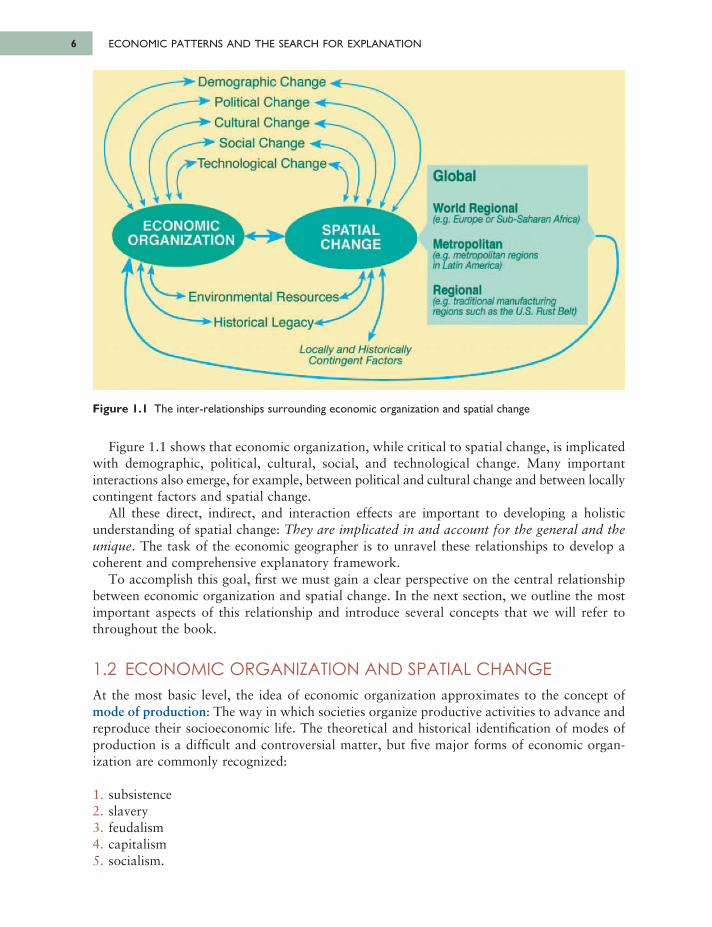
Figure 1.1 shows that economic organization, while critical to spatial change, is implicatedwith demographic, political, cultural, social, and technological change. Many importantinteractions also emerge, for example, between political and cultural change and between locallycontingent factors and spatial change.
All these direct, indirect, and interaction effects are important to developing a holisticunderstanding of spatial change: They are implicated in and account for the general and theunique. The task of the economic geographer is to unravel these relationships to develop acoherent and comprehensive explanatory framework.
To accomplish this goal, first we must gain a clear perspective on the central relationshipbetween economic organization and spatial change. In the next section, we outline the mostimportant aspects of this relationship and introduce several concepts that we will refer tothroughout the book.
1.2 ECONOMIC ORGANIZATION AND SPATIAL CHANGEAt the most basic level, the idea of economic organization approximates to the concept ofmode of production: The way in which societies organize productive activities to advance andreproduce their socioeconomic life. The theoretical and historical identification of modes ofproduction is a difficult and controversial matter, but five major forms of economic organ -ization are commonly recognized:
1. subsistence2. slavery3. feudalism4. capitalism5. socialism.
ECONOMIC PATTERNS AND THE SEARCH FOR EXPLANATION6
Figure 1.1 The inter-relationships surrounding economic organization and spatial change
6063 GEOGRAPHY WORLD ECON_PT_246x189 mm 22/01/2014 15:09 Page 6
Demographic ChangePolitical ChangeCultural ChangeSocial Change ·
Technological Change
SPATIALCHANGE
Global
World Regional(e.g. Europe or Sub-Saharan Africa)
Metropolitan(e.g. metropolitan regions in Latin America)
Regional(e.g. traditional manufacturing regions such as the U.S. Rust Belt)
ECONOMIC ORGANIZATIOr*
* Environmental Resources-
-Historical Legacy
Locally and Historically Contingent Factors
These broad categories also can be broken down into more specific forms of economicorganization. For example, scholars have often found it useful to differentiate betweenmerchant capitalism (or mercantilism), industrial (or competitive) capitalism, organizedcapitalism, and advanced (or globalized) capitalism.
What distinguishes these forms of economic organization are differences in the relationshipsbetween the factors of production such as land and other natural resources, labor, andphysical and human capital. Under slavery, for example, the laborer is private property andmay be bought and sold similar to any other instrument of production. Under feudalism (orrank redistribution), peasant laborers are legally tied to specific tracts of land. They may ownsome of the instruments of production, but the land and a percentage of the product of theirlabor is the property of the feudal lord. Under capitalism, the laborers own no instrumentsof production, but they are free to sell their labor power.
Different forms of economic organization are also characterized by different forces ofproduction (for example, technology, machinery, means of transportation) and social forma -tions (with specific proportions of participants from various social classes).
The economic “logic” of these different forms of economic organization results in sub -stantially different forms of spatial organization. Where feudalism translates into a patchworkof self-sufficient domains with little trade and, therefore, few market centers, merchantcapitalism requires a highly developed system of market towns and an inherent tendency tocolonize new territories to amass the wealth and resources necessary to sustain ever expandingmarkets.
In contrast to feudalism and mercantilism, industrial capitalism requires spatial restructuringthat enables the exploitation of new energy sources, development of increasingly efficientproduction techniques, and the adoption of new forms of corporate organization. Mining andmanufacturing towns appear, and whole regions, such as the manufacturing cities around theGreat Lakes or the Ruhr region of Germany, become specialized in certain kinds of industrialproduction.
The “classic” sequence of transformation from one form of economic organization to anotherruns from subsistence economies through slavery, feudalism, mercantilism, industrial capital -ism, and advanced capitalism.
This sequence is also distinctly European. The rise of capitalism in much of Europe andthe subsequent drive to acquire resources to propel economic growth led to different sequences of development in other regions. In North America, capitalism was imposed directly on the subsistence economies of Native American communities. In Japan, feudalismwas uprooted suddenly by state-sponsored industrial capitalism. In Russia, an embryonicindustrial capitalism was displaced by a socialism that soon gave way to state capitalism. Today,in many lesser developed countries, aspects of multiple forms of economic organization may also coexist. As a result of these variations, important regional differences have emergedin the world economy.
Spatial change and further regional differentiation also occurs with the evolution of formsof economic organization. So a regional agricultural landscape must be seen as one of a numberof possible realizations rather than a straightforward reflection of a particular form of eco -nomic organization. Each economic landscape should be interpreted, therefore, as the productof broad economic forces interacting with local social, cultural, political, and environmentalfactors: A product of the general and the unique.
1. THE CHANGING WORLD ECONOMY 7
6063 GEOGRAPHY WORLD ECON_PT_246x189 mm 22/01/2014 15:09 Page 7
ECONOMIC PATTERNS AND THE SEARCH FOR EXPLANATION8
THE EVOLUTION OF CAPITALISM
The evolution of the capitalist system of economic organization has been perhaps the mostimportant influence on the development of the world’s economic landscape. Its evolution canbe traced through three broad phases: Competitive, organized, and globalized capitalism.
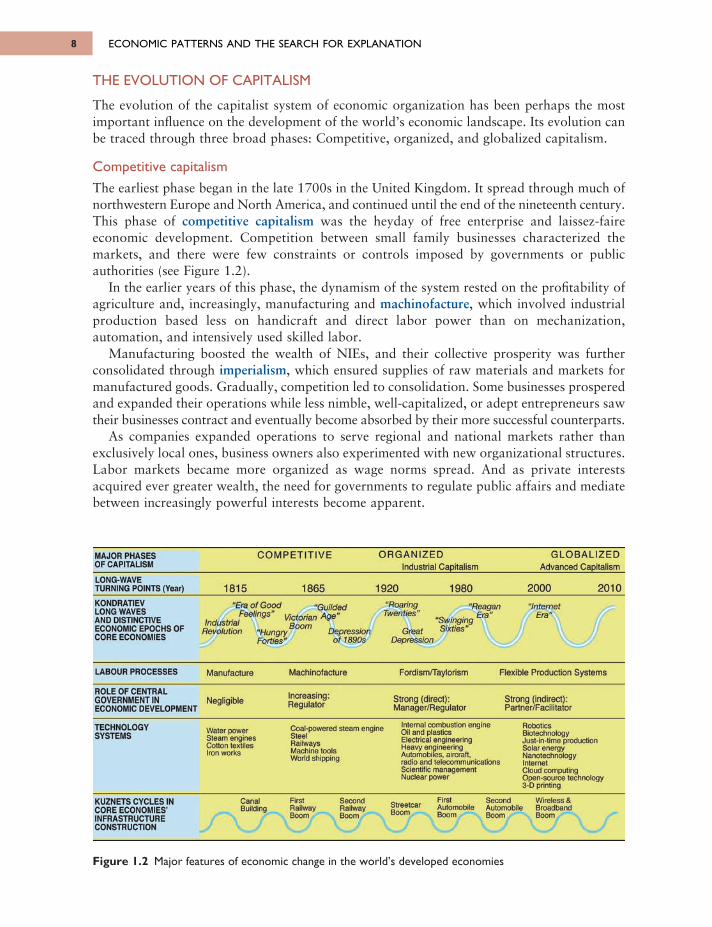
Competitive capitalismThe earliest phase began in the late 1700s in the United Kingdom. It spread through much ofnorthwestern Europe and North America, and continued until the end of the nineteenth century.This phase of competitive capitalism was the heyday of free enterprise and laissez-faireeconomic development. Competition between small family businesses characterized themarkets, and there were few constraints or controls imposed by governments or publicauthorities (see Figure 1.2).
In the earlier years of this phase, the dynamism of the system rested on the profitability ofagriculture and, increasingly, manufacturing and machinofacture, which involved industrialproduction based less on handicraft and direct labor power than on mechanization,automation, and intensively used skilled labor.
Manufacturing boosted the wealth of NIEs, and their collective prosperity was furtherconsolidated through imperialism, which ensured supplies of raw materials and markets formanufactured goods. Gradually, competition led to consolidation. Some businesses prosperedand expanded their operations while less nimble, well-capitalized, or adept entrepreneurs sawtheir businesses contract and eventually become absorbed by their more successful counterparts.
As companies expanded operations to serve regional and national markets rather thanexclusively local ones, business owners also experimented with new organizational structures.Labor markets became more organized as wage norms spread. And as private interestsacquired ever greater wealth, the need for governments to regulate public affairs and mediatebetween increasingly powerful interests become apparent.
Figure 1.2 Major features of economic change in the world’s developed economies
6063 GEOGRAPHY WORLD ECON_PT_246x189 mm 22/01/2014 15:09 Page 8
MAJOR PHASES OF CAPITALISM
LONG-WAVE TURNING POINTS (Year)
C O M P E T IT IV E O R G A N IZ E DIndustrial Capitalism
G L O B A L IZ E DAdvanced Capitalism
1815 1865 1920 1980 2000 2010“Era o f Good
Feelings" VictorianBoomIndustria l
Revolution "HungryForties"
"G uilded n A g e "
Depression o f 1890s
“Roaring Twenties"
GreatDepression
“Sw inging Sixties"
"Reagan6 . ·
“Internet Era"
KONDRATIEV LONG WAVES AND DISTINCTIVE ECONOMIC EPOCHS OF CORE ECONOMIES
LABOUR PROCESSES
ROLE OF CENTRAL GOVERNMENT IN ECONOMIC DEVELOPMENT
TECHNOLOGYSYSTEMS
Manufacture
Negligible
M achinofacture FordisnVTaytorism Flexible Production Systems
Strong (indirect): Partner/Facilitatoi
Strong (direct): Manager/Regulator
Increasing:Regulator
Water power Steam engines Cotton textiles Iron works
Coal-powered steam engineSteelRailwaysMachine toolsWorld shipping
Internal combustion engine Oil and plastics Electrical engineering Heavy engineering Automobiles, aircraft, radio and telecommunications Scientific management Nudear power
Robotics Biotechnology Just-in-time production Solar energy Nanotechnology InternetCloud computing Open-source technology 3-D printing
CanalBuilding
FirstRailwayBoom
SecondRailwayBoom
StreetcarBoom
FirstAutomobileBoom
SecondAutomobileBoom
Wireless S Broad barn Boom
KUZNETS CYCLES IN CORE ECONOMIES’ INFRASTRUCTURE CONSTRUCTION
Near the end of this phase of capitalism, the United States also surpassed the United Kingdomas the leading industrial economy.
Organized capitalism
By the early 1900s these trends had altered the nature of the capitalist enterprise so significantlythat a new phase—organized capitalism—was demarcated.
In the early decades of the twentieth century, profitability became increasingly dependenton new labor processes. Fordism, named after the automobile manufacturer Henry Ford,ushered in the era of mass production using assembly-line techniques. Frederick Winslow Taylor,an engineer and early critic of Fordism, also outlined the principles of scientific management(often known as Taylorism) which became central to the efficiency movement inmanufacturing.
During this period, mass production lowered the costs of many goods, and higher wagesand sophisticated advertising techniques fuelled mass consumption. In turn, mass consumptionand production initiated the race to find ever more efficient production processes and untappedmarkets.
A hallmark of this period was the emergence of a workable relationship between businessinterests and labor unions. Unions had grown in size and strength in the progressive era, andconstituted another increasingly important element of “organization.” Government alsoexpanded the scope of its activities in part to mediate the relationship between organizedbusiness and labor.
The market failures that triggered the Great Depression of 1929–1934 undermined thelegitimacy of classical economic liberalism and led to its eclipse in the New Deal era by anegalitarian liberalism that relied on the state to manage economic development and soften theunwanted side-effects of free market capitalism.
In this expanded role, government assumed responsibility for the management of thenational economy and the organization of various dimensions of social well-being. This typeof economic policy, which seeks to mitigate the deleterious effects of private market activityin aggregate through active fiscal and monetary policy, is known as Keynesianism after theeminent economist John Maynard Keynes.
Globalized capitalism
After the Second World War, another important transformation in the nature of capitalismbegan to take place and led to a third major phase: Advanced or globalized capitalism.
This period is characterized by a shift away from industrial production and toward services,particularly sophisticated financial and business services, as the basis for profitability withinthe more developed economies. Labor-intensive manufacturing declined althoughmanufacturing production continued to expand in these countries as sophisticated, technology-intensive manufacturing processes gained prominence.
The globalizing of the economy also meant that large transnational corporations (TNCs)were able to outmaneuver the national scope of governments and labor unions and contributedto a destabilization of the “organized” relationship between business, labor, and government.By the mid-1990s, the world’s largest TNCs accounted for two-thirds of international trade,and the largest ten reported total income that exceeded that of the world’s 100 poorest countries.
Meanwhile, Fordism became a victim of its own success as many markets were saturatedwith low-cost goods. As profit margins in conventional markets narrowed, many enterpriseschased revenues by catering to specialized market niches. Such specialization required flexibleproduction systems. The overall result has sometimes been labeled disorganized capitalism for
1. THE CHANGING WORLD ECONOMY 9
6063 GEOGRAPHY WORLD ECON_PT_246x189 mm 22/01/2014 15:09 Page 9
its distinct contrast to the orderly interdependence of business, labor, and government in thesystem of organized capitalism.
One of the driving forces behind growth during this phase of capitalism has been the global information (or knowledge) economy, a form of production and management whereproductivity and competitiveness rely heavily on knowledge generation and on gaining accessto and the rapid assimilation of new information.
A second critical driver of this era has been the ubiquity of high technology. In particular,the Internet has affected nearly every facet of the economy and sparked disruptive innovationthat has radically altered the dynamics of marketplaces and industries such as news and media,music, publishing, and advertising. Although the first phase of euphoric investment in Internettechnologies culminated in the bursting of the dot.com bubble in 2000, from its ashes emergeda number of robust and dynamic businesses such as Google, eBay, and Amazon.com thatcontinue to transform the economic landscape. With the expansion of broadband and wirelesstechnologies, cloud-computing, open source development tools, and the advent of Web 2.0,numerous platform technologies and social media enterprises such as YouTube, Twitter,Facebook, Flickr, and WordPress continue to change how people, companies, and institutionscollaborate, communicate, and compete with each other.
There is some question, however, about the sustainability of technological change as a driverof economic growth. We may have reached a technological plateau in which we continue toexploit yesterday’s ideas rather than develop new ones. For example, 80 percent of total growthin U.S. GDP between 1950 and 1993 came from the application of previously discovered ideasplus huge investments in education and scientific research that cannot be easily repeated inthe future. The overall rate of innovation from medieval times to the present peaked in thenineteenth century and has gone downhill since. So, we should be careful not to presume thatsomehow technological change will necessarily continue to endlessly create more growth.
TECHNOLOGY AND ECONOMIC DEVELOPMENT
The opening up of new markets, foreign or domestic, and the organizational development fromthe craft shop and factory to such concerns as U.S. Steel illustrate the same process of industrialmutation . . . that incessantly revolutionizes the economic structure from within, incessantlydestroying the old one, incessantly creating a new one. This process of Creative Destruction is theessential fact about capitalism.
(Schumpeter, 2010/1943: 73)
Coined by the Austrian economist Joseph A. Schumpeter, the term creative destructioncaptures the essence of the capitalism system—the relentless drive to innovate in the competitionfor markets—perhaps better than any other concept.
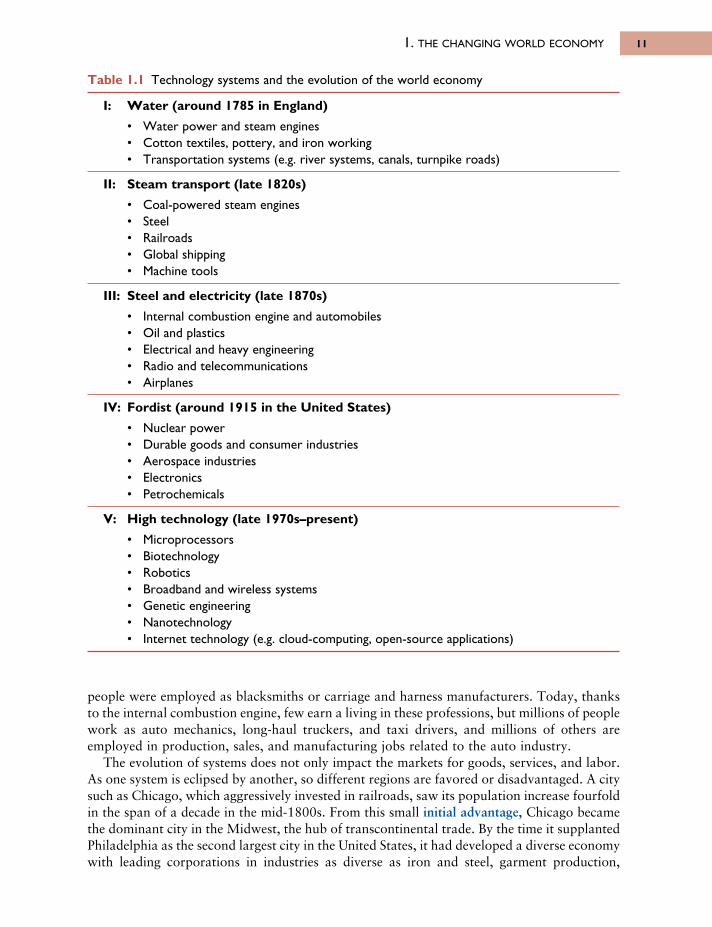
Creative destruction is at the heart of the broad structural shifts that occur in thedevelopment of technology systems (see Table 1.1). The transportation system providesperhaps the starkest example of creative destruction at work. With each advancement newmarkets opened, industries developed, and cities were built, but not without costs. Therailroads that opened the West in the United States also effectively closed the canal systemsthat had been built in the previous decades.
Technologies also destroy old jobs even as they create new ones. Typically, more primitivetechnologies are associated with higher levels of labor inputs than are more sophisticated ones.So as technology has become more central to economic development, employment, particularlyin limited or semi-skilled jobs, has suffered. The newest technologies today require “leaner”and more skilled labor than did the older ones. By way of example, in 1900 nearly 350,000
ECONOMIC PATTERNS AND THE SEARCH FOR EXPLANATION10
6063 GEOGRAPHY WORLD ECON_PT_246x189 mm 22/01/2014 15:09 Page 10
people were employed as blacksmiths or carriage and harness manufacturers. Today, thanksto the internal combustion engine, few earn a living in these professions, but millions of peoplework as auto mechanics, long-haul truckers, and taxi drivers, and millions of others areemployed in production, sales, and manufacturing jobs related to the auto industry.
The evolution of systems does not only impact the markets for goods, services, and labor.As one system is eclipsed by another, so different regions are favored or disadvantaged. A citysuch as Chicago, which aggressively invested in railroads, saw its population increase fourfoldin the span of a decade in the mid-1800s. From this small initial advantage, Chicago becamethe dominant city in the Midwest, the hub of transcontinental trade. By the time it supplantedPhiladelphia as the second largest city in the United States, it had developed a diverse economywith leading corporations in industries as diverse as iron and steel, garment production,
1. THE CHANGING WORLD ECONOMY 11
Table 1.1 Technology systems and the evolution of the world economy
I: Water (around 1785 in England)
• Water power and steam engines• Cotton textiles, pottery, and iron working• Transportation systems (e.g. river systems, canals, turnpike roads)
II: Steam transport (late 1820s)
• Coal-powered steam engines• Steel• Railroads• Global shipping• Machine tools
III: Steel and electricity (late 1870s)
• Internal combustion engine and automobiles• Oil and plastics• Electrical and heavy engineering• Radio and telecommunications• Airplanes
IV: Fordist (around 1915 in the United States)
• Nuclear power• Durable goods and consumer industries• Aerospace industries• Electronics• Petrochemicals
V: High technology (late 1970s–present)
• Microprocessors• Biotechnology• Robotics• Broadband and wireless systems• Genetic engineering• Nanotechnology• Internet technology (e.g. cloud-computing, open-source applications)
6063 GEOGRAPHY WORLD ECON_PT_246x189 mm 22/01/2014 15:09 Page 11
publishing, banking, insurance, and mail-order retail. During this rapid period of growth, italso surpassed older and initially larger cities such as St. Louis, which depended on and wereinvested in steamboat commerce.
As this example illustrates, changes in technology are crucial to understanding the geo -graphical path dependence of economic activities, that is, the historical relationship betweenpresent economic activities associated with a place and its past experience. As new technologieseclipse old ones, industries—and sometimes entire industrial regions—are “dismantled” (or,at least, neglected) as investors shift capital to fund the creation of new centers of profitabilityand employment.
1.3 SPATIAL DIVISIONS OF LABORThe evolution of capitalism has also brought about changes in the spatial division of labor.The division of labor within and between firms and over space is not fixed; rather, it respondsto changes in the historical-structural context in which firms operate.
For example, during the Fordist period in countries such as Britain and the United States,the basic division of labor was organized primarily within regional parts of the nationaleconomy. Plant, firm, and industry were national phenomena. They were organized aroundnational markets and industries, and they created national social (class) divisions. Althoughcapital, labor, and technology were often imported and exported, these factors of productionwere subject to intensive regulation by national governments.
The internal geography of a national economy such as Britain’s reflected its position in theinternational division of labor. In the 1930s Britain specialized in certain key manufacturingindustries such as coalmining, iron and steel manufacturing, and shipbuilding. Previousinvestments in these industries and the increasing returns to scale and external economies ofscale they generated defined Britain’s trading patterns. Elsewhere, different industries, oftennewer, mass-production ones based on larger firms, also took root. As a result, trade reflectedcumulative competitive advantages in sectors where each had a “head start.”
The locational consequences in the British case are laid out by Massey (1984: 28–29) asfollows:
It was the United Kingdom’s position as an imperial power, its early lead in the growth of modern industry, and its consequent commitment to free trade and its own specialization inmanufacturing within this international division of labor, which enabled the rapid growth, up to the First World War, of these major exporting industries. The spatial structures that wereestablished by those industries were those where all the stages of production of the commodityare concentrated within single geographical areas. The comparatively low level of separation offunctions within the process of production, and the relatively small variation in locationalrequirements between such potentially separable functions, were not sufficient to make geographicaldifferentiation a major attraction.
In other words, the spatial division of labor of key industries within national economies wasbased largely on different regional industrial specializations. And agglomeration was a majorfeature of economic organization across a number of manufacturing industries.
Similarly, in the United States during this period, the northeast contained a vast array ofspecialized manufacturing clusters—steel in Pittsburgh, automobiles in Detroit, chemicals inWilmington, and photographic equipment in Rochester—as well as regional areas of special -ization in agricultural (for example, tomatoes and sweet corn in the Garden State of NewJersey, low-bush blueberries in Maine, maple syrup in Vermont), and raw materials (for
ECONOMIC PATTERNS AND THE SEARCH FOR EXPLANATION12
6063 GEOGRAPHY WORLD ECON_PT_246x189 mm 22/01/2014 15:09 Page 12
1. THE CHANGING WORLD ECONOMY 13
example, stone quarries in the “granite state” of New Hampshire). In this respect, places andregions could readily be associated with specific products.
GLOBALIZATION AND CHANGING SPATIAL DIVISIONS OF LABOR
Under the conditions of flexible production, such regional specialization has been challengedand undermined to a considerable degree. Spatial divisions of labor are now structured in avariety of ways depending on the needs and characteristics of particular industries. In additionto (1) regional specialization and (2) regional dispersal (which has characterized consumerservices such as stores, restaurants, and hospitals, and some manufacturing industries such asshoe production and food processing), four additional spatial divisions of labor can beidentified:
1. Three-tier regional functional separationa. management and research activities in major metropolitan regionsb. skilled labor in “old” manufacturing areasc. unskilled labor in regional peripheries (to exploit lower wages and non-unionized labor
forces).2. Two-tier regional functional separation
a. management and research activities in major metropolitan regionsb. semi-skilled and unskilled labor in regional peripheries.
3. Regional and global functional separationa. management, research, and skilled labor in advanced industrial regionsb. unskilled labor in the global periphery.
4. Divisions by areas of growth and declinea. some areas characterized by investment, technical change, and job expansionb. other areas characterized by stagnant and progressively less competitive production and
job loss.
These new spatial divisions of labor have been possible because transportation andcommunications technologies have created an environment in which firms can decentralizeactivities associated with primary production yet maintain central control. A firm can remainheadquartered in New York, Zürich, or Hamburg, but locate manufacturing facilities in alocation such as Chennai, India, or the Monterrey-Nuevo Laredo corridor in Mexico and reapthe benefits of non-union labor forces, easier access to concentrated regional markets, andfavorable regulatory environments.
Under this new international division of labor (NIDL), investment and production are nolonger organized primarily around national economies. The process of production—mostobviously in the examples of the automobile, electronics, and software industries—is now global.Components or specific services are sourced from multiple suppliers in different countries andassembled in several locations (see Box 1.1).
In fact, many products no longer have any obvious nationality. It is difficult to distinguishsome “U.S.” from some “Japanese” cars, for example, now that U.S. car companies importvehicles under “their” names from Japan, and Japanese companies now manufacture cars inthe United States (for example, Honda in Marysville, Ohio, and Toyota in Blue Springs,Mississippi). Even manufacturing the Barbie doll, an all-American icon, includes operationsin a number of countries (see Box 1.2).
6063 GEOGRAPHY WORLD ECON_PT_246x189 mm 22/01/2014 15:09 Page 13
ECONOMIC PATTERNS AND THE SEARCH FOR EXPLANATION14
Box 1.1 Outsourcing and global commodity chains
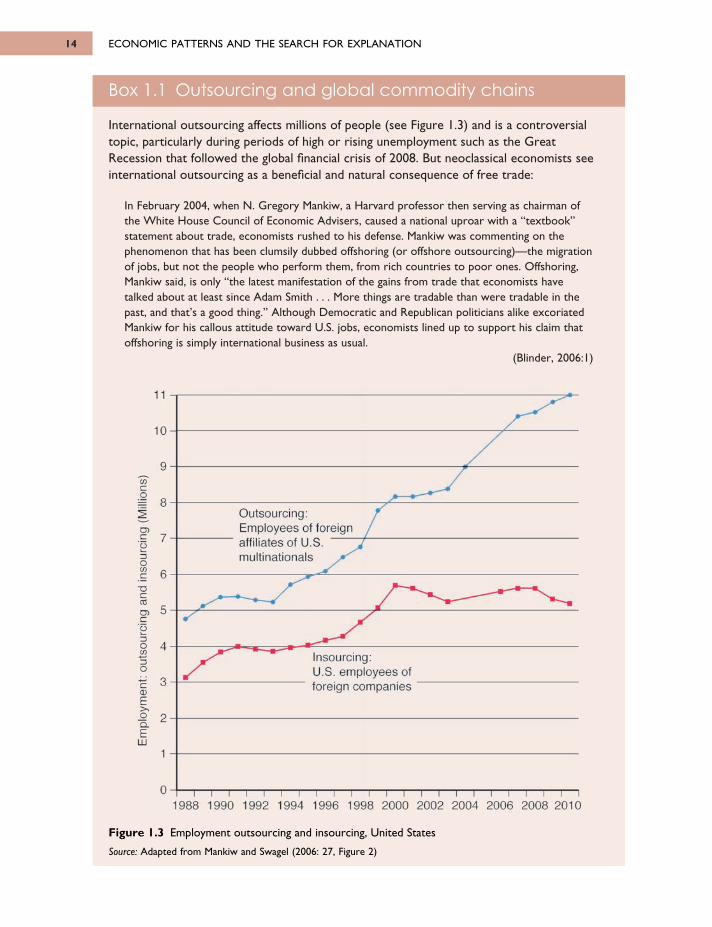
International outsourcing affects millions of people (see Figure 1.3) and is a controversialtopic, particularly during periods of high or rising unemployment such as the GreatRecession that followed the global financial crisis of 2008. But neoclassical economists seeinternational outsourcing as a beneficial and natural consequence of free trade:
In February 2004, when N. Gregory Mankiw, a Harvard professor then serving as chairman ofthe White House Council of Economic Advisers, caused a national uproar with a “textbook”statement about trade, economists rushed to his defense. Mankiw was commenting on thephenomenon that has been clumsily dubbed offshoring (or offshore outsourcing)—the migrationof jobs, but not the people who perform them, from rich countries to poor ones. Offshoring,Mankiw said, is only “the latest manifestation of the gains from trade that economists havetalked about at least since Adam Smith . . . More things are tradable than were tradable in thepast, and that’s a good thing.” Although Democratic and Republican politicians alike excoriatedMankiw for his callous attitude toward U.S. jobs, economists lined up to support his claim thatoffshoring is simply international business as usual.
(Blinder, 2006:1)
Figure 1.3 Employment outsourcing and insourcing, United States
Source: Adapted from Mankiw and Swagel (2006: 27, Figure 2)
6063 GEOGRAPHY WORLD ECON_PT_246x189 mm 22/01/2014 15:09 Page 14
Outsourcing: Employees of foreign affiliates of U.S. multinationals У '
9
8
7
6
5
4
3
2
1
0
1
0
1988 1990 1992 1994 1996 1998 2000 2002 2004 2006 2008 2010
Insourcing:U.S. employees of
" foreign companies "
(Лc0
1
O)coDoωc
~ocCO
U)cok.3oCO
Doc<D
E> .oCL
Eш
1. THE CHANGING WORLD ECONOMY 15
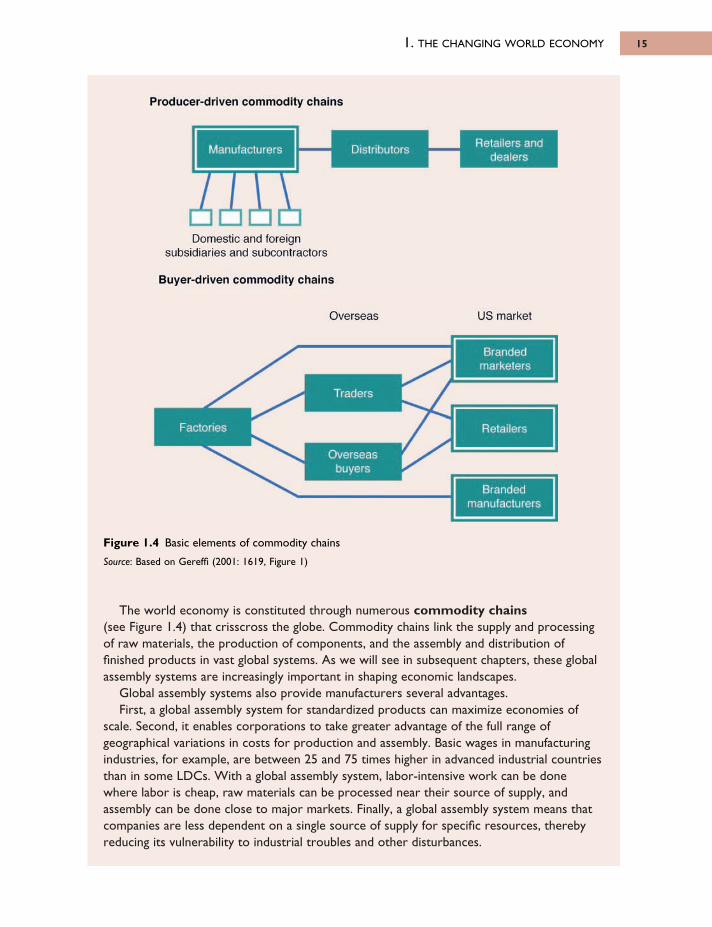
The world economy is constituted through numerous commodity chains(see Figure 1.4) that crisscross the globe. Commodity chains link the supply and processingof raw materials, the production of components, and the assembly and distribution offinished products in vast global systems. As we will see in subsequent chapters, these globalassembly systems are increasingly important in shaping economic landscapes.
Global assembly systems also provide manufacturers several advantages.First, a global assembly system for standardized products can maximize economies of
scale. Second, it enables corporations to take greater advantage of the full range ofgeographical variations in costs for production and assembly. Basic wages in manufacturingindustries, for example, are between 25 and 75 times higher in advanced industrial countriesthan in some LDCs. With a global assembly system, labor-intensive work can be donewhere labor is cheap, raw materials can be processed near their source of supply, andassembly can be done close to major markets. Finally, a global assembly system means thatcompanies are less dependent on a single source of supply for specific resources, therebyreducing its vulnerability to industrial troubles and other disturbances.
Figure 1.4 Basic elements of commodity chains
Source: Based on Gereffi (2001: 1619, Figure 1)
6063 GEOGRAPHY WORLD ECON_PT_246x189 mm 22/01/2014 15:09 Page 15
Manufacturers Distributors Retailers and dealers
Domestic and foreign subsidiaries and subcontractors
Overseas US market
Traders
Factories
Overseasbuyers
Brandedmarketers
Retailers
Brandedmanufacturers
Producer-driven commodity chains
Buver-driven commoditv chains
Producer-driven commodity chains
Buver-driven commoditv chains
ECONOMIC PATTERNS AND THE SEARCH FOR EXPLANATION16
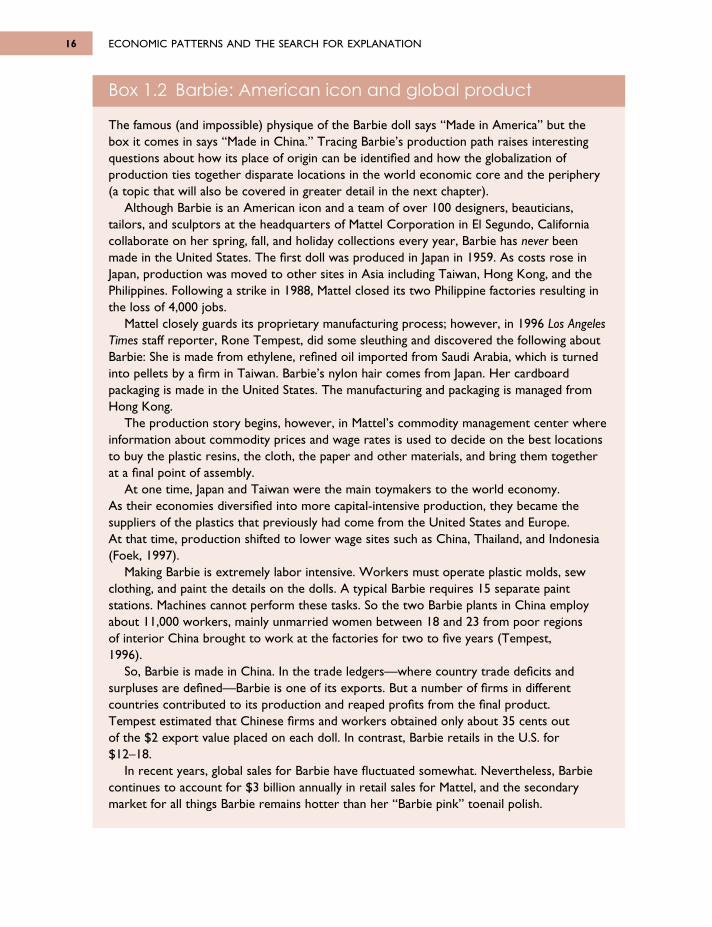
Box 1.2 Barbie: American icon and global product
The famous (and impossible) physique of the Barbie doll says “Made in America” but thebox it comes in says “Made in China.” Tracing Barbie’s production path raises interestingquestions about how its place of origin can be identified and how the globalization ofproduction ties together disparate locations in the world economic core and the periphery(a topic that will also be covered in greater detail in the next chapter).
Although Barbie is an American icon and a team of over 100 designers, beauticians,tailors, and sculptors at the headquarters of Mattel Corporation in El Segundo, Californiacollaborate on her spring, fall, and holiday collections every year, Barbie has never beenmade in the United States. The first doll was produced in Japan in 1959. As costs rose inJapan, production was moved to other sites in Asia including Taiwan, Hong Kong, and thePhilippines. Following a strike in 1988, Mattel closed its two Philippine factories resulting inthe loss of 4,000 jobs.
Mattel closely guards its proprietary manufacturing process; however, in 1996 Los AngelesTimes staff reporter, Rone Tempest, did some sleuthing and discovered the following aboutBarbie: She is made from ethylene, refined oil imported from Saudi Arabia, which is turnedinto pellets by a firm in Taiwan. Barbie’s nylon hair comes from Japan. Her cardboardpackaging is made in the United States. The manufacturing and packaging is managed fromHong Kong.
The production story begins, however, in Mattel’s commodity management center whereinformation about commodity prices and wage rates is used to decide on the best locationsto buy the plastic resins, the cloth, the paper and other materials, and bring them togetherat a final point of assembly.
At one time, Japan and Taiwan were the main toymakers to the world economy. As their economies diversified into more capital-intensive production, they became thesuppliers of the plastics that previously had come from the United States and Europe. At that time, production shifted to lower wage sites such as China, Thailand, and Indonesia(Foek, 1997).
Making Barbie is extremely labor intensive. Workers must operate plastic molds, sewclothing, and paint the details on the dolls. A typical Barbie requires 15 separate paintstations. Machines cannot perform these tasks. So the two Barbie plants in China employabout 11,000 workers, mainly unmarried women between 18 and 23 from poor regions of interior China brought to work at the factories for two to five years (Tempest, 1996).
So, Barbie is made in China. In the trade ledgers—where country trade deficits andsurpluses are defined—Barbie is one of its exports. But a number of firms in differentcountries contributed to its production and reaped profits from the final product. Tempest estimated that Chinese firms and workers obtained only about 35 cents out of the $2 export value placed on each doll. In contrast, Barbie retails in the U.S. for$12–18.
In recent years, global sales for Barbie have fluctuated somewhat. Nevertheless, Barbiecontinues to account for $3 billion annually in retail sales for Mattel, and the secondarymarket for all things Barbie remains hotter than her “Barbie pink” toenail polish.
6063 GEOGRAPHY WORLD ECON_PT_246x189 mm 22/01/2014 15:09 Page 16
1. THE CHANGING WORLD ECONOMY 17
For many transnational corporations, national markets for capital, labor, and plant andoffice location exist only as parts of global commodity chains. Even small firms now have theopportunity to operate globally, outsourcing web development and design, production andpackaging, customer service, and nearly any other facet of its business while competing forcustomers in local, regional, and global markets. So these “new” conditions cannot be solelyidentified with multinational corporations.
The pace of economic globalization has accelerated since the late 1960s. Between 1961 and1976, for example, the number of employees of German firms outside Germany increasedtenfold. The number of firms with foreign operations doubled during the same period of time.Today, the 30 largest corporations headquartered in Finland employ more than 50 percent oftheir employees outside Finland. German and Finnish firms have generally been less willingto expand foreign operations compared to U.S. and British firms, so these figures indicatesomething of a lower bound among countries with long histories of industrialization.
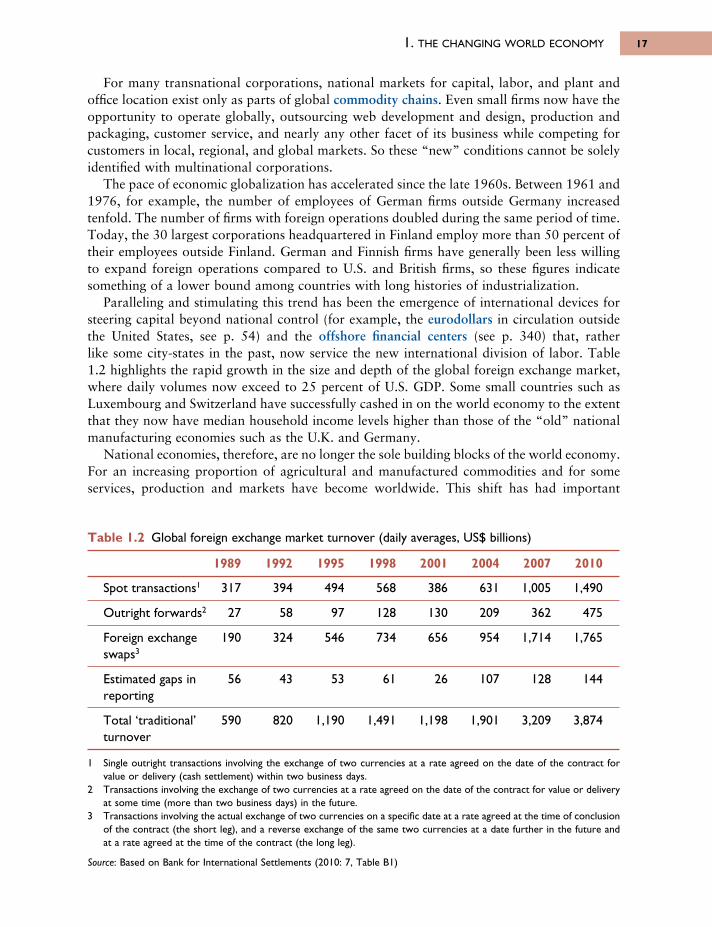
Paralleling and stimulating this trend has been the emergence of international devices forsteering capital beyond national control (for example, the eurodollars in circulation outsidethe United States, see p. 54) and the offshore financial centers (see p. 340) that, rather like some city-states in the past, now service the new international division of labor. Table1.2 highlights the rapid growth in the size and depth of the global foreign exchange market,where daily volumes now exceed to 25 percent of U.S. GDP. Some small countries such asLuxembourg and Switzerland have successfully cashed in on the world economy to the extentthat they now have median household income levels higher than those of the “old” nationalmanufacturing economies such as the U.K. and Germany.
National economies, therefore, are no longer the sole building blocks of the world economy.For an increasing proportion of agricultural and manufactured commodities and for someservices, production and markets have become worldwide. This shift has had important
Table 1.2 Global foreign exchange market turnover (daily averages, US$ billions)
1989 1992 1995 1998 2001 2004 2007 2010
Spot transactions1 317 394 494 568 386 631 1,005 1,490
Outright forwards2 27 58 97 128 130 209 362 475
Foreign exchange 190 324 546 734 656 954 1,714 1,765swaps3
Estimated gaps in 56 43 53 61 26 107 128 144reporting
Total ‘traditional’ 590 820 1,190 1,491 1,198 1,901 3,209 3,874turnover
1 Single outright transactions involving the exchange of two currencies at a rate agreed on the date of the contract forvalue or delivery (cash settlement) within two business days.
2 Transactions involving the exchange of two currencies at a rate agreed on the date of the contract for value or deliveryat some time (more than two business days) in the future.
3 Transactions involving the actual exchange of two currencies on a specific date at a rate agreed at the time of conclusionof the contract (the short leg), and a reverse exchange of the same two currencies at a date further in the future andat a rate agreed at the time of the contract (the long leg).
Source: Based on Bank for International Settlements (2010: 7, Table B1)
6063 GEOGRAPHY WORLD ECON_PT_246x189 mm 22/01/2014 15:09 Page 17
consequences for the spatial distribution of economic activities both globally and withincountries.
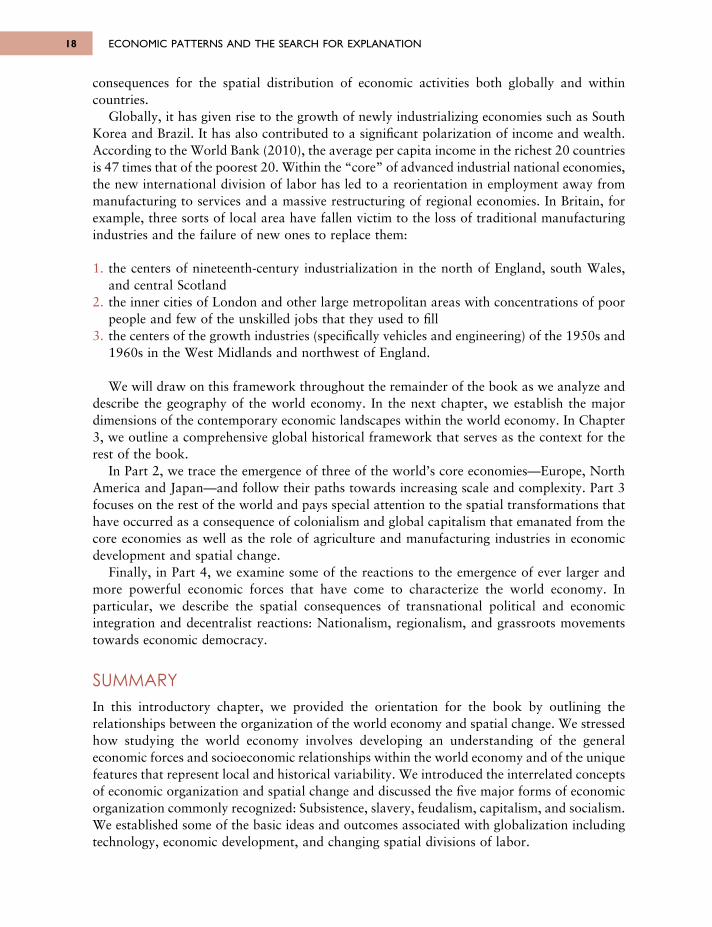
Globally, it has given rise to the growth of newly industrializing economies such as SouthKorea and Brazil. It has also contributed to a significant polarization of income and wealth.According to the World Bank (2010), the average per capita income in the richest 20 countriesis 47 times that of the poorest 20. Within the “core” of advanced industrial national economies,the new international division of labor has led to a reorientation in employment away frommanufacturing to services and a massive restructuring of regional economies. In Britain, forexample, three sorts of local area have fallen victim to the loss of traditional manufacturingindustries and the failure of new ones to replace them:
1. the centers of nineteenth-century industrialization in the north of England, south Wales,and central Scotland
2. the inner cities of London and other large metropolitan areas with concentrations of poorpeople and few of the unskilled jobs that they used to fill
3. the centers of the growth industries (specifically vehicles and engineering) of the 1950s and1960s in the West Midlands and northwest of England.
We will draw on this framework throughout the remainder of the book as we analyze anddescribe the geography of the world economy. In the next chapter, we establish the majordimensions of the contemporary economic landscapes within the world economy. In Chapter3, we outline a comprehensive global historical framework that serves as the context for therest of the book.
In Part 2, we trace the emergence of three of the world’s core economies—Europe, NorthAmerica and Japan—and follow their paths towards increasing scale and complexity. Part 3focuses on the rest of the world and pays special attention to the spatial transformations thathave occurred as a consequence of colonialism and global capitalism that emanated from thecore economies as well as the role of agriculture and manufacturing industries in economicdevelopment and spatial change.
Finally, in Part 4, we examine some of the reactions to the emergence of ever larger andmore powerful economic forces that have come to characterize the world economy. Inparticular, we describe the spatial consequences of transnational political and economicintegration and decentralist reactions: Nationalism, regionalism, and grassroots movementstowards economic democracy.
SUMMARYIn this introductory chapter, we provided the orientation for the book by outlining therelationships between the organization of the world economy and spatial change. We stressedhow studying the world economy involves developing an understanding of the generaleconomic forces and socioeconomic relationships within the world economy and of the uniquefeatures that represent local and historical variability. We introduced the interrelated conceptsof economic organization and spatial change and discussed the five major forms of economicorganization commonly recognized: Subsistence, slavery, feudalism, capitalism, and socialism.We established some of the basic ideas and outcomes associated with globalization includingtechnology, economic development, and changing spatial divisions of labor.
ECONOMIC PATTERNS AND THE SEARCH FOR EXPLANATION18
6063 GEOGRAPHY WORLD ECON_PT_246x189 mm 22/01/2014 15:09 Page 18
KEY SOURCES AND SUGGESTED READINGBlinder, A.S., 2006. Offshoring: The next Industrial Revolution? Foreign Affairs, March/April.Brynjolfsson, E. and McAfee, A., 2011. Race against the Machine: How the digital revolution is
accelerating innovation, driving productivity, and irreversibly transforming employment and theeconomy. Lexington, MA: Digital Frontier Press.
Cowen, T., 2011. The Great Stagnation: How America ate all the low-hanging fruit of modern history,got sick, and will (eventually) feel better. New York: Dutton.
Hughes, A. and Reimer, S. (eds.), 2004. Geographies of Commodity Chains. New York: Routledge.Johnston, R.J., Taylor, P.J., and Watts, M. (eds.), 2002. Geographies of Global Change: Remapping
the world. Cambridge, MA: Blackwell.Mankiw, N.G. and Swagel, P., 2006. The Politics and Economics of Outsourcing, Working Paper 12398,
National Bureau of Economic Research.Massey, D., 1984. Spatial Divisions of Labor. London: Methuen.O’Loughlin, J., Staeheli, L., and Greenburg, E. (eds.), 2004. Globalization and its Outcomes. New York:
Guilford Press.Schumpeter, J.A., 2010. Capitalism, Socialism and Democracy. New York: Routledge.Storper, M. and Scott, A.J. (eds.), 1992. Pathways to Industrialization and Regional Development. London:
Routledge.Venables, A.J., 2006. Shifts in Economic Geography and Their Causes, Federal Reserve Bank of Kansas
City Economic Review 31, 61–85.Wallerstein, I., 1991. Geopolitics and Geoculture. Essays on the changing world-system. Cambridge:
Cambridge University Press.
1. THE CHANGING WORLD ECONOMY 19
6063 GEOGRAPHY WORLD ECON_PT_246x189 mm 22/01/2014 15:09 Page 19
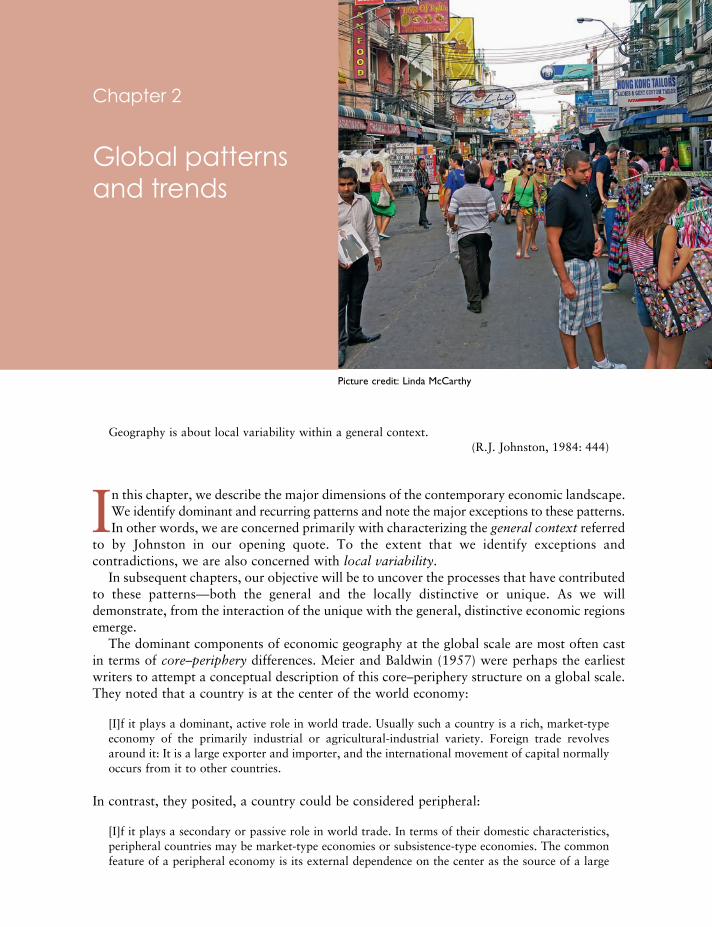
Geography is about local variability within a general context. (R.J. Johnston, 1984: 444)
In this chapter, we describe the major dimensions of the contemporary economic landscape.We identify dominant and recurring patterns and note the major exceptions to these patterns.In other words, we are concerned primarily with characterizing the general context referred
to by Johnston in our opening quote. To the extent that we identify exceptions andcontradictions, we are also concerned with local variability.
In subsequent chapters, our objective will be to uncover the processes that have contributedto these patterns—both the general and the locally distinctive or unique. As we willdemonstrate, from the interaction of the unique with the general, distinctive economic regionsemerge.
The dominant components of economic geography at the global scale are most often castin terms of core–periphery differences. Meier and Baldwin (1957) were perhaps the earliestwriters to attempt a conceptual description of this core–periphery structure on a global scale.They noted that a country is at the center of the world economy:
[I]f it plays a dominant, active role in world trade. Usually such a country is a rich, market-typeeconomy of the primarily industrial or agricultural-industrial variety. Foreign trade revolvesaround it: It is a large exporter and importer, and the international movement of capital normallyoccurs from it to other countries.
In contrast, they posited, a country could be considered peripheral:
[I]f it plays a secondary or passive role in world trade. In terms of their domestic characteristics,peripheral countries may be market-type economies or subsistence-type economies. The commonfeature of a peripheral economy is its external dependence on the center as the source of a large
Picture credit: Linda McCarthy
Chapter 2
Global patternsand trends
6063 GEOGRAPHY WORLD ECON_PT_246x189 mm 22/01/2014 15:09 Page 20
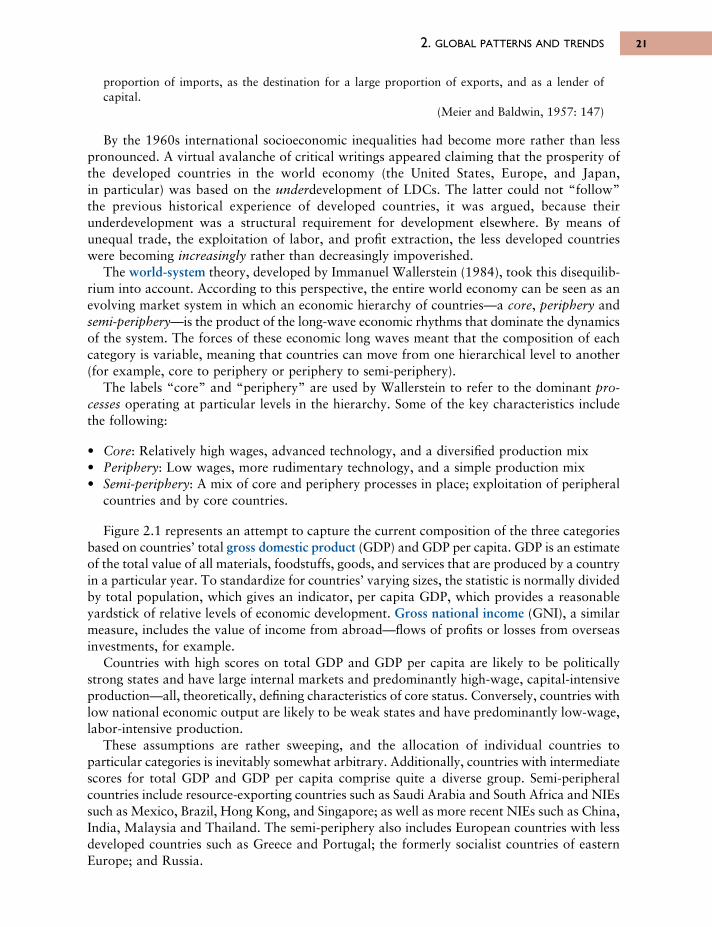
proportion of imports, as the destination for a large proportion of exports, and as a lender ofcapital.
(Meier and Baldwin, 1957: 147)
By the 1960s international socioeconomic inequalities had become more rather than lesspronounced. A virtual avalanche of critical writings appeared claiming that the prosperity ofthe developed countries in the world economy (the United States, Europe, and Japan, in particular) was based on the underdevelopment of LDCs. The latter could not “follow”the previous historical experience of developed countries, it was argued, because theirunderdevelopment was a structural requirement for development elsewhere. By means ofunequal trade, the exploitation of labor, and profit extraction, the less developed countrieswere becoming increasingly rather than decreasingly impoverished.
The world-system theory, developed by Immanuel Wallerstein (1984), took this disequilib -rium into account. According to this perspective, the entire world economy can be seen as anevolving market system in which an economic hierarchy of countries—a core, periphery andsemi-periphery—is the product of the long-wave economic rhythms that dominate the dynamicsof the system. The forces of these economic long waves meant that the composition of eachcategory is variable, meaning that countries can move from one hierarchical level to another(for example, core to periphery or periphery to semi-periphery).
The labels “core” and “periphery” are used by Wallerstein to refer to the dominant pro -cesses operating at particular levels in the hierarchy. Some of the key characteristics includethe following:
• Core: Relatively high wages, advanced technology, and a diversified production mix• Periphery: Low wages, more rudimentary technology, and a simple production mix• Semi-periphery: A mix of core and periphery processes in place; exploitation of peripheral
countries and by core countries.
Figure 2.1 represents an attempt to capture the current composition of the three categoriesbased on countries’ total gross domestic product (GDP) and GDP per capita. GDP is an estimateof the total value of all materials, foodstuffs, goods, and services that are produced by a countryin a particular year. To standardize for countries’ varying sizes, the statistic is normally dividedby total population, which gives an indicator, per capita GDP, which provides a reasonableyardstick of relative levels of economic development. Gross national income (GNI), a similarmeasure, includes the value of income from abroad—flows of profits or losses from overseasinvestments, for example.
Countries with high scores on total GDP and GDP per capita are likely to be politicallystrong states and have large internal markets and predominantly high-wage, capital-intensiveproduction—all, theoretically, defining characteristics of core status. Conversely, countries withlow national economic output are likely to be weak states and have predominantly low-wage,labor-intensive production.
These assumptions are rather sweeping, and the allocation of individual countries toparticular categories is inevitably somewhat arbitrary. Additionally, countries with intermediatescores for total GDP and GDP per capita comprise quite a diverse group. Semi-peripheralcountries include resource-exporting countries such as Saudi Arabia and South Africa and NIEssuch as Mexico, Brazil, Hong Kong, and Singapore; as well as more recent NIEs such as China,India, Malaysia and Thailand. The semi-periphery also includes European countries with lessdeveloped countries such as Greece and Portugal; the formerly socialist countries of easternEurope; and Russia.
2. GLOBAL PATTERNS AND TRENDS 21
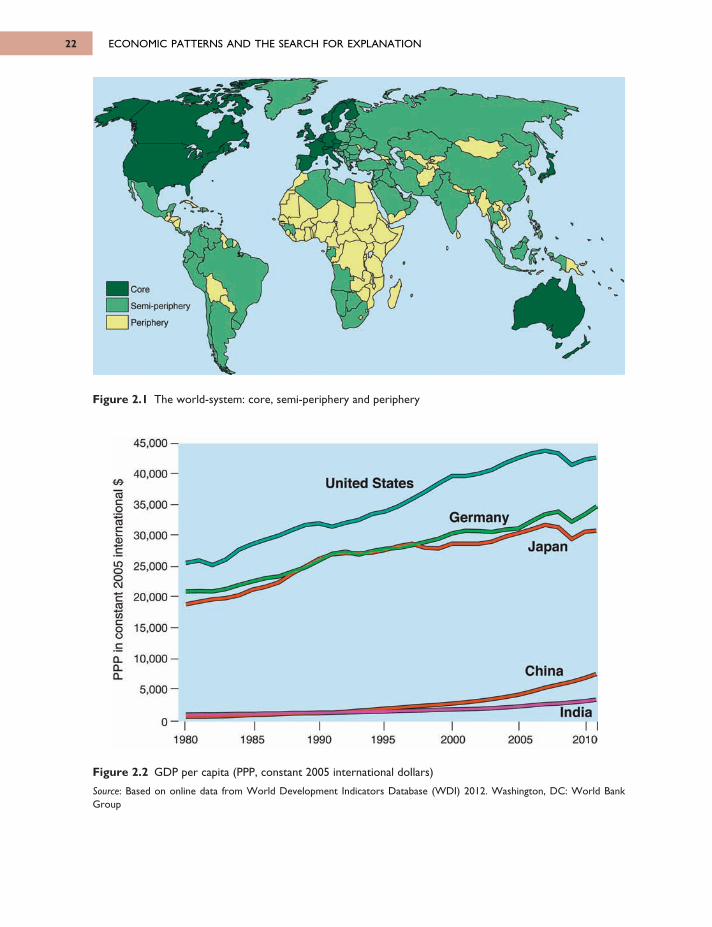
ECONOMIC PATTERNS AND THE SEARCH FOR EXPLANATION22
Figure 2.1 The world-system: core, semi-periphery and periphery
Figure 2.2 GDP per capita (PPP, constant 2005 international dollars)
Source: Based on online data from World Development Indicators Database (WDI) 2012. Washington, DC: World BankGroup
6063 GEOGRAPHY WORLD ECON_PT_246x189 mm 22/01/2014 15:09 Page 22
CoreSem i-periphery
I Periphery
United States
Germany
Japan
China
India
45.000
40.000
35.000
30.000
25.000
20.000
15.000
10.000
5,000
01980 1985 1990 1995 2000 2005 2010
ajcoCOcν-Ο)C
ЮOOC\J
c03
cn c o0 c
Q_01Ql
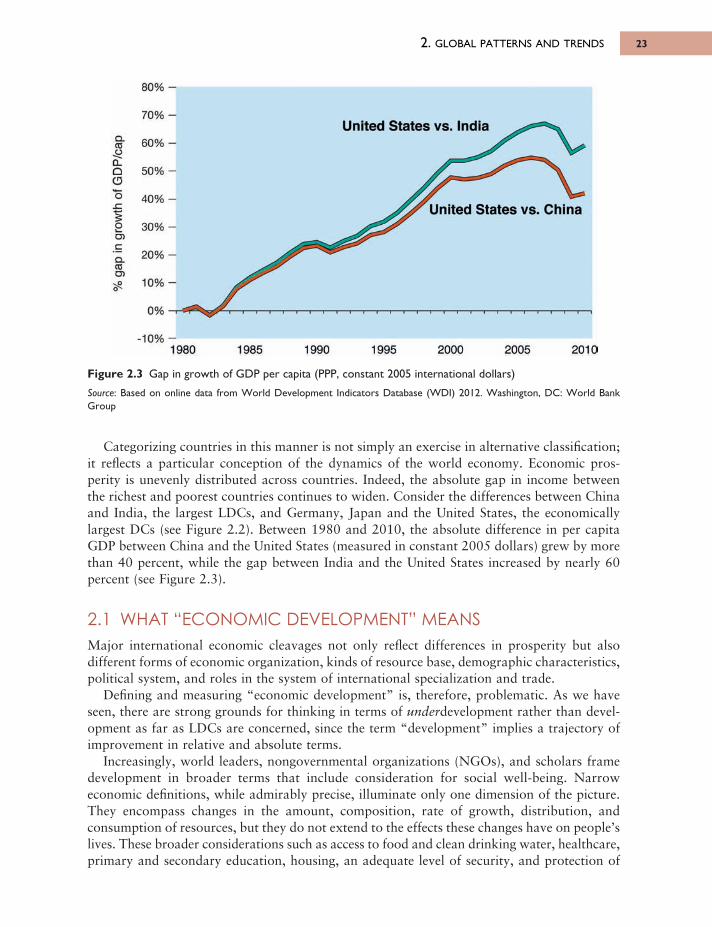
2. GLOBAL PATTERNS AND TRENDS 23
Figure 2.3 Gap in growth of GDP per capita (PPP, constant 2005 international dollars)
Source: Based on online data from World Development Indicators Database (WDI) 2012. Washington, DC: World BankGroup
Categorizing countries in this manner is not simply an exercise in alternative classification;it reflects a particular conception of the dynamics of the world economy. Economic pros-perity is unevenly distributed across countries. Indeed, the absolute gap in income betweenthe richest and poorest countries continues to widen. Consider the differences between Chinaand India, the largest LDCs, and Germany, Japan and the United States, the economicallylargest DCs (see Figure 2.2). Between 1980 and 2010, the absolute difference in per capitaGDP between China and the United States (measured in constant 2005 dollars) grew by morethan 40 percent, while the gap between India and the United States increased by nearly 60percent (see Figure 2.3).
2.1 WHAT “ECONOMIC DEVELOPMENT” MEANSMajor international economic cleavages not only reflect differences in prosperity but alsodifferent forms of economic organization, kinds of resource base, demographic characteristics,political system, and roles in the system of international specialization and trade.
Defining and measuring “economic development” is, therefore, problematic. As we haveseen, there are strong grounds for thinking in terms of underdevelopment rather than devel -op ment as far as LDCs are concerned, since the term “development” implies a trajectory ofimprovement in relative and absolute terms.
Increasingly, world leaders, nongovernmental organizations (NGOs), and scholars framedevelopment in broader terms that include consideration for social well-being. Narroweconomic definitions, while admirably precise, illuminate only one dimension of the picture.They encompass changes in the amount, composition, rate of growth, distribution, andconsumption of resources, but they do not extend to the effects these changes have on people’slives. These broader considerations such as access to food and clean drinking water, healthcare,primary and secondary education, housing, an adequate level of security, and protection of
6063 GEOGRAPHY WORLD ECON_PT_246x189 mm 22/01/2014 15:09 Page 23
70%
60%
50%
40%
30%
20%
10%
0%
80%
-10%
C Lтоо
CLОCDо
-Сgок_О )с
Q.03О )
о
1980 1985 1990 1995 2000 2005 2010
United States vs. India
United States vs. China
civil rights are more clearly reflected in the United Nations Millennium Development Goalsand “2015 End Poverty” campaign:
1. Reduce the number of people suffering from hunger and poverty by half.2. Achieve universal primary education.3. Eliminate gender disparity in primary and secondary education.4. Reduce by two-thirds the mortality rate of children under five.5. Reduce by three-quarters the maternal mortality rate.6. Halt and begin to reverse the spread of HIV/AIDS and other diseases.7. Integrate the principles of sustainable development into country policies and programs.8. Develop open trading and financial systems that are nondiscriminatory.
ECONOMIC PATTERNS AND THE SEARCH FOR EXPLANATION24
Box 2.1 HIV/AIDS and the impact on development in Sub-Saharan Africa
The HIV/AIDS epidemic has weakened the economic performance of many countries, butthe impact has been the most dramatic on less developed countries and, in particular, thepoorest members of those communities. Of the 31–35 million people worldwide who wereestimated to be infected with HIV/AIDS at the end of 2010, approximately 23 million lived in Sub-Saharan Africa (UNAIDS, 2011). Despite having only 12 percent of the world’spopulation, this region accounts for more than 68 percent of HIV-infected people.
In recent years, the pace of new HIV infections has fallen worldwide, including in 22 Sub-Saharan countries. The annual number of deaths from AIDS-related causes has alsodeclined due largely to the widespread introduction of antiretroviral therapy. It is estimatedthat over 700,000 deaths were averted in 2010 as a result of the rapid scale-up of treatmentefforts (UNAIDS, 2010).
Although these trends are positive, the long-term impact of HIV/AIDS on Sub-Saharancountries will be significant. Nearly 90 percent of the more than 16 million childrenorphaned as a result of HIV/AIDS live in the region. The impact on basic education has beendramatic with school enrolments declining even as the number of school-aged childrenincreases. In South Africa, one in five teachers is infected with HIV. In Tanzania, anestimated 45,000 additional teachers are needed to meet the basic educational needs ofschool-aged children.
In countries such as Mozambique, Botswana, Namibia, and Zimbabwe, the agriculturalworkforce is anticipated to be 20 percent smaller in 2020 than it would have been in theabsence of the disease (UNAIDS, 2006). It has also been estimated that the combinedimpact of AIDS-related healthcare expenditures, absenteeism, and lowered productivityreduces company profits in the region by at least 6 to 8 percent (UNAIDS, 2003).
Estimating the economic impact of HIV/AIDS is not easy; however, conservativecalculations suggest the effect will likely reduce the GDP growth rate of many Sub-Saharancountries by 1.5 percent per year. Although this decline may seem small, over 25 years, thecumulative impact will be economies that are 31 percent smaller than they would have beenotherwise in the absence of the disease (Greener, 2004).
6063 GEOGRAPHY WORLD ECON_PT_246x189 mm 22/01/2014 15:09 Page 24
2. GLOBAL PATTERNS AND TRENDS 25
Seen in this light, development is a normative concept; it involves values and standards thatenable the comparison of a particular situation against a preferred one. In this respect,development can properly be evaluated only in terms of how it meets the human needs andvalues of those impacted from their perspective. It also follows that although “development”implies economic, social, political, and cultural transformations, these elements should be seennot as ends in themselves but as means for enhancing the overall quality of human life.
Recognizing the limitations of various economic measures as indicators of well-being, theUnited Nations Development Program (UNDP) established the Human Development Index(HDI). This index includes three dimensions—income, education, and health—and fourindicators—life expectancy at birth, mean years of schooling, expected years of schooling, andGNI per capita—to estimate the relative welfare of countries.
Clearly, this indicator fails to provide a complete picture of human development, neglectingas it does political aspects like government corruption, human or worker rights, and politicalfreedoms; but, like other indices of well-being (see Box 2.2) it reflects several quality-of-lifedimensions beyond income and production, and as such offers a useful measure for comparingthe relative progress of countries and regions.
Over the last decade the HDI has risen across all regions—developed and less developed—though at variable rates. Figure 2.5 illustrates these differences by providing a comparison ofthe rate of change in the HDI for OECD countries and selected less developed regions—EastAsia and the Pacific, Latin America and the Caribbean, and Sub-Saharan Africa—as apercentage of the potential for improvement.
Framing improvements in terms of potential provides an important perspective for assessingthe relative success (and failure) of efforts to enhance human development. Consider arelatively high human development country with an index value around 0.8 (for example,Bahrain or Portugal) and a relatively low development country with an index value of 0.4 (forexample, Malawi or Côte d’Ivoire). While a 0.04 increase is only a 5 percent improvementfor the former (0.8 to 0.84), it is a 10 percent improvement for the latter (0.4 to 0.44). However,given that the HDI is a normalized index with a range from 0 to 1, the potential forimprovement for the high development country is significantly less than for the lowdevelopment country (0.2 vs. 0.6). In other words, Malawi and Côte d’Ivoire have far greaterroom for improvement. A 0.04 increase in the HDI for Portugal and Bahrain reflects a 20percent “capture” of the total improvement possible (0.04 of a possible 0.2), a relativelysignificant increase; but the same improvement reflects merely a 6.7 percent “capture” of thetotal improvement possible for Malawi and Côte d’Ivoire.
As Figure 2.6 illustrates, Sub-Saharan countries had the greatest potential for improvement;however, as shown in Figure 2.5, their rate of improvement lagged OECD countries in otherless developed regions. The gap in the HDI between Sub-Saharan Africa and OECD countriesnarrowed slightly—from approximately 49 percent (0.37 to 0.75, respectively) in 1980 to 52percent (0.46 to 0.87, respectively) in 2010—but, clearly, the disparity remains significant.
Figure 2.7 depicts the global pattern of human development in 2011. Many countries inSouth and Central America and East Asia have moved beyond the basic threshold ofdevelopment. In contrast, a number of countries in South Asia and sub-Saharan Africacontinue to have very low levels of development. Of the countries with index values for 1990,only four countries—Democratic Republic of the Congo, Lesotho, Swaziland, and Zimbabwe—had lower HDI scores in 2011.
Although statistics on development are often illuminating, we are concerned not only withthe “ends” but also the “means.” As a result, our perspective is necessarily broad and situateseconomic geography as the essential and dynamic core of human geography. In the next section,
6063 GEOGRAPHY WORLD ECON_PT_246x189 mm 22/01/2014 15:09 Page 25
ECONOMIC PATTERNS AND THE SEARCH FOR EXPLANATION26
Box 2.2 Indicators of well-being
By Bart Yavorosky
Despite their frequent use, economic indicators are not without limitations. For example,output that increases GDP today often also generates externalities, or costs, such aspollution, soil erosion, and depleted natural resources that are not fully reflected in currentprices but may impose serious constraints on future growth. Similarly, although theproduction aspects of services, such as education and healthcare, are captured in economicstatistics, the quality-of-life dimensions are not.
In an effort to overcome these shortcomings, a number of indicators have beendeveloped over the last few decades. The Gross National Happiness Index(www.grossnationalhappiness.com) includes assessments of psychological well-being, health,education, cultural and ecological diversity and resilience, good governance, communityvitality, and living standards. Similarly, the OECD’s Better Life Index(www.oecdbetterlifeindex.org) incorporates 11 dimensions of well-being ranging fromeducation and civic engagement to work–life balance and personal safety. The Measure ofEconomic Welfare broadens GNI by including the cost of economic “bads” such aspollution. This emphasis on balancing the costs and benefits of economic activity is alsoreflected in the Genuine Progress Indicator, which incorporates factors such as the loss ofleisure time and the psychological cost of unemployment.
The Happy Planet Index (www.happyplanetindex.org) draws on only three variables—lifesatisfaction, life expectancy, and ecological footprint—and measures the relative efficiency ofcountries in fostering long, happy lives for inhabitants without robbing future generations ofsimilar opportunities. The 2012 report found that no country achieved high and sustainablewell-being (see Figure 2.4); of the nine countries that came closest, eight were in LatinAmerica and the Caribbean. The United States, with its large ecological footprint, ranked105th, and the highest ranked country in Europe—Norway—was 29th.
Although more robust than many economic indicators, these quality-of-life measures failto reflect the diversity of experiences of people within countries. Wealthy people—whetherin Ghana or Germany, Canada or Colombia—experience life quite differently compared totheir counterparts at the other end of the economic spectrum who often lack access tobasic necessities, live in high-crime communities, receive inadequate schooling and healthservices, and likely have few employment opportunities outside the $10 trillion black marketthat is the fastest growing segment of the world economy. This divergence is most evidentin cities such as Chicago where the upscale shops of the Magnificent Mile stand in starkcontrast to the gangland violence of the South Side. In this local snapshot of the“core–periphery” pattern, the impediments to upward mobility for certain segments of thepopulation stand in stark contrast to the wealth of others.
6063 GEOGRAPHY WORLD ECON_PT_246x189 mm 22/01/2014 15:09 Page 26
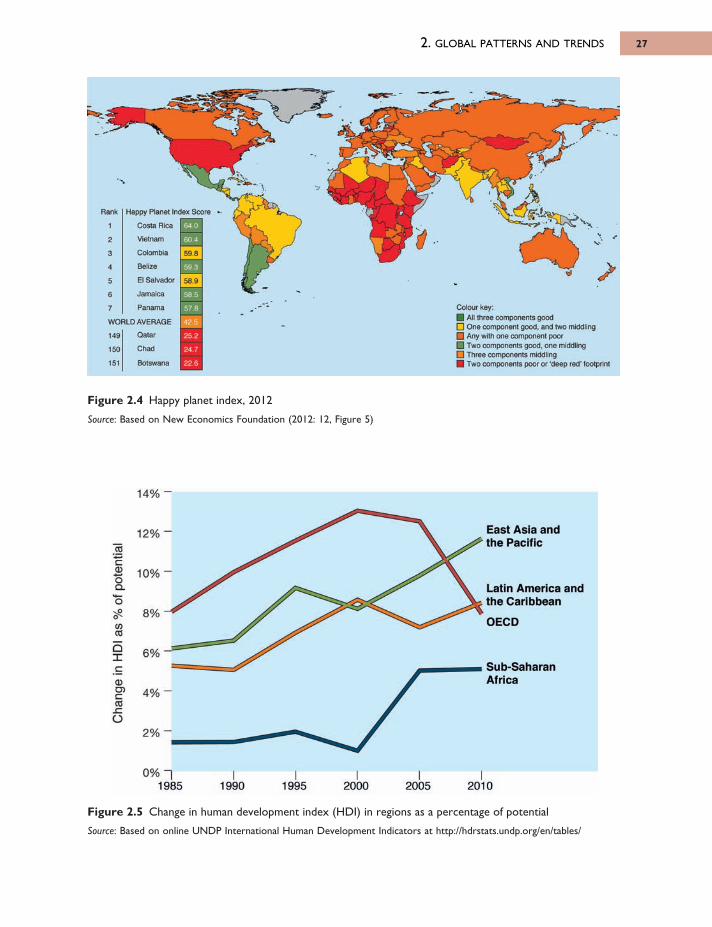
2. GLOBAL PATTERNS AND TRENDS 27
Figure 2.4 Happy planet index, 2012
Source: Based on New Economics Foundation (2012: 12, Figure 5)
Figure 2.5 Change in human development index (HDI) in regions as a percentage of potential
Source: Based on online UNDP International Human Development Indicators at http://hdrstats.undp.org/en/tables/
6063 GEOGRAPHY WORLD ECON_PT_246x189 mm 22/01/2014 15:09 Page 27
Rank
t
2
3
4
5
6
7
Happy Planet Index Score
Costa Rica
Vietnam
Colombia
Belize
El Salvado
Jamaica
Panama
64 0
604
ё - э59 3
E O58 5
57 8
425
252
24 7
226
WORLD AVERAGE
149
150
151
Qatar
Chad
Botswana
Colour key:I All three components good ] One component good, and two middling I Any with one component poor I Two components good, one middling I Three components middling I Two components poor or deep red' footprint
14°/
12%
10%
m
6 %
4°/c
2°/c
0°/c1985 1990 1995 2000 2005 2010
East Asia and the Pacific
Latin America and the Caribbean
OECD
Sub-SaharanAfrica
rec9oQ .
O•Po4C/3CO
QXc
CDC DCаз
-CO
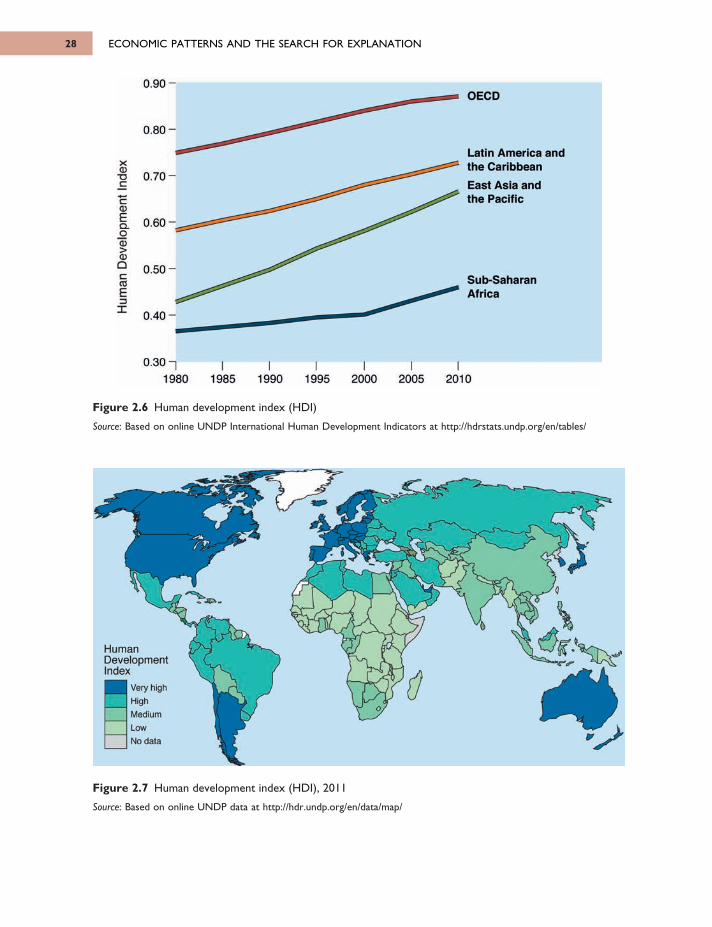
ECONOMIC PATTERNS AND THE SEARCH FOR EXPLANATION28
Figure 2.6 Human development index (HDI)
Source: Based on online UNDP International Human Development Indicators at http://hdrstats.undp.org/en/tables/
Figure 2.7 Human development index (HDI), 2011
Source: Based on online UNDP data at http://hdr.undp.org/en/data/map/
6063 GEOGRAPHY WORLD ECON_PT_246x189 mm 22/01/2014 15:09 Page 28
0 .9 0 -
0 .8 0 -
0 .70-Xш
Όс
сфЕQО(D>0J
асtoЄэX
0.60
0.50
0.40
0.301980 1985 1990 1995 2000 2005 2010
HumanDevelopmentIndex
Very high
High
Medium
Low
No data
OECD
Latin America and the Caribbean
East Asia and the Pacific
Sub-SaharanAfrica
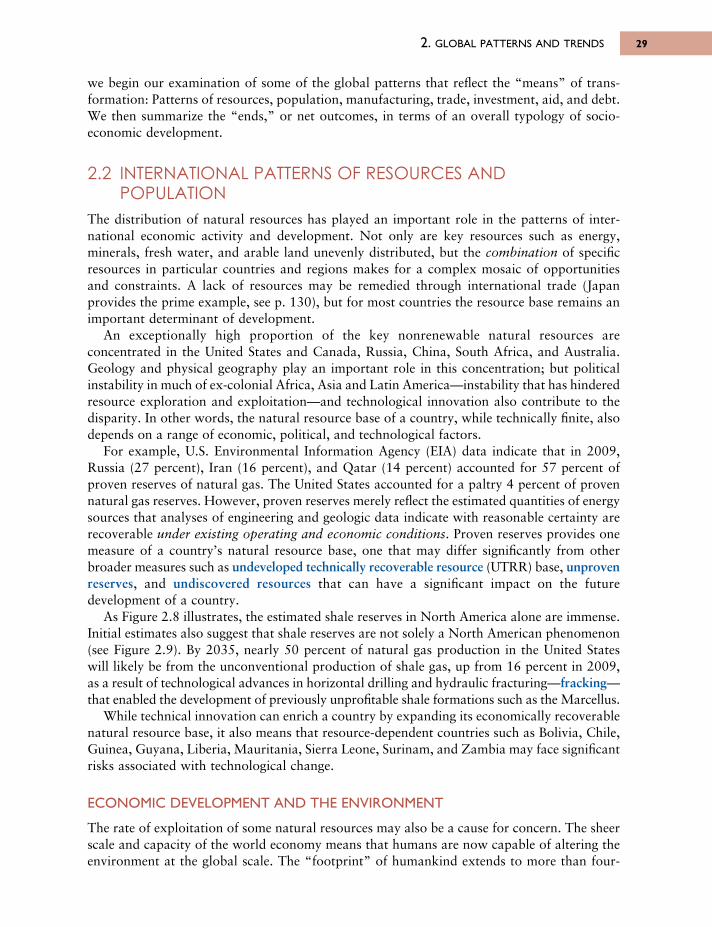
we begin our examination of some of the global patterns that reflect the “means” of trans -formation: Patterns of resources, population, manufacturing, trade, investment, aid, and debt.We then summarize the “ends,” or net outcomes, in terms of an overall typology of socio-economic development.
2.2 INTERNATIONAL PATTERNS OF RESOURCES ANDPOPULATION
The distribution of natural resources has played an important role in the patterns of inter-national economic activity and development. Not only are key resources such as energy,minerals, fresh water, and arable land unevenly distributed, but the combination of specificresources in particular countries and regions makes for a complex mosaic of opportunitiesand constraints. A lack of resources may be remedied through international trade (Japanprovides the prime example, see p. 130), but for most countries the resource base remains animportant determinant of development.
An exceptionally high proportion of the key nonrenewable natural resources areconcentrated in the United States and Canada, Russia, China, South Africa, and Australia.Geology and physical geography play an important role in this concentration; but politicalinstability in much of ex-colonial Africa, Asia and Latin America—instability that has hinderedresource exploration and exploitation—and technological innovation also contribute to thedisparity. In other words, the natural resource base of a country, while technically finite, alsodepends on a range of economic, political, and technological factors.
For example, U.S. Environmental Information Agency (EIA) data indicate that in 2009,Russia (27 percent), Iran (16 percent), and Qatar (14 percent) accounted for 57 percent ofproven reserves of natural gas. The United States accounted for a paltry 4 percent of provennatural gas reserves. However, proven reserves merely reflect the estimated quantities of energysources that analyses of engineering and geologic data indicate with reasonable certainty arerecoverable under existing operating and economic conditions. Proven reserves provides onemeasure of a country’s natural resource base, one that may differ significantly from otherbroader measures such as undeveloped technically recoverable resource (UTRR) base, unprovenreserves, and undiscovered resources that can have a significant impact on the futuredevelopment of a country.
As Figure 2.8 illustrates, the estimated shale reserves in North America alone are immense.Initial estimates also suggest that shale reserves are not solely a North American phenomenon(see Figure 2.9). By 2035, nearly 50 percent of natural gas production in the United Stateswill likely be from the unconventional production of shale gas, up from 16 percent in 2009,as a result of technological advances in horizontal drilling and hydraulic fracturing—fracking—that enabled the development of previously unprofitable shale formations such as the Marcellus.
While technical innovation can enrich a country by expanding its economically recoverablenatural resource base, it also means that resource-dependent countries such as Bolivia, Chile,Guinea, Guyana, Liberia, Mauritania, Sierra Leone, Surinam, and Zambia may face significantrisks associated with technological change.
ECONOMIC DEVELOPMENT AND THE ENVIRONMENT
The rate of exploitation of some natural resources may also be a cause for concern. The sheerscale and capacity of the world economy means that humans are now capable of altering theenvironment at the global scale. The “footprint” of humankind extends to more than four-
2. GLOBAL PATTERNS AND TRENDS 29
6063 GEOGRAPHY WORLD ECON_PT_246x189 mm 22/01/2014 15:09 Page 29
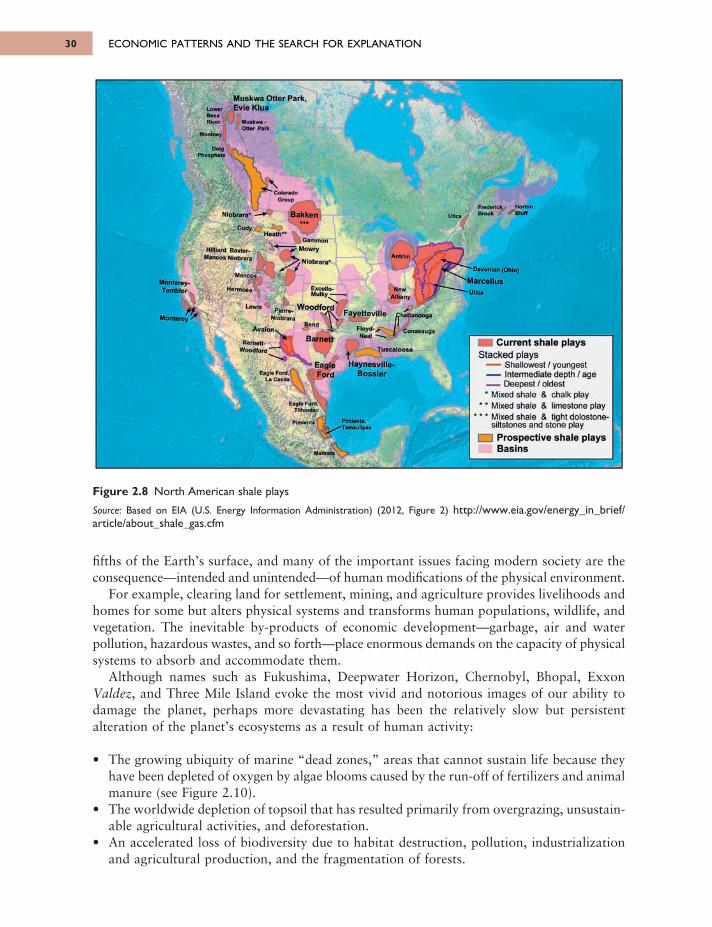
ECONOMIC PATTERNS AND THE SEARCH FOR EXPLANATION30
Figure 2.8 North American shale plays
Source: Based on EIA (U.S. Energy Information Administration) (2012, Figure 2) http://www.eia.gov/energy_in_brief/article/about_shale_gas.cfm
fifths of the Earth’s surface, and many of the important issues facing modern society are theconsequence—intended and unintended—of human modifications of the physical environment.
For example, clearing land for settlement, mining, and agriculture provides livelihoods andhomes for some but alters physical systems and transforms human populations, wildlife, andvegetation. The inevitable by-products of economic development—garbage, air and waterpollution, hazardous wastes, and so forth—place enormous demands on the capacity of physicalsystems to absorb and accommodate them.
Although names such as Fukushima, Deepwater Horizon, Chernobyl, Bhopal, ExxonValdez, and Three Mile Island evoke the most vivid and notorious images of our ability todamage the planet, perhaps more devastating has been the relatively slow but persistentalteration of the planet’s ecosystems as a result of human activity:
• The growing ubiquity of marine “dead zones,” areas that cannot sustain life because theyhave been depleted of oxygen by algae blooms caused by the run-off of fertilizers and animalmanure (see Figure 2.10).
• The worldwide depletion of topsoil that has resulted primarily from overgrazing, unsustain -able agricultural activities, and deforestation.
• An accelerated loss of biodiversity due to habitat destruction, pollution, industrializationand agricultural production, and the fragmentation of forests.
6063 GEOGRAPHY WORLD ECON_PT_246x189 mm 22/01/2014 15:09 Page 30
Muskwa Otter Park, Evie KluaLow ·
B*uRiver
Montney
Muskwa - Otter Parti
Do*gPho*ph*te
‘ ColoradoGroup
Bakken Utica
FrederickBrook
HortonBluff
-D e vo n ia n (Ohio)
^M arcellus
H I Current shale playsStacked plays
Shallowest / youngest Intermediate depth / age— Deepest / oldest * Mixed shale & chalk play
* · Mixed shale & limestone play ' * * Mixed shale & tight dolostone
siltstones and stone playProspective shale plays Basins
NewAlbany
Antrim
Niobrara*
Hilliard Ba ilor- Mane os Niobrara
CodyHeath **
Gamm on
M o w ry
M anco.
Niobrara*
Excello-M u lk y -
Fayetteville Chattanooga
C onasaugaFlo yd - s Neal "
Tuscaloosa
Haynesville·Bossier
EagleFord
Bend
WoodfordPierre- 1 Niobrara
Lew i*
HermosaM on te reyT e m b lo rH w v\
Monterey ^
Avalon.
Barnett-Woodfort
Eagle For LaCael
Eagle Ford. THhonlan
Pitwenta'amaulipas
Mallrat
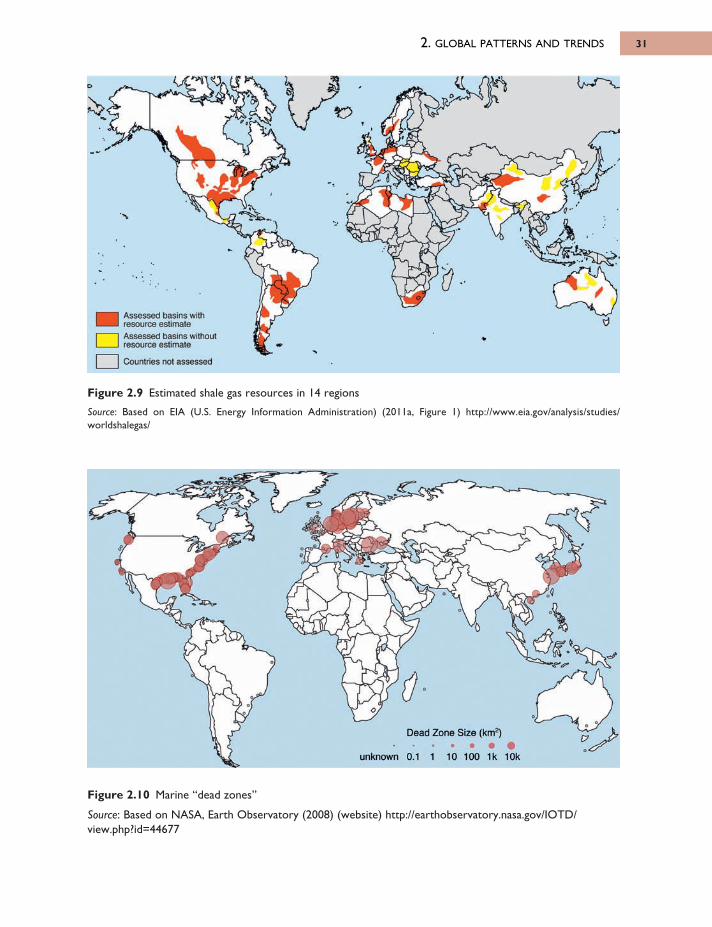
2. GLOBAL PATTERNS AND TRENDS 31
Figure 2.9 Estimated shale gas resources in 14 regions
Source: Based on EIA (U.S. Energy Information Administration) (2011a, Figure 1) http://www.eia.gov/analysis/studies/worldshalegas/
Figure 2.10 Marine “dead zones”
Source: Based on NASA, Earth Observatory (2008) (website) http://earthobservatory.nasa.gov/IOTD/view.php?id=44677
6063 GEOGRAPHY WORLD ECON_PT_246x189 mm 22/01/2014 15:09 Page 31
І Assessed basins with I resource estimate
] Assessed basins without resource estimate
Countries not assessed
Dead Zone Size (km2)
unknown 0.1 1 10 100 1k 10k
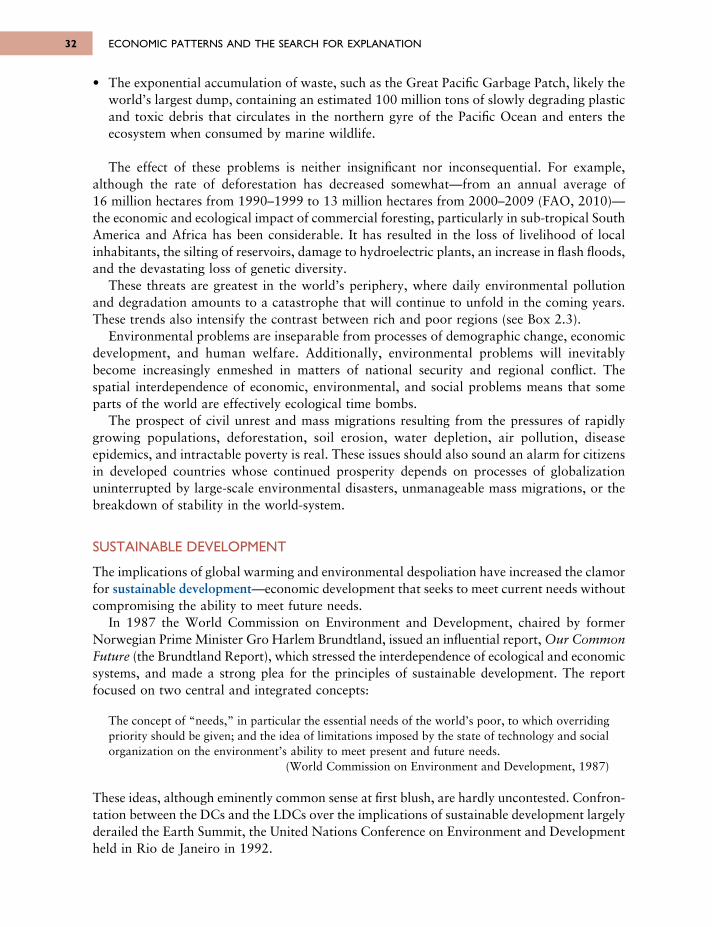
• The exponential accumulation of waste, such as the Great Pacific Garbage Patch, likely theworld’s largest dump, containing an estimated 100 million tons of slowly degrading plasticand toxic debris that circulates in the northern gyre of the Pacific Ocean and enters theecosystem when consumed by marine wildlife.
The effect of these problems is neither insignificant nor inconsequential. For example,although the rate of deforestation has decreased somewhat—from an annual average of 16 million hectares from 1990–1999 to 13 million hectares from 2000–2009 (FAO, 2010)—the economic and ecological impact of commercial foresting, particularly in sub-tropical SouthAmerica and Africa has been considerable. It has resulted in the loss of livelihood of localinhabitants, the silting of reservoirs, damage to hydroelectric plants, an increase in flash floods,and the devastating loss of genetic diversity.
These threats are greatest in the world’s periphery, where daily environmental pollutionand degradation amounts to a catastrophe that will continue to unfold in the coming years.These trends also intensify the contrast between rich and poor regions (see Box 2.3).
Environmental problems are inseparable from processes of demographic change, economicdevelopment, and human welfare. Additionally, environmental problems will inevitablybecome increasingly enmeshed in matters of national security and regional conflict. Thespatial interdependence of economic, environmental, and social problems means that someparts of the world are effectively ecological time bombs.
The prospect of civil unrest and mass migrations resulting from the pressures of rapidlygrowing populations, deforestation, soil erosion, water depletion, air pollution, diseaseepidemics, and intractable poverty is real. These issues should also sound an alarm for citizensin developed countries whose continued prosperity depends on processes of globalizationuninterrupted by large-scale environmental disasters, unmanageable mass migrations, or thebreakdown of stability in the world-system.
SUSTAINABLE DEVELOPMENT
The implications of global warming and environmental despoliation have increased the clamorfor sustainable development—economic development that seeks to meet current needs withoutcompromising the ability to meet future needs.
In 1987 the World Commission on Environment and Development, chaired by formerNorwegian Prime Minister Gro Harlem Brundtland, issued an influential report, Our CommonFuture (the Brundtland Report), which stressed the interdependence of ecological and economicsystems, and made a strong plea for the principles of sustainable development. The reportfocused on two central and integrated concepts:
The concept of “needs,” in particular the essential needs of the world’s poor, to which overridingpriority should be given; and the idea of limitations imposed by the state of technology and socialorganization on the environment’s ability to meet present and future needs.
(World Commission on Environment and Development, 1987)
These ideas, although eminently common sense at first blush, are hardly uncontested. Confron -tation between the DCs and the LDCs over the implications of sustainable development largelyderailed the Earth Summit, the United Nations Conference on Environment and Developmentheld in Rio de Janeiro in 1992.
ECONOMIC PATTERNS AND THE SEARCH FOR EXPLANATION32
6063 GEOGRAPHY WORLD ECON_PT_246x189 mm 22/01/2014 15:09 Page 32
2. GLOBAL PATTERNS AND TRENDS 33
Box 2.3 E-waste and the digital divide
By Bart Yavorosky
Although skeptics questioned the potential demand for Apple products in the LDCs, sales inChina account for about 15 percent of the company’s revenue. The rapid growth of China’smiddle class has fueled the demand for information technology and illustrates theincreasingly unequal distribution of benefits and burdens in the world economy.
Like Barbie (see Box 1.2), the iPhone may be an American icon, but at least 90 percent ofits more than 1,000 parts are manufactured outside the United States. Apple uses morethan 150 suppliers, including many in China. An Apple internal audit revealed that more thanone-fifth of these facilities failed to comply with requirements to prevent involuntarylabor; two facilities experienced explosions that resulted in four dead and 77 injuredworkers; and more than 100 of these suppliers failed to properly store, move, or handlehazardous chemicals.
The negative impacts of the digital revolution are not confined to the factory floor; theyalso extend down the supply chain. Materials used in electronic equipment, such as tantalum,tin, and tungsten, often comes from conflict regions such as the Democratic Republic of theCongo. And 97 percent of the rare earth elements in components such as LED backlightsare mined in China where refinement costs are much lower than in the DCs due to laxenvironmental regulations.
Although problematic, these issues pale in comparison to the human and environmentalcosts associated with the disposal of digital technology. Electronics is the fastest growingwaste stream in the DCs. In the United States, hundreds of thousands of cell phones andcomputers are discarded every day, and some NGOs have calculated that between 50 and80 percent of e-waste generated in the United States is exported overseas. This materialends up in places such as Guiyu in China where shipping containers arrive daily despiteChinese ratification of the Basel Ban Amendment to the Basel Convention that bans theimport of e-waste.
The laborers in Guiyu are a stark contrast to the upwardly mobile workers in Shanghaiand Shenzhen. Most toil in tiny shops and open-air fire pits, salvaging copper, lead, and gold,and earning perhaps $1.50 a day. The air in parts of Guiyu has the highest concentrations ofdioxins in the world. Soil samples have revealed unacceptably high levels of cadmium,chromium, copper, iron, lead, and tin.
Despite the attention that some NGOs have brought to places such as Guiyu, thenumber of these electronic graveyards is expected to multiply. Between 2010 and 2025 thevolume of e-waste is projected to triple, and LDCs, particularly those in Africa and Asiawith the world’s fastest growing economies and some of its largest populations, will beresponsible for generating two-thirds of it. E-waste illustrates how one person’s waste canbecome another person’s wealth. It also reflects global, regional, and intra-national flows anddivisions of labor that define the digital divide.
6063 GEOGRAPHY WORLD ECON_PT_246x189 mm 22/01/2014 15:09 Page 33
Economic development in industrialized countries has been powered to a significant extentby fossil fuels. Although renewables such as wind, solar, geothermal, biomass, and hydro -electricity have been the fastest growing source of energy, they account for only about 10 percentof global energy consumption (EIA, 2011b).
More importantly, as long as the market price of fossil fuels does not reflect the full costof production or consumption, so that negative externalities continue to exist, conventionalcarbon-based fuels such as coal and oil will likely remain significantly cheaper than renewablealternatives, and so provide the most direct path to economic development.
For example, China led the world in investment in clean energy in 2010 at $54.4 billion(compared to $34 billion for the United States and $3.3 billion for the United Kingdom) (PewCharitable Trusts, 2013). However, U.S. Environmental Information Agency (EIA) dataindicate that coal continued to provide nearly 70 percent of the energy consumed in China.In 2000, China consumed 1,239 short tons of coal. Nine years later, its consumption hadincreased 180 percent to 3,474 short tons.
As this brief description demonstrates, sustainable development means different things todifferent people. To some, it means regulating economic systems so the benefits of developmentare distributed more equitably (if only to prevent poverty from causing environmentaldegradation). To others, it means reorganizing societies to improve education, healthcare, andsocial welfare and, as a result, raising environmental awareness and sensitivity to improve thequality of life of all. To the approximately 315,000 citizens of the Maldives, an island countrywith a median altitude of 1.5 meters (4.9 feet) above sea level, it may mean the differencebetween having a homeland and becoming a permanent diaspora.
Clearly, perspective plays an important role. Citizens of DCs may want lesser developedcountries to be more responsible stewards of the environment, to curb deforestation, top soilerosion, and the profligate extraction of natural resources, but protecting the environmentmay also seem like a luxury to those who are among the estimated 925 million people whoare undernourished (FAO, 2011). It may also seem unreasonable and inequitable to the 1.3billion citizens of China who aspire to own 2.28 cars per household (Noor, 2008), 2,505-square feet houses (U.S. Census Bureau, 2013), and consume 185 pounds of meat per year asdo their U.S. counterparts (USDA, 2010).
Perhaps the most significant obstacle to sustainable development is simply the inadequacyof institutional frameworks. Sustainable development requires economic, financial, and fiscaldecisions to be fully integrated with environmental and ecological decisions. Such decisionsrequire a weighing and reconciliation of interests that are often contradictory and policies withoutcomes that can be estimated tenuously at best.
The implications of inaction are almost certainly significant—rising sea levels that swampcoastal cities, increased desertification and incidences of wildfires and severe weather phe -nomena such as tornadoes, hurricanes, drought, and monsoons—but coordinating a res ponse,one that effectively balances the competing interests of differently situated peoples andcountries, remains elusive.
As the United Nations Conference on Sustainable Development (Rio +20) demonstrated,in the 20 years since the first Earth Summit, perhaps the most poignant statement that can be made about sustainable development is that it remains an embarrassing contradiction in terms. And what is often referred to as Plan B, geoengineering the atmosphere to reflect sun-light away from the planet and reverse global warming, although perilous, increasinglyassumes the appearance of Plan A by default, particularly for countries most at risk, such asthe Maldives.
ECONOMIC PATTERNS AND THE SEARCH FOR EXPLANATION34
6063 GEOGRAPHY WORLD ECON_PT_246x189 mm 22/01/2014 15:09 Page 34
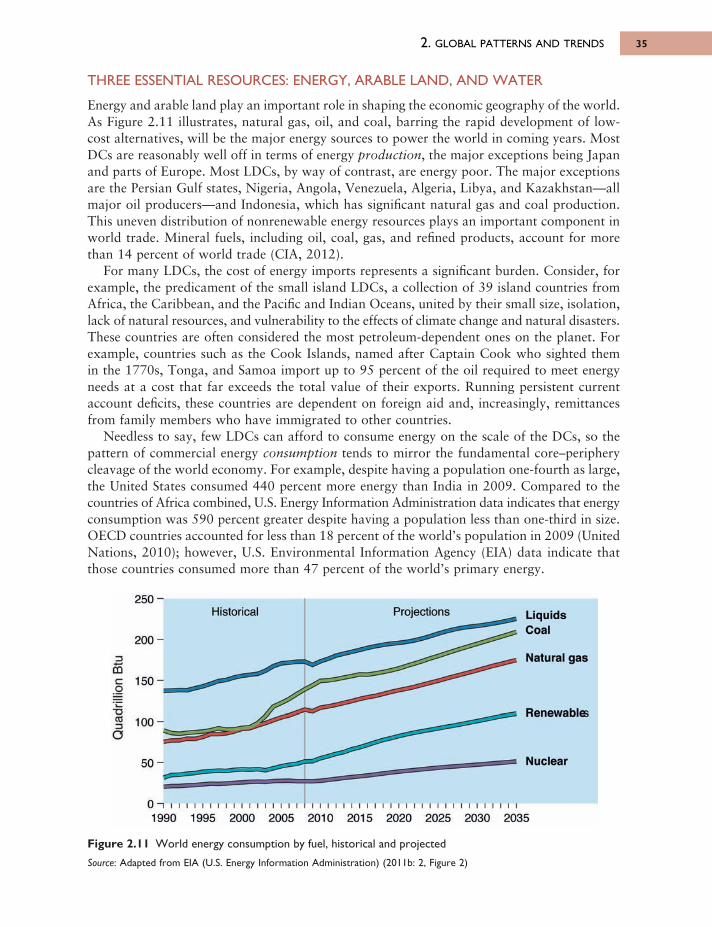
2. GLOBAL PATTERNS AND TRENDS 35
THREE ESSENTIAL RESOURCES: ENERGY, ARABLE LAND, AND WATER
Energy and arable land play an important role in shaping the economic geography of the world.As Figure 2.11 illustrates, natural gas, oil, and coal, barring the rapid development of low-cost alternatives, will be the major energy sources to power the world in coming years. MostDCs are reasonably well off in terms of energy production, the major exceptions being Japanand parts of Europe. Most LDCs, by way of contrast, are energy poor. The major exceptionsare the Persian Gulf states, Nigeria, Angola, Venezuela, Algeria, Libya, and Kazakhstan—allmajor oil producers—and Indonesia, which has significant natural gas and coal production.This uneven distribution of nonrenewable energy resources plays an important component inworld trade. Mineral fuels, including oil, coal, gas, and refined products, account for morethan 14 percent of world trade (CIA, 2012).
For many LDCs, the cost of energy imports represents a significant burden. Consider, forexample, the predicament of the small island LDCs, a collection of 39 island countries fromAfrica, the Caribbean, and the Pacific and Indian Oceans, united by their small size, isolation,lack of natural resources, and vulnerability to the effects of climate change and natural disasters.These countries are often considered the most petroleum-dependent ones on the planet. Forexample, countries such as the Cook Islands, named after Captain Cook who sighted themin the 1770s, Tonga, and Samoa import up to 95 percent of the oil required to meet energyneeds at a cost that far exceeds the total value of their exports. Running persistent currentaccount deficits, these countries are dependent on foreign aid and, increasingly, remittancesfrom family members who have immigrated to other countries.
Needless to say, few LDCs can afford to consume energy on the scale of the DCs, so thepattern of commercial energy consumption tends to mirror the fundamental core–peripherycleavage of the world economy. For example, despite having a population one-fourth as large,the United States consumed 440 percent more energy than India in 2009. Compared to thecountries of Africa combined, U.S. Energy Information Administration data indicates that energyconsumption was 590 percent greater despite having a population less than one-third in size.OECD countries accounted for less than 18 percent of the world’s population in 2009 (UnitedNations, 2010); however, U.S. Environmental Information Agency (EIA) data indicate thatthose countries consumed more than 47 percent of the world’s primary energy.
Figure 2.11 World energy consumption by fuel, historical and projected
Source: Adapted from EIA (U.S. Energy Information Administration) (2011b: 2, Figure 2)
6063 GEOGRAPHY WORLD ECON_PT_246x189 mm 22/01/2014 15:09 Page 35
Historical Projections LiquidsCoal
Natural gas
Renewables
Nuclear
250
200
150
100
50
0
3ffiCo
wΌCO3σ
1990 1995 2000 2005 2010 2015 2020 2025 2030 2035
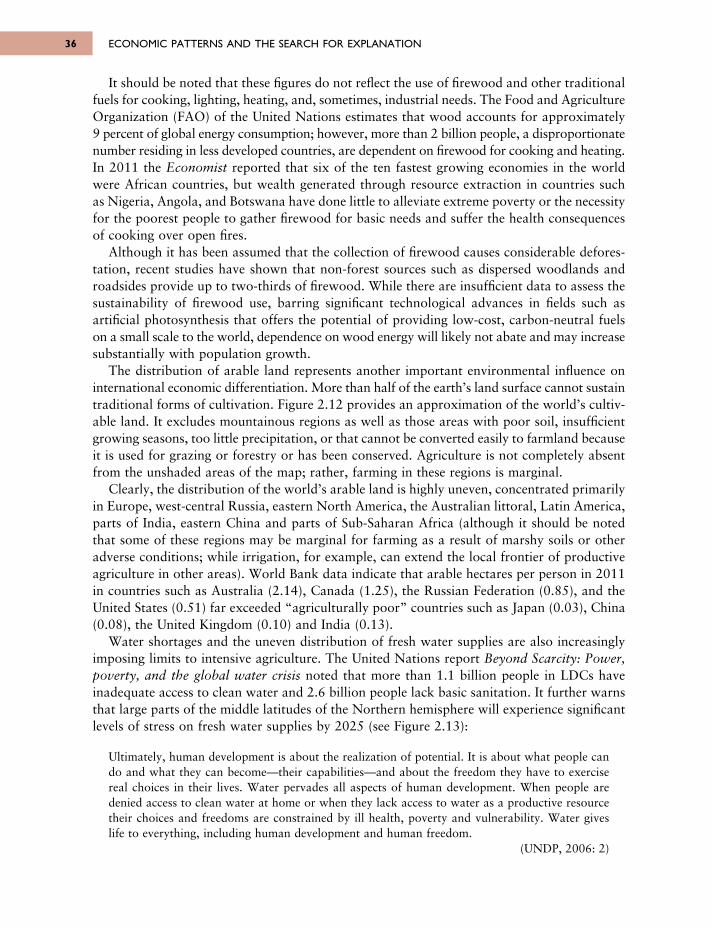
It should be noted that these figures do not reflect the use of firewood and other traditionalfuels for cooking, lighting, heating, and, sometimes, industrial needs. The Food and AgricultureOrganization (FAO) of the United Nations estimates that wood accounts for approximately9 percent of global energy consumption; however, more than 2 billion people, a dispro portionatenumber residing in less developed countries, are dependent on firewood for cooking and heating.In 2011 the Economist reported that six of the ten fastest growing economies in the worldwere African countries, but wealth generated through resource extraction in countries suchas Nigeria, Angola, and Botswana have done little to alleviate extreme poverty or the necessityfor the poorest people to gather firewood for basic needs and suffer the health consequencesof cooking over open fires.
Although it has been assumed that the collection of firewood causes considerable defores -tation, recent studies have shown that non-forest sources such as dispersed woodlands androadsides provide up to two-thirds of firewood. While there are insufficient data to assess thesustainability of firewood use, barring significant technological advances in fields such asartificial photosynthesis that offers the potential of providing low-cost, carbon-neutral fuelson a small scale to the world, dependence on wood energy will likely not abate and may increasesubstantially with population growth.
The distribution of arable land represents another important environmental influence oninternational economic differentiation. More than half of the earth’s land surface cannot sustaintraditional forms of cultivation. Figure 2.12 provides an approximation of the world’s cultiv -able land. It excludes mountainous regions as well as those areas with poor soil, insufficientgrowing seasons, too little precipitation, or that cannot be converted easily to farmland becauseit is used for grazing or forestry or has been conserved. Agriculture is not completely absentfrom the unshaded areas of the map; rather, farming in these regions is marginal.
Clearly, the distribution of the world’s arable land is highly uneven, concentrated primarilyin Europe, west-central Russia, eastern North America, the Australian littoral, Latin America,parts of India, eastern China and parts of Sub-Saharan Africa (although it should be notedthat some of these regions may be marginal for farming as a result of marshy soils or otheradverse conditions; while irrigation, for example, can extend the local frontier of productiveagriculture in other areas). World Bank data indicate that arable hectares per person in 2011in countries such as Australia (2.14), Canada (1.25), the Russian Federation (0.85), and theUnited States (0.51) far exceeded “agriculturally poor” countries such as Japan (0.03), China(0.08), the United Kingdom (0.10) and India (0.13).
Water shortages and the uneven distribution of fresh water supplies are also increasinglyimposing limits to intensive agriculture. The United Nations report Beyond Scarcity: Power,poverty, and the global water crisis noted that more than 1.1 billion people in LDCs haveinadequate access to clean water and 2.6 billion people lack basic sanitation. It further warnsthat large parts of the middle latitudes of the Northern hemisphere will experience significantlevels of stress on fresh water supplies by 2025 (see Figure 2.13):
Ultimately, human development is about the realization of potential. It is about what people cando and what they can become—their capabilities—and about the freedom they have to exercisereal choices in their lives. Water pervades all aspects of human development. When people aredenied access to clean water at home or when they lack access to water as a productive resourcetheir choices and freedoms are constrained by ill health, poverty and vulnerability. Water giveslife to everything, including human development and human freedom.
(UNDP, 2006: 2)
ECONOMIC PATTERNS AND THE SEARCH FOR EXPLANATION36
6063 GEOGRAPHY WORLD ECON_PT_246x189 mm 22/01/2014 15:09 Page 36
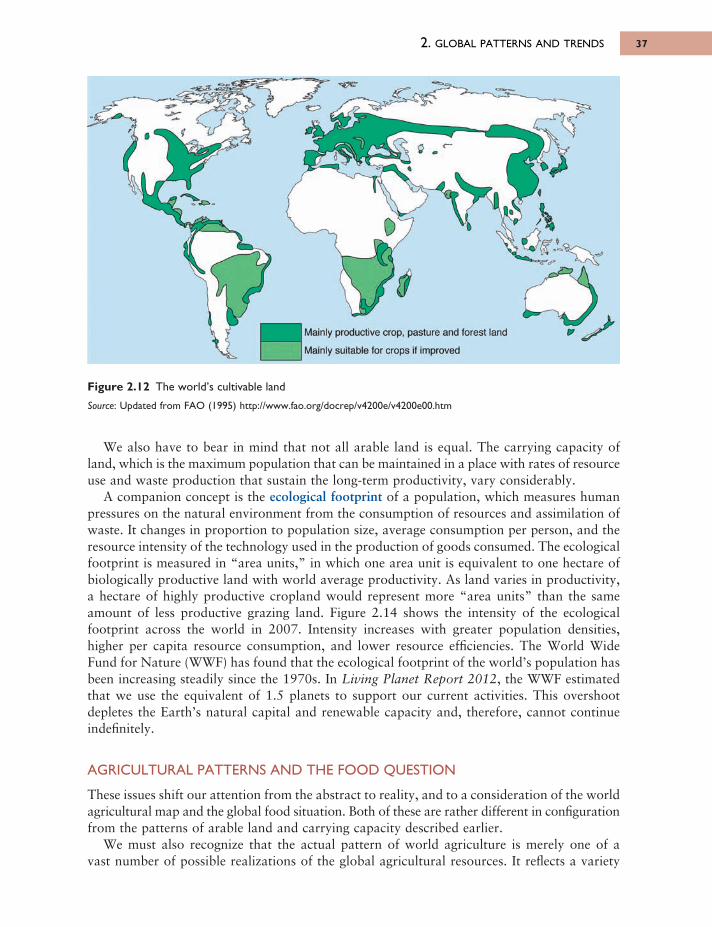
2. GLOBAL PATTERNS AND TRENDS 37
Figure 2.12 The world’s cultivable land
Source: Updated from FAO (1995) http://www.fao.org/docrep/v4200e/v4200e00.htm
We also have to bear in mind that not all arable land is equal. The carrying capacity ofland, which is the maximum population that can be maintained in a place with rates of resourceuse and waste production that sustain the long-term productivity, vary considerably.
A companion concept is the ecological footprint of a population, which measures humanpressures on the natural environment from the consumption of resources and assimilation ofwaste. It changes in proportion to population size, average consumption per person, and theresource intensity of the technology used in the production of goods consumed. The ecologicalfootprint is measured in “area units,” in which one area unit is equivalent to one hectare ofbiologically productive land with world average productivity. As land varies in productivity,a hectare of highly productive cropland would represent more “area units” than the sameamount of less productive grazing land. Figure 2.14 shows the intensity of the ecologicalfootprint across the world in 2007. Intensity increases with greater population densities, higher per capita resource consumption, and lower resource efficiencies. The World Wide Fund for Nature (WWF) has found that the ecological footprint of the world’s population hasbeen increasing steadily since the 1970s. In Living Planet Report 2012, the WWF estimatedthat we use the equivalent of 1.5 planets to support our current activities. This overshootdepletes the Earth’s natural capital and renewable capacity and, therefore, cannot continueindefinitely.
AGRICULTURAL PATTERNS AND THE FOOD QUESTION
These issues shift our attention from the abstract to reality, and to a consideration of the worldagricultural map and the global food situation. Both of these are rather different in con figurationfrom the patterns of arable land and carrying capacity described earlier.
We must also recognize that the actual pattern of world agriculture is merely one of a vast number of possible realizations of the global agricultural resources. It reflects a variety
6063 GEOGRAPHY WORLD ECON_PT_246x189 mm 22/01/2014 15:09 Page 37
Mainly productive crop, pasture and forest land
Mainly suitable tor crops if improved
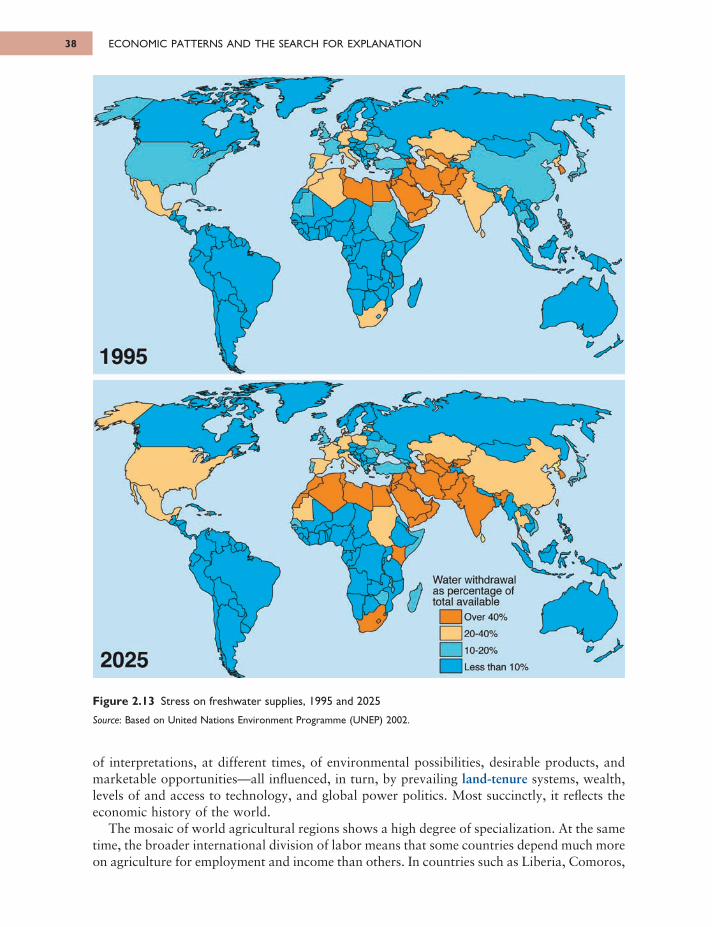
of inter pretations, at different times, of environmental possibilities, desirable products, andmarket able opportunities—all influenced, in turn, by prevailing land-tenure systems, wealth,levels of and access to technology, and global power politics. Most succinctly, it reflects theeconomic history of the world.
The mosaic of world agricultural regions shows a high degree of specialization. At the sametime, the broader international division of labor means that some countries depend much moreon agriculture for employment and income than others. In countries such as Liberia, Comoros,
ECONOMIC PATTERNS AND THE SEARCH FOR EXPLANATION38
Figure 2.13 Stress on freshwater supplies, 1995 and 2025
Source: Based on United Nations Environment Programme (UNEP) 2002.
6063 GEOGRAPHY WORLD ECON_PT_246x189 mm 22/01/2014 15:09 Page 38
1995
2025
Water withdrawal as percentage of total available
Over 40%
20-40%
10- 20%
Less than 10%
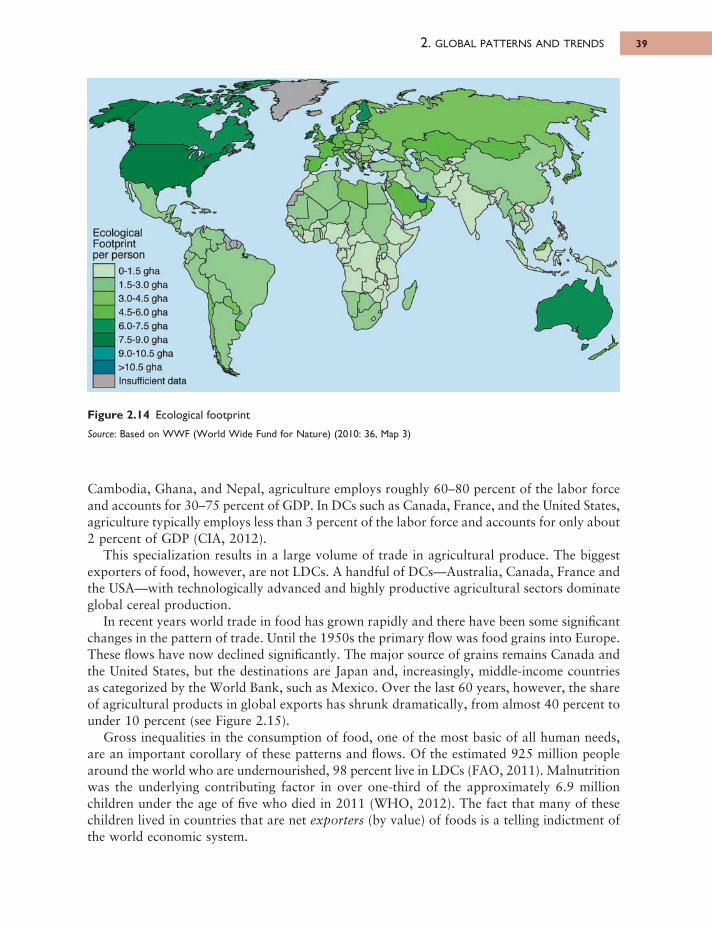
Cambodia, Ghana, and Nepal, agriculture employs roughly 60–80 percent of the labor forceand accounts for 30–75 percent of GDP. In DCs such as Canada, France, and the United States,agriculture typically employs less than 3 percent of the labor force and accounts for only about2 percent of GDP (CIA, 2012).
This specialization results in a large volume of trade in agricultural produce. The biggestexporters of food, however, are not LDCs. A handful of DCs—Australia, Canada, France andthe USA—with technologically advanced and highly productive agricultural sectors dominateglobal cereal production.
In recent years world trade in food has grown rapidly and there have been some significantchanges in the pattern of trade. Until the 1950s the primary flow was food grains into Europe.These flows have now declined significantly. The major source of grains remains Canada andthe United States, but the destinations are Japan and, increasingly, middle-income countriesas categorized by the World Bank, such as Mexico. Over the last 60 years, however, the shareof agricultural products in global exports has shrunk dramatically, from almost 40 percent tounder 10 percent (see Figure 2.15).
Gross inequalities in the consumption of food, one of the most basic of all human needs,are an important corollary of these patterns and flows. Of the estimated 925 million peoplearound the world who are undernourished, 98 percent live in LDCs (FAO, 2011). Malnutritionwas the underlying contributing factor in over one-third of the approximately 6.9 millionchildren under the age of five who died in 2011 (WHO, 2012). The fact that many of thesechildren lived in countries that are net exporters (by value) of foods is a telling indictment ofthe world economic system.
2. GLOBAL PATTERNS AND TRENDS 39
Figure 2.14 Ecological footprint
Source: Based on WWF (World Wide Fund for Nature) (2010: 36, Map 3)
6063 GEOGRAPHY WORLD ECON_PT_246x189 mm 22/01/2014 15:09 Page 39
Ecological Footprint Der Derson
0-1.5 gha \1.5-3.0 gha3.0-4.5 gha4.5-6.0 gha6.0-7.5 gha7.5-9.0 gha9.0-10.5 gha >10.5 gha Insufficient data
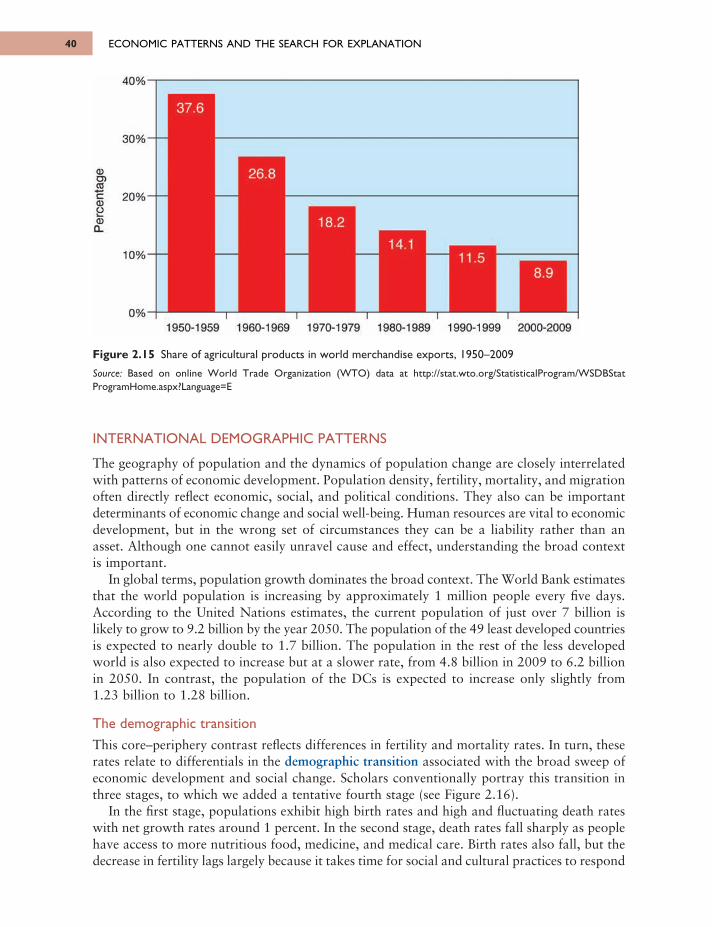
ECONOMIC PATTERNS AND THE SEARCH FOR EXPLANATION40
INTERNATIONAL DEMOGRAPHIC PATTERNS
The geography of population and the dynamics of population change are closely interrelatedwith patterns of economic development. Population density, fertility, mortality, and migrationoften directly reflect economic, social, and political conditions. They also can be importantdeterminants of economic change and social well-being. Human resources are vital to economicdevelopment, but in the wrong set of circumstances they can be a liability rather than an asset. Although one cannot easily unravel cause and effect, understanding the broad contextis important.
In global terms, population growth dominates the broad context. The World Bank estimatesthat the world population is increasing by approximately 1 million people every five days.According to the United Nations estimates, the current population of just over 7 billion islikely to grow to 9.2 billion by the year 2050. The population of the 49 least developed countriesis expected to nearly double to 1.7 billion. The population in the rest of the less developedworld is also expected to increase but at a slower rate, from 4.8 billion in 2009 to 6.2 billionin 2050. In contrast, the population of the DCs is expected to increase only slightly from 1.23 billion to 1.28 billion.
The demographic transitionThis core–periphery contrast reflects differences in fertility and mortality rates. In turn, theserates relate to differentials in the demographic transition associated with the broad sweep ofeconomic development and social change. Scholars conventionally portray this transition inthree stages, to which we added a tentative fourth stage (see Figure 2.16).
In the first stage, populations exhibit high birth rates and high and fluctuating death rateswith net growth rates around 1 percent. In the second stage, death rates fall sharply as peoplehave access to more nutritious food, medicine, and medical care. Birth rates also fall, but thedecrease in fertility lags largely because it takes time for social and cultural practices to respond
Figure 2.15 Share of agricultural products in world merchandise exports, 1950–2009
Source: Based on online World Trade Organization (WTO) data at http://stat.wto.org/StatisticalProgram/WSDBStatProgramHome.aspx?Language=E
6063 GEOGRAPHY WORLD ECON_PT_246x189 mm 22/01/2014 15:09 Page 40
4 0 % -
30%-
20%
10% -
0 %
α>σ>2Έα>a<υΟ-
37.6
26.8
18.2
11.58.9
1950-1959 1960-1969 1970-1979 1980-1989 1990-1999 2000-2009
11.5
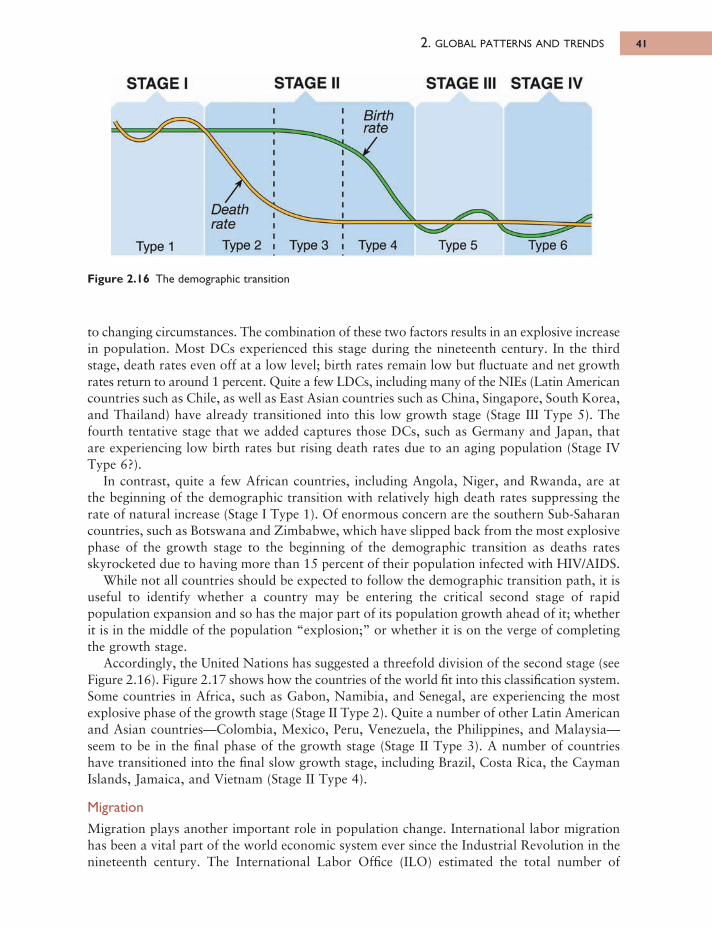
to changing circumstances. The combination of these two factors results in an explosive increasein population. Most DCs experienced this stage during the nineteenth century. In the thirdstage, death rates even off at a low level; birth rates remain low but fluctuate and net growthrates return to around 1 percent. Quite a few LDCs, including many of the NIEs (Latin Americancountries such as Chile, as well as East Asian countries such as China, Singapore, South Korea,and Thailand) have already transitioned into this low growth stage (Stage III Type 5). Thefourth tentative stage that we added captures those DCs, such as Germany and Japan, thatare experiencing low birth rates but rising death rates due to an aging population (Stage IVType 6?).
In contrast, quite a few African countries, including Angola, Niger, and Rwanda, are atthe beginning of the demographic transition with relatively high death rates suppressing therate of natural increase (Stage I Type 1). Of enormous concern are the southern Sub-Saharancountries, such as Botswana and Zimbabwe, which have slipped back from the most explosivephase of the growth stage to the beginning of the demographic transition as deaths ratesskyrocketed due to having more than 15 percent of their population infected with HIV/AIDS.
While not all countries should be expected to follow the demographic transition path, it isuseful to identify whether a country may be entering the critical second stage of rapidpopulation expansion and so has the major part of its population growth ahead of it; whetherit is in the middle of the population “explosion;” or whether it is on the verge of completingthe growth stage.
Accordingly, the United Nations has suggested a threefold division of the second stage (seeFigure 2.16). Figure 2.17 shows how the countries of the world fit into this classification system.Some countries in Africa, such as Gabon, Namibia, and Senegal, are experiencing the mostexplosive phase of the growth stage (Stage II Type 2). Quite a number of other Latin Americanand Asian countries—Colombia, Mexico, Peru, Venezuela, the Philippines, and Malaysia—seem to be in the final phase of the growth stage (Stage II Type 3). A number of countrieshave transitioned into the final slow growth stage, including Brazil, Costa Rica, the CaymanIslands, Jamaica, and Vietnam (Stage II Type 4).
Migration
Migration plays another important role in population change. International labor migrationhas been a vital part of the world economic system ever since the Industrial Revolution in thenineteenth century. The International Labor Office (ILO) estimated the total number of
2. GLOBAL PATTERNS AND TRENDS 41
Figure 2.16 The demographic transition
6063 GEOGRAPHY WORLD ECON_PT_246x189 mm 22/01/2014 15:09 Page 41
STAGE I STAGE II STAGE III STAGE IV
Birtl rate
Death rate
Type 1 Type 2 Type 3 Type 4 Type 5 Type 6
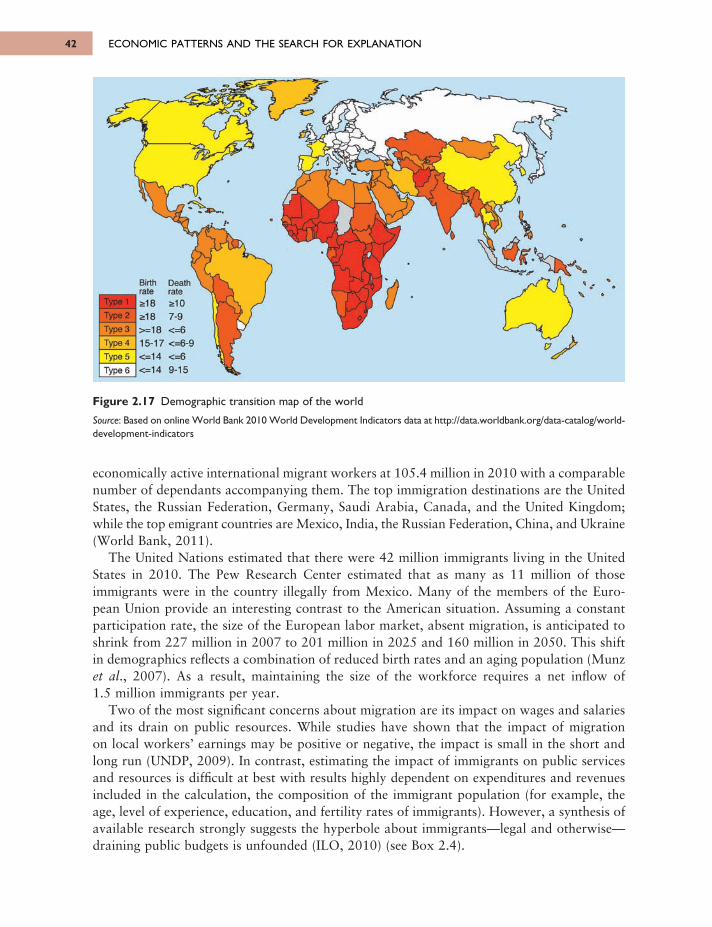
ECONOMIC PATTERNS AND THE SEARCH FOR EXPLANATION42
economically active international migrant workers at 105.4 million in 2010 with a comparablenumber of dependants accompanying them. The top immigration destinations are the UnitedStates, the Russian Federation, Germany, Saudi Arabia, Canada, and the United Kingdom;while the top emigrant countries are Mexico, India, the Russian Federation, China, and Ukraine(World Bank, 2011).
The United Nations estimated that there were 42 million immigrants living in the UnitedStates in 2010. The Pew Research Center estimated that as many as 11 million of thoseimmigrants were in the country illegally from Mexico. Many of the members of the Euro-pean Union provide an interesting contrast to the American situation. Assuming a constantparticipation rate, the size of the European labor market, absent migration, is anticipated toshrink from 227 million in 2007 to 201 million in 2025 and 160 million in 2050. This shiftin demographics reflects a combination of reduced birth rates and an aging population (Munzet al., 2007). As a result, maintaining the size of the workforce requires a net inflow of 1.5 million immigrants per year.
Two of the most significant concerns about migration are its impact on wages and salariesand its drain on public resources. While studies have shown that the impact of migration on local workers’ earnings may be positive or negative, the impact is small in the short andlong run (UNDP, 2009). In contrast, estimating the impact of immigrants on public servicesand resources is difficult at best with results highly dependent on expenditures and revenuesincluded in the calculation, the composition of the immigrant population (for example, theage, level of experience, education, and fertility rates of immigrants). However, a synthesis ofavailable research strongly suggests the hyperbole about immigrants—legal and otherwise—draining public budgets is unfounded (ILO, 2010) (see Box 2.4).
Figure 2.17 Demographic transition map of the world
Source: Based on online World Bank 2010 World Development Indicators data at http://data.worldbank.org/data-catalog/world-development-indicators
6063 GEOGRAPHY WORLD ECON_PT_246x189 mm 22/01/2014 15:09 Page 42
Birthrate
U l8218>=181 5 -1 7
<=14<=14
Deathrate2107-9< = 6
<=6-9< = 6
9-15
Type 1
Type 2Type 3Type 4 Type 5 Type 6
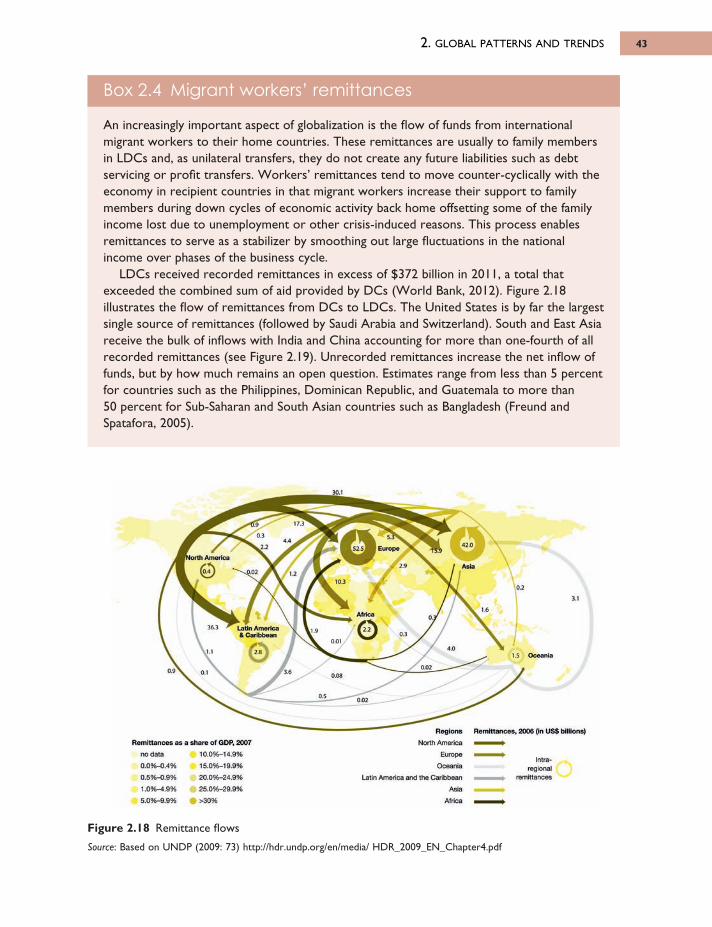
2. GLOBAL PATTERNS AND TRENDS 43
Box 2.4 Migrant workers’ remittances
An increasingly important aspect of globalization is the flow of funds from internationalmigrant workers to their home countries. These remittances are usually to family membersin LDCs and, as unilateral transfers, they do not create any future liabilities such as debtservicing or profit transfers. Workers’ remittances tend to move counter-cyclically with theeconomy in recipient countries in that migrant workers increase their support to familymembers during down cycles of economic activity back home offsetting some of the familyincome lost due to unemployment or other crisis-induced reasons. This process enablesremittances to serve as a stabilizer by smoothing out large fluctuations in the nationalincome over phases of the business cycle.
LDCs received recorded remittances in excess of $372 billion in 2011, a total thatexceeded the combined sum of aid provided by DCs (World Bank, 2012). Figure 2.18illustrates the flow of remittances from DCs to LDCs. The United States is by far the largestsingle source of remittances (followed by Saudi Arabia and Switzerland). South and East Asiareceive the bulk of inflows with India and China accounting for more than one-fourth of allrecorded remittances (see Figure 2.19). Unrecorded remittances increase the net inflow offunds, but by how much remains an open question. Estimates range from less than 5 percentfor countries such as the Philippines, Dominican Republic, and Guatemala to more than 50 percent for Sub-Saharan and South Asian countries such as Bangladesh (Freund andSpatafora, 2005).
Figure 2.18 Remittance flows
Source: Based on UNDP (2009: 73) http://hdr.undp.org/en/media/ HDR_2009_EN_Chapter4.pdf
6063 GEOGRAPHY WORLD ECON_PT_246x189 mm 22/01/2014 15:09 Page 43
OJ17.3
4.4X2
30.1
5 ^E urope 42.0
N o r th A m e r ica
C«0 soo; ' 1210.3
L a tin A m e rica A C aribb ea n
\l.1
0.10.9 '
V 4
A fric a
2.9 As ia
0.2
3.1
1.6
1.5 O ce an ia
0 /
4.0
0J
o.o;00 8
0.01
3.6
2 8
0.5 00
Remittances as a share o f GDP, 2007
no data 10.0%-14.9%
0.0%-0.4% 15.0%-19.9%
0.5%-0.9% 20.0%-24.9%
1.096-4.9% 25.0%-29.9%
5.0%-9.9% · >30%
R n n io n n R f lm i t la n r j tR ?OOfi f in I l f iS h i l l in n c l
North America
Latin America and the Caribbean
Europe
OceaniaIntra-
regionalremittances
Asia
Africa
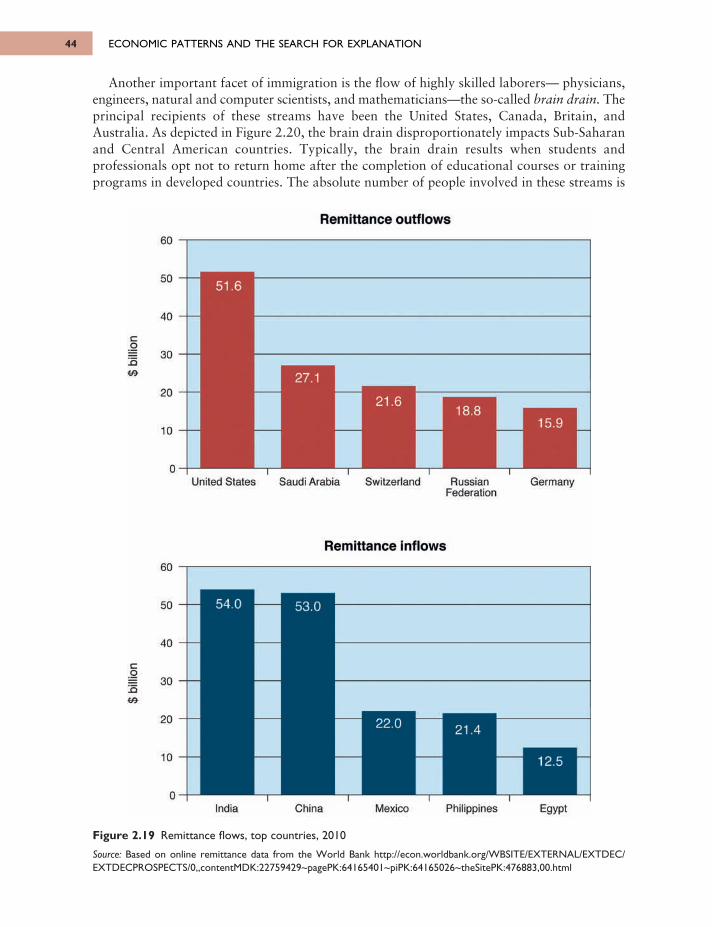
ECONOMIC PATTERNS AND THE SEARCH FOR EXPLANATION44
Figure 2.19 Remittance flows, top countries, 2010
Source: Based on online remittance data from the World Bank http://econ.worldbank.org/WBSITE/EXTERNAL/EXTDEC/EXTDECPROSPECTS/0,,contentMDK:22759429~pagePK:64165401~piPK:64165026~theSitePK:476883,00.html
Another important facet of immigration is the flow of highly skilled laborers— physicians,engineers, natural and computer scientists, and mathematicians—the so-called brain drain. Theprincipal recipients of these streams have been the United States, Canada, Britain, andAustralia. As depicted in Figure 2.20, the brain drain disproportionately impacts Sub-Saharanand Central American countries. Typically, the brain drain results when students andprofessionals opt not to return home after the completion of educational courses or trainingprograms in developed countries. The absolute number of people involved in these streams is
6063 GEOGRAPHY WORLD ECON_PT_246x189 mm 22/01/2014 15:09 Page 44
50
40
ЗО
20
10
О
60
сО
ъ(В
51.Є
21.618.8
15.9
United States Saudi Arabia Switzerland Russian GermanyFederation
Remittance inflows60
50
40
30
20
10
0
Co
! 5
54.0 53.0
22.0 21.4
12.5
India China Mexico Philippines Egypt
Remittance outflows
Co
!5
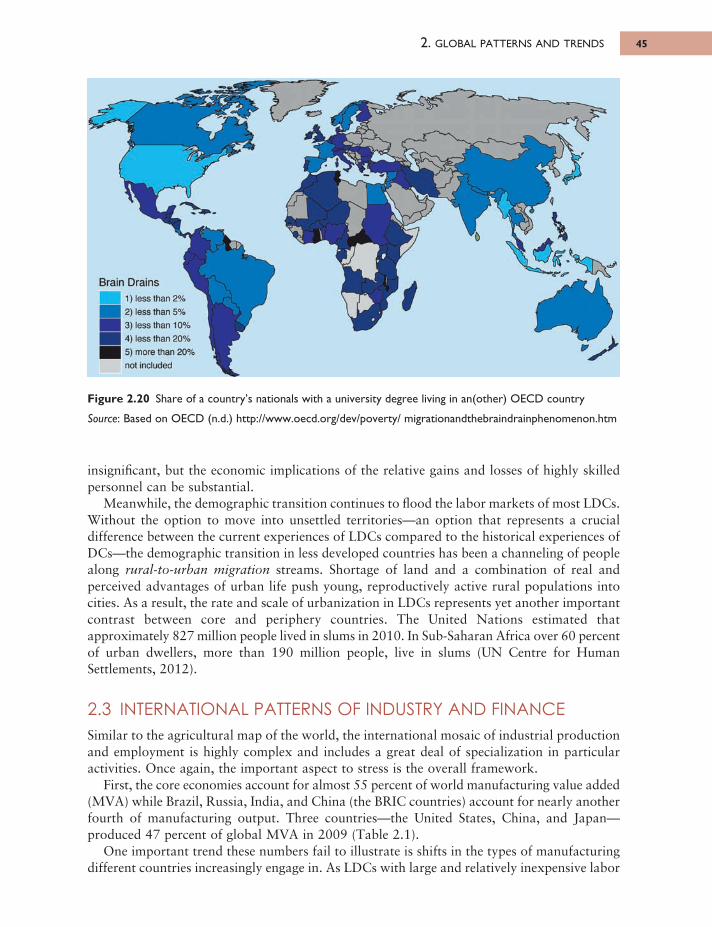
insignificant, but the economic implications of the relative gains and losses of highly skilledper sonnel can be substantial.
Meanwhile, the demographic transition continues to flood the labor markets of most LDCs.Without the option to move into unsettled territories—an option that represents a crucialdifference between the current experiences of LDCs compared to the historical experiences ofDCs—the demographic transition in less developed countries has been a channeling of peoplealong rural-to-urban migration streams. Shortage of land and a combination of real andperceived advantages of urban life push young, reproductively active rural populations intocities. As a result, the rate and scale of urbanization in LDCs represents yet another importantcontrast between core and periphery countries. The United Nations estimated thatapproximately 827 million people lived in slums in 2010. In Sub-Saharan Africa over 60 percentof urban dwellers, more than 190 million people, live in slums (UN Centre for HumanSettlements, 2012).
2.3 INTERNATIONAL PATTERNS OF INDUSTRY AND FINANCESimilar to the agricultural map of the world, the international mosaic of industrial productionand employment is highly complex and includes a great deal of specialization in particularactivities. Once again, the important aspect to stress is the overall framework.
First, the core economies account for almost 55 percent of world manufacturing value added(MVA) while Brazil, Russia, India, and China (the BRIC countries) account for nearly anotherfourth of manufacturing output. Three countries—the United States, China, and Japan—produced 47 percent of global MVA in 2009 (Table 2.1).
One important trend these numbers fail to illustrate is shifts in the types of manufacturingdifferent countries increasingly engage in. As LDCs with large and relatively inexpensive labor
2. GLOBAL PATTERNS AND TRENDS 45
Figure 2.20 Share of a country’s nationals with a university degree living in an(other) OECD country
Source: Based on OECD (n.d.) http://www.oecd.org/dev/poverty/ migrationandthebraindrainphenomenon.htm
6063 GEOGRAPHY WORLD ECON_PT_246x189 mm 22/01/2014 15:09 Page 45
Brain Drains1) less than 2%
2) less than 5%
3) less than 10%
4) less than 20%
5) m ore than 20%
not included
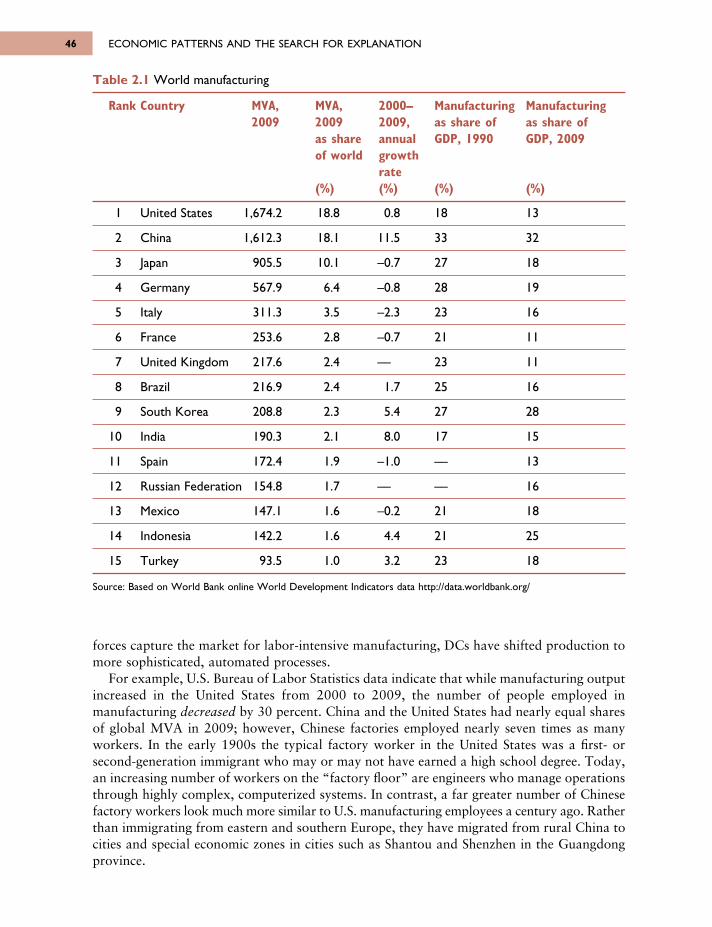
forces capture the market for labor-intensive manufacturing, DCs have shifted production tomore sophisticated, automated processes.
For example, U.S. Bureau of Labor Statistics data indicate that while manufacturing outputincreased in the United States from 2000 to 2009, the number of people employed inmanufacturing decreased by 30 percent. China and the United States had nearly equal sharesof global MVA in 2009; however, Chinese factories employed nearly seven times as manyworkers. In the early 1900s the typical factory worker in the United States was a first- orsecond-generation immigrant who may or may not have earned a high school degree. Today,an increasing number of workers on the “factory floor” are engineers who manage operationsthrough highly complex, computerized systems. In contrast, a far greater number of Chinesefactory workers look much more similar to U.S. manufacturing employees a century ago. Ratherthan immigrating from eastern and southern Europe, they have migrated from rural China tocities and special economic zones in cities such as Shantou and Shenzhen in the Guangdongprovince.
ECONOMIC PATTERNS AND THE SEARCH FOR EXPLANATION46
Table 2.1 World manufacturing
Rank Country MVA, MVA, 2000– Manufacturing Manufacturing2009 2009 2009, as share of as share of
as share annual GDP, 1990 GDP, 2009of world growth
rate(%) (%) (%) (%)
1 United States 1,674.2 18.8 0.8 18 13
2 China 1,612.3 18.1 11.5 33 32
3 Japan 905.5 10.1 –0.7 27 18
4 Germany 567.9 6.4 –0.8 28 19
5 Italy 311.3 3.5 –2.3 23 16
6 France 253.6 2.8 –0.7 21 11
7 United Kingdom 217.6 2.4 –– 23 11
8 Brazil 216.9 2.4 1.7 25 16
9 South Korea 208.8 2.3 5.4 27 28
10 India 190.3 2.1 8.0 17 15
11 Spain 172.4 1.9 –1.0 –– 13
12 Russian Federation 154.8 1.7 –– –– 16
13 Mexico 147.1 1.6 –0.2 21 18
14 Indonesia 142.2 1.6 4.4 21 25
15 Turkey 93.5 1.0 3.2 23 18
Source: Based on World Bank online World Development Indicators data http://data.worldbank.org/
6063 GEOGRAPHY WORLD ECON_PT_246x189 mm 22/01/2014 15:09 Page 46
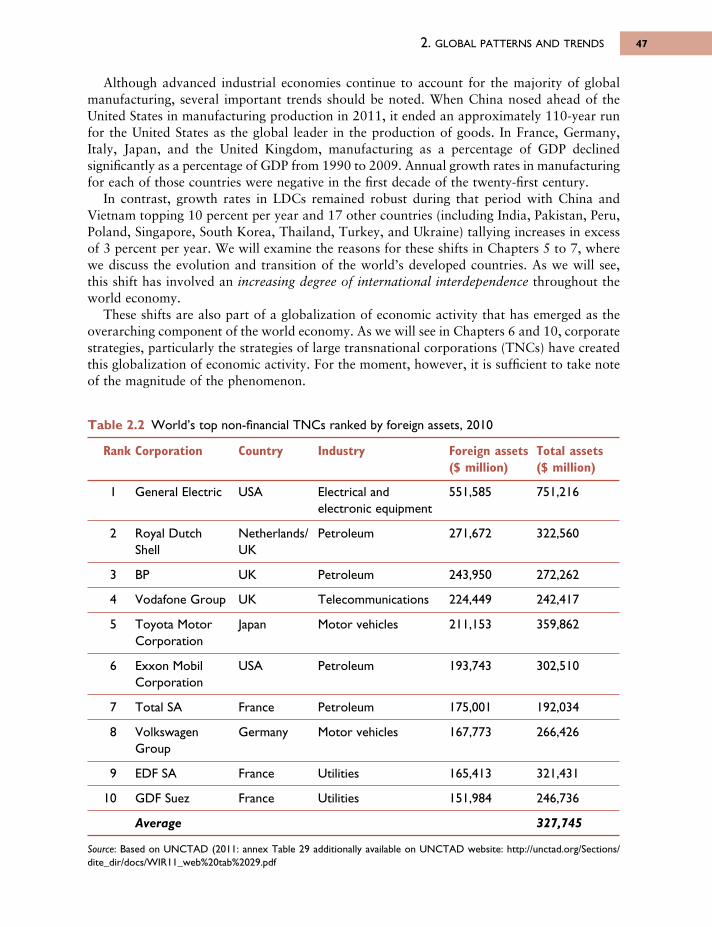
Although advanced industrial economies continue to account for the majority of globalmanufacturing, several important trends should be noted. When China nosed ahead of theUnited States in manufacturing production in 2011, it ended an approximately 110-year runfor the United States as the global leader in the production of goods. In France, Germany,Italy, Japan, and the United Kingdom, manufacturing as a percentage of GDP declinedsignificantly as a percentage of GDP from 1990 to 2009. Annual growth rates in manufacturingfor each of those countries were negative in the first decade of the twenty-first century.
In contrast, growth rates in LDCs remained robust during that period with China andVietnam topping 10 percent per year and 17 other countries (including India, Pakistan, Peru,Poland, Singapore, South Korea, Thailand, Turkey, and Ukraine) tallying increases in excessof 3 percent per year. We will examine the reasons for these shifts in Chapters 5 to 7, wherewe discuss the evolution and transition of the world’s developed countries. As we will see,this shift has involved an increasing degree of international interdependence throughout theworld economy.
These shifts are also part of a globalization of economic activity that has emerged as theoverarching component of the world economy. As we will see in Chapters 6 and 10, corporatestrategies, particularly the strategies of large transnational corporations (TNCs) have createdthis globalization of economic activity. For the moment, however, it is sufficient to take noteof the magnitude of the phenomenon.
2. GLOBAL PATTERNS AND TRENDS 47
Table 2.2 World’s top non-financial TNCs ranked by foreign assets, 2010
Rank Corporation Country Industry Foreign assets Total assets($ million) ($ million)
1 General Electric USA Electrical and 551,585 751,216electronic equipment
2 Royal Dutch Netherlands/ Petroleum 271,672 322,560Shell UK
3 BP UK Petroleum 243,950 272,262
4 Vodafone Group UK Telecommunications 224,449 242,417
5 Toyota Motor Japan Motor vehicles 211,153 359,862Corporation
6 Exxon Mobil USA Petroleum 193,743 302,510Corporation
7 Total SA France Petroleum 175,001 192,034
8 Volkswagen Germany Motor vehicles 167,773 266,426Group
9 EDF SA France Utilities 165,413 321,431
10 GDF Suez France Utilities 151,984 246,736
Average 327,745
Source: Based on UNCTAD (2011: annex Table 29 additionally available on UNCTAD website: http://unctad.org/Sections/dite_dir/docs/WIR11_web%20tab%2029.pdf
6063 GEOGRAPHY WORLD ECON_PT_246x189 mm 22/01/2014 15:09 Page 47
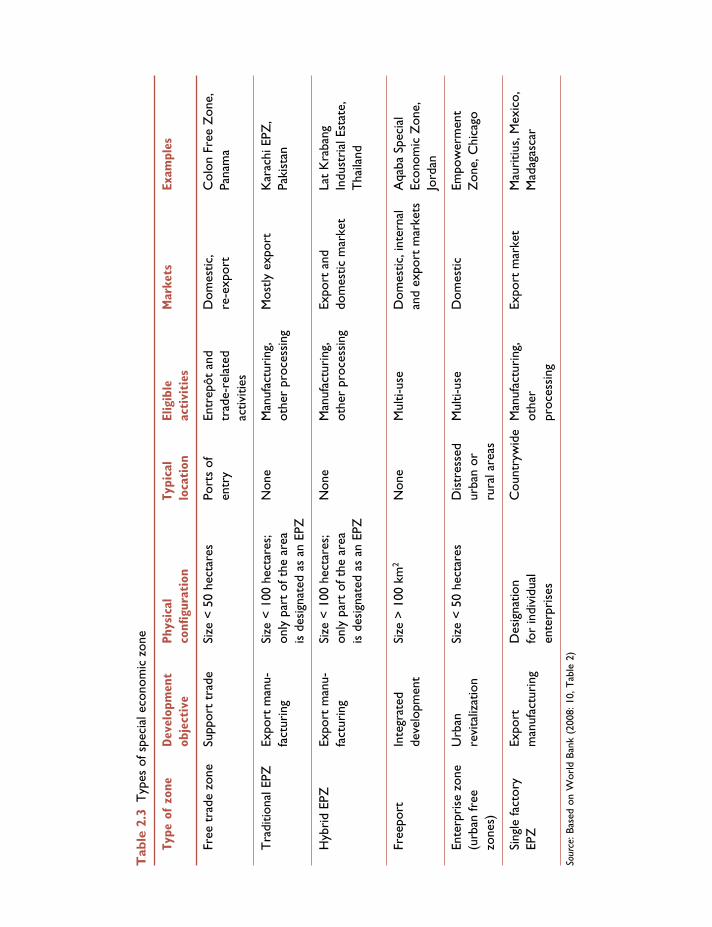
Tab
le 2
.3T
ypes
of s
peci
al e
cono
mic
zon
e
Type
of zo
neDev
elop
men
t Ph
ysic
al
Typi
cal
Elig
ible
M
arke
tsEx
ampl
esob
ject
ive
confi
gura
tion
loca
tion
activi
ties
Free
tra
de z
one
Supp
ort
trad
eSi
ze <
50
hect
ares
Port
s of
En
trep
ôt a
nd
Dom
estic
, C
olon
Fre
e Z
one,
en
try
trad
e-re
late
d re
-exp
ort
Pana
ma
activ
ities
Tra
ditio
nal E
PZEx
port
man
u-Si
ze <
100
hec
tare
s;
Non
eM
anuf
actu
ring
, M
ostly
exp
ort
Kar
achi
EPZ
, fa
ctur
ing
only
par
t of
the
are
a ot
her
proc
essi
ngPa
kist
anis
des
igna
ted
as a
n EP
Z
Hyb
rid
EPZ
Expo
rt m
anu-
Size
< 1
00 h
ecta
res;
N
one
Man
ufac
turi
ng,
Expo
rt a
ndLa
t K
raba
ng
fact
urin
gon
ly p
art
of t
he a
rea
othe
r pr
oces
sing
dom
estic
mar
ket
Indu
stri
al E
stat
e,
is d
esig
nate
d as
an
EPZ
Tha
iland
Free
port
Inte
grat
ed
Size
> 1
00 k
m2
Non
eM
ulti-
use
Dom
estic
, int
erna
l A
qaba
Spe
cial
de
velo
pmen
tan
d ex
port
mar
kets
Econ
omic
Zon
e,
Jord
an
Ente
rpri
se z
one
Urb
anSi
ze <
50
hect
ares
Dis
tres
sed
Mul
ti-us
eD
omes
ticEm
pow
erm
ent
(urb
an fr
ee
revi
taliz
atio
nur
ban
or
Zon
e, C
hica
gozo
nes)
rura
l are
as
Sing
le fa
ctor
y Ex
port
Des
igna
tion
Cou
ntry
wid
eM
anuf
actu
ring
, Ex
port
mar
ket
Mau
ritiu
s, M
exic
o,EP
Zm
anuf
actu
ring
for
indi
vidu
al
othe
r M
adag
asca
ren
terp
rise
spr
oces
sing
Sour
ce: B
ased
on
Wor
ld B
ank
(200
8: 1
0, T
able
2)
6063 GEOGRAPHY WORLD ECON_PT_246x189 mm 22/01/2014 15:09 Page 48
One striking measure of the importance of transnational corporations in the world economyis the size of their annual turnover in comparison with the GNI of entire countries. By thisyardstick, all of the top 50 global TNCs—including ExxonMobil, General Motors, Ford MotorCompany, General Electric, Mitsubishi, IBM, Nestlé, Unilever, BP, Royal Dutch/Shell, Siemens,and Toyota Motor Corporation—carry more economic clout than many smaller LDCs. Themedian total assets of the ten largest TNCs are larger than the economies of countries suchas South Africa, Portugal, Singapore, and Ireland (see Table 2.2). In fact, only 27 countrieshave higher GNIs than the median total assets of the ten largest TNCs.
Collectively, the 500 largest U.S. corporations now employ an overseas labor force as bigas their domestic labor force. Similar statistics apply to the largest Japanese corporations. Theseoverseas labor forces are spread among different parts of the world, but it is in LDCs and, inparticular, the NIEs where the most rapid growth has been taking place. More than 30 percentof manufacturing by Japanese firms happens overseas. The foreign-made share of output forToshiba exceeds 50 percent. For companies such as Fuji Xerox and Yamaha Motor, that shareaccounts for more than four-fifths of production with much of it relocated to countries in theregion such as South Korea, Thailand and Taiwan (Economist, 2010b).
The governments of LDCs have sought to take advantage of transnational corporations’need for cheap labor by setting up export-processing zones (EPZs)—see also Chapter 10—adaptations of free trade zones in which favorable investment and trade conditions are createdby waiving excise duties on components, providing factory space and warehousing at subsidizedrates, allowing tax “holidays” of up to five years, and suspending foreign exchange controls.EPZs are merely one type of special economic zones that range in size, objective, and markets(see Table 2.3). One of the primary objectives of these zones is increasing employmentopportunities. Currently, special economic zones are estimated to provide direct employmentfor over 68 million people, nearly 90 percent of those jobs are in Asia and the Pacific (WorldBank, 2008, Table 15).
At a more general level, governments everywhere have responded to the “global reach” of transnational corporations by intensifying their involvement with supranational economicand political organizations such as the European Union (EU), the Association of South EastAsian Nations (ASEAN) and the North American Free Trade Agreement (NAFTA). We willbe reviewing the changing role of the state in the context of the internationalization of theworld economy in Parts 2 and 3. In Part 4, we will explore supranational reactions to the internationalization of the world economy.
PATTERNS OF INTERNATIONAL TRADE
The fundamental structure of international trade has been based on a few trading blocs withmost trade taking place within these blocs. Membership in these trading blocs is principallythe result of the effects of (1) distance, (2) the legacy of colonial relationships, and (3) geopoliticalalliances. For most of the period from 1950 to 1990, for example, four trading blocs dominatedinternational trade:
1. western Europe including some former European colonies in Africa, South Asia, theCaribbean and Australasia
2. North America and some Latin American countries3. the countries of the former Soviet Union4. Japan along with other East Asian countries and the oil-exporting countries of Saudi Arabia
and Bahrain.
2. GLOBAL PATTERNS AND TRENDS 49
6063 GEOGRAPHY WORLD ECON_PT_246x189 mm 22/01/2014 15:09 Page 49
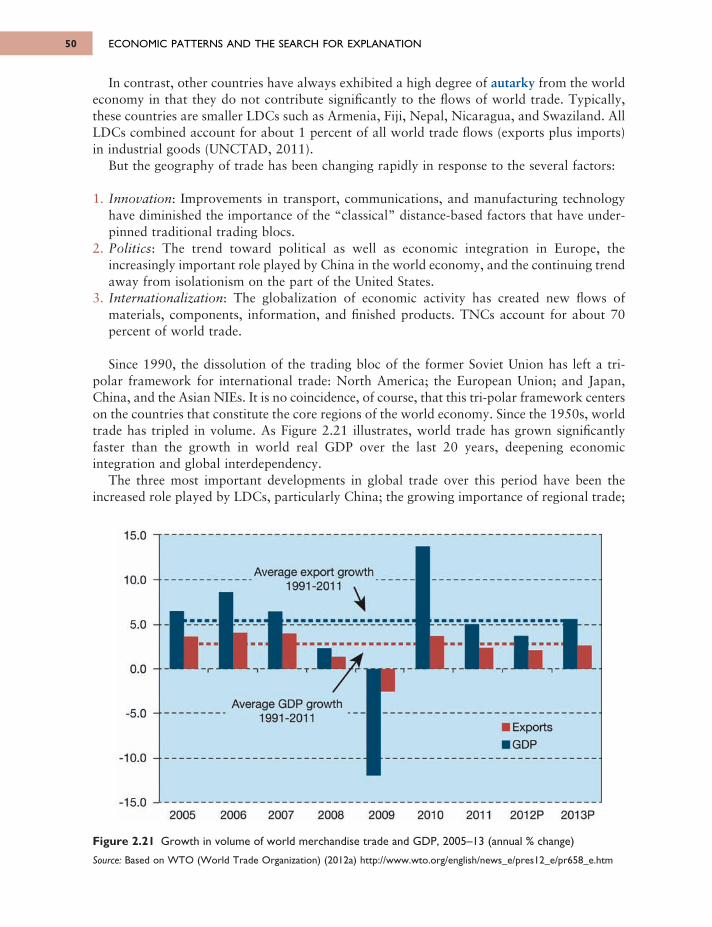
ECONOMIC PATTERNS AND THE SEARCH FOR EXPLANATION50
In contrast, other countries have always exhibited a high degree of autarky from the worldeconomy in that they do not contribute significantly to the flows of world trade. Typically,these countries are smaller LDCs such as Armenia, Fiji, Nepal, Nicaragua, and Swaziland. AllLDCs combined account for about 1 percent of all world trade flows (exports plus imports)in industrial goods (UNCTAD, 2011).
But the geography of trade has been changing rapidly in response to the several factors:
1. Innovation: Improvements in transport, communications, and manufacturing technologyhave diminished the importance of the “classical” distance-based factors that have under-pinned traditional trading blocs.
2. Politics: The trend toward political as well as economic integration in Europe, theincreasingly important role played by China in the world economy, and the continuing trendaway from isolationism on the part of the United States.
3. Internationalization: The globalization of economic activity has created new flows ofmaterials, components, information, and finished products. TNCs account for about 70percent of world trade.
Since 1990, the dissolution of the trading bloc of the former Soviet Union has left a tri-polar framework for international trade: North America; the European Union; and Japan,China, and the Asian NIEs. It is no coincidence, of course, that this tri-polar framework centerson the countries that constitute the core regions of the world economy. Since the 1950s, worldtrade has tripled in volume. As Figure 2.21 illustrates, world trade has grown significantlyfaster than the growth in world real GDP over the last 20 years, deepening economicintegration and global interdependency.
The three most important developments in global trade over this period have been theincreased role played by LDCs, particularly China; the growing importance of regional trade;
Figure 2.21 Growth in volume of world merchandise trade and GDP, 2005–13 (annual % change)
Source: Based on WTO (World Trade Organization) (2012a) http://www.wto.org/english/news_e/pres12_e/pr658_e.htm
6063 GEOGRAPHY WORLD ECON_PT_246x189 mm 22/01/2014 15:09 Page 50
15.0
10.0
5.0
0.0
-5.0
- 10.0
-15.02005 2006 2007 2008 2009 2010 2011 2012 9 201 ЗР
Exports GDP
Average GDP growth 1991-2011
Average export grow th 1991-2011 4
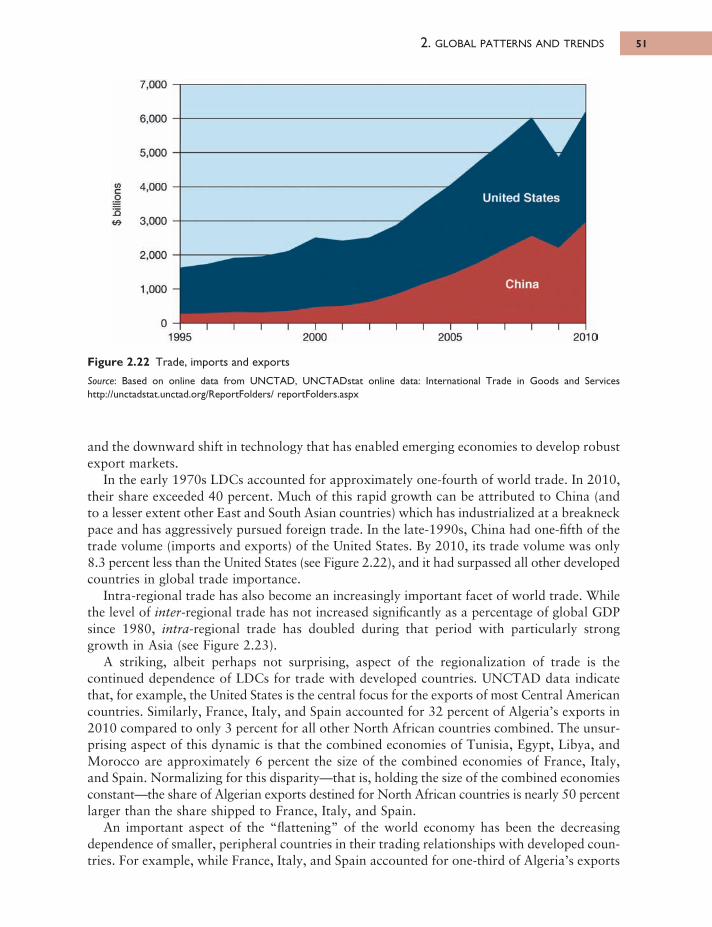
and the downward shift in technology that has enabled emerging economies to develop robustexport markets.
In the early 1970s LDCs accounted for approximately one-fourth of world trade. In 2010,their share exceeded 40 percent. Much of this rapid growth can be attributed to China (andto a lesser extent other East and South Asian countries) which has industrialized at a breakneckpace and has aggressively pursued foreign trade. In the late-1990s, China had one-fifth of thetrade volume (imports and exports) of the United States. By 2010, its trade volume was only8.3 percent less than the United States (see Figure 2.22), and it had surpassed all other developedcountries in global trade importance.
Intra-regional trade has also become an increasingly important facet of world trade. Whilethe level of inter-regional trade has not increased significantly as a percentage of global GDPsince 1980, intra-regional trade has doubled during that period with particularly stronggrowth in Asia (see Figure 2.23).
A striking, albeit perhaps not surprising, aspect of the regionalization of trade is thecontinued dependence of LDCs for trade with developed countries. UNCTAD data indicatethat, for example, the United States is the central focus for the exports of most Central Americancountries. Similarly, France, Italy, and Spain accounted for 32 percent of Algeria’s exports in2010 compared to only 3 percent for all other North African countries combined. The unsur -prising aspect of this dynamic is that the combined economies of Tunisia, Egypt, Libya, andMorocco are approximately 6 percent the size of the combined economies of France, Italy,and Spain. Normalizing for this disparity—that is, holding the size of the combined economiesconstant—the share of Algerian exports destined for North African countries is nearly 50 percentlarger than the share shipped to France, Italy, and Spain.
An important aspect of the “flattening” of the world economy has been the decreasingdepend ence of smaller, peripheral countries in their trading relationships with developed coun -tries. For example, while France, Italy, and Spain accounted for one-third of Algeria’s exports
2. GLOBAL PATTERNS AND TRENDS 51
Figure 2.22 Trade, imports and exports
Source: Based on online data from UNCTAD, UNCTADstat online data: International Trade in Goods and Serviceshttp://unctadstat.unctad.org/ReportFolders/ reportFolders.aspx
6063 GEOGRAPHY WORLD ECON_PT_246x189 mm 22/01/2014 15:09 Page 51
United States
China
2005 201020001995
7.000 ·
6.000
5.000
4.000
3.000
2.000 ·
1,000
0
inco
n«/»
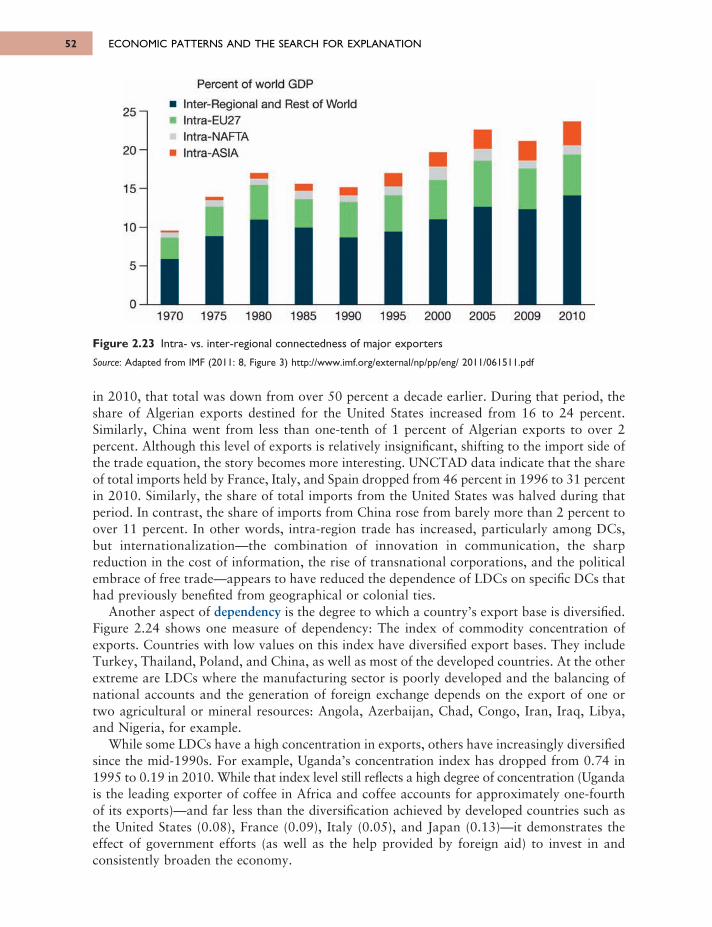
ECONOMIC PATTERNS AND THE SEARCH FOR EXPLANATION52
in 2010, that total was down from over 50 percent a decade earlier. During that period, theshare of Algerian exports destined for the United States increased from 16 to 24 percent.Similarly, China went from less than one-tenth of 1 percent of Algerian exports to over 2percent. Although this level of exports is relatively insignificant, shifting to the import side ofthe trade equation, the story becomes more interesting. UNCTAD data indicate that the shareof total imports held by France, Italy, and Spain dropped from 46 percent in 1996 to 31 percentin 2010. Similarly, the share of total imports from the United States was halved during thatperiod. In contrast, the share of imports from China rose from barely more than 2 percent toover 11 percent. In other words, intra-region trade has increased, particularly among DCs,but internationalization—the combination of innovation in communication, the sharpreduction in the cost of information, the rise of transnational corporations, and the politicalembrace of free trade—appears to have reduced the dependence of LDCs on specific DCs thathad previously benefited from geographical or colonial ties.
Another aspect of dependency is the degree to which a country’s export base is diversified.Figure 2.24 shows one measure of dependency: The index of commodity concentration ofexports. Countries with low values on this index have diversified export bases. They includeTurkey, Thailand, Poland, and China, as well as most of the developed countries. At the otherextreme are LDCs where the manufacturing sector is poorly developed and the balancing ofnational accounts and the generation of foreign exchange depends on the export of one ortwo agricultural or mineral resources: Angola, Azerbaijan, Chad, Congo, Iran, Iraq, Libya,and Nigeria, for example.
While some LDCs have a high concentration in exports, others have increasingly diversifiedsince the mid-1990s. For example, Uganda’s concentration index has dropped from 0.74 in1995 to 0.19 in 2010. While that index level still reflects a high degree of concentration (Ugandais the leading exporter of coffee in Africa and coffee accounts for approximately one-fourthof its exports)—and far less than the diversification achieved by developed countries such asthe United States (0.08), France (0.09), Italy (0.05), and Japan (0.13)—it demonstrates theeffect of government efforts (as well as the help provided by foreign aid) to invest in andconsistently broaden the economy.
Figure 2.23 Intra- vs. inter-regional connectedness of major exporters
Source: Adapted from IMF (2011: 8, Figure 3) http://www.imf.org/external/np/pp/eng/ 2011/061511.pdf
6063 GEOGRAPHY WORLD ECON_PT_246x189 mm 22/01/2014 15:09 Page 52
Percent of world GDP
Inter-Reaional and Rest o f W orldlntra-EU27Intra-NAFTAIntra-ASIA20
15
10
5
25
01970 1975 1980 1985 1990 1995 2000 2005 2009 2010
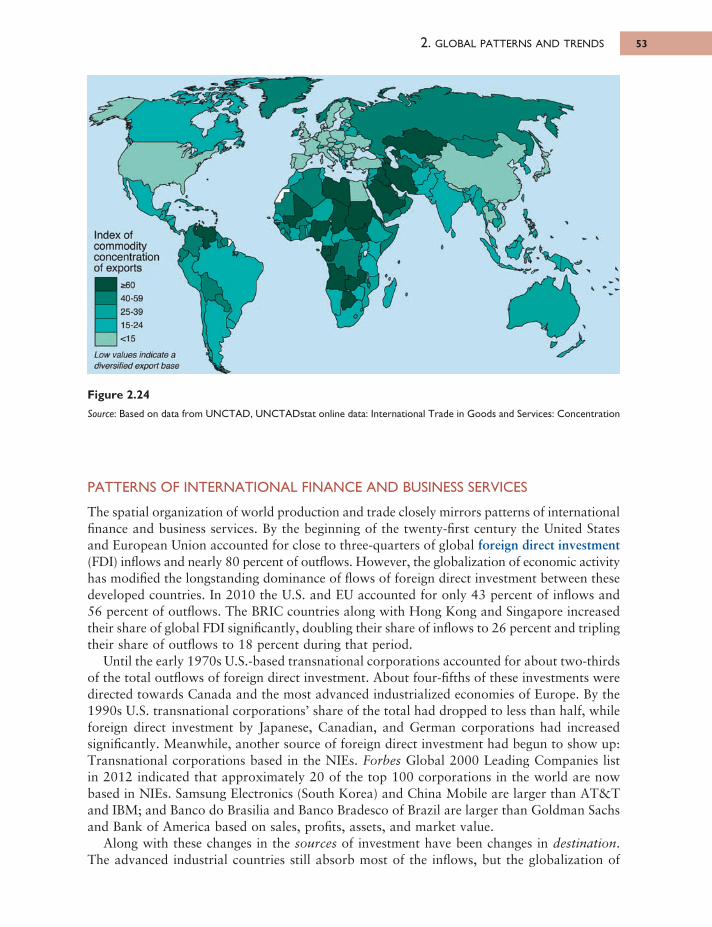
PATTERNS OF INTERNATIONAL FINANCE AND BUSINESS SERVICES
The spatial organization of world production and trade closely mirrors patterns of internationalfinance and business services. By the beginning of the twenty-first century the United Statesand European Union accounted for close to three-quarters of global foreign direct investment(FDI) inflows and nearly 80 percent of outflows. However, the globalization of economic activityhas modified the longstanding dominance of flows of foreign direct investment between thesedeveloped countries. In 2010 the U.S. and EU accounted for only 43 percent of inflows and56 percent of outflows. The BRIC countries along with Hong Kong and Singapore increasedtheir share of global FDI significantly, doubling their share of inflows to 26 percent and triplingtheir share of outflows to 18 percent during that period.
Until the early 1970s U.S.-based transnational corporations accounted for about two-thirdsof the total outflows of foreign direct investment. About four-fifths of these investments weredirected towards Canada and the most advanced industrialized economies of Europe. By the1990s U.S. transnational corporations’ share of the total had dropped to less than half, whileforeign direct investment by Japanese, Canadian, and German corporations had increasedsignificantly. Meanwhile, another source of foreign direct investment had begun to show up:Transnational corporations based in the NIEs. Forbes Global 2000 Leading Companies listin 2012 indicated that approximately 20 of the top 100 corporations in the world are nowbased in NIEs. Samsung Electronics (South Korea) and China Mobile are larger than AT&Tand IBM; and Banco do Brasilia and Banco Bradesco of Brazil are larger than Goldman Sachsand Bank of America based on sales, profits, assets, and market value.
Along with these changes in the sources of investment have been changes in destination.The advanced industrial countries still absorb most of the inflows, but the globalization of
2. GLOBAL PATTERNS AND TRENDS 53
Figure 2.24
Source: Based on data from UNCTAD, UNCTADstat online data: International Trade in Goods and Services: Concentration
6063 GEOGRAPHY WORLD ECON_PT_246x189 mm 22/01/2014 15:09 Page 53
Figure 2.24
Source: Based on data from UNCTAD, UNCTADstat online data: International Trade in Goods and Services: Concentration
Figure 2.24
Source: Based on data from UNCTAD, UNCTADstat online data: International Trade in Goods and Services: Concentration
Index of commodity concentration of exports
I 26O40-59
25-39
15-24
<15
Low values indicate a diversified export base
25-3915-24
economic activity has brought significant flows of capital into the NIEs; seven—Brazil, Chile,China (including Hong Kong), India, Mexico, Saudi Arabia, and Singapore—accounted for60 percent of inflows among LDCs.
Changes in international investment have been contingent on other changes in the patternof international finance. The Bretton Woods Agreement of 1944 set the pattern of internationalfinance in the first part of the post-war period. During this period exchange rates were fixedand the U.S. dollar served as the convertible medium of currency with a fixed relationship tothe price of gold. But, as the position of the United States deteriorated in terms of worldmanufacturing and trade, the system came under pressure.
The result was that the Bretton Woods system crumbled. In particular, by the late 1960s fixedexchange rates effectively disappeared and every domestic currency became convertible into everyother. Exchange rates “floated,” and, as a result, all domestic currencies became a medium thatcould be bought and sold and out of which a profit could be made
(Thrift, 1989: 34).
Meanwhile, a pool of eurodollars had developed—U.S. dollars held in banks located outsidethe United States (not to be confused with the European Union currency, the euro). This poolexpanded quickly after 1971 as the U.S. government began financing its budget deficit with itsown currency, effectively flooding the world with dollars and fuelling worldwide inflation.
Two years later, the eurodollar market swelled further as oil-producing countries rapidlyacquired reserves of dollars as a result of the quadrupling of petroleum prices in the wake ofthe embargo by the Organization of Petroleum Exporting Countries (OPEC). From thecombination of floating currencies and the creation of a large market in eurodollars, a new,more sophisticated system of international finance emerged. Consequently, an expansion andinternationalization of key business services such as stock exchanges, futures markets, andbanks accompanied these new patterns of investment.
As developed countries became less competitive in labor-intensive industrial production,they increasingly relied on these services to earn foreign currency and balance nationalaccounts. This system of international finance has produced giant financial conglomeratesincluding Citigroup, UBS, HSBC, and Deutsche Bank that dominate world financial affairs.As Barnet and Cavanagh (1994: 17) noted:
Twenty-four hours a day, trillions of dollars flow through the world’s foreign-exchange marketsas bits of data traveling at split-second speed. No more than 10 per cent of this staggering sumhas anything to do with trade in goods and services. International traffic in money has becomean end in itself, a highly profitable game.
But as the global debt crisis demonstrated, this interconnection also amplifies the potentialdomino effect of crises and can imperil not only these institutions but entire industries, countries,and the world economy. The subprime mortgage “meltdown” in the United States not onlyaffected U.S. financial institutions. Its repercussions were felt across Europe and Asia. Anestimated $2.2 trillion was written off on toxic assets and bad loans. The crisis triggered asell-off in world financial markets and a global recession. In the initial years after the onsetof the crisis, the reverberations continued to be felt as the debt burden of Greece, Ireland,Spain, Portugal, and Italy (Figure 2.25) increased the possibility of government default andthe implosion of the euro.
Additionally, not all of the needs of this “casino economy” can be met by conventionalfinancial and business services. Offshore financial centers have emerged to meet the need forsecrecy and the desire for shelter from taxation and regulation; islands and micro-states such
ECONOMIC PATTERNS AND THE SEARCH FOR EXPLANATION54
6063 GEOGRAPHY WORLD ECON_PT_246x189 mm 22/01/2014 15:09 Page 54
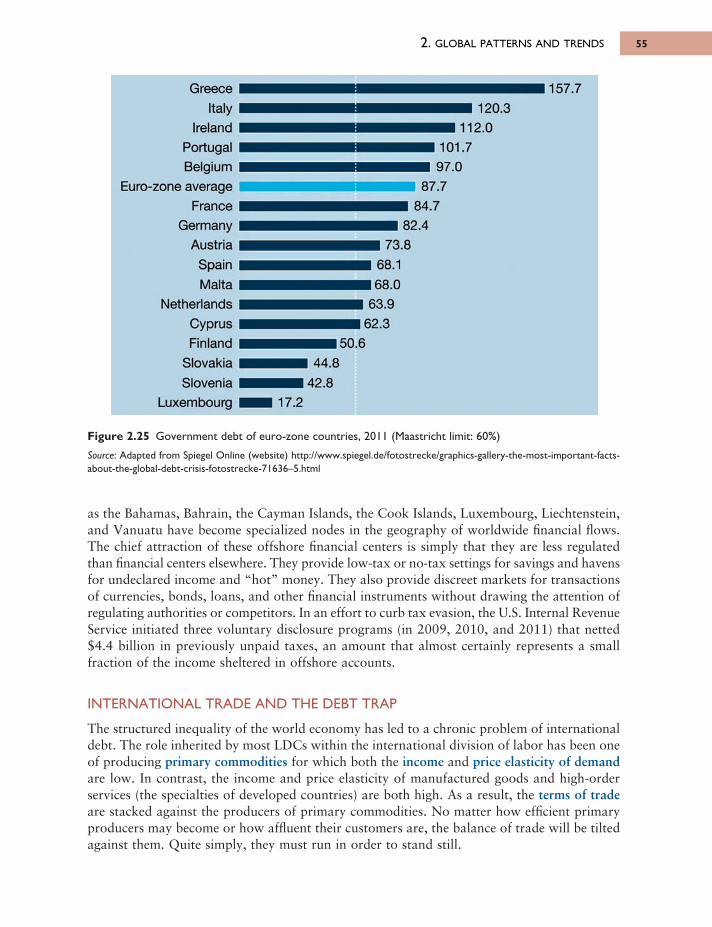
2. GLOBAL PATTERNS AND TRENDS 55
as the Bahamas, Bahrain, the Cayman Islands, the Cook Islands, Luxembourg, Liechtenstein,and Vanuatu have become specialized nodes in the geography of worldwide financial flows.The chief attraction of these offshore financial centers is simply that they are less regulatedthan financial centers elsewhere. They provide low-tax or no-tax settings for savings and havensfor undeclared income and “hot” money. They also provide discreet markets for transactionsof currencies, bonds, loans, and other financial instruments without drawing the attention ofregulating authorities or competitors. In an effort to curb tax evasion, the U.S. Internal RevenueService initiated three voluntary disclosure programs (in 2009, 2010, and 2011) that netted$4.4 billion in previously unpaid taxes, an amount that almost certainly represents a smallfraction of the income sheltered in offshore accounts.
INTERNATIONAL TRADE AND THE DEBT TRAP
The structured inequality of the world economy has led to a chronic problem of internationaldebt. The role inherited by most LDCs within the international division of labor has been oneof producing primary commodities for which both the income and price elasticity of demandare low. In contrast, the income and price elasticity of manufactured goods and high-orderservices (the specialties of developed countries) are both high. As a result, the terms of tradeare stacked against the producers of primary commodities. No matter how efficient primaryproducers may become or how affluent their customers are, the balance of trade will be tiltedagainst them. Quite simply, they must run in order to stand still.
Figure 2.25 Government debt of euro-zone countries, 2011 (Maastricht limit: 60%)
Source: Adapted from Spiegel Online (website) http://www.spiegel.de/fotostrecke/graphics-gallery-the-most-important-facts-about-the-global-debt-crisis-fotostrecke-71636–5.html
6063 GEOGRAPHY WORLD ECON_PT_246x189 mm 22/01/2014 15:09 Page 55
GreeceItaly
IrelandPortugalBelgium
Euro-zone averageFrance
GermanyAustria
SpainMalta
NetherlandsCyprusFinland
SlovakiaSlovenia
Luxembourg
157.7120.3
112.0101.7
97.087.7
84.7I 82.4
73.8
68.063.9
I 62.c50.6
44.842.8
17.2
ECONOMIC PATTERNS AND THE SEARCH FOR EXPLANATION56
A prudent counterstrategy for these countries is to change their role in the internationaldivision of labor, moving away from the specialization in primary commodities and towardsa diversified manufacturing base; that is, pursuing import substitution. Unfortunately, thisstrategy is easier to execute on paper than in practice. Establishing a diversified manufacturingbase requires vast amounts of start-up capital. With the terms of trade running against them,these countries have a difficult time acquiring the requisite capital. The only alternative, shortof striving for self-sufficiency—for example, Tanzania and Myanmar (Burma)—or opting out
Box 2.5 From darling to disaster: Iceland and the globalfinancial crisis
By Bart Yavorosky
The global financial crisis produced a number of high-profile failures such as LehmanBrothers, Merrill Lynch, and Bear Sterns, but none illustrates the interconnectedness of theworld economy quite as strikingly as Iceland.
For much of its history, Iceland had a “cod” economy. The ubiquitous fish of the Atlantic was its primary source of wealth, its main export, and its only impetus for “wars”(conflicts with the United Kingdom over the right to fish the waters off its mainland). In thespan of a few years leading up to the financial crisis, however, Iceland became the envy ofmany other DCs.
Mimicking the profitable short-term lending practices of financial institutions in othercountries, Icelandic commercial banks began offering low-interest, long-maturity loans at thestart of the 2000s. Easy credit fueled a construction boom and a spike in real estate prices.By refinancing their mortgages, Icelanders converted their paper wealth into cash andincreased personal consumption (see Figure 2.26 A). In an effort to curb inflation (see Figure 2.26 B), the central bank raised short-term interest rates to 15 percent. This ratewas attractive to foreign investors who borrowed money abroad (for example, from Japan)at low rates and invested in high-returning Icelandic assets. This “carry trade” increased netinflows of FDI nearly eightfold (see Figure 2.26 C) and enabled Icelanders to embark on aforeign-denominated debt spending spree.
Deregulation of Iceland’s financial sector also enabled its three main banks—Glitnir,Kaupthing, and Nyi Landsbanki—to expand operations abroad by acquiring commercialbanks and securities brokerage houses in Europe and the United States. As bank revenuesgrew, Iceland’s stock market soared (see Figure 2.26 D). By 2007 these banks hadaccumulated assets totaling more than eight times Iceland’s GDP and were funding as muchas 75 percent of their operations through short-term debt.
A country that traditionally had prided itself on prudence and thrift became one of thefastest growing economies in the world and an emblem of conspicuous consumption. Whenthe global financial crisis hit and credit markets seized up, Iceland’s banks could no longeracquire the capital to operate; given the size of their debt, Iceland’s central bank could notact as a lender-of-last-resort. With no other options, the government seized the banks,sending its stock market tumbling, decimating the krona, and devastating its real estatemarket. The fishing families who had eked out modest livings for generations by trolling theNorth Atlantic for cod had become investors who, for a few brief years, earned butsubsequently lost millions riding the waves of the global financial markets.
6063 GEOGRAPHY WORLD ECON_PT_246x189 mm 22/01/2014 15:09 Page 56
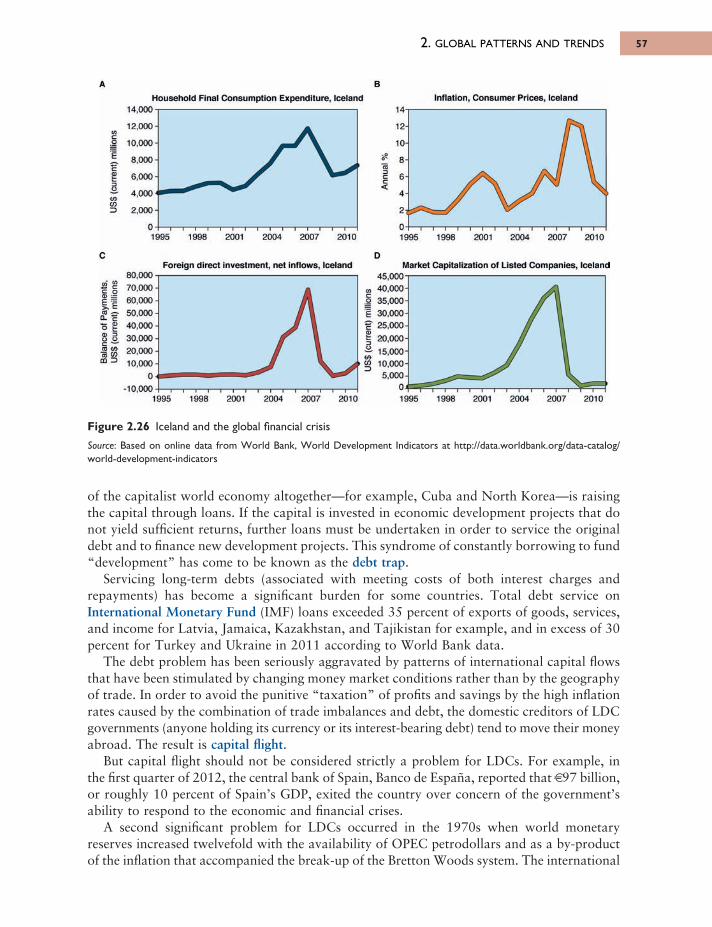
2. GLOBAL PATTERNS AND TRENDS 57
of the capitalist world economy altogether—for example, Cuba and North Korea—is raisingthe capital through loans. If the capital is invested in economic development projects that donot yield sufficient returns, further loans must be undertaken in order to service the originaldebt and to finance new development projects. This syndrome of constantly borrowing to fund“development” has come to be known as the debt trap.
Servicing long-term debts (associated with meeting costs of both interest charges andrepayments) has become a significant burden for some countries. Total debt service onInternational Monetary Fund (IMF) loans exceeded 35 percent of exports of goods, services,and income for Latvia, Jamaica, Kazakhstan, and Tajikistan for example, and in excess of 30percent for Turkey and Ukraine in 2011 according to World Bank data.
The debt problem has been seriously aggravated by patterns of international capital flowsthat have been stimulated by changing money market conditions rather than by the geographyof trade. In order to avoid the punitive “taxation” of profits and savings by the high inflationrates caused by the combination of trade imbalances and debt, the domestic creditors of LDCgovernments (anyone holding its currency or its interest-bearing debt) tend to move their moneyabroad. The result is capital flight.
But capital flight should not be considered strictly a problem for LDCs. For example, inthe first quarter of 2012, the central bank of Spain, Banco de España, reported that €97 billion,or roughly 10 percent of Spain’s GDP, exited the country over concern of the government’sability to respond to the economic and financial crises.
A second significant problem for LDCs occurred in the 1970s when world monetaryreserves increased twelvefold with the availability of OPEC petrodollars and as a by-productof the inflation that accompanied the break-up of the Bretton Woods system. The international
Figure 2.26 Iceland and the global financial crisis
Source: Based on online data from World Bank, World Development Indicators at http://data.worldbank.org/data-catalog/world-development-indicators
6063 GEOGRAPHY WORLD ECON_PT_246x189 mm 22/01/2014 15:09 Page 57
14.000
12.000
10,000
8,000
6,000
4.000
2.000
0
COcΟ
1Έ§9CJ
(Л=>
1995 1998 2001 2004 2007 2010
язс<
Household Final Consumption Expenditure, Iceland Inflation, Consumer Prices, Iceland
12
10
8
6
4
2
0
14
1995 1998 2001 2004 2007 201C
A В
CForeign direct investment, net inflows, Iceland Market Capitalization of Listed Companies, Iceland
D
11IIQ. c o ®ф зo o cCO 00
S d
80,00070.00060.00050.00040.00030.00020.000 10,000
n- 10,000
1995 1998 2001 2004 2007 2011
45.00040.00035.000
30.00025.000
20.000
15.00010.000 5,000
Ω
<oI1БIзO,
S3
1995 1998 2001 2004 2007 2010
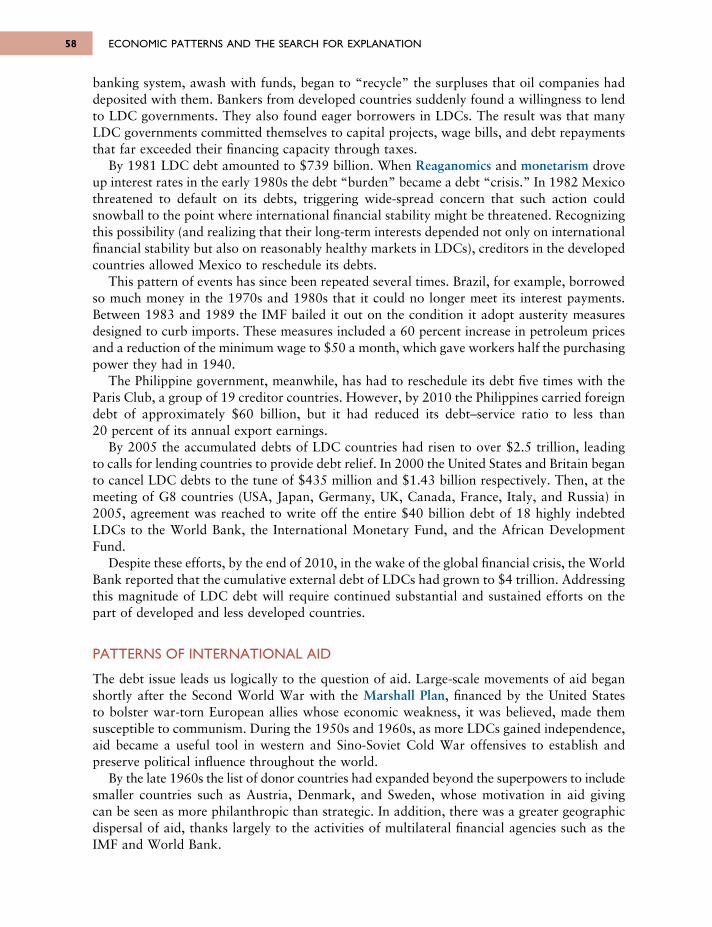
banking system, awash with funds, began to “recycle” the surpluses that oil companies haddeposited with them. Bankers from developed countries suddenly found a willingness to lendto LDC governments. They also found eager borrowers in LDCs. The result was that manyLDC governments committed themselves to capital projects, wage bills, and debt repaymentsthat far exceeded their financing capacity through taxes.
By 1981 LDC debt amounted to $739 billion. When Reaganomics and monetarism droveup interest rates in the early 1980s the debt “burden” became a debt “crisis.” In 1982 Mexicothreatened to default on its debts, triggering wide-spread concern that such action couldsnowball to the point where international financial stability might be threatened. Recognizingthis possibility (and realizing that their long-term interests depended not only on internationalfinancial stability but also on reasonably healthy markets in LDCs), creditors in the developedcountries allowed Mexico to reschedule its debts.
This pattern of events has since been repeated several times. Brazil, for example, borrowedso much money in the 1970s and 1980s that it could no longer meet its interest payments.Between 1983 and 1989 the IMF bailed it out on the condition it adopt austerity measuresdesigned to curb imports. These measures included a 60 percent increase in petroleum pricesand a reduction of the minimum wage to $50 a month, which gave workers half the purchasingpower they had in 1940.
The Philippine government, meanwhile, has had to reschedule its debt five times with theParis Club, a group of 19 creditor countries. However, by 2010 the Philippines carried foreigndebt of approximately $60 billion, but it had reduced its debt–service ratio to less than 20 percent of its annual export earnings.
By 2005 the accumulated debts of LDC countries had risen to over $2.5 trillion, leadingto calls for lending countries to provide debt relief. In 2000 the United States and Britain beganto cancel LDC debts to the tune of $435 million and $1.43 billion respectively. Then, at themeeting of G8 countries (USA, Japan, Germany, UK, Canada, France, Italy, and Russia) in2005, agreement was reached to write off the entire $40 billion debt of 18 highly indebtedLDCs to the World Bank, the International Monetary Fund, and the African DevelopmentFund.
Despite these efforts, by the end of 2010, in the wake of the global financial crisis, the WorldBank reported that the cumulative external debt of LDCs had grown to $4 trillion. Addressingthis magnitude of LDC debt will require continued substantial and sustained efforts on thepart of developed and less developed countries.
PATTERNS OF INTERNATIONAL AID
The debt issue leads us logically to the question of aid. Large-scale movements of aid beganshortly after the Second World War with the Marshall Plan, financed by the United States to bolster war-torn European allies whose economic weakness, it was believed, made themsusceptible to communism. During the 1950s and 1960s, as more LDCs gained independence,aid became a useful tool in western and Sino-Soviet Cold War offensives to establish andpreserve political influence throughout the world.
By the late 1960s the list of donor countries had expanded beyond the superpowers to includesmaller countries such as Austria, Denmark, and Sweden, whose motivation in aid giving can be seen as more philanthropic than strategic. In addition, there was a greater geographicdispersal of aid, thanks largely to the activities of multilateral financial agencies such as theIMF and World Bank.
ECONOMIC PATTERNS AND THE SEARCH FOR EXPLANATION58
6063 GEOGRAPHY WORLD ECON_PT_246x189 mm 22/01/2014 15:09 Page 58
Nevertheless, the geography of aid still has a strong political flavor. Bilateral aid from somecountries reflects localized political aspirations and colonial ties. So much British and Frenchaid is directed towards former African colonies; Japanese aid is disbursed largely within Asia;and aid from the OPEC countries has been directed mainly towards the “frontline” Arabcountries.
More significantly for the LDCs, the end of the Cold War, together with the balance ofpayments difficulties of several developed countries, has ensured that levels of aid havediminished. Whereas official development assistance from OECD countries amounted tonearly 0.5 percent of their total GNI in 1965, it had fallen to 0.3 percent by 2011 with onlySweden (1.02 percent), Norway (1.00 percent), Luxembourg (0.99 percent), Denmark (0.86percent), and Netherlands (0.75 percent) meeting the United Nations official developmentassistance (ODA) target of 0.7 of GNI.
OECD data indicate that the most striking decrease in ODA as a percentage of GNI hascome from the United States. It had maintained a ratio in excess of 0.5 percent for much ofthe 1960s but it fell to 0.19 percent at the end of the energy crisis in the 1970s and to around0.1 percent when Republicans controlled Congress during the Clinton administration in the1990s. It then rose steadily during the Bush administration and has been approximately 0.2percent during the Obama administration. It should also be noted that the dollar value of aidfrom the United States continues to exceed the aid provided by the two next highest donorcountries combined—Germany and the United Kingdom. In contrast, Japan has consistentlymaintained official development assistance at a level between 0.2 percent and 0.3 percent since1960.
At these levels, aid cannot seriously be regarded as redressing core–periphery inequalities.Contrariwise, because most aid is “tied” in some way to donor countries’ exports or to specificmilitary, educational, or cultural projects, it has been argued by many that, insignificant as itis in relative terms, it is sufficient to reinforce the initial advantage of the donors.
SUMMARYIn this chapter, we described the major dimensions of the contemporary economic landscape.We identified dominant and recurring patterns associated with resources, population, industryand finance and noted the major exceptions to these patterns. Other important points includethe following:
• The world economy can be seen as an evolving market system comprising an ever changingeconomic hierarchy of countries—core, periphery, and semi-periphery.
• Defining and measuring “economic development” is problematic. Increasingly, developmentis being framed in broader terms that include consideration for social well-being.
• Sustainable development requires economic, financial, and fiscal decisions to be fullyintegrated with environmental and ecological decisions. Such decisions require a weighingand reconciliation of interests that are often contradictory and policies with outcomes thatcan be estimated tenuously at best.
• The intensity of changes in patterns of economic activity and development are associatedwith the globalization of economic activity under the influence of the strategies oftransnational corporations (TNCs).
• A striking, although perhaps not surprising, aspect of the regionalization of trade is thecontinued dependence of less developed countries for trade with developed countries.
2. GLOBAL PATTERNS AND TRENDS 59
6063 GEOGRAPHY WORLD ECON_PT_246x189 mm 22/01/2014 15:09 Page 59
KEY SOURCES AND SUGGESTED READINGBarnet, R.J. and Cavanagh, J., 1994. Global Dreams. Imperial corporations and the new world order.
New York: Simon & Schuster.Beyon, J. and Dunkerley, D. (eds.), 2000. Globalization: The reader. New York: Routledge.FAO, 2011. The State of Food Insecurity in the World. Rome: FAO.Held, D. and McGrew, A. (eds.), 2000. The Global Transformations Reader. Malden, MA: Blackwell.Hutton, W. and Giddens, A. (eds.), 2000. Global Capitalism. New York: New Press.Lechner, F.J. and Boli, J. (eds.), 2000. The Globalization Reader. Malden, MA: Blackwell.Meier, G.M. and Baldwin, R.E., 1957. Economic Development. New York: John Wiley & Sons.Mittelman, J.H., 2000. The Globalization Syndrome: Transformation and resistance. Princeton, NJ:
Princeton University Press.O’Meara, P., Mehlinger, H.D., and Krain, M. (eds.), 2000. Globalization and the Challenges of a New
Century. Bloomington: Indiana University Press.Thrift, N., 1989. The geography of international economic disorder, in R.J. Johnston and P.J. Taylor
(eds.), A World in Crisis?, 2nd edn. Oxford: Blackwell, 16–78.UNCTAD, 2011. World Investment Report: Non-equity modes of international production and
development. New York and Geneva: United Nations.Wallerstein, I., 1984. The Politics of the World-Economy. Cambridge: Cambridge University Press.
ECONOMIC PATTERNS AND THE SEARCH FOR EXPLANATION60
6063 GEOGRAPHY WORLD ECON_PT_246x189 mm 22/01/2014 15:09 Page 60
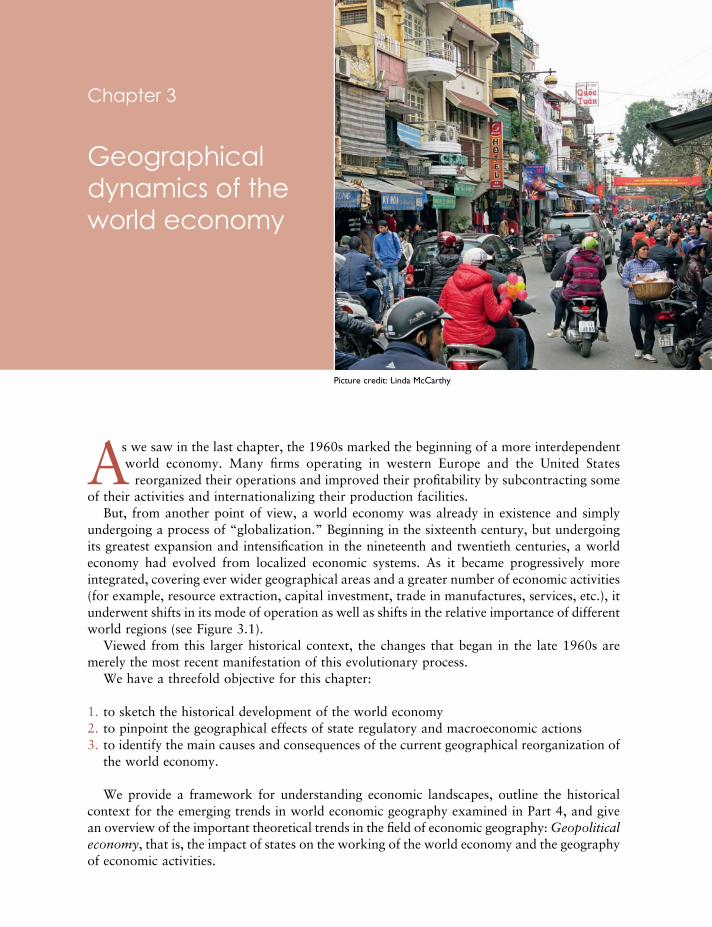
As we saw in the last chapter, the 1960s marked the beginning of a more interdependentworld economy. Many firms operating in western Europe and the United States
reorganized their operations and improved their profitability by subcontracting someof their activities and internationalizing their production facilities.
But, from another point of view, a world economy was already in existence and simplyundergoing a process of “globalization.” Beginning in the sixteenth century, but undergoingits greatest expansion and intensification in the nineteenth and twentieth centuries, a worldeconomy had evolved from localized economic systems. As it became progressively moreintegrated, covering ever wider geographical areas and a greater number of economic activities(for example, resource extraction, capital investment, trade in manufactures, services, etc.), itunderwent shifts in its mode of operation as well as shifts in the relative importance of differentworld regions (see Figure 3.1).
Viewed from this larger historical context, the changes that began in the late 1960s aremerely the most recent manifestation of this evolutionary process.
We have a threefold objective for this chapter:
1. to sketch the historical development of the world economy2. to pinpoint the geographical effects of state regulatory and macroeconomic actions3. to identify the main causes and consequences of the current geographical reorganization of
the world economy.
We provide a framework for understanding economic landscapes, outline the historicalcontext for the emerging trends in world economic geography examined in Part 4, and givean overview of the important theoretical trends in the field of economic geography: Geopoliticaleconomy, that is, the impact of states on the working of the world economy and the geographyof economic activities.
Picture credit: Linda McCarthy
Chapter 3
Geographicaldynamics of theworld economy
6063 GEOGRAPHY WORLD ECON_PT_246x189 mm 22/01/2014 15:09 Page 61
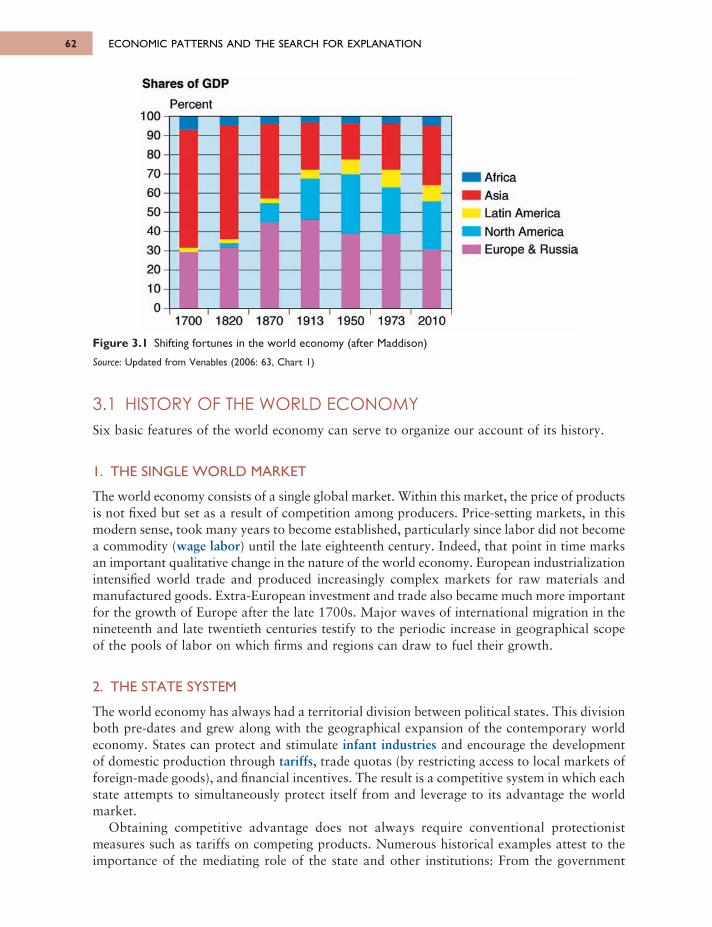
ECONOMIC PATTERNS AND THE SEARCH FOR EXPLANATION62
3.1 HISTORY OF THE WORLD ECONOMYSix basic features of the world economy can serve to organize our account of its history.
1. THE SINGLE WORLD MARKET
The world economy consists of a single global market. Within this market, the price of productsis not fixed but set as a result of competition among producers. Price-setting markets, in thismodern sense, took many years to become established, particularly since labor did not becomea commodity (wage labor) until the late eighteenth century. Indeed, that point in time marksan important qualitative change in the nature of the world economy. European industrializationintensified world trade and produced increasingly complex markets for raw materials andmanufactured goods. Extra-European investment and trade also became much more importantfor the growth of Europe after the late 1700s. Major waves of international migration in thenineteenth and late twentieth centuries testify to the periodic increase in geographical scopeof the pools of labor on which firms and regions can draw to fuel their growth.
2. THE STATE SYSTEM
The world economy has always had a territorial division between political states. This divisionboth pre-dates and grew along with the geographical expansion of the contemporary worldeconomy. States can protect and stimulate infant industries and encourage the developmentof domestic production through tariffs, trade quotas (by restricting access to local markets offoreign-made goods), and financial incentives. The result is a competitive system in which eachstate attempts to simultaneously protect itself from and leverage to its advantage the worldmarket.
Obtaining competitive advantage does not always require conventional protectionistmeasures such as tariffs on competing products. Numerous historical examples attest to theimportance of the mediating role of the state and other institutions: From the government
Figure 3.1 Shifting fortunes in the world economy (after Maddison)
Source: Updated from Venables (2006: 63, Chart 1)
6063 GEOGRAPHY WORLD ECON_PT_246x189 mm 22/01/2014 15:09 Page 62
100
90
80
70
60
50
40
ЗО
2010
О1700 1820 1870 1913 1950 1973 2010
I A frica
I A s ia
Latin America North America Europe & Russia
Shares of GDPP ercent
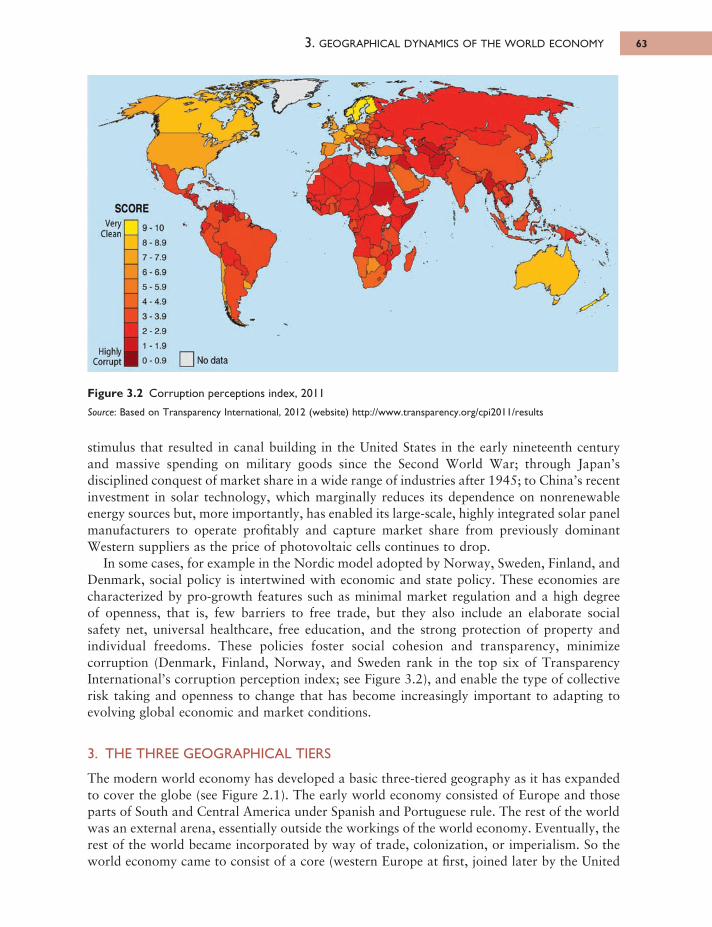
stimulus that resulted in canal building in the United States in the early nineteenth centuryand massive spending on military goods since the Second World War; through Japan’sdisciplined conquest of market share in a wide range of industries after 1945; to China’s recentinvestment in solar technology, which marginally reduces its dependence on nonrenewableenergy sources but, more importantly, has enabled its large-scale, highly integrated solar panelmanufacturers to operate profitably and capture market share from previously dominantWestern suppliers as the price of photovoltaic cells continues to drop.
In some cases, for example in the Nordic model adopted by Norway, Sweden, Finland, andDenmark, social policy is intertwined with economic and state policy. These economies arecharacterized by pro-growth features such as minimal market regulation and a high degree of openness, that is, few barriers to free trade, but they also include an elaborate social safety net, universal healthcare, free education, and the strong protection of property andindividual freedoms. These policies foster social cohesion and transparency, minimizecorruption (Denmark, Finland, Norway, and Sweden rank in the top six of TransparencyInternational’s corruption perception index; see Figure 3.2), and enable the type of collectiverisk taking and openness to change that has become increasingly important to adapting toevolving global economic and market conditions.
3. THE THREE GEOGRAPHICAL TIERS
The modern world economy has developed a basic three-tiered geography as it has expandedto cover the globe (see Figure 2.1). The early world economy consisted of Europe and thoseparts of South and Central America under Spanish and Portuguese rule. The rest of the worldwas an external arena, essentially outside the workings of the world economy. Eventually, therest of the world became incorporated by way of trade, colonization, or imperialism. So theworld economy came to consist of a core (western Europe at first, joined later by the United
3. GEOGRAPHICAL DYNAMICS OF THE WORLD ECONOMY 63
Figure 3.2 Corruption perceptions index, 2011
Source: Based on Transparency International, 2012 (website) http://www.transparency.org/cpi2011/results
6063 GEOGRAPHY WORLD ECON_PT_246x189 mm 22/01/2014 15:09 Page 63
9 - 1 0
8 - 8 .9
7 - 7 .9
6 - 6 .9
5 - 5 .9
4 - 4 .9
3 - 3 .9
2 - 2 .9
1 -1 .9
0 - 0 .9
SCOREVery
Clean
Highly Corrupt I No data
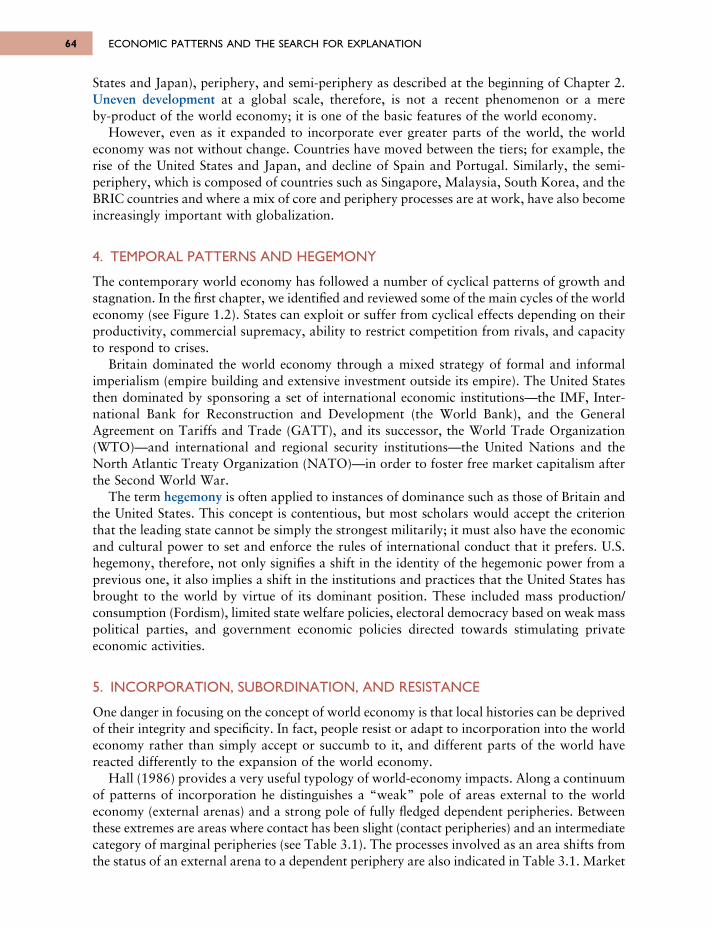
States and Japan), periphery, and semi-periphery as described at the beginning of Chapter 2.Uneven development at a global scale, therefore, is not a recent phenomenon or a mere by-product of the world economy; it is one of the basic features of the world economy.
However, even as it expanded to incorporate ever greater parts of the world, the worldeconomy was not without change. Countries have moved between the tiers; for example, therise of the United States and Japan, and decline of Spain and Portugal. Similarly, the semi-periphery, which is composed of countries such as Singapore, Malaysia, South Korea, and theBRIC countries and where a mix of core and periphery processes are at work, have also becomeincreasingly important with globalization.
4. TEMPORAL PATTERNS AND HEGEMONY
The contemporary world economy has followed a number of cyclical patterns of growth andstagnation. In the first chapter, we identified and reviewed some of the main cycles of the worldeconomy (see Figure 1.2). States can exploit or suffer from cyclical effects depending on theirproductivity, commercial supremacy, ability to restrict competition from rivals, and capacityto respond to crises.
Britain dominated the world economy through a mixed strategy of formal and informalimperialism (empire building and extensive investment outside its empire). The United Statesthen dominated by sponsoring a set of international economic institutions—the IMF, Inter-national Bank for Reconstruction and Development (the World Bank), and the GeneralAgreement on Tariffs and Trade (GATT), and its successor, the World Trade Organization(WTO)—and international and regional security institutions—the United Nations and the North Atlantic Treaty Organization (NATO)—in order to foster free market capitalism afterthe Second World War.
The term hegemony is often applied to instances of dominance such as those of Britain andthe United States. This concept is contentious, but most scholars would accept the criterionthat the leading state cannot be simply the strongest militarily; it must also have the economicand cultural power to set and enforce the rules of international conduct that it prefers. U.S.hegemony, therefore, not only signifies a shift in the identity of the hegemonic power from aprevious one, it also implies a shift in the institutions and practices that the United States hasbrought to the world by virtue of its dominant position. These included mass production/consumption (Fordism), limited state welfare policies, electoral democracy based on weak masspolitical parties, and government economic policies directed towards stimulating privateeconomic activities.
5. INCORPORATION, SUBORDINATION, AND RESISTANCE
One danger in focusing on the concept of world economy is that local histories can be deprivedof their integrity and specificity. In fact, people resist or adapt to incorporation into the worldeconomy rather than simply accept or succumb to it, and different parts of the world havereacted differently to the expansion of the world economy.
Hall (1986) provides a very useful typology of world-economy impacts. Along a continuumof patterns of incorporation he distinguishes a “weak” pole of areas external to the worldeconomy (external arenas) and a strong pole of fully fledged dependent peripheries. Betweenthese extremes are areas where contact has been slight (contact peripheries) and an intermediatecategory of marginal peripheries (see Table 3.1). The processes involved as an area shifts fromthe status of an external arena to a dependent periphery are also indicated in Table 3.1. Market
ECONOMIC PATTERNS AND THE SEARCH FOR EXPLANATION64
6063 GEOGRAPHY WORLD ECON_PT_246x189 mm 22/01/2014 15:09 Page 64
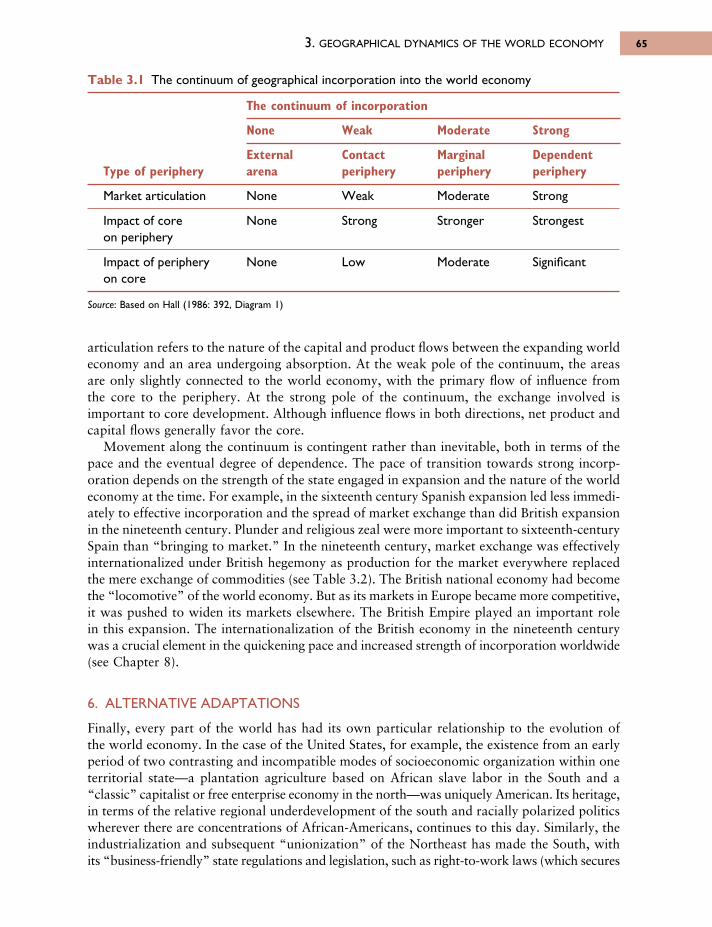
articulation refers to the nature of the capital and product flows between the expanding worldeconomy and an area undergoing absorption. At the weak pole of the continuum, the areasare only slightly connected to the world economy, with the primary flow of influence fromthe core to the periphery. At the strong pole of the continuum, the exchange involved isimportant to core development. Although influence flows in both directions, net product andcapital flows generally favor the core.
Movement along the continuum is contingent rather than inevitable, both in terms of thepace and the eventual degree of dependence. The pace of transition towards strong incorp -oration depends on the strength of the state engaged in expansion and the nature of the worldeconomy at the time. For example, in the sixteenth century Spanish expansion led less immedi -ately to effective incorporation and the spread of market exchange than did British expansionin the nineteenth century. Plunder and religious zeal were more important to sixteenth-centurySpain than “bringing to market.” In the nineteenth century, market exchange was effectivelyinternationalized under British hegemony as production for the market everywhere replacedthe mere exchange of commodities (see Table 3.2). The British national economy had becomethe “locomotive” of the world economy. But as its markets in Europe became more competitive,it was pushed to widen its markets elsewhere. The British Empire played an important rolein this expansion. The internationalization of the British economy in the nineteenth centurywas a crucial element in the quickening pace and increased strength of incorporation worldwide(see Chapter 8).
6. ALTERNATIVE ADAPTATIONS
Finally, every part of the world has had its own particular relationship to the evolution of the world economy. In the case of the United States, for example, the existence from an earlyperiod of two contrasting and incompatible modes of socioeconomic organization within oneterritorial state—a plantation agriculture based on African slave labor in the South and a“classic” capitalist or free enterprise economy in the north—was uniquely American. Its heritage,in terms of the relative regional underdevelopment of the south and racially polarized politicswherever there are concentrations of African-Americans, continues to this day. Similarly, theindustrialization and subsequent “unionization” of the Northeast has made the South, withits “business-friendly” state regulations and legislation, such as right-to-work laws (which secures
3. GEOGRAPHICAL DYNAMICS OF THE WORLD ECONOMY 65
Table 3.1 The continuum of geographical incorporation into the world economy
The continuum of incorporation
None Weak Moderate Strong
External Contact Marginal DependentType of periphery arena periphery periphery periphery
Market articulation None Weak Moderate Strong
Impact of core None Strong Stronger Strongeston periphery
Impact of periphery None Low Moderate Significanton core
Source: Based on Hall (1986: 392, Diagram 1)
6063 GEOGRAPHY WORLD ECON_PT_246x189 mm 22/01/2014 15:09 Page 65
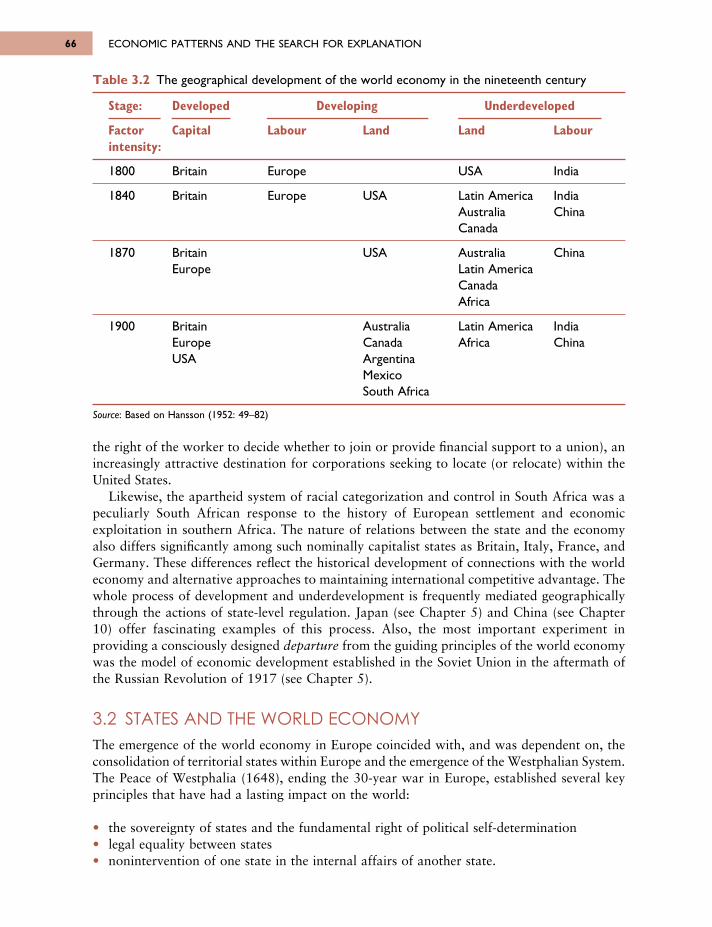
the right of the worker to decide whether to join or provide financial support to a union), anincreasingly attractive destination for corporations seeking to locate (or relocate) within theUnited States.
Likewise, the apartheid system of racial categorization and control in South Africa was apeculiarly South African response to the history of European settlement and economicexploitation in southern Africa. The nature of relations between the state and the economyalso differs significantly among such nominally capitalist states as Britain, Italy, France, andGermany. These differences reflect the historical development of connections with the worldeconomy and alternative approaches to maintaining international competitive advantage. Thewhole process of development and underdevelopment is frequently mediated geographicallythrough the actions of state-level regulation. Japan (see Chapter 5) and China (see Chapter10) offer fascinating examples of this process. Also, the most important experiment inproviding a consciously designed departure from the guiding principles of the world economywas the model of economic development established in the Soviet Union in the aftermath ofthe Russian Revolution of 1917 (see Chapter 5).
3.2 STATES AND THE WORLD ECONOMYThe emergence of the world economy in Europe coincided with, and was dependent on, theconsolidation of territorial states within Europe and the emergence of the Westphalian System.The Peace of Westphalia (1648), ending the 30-year war in Europe, established several keyprinciples that have had a lasting impact on the world:
• the sovereignty of states and the fundamental right of political self-determination• legal equality between states• nonintervention of one state in the internal affairs of another state.
ECONOMIC PATTERNS AND THE SEARCH FOR EXPLANATION66
Table 3.2 The geographical development of the world economy in the nineteenth century
Stage: Developed Developing Underdeveloped
Factor Capital Labour Land Land Labourintensity:
1800 Britain Europe USA India
1840 Britain Europe USA Latin America IndiaAustralia ChinaCanada
1870 Britain USA Australia ChinaEurope Latin America
CanadaAfrica
1900 Britain Australia Latin America IndiaEurope Canada Africa ChinaUSA Argentina
MexicoSouth Africa
Source: Based on Hansson (1952: 49–82)
6063 GEOGRAPHY WORLD ECON_PT_246x189 mm 22/01/2014 15:09 Page 66
These principles are still relevant today, which explains why the system of states is oftenreferred to as the Westphalian System. From approximately 500 political entities in Europein 1500, no more than 25 territorial states existed in 1900. Modern territorial states serve asthe political framework of the contemporary world economy. So the expansion of the worldeconomy has been accompanied by a parallel expansion of the interstate system as the solelegitimate form of political, military, and administrative organization.
But the state is not a standardized entity. It includes different institutions (varying repre -sentative assemblies, bureaucracies, police forces, militaries, etc.), each a product of particularhistories that adapted to shifts in national development and position within the world economy.The relative power of each state can be thought of in terms of three dimensions:
1. relative to one another2. relative to its inhabitants3. relative to the evolving world economy (Harris, 1986: 145–169).
The first—the hierarchy of states—has shown considerable variation historically, forexample, in the rise and decline of Britain and the Soviet Union; the rise of the United States;and the growing power of China, India, and the Asian Tigers—Hong Kong, Singapore, SouthKorea, and Taiwan. The second—the power of states relative to their inhabitants—seems togrow incessantly, particularly in the more developed countries, with respect to regulation,taxation, and surveillance. However, the third—the power of states relative to others in theworld economy, such as TNCs—appears to be declining in general, and to decline more ascountries develop economically.
STATES AND THE EVOLVING WORLD ECONOMY
The latest phase in the evolution of the world economy, labeled earlier (see Figure 1.2) by theterm globalized capitalism, has involved the erosion of national economies as the basicbuilding blocks of the world economy. A transnational element has been ascendant in the formof the growth of a global market that is supplied by firms that organize their production anddistribution without much reference to national boundaries. This “global shift” in productionhas given rise to an explosion of foreign direct investment (FDI) and to the emergence of tradewithin large firms as the most rapidly expanding component of total world trade. Perhaps asmuch as 40 percent of U.S. imports, for example, are intra-firm transactions involving partsand goods purchased by U.S. subsidiaries of multinational firms or from foreign subsidiariesof U.S. corporations (Hellerstein et al., 2006).
Transnational corporations, therefore, are major engines in the growth of world trade.Chapters 7, 8, 10, and 11 document the impact of this global shift on the geography of theworld economy. However, an important point that must be underscored is that, rather thanmarking the eclipse of national boundaries, the globalization of production has occurred inlarge part because of them. The strategies of transnational corporations are designed to exploitnational differences in labor forces, market conditions, regulatory environments, and macro -economic (fiscal and monetary) conditions. Without this variation, the attraction of shiftinginvestments and relocating production would be reduced. The challenge to states is to competein this more integrated and interdependent economic environment as effectively as possible.
One must also be cautious not to exaggerate the extent that the globalization of productionhas increased the power of global firms. Many “global” companies are still strongly attachedto their home countries. For example, non-national board membership on transnational
3. GEOGRAPHICAL DYNAMICS OF THE WORLD ECONOMY 67
6063 GEOGRAPHY WORLD ECON_PT_246x189 mm 22/01/2014 15:09 Page 67
corporations, although steadily increasing, remains low. European and North Americancompanies lead the trend towards global boards. In Japanese companies, in contrast, “foreigndirectors are as rare as British sumo wrestlers” (Economist, 1993a: 69). This bias manifestsitself in the activities of even the most “global” firms. When total sales decline, home marketstend to be protected at the expense of foreign ones. When firms expand abroad they continueto rely heavily on suppliers from their home countries. Antitrust laws and nationalism stillmake it difficult for foreign firms to expand through takeovers. Many states and trading blocs(such as the European Union) have industrial and trading policies that serve to protect andenhance their national economies by encouraging domestic and discouraging foreign investment(for example, Airbus Industrie, the producer of the European Airbus is a consortium of aero-space firms from different European countries that collaborates to compete with U.S. producerssuch as Boeing).
Britain provides an interesting contrast to these protectionist policies. Between 2000 and2010 foreigners spent nearly $1 trillion to acquire 5,400 British companies including Jaguarand Land Rover by Tata (India) and the purchase of the venerable chocolatier, Cadbury, bythe U.S. company, Kraft Foods. But it should be noted that the British also spent U.S. $750billion to acquire 6,000 foreign firms during this same period.
The sale of Cadbury, in particular, is also instructive from another perspective: 80 percentof its business and 8 percent of its employees resided outside the United Kingdom when it waspurchased (Economist, 2010a), raising questions about whether the emphasis is moreappropriately placed on the “multi” or “national” part of its operations and the extent thatBritish government policies can and, perhaps more importantly, should seek to align andsimultaneously advance the interests of UK-based multinational corporations and the broaderinterests of its citizenry.
INTERNATIONAL FINANCIAL SYSTEM
Perhaps the most significant factor contributing to the reduction of state power relative to theworld economy has been the ever increasing importance of the international financial system.All forms of capital have become more mobile. Corporate and financial market decisions aremade more frequently and within much tighter time schedules than was only recently the case.Decisions about employing and shedding labor are made weekly and monthly compared toquarterly (see Figure 3.3). Commodity, currency, and equity markets in world cities operatearound the clock. Banking has become a global industry with the reduction of national andlocal barriers to operations and capital movements.
Flows of capital have become increasingly important drivers of the world economy. Thevolume of flows has increased exponentially since the 1970s. Although developed countriesremain important recipients of FDI inflows, developing and transitioning countries accountedfor 52 percent of inflows in 2010 (Figure 3.4). When FDI is broken down by economic activity,services had been the most important sector leading up to the financial crisis. But in the post-crisis period, manufacturing accounted for 48 percent of FDI, while services, led by the financialindustry, experienced a sharp decline and only accounted for 30 percent of FDI. During thecrisis, FDI in the primary sector also declined sharply, but it had recovered to pre-crisis levelsby 2009–2010 (UNCTAD, 2011).
Government policies towards FDI have been liberalized worldwide. The privatization ofstate-owned industries has driven much of this change; however, pressure from multilateralinstitutions such as the IMF and the World Bank, which insist on increased openness to FDI
ECONOMIC PATTERNS AND THE SEARCH FOR EXPLANATION68
6063 GEOGRAPHY WORLD ECON_PT_246x189 mm 22/01/2014 15:09 Page 68
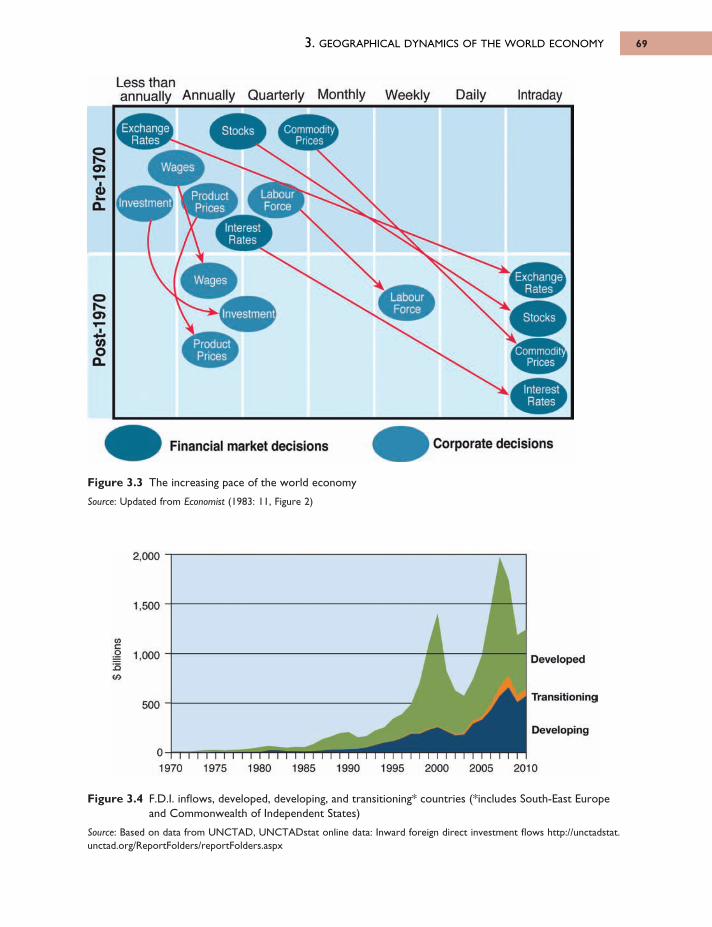
3. GEOGRAPHICAL DYNAMICS OF THE WORLD ECONOMY 69
Figure 3.3 The increasing pace of the world economy
Source: Updated from Economist (1983: 11, Figure 2)
Figure 3.4 F.D.I. inflows, developed, developing, and transitioning* countries (*includes South-East Europeand Commonwealth of Independent States)
Source: Based on data from UNCTAD, UNCTADstat online data: Inward foreign direct investment flows http://unctadstat.unctad.org/ReportFolders/reportFolders.aspx
6063 GEOGRAPHY WORLD ECON_PT_246x189 mm 22/01/2014 15:09 Page 69
Commodity’ k P r ic e s ^
StocksExchange! L Rates J
Е м Ш ғ
Щ З Е ш г
щ щ ?
Product Prices _
117 ·. і . *
LabourForce
Product , P r ic e y
Interest ^ Rates
Wages
Investment
Wagesoh -cr>
ω
CL
a
<xI
+ -acа
Financial market decisions Corporate decisions
2,000
1,500
1,000
500
П
COГo
360
1970 1975 1980 1985 1990 1995 2000 2005 2010
' Developed
Transitioning
Developing
Less thar annually Annually Quarterly Monthly Weekly Daily Intraday
ohO)
<u
Q .
Or*.o>
COo
CL
</)cojO</)
in return for favorable loan conditions, has also been instrumental. In some LDCs, the IMFand the World Bank have cooperated to intervene in domestic politics through structuraladjustment programs. These policies are stipulations that must be met to receive new loansor to obtain lower interest rates on existing loans. Their intent is to ensure that the moneylent will be spent in accordance with the overall goals of the loan, reducing the borrowingcountry’s macroeconomic imbalances, promoting economic growth, and generating incomein order to pay off accumulated debt. Structural adjustment programs are based on fiscal andmonetary restraint and a combination of deregulation and the liberalization of nationalmarkets.
Even the most economically powerful countries are now less autonomous and morevulnerable to both foreign ownership of economic assets and shocks emanating from worldfinancial markets. One commentator has proclaimed that global financial integration signifiesthe “end of geography” (O’Brien, 1992). The relative impotence of states to deftly “right theship” following the financial crisis suggests that O’Brien may be more correct than not at leastin certain respect. However, important institutional and cultural barriers remain to the freemovement of capital. For example, knowledge about financial opportunities is still tied toknowledge of the local investment “scene” to some extent, and this knowledge often dependson having access to local social networks and relationships developed through interaction andcommon social bonds.
Financial markets are undoubtedly more open than they were when the Bretton Woodssystem of pegged exchange rates prevailed (see Chapter 2). Under that system, free trade andregulated finance ultimately proved incompatible; once free trade became more significant inthe 1960s, the latter proved impossible to sustain. Confidence in a government’s ability tomaintain a fixed exchange rate (such as that of Britain in 1967) began to wane as capital controlsproved incapable of neutralizing international capital movements. Flexible exchange rates after1971 have proved relatively advantageous for large, relatively closed economies such as thoseof the United States and Japan. Some economists argue, however, that the costs of floatingcurrencies have become increasingly high for smaller, open economies. According to this view,excessively volatile exchange rates disrupt domestic policymaking and reduce the ability offirms to make calculations about long-term rates of return on investment.
INDEPENDENCE AND INTERDEPENDENCE
Increased financial integration does not mean, however, that the world economy now runsrampant over national economies. Individual governments (and state institutions such as centralbanks) can still influence international financial markets through industrial policies, budgetdeficits, and the manipulation of interest rates. But no single government can now control thesystem or completely control its own national economy. Even collaboration betweengovernments, such as the G8 meetings (of leaders from the United States, Japan, Germany,United Kingdom, Canada, France, Italy, and Russia), cannot always produce predictable effectson currencies, investments, and trade flows. Nevertheless, collaboration, both formal andinformal, and largely under U.S. sponsorship, has become an important feature of the worldeconomy. The high degree of interdependence among states was most strikingly evident in thecoordinated response to the global financial and Eurozone crises where bailouts and a rangeof stimulus programs were simultaneously and aggressively pursued in a number of countriesin an effort to stave off a global recession.
ECONOMIC PATTERNS AND THE SEARCH FOR EXPLANATION70
6063 GEOGRAPHY WORLD ECON_PT_246x189 mm 22/01/2014 15:09 Page 70
3. GEOGRAPHICAL DYNAMICS OF THE WORLD ECONOMY 71
MANAGEMENT AND MEDIATION
The crux of the contemporary world economy, then, is the coexistence of national and globalstructures, and attempts by states to manage the tensions between them. Transnationalactivities operate within states and under conditions imposed by them. Trade and tariff policiesare still of vital importance in regulating trade and investment. For example, even as industrialcountries’ tariff levels have dropped steadily as a result of the GATT/WTO negotiations of the post-Second World War period, nontariff barriers (quotas, voluntary trade restraints,technical barriers, etc.) have often increased, usually as a result of pressure on governmentsfrom domestic political coalitions. In a number of countries, especially the United States, thereis a growing controversy among economists and politicians over the geographical distributionof the costs and benefits of open as opposed to more “managed” trade. Some commentatorsargue that certain countries, particularly China and Japan, do not trade “fairly;” rather, theyimpose too many restrictions on imports while they benefit from the relative openness of othercountries.
Financial systems are also important to the geography of the world economy because theymediate between political systems, on the one hand, and the global system of production, onthe other. Largely as a result of regulatory policy, national financial systems still differprofoundly in their connection with local industry and in their openness to foreign penetration.The German and Japanese financial systems, for example, are intimately connected with their co-national industrial companies, whereas the U.S. and the British systems are not onlyindependent of but often appear to be at cross-purposes with the needs of the domesticmanufacturing industry. This difference has important consequences, particularly in terms ofthe geography of investment. In Germany and Japan, the fortunes of finance and industry areclosely tied. Each has a stake in the other. In Britain, industry has had to compete with a widerange of alternative and often more attractive outlets for bank investment, inside and outsidethe country. At the same time, financial markets in Britain have been more readily accessibleto investment from outside, creating in London a truly global financial center.
In general, national financial systems differ along three dimensions (Zysman, 1983: 69).The first is the process whereby savings are transformed into investments and allocated amongcompeting uses: “Intermediation.” The second dimension is the degree to which prices are setin financial markets by dominant financial institutions or by government: “Marketization,”or price controls. The third is the amount of government intervention in the financial system:Regulation.
Combinations of the three dimensions differ significantly across countries and so providedistinctive financial environments for internal economic development. The United States andBritain are capital market financial systems in which the intermediation of financial institutionsis relatively weak; prices are set in markets; and there is limited state intervention in financialmarkets. There is little, if any, bias towards local industrial firms or long-run nationaleconomic development.
Germany typifies a second model of a financial institution-dominated credit-based financialsystem in which bank intermediation dominates; prices are set in markets, but the state andfinancial institutions are closely related. Large banks provide the bulk of the credit to domesticindustrial firms and are usually represented on the governing boards of these firms.
Finally, there are government-dominated credit-based financial systems, exemplified byFrance and Japan. In this case, state entanglement with industry (nationalized industry in France,private industry in Japan) has fundamental limiting effects on the autonomy of markets andfinancial institutions. Particularly in Japan the financial system has been structured traditionally
6063 GEOGRAPHY WORLD ECON_PT_246x189 mm 22/01/2014 15:09 Page 71
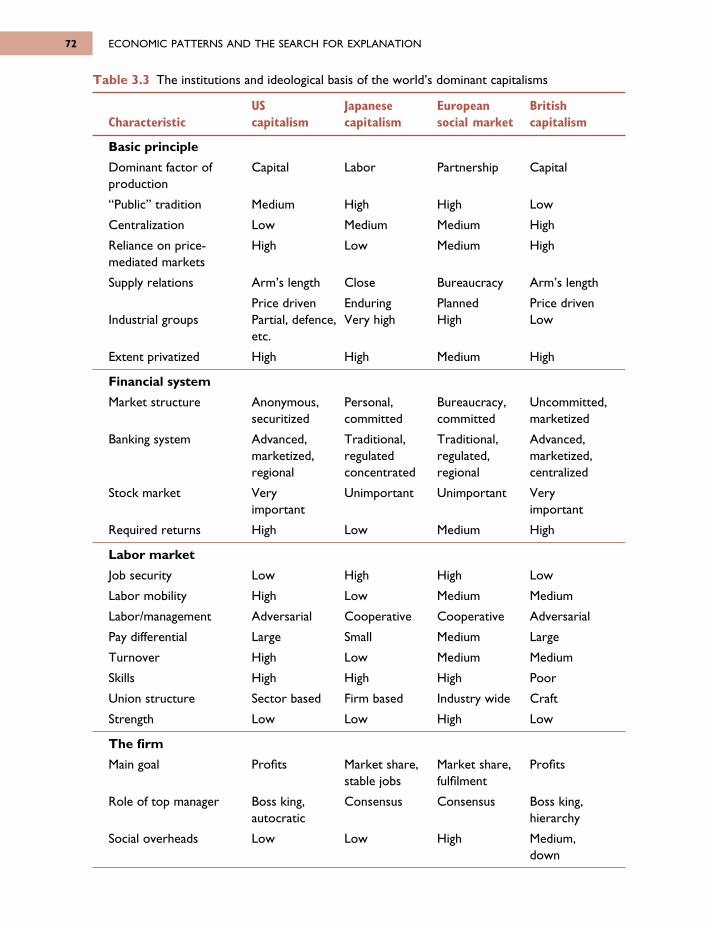
ECONOMIC PATTERNS AND THE SEARCH FOR EXPLANATION72
Table 3.3 The institutions and ideological basis of the world’s dominant capitalisms
US Japanese European BritishCharacteristic capitalism capitalism social market capitalism
Basic principle
Dominant factor of Capital Labor Partnership Capitalproduction
“Public” tradition Medium High High Low
Centralization Low Medium Medium High
Reliance on price- High Low Medium Highmediated markets
Supply relations Arm’s length Close Bureaucracy Arm’s length
Price driven Enduring Planned Price drivenIndustrial groups Partial, defence, Very high High Low
etc.
Extent privatized High High Medium High
Financial system
Market structure Anonymous, Personal, Bureaucracy, Uncommitted,securitized committed committed marketized
Banking system Advanced, Traditional, Traditional, Advanced,marketized, regulated regulated, marketized,regional concentrated regional centralized
Stock market Very Unimportant Unimportant Veryimportant important
Required returns High Low Medium High
Labor market
Job security Low High High Low
Labor mobility High Low Medium Medium
Labor/management Adversarial Cooperative Cooperative Adversarial
Pay differential Large Small Medium Large
Turnover High Low Medium Medium
Skills High High High Poor
Union structure Sector based Firm based Industry wide Craft
Strength Low Low High Low
The firm
Main goal Profits Market share, Market share, Profitsstable jobs fulfilment
Role of top manager Boss king, Consensus Consensus Boss king,autocratic hierarchy
Social overheads Low Low High Medium, down
6063 GEOGRAPHY WORLD ECON_PT_246x189 mm 22/01/2014 15:09 Page 72
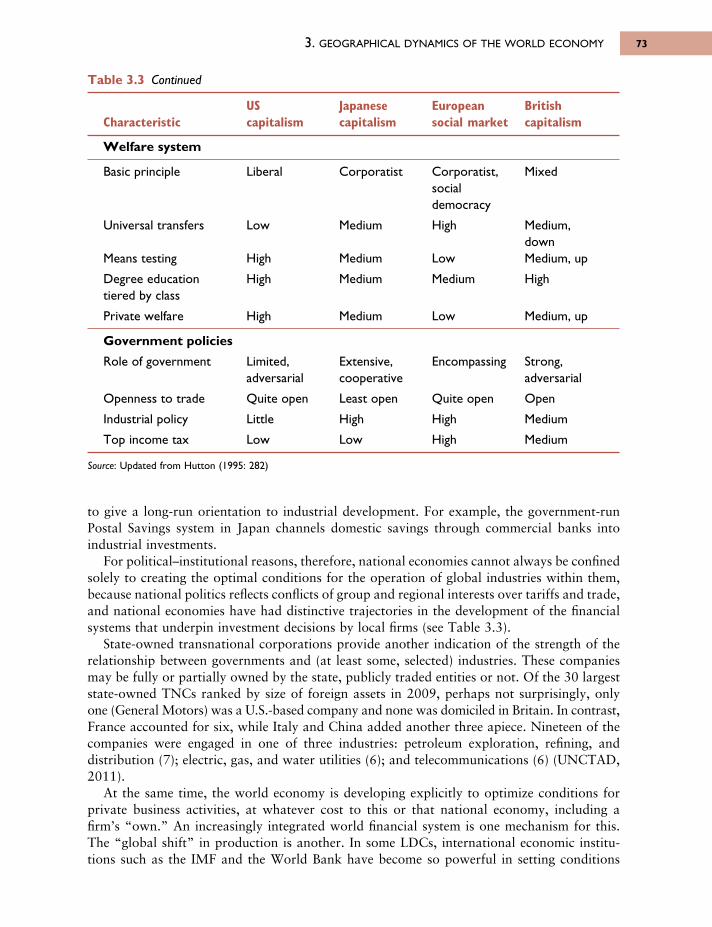
to give a long-run orientation to industrial development. For example, the government-runPostal Savings system in Japan channels domestic savings through commercial banks intoindustrial investments.
For political–institutional reasons, therefore, national economies cannot always be confinedsolely to creating the optimal conditions for the operation of global industries within them,because national politics reflects conflicts of group and regional interests over tariffs and trade,and national economies have had distinctive trajectories in the development of the financialsystems that underpin investment decisions by local firms (see Table 3.3).
State-owned transnational corporations provide another indication of the strength of therelationship between governments and (at least some, selected) industries. These companiesmay be fully or partially owned by the state, publicly traded entities or not. Of the 30 largeststate-owned TNCs ranked by size of foreign assets in 2009, perhaps not surprisingly, onlyone (General Motors) was a U.S.-based company and none was domiciled in Britain. In contrast,France accounted for six, while Italy and China added another three apiece. Nineteen of thecompanies were engaged in one of three industries: petroleum exploration, refining, anddistribution (7); electric, gas, and water utilities (6); and telecommunications (6) (UNCTAD,2011).
At the same time, the world economy is developing explicitly to optimize conditions forprivate business activities, at whatever cost to this or that national economy, including a firm’s “own.” An increasingly integrated world financial system is one mechanism for this.The “global shift” in production is another. In some LDCs, international economic institu-tions such as the IMF and the World Bank have become so powerful in setting conditions
3. GEOGRAPHICAL DYNAMICS OF THE WORLD ECONOMY 73
Table 3.3 Continued
US Japanese European BritishCharacteristic capitalism capitalism social market capitalism
Welfare system
Basic principle Liberal Corporatist Corporatist, Mixedsocial democracy
Universal transfers Low Medium High Medium, down
Means testing High Medium Low Medium, up
Degree education High Medium Medium Hightiered by class
Private welfare High Medium Low Medium, up
Government policies
Role of government Limited, Extensive, Encompassing Strong,adversarial cooperative adversarial
Openness to trade Quite open Least open Quite open Open
Industrial policy Little High High Medium
Top income tax Low Low High Medium
Source: Updated from Hutton (1995: 282)
6063 GEOGRAPHY WORLD ECON_PT_246x189 mm 22/01/2014 15:09 Page 73
under which loans will be granted that they have become the de facto governments of thosecountries. In a large number of African states the “internationalization of the state” has gone so far that some commentators have referred to them as quasi-states, unable to directtheir own economies without massive external assistance and not offering much in the wayof citizenship or economic benefits to their populations. Given the diminished capacity of statesto actively direct their economies, what is the significance of states in the contemporary contextof globalization?
STATES AND THE GEOGRAPHY OF THE WORLD ECONOMY
The importance of states in the world economy is evident in a number of ways: First, asorganizers and mobilizers in the NIEs; second, in the continuing geopolitical rivalry of theDCs; third, in the macroeconomic policies pursued by national governments and central banksto stabilize and reorganize their economies; fourth, in the continued importance of nationalgovernments as agents of social and political order within their territories; and, fifth, in thelatitude and initiative of lower level governments in attracting and keeping economic activitieswithin their jurisdictions.
1. The NIEsA remarkable, although perhaps not surprising fact, is that if one examines the larger NIEsin detail (excluding Singapore and the Hong Kong SAR because of their peculiarity as ethnicChinese city-states), the fastest growing and otherwise best performing countries have hadnational governments that directly and actively intervened in their economies. In South Korea,for example, successive governments played major roles in fostering economic growth. Addinggovernment savings to deposits in nationalized banks, the South Korean government controlledtwo-thirds of South Korea’s investment resources during the country’s period of most rapidgrowth in the late 1970s. It guided investment in chosen directions through differentialinterest rates and preferential credit terms. Korean export expansion, the main method ofeconomic growth, was built on an economic base that was stringently protected from foreignimports. In these ways, successive activist governments orchestrated economic growth. “Inexchange for subsidies, the state . . . imposed performance standards on private firms”(Amsden, 1989: 8). In other countries, subsidies have not always been tied so closely toperformance and the result has been lower growth.
The recent experience of South Korea and some other NIEs such as Taiwan, therefore, shouldnot be interpreted as an entirely “market” phenomenon. Economists on the political right andleft err when they ignore or systematically devalue the importance of state action in organizingand mobilizing resources for economic growth. Of course, not all states have either theinstitutional foundations or the resources to “mobilize” for economic growth. South Koreaand Taiwan had decisive advantages because of their ethnic homogeneity, their transport infra -structure inherited from Japanese colonialism, a history of land reform, and U.S. investmentduring the Cold War to help “contain” China and the Soviet Union. In many other cases,ethnic divisions and organized corruption have turned states into barriers rather than facili -tators of economic development. Their action or inaction continues to afflict their populations.One thinks of such examples as the Democratic Republic of the Congo, Zimbabwe, and Somaliain Africa (just three examples from a much longer list), Argentina and Venezuela in LatinAmerica, and Sri Lanka and the Philippines in Asia (see Chapters 8 and 10).
ECONOMIC PATTERNS AND THE SEARCH FOR EXPLANATION74
6063 GEOGRAPHY WORLD ECON_PT_246x189 mm 22/01/2014 15:09 Page 74
3. GEOGRAPHICAL DYNAMICS OF THE WORLD ECONOMY 75
2. States and geopolitical rivalry
States at the core of the world economy show few signs of disappearing (see Chapters 6 and7). Indeed, under the conditions of economic restructuring that have affected most DCs overthe past few decades, rivalries have deepened between many countries over trade, monetary,and foreign policy. Successive U.S. governments have used the devaluation and revaluation ofthe dollar to insulate its economy from the negative impacts of increased foreign competitionand import penetration. These actions—similar to the actions taken by China to keep the valueof the yuan artificially low to stimulate exports—have been at the expense of other currenciesand other countries.
These examples illustrate how some states can use fiscal and monetary policies to stabilizeand reorganize their economies at the expense of other national economies. Within their ownboundaries, they can also encourage or slow down the processes of restructuring that emanatefrom changes in the world economy. In the United States in the 1950s and 1960s, defensespending, and housing and transportation policies that stimulated suburban growth helpedthe development of Fordist firms oriented to national markets (for example, automobileproduction). In Japan during the same period, the government Ministry of International Tradeand Industry (MITI) (reorganized as the Ministry of Economy, Trade and Industry (METI)in 2001) used an industrial lifecycle model to guide investment in new industries as “old”ones achieved “maturity.”
Other countries had less direct industrial policies and often operated through government-owned industries (such as electricity or steel) to stimulate new industries and stabilizeproduction. In the United States in the 1980s, defense spending and new financial services(stimulated through the deregulation of banks and other financial institutions) became the focusof government attention. The large deficits in the federal government budget that began toaccrue in the early part of the decade further stimulated the financial services industry throughthe need to attract and reward foreign investment. Regions and localities specializing in militaryproduction and finance were primary beneficiaries. Increases in military spending were justifiedin terms of the security threat posed by the Soviet Union. Not surprisingly, the end of theCold War to some degree marked a turnaround in priorities with military spending decliningfrom 5.8 percent of GDP in 1988 to only 3 percent of GDP a decade later (although the risein GDP accounts for a significant portion of this disparity). In the post-9/11 period, fuelledby the wars in Afghanistan and Iraq, military spending by the United States once again increasedsignificantly (see Figure 3.5). In 2011 it accounted for 4.8 percent of GDP and matched theestimated combined investment of the next 14 countries ranked by the size of their militaryspending (SIPRI, 2013).
3. Macroeconomic policymaking
With the rise of international financial integration and highly speculative financial marketshas come a concomitant rise in the political power of central banks. Central banks have theability to affect conditions in domestic and global markets by manipulating interest rates andthe money supply. These banks also function differently in various countries and are subjectto distinctive pressures emanating from the conjuncture of external influences and distinctivenational institutional policy environments.
For example, where a central bank is politically independent and connections betweenindustry and finance are weak, as in the United States, the central bank will be a “rentier”bank and tend to pursue monetary policies that benefit banks and other financial interests.However, where a central bank is independent but industry and finance are closely linked, as
6063 GEOGRAPHY WORLD ECON_PT_246x189 mm 22/01/2014 15:09 Page 75
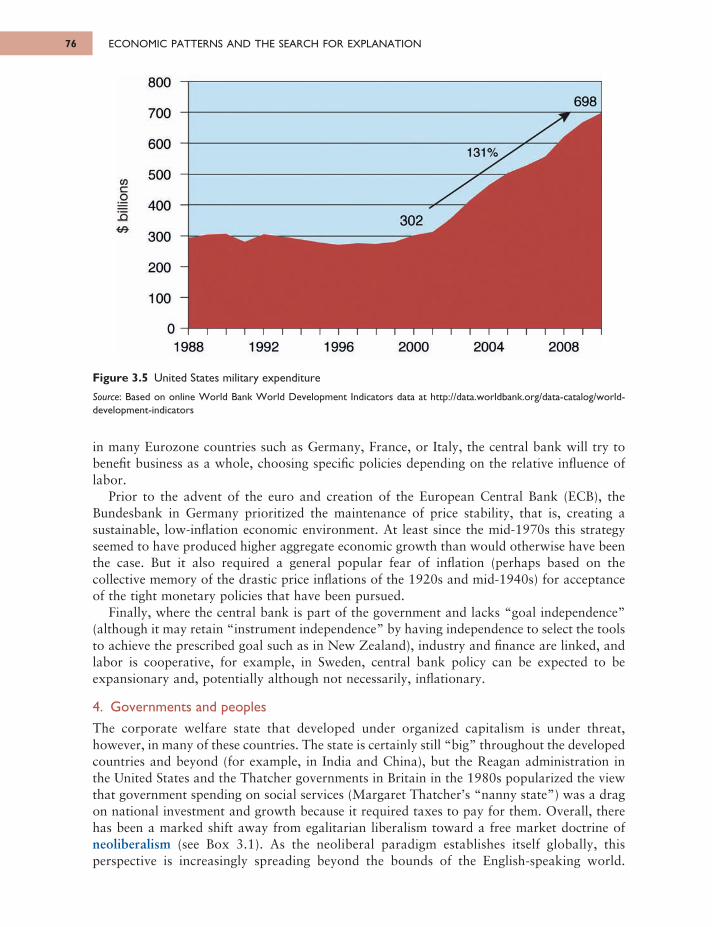
in many Eurozone countries such as Germany, France, or Italy, the central bank will try tobenefit business as a whole, choosing specific policies depending on the relative influence oflabor.
Prior to the advent of the euro and creation of the European Central Bank (ECB), theBundesbank in Germany prioritized the maintenance of price stability, that is, creating asustainable, low-inflation economic environment. At least since the mid-1970s this strategyseemed to have produced higher aggregate economic growth than would otherwise have beenthe case. But it also required a general popular fear of inflation (perhaps based on thecollective memory of the drastic price inflations of the 1920s and mid-1940s) for acceptanceof the tight monetary policies that have been pursued.
Finally, where the central bank is part of the government and lacks “goal independence”(although it may retain “instrument independence” by having independence to select the toolsto achieve the prescribed goal such as in New Zealand), industry and finance are linked, andlabor is cooperative, for example, in Sweden, central bank policy can be expected to beexpansionary and, potentially although not necessarily, inflationary.
4. Governments and peoplesThe corporate welfare state that developed under organized capitalism is under threat,however, in many of these countries. The state is certainly still “big” throughout the developedcountries and beyond (for example, in India and China), but the Reagan administration inthe United States and the Thatcher governments in Britain in the 1980s popularized the viewthat government spending on social services (Margaret Thatcher’s “nanny state”) was a dragon national investment and growth because it required taxes to pay for them. Overall, therehas been a marked shift away from egalitarian liberalism toward a free market doctrine ofneoliberalism (see Box 3.1). As the neoliberal paradigm establishes itself globally, thisperspective is increasingly spreading beyond the bounds of the English-speaking world.
ECONOMIC PATTERNS AND THE SEARCH FOR EXPLANATION76
Figure 3.5 United States military expenditure
Source: Based on online World Bank World Development Indicators data at http://data.worldbank.org/data-catalog/world-development-indicators
6063 GEOGRAPHY WORLD ECON_PT_246x189 mm 22/01/2014 15:09 Page 76
800
700
600
500
400
300
200
100
(/>cο
0
1988 1992 1996 2000 2004 2008
302
1 3 1 % .
698
(/>c:o
5
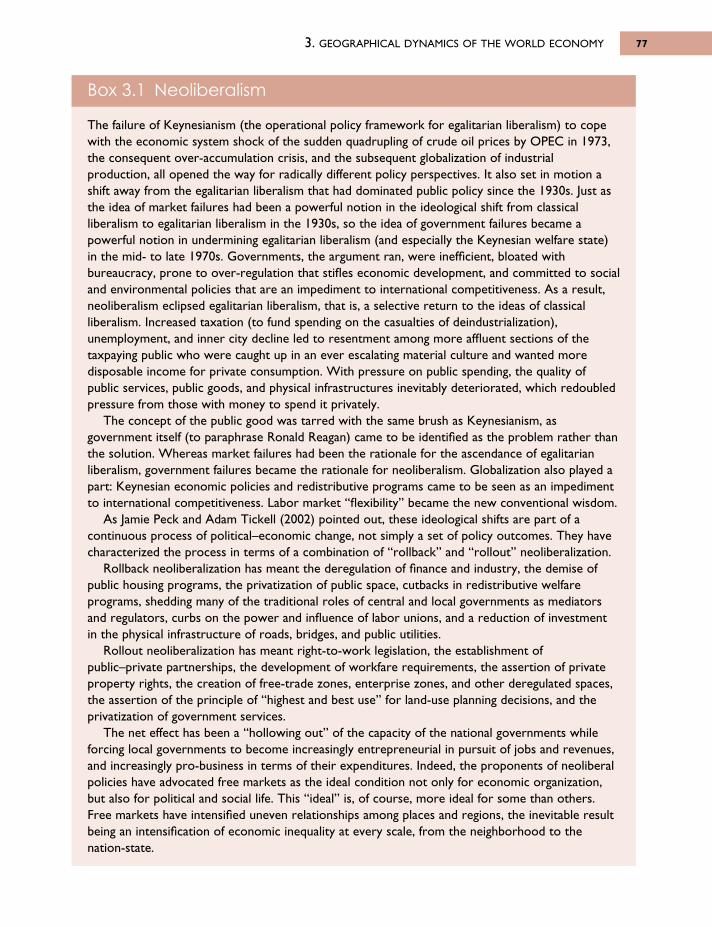
3. GEOGRAPHICAL DYNAMICS OF THE WORLD ECONOMY 77
Box 3.1 Neoliberalism
The failure of Keynesianism (the operational policy framework for egalitarian liberalism) to copewith the economic system shock of the sudden quadrupling of crude oil prices by OPEC in 1973,the consequent over-accumulation crisis, and the subsequent globalization of industrialproduction, all opened the way for radically different policy perspectives. It also set in motion ashift away from the egalitarian liberalism that had dominated public policy since the 1930s. Just asthe idea of market failures had been a powerful notion in the ideological shift from classicalliberalism to egalitarian liberalism in the 1930s, so the idea of government failures became apowerful notion in undermining egalitarian liberalism (and especially the Keynesian welfare state)in the mid- to late 1970s. Governments, the argument ran, were inefficient, bloated withbureaucracy, prone to over-regulation that stifles economic development, and committed to socialand environmental policies that are an impediment to international competitiveness. As a result,neoliberalism eclipsed egalitarian liberalism, that is, a selective return to the ideas of classicalliberalism. Increased taxation (to fund spending on the casualties of deindustrialization),unemployment, and inner city decline led to resentment among more affluent sections of thetaxpaying public who were caught up in an ever escalating material culture and wanted moredisposable income for private consumption. With pressure on public spending, the quality ofpublic services, public goods, and physical infrastructures inevitably deteriorated, which redoubledpressure from those with money to spend it privately.
The concept of the public good was tarred with the same brush as Keynesianism, asgovernment itself (to paraphrase Ronald Reagan) came to be identified as the problem rather thanthe solution. Whereas market failures had been the rationale for the ascendance of egalitarianliberalism, government failures became the rationale for neoliberalism. Globalization also played apart: Keynesian economic policies and redistributive programs came to be seen as an impedimentto international competitiveness. Labor market “flexibility” became the new conventional wisdom.
As Jamie Peck and Adam Tickell (2002) pointed out, these ideological shifts are part of acontinuous process of political–economic change, not simply a set of policy outcomes. They havecharacterized the process in terms of a combination of “rollback” and “rollout” neoliberalization.
Rollback neoliberalization has meant the deregulation of finance and industry, the demise ofpublic housing programs, the privatization of public space, cutbacks in redistributive welfareprograms, shedding many of the traditional roles of central and local governments as mediatorsand regulators, curbs on the power and influence of labor unions, and a reduction of investmentin the physical infrastructure of roads, bridges, and public utilities.
Rollout neoliberalization has meant right-to-work legislation, the establishment ofpublic–private partnerships, the development of workfare requirements, the assertion of privateproperty rights, the creation of free-trade zones, enterprise zones, and other deregulated spaces,the assertion of the principle of “highest and best use” for land-use planning decisions, and theprivatization of government services.
The net effect has been a “hollowing out” of the capacity of the national governments whileforcing local governments to become increasingly entrepreneurial in pursuit of jobs and revenues,and increasingly pro-business in terms of their expenditures. Indeed, the proponents of neoliberalpolicies have advocated free markets as the ideal condition not only for economic organization,but also for political and social life. This “ideal” is, of course, more ideal for some than others.Free markets have intensified uneven relationships among places and regions, the inevitable resultbeing an intensification of economic inequality at every scale, from the neighborhood to thenation-state.
6063 GEOGRAPHY WORLD ECON_PT_246x189 mm 22/01/2014 15:09 Page 77
Certainly, national governments in the core of the world economy now find themselves in thefiscal crisis that is a “normal” condition in the rest of the world with demands on their resourcesincreasing (for example, aging populations, increasing poverty) as their ability to meet them(for example, loss of higher paying traditional manufacturing jobs and associated revenues)declines. However, governments in the DCs remain the most important agents of social andpolitical order within their territories. They differ only in the degree of “bigness” as measuredby laws passed, range and comprehensiveness of programs, scope of government agencies,and number and initiative of employees. The overall involvement of most governments in thelives of their citizens—particularly in Europe as the debt crisis deepened while the mixed-marketeconomies of countries employing the Nordic model enjoyed far greater stability andprosperity—shows few signs of decline.
5. Lower tier governments and economic developmentIn some countries, local levels of government are able to pursue policies of their own withrespect to attracting and keeping economic activities. As some manufacturing and serviceindustries have become more “footloose” following the technological and organizationalchanges of the recent past (less tied through agglomeration economies to specific locations),a variety of factors once marginal to a firm’s locational calculus have assumed greaterprominence. Some of these can be subsumed under the rubric of local “business climate.” In the United States, for example, the northern states of the Manufacturing Belt (the regionstretching from Illinois to New York where most manufacturing industry was concentratedfrom 1880 to the 1960s) tend to have higher personal income tax rates, and greater provisionof public goods and services (public education, social services, etc.) than states in the southand west. These conditions provide for less favorable business climates for certain industriesthan are found in the other regions.
Many states and localities throughout the country, however, have actively pursuedbusinesses in what might be considered a “race to the bottom” by offering tax breaks andsubsidies to corporations to relocate. Many U.S. states have offices in Europe and Asiadesigned to attract foreign investment, but much of the competition for businesses seems toinvolve attracting established firms and branch plants from other states. This dynamic hasundoubtedly contributed to the decentralization of manufacturing industries within thecountry. The net contribution to national economic welfare is less substantial than might appear.
In contrast, the European Union’s Competition Policy attempts to restrict such wastefulzero-sum competition within its territory by placing restrictions on the provision of governmentincentives such as grants and subsidies to private companies. Increasingly, preparing local laborforces for higher skilled jobs through education and training, and thereby attracting “highervalue” industries, is seen as a much more important local economic development strategy (seeChapter 13).
CONCLUSION
In a number of respects, therefore, territorial states and the political regulation of the economythat they provide are essential to understanding the evolution of economic landscapes. Butthese states, far from being the same everywhere and staying the same over time, are intertwinedin complex and contradictory ways with the world economy. States today must operate in aglobal economic environment in which they have become managers of internal–externaltransactions rather than, in coordination with national businesses, monopolists over discretenational territories.
ECONOMIC PATTERNS AND THE SEARCH FOR EXPLANATION78
6063 GEOGRAPHY WORLD ECON_PT_246x189 mm 22/01/2014 15:09 Page 78
Indeed, it has become commonplace to observe that states are both too large and too smallfor a wide range of social and economic purposes. They are often too large territorially tocreate full social identities and real national interests as is evident in the proliferation of ethnicand cultural movements around the world. It can also be seen in the difficulties involved inachieving national consensus in many states around national institutions and policies. Forexample, the so-called welfare state has been under attack in Europe and the United States.But existing states are for many economic purposes also too small geographically. They areincreasingly “market sectors” in an intensely competitive, integrated, and interdependent worldeconomy. Two propositions follow from this perspective and inform the rest of this book:
• First, economic power is no longer a simple attribute of states. The growth of world trade,the activity of transnational corporations, the world financial system, global production,and regional trading blocs such as the European Union (EU) and the North American FreeTrade Agreement (NAFTA), and the rising power and importance of NIEs point towardsa new, highly dynamic, and rapidly evolving world order.
• Second, state, society, and economy are no longer mutually defining. Uneven economicdevelopment within and between states has redefined economic interests and politicalidentities across national, regional, and local levels. The economic restructuring associatedwith globalization has tied many local areas directly into global markets. So local areas are “communities of fate” in a world in which there is less possibility of being shieldedfrom competition within large territorial units. When such places have different orientationsto the world economy, because they have different commodities in trade, different tradingpartners, and different exposures to foreign competition, the possibility for nationalconsensus on trade policy can be significantly reduced. The growing redundancy of national governments as supranational entities (such as the EU) increase in importance, plusthe challenge to national regulation from global markets, have conspired to stimulate new and revive old political identities, especially when ethnic and cultural divisions aredefined geographically. In this context, therefore, the recent flowering of nationalist andseparatist movements around the world is not particularly surprising. New spaces for political regulation at this level may have to coexist with older ones at a larger scale.Institutions at both levels will have to cope with real if also reversible pressures for globalinterdependence.
3.3 “MARKET ACCESS” AND THE REGIONAL MOTORS OF THEWORLD ECONOMY
Wide acknowledgement that the world economy is undergoing a fundamental reorganizationhas not meant that there is agreement as to how and why this is happening. Agreement isconfined only to the sense that the world economy has entered a phase of flexible productionin which business operations around the world are increasingly taking the form of core firms(often transnational in scope) connected by formal and informal alliances to networks of otherorganizations—firms, governments, and communities.
The paradox of this trend, and the reason it has generated intense debate, is that whilenetworking allows for an increased spanning of political boundaries by concentrated businessorganizations, it also creates the opportunity for more decentralized production to sites withcompetitive advantages. Networks take on different forms with different sectors and indifferent places. Some have large corporations at their centers with geographically dispersedsubcontractors and allied firms (for example, many car manufacturers) whereas others are
3. GEOGRAPHICAL DYNAMICS OF THE WORLD ECONOMY 79
6063 GEOGRAPHY WORLD ECON_PT_246x189 mm 22/01/2014 15:09 Page 79
clusters of firms in high-tech regions (such as California’s Silicon Valley) or specializedindustrial districts (such as those in Emilia-Romagna and Tuscany, parts of the Third Italy,in which economic growth has been based on clusters of small firms specializing in the sameindustries such as machine tools, shoes, or woolen textiles).
In all cases, however, sites are never isolated worlds unto themselves. They are linked throughsocial connections and the benefits that come from either spatial divisions of labor (splittingdifferent activities among different locations) or external economies of scale (the benefits thataccrue from locating close to similar and complementary producers). The outcome is a worldeconomy in which networks and flows bring together sites widely scattered around the world.Nevertheless, the vast majority of the tightest connections are found in and between Europe,North America, and East Asia. In this respect, the world economy is not yet truly worldwidein its geographical scope.
One account of the source of this shift in the world economy from big, vertically integratedfirms organized with reference to national economies to globe-spanning networks of productionand finance emphasizes the declining rates of productivity and profits of major corporationsin the years between 1965 and 1980. These declines seem tied more to falling rates of produc -tivity than to rising labor costs. Although there have been recoveries in rates of profit at certaintimes in some economies (such as in the United States since the mid-1980s), these seem fueledin part by suppressing wages and other labor benefits more than by returns to new technologiesor new investment. This trend also reflects the “global turn” taken most aggressively by manyU.S. firms since the 1970s.
In any case, manufacturing industries in all of the major DCs experienced productivity andprofitability crises beginning in the 1970s. From this crisis came the push to rationalize opera -tions, downsize, divest relatively unprofitable activities, and use relocation and diversifi cationstrategies to produce higher rates of return for investors. This massive shakeout had a numberof consequences including the rapid spread of new technologies, the compression of the “shelflife” of commodities to keep up demand (planned obsolescence), and increased competitionto deliver goods and services quickly. Of particular importance, new transportation andcommunications technologies made it possible for businesses to move physical assets, com -ponents, finished products and services, and financial capital ever more rapidly.
In the background lay attempts by the governments of the most powerful states, particularlythe United States, to open up the world economy to increased trade and investment acrossinternational boundaries. These reflected both the perceived interests of certain businesses inthese countries in “going global” to solve their problems and the ideological imperative tobuild a “free world” economy as an alternative to the closed-off and state-centered economiesof the Soviet Union and its satellites. The exhaustion of Fordism also coincided with a numberof general changes in the workings of the world economy such as the collapse of the BrettonWoods system for fixing currency exchange rates in 1971, the oil price increases forced onworld consumers by OPEC in 1973 and again in 1979, and the world debt crisis followingthe failure of borrowers (such as semi-peripheral countries including Mexico and Brazil) topay back the loans made to them from the petrodollars recycled into the world economy bythe oil producers.
The emerging character of the world economy can be viewed through two lenses: from theperspective of states and how they fit into the picture as firms reorganize and from the pointof view of the firms and how they organize their networks geographically. The former is referredto by some commentators as an emerging “market-access economy” in which states increas -ingly standardize the rules governing trade and investment in order to situate themselves moreadvantageously within the evolving international division of labor. The latter can be seen as
ECONOMIC PATTERNS AND THE SEARCH FOR EXPLANATION80
6063 GEOGRAPHY WORLD ECON_PT_246x189 mm 22/01/2014 15:09 Page 80
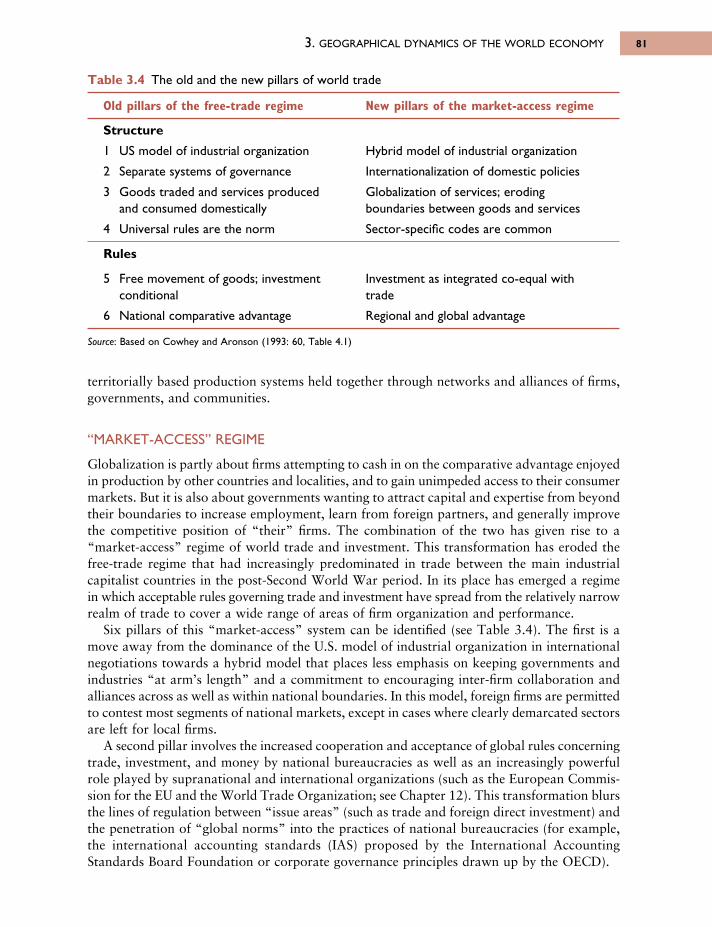
territorially based production systems held together through networks and alliances of firms,governments, and communities.
“MARKET-ACCESS” REGIME
Globalization is partly about firms attempting to cash in on the comparative advantage enjoyedin production by other countries and localities, and to gain unimpeded access to their consumermarkets. But it is also about governments wanting to attract capital and expertise from beyondtheir boundaries to increase employment, learn from foreign partners, and generally improvethe competitive position of “their” firms. The combination of the two has given rise to a“market-access” regime of world trade and investment. This transformation has eroded thefree-trade regime that had increasingly predominated in trade between the main industrialcapitalist countries in the post-Second World War period. In its place has emerged a regimein which acceptable rules governing trade and investment have spread from the relatively narrowrealm of trade to cover a wide range of areas of firm organization and performance.
Six pillars of this “market-access” system can be identified (see Table 3.4). The first is amove away from the dominance of the U.S. model of industrial organization in internationalnegotiations towards a hybrid model that places less emphasis on keeping governments andindustries “at arm’s length” and a commitment to encouraging inter-firm collaboration andalliances across as well as within national boundaries. In this model, foreign firms are permittedto contest most segments of national markets, except in cases where clearly demarcated sectorsare left for local firms.
A second pillar involves the increased cooperation and acceptance of global rules concerningtrade, investment, and money by national bureaucracies as well as an increasingly powerfulrole played by supranational and international organizations (such as the European Commis -sion for the EU and the World Trade Organization; see Chapter 12). This transformation blursthe lines of regulation between “issue areas” (such as trade and foreign direct investment) andthe penetration of “global norms” into the practices of national bureaucracies (for example,the international accounting standards (IAS) proposed by the International AccountingStandards Board Foundation or corporate governance principles drawn up by the OECD).
3. GEOGRAPHICAL DYNAMICS OF THE WORLD ECONOMY 81
Table 3.4 The old and the new pillars of world trade
Old pillars of the free-trade regime New pillars of the market-access regime
Structure
1 US model of industrial organization Hybrid model of industrial organization
2 Separate systems of governance Internationalization of domestic policies
3 Goods traded and services produced Globalization of services; eroding and consumed domestically boundaries between goods and services
4 Universal rules are the norm Sector-specific codes are common
Rules
5 Free movement of goods; investment Investment as integrated co-equal with conditional trade
6 National comparative advantage Regional and global advantage
Source: Based on Cowhey and Aronson (1993: 60, Table 4.1)
6063 GEOGRAPHY WORLD ECON_PT_246x189 mm 22/01/2014 15:09 Page 81
ECONOMIC PATTERNS AND THE SEARCH FOR EXPLANATION82
The third pillar emphasizes the growing level of trade in services beyond national boundariesand the concomitant increased importance of services (banking, insurance, transportation, legal,advertising, etc.) in the world economy. One reason for this is that high-tech products suchas computers and commercial aircraft contain high levels of service inputs. Servicing the“software” that such products require has led to an explosion in business of producer services.Another is that producers are demanding services that are of high quality and competitivelypriced. They can turn to foreign suppliers if appropriate ones are unavailable locally. Bankingand telephone industries are two services that have experienced a dramatic increase ininternationalization as producers have turned to nontraditional (frequently foreign–offshore)suppliers.
Fourth, international negotiations about trade and investment are now organized much morealong sector- and issue-specific lines. One rule no longer fits all. But many of the new rulesare essentially ad hoc rather than formal.
The final two pillars concern the content of the rules of the market-access regime. One isthe increasingly comparable importance of trade and investment due largely to the activitiesof TNCs in expanding the level of foreign direct investment. Local rules about what portionof a finished product must be made locally (within a particular country) and worries aboutthe competitive fairness of firm alliances, however, have also led to new efforts by governmentsin the DCs to regulate the flows of foreign investment. “Leveling the playing field” has meantpressure and counter-pressure between governments to ensure at least a degree of similarityin regulation (in, for example, cases of presumed monopoly or antitrust violations).
The final pillar involves the shift on the part of firms from a concern with national or domesticcomparative advantage to a concern with global or world–regional competitive advantages.This emphasis reflects the overwhelming attractiveness of “multinationality” to many busi -nesses as a way of diversifying assets, increasing market access, and, at the same time, enjoyingthe firm economies of scale that come from supplying larger markets.
Production facilities can be located to take advantage of other benefits that come fromoperating in multiple locations, particularly those offered by foreign sites. Foreign directinvestment is often seen as the result of three sets of factors:
• Ownership advantages: The advantages that accrue to firms abroad due to their technologyand market power relative to competitors.
• Internalized markets: The need to ensure returns on research and development (R&D) andother prior investments by controlling production and marketing rather than licensing toforeign firms.
• Location advantages: Favorable locational conditions that encourage foreign operationsrather than export (market size and needs, production costs, trade barriers).
Business economists tend to emphasize the first two, whereas economic geographers tend to give more weight to the third. In particular, the geographers have tended to use theproduct lifecycle model to explain the trend towards increased relocation of certain productionprocesses in foreign settings. In its original form, this idea did not have any locationalsignificance; it referred entirely to the tendency for products to move from being novelties to mass production to obsolescence. Vernon (1966) gave the product lifecycle a locationalcomponent by arguing that as production requirements change as a product “ages” so dolocational requirements. In particular, mass production is more labor-intensive than the earlierphases of production. So when a product reaches this phase in its lifecycle, it pays in terms
6063 GEOGRAPHY WORLD ECON_PT_246x189 mm 22/01/2014 15:09 Page 82
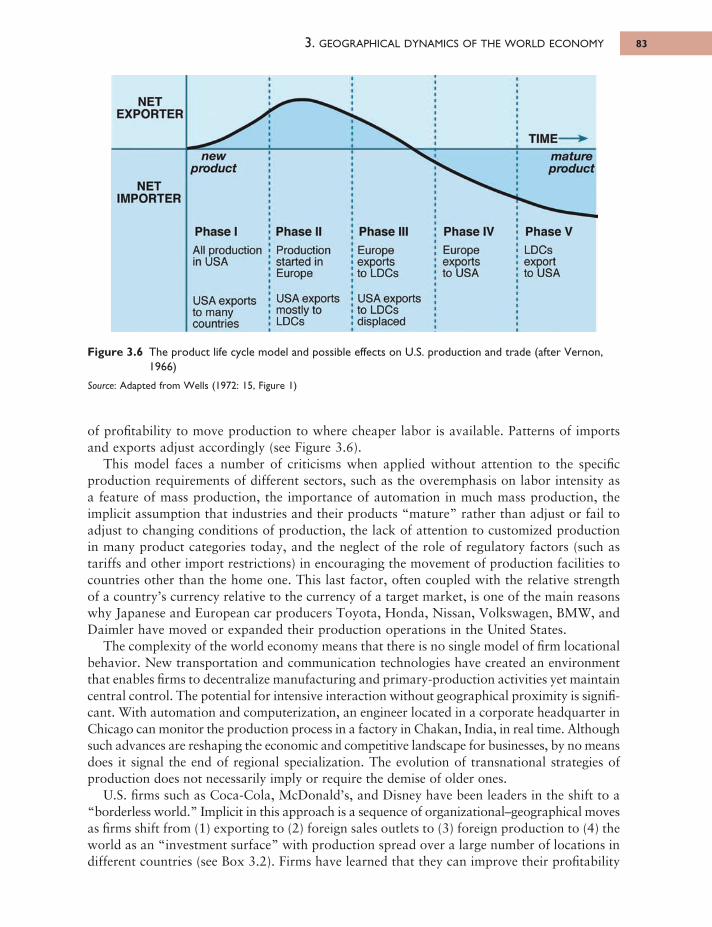
of profitability to move production to where cheaper labor is available. Patterns of importsand exports adjust accordingly (see Figure 3.6).
This model faces a number of criticisms when applied without attention to the specificproduction requirements of different sectors, such as the overemphasis on labor intensity asa feature of mass production, the importance of automation in much mass production, theimplicit assumption that industries and their products “mature” rather than adjust or fail toadjust to changing conditions of production, the lack of attention to customized productionin many product categories today, and the neglect of the role of regulatory factors (such astariffs and other import restrictions) in encouraging the movement of production facilities tocountries other than the home one. This last factor, often coupled with the relative strengthof a country’s currency relative to the currency of a target market, is one of the main reasonswhy Japanese and European car producers Toyota, Honda, Nissan, Volkswagen, BMW, andDaimler have moved or expanded their production operations in the United States.
The complexity of the world economy means that there is no single model of firm locationalbehavior. New transportation and communication technologies have created an environmentthat enables firms to decentralize manufacturing and primary-production activities yet maintaincentral control. The potential for intensive interaction without geographical proximity is signifi -cant. With automation and computerization, an engineer located in a corporate head quarter inChicago can monitor the production process in a factory in Chakan, India, in real time. Althoughsuch advances are reshaping the economic and competitive landscape for businesses, by no meansdoes it signal the end of regional specialization. The evolution of transnational strategies ofproduction does not necessarily imply or require the demise of older ones.
U.S. firms such as Coca-Cola, McDonald’s, and Disney have been leaders in the shift to a“borderless world.” Implicit in this approach is a sequence of organizational–geographical movesas firms shift from (1) exporting to (2) foreign sales outlets to (3) foreign production to (4) theworld as an “investment surface” with production spread over a large number of locations indifferent countries (see Box 3.2). Firms have learned that they can improve their profitability
3. GEOGRAPHICAL DYNAMICS OF THE WORLD ECONOMY 83
Figure 3.6 The product life cycle model and possible effects on U.S. production and trade (after Vernon,1966)
Source: Adapted from Wells (1972: 15, Figure 1)
6063 GEOGRAPHY WORLD ECON_PT_246x189 mm 22/01/2014 15:09 Page 83
NETEXPORTER
NETIMPORTER
newproduct
Phase I
All production in USA
Phase IIProduction started in Europe
Phase IIIEurope exports to LDCs
Phase IVEurope exports to USA
TIME-matureproduct
Phase V
LDCs export to USA
USA exports to LDCs displaced
USA exports mostly to LDCs
USA exports to many countries
ECONOMIC PATTERNS AND THE SEARCH FOR EXPLANATION84
Box 3.2 The semiconductor industry and the workings of themarket-access regime
Semiconductors are the basic components in electronics technologies. Electronicstechnologies are at the heart of the informational revolution that has both allowed andencouraged the transformation of the world economy since the 1970s. Semiconductorswere a $300 billion global industry in 2012. More than 30 percent of all semiconductors areexported, so it is a good candidate for showing the workings of the market-access regime.
In the 1980s the Japanese makers broke through in world markets, weakening the grip ofU.S. producers, and further threatening the already fragile European industry. This challengewas particularly strong in the market for standard memory chips (the DRAM or dynamicrandom-access memory chips) as innovation was rapid and Japanese manufacturers cutprices steeply. It is the DRAM market that has the largest economies of scale and so can, inthe long term, underwrite other types of production. Not surprisingly, semiconductorsbecame a key trade issue. According to IHS iSuppli market research data, in 2011, 11 of thetop 25 (and five—Intel, Texas Instruments, Qualcomm, Micron, and Broadcom—of the topten) semiconductor producers were U.S. companies.
By the end of 2010 the global market share of U.S firms in the semiconductor industrywas 48 percent and over 80 percent of these sales occurred in foreign markets. In the U.S.,the semiconductor industry is responsible for some 180,000 jobs with capital equipmentworth $13 billion and R&D investments of $20 billion (Wilson, 2011). The most lucrativeportion of the semiconductor industry has been microprocessors, a segment dominated byIntel (United States), the largest company in the semiconductor field, which has astranglehold on the production of chips for computers and servers, and ARM (UnitedKingdom), a company that is a fraction of the size of Intel but has developed an intricate“ecosystem” of relationship with licensees for its low-power, dynamic chips that dominatethe mobile phone, mobile computers, and consumer products market (Economist, 2012a)and is also used by Microsoft in its Surface tablet designed specifically to challenge thedominance of Apple’s iPad.
In Japan, the Ministry of International Trade and Industry (MITI) (now METI) accordedsemiconductors the highest priority and worked to establish a major presence in globalmarkets. In practice, Japanese success was the result of the marriage of the keiretsu systemof big companies at the center of affiliated networks to a national industrial policy. Inparticular, the Japanese firms enjoyed ready access to capital, and government policyreduced the risks of overextension and fostered domestic competition to achieve the bestresults in global markets. Out of this Japanese challenge came a whole new approach toglobal trade and investment in semiconductors. The first element was two U.S.–JapanSemiconductor Agreements (1986 and 1991), which opened up Japan to foreign (U.S.) firmsand monitored charges of Japanese “dumping” of semiconductors in the United States atbelow world prices. The second was the move of Japanese, European, and U.S. producersinto a number of international corporate alliances. This shift was particularly critical. Toanticipate future costs of R&D, “Firms are turning to ICAs (international corporate alliances)to build common, global infrastructures for the next generation of technologies. Alliancesalso allow firms to reduce the cost and risk of fielding extensive product lines” (Cowheyand Aronson, 1993: 162).
6063 GEOGRAPHY WORLD ECON_PT_246x189 mm 22/01/2014 15:09 Page 84
3. GEOGRAPHICAL DYNAMICS OF THE WORLD ECONOMY 85
if they use their economies of scope and coordination (returns to complexity and managerialcapability in producing multiple products) to compete effectively for global markets againstlocal producers who may have advantages in economies of scale and local connections. Brandnames, financial clout, and managerial savvy can overcome these barriers. But this can happenonly if foreign markets are opened up to competition, which is the essence of the market accessregime.
PRODUCTION NETWORKS AND REGIONAL MOTORS
From the business point of view, the response to the competitive pressures of the market-accessregime has been to acquire greater flexibility through technological change, reorganizing laborrelations, and establishing links with other firms. One solution has predominated: The creationof networks among producers. This shift has several origins. Perhaps the most significant isthe attempt by large firms to reduce the size of their work forces and to outsource less profitableactivities to other firms. This process of vertical disintegration can be cost saving if a unionizedlabor force is replaced by a nonunion one, for example, and it also taps into the specializedskills of suppliers and subcontractors.
Another important impetus is organizations’ desire to penetrate foreign markets and builda global presence through collaboration (including with erstwhile competitors). So, for example,Toyota entered into a joint venture with General Motors, while Nestlé has a joint venture withGeneral Mills. The focus on production networks highlights the central role of geographicalshifts in investment and production as a response to changes in the competitive environmentexperienced by firms in many economic sectors with the advent of the market-access regime.
Production networks
Four types of network among firms can be distinguished. The first type occurs with craft-based industries. These industries are organized around projects more than firms, per se. In construction, publishing, film and recording, architecture, and software engineering, high-skilled workforces are employed by firms but share knowledge easily across firm boundaries.Consequently, such industries tend to cluster to take advantage of the external economies
The net effect is a perfect example of the market-access regime of trade and investment.The new structure of the semiconductor industry is a hybrid of Japanese, U.S., and Europeanmodels (pillar 1 in Table 3.4). International agreements are the main means by which theindustry is regulated (pillar 2). The mix of hardware and software makes it hard to saywhere the product ends and servicing begins. What is clear is that both must be available ona worldwide basis for a product to be competitive (pillar 3). Since 1986 specialized industrycodes have steadily displaced older industry-wide ones (pillar 4). Where chips were oncetraded relatively freely but without much foreign direct investment, major networks basedon international alliances now span national boundaries. Semiconductor firms have becomeglobal in their organization as well as in their search for markets (pillar 5). Finally, firms arebuilding global and world–regional advantages in order to give them leverage over home andforeign markets (pillar 6). Product and technology flows are now so globalized that closingmarkets (national and regional) would doom affected producers to limited market share andto not participating in new rounds of innovation and product development.
6063 GEOGRAPHY WORLD ECON_PT_246x189 mm 22/01/2014 15:09 Page 85
implicit in such sharing. External economies include such factors as a labor pool with relevantskills, a broad network of suppliers, excellent educational and training support, and, perhapsmost importantly, access to venture capital knowledge about the nature of the business. Italso includes intangibles such as a “culture” accepting of innovation, tolerance of failure, localreinvestment, collaboration, promotion on merit, and openness to new enterprises.
The second type of network involves small firm industrial districts such as those oftenassociated with the Third Italy. These districts are local integrated networks of producers withdifferent firms specializing in different phases of the production process but competing forwork with other local firms when new projects arise. Evidence suggests that they rely in equalmeasure on external economies of scale in production (collaborative production, localgovernment financing, craft traditions, pools of skilled labor, etc.) and on what can be callednon-traded interdependencies—a long history of social collaboration, institutionalizedcooperation, and agreement on social conventions governing everyday inter-firm relations.
The third type of network is that of agglomerated big firm-based production systems suchas in Toyota City in Nagoya, Japan; Boeing and its suppliers in the Tacoma-Seattle region inthe United States; and Fiat and its suppliers around Turin in northwest Italy. In some cases,the suppliers pre-existed the emergence of the big firms; in others (as in Japan and South Korea),the dominant company financed the suppliers. Since the 1970s, however, the main processstimulating this kind of network has been the vertical disintegration of the big firms themselves.Whether territorially connected to them or not, large firms can now achieve improved flexibilityby using subcontractors to carry out aspects of production that used to be performed withinthe boundaries of the firm. A high-tech industrial complex such as Silicon Valley is somewherein between the first or “classic” type of industrial district and the third or agglomerated bigfirm production system, sharing features of both.
Finally, the fourth type of network is represented by strategic alliances between firms. Oneof the most important innovations of the market-access regime, especially in terms of strategicalliances between international competitors, in this network is that: “Each partner brings tothe marriage its own specialty—technology, financial power, access to government regulatorsor procurement officials—and its own constellation of small firm suppliers” (Harrison, 1994:138). Each party gains knowledge and connections intrinsic to the other to further their effortsat conquering global markets for their products. One logical consequence of alliances wouldbe merger or acquisition of one partner by the other. But some national laws and customs setlimits to these activities (for example, U.S. and Japanese laws restrict foreign acquisition ofhome-grown firms), and the goal of flexibility is best met by maintaining or recreating alliancesrather than engaging in fully fledged mergers.
NEW INTERNATIONAL DIVISION OF LABOR
The first interpretations of the changing character of business organization and the associatedchanges in the economic geography of production focused on the emergence of a newinternational division of labor (NIDL). From this point of view, big transnational corporationshave created a global economic geography. One of the architects of this viewpoint, StephenHymer (1972: 114), imagined that the transnational corporations:
[W]ould tend to produce a hierarchical division of labor between geographical regions corres pondingto the vertical division of labor within the firm. It would tend to centralize high-level decision-making occupations to a few key cities in the advanced countries, surrounded by a number ofregional sub-capitals, and confine the rest of the world to lower levels of activity and income.
ECONOMIC PATTERNS AND THE SEARCH FOR EXPLANATION86
6063 GEOGRAPHY WORLD ECON_PT_246x189 mm 22/01/2014 15:09 Page 86
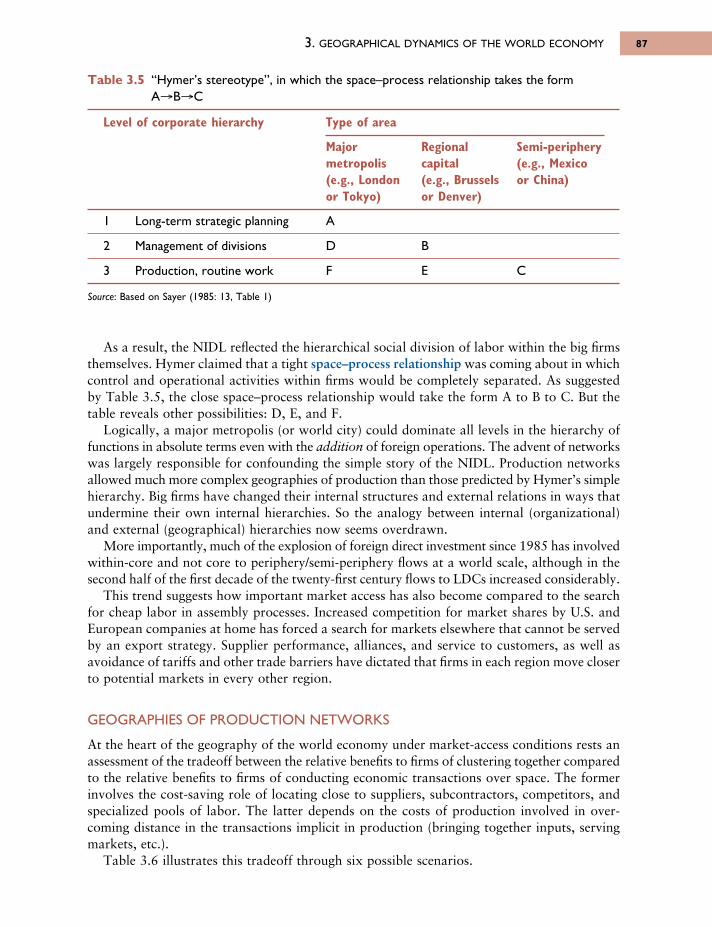
As a result, the NIDL reflected the hierarchical social division of labor within the big firmsthemselves. Hymer claimed that a tight space–process relationship was coming about in whichcontrol and operational activities within firms would be completely separated. As suggestedby Table 3.5, the close space–process relationship would take the form A to B to C. But thetable reveals other possibilities: D, E, and F.
Logically, a major metropolis (or world city) could dominate all levels in the hierarchy offunctions in absolute terms even with the addition of foreign operations. The advent of networkswas largely responsible for confounding the simple story of the NIDL. Production networksallowed much more complex geographies of production than those predicted by Hymer’s simplehierarchy. Big firms have changed their internal structures and external relations in ways thatundermine their own internal hierarchies. So the analogy between internal (organizational)and external (geographical) hierarchies now seems overdrawn.
More importantly, much of the explosion of foreign direct investment since 1985 has involvedwithin-core and not core to periphery/semi-periphery flows at a world scale, although in thesecond half of the first decade of the twenty-first century flows to LDCs increased considerably.
This trend suggests how important market access has also become compared to the searchfor cheap labor in assembly processes. Increased competition for market shares by U.S. andEuropean companies at home has forced a search for markets elsewhere that cannot be servedby an export strategy. Supplier performance, alliances, and service to customers, as well asavoidance of tariffs and other trade barriers have dictated that firms in each region move closerto potential markets in every other region.
GEOGRAPHIES OF PRODUCTION NETWORKS
At the heart of the geography of the world economy under market-access conditions rests anassessment of the tradeoff between the relative benefits to firms of clustering together comparedto the relative benefits to firms of conducting economic transactions over space. The formerinvolves the cost-saving role of locating close to suppliers, subcontractors, competitors, andspecialized pools of labor. The latter depends on the costs of production involved in over-coming distance in the transactions implicit in production (bringing together inputs, servingmarkets, etc.).
Table 3.6 illustrates this tradeoff through six possible scenarios.
3. GEOGRAPHICAL DYNAMICS OF THE WORLD ECONOMY 87
Table 3.5 “Hymer’s stereotype”, in which the space–process relationship takes the formA→B→C
Level of corporate hierarchy Type of area
Major Regional Semi-peripherymetropolis capital (e.g., Mexico(e.g., London (e.g., Brussels or China)or Tokyo) or Denver)
1 Long-term strategic planning A
2 Management of divisions D B
3 Production, routine work F E C
Source: Based on Sayer (1985: 13, Table 1)
6063 GEOGRAPHY WORLD ECON_PT_246x189 mm 22/01/2014 15:09 Page 87
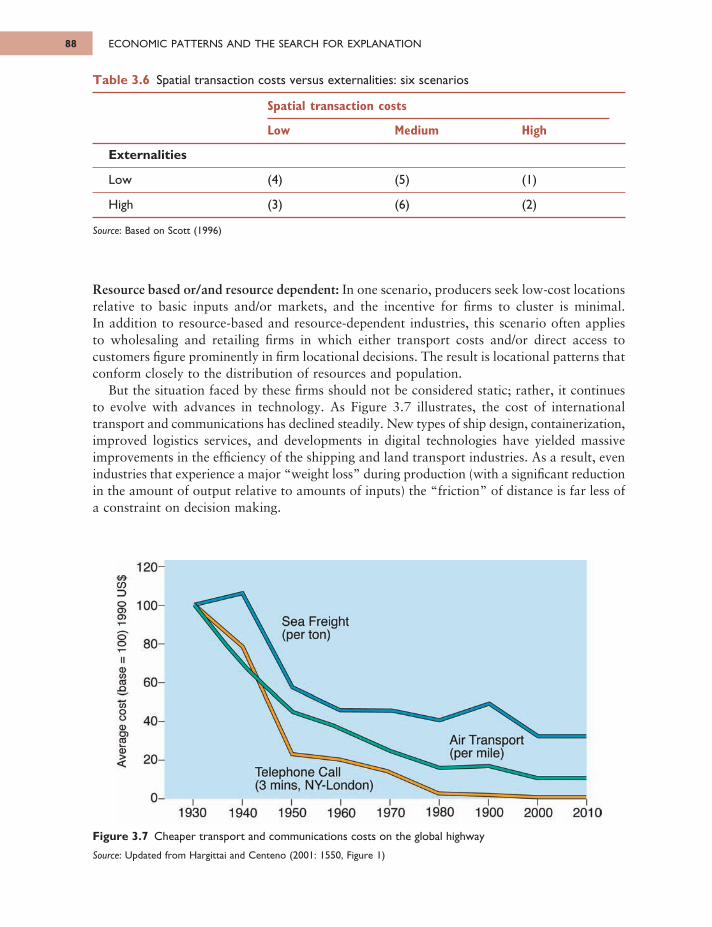
Resource based or/and resource dependent: In one scenario, producers seek low-cost locationsrelative to basic inputs and/or markets, and the incentive for firms to cluster is minimal. In addition to resource-based and resource-dependent industries, this scenario often appliesto wholesaling and retailing firms in which either transport costs and/or direct access tocustomers figure prominently in firm locational decisions. The result is locational patterns thatconform closely to the distribution of resources and population.
But the situation faced by these firms should not be considered static; rather, it continuesto evolve with advances in technology. As Figure 3.7 illustrates, the cost of internationaltransport and communications has declined steadily. New types of ship design, container ization,improved logistics services, and developments in digital technologies have yielded massiveimprovements in the efficiency of the shipping and land transport industries. As a result, evenindustries that experience a major “weight loss” during production (with a significant reductionin the amount of output relative to amounts of inputs) the “friction” of distance is far less ofa constraint on decision making.
ECONOMIC PATTERNS AND THE SEARCH FOR EXPLANATION88
Table 3.6 Spatial transaction costs versus externalities: six scenarios
Spatial transaction costs
Low Medium High
Externalities
Low (4) (5) (1)
High (3) (6) (2)
Source: Based on Scott (1996)
Figure 3.7 Cheaper transport and communications costs on the global highway
Source: Updated from Hargittai and Centeno (2001: 1550, Figure 1)
6063 GEOGRAPHY WORLD ECON_PT_246x189 mm 22/01/2014 15:09 Page 88
Sea Freight (per ton)
Air Transport (per mile)
Telephone Call (3 mins, NY-London)
120
100
80
60
40
20-
CODOO)O)
ooII
CD(Л03
-Ω
GOo0Q)CD03
1
ΟΙ 930 1940 1950 1960 1970 1980 1900 2000 201 (
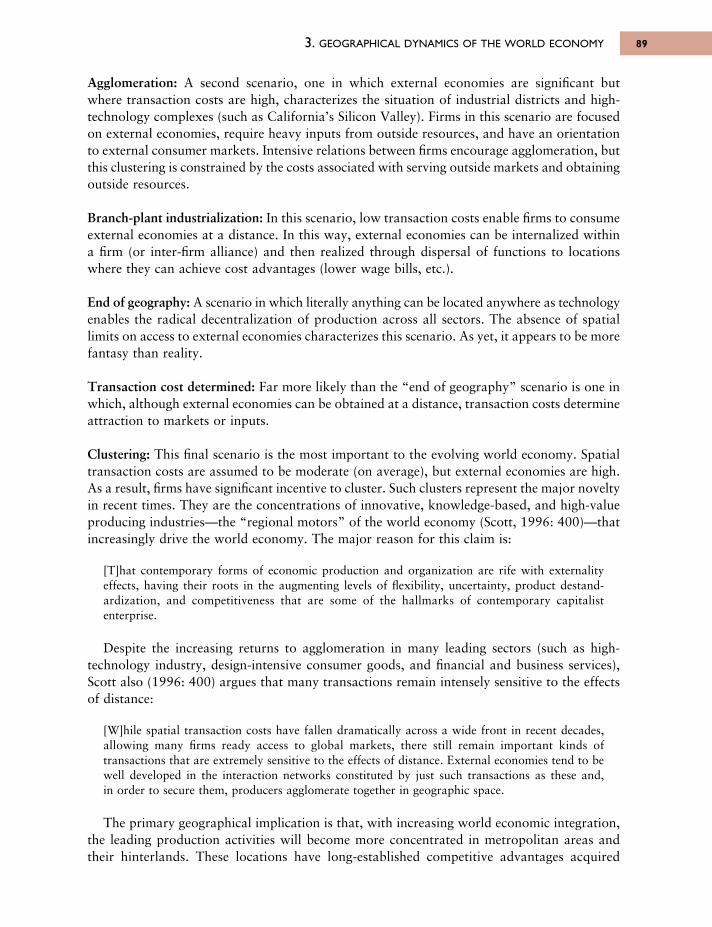
Agglomeration: A second scenario, one in which external economies are significant but where transaction costs are high, characterizes the situation of industrial districts and high-technology complexes (such as California’s Silicon Valley). Firms in this scenario are focusedon external economies, require heavy inputs from outside resources, and have an orientationto external consumer markets. Intensive relations between firms encourage agglomeration, butthis clustering is constrained by the costs associated with serving outside markets and obtainingoutside resources.
Branch-plant industrialization: In this scenario, low transaction costs enable firms to consumeexternal economies at a distance. In this way, external economies can be internalized withina firm (or inter-firm alliance) and then realized through dispersal of functions to locationswhere they can achieve cost advantages (lower wage bills, etc.).
End of geography: A scenario in which literally anything can be located anywhere as technologyenables the radical decentralization of production across all sectors. The absence of spatiallimits on access to external economies characterizes this scenario. As yet, it appears to be morefantasy than reality.
Transaction cost determined: Far more likely than the “end of geography” scenario is one inwhich, although external economies can be obtained at a distance, transaction costs determineattraction to markets or inputs.
Clustering: This final scenario is the most important to the evolving world economy. Spatialtransaction costs are assumed to be moderate (on average), but external economies are high.As a result, firms have significant incentive to cluster. Such clusters represent the major noveltyin recent times. They are the concentrations of innovative, knowledge-based, and high-valueproducing industries—the “regional motors” of the world economy (Scott, 1996: 400)—thatincreasingly drive the world economy. The major reason for this claim is:
[T]hat contemporary forms of economic production and organization are rife with externality effects, having their roots in the augmenting levels of flexibility, uncertainty, product destand-ard ization, and competitiveness that are some of the hallmarks of contemporary capitalistenterprise.
Despite the increasing returns to agglomeration in many leading sectors (such as high-technology industry, design-intensive consumer goods, and financial and business services),Scott also (1996: 400) argues that many transactions remain intensely sensitive to the effectsof distance:
[W]hile spatial transaction costs have fallen dramatically across a wide front in recent decades,allowing many firms ready access to global markets, there still remain important kinds oftransactions that are extremely sensitive to the effects of distance. External economies tend to bewell developed in the interaction networks constituted by just such transactions as these and, in order to secure them, producers agglomerate together in geographic space.
The primary geographical implication is that, with increasing world economic integration,the leading production activities will become more concentrated in metropolitan areas andtheir hinterlands. These locations have long-established competitive advantages acquired
3. GEOGRAPHICAL DYNAMICS OF THE WORLD ECONOMY 89
6063 GEOGRAPHY WORLD ECON_PT_246x189 mm 22/01/2014 15:09 Page 89
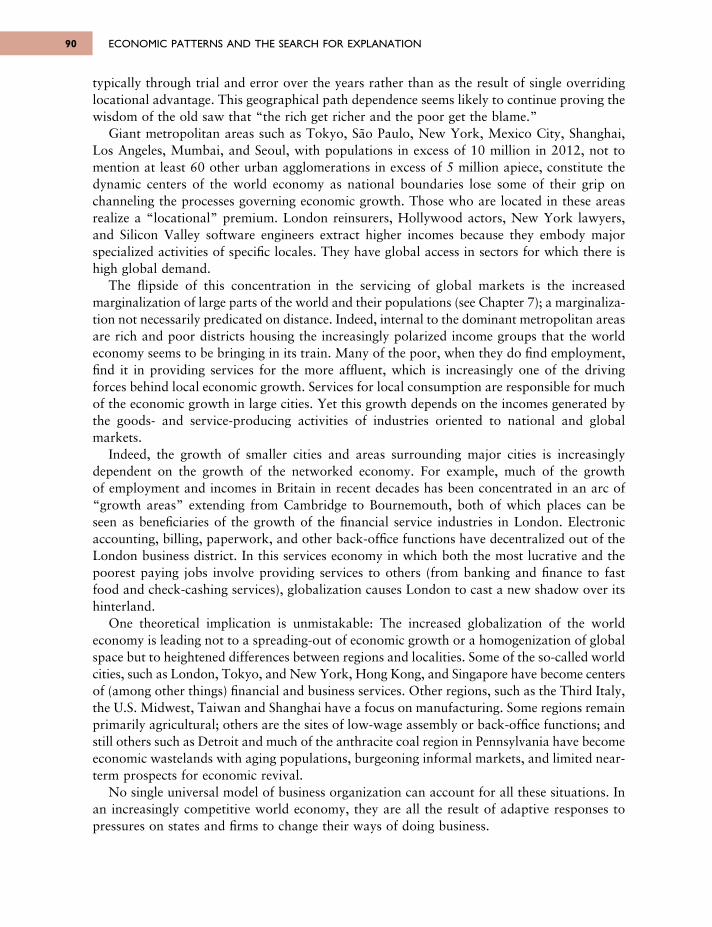
typically through trial and error over the years rather than as the result of single overridinglocational advantage. This geographical path dependence seems likely to continue proving thewisdom of the old saw that “the rich get richer and the poor get the blame.”
Giant metropolitan areas such as Tokyo, São Paulo, New York, Mexico City, Shanghai,Los Angeles, Mumbai, and Seoul, with populations in excess of 10 million in 2012, not tomention at least 60 other urban agglomerations in excess of 5 million apiece, constitute thedynamic centers of the world economy as national boundaries lose some of their grip onchanneling the processes governing economic growth. Those who are located in these areasrealize a “locational” premium. London reinsurers, Hollywood actors, New York lawyers,and Silicon Valley software engineers extract higher incomes because they embody majorspecialized activities of specific locales. They have global access in sectors for which there ishigh global demand.
The flipside of this concentration in the servicing of global markets is the increasedmarginalization of large parts of the world and their populations (see Chapter 7); a marginaliza-tion not necessarily predicated on distance. Indeed, internal to the dominant metropolitan areasare rich and poor districts housing the increasingly polarized income groups that the worldeconomy seems to be bringing in its train. Many of the poor, when they do find employment,find it in providing services for the more affluent, which is increasingly one of the drivingforces behind local economic growth. Services for local consumption are responsible for muchof the economic growth in large cities. Yet this growth depends on the incomes generated bythe goods- and service-producing activities of industries oriented to national and globalmarkets.
Indeed, the growth of smaller cities and areas surrounding major cities is increasinglydependent on the growth of the networked economy. For example, much of the growth of employment and incomes in Britain in recent decades has been concentrated in an arc of“growth areas” extending from Cambridge to Bournemouth, both of which places can be seen as beneficiaries of the growth of the financial service industries in London. Electronicaccounting, billing, paperwork, and other back-office functions have decentralized out of theLondon business district. In this services economy in which both the most lucrative and thepoorest paying jobs involve providing services to others (from banking and finance to fastfood and check-cashing services), globalization causes London to cast a new shadow over itshinterland.
One theoretical implication is unmistakable: The increased globalization of the worldeconomy is leading not to a spreading-out of economic growth or a homogenization of globalspace but to heightened differences between regions and localities. Some of the so-called worldcities, such as London, Tokyo, and New York, Hong Kong, and Singapore have become centersof (among other things) financial and business services. Other regions, such as the Third Italy,the U.S. Midwest, Taiwan and Shanghai have a focus on manufacturing. Some regions remainprimarily agricultural; others are the sites of low-wage assembly or back-office functions; andstill others such as Detroit and much of the anthracite coal region in Pennsylvania have becomeeconomic wastelands with aging populations, burgeoning informal markets, and limited near-term prospects for economic revival.
No single universal model of business organization can account for all these situations. Inan increasingly competitive world economy, they are all the result of adaptive responses topressures on states and firms to change their ways of doing business.
ECONOMIC PATTERNS AND THE SEARCH FOR EXPLANATION90
6063 GEOGRAPHY WORLD ECON_PT_246x189 mm 22/01/2014 15:09 Page 90
SUMMARYIn this chapter, we developed the historical–geographical perspective that lies behind the restof this book. Particular attention has been paid to the specific features of the world economyand its evolution including the following:
• the single world market• the state system• the three geographical tiers: core, periphery, and semi-periphery• temporal patterns and hegemony• subordination and resistance• alternative adaptations.
We also explored the changing relationship between states and the contemporary worldeconomy under conditions of globalized capitalism. We emphasized that economic power isno longer best thought of as an attribute of states, and that states and national economies areno longer mutually defining entities. However, we underscored the continuing importance ofstates as regulators of economic activities. We also emphasized that the world economy stillhas political divisions that take a geographical form.
We introduced the idea of a “market-access” economy in the third section. We exploredhow it differs from the previously dominant free-trade regime and the critical role of certainregional “motors” to the world economy. The importance of transnational corporations andstrategic alliances between them was emphasized, along with the increasingly complex inter-national division of labor in many economic sectors. The location of economic activities appearsto involve a decreased reliance on the costs of assembling the factors of production (that is,spatial transaction costs) and an increased reliance on both traded and nontraded inter-dependencies (external economies), which encourages a clustering of specialized activities.Rather than encouraging a spreading-out of manufacturing and service industries across theworld, therefore, the market-access model of increased global economic interdependenceproduces a remarkable regional clustering of many activities.
In Parts 2 and 3 of this book, we explore the specific economic–geographical consequencesof the evolution of the world economy as described in the first and third parts of this chapter.Part 4 is concerned with some of the manifestations of the globalization/localization nexus atthe center of the contemporary world economy that pose challenges to state management raisedin the second part: The growth of regional trading blocs and decentralist reactions to thechanging world economy.
KEY SOURCES AND SUGGESTED READINGCowhey, P.F. and Aronson, J.D., 1993. Managing the World Economy: The consequences of corporate
alliances. New York: Council on Foreign Relations Press.Eichengreen, B., 1996. Globalizing Capital: A history of the international monetary system. Princeton,
NJ: Princeton University Press.Gereffi, G. and Korzeniewicz, M., (eds.), 1993. Commodity Chains and Global Capitalism. Westport,
CT: Greenwood Press.Hackworth, J., 2006. The Neoliberal City. Governance, ideology, and development in American
urbanism. Ithaca, NY: Cornell University Press.Maddison, A., 2001. The World Economy: A millennial perspective. Paris: OECD Development Centre
Studies.
3. GEOGRAPHICAL DYNAMICS OF THE WORLD ECONOMY 91
6063 GEOGRAPHY WORLD ECON_PT_246x189 mm 22/01/2014 15:10 Page 91
Malmberg, A. and Maskell, P., 1997. Towards an Explanation of Regional Specialization and IndustryAgglomeration, European Planning Studies 5, 25–41.
Massey, D., 1984. Spatial Divisions of Labor. London: Methuen.O’Brien, R., 1992. Global Financial Integration: The end of geography. New York: Council on Foreign
Relations Press.Peck, J. and Tickell, A., 2002. Neoliberalizing space, in N. Brenner and N. Theodore (eds.), Spaces of
Neoliberalism. Urban restructuring in North America and western Europe. Oxford: Blackwell,33–57.
Scott, A.J., 1996. Regional motors of the global economy, Futures 28, 391–411.Venables, A.J., 2006. Shifts in economic geography and their causes, Federal Reserve Bank of Kansas
City Economic Review 31, 61–85.Wallerstein, I., 1979. The Capitalist World-Economy. Cambridge: Cambridge University Press.
ECONOMIC PATTERNS AND THE SEARCH FOR EXPLANATION92
6063 GEOGRAPHY WORLD ECON_PT_246x189 mm 22/01/2014 15:10 Page 92
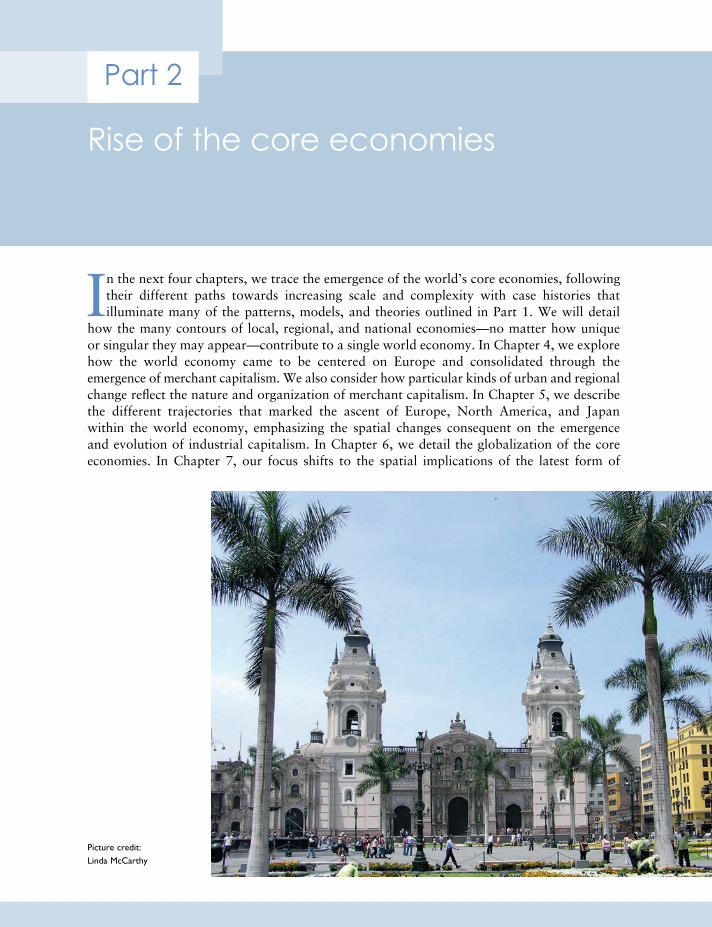
Part 2
Rise of the core economies
Picture credit: Linda McCarthy
In the next four chapters, we trace the emergence of the world’s core economies, followingtheir different paths towards increasing scale and complexity with case histories thatilluminate many of the patterns, models, and theories outlined in Part 1. We will detail
how the many contours of local, regional, and national economies—no matter how uniqueor singular they may appear—contribute to a single world economy. In Chapter 4, we explorehow the world economy came to be centered on Europe and consolidated through theemergence of merchant capitalism. We also consider how particular kinds of urban and regionalchange reflect the nature and organization of merchant capitalism. In Chapter 5, we describethe different trajectories that marked the ascent of Europe, North America, and Japan within the world economy, emphasizing the spatial changes consequent on the emergence and evolution of industrial capitalism. In Chapter 6, we detail the globalization of the coreeconomies. In Chapter 7, our focus shifts to the spatial implications of the latest form of
6063 GEOGRAPHY WORLD ECON_PT_246x189 mm 22/01/2014 15:10 Page 93
RISE OF THE CORE ECONOMIES94
economic organization of the world’s core regions. Although the emphasis throughout thispart of the book is on the interactions of dominant forms of economic organization and majordimensions of spatial change, the role of human agency in shaping and differentiating the mosaicof regional landscapes emerges as an important subtheme. What is done, where, and how—under any form of economic organization—reflects human interpretations of how resourcesshould be used. As Ron Johnston (1984: 446) noted, these interpretations:
[A]re shaped through cultural lenses (which may be locally created, or may be imported); theyreflect reactions to both the local physical environment and the international economic situation;they are mediated by local institutional structures; they are influenced by historical context; andthey change that context, and hence the environment for future operations.
6063 GEOGRAPHY WORLD ECON_PT_246x189 mm 22/01/2014 15:10 Page 94
In this chapter, we trace the emergence of an embryonic world economy centered on Europe,and describe the way in which Europeans became, as Robert Reynolds put it (1961: vii),the “leaders, drivers, persuaders, shapers, crushers and builders” of the rest of the world’s
economies and societies. From these changes, the core areas of Europe forged the templatefor the economic geography of the contemporary world. It must be recognized at the outset,however, that preindustrial economic development was by no means exclusively a Europeanphenomenon. The early trajectories of other parts of the world often eclipsed that of Europeand were sometimes important in influencing events in Europe itself. We begin, therefore, witha brief review that spans the origins and diffusion of the first, crucial “revolution” in thedevelopment of agricultural systems, the rise of ancient empires, the establishment of urbansystems, and the spread of feudalism as the dominant form of economic organization. Ratherthan provide a thumbnail sketch of early economic history, we simply highlight the emergenceand spatial implications of certain key socioeconomic forces.
4.1 BEGINNINGSWe start from some basic distinctions provided by the world-systems theory of ImmanuelWallerstein. In his view, at one time all societies were minisystems: “A minisystem is an entitythat has within it a complete division of labor, and a single cultural framework” (1979a: 17).Such minisystems would include simple hunter–gatherer and some agricultural societies. Butas soon as they became tied to empires or the world economy, they ceased to be separatesystems. Empires and the world economy are examples of what Wallerstein calls world-systems:Units with a single spatial division of labor but multiple cultural systems. In the case of a unitwith a common political system, there is a world empire. Where no political integration exists,a world economy occurs.
Relatively little is known about the first transitions from primitive hunter–gatheringminisystems to larger scale, agriculturally based world empires and world economies. Despite
Picture credit: Linda McCarthy
Chapter 4
Preindustrialfoundations
6063 GEOGRAPHY WORLD ECON_PT_246x189 mm 22/01/2014 15:10 Page 95
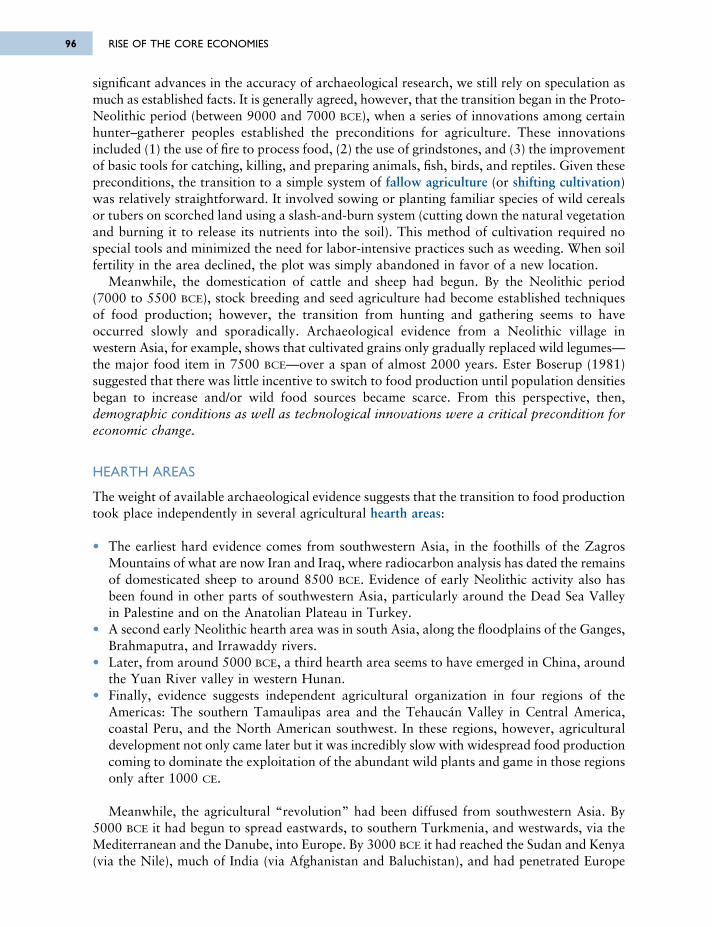
significant advances in the accuracy of archaeological research, we still rely on speculation asmuch as established facts. It is generally agreed, however, that the transition began in the Proto-Neolithic period (between 9000 and 7000 BCE), when a series of innovations among certainhunter–gatherer peoples established the preconditions for agriculture. These innovationsincluded (1) the use of fire to process food, (2) the use of grindstones, and (3) the improvementof basic tools for catching, killing, and preparing animals, fish, birds, and reptiles. Given thesepreconditions, the transition to a simple system of fallow agriculture (or shifting cultivation)was relatively straightforward. It involved sowing or planting familiar species of wild cerealsor tubers on scorched land using a slash-and-burn system (cutting down the natural vegetationand burning it to release its nutrients into the soil). This method of cultivation required nospecial tools and minimized the need for labor-intensive practices such as weeding. When soilfertility in the area declined, the plot was simply abandoned in favor of a new location.
Meanwhile, the domestication of cattle and sheep had begun. By the Neolithic period (7000 to 5500 BCE), stock breeding and seed agriculture had become established techniquesof food production; however, the transition from hunting and gathering seems to haveoccurred slowly and sporadically. Archaeological evidence from a Neolithic village in western Asia, for example, shows that cultivated grains only gradually replaced wild legumes—the major food item in 7500 BCE—over a span of almost 2000 years. Ester Boserup (1981)suggested that there was little incentive to switch to food production until population densitiesbegan to increase and/or wild food sources became scarce. From this perspective, then,demographic conditions as well as technological innovations were a critical precondition foreconomic change.
HEARTH AREAS
The weight of available archaeological evidence suggests that the transition to food productiontook place independently in several agricultural hearth areas:
• The earliest hard evidence comes from southwestern Asia, in the foothills of the ZagrosMountains of what are now Iran and Iraq, where radiocarbon analysis has dated the remainsof domesticated sheep to around 8500 BCE. Evidence of early Neolithic activity also hasbeen found in other parts of southwestern Asia, particularly around the Dead Sea Valleyin Palestine and on the Anatolian Plateau in Turkey.
• A second early Neolithic hearth area was in south Asia, along the floodplains of the Ganges,Brahmaputra, and Irrawaddy rivers.
• Later, from around 5000 BCE, a third hearth area seems to have emerged in China, aroundthe Yuan River valley in western Hunan.
• Finally, evidence suggests independent agricultural organization in four regions of theAmericas: The southern Tamaulipas area and the Tehaucán Valley in Central America,coastal Peru, and the North American southwest. In these regions, however, agriculturaldevelopment not only came later but it was incredibly slow with widespread food productioncoming to dominate the exploitation of the abundant wild plants and game in those regionsonly after 1000 CE.
Meanwhile, the agricultural “revolution” had been diffused from southwestern Asia. By5000 BCE it had begun to spread eastwards, to southern Turkmenia, and westwards, via theMediterranean and the Danube, into Europe. By 3000 BCE it had reached the Sudan and Kenya(via the Nile), much of India (via Afghanistan and Baluchistan), and had penetrated Europe
RISE OF THE CORE ECONOMIES96
6063 GEOGRAPHY WORLD ECON_PT_246x189 mm 22/01/2014 15:10 Page 96
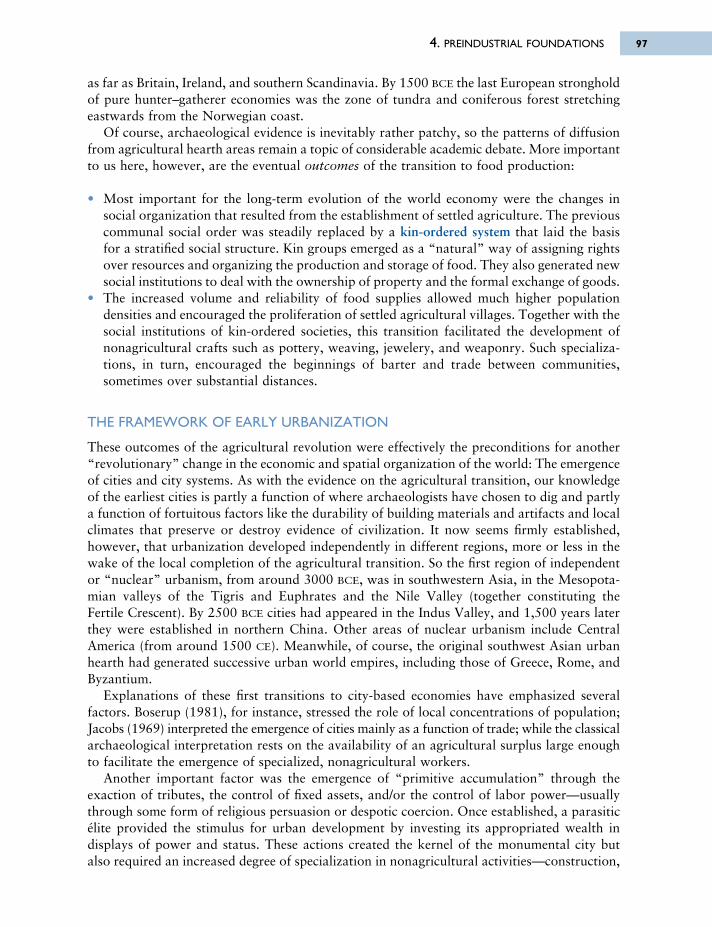
as far as Britain, Ireland, and southern Scandinavia. By 1500 BCE the last European strongholdof pure hunter–gatherer economies was the zone of tundra and coniferous forest stretchingeastwards from the Norwegian coast.
Of course, archaeological evidence is inevitably rather patchy, so the patterns of diffusionfrom agricultural hearth areas remain a topic of considerable academic debate. More importantto us here, however, are the eventual outcomes of the transition to food production:
• Most important for the long-term evolution of the world economy were the changes insocial organization that resulted from the establishment of settled agriculture. The previouscommunal social order was steadily replaced by a kin-ordered system that laid the basisfor a stratified social structure. Kin groups emerged as a “natural” way of assigning rightsover resources and organizing the production and storage of food. They also generated newsocial institutions to deal with the ownership of property and the formal exchange of goods.
• The increased volume and reliability of food supplies allowed much higher populationdensities and encouraged the proliferation of settled agricultural villages. Together with thesocial institutions of kin-ordered societies, this transition facilitated the development ofnonagricultural crafts such as pottery, weaving, jewelery, and weaponry. Such specializa -tions, in turn, encouraged the beginnings of barter and trade between communities,sometimes over substantial distances.
THE FRAMEWORK OF EARLY URBANIZATION
These outcomes of the agricultural revolution were effectively the preconditions for another“revolutionary” change in the economic and spatial organization of the world: The emergenceof cities and city systems. As with the evidence on the agricultural transition, our knowledgeof the earliest cities is partly a function of where archaeologists have chosen to dig and partlya function of fortuitous factors like the durability of building materials and artifacts and localclimates that preserve or destroy evidence of civilization. It now seems firmly established,however, that urbanization developed independently in different regions, more or less in thewake of the local completion of the agricultural transition. So the first region of independentor “nuclear” urbanism, from around 3000 BCE, was in southwestern Asia, in the Mesopota-mian valleys of the Tigris and Euphrates and the Nile Valley (together constituting the Fertile Crescent). By 2500 BCE cities had appeared in the Indus Valley, and 1,500 years laterthey were established in northern China. Other areas of nuclear urbanism include CentralAmerica (from around 1500 CE). Meanwhile, of course, the original southwest Asian urbanhearth had generated successive urban world empires, including those of Greece, Rome, andByzantium.
Explanations of these first transitions to city-based economies have emphasized severalfactors. Boserup (1981), for instance, stressed the role of local concentrations of population;Jacobs (1969) interpreted the emergence of cities mainly as a function of trade; while the classicalarchaeological interpretation rests on the availability of an agricultural surplus large enoughto facilitate the emergence of specialized, nonagricultural workers.
Another important factor was the emergence of “primitive accumulation” through theexaction of tributes, the control of fixed assets, and/or the control of labor power—usuallythrough some form of religious persuasion or despotic coercion. Once established, a parasiticélite provided the stimulus for urban development by investing its appropriated wealth indisplays of power and status. These actions created the kernel of the monumental city butalso required an increased degree of specialization in nonagricultural activities—construction,
4. PREINDUSTRIAL FOUNDATIONS 97
6063 GEOGRAPHY WORLD ECON_PT_246x189 mm 22/01/2014 15:10 Page 97
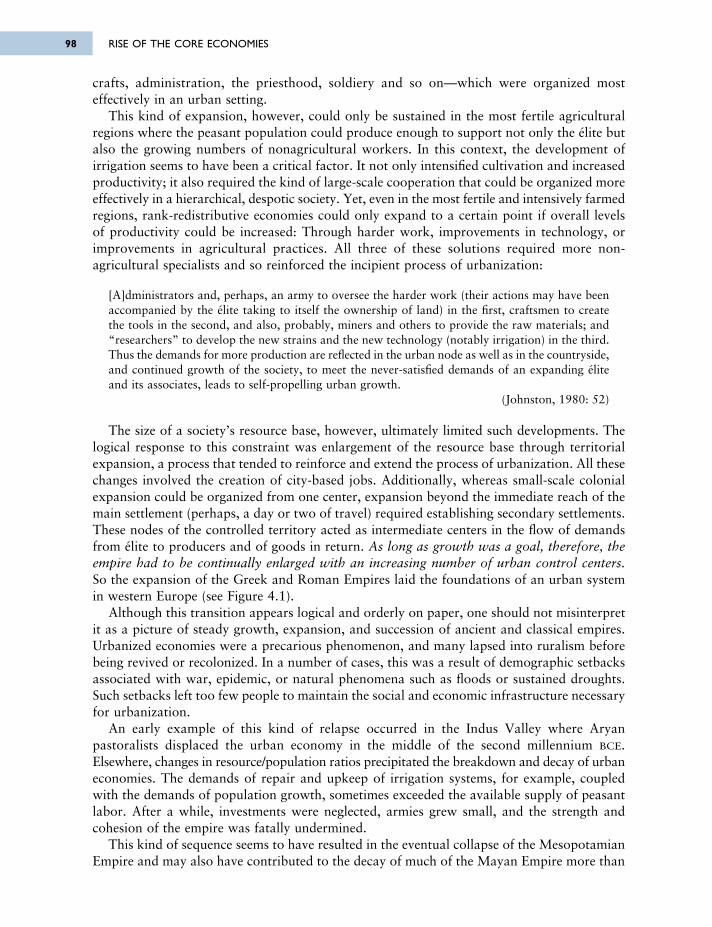
crafts, administration, the priesthood, soldiery and so on—which were organized mosteffectively in an urban setting.
This kind of expansion, however, could only be sustained in the most fertile agriculturalregions where the peasant population could produce enough to support not only the élite butalso the growing numbers of nonagricultural workers. In this context, the development ofirrigation seems to have been a critical factor. It not only intensified cultivation and increasedproductivity; it also required the kind of large-scale cooperation that could be organized moreeffectively in a hierarchical, despotic society. Yet, even in the most fertile and intensively farmedregions, rank-redistributive economies could only expand to a certain point if overall levelsof productivity could be increased: Through harder work, improvements in technology, orimprovements in agricultural practices. All three of these solutions required more non -agricultural specialists and so reinforced the incipient process of urbanization:
[A]dministrators and, perhaps, an army to oversee the harder work (their actions may have beenaccompanied by the élite taking to itself the ownership of land) in the first, craftsmen to createthe tools in the second, and also, probably, miners and others to provide the raw materials; and“researchers” to develop the new strains and the new technology (notably irrigation) in the third.Thus the demands for more production are reflected in the urban node as well as in the countryside,and continued growth of the society, to meet the never-satisfied demands of an expanding éliteand its associates, leads to self-propelling urban growth.
(Johnston, 1980: 52)
The size of a society’s resource base, however, ultimately limited such developments. Thelogical response to this constraint was enlargement of the resource base through territorialexpansion, a process that tended to reinforce and extend the process of urbanization. All thesechanges involved the creation of city-based jobs. Additionally, whereas small-scale colonialexpansion could be organized from one center, expansion beyond the immediate reach of themain settlement (perhaps, a day or two of travel) required establishing secondary settlements.These nodes of the controlled territory acted as intermediate centers in the flow of demandsfrom élite to producers and of goods in return. As long as growth was a goal, therefore, theempire had to be continually enlarged with an increasing number of urban control centers.So the expansion of the Greek and Roman Empires laid the foundations of an urban systemin western Europe (see Figure 4.1).
Although this transition appears logical and orderly on paper, one should not misinterpretit as a picture of steady growth, expansion, and succession of ancient and classical empires.Urbanized economies were a precarious phenomenon, and many lapsed into ruralism beforebeing revived or recolonized. In a number of cases, this was a result of demographic setbacksassociated with war, epidemic, or natural phenomena such as floods or sustained droughts.Such setbacks left too few people to maintain the social and economic infrastructure necessaryfor urbanization.
An early example of this kind of relapse occurred in the Indus Valley where Aryanpastoralists displaced the urban economy in the middle of the second millennium BCE.Elsewhere, changes in resource/population ratios precipitated the breakdown and decay of urbaneconomies. The demands of repair and upkeep of irrigation systems, for example, coupledwith the demands of population growth, sometimes exceeded the available supply of peasantlabor. After a while, investments were neglected, armies grew small, and the strength andcohesion of the empire was fatally undermined.
This kind of sequence seems to have resulted in the eventual collapse of the MesopotamianEmpire and may also have contributed to the decay of much of the Mayan Empire more than
RISE OF THE CORE ECONOMIES98
6063 GEOGRAPHY WORLD ECON_PT_246x189 mm 22/01/2014 15:10 Page 98
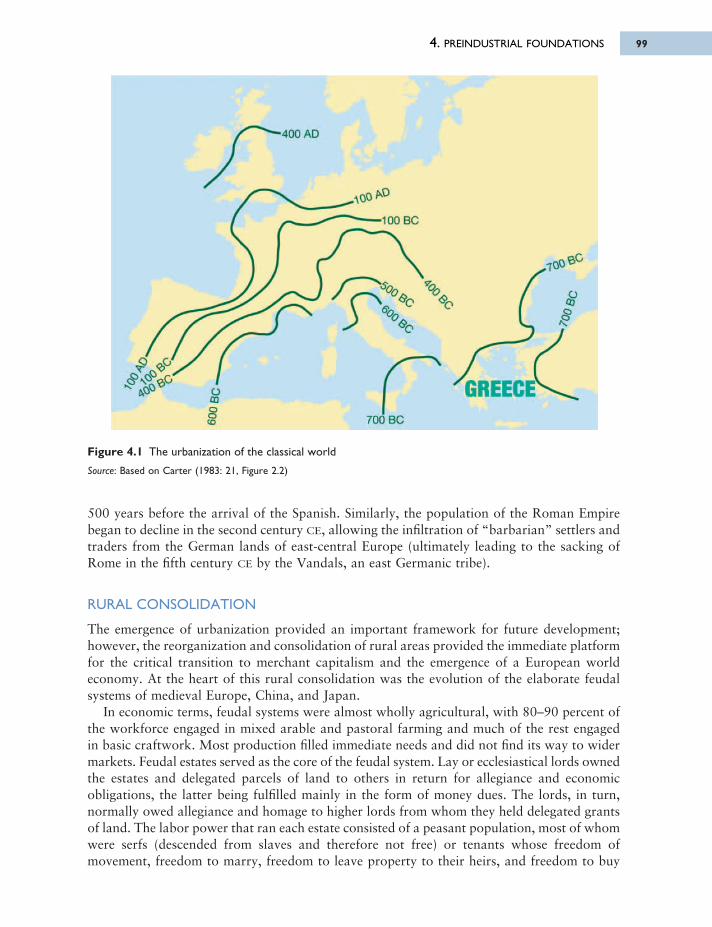
4. PREINDUSTRIAL FOUNDATIONS 99
500 years before the arrival of the Spanish. Similarly, the population of the Roman Empirebegan to decline in the second century CE, allowing the infiltration of “barbarian” settlers andtraders from the German lands of east-central Europe (ultimately leading to the sacking ofRome in the fifth century CE by the Vandals, an east Germanic tribe).
RURAL CONSOLIDATION
The emergence of urbanization provided an important framework for future development;however, the reorganization and consolidation of rural areas provided the immediate platformfor the critical transition to merchant capitalism and the emergence of a European worldeconomy. At the heart of this rural consolidation was the evolution of the elaborate feudalsystems of medieval Europe, China, and Japan.
In economic terms, feudal systems were almost wholly agricultural, with 80–90 percent ofthe workforce engaged in mixed arable and pastoral farming and much of the rest engagedin basic craftwork. Most production filled immediate needs and did not find its way to widermarkets. Feudal estates served as the core of the feudal system. Lay or ecclesiastical lords ownedthe estates and delegated parcels of land to others in return for allegiance and economicobligations, the latter being fulfilled mainly in the form of money dues. The lords, in turn,normally owed allegiance and homage to higher lords from whom they held delegated grantsof land. The labor power that ran each estate consisted of a peasant population, most of whomwere serfs (descended from slaves and therefore not free) or tenants whose freedom ofmovement, freedom to marry, freedom to leave property to their heirs, and freedom to buy
Figure 4.1 The urbanization of the classical world
Source: Based on Carter (1983: 21, Figure 2.2)
6063 GEOGRAPHY WORLD ECON_PT_246x189 mm 22/01/2014 15:10 Page 99
400 AD
ЛОО N D
'100 в с
%
<ь,
лос >ЄС
££
GREECE700 ВС
ошооCD
г е> 0 ,0
Ж Р
goods and sell their labor were closely circumscribed by public law. The peasantry was theessential element of the feudal economic system. Peasants provided the human capital (in theform of labor services) and monetary capital (for example, rents in kind, taxes, seigneurialdues, the issuance of money and payments for the use of essential services—milling, baking,olive pressing, and so on—monopolized by the lords) that enabled feudal lords to accumulatewealth.
By 1000 CE the countryside of most of Europe had been consolidated into a series of largely autonomous, feudal agricultural subsystems. Every estate was more or less self-sufficient in the raw materials for simple industrial products. Some of the members of everyrural household would be capable of specialized, nonagricultural, part-time activities such ascloth making or basketry; and nearly every community supported a range of specialist artisansand craft workers. In addition, most regions had the capacity to sustain at least some smalltowns whose existence hinged mainly on their role as ecclesiastical centers, defensivestrongholds, and administrative centers for the upper echelons of the feudal hierarchy.Improbably, this economic landscape—inflexible and introverted—nurtured the resurgence oftrade and the revival of cities and provided the preconditions for the rise of merchantcapitalism in Europe.
4.2 EMERGING IMPERATIVES OF ECONOMIC ORGANIZATIONBefore moving on to examine the transition to merchant capitalism and the emergence of theEuropean world-system, we pause briefly to review some of the organizing principles that seemto have been important in delineating the formative stages of preindustrial economic geography:
• Major changes in patterns of economic activity were gradual and incremental, even in hearthareas or core regions.
• Such changes generally preceded the development of critical innovations, particularly intechnology and economic organization.
• Such innovations were a necessary but not sufficient condition to bring about radical change;institutional and sociopolitical changes were also necessary in order to exploit them.
• Demographic factors were also critical. Insufficient absolute numbers of potential workerssometimes hindered economic development, while changes in the balance between apopulation and its local resource base could be important in precipitating either progressiveor regressive economic change.
• The law of diminishing returns provided an early impetus for territorial expansion.Colonization was pivotal in the development of hierarchical urban systems and improvedtransportation. It also stimulated the development of militarism, which induced importantchanges in spatial organization, for example, elevating the importance of defensive sites forkey settlements. Finally, the environmental and social constraints laid bare by the law ofdiminishing returns were responsible for the emergence of a new geopolitical element—thestate.
4.3 EMERGENCE OF THE EUROPEAN WORLD-SYSTEMIn this section, we consider the period that marked the first stirrings of the transition fromfeudalism to merchant capitalism in the thirteenth century through the creation of the Europeanworld-system in the sixteenth and seventeenth centuries. We also examine the proto-industrialization of the early eighteenth century, which served as the foundation for the
RISE OF THE CORE ECONOMIES100
6063 GEOGRAPHY WORLD ECON_PT_246x189 mm 22/01/2014 15:10 Page 100
Industrial Revolution. We will highlight the emergence, interaction, and spatial implicationsof the salient aspects of economic change. But, first, we must consider an obvious but oftenneglected question: Why Europe?
WHY EUROPE?
In the twelfth century, almost half a millennium before Europe embarked on the path ofcapitalist development that shaped, directly or indirectly, virtually the entire world economy,several well-developed “economic worlds” existed in the Eastern Hemisphere. One was theMediterranean region, whose principal elements included Byzantium, the Italian city-states,and Muslim North Africa. A second was the Chinese Empire. The central Asian land massfrom Russia to Mongolia was a third. The Indian Ocean/Red Sea complex was a fourth. Andthe Baltic area was on the verge of becoming a fifth.
Why did Europe become the locus of innovatory economic change? Perhaps moreimportantly, why not China? China had approximately the same total population as Europeand, until the fifteenth century, was at least as advanced in science and technology. Chineseironmasters had developed blast furnaces that enabled the casting of iron as early as 200 BCE.Iron plows were introduced in the sixth century, the compass in the tenth century, and thewater clock in the eleventh. The Chinese were also significantly more advanced than theEuropeans in medicine, papermaking, and printing, and the production of explosives. Theyalso retained an imperial system with centralized decision making, an extensive statebureaucracy, well-developed internal communications, and a unified financial system, elementsideally suited to economic development and territorial expansion.
China’s failure to take off must be attributed in part to its failure to pursue economicopportunities overseas. The Chinese had matched early European exploratory successes byspanning the Indian Ocean from Java to Africa in a series of lucrative and informative voyages;but they simply lacked a comparable interest in further exploration. One explanation for theabsence of this colonizing drive is that they saw their own “world” as the only one that mattered.Another is that they were distracted by the growing menace of Mongol nomad barbariansand Japanese pirates. A third explanation is that the centralized power structure of imperialChina did not contain enough different interest groups for whom overseas exploration wasan attractive proposition.
This last point is seen by some as a facet of a broader set of structural constraints associatedwith the imperial form. The administration and defense of a large population and land massperhaps drained the attention, energy, and wealth that might otherwise have been invested incapital development. The imperial system also meant that cultural and social élites tended tobe focused on the arts, humanities, and self-promotion vis-à-vis the imperial bureaucracy. Thecentralization of decision making, meanwhile, is seen as having been insensitive to theeconomic potential of China’s estimated 1,700 city-states and principalities. China’s imperialframework is also implicated in its failure to develop military technology (after having gaineda flying start) in the way that enabled Europeans to turn exploration into domination: Quitesimply, the Imperial court suppressed the spread of knowledge of gunnery because it fearedinternal bandits and domestic uprisings.
Agricultural production served as another important element guiding the trajectories of Chinaand Europe. European agriculture centered on the production of cattle and wheat. In contrast,rice production dominated Chinese agriculture. Because rice production requires relatively littleland, China had less need to seek territorial expansion. Conversely, Europe’s reliance on wheatand cattle provided a strong impetus for territorial expansion and exploration, while the more
4. PREINDUSTRIAL FOUNDATIONS 101
6063 GEOGRAPHY WORLD ECON_PT_246x189 mm 22/01/2014 15:10 Page 101
extensive use of animal power in Europe meant that “European man possessed in the fifteenthcentury a motor, more or less five times as powerful as that possessed by Chinese men” (Channu,1969: 336).
Finally, some writers have emphasized the lack of autonomy of oriental towns comparedto their European counterparts. As we will see, the legal and political autonomy of Europeantowns served as a crucial “pull” factor in attracting the rural migrants whose labor and initiativewere central to the emergence of merchant capitalism.
CRISIS OF FEUDALISM IN EUROPE
The transition from feudalism to merchant capitalism in Europe remains an issue ofconsiderable debate, largely because we do not know enough about the details or timing ofthe critical economic and social changes that took place between 1300 and 1450. As a result,a variety of theoretical interpretations have emerged, each emphasizing different elements inthe transition. In contrast, scholars generally agree that the overall context for the transitionwas a phase of economic, demographic, and political crisis brought about by the combinationof steady population growth, modest technological improvements, and limited amounts ofusable land.
As a result of improvements in plowing techniques, harnesses, and basic equipment in theearly feudal period, wheat yields rose significantly and led to a steady rise in population overthe twelfth and thirteenth centuries. In response, the feudal economy kept up by reclaimingrough pastureland and woodland. When this began to prove difficult (from around 1250), thepopulation responded by attempting to improve crop rotations and shortening the period theland was permitted to lay fallow. There were limits, however, to such adjustments (Figure 4.2illustrates the land intensity of a medieval manor in England). The number of cattle that couldbe kept, for example, was fixed by climatic constraints, which, in turn, limited the quantity ofavailable winter forage; and this, likewise, imposed a limit on the supply of fertilizer for farming.In the absence of further advances in agrarian technology, food shortages were an inevitableoutcome. In the wake of shortages, just as inevitably, came epidemics such as the Black Death(bubonic plague) in the 1340s, 1360s, and 1370s. These problems were compounded by climaticfluctuations: The cold winters and late springs of the fourteenth century aggravated the foodshortages, while some exceptionally hot summers helped to swell the population of the blackrat, host to the rat flea, the most significant vector of the bubonic plague.
Another aggravating factor was the beginning of the Hundred Years War in 1335–1345.The war necessitated a significant increase in taxes, which triggered a downward economicspiral fueled by falling rates of consumption, liquidity problems for noble treasuries, and ashortage of goods, which led to a spike in prices. The shortfall in funds necessitated additionaltax increases and provoked a political climate of endemic discontent. The combined result ofthese pressures was “not only to exhaust the goose that laid the golden eggs for the castle,but to provoke, from sheer desperation, a movement of illegal emigration from the manor”(Dobb, 1963: 21).
The destination of these fugitives was the town, where different laws and tax systemsprevailed. The late medieval European town (Cipolla, 1981: 146):
[W]as the “frontier,” a new and dynamic world where people felt they could break their ties withan unpleasant past, where people hoped they would find opportunities for economic and socialsuccess, where sclerotic traditional institutions and discriminations no longer counted, and wherethere would be ample reward for initiative, daring and industriousness.
RISE OF THE CORE ECONOMIES102
6063 GEOGRAPHY WORLD ECON_PT_246x189 mm 22/01/2014 15:10 Page 102
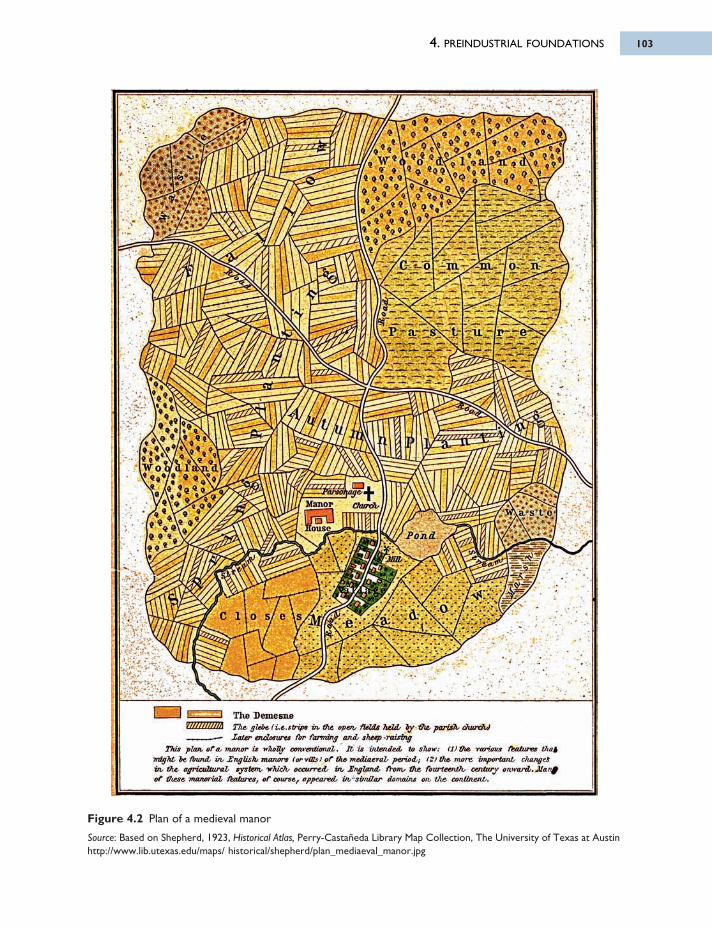
4. PREINDUSTRIAL FOUNDATIONS 103
Figure 4.2 Plan of a medieval manor
Source: Based on Shepherd, 1923, Historical Atlas, Perry-Castañeda Library Map Collection, The University of Texas at Austinhttp://www.lib.utexas.edu/maps/ historical/shepherd/plan_mediaeval_manor.jpg
6063 GEOGRAPHY WORLD ECON_PT_246x189 mm 22/01/2014 15:10 Page 103
C 1 I o s / c \ s β : ' do
Р о п і
Ш ж к а д е , .Малої С/шгАгі
1’ a s t и і · <·
WV XА Л О Г і г а а (
о ; о 9 г ' I V
чI \
« « п у л у ;W o V c L l r i i i d l
The Demesne77*£ glebt, fist.stripe in, the, open, fields held/ by the parish churchy) Later enclosures fo r farming andb sheep -raising
This plan, o f a, manor is wholly conventional. I t is intended/ to show: (1) the, various features tha$ might· be found- in, Snglish/ manors (o r vHb > o f the mediaeval period ; <2) the, more im portant changes in the· agricu ltural system, -which, occurred in. In g la n d front, the. fourteenth, century on.vrai'd. Мапф o f these manorial features, o f courser appeaitd in,~sbnilar domains on the, continent.
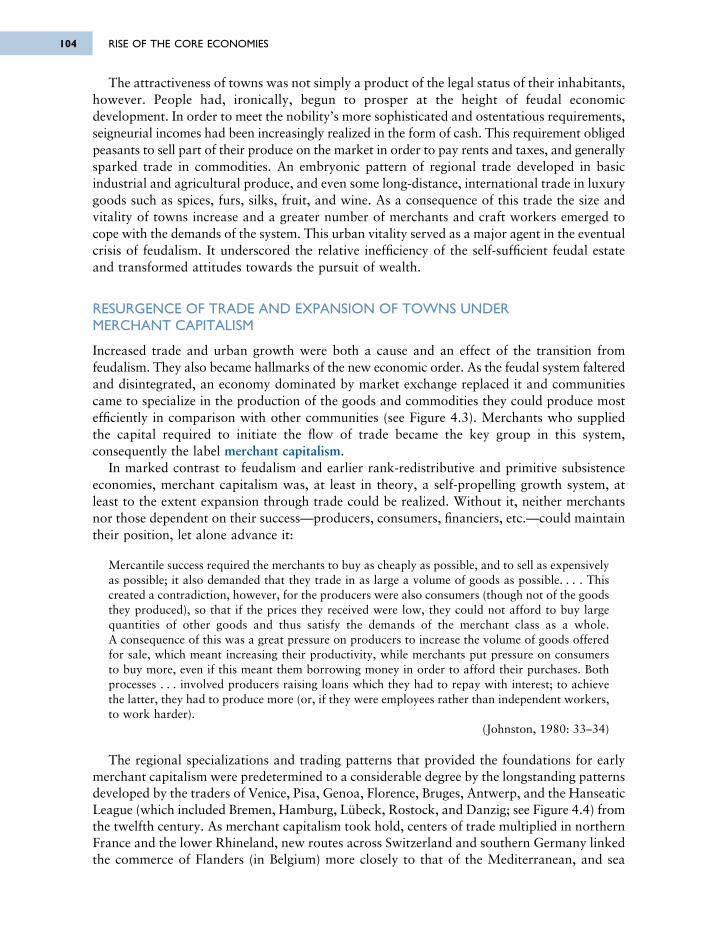
The attractiveness of towns was not simply a product of the legal status of their inhabitants,however. People had, ironically, begun to prosper at the height of feudal economicdevelopment. In order to meet the nobility’s more sophisticated and ostentatious requirements,seigneurial incomes had been increasingly realized in the form of cash. This requirement obligedpeasants to sell part of their produce on the market in order to pay rents and taxes, and generallysparked trade in commodities. An embryonic pattern of regional trade developed in basicindustrial and agricultural produce, and even some long-distance, international trade in luxurygoods such as spices, furs, silks, fruit, and wine. As a consequence of this trade the size andvitality of towns increase and a greater number of merchants and craft workers emerged tocope with the demands of the system. This urban vitality served as a major agent in the eventualcrisis of feudalism. It underscored the relative inefficiency of the self-sufficient feudal estateand transformed attitudes towards the pursuit of wealth.
RESURGENCE OF TRADE AND EXPANSION OF TOWNS UNDER MERCHANT CAPITALISM
Increased trade and urban growth were both a cause and an effect of the transition fromfeudalism. They also became hallmarks of the new economic order. As the feudal system falteredand disintegrated, an economy dominated by market exchange replaced it and communitiescame to specialize in the production of the goods and commodities they could produce mostefficiently in comparison with other communities (see Figure 4.3). Merchants who suppliedthe capital required to initiate the flow of trade became the key group in this system,consequently the label merchant capitalism.
In marked contrast to feudalism and earlier rank-redistributive and primitive subsistenceeconomies, merchant capitalism was, at least in theory, a self-propelling growth system, atleast to the extent expansion through trade could be realized. Without it, neither merchantsnor those dependent on their success—producers, consumers, financiers, etc.—could maintaintheir position, let alone advance it:
Mercantile success required the merchants to buy as cheaply as possible, and to sell as expensivelyas possible; it also demanded that they trade in as large a volume of goods as possible. . . . Thiscreated a contradiction, however, for the producers were also consumers (though not of the goodsthey produced), so that if the prices they received were low, they could not afford to buy largequantities of other goods and thus satisfy the demands of the merchant class as a whole. A consequence of this was a great pressure on producers to increase the volume of goods offeredfor sale, which meant increasing their productivity, while merchants put pressure on consumersto buy more, even if this meant them borrowing money in order to afford their purchases. Bothprocesses . . . involved producers raising loans which they had to repay with interest; to achievethe latter, they had to produce more (or, if they were employees rather than independent workers,to work harder).
(Johnston, 1980: 33–34)
The regional specializations and trading patterns that provided the foundations for earlymerchant capitalism were predetermined to a considerable degree by the longstanding patternsdeveloped by the traders of Venice, Pisa, Genoa, Florence, Bruges, Antwerp, and the HanseaticLeague (which included Bremen, Hamburg, Lübeck, Rostock, and Danzig; see Figure 4.4) fromthe twelfth century. As merchant capitalism took hold, centers of trade multiplied in northernFrance and the lower Rhineland, new routes across Switzerland and southern Germany linkedthe commerce of Flanders (in Belgium) more closely to that of the Mediterranean, and sea
RISE OF THE CORE ECONOMIES104
6063 GEOGRAPHY WORLD ECON_PT_246x189 mm 22/01/2014 15:10 Page 104
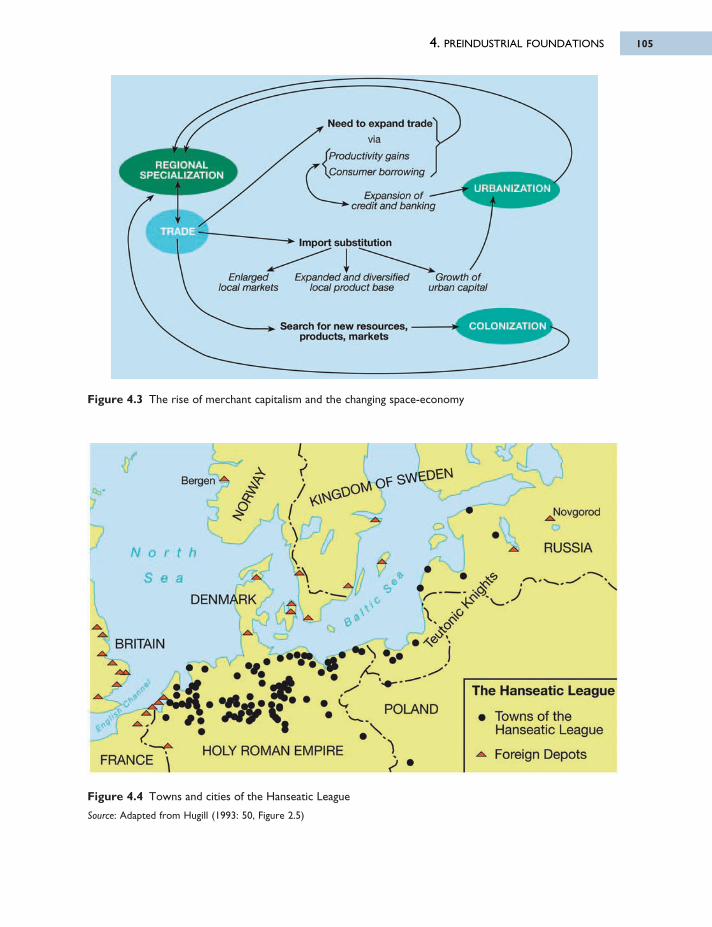
4. PREINDUSTRIAL FOUNDATIONS 105
Figure 4.3 The rise of merchant capitalism and the changing space-economy
Figure 4.4 Towns and cities of the Hanseatic League
Source: Adapted from Hugill (1993: 50, Figure 2.5)
6063 GEOGRAPHY WORLD ECON_PT_246x189 mm 22/01/2014 15:10 Page 105
Need to expand trade4
via
\ Productivity gains
\C o n s u m e r borrowing
Expansion o f —
• credit a nd banking
URBANIZATION
REGIONALSPECIALIZATION
TRADEIm port substitution
Enlarged local m arkets
Expanded a nd diversified local p rod uct base
Grow th o f urban capital
71>νΛ ιΓ ·]ί Д.. Search for new resources, - products, m arkets
Bergen
N o r t h
S e a
DENMARK
BRITAIN
f6 0 ° '
к л О ЇD iD E N
Novgorod
RUSSIA
POLANDThe Hanseatic League
Towns of the Hanseatic League
Foreign DepotHOLY ROMAN EMPIREFRANCE
lanes—across the English Channel, North Sea, and Baltic Sea—began to integrate the econ -omies of Britain, Scandinavia, and the Hansa territories with those of the continental core.Very quickly, a trading system of immense complexity came to span Europe, from Portugalto Poland and from Sweden to Sicily. This trading system was based not on the luxury goodsof earlier trade routes but on bulky staples such as grains, wine, salt, wool, cloth, and metals.
The increased volume of trade fostered a great deal of urban development as merchantsbegan to settle at locations that were of particular significance in relation to major trade routes,and as local economies came to focus on market exchange. But, once the dynamics of tradehad been initiated, the key to urban growth was a process of import substitution, wherebyexternally produced goods and services are replaced with locally produced ones. In this way,local economies reinvest their income within their boundaries, which leads to a partialrestoration of self-sufficiency and economic autarky. Although some things proved difficultto copy because of the constraints of climate or basic resource endowment, many importedmanufactures could be copied by local producers, which increased local employmentopportunities, intensifying the use of local resources, and increasing the amount of localinvestment capital available. As Jane Jacobs argued, cities that replaced imports could thenafford new types of goods being produced in other cities. The newly imported innovations,in their turn, might also be replaced with local production, opening up the market for stillmore innovations from elsewhere. So the cities of Europe:
[W]ere forever generating new exports for one another—bells, dyes, buckles, parchment, lace,carding combs, needles, painted cabinet work, ceramics, brushes, cutlery, paper, sieves, riddles,sweetmeats, elixirs, files, pitchforks, sextants—and then replacing them with local production, to become customers for still more innovations. They were developing on one another’s shoulder.
(Jacobs, 1984: 50)
As a result, patterns of trade and urban growth were very volatile; and long-term localsuccess within the new economic order became increasingly dependent on:
• sustained improvisation and innovation• repeated episodes of import substitution• the discovery and control of additional resources and new kinds of resource.
CONSOLIDATION AND EXPANSION
In the fifteenth and sixteenth centuries, a series of innovations in business and technologycontributed to the consolidation of merchant capitalism. These included innovations in theorganization of business and finance: banking, loan systems, credit transfers, company partner -ships, shares in stock, speculation in commodity futures, commercial insurance, courier/newsservices, and so on. The importance of these innovations lay not only in the way they oiledthe wheels of industry, agriculture, and commerce, but also in the way they encouraged savingsand facilitated their use for investment. Furthermore, the routinization of complex commercialand financial activity brought with it the codification of civil and criminal legislation relatingto property rights (for example, patent laws); a development seen by some as being of criticalimportance because it provided an incentive for a sufficient number of innovators andentrepreneurs to channel their efforts into the embryonic capitalist economy.
Meanwhile, technological innovations succeeded each other at an accelerated rate. Someof these were adaptations and improvements of oriental discoveries—the windmill, spinning
RISE OF THE CORE ECONOMIES106
6063 GEOGRAPHY WORLD ECON_PT_246x189 mm 22/01/2014 15:10 Page 106
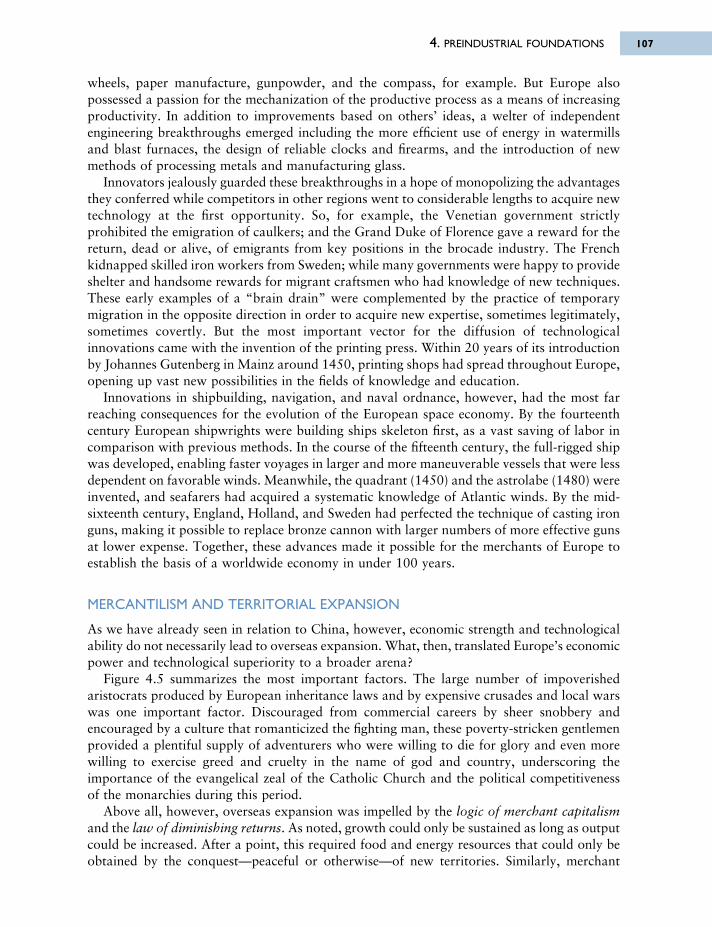
wheels, paper manufacture, gunpowder, and the compass, for example. But Europe alsopossessed a passion for the mechanization of the productive process as a means of increasingproductivity. In addition to improvements based on others’ ideas, a welter of independentengineering breakthroughs emerged including the more efficient use of energy in watermillsand blast furnaces, the design of reliable clocks and firearms, and the introduction of newmethods of processing metals and manufacturing glass.
Innovators jealously guarded these breakthroughs in a hope of monopolizing the advantagesthey conferred while competitors in other regions went to considerable lengths to acquire newtechnology at the first opportunity. So, for example, the Venetian government strictlyprohibited the emigration of caulkers; and the Grand Duke of Florence gave a reward for thereturn, dead or alive, of emigrants from key positions in the brocade industry. The Frenchkidnapped skilled iron workers from Sweden; while many governments were happy to provideshelter and handsome rewards for migrant craftsmen who had knowledge of new techniques.These early examples of a “brain drain” were complemented by the practice of temporarymigration in the opposite direction in order to acquire new expertise, sometimes legitimately,sometimes covertly. But the most important vector for the diffusion of technologicalinnovations came with the invention of the printing press. Within 20 years of its introductionby Johannes Gutenberg in Mainz around 1450, printing shops had spread throughout Europe,opening up vast new possibilities in the fields of knowledge and education.
Innovations in shipbuilding, navigation, and naval ordnance, however, had the most farreaching consequences for the evolution of the European space economy. By the fourteenthcentury European shipwrights were building ships skeleton first, as a vast saving of labor incomparison with previous methods. In the course of the fifteenth century, the full-rigged shipwas developed, enabling faster voyages in larger and more maneuverable vessels that were lessdependent on favorable winds. Meanwhile, the quadrant (1450) and the astrolabe (1480) wereinvented, and seafarers had acquired a systematic knowledge of Atlantic winds. By the mid-sixteenth century, England, Holland, and Sweden had perfected the technique of casting ironguns, making it possible to replace bronze cannon with larger numbers of more effective gunsat lower expense. Together, these advances made it possible for the merchants of Europe toestablish the basis of a worldwide economy in under 100 years.
MERCANTILISM AND TERRITORIAL EXPANSION
As we have already seen in relation to China, however, economic strength and technologicalability do not necessarily lead to overseas expansion. What, then, translated Europe’s economicpower and technological superiority to a broader arena?
Figure 4.5 summarizes the most important factors. The large number of impoverishedaristocrats produced by European inheritance laws and by expensive crusades and local warswas one important factor. Discouraged from commercial careers by sheer snobbery andencouraged by a culture that romanticized the fighting man, these poverty-stricken gentlemenprovided a plentiful supply of adventurers who were willing to die for glory and even morewilling to exercise greed and cruelty in the name of god and country, underscoring theimportance of the evangelical zeal of the Catholic Church and the political competitivenessof the monarchies during this period.
Above all, however, overseas expansion was impelled by the logic of merchant capitalismand the law of diminishing returns. As noted, growth could only be sustained as long as outputcould be increased. After a point, this required food and energy resources that could only beobtained by the conquest—peaceful or otherwise—of new territories. Similarly, merchant
4. PREINDUSTRIAL FOUNDATIONS 107
6063 GEOGRAPHY WORLD ECON_PT_246x189 mm 22/01/2014 15:10 Page 107
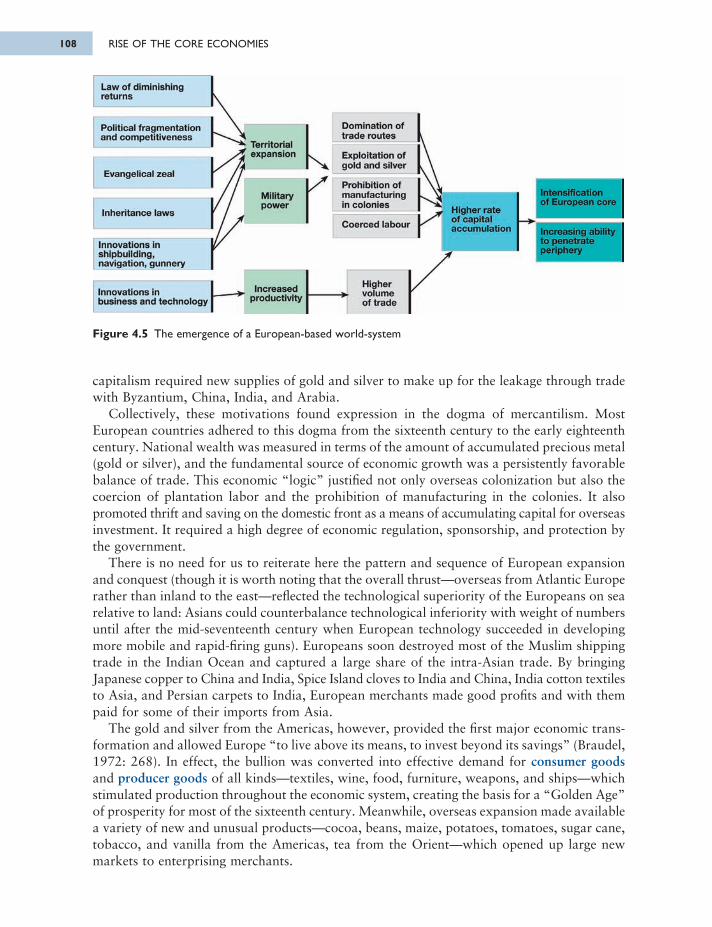
capitalism required new supplies of gold and silver to make up for the leakage through tradewith Byzantium, China, India, and Arabia.
Collectively, these motivations found expression in the dogma of mercantilism. MostEuropean countries adhered to this dogma from the sixteenth century to the early eighteenthcentury. National wealth was measured in terms of the amount of accumulated precious metal(gold or silver), and the fundamental source of economic growth was a persistently favorablebalance of trade. This economic “logic” justified not only overseas colonization but also thecoercion of plantation labor and the prohibition of manufacturing in the colonies. It alsopromoted thrift and saving on the domestic front as a means of accumulating capital for overseasinvestment. It required a high degree of economic regulation, sponsorship, and protection bythe government.
There is no need for us to reiterate here the pattern and sequence of European expansionand conquest (though it is worth noting that the overall thrust—overseas from Atlantic Europerather than inland to the east—reflected the technological superiority of the Europeans on searelative to land: Asians could counterbalance technological inferiority with weight of numbersuntil after the mid-seventeenth century when European technology succeeded in developingmore mobile and rapid-firing guns). Europeans soon destroyed most of the Muslim shippingtrade in the Indian Ocean and captured a large share of the intra-Asian trade. By bringingJapanese copper to China and India, Spice Island cloves to India and China, India cotton textilesto Asia, and Persian carpets to India, European merchants made good profits and with thempaid for some of their imports from Asia.
The gold and silver from the Americas, however, provided the first major economic trans-formation and allowed Europe “to live above its means, to invest beyond its savings” (Braudel,1972: 268). In effect, the bullion was converted into effective demand for consumer goodsand producer goods of all kinds—textiles, wine, food, furniture, weapons, and ships—whichstimulated production throughout the economic system, creating the basis for a “Golden Age”of prosperity for most of the sixteenth century. Meanwhile, overseas expansion made availablea variety of new and unusual products—cocoa, beans, maize, potatoes, tomatoes, sugar cane,tobacco, and vanilla from the Americas, tea from the Orient—which opened up large newmarkets to enterprising merchants.
Figure 4.5 The emergence of a European-based world-system
RISE OF THE CORE ECONOMIES108
6063 GEOGRAPHY WORLD ECON_PT_246x189 mm 22/01/2014 15:10 Page 108
Law of diminishing returns
Political fragmentation and competitiveness
Evangelical zeal
Inheritance laws
Innovations in shipbuilding, navigation, gunnery
Innovations in business and technology
• Territorial t expansion
Militarypower
Increasedproductivity
Domination of trade routes
Exploitation of gold and silver
Prohibition of manufacturing in colonies
Coerced labour
Higher volume of trade
. Higher rate of capital I accumulation I
Intensification of European core
Increasing ability to penetrate periphery
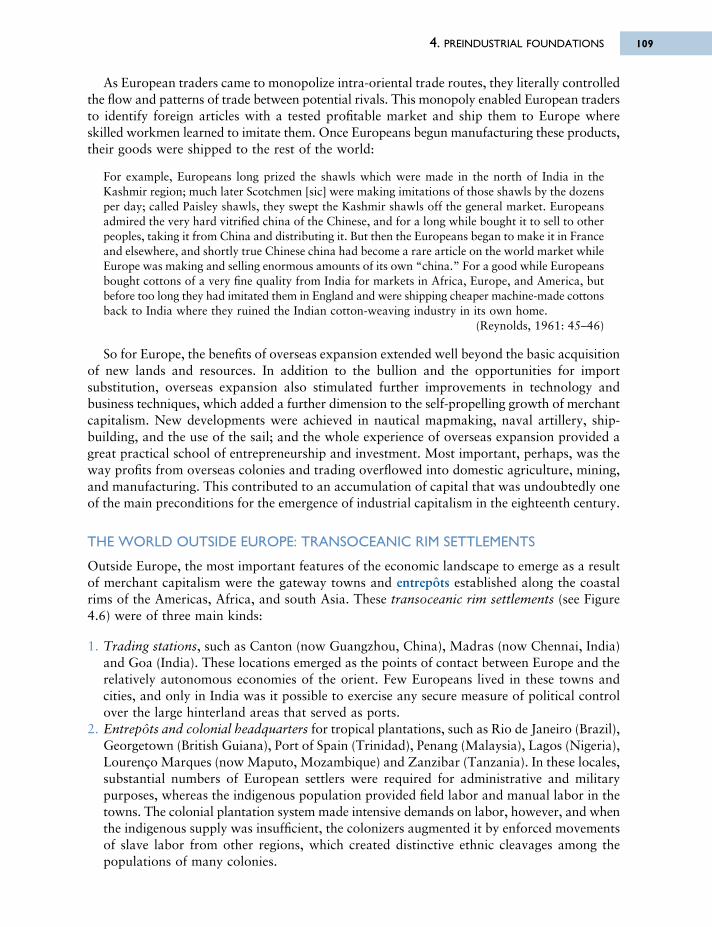
As European traders came to monopolize intra-oriental trade routes, they literally controlledthe flow and patterns of trade between potential rivals. This monopoly enabled European tradersto identify foreign articles with a tested profitable market and ship them to Europe whereskilled workmen learned to imitate them. Once Europeans begun manufacturing these products,their goods were shipped to the rest of the world:
For example, Europeans long prized the shawls which were made in the north of India in theKashmir region; much later Scotchmen [sic] were making imitations of those shawls by the dozensper day; called Paisley shawls, they swept the Kashmir shawls off the general market. Europeansadmired the very hard vitrified china of the Chinese, and for a long while bought it to sell to otherpeoples, taking it from China and distributing it. But then the Europeans began to make it in Franceand elsewhere, and shortly true Chinese china had become a rare article on the world market whileEurope was making and selling enormous amounts of its own “china.” For a good while Europeansbought cottons of a very fine quality from India for markets in Africa, Europe, and America, butbefore too long they had imitated them in England and were shipping cheaper machine-made cottonsback to India where they ruined the Indian cotton-weaving industry in its own home.
(Reynolds, 1961: 45–46)
So for Europe, the benefits of overseas expansion extended well beyond the basic acquisitionof new lands and resources. In addition to the bullion and the opportunities for importsubstitution, overseas expansion also stimulated further improvements in technology andbusiness techniques, which added a further dimension to the self-propelling growth of merchantcapitalism. New developments were achieved in nautical mapmaking, naval artillery, ship-building, and the use of the sail; and the whole experience of overseas expansion provided agreat practical school of entrepreneurship and investment. Most important, perhaps, was theway profits from overseas colonies and trading overflowed into domestic agriculture, mining,and manufacturing. This contributed to an accumulation of capital that was undoubtedly oneof the main preconditions for the emergence of industrial capitalism in the eighteenth century.
THE WORLD OUTSIDE EUROPE: TRANSOCEANIC RIM SETTLEMENTS
Outside Europe, the most important features of the economic landscape to emerge as a resultof merchant capitalism were the gateway towns and entrepôts established along the coastalrims of the Americas, Africa, and south Asia. These transoceanic rim settlements (see Figure4.6) were of three main kinds:
1. Trading stations, such as Canton (now Guangzhou, China), Madras (now Chennai, India)and Goa (India). These locations emerged as the points of contact between Europe and therelatively autonomous economies of the orient. Few Europeans lived in these towns andcities, and only in India was it possible to exercise any secure measure of political controlover the large hinterland areas that served as ports.
2. Entrepôts and colonial headquarters for tropical plantations, such as Rio de Janeiro (Brazil),Georgetown (British Guiana), Port of Spain (Trinidad), Penang (Malaysia), Lagos (Nigeria),Lourenço Marques (now Maputo, Mozambique) and Zanzibar (Tanzania). In these locales,substantial numbers of European settlers were required for administrative and militarypurposes, whereas the indigenous population provided field labor and manual labor in thetowns. The colonial plantation system made intensive demands on labor, however, and whenthe indigenous supply was insufficient, the colonizers augmented it by enforced movementsof slave labor from other regions, which created distinctive ethnic cleavages among thepopulations of many colonies.
4. PREINDUSTRIAL FOUNDATIONS 109
6063 GEOGRAPHY WORLD ECON_PT_246x189 mm 22/01/2014 15:10 Page 109
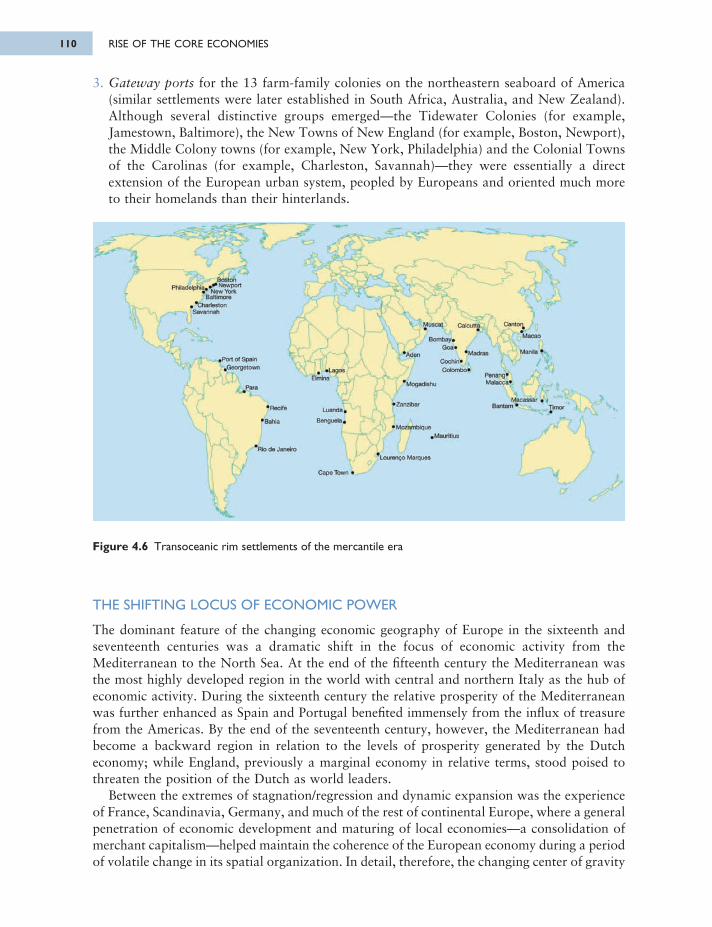
3. Gateway ports for the 13 farm-family colonies on the northeastern seaboard of America(similar settlements were later established in South Africa, Australia, and New Zealand).Although several distinctive groups emerged—the Tidewater Colonies (for example,Jamestown, Baltimore), the New Towns of New England (for example, Boston, Newport),the Middle Colony towns (for example, New York, Philadelphia) and the Colonial Townsof the Carolinas (for example, Charleston, Savannah)—they were essentially a directextension of the European urban system, peopled by Europeans and oriented much moreto their homelands than their hinterlands.
Figure 4.6 Transoceanic rim settlements of the mercantile era
THE SHIFTING LOCUS OF ECONOMIC POWER
The dominant feature of the changing economic geography of Europe in the sixteenth andseventeenth centuries was a dramatic shift in the focus of economic activity from theMediterranean to the North Sea. At the end of the fifteenth century the Mediterranean wasthe most highly developed region in the world with central and northern Italy as the hub ofeconomic activity. During the sixteenth century the relative prosperity of the Mediterraneanwas further enhanced as Spain and Portugal benefited immensely from the influx of treasurefrom the Americas. By the end of the seventeenth century, however, the Mediterranean hadbecome a backward region in relation to the levels of prosperity generated by the Dutcheconomy; while England, previously a marginal economy in relative terms, stood poised tothreaten the position of the Dutch as world leaders.
Between the extremes of stagnation/regression and dynamic expansion was the experienceof France, Scandinavia, Germany, and much of the rest of continental Europe, where a generalpenetration of economic development and maturing of local economies—a consolidation ofmerchant capitalism—helped maintain the coherence of the European economy during a periodof volatile change in its spatial organization. In detail, therefore, the changing center of gravity
RISE OF THE CORE ECONOMIES110
6063 GEOGRAPHY WORLD ECON_PT_246x189 mm 22/01/2014 15:10 Page 110
PhiladelphiaBoston
^Newpor *rw Yor*• New Yor
Batumore
Savannah
«Port of Spain ^Georgetown
(Para
»LaoosElm ini
•RecA
•Bahia
Luanda»
Bengueta*
*Rk> de Janeiro
Cape Town e
"ΐΛυΓβηςο Marques
e Mauritius• Mozambique
• Zannbar
* Mogadishu
•Aden
Muscat Calcuttj Canton
Macao
M an ia '
Bombay·Goa·
'MadrasCochin·Colombo·
Penang·Malacca·
Bantam ·Macassar ·
Tenor
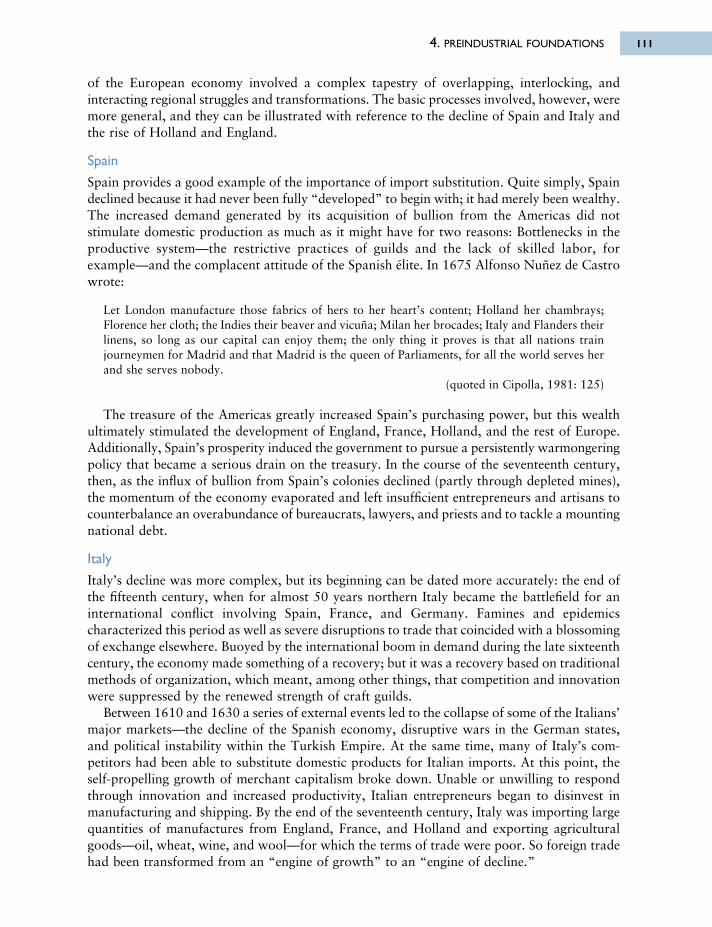
of the European economy involved a complex tapestry of overlapping, interlocking, andinteracting regional struggles and transformations. The basic processes involved, however, weremore general, and they can be illustrated with reference to the decline of Spain and Italy andthe rise of Holland and England.
Spain
Spain provides a good example of the importance of import substitution. Quite simply, Spaindeclined because it had never been fully “developed” to begin with; it had merely been wealthy.The increased demand generated by its acquisition of bullion from the Americas did notstimulate domestic production as much as it might have for two reasons: Bottlenecks in theproductive system—the restrictive practices of guilds and the lack of skilled labor, forexample—and the complacent attitude of the Spanish élite. In 1675 Alfonso Nuñez de Castrowrote:
Let London manufacture those fabrics of hers to her heart’s content; Holland her chambrays;Florence her cloth; the Indies their beaver and vicuña; Milan her brocades; Italy and Flanders theirlinens, so long as our capital can enjoy them; the only thing it proves is that all nations trainjourneymen for Madrid and that Madrid is the queen of Parliaments, for all the world serves herand she serves nobody.
(quoted in Cipolla, 1981: 125)
The treasure of the Americas greatly increased Spain’s purchasing power, but this wealthultimately stimulated the development of England, France, Holland, and the rest of Europe.Additionally, Spain’s prosperity induced the government to pursue a persistently warmongeringpolicy that became a serious drain on the treasury. In the course of the seventeenth century,then, as the influx of bullion from Spain’s colonies declined (partly through depleted mines),the momentum of the economy evaporated and left insufficient entrepreneurs and artisans tocounterbalance an overabundance of bureaucrats, lawyers, and priests and to tackle a mountingnational debt.
Italy
Italy’s decline was more complex, but its beginning can be dated more accurately: the end ofthe fifteenth century, when for almost 50 years northern Italy became the battlefield for aninternational conflict involving Spain, France, and Germany. Famines and epidemicscharacterized this period as well as severe disruptions to trade that coincided with a blossomingof exchange elsewhere. Buoyed by the international boom in demand during the late sixteenthcentury, the economy made something of a recovery; but it was a recovery based on traditionalmethods of organization, which meant, among other things, that competition and innovationwere suppressed by the renewed strength of craft guilds.
Between 1610 and 1630 a series of external events led to the collapse of some of the Italians’major markets—the decline of the Spanish economy, disruptive wars in the German states,and political instability within the Turkish Empire. At the same time, many of Italy’s com -petitors had been able to substitute domestic products for Italian imports. At this point, theself-propelling growth of merchant capitalism broke down. Unable or unwilling to respondthrough innovation and increased productivity, Italian entrepreneurs began to disinvest inmanufacturing and shipping. By the end of the seventeenth century, Italy was importing largequantities of manufactures from England, France, and Holland and exporting agriculturalgoods—oil, wheat, wine, and wool—for which the terms of trade were poor. So foreign tradehad been transformed from an “engine of growth” to an “engine of decline.”
4. PREINDUSTRIAL FOUNDATIONS 111
6063 GEOGRAPHY WORLD ECON_PT_246x189 mm 22/01/2014 15:10 Page 111
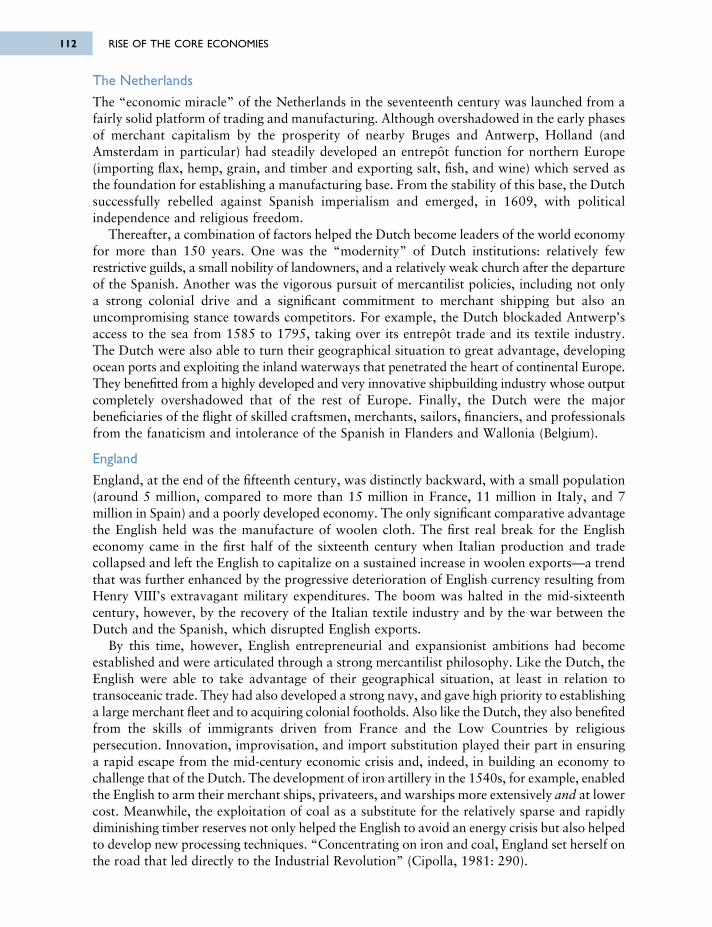
The Netherlands
The “economic miracle” of the Netherlands in the seventeenth century was launched from afairly solid platform of trading and manufacturing. Although overshadowed in the early phasesof merchant capitalism by the prosperity of nearby Bruges and Antwerp, Holland (andAmsterdam in particular) had steadily developed an entrepôt function for northern Europe(importing flax, hemp, grain, and timber and exporting salt, fish, and wine) which served asthe foundation for establishing a manufacturing base. From the stability of this base, the Dutchsuccessfully rebelled against Spanish imperialism and emerged, in 1609, with politicalindependence and religious freedom.
Thereafter, a combination of factors helped the Dutch become leaders of the world economyfor more than 150 years. One was the “modernity” of Dutch institutions: relatively fewrestrictive guilds, a small nobility of landowners, and a relatively weak church after the departureof the Spanish. Another was the vigorous pursuit of mercantilist policies, including not onlya strong colonial drive and a significant commitment to merchant shipping but also anuncompromising stance towards competitors. For example, the Dutch blockaded Antwerp’saccess to the sea from 1585 to 1795, taking over its entrepôt trade and its textile industry.The Dutch were also able to turn their geographical situation to great advantage, developingocean ports and exploiting the inland waterways that penetrated the heart of continental Europe.They benefitted from a highly developed and very innovative shipbuilding industry whose outputcompletely overshadowed that of the rest of Europe. Finally, the Dutch were the majorbeneficiaries of the flight of skilled craftsmen, merchants, sailors, financiers, and professionalsfrom the fanaticism and intolerance of the Spanish in Flanders and Wallonia (Belgium).
EnglandEngland, at the end of the fifteenth century, was distinctly backward, with a small population(around 5 million, compared to more than 15 million in France, 11 million in Italy, and 7million in Spain) and a poorly developed economy. The only significant comparative advantagethe English held was the manufacture of woolen cloth. The first real break for the Englisheconomy came in the first half of the sixteenth century when Italian production and tradecollapsed and left the English to capitalize on a sustained increase in woolen exports—a trendthat was further enhanced by the progressive deterioration of English currency resulting fromHenry VIII’s extravagant military expenditures. The boom was halted in the mid-sixteenthcentury, however, by the recovery of the Italian textile industry and by the war between theDutch and the Spanish, which disrupted English exports.
By this time, however, English entrepreneurial and expansionist ambitions had becomeestablished and were articulated through a strong mercantilist philosophy. Like the Dutch, theEnglish were able to take advantage of their geographical situation, at least in relation totransoceanic trade. They had also developed a strong navy, and gave high priority to establishinga large merchant fleet and to acquiring colonial footholds. Also like the Dutch, they also benefitedfrom the skills of immigrants driven from France and the Low Countries by religiouspersecution. Innovation, improvisation, and import substitution played their part in ensuringa rapid escape from the mid-century economic crisis and, indeed, in building an economy tochallenge that of the Dutch. The development of iron artillery in the 1540s, for example, enabledthe English to arm their merchant ships, privateers, and warships more extensively and at lowercost. Meanwhile, the exploitation of coal as a substitute for the relatively sparse and rapidlydiminishing timber reserves not only helped the English to avoid an energy crisis but also helpedto develop new processing techniques. “Concentrating on iron and coal, England set herself onthe road that led directly to the Industrial Revolution” (Cipolla, 1981: 290).
RISE OF THE CORE ECONOMIES112
6063 GEOGRAPHY WORLD ECON_PT_246x189 mm 22/01/2014 15:10 Page 112
SUMMARYSeveral organizing principles can be delineated to describe the evolving space economy up tothe eve of the Industrial Revolution. First, note that the emerging imperatives of early economicsystems described in this chapter appear as recurring elements in subsequent economic epochs,confirming the gradual and incremental nature of major economic change.
We can also confirm the continuing importance of innovations in technology and businessorganization; although we should note that the innovative process to this point occurred insmall steps by way of the gradual accumulation of improvements rather than by distinct bursts of invention which, as we will see, have characterized economic change since the industrialera.
The importance of institutional and sociopolitical factors was also a recurring theme (as,for example, in the constraints of a centralized imperial system on the evolution of the Chineseeconomy, in the stimulus provided by European laws on property rights, and the role ofEuropean governments in implementing mercantilist policies). Similarly, we must acknowledgethe continued interaction between demographic change and economic development and,finally, the ongoing impetus for territorial expansion as a product of the law of diminishingreturns and, of course, the ego aggrandizement of rulers. In addition, however, we can identifyseveral new dimensions of spatial-economic organization:
• The emergence of a true world economy involving long-distance interaction based on asophisticated spatial division of labor.
• The progressive elaboration of the world economy in space and across commodities wasuneven. Some sectors, countries, and regions expanded more quickly than others, and somespheres of opportunity and lines of communication were penetrated more quickly than others,so that its early spread was in a selective, spatially discontinuous fashion.
• The pattern of specialization and the nature of economic interaction within the worldeconomy resulted in the emergence of core areas, characterized by such mass-marketindustries as had emerged (for example, textiles, shipbuilding), international and localcommerce in the hands of an indigenous bourgeoisie, and relatively advanced forms of agri-culture; peripheral areas, characterized by the monoculture of cash crops by coerced laboron large estates or plantations; and semi-peripheral areas, characterized by a process ofdeindustrialization but retaining a significant share of specialized industrial production andfinancial control.
• The spatial organization of the European space economy was based around a cluster ofcore areas in northwestern Europe: southeastern England and Holland together with theBaltic states, the Rhine and Elbe regions of Germany, Flanders (Belgium), and northernFrance. Peripheral regions included northern Scandinavia, Britain’s Celtic fringe (Scotland,Wales and Ireland), east-central Europe, and all of the transoceanic rim settlements andcolonies. The semi-periphery consisted of the Christian Mediterranean region, which hadbeen the advanced core area at the beginning of the merchant capitalist era.
• The articulation of the European world economy also produced a distinctive pattern ofsettlement and urbanization. Merchant capitalism was reflected in the urban landscape bya strengthening of the hierarchical system of settlements and the development of a centralplace system. The overseas territorial expansion associated with merchant capitalism wasalso reflected in a distinctive urban landscape, as illustrated in Figure 4.7. Johnston (1980:74) once again provides a succinct description:
4. PREINDUSTRIAL FOUNDATIONS 113
6063 GEOGRAPHY WORLD ECON_PT_246x189 mm 22/01/2014 15:10 Page 113
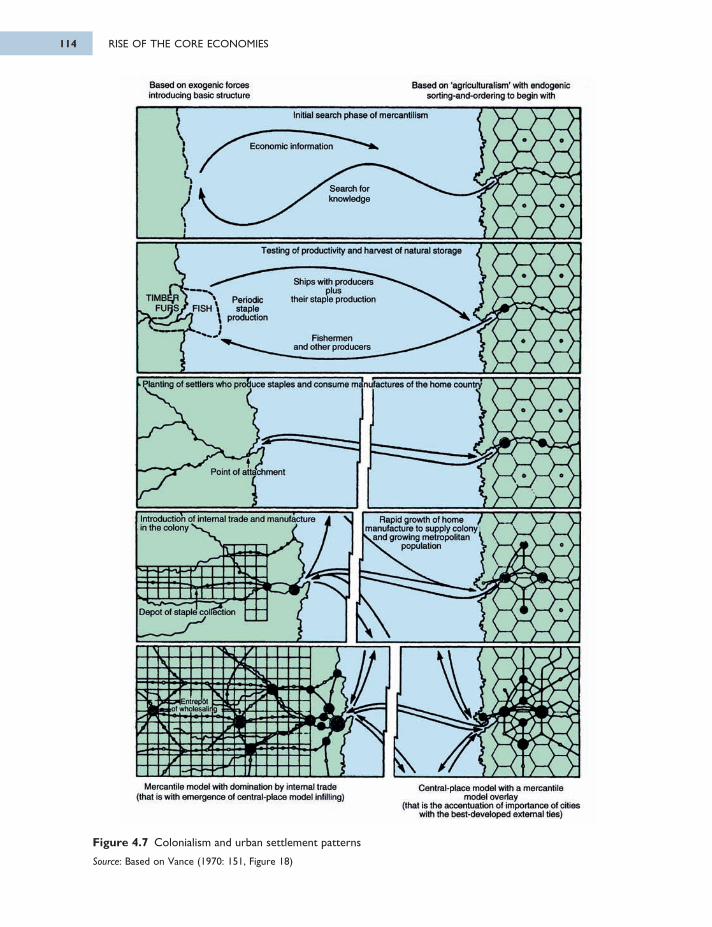
Figure 4.7 Colonialism and urban settlement patterns
Source: Based on Vance (1970: 151, Figure 18)
RISE OF THE CORE ECONOMIES114
6063 GEOGRAPHY WORLD ECON_PT_246x189 mm 22/01/2014 15:10 Page 114
Initial search phase of mercantilism
Based on 'agriculturalism1 with endogenic sorting-and-ordering to begin with
Based on exogenic forces introducing basic structure
Economic information
Search for knowledge
Testing of productivity and harvest of natural storage
Ships with producers plus
their staple productionPeriodicstaple
production
TIMBER Ϊf u r s / f is h
Fishermen and other producers
Planting ot settlers who produce staples and consume mi nufactures of the home country
Point of attachment
Introduction of internal trade and manufacture in the colony V /
Rapid growth of home , manufacture to supply colony 4*and growing metropolitan
\ population
Depot ol staple collection
( n гербі — ol wtiolesalii g
Mercantile model with domination by internal trade (that is with emergence ol central-place model infilling)
Central-place model with a mercantile model overlay
(that is the accentuation of importance of cities with the best-develooed external ties)
In the initial stages of mercantile exploration no permanent settlement is established in order toobtain the required products (fish, timber and furs). Then the colony is settled by agriculturalists;the export of their products moves through local articulation points to the colonial port, and thenceto the port in the homeland, which grows in size and status relative to its inland competitors. Assettlement of the colony expands further inland, so both of the ports increase in size, railwaysreplace rivers as the main traffic arteries within the colony, and internal gateways develop toarticulate the trade of areas some distance from the port, while in the homeland places near tothe original port benefit from the imports and a new outport is built to handle the larger volumeof trade and the bigger vessels.
The emergence of the European world economy brought about a system of internal dynamicsthat involved three important mechanisms of spatial change:
1. Strategic investments: The switching of investment from one area to another by merchantsin response to the shifting comparative advantages enjoyed by local producers. These shiftsin comparative advantage, in turn, were associated with technological innovations andimprovements, institutional changes, currency fluctuations, and so on.
2. Import substitution: Communities able to achieve repeated episodes of import substitution,as Jacobs (1984) pointed out, benefit from five aspects of economic development:
a) enlarged markets for new imports and innovationsb) an expanded and more varied employment basec) new applications of technology to increase rural productivityd) a spillover of employment to rural areas as older, expanding enterprises are crowded
out of citiese) growth of city capital.
3. Militarism and geopolitical change.
KEY SOURCES AND SUGGESTED READINGCipolla, C., 1981. Before the Industrial Revolution. European society and economy, 1000–1700, 2nd
edn. London: Methuen.Clark, C., 1977. World Prehistory in New Perspective. Cambridge: Cambridge University Press.De Vries, J., 1976. Economy of Europe in an Age of Crisis, 1600–1750. Cambridge: Cambridge
University Press.Diamond, J., 1997. Guns, Germs, and Steel. New York: W.W. Norton.Diamond, J., 2005. Collapse: How societies choose to fail or succeed. New York: Viking.Frank, A.G., 1998. ReORIENT: Global economy in the Asian age. Berkeley: University of California
Press.Jacobs, J., 1984. Cities and the wealth of nations, Atlantic Monthly March, 41–66.Johnston, R.J., 1984. The World is our Oyster, Transactions, Institute of British Geographers 9,
443–459.Landes, D.S., 1999. The Wealth and Poverty of Nations. New York: W.W. Norton.Reynolds, R., 1961. Europe Emerges. Transition toward an industrial world-wide society. Madison:
University of Wisconsin Press.Tilly, C., 1992. Coercion, Capital, and European States. Cambridge, MA: Blackwell.Wallerstein, I., 1980. The Modern World-System II: Mercantilism and the consolidation of the world-
economy 1600–1750. London: Academic Press.
4. PREINDUSTRIAL FOUNDATIONS 115
6063 GEOGRAPHY WORLD ECON_PT_246x189 mm 22/01/2014 15:10 Page 115
From the second half of the eighteenth century, industrialization rapidly reshaped economiclandscapes, introducing new dimensions and shifting the patterns and tempo of the worldeconomy. Today, economic geography within the core of the world economy is
dominated by the physical, institutional, and social legacies of industrial capitalism. Theeconomic geography of the peripheral regions has, meanwhile, been shaped by their role insustaining the industrial expansion of the core economies and more recently the NIEs. In short,few elements of the economic landscape are not a product, directly or indirectly, of the industrialera. In this chapter, we outline the evolution of the economic geography of the industrial coreregions, analyzing the major processes involved in the relative ascent and decline of countriesand regions within these regions.
5.1 THE INDUSTRIAL REVOLUTION AND SPATIAL CHANGEThe transition during the late eighteenth and early nineteenth centuries from merchantcapitalism to industrial capitalism as the dominant form of economic organization isconventionally ascribed to the Industrial Revolution. The Industrial Revolution, in turn, istypically depicted as a revolution in the techniques and organization of manufacturing basedon a series of innovations in the technology of production (e.g., Kay’s flying shuttle (1733),Hargreaves’ spinning Jenny (1765), and Cartwright’s machine loom (1787)) and in transporttechnology and engineering (particularly the development of canal and railway systems). Buttechnological advances were only part of a wider economic, social, and political transitionwhose origins and preconditions can be found in the Renaissance and Enlightenment. Indeed:
[P]rior to 1800, living standards in the world economy were roughly constant over the very longrun: per capita wage income, output and consumption did not grow. Modern industrial economies,on the other hand, enjoy unprecedented and seemingly endless growth in living standards.
(Hansen and Prescott, 2002: 1202)
Picture credit: © European Community, 2013
Chapter 5
Evolution of thecore regions
6063 GEOGRAPHY WORLD ECON_PT_246x189 mm 22/01/2014 15:10 Page 116
The most important context for technological advance was the existence within merchantcapitalism of industry organized on capitalist lines by entrepreneurs employing wage laborand producing commodities for sale in regional and national markets. In addition, the capitalthat had been accumulated through trading provided the means for entrepreneurs to financeinvestment in the capital-intensive but highly productive technologies introduced during theIndustrial Revolution.
From these roots, machine production and the organizational setting of the factory—machinofacture—emerged as the central characteristics of industrialization. While machineryprovided the basis for higher levels of productivity, factories enabled this productivity to beexploited to its fullest extent. Gains in productivity were most often achieved throughspecialization—the assembly-line division of labor—and internal economies of scale. At thesame time, the concentration of workers in big industrial units generated urban environmentsthat represented a new dynamic force for economic, social, and political change.
Like merchant capitalism before it, however, industrial capitalism had to confront the twinobstacles of market saturation and the law of diminishing returns. In response, industrialistspursued a variety of strategies. In addition to the constant search for technological advances,industrialists sought:
• new ways of exploiting internal and external economies of scale• cheaper sources of labor, raw materials, and energy• greater access to overseas markets• development of new products, either through new inventions or by the “commodification”
of activities previously performed within the household• formalized relations with labor unions and governments to provide a more stable context
(economic, social, and political) in which to operate.
The changes imposed on economic landscapes by the first waves of the Industrial Revolutionhave been overwritten by a succession of episodes of industrial development, restructuring,and reorganization. These episodes have created significant differences between the majorindustrial regions; differences that reflect variations in resource endowment, previous patternsof economic development, and, importantly, variations in the relative timing and interactionof these episodes of industrial change.
5.2 MACHINOFACTURE AND THE SPREAD OF INDUSTRIALIZATIONIN EUROPE
Although often considered a single, discrete period, the Industrial Revolution included severaldistinctive transitional phases, each with a unique impact on various regions and countries.As new technologies altered the margins of profitability in different enterprises, so the fortunesof specialized places shifted.
These regional differences, in turn, helped to influence the changing character of capitalism.With the evolution of capitalism came shifts, occasionally of a dramatic nature, in economic,social, political, and cultural relations. These evolving forms of economic organization—interrelated complexes of production, consumption, and income distribution based on theorganization of firms—grew in response to the opportunities and constraints created by newproduction, transportation, and communications technologies. At the same time, this evolutionyielded a succession of technology systems that were imprinted differentially across theeconomic landscape.
5. EVOLUTION OF THE CORE REGIONS 117
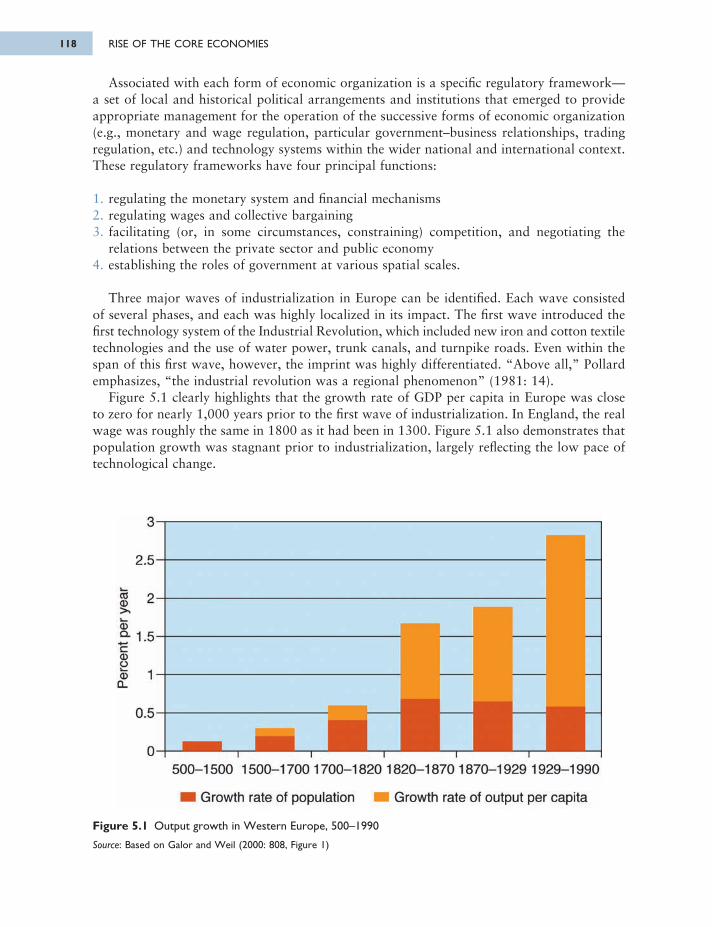
Associated with each form of economic organization is a specific regulatory framework—a set of local and historical political arrangements and institutions that emerged to provideappropriate management for the operation of the successive forms of economic organization(e.g., monetary and wage regulation, particular government–business relationships, tradingregulation, etc.) and technology systems within the wider national and international context.These regulatory frameworks have four principal functions:
1. regulating the monetary system and financial mechanisms2. regulating wages and collective bargaining3. facilitating (or, in some circumstances, constraining) competition, and negotiating the
relations between the private sector and public economy4. establishing the roles of government at various spatial scales.
Three major waves of industrialization in Europe can be identified. Each wave consistedof several phases, and each was highly localized in its impact. The first wave introduced thefirst technology system of the Industrial Revolution, which included new iron and cotton textiletechnologies and the use of water power, trunk canals, and turnpike roads. Even within thespan of this first wave, however, the imprint was highly differentiated. “Above all,” Pollardemphasizes, “the industrial revolution was a regional phenomenon” (1981: 14).
Figure 5.1 clearly highlights that the growth rate of GDP per capita in Europe was closeto zero for nearly 1,000 years prior to the first wave of industrialization. In England, the realwage was roughly the same in 1800 as it had been in 1300. Figure 5.1 also demonstrates thatpopulation growth was stagnant prior to industrialization, largely reflecting the low pace oftechnological change.
Figure 5.1 Output growth in Western Europe, 500–1990
Source: Based on Galor and Weil (2000: 808, Figure 1)
RISE OF THE CORE ECONOMIES118
6063 GEOGRAPHY WORLD ECON_PT_246x189 mm 22/01/2014 15:10 Page 118
з
2.5
2
1.5
1
0.5
0
к_соф> ,ΙΟ)CL
сQ)О0)
Cl
500-1500 1500-1700 1700-1820 1820-1870 1870-1929 1929-1990
Growth rate of population Growth rate of output per capita
FIRST-WAVE INDUSTRIALIZATION: BRITAIN
The springboard for the first wave of industrialization, which began in Britain around 1760,consisted of several local hearth areas of “proto-industrialization.” These areas had long-standing concentrations of industry based on a wage-labor force using the most advanced ofthe available industrial processes. The need to locate operations near mineral resources andsources of water power as well as within reasonable distance to local canal systems meantthat early industrial activity was highly localized. This localization also reflected the principleof comparative advantage whereby industry had been displaced into the least hospitable localesfor agricultural production.
This pattern of proto-industrialization, with its external economies, infrastructural advan -tages, and well-developed markets, helped to determine the nuclei of industrial developmentin Great Britain during the first phase of the first wave of industrialization between 1760 and1790. Although sub-regions such as north Cornwall, south Staffordshire, and north Walesshared the common impetus of certain key resources and innovations, each retained its owndistinctive business transitions and industrial style. Much of the required capital was raisedlocally, labor requirements were drawn (in the first instance) from the immediate hinterland,and industrialists formed regional organizations and operated regional cartels.
From the start, then, industrialization was articulated at the regional level. The second phase (of the first wave), between 1790 and 1820, reinforced the position of those embryoindustrial regions with a coalfield base and saw the emergence of other regions such as Ulsterin Northern Ireland and south Wales as industrialized regions. Meanwhile, the prosperity ofthe early starters declined markedly as their relative advantages were eclipsed by a combinationof three factors:
1. the exhaustion of minerals or the discovery of cheaper alternative supplies2. the relative inaccessibility of markets due to poor communications or the isolated nature
of the locale3. the lack of size to develop.
The third phase of the “British” wave, between 1820 and 1850, was dominated by theexpansion of the railway system. This development did not foster any new industrial regions,but it did widen the market area of the existing industrial regions, drawing more of Britaininto the sphere of industrial capitalism.
SECOND-WAVE INDUSTRIALIZATION: A NEW TECHNOLOGY SYSTEM ANDNEW FORMS OF ECONOMIC ORGANIZATION
The second wave was characterized by the spread of industrialization to continental Europe.This diffusion did not occur in a straightforward or systematic manner; rather, forms ofeconomic organization and regulatory frameworks emerged to exploit new technologies,primarily leveraging coal, steel, heavy engineering, steam power, and railways. This shift wasaccompanied by a number of other changes including the development of new labor practices(i.e., the spread of wage-labor norms), the emergence of new corporate structures (e.g., largelimited-liability firms with a national rather than local scope), and new relationships betweengovernments and industry (i.e., increased regulation of and investment in key industries bystates).
Similar to the British wave of industrialization, the second wave was launched from theproto-industrial regions of continental Europe. Initially, from around 1850, industrialization
5. EVOLUTION OF THE CORE REGIONS 119
6063 GEOGRAPHY WORLD ECON_PT_246x189 mm 22/01/2014 15:10 Page 119
was concentrated in the Sambre-Meuse region of Belgium and in the valley of the Scheldt inBelgium and France. Subsequent phases saw the spread of industrialization to areas such asthe Ruhr in Germany and Alsace, Normandy, and the upper Loire valley in France.
Unlike their counterparts during the first wave of industrialization, would-be competitorson the continent entered a market in which the early movers (i.e., the British) had securedcomfortable advantages in technology which translated into a dominant position in the worldmarkets. Britain also had a series of “natural” geographical advantages: A compact territorywith a large population, favorable conditions for intensive agricultural production, and a richvariety of minerals including coal.
This competitive disadvantage for the industrial regions of continental Europe wascompounded by the consequences of the Revolutionary and Napoleonic Wars of the earlynineteenth century (as it was in the United States by the Civil War of 1861–1865). Conscription,armed conflict, and military occupation disrupted production and suppressed industrialexpansion, allowing British industries to forge further ahead on the basis of the new technologysystem (and, of course, a constantly evolving and adapting regulatory framework).
But in contrast to their British counterparts, continental entrepreneurs and governmentsdid not have to industrialize by trial and error. By drawing on the British experience—as wellas importing British managers, workers, capital, and technology—they minimized misstepsand accelerated their pace of modernization. These regions of “inner” Europe differed fromone another not only in the mix of industries that gained a foothold, but also by what economichistorian Sidney Pollard calls the differential of contemporaneousness, whereby new tech-nologies, ideas, and market conditions reached regions simultaneously but affected them inunique ways because they were not comparably equipped to respond to them. Thus, forexample:
Legislation permitting the easy formation of joint-stock companies spread quickly across Europein the 1850s, and their contribution to overspeculation and wide-spread bankruptcies in the lesssophisticated European economies has often been commented on. In banking, the backwardeconomies, using the experience of the pioneers, could bypass some of the difficulties of the latterby enjoying the benefits of more efficient banks, ahead, as it were, of their own stage of economicgrowth.
(Pollard, 1981: 188–189)
In general terms, however, the cumulative impact of innovations in first- and second-waveindustrializers made for convergence: The French Nord (north) began to look and functionincreasingly like the central belt of the Scottish Lowlands, and the Ruhr began to look andfunction increasingly like the Sambre-Meuse region. At the same time, areas that had adoptedan industrial base and those that had yet to follow suit increasingly diverged in their socialand economic complexion. By 1875, the latter still covered a great deal of the map (see Figure5.2), but many of them were incorporated in the third wave of industrialization between 1870and 1914.
THIRD WAVE INDUSTRIALIZATION: INTERMEDIATE EUROPE
The third wave of industrialization included “intermediate” Europe—parts of Britain, France,Belgium, and Germany that had not been directly affected by the first two waves, togetherwith most of the Netherlands, southern Scandinavia, northern Italy, eastern Austria, andCatalonia in northeastern Spain. By this time, all European landscapes had begun reorganizing
RISE OF THE CORE ECONOMIES120
6063 GEOGRAPHY WORLD ECON_PT_246x189 mm 22/01/2014 15:10 Page 120
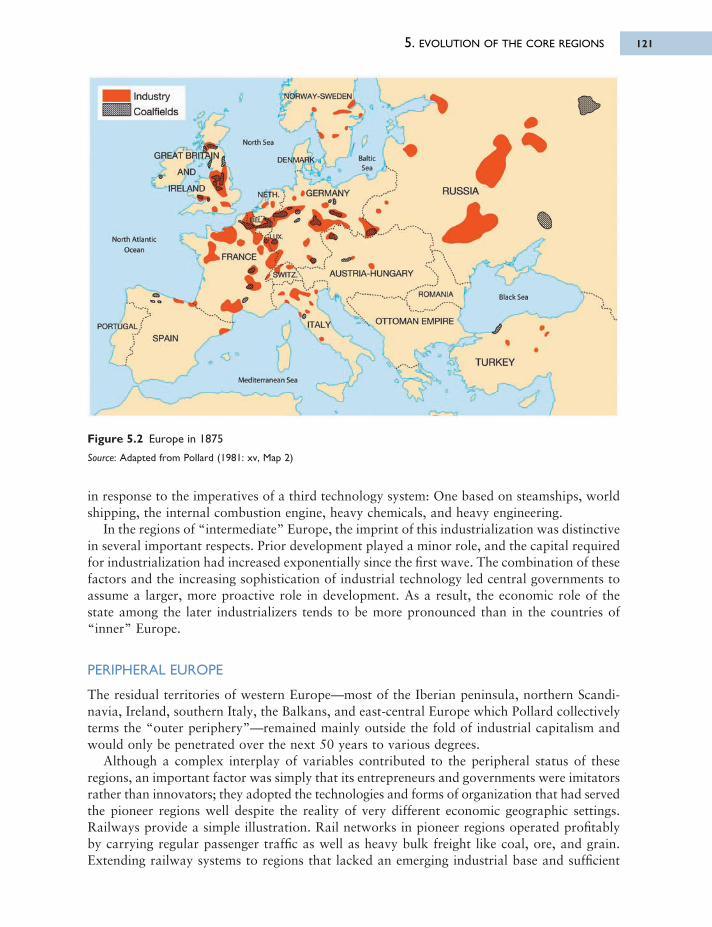
5. EVOLUTION OF THE CORE REGIONS 121
in response to the imperatives of a third technology system: One based on steamships, worldshipping, the internal combustion engine, heavy chemicals, and heavy engineering.
In the regions of “intermediate” Europe, the imprint of this industrialization was distinctivein several important respects. Prior development played a minor role, and the capital requiredfor industrialization had increased exponentially since the first wave. The combination of thesefactors and the increasing sophistication of industrial technology led central governments toassume a larger, more proactive role in development. As a result, the economic role of thestate among the later industrializers tends to be more pronounced than in the countries of“inner” Europe.
PERIPHERAL EUROPE
The residual territories of western Europe—most of the Iberian peninsula, northern Scandi -navia, Ireland, southern Italy, the Balkans, and east-central Europe which Pollard collectivelyterms the “outer periphery”—remained mainly outside the fold of industrial capitalism andwould only be penetrated over the next 50 years to various degrees.
Although a complex interplay of variables contributed to the peripheral status of theseregions, an important factor was simply that its entrepreneurs and governments were imitatorsrather than innovators; they adopted the technologies and forms of organization that had servedthe pioneer regions well despite the reality of very different economic geographic settings.Railways provide a simple illustration. Rail networks in pioneer regions operated profitablyby carrying regular passenger traffic as well as heavy bulk freight like coal, ore, and grain.Extending railway systems to regions that lacked an emerging industrial base and sufficient
Figure 5.2 Europe in 1875
Source: Adapted from Pollard (1981: xv, Map 2)
6063 GEOGRAPHY WORLD ECON_PT_246x189 mm 22/01/2014 15:10 Page 121
Industry
Coalfields
NORWAY-SWEDEN
North Sea
GREAT BRITAIN
AND
IRELAND
DENMARK BalticSea
»GERMAN>ΝΕΤΗ. RUSSIA
Black Se;'ROMANIA
AUSTRIA-HUNGARYSwrrz;·..
FRANCE
North Atlantic Ocean
PORTUGAL
SPAIN
ITALY OTTOMAN EMPIRE
TURKEY
Mediterranean Sea
population density (e.g., in Ireland, southern Italy, Spain, and most of east-central Europe)invited heavy losses. The willingness of states to underwrite such losses reflects the potencyof the railways as symbols of political (and economic) virility. What was not foreseen at thetime, however, was that integrating national territories did not necessarily result in industrialdevelopment; rather, the penetration of the railways to peripheral regions tended to result intheir specialization in a subordinate, agricultural role—a special case of Pollard’s “differentialof contemporaneousness.”
Another important reason these regions remained on the periphery can be found in thenature of urban development within the later industrializing regions. In Britain, “inner” Europe,and “intermediate” Europe, a symbiotic relationship between urban and industrial developmentemerged with cities providing capital, labor, markets, access to transport systems, and a varietyof agglomeration economies. In much of peripheral Europe, the “demonstration effect” of theseevents led to a very different relationship, largely because of the attitudes of the élite:
Railways were laid to royal palaces, gas or water mains supplied a narrow layer of privileged classes. . . innovations intended for mass markets were misused for a narrow luxury market and eitherdiverted resources, or led to burdensome capital imports. . . . Above all, the city became the gateof entry to new technology manufactures from abroad, spreading outward from Naples, Madrid,Budapest or St. Petersburg, to kill off native industry as unfashionable.
(Pollard, 1981: 212)
In short, conspicuous consumption precluded import substitution and resulted in cities thatinhibited rather than fostered industrial growth.
DISLOCATION AND DEPRESSION
In the first half of the twentieth century, two major wars punctuated the economic develop-ment of Europe. The disruption of the First World War was immense. The overall loss of life,including the victims of influenza epidemics and border conflicts which followed the war,amounted to between 50 and 60 million people. About half as many again were permanentlydisabled. For some countries, this meant a loss of 10–15 percent of the male workforce. Inaddition, material losses caused a severe dislocation to economic growth: Some estimates suggestthat the level of European output achieved in 1929 would have been reached by 1921 hadthe war not interceded.
Economic dislocation in Europe was further intensified by several indirect consequences ofthe war. In terms of tracing the evolving economic geography of the core regions of the world,two of these were particularly important:
1. The relative decline of Europe as a producer compared with the rest of the world. Europeaccounted for 43 percent of the world’s production and 59 percent of its trade in 1913,compared with only 34 percent of production and 50 percent of trade in 1923. The mainbeneficiaries of this decline were manufacturers in the United States and Japan, and LatinAmerica and the British dominions for primary production.
2. The redrawing of the political map of Europe. This transformation created 38 independenteconomic units instead of 26; 27 currencies instead of 14; and 20,000 extra kilometers ofnational boundaries. The corollary of these changes was a severe dislocation of economiclife, particularly in east-central Europe: Frontiers separated workers from factories, factoriesfrom markets, towns from traditional food supplies, and textile looms from spinning shedsand finishing mills; while the transport system found itself only loosely matched to this newpolitical geography.
RISE OF THE CORE ECONOMIES122
6063 GEOGRAPHY WORLD ECON_PT_246x189 mm 22/01/2014 15:10 Page 122
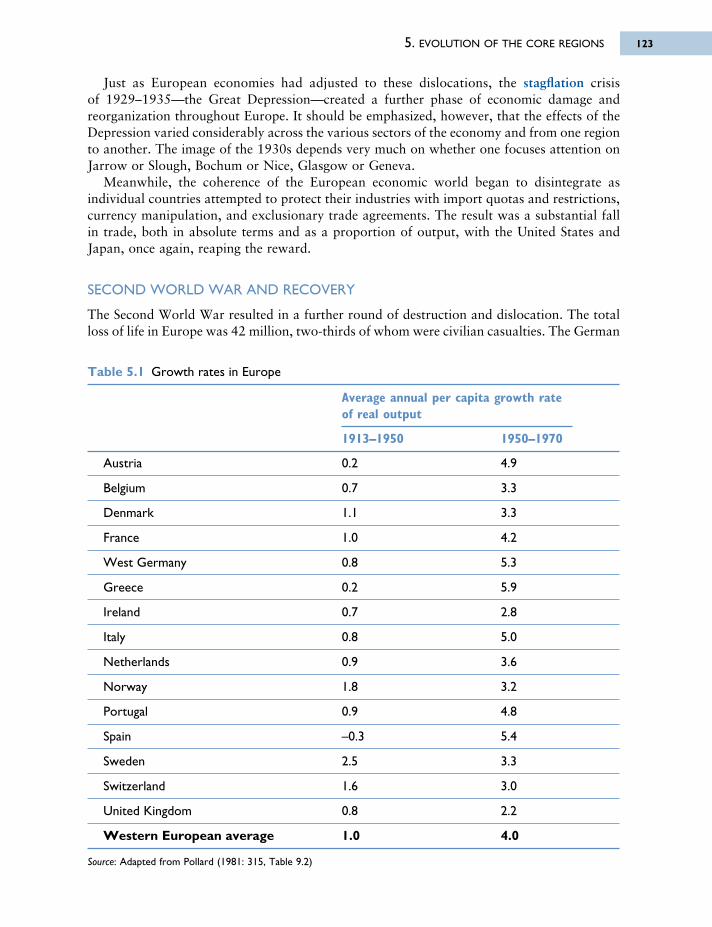
Just as European economies had adjusted to these dislocations, the stagflation crisis of 1929–1935—the Great Depression—created a further phase of economic damage andreorganization throughout Europe. It should be emphasized, however, that the effects of theDepression varied considerably across the various sectors of the economy and from one regionto another. The image of the 1930s depends very much on whether one focuses attention onJarrow or Slough, Bochum or Nice, Glasgow or Geneva.
Meanwhile, the coherence of the European economic world began to disintegrate asindividual countries attempted to protect their industries with import quotas and restrictions,currency manipulation, and exclusionary trade agreements. The result was a substantial fallin trade, both in absolute terms and as a proportion of output, with the United States andJapan, once again, reaping the reward.
SECOND WORLD WAR AND RECOVERY
The Second World War resulted in a further round of destruction and dislocation. The totalloss of life in Europe was 42 million, two-thirds of whom were civilian casualties. The German
5. EVOLUTION OF THE CORE REGIONS 123
Table 5.1 Growth rates in Europe
Average annual per capita growth rate of real output
1913–1950 1950–1970
Austria 0.2 4.9
Belgium 0.7 3.3
Denmark 1.1 3.3
France 1.0 4.2
West Germany 0.8 5.3
Greece 0.2 5.9
Ireland 0.7 2.8
Italy 0.8 5.0
Netherlands 0.9 3.6
Norway 1.8 3.2
Portugal 0.9 4.8
Spain –0.3 5.4
Sweden 2.5 3.3
Switzerland 1.6 3.0
United Kingdom 0.8 2.2
Western European average 1.0 4.0
Source: Adapted from Pollard (1981: 315, Table 9.2)
6063 GEOGRAPHY WORLD ECON_PT_246x189 mm 22/01/2014 15:10 Page 123
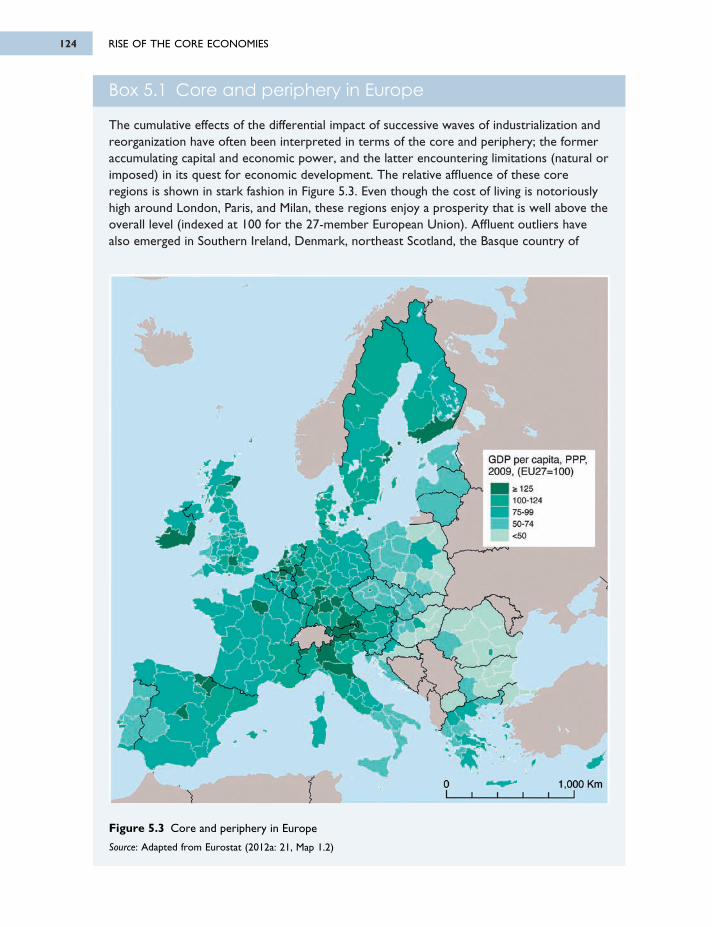
Box 5.1 Core and periphery in Europe
The cumulative effects of the differential impact of successive waves of industrialization andreorganization have often been interpreted in terms of the core and periphery; the formeraccumulating capital and economic power, and the latter encountering limitations (natural orimposed) in its quest for economic development. The relative affluence of these coreregions is shown in stark fashion in Figure 5.3. Even though the cost of living is notoriouslyhigh around London, Paris, and Milan, these regions enjoy a prosperity that is well above theoverall level (indexed at 100 for the 27-member European Union). Affluent outliers havealso emerged in Southern Ireland, Denmark, northeast Scotland, the Basque country of
Figure 5.3 Core and periphery in Europe
Source: Adapted from Eurostat (2012a: 21, Map 1.2)
RISE OF THE CORE ECONOMIES124
6063 GEOGRAPHY WORLD ECON_PT_246x189 mm 22/01/2014 15:10 Page 124
GDP per capita, PPP, 2009, (EU27=100)І 2 125
100-124 75-99 50-74 <50
0 1,000 Km
5. EVOLUTION OF THE CORE REGIONS 125
occupation of continental Europe involved ruthless exploitation. By the end of the war, Francewas below 50 percent of its pre-war level of living and had lost 8 percent of its industrialassets. The United Kingdom had lost 18 percent of its industrial assets (including overseasholdings), and the Soviet Union lost 25 percent. Similarly, Germany lost 13 percent of its assetsand ended the war with a level of income per capita that was less than 25 percent of the pre-war figure.
After the war, the political cleavage between eastern and western Europe (which resultedfrom the imposition of what Winston Churchill called the Iron Curtain along the westernfrontier of Soviet-dominated territory) further eroded the coherence of the European economyand, indeed, of its economic geography. Ironically, this cleavage sparked a surprisingly rapideconomic recovery in western Europe: The United States, learning from the mistakes of politicalleaders in the post-World War I period and believing that poverty and economic chaos wouldfoster communism, embarked on a massive program of aid under the Marshall Plan. This pump-priming action, together with the pent-up backlog of demand in almost every sphere ofproduction, provided the basis for a remarkable recovery. By the early 1950s most of Europehad exceeded pre-war levels of prosperity. By the early 1960s European central banks werein a position to step in, when necessary, to support the U.S. dollar. As Table 5.1 illustrates,growth rates throughout western Europe surged forward to impressive levels.
5.3 FORDISM AND NORTH AMERICAN INDUSTRIALIZATIONThe emergence of the United States as a dominant component of the world economy can beattributed to a number of factors including its vast supply of natural resources; a large andrapidly growing market and labor force (thanks, in part, to its open-door policy towardimmigration in the late nineteenth and early twentieth centuries); and sufficient size coupledwith a capitalist ethos that bred giant corporations with significant research budgets and anincentive to institutionalize the innovation process in a way that has been generally foreignto European industry.
Within the United States the evolving pattern of spatial organization can be interpreted interms of the interaction of (1) the geography of resources, (2) the introduction of majortechnological innovations (particularly in transport), and (3) movements of population. Thus:
Major changes in technology have resulted in critically important changes in the evaluation ordefinition of particular resources on which the growth of certain urban regions had previously
Spain, and the capital regions of Finland and Sweden. In contrast, Bulgaria, Romania, Latvia,and much of Poland and the Czech Republic are decidedly peripheral.
The European core has variously been interpreted as the triangular region defined byLille-Bremen-Strasbourg (the “heavy industrial triangle”), as an axial belt stretching betweenBoulogne and Amsterdam in the north and Besançon and Munich in the south, as a T-shapedregion whose stem extends down the Rhine to Stuttgart. Such definitions can be confusingin their variability, but their main weakness is that they overlook the interdependence thatexists between core and periphery. It is therefore more satisfactory to think in terms of acore consisting of a number of linkages or flows (e.g., capital, migrants, taxes, tourists,consumer goods, etc.) that bind core and periphery together, reinforcing their unequal butsymbiotic relationship.
6063 GEOGRAPHY WORLD ECON_PT_246x189 mm 22/01/2014 15:10 Page 125
been based. Great migrations have sought to exploit resources—ranging from climate or coal towater or zinc—that were either newly appreciated or newly accessible within the national market.Usually, of course, the new appreciation or accessibility had come about, in turn, through somemajor technological innovation.
(Borchert, 1967: 324)
The history of the development and evolution of the U.S. economy found its clearestgeographic expression in changing patterns of urbanization. At the time when Europe wasexperiencing the first waves of industrialization, the spatial organization of the North Americaneconomy was focused on the gateway ports of the Atlantic seaboard, each of which controlleda limited hinterland where the economy was dominated by the production of agricultural staplesfor export to Europe and the consumption of manufactured goods imported from Europe.From the end of the eighteenth century, however, the North American economy began to breakloose from this dependent relationship. Within 100 years, it became the dominant componentof the world economy with a closely integrated but highly differentiated urban system.
Several factors related to political independence contributed to this metamorphosis:
1. Political integration under a federal system provided an important stimulus for forgingeconomic links between the component parts of the old colonial system.
2. U.S. capital financed a relatively high proportion of investments which meant that less ofthe profits “leaked” back to Europe.
3. The federal system also stimulated a proliferation of government employment as every countyseat and state capital developed the infrastructure of democracy.
4. Territorial expansion provided a large, rich, and diverse resource base.
Both urban and economic development in this period, however, was constrained by the relativelyprimitive transportation system of the “sail and wagon” epoch. It was not until the 1840s,when the second technology system of industrial capitalism (i.e., coal, steel, steam, andrailways) began to be exploited that U.S. industrialization took off.
FORDISM, TAYLORISM, AND REGIONAL ECONOMIC CHANGE
Although the template of economic geography in the United States had been established largelyby 1920, the landscape of industrial capitalism continued to evolve, particularly with the arrivalof truck and automobile transportation between 1920 and 1940. Road and air travel, alongwith improvements in communications, increased the capacity and efficiency of the economy,and facilitated the functional integration of businesses and regions at an unprecedented pace.The 1920s marked the New Economic Era, a period when consumerism and boosterism edgedaside the liberal reactions to industrialism.
The large companies based in major metropolitan centers found themselves ideally situatedto capitalize on the increased capacity and efficiency of the economic system. They also exploitednew principles of economic organization based on a more intensive division of labor, assembly-line production, and the principles of “scientific” management (also known as Taylorismafter the mechanical engineer Frederick Winslow Taylor). The resulting increases in efficiencyand productivity meant that many goods could be mass produced at low prices for massmarkets. The consequent combination of mass production and mass consumption is generallyreferred to as Fordism, after Henry Ford, the automobile manufacturer who led the way inimplementing these changes.
RISE OF THE CORE ECONOMIES126
6063 GEOGRAPHY WORLD ECON_PT_246x189 mm 22/01/2014 15:10 Page 126
5. EVOLUTION OF THE CORE REGIONS 127
Box 5.2 The growth of the U.S. manufacturing belt
The acceleration of industrialization in the United States in the 1840s was in part the resultof the diffusion of industrial technology—particularly the wider industrial application ofsteam and the accompanying changes in the iron industry—and methods of industrial andcommercial organization from the hearth area of the Industrial Revolution in Europe. In addition, the demand for foodstuffs and other agricultural staples in North America and abroad stimulated the growth of industrial capitalism as farmers sought to increaseproductivity through mechanization and the use of improved agricultural implements.Increasing agricultural productivity, in turn, helped to sustain the growing numbers ofimmigrants from Europe, thus allowing them to be channeled into industrial employment inthe mushrooming cities of the United States.
The development of the railway system played a central role in the evolution of this neweconomic order. Initially, the railways were complementary to the waterways as competitivelong-haul carriers of general freight. By the end of the “iron horse” epoch, the railwaynetwork had not only realigned the economic system but also extended it to a continentalscale. In 1869 the railway network reached the Pacific when, at Promontory, Utah, theUnion Pacific railway, building west from Omaha, met the Central Pacific railway, buildingeast from Sacramento. By 1875 intense competition between railroad companies had begunto open up the western prairies as far as Minneapolis-St. Paul and Kansas City. Thesignificance of this transformation was profound:
Not only did this permit American enterprise to exploit fully the commercial advantages andscale economies of large, diversified natural resources and of the revolutionary technologiesevolved in those decades, but it generated rapid, large-scale functional and spatial concentrationof finance and management unimpeded by world events, creating a transcontinental businessmentality. Wide spatial separation of major resources, cities and markets, and adjacency to theeasily penetrated Canadian economy all induced mental thresholds for thinking intercontinentalonce imported resources and markets overseas became a necessary ingredient to sustainbusiness activity at home, especially during and after the Second World War.
(Hamilton, 1978: 26; emphasis added)
In short, the railways can be seen as the catalyst that allowed regional economies to developinto a continental economy that stood poised to become the leading component of theworld economic system.
Meanwhile, the westward extension of the railways inevitably affected the fortunes of theinland gateway cities. Buffalo and Louisville, for instance, experienced slowed rates ofgrowth and came increasingly to rely on more diversified regional functions. Further west,St. Paul and Kansas City expanded rapidly to become major wholesaling depots. Thedevelopment of improved transportation networks also led to adjustments in spatialorganization within the northeast where fierce competition between the railways and water-borne transport, coupled with equally fierce rivalry between neighboring cities, led to amarked increase in intra-regional trade.
In essence, the consolidation of the Manufacturing Belt as the continental economicheartland was the result of initial advantage. With its large markets, well-developedtransport networks, and access to nearby coal reserves, it was ideally placed to takeadvantage of the general upsurge in demand for consumer goods, the increased efficiency of
6063 GEOGRAPHY WORLD ECON_PT_246x189 mm 22/01/2014 15:10 Page 127
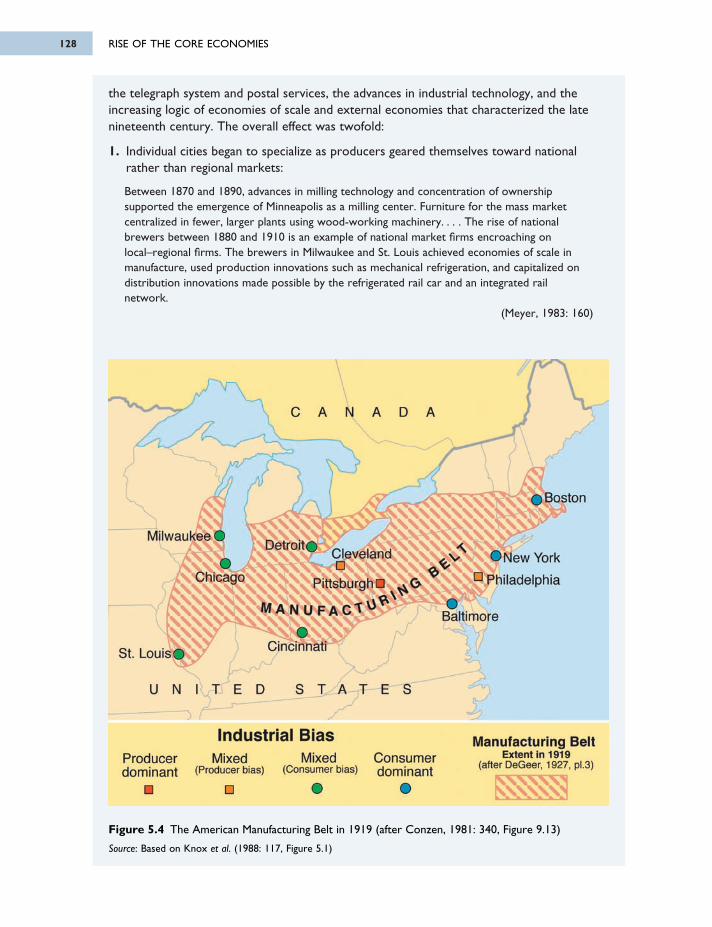
the telegraph system and postal services, the advances in industrial technology, and theincreasing logic of economies of scale and external economies that characterized the latenineteenth century. The overall effect was twofold:
1. Individual cities began to specialize as producers geared themselves toward nationalrather than regional markets:
Between 1870 and 1890, advances in milling technology and concentration of ownershipsupported the emergence of Minneapolis as a milling center. Furniture for the mass marketcentralized in fewer, larger plants using wood-working machinery. . . . The rise of nationalbrewers between 1880 and 1910 is an example of national market firms encroaching onlocal–regional firms. The brewers in Milwaukee and St. Louis achieved economies of scale inmanufacture, used production innovations such as mechanical refrigeration, and capitalized ondistribution innovations made possible by the refrigerated rail car and an integrated railnetwork.
(Meyer, 1983: 160)
Figure 5.4 The American Manufacturing Belt in 1919 (after Conzen, 1981: 340, Figure 9.13)
Source: Based on Knox et al. (1988: 117, Figure 5.1)
RISE OF THE CORE ECONOMIES128
6063 GEOGRAPHY WORLD ECON_PT_246x189 mm 22/01/2014 15:10 Page 128
C A N A D A
) Boston
'New York
MilwaukeeDetroit
Clevelanc
Pittsburgh IChicago
St. Louis
U N I T E D
Cincinnati
S T A T E S
Baltimore
Philadelphia
Industrial Bias Manufacturing BeltExtent in 1919
(after DeGeer, 1927, pl.3)Consumerdominant
Mixed(Consumer bias)
Mixed(Producer bias)
Producerdominant
This new form of economic organization required ever larger companies. A flurry ofcompany mergers soon transformed the business structure of the economy, resulting in arelatively small number of very powerful corporations that stood poised to dominate theeconomy. By 1920, a mere 1 percent of firms accounted for over 30 percent of all jobs andnearly 50 percent of the country’s production:
The Captains of Industry were clearly in charge. Across the country, territorial communities watchedeffective control over local production slip out of their grasp. Political power came to focus onthe national level of territorial integration which, for the time being, effectively bounded theoperation of most businesses.
(Friedmann and Weaver, 1979: 22)
However, the new form of economic organization associated with this new economic erafostered some serious problems. Mechanized agriculture became so “overproductive” thatcommodity prices plummeted; while the industrial market became unstable as a result of thelabyrinth of holding companies that had been created. In October 1929 the stock marketcollapsed, triggering the Great Depression during which millions of workers lost their jobs.The regional division of labor that had emerged over the previous 50 years meant that someareas suffered particularly acute social and economic problems. The political response tookthe form of a New Deal in which the central government assumed much greater responsi-bility for overall economic growth and regional economic well-being, a system of public
5. EVOLUTION OF THE CORE REGIONS 129
Similarly, musical instrument manufacture and men’s clothing emerged as specialties inBoston; meat packing, furniture manufacture, and printing and publishing in Chicago; coach-building and furniture manufacture in Cincinnati; textile manufacture in Philadelphia;and so on.
In smaller cities, specialization was often much more pronounced, as in the production of iron, steel, and coach-building in Columbus; furniture in Grand Rapids; agriculturalimplements in Springfield; and boots and shoes in Worcester. Overall, there emerged athree-part segmentation of the Manufacturing Belt (see Figure 5.4) with a heavy bias towardsconsumer goods production in the ports of Baltimore, Boston, and New York; a producergoods axis between Philadelphia and Cleveland; and a western cluster of rather lessspecialized consumer-oriented manufacturing cities.
2. This specialization provided the basis for increasing commodity flows between individualcities, thus binding the Manufacturing Belt together. These linkages, in turn, generatedimportant multiplier effects through wholesaling, finance, warehousing, andtransportation, adding to the cumulative process of regional industrial growth andincreasing the region’s comparative advantage. These advantages meant that theManufacturing Belt was able to attract a large proportion of any new industrial activitieswith large or national markets, thus stifling the chances of comparable levels ofindustrialization in late developing regions.
Of course, other regions also industrialized; however, they failed to match the scale andthe intensity of the Manufacturing Belt. Instead, these regions supported an array of locallyoriented manufacturers as well as some nationally oriented activities based on particularlocal advantages or raw materials, and they rarely attracted manufacturers of producergoods for the national market.
6063 GEOGRAPHY WORLD ECON_PT_246x189 mm 22/01/2014 15:10 Page 129
macroeconomic management that came to be known as Keynesianism after the doctrine ofBritish economist John Maynard Keynes. In these changes, we can see that a significant shiftoccurred in the regulatory framework associated with the Fordist form of economicorganization. The focus of economic policies shifted from regulation of the supply side to activemanagement of the demand side.
With the outbreak of war in Europe in 1939, the entire North American economy entereda phase of accelerated growth; and in the aftermath of the war the United States and Canadaemerged not only with stronger and more efficient industries but also with new technologiesand control over new international markets. The United States, in its more outward-lookingrole as leader of the capitalist world, dictated the pattern of world affairs through the termsof the Marshall Plan, its control of the Organization for European Economic Cooperation(OEEC) (forerunner of the OECD and established to administer U.S. and Canadian postwarreconstruction aid in Europe under the Marshall Plan), and the Bretton Woods Agreement(which established a new framework for international economic relations). By 1960 GNI per capita stood at $2,513 in the United States compared with $1,909 in Canada, $1,678 inSweden, $1,259 in the United Kingdom, $1,200 in West Germany, $1,193 in France, and apaltry $421 in Japan. By this time, however, the economic geography of North America hadbegun to respond to the imperatives of the new technology systems and forms of economicorganization of globalized capitalism, themes we explore in detail in Chapter 7.
5.4 JAPANESE INDUSTRIALIZATION: TWO ECONOMICMIRACLES
The early rise of the Japanese economy to join the core of the world economy represents amajor achievement, and it poses some important questions in relation to the theory and realityof economic organization and spatial change. In particular, how was it that a relatively resource-poor country like Japan was successful in industrializing so soon, when resource-rich regionselsewhere in Asia and in Latin America were not?
Broadly speaking, the answer lies in the fact that the Japanese economy, although organizedalong feudal lines until well into the nineteenth century, was autonomous. It had not beenpenetrated by the capitalism of the other core regions. Moreover, the transition from feudalismto capitalism took place as a deliberate attempt to preserve national political and economicautonomy.
Even though Japan was “lucky” in not having been politically and economically sub -ordinated, its path forward via industrialization was still obstructed by the other core regions’pre-emption of the technology, infrastructure, and capital necessary for industrial develop-ment. How were these obstacles overcome? The answer, again in general terms, lies in thecom bination of a proto-industrial base and an aggressive expansionist strategy that includedflooding overseas markets with cheap products and copying and adapting western technology—a strategy achieved at the expense of an authoritarian government, widespread exploitation,and acute regional disparities.
THE FIRST MIRACLE: FROM FEUDALISM TO INDUSTRIAL CAPITALISM
Japan’s transition from feudalism to industrial capitalism can be pinpointed to a specific year—1868—in which the feudal political economy of the Tokugawa regime was toppled by therestoration of imperial power. For over 200 years as the industrial system was developing in the Western Hemisphere, the Tokugawa regime attempted to sustain traditional Japanese
RISE OF THE CORE ECONOMIES130
6063 GEOGRAPHY WORLD ECON_PT_246x189 mm 22/01/2014 15:10 Page 130
society. The patriarchal government excluded missionaries, banned Christianity, prohibitedthe construction of ships larger than 50 tons, closed Japanese ports to foreign vessels (Nagasakiwas the single exception), and deliberately suppressed commercial enterprise. At the top ofthe feudal hierarchy were the nobility (the shogunate), the barons (daimyos), and warriors(samurai). Farmers and artisans represented the productive base exploited by these ruling classes.Only outcasts and prostitutes ranked lower than merchants.
In terms of spatial organization, the economy was built on a closed hierarchy of castle towns,each representing the administrative base of a local shogun. The position of a town withinthis hierarchy was dependent on the status of the shogun, which, in turn, was related to theproductivity of the agricultural hinterland. As a result, the largest cities—which became thefoundations for subsequent economic growth—emerged among the alluvial plains and thereclaimed lakes and bay heads of southern Honshu. At the top of the hierarchy was Edo (nowTokyo) which the Tokugawa regime had selected as its capital in preference to the traditionalimperial capital of Kyoto. Bloated by soldiery, administrators, and the entourages of the nobilityin attendance at the Tokugawa court, Tokyo reached a population of around 1 million peopleby the early nineteenth century. Kyoto and Osaka were the next largest cities with populationsof between 300,000 and 500,000 residents. They were followed by Nagoya and Kanazawawith around 100,000 residents each.
With cities of this size, suppressing commerce and preventing the breakdown of thetraditional political economy proved to be difficult. As in feudal Europe, peasants fled thecountryside in increasing numbers in response to a combination of taxation, technologicalimprovements in agriculture, and the lure of the relative freedom and prosperity of cities. Atthe same time, cities evolved into important centers of domestic manufacture: Nodes of proto-industrial development that served as the platform for Japan’s subsequent development.Meanwhile, prolonged peace had reduced the influence and the affluence of the samurai,drawing increasing numbers of them towards commercial and manufacturing activities. So:
[F]ormer peasants mingled with former warriors in secular occupations coordinated as much bymarket forces as by feudalistic regulations. A class-based commercial society thus developed despitethe efforts of the Tokugawa leaders to maintain the pre-industrial, status-oriented society of oldJapan.
(Light, 1983: 158)
By the early nineteenth century, Japan had moved into a period of crises characterized byfamines and peasant uprisings and the ineptitude of an introverted and self-serving leadership.In 1853 U.S. Admiral Perry arrived in Edo Bay to “persuade” the shogunate to open Japaneseports to trade with the United States and other foreign powers. This neocolonialist threatgalvanized feelings of nationalism and xenophobia and precipitated a period of civil war amongthe shogunate. The outcome was the restoration of the Meiji imperial dynasty in 1868 by aclique of samurai and daimyo who considered industrialization a necessity to maintainingnational independence.
Under the slogan “National Wealth and Military Strength,” the new élite of ex-warriorsset out to modernize Japan as quickly as possible. A distinctive feature of the process was thevery high degree of state involvement. Successive governments intervened to promote industrialdevelopment by fostering capitalist monopolies (zaibatsu). In many instances, whole industrieswere created from public funds and, once established, were sold off to private enterprise atless than cost. Given the prominent concerns over national security, building manufacturingcapabilities and capacity in iron and steel, shipbuilding, and armaments played a prominentrole in the early phase of Japanese modernization. The state facilitated the importation of
5. EVOLUTION OF THE CORE REGIONS 131
6063 GEOGRAPHY WORLD ECON_PT_246x189 mm 22/01/2014 15:10 Page 131
industrial technology and equipment, and foreign advisers (chiefly British) supervised the initialstages of development. Meanwhile, the state invested a considerable amount of resources inhighways, port facilities, the banking system, and public education in an attempt to “buy”modernization. Similarly, government financed the construction of the railway system (underBritish direction) before being sold to private enterprise.
The Japanese financed this modernization by harsh taxes on the agricultural sector. As aresult, a sharp polarization emerged between the urban and the rural economies; one that was characterized by the impoverishment of large numbers of peasant farmers. Yet the moreproductive components of the agrarian sector contributed significantly to Japanese economicgrowth. Improved technology, better seedstock, and the use of fertilizers provided an increaseof 2 percent per annum in rice production during the last quarter of the nineteenth centuryand the first part of the twentieth century, thereby helping to feed the growing nonfarm sectorwithout great dependence on food imports. It is important to note that population growthdid not absorb these increases in agricultural productivity as has been the case for most late-comers to industrialization. The Japanese demographic transition arrived after increases inagricultural productivity had helped to finance an emergent industrial sector but in time toprovide an expanding labor force and market for industrial products.
Several other factors helped to foster rapid industrialization in Japan in the late nineteenthand early twentieth centuries. One was the cultural order that allowed the Japanese to followgovernment leadership and accept new ways of life: A recurring theme in modern Japaneseeconomic history. Another was the success of educational reforms: By 1905, 95 percent of all children of school age received an elementary education. Third, Japanese sericulture (silkproduction) provided the basis for a lucrative export trade that helped finance expenditure onoverseas technology, materials, and expertise. It has been estimated that, between 1870 and1930, the raw silk trade alone was able to finance as much as 40 percent of Japan’s entireimports of raw materials and machinery. Finally, and most important, were the benefits derivingfrom military aggression. Naval victories over China (1894–1895) and Russia (1904–1905),and the annexation of Korea (1910) not only provided expanded markets for Japanese goodsin Asia but also provided indemnities for the losers (which paid for the costs of conquest) andstimulated the armaments industry, shipbuilding, and industrial technology and financialorganization in general.
By the early 1900s a broad spectrum of industries had been successfully established. Most were geared towards the domestic market in a kind of pre-emptive import-substitutionstrategy. The textile industry, however, had already begun to establish an export base. Unableto compete with western countries in the production of high-quality textiles, the Japaneseconcentrated on the production of inexpensive goods, competing initially with westernproducers for markets in Asia. Their success derived largely from labor-intensive processes inwhich high productivity and low wages were maintained through a combination ofexhortations to personal sacrifice in the cause of national independence and strict governmentsuppression of labor unrest.
JAPAN ADVANCES
During the First World War Japan became a major supplier of textiles, armaments, andindustrial equipment on world markets. It nearly doubled its merchant marine tonnage andestablished a balance of payments surplus. Between 1919 and 1929 this position wasconsolidated under government sponsorship. Steel manufacturing, engineering, and textileswere further developed, and aircraft and automobile industries were established. Meanwhile,
RISE OF THE CORE ECONOMIES132
6063 GEOGRAPHY WORLD ECON_PT_246x189 mm 22/01/2014 15:10 Page 132
Japanese innovations began to emerge, weakening its dependence on western technology andproviding an important competitive advantage. This pattern of progress was halted, however,by the stagnation of international trade that followed the stock market collapse of 1929. Onceagain, state intervention provided a critical boost. A massive devaluation of the yen in 1931allowed Japanese producers to undersell competitors on the world market, while a Bureau ofIndustrial Rationalization was established to increase efficiency, lower costs, and weed outsmaller, less profitable concerns.
Although these interventions helped to sustain Japanese industrialization and improve Japan’soverall economic independence, they led directly towards crisis. Western governments—particularly the United States—resisted the purchase of Japanese goods. In Japan, the austeritythat resulted from devaluation and rationalization precipitated social and political unrest. Inresponse, the government increased military expenditure and adopted a more aggressiveterritorial policy. In 1931 the Japanese army advanced into Manchuria and created a puppetstate. In 1936 a military faction gained full political power and, declaring a Greater East AsianCo-Prosperity Sphere, engaged in full-scale war with China the following year. In 1939 Japanattacked British colonies in East Asia, and by 1940 the Japanese “had become heavilycommitted to an industrial empire based on war. In that year, 17 per cent of the entire nationaloutput was for war purposes” (Kornhauser, 1989: 119).
By this time, as the rest of the world quickly realized, Japan had attained the status of anadvanced industrial economy. The military leaders overplayed their hand, however, byattacking the United States. With defeat in 1945, Japanese industry lay in ruins. In 1946, outputwas only 30 percent of the pre-war level; and the United States, having weakened the powerof the zaibatsu and imposed widespread social and political reforms, was set to impose punitivereparations.
THE SECOND MIRACLE: POSTWAR RECONSTRUCTION AND GROWTH
Within five years, the Japanese economy had recovered to its pre-war levels of output.Throughout the 1950s and 1960s the annual rate of growth of the economy held at around10 percent compared with growth rates of around 2 percent per annum in North Americaand western Europe. After beginning the postwar period at the bottom of the internationalmanufacturing league table, Japan rose to join the other developed countries by the 1980s(see Figure 5.5). By 1980, for example, Japan had outstripped, even in absolute terms, all themajor industrial core countries in the production of ships, automobiles, and television sets,and only the Soviet Union produced more steel.
Explanations of this “miracle” have identified a variety of contributory factors. One of themost important was a reversal in United States policy. Cold War strategy, in response to China’spursuit (in 1949) of a communist path to development, dictated that its initial punitive stancetoward Japan would be replaced by massive economic aid in order to create a bastion againstthe spread of communism in East Asia. In return for providing an offshore bastion in thecontainment of the Soviet Union during the early Cold War, Japan was allowed to re-enterthe world economy on terms that were favorable to its economic growth. For example, highJapanese tariffs were tolerated at the same time that the United States sponsored a worldeconomic order based on tariff reduction or removal. The Korean conflict (1950–1953) helpedto reinforce this logic and, at the same time, stimulated the Japanese economy through U.S.expenditure on Japanese supplies and military bases.
Once under way, the reconstruction of the Japanese economy drew on some of its previouslyestablished advantages: A well-educated, flexible, loyal, and relatively cheap labor force; a large
5. EVOLUTION OF THE CORE REGIONS 133
6063 GEOGRAPHY WORLD ECON_PT_246x189 mm 22/01/2014 15:10 Page 133
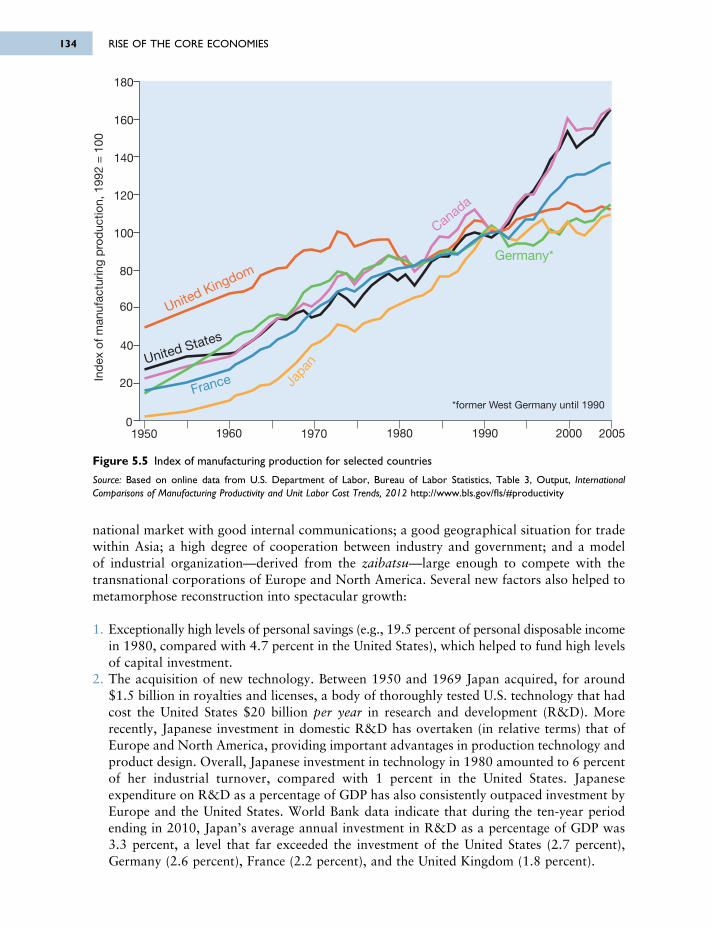
national market with good internal communications; a good geographical situation for tradewithin Asia; a high degree of cooperation between industry and government; and a model of industrial organization—derived from the zaibatsu—large enough to compete with thetransnational corporations of Europe and North America. Several new factors also helped tometamorphose reconstruction into spectacular growth:
1. Exceptionally high levels of personal savings (e.g., 19.5 percent of personal disposable incomein 1980, compared with 4.7 percent in the United States), which helped to fund high levelsof capital investment.
2. The acquisition of new technology. Between 1950 and 1969 Japan acquired, for around$1.5 billion in royalties and licenses, a body of thoroughly tested U.S. technology that hadcost the United States $20 billion per year in research and development (R&D). Morerecently, Japanese investment in domestic R&D has overtaken (in relative terms) that ofEurope and North America, providing important advantages in production technology andproduct design. Overall, Japanese investment in technology in 1980 amounted to 6 percentof her industrial turnover, compared with 1 percent in the United States. Japaneseexpenditure on R&D as a percentage of GDP has also consistently outpaced investment byEurope and the United States. World Bank data indicate that during the ten-year periodending in 2010, Japan’s average annual investment in R&D as a percentage of GDP was3.3 percent, a level that far exceeded the investment of the United States (2.7 percent),Germany (2.6 percent), France (2.2 percent), and the United Kingdom (1.8 percent).
*former West Germany until 1990
Ind
ex o
f man
ufac
turin
g p
rod
uctio
n, 1
992
= 1
00
0
20
40
60
80
100
120
140
160
180
United States
Canada
Japa
n
France
Germany*
United Kingdom
1950 1960 1970 1980 1990 2000 2005
Figure 5.5 Index of manufacturing production for selected countries
Source: Based on online data from U.S. Department of Labor, Bureau of Labor Statistics, Table 3, Output, InternationalComparisons of Manufacturing Productivity and Unit Labor Cost Trends, 2012 http://www.bls.gov/fls/#productivity
RISE OF THE CORE ECONOMIES134
6063 GEOGRAPHY WORLD ECON_PT_246x189 mm 22/01/2014 15:10 Page 134
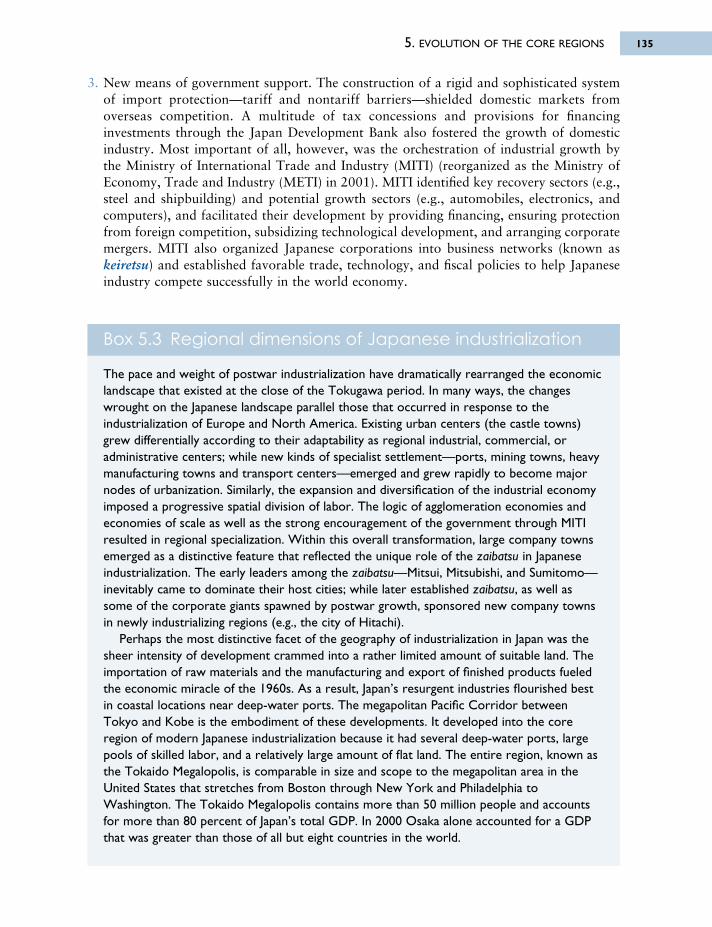
5. EVOLUTION OF THE CORE REGIONS 135
Box 5.3 Regional dimensions of Japanese industrialization
The pace and weight of postwar industrialization have dramatically rearranged the economiclandscape that existed at the close of the Tokugawa period. In many ways, the changeswrought on the Japanese landscape parallel those that occurred in response to theindustrialization of Europe and North America. Existing urban centers (the castle towns)grew differentially according to their adaptability as regional industrial, commercial, oradministrative centers; while new kinds of specialist settlement—ports, mining towns, heavymanufacturing towns and transport centers—emerged and grew rapidly to become majornodes of urbanization. Similarly, the expansion and diversification of the industrial economyimposed a progressive spatial division of labor. The logic of agglomeration economies andeconomies of scale as well as the strong encouragement of the government through MITIresulted in regional specialization. Within this overall transformation, large company townsemerged as a distinctive feature that reflected the unique role of the zaibatsu in Japaneseindustrialization. The early leaders among the zaibatsu—Mitsui, Mitsubishi, and Sumitomo—inevitably came to dominate their host cities; while later established zaibatsu, as well assome of the corporate giants spawned by postwar growth, sponsored new company townsin newly industrializing regions (e.g., the city of Hitachi).
Perhaps the most distinctive facet of the geography of industrialization in Japan was thesheer intensity of development crammed into a rather limited amount of suitable land. Theimportation of raw materials and the manufacturing and export of finished products fueledthe economic miracle of the 1960s. As a result, Japan’s resurgent industries flourished bestin coastal locations near deep-water ports. The megapolitan Pacific Corridor betweenTokyo and Kobe is the embodiment of these developments. It developed into the coreregion of modern Japanese industrialization because it had several deep-water ports, largepools of skilled labor, and a relatively large amount of flat land. The entire region, known asthe Tokaido Megalopolis, is comparable in size and scope to the megapolitan area in theUnited States that stretches from Boston through New York and Philadelphia toWashington. The Tokaido Megalopolis contains more than 50 million people and accountsfor more than 80 percent of Japan’s total GDP. In 2000 Osaka alone accounted for a GDPthat was greater than those of all but eight countries in the world.
3. New means of government support. The construction of a rigid and sophisticated systemof import protection—tariff and nontariff barriers—shielded domestic markets fromoverseas competition. A multitude of tax concessions and provisions for financinginvestments through the Japan Development Bank also fostered the growth of domesticindustry. Most important of all, however, was the orchestration of industrial growth bythe Ministry of International Trade and Industry (MITI) (reorganized as the Ministry ofEconomy, Trade and Industry (METI) in 2001). MITI identified key recovery sectors (e.g.,steel and shipbuilding) and potential growth sectors (e.g., automobiles, electronics, andcomputers), and facilitated their development by providing financing, ensuring protectionfrom foreign competition, subsidizing technological development, and arranging corporatemergers. MITI also organized Japanese corporations into business networks (known askeiretsu) and established favorable trade, technology, and fiscal policies to help Japaneseindustry compete successfully in the world economy.
6063 GEOGRAPHY WORLD ECON_PT_246x189 mm 22/01/2014 15:10 Page 135
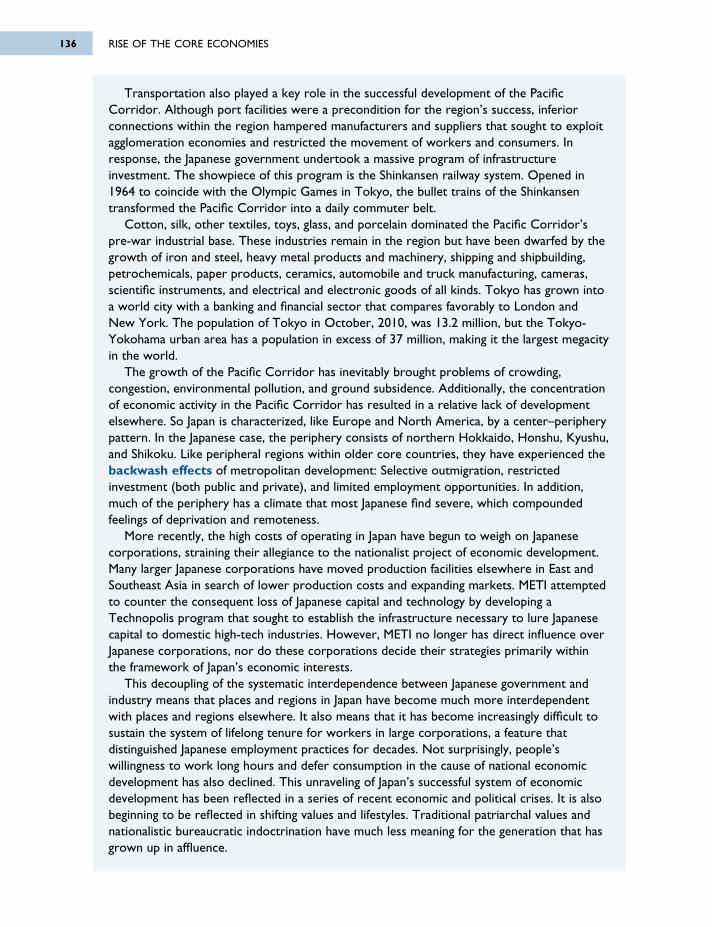
Transportation also played a key role in the successful development of the PacificCorridor. Although port facilities were a precondition for the region’s success, inferiorconnections within the region hampered manufacturers and suppliers that sought to exploitagglomeration economies and restricted the movement of workers and consumers. Inresponse, the Japanese government undertook a massive program of infrastructureinvestment. The showpiece of this program is the Shinkansen railway system. Opened in1964 to coincide with the Olympic Games in Tokyo, the bullet trains of the Shinkansentransformed the Pacific Corridor into a daily commuter belt.
Cotton, silk, other textiles, toys, glass, and porcelain dominated the Pacific Corridor’spre-war industrial base. These industries remain in the region but have been dwarfed by thegrowth of iron and steel, heavy metal products and machinery, shipping and shipbuilding,petrochemicals, paper products, ceramics, automobile and truck manufacturing, cameras,scientific instruments, and electrical and electronic goods of all kinds. Tokyo has grown intoa world city with a banking and financial sector that compares favorably to London and New York. The population of Tokyo in October, 2010, was 13.2 million, but the Tokyo-Yokohama urban area has a population in excess of 37 million, making it the largest megacityin the world.
The growth of the Pacific Corridor has inevitably brought problems of crowding,congestion, environmental pollution, and ground subsidence. Additionally, the concentrationof economic activity in the Pacific Corridor has resulted in a relative lack of developmentelsewhere. So Japan is characterized, like Europe and North America, by a center–peripherypattern. In the Japanese case, the periphery consists of northern Hokkaido, Honshu, Kyushu,and Shikoku. Like peripheral regions within older core countries, they have experienced thebackwash effects of metropolitan development: Selective outmigration, restrictedinvestment (both public and private), and limited employment opportunities. In addition,much of the periphery has a climate that most Japanese find severe, which compoundedfeelings of deprivation and remoteness.
More recently, the high costs of operating in Japan have begun to weigh on Japanesecorporations, straining their allegiance to the nationalist project of economic development.Many larger Japanese corporations have moved production facilities elsewhere in East andSoutheast Asia in search of lower production costs and expanding markets. METI attemptedto counter the consequent loss of Japanese capital and technology by developing aTechnopolis program that sought to establish the infrastructure necessary to lure Japanesecapital to domestic high-tech industries. However, METI no longer has direct influence overJapanese corporations, nor do these corporations decide their strategies primarily withinthe framework of Japan’s economic interests.
This decoupling of the systematic interdependence between Japanese government andindustry means that places and regions in Japan have become much more interdependentwith places and regions elsewhere. It also means that it has become increasingly difficult tosustain the system of lifelong tenure for workers in large corporations, a feature thatdistinguished Japanese employment practices for decades. Not surprisingly, people’swillingness to work long hours and defer consumption in the cause of national economicdevelopment has also declined. This unraveling of Japan’s successful system of economicdevelopment has been reflected in a series of recent economic and political crises. It is alsobeginning to be reflected in shifting values and lifestyles. Traditional patriarchal values andnationalistic bureaucratic indoctrination have much less meaning for the generation that hasgrown up in affluence.
RISE OF THE CORE ECONOMIES136
6063 GEOGRAPHY WORLD ECON_PT_246x189 mm 22/01/2014 15:10 Page 136
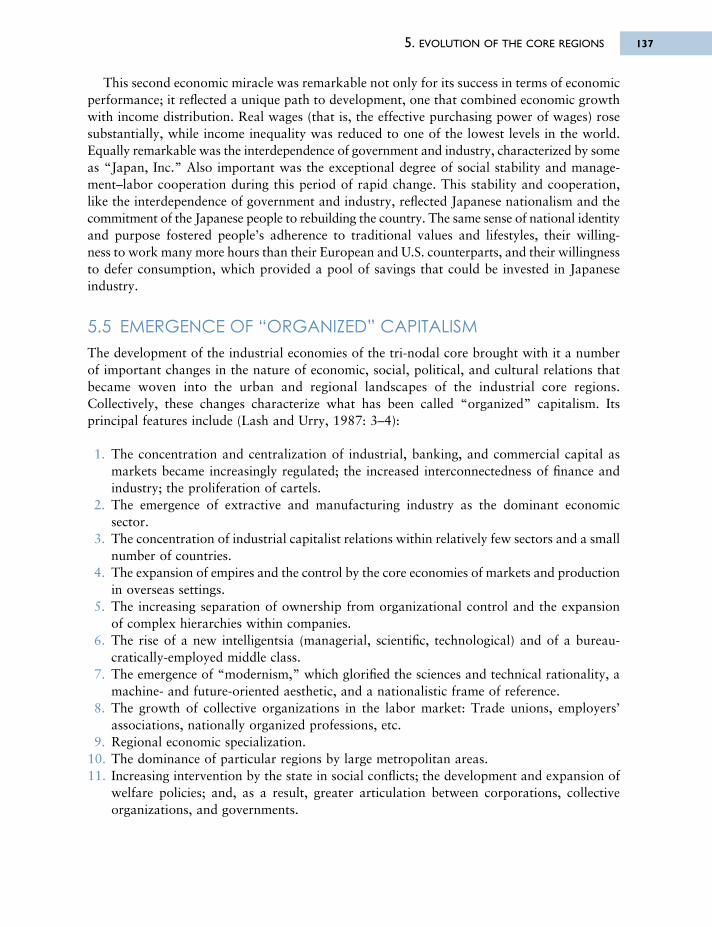
This second economic miracle was remarkable not only for its success in terms of economicperformance; it reflected a unique path to development, one that combined economic growthwith income distribution. Real wages (that is, the effective purchasing power of wages) rosesubstantially, while income inequality was reduced to one of the lowest levels in the world.Equally remarkable was the interdependence of government and industry, characterized by someas “Japan, Inc.” Also important was the exceptional degree of social stability and manage-ment–labor cooperation during this period of rapid change. This stability and cooperation, like the interdependence of government and industry, reflected Japanese nationalism and thecommitment of the Japanese people to rebuilding the country. The same sense of national identityand purpose fostered people’s adherence to traditional values and lifestyles, their willing-ness to work many more hours than their European and U.S. counterparts, and their willingnessto defer consumption, which provided a pool of savings that could be invested in Japaneseindustry.
5.5 EMERGENCE OF “ORGANIZED” CAPITALISMThe development of the industrial economies of the tri-nodal core brought with it a numberof important changes in the nature of economic, social, political, and cultural relations thatbecame woven into the urban and regional landscapes of the industrial core regions.Collectively, these changes characterize what has been called “organized” capitalism. Itsprincipal features include (Lash and Urry, 1987: 3–4):
1. The concentration and centralization of industrial, banking, and commercial capital asmarkets became increasingly regulated; the increased interconnectedness of finance andindustry; the proliferation of cartels.
2. The emergence of extractive and manufacturing industry as the dominant economicsector.
3. The concentration of industrial capitalist relations within relatively few sectors and a smallnumber of countries.
4. The expansion of empires and the control by the core economies of markets and productionin overseas settings.
5. The increasing separation of ownership from organizational control and the expansionof complex hierarchies within companies.
6. The rise of a new intelligentsia (managerial, scientific, technological) and of a bureau -cratically-employed middle class.
7. The emergence of “modernism,” which glorified the sciences and technical rationality, amachine- and future-oriented aesthetic, and a nationalistic frame of reference.
8. The growth of collective organizations in the labor market: Trade unions, employers’associations, nationally organized professions, etc.
9. Regional economic specialization.10. The dominance of particular regions by large metropolitan areas.11. Increasing intervention by the state in social conflicts; the development and expansion of
welfare policies; and, as a result, greater articulation between corporations, collectiveorganizations, and governments.
5. EVOLUTION OF THE CORE REGIONS 137
6063 GEOGRAPHY WORLD ECON_PT_246x189 mm 22/01/2014 15:10 Page 137
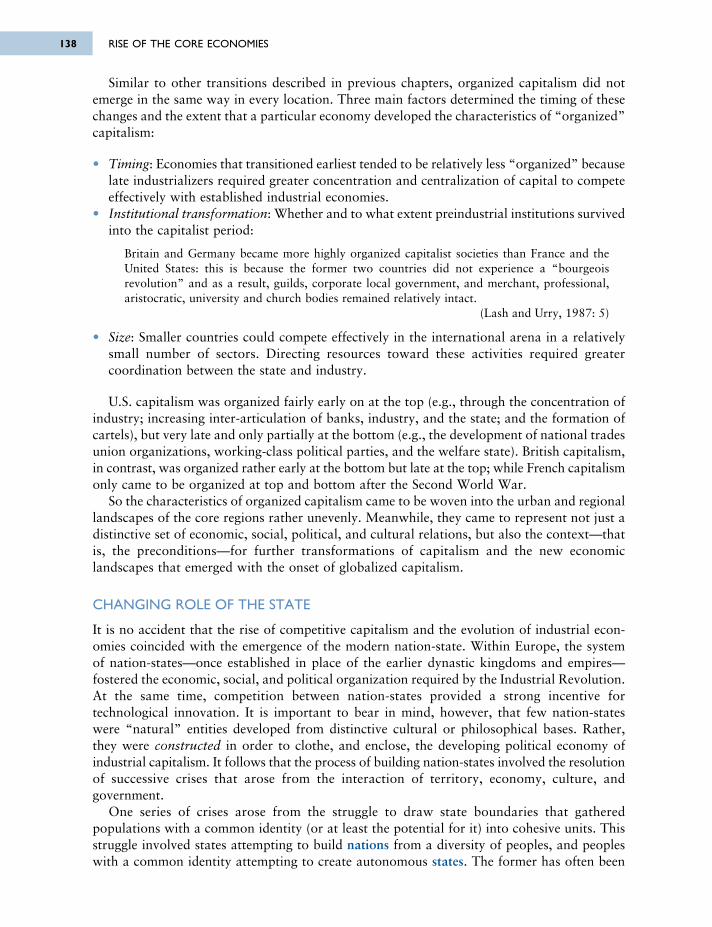
Similar to other transitions described in previous chapters, organized capitalism did notemerge in the same way in every location. Three main factors determined the timing of thesechanges and the extent that a particular economy developed the characteristics of “organized”capitalism:
• Timing: Economies that transitioned earliest tended to be relatively less “organized” becauselate industrializers required greater concentration and centralization of capital to competeeffectively with established industrial economies.
• Institutional transformation: Whether and to what extent preindustrial institutions survivedinto the capitalist period:
Britain and Germany became more highly organized capitalist societies than France and theUnited States: this is because the former two countries did not experience a “bourgeoisrevolution” and as a result, guilds, corporate local government, and merchant, professional,aristocratic, university and church bodies remained relatively intact.
(Lash and Urry, 1987: 5)
• Size: Smaller countries could compete effectively in the international arena in a relativelysmall number of sectors. Directing resources toward these activities required greatercoordination between the state and industry.
U.S. capitalism was organized fairly early on at the top (e.g., through the concentration ofindustry; increasing inter-articulation of banks, industry, and the state; and the formation ofcartels), but very late and only partially at the bottom (e.g., the development of national tradesunion organizations, working-class political parties, and the welfare state). British capitalism,in contrast, was organized rather early at the bottom but late at the top; while French capitalismonly came to be organized at top and bottom after the Second World War.
So the characteristics of organized capitalism came to be woven into the urban and regionallandscapes of the core regions rather unevenly. Meanwhile, they came to represent not just adistinctive set of economic, social, political, and cultural relations, but also the context—thatis, the preconditions—for further transformations of capitalism and the new economiclandscapes that emerged with the onset of globalized capitalism.
CHANGING ROLE OF THE STATE
It is no accident that the rise of competitive capitalism and the evolution of industrial econ -omies coincided with the emergence of the modern nation-state. Within Europe, the systemof nation-states—once established in place of the earlier dynastic kingdoms and empires—fostered the economic, social, and political organization required by the Industrial Revolution.At the same time, competition between nation-states provided a strong incentive fortechnological innovation. It is important to bear in mind, however, that few nation-states were “natural” entities developed from distinctive cultural or philosophical bases. Rather, they were constructed in order to clothe, and enclose, the developing political economy ofindustrial capitalism. It follows that the process of building nation-states involved the resolutionof successive crises that arose from the interaction of territory, economy, culture, andgovernment.
One series of crises arose from the struggle to draw state boundaries that gatheredpopulations with a common identity (or at least the potential for it) into cohesive units. Thisstruggle involved states attempting to build nations from a diversity of peoples, and peopleswith a common identity attempting to create autonomous states. The former has often been
RISE OF THE CORE ECONOMIES138
6063 GEOGRAPHY WORLD ECON_PT_246x189 mm 22/01/2014 15:10 Page 138
perpetrated by powerful regions or groups of neighboring territories. As a result, many nation-states came into being with inbuilt core–periphery contrasts and with sociopolitical tensionscompounding economic differentials. We examine the reaction to these developments inChapter 13.
Another series of crises arose from the increasing degree of organization required bycapitalism. The evolution of the industrial core regions posed a succession of problems, whichresulted in more state intervention in a greater variety of fields. The initial advantage gainedby British manufacturers with the advent of the Industrial Revolution soon promptedbusinessmen elsewhere to realize that the old doctrine of laissez-faire and free trade primarilyserved the interests of the dominant economy. As a result, governments often assumed therole of protectors—through tariffs and quotas—against low-priced British imports.
Meanwhile, the advent of rail transportation mobilized the state in another sphere—investment in infrastructure. Problems of public health, working conditions, housing, and civildisorder induced further state involvement, as did the need to provide a stable price systemfor the successful operation of private industry, the need to manage the cyclical fluctuationsof the industrial economy, and the need to improve the quality of the workforce and its managersthrough formal education. Of course, the effectiveness of government intervention dependedon economic growth. Nevertheless, the wealthiest economies did not necessarily lead the wayin state activity, since public expenditure is mediated through the complex arena of politics.
In detail, then, the development of state functions has been complex; however, two majortrends can be identified:
1. The centralization of the functions of states, whereby local and regional activities have beenrationalized into centralized national bureaucracies as the organization of government hasattempted to keep up with the changing scale of economic organization. With increasinglypowerful central bureaucracies, the power of politicians at both local and national levelshas been constrained and this, in turn, has contributed to crises in the legitimacy of politicalinstitutions. One response has been the intensification of demands for the regional devolutionof power by the representatives of communities in peripheral areas. Another has been thegrowth of forms of direct action in the shape of grassroots pressure groups. Both phenomenaare explored in more detail in Chapter 13.
2. The dramatic expansion of the public economy as governments became increasingly drawninto the creation of welfare states. In most core countries, the public economy channels avast amount of resources into everything from defense, health, education, and income securityto transport, infrastructural development, and industrial investment. In 2010, following theglobal debt crisis, EU statistical office, Eurostat, data indicated that general governmentexpenditure amounted to 50.3 percent of EU GDP with more than half of this amountdedicated to social protection and healthcare.
Indeed, the sheer magnitude of the public economy has come to blur the boundary betweenthe public and the private sectors. Many governments have even been impelled to interveneto prevent the collapse of private corporations (examples have included the U.S. government’sefforts to rescue Lockheed and Chrysler in the 1970s, the UK government’s efforts in the 1980sto sustain British Leyland, as well as the U.S. government’s massive bailout of financialinstitutions including AIG, Bank of America, and Citigroup in 2008 as well as the automanufacturers General Motors and, yet again, Chrysler). Governments everywhere have alsobecome the largest single consumers of the goods produced by private-sector enterprise. Inshort, the public economy is pervasive in its effects on economic well-being.
5. EVOLUTION OF THE CORE REGIONS 139
6063 GEOGRAPHY WORLD ECON_PT_246x189 mm 22/01/2014 15:10 Page 139
GEOGRAPHY OF THE PUBLIC ECONOMY
Most public-sector activity has a geographical expression. One of the most obvious examplesis the deliberate bias of regional policy and planning, a topic we explore in Chapter 13. Inthis section, we emphasize the spatial bias—often unintentional—that results from other aspectsof the public economy.
The geography of public finance is a complex subject that resists attempts for clearcomparisons between countries. It is possible, however, to identify major categories of activityand to illustrate their spatial implications with specific examples:
1. Wages: The salaries of government employees including clerks, bureaucrats, and workersin the armed forces, education, public health, nationalized industries, law enforcement, andthe courts. Expenditure on these salaries is localized in capital cities. In Washington, DC,for example, almost one-third of all earnings come from federal employment. In addition,government salaries can have an important impact in small or medium-sized cities that havebeen selected for specific functions—defense installations, for example, or decentralizedbranches of the bureaucracy (as in the UK government’s relocation of social security officesfrom London to Newcastle-upon-Tyne).
2. Transfers: Payments to particular population groups (e.g., the elderly, the unemployed,families with dependent children) and particular industries (e.g., agricultural subsidies andguaranteed prices). These expenditures involve complex flows of monies and aregeographically localized only in as much as the “target” populations and industries arelocalized.
3. Subcontracting: Purchasing and outsourcing the delivery of goods and services frombusinesses in the private sector. This includes a wide range of items—e.g., buildings, roads,dams, power stations, military equipment, office equipment, and publishing—which canhave highly localized impacts. Defense expenditure, for example, generally tends to besufficiently localized (because it is concentrated to a few large corporations such as GeneralDynamics, McDonnell-Douglas, United Technologies, Boeing, General Electric, Lockheedand Hughes Aircraft in the United States) to create significant multiplier effects. But theresultant spatial bias seems to bear no consistent relationship to core–periphery patternsor to dimensions of economic geography.
4. Local government expenditure: In many core countries, spending by local governments hasapproached the level of expenditure by central governments (although a large portion oflocal expenditure is always dependent on revenues provided by central governments in theform of grants and revenue-sharing funds). What is most striking about local governmentexpenditure is that, after fulfilling their statutory obligations, local governments vary a greatdeal in the amount they spend and the categories of their expenditure. These differencesreflect a complex relationship between local resources, local needs, and the local politicalclimate.
In order to gauge the net impact of these expenditures, we have to set them against thegeography of taxation. Such an exercise is far from straightforward, but we can illustrate thekind of biases that can emerge by reference to federal taxes in the United States. Around 40percent of all federal revenues are derived from personal income taxes, with another 25 percentcoming from taxes on pension trusts and a further 15 percent from taxes on corporate profits.To a large extent, therefore, the geography of federal revenues reflects the geography of incomeand economic health.
RISE OF THE CORE ECONOMIES140
6063 GEOGRAPHY WORLD ECON_PT_246x189 mm 22/01/2014 15:10 Page 140
Yet the structure of the tax system can have less straightforward geographical implications.The federal tax breaks that are geared to encourage business investment in new equipmentand machinery, for example, tend to benefit growth industries in growth areas. By the sametoken, studies of industrial location have shown that tax differences between states are not asignificant factor in inducing industrial relocation.
Although it is difficult to quantify the local effect of these structural characteristics of the taxsystem, the magnitude of the net flows of monies between the federal government and individualstates can be specified. Interstate differentials in such flows have tended to diminish during thepostwar period as the federal tax system has become more uniformly progressive and as statevariations in per capita incomes have narrowed. That said, the marginal impact of the flow of federal funds seems to have been much greater in the South and West. By improving theinfrastructure of communications, transportation, sewage facilities, and energy, the federalgovernment helped to establish the preconditions for the development of new industries in theSunbelt. By direct and indirect investment in electronics research, semiconductors, computers,aeronautics, and scientific instruments in the South and West, the federal government enabledthe Sunbelt to capture some of the most dynamic activities of the advanced capitalist economy.
INCREASING GLOBAL INTERDEPENDENCE
Although the industrial core regions have been the focus of this chapter, the historical processof industrialization must be viewed from a global perspective. Quite simply, the ascent of theindustrial core regions could not have taken place without the foodstuffs, raw materials, andmarkets provided by the rest of the world. In order to ensure the availability of goods and access to markets, the industrial core countries vigorously pursued a second phase ofcolonialism and imperialism, creating a series of trading empires.
As soon as the Industrial Revolution gathered momentum, European colonial powersembarked on the inland penetration of mid-continental grassland zones in order to exploitthem for grain or stock production—although the detailed pattern and timing of thisexploitation was conditioned by innovations such as the railways, barbed wire, andrefrigeration—resulting in the settlement of the prairies and the pampas in the Americas, theveld in Africa, and the Murray-Darling and Canterbury Plains in Australasia. The emigrationthat fuelled this colonization was itself a major factor in the economic development of thecore regions, siphoning off the “surplus” population generated by demographic transition andswollen by the rationalization of rural economies. Meanwhile, as the demand for tropicalplantation products increased, most of the tropical world came under the political control—direct or indirect—of one or another of the industrial core countries.
This expansionism resulted in specialization by the colonies and client states in theproduction of those foodstuffs and raw materials in demand from the industrial core and for which they held a comparative advantage. This specialization, in turn, established a complex pattern of interdependent development that was articulated, above all, in patterns of international trade. From the start, however, this expanded and more closely integratedinternational system was unevenly balanced. On the one hand, the influence of the core countrieson the cultural and institutional organization of the peripheral countries has molded theireconomic organization to fit core-oriented needs and core-inspired philosophies of “develop -ment” (see Chapters 9 through 11). On the other hand, a variety of barriers and imperfectionshave blunted the effectiveness of international trade as an “engine of growth.” While someof the semi-peripheral and peripheral national economies achieved considerable momentumas a result of the stimulus provided by rapidly increasing levels of demand transmitted from
5. EVOLUTION OF THE CORE REGIONS 141
6063 GEOGRAPHY WORLD ECON_PT_246x189 mm 22/01/2014 15:10 Page 141
the industrial core regions, many did not. In general terms, the effective distance from theindustrial core that represented their major market determined the type and profitability ofactivities in semi-peripheral and peripheral regions. Within the resultant zones of specialization,the beneficial effects of trade were conditioned by a variety of factors including variations inclimate, topography, pre-existing systems of agriculture, and population densities. In practice:
The trade impetus to growth was . . . immensely important for Argentina and Uruguay in LatinAmerica, South Africa and Zimbabwe (formerly Southern Rhodesia) in Africa, Australia and New Zealand, and, to a lesser extent, in Sri Lanka (formerly Ceylon). Elsewhere, there was asignificant impact, but this was inadequate to get sustained development going, for example onthe west coast of Africa. For countries such as India, Pakistan, Bangladesh, Iraq and Iran, the export trades were too small relative to the total population to provide much impetus fordevelopment, except in very restricted areas.
(Chisholm, 1982: 88; emphasis added)
In short, the benefits of specialization and international trade enabled some regions andcountries to ascend within the world-system, but it primarily enhanced the position of thoseat the top. For the rest, the prospect of economic growth through trade has been diminished.These regions and countries find themselves at a relative disadvantage in accessing capital which,in turn, affects their use of technology and hinders their ability to realize significant increasesin productivity. As a result, the amount of labor power required to produce a given quantityof exports from the industrial core will generally be much less than that needed to producean equivalent value of exports from peripheral countries. From this point of view, theinternational trade system is characterized by unequal exchange.
Attempts to short-circuit this built-in handicap by borrowing capital with which to purchasenew (but not always appropriate) technology have almost always resulted in a debt trap ascompounded interest on loans has outpaced increases in the rate of productivity.
In addition, many peripheral countries have been affected by another built-in handicap: thedifferential elasticities of demand for their products vis-à-vis those of their trading partnersin the industrial core. In general, the elasticity of demand for primary commodities that arethe staples of the periphery is low, that is, large price reductions in overseas markets elicitonly a modest rise in demand. Similarly, demand for these products increases only slightly inresponse to increases in the purchasing power of consumers in the core countries. Conversely,elasticities of demand for manufactured goods are generally high. The net result is that theterms of trade have tended to work to the cumulative advantage of the industrial core.
Most simply, although the world economy has become characterized by interdependentrelationships as a result of the spatial division of labor, the periphery has carried the burdenof dependency. We explore this theme in detail in Part 3.
5.6 PRINCIPLES OF ECONOMIC GEOGRAPHY: SUMMARIZINGLESSONS FROM THE INDUSTRIAL ERA
The case histories in this chapter illustrate how the increasing complexity of economicorganization and spatial change make it difficult to generalize about organizing principles orcharacteristic features. However, the recurrence of certain elements and the emergence of othersin the development of the economic landscapes of the industrial core regions during theindustrial era can be underscored. Among those elements that carried over from previous erasare the following:
RISE OF THE CORE ECONOMIES142
6063 GEOGRAPHY WORLD ECON_PT_246x189 mm 22/01/2014 15:10 Page 142
• Natural resource distribution—in particular, the importance of iron ore and coal.• Demographic change—the timing of the demographic transition in relation to industrializa-
tion and the role of large-scale migrations in relation to changing labor markets.• Technological change—improvements and innovations in transport and communications.• Territory—specifically, colonialism and territorial expansion as responses to the law of
diminishing returns.• Changes in institutional and sociopolitical settings.• Spatial distribution of investment—changes in response to the shifting comparative
advantages enjoyed by producers in different areas.• Import substitution—as a mechanism of ascent within the world economy.• Militarism and geopolitical change.
In addition, the industrial era saw the emergence of several new dimensions of spatial-economic organization and the increased prominence of others:
• The extension of the world economy to a global scale with a corresponding extension ofthe spatial division of labor and the consequent intensification of the interdependenciesbetween core, semi-periphery, and periphery.
• The replacement of “liberal” merchant capitalism with a competitive and, later, anincreasingly organized form of industrial capitalism characterized by distinct, specializedregional economies organized around growing urban centers.
• The eclipse of the European core of the world economy by the ascent of the United Statesand Japan.
• The emergence of distinctive core–periphery contrasts within the industrial core territoriesof the world economy.
• The agglomeration of industrial activity as a result of the logic of economies of scale andthe multiplier effect.
• The modification of urban systems by the addition of new kinds of town and city—miningtowns, heavy manufacturing centers, power centers, and transport nodes—and the rapidgrowth of larger preindustrial cities as they benefited disproportionately (because of theirestablished markets, entrepreneurship, trading links, and commercial infrastructure) fromthe various growth impulses that characterize industrialization.
• The imprint of cyclical fluctuations in the pace and nature of economic activity.• The “differential of contemporaneousness” in regional economic development—a phe nom -
enon linked to the uneven impacts of the process of technological diffusion and changingtechnology systems.
• The adaptation of private firms to the changing opportunities and constraints of differenttechnology systems resulting in evolving forms of economic organization from simplemanufacturing to machinofacture to Fordism.
• The adaptation of a wider society to these changing forms of economic organization andanother evolutionary process—that of changing regulatory frameworks—in which theincreasing intervention of governments in economic development was the most importantdevelopment.
• The emergence of an “organized” form of capitalism founded on the power and authorityof independent countries; characterized by a sophisticated interdependence of firms,industries, regions, and governments; and forming the basis for core–periphery relationshipsat various geographic scales.
5. EVOLUTION OF THE CORE REGIONS 143
6063 GEOGRAPHY WORLD ECON_PT_246x189 mm 22/01/2014 15:10 Page 143
SUMMARYIn this chapter, we outlined the evolution of the economic geography of the industrial coreregions, analyzing the major processes involved in the relative ascent and decline of countriesand regions within the core of the world economy. Important aspects in the evolution of thecore economies included the following:
• The Industrial Revolution and how industrialization rapidly reshaped economic landscapesin the DCs such that today economic geography within the core of the world economy isdominated by the physical, institutional, and social legacies of industrial capitalism.
• Machinofacture and the spread of industrialization in Europe associated with machineproduction and the organizational setting of the factory. While machinery provided the basisfor higher levels of productivity, factories enabled this productivity to be exploited to itsfullest extent.
• Fordism and associated U.S. industrialization that was partly associated with the emergenceof the United States as a dominant component of the world economy.
• Japanese industrialization that drew on established advantages including a high degree ofcooperation between industry and government and a model of industrial organization—derived from the zaibatsu—large enough to compete with the transnational corporationsof Europe and the United States.
• The emergence of “organized” capitalism in the developed countries. A hallmark of thisperiod was the emergence of a workable relationship between business interests and laborunions. Unions had grown in size and strength in the Progressive Era, and constituted anotherincreasingly important element of “organization.” The role of the state also changed asgovernment expanded the scope of its activities in part to mediate the relationship betweenorganized business and labor.
KEY SOURCES AND SUGGESTED READINGBorchert, J., 1967. American metropolitan evolution, Geographical Review 57, 301–332.Castells, M., 2000. The Information Age: Economy, society and culture: Volume 1, The rise of the network
society, 2nd edn. Oxford: Blackwell.Dunford, M., 1990. Theories of regulation, Society and Space 8, 297–321.Galor, O. and Weil, D., 2000. Population, Technology, and Growth: From Malthusian stagnation to
the demographic transition and beyond, American Economic Review 90(4), 806–828.Hansen, G. and Prescott, E., 2002. Malthus to Solow, American Economic Review 94(2), 1205–1217.Haywood, J., 1998. Historical Atlas of the 19th Century World 1783–1914. New York: Barnes & Noble.Hugill, P., 1994. World Trade Since 1431: Geography, technology, and capitalism. Baltimore, MD: Johns
Hopkins University Press.Hugill, P., 1999. Global Communications Since 1844: Geography, technology, and capitalism. Baltimore,
MD: Johns Hopkins University Press.Pollard, S., 1981. Peaceful Conquest: The industrialization of Europe, 1760–1970. Oxford: Oxford
University Press.
RISE OF THE CORE ECONOMIES144
6063 GEOGRAPHY WORLD ECON_PT_246x189 mm 22/01/2014 15:10 Page 144
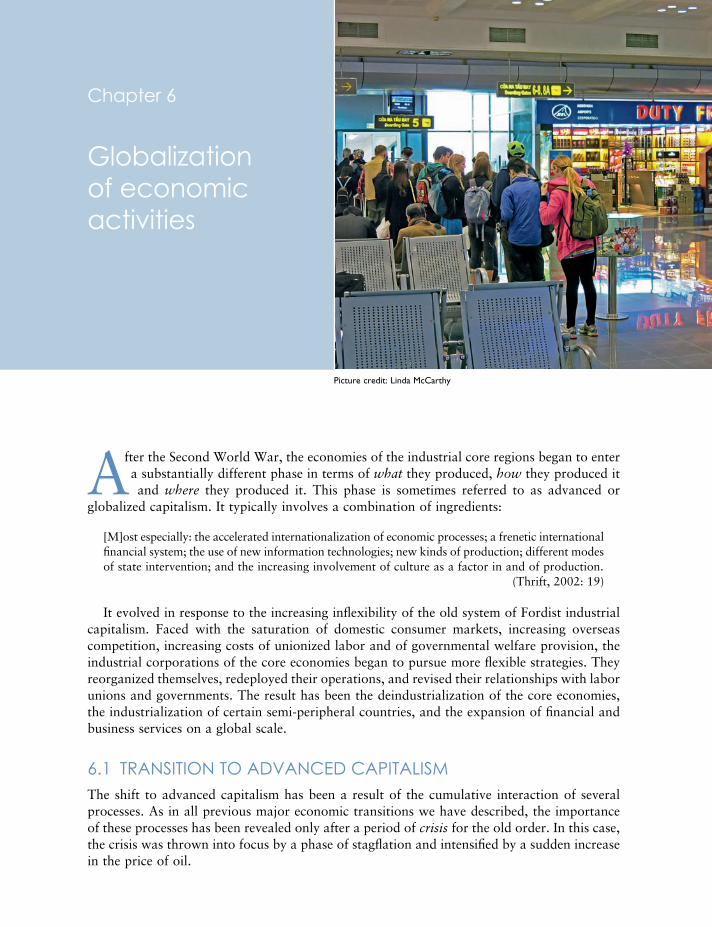
After the Second World War, the economies of the industrial core regions began to enter a substantially different phase in terms of what they produced, how they produced it and where they produced it. This phase is sometimes referred to as advanced or
globalized capitalism. It typically involves a combination of ingredients:
[M]ost especially: the accelerated internationalization of economic processes; a frenetic internationalfinancial system; the use of new information technologies; new kinds of production; different modesof state intervention; and the increasing involvement of culture as a factor in and of production.
(Thrift, 2002: 19)
It evolved in response to the increasing inflexibility of the old system of Fordist industrialcapitalism. Faced with the saturation of domestic consumer markets, increasing overseascompetition, increasing costs of unionized labor and of governmental welfare provision, theindustrial corporations of the core economies began to pursue more flexible strategies. Theyreorganized themselves, redeployed their operations, and revised their relationships with laborunions and governments. The result has been the deindustrialization of the core economies,the industrialization of certain semi-peripheral countries, and the expansion of financial andbusiness services on a global scale.
6.1 TRANSITION TO ADVANCED CAPITALISMThe shift to advanced capitalism has been a result of the cumulative interaction of severalprocesses. As in all previous major economic transitions we have described, the importanceof these processes has been revealed only after a period of crisis for the old order. In this case,the crisis was thrown into focus by a phase of stagflation and intensified by a sudden increasein the price of oil.
Picture credit: Linda McCarthy
Chapter 6
Globalization of economicactivities
6063 GEOGRAPHY WORLD ECON_PT_246x189 mm 22/01/2014 15:10 Page 145
PRELUDE: CRISIS OF FORDISM
The crisis of Fordism emerged abruptly in the early 1970s, throwing into reverse the postwarindustrial boom. This reversal is clearly illustrated by the performance of the U.S. economy.In overall terms, the U.S. economy performed exceptionally well from the late 1940s rightthrough to the early 1970s. Real disposable income per capita rose from just over US$2,200(in constant 1972 dollars) in 1947 to over US$3,800 in 1972. The 1960s were particularlyprosperous, with economic growth averaging over 4 percent per year, as a result expandingGNI by 50 percent over the decade. Meanwhile, the average family obtained a real increaseof over 30 percent in its disposable income; these were the years of J.K. Galbraith’s “affluentsociety.”
After the early 1970s, however, U.S. economic growth averaged only 2.2 percent, whileproductivity in the private business sector, having increased at around 3.3 percent per year in the 1960s, fell away to 1.3 percent per year in the 1970s. “By 1979, the typical family witha $20,000 income had only 7 per cent more real purchasing power than it had a full decadeearlier. The years had brought a mere $25 more per week in purchasing power for the averagefamily” (Bluestone and Harrison, 1982: 4). Unemployment, having remained steady at around4.5 percent until the early 1970s, almost doubled over the next five years, leveling off at around 10 percent by the mid-1980s. The rate of inflation doubled from around 2.5 percentper year in the 1960s to over 5 percent per year in the mid-1980s. Meanwhile, in 1971, theU.S. economy had moved, for the first time during the twentieth century, into a negative tradebalance with the rest of the world; and except for 1973 and 1975, the trade balance hasremained negative ever since.
The system shock precipitated by the rise in oil prices in 1973 as a result of the OPECcartel has been widely cited as a major cause of this downturn (in 1973–1974, petroleum pricesquadrupled as a result of the cartel’s actions). The evidence is inconclusive, however. Similarly,it has been difficult to establish the influence of other popular scapegoats, such as the role oflabor unions in obtaining wage increases in excess of productivity. Rather, the crisis of the1970s must be seen as the product of a conjunction of trends whose origins can be traced tothe 1960s or before. Hamilton (1984) identified several such trends:
1. The stagflation phase of economic cycles. With the downswing of the economic cycle (seeFigure 1.2) there was a slowing down of economic growth and a steady fall in profits,particularly in the industrial core countries. This was associated with falling levels of demandfor capital goods, particularly transport, building, mining and factory equipment (forexample, ships, vehicles, machinery, machine tools) and, as a result, steel. Overall, rates ofgrowth in the OECD countries fell from an annual average of 5 to 6 percent between 1963and 1973 to around 2.5 percent between 1973 and 1978, and less than 1 percent between1979 and 1982.
At the same time, rising levels of inflation generally served to reduce profits and limitcapital for investment. This resulted in greater dependency on financing investment through the banking sector. This, in turn, meant high interest rates that retarded techno -logical investment and so hindered competitiveness. Inflation also raised labor costs, whichincreased the urgency of technological investment (particularly automation) at a time whencapital was expensive. The result was the widespread depression of both capital-intensiveindus tries (for example, steel, shipbuilding, vehicles, appliances) and labor-intensive indus -tries (for example, textiles, clothing, footwear).
RISE OF THE CORE ECONOMIES146
6063 GEOGRAPHY WORLD ECON_PT_246x189 mm 22/01/2014 15:10 Page 146
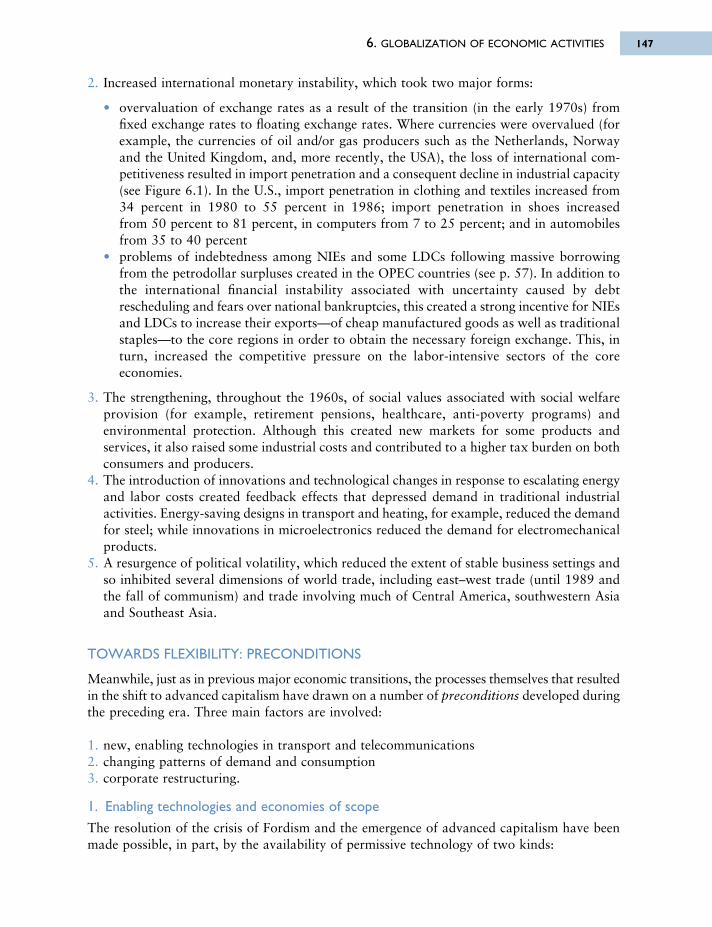
6. GLOBALIZATION OF ECONOMIC ACTIVITIES 147
2. Increased international monetary instability, which took two major forms:
• overvaluation of exchange rates as a result of the transition (in the early 1970s) fromfixed exchange rates to floating exchange rates. Where currencies were overvalued (forexample, the currencies of oil and/or gas producers such as the Netherlands, Norwayand the United Kingdom, and, more recently, the USA), the loss of international com -petitiveness resulted in import penetration and a consequent decline in industrial capacity(see Figure 6.1). In the U.S., import penetration in clothing and textiles increased from34 percent in 1980 to 55 percent in 1986; import penetration in shoes increased from 50 percent to 81 percent, in computers from 7 to 25 percent; and in automobilesfrom 35 to 40 percent
• problems of indebtedness among NIEs and some LDCs following massive borrowingfrom the petrodollar surpluses created in the OPEC countries (see p. 57). In addition tothe international financial instability associated with uncertainty caused by debtrescheduling and fears over national bankruptcies, this created a strong incentive for NIEsand LDCs to increase their exports—of cheap manufactured goods as well as traditionalstaples—to the core regions in order to obtain the necessary foreign exchange. This, inturn, increased the competitive pressure on the labor-intensive sectors of the coreeconomies.
3. The strengthening, throughout the 1960s, of social values associated with social welfareprovision (for example, retirement pensions, healthcare, anti-poverty programs) andenvironmental protection. Although this created new markets for some products andservices, it also raised some industrial costs and contributed to a higher tax burden on bothconsumers and producers.
4. The introduction of innovations and technological changes in response to escalating energyand labor costs created feedback effects that depressed demand in traditional industrialactivities. Energy-saving designs in transport and heating, for example, reduced the demandfor steel; while innovations in microelectronics reduced the demand for electromechanicalproducts.
5. A resurgence of political volatility, which reduced the extent of stable business settings andso inhibited several dimensions of world trade, including east–west trade (until 1989 andthe fall of communism) and trade involving much of Central America, southwestern Asiaand Southeast Asia.
TOWARDS FLEXIBILITY: PRECONDITIONS
Meanwhile, just as in previous major economic transitions, the processes themselves that resultedin the shift to advanced capitalism have drawn on a number of preconditions developed duringthe preceding era. Three main factors are involved:
1. new, enabling technologies in transport and telecommunications2. changing patterns of demand and consumption3. corporate restructuring.
1. Enabling technologies and economies of scope
The resolution of the crisis of Fordism and the emergence of advanced capitalism have beenmade possible, in part, by the availability of permissive technology of two kinds:
6063 GEOGRAPHY WORLD ECON_PT_246x189 mm 22/01/2014 15:10 Page 147
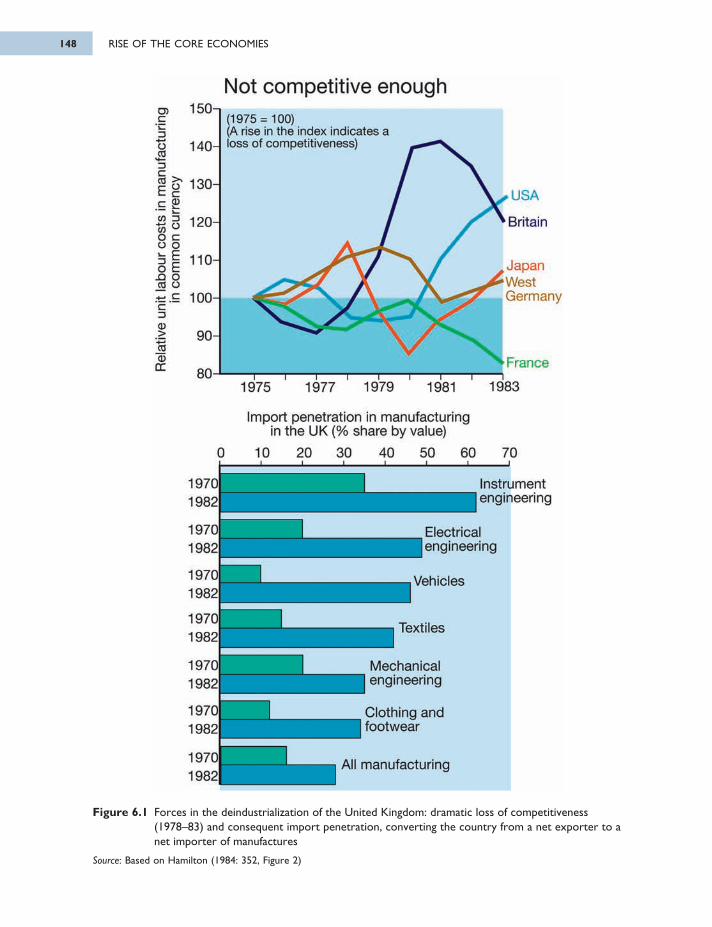
Figure 6.1 Forces in the deindustrialization of the United Kingdom: dramatic loss of competitiveness(1978–83) and consequent import penetration, converting the country from a net exporter to anet importer of manufactures
Source: Based on Hamilton (1984: 352, Figure 2)
RISE OF THE CORE ECONOMIES148
6063 GEOGRAPHY WORLD ECON_PT_246x189 mm 22/01/2014 15:10 Page 148
(1975 = 100)(A rise in the index indicates a loss of competitiveness)
USA
Britain
JapanWestGermanv
France
1975 1977 1979 1981 1983
1 4 0
130
1 2 0
1 1 0
1 0 0
90
80
150O)c
\ _3
IE § c 2</> 3go uO Co o
sin o ra о
cc '3
>
Ф0c
Import penetration in manufacturing in the UK (% share by value)
19701982
19701982
19701982
19701982
19701982
19701982
19701982
All manufacturing
Clothing and footwear
Mechanical I engineering
Textiles
Vehicles
Electrical I engineering
Instrument і engineering
0 10 20 30 40 50 60 70
Not competitive enoughac
D
O
33C03Ec
(/)V iooi_3o
noj
‘cD
0>030
o c
>oc2?•—3OcoEEooc
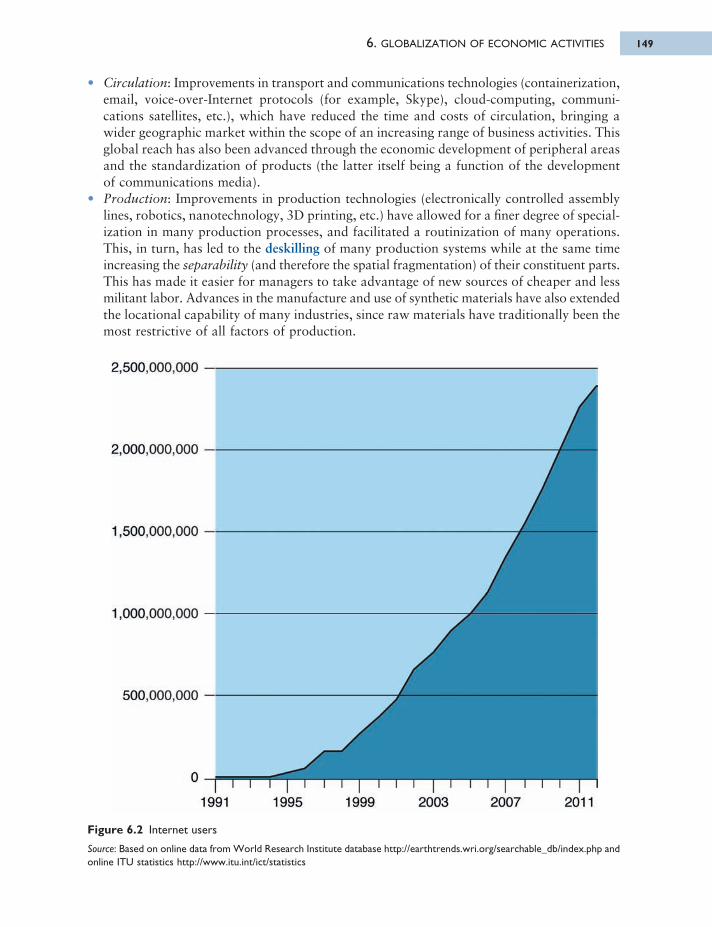
• Circulation: Improvements in transport and communications technologies (containerization,email, voice-over-Internet protocols (for example, Skype), cloud-computing, communi -cations satellites, etc.), which have reduced the time and costs of circulation, bringing awider geographic market within the scope of an increasing range of business activities. Thisglobal reach has also been advanced through the economic development of peripheral areasand the standardization of products (the latter itself being a function of the developmentof communications media).
• Production: Improvements in production technologies (electronically controlled assemblylines, robotics, nanotechnology, 3D printing, etc.) have allowed for a finer degree of special -ization in many production processes, and facilitated a routinization of many operations.This, in turn, has led to the deskilling of many production systems while at the same timeincreasing the separability (and therefore the spatial fragmentation) of their constituent parts.This has made it easier for managers to take advantage of new sources of cheaper and lessmilitant labor. Advances in the manufacture and use of synthetic materials have also extendedthe locational capability of many industries, since raw materials have traditionally been themost restrictive of all factors of production.
6. GLOBALIZATION OF ECONOMIC ACTIVITIES 149
Figure 6.2 Internet users
Source: Based on online data from World Research Institute database http://earthtrends.wri.org/searchable_db/index.php andonline ITU statistics http://www.itu.int/ict/statistics
6063 GEOGRAPHY WORLD ECON_PT_246x189 mm 22/01/2014 15:10 Page 149
2 ,500,000,000
2 ,000 ,000,000
1,500,000,000
1,000,000,000
500,000,000
0 -
1991 1995 1999 2003 2007 2011
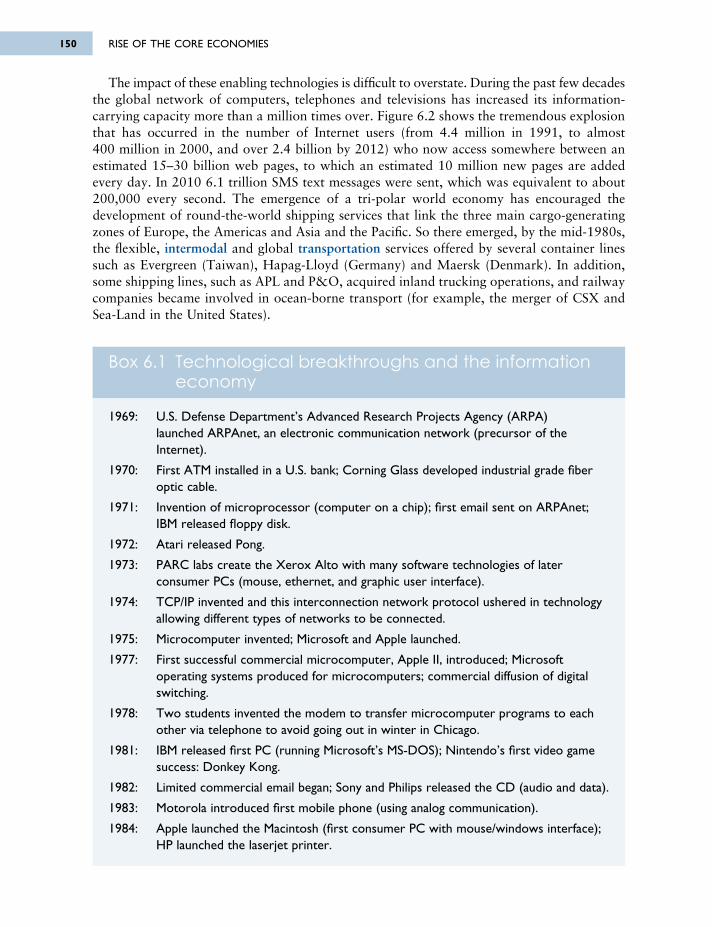
The impact of these enabling technologies is difficult to overstate. During the past few decadesthe global network of computers, telephones and televisions has increased its information-carrying capacity more than a million times over. Figure 6.2 shows the tremendous explosionthat has occurred in the number of Internet users (from 4.4 million in 1991, to almost 400 million in 2000, and over 2.4 billion by 2012) who now access somewhere between anestimated 15–30 billion web pages, to which an estimated 10 million new pages are addedevery day. In 2010 6.1 trillion SMS text messages were sent, which was equivalent to about200,000 every second. The emergence of a tri-polar world economy has encouraged thedevelopment of round-the-world shipping services that link the three main cargo-generatingzones of Europe, the Americas and Asia and the Pacific. So there emerged, by the mid-1980s,the flexible, intermodal and global transportation services offered by several container linessuch as Evergreen (Taiwan), Hapag-Lloyd (Germany) and Maersk (Denmark). In addition,some shipping lines, such as APL and P&O, acquired inland trucking operations, and railwaycompanies became involved in ocean-borne transport (for example, the merger of CSX andSea-Land in the United States).
Box 6.1 Technological breakthroughs and the informationeconomy
1969: U.S. Defense Department’s Advanced Research Projects Agency (ARPA) launched ARPAnet, an electronic communication network (precursor of theInternet).
1970: First ATM installed in a U.S. bank; Corning Glass developed industrial grade fiberoptic cable.
1971: Invention of microprocessor (computer on a chip); first email sent on ARPAnet;IBM released floppy disk.
1972: Atari released Pong.
1973: PARC labs create the Xerox Alto with many software technologies of laterconsumer PCs (mouse, ethernet, and graphic user interface).
1974: TCP/IP invented and this interconnection network protocol ushered in technologyallowing different types of networks to be connected.
1975: Microcomputer invented; Microsoft and Apple launched.
1977: First successful commercial microcomputer, Apple II, introduced; Microsoftoperating systems produced for microcomputers; commercial diffusion of digitalswitching.
1978: Two students invented the modem to transfer microcomputer programs to eachother via telephone to avoid going out in winter in Chicago.
1981: IBM released first PC (running Microsoft’s MS-DOS); Nintendo’s first video gamesuccess: Donkey Kong.
1982: Limited commercial email began; Sony and Philips released the CD (audio and data).
1983: Motorola introduced first mobile phone (using analog communication).
1984: Apple launched the Macintosh (first consumer PC with mouse/windows interface);HP launched the laserjet printer.
RISE OF THE CORE ECONOMIES150
6063 GEOGRAPHY WORLD ECON_PT_246x189 mm 22/01/2014 15:10 Page 150
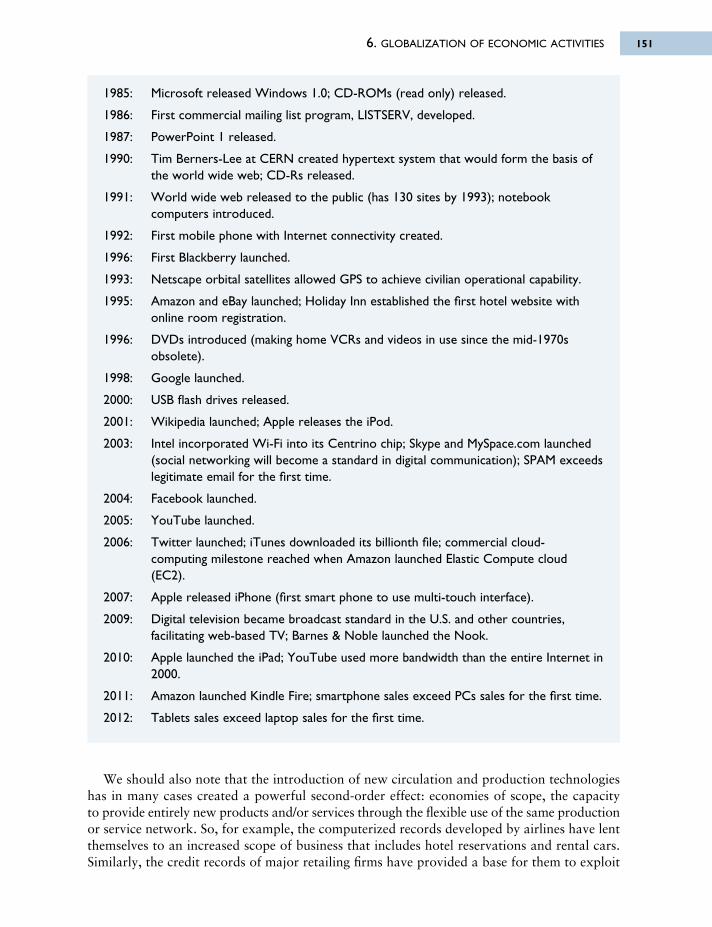
6. GLOBALIZATION OF ECONOMIC ACTIVITIES 151
1985: Microsoft released Windows 1.0; CD-ROMs (read only) released.
1986: First commercial mailing list program, LISTSERV, developed.
1987: PowerPoint 1 released.
1990: Tim Berners-Lee at CERN created hypertext system that would form the basis ofthe world wide web; CD-Rs released.
1991: World wide web released to the public (has 130 sites by 1993); notebookcomputers introduced.
1992: First mobile phone with Internet connectivity created.
1996: First Blackberry launched.
1993: Netscape orbital satellites allowed GPS to achieve civilian operational capability.
1995: Amazon and eBay launched; Holiday Inn established the first hotel website withonline room registration.
1996: DVDs introduced (making home VCRs and videos in use since the mid-1970sobsolete).
1998: Google launched.
2000: USB flash drives released.
2001: Wikipedia launched; Apple releases the iPod.
2003: Intel incorporated Wi-Fi into its Centrino chip; Skype and MySpace.com launched(social networking will become a standard in digital communication); SPAM exceedslegitimate email for the first time.
2004: Facebook launched.
2005: YouTube launched.
2006: Twitter launched; iTunes downloaded its billionth file; commercial cloud-computing milestone reached when Amazon launched Elastic Compute cloud(EC2).
2007: Apple released iPhone (first smart phone to use multi-touch interface).
2009: Digital television became broadcast standard in the U.S. and other countries,facilitating web-based TV; Barnes & Noble launched the Nook.
2010: Apple launched the iPad; YouTube used more bandwidth than the entire Internet in2000.
2011: Amazon launched Kindle Fire; smartphone sales exceed PCs sales for the first time.
2012: Tablets sales exceed laptop sales for the first time.
We should also note that the introduction of new circulation and production technologieshas in many cases created a powerful second-order effect: economies of scope, the capacityto provide entirely new products and/or services through the flexible use of the same productionor service network. So, for example, the computerized records developed by airlines have lentthemselves to an increased scope of business that includes hotel reservations and rental cars.Similarly, the credit records of major retailing firms have provided a base for them to exploit
6063 GEOGRAPHY WORLD ECON_PT_246x189 mm 22/01/2014 15:10 Page 151
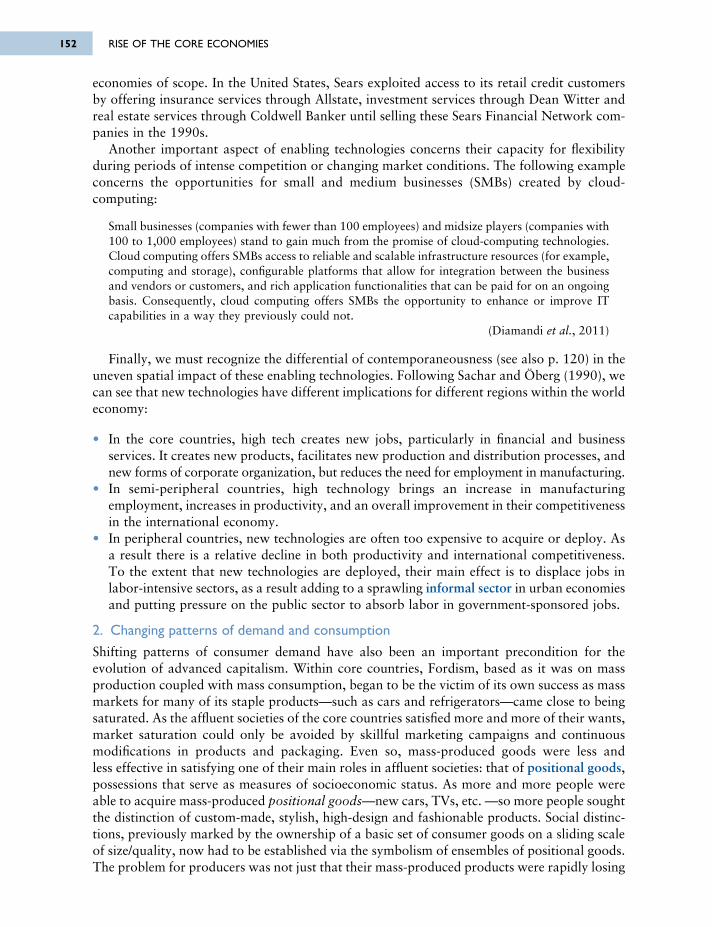
economies of scope. In the United States, Sears exploited access to its retail credit customersby offering insurance services through Allstate, investment services through Dean Witter andreal estate services through Coldwell Banker until selling these Sears Financial Network com -panies in the 1990s.
Another important aspect of enabling technologies concerns their capacity for flexibilityduring periods of intense competition or changing market conditions. The following exampleconcerns the opportunities for small and medium businesses (SMBs) created by cloud-computing:
Small businesses (companies with fewer than 100 employees) and midsize players (companies with100 to 1,000 employees) stand to gain much from the promise of cloud-computing technologies.Cloud computing offers SMBs access to reliable and scalable infrastructure resources (for example,computing and storage), configurable platforms that allow for integration between the businessand vendors or customers, and rich application functionalities that can be paid for on an ongoingbasis. Consequently, cloud computing offers SMBs the opportunity to enhance or improve ITcapabilities in a way they previously could not.
(Diamandi et al., 2011)
Finally, we must recognize the differential of contemporaneousness (see also p. 120) in theuneven spatial impact of these enabling technologies. Following Sachar and Öberg (1990), wecan see that new technologies have different implications for different regions within the worldeconomy:
• In the core countries, high tech creates new jobs, particularly in financial and businessservices. It creates new products, facilitates new production and distribution processes, andnew forms of corporate organization, but reduces the need for employment in manu facturing.
• In semi-peripheral countries, high technology brings an increase in manufacturingemployment, increases in productivity, and an overall improvement in their competitivenessin the international economy.
• In peripheral countries, new technologies are often too expensive to acquire or deploy. Asa result there is a relative decline in both productivity and international competitiveness.To the extent that new technologies are deployed, their main effect is to displace jobs inlabor-intensive sectors, as a result adding to a sprawling informal sector in urban economiesand putting pressure on the public sector to absorb labor in government-sponsored jobs.
2. Changing patterns of demand and consumption
Shifting patterns of consumer demand have also been an important precondition for theevolution of advanced capitalism. Within core countries, Fordism, based as it was on massproduction coupled with mass consumption, began to be the victim of its own success as massmarkets for many of its staple products—such as cars and refrigerators—came close to beingsaturated. As the affluent societies of the core countries satisfied more and more of their wants,market saturation could only be avoided by skillful marketing campaigns and continuousmodifications in products and packaging. Even so, mass-produced goods were less and less effective in satisfying one of their main roles in affluent societies: that of positional goods,possessions that serve as measures of socioeconomic status. As more and more people wereable to acquire mass-produced positional goods—new cars, TVs, etc. —so more people soughtthe distinction of custom-made, stylish, high-design and fashionable products. Social distinc -tions, previously marked by the ownership of a basic set of consumer goods on a sliding scaleof size/quality, now had to be established via the symbolism of ensembles of positional goods.The problem for producers was not just that their mass-produced products were rapidly losing
RISE OF THE CORE ECONOMIES152
6063 GEOGRAPHY WORLD ECON_PT_246x189 mm 22/01/2014 15:10 Page 152
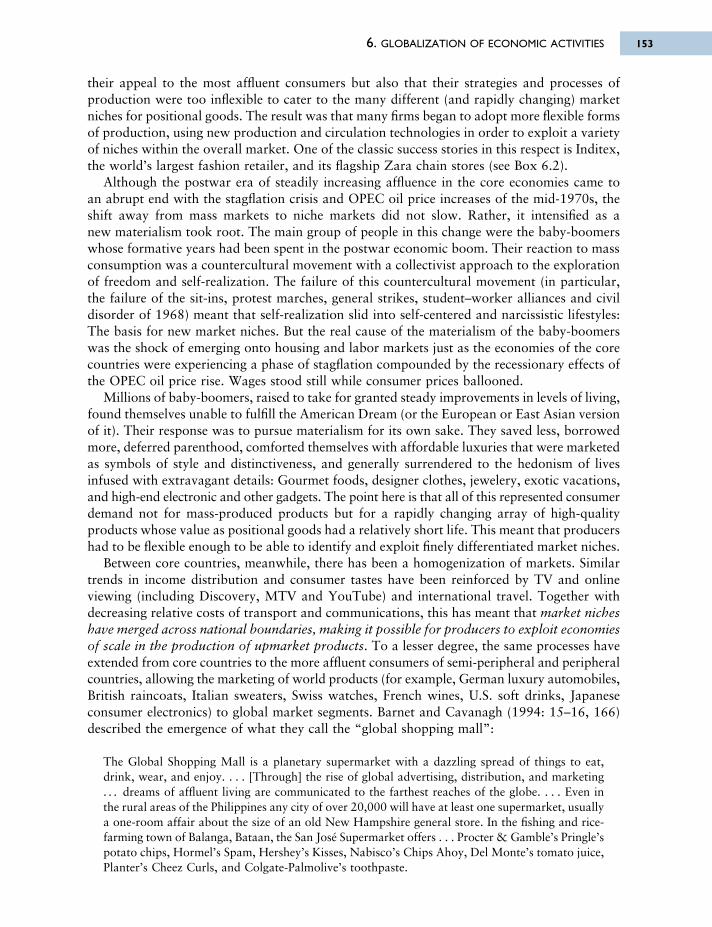
their appeal to the most affluent consumers but also that their strategies and processes ofproduction were too inflexible to cater to the many different (and rapidly changing) marketniches for positional goods. The result was that many firms began to adopt more flexible formsof production, using new production and circulation technologies in order to exploit a varietyof niches within the overall market. One of the classic success stories in this respect is Inditex,the world’s largest fashion retailer, and its flagship Zara chain stores (see Box 6.2).
Although the postwar era of steadily increasing affluence in the core economies came to an abrupt end with the stagflation crisis and OPEC oil price increases of the mid-1970s, theshift away from mass markets to niche markets did not slow. Rather, it intensified as a new materialism took root. The main group of people in this change were the baby-boomerswhose formative years had been spent in the postwar economic boom. Their reaction to massconsumption was a countercultural movement with a collectivist approach to the explorationof freedom and self-realization. The failure of this countercultural movement (in particular,the failure of the sit-ins, protest marches, general strikes, student–worker alliances and civildisorder of 1968) meant that self-realization slid into self-centered and narcissistic lifestyles:The basis for new market niches. But the real cause of the materialism of the baby-boomerswas the shock of emerging onto housing and labor markets just as the economies of the corecountries were experiencing a phase of stagflation compounded by the recessionary effects ofthe OPEC oil price rise. Wages stood still while consumer prices ballooned.
Millions of baby-boomers, raised to take for granted steady improvements in levels of living,found themselves unable to fulfill the American Dream (or the European or East Asian versionof it). Their response was to pursue materialism for its own sake. They saved less, borrowedmore, deferred parenthood, comforted themselves with affordable luxuries that were marketedas symbols of style and distinctiveness, and generally surrendered to the hedonism of livesinfused with extravagant details: Gourmet foods, designer clothes, jewelery, exotic vacations,and high-end electronic and other gadgets. The point here is that all of this represented consumerdemand not for mass-produced products but for a rapidly changing array of high-qualityproducts whose value as positional goods had a relatively short life. This meant that producershad to be flexible enough to be able to identify and exploit finely differentiated market niches.
Between core countries, meanwhile, there has been a homogenization of markets. Similartrends in income distribution and consumer tastes have been reinforced by TV and onlineviewing (including Discovery, MTV and YouTube) and international travel. Together withdecreasing relative costs of transport and communications, this has meant that market nicheshave merged across national boundaries, making it possible for producers to exploit economiesof scale in the production of upmarket products. To a lesser degree, the same processes haveextended from core countries to the more affluent consumers of semi-peripheral and peripheralcountries, allowing the marketing of world products (for example, German luxury automobiles,British raincoats, Italian sweaters, Swiss watches, French wines, U.S. soft drinks, Japaneseconsumer electronics) to global market segments. Barnet and Cavanagh (1994: 15–16, 166)described the emergence of what they call the “global shopping mall”:
The Global Shopping Mall is a planetary supermarket with a dazzling spread of things to eat,drink, wear, and enjoy. . . . [Through] the rise of global advertising, distribution, and marketing. . . dreams of affluent living are communicated to the farthest reaches of the globe. . . . Even inthe rural areas of the Philippines any city of over 20,000 will have at least one supermarket, usuallya one-room affair about the size of an old New Hampshire general store. In the fishing and rice-farming town of Balanga, Bataan, the San José Supermarket offers . . . Procter & Gamble’s Pringle’spotato chips, Hormel’s Spam, Hershey’s Kisses, Nabisco’s Chips Ahoy, Del Monte’s tomato juice,Planter’s Cheez Curls, and Colgate-Palmolive’s toothpaste.
6. GLOBALIZATION OF ECONOMIC ACTIVITIES 153
6063 GEOGRAPHY WORLD ECON_PT_246x189 mm 22/01/2014 15:10 Page 153
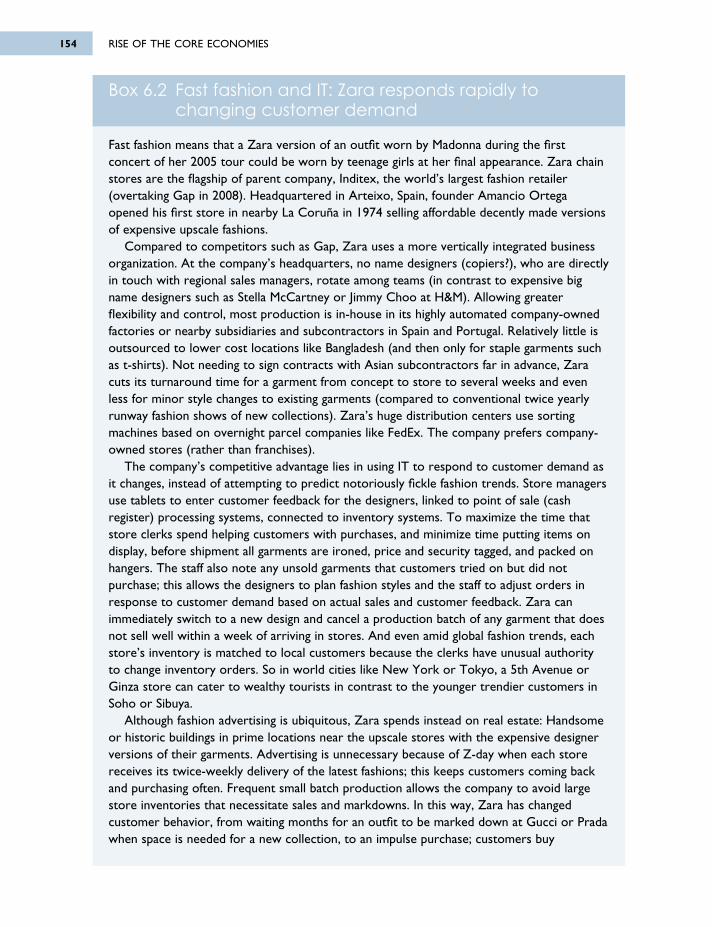
Box 6.2 Fast fashion and IT: Zara responds rapidly tochanging customer demand
Fast fashion means that a Zara version of an outfit worn by Madonna during the firstconcert of her 2005 tour could be worn by teenage girls at her final appearance. Zara chainstores are the flagship of parent company, Inditex, the world’s largest fashion retailer(overtaking Gap in 2008). Headquartered in Arteixo, Spain, founder Amancio Ortegaopened his first store in nearby La Coruña in 1974 selling affordable decently made versionsof expensive upscale fashions.
Compared to competitors such as Gap, Zara uses a more vertically integrated businessorganization. At the company’s headquarters, no name designers (copiers?), who are directlyin touch with regional sales managers, rotate among teams (in contrast to expensive bigname designers such as Stella McCartney or Jimmy Choo at H&M). Allowing greaterflexibility and control, most production is in-house in its highly automated company-ownedfactories or nearby subsidiaries and subcontractors in Spain and Portugal. Relatively little isoutsourced to lower cost locations like Bangladesh (and then only for staple garments suchas t-shirts). Not needing to sign contracts with Asian subcontractors far in advance, Zaracuts its turnaround time for a garment from concept to store to several weeks and evenless for minor style changes to existing garments (compared to conventional twice yearlyrunway fashion shows of new collections). Zara’s huge distribution centers use sortingmachines based on overnight parcel companies like FedEx. The company prefers company-owned stores (rather than franchises).
The company’s competitive advantage lies in using IT to respond to customer demand asit changes, instead of attempting to predict notoriously fickle fashion trends. Store managersuse tablets to enter customer feedback for the designers, linked to point of sale (cashregister) processing systems, connected to inventory systems. To maximize the time thatstore clerks spend helping customers with purchases, and minimize time putting items ondisplay, before shipment all garments are ironed, price and security tagged, and packed onhangers. The staff also note any unsold garments that customers tried on but did notpurchase; this allows the designers to plan fashion styles and the staff to adjust orders inresponse to customer demand based on actual sales and customer feedback. Zara canimmediately switch to a new design and cancel a production batch of any garment that doesnot sell well within a week of arriving in stores. And even amid global fashion trends, eachstore’s inventory is matched to local customers because the clerks have unusual authorityto change inventory orders. So in world cities like New York or Tokyo, a 5th Avenue orGinza store can cater to wealthy tourists in contrast to the younger trendier customers inSoho or Sibuya.
Although fashion advertising is ubiquitous, Zara spends instead on real estate: Handsomeor historic buildings in prime locations near the upscale stores with the expensive designerversions of their garments. Advertising is unnecessary because of Z-day when each storereceives its twice-weekly delivery of the latest fashions; this keeps customers coming backand purchasing often. Frequent small batch production allows the company to avoid largestore inventories that necessitate sales and markdowns. In this way, Zara has changedcustomer behavior, from waiting months for an outfit to be marked down at Gucci or Pradawhen space is needed for a new collection, to an impulse purchase; customers buy
RISE OF THE CORE ECONOMIES154
6063 GEOGRAPHY WORLD ECON_PT_246x189 mm 22/01/2014 15:10 Page 154
6. GLOBALIZATION OF ECONOMIC ACTIVITIES 155
3. Logic of corporate restructuringOne of the most important preconditions for advanced capitalism and the globalization ofbusiness activity has been the restructuring of the corporate world. In response to changingcircumstances, private business has had to develop new strategies in order to survive; strategiesthat have significantly altered the fortunes of different kinds of cities, regions, and countries.
Two of the most important outcomes overall have been corporate concentration andcentralization. Concentration involves the elimination of small, weak firms in particularspheres of economic activity, partly through competition, and partly through mergers andacquisitions. Centralization involves the merging of the resultant large corporations fromdifferent spheres of economic activity to form giant conglomerates with a diversified range ofactivities. Such corporations are often transnational in their operations, having establishedoverseas subsidiaries, taken over foreign competitors, or bought into profitable foreignbusinesses.
In every industry, there are limits both to the extent to which productivity can be increasedand to which consumers can be induced to purchase more. As competition to maintain profitlevels becomes more intense, some firms will be driven out of business while others will betaken over by stronger competitors in a process of horizontal integration. A successfulautomobile manufacturer, for example, might buy out other automobile manufacturers.
Meanwhile, the chances of new firms being successful tend to be diminished, since the largerexisting corporations are able to draw on economies of scale in order to edge out smallercompetitors by price cutting. But even giant corporations cannot prevent market saturationindefinitely; and they are, in any case, always vulnerable to unforeseen shifts in demand. Acommon corporate strategy has therefore been to engage in vertical integration (taking overthe firms that provide their inputs and/or those that purchase their output) in an attempt tocapture a greater proportion of the final selling price. The automobile manufacturer, forexample, might take over companies that make specialized components like engines or carnavigation systems; and/or companies that distribute or sell automobiles. The net result is theconcentration of production, within most industries, in the hands of a diminishing number ofincreasingly large companies.
Alternatively—or in addition—diagonal integration (taking over firms whose activities arecompletely unrelated to their own) offers the chance of gaining access to more profitable marketsand/or less expensive factors of production. Staying with the same example, the automobilemanufacturer may buy into energy, advertising, or entertainment companies. The net resultin this case is the centralization of assets, jobs, production, and decisions about economic lifein the hands of an even smaller number of even larger companies.
immediately at full price because the cost is low, the outfit is unlikely to be worn by a co-worker, but will not be in the store on a return trip.
Whether this kind of fast fashion is sustainable is a concern, given that customers arebuying many more garments than they really need because the purchase price is so low. Yetthere is a high environmental cost in terms of the use of chemicals, water, transportation,and so on. While certainly not the only company outed in Greenpeace’s 2012 Toxic Threadsreport, tests indicated that some of Zara’s garments contained nonylphenol ethoxylates thatbreak down and form toxic hormone-disrupting chemicals and dyes that can releasecarcinogenic amine.
6063 GEOGRAPHY WORLD ECON_PT_246x189 mm 22/01/2014 15:10 Page 155
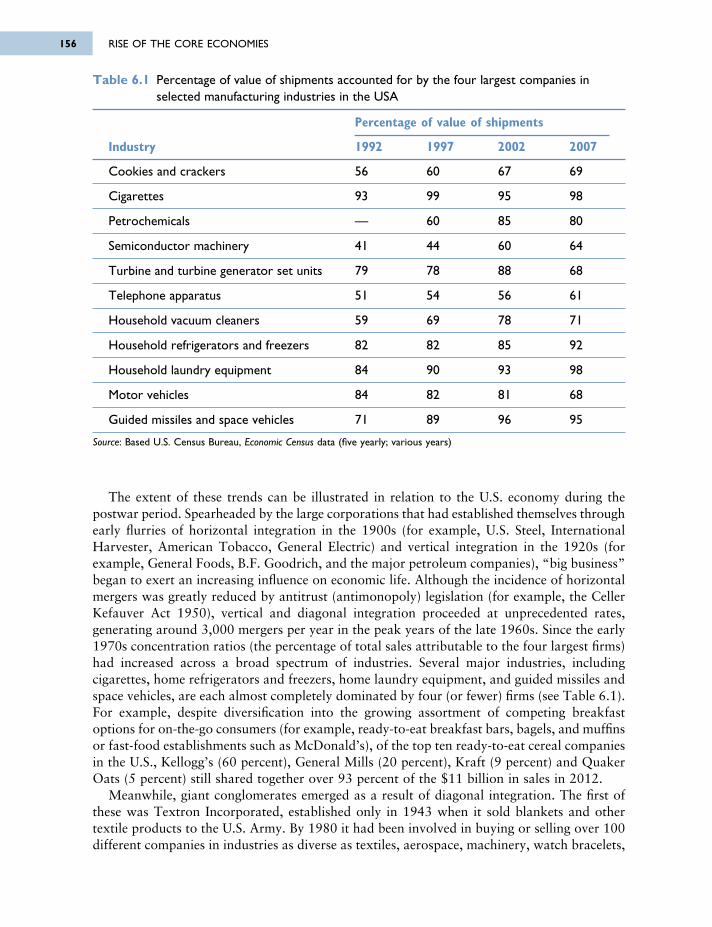
The extent of these trends can be illustrated in relation to the U.S. economy during thepostwar period. Spearheaded by the large corporations that had established themselves throughearly flurries of horizontal integration in the 1900s (for example, U.S. Steel, InternationalHarvester, American Tobacco, General Electric) and vertical integration in the 1920s (forexample, General Foods, B.F. Goodrich, and the major petroleum companies), “big business”began to exert an increasing influence on economic life. Although the incidence of horizontalmergers was greatly reduced by antitrust (antimonopoly) legislation (for example, the CellerKefauver Act 1950), vertical and diagonal integration proceeded at unprecedented rates,generating around 3,000 mergers per year in the peak years of the late 1960s. Since the early1970s concentration ratios (the percentage of total sales attributable to the four largest firms)had increased across a broad spectrum of industries. Several major industries, includingcigarettes, home refrigerators and freezers, home laundry equipment, and guided missiles andspace vehicles, are each almost completely dominated by four (or fewer) firms (see Table 6.1).For example, despite diversification into the growing assortment of competing breakfastoptions for on-the-go consumers (for example, ready-to-eat breakfast bars, bagels, and muffinsor fast-food establishments such as McDonald’s), of the top ten ready-to-eat cereal companiesin the U.S., Kellogg’s (60 percent), General Mills (20 percent), Kraft (9 percent) and QuakerOats (5 percent) still shared together over 93 percent of the $11 billion in sales in 2012.
Meanwhile, giant conglomerates emerged as a result of diagonal integration. The first ofthese was Textron Incorporated, established only in 1943 when it sold blankets and othertextile products to the U.S. Army. By 1980 it had been involved in buying or selling over 100different companies in industries as diverse as textiles, aerospace, machinery, watch bracelets,
Table 6.1 Percentage of value of shipments accounted for by the four largest companies inselected manufacturing industries in the USA
Percentage of value of shipments
Industry 1992 1997 2002 2007
Cookies and crackers 56 60 67 69
Cigarettes 93 99 95 98
Petrochemicals –– 60 85 80
Semiconductor machinery 41 44 60 64
Turbine and turbine generator set units 79 78 88 68
Telephone apparatus 51 54 56 61
Household vacuum cleaners 59 69 78 71
Household refrigerators and freezers 82 82 85 92
Household laundry equipment 84 90 93 98
Motor vehicles 84 82 81 68
Guided missiles and space vehicles 71 89 96 95
Source: Based U.S. Census Bureau, Economic Census data (five yearly; various years)
RISE OF THE CORE ECONOMIES156
6063 GEOGRAPHY WORLD ECON_PT_246x189 mm 22/01/2014 15:10 Page 156
and pens. Textron was by no means an isolated example, however. As early as 1955 the majorityof mergers taking place in the U.S. were diagonal, conglomerate mergers. By the early 1990snine out of every ten mergers involved conglomerate companies.
As a result of all this merger activity, giant conglomerates increasingly influence the world’score economies. For example, between 1950 and 1980 the 50 largest U.S. corporationsincreased their share of the total value added in all manufacturing from less than 20 percentto nearly 30 percent; and the largest 200 increased their share from 30 percent to 50 percent.Similar trends have occurred in the services sector (where the control of variety stores,department stores, car rental firms, motion picture distribution and data processing had becomeparticularly centralized). In the U.S., for example, the ten largest cable operators serve morethan 80 percent of all cable subscribers, with the largest two, Comcast with more than 22million subscribers and TimeWarner Cable with over 12 million subscribers together servingabout 47 percent of all cable subscribers. Four companies dominated the mobile phonemarket in 2012 with the following shares of subscribers: Verizon Wireless (33 percent), AT&TMobility (30 percent), Sprint Nextel (16 percent) and T-Mobile (9 percent). The top fivecompanies worldwide for tablet shipments (of nearly 130 million in 2012) were Apple (withjust over 50 percent of shipments) followed by Samsung, Amazon.com, ASUS (for Google)and Barnes & Noble.
Internet users have even been visiting fewer websites recently (perhaps partly due todominant websites such as Google not only being a search engine but also offering email andsocial network services). Online music has also seen a shift to fewer commercial providers asiTunes has become music’s biggest retailer; the company also dominates the digital video marketwith about two-thirds of both TV show and movie sales. Although peer-to-peer (P2P) file sharinghas spawned free download companies since the days of Napster, copyright infringementlawsuits forced many to shut down while lawsuits against individuals have made some peoplethink twice about downloading bit torrent files.
Because of their size, the larger elements of U.S. conglomerates have also come to exert anincreasing influence in the international economy. This is not surprising given that the annualrevenue of the very largest business enterprises like Wal-Mart and General Motors are greaterthan the GDP of countries such as Austria and South Africa. Perhaps more significant is thefact that the combined overseas output of U.S.-based transnational corporations (TNCs) isnow larger than the GDP of every country in the world except the USA itself. As we will see(Chapter 12), this dimension of the international economy has come to represent a seriouseconomic threat to small countries, and it has prompted the creation of a variety ofinternational and supranational economic and political organizations.
It should be stressed that the United States has by no means been the only core country togenerate giant conglomerates. Major TNCs have been bred in Europe, Japan, Canada, andAustralasia in response to the same logic that has applied to the U.S.; and some NIEs andperipheral countries now have large home-based transnational corporations. Indeed, thesecompanies have been increasing their share of world markets at the expense of U.S.-based companies; and some of them have extended their operations to the U.S. itself. TheSouth Korean conglomerate Samsung Group, for example (the world’s largest maker of TVs, LCD panels, mobile handsets, and computer memory chips, with a global workforce ofmore than 350,000 and annual revenue of about US$250 billion) has multiple subsidiariesand affiliates including those that produce, market, and sell a wide range of electronic partsand components including smartphones and semiconductors. The company’s designers workin design centers in Seoul, London, San Francisco, Tokyo, Shanghai, and Delhi. Overall, the
6. GLOBALIZATION OF ECONOMIC ACTIVITIES 157
6063 GEOGRAPHY WORLD ECON_PT_246x189 mm 22/01/2014 15:10 Page 157
number of transnational corporations increased from just over 7,000 in the early 1970s tomore than 80,000 today. Together, these corporations have several hundred thousand foreignaffiliates and the largest five hundred account for more than US$15 trillion in worldwide annualsales.
EVOLUTION OF TRANSNATIONAL CORPORATE ACTIVITY
The current importance of transnational corporations in the world economy is the result ofan evolutionary process that can be characterized in terms of three distinctive phases (withreference to the experience of U.S.-based TNCs):
• Phase I: Beginning in the nineteenth century and extending to 1940, this phase wasdominated by investment directed at obtaining raw materials—mainly oil and minerals—for domestic manufacturing operations.
• Phase II: After the Second World War, some of the leading corporations began to use foreigndirect investment (FDI) in overseas production operations as a means of penetrating foreignconsumer markets. Initially, the focus of this investment was western Europe, where theMarshall Plan, NATO rearmament and the U.S. military presence in West Germanyprovided useful information feedback and points of entry to an expanding consumermarket. Meanwhile, the establishment of the U.S. dollar as the world’s principal reservecurrency at the 1944 Bretton Woods conference (see Chapter 2), had made it much easierfor U.S. companies to buy into foreign industries. It was not long before many U.S. firmsbegan to penetrate the expanding markets of parts of the rest of the world, particularly inLatin America. The resulting mergers and acquisitions often led to the restructuring ofcorporate production processes.
Bulova Watch is a good example. Bulova originally manufactured watch movements inSwitzerland and shipped them to Pago Pago in American Samoa where they were assembledand shipped for sale in the United States. Bluestone and Harrison (1982: 114) reported thatCorporation President Harry B. Henshel said about this arrangement: “We are able to beatthe foreign competition because we are the foreign competition.” Bulova is nowheadquartered in New York City with operations in Switzerland, the UK, Italy, Canada,China, Japan, and Mexico.
Between 1957 and 1967, 20 percent of all new U.S. machinery plants, 25 percent of newchemical plants, and over 30 percent of new transport equipment plants were located abroad.By 1970, almost 75 percent of U.S. imports were transactions between the domestic andforeign subsidiaries of transnational corporations. By the end of the 1970s overseas profitsaccounted for one-third or more of the overall profits of the 100 largest transnationalproducers and banks.
• Phase III: During the 1970s the crisis and destabilization associated with the episode ofstagflation brought growing competition from goods produced in the NIEs with cheap labor.In addition, the collapse of the Bretton Woods Agreement in 1971 increased the value ofthe U.S. dollar, making imported goods cheaper, and making it easier for European andJapanese TNCs to penetrate U.S. markets. In response, U.S. transnational corporations beganto restructure their production processes once again, eliminating the duplication of activitiesbetween domestic and foreign-based facilities, and reorganizing the division of tasks betweenthem.
RISE OF THE CORE ECONOMIES158
6063 GEOGRAPHY WORLD ECON_PT_246x189 mm 22/01/2014 15:10 Page 158
Effectively, this third phase has meant:
1. retaining existing facilities that require high inputs of technology and/or skilled labor (forexample, headquarter offices in, for example, the United States and Europe)
2. the further redeployment of capital, bringing peripheral countries into the production spaceof U.S. companies in order to benefit from lower labor costs (in 2011 the costs of hourlycompensation for production workers in manufacturing industries in Singapore and SouthKorea were between about 19 and 23 percent of those for U.S. workers; in Mexico andBrazil, they were between 6 and 12 percent; and in China, they were less than 5 percent)
3. withdrawing from locations where unskilled and semi-skilled labor is more expensive(particularly the United States and Europe—in 2011, for example, the costs of hourlycompensation for production workers in manufacturing industries in Germany, Switzerland,and the Scandinavian countries were between about 124 and 181 percent of those for U.S.workers), by using foreign subcontractors.
So, for example, General Electric added 30,000 foreign jobs to its payroll during the 1970swhile reducing its U.S. employment by 25,000. Nike is a good example of the consequencesof this third phase. This company sold its manufacturing plants in the United States and UnitedKingdom and now subcontracts out all its production. The geography of Nike’s productionnetwork has changed over time to reflect changing labor costs across the LDCs. Nike shoeproduction was initially carried out in Japan, but was later relocated to Taiwan and SouthKorea. Today, Nike products are manufactured in more than 750 factories by subcontractorsemploying over 1 million workers across more than 40 countries with low labor costs,including Argentina, Bangladesh, Brazil, Bulgaria, China, India, Indonesia, South Africa, andVietnam.
6.2 PATTERNS AND PROCESSES OF GLOBALIZATIONMost of the world’s population now lives in countries that are either integrated into worldmarkets for goods and finance, or rapidly becoming so. As recently as the late 1970s, only afew peripheral countries had opened their borders to flows of trade and investment capital.About one-third of the world’s labor force lived in countries such as the former Soviet Unionand China with centrally planned economies, and at least another third lived in countriesinsulated from international markets by prohibitive trade barriers, and currency controls. Withnearly half the world’s labor force among them, three giant population blocs—China, Russiaand India—have rapidly integrated into the global market.
Globalization, although incorporating more of the world, more completely, into thecapitalist world-system, has intensified the differences between the core and the periphery.During the last 50 years, the average per capita income in the wealthiest 20 countriesmultiplied by 21 times while that in the poorest 20 countries multiplied by 13 times. Someparts of the periphery have really struggled. In Sub-Saharan Africa, economic output fell byone-third during the 1980s. Unlike many other LDCs that managed to restore growth in theearly 1990s, Sub-Saharan Africa experienced growth during the 1990s that merely matchedthe population growth rate (with average annual GDP growth of less than 2.5 percent for1990–2000) due to “a combination of adverse external developments, structural and institu -tional bottlenecks and policy errors” (UNCTAD, 2001). Although GDP growth rose to over4.5 percent during the 2000s, average per capita incomes in Sub-Saharan Africa adjusted forinflation were lower in 1990 and 2000 compared to in 1980, and grew by an average of only
6. GLOBALIZATION OF ECONOMIC ACTIVITIES 159
6063 GEOGRAPHY WORLD ECON_PT_246x189 mm 22/01/2014 15:10 Page 159
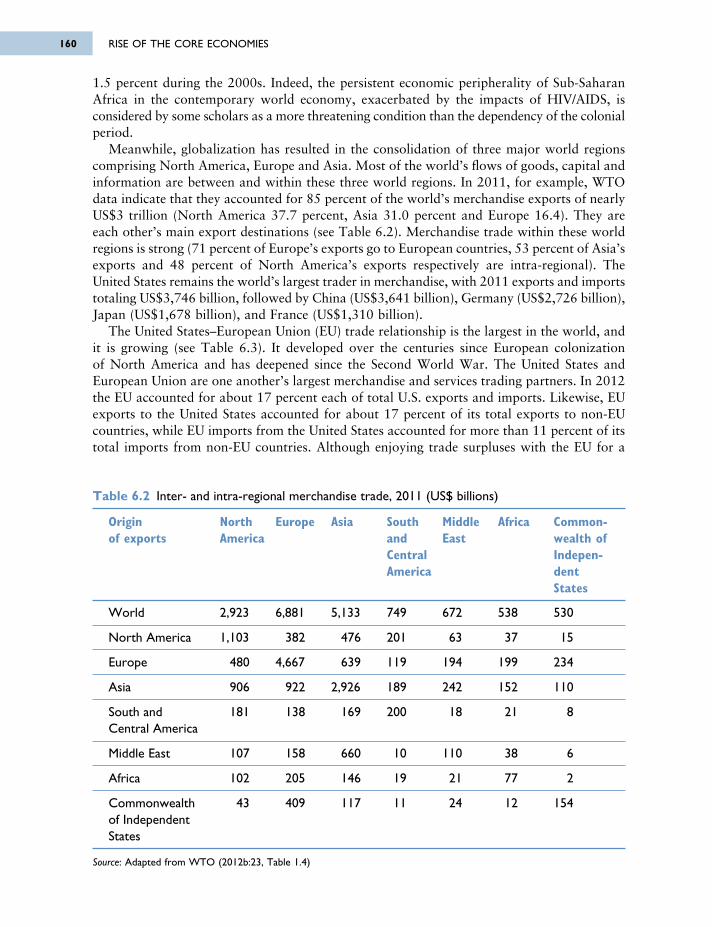
1.5 percent during the 2000s. Indeed, the persistent economic peripherality of Sub-SaharanAfrica in the contemporary world economy, exacerbated by the impacts of HIV/AIDS, isconsidered by some scholars as a more threatening condition than the dependency of the colonialperiod.
Meanwhile, globalization has resulted in the consolidation of three major world regionscomprising North America, Europe and Asia. Most of the world’s flows of goods, capital andinformation are between and within these three world regions. In 2011, for example, WTOdata indicate that they accounted for 85 percent of the world’s merchandise exports of nearlyUS$3 trillion (North America 37.7 percent, Asia 31.0 percent and Europe 16.4). They areeach other’s main export destinations (see Table 6.2). Merchandise trade within these worldregions is strong (71 percent of Europe’s exports go to European countries, 53 percent of Asia’sexports and 48 percent of North America’s exports respectively are intra-regional). TheUnited States remains the world’s largest trader in merchandise, with 2011 exports and importstotaling US$3,746 billion, followed by China (US$3,641 billion), Germany (US$2,726 billion),Japan (US$1,678 billion), and France (US$1,310 billion).
The United States–European Union (EU) trade relationship is the largest in the world, andit is growing (see Table 6.3). It developed over the centuries since European colonization of North America and has deepened since the Second World War. The United States andEuropean Union are one another’s largest merchandise and services trading partners. In 2012the EU accounted for about 17 percent each of total U.S. exports and imports. Likewise, EUexports to the United States accounted for about 17 percent of its total exports to non-EUcountries, while EU imports from the United States accounted for more than 11 percent of itstotal imports from non-EU countries. Although enjoying trade surpluses with the EU for a
Table 6.2 Inter- and intra-regional merchandise trade, 2011 (US$ billions)
Origin North Europe Asia South Middle Africa Common-of exports America and East wealth of
Central Indepen-America dent
States
World 2,923 6,881 5,133 749 672 538 530
North America 1,103 382 476 201 63 37 15
Europe 480 4,667 639 119 194 199 234
Asia 906 922 2,926 189 242 152 110
South and 181 138 169 200 18 21 8Central America
Middle East 107 158 660 10 110 38 6
Africa 102 205 146 19 21 77 2
Commonwealth 43 409 117 11 24 12 154of IndependentStates
Source: Adapted from WTO (2012b:23, Table 1.4)
RISE OF THE CORE ECONOMIES160
6063 GEOGRAPHY WORLD ECON_PT_246x189 mm 22/01/2014 15:10 Page 160
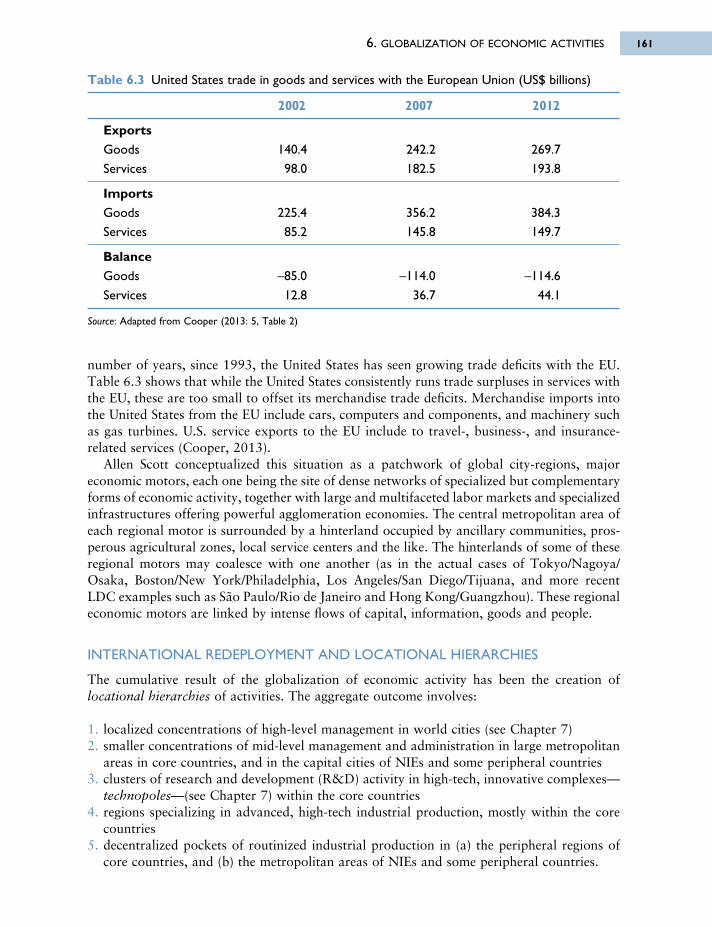
number of years, since 1993, the United States has seen growing trade deficits with the EU.Table 6.3 shows that while the United States consistently runs trade surpluses in services withthe EU, these are too small to offset its merchandise trade deficits. Merchandise imports intothe United States from the EU include cars, computers and components, and machinery suchas gas turbines. U.S. service exports to the EU include to travel-, business-, and insurance-related services (Cooper, 2013).
Allen Scott conceptualized this situation as a patchwork of global city-regions, majoreconomic motors, each one being the site of dense networks of specialized but complementaryforms of economic activity, together with large and multifaceted labor markets and specializedinfrastructures offering powerful agglomeration economies. The central metropolitan area ofeach regional motor is surrounded by a hinterland occupied by ancillary communities, pros -perous agricultural zones, local service centers and the like. The hinterlands of some of theseregional motors may coalesce with one another (as in the actual cases of Tokyo/Nagoya/Osaka, Boston/New York/Philadelphia, Los Angeles/San Diego/Tijuana, and more recentLDC examples such as São Paulo/Rio de Janeiro and Hong Kong/Guangzhou). These regionaleconomic motors are linked by intense flows of capital, information, goods and people.
INTERNATIONAL REDEPLOYMENT AND LOCATIONAL HIERARCHIES
The cumulative result of the globalization of economic activity has been the creation oflocational hierarchies of activities. The aggregate outcome involves:
1. localized concentrations of high-level management in world cities (see Chapter 7)2. smaller concentrations of mid-level management and administration in large metropolitan
areas in core countries, and in the capital cities of NIEs and some peripheral countries3. clusters of research and development (R&D) activity in high-tech, innovative complexes—
technopoles—(see Chapter 7) within the core countries4. regions specializing in advanced, high-tech industrial production, mostly within the core
countries5. decentralized pockets of routinized industrial production in (a) the peripheral regions of
core countries, and (b) the metropolitan areas of NIEs and some peripheral countries.
6. GLOBALIZATION OF ECONOMIC ACTIVITIES 161
Table 6.3 United States trade in goods and services with the European Union (US$ billions)
2002 2007 2012
ExportsGoods 140.4 242.2 269.7Services 98.0 182.5 193.8
ImportsGoods 225.4 356.2 384.3Services 85.2 145.8 149.7
BalanceGoods –85.0 –114.0 –114.6
Services 12.8 36.7 44.1
Source: Adapted from Cooper (2013: 5, Table 2)
6063 GEOGRAPHY WORLD ECON_PT_246x189 mm 22/01/2014 15:10 Page 161
These tendencies, and the fact that they have been influenced so much by the locational strategiesof transnational corporations equipped to take a global approach in pursuit of the mostprofitable redeployment of activities, have contributed to a new international division of labor(NIDL) (see Chapter 1).
It should be acknowledged that not all firms or industries are equal in their need or theircapability to engage in international redeployment of this kind. It is the largest companies—the transnational corporations—that are in the best position to take advantage of the advancesin circulation and production technology. Probably the best-developed example of globalproduction—and the most researched—is provided by the automobile industry, where the clearly defined national markets of the early postwar period have been almost entirely replaced by production and marketing on a global scale. In 1976 Ford introduced the Fiesta,a vehicle designed to sell in Europe, South America, the Asian market, and North America.The Fiesta was assembled in several different locations from components manufactured in aneven greater number of locations. The Fiesta became the first of a series of Ford “world cars,”which today includes the Focus. Ford’s international subsidiaries, which used to operateindependently of the parent company, are now functionally integrated, through sophisticatedIT systems.
The other automobile companies have organized their own global assembly systems. Theyemploy modular manufacturing for their world cars based on a common underbody platformyet with the flexibility to adapt the interior, trim, body, and ride characteristics to localconditions in different countries: Volkswagen’s best-selling European Golf (U.S. Rabbit), forexample, GM’s Opel Corsa, and Fiat’s Palio model deriving from its “Project 178” world carplatform. Ford’s Focus in North America, for example, has larger front and rear bumpers.Honda produces two distinct versions of the same car from its Accord world car platform:The more powerful, bigger, and more comfortable Accord for U.S. drivers and the smallersportier Accord aimed at European and Japanese drivers. The top three global automobilecorporations accounted for more than one-third of global sales of more than 80 million vehiclesin 2012. The top five corporations were, in order of sales: Toyota 9.75 million (with Daihatsu,Hino, Lexus, and Scion), General Motors 9.29 million (which includes Buick, Cadillac,Chevrolet, GMC, Holden, Opel, Vauxhall, and Wuling), Volkswagen 9.07 million (Audi,Bugatti, Bentley, Lamborghini, MAN, Porsche, Scania, SEAT, and Skoda), Ford (incorporatingFPV, Lincoln, and Troller) and Hyundai (with Kia).
FLEXIBLE PRODUCTION SYSTEMS
Concurrent with the changing competitive strategies of firms, there have been some significantchanges in the organization of production systems in many industries. These are oftenexpressed in terms of a transition from Fordism to flexible production systems. Today, thelogic of mass production coupled with mass consumption has been modified by the additionof more flexible production, distribution and marketing systems.
This flexibility is rooted in forms of production that enable manufacturers to shift quicklyand efficiently from one level of output to another and, more importantly, from one processand/or product configuration to another. It must be understood as a change that involvesflexibility both within firms and between them. Within firms, a great deal of this flexibility isattributable to the exploitation of new technologies. Computerized machine tools are capableof producing a variety of new products simply by being reprogrammed, often with very littledowntime between production runs for different products. Different stages of the productionprocess (sometimes located in different places) can be integrated and coordinated through
RISE OF THE CORE ECONOMIES162
6063 GEOGRAPHY WORLD ECON_PT_246x189 mm 22/01/2014 15:10 Page 162
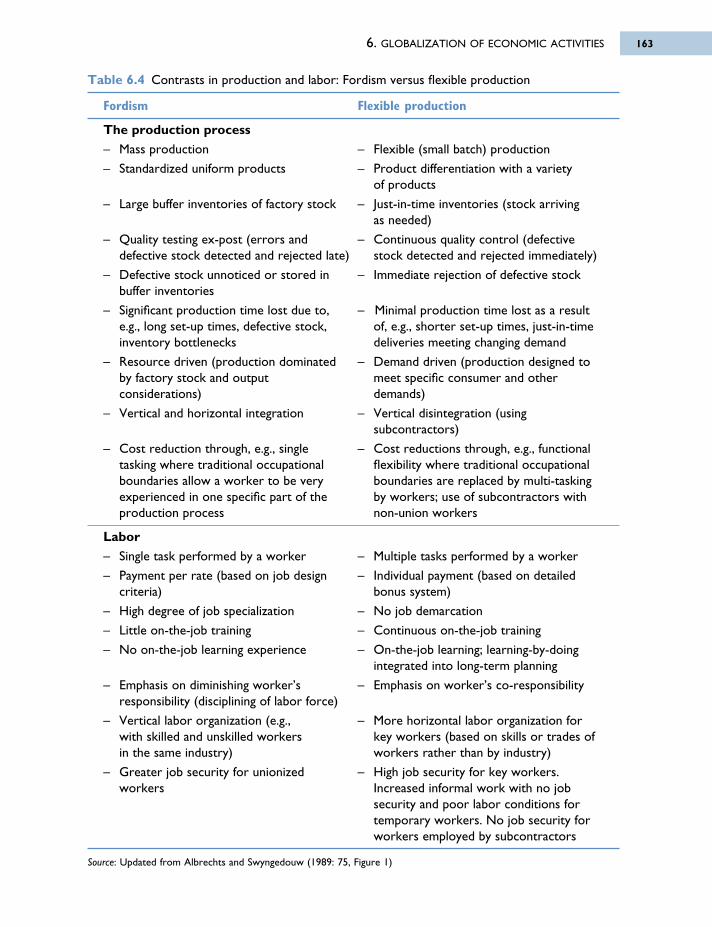
6. GLOBALIZATION OF ECONOMIC ACTIVITIES 163
Table 6.4 Contrasts in production and labor: Fordism versus flexible production
Fordism Flexible production
The production process– Mass production – Flexible (small batch) production
– Standardized uniform products – Product differentiation with a variety of products
– Large buffer inventories of factory stock – Just-in-time inventories (stock arriving as needed)
– Quality testing ex-post (errors and – Continuous quality control (defective defective stock detected and rejected late) stock detected and rejected immediately)
– Defective stock unnoticed or stored in – Immediate rejection of defective stockbuffer inventories
– Significant production time lost due to, – Minimal production time lost as a result e.g., long set-up times, defective stock, of, e.g., shorter set-up times, just-in-time inventory bottlenecks deliveries meeting changing demand
– Resource driven (production dominated – Demand driven (production designed to by factory stock and output meet specific consumer and other considerations) demands)
– Vertical and horizontal integration – Vertical disintegration (using subcontractors)
– Cost reduction through, e.g., single – Cost reductions through, e.g., functional tasking where traditional occupational flexibility where traditional occupational boundaries allow a worker to be very boundaries are replaced by multi-tasking experienced in one specific part of the by workers; use of subcontractors with production process non-union workers
Labor– Single task performed by a worker – Multiple tasks performed by a worker
– Payment per rate (based on job design – Individual payment (based on detailed criteria) bonus system)
– High degree of job specialization – No job demarcation
– Little on-the-job training – Continuous on-the-job training
– No on-the-job learning experience – On-the-job learning; learning-by-doing integrated into long-term planning
– Emphasis on diminishing worker’s – Emphasis on worker’s co-responsibility responsibility (disciplining of labor force)
– Vertical labor organization (e.g., – More horizontal labor organization forwith skilled and unskilled workers key workers (based on skills or trades ofin the same industry) workers rather than by industry)
– Greater job security for unionized – High job security for key workers. workers Increased informal work with no job
security and poor labor conditions for temporary workers. No job security for workers employed by subcontractors
Source: Updated from Albrechts and Swyngedouw (1989: 75, Figure 1)
6063 GEOGRAPHY WORLD ECON_PT_246x189 mm 22/01/2014 15:10 Page 163
computer-aided design (CAD) and computer-aided manufacturing (CAM) systems. Computer-based information systems can be used to monitor retail sales and track wholesale orders,allowing producers to reduce the costs of raw materials stockpiles, parts inventories andwarehousing through sophisticated small-batch, just-in-time production and distributionsystems. The combination of computer-based information systems, CAD/CAM systems andcomputerized machine tools has also helped firms to be flexible enough to exploit specializedniches of consumer demand, rendering geographically scattered upscale markets accessible toeconomies of scale in production. This kind of flexibility depends on new labor practices aswell as new technologies, however (see Table 6.4). There are two main aspects to this. Oneis the increasingly flexible use of labor within firms, which requires individual workers toperform a wider variety of tasks. Taken to its extreme, this trend has in some instancessubstituted craftwork for production-line work. The other is the increasingly flexible size andquality of the labor force required at any one plant. This trend has substituted overtime, part-time and temporary employment for permanent, full-time jobs.
Between firms, flexible production can be achieved through the externalization of certainfunctions. One way of doing this has been to restructure permanent and hierarchicallystructured administrative, managerial, and technical units within large corporations intoflatter, leaner, and more flexible forms of organization that can make increased use of outsideconsultants, specialists and subcontractors. This has led to a degree of vertical disintegrationamong firms (see Chapter 3). An example is Boeing’s 787 Dreamliner that may offer acautionary tale, however, about production delays and the difficulties of quality control insuch an extensive global assembly system. This airplane is sourced with components fromAustralia, Canada, China, France, Japan, Italy, Russia, South Korea, Sweden, the UnitedKingdom, and the United States (see Figure 6.3). The worldwide grounding of the Dreamlinerfollowed a January 2013 emergency landing because of an electrical fire associated with theplane’s lithium ion batteries. The batteries were manufactured by GS Yuasa Corporation ofKyoto, Japan. Another route to externalization has been to participate in joint ventures, inthe licensing or contracting of technology, and in strategic alliances involving designpartnerships, collaborative R&D projects and the like. In addition to more traditional (andmore expensive) mergers and acquisitions, joint ventures and strategic alliances have becomean important contributor to the intensification of economic globalization.
The numerous strategic alliances between the world’s largest automakers include parts-sharing agreements and joint ventures in research, as well as in manufacturing. In 2013, forinstance, Toyota and BMW formed a strategic alliance to develop hydrogen-based fuel celltechnology as well as a new sports vehicle that will run on clean, high-mileage gas. Soon after,Ford, Daimler, and Nissan entered into a strategic alliance to develop hydrogen-based fuelcell technology and vehicles. Other products of strategic alliances include the NissanMicra/Renault Pulse and the Nissan Sunny/Renault Scala that are manufactured in India in aplatform-sharing arrangement.
The Nestlé food company’s strategic alliances, for example, include a joint venture withGeneral Mills called Cereal Partners Worldwide (CPW), and one with New Zealand’s leadingdairy company, Fronterra to supply dairy products throughout the Americas called DairyPartners Americas. Nestlé also has a joint venture with the Coca-Cola Company, called BeveragePartners Worldwide (BPW), in which the Swiss company cooperates with Coca-Cola inexchanging technologies and in marketing. Nestlé has, for example, licensed its Nestea andEnviga brands of ready-to-drink teas to Coca-Cola in the United States and to BPW for therest of the world.
RISE OF THE CORE ECONOMIES164
6063 GEOGRAPHY WORLD ECON_PT_246x189 mm 22/01/2014 15:10 Page 164
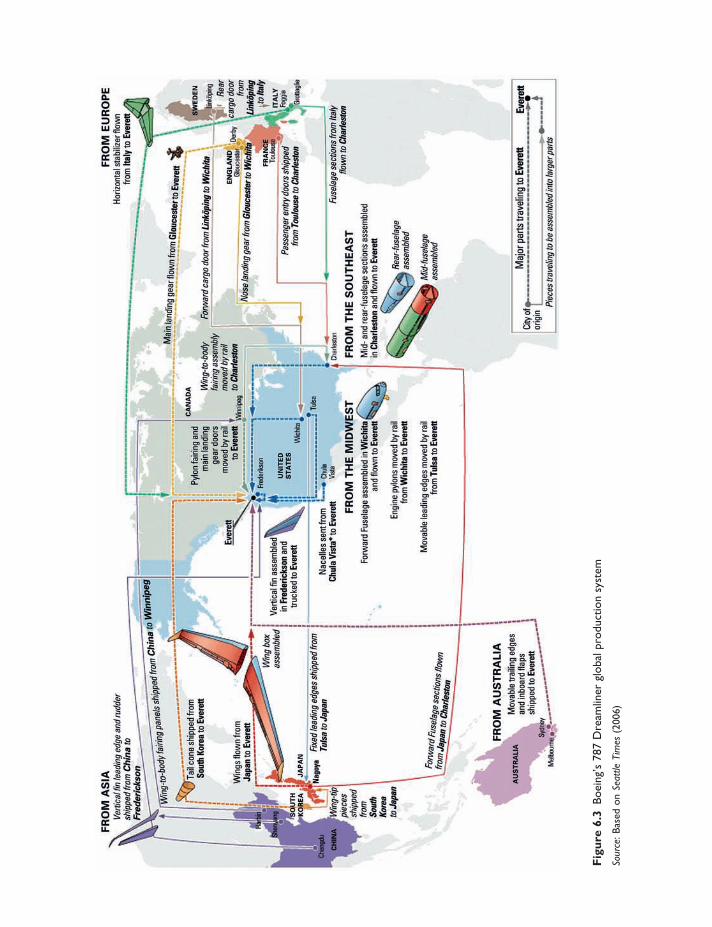
Fig
ure
6.3
Boei
ng’s
787
Dre
amlin
er g
loba
l pro
duct
ion
syst
em
Sour
ce: B
ased
on
Seat
tle T
imes
(200
6)
6063 GEOGRAPHY WORLD ECON_PT_246x189 mm 22/01/2014 15:10 Page 165
FR
OM
AS
IAV
Ver
tical
fin
lead
ing
edge
and
rudd
erA
sh
ippe
d fro
m C
hina
to
\\F
red
eri
ck
so
n
'Win
g-io
-tbod
y fai
nn g
pane
l:з/s s
hipp
ed і
,a (o
Win
mlip
eg
'Tai
l con
e sh
ippe
d fro
m
Sout
h Ko
rea
to E
vere
tt
Win
gs fl
own
from
Ja
pan
to E
vere
tt
Win
g bo
x as
sem
bled
SO
UT
HK
OR
EA
JAP
AN
rCh
engd
u
CH
INA
Win
g-lip
piec
essh
ippe
dfro
mSo
uth
Kor
eato
Jap
an
Nago
yaFi
xed
lead
ing
edge
s sh
ippe
d fro
m
Tuls
a to
Jap
an
Ver
tical
fin
asse
mbl
ed!
in F
rede
ricks
on a
nd
truck
ed to
Eve
rett
1 Ffed
enks
on
UN
ITE
DS
TATE
SW
cNta
‘
’ΤΛ
ιN
acel
les
sent
from
Ch
uia
Vist
a* to
Eve
rett
' Ch
ula
Vista
FR
OM
TH
E M
IDW
ES
TFo
rwar
d Fu
sela
ge a
ssem
bled
in W
ichi
ta:
and
flow
n to
Eve
rett
Engi
ne p
ylon
s m
oved
by
rail
from
Wic
hita
to E
vere
tt
Fon/
vai
from
j."I u
ruSB
: la
pan
to/ag
e st
’ Cha
rUsect
ions
f!o\
fe
ston
Mov
able
lead
ing
edge
s m
oved
by
rail
from
Tul
sa to
Eve
rett
FR
OM
AU
ST
RA
LIA
Mov
able
trai
ling
edge
s an
d in
boar
d fla
ps
ship
ped
to E
vere
tt
AU
STR
ALI
A
Sydn
eyM
elbou
rne
Cha
rlest
on
FR
OM
TH
E S
OU
TH
EA
ST
Mid
- and
rear
-fuse
lage
sec
tions
ass
embl
ed
in C
harle
ston
and
flow
n to
Eve
rett
. R
ear-
fuse
lage
)
asse
mbl
ed
j M
id-fu
sela
ge
asse
mbl
ed
Fuse
lage
sec
tions
from
Ital
y flo
wn
to C
harle
ston
Pas
seng
er e
ntry
doo
rs s
hipp
ed
from
Tou
lous
e to
Cha
rlest
on
FRA
NC
ETn
fcua
Nos
e E
ndin
g ge
ar fr
om G
louc
este
r to
Wic
hita
EN
GLA
ND
Q
Glou
cest
er
UefD
V
CA
NA
DA
Pylo
n fa
iring
and
m
ain
land
ing
gear
doo
rs
mov
ed b
y ra
il to
Eve
rett
Ever
ett
rmni
oea
Win
g-to
-bod
y fa
iring
ass
embl
) m
oved
by
rail
to C
harle
ston
war
n la
ndin
g ge
ar fl
own
from
Glo
uces
ter t
o E
ver*
. ^
Forw
ard
carg
o do
or fr
om L
inko
ping
to W
ichi
taS
WE
DE
N
fljM
dpiig
R
ear
carg
o do
or
from
Li
nkop
ing
^io
Italy
Grott
agke
FR
OM
EU
RO
PE
Hor
izon
tal s
tabi
lizer
flow
n fro
m It
aly
to E
vere
tt /T
f, i ITAL
Y Fo
ggia
City
of
orig
in
Maj
or p
arts
trav
elin
g to
Eve
rett
Pie
ces
trav
elin
g to
be
asse
mbl
ed in
to la
rger
par
ts
Ever
ett
'Win
g-to
-bo-bo
dy to
irin
g pa
nels
sn
Ch
ina
to
Win
nnnip
eg
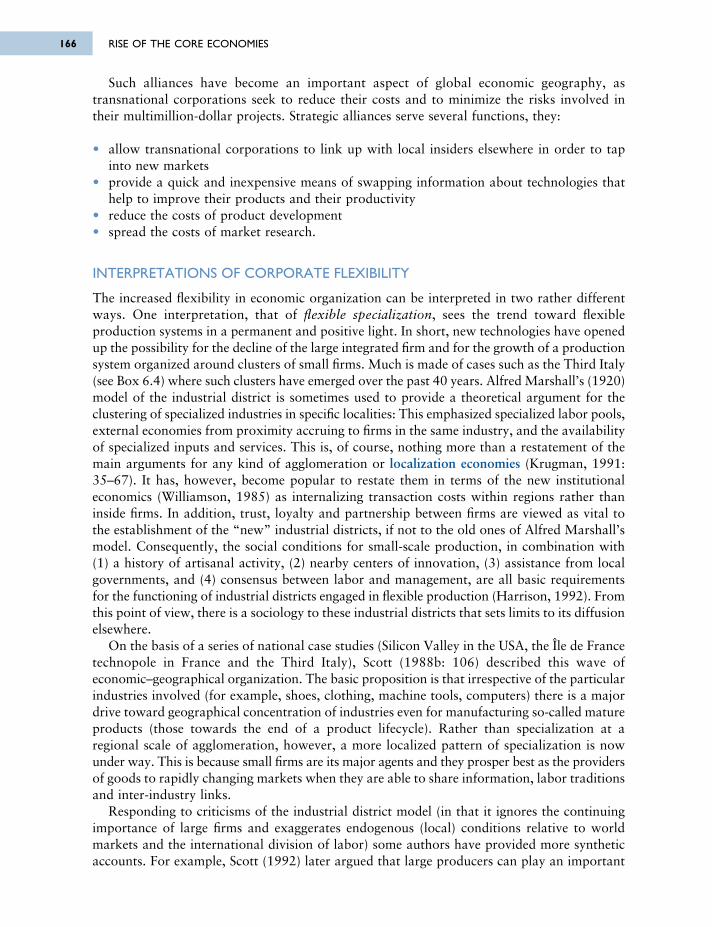
Such alliances have become an important aspect of global economic geography, astransnational corporations seek to reduce their costs and to minimize the risks involved intheir multimillion-dollar projects. Strategic alliances serve several functions, they:
• allow transnational corporations to link up with local insiders elsewhere in order to tapinto new markets
• provide a quick and inexpensive means of swapping information about technologies thathelp to improve their products and their productivity
• reduce the costs of product development• spread the costs of market research.
INTERPRETATIONS OF CORPORATE FLEXIBILITY
The increased flexibility in economic organization can be interpreted in two rather differentways. One interpretation, that of flexible specialization, sees the trend toward flexibleproduction systems in a permanent and positive light. In short, new technologies have openedup the possibility for the decline of the large integrated firm and for the growth of a productionsystem organized around clusters of small firms. Much is made of cases such as the Third Italy(see Box 6.4) where such clusters have emerged over the past 40 years. Alfred Marshall’s (1920)model of the industrial district is sometimes used to provide a theoretical argument for theclustering of specialized industries in specific localities: This emphasized specialized labor pools,external economies from proximity accruing to firms in the same industry, and the availabilityof specialized inputs and services. This is, of course, nothing more than a restatement of themain arguments for any kind of agglomeration or localization economies (Krugman, 1991:35–67). It has, however, become popular to restate them in terms of the new institutionaleconomics (Williamson, 1985) as internalizing transaction costs within regions rather thaninside firms. In addition, trust, loyalty and partnership between firms are viewed as vital tothe establishment of the “new” industrial districts, if not to the old ones of Alfred Marshall’smodel. Consequently, the social conditions for small-scale production, in combination with(1) a history of artisanal activity, (2) nearby centers of innovation, (3) assistance from localgovernments, and (4) consensus between labor and management, are all basic requirementsfor the functioning of industrial districts engaged in flexible production (Harrison, 1992). Fromthis point of view, there is a sociology to these industrial districts that sets limits to its diffusionelsewhere.
On the basis of a series of national case studies (Silicon Valley in the USA, the Île de Francetechnopole in France and the Third Italy), Scott (1988b: 106) described this wave ofeconomic–geographical organization. The basic proposition is that irrespective of the particularindustries involved (for example, shoes, clothing, machine tools, computers) there is a majordrive toward geographical concentration of industries even for manufacturing so-called matureproducts (those towards the end of a product lifecycle). Rather than specialization at aregional scale of agglomeration, however, a more localized pattern of specialization is nowunder way. This is because small firms are its major agents and they prosper best as the providersof goods to rapidly changing markets when they are able to share information, labor traditionsand inter-industry links.
Responding to criticisms of the industrial district model (in that it ignores the continuingimportance of large firms and exaggerates endogenous (local) conditions relative to worldmarkets and the international division of labor) some authors have provided more syntheticaccounts. For example, Scott (1992) later argued that large producers can play an important
RISE OF THE CORE ECONOMIES166
6063 GEOGRAPHY WORLD ECON_PT_246x189 mm 22/01/2014 15:10 Page 166
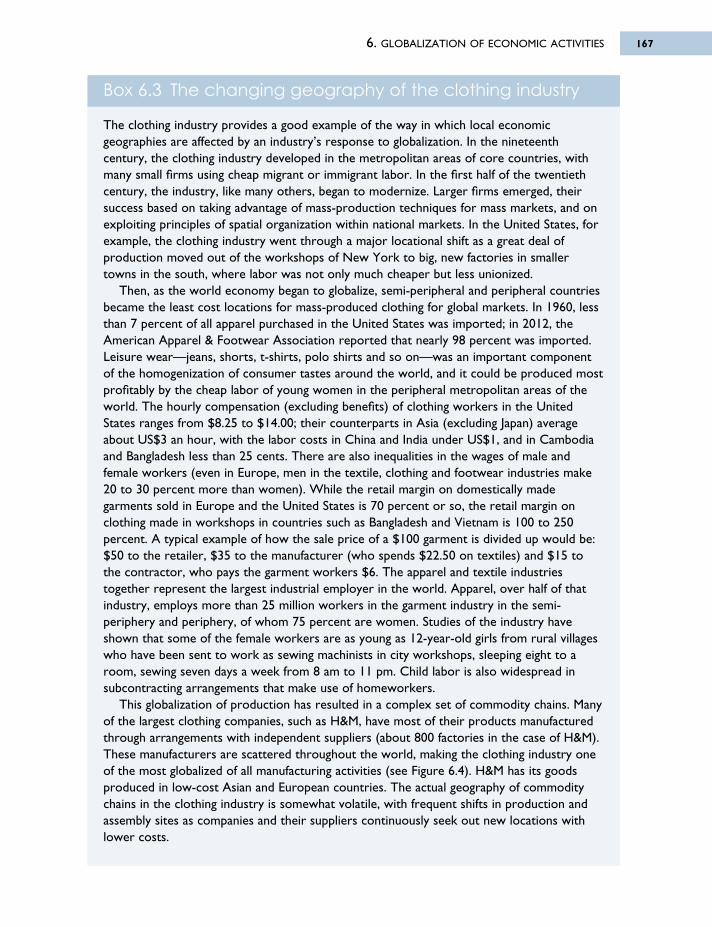
6. GLOBALIZATION OF ECONOMIC ACTIVITIES 167
Box 6.3 The changing geography of the clothing industry
The clothing industry provides a good example of the way in which local economicgeographies are affected by an industry’s response to globalization. In the nineteenthcentury, the clothing industry developed in the metropolitan areas of core countries, withmany small firms using cheap migrant or immigrant labor. In the first half of the twentiethcentury, the industry, like many others, began to modernize. Larger firms emerged, theirsuccess based on taking advantage of mass-production techniques for mass markets, and onexploiting principles of spatial organization within national markets. In the United States, forexample, the clothing industry went through a major locational shift as a great deal ofproduction moved out of the workshops of New York to big, new factories in smallertowns in the south, where labor was not only much cheaper but less unionized.
Then, as the world economy began to globalize, semi-peripheral and peripheral countriesbecame the least cost locations for mass-produced clothing for global markets. In 1960, lessthan 7 percent of all apparel purchased in the United States was imported; in 2012, theAmerican Apparel & Footwear Association reported that nearly 98 percent was imported.Leisure wear—jeans, shorts, t-shirts, polo shirts and so on—was an important componentof the homogenization of consumer tastes around the world, and it could be produced mostprofitably by the cheap labor of young women in the peripheral metropolitan areas of theworld. The hourly compensation (excluding benefits) of clothing workers in the UnitedStates ranges from $8.25 to $14.00; their counterparts in Asia (excluding Japan) averageabout US$3 an hour, with the labor costs in China and India under US$1, and in Cambodiaand Bangladesh less than 25 cents. There are also inequalities in the wages of male andfemale workers (even in Europe, men in the textile, clothing and footwear industries make20 to 30 percent more than women). While the retail margin on domestically madegarments sold in Europe and the United States is 70 percent or so, the retail margin onclothing made in workshops in countries such as Bangladesh and Vietnam is 100 to 250percent. A typical example of how the sale price of a $100 garment is divided up would be:$50 to the retailer, $35 to the manufacturer (who spends $22.50 on textiles) and $15 tothe contractor, who pays the garment workers $6. The apparel and textile industriestogether represent the largest industrial employer in the world. Apparel, over half of thatindustry, employs more than 25 million workers in the garment industry in the semi-periphery and periphery, of whom 75 percent are women. Studies of the industry haveshown that some of the female workers are as young as 12-year-old girls from rural villageswho have been sent to work as sewing machinists in city workshops, sleeping eight to aroom, sewing seven days a week from 8 am to 11 pm. Child labor is also widespread insubcontracting arrangements that make use of homeworkers.
This globalization of production has resulted in a complex set of commodity chains. Manyof the largest clothing companies, such as H&M, have most of their products manufacturedthrough arrangements with independent suppliers (about 800 factories in the case of H&M).These manufacturers are scattered throughout the world, making the clothing industry oneof the most globalized of all manufacturing activities (see Figure 6.4). H&M has its goodsproduced in low-cost Asian and European countries. The actual geography of commoditychains in the clothing industry is somewhat volatile, with frequent shifts in production andassembly sites as companies and their suppliers continuously seek out new locations withlower costs.
6063 GEOGRAPHY WORLD ECON_PT_246x189 mm 22/01/2014 15:10 Page 167
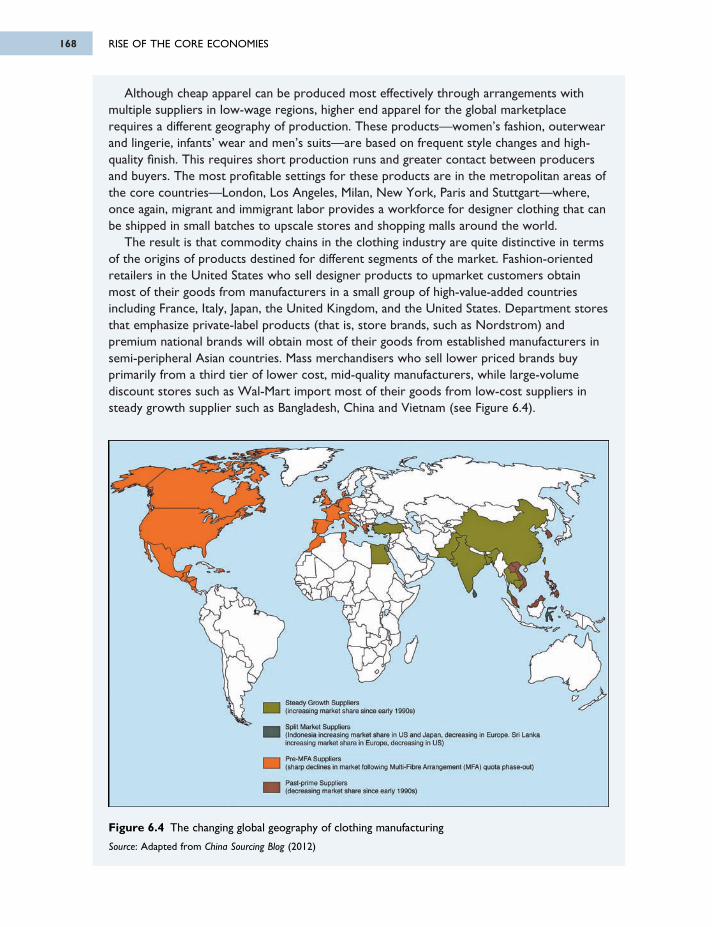
Although cheap apparel can be produced most effectively through arrangements withmultiple suppliers in low-wage regions, higher end apparel for the global marketplacerequires a different geography of production. These products—women’s fashion, outerwearand lingerie, infants’ wear and men’s suits—are based on frequent style changes and high-quality finish. This requires short production runs and greater contact between producersand buyers. The most profitable settings for these products are in the metropolitan areas ofthe core countries—London, Los Angeles, Milan, New York, Paris and Stuttgart—where,once again, migrant and immigrant labor provides a workforce for designer clothing that canbe shipped in small batches to upscale stores and shopping malls around the world.
The result is that commodity chains in the clothing industry are quite distinctive in termsof the origins of products destined for different segments of the market. Fashion-orientedretailers in the United States who sell designer products to upmarket customers obtainmost of their goods from manufacturers in a small group of high-value-added countriesincluding France, Italy, Japan, the United Kingdom, and the United States. Department storesthat emphasize private-label products (that is, store brands, such as Nordstrom) andpremium national brands will obtain most of their goods from established manufacturers insemi-peripheral Asian countries. Mass merchandisers who sell lower priced brands buyprimarily from a third tier of lower cost, mid-quality manufacturers, while large-volumediscount stores such as Wal-Mart import most of their goods from low-cost suppliers insteady growth supplier such as Bangladesh, China and Vietnam (see Figure 6.4).
Figure 6.4 The changing global geography of clothing manufacturing
Source: Adapted from China Sourcing Blog (2012)
RISE OF THE CORE ECONOMIES168
6063 GEOGRAPHY WORLD ECON_PT_246x189 mm 22/01/2014 15:10 Page 168
Steady Growth Suppliers(increasing market share since early 1990s)
Split Market Suppliers(Indonesia increasing market share in US and Japan, decreasing in Europe. Sri Lanka increasing market share in Europe, decreasing in US)
Pre-MFA Suppliers(sham declines in market following Multi-Fibre Arrangement (MFA) quota phase-out)
Past-pnme Suppliers(decreasing market share since early 1990s
part in inducing and maintaining the growth of (high-technology) industrial districts. He suggeststhat the usual division of production units between flexible and mass producers is insufficient.He identifies a third type, the systems house, flexible producers that benefit from economiesof scope flowing from R&D or design synergies, with a variegated internal structure of jobspecialization and batch production (as opposed to mass production) of complex products.These systems houses do not stand alone but are usually connected with nearby flexibleproducers. They are the hubs for high-technology industrial districts such as those in southernCalifornia, Cambridge, Baden-Württemberg, Germany, and Tokyo and Kyoto in Japan. Scott,for one, does not see this model of industrial districts as incompatible with an internationalizedworld economy. Indeed, he sees this phenomenon as itself “the interlinkage of industrial districtsacross the globe, . . . as a mosaic of regions consisting of localized networks of transactions(i.e. industrial districts) embedded in global networks of transactions” (Scott, 1992: 274).
A second interpretation of the Fordist/flexible production systems divide sees the methodsof flexible production more as a response to a crisis of capital growth in some sectors ofindustrial production rather than a fully fledged form of economic organization. From thispoint of view it is the transformation of financial markets and the introduction of flexibleproduction as a means of disciplining the power of labor that attract attention. In the firstcase, it is argued that through the development in new financial instruments (for example,junk bonds) combined with the spread of sophisticated systems of global financial coordination,the financial system demands increased geographical and temporal flexibility of capital growth(Harvey, 1990). In the second case, the declining rate of profit in the 1970s led firms to astrategy of decentralized production to undermine the power of labor (and reduce wage bills),which had increased under Fordism, yet still maintain centralized control. Many of the oftenidealized small firms of the Third Italy are indeed subcontractors for larger firms searchingfor alternatives to their large unionized labor forces.
It is important to note, however, that several criticisms have been directed at theseinterpretations, most especially the first one of flexible specialization:
• Not all the apparently flexible methods of production are, in fact, that flexible. Simpleoppositions such as Fordist and flexible impose a structure on an industrial history that isnot all that simple. In particular, the labor processes in different industries, the market andmacroeconomic features of different sectors, and the organizational cultures of the firmsand areas involved combine to produce a range of industrial geographies along the spectrumbetween locational fixity and global mobility (Amin and Thrift, 1992: 574).
• Large firms are now adopting many of the methods that were seen as the exclusive provinceof small firms clustered in industrial districts (as acknowledged by Scott). Some enter intostrategic alliances to produce certain items even with firms that are their direct competitors(for example, Toyota with BMW, or Ford with Nissan and Daimler). They can do this evenwith dispersed production facilities.
• The geographical boundaries of industrial districts are not usually carefully defined; partlythis is a result of a lack of consensus about the transactions and flows that must be internal -ized geographically for a district to exist. Some newer industrial districts sprawl over largeareas and overlap with other districts, whereas others are small and exclusive. Does thesame logic of production govern both of these types of industrial space?
• Missing from most discussions of both models is attention to specifics (in terms of industries,technologies and limited areas) of flexible production, prior spatial divisions of labor in theaffected areas (and elsewhere where a shift to flexible production is not taking place), and
6. GLOBALIZATION OF ECONOMIC ACTIVITIES 169
6063 GEOGRAPHY WORLD ECON_PT_246x189 mm 22/01/2014 15:10 Page 169
the influence of government policies, especially with respect to technical education,innovation policy, tax incentives and trade barriers.
• More research is needed into how local conditions interact with global competitiveconditions to affect the fortunes of industrial districts. What is known suggests that suchdistricts are not immune to the problems of international competition affecting Fordist firms(see Box 6.4 and Chapter 13).
• Scholars who live in places that experienced changes in forms of economic developmentemphasize the shift to flexible production. The so-called Los Angeles School (Scott is a leadingmember) used examples of production complexes from southern California, Massachusetts(Route 128), or the Third Italy as if they were drawn from a universal sample or providea window on the future everywhere. The view of traditional manufacturing workers fromthe Rustbelt of the USA, for example, would be considerably less sanguine about the breakwith mass production and the possible universality of flexible production. Many large firmsin the northeast of the USA continue to move production abroad or invest in automation.In many manufacturing industries, Fordist principles of production still prevail.
Box 6.4 The myth of the new industrial districts of the ThirdItaly?
The Third Italy (central and northeast Italy) is an often cited example of one of the flexibleproduction systems organized around clusters of small firms that have emerged during thepast 40 years. Small firms are seen as the best providers of goods to rapidly changingmarkets in a localized pattern of specialization where they are able to share information,labor traditions and inter-industry links. Yet in many cases the tradition and style of theItalian artisanal approach have had to be adapted to modern production methods. Many ofthe often idealized small firms of the Third Italy are, in fact, subcontractors for larger firmssearching for alternatives to their large and more expensive unionized labor forces. Some ofthe largest Italian shoe manufacturers have even outsourced production to lower-cost eastEuropean countries such as Romania and Slovenia, and to China or replaced Italian artisanswith cheaper non-EU immigrant workers from countries such as Morocco and China. Eventhe small upmarket Italian shoe firms and their workers are not immune to the problems ofinternational competition that afflicted Fordist firms. Italian exports have been impacted byincreased production in China, India, and Vietnam. Job losses have occurred as some smallerbusinesses have folded and others have been forced into mergers or acquisitions.International competition has stimulated businesses to strengthen their position at the topend of the market by investing in research and development (R&D), and new technology anddesign techniques to improve quality and comfort, and to create innovative models andcolors. Italy remains the foremost shoe manufacturer in the European Union, and in 2011was the tenth largest footwear manufacturer and the third largest footwear exporter in theworld (after China/Hong Kong and Vietnam). Despite the higher cost of producing shoes inthe Third Italy, the small upmarket shoe manufacturers there are betting that they and theirquality shoes will survive international competition (Galbraith, 2001).
RISE OF THE CORE ECONOMIES170
6063 GEOGRAPHY WORLD ECON_PT_246x189 mm 22/01/2014 15:10 Page 170
THE GLOBAL OFFICE AND THE INFORMATION ECONOMY
The globalization of production and the growth of transnational corporations have beenassociated with another important change in patterns of local economic development: Producerservices such as financial and business services are now no longer locally oriented ancillaryactivities but important global industries in their own right. The growing importance of financialand business services was initially a result of the globalization of manufacturing, an increasein the volume of world trade and the growing dominance of transnational corporations. It was helped along by advances in IT. Satellite communications systems and fiber-opticnetworks made it possible for firms to operate key financial and business services 24 hours aday, around the globe, handling an enormous volume of transactions.
As banking, finance and business services grew into important global activities, however,they were themselves transformed into something quite different from the old, locally orientedancillary services. The global banking and financial network now handles trillions of dollarsevery day—no more than 10 percent of which has anything to do with the traditional worldeconomy of trade in goods and services. International movements of money, bonds, securitiesand other financial instruments have now become an end in themselves because they are apotential source of high profits from speculation and manipulation. Several factors havesupported this development:
• The institutionalization of savings (through pension funds and so on) has established a largepool of capital managed by professional investors with few local or regional allegiances orties.
• Deregulation of banking and financial services, as governments in many countries liftedrestrictions and regulations in the hope of capturing more of their growth.
• The quadrupling of crude oil prices in 1973 that generated so much capital for oil-richcountries that their banks opened overseas branches in order to find enough borrowers. Inmany cases, the borrowers were companies and governments in LDCs that had previouslybeen considered poor investment prospects. The internationalization of financial servicessoon paid off for the big banks. By the mid-1970s, about 70 percent of Citibank’s overallearnings came from its international operations, with Brazil alone accounting for 13 percentof the bank’s earnings in 1976.
• A persistent trade deficit of the United States vis-à-vis the rest of the world (a result initiallyof the postwar recovery of Europe and Japan but more recently the growth of NIEs suchas China) created a growing pool of dollars outside the United States, known as eurodollars.This supply in turn created a pool of capital that was beyond the direct control of the U.S.authorities.
• “Hot” money (undeclared business income, proceeds of securities fraud, trade in illegal drugs and syndicated crime), easily laundered through international electronic transactions,also found its way into the growing pool of eurodollars. It is estimated that US$1–2 trillionare laundered each year through the global financial system. Even though the margin betweenthese two estimates is enormous, the lower figure of US$1 trillion is still incredibly high.
• The initial response of many governments (including the U.S. government) to balance-of-payments problems was to print more money—a short-term solution that eventuallycontributed to a significant surge in inflation in the world economy. This inflation, becauseit promoted rapid change and international differentials in financial markets, provided afurther boost to speculative international financial transactions of all kinds.
6. GLOBALIZATION OF ECONOMIC ACTIVITIES 171
6063 GEOGRAPHY WORLD ECON_PT_246x189 mm 22/01/2014 15:10 Page 171
Together, these factors amounted to a change so important that a deep-seated restructuringof the world economy occurred. Banks and financial corporations with the size and inter nationalreach of JP Morgan Chase, HSBC, ICBC (China), Citigroup, BNP Paribas, or Deutsche Bankare able to influence local patterns and processes of economic development throughout theworld, just like the major transnational corporations involved in the global assembly system.In addition, key producer services (such as market research, accountancy, advertising, banking,corporate insurance, and legal services) have added an important dimension to the world’seconomic landscapes. Today, more than four out of five jobs in the USA and UK are in theservices sector.
Perhaps most important of all, the combined effect of all this has been to create an informa-tion economy. The information economy represents a form of economic production andmanagement in which productivity and competitiveness rely heavily on the generation of newknowledge and on the access to, processing and communication of new information. Some ofthe most important economic sectors in this information economy are high-technologymanufacturing, design-intensive consumer goods, and business and financial services.
BUSINESS SERVICES AND METROPOLITAN GROWTH
A fast growing component of the services sector has been business services. Most of theseactivities employ personnel either in managerial or information-processing positions. Demandfor these services comes from other firms rather than the general public. Consequently, manyof these services are located close to their main customers, overwhelmingly in and aroundlarge cities. Several factors have acted to reinforce this trend. The first is their international -ization. Agglomeration economies (access to clients and competitors, proximity to technicalservices, availability of qualified personnel) are so powerful across most of these services thatthey are disproportionately located in major cities. But ease of communication has made itpossible for firms to operate across different cities rather than restrict themselves to one. Thespread of manufacturing and conglomerate TNCs has encouraged successful business servicesfirms to follow suit, establishing multicity offices to service their transnational accounts. Second,the deregulation of national markets (especially in banking and finance) also strengthened therelationship between certain large cities with well-established institutions (exchanges andcommodity markets) and business services. A relatively small number of centers (London,Tokyo, New York) have benefited disproportionately from this trend. These world cities havebecome vital control points within a world economy breaking the bounds previously imposedby national restrictions.
BUSINESS SERVICES AND FLEXIBLE ECONOMIES
It can be argued that processes of subcontracting and small firm growth associated with flexibleproduction give rise to new service activities and increase the dependence of manufacturerson the purchase of services from independent vendors. Typically, intermediary functions in economic activity, such as wholesaling, have been regarded as internal to large verticallyintegrated firms (where all functions are carried out within one firm) or ignored because ofan assumption that producers trade directly with one another. However, wholesaling haspersisted. Glasmeier (1990) makes a plausible case for the view that high-tech industrial districts,such as Silicon Valley and Baden-Württemberg, Germany, depended from the start on thecoexistence of manufacturers and merchant wholesalers. In the case of Austin, Texas, whichGlasmeier examines in detail, the wholesalers serve as agents of interregional trade, bringing
RISE OF THE CORE ECONOMIES172
6063 GEOGRAPHY WORLD ECON_PT_246x189 mm 22/01/2014 15:10 Page 172
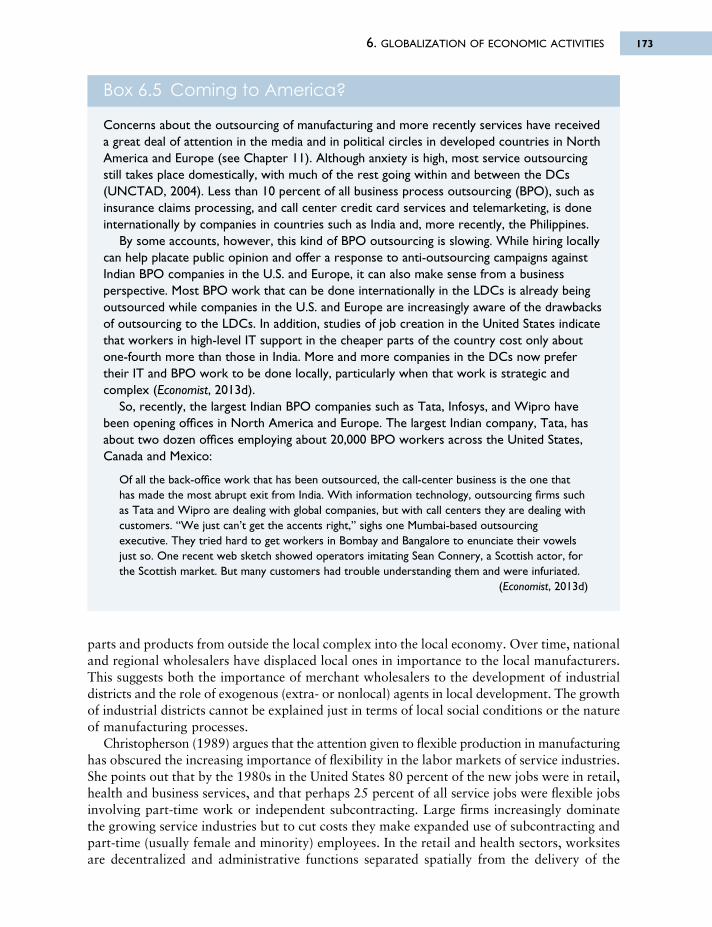
6. GLOBALIZATION OF ECONOMIC ACTIVITIES 173
parts and products from outside the local complex into the local economy. Over time, nationaland regional wholesalers have displaced local ones in importance to the local manufacturers.This suggests both the importance of merchant wholesalers to the development of industrialdistricts and the role of exogenous (extra- or nonlocal) agents in local development. The growthof industrial districts cannot be explained just in terms of local social conditions or the natureof manufacturing processes.
Christopherson (1989) argues that the attention given to flexible production in manu facturinghas obscured the increasing importance of flexibility in the labor markets of service industries.She points out that by the 1980s in the United States 80 percent of the new jobs were in retail,health and business services, and that perhaps 25 percent of all service jobs were flexible jobsinvolving part-time work or independent subcontracting. Large firms increasingly dominatethe growing service industries but to cut costs they make expanded use of subcontracting andpart-time (usually female and minority) employees. In the retail and health sectors, worksitesare decentralized and administrative functions separated spatially from the delivery of the
Box 6.5 Coming to America?
Concerns about the outsourcing of manufacturing and more recently services have receiveda great deal of attention in the media and in political circles in developed countries in NorthAmerica and Europe (see Chapter 11). Although anxiety is high, most service outsourcingstill takes place domestically, with much of the rest going within and between the DCs(UNCTAD, 2004). Less than 10 percent of all business process outsourcing (BPO), such asinsurance claims processing, and call center credit card services and telemarketing, is doneinternationally by companies in countries such as India and, more recently, the Philippines.
By some accounts, however, this kind of BPO outsourcing is slowing. While hiring locallycan help placate public opinion and offer a response to anti-outsourcing campaigns againstIndian BPO companies in the U.S. and Europe, it can also make sense from a businessperspective. Most BPO work that can be done internationally in the LDCs is already beingoutsourced while companies in the U.S. and Europe are increasingly aware of the drawbacksof outsourcing to the LDCs. In addition, studies of job creation in the United States indicatethat workers in high-level IT support in the cheaper parts of the country cost only aboutone-fourth more than those in India. More and more companies in the DCs now prefertheir IT and BPO work to be done locally, particularly when that work is strategic andcomplex (Economist, 2013d).
So, recently, the largest Indian BPO companies such as Tata, Infosys, and Wipro havebeen opening offices in North America and Europe. The largest Indian company, Tata, hasabout two dozen offices employing about 20,000 BPO workers across the United States,Canada and Mexico:
Of all the back-office work that has been outsourced, the call-center business is the one thathas made the most abrupt exit from India. With information technology, outsourcing firms suchas Tata and Wipro are dealing with global companies, but with call centers they are dealing withcustomers. “We just can’t get the accents right,” sighs one Mumbai-based outsourcingexecutive. They tried hard to get workers in Bombay and Bangalore to enunciate their vowelsjust so. One recent web sketch showed operators imitating Sean Connery, a Scottish actor, forthe Scottish market. But many customers had trouble understanding them and were infuriated.
(Economist, 2013d)
6063 GEOGRAPHY WORLD ECON_PT_246x189 mm 22/01/2014 15:10 Page 173
services themselves even as large firms become dominant. The services are increasinglystandardized from place to place; much like the physical settings such as regional shoppingcenters, shopping malls, and suburban medical buildings in which they are located.
Spatial homogenization rather than local specialization, therefore, characterizes the spatialpattern of major service industries and the flexible employment on which they rely. Thisflexibility is more difficult to romanticize than that associated with manufacturing. It involvesserious reductions in incomes compared to those paid in the Fordist manufacturing industries.It also reduces the overall bargaining power of the workforce through exploiting gender andethnic divisions (for example, by paying women less) and spatially dispersed worksites(including services outsourcing, addressed in detail in Chapter 11) to restrict employmentsecurity and limit labor organizing.
SUMMARYIn this chapter, we have seen how the crisis of Fordism, coupled with trends associated withcorporate restructuring, technological advances, and shifting consumer demand have resultedin the globalization of economic activities that were previously localized within the coreeconomies. Among the salient features of these changes are the following:
• Production hierarchies within the large companies that have come to dominate mostindustries. These hierarchies have tended to result in separate locational settings for (1) high-level corporate control, (2) production requiring high inputs of skilled labor and new tech-nology; intermediate administration and R&D activities; and (3) routine production.
• The organization of the world economy into three broad international regions:
1. the highly integrated and very diversified industrial and control centers of the core ofNorth America, Europe, Japan and Australasia
2. the semi-periphery of resource-exporting countries (such as Saudi Arabia and SouthAfrica), old NIEs (such as Mexico and Brazil), and new NIEs (such as China, India, andVietnam)
3. the relatively thinly industrialized periphery that makes up most of the SouthernHemisphere (such as Sub-Saharan Africa), which is highly dependent on the core.
• Persistence within each of these broad regions of nested hierarchies of countries and regionsat different levels of economic development. As such the periphery contains core regions andsemi-peripheral regions (as, for example, the Lagos/Ibadan region and Abidjan regionrespectively in West Africa), the semi-periphery contains core regions and peripheral regions (for example, the Calcutta-Hooghly-Howra conurbation and Uttar Pradesh respect-ively in India), and the core contains regions that are, relatively, semi-peripheral (forexample, Greece and east-central Europe respectively in Europe).
KEY SOURCES AND SUGGESTED READINGChristopherson, S. and Clark, J., 2009. Remarking the Regional Economies: Power, labor and firm
strategies in the knowledge economy. London: Routledge.Cooper, W.H., 2013. EU-U.S. Economic Ties: Framework, scope and magnitude. Washington, DC:
Congressional Research Service.Economist, 2013. The next big thing: Developed countries are beginning to take back service-industry
jobs too. Economist January 19.
RISE OF THE CORE ECONOMIES174
6063 GEOGRAPHY WORLD ECON_PT_246x189 mm 22/01/2014 15:10 Page 174
Harrison, B., 2007. Industrial districts: Old wine in new bottles?, Regional Studies 41, S107–S121.Leinbach, T.R. and Brunn, S.D. (eds.), 2001. Worlds of E-Commerce: Economic, geographical and social
dimensions. Chichester: John Wiley & Sons.Polenske, K.R. (ed.), 2007. The Economic Geography of Innovation. Cambridge: Cambridge University
Press.Scott, A.J., 2006. Geography and Economy. Oxford: Clarendon Press.Scott, A.J. and Storper, M., 2003. Regions, globalization, development, Regional Studies 37, 579–593.Thrift, N.J., 2002. A hyperactive world, in R.J. Johnston, P.J. Taylor, and M. Watts (eds.), Geographies
of Global Change. Remapping the world in the late twentieth century, 2nd edn. Oxford: Blackwell,18–35.
UNCTAD, 2011. World Investment Report 2011: Non-equity modes of international production anddevelopments. New York and Geneva: United Nations.
UNCTAD, 2012. World Investment Report 2012: Towards a new generation of investment policies.New York and Geneva: United Nations.
6. GLOBALIZATION OF ECONOMIC ACTIVITIES 175
6063 GEOGRAPHY WORLD ECON_PT_246x189 mm 22/01/2014 15:10 Page 175

6063 GEOGRAPHY WORLD ECON_PT_246x189 mm 22/01/2014 15:10 Page 176
This page intentionally left blank
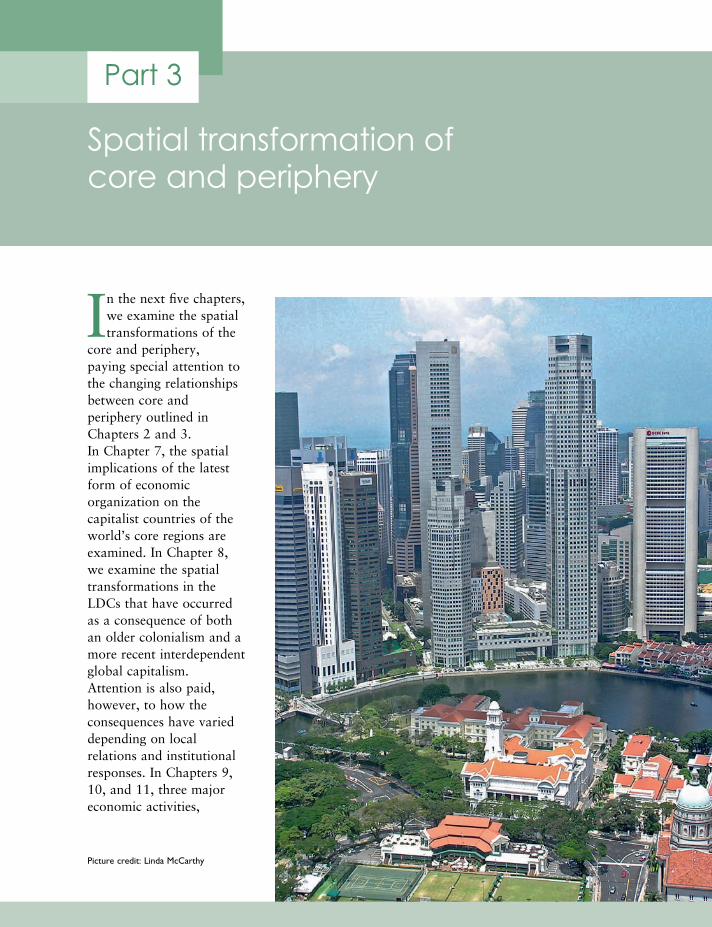
Part 3
Spatial transformation of core and periphery
Picture credit: Linda McCarthy
In the next five chapters, we examine the spatialtransformations of the
core and periphery, paying special attention tothe changing relationshipsbetween core andperiphery outlined inChapters 2 and 3. In Chapter 7, the spatialimplications of the latestform of economicorganization on thecapitalist countries of theworld’s core regions areexamined. In Chapter 8, we examine the spatialtransformations in theLDCs that have occurredas a consequence of bothan older colonialism and amore recent interdependentglobal capitalism.Attention is also paid,however, to how theconsequences have varieddepending on localrelations and institutionalresponses. In Chapters 9,10, and 11, three majoreconomic activities,
6063 GEOGRAPHY WORLD ECON_PT_246x189 mm 22/01/2014 15:10 Page 177

SPATIAL TRANSFORMATION OF CORE AND PERIPHERY178
agriculture, manufacturing and services are examined both with respect to their roles ineconomic development and their changing geographical patterns, particularly from theperspective of the LDCs. The emphasis throughout this section is on the impacts of andresponses to the evolving world economy in both the developed and the less developedcountries, and to the changing relationships between them.
6063 GEOGRAPHY WORLD ECON_PT_246x189 mm 22/01/2014 15:10 Page 178
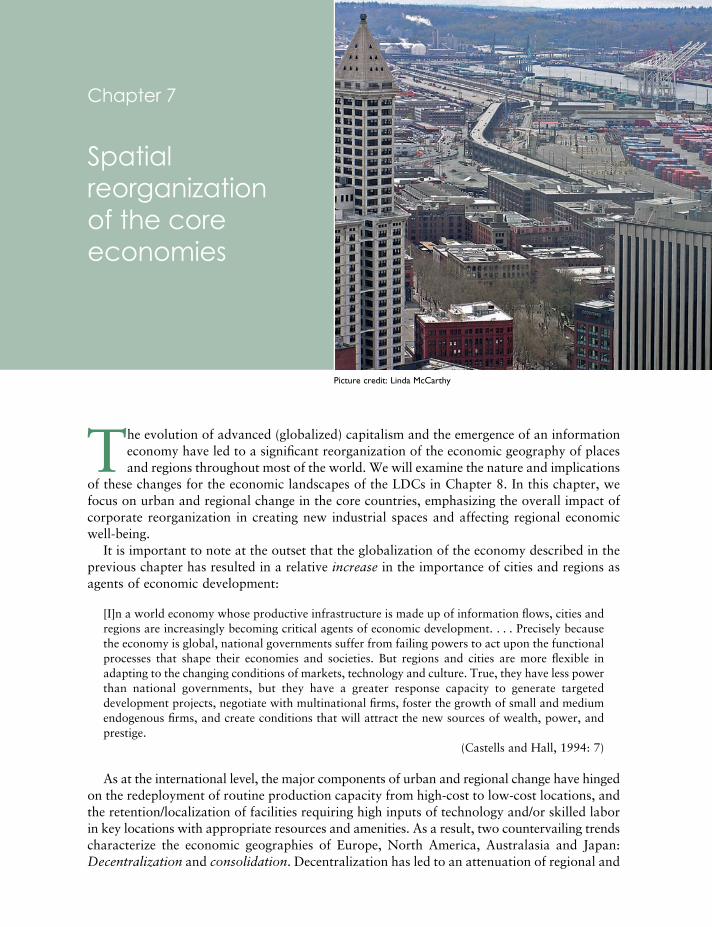
The evolution of advanced (globalized) capitalism and the emergence of an informationeconomy have led to a significant reorganization of the economic geography of placesand regions throughout most of the world. We will examine the nature and implications
of these changes for the economic landscapes of the LDCs in Chapter 8. In this chapter, wefocus on urban and regional change in the core countries, emphasizing the overall impact ofcorporate reorganization in creating new industrial spaces and affecting regional economicwell-being.
It is important to note at the outset that the globalization of the economy described in theprevious chapter has resulted in a relative increase in the importance of cities and regions asagents of economic development:
[I]n a world economy whose productive infrastructure is made up of information flows, cities andregions are increasingly becoming critical agents of economic development. . . . Precisely becausethe economy is global, national governments suffer from failing powers to act upon the functionalprocesses that shape their economies and societies. But regions and cities are more flexible inadapting to the changing conditions of markets, technology and culture. True, they have less powerthan national governments, but they have a greater response capacity to generate targeteddevelopment projects, negotiate with multinational firms, foster the growth of small and mediumendogenous firms, and create conditions that will attract the new sources of wealth, power, andprestige.
(Castells and Hall, 1994: 7)
As at the international level, the major components of urban and regional change have hingedon the redeployment of routine production capacity from high-cost to low-cost locations, andthe retention/localization of facilities requiring high inputs of technology and/or skilled laborin key locations with appropriate resources and amenities. As a result, two countervailing trendscharacterize the economic geographies of Europe, North America, Australasia and Japan:Decentralization and consolidation. Decentralization has led to an attenuation of regional and
Picture credit: Linda McCarthy
Chapter 7
Spatialreorganizationof the coreeconomies
6063 GEOGRAPHY WORLD ECON_PT_246x189 mm 22/01/2014 15:10 Page 179
interurban gradients in economic well-being; consolidation has contributed to an increasedspatial differentiation in terms of the conditions of production and exchange, and thehierarchical structure of control.
At the same time, we have to consider the effects on core countries of wider changes in theworld economy and globalized capitalism. We begin, therefore, with a brief outline of themain outcomes of these transformations. In the broadest of terms, three key changes can beidentified: An altered relationship between capital and labor; new regional divisions of labor;and new roles for the state. Together, they contributed to the development of a distinctivecontext for economic development in core countries.
7.1 THE CONTEXT FOR URBAN AND REGIONAL CHANGEFlexible production has taken hold as companies throughout the developed world haveexploited new technologies and new strategies in order to remain competitive in a globaleconomy. In the process, the relationship between capital and labor has been transformed,with corporations recapturing the initiative over wage rates and conditions. New technologieshave played a major role in this transformation. The introduction of robotics in factories andinformation-processing technologies in offices, for example, has made for dramatic increasesin productivity but has also created a long-term threat: That of substituting machines forworkers that puts them in a weak bargaining position.
Flexible production systems have also created a new interregional and international divisionof labor, as large corporations have pursued strategies in order to deal with, and exploit, thetime–space compression introduced by new transport and telecommunications technologiessuch as intelligent vehicle technologies and cloud computing. Paradoxically, the reduction ofspatial barriers has heightened the importance of geography and magnified the significance ofwhat local spaces contain because the new flexibility of the business world enables relativelysmall differences between places to be quickly, if temporarily, exploited. As a result, there hasbeen an acceleration of shifts in the patterning of uneven development based on particularlocal mixes of skills and resources: A continuously variable geometry of labor, capital,production, markets, and management.
Last, but not least, flexible production has required the development of new roles for thestate and the public sector: Reduced direct government intervention in the economy and adecreased emphasis on providing for collective consumption (school, hospitals, communityservices, etc.). The dilemma facing most governments was that deindustrialization accentuatedthe vulnerability of more and more people while making it increasingly difficult—politicallyas well as economically—to finance existing programs. As a result, a new conservatism in theorientation of central and local governments emerged. This new conservatism was associatedwith an ideological stance based on asserting that the welfare state had not only generatedunreasonably high levels of taxation, budget deficits, disincentives to work and save, and abloated class of unproductive workers, but also have fostered “soft” attitudes towards“problem” groups in society. The consequent restructuring of the welfare state was mostpronounced in the United Kingdom and the United States, where the Thatcher and Reaganadministrations respectively embarked on programs of privatization in health, housing, andeducation, accompanied by cuts in higher education, in programs for the unemployed, thosewith disabilities and the elderly, and in regional policy budgets. In the United Kingdom, closercontrols on local government expenditure by the national government led to correspondingcuts at the local level, particularly in depressed towns and cities where the need for welfareservices is high but local fiscal resources are low.
SPATIAL TRANSFORMATION OF CORE AND PERIPHERY180
6063 GEOGRAPHY WORLD ECON_PT_246x189 mm 22/01/2014 15:10 Page 180
This last point is central to the emergence of changes in government regulation andintervention that, in turn, is tied in to the emergence of more flexible production. FollowingJessop (1992), we can characterize this neoliberal regulation in general terms as involving acommitment to supply-side innovation in flexibility, with specific manifestations in several areas:
• a change in the regulation and conduct of labor markets, involving (1) a shift away fromcentralized collective bargaining towards company- or plant-level negotiations, and (2) anincreasing tolerance of insecurity and marginality in the wage relations and employmentconditions of unskilled workers
• flatter, leaner and more flexible forms of corporate organization that are suited not onlyto externalization but also to joint ventures and to public–private partnerships
• more flexible forms of credit: The result of deregulation of financial markets and the inter -nationalization of finance and financial services, which has effectively reduced the degreeof control that can be exerted by individual national governments
• displacement of Keynesian welfare states by workfare states:
The emerging state form will no longer be concerned mainly with securing full employmentwithin a national economy but with guiding and promoting the structural competitiveness ofthe national economy by intervening on the supply-side to encourage innovation; and it willno longer be concerned to generalise norms of mass consumption but to articulate policies tothe need to promote greater flexibility.
(Jessop, 1992: 32)
Table 7.1 illustrates some of the main contrasts between the characteristics of states underthe two systems:
• The “hollowing out” of national government as a result of (1) the displacement of nationalpower upwards through international agreements and organizations (see Chapter 12) anddownwards to regional and local governments (see Chapter 13) and (2) increasingcooperation among local and regional governments in key fields such as R&D andtechnology transfer in ways that bypass their respective national states.
Neoliberalism, together with the imprint of flexibility and the globalization of economicactivity (as described in this chapter) are described by Lash and Urry (1987) as advanced(disorganized) capitalism; this term distinguishes it from the previous phase that was dominatedby a closely regulated and highly organized relationship between labor, capital and governmentat the level of a country. Advanced capitalism, in contrast, is characterized by:
1. deconcentration of capital within national markets, a growing separation of finance fromindustry, and the decline of cartels (as a result of the growth of a world market, the increasingscale of industrial, commercial and banking enterprises, and the general decline of tariffs)
2. decline in the absolute and relative size of workers in the traditional industrial sector ofcore countries as they deindustrialize and the expansion of the services sector withprofessional, white-collar workers
3. decline in the importance and effectiveness of national-level collective bargaining, and agrowth in company and plant-level bargaining (as companies exert their new leverage inorder to impose more flexible forms of organization)
7. SPATIAL REORGANIZATION OF THE CORE ECONOMIES 181
6063 GEOGRAPHY WORLD ECON_PT_246x189 mm 22/01/2014 15:10 Page 181
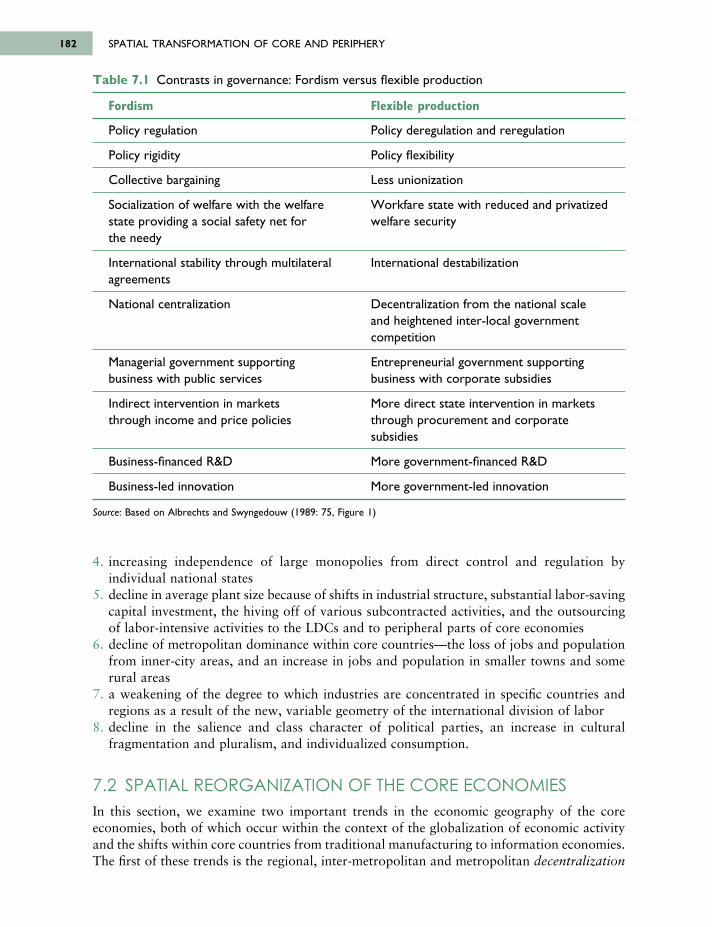
4. increasing independence of large monopolies from direct control and regulation byindividual national states
5. decline in average plant size because of shifts in industrial structure, substantial labor-savingcapital investment, the hiving off of various subcontracted activities, and the outsourcingof labor-intensive activities to the LDCs and to peripheral parts of core economies
6. decline of metropolitan dominance within core countries—the loss of jobs and populationfrom inner-city areas, and an increase in jobs and population in smaller towns and somerural areas
7. a weakening of the degree to which industries are concentrated in specific countries andregions as a result of the new, variable geometry of the international division of labor
8. decline in the salience and class character of political parties, an increase in culturalfragmentation and pluralism, and individualized consumption.
7.2 SPATIAL REORGANIZATION OF THE CORE ECONOMIESIn this section, we examine two important trends in the economic geography of the coreeconomies, both of which occur within the context of the globalization of economic activityand the shifts within core countries from traditional manufacturing to information economies.The first of these trends is the regional, inter-metropolitan and metropolitan decentralization
SPATIAL TRANSFORMATION OF CORE AND PERIPHERY182
Table 7.1 Contrasts in governance: Fordism versus flexible production
Fordism Flexible production
Policy regulation Policy deregulation and reregulation
Policy rigidity Policy flexibility
Collective bargaining Less unionization
Socialization of welfare with the welfare Workfare state with reduced and privatized state providing a social safety net for welfare securitythe needy
International stability through multilateral International destabilization agreements
National centralization Decentralization from the national scale and heightened inter-local government competition
Managerial government supporting Entrepreneurial government supporting business with public services business with corporate subsidies
Indirect intervention in markets More direct state intervention in markets through income and price policies through procurement and corporate
subsidies
Business-financed R&D More government-financed R&D
Business-led innovation More government-led innovation
Source: Based on Albrechts and Swyngedouw (1989: 75, Figure 1)
6063 GEOGRAPHY WORLD ECON_PT_246x189 mm 22/01/2014 15:10 Page 182
of certain categories of both manufacturing and service employment. The second is theregional and inter-metropolitan consolidation of other kinds of activities.
1. SPATIAL DECENTRALIZATION AND EXTERNAL CONTROL
Decentralization operates at regional, metropolitan and inter-metropolitan scales in responseto a variety of complex and often crosscutting processes of reorganization and adjustment.
Regional decentralizationRegional decentralization is a product of the migration of some firms and the “births” and“deaths” of others, together with the transfer of productive capacity by plant shutdowns incore, metropolitan regions and the opening of new branch plants (or the expansion of existingones) in declining or peripheral cities and regions of core countries.
A useful distinction can be made between diffuse industrialization and branch-plantindustrialization (Hudson, 1983). Diffuse industrialization has been directed towards thereserves of unskilled labor in rural regions. The areas of central and northeastern Italycustomarily provided classic examples of diffuse industrialization that resulted from thedecentralization of companies from the Milan-Turin area in response to the increasingshortage, cost, and militancy of labor there. Diffuse industrialization has typically involvedactivities in which labor costs were an important part of overall production costs and in whichthere was little scope for reducing labor costs through technological change; so it can be seenas an expression of the product–cycle model of industrial location. Empirical studies have shownthat the main attractions of rural locations for such activities have been:
• the availability of relatively low-cost labor• inexpensive supplies of easily developed land• lower levels of taxation• low levels of unionization.
In contrast, branch–plant industrialization has been directed towards the skilled manual laborreserves of declining industrial regions. It has typically involved activities that required signifi -cant inputs of technology and of skilled (or at least experienced) labor, and that also requireda certain degree of centrality in order to assemble and distribute raw materials and finishedproducts. Good examples are provided by many former textile cities—Dundee in the UnitedKingdom, for example, and Amiens in France—where branch plants in a variety of light indus -tries (including light engineering and, more recently, IT) have moved in to take advantage of“surplus” labor, cheap factory space and an established infrastructure. It is not only manu -facturing activities that are being decentralized, however, some places have attracted white-collar information-processing or wholesaling functions. Of the estimated 5 million customerservice agents in the United States, Texas has the most with 450,000 employed in bricks andmortar call centers or using the less expensive cloud-based contact-center technology that allowsagents to be “homesourced” through “phonesourcing.” In addition to its reliable telecom muni -cations and electric power infrastructure, what attracts companies is the relatively low cost ofliving and, some have argued, southern hospitality and Texan charm of the call center agents.Kentucky, for example, with its easy access to major population centers via major truckingroutes, is home to several of Amazon.com’s warehousing and order-fulfillment centers.
The twin processes of diffuse and branch–plant industrialization, combined with the processof mergers and acquisitions, have meant that regional decentralization has come to be
7. SPATIAL REORGANIZATION OF THE CORE ECONOMIES 183
6063 GEOGRAPHY WORLD ECON_PT_246x189 mm 22/01/2014 15:10 Page 183
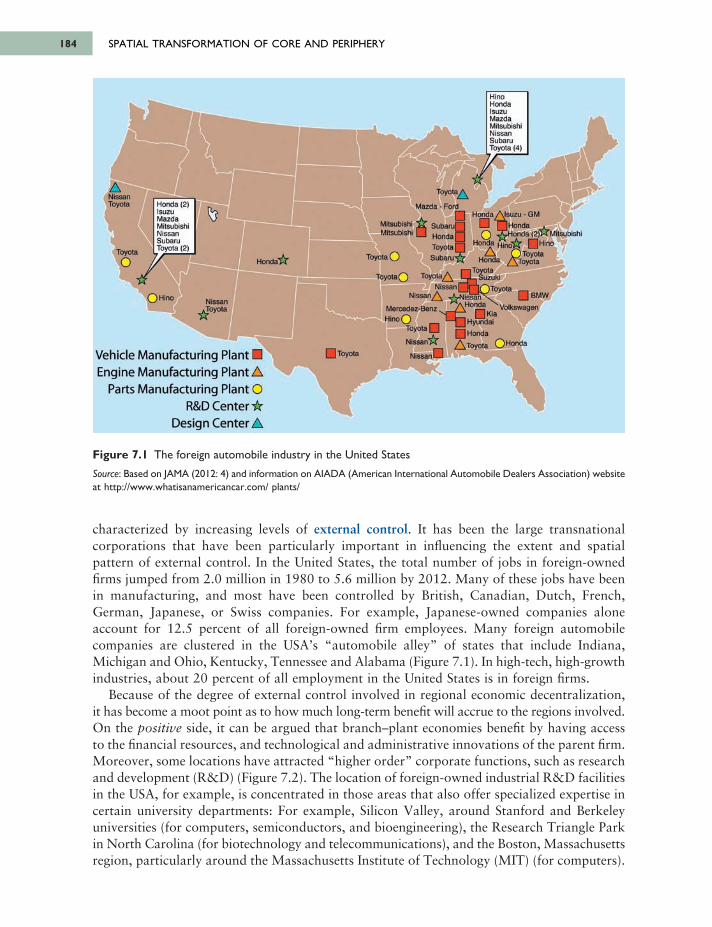
SPATIAL TRANSFORMATION OF CORE AND PERIPHERY184
characterized by increasing levels of external control. It has been the large transnationalcorporations that have been particularly important in influencing the extent and spatialpattern of external control. In the United States, the total number of jobs in foreign-ownedfirms jumped from 2.0 million in 1980 to 5.6 million by 2012. Many of these jobs have beenin manufacturing, and most have been controlled by British, Canadian, Dutch, French,German, Japanese, or Swiss companies. For example, Japanese-owned companies aloneaccount for 12.5 percent of all foreign-owned firm employees. Many foreign automobilecompanies are clustered in the USA’s “automobile alley” of states that include Indiana,Michigan and Ohio, Kentucky, Tennessee and Alabama (Figure 7.1). In high-tech, high-growthindustries, about 20 percent of all employment in the United States is in foreign firms.
Because of the degree of external control involved in regional economic decentralization,it has become a moot point as to how much long-term benefit will accrue to the regions involved.On the positive side, it can be argued that branch–plant economies benefit by having accessto the financial resources, and technological and administrative innovations of the parent firm.Moreover, some locations have attracted “higher order” corporate functions, such as researchand development (R&D) (Figure 7.2). The location of foreign-owned industrial R&D facilitiesin the USA, for example, is concentrated in those areas that also offer specialized expertise incertain university departments: For example, Silicon Valley, around Stanford and Berkeleyuniversities (for computers, semiconductors, and bioengineering), the Research Triangle Parkin North Carolina (for biotechnology and telecommunications), and the Boston, Massachusettsregion, particularly around the Massachusetts Institute of Technology (MIT) (for computers).
Figure 7.1 The foreign automobile industry in the United States
Source: Based on JAMA (2012: 4) and information on AIADA (American International Automobile Dealers Association) websiteat http://www.whatisanamericancar.com/ plants/
6063 GEOGRAPHY WORLD ECON_PT_246x189 mm 22/01/2014 15:10 Page 184
Honda (2)IsuzuMazdaMitsubishiNissanSubaruToyota (2)
NissanToyota
Toyota
Hino
Honda!
Nissan.Toyota
I Toyota
MitsubishiMitsubishi
Mazda - Ford
HinoHondaIsuzuMazdaMitsubishiNissanSubaruToyota (4)
Honda
J HondavHondaі rMitsubishi
]H in otonda Hin
; Subaru Honda[ Toyota [ Subaru’'Toyota (
Toyota
Mercedez-BenzHtnnf
Toyota [
Nissan
Nissan
] Hyundai
] Honda
^Toyota ) Honda
] BMWNissan\ Hnndf
Kia
Toyota/Nissan I
Nissan/
HondaJ Toyota Joyota
і Toyota L Suzuki
" j Q Toyota
Jsuzu - GM
Vehicle Manufacturing Plant Engine Manufacturing Plant
Parts Manufacturina PlantR&D Center
Design Center
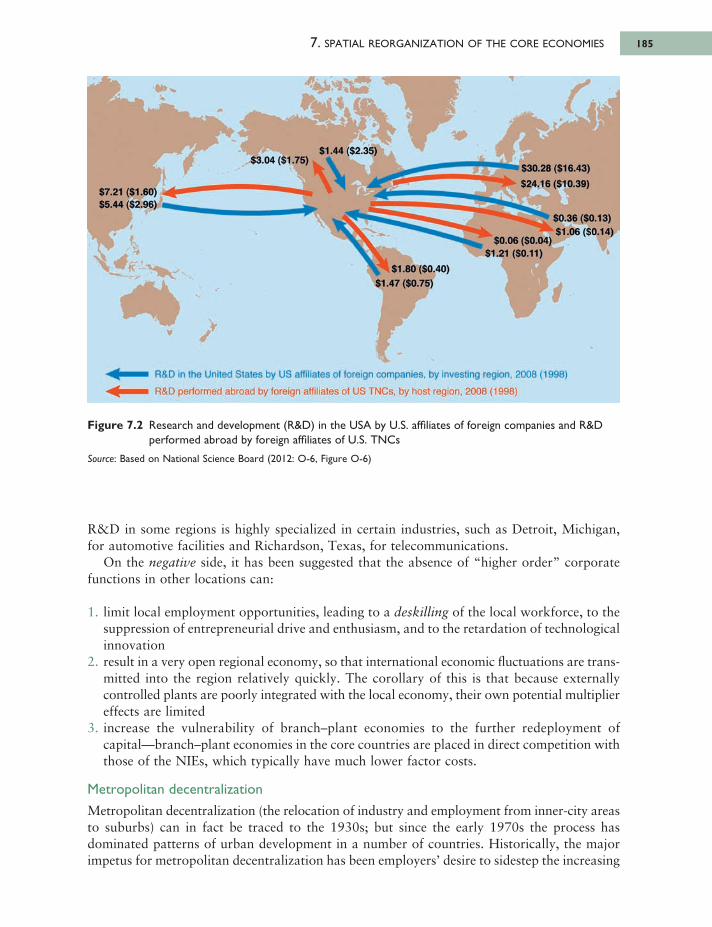
R&D in some regions is highly specialized in certain industries, such as Detroit, Michigan,for automotive facilities and Richardson, Texas, for telecommunications.
On the negative side, it has been suggested that the absence of “higher order” corporatefunctions in other locations can:
1. limit local employment opportunities, leading to a deskilling of the local workforce, to thesuppression of entrepreneurial drive and enthusiasm, and to the retardation of technologicalinnovation
2. result in a very open regional economy, so that international economic fluctuations are trans -mitted into the region relatively quickly. The corollary of this is that because externallycontrolled plants are poorly integrated with the local economy, their own potential multipliereffects are limited
3. increase the vulnerability of branch–plant economies to the further redeployment ofcapital—branch–plant economies in the core countries are placed in direct competition withthose of the NIEs, which typically have much lower factor costs.
Metropolitan decentralization
Metropolitan decentralization (the relocation of industry and employment from inner-city areasto suburbs) can in fact be traced to the 1930s; but since the early 1970s the process hasdominated patterns of urban development in a number of countries. Historically, the majorimpetus for metropolitan decentralization has been employers’ desire to sidestep the increasing
7. SPATIAL REORGANIZATION OF THE CORE ECONOMIES 185
Figure 7.2 Research and development (R&D) in the USA by U.S. affiliates of foreign companies and R&Dperformed abroad by foreign affiliates of U.S. TNCs
Source: Based on National Science Board (2012: O-6, Figure O-6)
6063 GEOGRAPHY WORLD ECON_PT_246x189 mm 22/01/2014 15:10 Page 185
S7.21 ($1.60) S5.44 (S2.96)
$3.04(51.75)51.44 (S2.35)
530.28 (S16.43) 524.16(510.39)
50.36 (50.13) 51.06 (S0.14)
50.06 (50.04] 51.21 (50.11)
51.80(50.40) $1.47 ($0.75)
R&D in the United States by US affiliates of foreign companies, by investing region, 2008 (1998)
R&D perfo rm ed abroad by fo re ign a ffilia tes o f US TN C s, by host region, 2008 (1998)
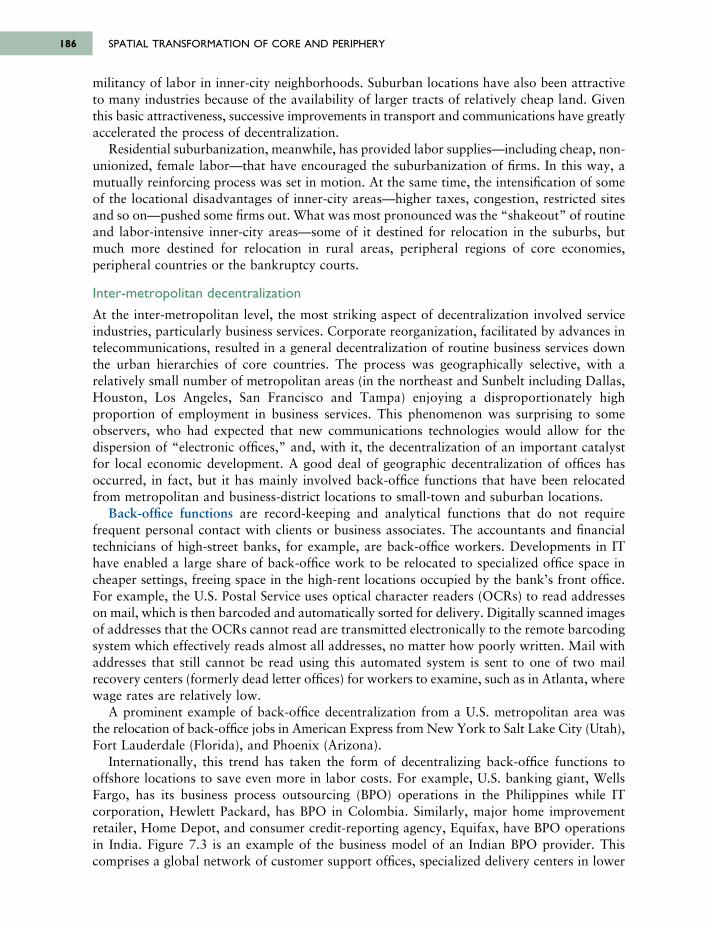
militancy of labor in inner-city neighborhoods. Suburban locations have also been attractiveto many industries because of the availability of larger tracts of relatively cheap land. Giventhis basic attractiveness, successive improvements in transport and communications have greatlyaccelerated the process of decentralization.
Residential suburbanization, meanwhile, has provided labor supplies—including cheap, non-unionized, female labor—that have encouraged the suburbanization of firms. In this way, amutually reinforcing process was set in motion. At the same time, the intensification of someof the locational disadvantages of inner-city areas—higher taxes, congestion, restricted sitesand so on—pushed some firms out. What was most pronounced was the “shakeout” of routineand labor-intensive inner-city areas—some of it destined for relocation in the suburbs, butmuch more destined for relocation in rural areas, peripheral regions of core economies,peripheral countries or the bankruptcy courts.
Inter-metropolitan decentralization
At the inter-metropolitan level, the most striking aspect of decentralization involved serviceindustries, particularly business services. Corporate reorganization, facilitated by advances intelecommunications, resulted in a general decentralization of routine business services downthe urban hierarchies of core countries. The process was geographically selective, with arelatively small number of metropolitan areas (in the northeast and Sunbelt including Dallas,Houston, Los Angeles, San Francisco and Tampa) enjoying a disproportionately highproportion of employment in business services. This phenomenon was surprising to someobservers, who had expected that new communications technologies would allow for thedispersion of “electronic offices,” and, with it, the decentralization of an important catalystfor local economic development. A good deal of geographic decentralization of offices hasoccurred, in fact, but it has mainly involved back-office functions that have been relocatedfrom metropolitan and business-district locations to small-town and suburban locations.
Back-office functions are record-keeping and analytical functions that do not requirefrequent personal contact with clients or business associates. The accountants and financialtechnicians of high-street banks, for example, are back-office workers. Developments in IThave enabled a large share of back-office work to be relocated to specialized office space incheaper settings, freeing space in the high-rent locations occupied by the bank’s front office.For example, the U.S. Postal Service uses optical character readers (OCRs) to read addresseson mail, which is then barcoded and automatically sorted for delivery. Digitally scanned imagesof addresses that the OCRs cannot read are transmitted electronically to the remote barcodingsystem which effectively reads almost all addresses, no matter how poorly written. Mail withaddresses that still cannot be read using this automated system is sent to one of two mailrecovery centers (formerly dead letter offices) for workers to examine, such as in Atlanta, wherewage rates are relatively low.
A prominent example of back-office decentralization from a U.S. metropolitan area wasthe relocation of back-office jobs in American Express from New York to Salt Lake City (Utah),Fort Lauderdale (Florida), and Phoenix (Arizona).
Internationally, this trend has taken the form of decentralizing back-office functions tooffshore locations to save even more in labor costs. For example, U.S. banking giant, WellsFargo, has its business process outsourcing (BPO) operations in the Philippines while ITcorporation, Hewlett Packard, has BPO in Colombia. Similarly, major home improvementretailer, Home Depot, and consumer credit-reporting agency, Equifax, have BPO operationsin India. Figure 7.3 is an example of the business model of an Indian BPO provider. Thiscomprises a global network of customer support offices, specialized delivery centers in lower
SPATIAL TRANSFORMATION OF CORE AND PERIPHERY186
6063 GEOGRAPHY WORLD ECON_PT_246x189 mm 22/01/2014 15:10 Page 186
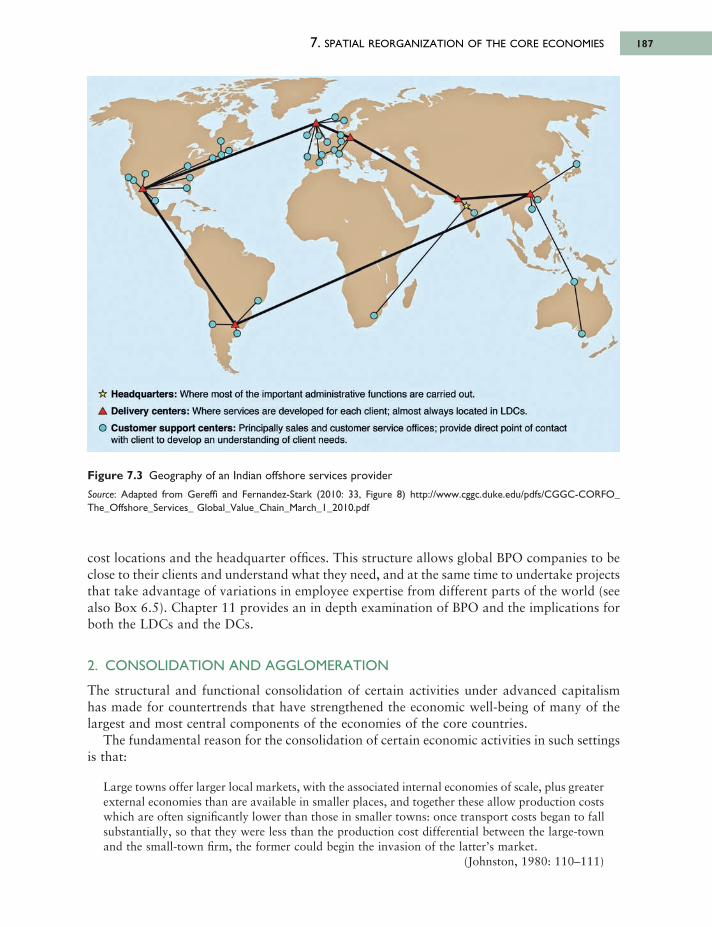
7. SPATIAL REORGANIZATION OF THE CORE ECONOMIES 187
cost locations and the headquarter offices. This structure allows global BPO companies to beclose to their clients and understand what they need, and at the same time to undertake projectsthat take advantage of variations in employee expertise from different parts of the world (seealso Box 6.5). Chapter 11 provides an in depth examination of BPO and the implications forboth the LDCs and the DCs.
2. CONSOLIDATION AND AGGLOMERATION
The structural and functional consolidation of certain activities under advanced capitalismhas made for countertrends that have strengthened the economic well-being of many of thelargest and most central components of the economies of the core countries.
The fundamental reason for the consolidation of certain economic activities in such settingsis that:
Large towns offer larger local markets, with the associated internal economies of scale, plus greaterexternal economies than are available in smaller places, and together these allow production costswhich are often significantly lower than those in smaller towns: once transport costs began to fallsubstantially, so that they were less than the production cost differential between the large-townand the small-town firm, the former could begin the invasion of the latter’s market.
(Johnston, 1980: 110–111)
Figure 7.3 Geography of an Indian offshore services provider
Source: Adapted from Gereffi and Fernandez-Stark (2010: 33, Figure 8) http://www.cggc.duke.edu/pdfs/CGGC-CORFO_The_Offshore_Services_ Global_Value_Chain_March_1_2010.pdf
6063 GEOGRAPHY WORLD ECON_PT_246x189 mm 22/01/2014 15:10 Page 187
г Headquarters: Where most of the important administrative functions are carried out
Delivery centers: Where services are developed for each client; almost always located in LDC:
Customer support centers: Principally sales and customer service offices; provide direct point of contact with client to develop an understanding of client needs.
The sectoral shifts and manufacturing specializations of advanced capitalism have alsoworked in favor of many large cities and metropolitan regions. Manufacturers of manysophisticated new high-value-added products have been drawn to such locations. The reasonsfor this are several:
• the complex links that these new products have with established industries• their dependence on risk capital in the early stages of development• their need for access to a large, affluent and sophisticated market during the early stages
of marketing.
Similarly, large parts of the expanding service sector have been drawn towards metropolitanlocations because of the kind of environment and workforce required by information-processing, coordinating, controlling and marketing activities.
Corporate restructuring and new competitive strategies have added to the agglomerativeand recentralizing trends of certain economic activities in metropolitan settings. Flexibleproduction requires a new social division of labor with access to a large and fluid labor pool(containing part-time and temporary workers as well as highly skilled workers—attributes thatare most readily found in metropolitan settings). Equally important, metropolitan settings areessential to the externalization of certain functions and the more extensive use of outsideconsultants, subcontracting, joint ventures, strategic alliances and collaborative R&D thatcharacterize flexible production systems.
SPATIAL TRANSFORMATION OF CORE AND PERIPHERY188
Box 7.1 The Sunbelt
Regional, metropolitan and inter-metropolitan decentralization are individual components inwhat is ultimately a multidimensional dynamic of spatial change. The growth of the U.S.Sunbelt provides a good example. The Sunbelt phenomenon can be interpreted as thecombined product of diffuse industrialization, inter-metropolitan decentralization andmetropolitan decentralization. Such an interpretation is supported by the types ofemployment growth that characterized the rise of the Sunbelt: (1) production jobs in branchplants in industries such as textiles, clothing and electronics; (2) production jobs in branchplants and in locally based firms in high-growth industries—mainly in computer hardware,scientific instruments, aerospace, and chemicals and plastics; and (3) service jobs cateringboth to these industries and to the increased population attracted to the retirement andleisure communities.
In very general terms, Sunbelt states such as Arizona, California, and Texas benefitedfrom relative advantages in terms of labor costs, labor unionization, land costs, energy costs,local taxation, local government boosterism, and federal expenditure patterns. In addition,Sunbelt cities were attractive to industries because they did not have a legacy of inefficientlayout and obsolete infrastructure.
Having enjoyed decades of heady growth, the economic downturn that began in the late2000s hit particularly hard. Sunbelt states such as Arizona, California, Nevada and Floridasuffered record job losses and home foreclosures. But the Sunbelt is rebounding, especiallyin states like Texas with oil and gas drilling and processing.
6063 GEOGRAPHY WORLD ECON_PT_246x189 mm 22/01/2014 15:10 Page 188
7. SPATIAL REORGANIZATION OF THE CORE ECONOMIES 189
Box 7.2 Agglomeration and the “relational turn” ineconomic geography: Motorsport Valley
[I]t is precisely the social, institutional, cultural and political embeddedness of local and regionaleconomies that can play a key role in determining the possibilities for or constraints ondevelopment; and thus why spatial agglomeration of economic activity occurs in particularplaces and not others . . . it is not merely a case of recognizing that the mechanisms ofeconomic development, growth and welfare operate unevenly across space, but that thosemechanisms are themselves spatially differentiated and in part geographically constituted; that is,determined by locally varying, scale-dependent social, cultural and institutional conditions.
Martin (1999: 75, 83)
Many economic geographers have become increasingly concerned with the ways in whichthe socio-spatial relations among agents and structures shape the spatial organization ofeconomic activities. In 2003 the Journal of Economic Geography devoted a special issue to the“relational turn” in economic geography (see, for example, Boggs and Rantisi, 2003).
Henry and Pinch (2000) offered a case study of the agglomeration of the Britishmotorsport industry in Motorsport Valley to show how this relational economic geographyallows economic geographers to conceptualize geographical specialization as theconstruction of a socially embedded and “relational” economic system. By global standards,the British motorsport industry is a classic example of a leading regional agglomeration. This agglomeration—the Silicon Valley of Motorsport—is located in the vicinity of Oxford(northwest of London) and dominates the world’s racing car industry.
Motorsport Valley began as a network of small companies but now includes close linkswith major international automobile manufacturers, including Ferrari, Ford and Mercedes-Benz. About three-fourths of the world’s single-seater racing cars are designed andassembled in this region, including the vast majority of the most competitive Formula Oneand IndyCar cars. The region is also the base for a large number of rallying teams.
Henry and Pinch argue that Motorsport Valley can best be conceptualized as a“knowledge community” that comprises a socially and spatially embedded economic systemfacilitating the generation and rapid dissemination of knowledge about the best ways todesign and manufacture racing cars. Their case study analysis found that a key characteristicof the industrial organization and labor market of motorsport is a set of processes involvinga continual “churning” of people and ideas, in this case, centered on, and within, MotorsportValley. This “churning” is a process of producing and circulating knowledge within theknowledge community and regional production center of Motorsport Valley. As workersmove among companies, for example, they carry with them knowledge and ideas about howthings are done in other companies, which helps to raise the level of knowledge throughoutthe industry and within the region.
Henry and Pinch report on concerns about the geographical mobility of motorsportproduction within the context of the growth of industry in the NIEs (see Chapter 10).Because the success of Motorsport Valley depends largely on knowledge, it may be easy toshift this expertise to another region, for example, to China where major investments havebeen made to promote a motorsport industry there. These authors argue, however, thatthis concern underestimates the (knowledge-laden) production process of the fast movingmotorsport industry. “The knowledge of the British motorsport industry is encapsulated inparticular people, objects and ways of doing things which are themselves constructed in aparticular place” (Henry and Pinch, 2000: 140) in this case, Motorsport Valley.
6063 GEOGRAPHY WORLD ECON_PT_246x189 mm 22/01/2014 15:10 Page 189
Finally, the national and international redeployment of activities by large conglomeratecompanies has also contributed to the consolidation of certain activities in the central regionsand metropolitan areas of the developed countries. In particular, there has been a markedlocalization of two key functions: Headquarters offices and R&D establishments. Indeed, thedistribution of these two functions has come to represent an important dimension of theeconomic geography of advanced capitalism.
CORPORATE CONTROL CENTERS AND WORLD CITIES
The United States provides a good example of the changing geography of corporate head-quarters. Historically, the most striking feature of the geography of corporate headquartersin the USA had been the dominance of the Manufacturing Belt in general and of New Yorkand Chicago in particular. Elsewhere, the pattern of headquarters offices had tended to reflectthe geography of urbanization, so that the more important “control centers,” in terms ofbusiness corporations, had been the major entrepôts and central places that developed underearlier phases of economic development, as points of optimal accessibility to regionaleconomies.
With advanced capitalism the relative importance of the control centers of the Manu-facturing Belt has decreased somewhat, with cities in the Midwest, and in the south and thewest increasing their share of major company headquarters offices. Atlanta, Dallas, Houston,Minneapolis, and St. Louis have been the major beneficiaries of this shift, although no newcontrol centers have emerged to counter the dominance of New York. One interpretation ofthis shift is that it is simply a reflection of changes in the central place system: High-orderurban areas tend to be higher order business control centers because of their reserves ofentrepreneurial talent, the array of support services they can offer, and their accessibility inboth a regional and a national context.
In overall terms, “there has been a process of cumulative and mutual reinforcement betweenrelatively accessible locations and relatively effective entrepreneurship” (Borchert, 1978: 230;emphasis added). This has made for a high degree of inertia in the geography of economiccontrol centers and this, in turn, has consolidated the economic position of the metropolitanareas of the northeast through the multiplier effects of concentrations of corporateheadquarters, whereby the vitality of the corporate administrative sector contributes to thegrowth and circulation of specialized information concerning business activity, which generatesfurther employment in a relatively well-paid sector and sustains the area’s attractiveness forheadquarters offices.
The concentration of corporate headquarters offices has contributed to the emergence of afew places within the international urban system as world cities, dominant centers and sub-centers of transnational business, international finance and international business services—what Friedmann (1986) called the “basing points” for global capital. These world cities, itshould be stressed, are not necessarily the biggest within the international system of cities interms of population, employment or output. Rather, they are the “control centers” of the worldeconomy: Places that are critical to the articulation of production and marketing under thecontemporary phase of world economic development. Because these properties are difficult toquantify, it is not possible to establish a definitive list or hierarchy of world cities. It is possibleto identify world cities on the basis of their role in articulating the functions of the worldeconomy associated with financial markets, major corporate headquarters, internationalinstitutions, communications nodes and concentrations of business services (Figure 7.4). Onthis basis, all three of the dominant world cities—New York, London and Tokyo—are located
SPATIAL TRANSFORMATION OF CORE AND PERIPHERY190
6063 GEOGRAPHY WORLD ECON_PT_246x189 mm 22/01/2014 15:10 Page 190
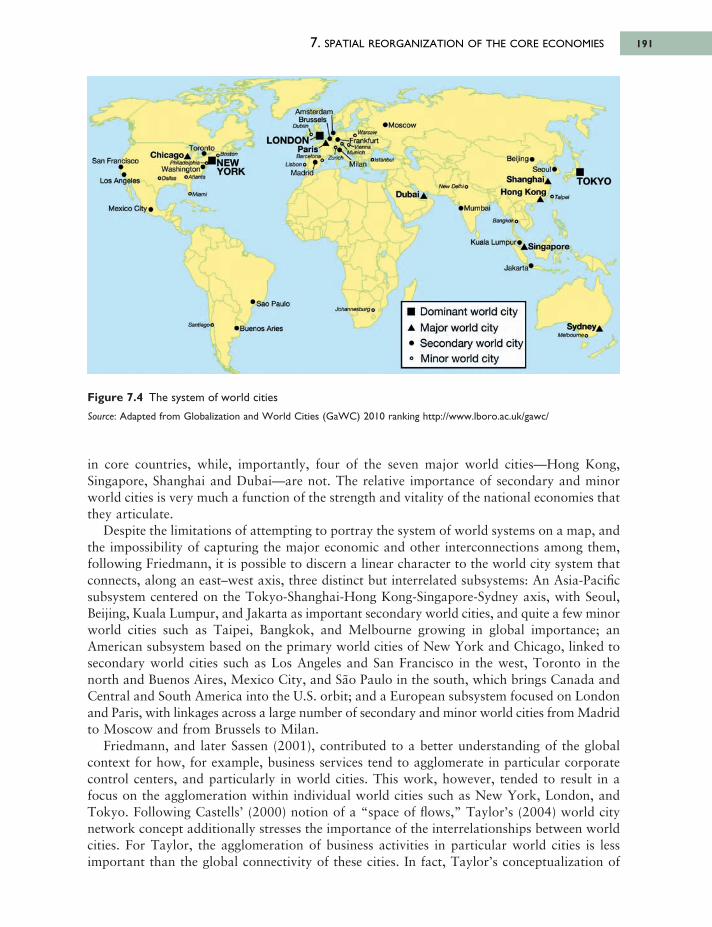
7. SPATIAL REORGANIZATION OF THE CORE ECONOMIES 191
in core countries, while, importantly, four of the seven major world cities—Hong Kong,Singapore, Shanghai and Dubai—are not. The relative importance of secondary and minorworld cities is very much a function of the strength and vitality of the national economies thatthey articulate.
Despite the limitations of attempting to portray the system of world systems on a map, andthe impossibility of capturing the major economic and other interconnections among them,following Friedmann, it is possible to discern a linear character to the world city system thatconnects, along an east–west axis, three distinct but interrelated subsystems: An Asia-Pacificsubsystem centered on the Tokyo-Shanghai-Hong Kong-Singapore-Sydney axis, with Seoul,Beijing, Kuala Lumpur, and Jakarta as important secondary world cities, and quite a few minorworld cities such as Taipei, Bangkok, and Melbourne growing in global importance; anAmerican subsystem based on the primary world cities of New York and Chicago, linked tosecondary world cities such as Los Angeles and San Francisco in the west, Toronto in thenorth and Buenos Aires, Mexico City, and São Paulo in the south, which brings Canada andCentral and South America into the U.S. orbit; and a European subsystem focused on Londonand Paris, with linkages across a large number of secondary and minor world cities from Madridto Moscow and from Brussels to Milan.
Friedmann, and later Sassen (2001), contributed to a better understanding of the globalcontext for how, for example, business services tend to agglomerate in particular corporatecontrol centers, and particularly in world cities. This work, however, tended to result in afocus on the agglomeration within individual world cities such as New York, London, andTokyo. Following Castells’ (2000) notion of a “space of flows,” Taylor’s (2004) world citynetwork concept additionally stresses the importance of the interrelationships between worldcities. For Taylor, the agglomeration of business activities in particular world cities is lessimportant than the global connectivity of these cities. In fact, Taylor’s conceptualization of
Figure 7.4 The system of world cities
Source: Adapted from Globalization and World Cities (GaWC) 2010 ranking http://www.lboro.ac.uk/gawc/
6063 GEOGRAPHY WORLD ECON_PT_246x189 mm 22/01/2014 15:10 Page 191
Amsterdam Brussels I
•M oscowe Warsaw0w s*w
r-FrankfurtV'-Viarvvi
o to w * * *Milan
LONDON^1Paris
Barcelona^ _Lnbono ]
Madrid
Dubaitow D*>ΙΟ
Beijing і
Jeouli
TOKYOShanghaiHong Kong #
•M um bai
Bangkoko
Lunw.ASjngapore
Jakarta'
Dominant world city Major world city Secondary world city Minor world city
Sydney^КШЬоитао
Johannesburg <•S a o Paulo
SanriagoO Buenos Aries
San Francisco
TorontoChicago a · ©*»»"
Philadelphia n e wW ashington· YORK
OOallas OAUanta
OAtan
Los Angeles
Mexico C ity i
world cities in the world economy fits nicely with Immanuel Wallerstein’s world-system theorythat forms an important underlying explanatory framework for this book (see Chapter 2):
Wallerstein’s (1979a) description of core processes can be interpreted as city-making processes(both produce spatially clustered high-tech outcomes), and peripheral processes—the developmentof underdevelopment . . . In the contemporary world-economy, therefore, the core is defined bythe processes of new work that are constituting the world city network, and the periphery is therest of the world beyond the world city network. The semi-periphery is defined in Wallersteinianterms as locales where core and periphery processes are approximately balanced; these are citiesin the erstwhile “third world” that are now part of the world city network but are also “mega-cities” (pernicious population “town” growth that is a periphery process). This is what makescities such as São Paulo, Mexico City, Mumbai, Johannesburg and Bangkok among the mostinteresting settlements in the first decades of the twenty-first century.
(Taylor, 2007: 296)
AGGLOMERATION AND BUSINESS SERVICES
Business services tend to agglomerate in particular corporate control centers, and particularlyin world cities. Barney Warf (2007) argues for the use of actor-network theory to betterunderstand why some forms of service production are concentrated in a small number of urbancenters like world cities, while other services are more dispersed globally. He makes adistinction between two kinds of knowledge: Standardized knowledge, which includes formsof information that are easily transmitted from one person to another, such as quantitativedata, publicly known rules and standards, and orderly records; and tacit knowledge, whichincludes information that is not standardized, changes rapidly, and is often not put in writing.Actor-network theory focuses on questions of power, politics and social relations, andhighlights the fact that the global service economy is the contingent outcome of differentindividuals and groups situated in networks. In conjunction with the “cultural turn” ineconomic geography (see Box 7.5), the use of actor-network theory is a way to help makesense of the emerging geographies of centrality and peripherality unleashed by the globalizationnot only of manufacturing but also of services:
High value-added services, using skilled labor and tacit forms of knowledge, are highlyagglomerated in the world’s global cities. Such functions tend to be deeply embedded territoriallyand thus the competitive advantages of established centers are difficult to reproduce. In contrast,relatively low value-added service functions, such as back offices, call centers, and offshore banks,are increasingly dispersed to the world’s low wage periphery. These operations, relying upondisembedded, standardized knowledge, are footloose and change locations frequently. These twosets of services represent opposite poles of one continuous process that geographically segregatesfunctions on the basis of their value-added and types of skills and knowledges utilized. Both typesof services are embodied in people and embedded in local and international contexts, formingcomplex mixtures of the local and global.
(Warf, 2007: 1)
Research on changing occupational structure and the use of computers in the workplaceby Levy and Murnane (2004) supports this assessment. They found that since the 1960s inthe United States, the percentage of employees has risen in occupations that emphasize “expertthinking” involving solving problems for which there are no rule-based solutions. Examplesinclude diagnosing an illness of a patient whose symptoms seem strange or repairing an auto -mobile that does not run well but which the computer diagnostics indicate has no problems.
SPATIAL TRANSFORMATION OF CORE AND PERIPHERY192
6063 GEOGRAPHY WORLD ECON_PT_246x189 mm 22/01/2014 15:10 Page 192
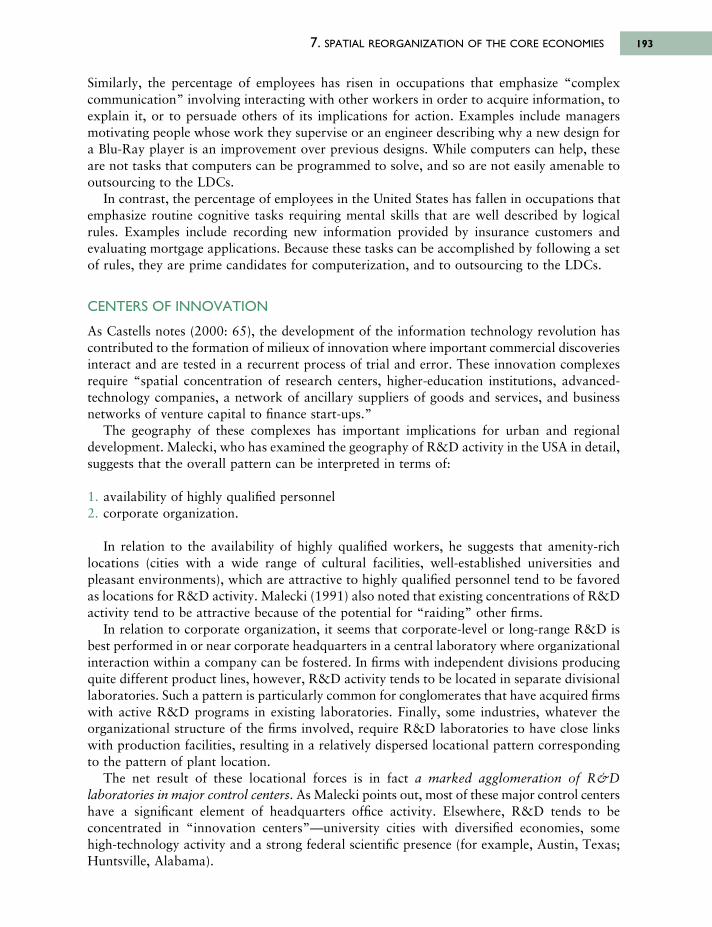
Similarly, the percentage of employees has risen in occupations that emphasize “complexcommunication” involving interacting with other workers in order to acquire information, toexplain it, or to persuade others of its implications for action. Examples include managersmotivating people whose work they supervise or an engineer describing why a new design fora Blu-Ray player is an improvement over previous designs. While computers can help, theseare not tasks that computers can be programmed to solve, and so are not easily amenable tooutsourcing to the LDCs.
In contrast, the percentage of employees in the United States has fallen in occupations thatemphasize routine cognitive tasks requiring mental skills that are well described by logicalrules. Examples include recording new information provided by insurance customers andevaluating mortgage applications. Because these tasks can be accomplished by following a setof rules, they are prime candidates for computerization, and to outsourcing to the LDCs.
CENTERS OF INNOVATION
As Castells notes (2000: 65), the development of the information technology revolution hascontributed to the formation of milieux of innovation where important commercial discoveriesinteract and are tested in a recurrent process of trial and error. These innovation complexesrequire “spatial concentration of research centers, higher-education institutions, advanced-technology companies, a network of ancillary suppliers of goods and services, and businessnetworks of venture capital to finance start-ups.”
The geography of these complexes has important implications for urban and regionaldevelopment. Malecki, who has examined the geography of R&D activity in the USA in detail,suggests that the overall pattern can be interpreted in terms of:
1. availability of highly qualified personnel2. corporate organization.
In relation to the availability of highly qualified workers, he suggests that amenity-richlocations (cities with a wide range of cultural facilities, well-established universities andpleasant environments), which are attractive to highly qualified personnel tend to be favoredas locations for R&D activity. Malecki (1991) also noted that existing concentrations of R&Dactivity tend to be attractive because of the potential for “raiding” other firms.
In relation to corporate organization, it seems that corporate-level or long-range R&D isbest performed in or near corporate headquarters in a central laboratory where organizationalinteraction within a company can be fostered. In firms with independent divisions producingquite different product lines, however, R&D activity tends to be located in separate divisionallaboratories. Such a pattern is particularly common for conglomerates that have acquired firmswith active R&D programs in existing laboratories. Finally, some industries, whatever theorganizational structure of the firms involved, require R&D laboratories to have close linkswith production facilities, resulting in a relatively dispersed locational pattern correspondingto the pattern of plant location.
The net result of these locational forces is in fact a marked agglomeration of R&Dlaboratories in major control centers. As Malecki points out, most of these major control centershave a significant element of headquarters office activity. Elsewhere, R&D tends to beconcentrated in “innovation centers”—university cities with diversified economies, some high-technology activity and a strong federal scientific presence (for example, Austin, Texas;Huntsville, Alabama).
7. SPATIAL REORGANIZATION OF THE CORE ECONOMIES 193
6063 GEOGRAPHY WORLD ECON_PT_246x189 mm 22/01/2014 15:10 Page 193
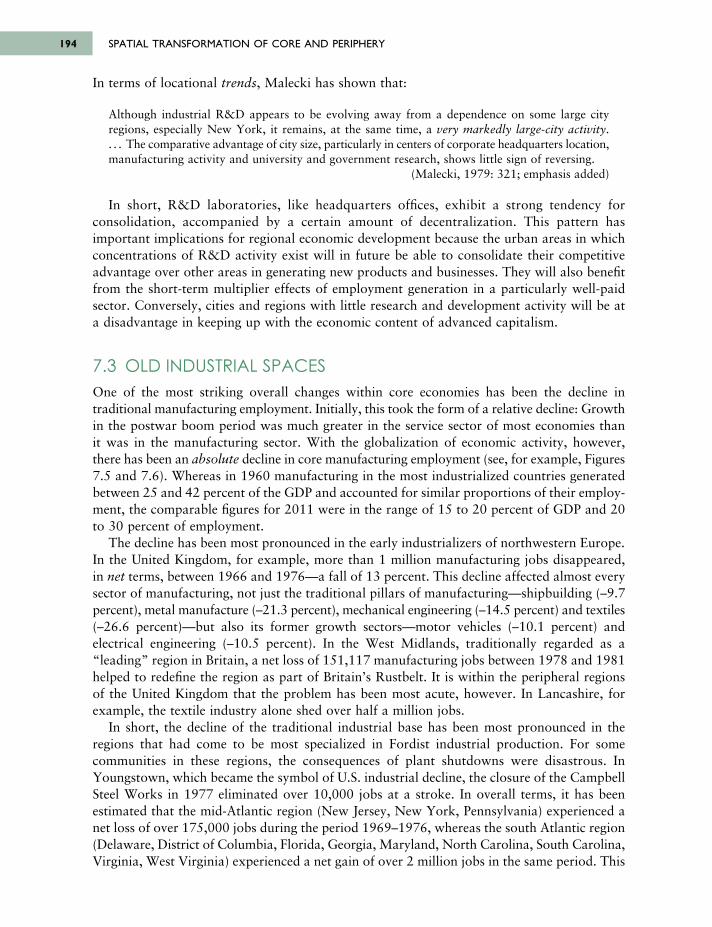
In terms of locational trends, Malecki has shown that:
Although industrial R&D appears to be evolving away from a dependence on some large cityregions, especially New York, it remains, at the same time, a very markedly large-city activity. . . . The comparative advantage of city size, particularly in centers of corporate headquarters location,manufacturing activity and university and government research, shows little sign of reversing.
(Malecki, 1979: 321; emphasis added)
In short, R&D laboratories, like headquarters offices, exhibit a strong tendency forconsolidation, accompanied by a certain amount of decentralization. This pattern hasimportant implications for regional economic development because the urban areas in whichconcentrations of R&D activity exist will in future be able to consolidate their competitiveadvantage over other areas in generating new products and businesses. They will also benefitfrom the short-term multiplier effects of employment generation in a particularly well-paidsector. Conversely, cities and regions with little research and development activity will be ata disadvantage in keeping up with the economic content of advanced capitalism.
7.3 OLD INDUSTRIAL SPACESOne of the most striking overall changes within core economies has been the decline intraditional manufacturing employment. Initially, this took the form of a relative decline: Growthin the postwar boom period was much greater in the service sector of most economies thanit was in the manufacturing sector. With the globalization of economic activity, however, there has been an absolute decline in core manufacturing employment (see, for example, Figures7.5 and 7.6). Whereas in 1960 manufacturing in the most industrialized countries generatedbetween 25 and 42 percent of the GDP and accounted for similar proportions of their employ-ment, the comparable figures for 2011 were in the range of 15 to 20 percent of GDP and 20to 30 percent of employment.
The decline has been most pronounced in the early industrializers of northwestern Europe.In the United Kingdom, for example, more than 1 million manufacturing jobs disappeared,in net terms, between 1966 and 1976—a fall of 13 percent. This decline affected almost everysector of manufacturing, not just the traditional pillars of manufacturing—shipbuilding (–9.7percent), metal manufacture (–21.3 percent), mechanical engineering (–14.5 percent) and textiles(–26.6 percent)—but also its former growth sectors—motor vehicles (–10.1 percent) andelectrical engineering (–10.5 percent). In the West Midlands, traditionally regarded as a“leading” region in Britain, a net loss of 151,117 manufacturing jobs between 1978 and 1981helped to redefine the region as part of Britain’s Rustbelt. It is within the peripheral regionsof the United Kingdom that the problem has been most acute, however. In Lancashire, forexample, the textile industry alone shed over half a million jobs.
In short, the decline of the traditional industrial base has been most pronounced in theregions that had come to be most specialized in Fordist industrial production. For somecommunities in these regions, the consequences of plant shutdowns were disastrous. InYoungstown, which became the symbol of U.S. industrial decline, the closure of the CampbellSteel Works in 1977 eliminated over 10,000 jobs at a stroke. In overall terms, it has beenestimated that the mid-Atlantic region (New Jersey, New York, Pennsylvania) experienced anet loss of over 175,000 jobs during the period 1969–1976, whereas the south Atlantic region(Delaware, District of Columbia, Florida, Georgia, Maryland, North Carolina, South Carolina,Virginia, West Virginia) experienced a net gain of over 2 million jobs in the same period. This
SPATIAL TRANSFORMATION OF CORE AND PERIPHERY194
6063 GEOGRAPHY WORLD ECON_PT_246x189 mm 22/01/2014 15:10 Page 194
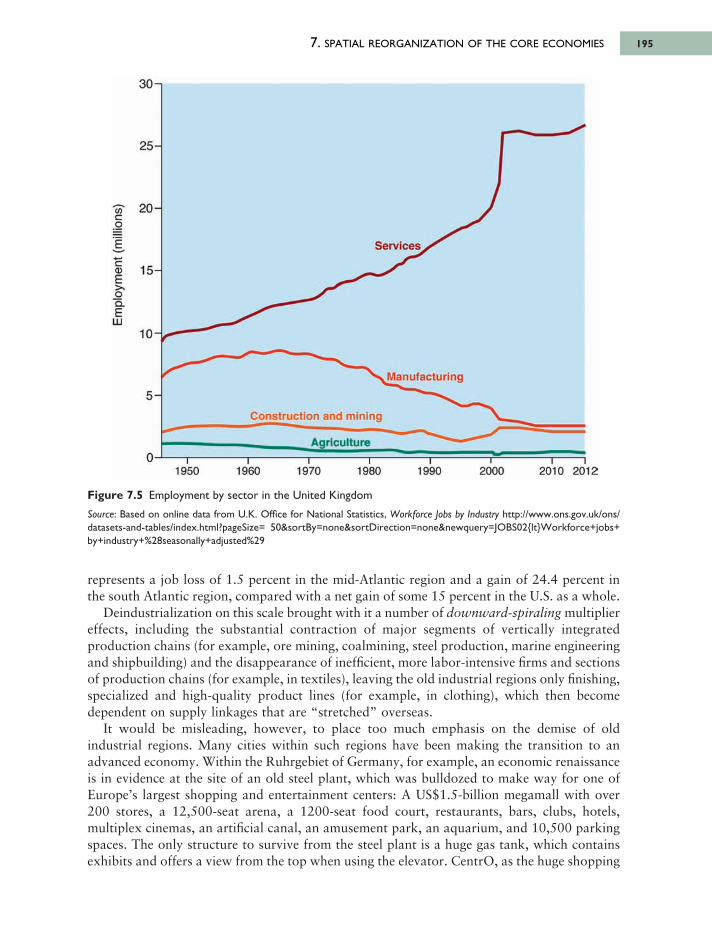
7. SPATIAL REORGANIZATION OF THE CORE ECONOMIES 195
represents a job loss of 1.5 percent in the mid-Atlantic region and a gain of 24.4 percent inthe south Atlantic region, compared with a net gain of some 15 percent in the U.S. as a whole.
Deindustrialization on this scale brought with it a number of downward-spiraling multipliereffects, including the substantial contraction of major segments of vertically integratedproduction chains (for example, ore mining, coalmining, steel production, marine engineeringand shipbuilding) and the disappearance of inefficient, more labor-intensive firms and sectionsof production chains (for example, in textiles), leaving the old industrial regions only finishing,specialized and high-quality product lines (for example, in clothing), which then becomedependent on supply linkages that are “stretched” overseas.
It would be misleading, however, to place too much emphasis on the demise of oldindustrial regions. Many cities within such regions have been making the transition to anadvanced economy. Within the Ruhrgebiet of Germany, for example, an economic renaissanceis in evidence at the site of an old steel plant, which was bulldozed to make way for one ofEurope’s largest shopping and entertainment centers: A US$1.5-billion megamall with over200 stores, a 12,500-seat arena, a 1200-seat food court, restaurants, bars, clubs, hotels,multiplex cinemas, an artificial canal, an amusement park, an aquarium, and 10,500 parkingspaces. The only structure to survive from the steel plant is a huge gas tank, which containsexhibits and offers a view from the top when using the elevator. CentrO, as the huge shopping
Figure 7.5 Employment by sector in the United Kingdom
Source: Based on online data from U.K. Office for National Statistics, Workforce Jobs by Industry http://www.ons.gov.uk/ons/datasets-and-tables/index.html?pageSize= 50&sortBy=none&sortDirection=none&newquery=JOBS02ltWorkforce+jobs+by+industry+%28seasonally+adjusted%29
6063 GEOGRAPHY WORLD ECON_PT_246x189 mm 22/01/2014 15:10 Page 195
Services
Manufacturing
Construction and mining
Agriculture
25
2 0
15
10
5
30
0-
ωc
5
Ic<uE>ooEш
19 50 1960 1970 1980 1990 2 0 0 0 2 0 1 0 2 0 1 2
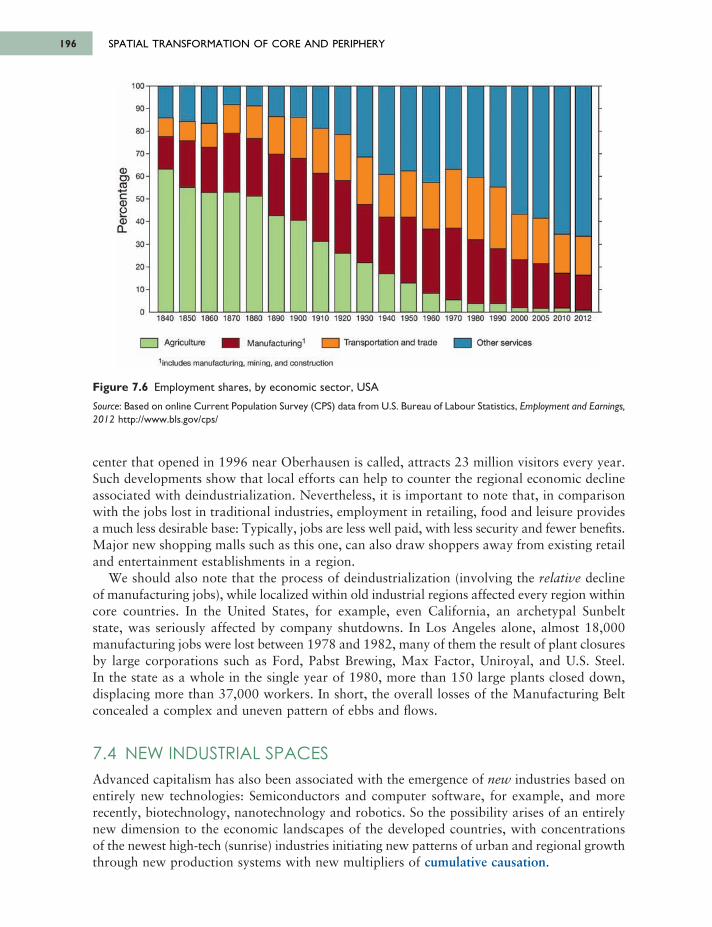
SPATIAL TRANSFORMATION OF CORE AND PERIPHERY196
center that opened in 1996 near Oberhausen is called, attracts 23 million visitors every year.Such developments show that local efforts can help to counter the regional economic declineassociated with deindustrialization. Nevertheless, it is important to note that, in comparisonwith the jobs lost in traditional industries, employment in retailing, food and leisure providesa much less desirable base: Typically, jobs are less well paid, with less security and fewer benefits.Major new shopping malls such as this one, can also draw shoppers away from existing retailand entertainment establishments in a region.
We should also note that the process of deindustrialization (involving the relative declineof manufacturing jobs), while localized within old industrial regions affected every region withincore countries. In the United States, for example, even California, an archetypal Sunbelt state, was seriously affected by company shutdowns. In Los Angeles alone, almost 18,000manufacturing jobs were lost between 1978 and 1982, many of them the result of plant closuresby large corporations such as Ford, Pabst Brewing, Max Factor, Uniroyal, and U.S. Steel. In the state as a whole in the single year of 1980, more than 150 large plants closed down,displacing more than 37,000 workers. In short, the overall losses of the Manufacturing Beltconcealed a complex and uneven pattern of ebbs and flows.
7.4 NEW INDUSTRIAL SPACESAdvanced capitalism has also been associated with the emergence of new industries based onentirely new technologies: Semiconductors and computer software, for example, and morerecently, biotechnology, nanotechnology and robotics. So the possibility arises of an entirelynew dimension to the economic landscapes of the developed countries, with concentrationsof the newest high-tech (sunrise) industries initiating new patterns of urban and regional growththrough new production systems with new multipliers of cumulative causation.
Figure 7.6 Employment shares, by economic sector, USA
Source: Based on online Current Population Survey (CPS) data from U.S. Bureau of Labour Statistics, Employment and Earnings,2012 http://www.bls.gov/cps/
6063 GEOGRAPHY WORLD ECON_PT_246x189 mm 22/01/2014 15:10 Page 196
90
80
70
60
50
40
ЗО
20
10
О
100
1840 1850 1860 1870 1880 1890 1900 1910 1920 1930 1940 1950 1960 1970 1980 1990 2000 2005 2010 2012
Agriculture Manufacturing Transportation and trade Other services
<DCJ9c<Dу0)
CL
includes manufacturing, m ining, and construction
Studies of high-tech industries in the United States confirm that job creation has beensignificant. Today nearly 6 million people (just over 4 percent of total U.S. employment) areemployed in high-tech industries (comprising about 1.3 million in high-tech manufacturingand more than 4.6 million in the high-tech services industry (communications services withabout 1.2 million, software services with almost 1.8 million and engineering and tech serviceswith 1.6 million)).
The growth of some of these industries has certainly been explosive. Employment insoftware services in the United States, for example, doubled during the 1970s to 250,000, and has now grown to nearly 1.8 million. Some estimates suggest that between now and 2020 employment in robotics will add as many as 3.5 million new jobs worldwide. Of course, jobs in other industries are being displaced by the application of robotics. Whetherthe growth in high-tech industries will be sufficient to cancel out the effects of continueddeindustrialization and outsourcing of manufacturing from the core economies is by no meanscertain, however.
It should also be noted that in terms of occupational structure the expansion of high-techemployment is a microcosm of the trends that have dominated advanced capitalism (in thisconnection, see also Box 7.3). Studies in California, for example, “suggest that the occu pational,ethnic and gender composition of new jobs in high-tech sectors will tend to worsen the currenttrend toward the ‘disappearing middle’, that is, toward a labor force bifurcated between high-paid professionals and low-paid service workers” (Markusen, 1983: 19). In relation tocorporate structure, high-tech industry is distinctive for its tendency towards the proliferationof small breakaway companies set up by key employees; but at the same time the larger andmore established firms have soon been drawn into the process of mergers and acquisitions,either as the dominant element (in horizontal and vertical integration) or as a subsidiary element(in diagonal integration).
TECHNOPOLES
The locational impact of high-tech activities has received a great deal of attention, includingtechnology-oriented complexes, or technopoles, and an archetype in Santa Clara county—SiliconValley—in California. In the 1950s, Santa Clara was a quiet agricultural county with apopulation of about 300,000. By 1980 it had already been transformed into the world’s mostintensive complex of high-tech activity, with a population of 1.25 million. Silicon Valleyemployment in high-tech jobs has risen to nearly 200,000. Each new high-tech job creates atleast two or three additional jobs in other sectors—an extremely high multiplier effect.
The initial development of Silicon Valley is generally attributed to the work of FrederickTerman, a professor (and, later, vice-president) of Stanford University at Palo Alto, in thenorthwestern corner of Santa Clara county. As early as the 1930s Terman began to encouragehis graduates in electrical engineering to stay in the area and establish their own companies(one of the first was founded by William Hewlett and David Packard in a garage near thecampus; it is now one of the world’s largest electronics firms). By the end of the 1950s Termanhad persuaded Stanford University to develop a special industrial park for such fledgling high-tech firms, creating a hothouse of innovation and generating significant external economies—including a specialized workforce and a specialized array of business services—which havenot only sustained the continued agglomeration of high-tech electronics enterprises but alsoattracted other high-tech industries. With about 2,500 biomedical companies, California, andthe San Francisco Bay area in particular have the largest concentration of biotechnologycompanies in the country. California’s more than 150,000 biotech workers represent more
7. SPATIAL REORGANIZATION OF THE CORE ECONOMIES 197
6063 GEOGRAPHY WORLD ECON_PT_246x189 mm 22/01/2014 15:10 Page 197
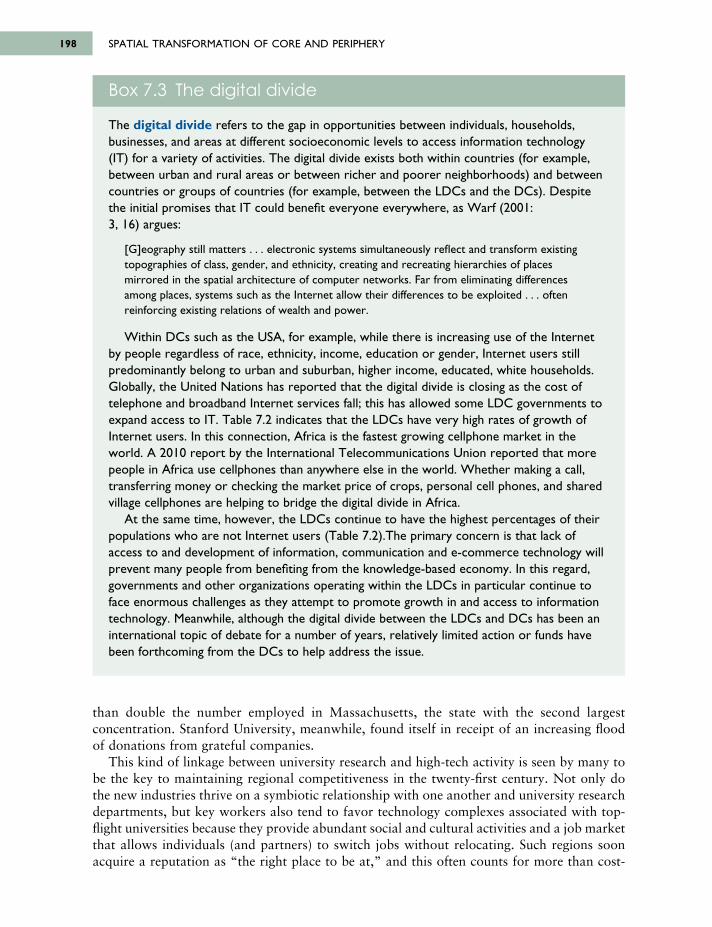
SPATIAL TRANSFORMATION OF CORE AND PERIPHERY198
than double the number employed in Massachusetts, the state with the second largestconcentration. Stanford University, meanwhile, found itself in receipt of an increasing floodof donations from grateful companies.
This kind of linkage between university research and high-tech activity is seen by many tobe the key to maintaining regional competitiveness in the twenty-first century. Not only dothe new industries thrive on a symbiotic relationship with one another and university researchdepartments, but key workers also tend to favor technology complexes associated with top-flight universities because they provide abundant social and cultural activities and a job marketthat allows individuals (and partners) to switch jobs without relocating. Such regions soonacquire a reputation as “the right place to be at,” and this often counts for more than cost-
Box 7.3 The digital divide
The digital divide refers to the gap in opportunities between individuals, households,businesses, and areas at different socioeconomic levels to access information technology (IT) for a variety of activities. The digital divide exists both within countries (for example,between urban and rural areas or between richer and poorer neighborhoods) and betweencountries or groups of countries (for example, between the LDCs and the DCs). Despitethe initial promises that IT could benefit everyone everywhere, as Warf (2001: 3, 16) argues:
[G]eography still matters . . . electronic systems simultaneously reflect and transform existingtopographies of class, gender, and ethnicity, creating and recreating hierarchies of placesmirrored in the spatial architecture of computer networks. Far from eliminating differencesamong places, systems such as the Internet allow their differences to be exploited . . . oftenreinforcing existing relations of wealth and power.
Within DCs such as the USA, for example, while there is increasing use of the Internetby people regardless of race, ethnicity, income, education or gender, Internet users stillpredominantly belong to urban and suburban, higher income, educated, white households.Globally, the United Nations has reported that the digital divide is closing as the cost oftelephone and broadband Internet services fall; this has allowed some LDC governments toexpand access to IT. Table 7.2 indicates that the LDCs have very high rates of growth ofInternet users. In this connection, Africa is the fastest growing cellphone market in theworld. A 2010 report by the International Telecommunications Union reported that morepeople in Africa use cellphones than anywhere else in the world. Whether making a call,transferring money or checking the market price of crops, personal cell phones, and sharedvillage cellphones are helping to bridge the digital divide in Africa.
At the same time, however, the LDCs continue to have the highest percentages of theirpopulations who are not Internet users (Table 7.2).The primary concern is that lack ofaccess to and development of information, communication and e-commerce technology willprevent many people from benefiting from the knowledge-based economy. In this regard,governments and other organizations operating within the LDCs in particular continue toface enormous challenges as they attempt to promote growth in and access to informationtechnology. Meanwhile, although the digital divide between the LDCs and DCs has been aninternational topic of debate for a number of years, relatively limited action or funds havebeen forthcoming from the DCs to help address the issue.
6063 GEOGRAPHY WORLD ECON_PT_246x189 mm 22/01/2014 15:10 Page 198
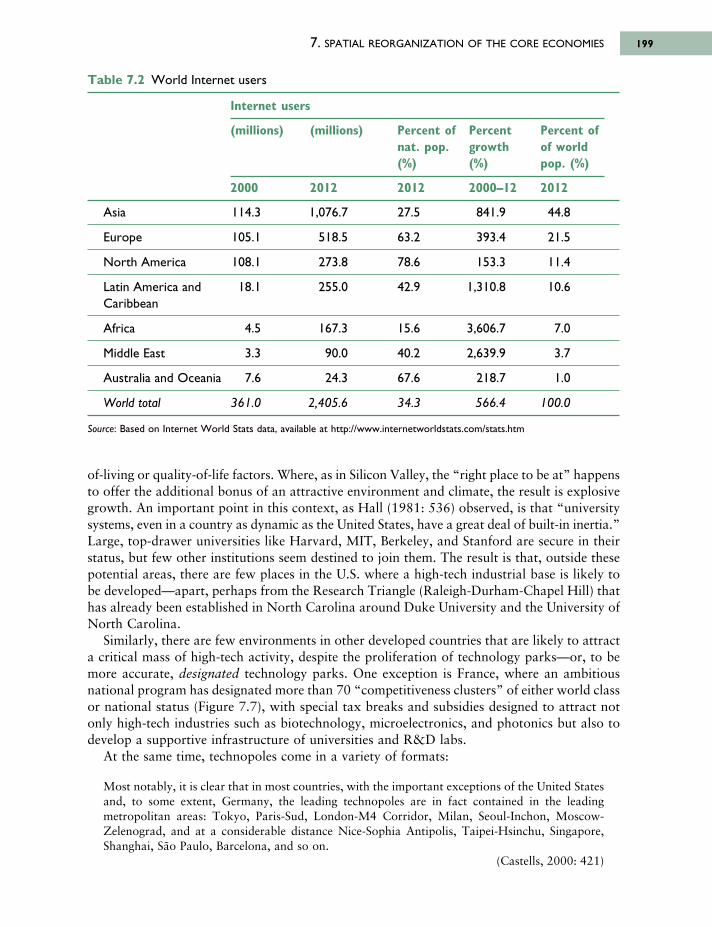
of-living or quality-of-life factors. Where, as in Silicon Valley, the “right place to be at” happensto offer the additional bonus of an attractive environment and climate, the result is explosivegrowth. An important point in this context, as Hall (1981: 536) observed, is that “universitysystems, even in a country as dynamic as the United States, have a great deal of built-in inertia.”Large, top-drawer universities like Harvard, MIT, Berkeley, and Stanford are secure in theirstatus, but few other institutions seem destined to join them. The result is that, outside thesepotential areas, there are few places in the U.S. where a high-tech industrial base is likely tobe developed—apart, perhaps from the Research Triangle (Raleigh-Durham-Chapel Hill) thathas already been established in North Carolina around Duke University and the University ofNorth Carolina.
Similarly, there are few environments in other developed countries that are likely to attracta critical mass of high-tech activity, despite the proliferation of technology parks—or, to bemore accurate, designated technology parks. One exception is France, where an ambitiousnational program has designated more than 70 “competitiveness clusters” of either world classor national status (Figure 7.7), with special tax breaks and subsidies designed to attract notonly high-tech industries such as biotechnology, microelectronics, and photonics but also todevelop a supportive infrastructure of universities and R&D labs.
At the same time, technopoles come in a variety of formats:
Most notably, it is clear that in most countries, with the important exceptions of the United Statesand, to some extent, Germany, the leading technopoles are in fact contained in the leadingmetropolitan areas: Tokyo, Paris-Sud, London-M4 Corridor, Milan, Seoul-Inchon, Moscow-Zelenograd, and at a considerable distance Nice-Sophia Antipolis, Taipei-Hsinchu, Singapore,Shanghai, São Paulo, Barcelona, and so on.
(Castells, 2000: 421)
7. SPATIAL REORGANIZATION OF THE CORE ECONOMIES 199
Table 7.2 World Internet users
Internet users
(millions) (millions) Percent of Percent Percent ofnat. pop. growth of world (%) (%) pop. (%)
2000 2012 2012 2000–12 2012
Asia 114.3 1,076.7 27.5 841.9 44.8
Europe 105.1 518.5 63.2 393.4 21.5
North America 108.1 273.8 78.6 153.3 11.4
Latin America and 18.1 255.0 42.9 1,310.8 10.6Caribbean
Africa 4.5 167.3 15.6 3,606.7 7.0
Middle East 3.3 90.0 40.2 2,639.9 3.7
Australia and Oceania 7.6 24.3 67.6 218.7 1.0
World total 361.0 2,405.6 34.3 566.4 100.0
Source: Based on Internet World Stats data, available at http://www.internetworldstats.com/stats.htm
6063 GEOGRAPHY WORLD ECON_PT_246x189 mm 22/01/2014 15:10 Page 199
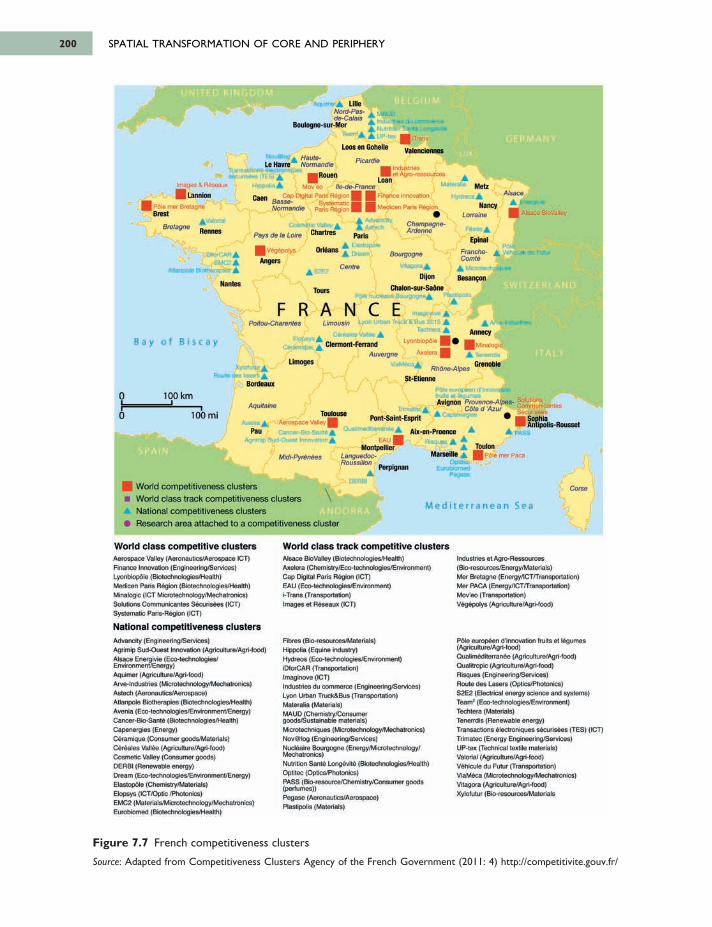
SPATIAL TRANSFORMATION OF CORE AND PERIPHERY200
Figure 7.7 French competitiveness clusters
Source: Adapted from Competitiveness Clusters Agency of the French Government (2011: 4) http://competitivite.gouv.fr/
6063 GEOGRAPHY WORLD ECON_PT_246x189 mm 22/01/2014 15:10 Page 200
Ш ш І Й М .•Vi· A LilleNord-Pas-de-Calais
no .cn r.M pr A . iM iu e m n e u А ’ П ІШ ^ М І .
Loos en Gohelle Valenciennes
B o ulo gne-sur-M er
Le Havre
Brest
Lannion Caen MgrtalParwF
be Pans F
LUOIIlle^ie-France
·.· I'·· : - Ц Щ ' -.! .< -
w » : e n Ρ »
Haute-Normandh
I n — — г т к і а
Images & R«eaux
BretagneA · 'Rennes
WC2Aлтпоот Вюишжш A
ЛМггСАР.
B ay o f B is c a y
F R A N C E
Nantes
Pays de la Loire
Щ vegepoi>-s
Angerso e n rre
Champagne-Ardenne
innovation
і Pan* Я eg-on
Picardie
I Industries et Ag/o-fcs&ourcos
inMOV '
Basse-Normandie
A * * ' * * * »Х м к и
.Lmuoom.k O' MVI
• ALoire Chartres
>tys OrgansBourgogne
MetzAlsace
A » « r ·A iu c a BiOVaHoy
• w e n t*N anrv
Lorraine
Epinal
Franche-Comte
·· -ЛA * ' ’
Poitou-Charentes Limoustr LfOf. Uitaan Tritc:| λ Hij» a l t ! іTacntara.
Ш м м J
:« raa iaav. - і
Clermont-Ferranduvergne
Lyonbiopdto j
Axelera
Annecy
BesanconChalon-sur-Sadne
^ В ім о я м А Ми
POta mar Bretagne
>y**utwLimoges
loraeaux
AquitaineQ
C
100 km
100 mi
World competitiveness clustersWorld class track competitiveness clustersNational competitiveness clustersResearch area attached to a competitiveness cluster
U a t-P y rtn te s t-ornyuouwRoussillon
ToulouseA>«nia A Aerospace Valley I
PauA g n m r O n e * InrevaWoe,
Pont-Saint-Esprit
Perpignan
Marseille aDow*.
Ьоімпм) ! · ·
ToulonH .·· I .· · ·’.· >
M e d ite r r a n e a n Sea
Corse
Anftpolis-Rousset=*SS
St-Etienne>*aie wmopaen «гтома^^Иіп л іа Ц ш а ї Avignon Provenco-Alpes-
A Cdie d Azur. _ .. a
a.iloq c A t a n e J
Grenoble
' - £ * m t
' ' A - » -A "rn m ix itm m m
F R A N C E
Tours
Paris
Diion
Cap Digital Pana Region I *®* Systematic Imandie Paris Region |
tr H I M TO Si A
EAU I
Rh6rw-AlpesvteMticaA
A ™
FWm» 9 n Waari J
C«nc«r 0w 5*m(
WagoraJ
World class competitive clustersAerospace Valley (Aeronautics/Aerospace ICT) Finance Innovation (Engineering/Services) Lyonb*op6le (&otechnolog»es/Health)Medicen Pans Region (Biotechnologies/Health) Minatogic (ICT Microtechnotogy/Mechatronics) Solutions Commurocantes Secunsees (ICT) Systematic Pans-Region (ICT)
National competitiveness clustersAdvancity (Engineenng/ServKes)Agrimlp Sud-Ouest Innovation (Agrlcultura/Agn-food Alsace Energivie (Eco-technotogies/ Environment/Energy)Aquimer (Agncuiture/Agrt-food)Arve- Industries (Microtechnotogy/Mechatronics) Astech (Aeronautics/Aerospace)Atianpoie B*cxhmap*es (Biotechnologies/Health) Avenia (Eco-technotogles/Environment/Energy) Cancer-B«o-Sante (Biotechnotogies/Health) Capenergies (Energy)C^ramique (Consumer goodsMatenals)Cereales Vallee (Agnculture/Agn-lood)Cosmetic VaMey (Consumer goods)DERBI (Renewable energy)Dream (Eco-technologies/Environment/Energy) Elastopdle (Chemistry/Materials)Elopsys (ICT/Optic /Photonics)EMC2 (Materials/Microtechnclogy/Mechatronics) Eurobtomed (Biotechnologies/Health)
World class track competitive clustersAlsace Bto Valley (Biotechnologies/Health)Axelera (Chemistry/Eco-technotogies/Environment)Cap Digital Paris Region (ICT)EAU (Eco-technotogies/Environment) i-Trans (Transportation)Images et Reseaux (ICT)
Industries et Agro-Ressources (Bio-resources/Energy/Materials)Mer Bretagne (Energy/ICT/Transportation) Met PACA (Energy/ICT/Transportation) Mov'eo (Transportation)V6g6po*ys (Agriculture/Agn-food)
P6*e europeen d’innovation fruits et legumes (Agricutture/Agh-food)Qualimediterranee (Agnculture/Agn-lood) QuaJitropic (Agnculture/Agn-food)Rtsques (Engineenng/Services)Route des Lasers (Optics/Photonics)S2E2 (Electrical energy science and systems) Team' (Eco-technotogies/Environment)Techtera (Materials)Tenerrdis (Renewable energy)Transactions 6lectromques secunsees (TES) (ICT) Tnmatec (Energy Engineenng/Services)UP-tex (Technical textile materials)Valonal (Agncullure/Agn-lood)V6hicu»e du Futur (Transportation)ViaMOca (Mcrotechnotogy/Mechatronics)Vltagora (Agnculture/Agn-food)Xytofutur (B*o-resources/MatenaIs
Fibres (Bio-resources/Matenals)Hippoka (Equine industry)Hydreos (Eco-technotogies/Environment) iDforCAR (Transportation)I mag move (ICT)Industries du commerce (Engineering/Services; Lyon Urban Truck&Bus (Transportation)Mater aka (Materials)MAUD (Chemistry/Consumer goods/S ustamable materials)Microtechniques (Microtechnotogy/Mechatronic Nov® log (Engineering/Services)Nucleate Bourgogne (Energy/Microtechnologyi Mechatronics)Nutrition Sant6 Longevity (Btotechnotogies/Hea Optitec (Optics/Photonics)PASS (Bio-resource/Chemistry/Consumer gooc (perfumes))Pegase (Aeronautics/Aerospace)Ptastipolis (Materials)
DECENTRALIZATION OF HIGH-TECH EMPLOYMENT
Almost all high-technology complexes are a suburban phenomenon. As Markusen (1983: 26)noted in relation to the early development of the Silicon Valley and Route 128 (Boston)complexes, they were “newly developed, auto-based, suburban areas whose jobs and tax basedo not overlay the inner-city poor nor the central city jurisdiction.” But, because high-techfirms have tended to be very self-conscious about their “address,” these suburban complexeshave become crowded and expensive. The outcome has been the familiar combination ofcorporate functional and spatial reorganization. More routine production tasks anddownstream marketing and service functions have been dispersed, while managerial anddevelopmental activities have been retained in order to maximize the external economies ofthe “right address.”
U.S. computer firms have typically kept their R&D and administrative activities in placessuch as California and Massachusetts while moving their production facilities to southern statesto take advantage of lower labor costs. Furthermore, some of the larger corporations in thecomputer and semiconductor fields have redeployed internationally, also partly in search ofcheaper labor, both highly qualified and semi-skilled. There is now an international divisionof labor in the semiconductor industry, for example. The world’s largest manufacturer, Intel,with over 100,000 employees worldwide, has its R&D organized internationally from its head -quarters in Silicon Valley. About half of Intel’s wafer fabrication, including micro processorsand chipsets, are produced at the company’s facilities in Arizona, New Mexico, Massachusettsand Oregon; the other half is manufactured outside the U.S. in Ireland, Israel and China. Mostof Intel’s components are subject to assembly and testing at facilities in China, Costa Rica,Malaysia, and Vietnam. As with the local branch–plant economies generated by the decentral -ization of traditional manufacturing industries, these regional concentrations of decentralizedhigh-tech industry do not always generate many local linkages or multiplier effects.
FLEXIBLE PRODUCTION REGIONS
While the imprint of the high-tech industries of advanced capitalism cannot be said to amountto an entirely new dimension of the economic landscapes of the core countries, their industrialspaces have clearly contributed an additional component to existing landscapes. Meanwhile,however, other industries have been changing, leaving their imprint on the economic geographyof the core. The crisis of Fordism, combined with the opportunities afforded by newproduction-process and circulation technologies, by changing patterns of consumer demand,and by corporate restructuring and new competitive strategies, has led in the last several decadesto the emergence of something that can be described as a new dimension of the economiclandscapes of the core countries. Flexible production regions have emerged in many coreeconomies as a result of the interplay of flexible production systems, existing labor marketsand the fixed capital of older industrial spaces.
Flexible production regions, which may contain elements of branch–plant industrialization(see p.183) along with a mixture of other functions and activities in which the emphasis onflexibility results in the externalization of certain functions and the vertical disintegration oforganizational structures, which, in turn, lead to locational convergence and spatial agglom -eration. Allen Scott, who has contributed most to this interpretation, summed up the centraltendency as: “Vertical disintegration encourages agglomeration, and agglomeration encouragesvertical disintegration” (1986: 224). The result is a series of regions or production complexeswhose dynamics “revolve for the most part around the social division of labor, the formation
7. SPATIAL REORGANIZATION OF THE CORE ECONOMIES 201
6063 GEOGRAPHY WORLD ECON_PT_246x189 mm 22/01/2014 15:10 Page 201
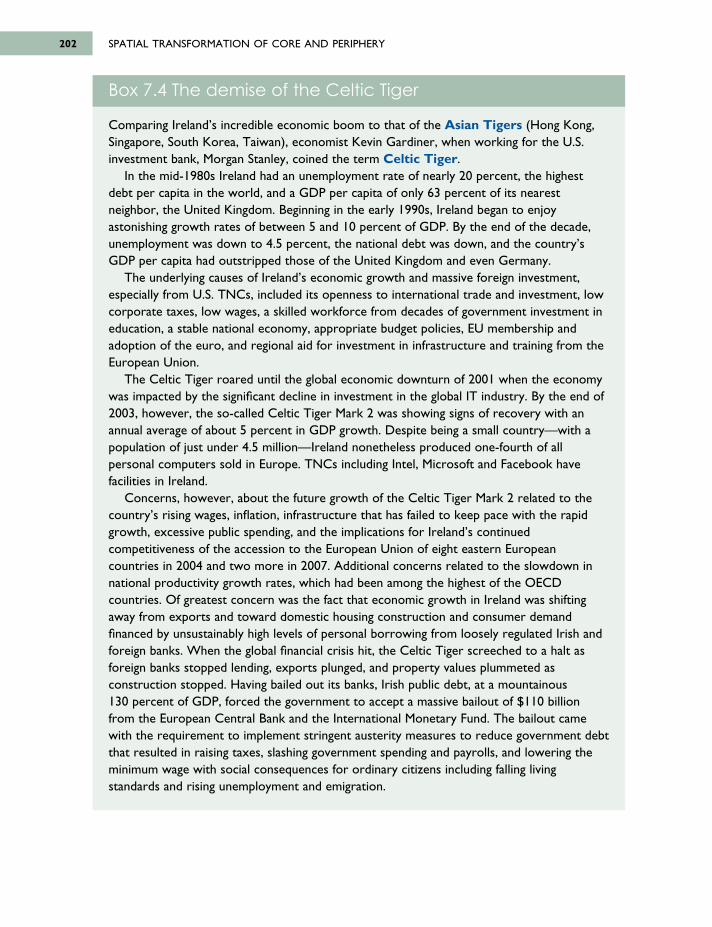
SPATIAL TRANSFORMATION OF CORE AND PERIPHERY202
Box 7.4 The demise of the Celtic Tiger
Comparing Ireland’s incredible economic boom to that of the Asian Tigers (Hong Kong,Singapore, South Korea, Taiwan), economist Kevin Gardiner, when working for the U.S.investment bank, Morgan Stanley, coined the term Celtic Tiger.
In the mid-1980s Ireland had an unemployment rate of nearly 20 percent, the highestdebt per capita in the world, and a GDP per capita of only 63 percent of its nearestneighbor, the United Kingdom. Beginning in the early 1990s, Ireland began to enjoyastonishing growth rates of between 5 and 10 percent of GDP. By the end of the decade,unemployment was down to 4.5 percent, the national debt was down, and the country’sGDP per capita had outstripped those of the United Kingdom and even Germany.
The underlying causes of Ireland’s economic growth and massive foreign investment,especially from U.S. TNCs, included its openness to international trade and investment, lowcorporate taxes, low wages, a skilled workforce from decades of government investment ineducation, a stable national economy, appropriate budget policies, EU membership andadoption of the euro, and regional aid for investment in infrastructure and training from theEuropean Union.
The Celtic Tiger roared until the global economic downturn of 2001 when the economywas impacted by the significant decline in investment in the global IT industry. By the end of2003, however, the so-called Celtic Tiger Mark 2 was showing signs of recovery with anannual average of about 5 percent in GDP growth. Despite being a small country—with apopulation of just under 4.5 million—Ireland nonetheless produced one-fourth of allpersonal computers sold in Europe. TNCs including Intel, Microsoft and Facebook havefacilities in Ireland.
Concerns, however, about the future growth of the Celtic Tiger Mark 2 related to thecountry’s rising wages, inflation, infrastructure that has failed to keep pace with the rapidgrowth, excessive public spending, and the implications for Ireland’s continuedcompetitiveness of the accession to the European Union of eight eastern Europeancountries in 2004 and two more in 2007. Additional concerns related to the slowdown innational productivity growth rates, which had been among the highest of the OECDcountries. Of greatest concern was the fact that economic growth in Ireland was shiftingaway from exports and toward domestic housing construction and consumer demandfinanced by unsustainably high levels of personal borrowing from loosely regulated Irish andforeign banks. When the global financial crisis hit, the Celtic Tiger screeched to a halt asforeign banks stopped lending, exports plunged, and property values plummeted asconstruction stopped. Having bailed out its banks, Irish public debt, at a mountainous 130 percent of GDP, forced the government to accept a massive bailout of $110 billionfrom the European Central Bank and the International Monetary Fund. The bailout camewith the requirement to implement stringent austerity measures to reduce government debtthat resulted in raising taxes, slashing government spending and payrolls, and lowering theminimum wage with social consequences for ordinary citizens including falling livingstandards and rising unemployment and emigration.
6063 GEOGRAPHY WORLD ECON_PT_246x189 mm 22/01/2014 15:10 Page 202
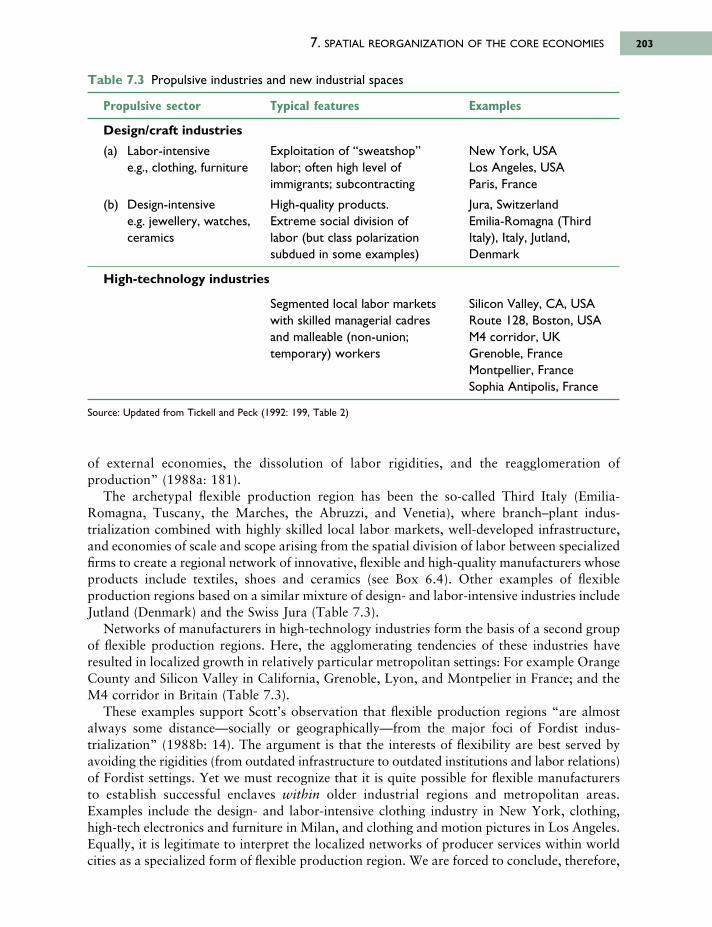
of external economies, the dissolution of labor rigidities, and the reagglomeration ofproduction” (1988a: 181).
The archetypal flexible production region has been the so-called Third Italy (Emilia-Romagna, Tuscany, the Marches, the Abruzzi, and Venetia), where branch–plant indus -trialization combined with highly skilled local labor markets, well-developed infrastructure,and economies of scale and scope arising from the spatial division of labor between specializedfirms to create a regional network of innovative, flexible and high-quality manufacturers whoseproducts include textiles, shoes and ceramics (see Box 6.4). Other examples of flexibleproduction regions based on a similar mixture of design- and labor-intensive industries includeJutland (Denmark) and the Swiss Jura (Table 7.3).
Networks of manufacturers in high-technology industries form the basis of a second groupof flexible production regions. Here, the agglomerating tendencies of these industries haveresulted in localized growth in relatively particular metropolitan settings: For example OrangeCounty and Silicon Valley in California, Grenoble, Lyon, and Montpelier in France; and theM4 corridor in Britain (Table 7.3).
These examples support Scott’s observation that flexible production regions “are almostalways some distance—socially or geographically—from the major foci of Fordist indus -trialization” (1988b: 14). The argument is that the interests of flexibility are best served byavoiding the rigidities (from outdated infrastructure to outdated institutions and labor relations)of Fordist settings. Yet we must recognize that it is quite possible for flexible manufacturersto establish successful enclaves within older industrial regions and metropolitan areas.Examples include the design- and labor-intensive clothing industry in New York, clothing,high-tech electronics and furniture in Milan, and clothing and motion pictures in Los Angeles.Equally, it is legitimate to interpret the localized networks of producer services within worldcities as a specialized form of flexible production region. We are forced to conclude, therefore,
7. SPATIAL REORGANIZATION OF THE CORE ECONOMIES 203
Table 7.3 Propulsive industries and new industrial spaces
Propulsive sector Typical features Examples
Design/craft industries
(a) Labor-intensive Exploitation of “sweatshop” New York, USAe.g., clothing, furniture labor; often high level of Los Angeles, USA
immigrants; subcontracting Paris, France
(b) Design-intensive High-quality products. Jura, Switzerlande.g. jewellery, watches, Extreme social division of Emilia-Romagna (Third ceramics labor (but class polarization Italy), Italy, Jutland,
subdued in some examples) Denmark
High-technology industries
Segmented local labor markets Silicon Valley, CA, USAwith skilled managerial cadres Route 128, Boston, USAand malleable (non-union; M4 corridor, UKtemporary) workers Grenoble, France
Montpellier, FranceSophia Antipolis, France
Source: Updated from Tickell and Peck (1992: 199, Table 2)
6063 GEOGRAPHY WORLD ECON_PT_246x189 mm 22/01/2014 15:10 Page 203
SPATIAL TRANSFORMATION OF CORE AND PERIPHERY204
Box 7.5 Hollywood and the cultural economy of cities
Allen Scott (2005: 1) begins his book, On Hollywood, with the following paragraph:
One of the defining features of contemporary society, at least in the high income countries ofthe world, is the conspicuous convergence that is occurring between the domain of theeconomic on the one hand and the domain of the cultural on the other. Vast segments of themodern economy are inscribed with significant cultural content, while culture itself isincreasingly being supplied in the form of goods and services produced by private firms for aprofit under conditions of market exchange. These trends can be described variously in termsof the aestheticization of the economy and the commodification of culture.
The cultural economy can be defined as a group of sectors (cultural-productsindustries) that produce goods and services—including jewelery, live theatre, musicrecording, film production—whose symbolic value to consumers is high relative to theirpractical purpose. Scott’s work on Hollywood is of interest to economic geographersbecause it argues for the vital role of agglomeration economies and localized increasingreturns to scale in allowing this “industrial district” to become the largest and mostinfluential cultural-products agglomeration in the world.
As Scott (2010: 193) puts it:
In one sense, Hollywood is a very specific place in Southern California, and, more to the point,a particular locale-bound nexus of production relationships and local labor market activities. Inanother sense, Hollywood is everywhere, and in its realization as a disembodied assortment ofimages and narratives, its presence is felt across the entire globe. These local and globalmanifestations of Hollywood are linked together by a complex machinery of distribution andmarketing. In this manner, Hollywood’s existence as a productive agglomeration is sustained,while the images and narratives it creates are dispersed to a far flung and ever expanding circleof consumers.
Scott (2005: 8) offers five thematic arguments that address how the history, geography,economic structure, and cultural energies of the Hollywood motion picture industrycombine to hold Hollywood together as a spatial unit, while endowing those producingwithin this agglomeration with potential long-term competitive advantages.
First, Hollywood emerged as the main center of the U.S. motion picture industry (incompetition with New York) because its pioneering model of film production generated an expanding system of agglomeration economies. By the 1920s the “old” classical studiosystem of production was securely in place and Hollywood had risen to unparalleleddominance nationally and internationally.
Second, following the Second World War, a “new” Hollywood developed as the “old”studio system was transformed into a more diffuse organizational pattern of production.This greatly enhanced the role of Hollywood as a concentrated industrial district,intensifying its place-specific competitive advantages. Important in this process were thesignificant extension of flexible production systems in Hollywood and the fundamental shiftin the role of the major film production companies as they began to act more as sources offinancial and coordination services for independent producers in combination with overallmarketing and distribution services.
Third, the film production companies in Hollywood, as part of an industrial district,include not only the units of production from which they derive their principal identity, but
6063 GEOGRAPHY WORLD ECON_PT_246x189 mm 22/01/2014 15:10 Page 204
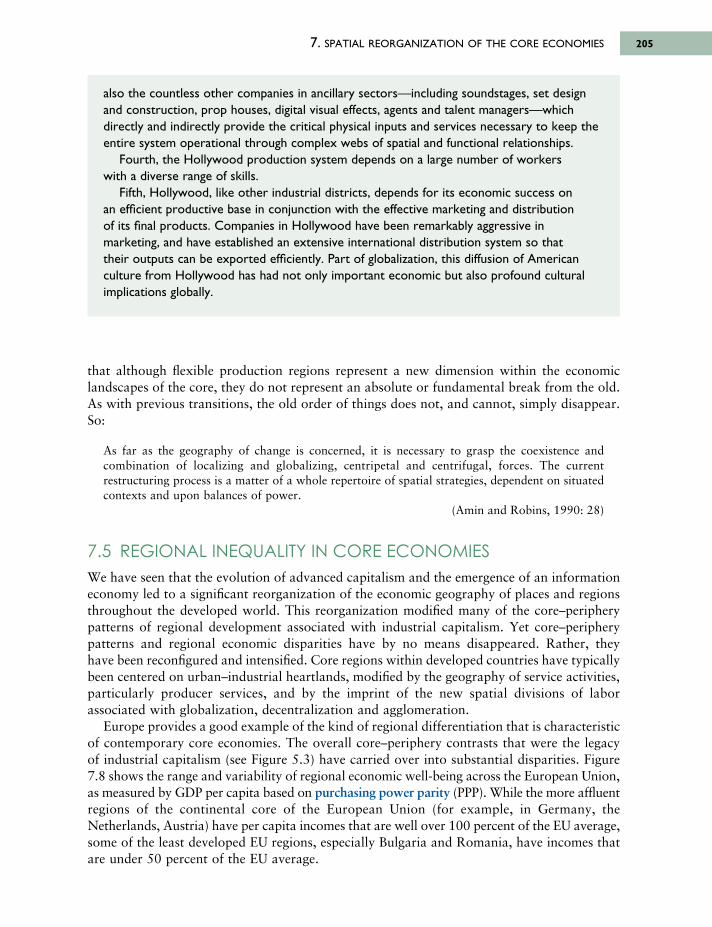
7. SPATIAL REORGANIZATION OF THE CORE ECONOMIES 205
that although flexible production regions represent a new dimension within the economiclandscapes of the core, they do not represent an absolute or fundamental break from the old.As with previous transitions, the old order of things does not, and cannot, simply disappear.So:
As far as the geography of change is concerned, it is necessary to grasp the coexistence andcombination of localizing and globalizing, centripetal and centrifugal, forces. The currentrestructuring process is a matter of a whole repertoire of spatial strategies, dependent on situatedcontexts and upon balances of power.
(Amin and Robins, 1990: 28)
7.5 REGIONAL INEQUALITY IN CORE ECONOMIESWe have seen that the evolution of advanced capitalism and the emergence of an informationeconomy led to a significant reorganization of the economic geography of places and regionsthroughout the developed world. This reorganization modified many of the core–peripherypatterns of regional development associated with industrial capitalism. Yet core–peripherypatterns and regional economic disparities have by no means disappeared. Rather, they have been reconfigured and intensified. Core regions within developed countries have typicallybeen centered on urban–industrial heartlands, modified by the geography of service activities,particularly producer services, and by the imprint of the new spatial divisions of laborassociated with globalization, decentralization and agglomeration.
Europe provides a good example of the kind of regional differentiation that is characteristicof contemporary core economies. The overall core–periphery contrasts that were the legacyof industrial capitalism (see Figure 5.3) have carried over into substantial disparities. Figure7.8 shows the range and variability of regional economic well-being across the European Union,as measured by GDP per capita based on purchasing power parity (PPP). While the more affluentregions of the continental core of the European Union (for example, in Germany, theNetherlands, Austria) have per capita incomes that are well over 100 percent of the EU average,some of the least developed EU regions, especially Bulgaria and Romania, have incomes thatare under 50 percent of the EU average.
also the countless other companies in ancillary sectors—including soundstages, set designand construction, prop houses, digital visual effects, agents and talent managers—whichdirectly and indirectly provide the critical physical inputs and services necessary to keep theentire system operational through complex webs of spatial and functional relationships.
Fourth, the Hollywood production system depends on a large number of workerswith a diverse range of skills.
Fifth, Hollywood, like other industrial districts, depends for its economic success onan efficient productive base in conjunction with the effective marketing and distributionof its final products. Companies in Hollywood have been remarkably aggressive inmarketing, and have established an extensive international distribution system so thattheir outputs can be exported efficiently. Part of globalization, this diffusion of Americanculture from Hollywood has had not only important economic but also profound culturalimplications globally.
6063 GEOGRAPHY WORLD ECON_PT_246x189 mm 22/01/2014 15:10 Page 205
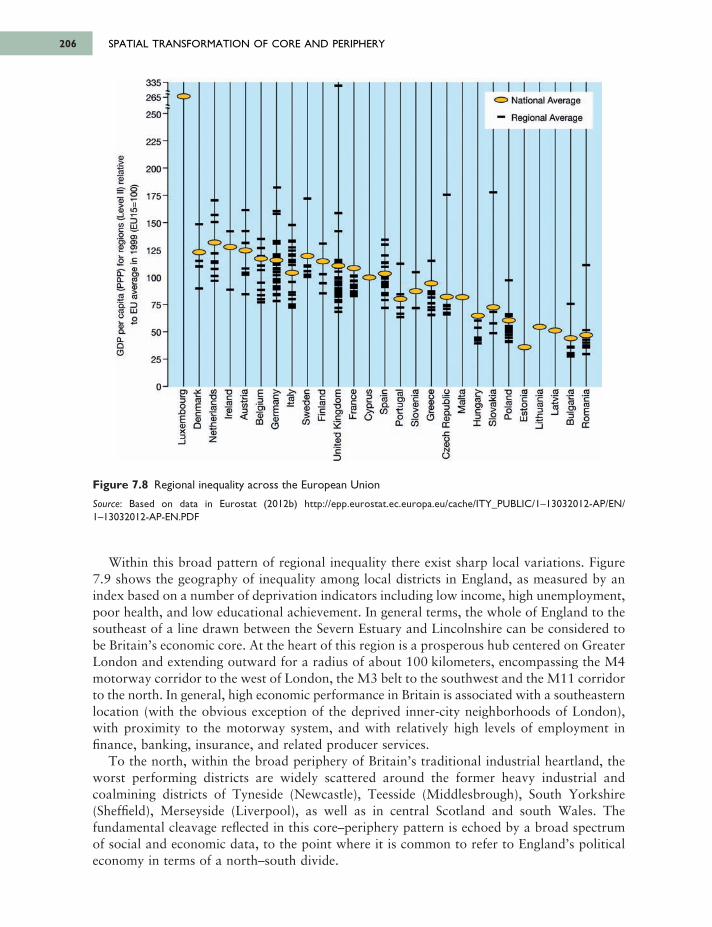
SPATIAL TRANSFORMATION OF CORE AND PERIPHERY206
Within this broad pattern of regional inequality there exist sharp local variations. Figure7.9 shows the geography of inequality among local districts in England, as measured by anindex based on a number of deprivation indicators including low income, high unemployment,poor health, and low educational achievement. In general terms, the whole of England to thesoutheast of a line drawn between the Severn Estuary and Lincolnshire can be considered tobe Britain’s economic core. At the heart of this region is a prosperous hub centered on GreaterLondon and extending outward for a radius of about 100 kilometers, encompassing the M4motorway corridor to the west of London, the M3 belt to the southwest and the M11 corridorto the north. In general, high economic performance in Britain is associated with a southeasternlocation (with the obvious exception of the deprived inner-city neighborhoods of London),with proximity to the motorway system, and with relatively high levels of employment infinance, banking, insurance, and related producer services.
To the north, within the broad periphery of Britain’s traditional industrial heartland, theworst performing districts are widely scattered around the former heavy industrial andcoalmining districts of Tyneside (Newcastle), Teesside (Middlesbrough), South Yorkshire(Sheffield), Merseyside (Liverpool), as well as in central Scotland and south Wales. Thefundamental cleavage reflected in this core–periphery pattern is echoed by a broad spectrumof social and economic data, to the point where it is common to refer to England’s politicaleconomy in terms of a north–south divide.
Figure 7.8 Regional inequality across the European Union
Source: Based on data in Eurostat (2012b) http://epp.eurostat.ec.europa.eu/cache/ITY_PUBLIC/1–13032012-AP/EN/1–13032012-AP-EN.PDF
6063 GEOGRAPHY WORLD ECON_PT_246x189 mm 22/01/2014 15:10 Page 206
і з National Average
- Regional Average
335
265
250
225
200
175
150
125
100
75
50
25
nр > ^ : < п х ) г а с > . > . с т з е < і > и с й Я ( і > о г а > . г а т з < о г а г а < я г а
1 1 1 і 1 1 H ! η I n і i n i f I I I і πE ® ш - < $ fc І І Г £ “ · ϋ .o S Ο ο 3 oщ O .c CD ^ CO £ Q .C 0 ( r X O T c o tES ® TJ C.3 Z δ O
- Йr ND O
5§ss· o Z °<D> IIQ> ID _J T -
C.9 σ> σ> σ> φ σ>ο cг Г Зі. ο. σ> ο. гаQ. <52 яα ρга ш ^ Ο φ Q.Q.СіΟ
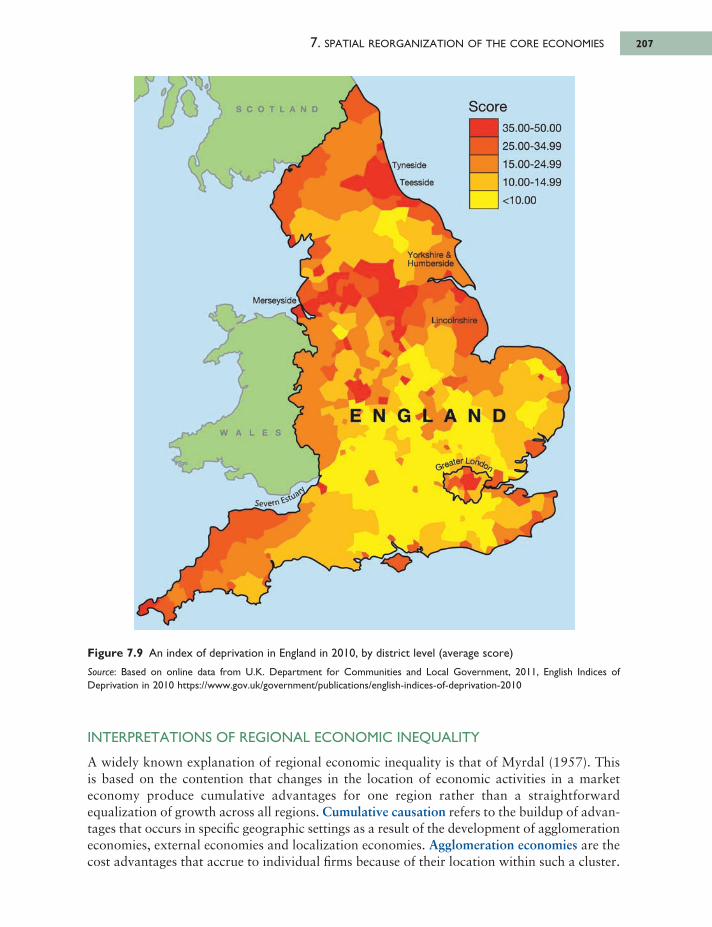
INTERPRETATIONS OF REGIONAL ECONOMIC INEQUALITY
A widely known explanation of regional economic inequality is that of Myrdal (1957). Thisis based on the contention that changes in the location of economic activities in a marketeconomy produce cumulative advantages for one region rather than a straightforwardequalization of growth across all regions. Cumulative causation refers to the buildup of advan -tages that occurs in specific geographic settings as a result of the development of agglomerationeconomies, external economies and localization economies. Agglomeration economies are thecost advantages that accrue to individual firms because of their location within such a cluster.
7. SPATIAL REORGANIZATION OF THE CORE ECONOMIES 207
Figure 7.9 An index of deprivation in England in 2010, by district level (average score)
Source: Based on online data from U.K. Department for Communities and Local Government, 2011, English Indices ofDeprivation in 2010 https://www.gov.uk/government/publications/english-indices-of-deprivation-2010
6063 GEOGRAPHY WORLD ECON_PT_246x189 mm 22/01/2014 15:10 Page 207
Score
3 5 .0 0 -5 0 .0 0
25 .0 0 -3 4 .9 9
15 .00 -24 .9 9
1 0 .00 -14 .9 9
<10.00
^Tyneside
Lleesside
S C O T L A N D
Merseyside]
Yorkshire & I Humberside'
Lincolnshire
E N G L A N DW A L E S
6<e2ЛЄГ Lon
SPATIAL TRANSFORMATION OF CORE AND PERIPHERY208
Box 7.6 National economic development and regionalinequality
The relationship between overall levels of development and the intensity of regionaldisparities is central to theory in economic geography. Much of the conventional wisdom onthe subject is derived from a major study by Williamson (1965), who examined interregionalincome disparities in a sample of 24 countries. The results of this analysis suggested that thegreatest regional inequalities were associated with countries at a semi-peripheral level ofdevelopment, with much smaller differences within both the most and the least developedcountries (see Figure 7.10). Williamson interpreted these cross-national results as aconsequence of the dynamics of economic development, suggesting that the onset ofindustrial development precipitates sharp increases in regional inequality, which aresubsequently reduced as the economy matures.
Both the results and the interpretation of Williamson’s work have been questioned,however. Reviewing the large number of empirical studies that followed Williamson’s work,Krebs (1982) showed that, even allowing for different measurement techniques, the idea ofdivergence followed by convergence in regional disparities does not meet with strongsupport (see, for example, Figures 7.9 and 7.11).
Finally, we must set these trends within the context of longer run economic cycles such that each new phase of economic development, based on new technology systems, and requiring new resources and new markets, initiates a round of “creative destruction”that leaves an indelible imprint on economic landscapes and, therefore, on the pattern andintensity of regional inequality. Furthermore, the related dynamics of the political economyinfluence the whole question of inequality within countries. So, for example, periods ofeconomic growth and low inflation tend to generate widespread satisfaction and a lack of enthusiasm for altering the status quo at the same time that voters are most likely to feel able to afford to pay for redistributive policies. While we have no adequate single
Figure 7.10 The relationship between interregional inequality and levels of economic development,as posited by Williamson (1965)
6063 GEOGRAPHY WORLD ECON_PT_246x189 mm 22/01/2014 15:10 Page 208
HIGH
Degree of inter-regional inequality in levels
Df economic development
LOWLOW HIGH
National level of economic development
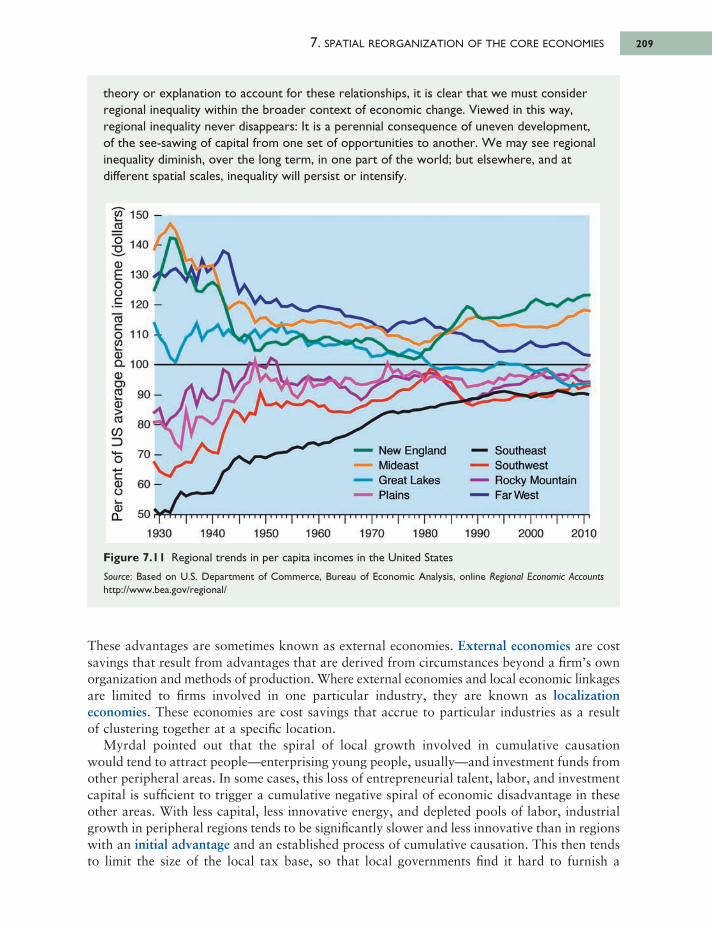
These advantages are sometimes known as external economies. External economies are costsavings that result from advantages that are derived from circumstances beyond a firm’s ownorganization and methods of production. Where external economies and local economic linkagesare limited to firms involved in one particular industry, they are known as localizationeconomies. These economies are cost savings that accrue to particular industries as a resultof clustering together at a specific location.
Myrdal pointed out that the spiral of local growth involved in cumulative causation would tend to attract people—enterprising young people, usually—and investment funds fromother peripheral areas. In some cases, this loss of entrepreneurial talent, labor, and investmentcapital is sufficient to trigger a cumulative negative spiral of economic disadvantage in theseother areas. With less capital, less innovative energy, and depleted pools of labor, industrialgrowth in peripheral regions tends to be significantly slower and less innovative than in regionswith an initial advantage and an established process of cumulative causation. This then tendsto limit the size of the local tax base, so that local governments find it hard to furnish a
7. SPATIAL REORGANIZATION OF THE CORE ECONOMIES 209
theory or explanation to account for these relationships, it is clear that we must considerregional inequality within the broader context of economic change. Viewed in this way,regional inequality never disappears: It is a perennial consequence of uneven development,of the see-sawing of capital from one set of opportunities to another. We may see regionalinequality diminish, over the long term, in one part of the world; but elsewhere, and atdifferent spatial scales, inequality will persist or intensify.
Figure 7.11 Regional trends in per capita incomes in the United States
Source: Based on U.S. Department of Commerce, Bureau of Economic Analysis, online Regional Economic Accountshttp://www.bea.gov/regional/
6063 GEOGRAPHY WORLD ECON_PT_246x189 mm 22/01/2014 15:10 Page 209
W 150 І З
-g 140
О)E 130оо
120" я
О 110(Яїм0)Ω. 100фО)2 90 ω
І ео3
Ъ 70нС __О) 6 0 о
® с п Q . 5 0
1930 1940 1950 1960 1970 1980 1990 2000 2010
New England Mideast Great Lakes Plains
Southeast Southwest Rocky Mountain Far West
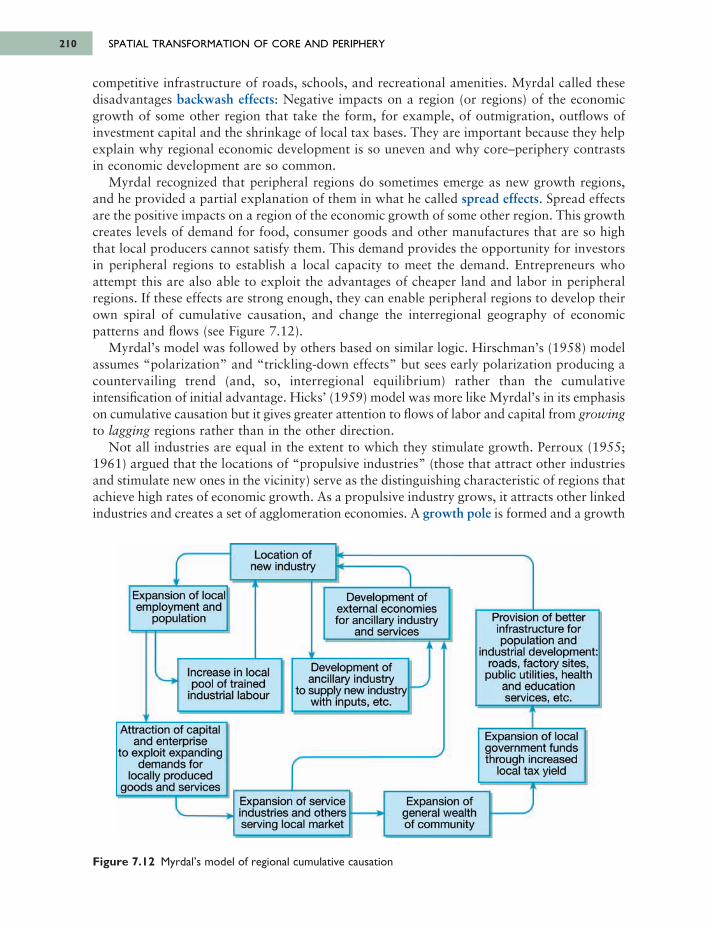
SPATIAL TRANSFORMATION OF CORE AND PERIPHERY210
competitive infrastructure of roads, schools, and recreational amenities. Myrdal called thesedisadvantages backwash effects: Negative impacts on a region (or regions) of the economicgrowth of some other region that take the form, for example, of outmigration, outflows ofinvestment capital and the shrinkage of local tax bases. They are important because they helpexplain why regional economic development is so uneven and why core–periphery contrastsin economic development are so common.
Myrdal recognized that peripheral regions do sometimes emerge as new growth regions,and he provided a partial explanation of them in what he called spread effects. Spread effectsare the positive impacts on a region of the economic growth of some other region. This growthcreates levels of demand for food, consumer goods and other manufactures that are so highthat local producers cannot satisfy them. This demand provides the opportunity for investorsin peripheral regions to establish a local capacity to meet the demand. Entrepreneurs whoattempt this are also able to exploit the advantages of cheaper land and labor in peripheralregions. If these effects are strong enough, they can enable peripheral regions to develop theirown spiral of cumulative causation, and change the interregional geography of economicpatterns and flows (see Figure 7.12).
Myrdal’s model was followed by others based on similar logic. Hirschman’s (1958) modelassumes “polarization” and “trickling-down effects” but sees early polarization producing acountervailing trend (and, so, interregional equilibrium) rather than the cumulativeintensification of initial advantage. Hicks’ (1959) model was more like Myrdal’s in its emphasison cumulative causation but it gives greater attention to flows of labor and capital from growingto lagging regions rather than in the other direction.
Not all industries are equal in the extent to which they stimulate growth. Perroux (1955;1961) argued that the locations of “propulsive industries” (those that attract other industriesand stimulate new ones in the vicinity) serve as the distinguishing characteristic of regions thatachieve high rates of economic growth. As a propulsive industry grows, it attracts other linkedindustries and creates a set of agglomeration economies. A growth pole is formed and a growth
Figure 7.12 Myrdal’s model of regional cumulative causation
6063 GEOGRAPHY WORLD ECON_PT_246x189 mm 22/01/2014 15:10 Page 210
Location of new industry
Development of external economies for ancillary industry
and servicesProvision of better infrastructure for population and
industrial development: roads, factory sites,
public utilities, health and education services, etc.
Expansion of loca government fundi through increasec
local tax yield
Development of ancillary industry
to supply new industry with inputs, etc.
Increase in local pool of trained
industrial labour
Expansion of local employment and
population
Attraction of capital and enterprise
to exploit expanding demands for
locally produced goods and services
Expansion of service industries and others serving local market
Expansion of general wealth of community
center develops. In the 1920s shipbuilding was a propulsive industry. In the 1950s and 1960sautomobile manufacturing was a propulsive industry, and, in today’s information economyhigh-tech manufacturing, design-intensive consumer goods, and business and financial servicesare propulsive industries.
Krugman (1991) suggests a more complex and more formal model to account for acore–periphery pattern of economic development and for the possibility of its transformation.He argues that the relationship between demand and production established during an earlyphase of industrialization locks into place an interregional imbalance through increasing returnsto scale in plant operations, transportation costs and demand. As he put it:
Given sufficiently strong economies of scale, each manufacturer wants to serve the national marketfrom a single location. To minimize transportation costs, she chooses a location with large localdemand. But local demand will be large precisely where the majority of manufacturers choose tolocate. Thus there is a circularity that tends to keep a manufacturing belt in existence once it isestablished.
(Krugman, 1991: 15)
However, once the population of a peripheral region reaches critical mass it may serve tostimulate production facilities there. A dramatic shift in regional fortunes may follow. Local“boosterism,” faith in a locality’s future possibilities, and policies that reflect this can alsoprove decisive in reversing regional imbalance: “Nothing,” therefore, “is forever” (Krugman,1991: 26). This is an argument for a rapid reversal in regional fortunes, rather than for slowregional balancing. Cores become peripheries and vice versa. Krugman argues that increasingreturns to scale, imperfect competition and historical accident conspire to produce geographicalconcentration. But the identity of the favored region is not set for all time—a new pattern ofconcentration can break the historic mold.
SUMMARYIn this chapter, we have seen how the crisis of Fordism and the sectoral shifts and changingbusiness structures of advanced capitalism have reshaped the economic landscapes of theindustrial core regions. Several aspects of this transition are of special importance:
• The spatial reorganization of core economies has been the product of several interdependentprocesses, including the globalization of some core-area economic activity, shift frommanufacturing towards service industries, development of flexible production processes andcompetitive strategies, and changes in government regulation and intervention.
• The imprint of the shift towards service employment has had two main dimensions:Deindustrialization and economic decline in regions of traditional heavy industries, andgrowth in larger metropolitan settings that have attracted higher order producer services.
• This shift overlapped with the globalization of some core-area economic activity, with theresult that certain aspects of change have been intensified and others have been introduced.The globalization of economic activity, for example, has intensified the effects ofdeindustrialization and been associated with the adoption of neoliberal policies.
• Corporate reorganization amid globalization has resulted in an increase in the externalcontrol of regional economies.
• Net effects of change have resulted in simultaneous spatial trends involving both decen -tralization and agglomeration, each highly selective in terms of the regions and economicactivities involved.
7. SPATIAL REORGANIZATION OF THE CORE ECONOMIES 211
6063 GEOGRAPHY WORLD ECON_PT_246x189 mm 22/01/2014 15:10 Page 211
• The diverse mixes of industry, workers and infrastructure inherited from the industrial erahave mediated the broader processes of structural change and reorganization, so that differentkinds of regions have evolved in different ways. There have been four broad trajectories ofchange. In the first, restructuring in response to a legacy of declining industry has been thedominant process. Examples include the old manufacturing heartlands of northern England,south Wales, central Scotland and the U.S. Manufacturing Belt. In some rural areas andperipheral regions, in contrast, the dominant process has been one of decentralization offootloose, labor-intensive industries from the metropolitan areas and core regions. Examplesinclude parts of the southern U.S. such as Alabama. A third trajectory is characterized byregions whose industry has developed at or just above the national average, sustained by a consistent supply of new investment. Examples include most of southeast England and,in the U.S., the Boston-New York-Washington, DC-Richmond corridor. Finally, there aresome regions whose attributes have made them attractive to new industries and/or to newinvestments aimed at exploiting new competitive strategies and new production processes.These include the high-tech concentrations of Orange County and Silicon Valley, and flexibleproduction regions such as north-central Italy.
• Overlying these categories there has been a general accentuation of the importance andprosperity of large metropolitan areas, while many smaller towns and, in particular, many of the specialized towns spawned by industrial capitalism (mining towns, heavymanufacturing towns, and so on) have declined.
KEY SOURCES AND SUGGESTED READINGBryson, J.R., Daniels, P.W., Henry, N., and Pollard, J. (eds.), 2000. Knowledge, Space, Economy. London:
Routledge.Castells, M., 2012. Networks of Outrage and Hope: Social movements in the internet age. Cambridge:
Polity Press.Cox, K.R., 2005. Global/Local. In P. Cloke and R.J. Johnston (eds.), Spaces of Geographical Thought.
London: Sage.Massey, D., 2005. For Space. London: Sage.OECD, 2004. Regulatory Reform as a Tool for Bridging the Digital Divide. Paris: OECD.Scott, A.J., 2010. Creative Cities: The role of culture, Revue d’Économie Politique 1, 181–204.Scott, A.J., 2012. A World in Emergence: Cities and regions in the 21st century. Cheltenham: Edward
Elgar.Taylor, P.J., 2004. World City Network: A global urban analysis. London: Routledge.Taylor, P.J., Ni, P., Derudder, B., Hoyler, M., and Witlox, F. (eds.), 2010. Global Urban Analysis:
A survey of cities in globalization. London: Routledge.Warf, B., 2013. Contemporary Digital Divides in the United States, Tijdschrift voor Economische en
Sociale Geografie, 104, 1–17.
SPATIAL TRANSFORMATION OF CORE AND PERIPHERY212
6063 GEOGRAPHY WORLD ECON_PT_246x189 mm 22/01/2014 15:10 Page 212
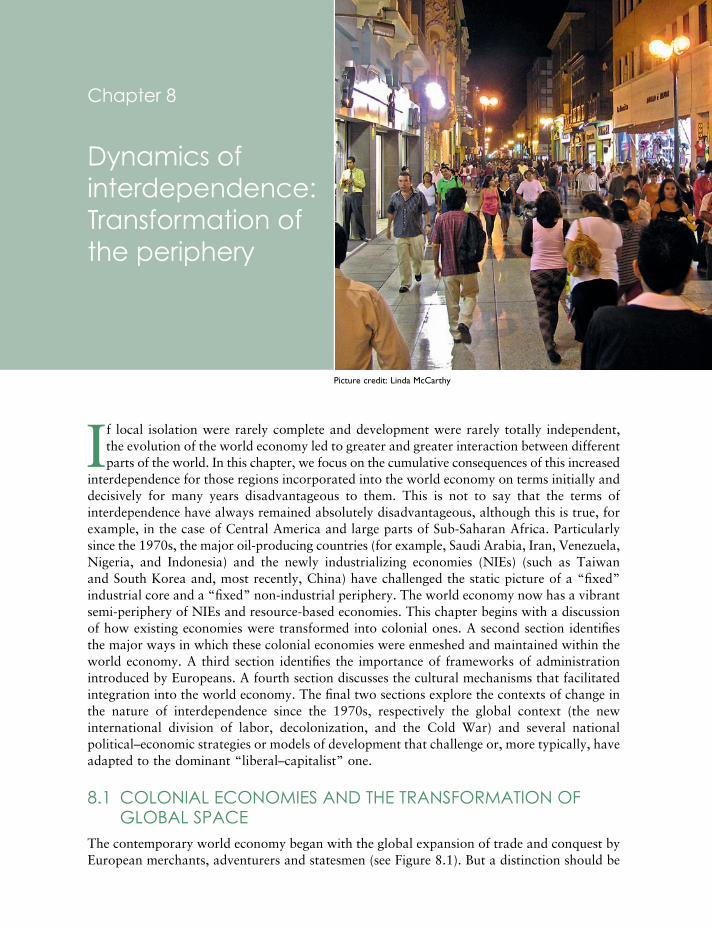
If local isolation were rarely complete and development were rarely totally independent,the evolution of the world economy led to greater and greater interaction between differentparts of the world. In this chapter, we focus on the cumulative consequences of this increased
interdependence for those regions incorporated into the world economy on terms initially anddecisively for many years disadvantageous to them. This is not to say that the terms ofinterdependence have always remained absolutely disadvantageous, although this is true, forexample, in the case of Central America and large parts of Sub-Saharan Africa. Particularlysince the 1970s, the major oil-producing countries (for example, Saudi Arabia, Iran, Venezuela,Nigeria, and Indonesia) and the newly industrializing economies (NIEs) (such as Taiwan and South Korea and, most recently, China) have challenged the static picture of a “fixed”industrial core and a “fixed” non-industrial periphery. The world economy now has a vibrantsemi-periphery of NIEs and resource-based economies. This chapter begins with a discussionof how existing economies were transformed into colonial ones. A second section identifiesthe major ways in which these colonial economies were enmeshed and maintained within theworld economy. A third section identifies the importance of frameworks of administrationintroduced by Europeans. A fourth section discusses the cultural mechanisms that facilitatedintegration into the world economy. The final two sections explore the contexts of change inthe nature of interdependence since the 1970s, respectively the global context (the newinternational division of labor, decolonization, and the Cold War) and several nationalpolitical–economic strategies or models of development that challenge or, more typically, haveadapted to the dominant “liberal–capitalist” one.
8.1 COLONIAL ECONOMIES AND THE TRANSFORMATION OFGLOBAL SPACE
The contemporary world economy began with the global expansion of trade and conquest byEuropean merchants, adventurers and statesmen (see Figure 8.1). But a distinction should be
Picture credit: Linda McCarthy
Chapter 8
Dynamics ofinterdependence:Transformation ofthe periphery
6063 GEOGRAPHY WORLD ECON_PT_246x189 mm 22/01/2014 15:10 Page 213
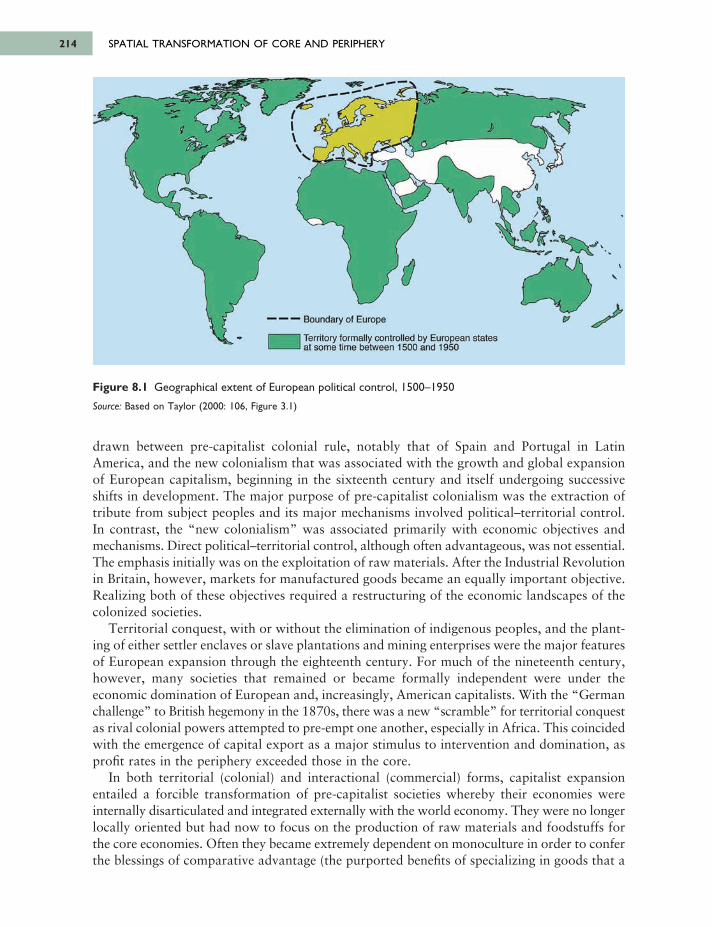
SPATIAL TRANSFORMATION OF CORE AND PERIPHERY214
drawn between pre-capitalist colonial rule, notably that of Spain and Portugal in LatinAmerica, and the new colonialism that was associated with the growth and global expansionof European capitalism, beginning in the sixteenth century and itself undergoing successiveshifts in development. The major purpose of pre-capitalist colonialism was the extraction oftribute from subject peoples and its major mechanisms involved political–territorial control.In contrast, the “new colonialism” was associated primarily with economic objectives andmechanisms. Direct political–territorial control, although often advantageous, was not essential.The emphasis initially was on the exploitation of raw materials. After the Industrial Revolutionin Britain, however, markets for manufactured goods became an equally important objective.Realizing both of these objectives required a restructuring of the economic landscapes of thecolonized societies.
Territorial conquest, with or without the elimination of indigenous peoples, and the plant -ing of either settler enclaves or slave plantations and mining enterprises were the major featuresof European expansion through the eighteenth century. For much of the nineteenth century,however, many societies that remained or became formally independent were under theeconomic domination of European and, increasingly, American capitalists. With the “Germanchallenge” to British hegemony in the 1870s, there was a new “scramble” for territorial conquestas rival colonial powers attempted to pre-empt one another, especially in Africa. This coincidedwith the emergence of capital export as a major stimulus to intervention and domination, asprofit rates in the periphery exceeded those in the core.
In both territorial (colonial) and interactional (commercial) forms, capitalist expansionentailed a forcible transformation of pre-capitalist societies whereby their economies wereinternally disarticulated and integrated externally with the world economy. They were no longerlocally oriented but had now to focus on the production of raw materials and foodstuffs forthe core economies. Often they became extremely dependent on monoculture in order to conferthe blessings of comparative advantage (the purported benefits of specializing in goods that a
Figure 8.1 Geographical extent of European political control, 1500–1950
Source: Based on Taylor (2000: 106, Figure 3.1)
6063 GEOGRAPHY WORLD ECON_PT_246x189 mm 22/01/2014 15:10 Page 214
Boundary of Europe
Territory formally controlled by European stales at some time between 1500 and 1950
country can produce at a lower relative cost while importing goods for which its own produc -tion costs are relatively higher) on the developed world. At the same time they also providedmarkets for the manufactured goods exchanged in return. For many parts of the world, thisrelationship still holds true today.
The dramatic transformation of the existing geography of production that the reorientationtowards the core countries entailed is not sufficiently noted. Before the Industrial Revolutionand European capitalist expansion, Asian and other countries that are now conventionallycharacterized as LDCs contained a far larger share of world manufacturing output than didEurope. Bairoch’s (1982) calculations of industrial output by world region during the courseof the nineteenth century, for example, reveal a picture not simply of a higher rate of indus -trialization in core countries but also of deindustrialization in the periphery as the cheaperEuropean products forced traditional producers elsewhere out of business.
The division between “developed” and “less developed” economies, therefore, which hadbeen moderate before now grew enormously. This was the main geographical consequence ofthe evolution of the world economy. The conditions for the development of “nationaleconomies” did not exist; neither were they permitted to exist in the “dependent world” thatcame into existence during the course of the early expansion of the European world economy.The unequal core–periphery structure of the world economy has been in place since theEuropeans first ventured out into the world in the sixteenth century. From this point of view,underdevelopment is not an original condition, equivalent to “traditionalism” or “backward -ness.” On the contrary, it is a condition created by integration into the world economy. Atthe same time, however, the die is not permanently cast in confining some places and peoplesto an underdeveloped condition. Examples such as the United States, Japan, Australia, andthe NIEs suggest that upward mobility is possible for some states/regions initially in anunderdeveloped state. What is equally clear is that for large parts of the world such mobilityis either difficult or next to impossible. To understand the geography of the world economy,we need to understand such cases as well as the “successful” ones.
During the early years of incorporation into the world economy the periphery tended tobecome specialized in the extraction of raw materials (from gold bullion to furs and spices)and production of plantation crops (such as tobacco, cotton and sugar). As time wore on,plantations and extractive industries were sometimes supplemented by labor-intensive manu -facturing that took advantage of cheap colonial labor. By the mid-twentieth century, LatinAmerica, Asia, and Africa were organically linked to and financially dependent on Europeand the United States. The emergence of the United States as a dominant force and the growthof the Soviet bloc, however, undermined the monopoly of political control exercised by theEuropean powers over large parts of the world. A process of decolonization began with theindependence of the South Asian countries in 1947. This brought the possibility, howeverconstrained (as the experience of Latin America, politically “independent” since 1820, shows),of more autonomous development.
IMPOSITION OF REGIONAL SPECIALIZATIONS
The nineteenth century was an especially critical period in the creation of colonial economies(see Figure 8.2). Whole regions were made to specialize in the production of a specific rawmaterial (such as gold, spices, or cotton), food crop (such as bananas) or “stimulant” (suchas tea or tobacco). Many of these had a prior history, such as the sugar-producing areas ofthe Caribbean or the cotton-growing regions of the United States, India, and Egypt. But theLong Depression (1883–1896), a major downturn in the world economy—due, among other
8. DYNAMICS OF INTERDEPENDENCE 215
6063 GEOGRAPHY WORLD ECON_PT_246x189 mm 22/01/2014 15:10 Page 215
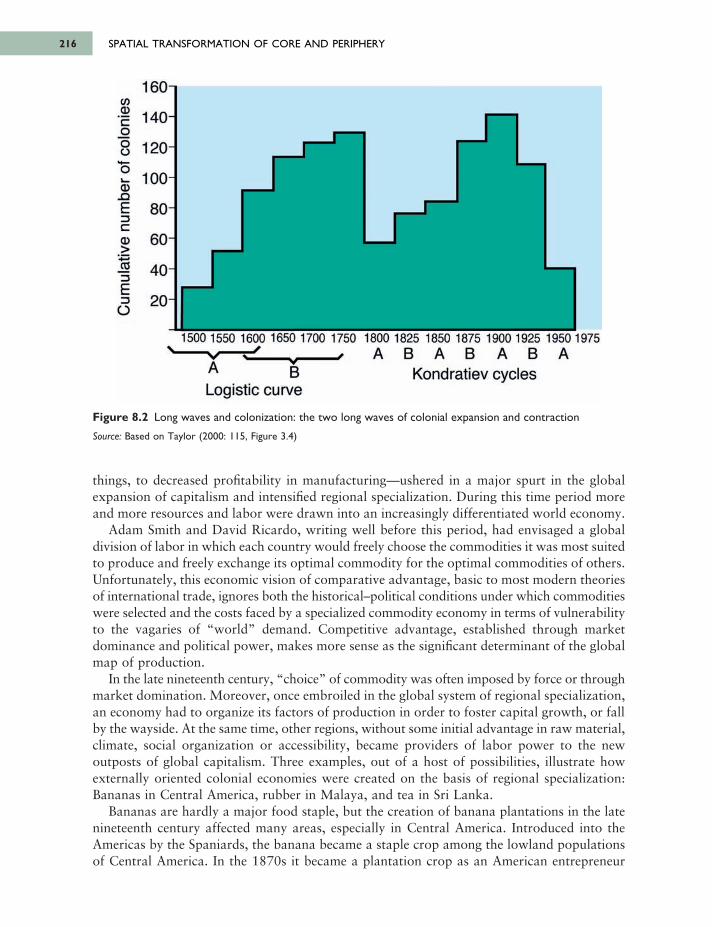
SPATIAL TRANSFORMATION OF CORE AND PERIPHERY216
things, to decreased profitability in manufacturing—ushered in a major spurt in the globalexpansion of capitalism and intensified regional specialization. During this time period moreand more resources and labor were drawn into an increasingly differentiated world economy.
Adam Smith and David Ricardo, writing well before this period, had envisaged a globaldivision of labor in which each country would freely choose the commodities it was most suitedto produce and freely exchange its optimal commodity for the optimal commodities of others.Unfortunately, this economic vision of comparative advantage, basic to most modern theoriesof international trade, ignores both the historical–political conditions under which commoditieswere selected and the costs faced by a specialized commodity economy in terms of vulnerabilityto the vagaries of “world” demand. Competitive advantage, established through marketdominance and political power, makes more sense as the significant determinant of the globalmap of production.
In the late nineteenth century, “choice” of commodity was often imposed by force or throughmarket domination. Moreover, once embroiled in the global system of regional specialization,an economy had to organize its factors of production in order to foster capital growth, or fallby the wayside. At the same time, other regions, without some initial advantage in raw material,climate, social organization or accessibility, became providers of labor power to the newoutposts of global capitalism. Three examples, out of a host of possibilities, illustrate howexternally oriented colonial economies were created on the basis of regional specialization:Bananas in Central America, rubber in Malaya, and tea in Sri Lanka.
Bananas are hardly a major food staple, but the creation of banana plantations in the latenineteenth century affected many areas, especially in Central America. Introduced into theAmericas by the Spaniards, the banana became a staple crop among the lowland populationsof Central America. In the 1870s it became a plantation crop as an American entrepreneur
Figure 8.2 Long waves and colonization: the two long waves of colonial expansion and contraction
Source: Based on Taylor (2000: 115, Figure 3.4)
6063 GEOGRAPHY WORLD ECON_PT_246x189 mm 22/01/2014 15:10 Page 216
1 4 0
1 2 0
1 0 0
8 0
6 0
4 0
20
1 6 0CO0 )
Έοοοοί α ;
X IΕзC<υ>
ro3Ε3Ο
1500 1550 1600 1650 1700 1750 1800 1825 1850 1875 1900 1925 1950 1975
А В А В А В AKondratiev cycles\ В
Logistic curve
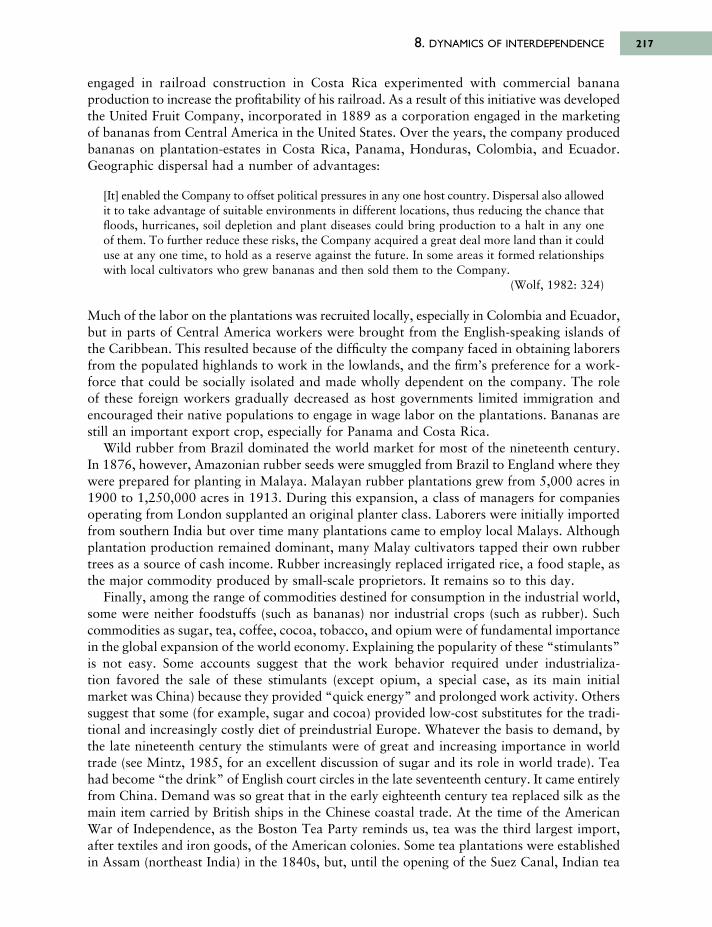
engaged in railroad construction in Costa Rica experimented with commercial bananaproduction to increase the profitability of his railroad. As a result of this initiative was developedthe United Fruit Company, incorporated in 1889 as a corporation engaged in the marketingof bananas from Central America in the United States. Over the years, the company producedbananas on plantation-estates in Costa Rica, Panama, Honduras, Colombia, and Ecuador.Geographic dispersal had a number of advantages:
[It] enabled the Company to offset political pressures in any one host country. Dispersal also allowedit to take advantage of suitable environments in different locations, thus reducing the chance thatfloods, hurricanes, soil depletion and plant diseases could bring production to a halt in any oneof them. To further reduce these risks, the Company acquired a great deal more land than it coulduse at any one time, to hold as a reserve against the future. In some areas it formed relationshipswith local cultivators who grew bananas and then sold them to the Company.
(Wolf, 1982: 324)
Much of the labor on the plantations was recruited locally, especially in Colombia and Ecuador,but in parts of Central America workers were brought from the English-speaking islands ofthe Caribbean. This resulted because of the difficulty the company faced in obtaining laborersfrom the populated highlands to work in the lowlands, and the firm’s preference for a work -force that could be socially isolated and made wholly dependent on the company. The roleof these foreign workers gradually decreased as host governments limited immigration andencouraged their native populations to engage in wage labor on the plantations. Bananas arestill an important export crop, especially for Panama and Costa Rica.
Wild rubber from Brazil dominated the world market for most of the nineteenth century.In 1876, however, Amazonian rubber seeds were smuggled from Brazil to England where theywere prepared for planting in Malaya. Malayan rubber plantations grew from 5,000 acres in1900 to 1,250,000 acres in 1913. During this expansion, a class of managers for companiesoperating from London supplanted an original planter class. Laborers were initially importedfrom southern India but over time many plantations came to employ local Malays. Althoughplantation production remained dominant, many Malay cultivators tapped their own rubbertrees as a source of cash income. Rubber increasingly replaced irrigated rice, a food staple, asthe major commodity produced by small-scale proprietors. It remains so to this day.
Finally, among the range of commodities destined for consumption in the industrial world,some were neither foodstuffs (such as bananas) nor industrial crops (such as rubber). Suchcommodities as sugar, tea, coffee, cocoa, tobacco, and opium were of fundamental importancein the global expansion of the world economy. Explaining the popularity of these “stimulants”is not easy. Some accounts suggest that the work behavior required under industrializa-tion favored the sale of these stimulants (except opium, a special case, as its main initial market was China) because they provided “quick energy” and prolonged work activity. Otherssuggest that some (for example, sugar and cocoa) provided low-cost substitutes for the tradi -tional and increasingly costly diet of preindustrial Europe. Whatever the basis to demand, bythe late nineteenth century the stimulants were of great and increasing importance in worldtrade (see Mintz, 1985, for an excellent discussion of sugar and its role in world trade). Teahad become “the drink” of English court circles in the late seventeenth century. It came entirelyfrom China. Demand was so great that in the early eighteenth century tea replaced silk as themain item carried by British ships in the Chinese coastal trade. At the time of the AmericanWar of Independence, as the Boston Tea Party reminds us, tea was the third largest import,after textiles and iron goods, of the American colonies. Some tea plantations were establishedin Assam (northeast India) in the 1840s, but, until the opening of the Suez Canal, Indian tea
8. DYNAMICS OF INTERDEPENDENCE 217
6063 GEOGRAPHY WORLD ECON_PT_246x189 mm 22/01/2014 15:10 Page 217
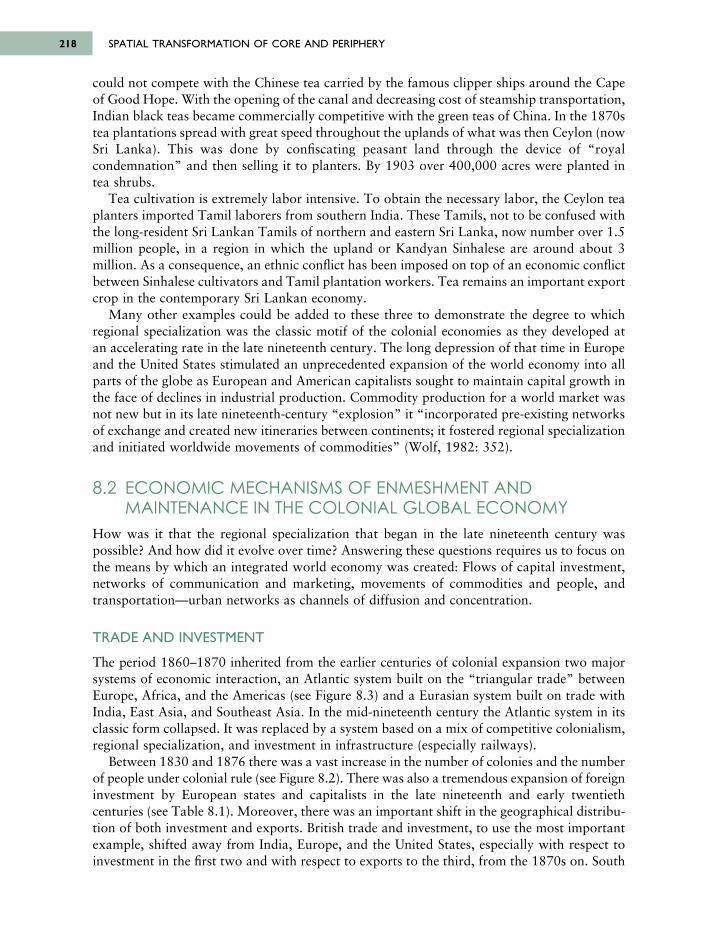
could not compete with the Chinese tea carried by the famous clipper ships around the Capeof Good Hope. With the opening of the canal and decreasing cost of steamship transportation,Indian black teas became commercially competitive with the green teas of China. In the 1870stea plantations spread with great speed throughout the uplands of what was then Ceylon (nowSri Lanka). This was done by confiscating peasant land through the device of “royalcondemnation” and then selling it to planters. By 1903 over 400,000 acres were planted intea shrubs.
Tea cultivation is extremely labor intensive. To obtain the necessary labor, the Ceylon teaplanters imported Tamil laborers from southern India. These Tamils, not to be confused withthe long-resident Sri Lankan Tamils of northern and eastern Sri Lanka, now number over 1.5million people, in a region in which the upland or Kandyan Sinhalese are around about 3million. As a consequence, an ethnic conflict has been imposed on top of an economic conflictbetween Sinhalese cultivators and Tamil plantation workers. Tea remains an important exportcrop in the contemporary Sri Lankan economy.
Many other examples could be added to these three to demonstrate the degree to whichregional specialization was the classic motif of the colonial economies as they developed atan accelerating rate in the late nineteenth century. The long depression of that time in Europeand the United States stimulated an unprecedented expansion of the world economy into allparts of the globe as European and American capitalists sought to maintain capital growth inthe face of declines in industrial production. Commodity production for a world market wasnot new but in its late nineteenth-century “explosion” it “incorporated pre-existing networksof exchange and created new itineraries between continents; it fostered regional specializationand initiated worldwide movements of commodities” (Wolf, 1982: 352).
8.2 ECONOMIC MECHANISMS OF ENMESHMENT ANDMAINTENANCE IN THE COLONIAL GLOBAL ECONOMY
How was it that the regional specialization that began in the late nineteenth century waspossible? And how did it evolve over time? Answering these questions requires us to focus onthe means by which an integrated world economy was created: Flows of capital investment,networks of communication and marketing, movements of commodities and people, andtransportation—urban networks as channels of diffusion and concentration.
TRADE AND INVESTMENT
The period 1860–1870 inherited from the earlier centuries of colonial expansion two majorsystems of economic interaction, an Atlantic system built on the “triangular trade” betweenEurope, Africa, and the Americas (see Figure 8.3) and a Eurasian system built on trade withIndia, East Asia, and Southeast Asia. In the mid-nineteenth century the Atlantic system in itsclassic form collapsed. It was replaced by a system based on a mix of competitive colonialism,regional specialization, and investment in infrastructure (especially railways).
Between 1830 and 1876 there was a vast increase in the number of colonies and the numberof people under colonial rule (see Figure 8.2). There was also a tremendous expansion of foreigninvestment by European states and capitalists in the late nineteenth and early twentiethcenturies (see Table 8.1). Moreover, there was an important shift in the geographical distribu -tion of both investment and exports. British trade and investment, to use the most importantexample, shifted away from India, Europe, and the United States, especially with respect toinvestment in the first two and with respect to exports to the third, from the 1870s on. South
SPATIAL TRANSFORMATION OF CORE AND PERIPHERY218
6063 GEOGRAPHY WORLD ECON_PT_246x189 mm 22/01/2014 15:10 Page 218
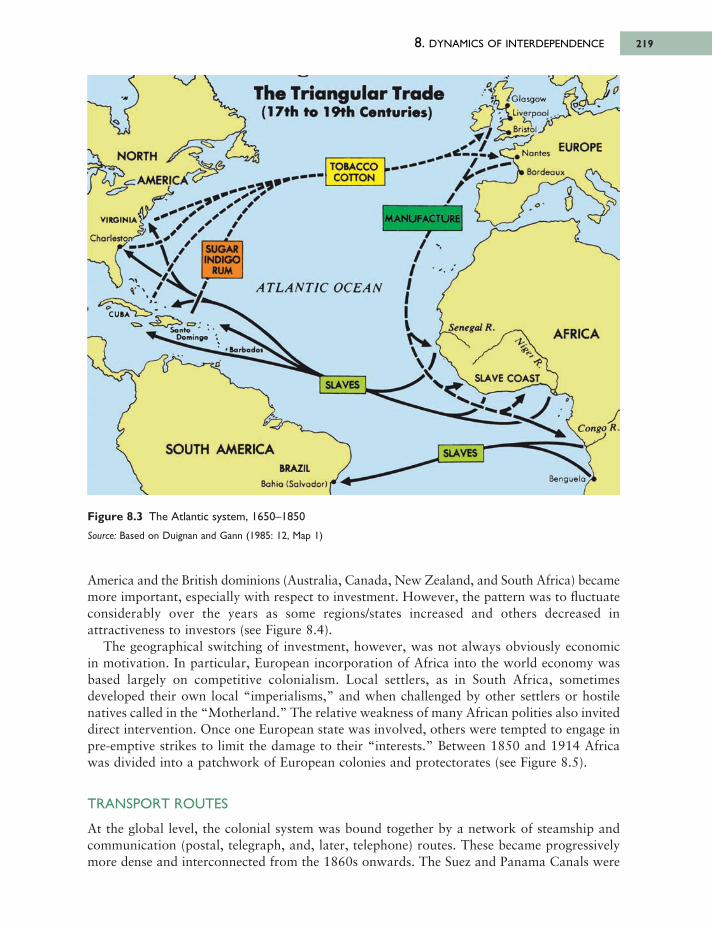
8. DYNAMICS OF INTERDEPENDENCE 219
America and the British dominions (Australia, Canada, New Zealand, and South Africa) becamemore important, especially with respect to investment. However, the pattern was to fluctuateconsiderably over the years as some regions/states increased and others decreased inattractiveness to investors (see Figure 8.4).
The geographical switching of investment, however, was not always obviously economicin motivation. In particular, European incorporation of Africa into the world economy wasbased largely on competitive colonialism. Local settlers, as in South Africa, sometimesdeveloped their own local “imperialisms,” and when challenged by other settlers or hostilenatives called in the “Motherland.” The relative weakness of many African polities also inviteddirect intervention. Once one European state was involved, others were tempted to engage inpre-emptive strikes to limit the damage to their “interests.” Between 1850 and 1914 Africawas divided into a patchwork of European colonies and protectorates (see Figure 8.5).
TRANSPORT ROUTES
At the global level, the colonial system was bound together by a network of steamship andcommunication (postal, telegraph, and, later, telephone) routes. These became progressivelymore dense and interconnected from the 1860s onwards. The Suez and Panama Canals were
Figure 8.3 The Atlantic system, 1650–1850
Source: Based on Duignan and Gann (1985: 12, Map 1)
6063 GEOGRAPHY WORLD ECON_PT_246x189 mm 22/01/2014 15:10 Page 219
The Triangular Tra d(17th to 19th Centuries)
Glosgow
» L ive rp o o l.
Bristo
EUROPE, Nontes
Bordeaux
MANUFACTURE
TOBACCOCOTTON
NORTH ,
; AMERICA"
VIRGINIA ζ
Charleston"SUGAfINDICX
RUM
ATLANTIC OCEAN
Senegal R. AFRICA
SLAVE COASSLAVES
CUBA ·> C=r Santo
^ Domino-
jo rbodo»
SOUTH AMERICABRAZIL
Bahia (S a lvador) f
SLAVES
C ongo R.
Benguelc
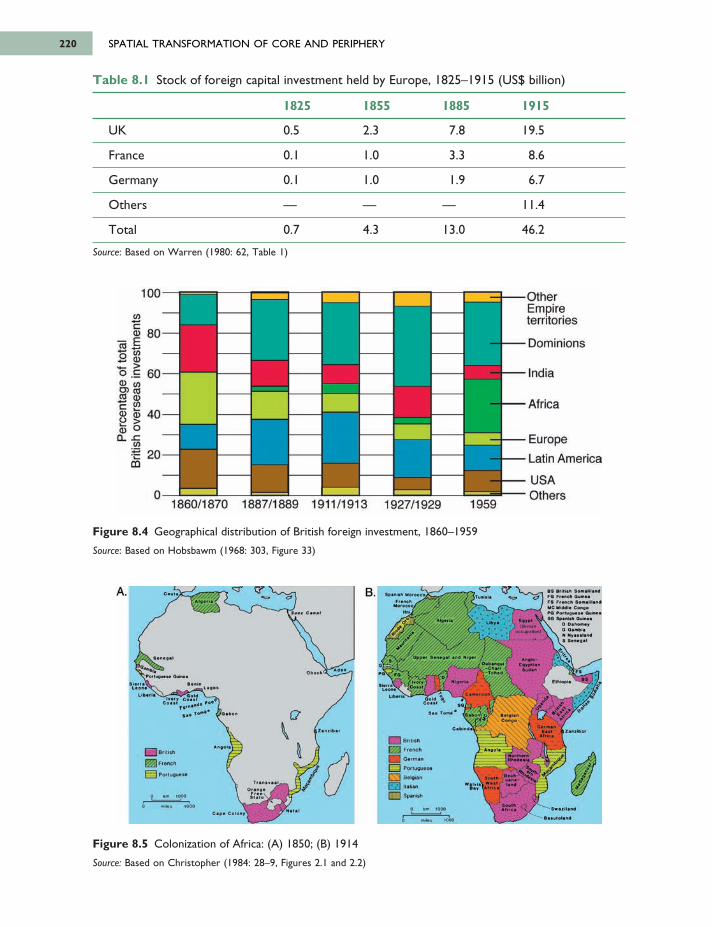
SPATIAL TRANSFORMATION OF CORE AND PERIPHERY220
Table 8.1 Stock of foreign capital investment held by Europe, 1825–1915 (US$ billion)
1825 1855 1885 1915
UK 0.5 2.3 7.8 19.5
France 0.1 1.0 3.3 8.6
Germany 0.1 1.0 1.9 6.7
Others –– –– –– 11.4
Total 0.7 4.3 13.0 46.2
Source: Based on Warren (1980: 62, Table 1)
Figure 8.4 Geographical distribution of British foreign investment, 1860–1959
Source: Based on Hobsbawm (1968: 303, Figure 33)
Figure 8.5 Colonization of Africa: (A) 1850; (B) 1914
Source: Based on Christopher (1984: 28–9, Figures 2.1 and 2.2)
6063 GEOGRAPHY WORLD ECON_PT_246x189 mm 22/01/2014 15:10 Page 220
80
60
40
20
0
100
<л*—·
ІЇ Іг>о ф— ї0 .εа> ія 2і(О Q)1 S"О) Q)2 > оЗ о
CL -Сω*сm
OtherEmpireterritories
Dominions
India
Africa
Europe
Latin America
USAOthers
1860/1870 1887/1889 1911/1913 1927/1929 1959
• S X . li· · . ϊο - ·Μ » "« f O F iM t* Оммаа rs r iM ch So«*Ma»d MC М.0ЛІ· Ce»fl·PO О кма
. SO Sf IM |h Own··\ 0 0 ·Μ ··νs. \ o OainkiaΛ \ N N r* l*U n4 Γ Λ \ S » ·« ·β · 1
в.A.*··>··«
4 Portuoua»· ОшміІІІІІІЇІаола
•капаЧДr
Ι.β ί» Co Co»»l
Μ '*
іао.п^ . Ч И І
ϊοΙβ V _><•1 . J, , Μ · f··
О й .ь о
| British
j fH IK h
] Portugu«M
Са»а Col»»*'
Т>апа>ааі)r« K |t У ? rr·· (: St111
loaman Morocco
i-Tcfcl« λ
SiaoaV.І м м \
I * · · · ·
СоГаї )Odd
C o iil
British
FrenchG *rm»nPortuguen
BalkanItalianSpan·»
0»іт»я
l>t>f a
Α«β·οC f l t l i ia
S»da«
I · » · 'I iftf*ti*h \
' o«.Ci4MlMnl
\ _ і "“ в.” '
1 ««..IK ·«* 1V *e“l" «ana- 7V Λ " · · · land ·\A' " C·
SvMDaM aauloland
lo.lk ,0 I * 1000
0 <M|| IOOO
S . . T ·» · *
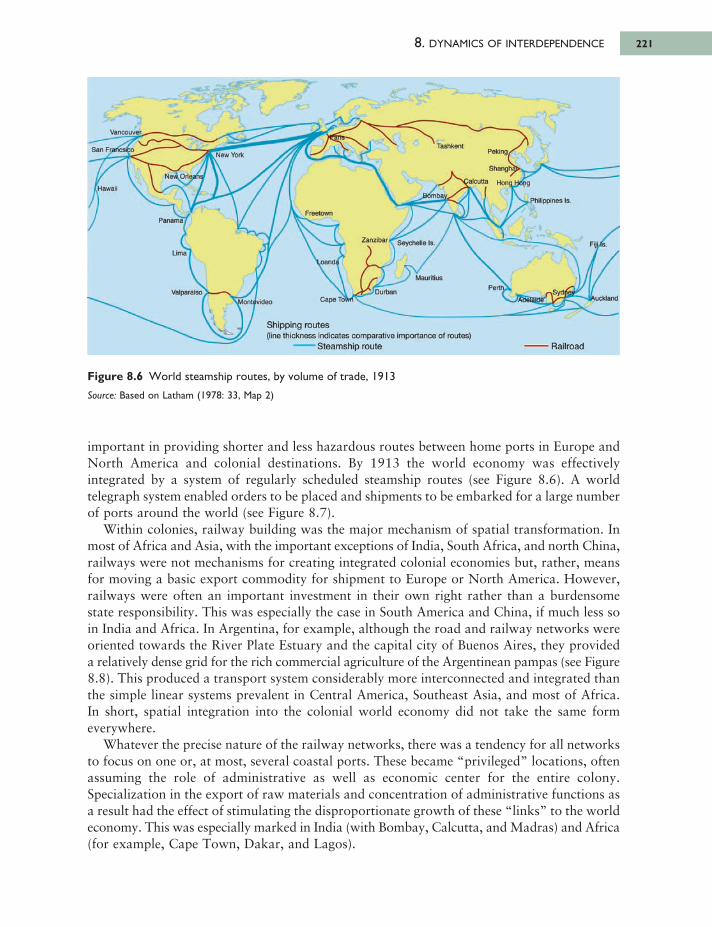
important in providing shorter and less hazardous routes between home ports in Europe andNorth America and colonial destinations. By 1913 the world economy was effectivelyintegrated by a system of regularly scheduled steamship routes (see Figure 8.6). A worldtelegraph system enabled orders to be placed and shipments to be embarked for a large numberof ports around the world (see Figure 8.7).
Within colonies, railway building was the major mechanism of spatial transformation. Inmost of Africa and Asia, with the important exceptions of India, South Africa, and north China,railways were not mechanisms for creating integrated colonial economies but, rather, meansfor moving a basic export commodity for shipment to Europe or North America. However,railways were often an important investment in their own right rather than a burdensomestate responsibility. This was especially the case in South America and China, if much less soin India and Africa. In Argentina, for example, although the road and railway networks wereoriented towards the River Plate Estuary and the capital city of Buenos Aires, they provideda relatively dense grid for the rich commercial agriculture of the Argentinean pampas (see Figure8.8). This produced a transport system considerably more interconnected and integrated thanthe simple linear systems prevalent in Central America, Southeast Asia, and most of Africa.In short, spatial integration into the colonial world economy did not take the same formeverywhere.
Whatever the precise nature of the railway networks, there was a tendency for all networksto focus on one or, at most, several coastal ports. These became “privileged” locations, oftenassuming the role of administrative as well as economic center for the entire colony.Specialization in the export of raw materials and concentration of administrative functions asa result had the effect of stimulating the disproportionate growth of these “links” to the worldeconomy. This was especially marked in India (with Bombay, Calcutta, and Madras) and Africa(for example, Cape Town, Dakar, and Lagos).
8. DYNAMICS OF INTERDEPENDENCE 221
Figure 8.6 World steamship routes, by volume of trade, 1913
Source: Based on Latham (1978: 33, Map 2)
6063 GEOGRAPHY WORLD ECON_PT_246x189 mm 22/01/2014 15:10 Page 221
Vancouver..
San FrancsfccNew Yorfc
NeviOrle^haf
/Hawaii
3anama/
Lima і
Valparaiso^
Freetown
rashkent3efcinc
Shangha>
NCateutta Honay<Jng
. Philippines Is.
Zanzibar Seychelle Is Fiji h
Perth, .Syrllw\uckland
- Railroad
Mauntius
^DurbanCapeTofcrtX^
Shipping routes(line thickness indicates comparative importance of routes)
Steamship route
^Montevideo
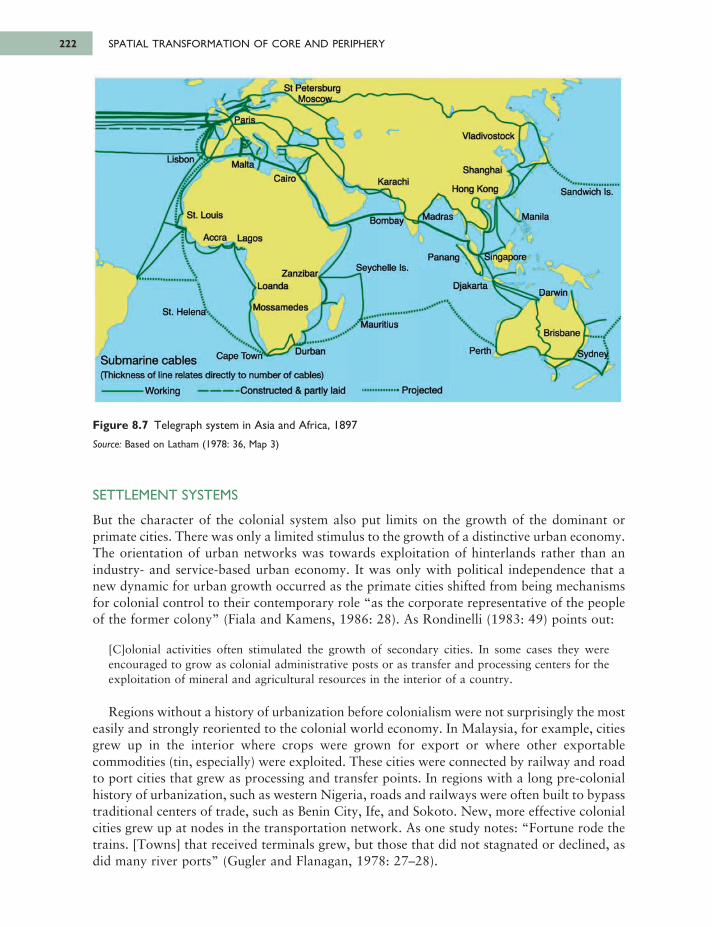
SETTLEMENT SYSTEMS
But the character of the colonial system also put limits on the growth of the dominant orprimate cities. There was only a limited stimulus to the growth of a distinctive urban economy.The orientation of urban networks was towards exploitation of hinterlands rather than anindustry- and service-based urban economy. It was only with political independence that anew dynamic for urban growth occurred as the primate cities shifted from being mechanismsfor colonial control to their contemporary role “as the corporate representative of the peopleof the former colony” (Fiala and Kamens, 1986: 28). As Rondinelli (1983: 49) points out:
[C]olonial activities often stimulated the growth of secondary cities. In some cases they wereencouraged to grow as colonial administrative posts or as transfer and processing centers for theexploitation of mineral and agricultural resources in the interior of a country.
Regions without a history of urbanization before colonialism were not surprisingly the mosteasily and strongly reoriented to the colonial world economy. In Malaysia, for example, citiesgrew up in the interior where crops were grown for export or where other exportablecommodities (tin, especially) were exploited. These cities were connected by railway and roadto port cities that grew as processing and transfer points. In regions with a long pre-colonialhistory of urbanization, such as western Nigeria, roads and railways were often built to bypasstraditional centers of trade, such as Benin City, Ife, and Sokoto. New, more effective colonialcities grew up at nodes in the transportation network. As one study notes: “Fortune rode thetrains. [Towns] that received terminals grew, but those that did not stagnated or declined, asdid many river ports” (Gugler and Flanagan, 1978: 27–28).
SPATIAL TRANSFORMATION OF CORE AND PERIPHERY222
Figure 8.7 Telegraph system in Asia and Africa, 1897
Source: Based on Latham (1978: 36, Map 3)
6063 GEOGRAPHY WORLD ECON_PT_246x189 mm 22/01/2014 15:10 Page 222
St Petersburg XjHoscow—
MaltaLisbon.
Cairo Karachi
V lad ivo s to k
Shanghai
Hong Kong Sandwich Is.
М а т і;M adrasBombay> St. Louis
Accra Lagos
Zanzibar\L o a n d a
IMossamedeSt. Helen;
Submarine cables Cape Town(Thickness o f line relates d irectly to num ber o f cables)
----------------W o r k i n g -----------------C onstructed & partly laid
Seychelle Is.Panang ^Singapore
DjakartaDarwin t
' Mauritius
1 Projected
Perth /Sydney
(Brisbane
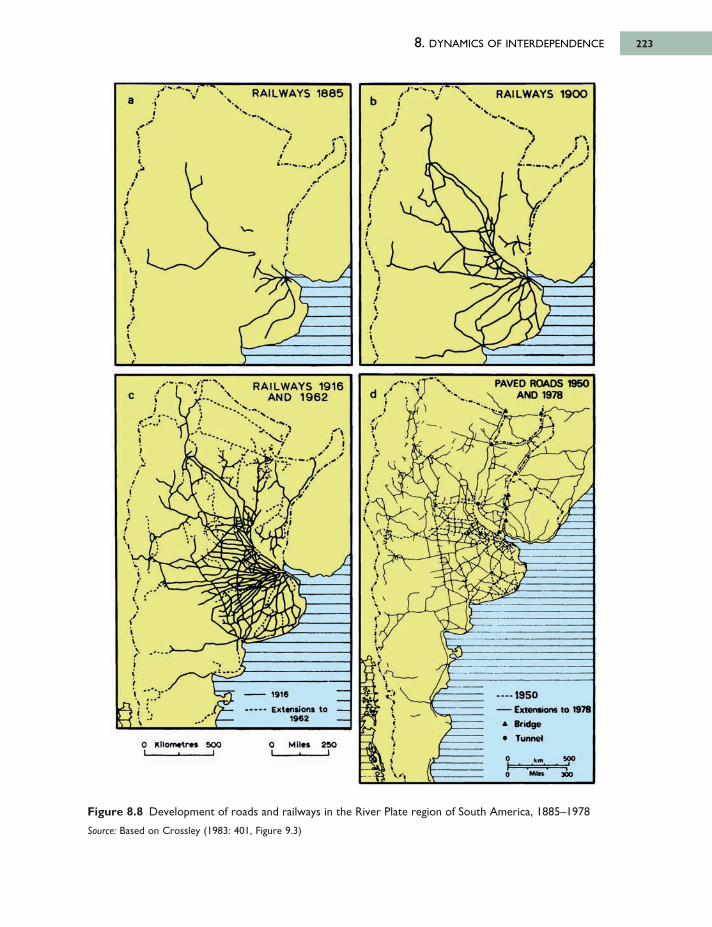
8. DYNAMICS OF INTERDEPENDENCE 223
Figure 8.8 Development of roads and railways in the River Plate region of South America, 1885–1978
Source: Based on Crossley (1983: 401, Figure 9.3)
6063 GEOGRAPHY WORLD ECON_PT_246x189 mm 22/01/2014 15:10 Page 223
R A IL W A Y S 1 8 8 5a b R A ILW A Y S 190C
PAVED ROADS 1950 . AND 1978d
R A IL W A Y S 19 16 A N D 1 9 6 2c
• 1916
Extension» to 1962
1950— Extensions to 1978
* Bridge
• Tunnel
0 km 500 - * -J
0 Mi·» Э00
0 Kilom etres 500 O Miles 250
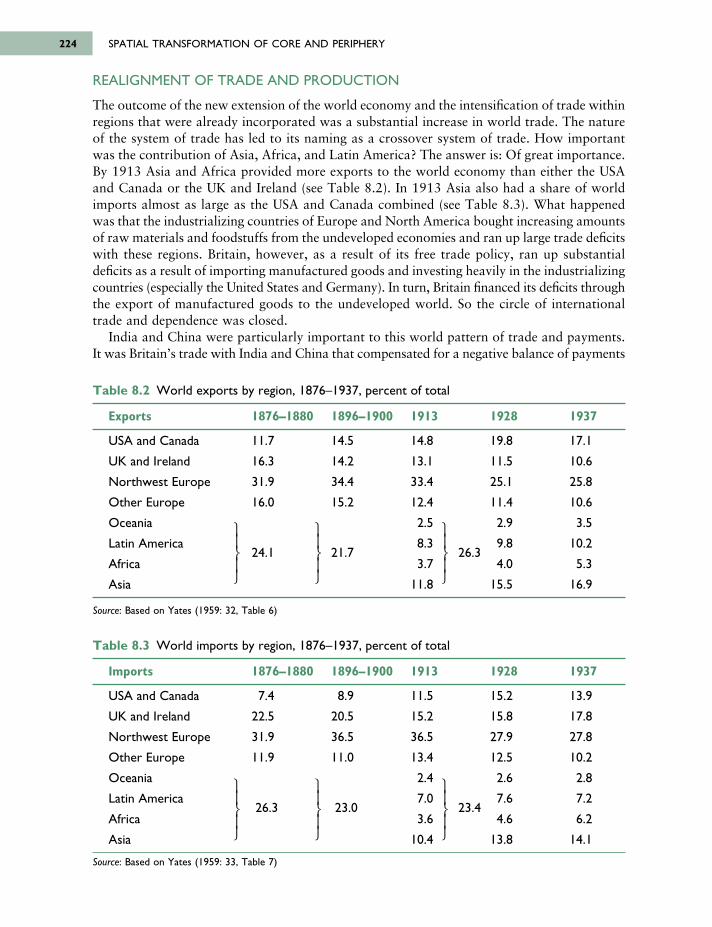
REALIGNMENT OF TRADE AND PRODUCTION
The outcome of the new extension of the world economy and the intensification of trade withinregions that were already incorporated was a substantial increase in world trade. The natureof the system of trade has led to its naming as a crossover system of trade. How importantwas the contribution of Asia, Africa, and Latin America? The answer is: Of great importance.By 1913 Asia and Africa provided more exports to the world economy than either the USAand Canada or the UK and Ireland (see Table 8.2). In 1913 Asia also had a share of worldimports almost as large as the USA and Canada combined (see Table 8.3). What happenedwas that the industrializing countries of Europe and North America bought increasing amountsof raw materials and foodstuffs from the undeveloped economies and ran up large trade deficitswith these regions. Britain, however, as a result of its free trade policy, ran up substantialdeficits as a result of importing manufactured goods and investing heavily in the industrializingcountries (especially the United States and Germany). In turn, Britain financed its deficits throughthe export of manufactured goods to the undeveloped world. So the circle of internationaltrade and dependence was closed.
India and China were particularly important to this world pattern of trade and payments.It was Britain’s trade with India and China that compensated for a negative balance of payments
SPATIAL TRANSFORMATION OF CORE AND PERIPHERY224
Table 8.2 World exports by region, 1876–1937, percent of total
Exports 1876–1880 1896–1900 1913 1928 1937
USA and Canada 11.7 14.5 14.8 19.8 17.1
UK and Ireland 16.3 14.2 13.1 11.5 10.6
Northwest Europe 31.9 34.4 33.4 25.1 25.8
Other Europe 16.0 15.2 12.4 11.4 10.6
Oceania 2.5 2.9 3.5
Latin America24.1 21.7
8.326.3
9.8 10.2
Africa 3.7 4.0 5.3
Asia 11.8 15.5 16.9
Source: Based on Yates (1959: 32, Table 6)
⎫⎪⎬⎪⎭
⎫⎪⎬⎪⎭
⎫⎪⎬⎪⎭
Table 8.3 World imports by region, 1876–1937, percent of total
Imports 1876–1880 1896–1900 1913 1928 1937
USA and Canada 7.4 8.9 11.5 15.2 13.9
UK and Ireland 22.5 20.5 15.2 15.8 17.8
Northwest Europe 31.9 36.5 36.5 27.9 27.8
Other Europe 11.9 11.0 13.4 12.5 10.2
Oceania 2.4 2.6 2.8
Latin America26.3 23.0
7.0 23.4
7.6 7.2
Africa 3.6 4.6 6.2
Asia 10.4 13.8 14.1
Source: Based on Yates (1959: 33, Table 7)
⎫⎪⎬⎪⎭
⎫⎪⎬⎪⎭
⎫⎪⎬⎪⎭
6063 GEOGRAPHY WORLD ECON_PT_246x189 mm 22/01/2014 15:10 Page 224
with the United States, industrial Europe, Canada, South Africa, and New Zealand. Withoutthe “Asian surplus,” Britain would not have been able to subsidize the growth of these othereconomies. So, far from being “peripheral” to the growth of the world economy, the undevel -oped world, especially India and China, was vital.
Between 1918 and 1939 this system of multilateral trade suffered a number of setbacks.One was the overall decline in trade as the world experienced a major depression. But theworst was the decline in Britain’s relative position as the linchpin of the colonial world economy.This reflected both successful industrialization in India and China displacing British products(especially cotton textiles) and increased competition from Japan in Britain’s “traditional”colonial markets. But another problem was the overproduction of the main export crops andraw materials. As a consequence, commodity prices fell and so did demand for manufacturedgoods. The successful expansion of plantations and mines, therefore, ultimately underminedthe system of capital circulation and growth that their introduction had brought into existencein the nineteenth century.
The onset of the Great Depression of the 1930s effectively ended the expansionist regimeof international trade established in the late nineteenth century. The major industrial statesreacted to the Depression by raising tariffs and devaluing their currencies. These shifts ineconomic policy were premised on the assumption that Britain would remain “open” as thelinch pin of the colonial world economy. But, as Stein (1984: 375) puts it: “Depression leftBritain unable and unwilling to accept an increasingly asymmetric bargain.” Not until the1970s would world trade return to the relative levels that it had achieved in the early 1900s.
Military spending and massive increases in domestic consumption of domestic manufac-tures provided the keys to economic recovery in western Europe and the United States in the1940s and 1950s. Although this did lead to increased demand for many of the industrial rawmaterials and foodstuffs produced in the periphery, there was no longer the crossover systemof trading linkages. If anything, the European colonial states and, above all, the United Statesnow came to have direct links to specific sites of exploitation in the periphery without thenecessity of the infrastructure and administrative investments that had limited short-runpayoffs. This approach favored direct investment and the creation of subsidiaries by trans -national corporations rather than portfolio investment and conventional trade. Advantagespreviously specific to the United States—the cost effectiveness of large plants, economies ofprocess, product and market integration—had become the proprietary rights of large firms.The world was now their oyster, rather than that of the colonial states: “American governmentscould preach against colonialism while large American [and other] firms colonized the world”(Agnew, 1987: 62).
In the early part of the twentieth century the major share of accumulated foreign directinvestment (FDI) was in the less developed countries (LDCs) (62.8 percent in 1914). TotalFDI came overwhelmingly from Britain (45.5 percent) and the USA (18.5 percent). Since theSecond World War, however, most foreign direct investment has been between the DCs. By the early 1970s only about 30 percent of FDI was directed to the LDCs (which has sincefallen to about 20 percent); although after Europe, Latin America was the major recipientregion. By the early 1970s also, the USA, with nearly 50 percent, was the major source oftotal FDI (Dunning, 1983). This has decreased since to about 30 percent with the growth of Japanese, European, and some NIE FDI. The dramatic post-Second World War expansionin FDI, therefore, has not involved all parts of the world on equal terms. In terms of flows ofFDI, the LDCs have, on the whole, become less central to the world economy than they werepreviously. From this point of view at least, the end of colonialism was something of a mixedblessing.
8. DYNAMICS OF INTERDEPENDENCE 225
6063 GEOGRAPHY WORLD ECON_PT_246x189 mm 22/01/2014 15:10 Page 225
8.3 INFLUENCE OF COLONIAL ADMINISTRATION ONINTERDEPENDENCE
Many of those who colonized the world from Europe, in both the sixteenth and the nineteenthcenturies, saw their activities as part of a historic “mission” of western civilization: To bringprogress to backward and barbarian peoples. Lord Lugard, the famous British colonialadministrator, maintained that Britain stood in a kind of apostolic succession of empire:
[A]s Roman imperialism . . . led the wild barbarians of these islands [the British Isles] along thepath of progress, so in Africa today we are re-paying the debt, and bringing to the dark places ofthe earth . . . the torch of culture and progress.
(Ranger, 1976: 115–116)
At best the political ideas of the European imperialists were that:
[P]olitical power tended constantly to deposit itself in the hands of a natural aristocracy, that powerso deposited was morally valid, and that it was not to be tamely surrendered before the claims ofabstract democratic ideals, but was to be asserted and exercised with justice and mercy.
(Stokes, 1959: 69)
The chief problem was to understand and pacify the indigenous colonized. The Nigeriannovelist Chinua Achebe (1975: 5) puts this as follows:
To the colonialist mind it was always of the utmost importance to be able to say: I know mynatives, a claim which implied two things at once: (a) that the native was really quite simple and(b) that understanding him and controlling him went hand in hand—understanding being aprecondition for control and control constituting adequate proof of understanding.
This approach provided the ideology for what Hopkins (1973: 189), referring to the Britishin Africa, has called the “art of light administration,” administration without too much long-run investment or explicit (and expensive) violence.
The colonial regimes themselves never amounted to more than a thin veneer of Europeanofficials and soldiers on top of complex networks of local collaborators. In India in the 1930s,for example, 4,000 British civil servants, 60,000 soldiers, and 90,000 civilians ruled a countryof 300 million people. The British were able to do this:
[B]y constructing a delicately balanced network through which they gained the support of certainfavored economic groups (the Zamindars acting as landed tax collectors in areas such as Bengal,for example), different traditional power holders (especially after the Great Mutiny of 1857, thenative princes), warrior tribes (such as the Sikhs of the [sic] Punjab), and aroused minority groupssuch as the Muslims.
(Smith, 1981: 52)
This kind of brokerage system was to be found in every colonial territory without a largeEuropean settler population. Sometimes a foreign economic presence was crucial (the Chinesein Southeast Asia; the Lebanese in West Africa; European settlers in Algeria and Kenya). Oftenthere were alliances with new or traditional ruling groups (the princely states in Malaya; theOttoman bureaucracies in Tunisia and Morocco; the Hashemite family in Mesopotamia andSyria). Above all, local rivalries were exploited to advantage, as in Madagascar, India, andChina. Even in the face of nominal local political independence, as in China or Latin America,
SPATIAL TRANSFORMATION OF CORE AND PERIPHERY226
6063 GEOGRAPHY WORLD ECON_PT_246x189 mm 22/01/2014 15:10 Page 226
colonial imperatives and administrative models had considerable influence through importedschool curricula and business practices (for example, British influence was strong in Argentinaand Venezuela; German influence was strong in Chile and Brazil).
Alliances and administrative structures were far from static and differed from colony tocolony and between colonial powers. But one change was permanent. The new colonies, oftenvastly bigger than the territorial units they superseded, created markets of unprecedented size.Internal tolls and other restraints on trade disappeared. Sumptuary laws that prevented peopleof low status from acquiring luxury goods were abolished. All forms of servitude thatinterfered with the wage economy were outlawed. The great tribal migrations of eastern andsouthern Africa were brought to a close. New judicial methods were introduced and old oneseliminated. Schools and hierarchical systems of local administration were established.
The colonial powers operated in different ways. In Africa, for example, the Britishadministration was more civilian and decentralized than the French and Belgian adminis trations.Its officials:
[P]rided themselves on being gentlemen and amateurs, rather than on being military, legal oradministrative specialists. The British pioneers set up an administrative hybrid based partly onBritish metropolitan models and partly on models derived from colonial India and Ireland.
(Gann and Duignan, 1978: 355)
In particular, there was a dispersal of administrative power.Any description of the particularities of administration in the various territories would require
much more space than is available here (see Gann and Duignan, 1978; Gifford and Louis,1971, for some of the details). One example must suffice. In Nigeria, Britain’s most populouscolony in Africa, the coastal (Lagos) and northern (Kaduna) regions were administered incompletely different ways. The coastal region had a longstanding commercial base and exporttrade, tied to Liverpool and England’s northern (for example, Lancashire) industries.Consequently:
Lagos governors . . . tried to please north country British businessmen by emphasizing the needsof trade, communications and public health, by avoiding wars and punitive expeditions, by theirreluctance to impose direct taxation, and by their determination to maintain a policy aimed at“peaceful penetration” and commercial development.
(Gann and Duignan, 1978: 209)
The northern region was a borderland and its international trade was limited:
In this region the tone of administration was military; the British ruling group was linked to Londonand the Home Counties [the southeast of England] rather than to Lancashire . . . Governmentemphasized prestige instead of profit, hierarchy in place of diversity.
(Gann and Duignan, 1978: 209)
In all colonies, however, priority was given to communication, transport, and medical care.Railways were built both to promote agricultural and mineral exports and to facilitate themovement of police and army detachments. Post offices, telegraphs, and telephones graduallytied together the local administrative units. Indicative of the centrality of transportationnetworks to colonial administration was the fact that public works departments were oftenthe first government units established in a territory. As Gann and Duignan (1978: 271)emphasize: “By 1914 all the British African dependencies possessed a basic infrastructure of
8. DYNAMICS OF INTERDEPENDENCE 227
6063 GEOGRAPHY WORLD ECON_PT_246x189 mm 22/01/2014 15:10 Page 227
specialized services, the most important of which was the creation of a modern transportationnetwork.”
An important cultural import into the colonies, therefore, was the assumption that the stateshould both encourage development and provide social services—education, agriculturalinstruction, etc.:
The very notion of the state as a territorial entity independent of ethnic or kinship ties, operatingthrough impersonal rules, was one of the most revolutionary concepts bequeathed by colonialismto post-colonial precedent . . . All of them have taken over, in some form or other, both theboundaries and the administrative institutions of their erstwhile Western overlords.
(Gann and Duignan, 1978: 347)
8.4 MECHANISMS OF CULTURAL INTEGRATIONThe imposition of colonial rule and, more generally, western penetration of societies outsideEurope, involved a great deal of violence and war. But, once established, “law and order”involved the imposition of western values as much as terminating local conflicts and suppressingpractices (witchcraft, infanticide, bride burning) that Europeans regarded as “barbaric.”
The social effects of European values were paradoxical. On the one hand, old values weredestroyed, as missionaries and schoolteachers attacked animistic creeds, polygamy, and othercustoms. Families often broke up as some members “converted” to Christianity and othersdid not. On the other hand, some people used the new ways to establish new bases of authority.In particular, western-educated natives became indispensable to European rule and influence.Interpreters, clerks, foremen, and police sergeants were cultural pioneers; they represented thenew order and profited from it.
The economic effects were also double-edged. As restraints on trade disappeared, com mercialagriculture and trade spread in extent and intensity. Yields increased as agricultural techniquesimproved, and trade proved more profitable as new communications linked previously isolatedinteriors with coastal entrepôts. Yet, as a consequence, the certainties and rhythms of locallife broke down and traditional skills were devalued. Above all, new types of consumption,while adding to the comforts of life of those with sufficient disposable income, led to thedestruction of many local industries and the growth of dependence on manufactured importsfrom the colonial “Motherland.” In this context, obligations to community and chief beganto weaken. Money became the major metric for assessing social status. This was in part becausemoney could help purchase an education:
Education, in turn, brought power and influence. These new opportunities profoundly affectedlife in the village, and the village ceased to be an almost self-contained unit, absorbing all the interestsof its people. Instead, cash-cropping and wage labor for limited periods gradually came to occupya much more central position in the cultivator’s life.
(Gann and Duignan, 1978: 367)
The growth of “free” labor was a process that was “always uneven and idiosyncratic” (Marksand Rathbone, 1982: 13). It depended on spatial variation in the extent of competition forlabor; conflicts of interest between firms and the colonial states; and the availability ofalternatives to wage labor. But once colony-wide labor and other markets were effectivelycreated, the prospering of commercial enterprises (both foreign and indigenous), such as minesand plantations, depended on an increasingly efficient and productive labor force to operatenew equipment and machinery. This required measures to both increase labor force stability
SPATIAL TRANSFORMATION OF CORE AND PERIPHERY228
6063 GEOGRAPHY WORLD ECON_PT_246x189 mm 22/01/2014 15:10 Page 228
(housing, minimum wages) and attempts to upgrade the health, literacy, and skills of employees.Of course, employee organizations also played a role in pressuring for these changes. Consump -tion demands, and so demands for higher incomes, tended to increase in concert with theincrease in permanent wage employment.
It is evident that in many colonies there were dramatic improvements in education and health.In Africa in the period 1910–1960 the number of children attending school grew much morequickly than had school enrolments in Europe in the boom years of 1840–1880. There werealso significant increases in life expectancy (for example, in Ghana in 1921 it was 28 years;in 1980 it was 45; and by 2000 it was 57) and reductions in infant mortality rates. To theBritish colonial authorities education was an important means of inculcating both “modern”work habits and a commitment to the class structure of colonialism. At the center of colonialeducation, was:
[T]he idea of work—taught to those who lacked property—emphasizing regularity, the organizationof time and human energy around the work routine, and the necessity of discipline. It was a moraland cultural concept . . . Prohibitions against drinking and dancing . . . were as much a part ofchanging concepts of labor as forced recruitment, vagrancy laws, and the insistence that workersput in regular hours.
(Cooper, 1980: 69–70)
But, above all, it was necessary “to get workers to internalize cultural values and behaviorpatterns that would define their role in the economy and society” (Cooper, 1980: 70).
This conception of education was particularly characteristic of the British colonies. Othercolonies either failed to develop the capitalist labor markets to which it was a reaction (forexample, sections of the French colonies on the southern margins of the Sahara Desert) or wereseverely underfunded for public activities (for example, the Belgian Congo and Portuguesecolonies). But British policy brought a price. It was precisely the educated élite that “formedthe vanguard of the nationalist movements, and the more ‘disciplined’ African workers became,the more effective were their trade union organizations in pursuing not only economic, butpolitical anti-colonial objectives” (Sender and Smith, 1986: 66). As taught in colonial schools,western concepts of “democracy” and “justice” served to undermine the legitimacy of thewestern empires that had introduced them.
The growth of wage labor incorporated women as well as men into the colonial worldeconomy, although at significantly lower levels of participation. More importantly, however,the spread of wage employment disrupted existing sexual divisions of labor, often to thedetriment of women. Women remained powerfully constrained by family, marriage, religionand so-called “domestic duties,” even while engaged in wage employment. But norms, power,and traditional patterns of authority based on gender, as well as age, caste, and lineage, weresubject to radical challenge because of wage labor, education, migration, and urbanization.Lonsdale (1985: 730) quotes from one Zulu chief in southern Africa who in 1905 expressedhis opposition to the cultural changes of the time as follows:
Our sons elbow us away from the boiled mealies in the pot when we reach for a handful to eat,saying, “we bought these, father,” and when remonstrated with, our wives dare to raise their eyesand glare at us. It used not to be thus. If we chide or beat our wives and children for misconduct,they run off to the police and the magistrate fines us.
Cultural change was not always one way, however. Some pre-capitalist and pre-colonial social and religious institutions were strengthened. More accurately, perhaps, “new” syncretic
8. DYNAMICS OF INTERDEPENDENCE 229
6063 GEOGRAPHY WORLD ECON_PT_246x189 mm 22/01/2014 15:10 Page 229
traditions were invented out of elements of past traditions. Mission-educated élites ofteninvented mythic histories of ancient empires and new nationalist traditions both to legitimizetheir quests for political power and to protect themselves in the new labor markets. Adaptationwas at least as common as straightforward assimilation in many colonial settings.
Ultimately, however, cultural incorporation, whether by adaptation or assimilation, under-mined the sociopolitical relation of dominance/subordination that colonialism existed toreproduce. Even when the idiom of dominance was improvement rather than order, nativegroups were not always persuaded of the natural superiority of colonial ways. Langley’s (1983:223) conclusion concerning American colonial adventures in the Caribbean is a fitting epitaphto the cultural contradictions of the entire colonial enterprise:
Striving to teach by example, they found it necessary to denigrate the cultural values of those whomthey had come to save . . . Their presence, even when it meant a peaceful society and materialadvancement, stripped Caribbean peoples of their dignity and constituted an unspoken Americanjudgment of Caribbean inferiority. Little wonder, then, that the occupied were so “ungrateful”for what Americans considered years of benign tutelage. But, then, Americans do not have in theirepigrammatic repertory that old Spanish proverb that Mexicans long ago adopted: “The wine isbitter, but it’s our wine.”
8.5 CHANGING GLOBAL CONTEXT OF INTERDEPENDENCEThe colonial world economy began to disintegrate after the Second World War. The crossovertrading system effectively ended in the 1930s. The Second World War’s buildup of industrialcapacity for military purposes in the United States and the Soviet Union produced two super -powers without overseas colonial empires and European decolonization further underminedthe colonial world order. Respectively, they and their allies defined the so-called First and SecondWorlds. In the 1950s and 1960s the then so-called Third World (of politically independentbut often politically nonaligned and always less prosperous countries) was born. Large partsof Asia and Africa now joined Latin America as a largely nonindustrial and ex-colonial butstill “dependent world” (see Figure 8.9). The initial tendency was to attempt to achieve economicself-reliance through national strategies of industrialization and diversifi cation of tradingpartners away from the particular colonial power (France, Britain, etc.). This was the firstchange in relation to the global context of interdependence.
END OF COLONIALISM AND NATIONAL STRATEGIES OF DEVELOPMENT
As new states came into existence, so did attempts to stimulate industrial development andeconomic growth. From the Depression of the 1930s on and especially during the Second WorldWar, stagnation and shipping blockades had encouraged some import substitution in thecolonies. Increasingly, traders and merchants in the richer peripheral countries looked tomanufacturing industry as a source of capital growth. Leading politicians also saw in industrialdevelopment both national and personal advantage (see Chapter 10 for more details on thepreference for industrialization).
Most importantly, however, the barter terms of trade (the ratio between the prices of exportsand the prices of imports) for many of the basic commodities exported to the core countriesdeteriorated for many years only recovering somewhat recently in the face of dramaticincreases in world prices for foodstuffs and some other primary commodities since 2007 (seeTable 8.4). Basic commodity prices (largely those for raw materials) also declined relative to
SPATIAL TRANSFORMATION OF CORE AND PERIPHERY230
6063 GEOGRAPHY WORLD ECON_PT_246x189 mm 22/01/2014 15:10 Page 230
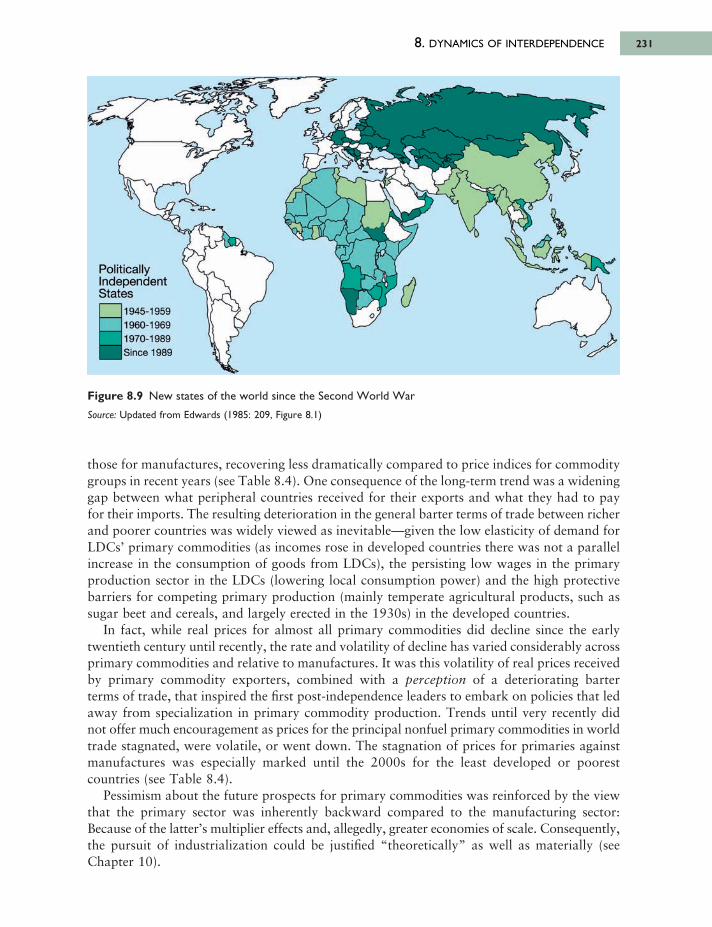
8. DYNAMICS OF INTERDEPENDENCE 231
those for manufactures, recovering less dramatically compared to price indices for commoditygroups in recent years (see Table 8.4). One consequence of the long-term trend was a wideninggap between what peripheral countries received for their exports and what they had to payfor their imports. The resulting deterioration in the general barter terms of trade between richerand poorer countries was widely viewed as inevitable—given the low elasticity of demand forLDCs’ primary commodities (as incomes rose in developed countries there was not a parallelincrease in the consumption of goods from LDCs), the persisting low wages in the primaryproduction sector in the LDCs (lowering local consumption power) and the high protectivebarriers for competing primary production (mainly temperate agricultural products, such assugar beet and cereals, and largely erected in the 1930s) in the developed countries.
In fact, while real prices for almost all primary commodities did decline since the earlytwentieth century until recently, the rate and volatility of decline has varied considerably acrossprimary commodities and relative to manufactures. It was this volatility of real prices receivedby primary commodity exporters, combined with a perception of a deteriorating barter terms of trade, that inspired the first post-independence leaders to embark on policies that ledaway from specialization in primary commodity production. Trends until very recently didnot offer much encouragement as prices for the principal nonfuel primary commodities in worldtrade stag nated, were volatile, or went down. The stagnation of prices for primaries againstmanu factures was especially marked until the 2000s for the least developed or poorestcountries (see Table 8.4).
Pessimism about the future prospects for primary commodities was reinforced by the viewthat the primary sector was inherently backward compared to the manufacturing sector: Because of the latter’s multiplier effects and, allegedly, greater economies of scale. Conse quently,the pursuit of industrialization could be justified “theoretically” as well as materially (seeChapter 10).
Figure 8.9 New states of the world since the Second World War
Source: Updated from Edwards (1985: 209, Figure 8.1)
6063 GEOGRAPHY WORLD ECON_PT_246x189 mm 22/01/2014 15:10 Page 231
PoliticallyIndependentStates
1945-1959
1960-1969
1970-1989
S ince 1989
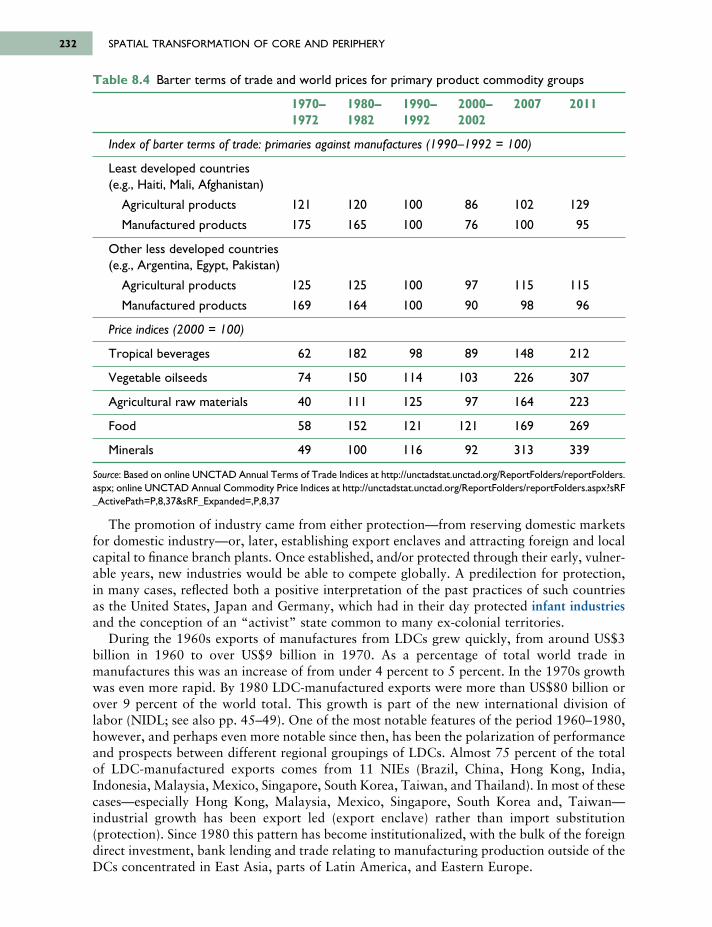
The promotion of industry came from either protection—from reserving domestic marketsfor domestic industry—or, later, establishing export enclaves and attracting foreign and localcapital to finance branch plants. Once established, and/or protected through their early, vulner -able years, new industries would be able to compete globally. A predilection for protection,in many cases, reflected both a positive interpretation of the past practices of such countriesas the United States, Japan and Germany, which had in their day protected infant industriesand the conception of an “activist” state common to many ex-colonial territories.
During the 1960s exports of manufactures from LDCs grew quickly, from around US$3billion in 1960 to over US$9 billion in 1970. As a percentage of total world trade inmanufactures this was an increase of from under 4 percent to 5 percent. In the 1970s growthwas even more rapid. By 1980 LDC-manufactured exports were more than US$80 billion orover 9 percent of the world total. This growth is part of the new international division oflabor (NIDL; see also pp. 45–49). One of the most notable features of the period 1960–1980,however, and perhaps even more notable since then, has been the polarization of performanceand prospects between different regional groupings of LDCs. Almost 75 percent of the totalof LDC-manufactured exports comes from 11 NIEs (Brazil, China, Hong Kong, India,Indonesia, Malaysia, Mexico, Singapore, South Korea, Taiwan, and Thailand). In most of thesecases—especially Hong Kong, Malaysia, Mexico, Singapore, South Korea and, Taiwan—industrial growth has been export led (export enclave) rather than import substitution(protection). Since 1980 this pattern has become institutionalized, with the bulk of the foreigndirect investment, bank lending and trade relating to manufacturing production outside of theDCs concentrated in East Asia, parts of Latin America, and Eastern Europe.
SPATIAL TRANSFORMATION OF CORE AND PERIPHERY232
Table 8.4 Barter terms of trade and world prices for primary product commodity groups
1970– 1980– 1990– 2000– 2007 20111972 1982 1992 2002
Index of barter terms of trade: primaries against manufactures (1990–1992 = 100)
Least developed countries (e.g., Haiti, Mali, Afghanistan)
Agricultural products 121 120 100 86 102 129
Manufactured products 175 165 100 76 100 95
Other less developed countries (e.g., Argentina, Egypt, Pakistan)
Agricultural products 125 125 100 97 115 115
Manufactured products 169 164 100 90 98 96
Price indices (2000 = 100)
Tropical beverages 62 182 98 89 148 212
Vegetable oilseeds 74 150 114 103 226 307
Agricultural raw materials 40 111 125 97 164 223
Food 58 152 121 121 169 269
Minerals 49 100 116 92 313 339
Source: Based on online UNCTAD Annual Terms of Trade Indices at http://unctadstat.unctad.org/ReportFolders/reportFolders.aspx; online UNCTAD Annual Commodity Price Indices at http://unctadstat.unctad.org/ReportFolders/reportFolders.aspx?sRF_ActivePath=P,8,37&sRF_Expanded=,P,8,37
6063 GEOGRAPHY WORLD ECON_PT_246x189 mm 22/01/2014 15:10 Page 232
Just over 66 percent of all LDC merchandise exports (manufactures, food, agricultural rawmaterials, fuels, ores and metals) are now sold to DCs. Both high levels of protection in theDCs and the risk of increased protection in the future have limited this market. Since the early1970s the level and uncertainty of protective trade barriers to LDC manufactured exports have increased tremendously, particularly so-called hard-core nontariff barriers such as quotas,voluntary export restraints, and the Multifiber Agreement (MFA) (involving quotas by theDCs on textile and clothing imports from the LDCs between 1974 and 2005). This is especiallythe case for relatively more finished products. Between 1966 and 1986, the share of importsaffected by all nontariff measures increased by more than 20 percent for the USA, around 40 percent for Japan and 160 percent for the EC. By 1986 21 percent of LDC exports to theDCs were covered by these barriers even as global average tariff rates and coverage declined.The Uruguay round of the General Agreement on Tariffs and Trade (GATT), however,incorporated some significant steps towards trade liberalization. Beginning in 1994, voluntaryexport restraints were abolished and the highly protectionist quota regime for textiles andclothing began to be phased out.
Manufactured goods can be classified into two main product groups: producer goods—capital goods (for example, machinery and equipment, including transport equipment) andintermediate goods (for example, raw materials, and semi-finished items)—and consumer goods,of which textiles and clothing are the largest single category in international trade. Capitalgoods account for about half of all manufactured goods traded in the world economy (upfrom 46 percent in 1990). But different world regions account for different shares of the twoproduct categories. For example, DCs supply 65 percent of world exports of machinery andtransport equipment and 35 percent of textiles and clothing. LDCs are important mainly assuppliers of textiles and clothing and certain light industrial products, mainly consumer goods(with the important exception of electronics components and automobile components, in thecase of countries such as China, Brazil, Mexico, and South Korea). The specialization of tradeflows between LDCs and DCs, therefore, extends today beyond the distinction betweenprimary commodities and other goods to apply within the category of manufactured goods.
ROLE OF TRANSNATIONAL CORPORATIONS
The growth of trade in manufactures in the 1970s, after a 40-year period in which manu -facturing production was intensively concentrated in the DCs and there was more limitedDC–DC as well as DC–LDC trade in manufactures, was influenced by the growing significanceof transnational corporations and of contractual cooperation between firms in differentcountries. Transnational corporations (TNCs) have long been active in manufacturing in LDCs.As we saw in Chapter 6 and discuss further in Chapter 10, they tended at first to duplicateplants around the world in order to gain access to protected markets or to make use of localraw materials. The production by TNCs of cars (for example, in Brazil), agricultural engin -eering products (for example, in South Africa and Mexico) and pharmaceuticals (for example,in India) across a range of LDCs are examples. This kind of manufacturing production stillexists, especially in countries with large internal markets. In Brazil, for example, in the mid-1970s to take an extreme case, almost 50 percent of industrial output was produced by TNCsand more than 90 percent of TNC production was sold locally.
Since the 1970s, however, much TNC involvement in LDCs has also involved what is knownas global sourcing. As a result of technical change, especially reductions in transportation costs,and the appeal of cheap (often female) labor in certain countries, production activities thatonce were adjacent spatially can now be dispersed widely. Many so-called light industrial
8. DYNAMICS OF INTERDEPENDENCE 233
6063 GEOGRAPHY WORLD ECON_PT_246x189 mm 22/01/2014 15:10 Page 233
processes are especially suited to the separation of various stages of production. In particular,labor-intensive stages (as in the product lifecycle model) can be located to take advantage ofboth the enormous international spread in wage levels and the exchange rate fluctuationsbetween currencies that have been a feature of the world economy since the early 1970s. Withrespect to wage levels, the footwear industry faces wage costs of about US$15 per hour in theUnited States but under US$1 in Bangladesh, the Philippines, and Trinidad and Tobago; Chinesetextile workers earn less than US$3.50 per hour compared to a U.S. rate of about US$19 (thehigher skills and productivity of workers in the textile industry translate into higher wagescompared to the clothing and footwear industries).
One industry that has engaged in global sourcing on a massive scale (and, perhaps, for this reason, is somewhat exceptional) is the consumer electronics components and productsindustry. This industry has two characteristics that have encouraged the shift to globalsourcing: Discrete production segments, of which some are extremely labor intensive and requirea “flexible response” because of short product cycles that make automation uneconomic; andcompact products (parts and components) that can be shipped relatively cheaply. East Asianlocations with cheap, reliable, literate and tractable (largely female) labor forces have beenespecially attractive to this industry (and some others such as textiles and clothing). Govern -ments have often facilitated the process of establishing component and assembly plantsthrough the provision of export processing zones (EPZs), subsidies and tax advantages, andthe enforcement of the “political stability” highly valued by TNCs and their local sub-contractors.
CHANGES IN MARKETS FOR PRIMARY COMMODITIES
For many LDCs, however, there is still a heavy dependence on trade in primary commodities(see Chapter 9). But the primary commodity sector has become extremely heterogeneous withrespect to trading conditions since the Second World War. Four major categories stand outin this regard: Fuels (mainly petroleum), nonfuel minerals, grains, and other agriculturalproducts. These product groups have experienced very different price movements and, to someextent, quantity fluctuations over the past 50 years. The nonfood commodity prices have beenespecially volatile. Generally, manufactures have increased in price to the disadvantage ofprimary commodity exporters. But there have been two periods, 1949–1952 and 1973–1980,when demand for primary nonfood commodities was extremely strong and commodity pricessurged. In particular, in the years 1973–1980, inflation and uncertain economic conditions inthe DCs boosted the prices of agricultural raw materials. Since 1980, however, at least untilthe 2000s, the relative price strength in the fuels and agricultural products groups largelydisappeared and the value of commodity export earnings in these sectors sank precipitouslyin relation to the prices of manufactures and minerals. Perhaps the most negative pricemovement from the perspective of most LDCs has been in the price of grains. There was along-term decline in world grain prices until around 2007. This reflects tremendous increasesin production the world over, but especially in the United States and other DCs. Normal yieldsper hectare are now more than twice what they were in 1950. The real price of wheat, however,is now about half what it was 100 years ago. Climate change and huge increases in demand,however, are now seeing this trend threatened as at no time in the previous 50 years.
Across all primary commodities, commodity agreements between producing and consumingcountries (cocoa, tin, sugar, and natural rubber) and producer cartels (most famously, OPECfor petroleum) have failed to reduce volatility and consistently raise the prices of primarycommodities relative to those of manufactures because of fundamental differences of interest
SPATIAL TRANSFORMATION OF CORE AND PERIPHERY234
6063 GEOGRAPHY WORLD ECON_PT_246x189 mm 22/01/2014 15:10 Page 234
between producers and consumers and among producers. Even OPEC, after successfully raisingthe price of oil between 1973 and 1979, has been riven by conflict and the failure to attractsome major oil producers (such as Britain, Mexico, and Norway) to its ranks. This failure hasencouraged further attempts at industrialization as the major strategy of economicdevelopment. However, price volatility acts to reduce the industrial potential of “mineraleconomies” (Auty, 1991). This is one of the Catch-22s of the contemporary world economy.Dependence on oil is said to sometimes lead to what is called the resource curse. This suggeststhat rather than a blessing, reliance on a primary commodity for which there is tremendousworld demand can give rise to a range of negative effects such as encouragement of corruption(particularly when state-owned companies have a monopoly), a rise in the exchange rate betweenthe country’s currency and others that can then raise inflation and squeeze out investment inagriculture and manufacturing, and pressure to share revenues by investing in prestige projectsand providing subsidies that do not stimulate long-term economic growth.
Some countries, however, especially those in Sub-Saharan Africa, could probably benefitfrom increased attention to primary commodities. The macroeconomic policies of manyAfrican governments have worked to undermine their region’s shares of world export marketsacross a range of primary commodities. Since the early 1970s real export earnings have remainedstagnant or declined significantly in 25 out of 33 countries in Sub-Saharan Africa for whichdata are available. The whole of this region, with around 700 million people, has exportrevenues that are less than those of Singapore, a city-state of 5 million people.
Inelasticity of demand in the DCs (expressed in deteriorating barter terms of trade) cannotcompletely explain the magnitude of these declines; neither can the absence of commoditydiversification, since those countries with a relatively diversified structure of agriculturalexports—such as Tanzania—have not experienced more favorable trends in export earningsthan more specialized ones. Sender and Smith (1986: 127) explain the absolute decline of Sub-Saharan Africa’s contributions to world commodity markets in terms of “the continueddominance of anti-trade ideologies and export pessimism” that are:
[P]robably explained by the political hegemony of nationalism. It remains expedient for the nationalbourgeoisie, or for those determining the form and nature of state intervention, to deflect criticismby resort to anti-imperialist rhetoric and to blame foreign scapegoats for economic failure.
However, this is probably too narrow a perspective. Political agendas and social problemsof a more general nature have also played important roles. In the immediate post-independenceperiod, considerable political energy was expended in diversifying import and export marketsrather than building larger ones. This was a direct result of trying to slay the “colonial dragon”as the newly independent countries tried to become less dependent on their former colonialpowers. Governments have also been faced with major ethnic divisions and rivalries, fragilepolitical institutions, and “superpower” infiltration and manipulation. The Nigerian Civil Warin the early 1970s, frequent military coups d’état and American or Soviet covert operationsin most African countries are symptomatic examples of the diversions from economicpolicymaking that have faced political élites in Sub-Saharan Africa (and to a lesser extent alsoin Latin America and Asia) since the 1940s.
DISPARITIES WITHIN THE PERIPHERY
Disparities among LDCs have increased substantially since the 1970s. Several groups haveemerged and can be distinguished. First, there are those NIEs that have grown rapidly andare important exporters of manufactured goods. These include the “old” NIEs such as South
8. DYNAMICS OF INTERDEPENDENCE 235
6063 GEOGRAPHY WORLD ECON_PT_246x189 mm 22/01/2014 15:10 Page 235
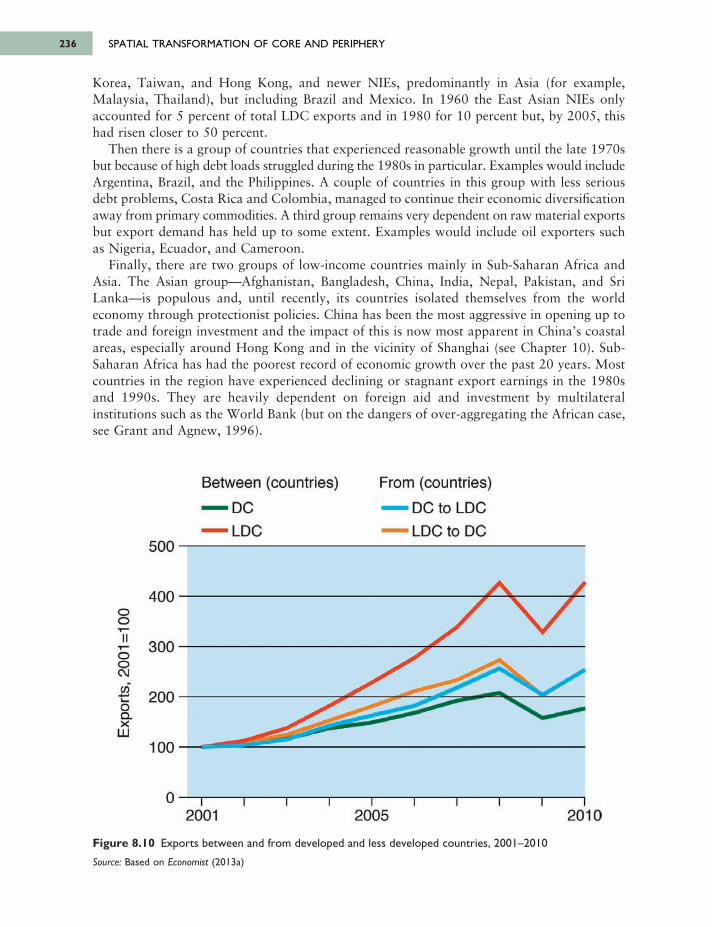
SPATIAL TRANSFORMATION OF CORE AND PERIPHERY236
Korea, Taiwan, and Hong Kong, and newer NIEs, predominantly in Asia (for example,Malaysia, Thailand), but including Brazil and Mexico. In 1960 the East Asian NIEs onlyaccounted for 5 percent of total LDC exports and in 1980 for 10 percent but, by 2005, thishad risen closer to 50 percent.
Then there is a group of countries that experienced reasonable growth until the late 1970sbut because of high debt loads struggled during the 1980s in particular. Examples would includeArgentina, Brazil, and the Philippines. A couple of countries in this group with less seriousdebt problems, Costa Rica and Colombia, managed to continue their economic diversificationaway from primary commodities. A third group remains very dependent on raw material exportsbut export demand has held up to some extent. Examples would include oil exporters suchas Nigeria, Ecuador, and Cameroon.
Finally, there are two groups of low-income countries mainly in Sub-Saharan Africa andAsia. The Asian group—Afghanistan, Bangladesh, China, India, Nepal, Pakistan, and SriLanka—is populous and, until recently, its countries isolated themselves from the worldeconomy through protectionist policies. China has been the most aggressive in opening up totrade and foreign investment and the impact of this is now most apparent in China’s coastalareas, especially around Hong Kong and in the vicinity of Shanghai (see Chapter 10). Sub-Saharan Africa has had the poorest record of economic growth over the past 20 years. Mostcountries in the region have experienced declining or stagnant export earnings in the 1980sand 1990s. They are heavily dependent on foreign aid and investment by multilateralinstitutions such as the World Bank (but on the dangers of over-aggregating the African case,see Grant and Agnew, 1996).
Figure 8.10 Exports between and from developed and less developed countries, 2001–2010
Source: Based on Economist (2013a)
6063 GEOGRAPHY WORLD ECON_PT_246x189 mm 22/01/2014 15:10 Page 236
Between (countries) From (countries)
DC to LDC LDC to DC
DCLDC
400
300
200
1 0 0
П
500
ooї їδο(Μ
сл -*—* ί Ο Ο Χ
Ш
2001 2005 2010
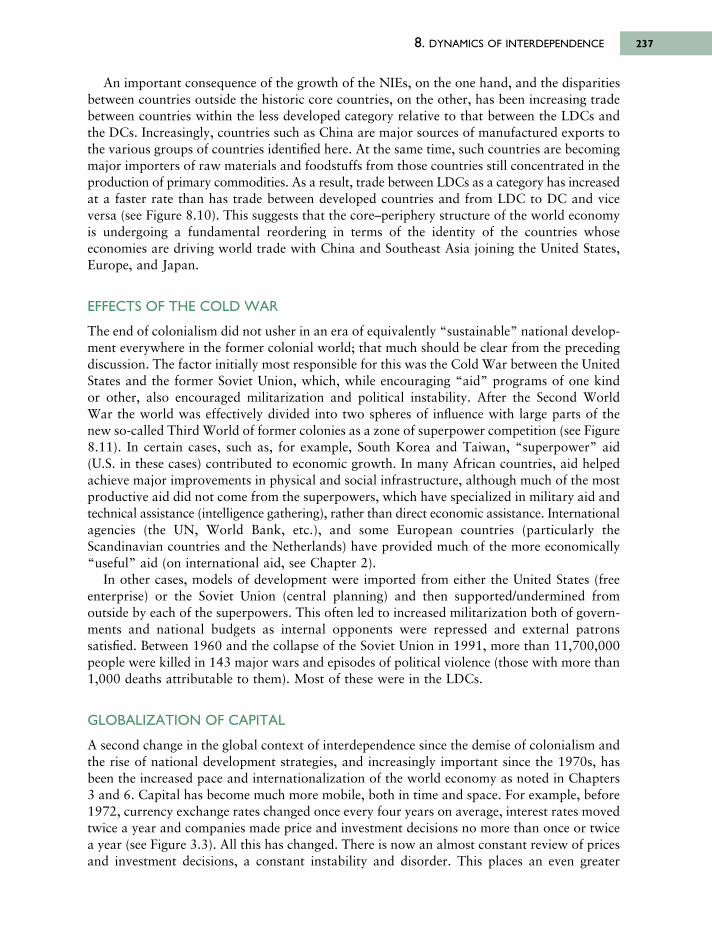
An important consequence of the growth of the NIEs, on the one hand, and the disparitiesbetween countries outside the historic core countries, on the other, has been increasing tradebetween countries within the less developed category relative to that between the LDCs andthe DCs. Increasingly, countries such as China are major sources of manufactured exports tothe various groups of countries identified here. At the same time, such countries are becomingmajor importers of raw materials and foodstuffs from those countries still concentrated in theproduction of primary commodities. As a result, trade between LDCs as a category has increasedat a faster rate than has trade between developed countries and from LDC to DC and viceversa (see Figure 8.10). This suggests that the core–periphery structure of the world economyis undergoing a fundamental reordering in terms of the identity of the countries whoseeconomies are driving world trade with China and Southeast Asia joining the United States,Europe, and Japan.
EFFECTS OF THE COLD WAR
The end of colonialism did not usher in an era of equivalently “sustainable” national develop -ment everywhere in the former colonial world; that much should be clear from the precedingdiscussion. The factor initially most responsible for this was the Cold War between the UnitedStates and the former Soviet Union, which, while encouraging “aid” programs of one kind or other, also encouraged militarization and political instability. After the Second World War the world was effectively divided into two spheres of influence with large parts of thenew so-called Third World of former colonies as a zone of superpower competition (see Figure8.11). In certain cases, such as, for example, South Korea and Taiwan, “superpower” aid (U.S. in these cases) contributed to economic growth. In many African countries, aid helpedachieve major improvements in physical and social infrastructure, although much of the mostproductive aid did not come from the superpowers, which have specialized in military aid andtechnical assistance (intelligence gathering), rather than direct economic assistance. Inter nationalagencies (the UN, World Bank, etc.), and some European countries (particularly theScandinavian countries and the Netherlands) have provided much of the more economically“useful” aid (on international aid, see Chapter 2).
In other cases, models of development were imported from either the United States (freeenterprise) or the Soviet Union (central planning) and then supported/undermined fromoutside by each of the superpowers. This often led to increased militarization both of govern -ments and national budgets as internal opponents were repressed and external patronssatisfied. Between 1960 and the collapse of the Soviet Union in 1991, more than 11,700,000people were killed in 143 major wars and episodes of political violence (those with more than1,000 deaths attributable to them). Most of these were in the LDCs.
GLOBALIZATION OF CAPITAL
A second change in the global context of interdependence since the demise of colonialism andthe rise of national development strategies, and increasingly important since the 1970s, hasbeen the increased pace and internationalization of the world economy as noted in Chapters3 and 6. Capital has become much more mobile, both in time and space. For example, before1972, currency exchange rates changed once every four years on average, interest rates movedtwice a year and companies made price and investment decisions no more than once or twicea year (see Figure 3.3). All this has changed. There is now an almost constant review of pricesand investment decisions, a constant instability and disorder. This places an even greater
8. DYNAMICS OF INTERDEPENDENCE 237
6063 GEOGRAPHY WORLD ECON_PT_246x189 mm 22/01/2014 15:10 Page 237
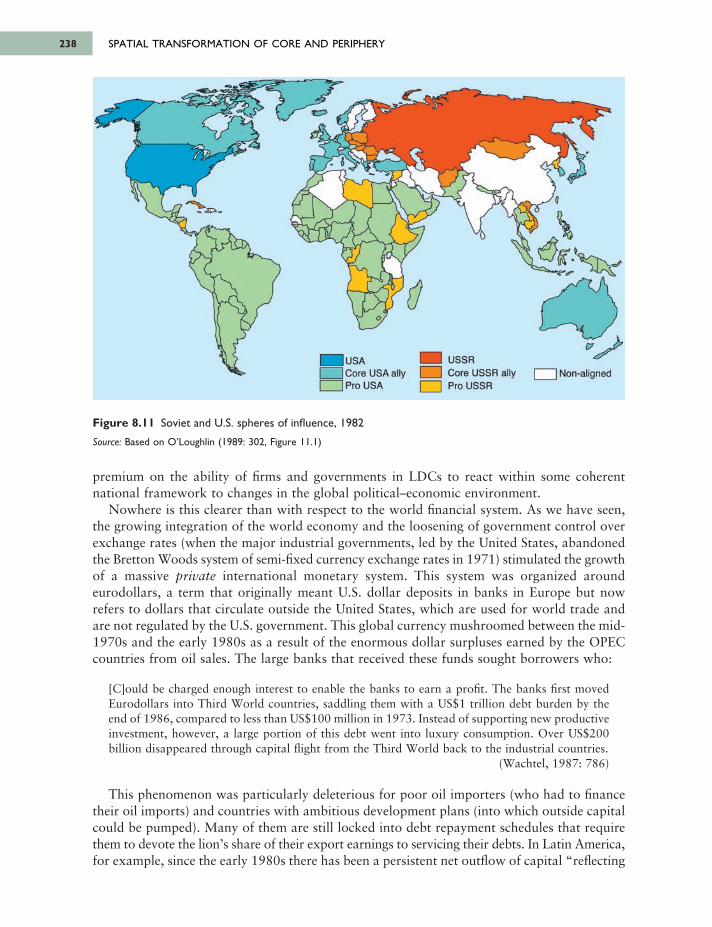
SPATIAL TRANSFORMATION OF CORE AND PERIPHERY238
premium on the ability of firms and governments in LDCs to react within some coherentnational framework to changes in the global political–economic environment.
Nowhere is this clearer than with respect to the world financial system. As we have seen,the growing integration of the world economy and the loosening of government control overexchange rates (when the major industrial governments, led by the United States, abandonedthe Bretton Woods system of semi-fixed currency exchange rates in 1971) stimulated the growthof a massive private international monetary system. This system was organized aroundeurodollars, a term that originally meant U.S. dollar deposits in banks in Europe but nowrefers to dollars that circulate outside the United States, which are used for world trade andare not regulated by the U.S. government. This global currency mushroomed between the mid-1970s and the early 1980s as a result of the enormous dollar surpluses earned by the OPECcountries from oil sales. The large banks that received these funds sought borrowers who:
[C]ould be charged enough interest to enable the banks to earn a profit. The banks first movedEurodollars into Third World countries, saddling them with a US$1 trillion debt burden by theend of 1986, compared to less than US$100 million in 1973. Instead of supporting new productiveinvestment, however, a large portion of this debt went into luxury consumption. Over US$200billion disappeared through capital flight from the Third World back to the industrial countries.
(Wachtel, 1987: 786)
This phenomenon was particularly deleterious for poor oil importers (who had to financetheir oil imports) and countries with ambitious development plans (into which outside capitalcould be pumped). Many of them are still locked into debt repayment schedules that requirethem to devote the lion’s share of their export earnings to servicing their debts. In Latin America,for example, since the early 1980s there has been a persistent net outflow of capital “reflecting
Figure 8.11 Soviet and U.S. spheres of influence, 1982
Source: Based on O’Loughlin (1989: 302, Figure 11.1)
6063 GEOGRAPHY WORLD ECON_PT_246x189 mm 22/01/2014 15:10 Page 238
[USACore USA ally Pro USA
USSRCore USSR ally Pro USSR
] Non-aligned
a ‘scissors movement’ of declining grant aid and mounting debt repayments” (Cook andKirkpatrick, 1997: 63).
After 1982, when Mexico and certain other major Latin American borrowers effectivelydefaulted on loan repayments, the eurodollars shifted into funding the U.S. budget deficit, intofirm mergers and acquisitions in the United States and Europe and into the world’s stockmarkets. But the burden of debt, in both the form of repayment and the inability to borrowfresh capital with outstanding debt, emerged as a major new barrier to economic development.In the 1980s net financial flows to LDCs initially decreased as commercial bank lending driedup. Since 1986 government and multilateral agency (World Bank, etc.) aid and foreign directinvestment by TNCs have increased substantially. But only in 1989 did total flows equal the1982 figure and, within this, aid increased from 38 to 55 percent of the total. Since then privateinvestment has increased somewhat, including both portfolio and foreign direct investment,but debt service still soaks up significant proportions of all capital inflows. This is borrowingto pay back what was previously borrowed rather than productive investment in economicactivities that improve the lot of the LDCs and their populations. In the years between 1990and the Asian financial crisis in 1997 in particular, most new bank lending from the DCs wentto Asia, whereas the other regions had to rely more on foreign direct investment (as in LatinAmerica) or on aid and multilateral loans from international organizations (for example, theInternational Monetary Fund in Sub-Saharan Africa).
DEBT AND INSTABILITY
If the 1970s are remembered for two major oil price shocks (in 1973 and 1979) and a persistingdownturn in the world economy, the 1980s were marked by three global phenomena. Onewas the international debt problem, which effectively undermined growth in many LDCs formost of the decade. Although a variety of international agreements renegotiating interestpayments reduced the overall severity of the international debt crisis in the 1980s, debt burdensremain at historic highs and effectively undermine the possibility of future credit-led economicdevelopment (Corbridge, 1993, offers a thorough overview of this phenomenon). The absolutedebt load of LDCs peaked during the mid- to late 1990s at around 39 percent of their combinedGDP after declining in a cyclical fashion to 33 percent in 1990 from a previous high of around37 percent in 1986. So debt is a problem that still haunts many LDCs’ economies. Its impactvaries widely, however, and is not a direct function of the absolute size of the debt. For example,as of 1999 Mexico had a huge debt of US$166.9 billion but its debt–service ratio (interestand principal payments as a share of all exports) was “only” 25.1 percent, whereas, at theother extreme, Colombia with a debt of US$34.5 billion had a debt–service ratio of 43.5 percent.Of course, many developed economies also now have huge government debt loads, in largepart because of bailing out failing banks in the context of the global financial crisis of 2008.A second was the volatility of exchange rates, illustrated most vividly by the steep appreciationof the U.S. dollar until 1985, followed by a dramatic descent until the late 1990s, at whichpoint it began to appreciate again so that by the early 2000s it had reached levels not seensince the mid-1980s. These shifts have had important effects on the imports and exports ofcountries whose currencies are pegged in value to global currencies such as the U.S. dollar.Commodities become more or less expensive depending on the shifts in the value of the globalcurrency. The net impact has been negative for nearly all LDCs. Finally, the U.S. federalgovernment and national trade deficits, emerging spectacularly after 1983, produced growthin the USA at the expense of stagnation elsewhere. Investment that could have gone to theLDCs under other circumstances was diverted to the USA to finance the deficits. This also
8. DYNAMICS OF INTERDEPENDENCE 239
6063 GEOGRAPHY WORLD ECON_PT_246x189 mm 22/01/2014 15:10 Page 239
SPATIAL TRANSFORMATION OF CORE AND PERIPHERY240
raised interest rates on outstanding loans such as those held by heavily indebted LDCs. Conse -quently, high interest rates and low commodity prices rather than the debt loads incurred inthe 1970s were probably the major barriers to growth in the LDCs in the 1980s. On balance,the 1980s was not a good decade for the LDCs as a whole. Likewise, the period since 1990has hardly been stellar given the generally declining terms of trade for primary commodities,the debt loads incurred but not yet paid off and the economic woes of a number of the NIEs precipitated by the Asian financial crisis of 1997. With the global financial crisis since2007, many of the world’s poorer countries, with the exception of the NIEs this time around,also find themselves crowded out of world credit markets and unable to refinance previousdebt loads.
CONTINUED CORE–PERIPHERY POLARIZATION?
From one point of view, the net effect of the changes in the global context for inter dependencehas been an increased division between the LDCs, on the one hand, and the DCs, on the other.National income and purchasing power statistics support this interpretation. But, from anotherpoint of view, the periphery has, in fact, developed rapidly. This interpretation is supported
Box 8.1 The Asian financial crisis
The early 1990s in East Asia was a time of rapid economic growth. Doubts about the EastAsian Miracle surfaced in 1996, however, as observers pointed to a slowdown in exports,excess capacity in many industries and declining earnings. In 1997 the currency and financialcrisis that erupted in Thailand in July spread to South Korea, Malaysia, and Indonesia; HongKong, the Philippines, and Singapore were less hard hit; China and Taiwan were leastaffected although they still experienced a slowdown in growth.
The crisis in East Asia deepened in late 1997 and had spread to the rest of the world by1998. Speculative attacks in other semi-peripheral countries—notably Brazil and the RussianFederation—caused economic difficulties and capital flight. On Wall Street, the Dow JonesIndustrial Average recorded its second and third biggest losses in August. Efforts by theindividual East Asian countries themselves, combined with assistance from the IMF andWorld Bank among others, helped bring the crisis under control to the extent that, byMarch 1999, the Dow closed above 10,000 for the first time in its history. The East Asianeconomies rebounded and enjoyed a growth rate of 4.1 percent in 1999 and close to 6percent by 2000.
Some of the factors that precipitated this crisis in East Asia, which have been targetedwith macroeconomic and structural policies, include national financial weakness(overvaluation of currencies pegged to the U.S. dollar, large volumes of short-term capitalinflows and exposure to short-term debt), inadequate regulatory oversight of financial andother businesses, high corporate indebtedness, failed management and overcapacity in keymanufacturing sectors. Governments in the countries that were most affected learned theirlessons. Since 1999 they have tended to manage their currencies more actively, restrictcapital movements, and shift from what Studwell (2013, 223) calls an “economics ofefficiency”—focused entirely on global competitiveness—to an “economics ofdevelopment”—oriented to education, nurturing of new industries, and competition.
6063 GEOGRAPHY WORLD ECON_PT_246x189 mm 22/01/2014 15:10 Page 240
by data on output, health and education. One way of reconciling these discordant inter pretationsis to argue that the post-colonial world economy has come to rest on increasingly diffusedglobal production but has lacked a similar attainment of a global spread of consumption. Therelatively low incomes available in LDC factories and plantations have put a cap on localpurchasing power even as local labor forces were made more efficient (through improved healthand education) and increased their output.
The problem with this reconciliation and the interpretations on which it is based is thatthey are geographically over-aggregated. The experience of different groups of LDCs has beendifferent, as suggested previously by the “grouping” of countries. On the one hand, some ofthe Latin American countries, for example, are relatively large and have relatively high levelsof per capita income (for example, Brazil, Argentina). Some of them did achieve considerableincome growth in the 1960s and 1970s on the basis of industrialization to satisfy local markets(import substitution). Most of them, however, were heavy importers of oil (Mexico andVenezuela were exceptional) and their industrial sectors were generally uncompetitive in worldmarkets. They were hit in the 1970s by the combination of oil price rises and their failure toswitch to export-oriented manufacturing in the boom years of the late 1960s. They had toborrow to ease the oil shock adjustment instead of paying for it with export earnings. Theyare now caught in a debt trap of accumulated loans compounded by the high interest ratesof the early 1980s, and the growth of trade barriers to the manufactures they export to theUnited States and Europe.
The Sub-Saharan African countries, on the other hand, are much poorer per capita on theaverage than Latin American or East Asian countries and their low level of output in all sectorsis undermined by their even faster rates of population increase. They are economies with smallindustrial sectors and a heavy dependence on primary commodities. As commodity pricesdropped in the 1980s (see Table 8.4), the Sub-Saharan African countries were forced to borrowto maintain minimal levels of consumption. Their debt burden is similar to that of the mostindebted Latin American countries. The consequence, as in Latin America, is a generalreduction in the standard of living but in contexts where it is already desperately low.
Finally, Asian countries have, on average, managed the best over the past 30 years. Theyhave been more successful in maintaining economic growth as a secular trend and adjustingto short-run cyclical downturns such as the world recessions of 1974–1975, 1979–1982,1989–1993, 2000–2002 and 2007 to the present day. The East Asian NIEs, the most dynamiceconomies in the region, have been able to expand their export of manufactures. They nowaccount for almost 60 percent of LDC total exports of manufactures. Although, like the LatinAmerican countries, they borrowed heavily in 1974–1975 to adjust to the oil price increases,their export performance has allowed them to keep relatively good borrowing terms and adjustmore easily to the massive interest rate increases of 1980–1981. Yet, they are not withouttheir own difficulties. Even before the Asian financial crisis, growth rates were slowingthroughout East Asia in the mid-1990s indicating that there may be limits to an export-basedstrategy of economic development when established markets stagnate or decline and growthis more reliant on cheap labor and high savings than on technological and organizationalinnovation. The rise of the East Asian NIEs, however, has altered the global development picturein fundamental ways. For one thing, their high rates of economic growth have translated intodeclining national poverty rates. Because of the numbers of people involved this can be madeto seem as if this is a trend across the entire periphery. In fact, poverty reduction has beenmuch less evident elsewhere. This means that there are increasingly significant differences withinthe periphery and between semi-peripheral and truly peripheral economies with respect topoverty and overall quality of life.
8. DYNAMICS OF INTERDEPENDENCE 241
6063 GEOGRAPHY WORLD ECON_PT_246x189 mm 22/01/2014 15:10 Page 241
8.6 ALTERNATIVE MODELS OF DEVELOPMENT
In the face of the failure of many LDCs to maintain, let alone increase, their production outputand the consumption levels of their populations, the models of development on which nationaldevelopment efforts have been based have been called into question. This coincides with the growing questioning of the American model of competitive capitalism (especially the lackof effective national trade and industrial policies) in the USA and the collapse of the Sovietcommand economy model in the (former) Soviet Union and Eastern Europe. Neither of these models can any longer be said to offer a simple way out of the “development impasse.”The spread of more liberal and open trading policies in the 1980s, 1990s, and 2000s did produce benefits for some countries, particularly the NIEs, but these have been strictly limitedgeographically. The open economy/liberal model is undoubtedly still dominant at the moment;sponsored by the main international economic institutions (such as the IMF, WTO, and WorldBank) as well as by the TNCs and major global banks. But after the global financial crisis of2007 onwards, it too is now in question within the developed core as much as elsewhere.
It is in this context that new models have appeared to replace previous ones. Perhaps thethree most important ones today are based on (1) a synthesis of liberal reforms and socialdemocracy as practiced in parts of Europe, particularly in Sweden, (2) the Chinese experimentin globalization since 1978, and, to a much more limited extent, (3) Islamic economic practices.Each of these alternative models is noted briefly.
The European experience is seen as relevant because it combines both a focus on economicgrowth with an emphasis on reducing income inequalities and social exclusion. The problemis that historical experience suggests that both rarely take place at the same time. It has beenonly with considerable struggle that subordinated groups have been able to wrest variousprograms and social rights from their national governments often in the face of resistance fromdominant groups such as local and foreign capitalists. The great Chinese experiment since1978 is also unique in that it combines a government regulated macro-economy with con -siderable decentralization of power over industrial and financial affairs to a range of othergroups including domestic capitalists, local governments, and TNCs. Finally, practices andbeliefs drawn from the Islamic religion have become important in southwest Asia, North Africa,and other parts of Asia (for example, Indonesia). The prohibition of usury or “excessive” interestcharged on monetary loans is one of the more concrete and obviously appealing features ofIslamic economics. But, as yet, no system of political economy based on Islamic principles hasbeen established in any country (including Iran). The conclusion of Katouzian (1983: 164),one of the leading authorities on Islamic economics, seems appropriate:
While one may empathize with the desire to construct an indigenous ideology that can be identifiedwith the Islamic beliefs and practices of its advocates particularly in view of the havoc caused byselective application of Western ideas under the late Shah [of Iran], it is no more to be expectedthat Islam can provide a comprehensive economic system than that the latter could be based onChristianity, Judaism, or any other traditional religio-political system.
In practice, what is happening is more by way of different adaptations to a dominant liberalcapitalism than the adoption of full-blooded alternatives to it. If some places have seen a full-scale adoption of a market-access capitalism in which barriers to the flow of goods and capitalhave been radically reduced, others have seen the continued or renewed imposition of stateregulation. Some places with heavy state regulation have been able to successfully incorporatethemselves into global trade and capital circuits primarily through the export of manufacturedgoods and services (see Table 8.5). These are usually populous states such as India and China
SPATIAL TRANSFORMATION OF CORE AND PERIPHERY242
6063 GEOGRAPHY WORLD ECON_PT_246x189 mm 22/01/2014 15:10 Page 242
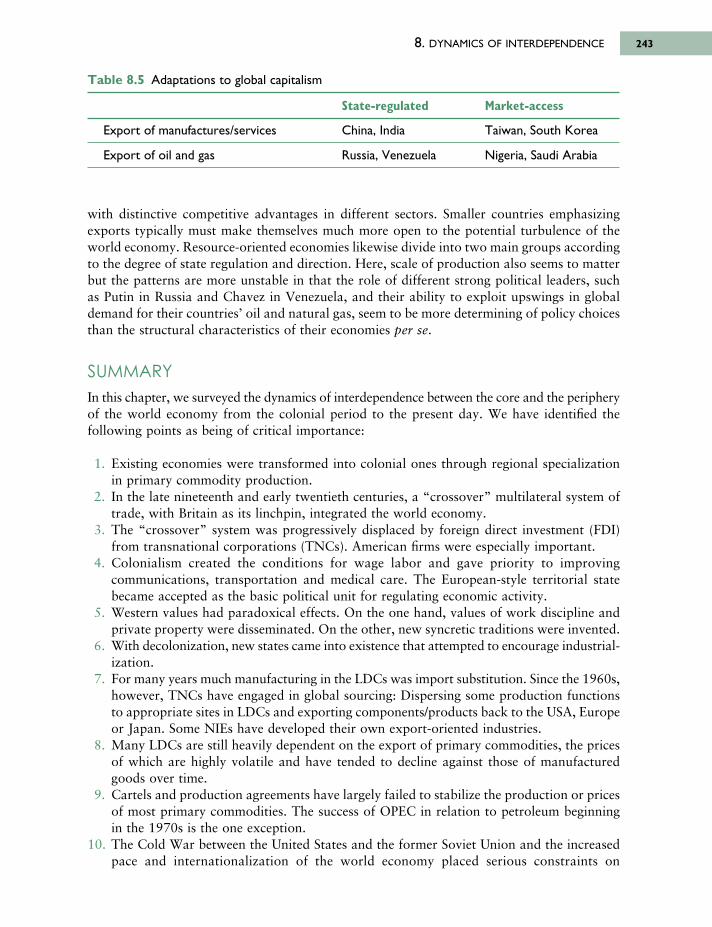
with distinctive competitive advantages in different sectors. Smaller countries emphasizingexports typically must make themselves much more open to the potential turbulence of theworld economy. Resource-oriented economies likewise divide into two main groups accordingto the degree of state regulation and direction. Here, scale of production also seems to matterbut the patterns are more unstable in that the role of different strong political leaders, suchas Putin in Russia and Chavez in Venezuela, and their ability to exploit upswings in globaldemand for their countries’ oil and natural gas, seem to be more determining of policy choicesthan the structural characteristics of their economies per se.
SUMMARYIn this chapter, we surveyed the dynamics of interdependence between the core and the peripheryof the world economy from the colonial period to the present day. We have identified thefollowing points as being of critical importance:
1. Existing economies were transformed into colonial ones through regional specializationin primary commodity production.
2. In the late nineteenth and early twentieth centuries, a “crossover” multilateral system oftrade, with Britain as its linchpin, integrated the world economy.
3. The “crossover” system was progressively displaced by foreign direct investment (FDI)from transnational corporations (TNCs). American firms were especially important.
4. Colonialism created the conditions for wage labor and gave priority to improvingcommunications, transportation and medical care. The European-style territorial statebecame accepted as the basic political unit for regulating economic activity.
5. Western values had paradoxical effects. On the one hand, values of work discipline andprivate property were disseminated. On the other, new syncretic traditions were invented.
6. With decolonization, new states came into existence that attempted to encourage industrial-ization.
7. For many years much manufacturing in the LDCs was import substitution. Since the 1960s,however, TNCs have engaged in global sourcing: Dispersing some production functionsto appropriate sites in LDCs and exporting components/products back to the USA, Europeor Japan. Some NIEs have developed their own export-oriented industries.
8. Many LDCs are still heavily dependent on the export of primary commodities, the pricesof which are highly volatile and have tended to decline against those of manufacturedgoods over time.
9. Cartels and production agreements have largely failed to stabilize the production or pricesof most primary commodities. The success of OPEC in relation to petroleum beginningin the 1970s is the one exception.
10. The Cold War between the United States and the former Soviet Union and the increasedpace and internationalization of the world economy placed serious constraints on
8. DYNAMICS OF INTERDEPENDENCE 243
Table 8.5 Adaptations to global capitalism
State-regulated Market-access
Export of manufactures/services China, India Taiwan, South Korea
Export of oil and gas Russia, Venezuela Nigeria, Saudi Arabia
6063 GEOGRAPHY WORLD ECON_PT_246x189 mm 22/01/2014 15:10 Page 243
development efforts. The global debt crisis of the early 1980s has been another especiallyimportant constraint.
11. The integration of production within the world economy has not been matched by anintegration of consumption. However, different world regions of the periphery have haddifferent experiences in this regard: The Asian countries (especially the East Asian NIEs)have been most successful, the countries of Sub-Saharan Africa least so.
12. Alternative models of development, from Europe, China and Islamic traditions, have arisento challenge the dominant U.S./Soviet ones because of the failure of the dominant ones to manage social inequalities or generate sustainable economic development. But moretypical in practice have been adaptations to the dominant liberal capitalism of theglobalizing world economy involving greater or lesser degrees of state intervention versusmore whole-hearted acceptance of market-access policies.
The next three chapters take off from this general perspective on the transformation of theperiphery and semi-periphery to examine contemporary patterns of agriculture, industry andservices, paying special attention to the changing relationships between core and peripheryoutlined in Chapters 2 and 3.
KEY SOURCES AND SUGGESTED READINGAmsden, A., 2007. Escape from Empire: The developing world’s journey through heaven and hell.
Cambridge, MA: MIT Press.Banerjee, A.V., Bénabou, R., and Mookherjee, D. (eds.), 2007. Understanding Poverty. Oxford: Oxford
University Press.Cook, P. and Kirkpatrick, C., 1997. Globalization, Regionalization and Third World Development,
Regional Studies 31, 55–66.Corbridge, S., 1993. Debt and Development. Oxford: Blackwell.Diakosavvas, D. and Scandizzo, P., 1991. Trends in the Terms of Trade of Primary Commodities,
1900–1982: The controversy and its origins, Economic Development and Cultural Change 39,231–264.
Fiala, R. and Kamens, D., 1986. Urban Growth and World Polity in the Nineteenth and TwentiethCenturies: A research agenda, Studies in Comparative International Development 21, 23–35.
Grant, R.J. and Agnew, J.A., 1996. Representing Africa: The geography of Africa in world trade,1960–1992, Annals of the Association of American Geographers 86, 729–744.
Powell, A., 1991. Commodity and Developing Country Terms of Trade: What does the long run show?,Economic Journal 101, 1485–1496.
Sender, J. and Smith, S., 1986. The Development of Capitalism in Africa. London: Methuen.Studwell, J., 2013. How Asia Works: Success and failure in the world’s most dynamic region. London:
Profile Books.Wachtel, H.M., 1987. Currency without a Country: The global funny money game, The Nation 245,
26 December, 784–790.Weinthal, E. and Luong, P.J., 2006. Combating the Resource Curse: An alternative solution to managing
mineral wealth, Perspectives on Politics 4(1), 35–53.
SPATIAL TRANSFORMATION OF CORE AND PERIPHERY244
6063 GEOGRAPHY WORLD ECON_PT_246x189 mm 22/01/2014 15:10 Page 244
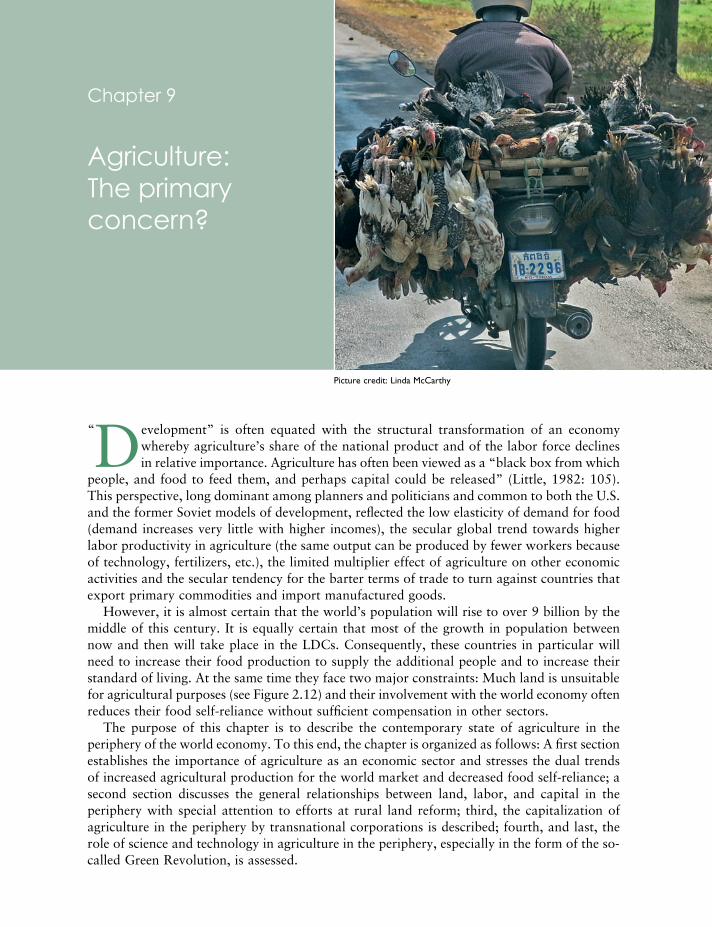
Development” is often equated with the structural transformation of an economywhereby agriculture’s share of the national product and of the labor force declinesin relative importance. Agriculture has often been viewed as a “black box from which
people, and food to feed them, and perhaps capital could be released” (Little, 1982: 105).This perspective, long dominant among planners and politicians and common to both the U.S.and the former Soviet models of development, reflected the low elasticity of demand for food(demand increases very little with higher incomes), the secular global trend towards higherlabor productivity in agriculture (the same output can be produced by fewer workers becauseof technology, fertilizers, etc.), the limited multiplier effect of agriculture on other economicactivities and the secular tendency for the barter terms of trade to turn against countries thatexport primary commodities and import manufactured goods.
However, it is almost certain that the world’s population will rise to over 9 billion by themiddle of this century. It is equally certain that most of the growth in population betweennow and then will take place in the LDCs. Consequently, these countries in particular willneed to increase their food production to supply the additional people and to increase theirstandard of living. At the same time they face two major constraints: Much land is unsuitablefor agricultural purposes (see Figure 2.12) and their involvement with the world economy oftenreduces their food self-reliance without sufficient compensation in other sectors.
The purpose of this chapter is to describe the contemporary state of agriculture in theperiphery of the world economy. To this end, the chapter is organized as follows: A first sectionestablishes the importance of agriculture as an economic sector and stresses the dual trendsof increased agricultural production for the world market and decreased food self-reliance; asecond section discusses the general relationships between land, labor, and capital in theperiphery with special attention to efforts at rural land reform; third, the capitalization ofagriculture in the periphery by transnational corporations is described; fourth, and last, therole of science and technology in agriculture in the periphery, especially in the form of the so-called Green Revolution, is assessed.
Picture credit: Linda McCarthy
Chapter 9
Agriculture: The primaryconcern?
“
6063 GEOGRAPHY WORLD ECON_PT_246x189 mm 22/01/2014 15:10 Page 245
9.1 AGRICULTURE IN THE PERIPHERYThe countries of the periphery have all been significantly involved with modern commercialfarming since the beginning of western colonization in the sixteenth century. But subsistenceand production for local markets have remained of great, if decreasing, importance. Malassis(1975) identifies four types of agricultural system in the periphery: (1) the “customary” farminvolving common ownership of land for both cultivation and grazing; (2) the “feudal or semi-feudal” estate, hacienda and latifundia; (3) “peasant agriculture,” including minifundia (small,subsistence farms), commercial farms, and share cropping; and (4) capitalist plantation ormechanized agriculture based on wage labor. These four types of farm organization producethree types of commodity: (a) commercial foods, primarily cereals for the domestic market;(b) subsistence foods, primarily for personal use; and (c) export crops, where the major marketis overseas. The historical trend in agriculture in most countries of the periphery has beenfrom (1) and (2) to (3) and, especially, (4) in farm organization and from (a) and (b) to (c) intypes of agricultural commodity.
However, the three continents of the periphery—Africa, Asia and Latin America—differ interms of agricultural organization and performance. Above all, Sub-Saharan Africa is, or hasbeen until recently, abundant in land and sparse in population; Asia is largely short of landrelative to population; and Latin America contains both areas with large populations and areaswith few inhabitants. Agriculture is also of much greater relative importance in Sub-SaharanAfrica and Asia than in Latin America, both in terms of employment and contribution tonational product.
WOMEN’S WORK
It is also important to recognize that in agriculture in the LDCs it is the women rather thanthe men who are overwhelmingly more important as the source of workers. Indeed, the genderdimension is not a secondary consequence of variations in agricultural organization but “a fundamental organizing principle of labor use” (Joekes, 1987: 63). Regional differencesare apparent, however, indicating the contingencies of resource endowment and carryingcapacity. More women are involved in agriculture in Africa, relatively speaking, than elsewhere.In 2000 the UN FAO estimated that at least 75 percent of all women in the labor force inSub-Saharan Africa were involved in agriculture, compared to 68 percent in India, 70 percentin China, 62 percent in other low-income Asian countries (such as Bangladesh and Cambodia)and 35 percent in middle-income Asian countries (such as Malaysia and South Korea). In LatinAmerica, the comparable figure is a very low 10 percent. This reflects the greater degree ofmechanization (and export crop orientation) in Latin American agriculture and higher levelsof female rural to urban migration compared to other regions. Official figures may capturethe female day laborers on larger commercial farms but certainly miss many of the subsistencefarming activities carried out predominantly by women. Labor force participation data usuallyinvolve very narrow definitions of agricultural activity focused on land cultivation and large-scale livestock keeping. While many of the men migrate to find work, they leave behind thewomen, whose largely unrecorded role in agriculture includes tending to the fields and theanimals. Women also do most of the domestic work: Processing food crops, preparing meals,fetching water, collecting fuel wood, and caring for the children, elderly and sick (an increasingburden in the face of the HIV/AIDS pandemic):
SPATIAL TRANSFORMATION OF CORE AND PERIPHERY246
6063 GEOGRAPHY WORLD ECON_PT_246x189 mm 22/01/2014 15:10 Page 246
However, although women have the primary responsibility for managing resources, they usuallydo not have control. National law or local customs often deny women the right to secure title orinherit land, which means they have no collateral to raise credit and improve their conditions.
(UNFPA, 2001: 7)
In a few communities, government agencies and nonprofit organizations that haverecognized this untapped economic potential have begun to provide women with information,education and access to credit.
FORMS OF AGRICULTURAL ORGANIZATION
Forms of agricultural employment and organization also tend to differ among the regions ofthe world. Mechanized agriculture and export crops have become of greatest importance inLatin America. Green Revolution agriculture has become most widespread in producing wageand peasant foods in lowland Asia with pockets in Latin America and North Africa. “Resource-poor” agriculture, producing a range of crops, predominates in Sub-Saharan Africa and areasof poor soils and drainage elsewhere. Production differences reflect these organizational andendowment differences.
While per capita food production in the periphery has not matched that of the core, andin many cases has not kept up with population increases, spectacular growth in the productionof specific crops for export to the core was characteristic of the 1970s and 1980s in particular.In Latin America by the late 1970s, commercial agriculture, centered primarily in the largefarm sector, was estimated to account for half of all agricultural production, nearly one-thirdof the cultivated area and one-fifth of the entire workforce. For example, sugar productionincreased by over 200 percent in El Salvador, Guatemala, and Honduras between 1965 and1977. The production of sugar in these three countries has continued to increase since then,by over 100 percent. Beef production in the Dominican Republic grew at 7.6 percent per annumbetween 1970 and 1979. It continued to grow at 4.6 percent annually throughout the 1990s.Soybean production, relatively unimportant in Brazil before 1970 at 1.5 million metric tons,rose to almost 26 million metric tons per annum by 2010. The expansion of export productionand regional specialization has been most characteristic of agriculture in Latin America. InSub-Saharan Africa, however, export crops have failed to maintain global market shares evenas total agricultural production increased. This reflects both declining productivity in the exportsector and government attempts to direct investment into industrialization rather thanagricultural commodities. Food production has been dismal, particularly in the context of rapidpopulation increase. In Asia, both productivity and production have increased enormouslybecause of fertilizers and the application of new technologies, but most growth has been incereals (especially rice and wheat) production rather than “special” export crops such as thoseof growing importance in Latin America (for example, fruits and beef). The problems for theAsian countries are their high land–population ratios and the competition they face fromagriculture in the United States and Europe in the crops (such as wheat and rice) in whichtheir growth has been concentrated. U.S., EU and Japanese subsidies and market protectionfor agricultural production deprive Asian (and other LDC producers such as Argentina) ofboth higher prices and international markets. Lower production of cereal crops in the core ofthe world economy would produce higher world prices (through a decrease in the amountproduced) and greater access of LDC producers to DC markets.
9. AGRICULTURE: THE PRIMARY CONCERN 247
6063 GEOGRAPHY WORLD ECON_PT_246x189 mm 22/01/2014 15:10 Page 247
SPATIAL TRANSFORMATION OF CORE AND PERIPHERY248
PROBLEMS
Each of the three major regions of the periphery/semi-periphery faces distinctive problems withrespect to its agriculture. For Latin America, it is the expansion of export crops at the expenseof local food crops. As a consequence, food imports are often necessary. For Sub-SaharanAfrica, it is the total deterioration of agriculture in the face of population pressure on marginalland, low productivity, government bias against investment in agriculture and fluctuations inexport earnings. Food imports are now an absolute necessity. For Asia, production of cerealshas increased greatly but prices have been low because of global gluts. So increased agriculturalproduction has not generated the capital necessary for investment in other sectors, such asindustry. When prices increase, local populations must pay the increase or substitute othercereals that are imported, more often than not, from Europe or the United States. Between
Box 9.1 The coffee commodity chain
Coffee is the world’s second most valuable traded commodity, behind oil. There are about25 million farmers and coffee workers in over 50 countries producing coffee. Coffee washistorically developed as a cash crop in colonial economies, planted by peasants or wagelaborers on large plantations for sale in the core countries. It is currently the largest foodimport of the United States. The coffee commodity chain today involves a string ofproducers, middlemen, exporters, importers, roasters and retailers before reaching theconsumer (see Chapter 1). Global consumption has increased tremendously over the past20 years, owing much to the Starbucks® phenomenon: The spread of coffee shop franchisesof this or other similar brands all over the world. Around 70 percent of world production isof Arabica beans, used for higher grade and specialty coffees, with 80 percent coming fromLatin America. The rest is Robusta coffee, grown mainly in Africa and Asia. Typically, coffeefarmers and workers receive extremely low wages relative to the final retail price of coffee.This has encouraged the development of the fair trade in coffee movement to try toimprove working conditions and wages for producers (see Box 9.2). Most small farmers sellto middlemen, while large estate owners usually process and sell their crop directlyoverseas at prices fixed by the New York or other international coffee exchanges. Mostimporters purchase green coffee from established exporters and estate owners in producingcountries such as Brazil and Colombia. They then hold the stocks selling gradually toroasters to both maintain the price and to control supply. Importers, therefore, are the keyagents in the coffee commodity chain. Roasters, of whom there are around 1,100 in theUnited States today, usually have a set of recipes and sell to large retailers under suchbrands as Maxwell House (Kraft) and Sanka (Philip Morris), Folgers and Millstone (Procter &Gamble), and Nestlé. Although these large roasters account for 60 percent of green coffeevolume in the USA, some roasters produce as few as 500 bags a year for the specialty coffeemarket of high-end coffee shops. With the highest profit margins in the value chain, roastersare a key link, therefore, on the road from producers to consumers. Retailers sometimesnow roast their own beans but, by and large, they sell either beans or coffee to the generalpublic. Supermarkets and other shops account for about 60 percent of retail sales withcoffee shops making up the rest. Other foodstuffs and industrial raw materials follow similarcommodity chains geographically linking together producers and consumers living andworking in different places.
6063 GEOGRAPHY WORLD ECON_PT_246x189 mm 22/01/2014 15:10 Page 248
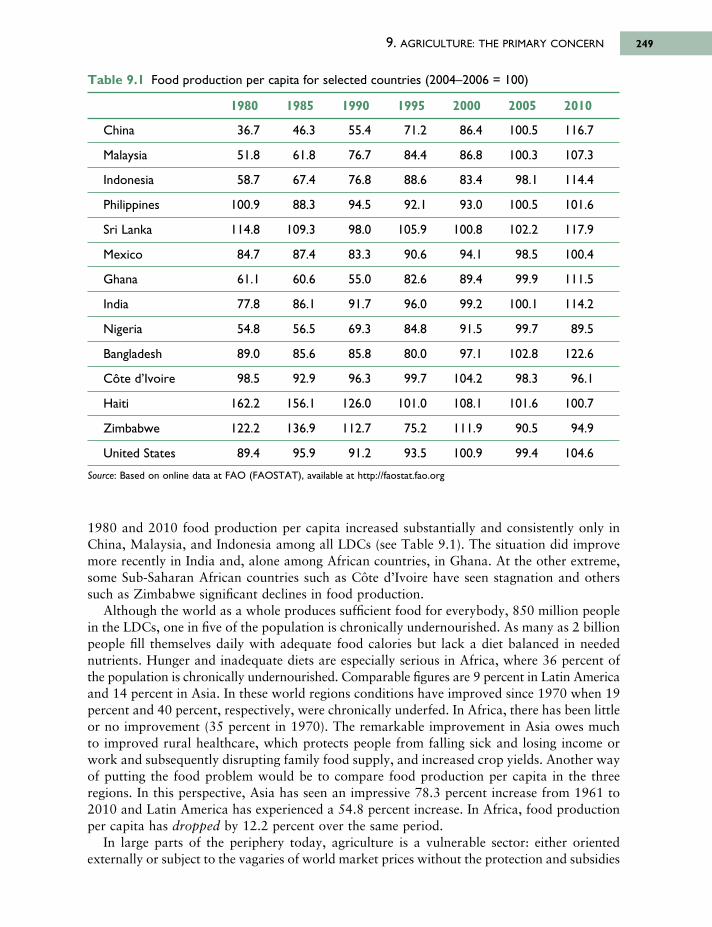
1980 and 2010 food production per capita increased substantially and consistently only inChina, Malaysia, and Indonesia among all LDCs (see Table 9.1). The situation did improvemore recently in India and, alone among African countries, in Ghana. At the other extreme,some Sub-Saharan African countries such as Côte d’Ivoire have seen stagnation and otherssuch as Zimbabwe significant declines in food production.
Although the world as a whole produces sufficient food for everybody, 850 million peoplein the LDCs, one in five of the population is chronically undernourished. As many as 2 billionpeople fill themselves daily with adequate food calories but lack a diet balanced in needednutrients. Hunger and inadequate diets are especially serious in Africa, where 36 percent ofthe population is chronically undernourished. Comparable figures are 9 percent in Latin Americaand 14 percent in Asia. In these world regions conditions have improved since 1970 when 19percent and 40 percent, respectively, were chronically underfed. In Africa, there has been littleor no improvement (35 percent in 1970). The remarkable improvement in Asia owes muchto improved rural healthcare, which protects people from falling sick and losing income orwork and subsequently disrupting family food supply, and increased crop yields. Another wayof putting the food problem would be to compare food production per capita in the threeregions. In this perspective, Asia has seen an impressive 78.3 percent increase from 1961 to2010 and Latin America has experienced a 54.8 percent increase. In Africa, food productionper capita has dropped by 12.2 percent over the same period.
In large parts of the periphery today, agriculture is a vulnerable sector: either orientedexternally or subject to the vagaries of world market prices without the protection and subsidies
9. AGRICULTURE: THE PRIMARY CONCERN 249
Table 9.1 Food production per capita for selected countries (2004–2006 = 100)
1980 1985 1990 1995 2000 2005 2010
China 36.7 46.3 55.4 71.2 86.4 100.5 116.7
Malaysia 51.8 61.8 76.7 84.4 86.8 100.3 107.3
Indonesia 58.7 67.4 76.8 88.6 83.4 98.1 114.4
Philippines 100.9 88.3 94.5 92.1 93.0 100.5 101.6
Sri Lanka 114.8 109.3 98.0 105.9 100.8 102.2 117.9
Mexico 84.7 87.4 83.3 90.6 94.1 98.5 100.4
Ghana 61.1 60.6 55.0 82.6 89.4 99.9 111.5
India 77.8 86.1 91.7 96.0 99.2 100.1 114.2
Nigeria 54.8 56.5 69.3 84.8 91.5 99.7 89.5
Bangladesh 89.0 85.6 85.8 80.0 97.1 102.8 122.6
Côte d’Ivoire 98.5 92.9 96.3 99.7 104.2 98.3 96.1
Haiti 162.2 156.1 126.0 101.0 108.1 101.6 100.7
Zimbabwe 122.2 136.9 112.7 75.2 111.9 90.5 94.9
United States 89.4 95.9 91.2 93.5 100.9 99.4 104.6
Source: Based on online data at FAO (FAOSTAT), available at http://faostat.fao.org
6063 GEOGRAPHY WORLD ECON_PT_246x189 mm 22/01/2014 15:10 Page 249
SPATIAL TRANSFORMATION OF CORE AND PERIPHERY250
Box 9.2 From free trade to fair trade?
Developed countries such as the United States and those in the European Union (EU)continue to provide billions of dollars in agricultural subsidies to their own growers whilelimiting access to their markets by poor farmers in the LDCs. Oxfam developed an index ofthese double standards using ten measures of trade policies in the DCs, including averagetariffs, the size of tariffs on agricultural imports, and restrictions on imports from the LDCs.The index scores for the EU and the United States were at the top of the list of DCs thatcall for free trade but limit access by the LDCs to their markets. Compounding this situationhas been the volatility in world prices during the last few decades for the sale of primaryproducts such as tropical beverages and food that farmers in LDCs depend on for income.
Believing that aid alone is not the answer to poverty in the LDCs, Oxfam and other aidorganizations have worked to establish a fair trade model. Seeking to set up alternativetrading links between producers and consumers, people such as Michael Barratt Brownfounded organizations such as Twin Trading. Influenced by ideas of sustainable development,unequal exchange and dependency, Barratt Brown, in his seminal book, Fair Trade, pointedto the deteriorating trading position of many LDCs due to the decline in basic commodityprices for their exported food and raw materials relative to the prices of their importedmanufactured goods.
The fair trade model recognizes the weak bargaining position of many small producers atthe beginning of the commodity chains that underpin the world economy. This model is anattempt directly to connect consumers in the DCs with producers in the LDCs through anetwork that includes features such as long-term trading contracts that offer price stabilityfor farmers. Fair Trade Labeling Organizations International (FLO), an umbrella organizationof three producer networks, 19 labeling groups, and three marketing organizations,maintains the standards for the fair trade label and certifies cooperatives that meet thesestandards. Goods displaying the fair trade label are sold with a guaranteed minimum pricethat includes a social premium paid by the consumer to the democratically organizedcooperatives to be spent on infrastructure investments—processing facilities, schools andhospitals—for the benefit of members. Fair trade goods meet environmental sustainabilitystandards and ILO conventions covering labor practices.
The fair trade label applies to a variety of goods, including coffee, tea, cocoa, bananas, andhoney. The first fair trade coffee was imported in 1973 into the Netherlands from a small-farmer cooperative in Guatemala. In 2003 the United States overtook the Netherlands asthe largest destination for fair trade coffee. Today, over 250 coffee cooperativesrepresenting more than 700,000 farmers across more than two dozen countries in LatinAmerica, Africa, and Asia are certified by the FLO. Annual sales of all fair trade products aregrowing at double-digit rates and are estimated to be worth well over US$1 billion. At thesame time, however, the total value of fair trade products—accounting for 0.5–5.0 percentof all sales in their product categories in Europe, the United States, and Canada—is minor inrelation to the overall flows of international trade.
Gavin Fridell identified three perspectives on the fair trade network. The“decommodification” perspective incorporates notions of “ethical trade” and depicts fairtrade as a challenge to the commodification of goods under global capitalism. Jeff Popke seesthe ethical trade movement as the reincarnation of the traditional Marxist concept of“defetishizing” the commodity in order to expose its underlying unequal social relations of
6063 GEOGRAPHY WORLD ECON_PT_246x189 mm 22/01/2014 15:10 Page 250
9. AGRICULTURE: THE PRIMARY CONCERN 251
enjoyed by agriculture in the core. Yet it is absolutely vital. Vast numbers of people are stillemployed in or are immediately dependent on agriculture. And, whatever the model ofeconomic development adopted, any hope of improving living standards in general dependson increasing agricultural production.
9.2 LAND, LABOR, AND CAPITALAgriculture in the contemporary periphery rests on a foundation of agrarian history and recentchanges can only be understood in this context. Central to agrarian history the world overhas been the impact of market forces on landholding patterns and the structure of rural socialrelationships. Although rural areas are often characterized as static and traditional, thehistorical record shows frequent changes in agricultural practices and labor relationships inresponse to global and domestic political–economic conditions. But some features of land -holding systems and rural life have persisted from the period of incorporation into the worldeconomy. In this section the mix of “old” and “new” in the agricultural organization of differentparts of the contemporary periphery (Latin America, Sub-Saharan Africa, and Asia) will beexamined.
LATIN AMERICA
In Latin America, conquest and colonial domination created patterns of subsistence andcommercial agriculture based on large landholdings. After independence, this characteristic
production. Although challenging the core values of global capitalism—competition, growthand profit maximization—this approach has limited potential to change the global tradingsystem because it depends completely on revealing the conditions of global inequity toconsumers in the DCs.
The “alternative” perspective offers a rights-based approach to development that “makestrade fair” as a replacement for free trade and the consequent dominance of DCs andTNCs. This perspective not only highlights the plight of farmers in the LDCs, but alsoconfronts organizations such as the WTO about the structural causes of poverty, such asthe trade barriers and subsidies of the DCs. The main criticism of this approach, however, isthat its successes have only been possible because it has remained part of the dominantparadigm, and as such is limited by the constraints of consumer demand, limits on the priceof fair trade goods imposed by the market, and the growth potential of fair trade nichemarkets.
As a result, the “shaped-advantage” perspective is seen as most accurately reflecting theoverall impact of fair trade so far. This more moderate approach seeks to help poor farmersto improve their position in the existing global market through the help of nongovernmentalorganizations (NGOs). The more market-oriented approach of this “microeconomictinkering” is seen as accounting for its recent success in assisting certain groups of poorfarmers to enter the global market on better terms. Of concern, however, are the dangersof “mainstreaming” that require the farmers to deal with TNCs such as Starbucks® in orderto get fair trade products more widely into the hands of DC consumers and the lack of anexplicit component that directly confronts the structural causes of poverty.
6063 GEOGRAPHY WORLD ECON_PT_246x189 mm 22/01/2014 15:10 Page 251
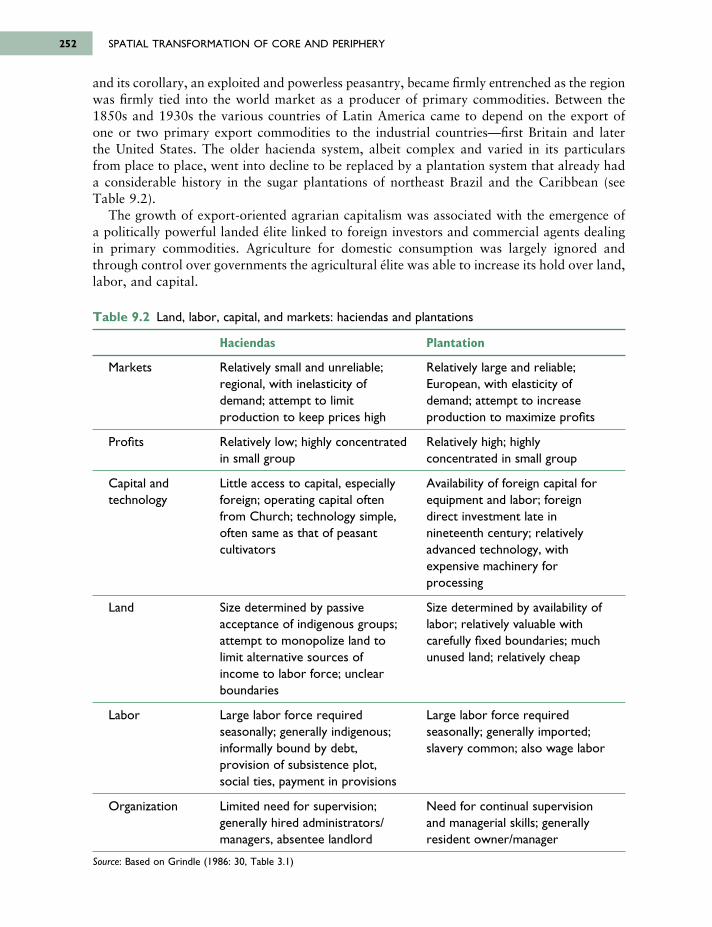
and its corollary, an exploited and powerless peasantry, became firmly entrenched as the regionwas firmly tied into the world market as a producer of primary commodities. Between the1850s and 1930s the various countries of Latin America came to depend on the export of one or two primary export commodities to the industrial countries—first Britain and later the United States. The older hacienda system, albeit complex and varied in its particulars from place to place, went into decline to be replaced by a plantation system that already hada considerable history in the sugar plantations of northeast Brazil and the Caribbean (see Table 9.2).
The growth of export-oriented agrarian capitalism was associated with the emergence ofa politically powerful landed élite linked to foreign investors and commercial agents dealingin primary commodities. Agriculture for domestic consumption was largely ignored andthrough control over governments the agricultural élite was able to increase its hold over land,labor, and capital.
SPATIAL TRANSFORMATION OF CORE AND PERIPHERY252
Table 9.2 Land, labor, capital, and markets: haciendas and plantations
Haciendas Plantation
Markets Relatively small and unreliable; Relatively large and reliable; regional, with inelasticity of European, with elasticity of demand; attempt to limit demand; attempt to increase production to keep prices high production to maximize profits
Profits Relatively low; highly concentrated Relatively high; highly in small group concentrated in small group
Capital and Little access to capital, especially Availability of foreign capital for technology foreign; operating capital often equipment and labor; foreign
from Church; technology simple, direct investment late in often same as that of peasant nineteenth century; relatively cultivators advanced technology, with
expensive machinery for processing
Land Size determined by passive Size determined by availability of acceptance of indigenous groups; labor; relatively valuable with attempt to monopolize land to carefully fixed boundaries; much limit alternative sources of unused land; relatively cheapincome to labor force; unclear boundaries
Labor Large labor force required Large labor force required seasonally; generally indigenous; seasonally; generally imported; informally bound by debt, slavery common; also wage laborprovision of subsistence plot, social ties, payment in provisions
Organization Limited need for supervision; Need for continual supervision generally hired administrators/ and managerial skills; generally managers, absentee landlord resident owner/manager
Source: Based on Grindle (1986: 30, Table 3.1)
6063 GEOGRAPHY WORLD ECON_PT_246x189 mm 22/01/2014 15:10 Page 252
The concentration of landholding and the marginalization of peasant agriculture did notoccur without resistance. Agrarian uprisings and social banditry were widespread. In Mexicothe 1910 uprising was a major impetus to the revolution; strikes were extremely common inthe corporate plantations of coastal Peru in the period 1912–1928; in Colombia, rural violenceby agrarian tenant syndicates directed against commercial coffee producers lasted well intothe 1930s. The 1930s also was a period of rural unrest in the Brazilian northeast and in ElSalvador among dispossessed peasants and unemployed plantation workers.
When the world economy collapsed in the Great Depression of the 1930s so too did export-oriented agriculture. This spurred the emergence of active nationalists, often in the military,who wanted to increase industrialization and diminish reliance on the export of primarycommodities. Between 1930 and 1934 there were 12 forcible takeovers of power—fromArgentina to Peru to El Salvador. Argentina, Brazil, Chile, Colombia, Mexico, and Uruguayall instituted import substitution industrial strategies. These led to a massive movement ofpeople off the land. For the region as a whole, in 1920, only 14 percent of the populationlived in urban areas, but by 1940 the proportion had risen to 20 percent. In Argentina, Chile,and Uruguay, urban percentages reached 35–45 percent of the population. One majorconsequence of this was a decline in the grip of the landholding élite over national politics insome countries as urban professional and working classes grew in size and influence.
This change, however, can be exaggerated. Many countries continued to rely on the exportof one or few primary commodities—the Central American and Caribbean countries, but alsoArgentina, Colombia, and Chile—and rural land remained concentrated in the hands of thelanded élite. What was different was the emergence of nationalist and populist movementscommitted to industrialization rather than export agriculture.
Pursuing policies of import substitution had important effects on agriculture. For one,manufacturing surpassed agriculture in its contribution to gross domestic product in a numberof countries (Argentina, Brazil, Chile, Mexico, Uruguay, and Venezuela) in the 1940s. Muchof the new capacity was concentrated in or near the capital cities of the states that were itsmajor sponsors (Buenos Aires, Rio de Janeiro, Santiago, etc.).
Industrialization required a “draining” of agriculture for resources (cheap food, rawmaterials) and capital (foreign exchange, taxation). As a consequence, a premium was placedon efficiency in agricultural production. This was thought to require large holdings, the spreadof technological innovation and capitalization (heavy capital investment). Between 1940 and1960 there was a massive migration of people from the countryside to the cities as aconsequence of mechanization and the expansion of large landholdings at the expense of smalltenants and proprietors.
In the 1960s import substitution became increasingly expensive as the “easy phase”emphasizing light consumer goods was played out and the prodigious expense of moving intoheavier capital goods became apparent. In a process that accelerated during the 1970s, adevelopment model based on export promotion slowly displaced import substitution.According to this model, agriculture had been neglected and, although no substitute forindustrialization, more efficient production of domestic food crops and increased agriculturalexports were important in both maintaining political stability and obtaining foreign exchange.After 1965 public investment in rural areas and agriculture increased in a large number ofLatin American countries.
Government policies have discriminated heavily in favor of the larger landowners. Thegeographical distribution of official credit, research and extension, infrastructure, mechan izationand Green Revolution inputs reflects the geography of landholding. In Peru, for example, abouthalf the credit supplied by the Agricultural Development Bank between 1940 and 1965 went
9. AGRICULTURE: THE PRIMARY CONCERN 253
6063 GEOGRAPHY WORLD ECON_PT_246x189 mm 22/01/2014 15:10 Page 253
to cotton growers, who were among the wealthiest coastal agricultural exporters. Food crop producers—largely peasants—were mainly ignored by the bank. In Mexico in 1970,mechanization was used on 25.7 percent of the crop area of farms of more than five hectaresbut was used on only 4.3 percent of the crop area of farms that were under five hectares insize. In Brazil, all government policies have tended to reinforce the emphasis on commercialagriculture in the south and east regions at the expense of the northeast and small-scaleproducers everywhere.
This is not to say that large-scale capitalist agriculture has completely displaced peasantproduction. Far from it. A large section of the agricultural labor force is still “part-peasant”in that it supplements its wage earnings with the produce of its often less-than-subsistenceplots. This serves to sustain capitalist agriculture through reducing the costs of reproducinga labor force. In many parts of Latin America, therefore, large-scale capitalist agriculture andsmall-scale peasant production still coexist uneasily. The past is still present.
SUB-SAHARAN AFRICA
In Sub-Saharan Africa, unlike Latin America (or Europe), access to labor not land was alwaysthe basis of economic and political power. From 1830 to 1930 agriculture in Sub-SaharanAfrica underwent an incredible expansion in the form of small-scale commercial farming. Somecommercial farming had existed prior to this period, for example in the Hausa-Fulani andMandinka states of northwest Africa, but the introduction of new crops and the expansionof existing ones into previously uncultivated areas increased the scale and geographicaldistribution of commercial agriculture. Of special importance were such crops as cocoa, cotton,coffee, groundnuts, and oil palm, which were grown mainly for export markets. They spreadalong with European traders, the introduction of foreign capital, the shifting objectives of nativefarmers and traders, and, finally, colonial rule. This was the “cash crop revolution” (Tosh,1980) that brought Africa into the world economy and capitalism into Africa.
Colonial rule involved massive intervention in existing agriculture through forced labor andtaxation. Taxation, in particular, provided a fresh stimulus to cash cropping. In some partsof Africa, especially the east and south, taxation also encouraged labor migration to mines,plantations, and industries established by European settlers. In West Africa, however, labormigration pre-dated colonial rule. It was of a seasonal nature and involved the integration offarming in the interior with migration to more fertile but labor-deficient coastal areas. In WestAfrica, cash cropping by small-scale farmers and long-distance labor migration at harvest timewere indigenous phenomena that increased in intensity after the onset of colonial rule.Elsewhere, cash cropping and labor migration were relatively novel and related much moreto either European settlement (as in South Africa, Zimbabwe, or Kenya) or European initiativesin mining and plantation agriculture (as in Zambia and Zaire).
Another distinctive feature of West Africa as compared, for example, to Kenya was thatthe production of food and cash crops was complementary rather than competitive. Even todayfood crops such as plantains, cocoyams, and peppers are grown to provide shade for youngcocoa trees. Moreover, the period of peak labor demand for cocoa harvesting (November–February) complements the peak labor demand periods for the cereal-growing areas to thenorth (May–July and February–March). Cocoa farms, therefore, have rarely faced a maximumprice for labor and the commercial cocoa industry can coexist with the market for labor infood crop production.
In Kenya, however, the European settlers specialized in the production of food crops andtheir production cycle matched that of subsistence producers. They consequently had to compete
SPATIAL TRANSFORMATION OF CORE AND PERIPHERY254
6063 GEOGRAPHY WORLD ECON_PT_246x189 mm 22/01/2014 15:10 Page 254
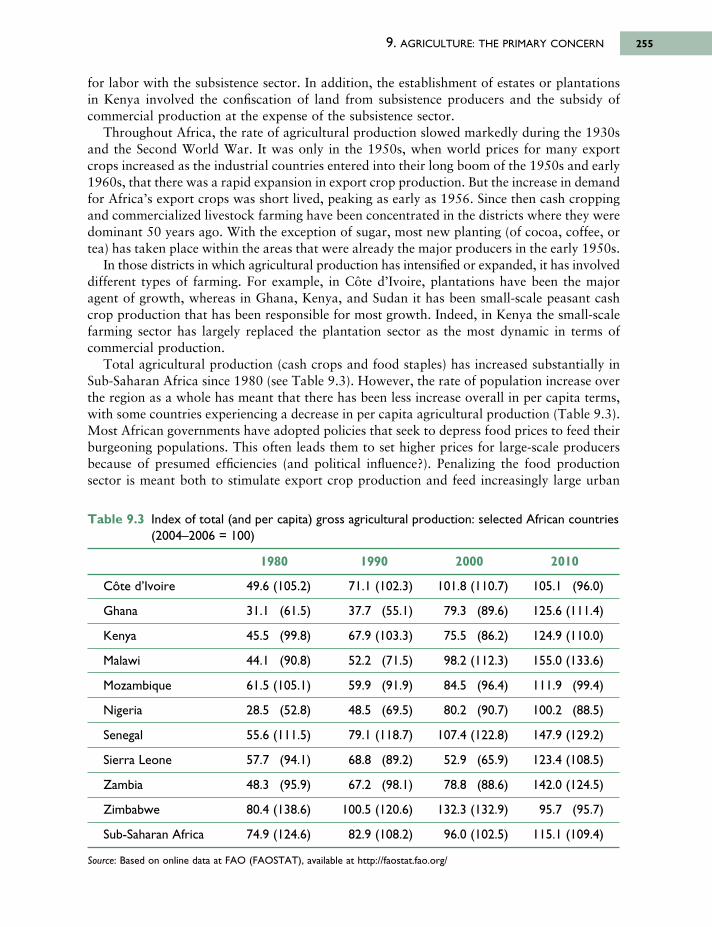
for labor with the subsistence sector. In addition, the establishment of estates or plantationsin Kenya involved the confiscation of land from subsistence producers and the subsidy ofcommercial production at the expense of the subsistence sector.
Throughout Africa, the rate of agricultural production slowed markedly during the 1930sand the Second World War. It was only in the 1950s, when world prices for many exportcrops increased as the industrial countries entered into their long boom of the 1950s and early1960s, that there was a rapid expansion in export crop production. But the increase in demandfor Africa’s export crops was short lived, peaking as early as 1956. Since then cash croppingand commercialized livestock farming have been concentrated in the districts where they weredominant 50 years ago. With the exception of sugar, most new planting (of cocoa, coffee, ortea) has taken place within the areas that were already the major producers in the early 1950s.
In those districts in which agricultural production has intensified or expanded, it has involveddifferent types of farming. For example, in Côte d’Ivoire, plantations have been the majoragent of growth, whereas in Ghana, Kenya, and Sudan it has been small-scale peasant cashcrop production that has been responsible for most growth. Indeed, in Kenya the small-scalefarming sector has largely replaced the plantation sector as the most dynamic in terms ofcommercial production.
Total agricultural production (cash crops and food staples) has increased substantially inSub-Saharan Africa since 1980 (see Table 9.3). However, the rate of population increase overthe region as a whole has meant that there has been less increase overall in per capita terms,with some countries experiencing a decrease in per capita agricultural production (Table 9.3).Most African governments have adopted policies that seek to depress food prices to feed theirburgeoning populations. This often leads them to set higher prices for large-scale producersbecause of presumed efficiencies (and political influence?). Penalizing the food production sector is meant both to stimulate export crop production and feed increasingly large urban
9. AGRICULTURE: THE PRIMARY CONCERN 255
Table 9.3 Index of total (and per capita) gross agricultural production: selected African countries(2004–2006 = 100)
1980 1990 2000 2010
Côte d’Ivoire 49.6 (105.2) 71.1 (102.3) 101.8 (110.7) 105.1 (96.0)
Ghana 31.1 (61.5) 37.7 (55.1) 79.3 (89.6) 125.6 (111.4)
Kenya 45.5 (99.8) 67.9 (103.3) 75.5 (86.2) 124.9 (110.0)
Malawi 44.1 (90.8) 52.2 (71.5) 98.2 (112.3) 155.0 (133.6)
Mozambique 61.5 (105.1) 59.9 (91.9) 84.5 (96.4) 111.9 (99.4)
Nigeria 28.5 (52.8) 48.5 (69.5) 80.2 (90.7) 100.2 (88.5)
Senegal 55.6 (111.5) 79.1 (118.7) 107.4 (122.8) 147.9 (129.2)
Sierra Leone 57.7 (94.1) 68.8 (89.2) 52.9 (65.9) 123.4 (108.5)
Zambia 48.3 (95.9) 67.2 (98.1) 78.8 (88.6) 142.0 (124.5)
Zimbabwe 80.4 (138.6) 100.5 (120.6) 132.3 (132.9) 95.7 (95.7)
Sub-Saharan Africa 74.9 (124.6) 82.9 (108.2) 96.0 (102.5) 115.1 (109.4)
Source: Based on online data at FAO (FAOSTAT), available at http://faostat.fao.org/
6063 GEOGRAPHY WORLD ECON_PT_246x189 mm 22/01/2014 15:10 Page 255
popula tions. In fact, it has discouraged farmers, especially the mass of small-scale farmers,from increasing their production through investment in increased productivity.
The trade policies of DCs and the advice their experts offer have also contributed to theproblems of African agriculture. North America, the European Union (EU) and Japan maypractice fairly free trade in the manufactured goods and services in which they may havecomparative advantages but they are relentlessly protectionist about foodstuffs; precisely thesector in which African countries can offer competitive products. For example, U.S. governmentsubsidies to its sugar, tobacco, and groundnut farmers lead to lower prices for U.S.-producedcrops than would be the case without the subsidies. This deprives African producers of potentialmarkets. With respect to advice about cropping decisions, Africans have received some of theworst advice ever offered by people from one part of the world to another. The litany of disastersresulting from advice offered by foreign experts is much too long to provide here. Two examplesmust suffice. In Burkina Faso and elsewhere in the dry Sahel region of north-central Africa,the UN Food and Agricultural Organization (FAO) encouraged local farmers to grow potatoes.A bumper crop resulted, which then rotted unsold in local markets where potatoes were seenas an exotic crop without any history in local diets. By Lake Turkana in East Africa, Norwegianexperts persuaded Turkana cattle herdsmen to give up their cattle and take up fishing only tofind out that the cost of chilling the fish exceeded what they could bring in city markets. Notonly was the fishing equipment a wasted investment but the Turkana were now also withouttheir cattle. They ended up on food aid provided by the surpluses bought up by the U.S. andother governments as a result of overproduction brought about by their subsidy programs tocereal producers and dairy producers.
But countries differ in the relative extent to which farmers must bear the brunt of tax- andprice-setting policies. It all depends on the political base of governing élites and the origins ofmarketing organizations. In Ghana and Zambia in the 1980s, for example, urban-basedpoliticians put the burden on small-scale farmers to a much greater extent than the rural-basedpoliticians of Kenya. In Ghana, the Cocoa Board is a patronage organization, whereas in Kenya,producers control the marketing organizations. Interestingly, the increase in total agriculturalproduction in the 1980s was higher in Kenya than in Ghana and Zambia (see Table 9.3). InKenya, this benefited both food production for domestic consumption and increases in salesof export crops. Subsequent liberalization and privatization in Ghana, however, havecontributed to significantly increased production in the 1990s (Table 9.3).
Three trends have nevertheless been fairly general over the past 30 years. One has been theincreased importance of wage labor, especially with respect to export crops. This has furthermonetized the rural economy and reduced the degree of reliance on domestic groups (families)as sources of farm labor. This in turn has reinforced the role of long-distance migration inagricultural labor and given some districts the specialized role of “migrant labor reserve” forother districts in which export agriculture is important. For example, even with restrictionson international migration, Togo and Benin in West Africa have been a major source oftemporary and permanent migrants to Côte d’Ivoire and Ghana (see Figure 9.1).
A second trend has been the changing role of women in African agriculture. Women havebecome central to the production of food crops on small-scale farms such as those that dominatethroughout Sub-Saharan Africa. As Swindell (1985: 179) puts it:
As men have become more involved in commercial cropping and non-farm occupations, so womenhave become increasingly responsible for the cultivation of food staples. This is especially true inthose areas where the out-migration of men is persistent, and it could be argued that the expansionof commercial cropping and the industrial labor force has been built on the backs of women farmers.
SPATIAL TRANSFORMATION OF CORE AND PERIPHERY256
6063 GEOGRAPHY WORLD ECON_PT_246x189 mm 22/01/2014 15:10 Page 256
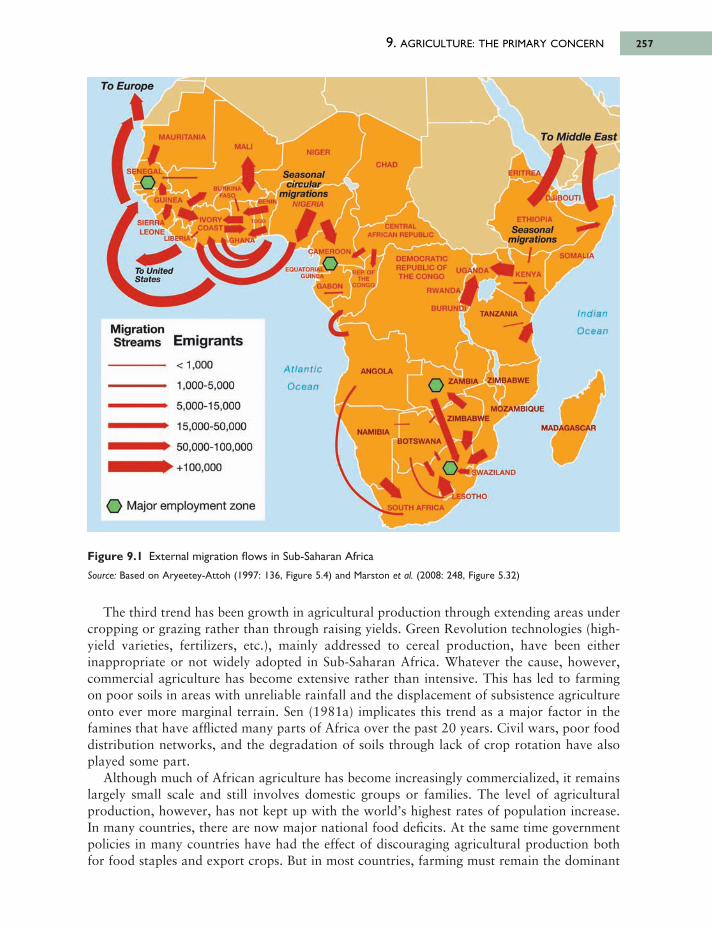
9. AGRICULTURE: THE PRIMARY CONCERN 257
The third trend has been growth in agricultural production through extending areas undercropping or grazing rather than through raising yields. Green Revolution technologies (high-yield varieties, fertilizers, etc.), mainly addressed to cereal production, have been eitherinappropriate or not widely adopted in Sub-Saharan Africa. Whatever the cause, however,commercial agriculture has become extensive rather than intensive. This has led to farmingon poor soils in areas with unreliable rainfall and the displacement of subsistence agricultureonto ever more marginal terrain. Sen (1981a) implicates this trend as a major factor in thefamines that have afflicted many parts of Africa over the past 20 years. Civil wars, poor fooddistribution networks, and the degradation of soils through lack of crop rotation have alsoplayed some part.
Although much of African agriculture has become increasingly commercialized, it remainslargely small scale and still involves domestic groups or families. The level of agriculturalproduction, however, has not kept up with the world’s highest rates of population increase.In many countries, there are now major national food deficits. At the same time governmentpolicies in many countries have had the effect of discouraging agricultural production bothfor food staples and export crops. But in most countries, farming must remain the dominant
Figure 9.1 External migration flows in Sub-Saharan Africa
Source: Based on Aryeetey-Attoh (1997: 136, Figure 5.4) and Marston et al. (2008: 248, Figure 5.32)
6063 GEOGRAPHY WORLD ECON_PT_246x189 mm 22/01/2014 15:10 Page 257
MigrationStreams Emigrants
< 1,000
• 1,000-5,000
5,000-15,000
15,000-50,000
50,000-100,000
+ 1 0 0 ,0 0 0
» Major employment zone
A tla n tic
O c e a n
ANGOLAZAMBIA ZIMBABWE
ZIMBABWEMOZAMBIQUE
MADAGASCAR
In d ia n
O c e a n
NAMIBIABOTSWANA
/ • i SWAZILAND
L E S O T H O
SOUTH AFRICA
To United States
SIERRALEONE
L IB E R IA
4VORV4COASTI
k (ΊΗΔΝΛ
Seasonalcircular
m igrationsNIGERIA
CHAD
CENTRAL AFRICAN REPUBLIC
DEMOCRATIC REPUBUC OF THE CONGO
JGANDA
RWANDA,
BURUNDI
E Q U A T O R IA L ^ /GUINEA
GABON
REP OF
cSSor У/ ' '
CAM ER O O N ^
NIGER
BENIN
MAURITANIA
To Europ
SENEGAL
GUINEA
BURKINA^FASO
MALITo Middle East
ERITREA і
D J I B O U T I !
ETHIOPIASeasonal
m igrations
SOMALIA
KENYA
ANZANIA
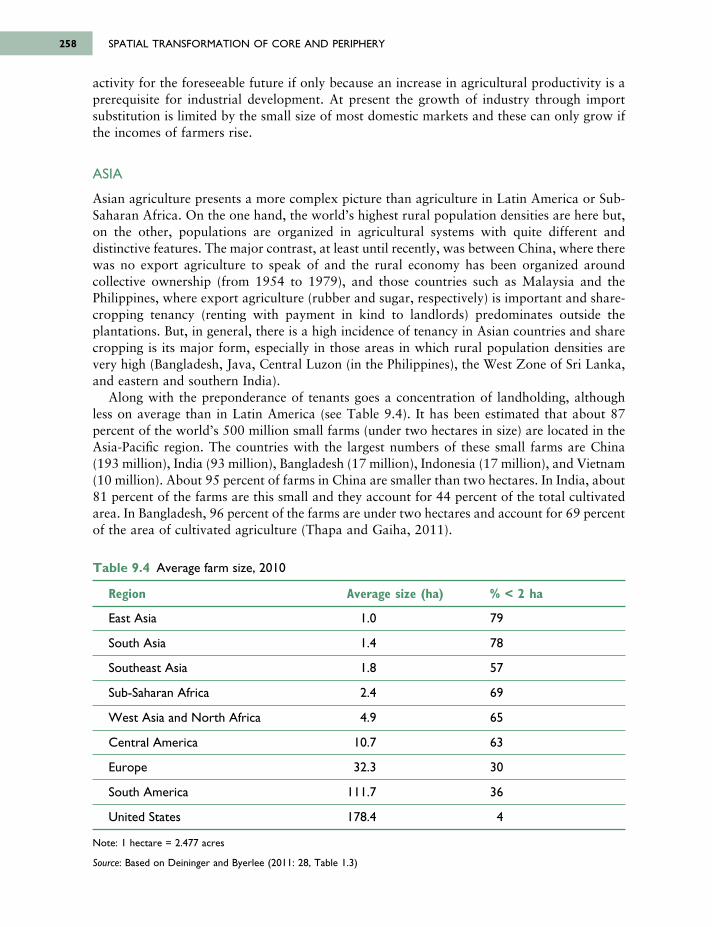
activity for the foreseeable future if only because an increase in agricultural productivity is aprerequisite for industrial development. At present the growth of industry through importsubstitution is limited by the small size of most domestic markets and these can only grow ifthe incomes of farmers rise.
ASIA
Asian agriculture presents a more complex picture than agriculture in Latin America or Sub-Saharan Africa. On the one hand, the world’s highest rural population densities are here but,on the other, populations are organized in agricultural systems with quite different anddistinctive features. The major contrast, at least until recently, was between China, where therewas no export agriculture to speak of and the rural economy has been organized aroundcollective ownership (from 1954 to 1979), and those countries such as Malaysia and thePhilippines, where export agriculture (rubber and sugar, respectively) is important and share-cropping tenancy (renting with payment in kind to landlords) predominates outside theplantations. But, in general, there is a high incidence of tenancy in Asian countries and sharecropping is its major form, especially in those areas in which rural population densities arevery high (Bangladesh, Java, Central Luzon (in the Philippines), the West Zone of Sri Lanka,and eastern and southern India).
Along with the preponderance of tenants goes a concentration of landholding, althoughless on average than in Latin America (see Table 9.4). It has been estimated that about 87percent of the world’s 500 million small farms (under two hectares in size) are located in theAsia-Pacific region. The countries with the largest numbers of these small farms are China(193 million), India (93 million), Bangladesh (17 million), Indonesia (17 million), and Vietnam(10 million). About 95 percent of farms in China are smaller than two hectares. In India, about81 percent of the farms are this small and they account for 44 percent of the total cultivatedarea. In Bangladesh, 96 percent of the farms are under two hectares and account for 69 percentof the area of cultivated agriculture (Thapa and Gaiha, 2011).
SPATIAL TRANSFORMATION OF CORE AND PERIPHERY258
Table 9.4 Average farm size, 2010
Region Average size (ha) % < 2 ha
East Asia 1.0 79
South Asia 1.4 78
Southeast Asia 1.8 57
Sub-Saharan Africa 2.4 69
West Asia and North Africa 4.9 65
Central America 10.7 63
Europe 32.3 30
South America 111.7 36
United States 178.4 4
Note: 1 hectare = 2.477 acres
Source: Based on Deininger and Byerlee (2011: 28, Table 1.3)
6063 GEOGRAPHY WORLD ECON_PT_246x189 mm 22/01/2014 15:10 Page 258
The evidence from many Asian countries, including Bangladesh, China, the Philippines,Thailand, Pakistan, and India, indicates that average farm size has decreased over time. Otherevidence from India suggests two types of change in historical patterns of rural social structure:The growth in some areas of the class of self-employed cultivators or rich peasants, favoredby 1950s’ land reform (for example, Gujarat) and the transformation of large landowners intocapitalist farmers employing migrant laborers (for example, Punjab). Both changes are signsof increasing commercialization of agriculture even as sharecropping tenancy persists inmarginal areas to provide labor reserves for seasonal and cyclical purposes at little or no costto the commercial sector.
In the colonial period, governments concerned themselves either with plantation agricultureor with raising taxes from other forms of agriculture. In India, the British created a class oflanded aristocrats called zamindars as revenue collectors for the government. The zamindars,however, did not have any real interest in improving agriculture. Over time they and otherintermediaries became an immense burden on actual cultivators whose rents included not onlyrevenue for the government but also income for the various intermediaries. After independence,India, Pakistan, and other countries in South and Southeast Asia where this system prevailed,abolished intermediary tenures. However, many of the old intermediaries continued to cultivatetheir holdings through tenants and sharecroppers on the same exploitative terms as before.Only in China, South Korea, and Taiwan did land redistribution lead to an effective abolitionof the power of large landlords. This was arguably crucial in providing the basis for laterspectacular economic development as small household farms gained incentives to dramaticallyincrease production. In China, this was spoiled for a generation by large collective farms thatdrained rather than invigorated the agricultural sector. The recent return to smaller, equalplots in China has again provided the basis for maximizing agricultural output; what Studwell(2013, xiii) calls “highly labor-intensive household farming.”
Since independence, however, total agricultural production has increased at rates at leastcommensurate with population growth in most Asian countries. Unfortunately, much of thegrowth has been concentrated in export crops or cereals (wheat, rice) rather than across theboard. Moreover, the unequal social structure of most rural areas has ensured an upward driftof the benefits of increased production. Rural poverty has increased as agricultural productionhas increased.
A major source of increased production of cereals (especially wheat) since the 1960s hasbeen the Green Revolution. This had its most significant impact in both Punjab regions (sincePartition, there is one in India and one in Pakistan) and the Indian state of Haryana whereirrigation facilities could be utilized. Benefits have accrued disproportionately to large farmersand the technologies involved (new seed varieties, heavy applications of chemical fertilizers)cannot be applied in areas without irrigation facilities: 80 percent of the cultivated area inIndia, 90 percent in Bangladesh.
In general, over the past 40 years most Asian governments have not favored agriculture.Many have pursued pricing and credit policies similar to those noted earlier for Sub-SaharanAfrica. This seems also to be true at least for considerable periods in the case of China. Indiandevelopment plans until the late 1970s were systematically biased against the agricultural sector.Yet there is a direct relationship between agricultural yields and a price structure that favorsthe agricultural sector. The countries with the highest ratios of product prices (for example,rice) to input costs (for example, fertilizer cost) are also where yields are highest. The threecountries with the highest rice yields per hectare in Asia, Japan, South Korea, and Taiwanalso have perhaps some of the poorest soils in Asia. Government policies (especially subsidiesfor inputs such as fertilizers) and egalitarian rural social structures (all farmers are rewarded)
9. AGRICULTURE: THE PRIMARY CONCERN 259
6063 GEOGRAPHY WORLD ECON_PT_246x189 mm 22/01/2014 15:10 Page 259
are the most plausible causes of the differences in crop yields. One negative effect of this,however, is a high level of water pollution produced by the heavy use of subsidized fertilizers.
According to the United Nations, three-fourths of the world’s “absolute poor” (those unableto maintain a minimum nutritional standard) live in Asia and more than four-fifths of themlive in rural areas. The most common feature of the rural poor in the region is landlessnessor limited access to land. Poor rural households tend to have larger families, lower educationalattainment and higher underemployment. While the Green Revolution helped to achieve themost rapid and widespread decline in poverty, hunger and premature death in history duringthe 1970s and 1980s, progress has since stalled. Appropriate technologies remain to bedeveloped for the agriculturally marginal areas that are home today to about 40 percent ofthe rural poor. In China, for example, nearly 65 million officially recognized poor people livein remote, mountainous areas: “In the 1990s, poverty reduction fell to less than one third ofthe rate needed to meet the United Nations’ commitment to halve extreme poverty by 2015”(IFAD, 2002: 2).
9.3 RURAL LAND REFORMIn Latin America and Asia, the landholding and tenurial systems have been periodically“reformed” as a result of pressure from peasant movements, government attempts to makeagriculture more efficient and productive, and external pressures from TNCs and internationaldevelopment agencies. Certain models have sometimes been followed depending on whetherefficiency or equity has been the overriding goal. In the former case, the Taiwanese and SouthKorean experiences are emphasized; in the latter, the Chinese experience is often the model.However, in practice, agricultural reform, especially land reform, is overwhelmingly a socio-political process rather than a technical one of choosing a model and then following it.
At one time or another, but especially between 1960 and the early 1970s, virtually everycountry in Latin America and Asia passed land reform laws. A wide range of arguments havebeen proposed to justify a role for land reform in agricultural development. There are perhapsfour justifications that have been most common and they have appealed differentially to differentsocial groups. The first of these is a “conservative” argument: Land reform is a minimalconcession for political stabilization. The second is a “liberal” argument: Land reform is neededto create a class of capitalist farmers and expand the domestic market. Third, there is the“populist” argument: Small farms are more efficient (and equitable) than large ones. Fourth,the “radical” argument: Peasants are rapidly being dispossessed of their status as independentproducers and are prisoners of cheap food policies and agro-export policies, consequently landreform towards collective production (collective farms, state farms) is necessary, if insufficient,for economic development.
Most actual land reform policies have been of the “liberal” type, concerned with creatinga reform sector. About three dozen land reforms are classified in Table 9.5, including thosein the same country when a land reform program was later redefined (for example, Chile).All the diagonal reforms on this table are redistributive ones in the sense that they either increasethe size of the reform sector without changing the non-reform sector (1, 7 and 13 in Table9.5) or involve expansion of the reform sector (25). Reforms 2, 3 and 4 are oriented towardseliminating “feudal” (or other pre-capitalist) remnants from agriculture rather than redistribut -ing land. In each case, the transition to capitalism is dominated by (2) a landed élite, (3) farmersor (4) peasants.
The only possible reforms, as opposed to drastic changes, once a capitalist agriculture hasbeen established are either shifts in the type of agrarian structure (8, 9, 14) or distributive
SPATIAL TRANSFORMATION OF CORE AND PERIPHERY260
6063 GEOGRAPHY WORLD ECON_PT_246x189 mm 22/01/2014 15:10 Page 260
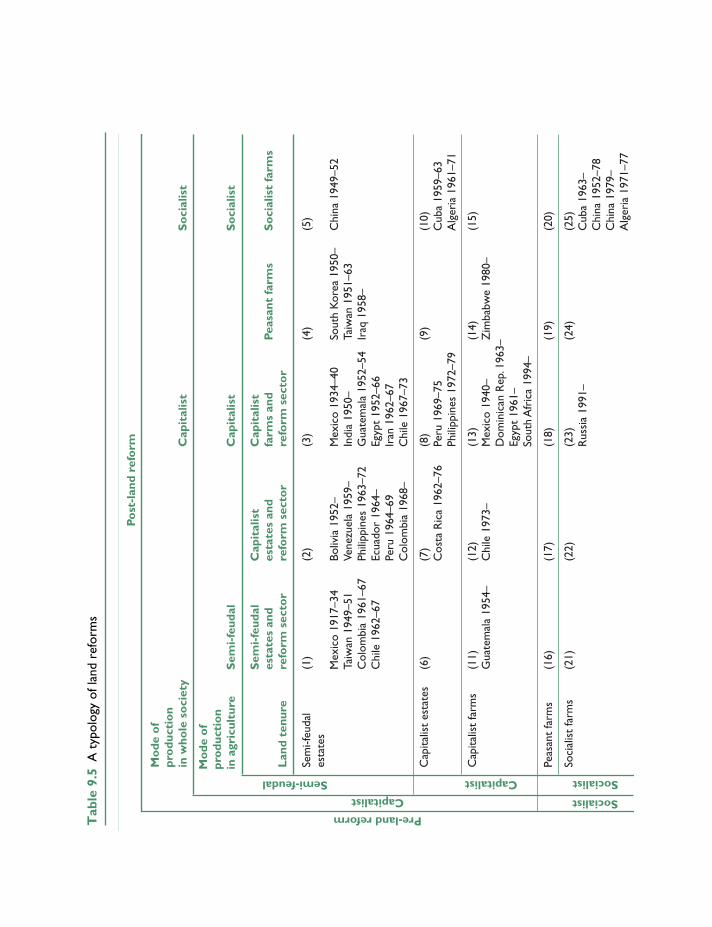
Post
-lan
dre
form
Mo
deo
fpr
odu
ctio
nin
who
leso
ciet
yC
apit
alis
tS
oci
alis
t
Mo
deo
fpr
odu
ctio
nin
agri
cult
ure
Sem
i-fe
udal
Cap
ital
ist
So
cial
ist
Sem
i-fe
udal
Cap
ital
ist
Cap
ital
ist
esta
tes
and
esta
tes
and
farm
san
dPe
asan
tfa
rms
So
cial
ist
farm
sL
and
tenu
rere
form
sect
or
refo
rmse
cto
rre
form
sect
or
Sem
i-feu
dal
(1)
(2)
(3)
(4)
(5)
esta
tes
Mex
ico
1917
–34
Boliv
ia19
52–
Mex
ico
1934
–40
Sout
hK
orea
1950
–C
hina
1949
–52
Taiw
an19
49–5
1Ve
nezu
ela
1959
–In
dia
1950
–Ta
iwan
1951
–63
Col
ombi
a19
61–6
7Ph
ilipp
ines
1963
–72
Gua
tem
ala
1952
–54
Iraq
1958
–C
hile
1962
–67
Ecua
dor
1964
–Eg
ypt
1952
–66
Peru
1964
–69
Iran
1962
–67
Col
ombi
a19
68–
Chi
le19
67–7
3
Cap
italis
tes
tate
s(6
)(7
)(8
)(9
)(1
0)C
osta
Ric
a19
62–7
6Pe
ru19
69–7
5C
uba
1959
–63
Phili
ppin
es19
72–7
9A
lger
ia19
61–7
1
Cap
italis
tfa
rms
(11)
(12)
(13)
(14)
(15)
Gua
tem
ala
1954
–C
hile
1973
–M
exic
o19
40–
Zim
babw
e19
80–
Dom
inic
anR
ep.1
963–
Egyp
t19
61–
Sout
hA
fric
a19
94–
Peas
ant
farm
s(1
6)(1
7)(1
8)(1
9)(2
0)
Soci
alis
tfa
rms
(21)
(22)
(23)
(24)
(25)
Rus
sia
1991
–C
uba
1963
–C
hina
1952
–78
Chi
na19
79–
Alg
eria
1971
–77
Semi-feudal
Capitalist
Pre-landreform
Capitalist Socialist
Socialist
Tab
le 9
.5A
typ
olog
y of
land
ref
orm
s
6063 GEOGRAPHY WORLD ECON_PT_246x189 mm 22/01/2014 15:10 Page 261
reforms within a given type (7, 13, 19, 25). All reforms can give way to counter-reforms: Chileessentially switched to (12) from (3) after the 1973 military coup, Guatemala returned to (11)from (3) after the military coup of 1954. The Chinese, Cuban, and Algerian cases are ones of land reform involving the collectivization of agriculture that were part of more “radical”programs of sociopolitical change. But since the early 1980s China has shifted to a mixedsystem of collective ownership but private use. The recent redistribution of land from largecapitalist farms to small peasant holdings in Zimbabwe and some other African countries hasdestroyed the existing agricultural system without affecting either improvements in productionor in the incomes and status of the new farmers.
The most widespread and successful (in the sense of lasting) land reforms have been thosefacilitating the creation of a capitalist agriculture (1–5 in Table 9.5). In Latin America, thecombination of antifeudal land reforms with more spontaneous development of capitalismhas both removed most feudal remnants and put an end to reform efforts. A similar conclusioncan be drawn for Asia. Except for China, reform efforts generally ended in the early 1970s.By and large, they cannot be said to have lived up to their promise for the needs of the bulkof the rural population irrespective of the nature of the reform undertaken. However, in somecases, such as Taiwan and South Korea after the Second World War, and China’s landprivatization since 1978, rural land reform appears to have served as a prerequisite for laterindustrialization by increasing crop yields and through increased rural earnings providing capitalfor industrial investment.
9.4 CAPITALIZATION OF AGRICULTURESpontaneous change, therefore, has now become much more important than reform inagricultural development. Over the past 20 years there has been a substantial increase in directand indirect investment by transnational corporations (TNCs) in the agriculture of a numberof peripheral countries. In many countries, TNCs, attracted by cheap land and labor, appro -priate physical conditions, improved infrastructure and a decline in the relative profitabilityof other sorts of investment, have increased their involvement in export-oriented agricultureand the production and distribution of seeds, pesticides and fertilizers. Thailand, for example,which exported no pineapples in the early 1970s, had, by 1979, become the major worldexporter after Hawaii because the U.S. company Castle and Cooke had moved a major partof its pineapple operations out of Hawaii. Similarly, the Philippines, which exported no bananas in the 1960s, had become one of the world’s major exporters by the mid-1970s.This was again due almost entirely to new TNC investment. So, just as TNCs that specializein manufacturing use global sourcing, agricultural TNCs have turned to multiple sites ofproduction to lower labor costs, gain year-round supplies for seasonal crops (for example,strawberries in January in Europe from Chile) and to avoid labor and environmentalregulations. Over the past 30 years the global food industry has been one of the world’s fastestgrowing industries.
Of great importance, however, was the prior emergence in Europe, Japan, and North Americaof a highly capital-intensive agriculture serving a food system in which consumers increasinglydemanded high-value products (such as lean beef, chicken products, and fresh fruit andvegetables) at the same time as marketing and distribution were concentrating in the handsof large-scale wholesalers and supermarket chains. Economies of scale could be realized withinlarge vertically integrated firms that supplied the new wholesalers and direct retailers. Globalsourcing is an extension into the periphery of a shift towards industrialized agriculture thatwas well under way by the 1950s in the United States and Europe, with beef cattle lodged in
SPATIAL TRANSFORMATION OF CORE AND PERIPHERY262
6063 GEOGRAPHY WORLD ECON_PT_246x189 mm 22/01/2014 15:10 Page 262
9. AGRICULTURE: THE PRIMARY CONCERN 263
lots for fattening and chickens stacked on top of one another in battery houses. The recentdemand for organic produce, very fresh fruit and vegetables and worries about contaminationof the beef food chain—prompted by the outbreak of so-called mad cow disease (bovine spongi -form encephalopathy (BSE)) in Britain—however, may signal the limits of the globalizationof food production when consumer tastes and demands in urban and export markets resistthe imposition of mass-produced items. Different food products now have different food systemsassociated with them. Only some are amenable to global sourcing.
It is in Latin America that the capitalization of agriculture by TNCs has been both most extensive and intensive. Of the six countries usually identified as the “new agricultural
Box 9.3 Agribusiness and the developed countries
Direct corporate involvement in agriculture—agribusiness—has been an inevitable outcomeof the logic of specialization and economies of scale. With greater specialization, farmsbecome less autonomous and self-contained as productive units, making for the penetrationof an integrated, corporate system of food production, processing and distribution:Agriculture has become increasingly drawn into a food-producing complex whose limits lie:
[Well] beyond farming itself, a complex of agro-chemical, engineering, processing, marketing anddistribution industries which are involved both in the supply of farming inputs and in theforward marketing of farm produce.
(Newby, 1980: 61)
It is in the actions of food-processing conglomerates like Archer Daniels Midland (ADM),Cargill, ConAgra, Monsanto and Nestlé, Newby suggests, “that the shape of agriculture andultimately of rural society in virtually all advanced industrial societies is decided” (1980: 62).The most common form of corporate involvement in agriculture has to do with the forwardcontracting of produce at a fixed price. This not only weakens the independence of farmers,but also tends to transfer income from farmers and rural communities to the processingindustry. Forward-contracting arrangements also reinforce the overall structural changesaffecting agriculture:
They encourage both fewer, larger holdings and increased specialization so that the size ofindividual enterprises can be enlarged to fully achieve the prevailing scale economies. This trend. . . is likely to lead to both a reduction in the numbers employed in agriculture, and a decline inthe managerial role of those farmers remaining . . . leaving them caretaker functions.
(Metcalf, 1969: 104)
Rural landscapes have also been affected as the logic of industrial production andcentralization has been applied to agriculture. In northwestern Europe, for example, fieldsystems have been rationalized, hedgerows and dykes removed, and mechanization hasvirtually eliminated the need for a large labor force, leaving the fields of most farms devoidof human life for most of the year. Factory farming has brought poultry and pigs indoorspermanently, while many cattle spend their winter months indoors, and there are now zero-grazing techniques that may see them inside year round. Only the sheep steadfastly refuse toacknowledge the laws of industrial production, stubbornly refusing to prosper in regimentedand sanitized conditions.
6063 GEOGRAPHY WORLD ECON_PT_246x189 mm 22/01/2014 15:10 Page 263
coun tries” in which agricultural investment has been concentrated, four are in Latin America:Argentina, Brazil, Chile, and Mexico. The other two are Hungary and Thailand, where thegovernments have promoted agricultural investment for urban and export markets, focusingon such high-value food products as meats, fruits, and vegetables. Sometimes control is exerciseddirectly by purchase of land and involvement in production. For example, between 1964 and1970 U.S.-based TNCs purchased 35 million hectares of agricultural land in Brazil alone.Increasingly, however, TNCs and international development agencies (the World Bank, theU.S. Agency for International Development (AID), etc.) are encouraging traditional rural élitesto become commercial élites, practicing mechanized farming of export crops that are processedand marketed by the TNCs or by contracting out to peasant producers. These strategies reflectboth fear of the revolutionary potential of peasant movements in traditional agrarian socialstructures and the need for TNCs to keep a low profile lest they become the targets ofnationalization drives.
AGRIBUSINESS
The impact of agribusiness investment in the agriculture of the periphery, therefore, is notrestricted to the development of export enclaves or plantation enclaves as was characteristicof an earlier phase in the development of the world economy. Rather, its most important effectis probably the way in which it channels capital to a class of rural capitalists and so consolidatesTNC control over entire national agricultural systems. The penetration of peripheral agricultureby international agribusiness is, in effect, just another aspect of the new international divisionof labor.
Between 1966 and 1978, for example, U.S. investment in Latin American agricultureexpanded from US$365 million to US$1.04 billion, growing from 15 percent to 21 percentof total U.S. foreign direct investment (FDI) in Latin America. This investment was heavilyconcentrated in Argentina, Brazil, Mexico, and Venezuela where the growing urban middleand upper classes provided a domestic supplement to U.S. demand for so-called luxuryfoodstuffs (meat, fruits, and vegetables). As demand grew for the fertilizers, pesticides, herbi -cides, improved seeds, and agricultural machinery needed by the “new” agriculture, TNCssuch as Du Pont, W.R. Grace, Monsanto, Exxon, and Allied Chemical were increasinglyinvolved in local production.
TNCs and foreign portfolio investment capital have been involved in a variety of ways. In the state of Sinaloa in northern Mexico, for example, 20–40 percent of the credit foragricultural production in the 1970s came from north of the border. In Argentina, the amountof foreign capital in beef production decreased, while it increased in the packing and processingindustries. In Mexico and Central America, contract production linked national producers withTNCs. Foreign banks have become major agricultural lenders. For example, the San Francisco-based Bank of America became heavily involved in Guatemala in the 1970s, lending for majordevelopment projects such as converting forest to pasture for beef production, and providingspeculative export loans.
Since the 1990s foreign companies and state-owned corporations (particularly from Chinaand South Korea) have been active in directly buying up large tracts of land in Africa and, toa degree, in Latin America. So-called land grabs, these land purchases are directed atguaranteeing access to agricultural land (and raw materials) in the future for countries andagribusinesses whose land supplies (and raw materials) closer to home are running out. Assubsidies encourage farmers in North America and Europe to convert more and more cropsinto biofuels (in 2012, 40 percent of the U.S. corn/maize crop ended up as ethanol), the entire
SPATIAL TRANSFORMATION OF CORE AND PERIPHERY264
6063 GEOGRAPHY WORLD ECON_PT_246x189 mm 22/01/2014 15:10 Page 264
9. AGRICULTURE: THE PRIMARY CONCERN 265
global food supply chain is extending globally. It is not simply the capture of agricultural landfrom local users and production that is problematic. More seriously, the land grabs definecaptive supply chains with the land locked into corporate and national chains that leave lessproduction (particularly of food crops) available for open exchange. Gigantic commodity tradinghouses such as Glencore, Cargill, Archer Daniels Midland, and Bunge have been particularlyactive in organizing this global agricultural system. But they are not alone. In Southeast Asia,for example, Vietnamese companies have ruthlessly carved out large rubber plantations in Laos
Box 9.4 The great land grab?
By Bart Yavorosky
Before the spike in commodity prices in 2007–2008, FDI rarely targeted land. But in 2009,approximately 56 million hectares of large-scale farmland deals were announced (Deiningerand Byerlee, 2011). These acquisitions were concentrated in the LDCs, particularly in partsof Africa (Sudan, Ethiopia, Mozambique, Tanzania, Madagascar, Zambia, and the DemocraticRepublic of the Congo), Latin America, and Southeast Asia (Philippines, Indonesia, and Laos).In contrast, the majority of investors represented DCs such as the United States andEuropean countries, as well as NIEs including Brazil, China, India, South Africa, South Korea,and the Gulf States. Many of these transactions reflected regional or colonial patterns. Forexample, 96 percent of South African purchases were located in Africa, while 87 percent ofSouth Korean acquisitions were located in Southeast Asia and Melanesia. Similarly,Portuguese investments were located exclusively in the former colonies of Mozambique,Sierra Leone, and Angola (Land Matrix, 2012a).
The potential for a land grab—particularly as population growth and climate changeimpact arable land and fresh water supplies—raises a number of controversial issues.International financial institutions and agribusinesses argue that much of this land,particularly in Sub-Saharan Africa, has low yields (often one-third or less of its potential).Raising yields could help feed the estimated 1 billion hungry people in the world includingthe 240 million in Sub-Saharan Africa. In theory, modernizing agricultural production couldcreate jobs and generate revenues in places where most people are engaged in subsistencefarming. The acquisition of land by foreign investors also has the potential to positivelytransform rural economies (but only if it is coupled with transparency, good governance,strict environmental regulation, and investments in infrastructure that benefit localpopulations).
In contrast, many NGOs and scholars contend that land purchases often dispossess themost vulnerable local people who are removed from land they had cultivated or grazed forgenerations, create few jobs due to the mechanization inherent to industrial–agriculturalpractices, and do not increase the amount of food available to local populations becauseproduction is geared toward exports.
Large-scale farming also raises concerns about water supplies. Nearly 65 percent of theacquired land that has been put into production has been used to raise water-intensivecrops such as jatropha, soybeans, and corn (Land Matrix, 2012b). At the current acquisitionrate in Africa, if the acquired land is cultivated with water-intensive biofuel and flex crops(crops that can be used for food or nonfood purposes), the water required for irrigationwould exceed the available supply by 2019 (Oakland Institute, 2011).
6063 GEOGRAPHY WORLD ECON_PT_246x189 mm 22/01/2014 15:10 Page 265
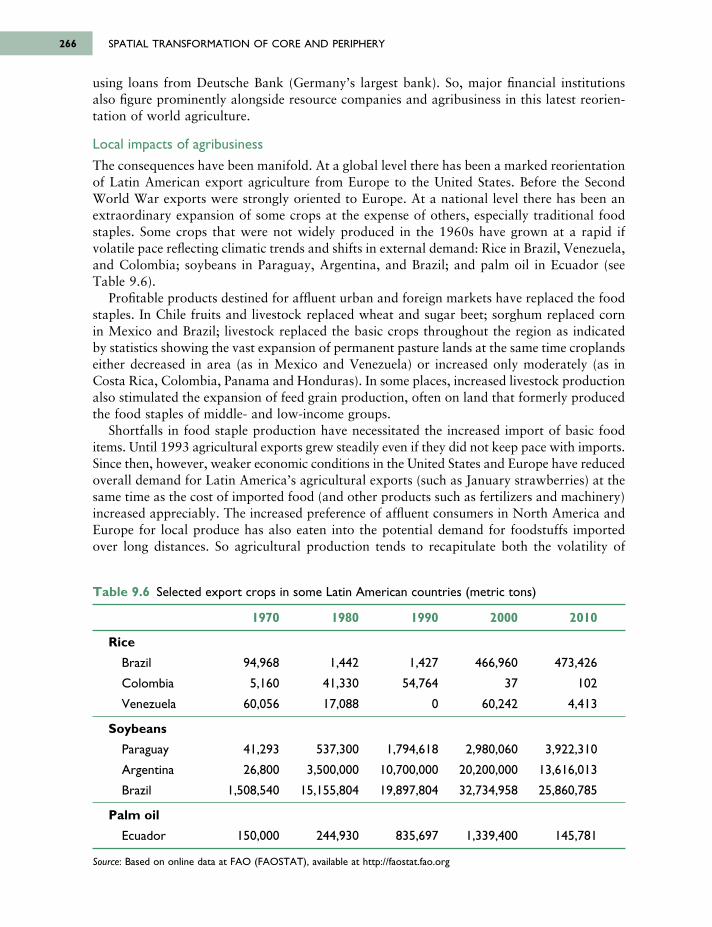
using loans from Deutsche Bank (Germany’s largest bank). So, major financial institutionsalso figure prominently alongside resource companies and agribusiness in this latest reorien -tation of world agriculture.
Local impacts of agribusinessThe consequences have been manifold. At a global level there has been a marked reorientationof Latin American export agriculture from Europe to the United States. Before the SecondWorld War exports were strongly oriented to Europe. At a national level there has been anextraordinary expansion of some crops at the expense of others, especially traditional foodstaples. Some crops that were not widely produced in the 1960s have grown at a rapid if volatile pace reflecting climatic trends and shifts in external demand: Rice in Brazil, Venezuela,and Colombia; soybeans in Paraguay, Argentina, and Brazil; and palm oil in Ecuador (seeTable 9.6).
Profitable products destined for affluent urban and foreign markets have replaced the foodstaples. In Chile fruits and livestock replaced wheat and sugar beet; sorghum replaced cornin Mexico and Brazil; livestock replaced the basic crops throughout the region as indicatedby statistics showing the vast expansion of permanent pasture lands at the same time croplandseither decreased in area (as in Mexico and Venezuela) or increased only moderately (as inCosta Rica, Colombia, Panama and Honduras). In some places, increased livestock productionalso stimulated the expansion of feed grain production, often on land that formerly producedthe food staples of middle- and low-income groups.
Shortfalls in food staple production have necessitated the increased import of basic fooditems. Until 1993 agricultural exports grew steadily even if they did not keep pace with imports.Since then, however, weaker economic conditions in the United States and Europe have reducedoverall demand for Latin America’s agricultural exports (such as January strawberries) at thesame time as the cost of imported food (and other products such as fertilizers and machinery)increased appreciably. The increased preference of affluent consumers in North America andEurope for local produce has also eaten into the potential demand for foodstuffs importedover long distances. So agricultural production tends to recapitulate both the volatility of
SPATIAL TRANSFORMATION OF CORE AND PERIPHERY266
Table 9.6 Selected export crops in some Latin American countries (metric tons)
1970 1980 1990 2000 2010
Rice
Brazil 94,968 1,442 1,427 466,960 473,426
Colombia 5,160 41,330 54,764 37 102
Venezuela 60,056 17,088 0 60,242 4,413
Soybeans
Paraguay 41,293 537,300 1,794,618 2,980,060 3,922,310
Argentina 26,800 3,500,000 10,700,000 20,200,000 13,616,013
Brazil 1,508,540 15,155,804 19,897,804 32,734,958 25,860,785
Palm oil
Ecuador 150,000 244,930 835,697 1,339,400 145,781
Source: Based on online data at FAO (FAOSTAT), available at http://faostat.fao.org
6063 GEOGRAPHY WORLD ECON_PT_246x189 mm 22/01/2014 15:10 Page 266
demand and the declining terms of trade associated with the historic production of agriculturalcommodities in peripheral economies.
Nevertheless, the penetration of foreign agribusiness has had important effects on ruralpopulations. One effect has been the increased concentration of land holdings in the hands ofcapitalist farmers and TNCs such that:
Throughout the region, tenants and sharecroppers were replaced by agricultural workers, andpermanent workers were displaced by part-time laborers. Given these changes, landowners couldminimize the costs of maintaining a labor force through periods when it was not needed and expandcropping or live stocking areas by taking over lands that had been assigned to resident laborers,tenants, and sharecroppers. Labor costs were thus reduced for the entrepreneur, and the availablepool of laborers, forced to provide for their own maintenance during inactive periods, wasenlarged.
(Grindle, 1986: 98)
Another effect has been to increase the need to borrow, and so indebtedness of survivingpeasant farmers and part-time laborers. Debt is nothing new for peasant farmers. As the meaningof subsistence changed in a monetized economy to include “urban goods” and processed foods,so too did the importance of money. In the past, money was obtained through the sale oflabor for cash wages or sale of market crops. Debt arose because of the need to store andtransport crops and pay for inputs before cash was available. Often yields and cash wageswere so low that more debt was incurred merely to survive. Today debt is also incurred bythe necessity of competing against the capitalist export sector for land, inputs, and waterresources.
THE CYCLE OF INDEBTEDNESS
In order to manage the higher debt load, peasants must farm their land more intensively. Thisonly exacerbates the problem. Traditional farming methods such as crop rotation and fallowagriculture are replaced by monoculture to grow the most remunerative crop. This processleaches and depletes the soil, leading to poor harvests and soil erosion. As a consequence,more fertilizers and new seeds are required, which deepens the cycle of indebtedness. Warman(1980: 238) described the cycle of indebtedness that has followed the increased capitalizationof agriculture in central Mexico:
The peasant has to combine several sources of credit, on occasion all of them, in order to bringoff the miracle of continuing to produce without dying of starvation. He does it through a set ofelaborate and sometimes convoluted strategies. Some people plant peanuts only in order to financethe fertilizers for the corn crop. Others use official credit to finance planting a cornfield or forbuying corn for consumption in the months of scarcity, while they resort to the local bourgeoisieor the big monopolists in order to finance a field of tomatoes or onions. Many turn to usurers[money lenders] to cover the costs of an illness or a fiesta . . . Given what they produce in a year,what is left after paying the debts does not go far enough even for food during the dry season,much less for starting a crop on their own. For them, obtaining a new loan is a precondition forcontinuing cultivation, one that must be combined with the sale of labor if they are to hold outto the next harvest. Each year the effort necessary to maintain the precarious equilibrium increases.
Peasants, then, are survivors as much as victims. Increasingly, wage labor has come to providea major portion of family income even for peasants who own land. Often this has involvedtemporary long-distance migration. In Guatemala, for example, the coffee, cotton, and sugar
9. AGRICULTURE: THE PRIMARY CONCERN 267
6063 GEOGRAPHY WORLD ECON_PT_246x189 mm 22/01/2014 15:10 Page 267
harvests in December and January involve the seasonal migration of an estimated 1 millionhighland Indians. Temporary wage labor on nearby plantations and capitalist farms, however,is perhaps the major form of adaptation.
DRUG CROPS
In some areas, peasants have also supplemented their incomes by switching to the cultivationof drug crops. The market for these crops in the United States and Europe has grownexponentially since 1970 and the crops can be grown in remote areas on low-grade soils. Giventhe illegality of drug crops in world trade, remoteness becomes a virtue rather than the liabilityit is in more legitimate trade. Afghanistan and Myanmar (Burma) are important sources of heroin destined for U.S. and European markets. In three Latin American countries, Peru,Colombia, and Bolivia, the value of cocaine exports is estimated to be US$800 million perannum. Of course, much of the proceeds goes to drug barons, public officials, and inter -mediaries. But for many peasants, the drug traffic is one of the only ways they have of payingtheir debts in an effort to respond to the disruptions resulting from the capitalization ofagriculture by TNCs and foreign investment. Profits from drugs also fuel the insurgencies of ethnic and political opponents of existing governments. The main routes of surreptitiousexport change frequently in response to both new alliances between producers and inter-mediaries and successful efforts by police forces at intercepting the drugs before they hit thestreets of U.S. and European cities. Some commentators see the laundering of profits from the inter national drug business as a major activity in some offshore financial centers. The drugsbusiness is not new. It has ancient roots. In the nineteenth century opening up China to theexport of opium from India was one of the main causes of the war between Britain and Chinathat was, as a result, called the Opium War. Illicit though it may now be, the global trade indrugs fits into the long history of the trade in stimulants—tea, coffee, opium, etc.—as animportant part of the growth of the world economy (see Chapter 8).
THE CASE OF THE BEEF BOOM IN CENTRAL AMERICA
An interesting case study in the capitalization of Latin American agriculture is the so-calledbeef boom in Central America in the 1970s and early 1980s. This led to the emergence ofCentral America as a major supplier of beef to the United States when it had been previouslyrelatively insignificant. It resulted from the tremendous increase in demand for beef in the UnitedStates as a result of the emergence of fast-food franchises such as McDonald’s and BurgerKing. The new franchises were not particularly demanding of high-quality beef; what theywanted was quantity that could be formed into patties of equal size and weight by sufficientgrinding and tenderizing. But the quantity needed was so huge that the fast-food chains (andfrozen-meals makers) needed to look beyond the USA for their supply. Sources such as Australia,New Zealand, and Canada were subject to severe quota limitations that were part of intensivetit-for-tat trade negotiations on the part of the U.S. government in the GATT. South Americawas excluded because of the prevalence of foot and mouth disease. Central America was favoredby U.S. government policy to help “friendly” governments diversify their exports in the faceof the perceived “geostrategic threat” from Cuba and the Soviet Union in the region. By 1979Central America had acquired 93 percent of the share of the U.S. beef quota available to LDCs.
A number of TNCs and individuals found it profitable to respond to the demand for beeffrom Central America. Some very large U.S. companies became involved through subsidiariesand joint ventures. For example, R.J. Reynolds owned huge grazing ranches in Guatemala
SPATIAL TRANSFORMATION OF CORE AND PERIPHERY268
6063 GEOGRAPHY WORLD ECON_PT_246x189 mm 22/01/2014 15:10 Page 268
and Costa Rica at that time through its then subsidiary, Del Monte, and directly processedand marketed its beef through a variety of outlets: Ortega beef tacos, Chun King beef chowmein, and Delmonte Mexican foods. It also sold beef through Zantigo Mexican outlets(Kentucky Fried Chicken). One of the largest firms in the Central American beef business wasAgrodinamica Holding Company, formed in 1971 with 60 percent of the stock owned bywealthy Latin Americans and 40 percent of the stock owned by the ADELA InvestmentCompany (a private investment company with offices in Washington, DC, Luxembourg, Zürich,and Lima that operated entirely in Latin America). This operation controlled thousands ofacres of pasture in Central America, owned numerous packing plants, and ran a Miami (Florida)beef import house and wholesale distributor.
Other TNCs became involved in supplying the beef business with inputs (grass seed, barbedwire, fertilizers, feed grains, and veterinary supplies). Pulp and paper companies, such as CrownZellerbach and Weyerhauser, invested in cardboard box factories to supply packinghouseswith containers for shipping the beef. Finally, fruit companies with access to large blocks ofland turned them into moneymaking properties.
TNCs, however, were not the only beneficiaries. Wealthy families with access to largeamounts of marginal and forestland turned them into pasture. Some urban-based professionals(lawyers, bankers, etc.) also became involved as “weekend ranchers” of peripheral areaspreviously untouched by commercial agriculture.
The massive displacement of peasants by ranchers and cattle, however, met with tremendousresistance. As Williams (1986: 151) put it: “The receding edge of the tropical forest becamethe setting of a conflict between two incompatible systems of land use, one driven by the logicof the world market, the other driven by the logic of survival.” The violence and civil warthroughout much of Central America in the 1970s and 1980s bore no small relationship tothe expansion of the beef export business.
The Central American beef boom ended in the 1980s, however, due to declininginternational beef prices and reduced U.S. demand as real incomes stagnated and consumersbecame more health conscious. The U.S. Congress also passed a more restrictive meat importact in 1979, which significantly reduced Central America’s access to the U.S. market. Beefexports from Costa Rica, Guatemala, and Honduras were prohibited on several occasions asthe USA enforced laws prohibiting the import of substandard beef and beef with pesticideresidues. During the 1980s and early 1990s the U.S. government also prohibited meat importsfrom Nicaragua and Panama for political reasons. To make matters worse, cattle ranchers’costs (inputs and taxes) were rising. A major blow was the decision in 1987 by Burger King,which at one time bought 70 percent of Costa Rica’s beef exports, to stop buying LatinAmerican beef because of criticism of the “hamburger connection” (Kaimowitz, 1995).
This criticism relates to other important consequences associated with the capitalization ofagriculture: deforestation and environmental degradation. Much of the loss of forest in CentralAmerica, the Amazon Basin of Brazil, and in Southeast Asia has been due to the extension ofranching as well as timber extraction and the burning of timber as fuel wood. While the rateof Deforestation in Central America is estimated to have declined from 4,000,000 hectares per year in the 1970s to 300,000 hectares in the 1990s, at this current rate, Central Americawill lose its remaining forest in fewer than 60 years. A related stimulus to the incredible paceat which tropical forests have been disappearing since the 1970s has been the need to pay off the debts incurred in expensive industrialization campaigns. The opening of forestland tocapital-intensive agriculture has been one strategy for swapping natural resources for incometo repay debts. Five of the world’s “mega-debtors”—Brazil, India, Indonesia, Mexico, andNigeria—all rank among the top ten deforesters. The conversion from forest to pasture or
9. AGRICULTURE: THE PRIMARY CONCERN 269
6063 GEOGRAPHY WORLD ECON_PT_246x189 mm 22/01/2014 15:10 Page 269
cultivation can also increase soil compaction, soil erosion and nutrient depletion—particularproblems in marginal locations with less fertile soils. During the rainy season, erosion in placeswith steeper slopes can contribute to devastating flooding and mudslides in the flatland areas.The capitalization of agriculture in the periphery, therefore, has had correlates other thanincreased productivity, the establishment of comparative advantage in export crops and theincreased import of food crops.
9.5 SCIENCE AND TECHNOLOGY IN AGRICULTURE
The beef export boom in Central America would not have been possible without theimportation of techniques of “scientific agriculture.” In this context, this involved creating“new” breeds of cattle by combining “beefier” attributes with high resistance to pests andtropical heat, transforming pasture management by sowing higher yield grasses and fertilizers,enhancing water supplies by digging new wells and ponds, and providing better veterinarycare to cattle herds.
The past 40 years have witnessed an intensive drive on the part of international developmentagencies (such as the Food and Agriculture Organization (FAO) of the UN and the WorldBank), some national governments, and agribusiness to introduce scientific farming intoagriculture in LDCs. The results have been controversial. From one point of view, yields havebeen increased and, especially in parts of Asia but also to a degree elsewhere, agriculturalproductivity and production have been significantly increased. Of particular importance havebeen the new wheat, maize, and rice varieties associated with the so-called Green Revolution.It is generally acknowledged that the gains from these new varieties (and the fertilizers andirrigation they require) have been concentrated in certain districts of India, Pakistan, and SriLanka, the central Philippines, Java in Indonesia, peninsular Malaysia, northern Turkey, andnorthern Colombia. In addition to increased yields, the new techniques can involve an increasein demand for labor in land preparation, fertilizer application, and harvesting, and increasesin the wages of agricultural laborers (as in Indian Punjab). Doubts are sometimes expressed,however, about the sustainability of these trends in yields and labor use.
From another point of view, scientific agriculture is largely an instrument of commercial -ization and capitalization rather than a mechanism for improving agricultural productivityand production per se. This is not to say that new seed varieties, fertilizers, etc., are alwaysinappropriate; rather, that it all depends on the sociopolitical context in which they are applied.In particular, research efforts in scientific agriculture have been heavily biased towards certaincommodities that are either most important in the DCs or significant in world trade. The verysmall amount of research on important food staples such as cassava, coconuts, sweet potatoes,groundnuts, and chickpeas is especially noteworthy. The “research system” gives high priorityto export crops such as cattle, cotton, and sorghum and to those such as rice and wheat thathave “wide adaptability”: The ability to transfer a new variety from one region to others.Wide adaptability can be criticized, however, for its potential in reducing genetic variety andmaking crops more vulnerable to disease.
A more frequent criticism of scientific agriculture, particularly in its manifestation as theGreen Revolution, is that it primarily benefits larger, more prosperous farmers who have readieraccess to the necessary inputs and credit sources. At the same time it encourages the debt cycleamong poorer peasants and part-time laborers discussed earlier. Farmers must take out loansto pay for the increasingly expensive inputs that only with increasing prices relative toproduction can they possibly repay. Moreover, the new varieties require increased dependence
SPATIAL TRANSFORMATION OF CORE AND PERIPHERY270
6063 GEOGRAPHY WORLD ECON_PT_246x189 mm 22/01/2014 15:10 Page 270
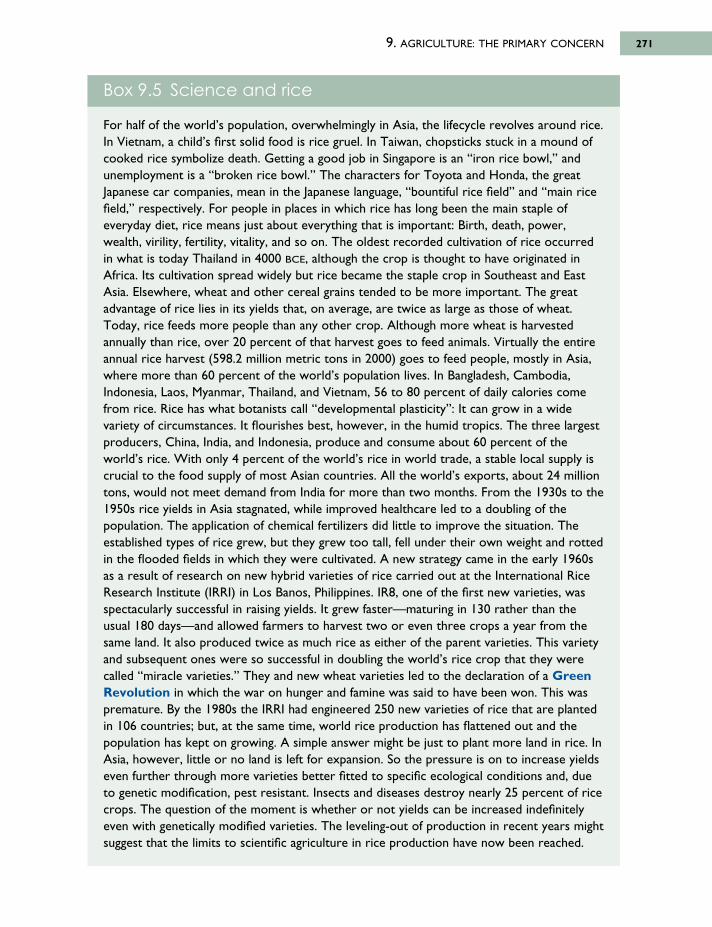
9. AGRICULTURE: THE PRIMARY CONCERN 271
Box 9.5 Science and rice
For half of the world’s population, overwhelmingly in Asia, the lifecycle revolves around rice.In Vietnam, a child’s first solid food is rice gruel. In Taiwan, chopsticks stuck in a mound ofcooked rice symbolize death. Getting a good job in Singapore is an “iron rice bowl,” andunemployment is a “broken rice bowl.” The characters for Toyota and Honda, the greatJapanese car companies, mean in the Japanese language, “bountiful rice field” and “main ricefield,” respectively. For people in places in which rice has long been the main staple ofeveryday diet, rice means just about everything that is important: Birth, death, power,wealth, virility, fertility, vitality, and so on. The oldest recorded cultivation of rice occurredin what is today Thailand in 4000 BCE, although the crop is thought to have originated inAfrica. Its cultivation spread widely but rice became the staple crop in Southeast and EastAsia. Elsewhere, wheat and other cereal grains tended to be more important. The greatadvantage of rice lies in its yields that, on average, are twice as large as those of wheat.Today, rice feeds more people than any other crop. Although more wheat is harvestedannually than rice, over 20 percent of that harvest goes to feed animals. Virtually the entireannual rice harvest (598.2 million metric tons in 2000) goes to feed people, mostly in Asia,where more than 60 percent of the world’s population lives. In Bangladesh, Cambodia,Indonesia, Laos, Myanmar, Thailand, and Vietnam, 56 to 80 percent of daily calories comefrom rice. Rice has what botanists call “developmental plasticity”: It can grow in a widevariety of circumstances. It flourishes best, however, in the humid tropics. The three largestproducers, China, India, and Indonesia, produce and consume about 60 percent of theworld’s rice. With only 4 percent of the world’s rice in world trade, a stable local supply iscrucial to the food supply of most Asian countries. All the world’s exports, about 24 milliontons, would not meet demand from India for more than two months. From the 1930s to the1950s rice yields in Asia stagnated, while improved healthcare led to a doubling of thepopulation. The application of chemical fertilizers did little to improve the situation. Theestablished types of rice grew, but they grew too tall, fell under their own weight and rottedin the flooded fields in which they were cultivated. A new strategy came in the early 1960sas a result of research on new hybrid varieties of rice carried out at the International RiceResearch Institute (IRRI) in Los Banos, Philippines. IR8, one of the first new varieties, wasspectacularly successful in raising yields. It grew faster—maturing in 130 rather than theusual 180 days—and allowed farmers to harvest two or even three crops a year from thesame land. It also produced twice as much rice as either of the parent varieties. This varietyand subsequent ones were so successful in doubling the world’s rice crop that they werecalled “miracle varieties.” They and new wheat varieties led to the declaration of a GreenRevolution in which the war on hunger and famine was said to have been won. This waspremature. By the 1980s the IRRI had engineered 250 new varieties of rice that are plantedin 106 countries; but, at the same time, world rice production has flattened out and thepopulation has kept on growing. A simple answer might be just to plant more land in rice. InAsia, however, little or no land is left for expansion. So the pressure is on to increase yieldseven further through more varieties better fitted to specific ecological conditions and, dueto genetic modification, pest resistant. Insects and diseases destroy nearly 25 percent of ricecrops. The question of the moment is whether or not yields can be increased indefinitelyeven with genetically modified varieties. The leveling-out of production in recent years mightsuggest that the limits to scientific agriculture in rice production have now been reached.
6063 GEOGRAPHY WORLD ECON_PT_246x189 mm 22/01/2014 15:10 Page 271
on the acquisition of energy-intensive inputs (such as fertilizers and agricultural machinery),largely controlled by TNCs.
The substitution of feed crops—crops for feeding animals rather than direct human use—and export food crops for local food crops has been one important recent impact of scientificagriculture. Some observers refer to this as the “second green revolution,” meaning that it hasproduced a new wave of crops, whereas the earlier trend produced greater yields of staplecrops. This is not only biased in favor of farmers with capital, it also can lead to the neglectof food crops fundamental to local diets. As a result, while exporting increasing quantities ofmeat and fruits, some countries find themselves having to import beans, wheat, and maize tofeed their rural populations.
Evidence from such diverse settings as Mexico, India, and Bangladesh suggests that wherecapital-intensive agriculture is introduced into areas with an uneven distribution of resourcesit exacerbates the condition of the rural poor by marginalizing subsistence systems, such asshare cropping, and encourages the polarization of land control between a class of capitalistfarmers, on the one hand, and the mass of the rural population, on the other. The impact ofscientific agriculture, therefore, cannot be separated from issues of social structure.
SUMMARYSince the early 1960s until 2010 GDP growth rates have been generally faster in the lessdeveloped countries than in the developed countries (5.2 percent per annum compared to 2.2percent). In addition, despite large rates of population growth, the per capita incomes of theperiphery taken as a whole have grown at about 3.2 percent per annum. Agriculturalproduction has also increased, in contrast to the stagnation of the colonial period in manyAsian and some African countries. Food production per capita in Latin America and Asia grewby 5 to 10 percent from 1960 to 1970 and from 1970 to 1980. In Asia, these rates acceleratedto over 20 percent from 1980 to 1990 and from 1990 to 2000. In Latin America, althoughthe rates slipped somewhat from 1980 to 1990, the growth of food production rebounded toa more than 15 percent increase from 1990 to 2000. Only in countries with birth rates of 3percent or more, as in parts of Sub-Saharan Africa, or where there were major social upheavals,such as Central America, Bangladesh, Cambodia, and Vietnam, is this picture particularlymisleading. Throughout the periphery, the incidence of chronic hunger and malnourishmenthas declined since 1970, however, despite civil strife, wars, and natural disasters such asdroughts, floods, and earthquakes.
At the same time, however, the incidence of rural indebtedness and poverty and the loss ofland for food production to meet local demand have increased enormously. This is becauseincreased agricultural production in the context of the world economy is no guarantee thatthe people involved in achieving it will see its fruits. This chapter has attempted to show howthis can be the case by detailing the effects of progressive commercialization and capitalization.When export crops displace subsistence uses and food staple production, increased agriculturalproduction does not necessarily benefit rural populations. Far from it: They often findthemselves ensnared in webs of poverty and indebtedness that are the direct product of modernscientific agriculture in contexts where there are few alternatives to agricultural employment.In reaching this conclusion, the argument of this chapter has involved making the followingmajor points:
1. Agriculture is often given a subsidiary role in models of development followed bygovernments even when it is a vital source of sustenance and employment. For a variety of
SPATIAL TRANSFORMATION OF CORE AND PERIPHERY272
6063 GEOGRAPHY WORLD ECON_PT_246x189 mm 22/01/2014 15:10 Page 272
reasons, national government pricing and credit policies have tended to drain agriculturein favor of the industrial–urban sector.
2. The three continents of the periphery—Africa, Asia and Latin America—differ significantlyin terms of agricultural organization and performance.
3. It is also important to recognize that in agriculture in the LDCs, it is the women ratherthan the men who are overwhelmingly more important as the source of workers, especiallyin Sub-Saharan Africa.
4. There is a long history of commercial agriculture in the periphery. Until recently, however,it was a plantation or export enclave sector surrounded by a largely subsistence sector.
5. Agriculture, particularly when based in small labor-intensive household farms and leadingto increases in food and crop production of benefit to local communities, has a vital role to play in laying the foundation for subsequent economic development across othersectors.
6. Rural land reform has tended to encourage the development of capitalist agriculture ratherthan benefit the interests of peasant farmers.
7. Rural land reform, and the recent activities of governments and transnational corporationshave produced a much more widespread commercialization and capitalization (increasinglycapital-intensive type) of agriculture. This has been most marked in Latin America but canalso be seen elsewhere.
8. “Scientific” agriculture has tended to reflect and reinforce the capitalization of agricultureeven as it has increased yields for a limited number of agricultural products, mainly a fewstaples such as rice and wheat and others in the export trade.
KEY SOURCES AND SUGGESTED READINGDe Janvry, A., 1984. The Role of Land Reform in Economic Development: Policies and politics, in C.K.
Eicher and J.M. Staatz (eds.), Agricultural Development in the Third World. Baltimore, MD: JohnsHopkins University Press.
Fine, B., 1994. Towards a Political Economy of Food, Review of International Political Economy 3,519–545.
Goodman, D., 2003. The Quality “Turn” and Alternative Food Practices: Reflections and agenda, Journalof Rural Studies 19, 1–7.
Hayami, Y., 1984. Assessment of the Green Revolution, in C.K. Eicher and J.M. Staatz (eds.), AgriculturalDevelopment in the Third World. Baltimore, MD: Johns Hopkins University Press.
Hesse, M., Schmitt, J., and Wagner, W. (eds.), 2013. Deutsche Bank backs Ruthless “Rubber Lords,”Der Spiegel (English Edition), May 15.
Joekes, S.P., 1987. Women in the World Economy. New York: Oxford University Press.McMahon, P., 2013. Feeding Frenzy: The politics of food. London: Profile Books.Rosenthal, E., 2013. As Biofuel Demand grows, so do Guatemala’s Hunger Pangs. New York Times,
January 5.Rosset, P., Patel, R., and Courville, M. (eds.), 2007. Promised Land: Competing visions of agrarian reform.
San Francisco: Food First.Studwell, J., 2013. How Asia Works: Success and failure in the world’s most dynamic region. London:
Profile Books.Swindell, K., 1985. Farm Labor. Cambridge: Cambridge University Press.Warman, A., 1980. “We Come to Protest”: The peasants of Morelos and the national state. Baltimore,
MD: Johns Hopkins University Press.
9. AGRICULTURE: THE PRIMARY CONCERN 273
6063 GEOGRAPHY WORLD ECON_PT_246x189 mm 22/01/2014 15:10 Page 273
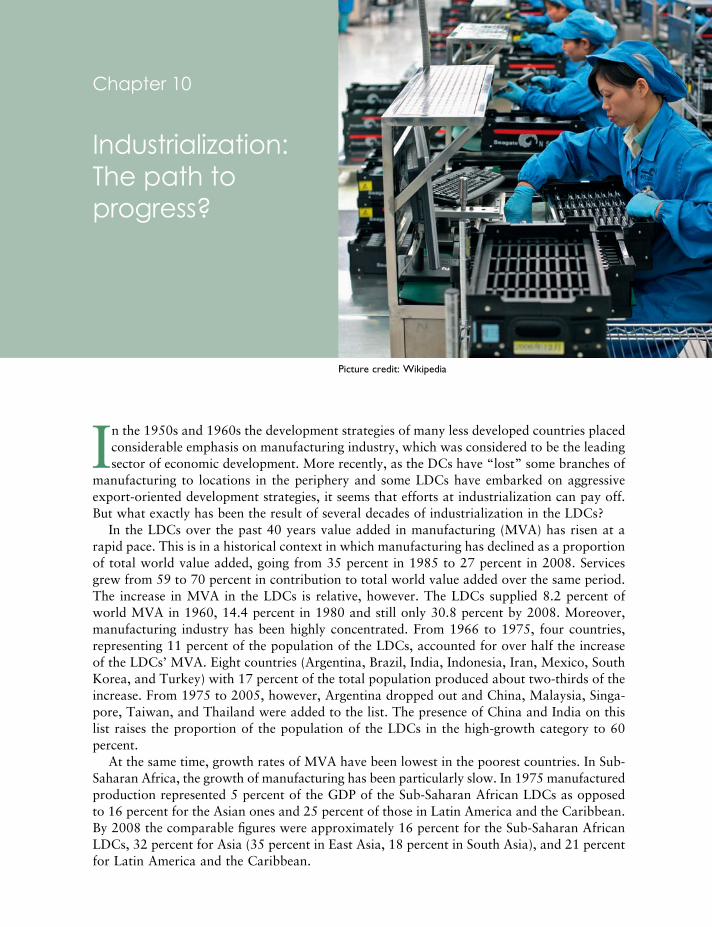
In the 1950s and 1960s the development strategies of many less developed countries placedconsiderable emphasis on manufacturing industry, which was considered to be the leadingsector of economic development. More recently, as the DCs have “lost” some branches of
manufacturing to locations in the periphery and some LDCs have embarked on aggressiveexport-oriented development strategies, it seems that efforts at industrialization can pay off.But what exactly has been the result of several decades of industrialization in the LDCs?
In the LDCs over the past 40 years value added in manufacturing (MVA) has risen at arapid pace. This is in a historical context in which manufacturing has declined as a proportionof total world value added, going from 35 percent in 1985 to 27 percent in 2008. Servicesgrew from 59 to 70 percent in contribution to total world value added over the same period.The increase in MVA in the LDCs is relative, however. The LDCs supplied 8.2 percent ofworld MVA in 1960, 14.4 percent in 1980 and still only 30.8 percent by 2008. Moreover,manufacturing industry has been highly concentrated. From 1966 to 1975, four countries,representing 11 percent of the population of the LDCs, accounted for over half the increaseof the LDCs’ MVA. Eight countries (Argentina, Brazil, India, Indonesia, Iran, Mexico, SouthKorea, and Turkey) with 17 percent of the total population produced about two-thirds of theincrease. From 1975 to 2005, however, Argentina dropped out and China, Malaysia, Singa -pore, Taiwan, and Thailand were added to the list. The presence of China and India on thislist raises the proportion of the population of the LDCs in the high-growth category to 60percent.
At the same time, growth rates of MVA have been lowest in the poorest countries. In Sub-Saharan Africa, the growth of manufacturing has been particularly slow. In 1975 manufacturedproduction represented 5 percent of the GDP of the Sub-Saharan African LDCs as opposedto 16 percent for the Asian ones and 25 percent of those in Latin America and the Caribbean.By 2008 the comparable figures were approximately 16 percent for the Sub-Saharan AfricanLDCs, 32 percent for Asia (35 percent in East Asia, 18 percent in South Asia), and 21 percentfor Latin America and the Caribbean.
Picture credit: Wikipedia
Chapter 10
Industrialization:The path toprogress?
6063 GEOGRAPHY WORLD ECON_PT_246x189 mm 22/01/2014 15:10 Page 274
In all LDCs, irrespective of their growth rates, industrial production has been characterizedby a particular expansion of heavy industries: Iron and steel, machinery, and chemicals. Overthe entire period 1950–2000 this expansion was more rapid than the growth of food processingor textile, clothing, and shoe industries. This point needs emphasizing because of the tendencyto assume, because of increasing exports of goods such as clothing and shoes to Europe andthe United States, that light and consumer goods industries have grown the most. However,since the 1970s, the industrial mix of many LDCs has undergone significant change. After theSecond World War, industrialization, even if involving foreign investment by TNCs, was largelyconcerned with import substitution. Since the early 1960s the possibilities of substitution have dwindled in the face of the mounting costs of establishing heavy industries and assubcontracting and global sourcing by TNCs have replaced the older strategy of directestablishment of subsidiaries. In this changed global context, a fundamental reorientation hastaken place in the most industrialized LDCs in East Asia and Latin America. In these countries,an increasing proportion of industry is oriented towards exporting manufactured goods, mostlyto the developed countries.
The shift towards an export orientation was facilitated by rapid economic growth (andincreasing consumer incomes) in the developed countries (especially in Europe and Japan) and the liberalization of world trade beginning in the 1960s. Above all, however, it reflects a change in national industrialization strategy. The role of the state remains central. Like importsubstitution, export-oriented development strategies involve a strong managerial role for thestate in adjusting to changing global pressures. The states that have been most successful indoing so, such as China, South Korea and Taiwan, are now among the leading industrializers.But the ideological and institutional context has changed fundamentally. The focus has movedfrom self-sufficiency in a world of national economies to gaining competitive advantage in aworld economy organized around principles of market access.
In this chapter, the progress of manufacturing industrialization in the LDCs is examinedin four complementary ways. First, the national and global stimuli to industrialization aredescribed. Particular attention is directed towards the role of industrialization in nationalideologies of modernization, the practical basis to the demand for industrialization and theglobal context for the shift from import substitution to export-oriented export strategies. Second,the problems facing industrialization in the LDCs are reviewed, focusing on the limits toindustrialization posed by certain national-level and global constraints. Third, the geographicalpattern of industrialization is surveyed at global, regional and urban scales. Finally,industrialization in Russia and China is profiled. China, in particular, is examined for itsexperience of industrialization over the recent past because it calls into question the sustaina-bility of the core–periphery structure of the world economy as it has previously been organized.Along with such growing industrial powers as Brazil, Russia, and India, China’s rapid risewithin the global manufacturing system signals a shift towards a very different world economy.The BRIC (Brazil, Russia, India, and China) economies are seen by some com mentators asthe beneficiaries of increasingly export-oriented globalization.
10.1 NATIONAL AND GLOBAL STIMULI TO INDUSTRIALIZATIONThe central attention given by many LDCs to industry is partly a result of the prestige of thissector, which is widely considered the hallmark of development. Although the notion of“industrialization-in-general” can be criticized on grounds of vagueness and lack of attentionto the specific mix of industries and their relation to the needs of the mass of the population,industrialization figures prominently in most national ideologies of modernization. Perhaps
10. INDUSTRIALIZATION: THE PATH TO PROGRESS? 275
China for part of the 1960s was something of an exception, at least in theory; but even therethe lure of industrialization as a development strategy proved stronger than ideologicalcommitment to rural–agricultural development.
Interestingly, in the core of the world economy, particularly in Europe, industrializationhas always given rise to various “discontents.” Contempt for the production of worldly goodsshows up even in the writings of the classical economist, Adam Smith. Later concerns havebeen more with the nature of industrialization, in particular the “balance” between heavy and consumer goods industries. These ideas have had their most vocal expression among thoseEast Europeans who decried the “overemphasis” of the now defunct communist govern-ments on heavy industry and Latin American complaints about the “lack” of heavy industry.However, the association between industrialization and progress is now strongly established.Only environmental activists, a rare breed in most LDCs, question the unrelenting prioritygiven to industrial development.
THREE MYTHS
Three ideas of mythic proportions are at the center of the claim that national industrializationis the path to progress, even though they are of questionable empirical validity. Interestingly,they all involve negative views of agriculture as much as positive endorsements of industryand they all imply a simple sectoral logic of development as movement from agriculture toindustry. The word “myth” does not imply falsehood so much as an unexamined idea thatcomes to guide thought and action.
First, agriculture is viewed as having more limited stimulus effects on other economic activitiesthan industry. In other words, industry is seen as providing multiplier effects (new knowledge,new products, stimulative effects on the service sector, etc.) that agriculture cannot provide.The best refutation of this particular idea is the key role that agriculture played in the earlyindustrialization of Europe and the continued importance of agriculture in the economies ofthe developed world. Of course, in each case investment was required to develop forwardlinkages to consumer industry (food processing, etc.) and backward linkages to input providers(fertilizers, etc.). In each case, farmers were also important as consumers of industrial products,when not penalized by low prices for their products, and as significant financiers of industrialinvestment, through savings and taxation. Adelman (1984) has proposed that precisely these stimulative features of agriculture can be used to substitute “agriculture-demand-led-industrialization” (ADLI) for import substitution and export-oriented development models.
Second, farmers have a reputation for conservatism whereas industrialists (and workers)are viewed as agents of modernization. Imprisoned in ancient and traditional cultures, farmers,especially peasant farmers, are without dynamism and rationality. Yet, again, this idea is easilyrefuted by evidence from all over the world. For example, as shown in Chapter 9, there is astrong link between producer prices and yields of rice in different Asian countries. Corn (maize)production in Thailand, bean production in the Sudan, and wheat production in India andPakistan have all increased as prices have increased and decreased when prices have declined.These are hardly indications of conservatism and lack of responsiveness to commercialincentives.
Third, for many governments industry is seen as the only productive sector. Only inindustry, the argument goes, are there increasing marginal returns through economies of scale in production. Moreover, the average productivity of workers in industry is higher thanthat of those in agriculture. However, the productivity of other factors, capital in particular,is probably higher in agriculture. In most of the countries for which data exist, the gross marginal
SPATIAL TRANSFORMATION OF CORE AND PERIPHERY276
6063 GEOGRAPHY WORLD ECON_PT_246x189 mm 22/01/2014 15:10 Page 276
capital–output ratio is lower and so productivity is higher in agriculture than in other sectors.In the United States, the only country with a sufficiently long statistical series, the totalproductivity of all factors has increased faster in agriculture than in other sectors.
PRACTICAL RATIONALES FOR INDUSTRIALIZATION
Whatever the empirical merit of the three ideas, they have become firmly entrenched andassociated with modernization through industrialization. Manufacturing industry is widelyviewed as the path to progress and it figures prominently in most national developmentideologies and plans. These ideologies, whatever precise roles they reserve for “private”business and state direction, have been reinforced by certain practical problems facing mostgovernments. There are perhaps three that appear most important. One of them concerns theterms of trade in exchanging primary commodities for manufactured goods. As suggested inChapter 9, there are good grounds for pessimism about the growth potential in general ofprimary production (raw materials and agricultural exports) because of the long-term trendof deteriorating barter terms of trade with manufactured goods. However, for specific primarycommodities and specific countries, investment in primary production can be preferable. Since2000 prices of many basic commodities have trended upwards and the barter terms of tradebetween primaries and manufactured goods has become less disadvantageous. Nevertheless,by and large, governments have not been persuaded of the virtues of agricultural (or resource)specialization. They can even point to the case of the OPEC cartel—the most successful attemptin the history of the world economy to bolster the price of a primary commodity—to illustratethe limitations of primary production. From its dominant position in 1973–1974, OPEC hasbecome less and less able to govern the world price of oil. This reflects both adjustment strategiesin consumer countries (energy conservation, shifts to non-OPEC suppliers), and the emergenceof political conflicts and different production strategies among member countries (the Iran/Iraqwar of the 1980s; long-term market share and conservation of oil reserves versus rapidproduction, for example, Saudi Arabia versus Nigeria). It is easy to infer from the experienceof OPEC the long-run limitations of a development strategy based on primary production forworld markets.
Second, many LDCs have massive unemployed and underemployed populationsconcentrated increasingly in urban areas. Deteriorating living conditions in the countryside(see Chapter 9) and the availability of better public services in urban areas have encouragedlarge-scale rural-to-urban migration, often in the absence of industrialization. To survive inthe cities, people engage in a wide range of “informal sector” economic activities as streetvendors, shoeshine boys, stall keepers, public letter writers, auto mechanics, taxi drivers,subcontractors, tailors, drug dealers, and prostitutes. Sometimes these activities can be linkedto industrialization of a formal variety through subcontracting, but often they cannot.International migration, both temporary and permanent, is sometimes an alternative for thosewith better education and greatest initiative. But, among other things, this produces a “braindrain” that poor countries can ill afford. It is in this context that expansion of employmentin manufacturing industry can often become an important national imperative.
A third incentive for industrialization comes from the state-building activities of nationalélites. National industrialization can be a “prestige” goal around which national populationscan be mobilized. All governments are also under pressure to industrialize in order to competewith other countries. Pressure comes from both domestic élites, especially the military, andfrom foreign allies and patrons. Some of the emphasis on heavy industries undoubtedly derivesfrom this pressure. The significant growth of military industries in the LDCs is directly related
10. INDUSTRIALIZATION: THE PATH TO PROGRESS? 277
6063 GEOGRAPHY WORLD ECON_PT_246x189 mm 22/01/2014 15:10 Page 277
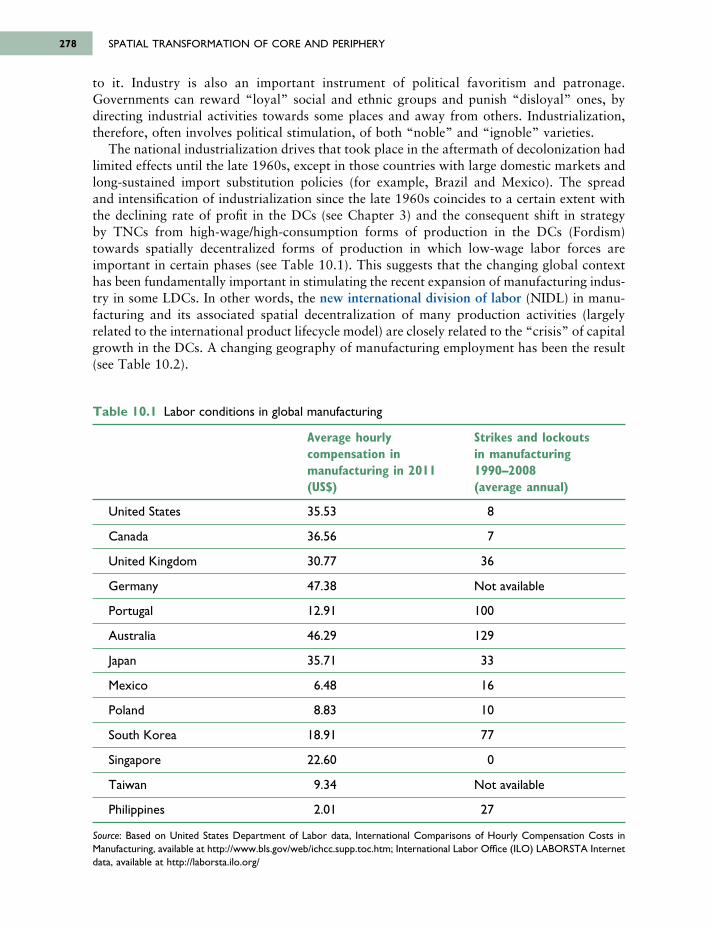
to it. Industry is also an important instrument of political favoritism and patronage.Governments can reward “loyal” social and ethnic groups and punish “disloyal” ones, bydirecting industrial activities towards some places and away from others. Industrialization,therefore, often involves political stimulation, of both “noble” and “ignoble” varieties.
The national industrialization drives that took place in the aftermath of decolonization hadlimited effects until the late 1960s, except in those countries with large domestic markets andlong-sustained import substitution policies (for example, Brazil and Mexico). The spread and intensification of industrialization since the late 1960s coincides to a certain extent withthe declining rate of profit in the DCs (see Chapter 3) and the consequent shift in strategy by TNCs from high-wage/high-consumption forms of production in the DCs (Fordism)towards spatially decentralized forms of production in which low-wage labor forces areimportant in certain phases (see Table 10.1). This suggests that the changing global contexthas been fundamentally important in stimulating the recent expansion of manufacturing indus-try in some LDCs. In other words, the new international division of labor (NIDL) in manu -facturing and its associated spatial decentralization of many production activities (largely related to the international product lifecycle model) are closely related to the “crisis” of capitalgrowth in the DCs. A changing geography of manufacturing employment has been the result(see Table 10.2).
SPATIAL TRANSFORMATION OF CORE AND PERIPHERY278
Table 10.1 Labor conditions in global manufacturing
Average hourly Strikes and lockouts compensation in in manufacturing manufacturing in 2011 1990–2008 (US$) (average annual)
United States 35.53 8
Canada 36.56 7
United Kingdom 30.77 36
Germany 47.38 Not available
Portugal 12.91 100
Australia 46.29 129
Japan 35.71 33
Mexico 6.48 16
Poland 8.83 10
South Korea 18.91 77
Singapore 22.60 0
Taiwan 9.34 Not available
Philippines 2.01 27
Source: Based on United States Department of Labor data, International Comparisons of Hourly Compensation Costs inManufacturing, available at http://www.bls.gov/web/ichcc.supp.toc.htm; International Labor Office (ILO) LABORSTA Internetdata, available at http://laborsta.ilo.org/
6063 GEOGRAPHY WORLD ECON_PT_246x189 mm 22/01/2014 15:10 Page 278
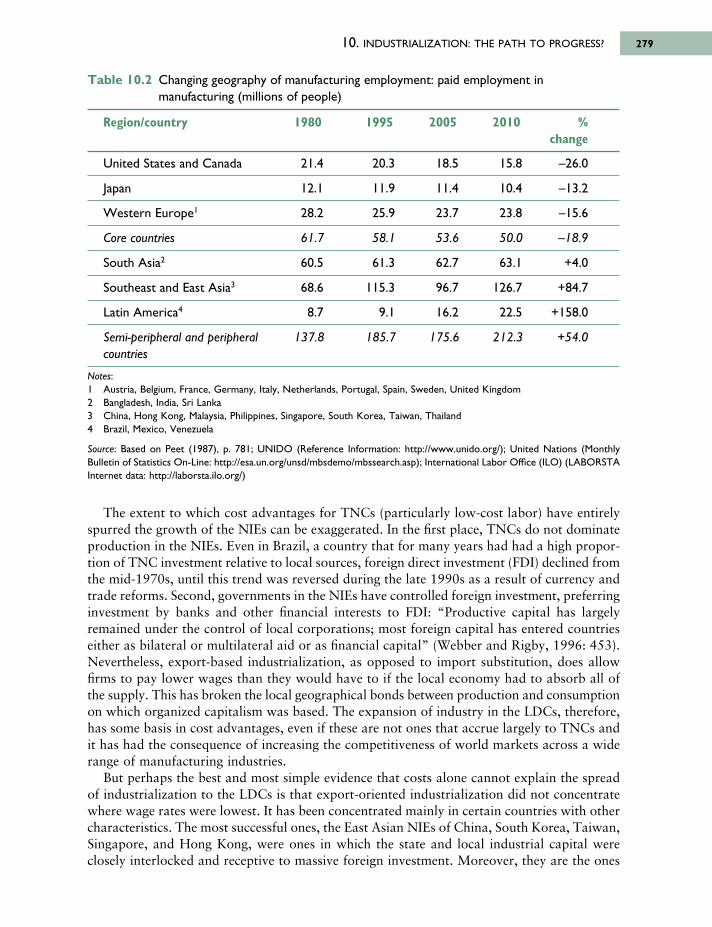
The extent to which cost advantages for TNCs (particularly low-cost labor) have entirelyspurred the growth of the NIEs can be exaggerated. In the first place, TNCs do not dominateproduction in the NIEs. Even in Brazil, a country that for many years had had a high propor -tion of TNC investment relative to local sources, foreign direct investment (FDI) declined fromthe mid-1970s, until this trend was reversed during the late 1990s as a result of currency andtrade reforms. Second, governments in the NIEs have controlled foreign investment, preferringinvestment by banks and other financial interests to FDI: “Productive capital has largelyremained under the control of local corporations; most foreign capital has entered countrieseither as bilateral or multilateral aid or as financial capital” (Webber and Rigby, 1996: 453).Nevertheless, export-based industrialization, as opposed to import substitution, does allowfirms to pay lower wages than they would have to if the local economy had to absorb all ofthe supply. This has broken the local geographical bonds between production and consumptionon which organized capitalism was based. The expansion of industry in the LDCs, therefore,has some basis in cost advantages, even if these are not ones that accrue largely to TNCs andit has had the consequence of increasing the competitiveness of world markets across a widerange of manufacturing industries.
But perhaps the best and most simple evidence that costs alone cannot explain the spreadof industrialization to the LDCs is that export-oriented industrialization did not concentratewhere wage rates were lowest. It has been concentrated mainly in certain countries with othercharacteristics. The most successful ones, the East Asian NIEs of China, South Korea, Taiwan,Singapore, and Hong Kong, were ones in which the state and local industrial capital wereclosely interlocked and receptive to massive foreign investment. Moreover, they are the ones
10. INDUSTRIALIZATION: THE PATH TO PROGRESS? 279
Table 10.2 Changing geography of manufacturing employment: paid employment inmanufacturing (millions of people)
Region/country 1980 1995 2005 2010 % change
United States and Canada 21.4 20.3 18.5 15.8 –26.0
Japan 12.1 11.9 11.4 10.4 –13.2
Western Europe1 28.2 25.9 23.7 23.8 –15.6
Core countries 61.7 58.1 53.6 50.0 –18.9
South Asia2 60.5 61.3 62.7 63.1 +4.0
Southeast and East Asia3 68.6 115.3 96.7 126.7 +84.7
Latin America4 8.7 9.1 16.2 22.5 +158.0
Semi-peripheral and peripheral 137.8 185.7 175.6 212.3 +54.0countries
Notes:1 Austria, Belgium, France, Germany, Italy, Netherlands, Portugal, Spain, Sweden, United Kingdom2 Bangladesh, India, Sri Lanka3 China, Hong Kong, Malaysia, Philippines, Singapore, South Korea, Taiwan, Thailand4 Brazil, Mexico, Venezuela
Source: Based on Peet (1987), p. 781; UNIDO (Reference Information: http://www.unido.org/); United Nations (MonthlyBulletin of Statistics On-Line: http://esa.un.org/unsd/mbsdemo/mbssearch.asp); International Labor Office (ILO) (LABORSTAInternet data: http://laborsta.ilo.org/)
6063 GEOGRAPHY WORLD ECON_PT_246x189 mm 22/01/2014 15:10 Page 279
in which much of the foreign investment was in the form of private bank credit or strategicalliances between TNCs and local partners rather than direct investment by TNCs. In thisway, they maintained more local control over investment decisions. In addition, the privilegedgeopolitical arrangements of South Korea and Taiwan with the United States were importantin opening U.S. markets and making available U.S. aid and investment in return for the EastAsian countries’ forward role in “containment” of mainland China and the Soviet Union. Sincethe late 1980s there has been an increased level of FDI in East Asia, much of it flowing betweenEast Asian countries rather than emanating from outside the region. The East Asian financialcrisis of 1997 reinforced this trend as some FDI that would otherwise have gone into SoutheastAsian countries (for example, Thailand, the Philippines, and, especially, Indonesia), wasdiverted to East Asian countries (for example, South Korea, Taiwan, as well as China andHong Kong). Indeed, between 1991 and 2000 private financial flows to the LDCs grew rapidlyafter stagnating in the 1980s but “official” (governments, World Bank, etc.) investment tailedoff having been more important than private flows throughout the 1980s. This has led somecommentators to see a foundation being laid for a future boom in peripheral industrialization.However, though the global context may well trigger the possibility for industrialization,especially of the export-oriented type, it never guarantees its realization. Various contingencies—political, economic, social—intervene to determine where it takes place.
10.2 LIMITS TO INDUSTRIALIZATION IN THE PERIPHERY
There are a number of constraints that will probably limit the spread and intensification ofthe export-oriented industrialization that has lain behind the impressive growth of the NIEsin particular and the semi-peripheral and peripheral countries in general since the 1970s.
PROFIT CYCLES
The declining rates of profit in the DCs—between the 1960s and the mid-1980s—may havebeen cyclical rather than secular. There is evidence that corporate profitability in the USA, forexample, began to rebound in the late 1980s after a 15-year downturn. The more criticalanalyses of this trend argue that the return to profitability has been fueled by stagnant wagerates. This may mean that locating production facilities or engaging in subcontracting in theLDCs can be less attractive to U.S. TNCs as labor costs go down in the core. However, thefigures (as reported by the U.S. Department of Commerce, for example, 4.57 percent averageafter-tax return on capital in manufacturing in the USA in 1988 compared to 2.87 percent in 1985, 3.99 percent in 1975 and 4.80 percent in 1965) may reflect the falling dollar after1985 helping U.S. manufacturers in foreign markets and the increased return on foreigninvestments rather than improving domestic profitability (for example, the European operationsof General Motors lifted what would otherwise have been an even more dismal rate ofprofitability in the late 1980s). Certainly the picture is a complex one, with not only countriesbut also industrial sectors (electronics, automobiles, etc.) having different trajectories in profitrates over time.
In addition, some of the major U.S. TNCs, such as IBM and GE, that pioneered the shiftin production to the new international division of labor (NIDL) through the creation of foreign assembly operations in the LDCs have become lackluster performers, challenged inthe most profitable production lines by more innovative smaller firms with currently morelocalized patterns of production in industrial districts because of their reliance on immed-iate response from independent subcontractors. Overall, however, many companies with their
SPATIAL TRANSFORMATION OF CORE AND PERIPHERY280
6063 GEOGRAPHY WORLD ECON_PT_246x189 mm 22/01/2014 15:10 Page 280
origins in different countries, not just those that faced profit crises in the 1970s, have developedand become committed to supply chains that extend across multiple locations in differentcountries.
PROTECTIONISM
There are inherent limits to the generalization to other LDCs of the export successes of theNIEs. To begin with, the period 1950–1973 was one of unusually high growth in world trade.Whereas global trade expanded only at 1 percent per annum during 1910–1940, the period1953–1973 saw an increase in total trade of 8 percent per annum, and of 11 percent per annumfor manufactures. The consequence was an increased interdependence in the world economyas trade barriers were lowered. Since the late 1970s, however, protectionism has remained aresponse in the DCs in times of declining rates of economic growth and increased unemploy -ment, domestic inflation and balance of payments deficits. It is the LDCs that have becomethe major advocates of global trade liberalization. Cline (1982) estimated that if all the LDCshad the same export intensity as Hong Kong, Singapore, South Korea, and Taiwan, there wouldbe a shift from 16.4 to 60.4 percent of aggregate DC manufactured imports originating in theLDCs. Given the reliance of the NIEs on DC markets, the likelihood of this expansion withoutprotectionist responses seems extremely unlikely. As Cline (1982: 89) concludes:
It is seriously misleading to hold up the East Asian G4 [Gang of Four, i.e., Hong Kong, Singapore,South Korea, and Taiwan] as a model of development because that model almost certainly cannotbe generalized without provoking [a] protectionist response ruling out its implementation.
Of course, Cline’s generalization from the current NIEs to all LDCs represents an extremescenario. There is still considerable scope for building up export markets in both DCs andother LDCs. In particular, there is evidence that the established NIEs are now transferringsome of their more labor intensive industries to countries that have a short-run comparativeadvantage. For example, Taiwanese firms have subsidiaries in China and Malaysia, and HongKong firms have subsidiaries in China and the Philippines. Among the LDCs, consequently,adjacent countries are not necessarily condemned to see their neighbors who enjoy an initialadvantage permanently monopolize the positions they have won in world markets, even thoughthey must of necessity start out as subservient to them.
ACCESS TO TECHNOLOGY
The TNCs that have been involved in setting up subsidiaries or engaging subcontractors inthe NIEs must now respond to protectionist pressures in the DCs in which their final marketsare concentrated. This will involve substituting radical new automation technologies for low-wage labor. Even if the technology diffuses evenly at a global scale, production costs will declinemore steeply in the DCs than in the NIEs. In addition, economies of scale associated withbatch production for customized as opposed to mass markets and external economies associ -ated with a close geographical integration of component suppliers and final assembly in just-in-time (JIT) and zero inventory production systems can reduce the attractiveness of globalsourcing. There is already evidence that some assembly of electronic circuits is being broughtback to DCs from LDCs, and the introduction of new technologies and new production systemsmay further reduce the need for cheap, unskilled labor.
10. INDUSTRIALIZATION: THE PATH TO PROGRESS? 281
6063 GEOGRAPHY WORLD ECON_PT_246x189 mm 22/01/2014 15:10 Page 281
It is important to note again, however, that the growth of the NIEs is not uniquely due tothe activities of foreign TNCs. Domestic firms, including an increasing number of TNCs fromthe NIEs themselves play important roles, particularly in such export sectors as electronics,automobiles, textiles, clothing, and shoes. By 2000, for example, foreign sales accounted formore than 25 percent of total sales for the ten largest East Asian TNCs (as ranked by foreignassets, for example, Hutchinson Whampoa from Hong Kong, Samsung from South Korea).Only in Latin America and, to a certain degree, in China have the expansion of foreign TNCsand the growth of exports been closely related; but the control of foreign TNCs over most ofthe new automation and information technologies can limit their transfer when these TNCsare not locally dominant.
DEBT AND CREDITWORTHINESS
The success of export-oriented industrialization has been tied to the growth of enormous debtloads underwritten by FDI, official aid agencies and international banks. Among the mostproblematic features of the world economy by the late 1990s was the absence of any newgroups willing to finance industrialization in the LDCs and the appearance of a global creditshortage because of the emergence of Eastern Europe (especially the former East Germany)and the former Soviet Union (particularly Russia) as competitors in world financial markets.The institutions that did play a central role in the past are largely unwilling to do so now.Perhaps the only institution that has substantially increased its lending and encouraged othersto do likewise is the International Monetary Fund (IMF). But the IMF still lends relativelylittle compared to the size of LDCs’ current account deficits and attaches conditions to loansthat many countries with strong state direction find undesirable and damaging to long-rundevelopment.
Even in the 1970s lending, especially private bank lending, was concentrated in the LDCswith relatively high per capita incomes and those with already impressive growth records. Thefour largest borrowers (Mexico, Brazil, South Korea, and the Philippines) accounted for over60 percent of total accumulated non-OPEC LDCs’ debt to international banks in December1982. Much of the money lent came from recycled petrodollars in the context of declines incredit demand from traditional clients in the DCs in the wake of the 1974–1975 recession.This situation is not likely to repeat itself even though in the 1990s private lending from banksand stock markets to East Asia and Latin America did increase after declining precipitouslyin the 1980s.
RESEARCH AND DEVELOPMENT (R&D) CAPACITY
The leading sectors of industrial growth in the world economy are the information technologies.The USA, Europe, and Japan lead the way in world demand for these technologies and theirproducts. Consequently, success in the global information processing and electronics industriesrequires a research and development (R&D), production, marketing and political lobbyingbase inside all three regions of demand. Given the importance of politics—especially in theform of lobbying against protectionist threats—established TNCs and countries with large publicsector investments in information technologies are at a distinct advantage. Those com paniesand countries struggling to gain entry beyond the labor intensive, assembly level will be faced with formidable barriers, not least the absence of local protection in the face ofU.S.-led attempts in such international institutions as the GATT over the past ten years atderegulation of LDC domestic markets.
SPATIAL TRANSFORMATION OF CORE AND PERIPHERY282
6063 GEOGRAPHY WORLD ECON_PT_246x189 mm 22/01/2014 15:10 Page 282
POLARIZATION AND INSTABILITY
The non-city-state NIEs (the experience of Singapore and Hong Kong is not immediately relevantto most LDCs) with the highest growth rates—particularly China, South Korea, and Taiwan—have enjoyed a unique set of circumstances that are not generalizable to other peripheral settings.In particular, the last two inherited the transport and education infrastructure imposed byJapanese colonialism. Later, massive U.S. aid in the 1950s—for geopolitical purposes—stabilized their economies and tight controls on imports plus government allocation of foreignexchange and capital promoted export-led growth. In addition to land reform (see Chapter9) in South Korea and Taiwan (and latterly in China), state enterprises were a key part ofnational growth strategies in the 1970s, accounting for 25 percent to 35 percent of total fixedinvestment. In South Korea—following the practice of Japan—interest subsidies and otherincentives that rewarded performance were employed to induce private companies to developmajor industries and focus on exports.
Crucially, relatively equal income distribution in South Korea—where the richest 20 percentreceive 5.3 times the income of the poorest 20 percent—has allowed the government to adoptpolicies pursuing efficiency and growth with limited social and political unrest. By contrast,Latin American countries such as Brazil (until its fiscal reforms, beginning in 1994), wherethe comparable income differential exceeds a factor of 26, have run larger government budgetdeficits through financing redistributive programs to the poor that help prevent political unrestwhile yielding to the demands of the rich to limit taxation. In such circumstances the extremeinequality of incomes limits government fiscal flexibility (see Table 10.3). Inevitably, politicsin the face of great income inequalities tends to favor the status quo and works against theinnovation needed for manufacturing industries to prosper.
WEIGHT OF POPULATION GROWTH
Finally, it seems that export-oriented industries can make, and have already made, an importantcontribution to the creation of new employment in certain small countries. However, it wouldprobably be a mistake to believe that these industries can make anything other than a marginalcontribution to employment in the periphery as a whole. As of 1980 the World Bank estimatedthe total number of direct jobs created by export industries in the poorest LDCs as between2 and 3 million, about 10 percent of total industrial employment in these countries, or, inother terms, less than 0.5 percent of the total labor force of some 850 million people. Evenconsidering multiplier effects, the total number of direct and indirect jobs created came to5–10 million, around 1 percent of the total labor force. As this labor force of over 1 billiontoday is growing at an annual rate of 2.0 percent (down from 2.3 percent in the 1980s and1990s), the number of workers added every year to the total labor force is about twice aslarge as the entire labor force employed in jobs created by export-oriented manufacturing.Across all LDCs, therefore, export industries cannot possibly absorb the additional labor forcearriving each year or even reabsorb those unemployed due to cyclical shifts in demand forexport products. Even restricting attention to seven NIEs (Brazil, Egypt, India, Mexico, thePhilippines, South Korea, and Taiwan), total jobs created during the 1960s by the export ofmanufactured goods represented only 3 percent of total employment. However, for smallcountries with high levels of industrial exports the picture is somewhat different. So in Taiwanin 1969 one job in six was created by manufactured exports and in South Korea in 1970 onejob in ten was created by exports of all kinds. These numbers doubled in the 1980s. Moreover,for the city-states such as Hong Kong and Singapore, with their dynamic producer service
10. INDUSTRIALIZATION: THE PATH TO PROGRESS? 283
6063 GEOGRAPHY WORLD ECON_PT_246x189 mm 22/01/2014 15:10 Page 283
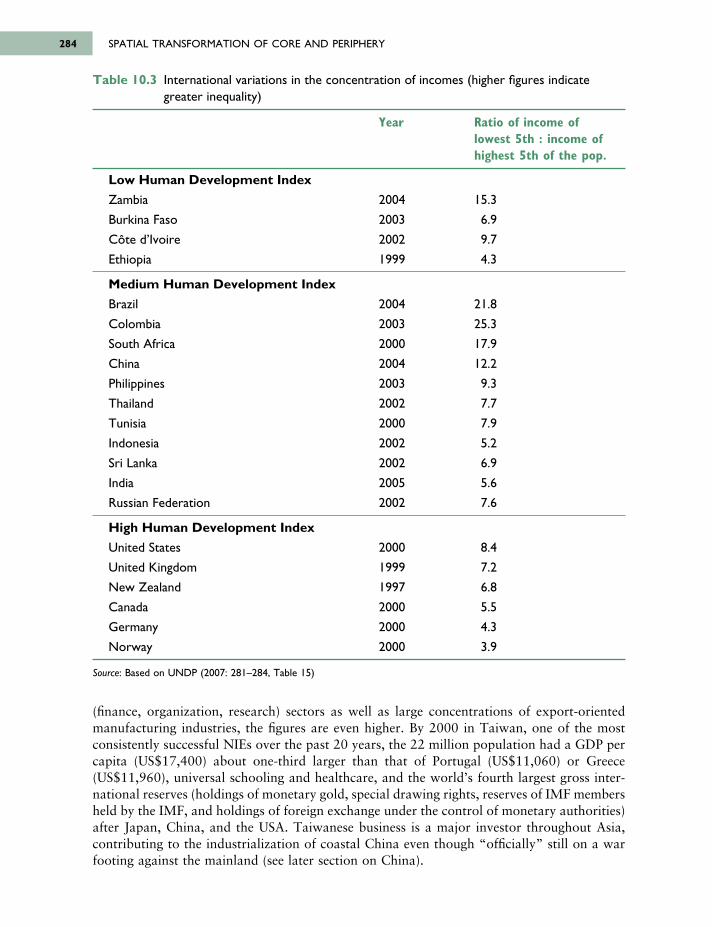
(finance, organization, research) sectors as well as large concentrations of export-orientedmanufacturing industries, the figures are even higher. By 2000 in Taiwan, one of the mostconsistently successful NIEs over the past 20 years, the 22 million population had a GDP percapita (US$17,400) about one-third larger than that of Portugal (US$11,060) or Greece(US$11,960), universal schooling and healthcare, and the world’s fourth largest gross inter -national reserves (holdings of monetary gold, special drawing rights, reserves of IMF membersheld by the IMF, and holdings of foreign exchange under the control of monetary authorities)after Japan, China, and the USA. Taiwanese business is a major investor throughout Asia,contributing to the industrialization of coastal China even though “officially” still on a warfooting against the mainland (see later section on China).
SPATIAL TRANSFORMATION OF CORE AND PERIPHERY284
Table 10.3 International variations in the concentration of incomes (higher figures indicategreater inequality)
Year Ratio of income of lowest 5th : income ofhighest 5th of the pop.
Low Human Development Index
Zambia 2004 15.3
Burkina Faso 2003 6.9
Côte d’Ivoire 2002 9.7
Ethiopia 1999 4.3
Medium Human Development Index
Brazil 2004 21.8
Colombia 2003 25.3
South Africa 2000 17.9
China 2004 12.2
Philippines 2003 9.3
Thailand 2002 7.7
Tunisia 2000 7.9
Indonesia 2002 5.2
Sri Lanka 2002 6.9
India 2005 5.6
Russian Federation 2002 7.6
High Human Development Index
United States 2000 8.4
United Kingdom 1999 7.2
New Zealand 1997 6.8
Canada 2000 5.5
Germany 2000 4.3
Norway 2000 3.9
Source: Based on UNDP (2007: 281–284, Table 15)
6063 GEOGRAPHY WORLD ECON_PT_246x189 mm 22/01/2014 15:10 Page 284
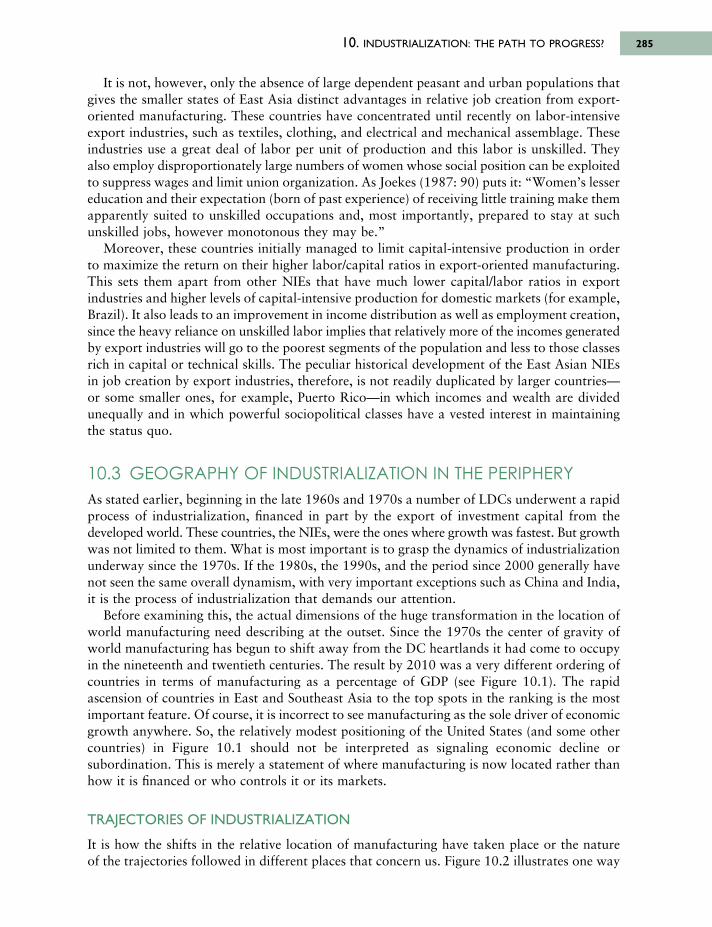
It is not, however, only the absence of large dependent peasant and urban populations thatgives the smaller states of East Asia distinct advantages in relative job creation from export-oriented manufacturing. These countries have concentrated until recently on labor-intensiveexport industries, such as textiles, clothing, and electrical and mechanical assemblage. Theseindustries use a great deal of labor per unit of production and this labor is unskilled. Theyalso employ disproportionately large numbers of women whose social position can be exploitedto suppress wages and limit union organization. As Joekes (1987: 90) puts it: “Women’s lessereducation and their expectation (born of past experience) of receiving little training make themapparently suited to unskilled occupations and, most importantly, prepared to stay at suchunskilled jobs, however monotonous they may be.”
Moreover, these countries initially managed to limit capital-intensive production in orderto maximize the return on their higher labor/capital ratios in export-oriented manufacturing.This sets them apart from other NIEs that have much lower capital/labor ratios in exportindustries and higher levels of capital-intensive production for domestic markets (for example,Brazil). It also leads to an improvement in income distribution as well as employment creation,since the heavy reliance on unskilled labor implies that relatively more of the incomes generatedby export industries will go to the poorest segments of the population and less to those classesrich in capital or technical skills. The peculiar historical development of the East Asian NIEsin job creation by export industries, therefore, is not readily duplicated by larger countries—or some smaller ones, for example, Puerto Rico—in which incomes and wealth are dividedunequally and in which powerful sociopolitical classes have a vested interest in maintainingthe status quo.
10.3 GEOGRAPHY OF INDUSTRIALIZATION IN THE PERIPHERYAs stated earlier, beginning in the late 1960s and 1970s a number of LDCs underwent a rapidprocess of industrialization, financed in part by the export of investment capital from thedeveloped world. These countries, the NIEs, were the ones where growth was fastest. But growthwas not limited to them. What is most important is to grasp the dynamics of industrializationunderway since the 1970s. If the 1980s, the 1990s, and the period since 2000 generally havenot seen the same overall dynamism, with very important exceptions such as China and India,it is the process of industrialization that demands our attention.
Before examining this, the actual dimensions of the huge transformation in the location ofworld manufacturing need describing at the outset. Since the 1970s the center of gravity ofworld manufacturing has begun to shift away from the DC heartlands it had come to occupyin the nineteenth and twentieth centuries. The result by 2010 was a very different ordering ofcountries in terms of manufacturing as a percentage of GDP (see Figure 10.1). The rapidascension of countries in East and Southeast Asia to the top spots in the ranking is the mostimportant feature. Of course, it is incorrect to see manufacturing as the sole driver of economicgrowth anywhere. So, the relatively modest positioning of the United States (and some othercountries) in Figure 10.1 should not be interpreted as signaling economic decline orsubordination. This is merely a statement of where manufacturing is now located rather thanhow it is financed or who controls it or its markets.
TRAJECTORIES OF INDUSTRIALIZATION
It is how the shifts in the relative location of manufacturing have taken place or the natureof the trajectories followed in different places that concern us. Figure 10.2 illustrates one way
10. INDUSTRIALIZATION: THE PATH TO PROGRESS? 285
6063 GEOGRAPHY WORLD ECON_PT_246x189 mm 22/01/2014 15:10 Page 285
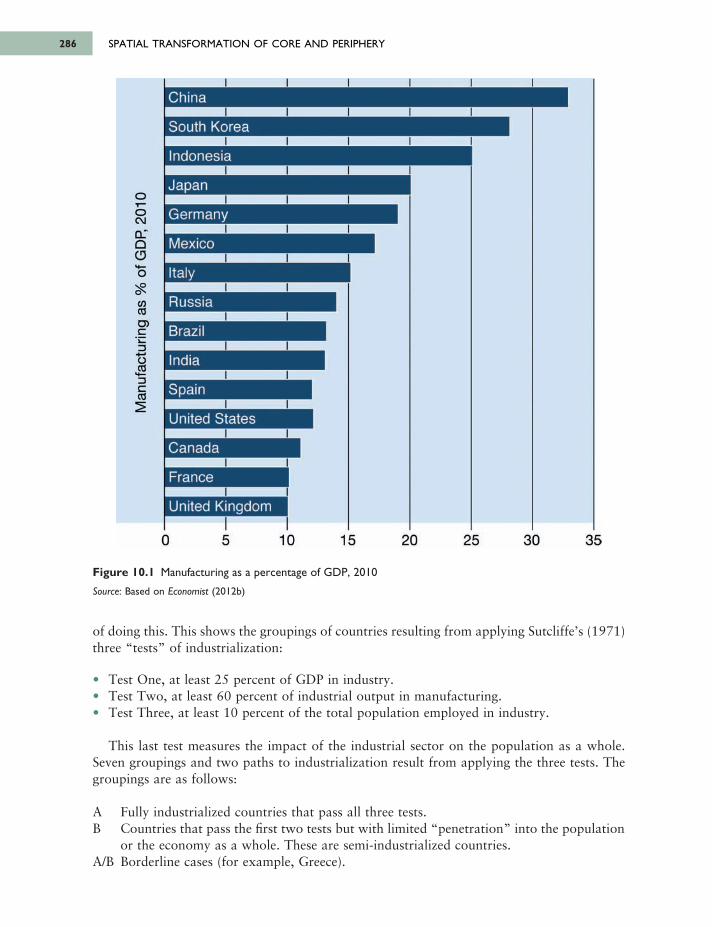
SPATIAL TRANSFORMATION OF CORE AND PERIPHERY286
of doing this. This shows the groupings of countries resulting from applying Sutcliffe’s (1971)three “tests” of industrialization:
• Test One, at least 25 percent of GDP in industry.• Test Two, at least 60 percent of industrial output in manufacturing.• Test Three, at least 10 percent of the total population employed in industry.
This last test measures the impact of the industrial sector on the population as a whole.Seven groupings and two paths to industrialization result from applying the three tests. Thegroupings are as follows:
A Fully industrialized countries that pass all three tests.B Countries that pass the first two tests but with limited “penetration” into the population
or the economy as a whole. These are semi-industrialized countries.A/B Borderline cases (for example, Greece).
Figure 10.1 Manufacturing as a percentage of GDP, 2010
Source: Based on Economist (2012b)
6063 GEOGRAPHY WORLD ECON_PT_246x189 mm 22/01/2014 15:10 Page 286
Ο)C*L.3ο€DC032
China
South Korea
Indonesia
Japan
I Germany
Mexico
Italy
Russia
Brazil
India
Spain
United States
Canada
France
I United Kingdom
0 5 10 15 20 25 30 35
gro
wth
gro
wth
gro
wth
gro
wth
gro
wth
gro
wth
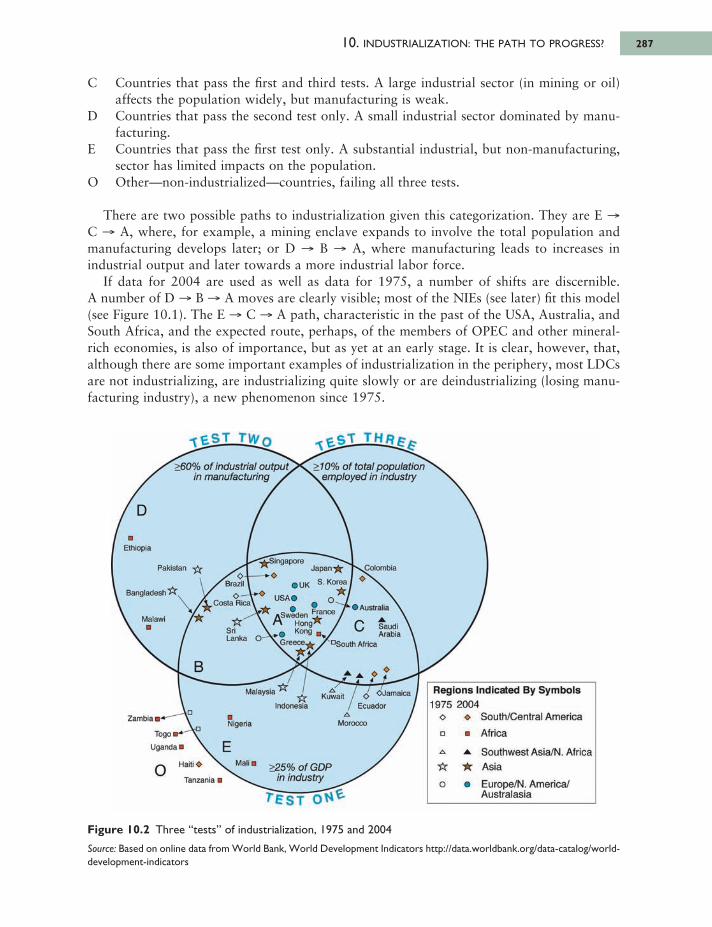
C Countries that pass the first and third tests. A large industrial sector (in mining or oil)affects the population widely, but manufacturing is weak.
D Countries that pass the second test only. A small industrial sector dominated by manu-facturing.
E Countries that pass the first test only. A substantial industrial, but non-manufacturing,sector has limited impacts on the population.
O Other—non-industrialized—countries, failing all three tests.
There are two possible paths to industrialization given this categorization. They are E →C → A, where, for example, a mining enclave expands to involve the total population andmanufacturing develops later; or D → B → A, where manufacturing leads to increases inindustrial output and later towards a more industrial labor force.
If data for 2004 are used as well as data for 1975, a number of shifts are discernible. A number of D → B → A moves are clearly visible; most of the NIEs (see later) fit this model(see Figure 10.1). The E → C → A path, characteristic in the past of the USA, Australia, andSouth Africa, and the expected route, perhaps, of the members of OPEC and other mineral-rich economies, is also of importance, but as yet at an early stage. It is clear, however, that,although there are some important examples of industrialization in the periphery, most LDCsare not industrializing, are industrializing quite slowly or are deindustrializing (losing manu-facturing industry), a new phenomenon since 1975.
10. INDUSTRIALIZATION: THE PATH TO PROGRESS? 287
Figure 10.2 Three “tests” of industrialization, 1975 and 2004
Source: Based on online data from World Bank, World Development Indicators http://data.worldbank.org/data-catalog/world-development-indicators
6063 GEOGRAPHY WORLD ECON_PT_246x189 mm 22/01/2014 15:10 Page 287
X Б ST TVVq t t s i І Я Я є а ·
>10% o f total population \em p loyed in industry
>60% o f industrial output in manufacturing /
D
Ethiopia
PakistanSingapore
JaDani „Colombia
Bangladesh з
Malawi
Brazil
Costa Rica'
SriLanka
ASweden І r \ Hong
Kong SyGreece^
USA
I UK S. Korea
wFrance b Australia
0 Saudi Arabia
DSouth Africa
Malaysia
IndonesiaKuwait OJamarca
Ecuador
Morocco
Regions Indicated By Symbols1975 2004
o ♦ South/Central Americao Africa
δ λ. Southwest Asia/N. Africa Asiao · Europe/N. America/
Australasia
R
Zambia Nigena
EMali c >25% ofGDF
in industry
Togo Q
Uganda
Haiti ♦oTanzania
One problem with this type of analysis is that it provides minimum thresholds for definingindustrialization but misses the point that after achieving these levels, economies typically beginto lose jobs in manufacturing and experience an expansion of their producer and financialservice industries. Manufacturing in itself is then no longer the driving force behind economicgrowth. This is what has happened in all of the DCs, where services are now a much moreimportant component of their economies than is manufacturing. For example, in the USA by2000, services accounted for 72 percent of GDP, manufacturing had fallen to 18 percent, andonly 15 percent of jobs were in manufacturing.
The conclusion about the general lack of industrialization across the periphery as a wholeis reinforced by focusing more directly on rates of growth in manufacturing output. Figure10.3 shows that the high rates of growth in the period 1995–2005, the years immediatelypreceding the global economic crisis beginning in 2007 that has probably limited subsequentdevelopment, were relatively concentrated geographically. There is no “exclusive” list of NIEs,as different indicators lead to the inclusion of different countries. Also, there has been somevolatility over time. The 1980s and 1990s were not particularly good decades for the NIEsas a whole. Latin American NIEs such as Brazil and Mexico fared worse in the 1980s thanin the 1990s. The Asian financial crisis impaired the economic performance of many AsianNIEs in the late 1990s. Back in 1979 the OECD recognized ten countries as NIEs (Brazil,Hong Kong, Greece, Mexico, Portugal, Singapore, South Korea, Spain, Taiwan, and the thenYugoslavia) on the grounds of “fast growth of the level and share of industrial employment,an enlargement of export market shares in manufactures, and a rapid relative reduction in the per capita income gap separating them from the advanced industrial countries” (OECD,1979). In Figure 10.3, only two of these NIEs had manufacturing output growth rates between1995 and 2005 exceeding 5 percent per year (South Korea (7.6) and Singapore (5.3)), twohad 3.6 percent (Spain and Portugal), one had 3.1 percent (Mexico), one had 2.5 percent(Greece), one had 1.3 percent (Brazil), the former Yugoslavia no longer exists and growthrates are not available for the other two. Of the other countries with high growth rates (5percent or more), some are major oil exporters (for example, Oman (10.6)) or starting fromtiny industrial sectors (for example, Vietnam (11.0)). Some are “new” NIEs (for example, China(10.1) and India (5.5)).
EXPORT PROCESSING ZONES
The NIEs such as South Korea, Singapore, Mexico, Taiwan and, predominantly, China, havebeen especially active in export-oriented industrialization particularly in early stages ofdeveloping export-oriented sectors (Figure 10.4). Some of this industry was attracted to andconcentrated geographically in export processing zones (EPZs) (see Chapter 2). These are limitedareas in which special advantages accrue to investors. These include duty-free entry of goodsfor assembly, limited restrictions on profit repatriation, lower taxation, reduced pollutioncontrols and constraints on labor organization (strikes banned, etc.). The intention of EPZswas to attract local and international companies with the capital to set up factories orientedto export production; and much of the industry in EPZs is owned by TNCs. According to theWorld Bank (2002), the number of these EPZs mushroomed from only a handful in the 1970sto more than 500 in 73 countries by the late 1990s. Most of the EPZs have clustered in NIEsaround major markets: North America, Europe, and Japan. The share of employment in theEPZs is substantial in some LDCs, especially when taking into account that the agriculturaland informal sectors still employ a significant percentage of the population. While Mauritiusis particularly high at 17 percent, EPZ employment shares are about 5 percent in the Dominican
SPATIAL TRANSFORMATION OF CORE AND PERIPHERY288
6063 GEOGRAPHY WORLD ECON_PT_246x189 mm 22/01/2014 15:10 Page 288
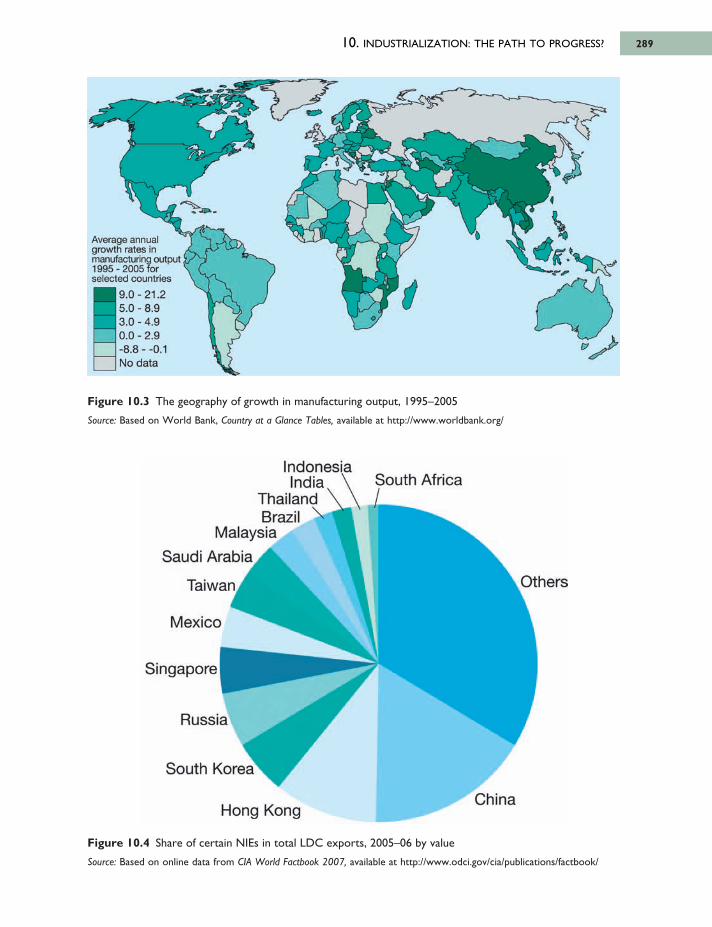
10. INDUSTRIALIZATION: THE PATH TO PROGRESS? 289
Figure 10.3 The geography of growth in manufacturing output, 1995–2005
Source: Based on World Bank, Country at a Glance Tables, available at http://www.worldbank.org/
Figure 10.4 Share of certain NIEs in total LDC exports, 2005–06 by value
Source: Based on online data from CIA World Factbook 2007, available at http://www.odci.gov/cia/publications/factbook/
6063 GEOGRAPHY WORLD ECON_PT_246x189 mm 22/01/2014 15:10 Page 289
Average annual g row th ra tes in manufacturing output 1 9 9 5 -2 0 0 5 fo r se lected coun tries
19.0-21.2 5.0 - 8.9
3.0 - 4.9 0.0 - 2.9
' - 8.8 - - 0.1 No data
Hong KongChina
Others
South AfricaIndonesiaIndia
ThailandBrazil
MalaysiaSaudi Arabia
Taiwan,
Mexico
Singapore
Russia
South Korea
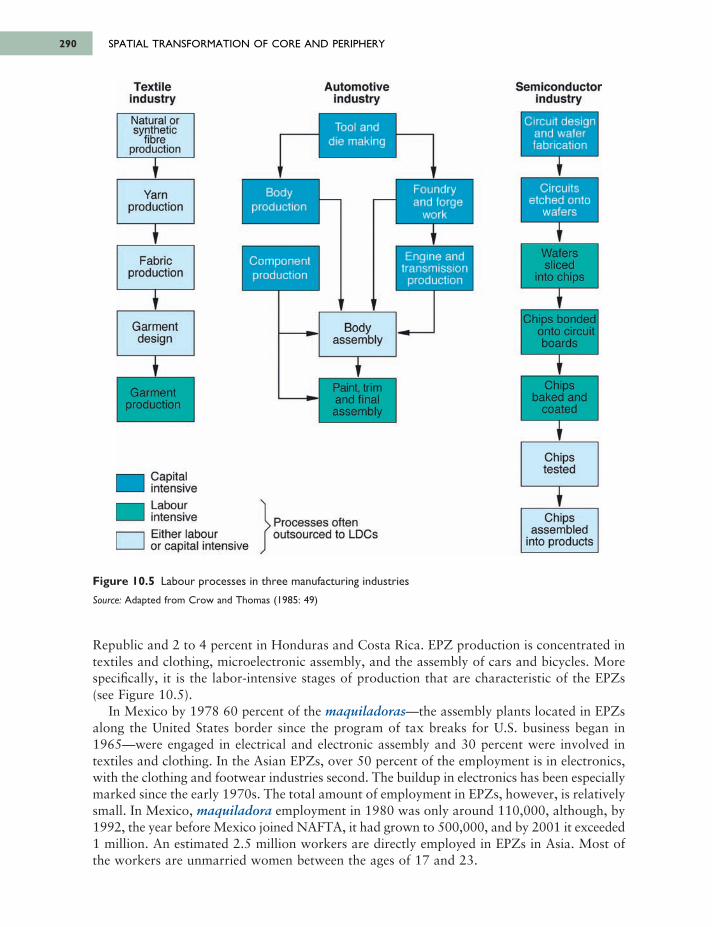
SPATIAL TRANSFORMATION OF CORE AND PERIPHERY290
Republic and 2 to 4 percent in Honduras and Costa Rica. EPZ production is concentrated intextiles and clothing, microelectronic assembly, and the assembly of cars and bicycles. Morespecifically, it is the labor-intensive stages of production that are characteristic of the EPZs(see Figure 10.5).
In Mexico by 1978 60 percent of the maquiladoras—the assembly plants located in EPZsalong the United States border since the program of tax breaks for U.S. business began in1965—were engaged in electrical and electronic assembly and 30 percent were involved intextiles and clothing. In the Asian EPZs, over 50 percent of the employment is in electronics,with the clothing and footwear industries second. The buildup in electronics has been especiallymarked since the early 1970s. The total amount of employment in EPZs, however, is relativelysmall. In Mexico, maquiladora employment in 1980 was only around 110,000, although, by1992, the year before Mexico joined NAFTA, it had grown to 500,000, and by 2001 it exceeded1 million. An estimated 2.5 million workers are directly employed in EPZs in Asia. Most ofthe workers are unmarried women between the ages of 17 and 23.
Figure 10.5 Labour processes in three manufacturing industries
Source: Adapted from Crow and Thomas (1985: 49)
6063 GEOGRAPHY WORLD ECON_PT_246x189 mm 22/01/2014 15:10 Page 290
Automotiveindustry
Semiconductorindustry
Circuit design and wafer fabrication
Tool and die making
Foundry and forge
work
Circuits etched onto
wafers
Wafers sliced
into chips
Chips bonded onto circuit boards
Chips baked and
coated
Chipstested
Chips assembled
into products
Paint, trim and final assembly
Bodyassembly
Engine and transmission production
Bodyproduction
Componentproduction
Yarnproduction
Fabricproduction
Garmentdesign
Garmentproduction
CapitalintensiveLabourintensiveEither labour or capital intensive
> Processes often outsourced to LDCs
Natural or synthetic
fibre production
Textileindustry
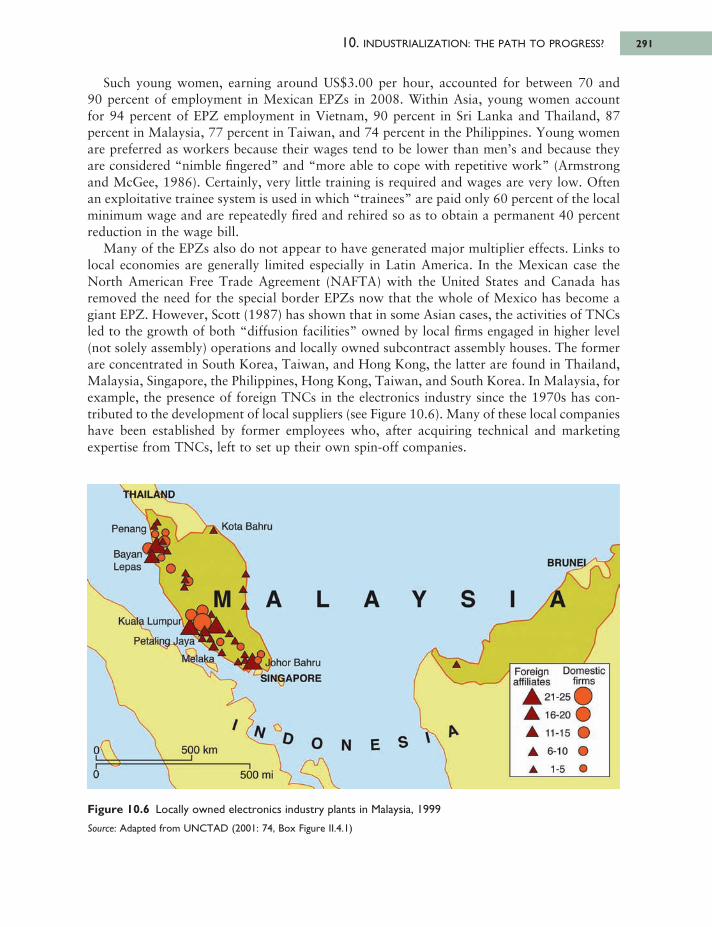
Such young women, earning around US$3.00 per hour, accounted for between 70 and 90 percent of employment in Mexican EPZs in 2008. Within Asia, young women account for 94 percent of EPZ employment in Vietnam, 90 percent in Sri Lanka and Thailand, 87percent in Malaysia, 77 percent in Taiwan, and 74 percent in the Philippines. Young womenare preferred as workers because their wages tend to be lower than men’s and because theyare considered “nimble fingered” and “more able to cope with repetitive work” (Armstrongand McGee, 1986). Certainly, very little training is required and wages are very low. Oftenan exploitative trainee system is used in which “trainees” are paid only 60 percent of the localminimum wage and are repeatedly fired and rehired so as to obtain a permanent 40 percentreduction in the wage bill.
Many of the EPZs also do not appear to have generated major multiplier effects. Links tolocal economies are generally limited especially in Latin America. In the Mexican case theNorth American Free Trade Agreement (NAFTA) with the United States and Canada hasremoved the need for the special border EPZs now that the whole of Mexico has become agiant EPZ. However, Scott (1987) has shown that in some Asian cases, the activities of TNCsled to the growth of both “diffusion facilities” owned by local firms engaged in higher level(not solely assembly) operations and locally owned subcontract assembly houses. The formerare concentrated in South Korea, Taiwan, and Hong Kong, the latter are found in Thailand,Malaysia, Singapore, the Philippines, Hong Kong, Taiwan, and South Korea. In Malaysia, forexample, the presence of foreign TNCs in the electronics industry since the 1970s has con -tributed to the development of local suppliers (see Figure 10.6). Many of these local companieshave been established by former employees who, after acquiring technical and marketingexpertise from TNCs, left to set up their own spin-off companies.
10. INDUSTRIALIZATION: THE PATH TO PROGRESS? 291
Figure 10.6 Locally owned electronics industry plants in Malaysia, 1999
Source: Adapted from UNCTAD (2001: 74, Box Figure II.4.1)
6063 GEOGRAPHY WORLD ECON_PT_246x189 mm 22/01/2014 15:10 Page 291
THAILAND
, Kota BahruPenang
BayanLepas
k M l A L A Y S I A
B R U N E I /
Foreignaffiliates
Domesticfirms
21-25116-2011-156-10
1-5
[ Jbhor Bahru SINGAPORE
Kuala Lumpur
Petaling Jaya
Melaka
500 kmI0'LΓ0 500 mi
/ Л/ -JD G N E S \ *
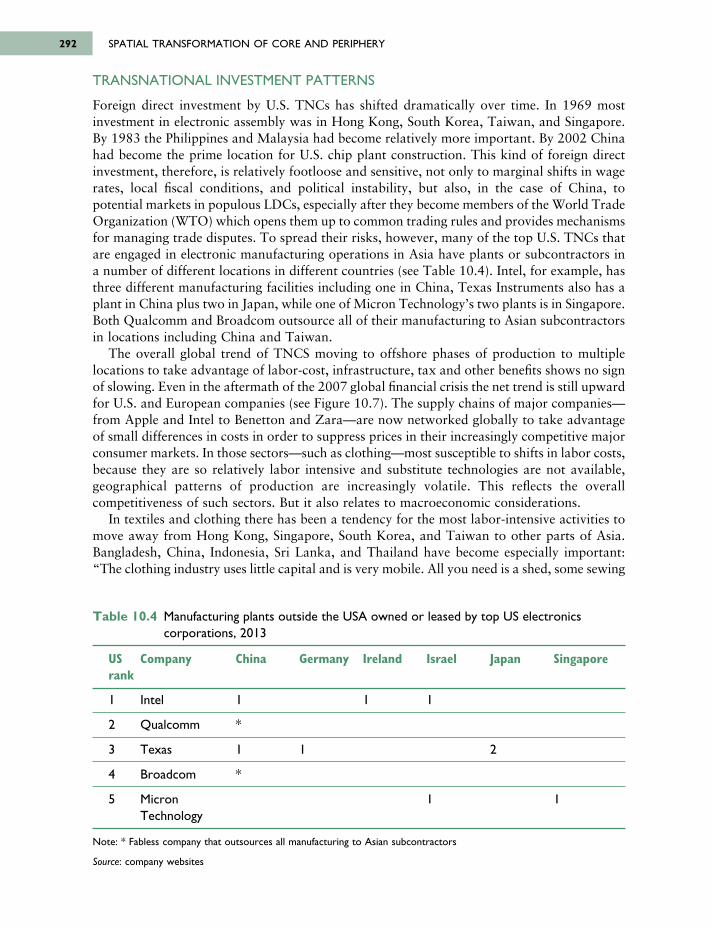
TRANSNATIONAL INVESTMENT PATTERNS
Foreign direct investment by U.S. TNCs has shifted dramatically over time. In 1969 mostinvestment in electronic assembly was in Hong Kong, South Korea, Taiwan, and Singapore.By 1983 the Philippines and Malaysia had become relatively more important. By 2002 Chinahad become the prime location for U.S. chip plant construction. This kind of foreign directinvestment, therefore, is relatively footloose and sensitive, not only to marginal shifts in wagerates, local fiscal conditions, and political instability, but also, in the case of China, topotential markets in populous LDCs, especially after they become members of the World TradeOrganization (WTO) which opens them up to common trading rules and provides mechanismsfor managing trade disputes. To spread their risks, however, many of the top U.S. TNCs thatare engaged in electronic manufacturing operations in Asia have plants or subcontractors ina number of different locations in different countries (see Table 10.4). Intel, for example, hasthree different manufacturing facilities including one in China, Texas Instruments also has aplant in China plus two in Japan, while one of Micron Technology’s two plants is in Singapore.Both Qualcomm and Broadcom outsource all of their manufacturing to Asian subcontractorsin locations including China and Taiwan.
The overall global trend of TNCS moving to offshore phases of production to multiplelocations to take advantage of labor-cost, infrastructure, tax and other benefits shows no signof slowing. Even in the aftermath of the 2007 global financial crisis the net trend is still upwardfor U.S. and European companies (see Figure 10.7). The supply chains of major companies—from Apple and Intel to Benetton and Zara—are now networked globally to take advantageof small differences in costs in order to suppress prices in their increasingly competitive majorconsumer markets. In those sectors—such as clothing—most susceptible to shifts in labor costs,because they are so relatively labor intensive and substitute technologies are not available,geographical patterns of production are increasingly volatile. This reflects the overallcompetitiveness of such sectors. But it also relates to macroeconomic considerations.
In textiles and clothing there has been a tendency for the most labor-intensive activities tomove away from Hong Kong, Singapore, South Korea, and Taiwan to other parts of Asia.Bangladesh, China, Indonesia, Sri Lanka, and Thailand have become especially important: “The clothing industry uses little capital and is very mobile. All you need is a shed, some sewing
SPATIAL TRANSFORMATION OF CORE AND PERIPHERY292
Table 10.4 Manufacturing plants outside the USA owned or leased by top US electronicscorporations, 2013
US Company China Germany Ireland Israel Japan Singaporerank
1 Intel 1 1 1
2 Qualcomm *
3 Texas 1 1 2
4 Broadcom *
5 Micron 1 1Technology
Note: * Fabless company that outsources all manufacturing to Asian subcontractors
Source: company websites
6063 GEOGRAPHY WORLD ECON_PT_246x189 mm 22/01/2014 15:10 Page 292
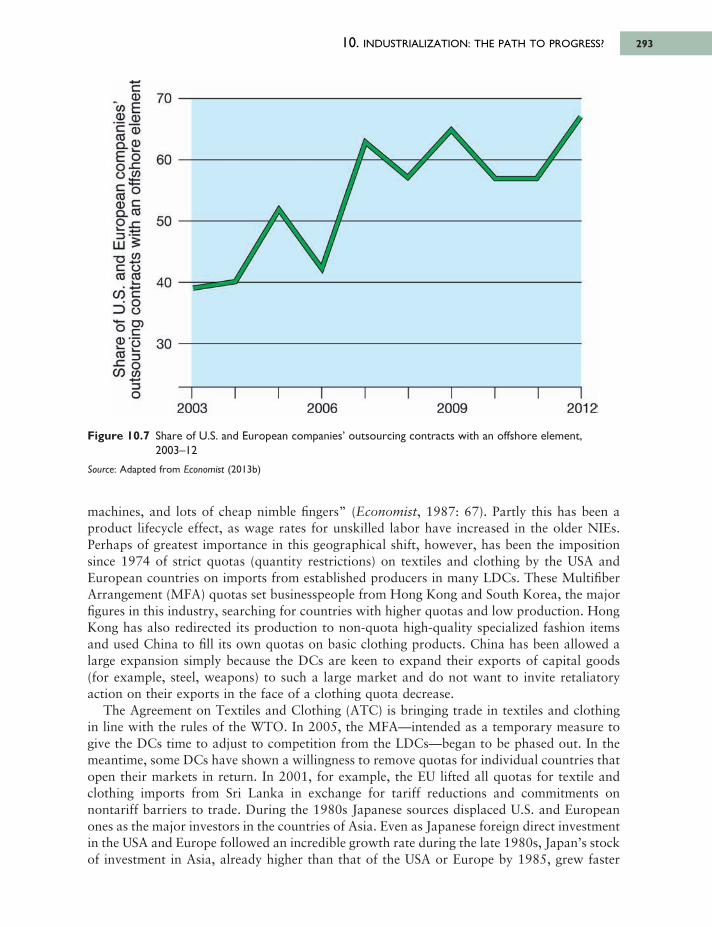
10. INDUSTRIALIZATION: THE PATH TO PROGRESS? 293
machines, and lots of cheap nimble fingers” (Economist, 1987: 67). Partly this has been aproduct lifecycle effect, as wage rates for unskilled labor have increased in the older NIEs.Perhaps of greatest importance in this geographical shift, however, has been the impositionsince 1974 of strict quotas (quantity restrictions) on textiles and clothing by the USA andEuropean countries on imports from established producers in many LDCs. These MultifiberArrangement (MFA) quotas set businesspeople from Hong Kong and South Korea, the majorfigures in this industry, searching for countries with higher quotas and low production. HongKong has also redirected its production to non-quota high-quality specialized fashion itemsand used China to fill its own quotas on basic clothing products. China has been allowed alarge expansion simply because the DCs are keen to expand their exports of capital goods(for example, steel, weapons) to such a large market and do not want to invite retaliatoryaction on their exports in the face of a clothing quota decrease.
The Agreement on Textiles and Clothing (ATC) is bringing trade in textiles and clothingin line with the rules of the WTO. In 2005, the MFA—intended as a temporary measure togive the DCs time to adjust to competition from the LDCs—began to be phased out. In themeantime, some DCs have shown a willingness to remove quotas for individual countries thatopen their markets in return. In 2001, for example, the EU lifted all quotas for textile andclothing imports from Sri Lanka in exchange for tariff reductions and commitments onnontariff barriers to trade. During the 1980s Japanese sources displaced U.S. and Europeanones as the major investors in the countries of Asia. Even as Japanese foreign direct investmentin the USA and Europe followed an incredible growth rate during the late 1980s, Japan’s stockof investment in Asia, already higher than that of the USA or Europe by 1985, grew faster
Figure 10.7 Share of U.S. and European companies’ outsourcing contracts with an offshore element,2003–12
Source: Adapted from Economist (2013b)
6063 GEOGRAPHY WORLD ECON_PT_246x189 mm 22/01/2014 15:10 Page 293
60
50
40
ЗО
70сф
от Еф ф С (1)
О. 2Е оВ и
3=£ о53 г-Q .C 0
2 £ш 'їтз І5 с о оз соV—* ·*—* СО с
=> 8Bg>0 > о
« з« gч—* З
О2003 2006 2009 2012
than either of the other two. Despite its economic woes during the 1990s, Japan’s investmentin Asia remained higher than that of the EU or the USA (in 1998, for example, Japan’s FDIin East Asia was US$72 billion, compared to US$65 billion from the EU and US$45 billionfrom the USA). This has led to talk of an East Asian economic bloc forming under Japanesedominance. Certainly, Japan’s investment in manufacturing in neighboring Asian countrieshas involved Japanese companies moving production abroad in a sector in which Japan hasbeen losing comparative advantage. Moreover, increasing Japanese FDI in Asia has not beenrestricted to investment in manufacturing:
More recently, increases in FDI have been associated with the rapid growth of spending on researchand development by Japanese firms. Some Japanese FDI has also been triggered by policy actionsthat make it advisable to move production of certain goods to other countries. Trade frictions . . .may have encouraged Japanese firms to invest in Asia so as to build “export platforms” for theU.S. market.
(Bayoumi and Lipworth, 1997: 12)
In fact, the evidence suggests that the region is moving, but only slowly, towards an intra-regional bias in trade and direct investment flows such as is evident in Europe. East Asiantrade and investment barriers are being reduced or eliminated as part of voluntary efforts by Asia Pacific Economic Cooperation group (APEC) members (see Chapter 12) and inconjunction with WTO agreements. As yet, however, East Asia in general and Southeast Asiain particular, including such countries as Malaysia, Indonesia, Thailand and the Philippines(despite their membership in ASEAN; see Chapter 12), do not form an incipient trading blocdiverting trade through some deliberate strategy of economic regionalism.
However, there is undoubtedly a degree to which regional proximity to a historicallydominant trading and investment partner underpins the success of the old NIEs and the emergingNIEs close by. Most of the successful export-oriented NIEs are adjacent to other ones and at least one important already industrialized economy. But although this is necessary, it is nota sufficient condition. Other factors such as underlying productivity conditions, political regimestrength and stability, adaptability (rather than factor endowments or resources), and a mixof import substitution and export-oriented industrialization are among the most vitalingredients. The economies of East Asia, including the emerging NIEs of Southeast Asia, havemajor advantages with respect to all of these factors. It is interesting to see how the formerlycentrally planned economies of Eastern Europe have gained competitive advantage in likemanner from their proximity to Western Europe and reasonably well-developed infrastructuresand well-trained labor forces (as well as membership of the European Union, of course).
REGIONAL LINKAGES AND INDUSTRIAL EVOLUTION
It should be emphasized, however, that although the EPZs and the spatial division of laborwithin East Asia are symptomatic of the importance of offshore production for final marketsin the developed countries, it would be mistaken to see peripheral industrialization solely inthese terms. For one thing, local markets for electronic components and semiconductor deviceshave grown rapidly in East Asia over the past few decades. U.S. factories now ship about 27percent of their production to consumers in East Asia. This has encouraged the establishmentof marketing, sales and after-sales service facilities in the region, especially in Hong Kong andSingapore. These two centers now function as nodes in a global system of producer serviceslocated in major world cities. They have also become important global banking and financial
SPATIAL TRANSFORMATION OF CORE AND PERIPHERY294
6063 GEOGRAPHY WORLD ECON_PT_246x189 mm 22/01/2014 15:10 Page 294
centers as a result of their coordinating roles in East Asian manufacturing industry. One factorfacilitating this has been the international networks between ethnic Chinese groups in EastAsia and North America.
Also of great importance, however, in that local firms have developed a wide range ofindustries oriented towards producing final products for export. Beginning in the early 1960s,for example, South Korea pursued an aggressive export-oriented industrial policy. In the early1960s familiarity with manufacturing acquired during the earlier import substitution periodwas used to develop a number of export infant industries by obtaining manufacturing licenses,loan capital and imported business know-how (see Table 10.5). These were mainly labor-intensive activities. But even with low wages it was not until the late 1960s that productivityand quality were high enough to make these industries, textiles, clothing, and footwear,internationally competitive. The South Korean government subsidized this process by usingcurrency depreciations to boost exports, making tax concessions and providing cheap loans.
During a second stage, 1967–1971, other infant industries were encouraged as the initialgroup achieved international competitiveness. These were more technologically advancedindustries such as electronic assembly and shipbuilding. In shipbuilding, production went from25,000 gross tons in 1970 to 996,000 gross tons in 1975; the ships built were also increasinglylarge and simple (such as supertankers and bulk carriers) with greater potential for automatedproduction. By 1976 the Korean shipbuilding industry was globally competitive.
In the early 1970s a third “wave” of industries was in the process of creation includingmotor vehicle assembly and consumer electronics. For instance, the automobile industry, whichbegan in South Korea in 1967, produced 83,000 units by 1977 (and 3.5 million units by 1985).By the early 1980s, therefore, South Korea had acquired a wide range of internationallycompetitive and self-sustaining industries. And, despite the increasing technological sophisti -cation of each wave of innovation, considerable emphasis was still placed on the original labor-intensive industries; although some of these were increasingly decentralized to other Asianlocations. The South Korean policy of widening its manufacturing base is the most successfulmodel of the kind of development policy being pursued by all the NIEs. The country’stechnology-intensive industry drive since the early 1980s has been toward more high valueindustries, including semiconductors, bioengineering, aerospace, and even robotics (Table 10.5).Peripheral industrialization, therefore, is not just the offshore processing or assembly workfor TNCs that a simple focus on EPZs would imply.
AGGLOMERATION AND NEW INDUSTRIAL COMPLEXES
Peripheral industrialization is organized at the intra-national and urban levels as well. Coastaland metropolitan areas have been favored locations, because of infrastructural advantages and ease of external access. Even in countries with little export-oriented industry this patternis evident. In Nigeria, for example, and despite the transfer of the federal capital in 1991 tothe more centrally located Abuja, well over 50 percent of the country’s industrial employ-ment remains concentrated in Lagos and five other coastal states. In East Asia and Latin Americamuch of the new manufacturing industry of the past 30 years is found in the major metro-politan areas. Both foreign and indigenous investment tends to be attracted by the amenities,basic infrastructure and political access characteristic of the larger urban areas (see the sectionheaded “Production networks and regional motors” in Chapter 3 for why this is the case).When urban growth is already concentrated in a primate city, such as Bangkok in Thailand,recent growth has tended to reinforce its primacy. This seems to be especially true of foreigndirect investment.
10. INDUSTRIALIZATION: THE PATH TO PROGRESS? 295
6063 GEOGRAPHY WORLD ECON_PT_246x189 mm 22/01/2014 15:10 Page 295
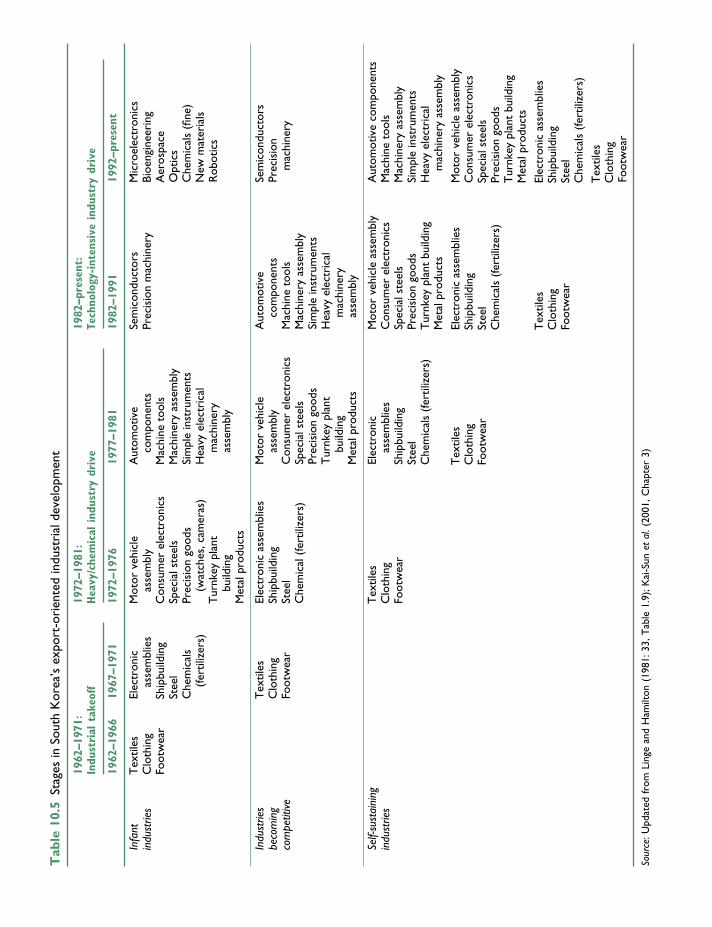
Tab
le 1
0.5
Stag
es in
Sou
th K
orea
’s e
xpor
t-or
ient
ed in
dust
rial
dev
elop
men
t
1962
–197
1:
1972
–198
1:
1982
–pre
sent
:In
dust
rial
tak
eoff
Hea
vy/c
hem
ical
ind
ustr
y dr
ive
Tech
nolo
gy-int
ensive
ind
ustr
y dr
ive
1962
–196
619
67–1
971
1972
–197
619
77–1
981
1982
–199
119
92–p
rese
nt
Infa
ntT
extil
es
Elec
tron
ic
Mot
or v
ehic
le
Aut
omot
ive
Sem
icon
duct
ors
Mic
roel
ectr
onic
sin
dust
ries
Clo
thin
gas
sem
blie
s as
sem
bly
com
pone
nts
Prec
isio
n m
achi
nery
Bioe
ngin
eeri
ngFo
otw
ear
Ship
build
ing
Con
sum
er e
lect
roni
csM
achi
ne t
ools
Aer
ospa
ceSt
eel
Spec
ial s
teel
sM
achi
nery
ass
embl
yO
ptic
sC
hem
ical
s Pr
ecis
ion
good
s Si
mpl
e in
stru
men
tsC
hem
ical
s (fi
ne)
(fert
ilize
rs)
(wat
ches
, cam
eras
)H
eavy
ele
ctri
cal
New
mat
eria
lsT
urnk
ey p
lant
m
achi
nery
Rob
otic
sbu
ildin
gas
sem
bly
Met
al p
rodu
cts
Indu
strie
s T
extil
esEl
ectr
onic
ass
embl
ies
Mot
or v
ehic
le
Aut
omot
ive
Sem
icon
duct
ors
beco
min
g C
loth
ing
Ship
build
ing
asse
mbl
yco
mpo
nent
sPr
ecis
ion
com
petit
iveFo
otw
ear
Stee
lC
onsu
mer
ele
ctro
nics
Mac
hine
too
lsm
achi
nery
Che
mic
al (
fert
ilize
rs)
Spec
ial s
teel
sM
achi
nery
ass
embl
yPr
ecis
ion
good
sSi
mpl
e in
stru
men
tsT
urnk
ey p
lant
H
eavy
ele
ctri
cal
build
ing
mac
hine
ryM
etal
pro
duct
sas
sem
bly
Self-
sust
aini
ng
Tex
tiles
Elec
tron
icM
otor
veh
icle
ass
embl
yA
utom
otiv
e co
mpo
nent
sin
dust
ries
Clo
thin
gas
sem
blie
sC
onsu
mer
ele
ctro
nics
Mac
hine
too
lsFo
otw
ear
Ship
build
ing
Spec
ial s
teel
sM
achi
nery
ass
embl
ySt
eel
Prec
isio
n go
ods
Sim
ple
inst
rum
ents
Che
mic
als
(fert
ilize
rs)
Tur
nkey
pla
nt b
uild
ing
Hea
vy e
lect
rica
l M
etal
pro
duct
sm
achi
nery
ass
embl
yT
extil
esEl
ectr
onic
ass
embl
ies
Mot
or v
ehic
le a
ssem
bly
Clo
thin
gSh
ipbu
ildin
gC
onsu
mer
ele
ctro
nics
Foot
wea
rSt
eel
Spec
ial s
teel
sC
hem
ical
s (fe
rtili
zers
)Pr
ecis
ion
good
sT
urnk
ey p
lant
bui
ldin
gM
etal
pro
duct
sT
extil
esEl
ectr
onic
ass
embl
ies
Clo
thin
gSh
ipbu
ildin
gFo
otw
ear
Stee
lC
hem
ical
s (fe
rtili
zers
)T
extil
esC
loth
ing
Foot
wea
r
Sour
ce: U
pdat
ed fr
om L
inge
and
Ham
ilton
(19
81: 3
3, T
able
1.9
); K
ai-S
un e
t al
. (20
01, C
hapt
er 3
)
6063 GEOGRAPHY WORLD ECON_PT_246x189 mm 22/01/2014 15:10 Page 296
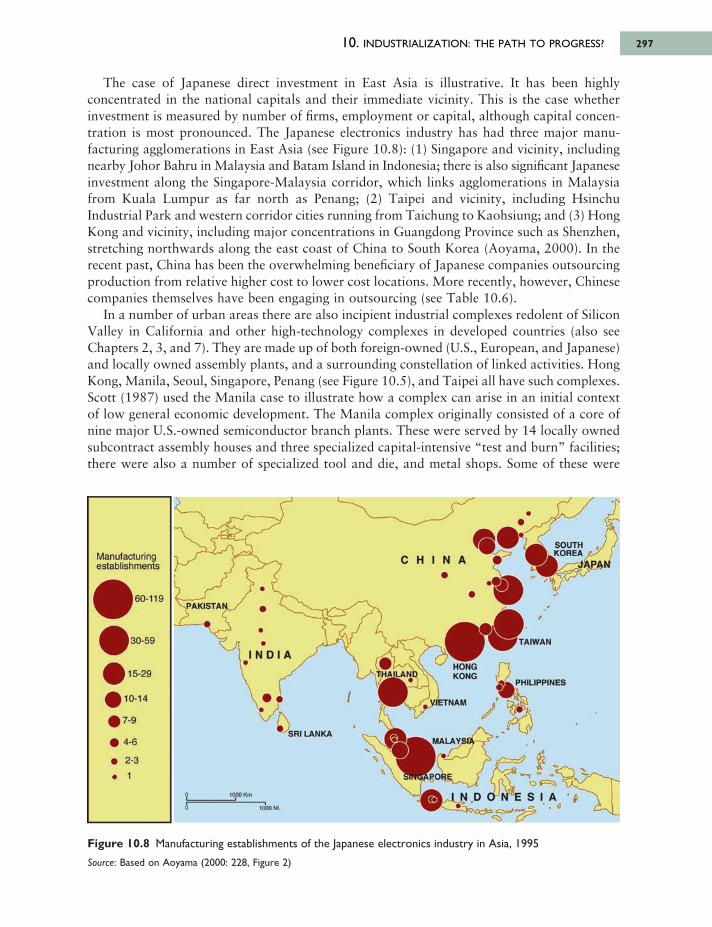
10. INDUSTRIALIZATION: THE PATH TO PROGRESS? 297
The case of Japanese direct investment in East Asia is illustrative. It has been highlyconcentrated in the national capitals and their immediate vicinity. This is the case whetherinvestment is measured by number of firms, employment or capital, although capital concen -tration is most pronounced. The Japanese electronics industry has had three major manu -facturing agglomerations in East Asia (see Figure 10.8): (1) Singapore and vicinity, includingnearby Johor Bahru in Malaysia and Batam Island in Indonesia; there is also significant Japaneseinvestment along the Singapore-Malaysia corridor, which links agglom erations in Malaysiafrom Kuala Lumpur as far north as Penang; (2) Taipei and vicinity, including HsinchuIndustrial Park and western corridor cities running from Taichung to Kaohsiung; and (3) HongKong and vicinity, including major concentrations in Guangdong Province such as Shenzhen,stretching northwards along the east coast of China to South Korea (Aoyama, 2000). In therecent past, China has been the overwhelming beneficiary of Japanese companies outsourcingproduction from relative higher cost to lower cost locations. More recently, however, Chinesecompanies themselves have been engaging in outsourcing (see Table 10.6).
In a number of urban areas there are also incipient industrial complexes redolent of SiliconValley in California and other high-technology complexes in developed countries (also seeChapters 2, 3, and 7). They are made up of both foreign-owned (U.S., European, and Japanese)and locally owned assembly plants, and a surrounding constellation of linked activities. HongKong, Manila, Seoul, Singapore, Penang (see Figure 10.5), and Taipei all have such complexes.Scott (1987) used the Manila case to illustrate how a complex can arise in an initial contextof low general economic development. The Manila complex originally consisted of a core ofnine major U.S.-owned semiconductor branch plants. These were served by 14 locally ownedsubcontract assembly houses and three specialized capital-intensive “test and burn” facilities;there were also a number of specialized tool and die, and metal shops. Some of these were
Figure 10.8 Manufacturing establishments of the Japanese electronics industry in Asia, 1995
Source: Based on Aoyama (2000: 228, Figure 2)
6063 GEOGRAPHY WORLD ECON_PT_246x189 mm 22/01/2014 15:10 Page 297
M anufacturingestablishm ents
60-119
130-59
115-29
110-14
17-9
4-6
2-31
1f
1000 Km
1000 Mr
SRI LANKA
I N D I A
PAKISTAN
C H I N A
SOUTH L KOREA
HONGKONG
f TAIWAN
PHILIPPINES
e VIETNAM
THAILAND
^M ALAYSIA
I N D O N E S I A
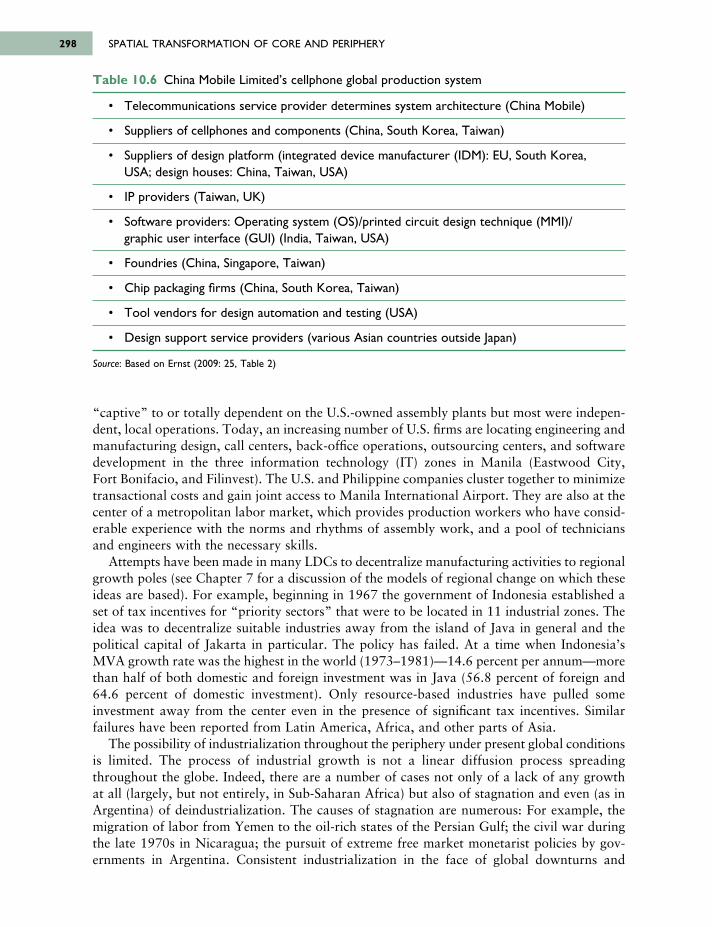
“captive” to or totally dependent on the U.S.-owned assembly plants but most were indepen -dent, local operations. Today, an increasing number of U.S. firms are locating engineering andmanufacturing design, call centers, back-office operations, outsourcing centers, and softwaredevelopment in the three information technology (IT) zones in Manila (Eastwood City, Fort Bonifacio, and Filinvest). The U.S. and Philippine companies cluster together to minimizetransactional costs and gain joint access to Manila International Airport. They are also at thecenter of a metropolitan labor market, which provides production workers who have consid -erable experience with the norms and rhythms of assembly work, and a pool of techniciansand engineers with the necessary skills.
Attempts have been made in many LDCs to decentralize manufacturing activities to regionalgrowth poles (see Chapter 7 for a discussion of the models of regional change on which theseideas are based). For example, beginning in 1967 the government of Indonesia established aset of tax incentives for “priority sectors” that were to be located in 11 industrial zones. Theidea was to decentralize suitable industries away from the island of Java in general and thepolitical capital of Jakarta in particular. The policy has failed. At a time when Indonesia’sMVA growth rate was the highest in the world (1973–1981)—14.6 percent per annum—morethan half of both domestic and foreign investment was in Java (56.8 percent of foreign and64.6 percent of domestic investment). Only resource-based industries have pulled someinvestment away from the center even in the presence of significant tax incentives. Similarfailures have been reported from Latin America, Africa, and other parts of Asia.
The possibility of industrialization throughout the periphery under present global conditionsis limited. The process of industrial growth is not a linear diffusion process spreadingthroughout the globe. Indeed, there are a number of cases not only of a lack of any growthat all (largely, but not entirely, in Sub-Saharan Africa) but also of stagnation and even (as inArgentina) of deindustrialization. The causes of stagnation are numerous: For example, themigration of labor from Yemen to the oil-rich states of the Persian Gulf; the civil war duringthe late 1970s in Nicaragua; the pursuit of extreme free market monetarist policies by gov -ern ments in Argentina. Consistent industrialization in the face of global downturns and
SPATIAL TRANSFORMATION OF CORE AND PERIPHERY298
Table 10.6 China Mobile Limited’s cellphone global production system
• Telecommunications service provider determines system architecture (China Mobile)
• Suppliers of cellphones and components (China, South Korea, Taiwan)
• Suppliers of design platform (integrated device manufacturer (IDM): EU, South Korea,USA; design houses: China, Taiwan, USA)
• IP providers (Taiwan, UK)
• Software providers: Operating system (OS)/printed circuit design technique (MMI)/graphic user interface (GUI) (India, Taiwan, USA)
• Foundries (China, Singapore, Taiwan)
• Chip packaging firms (China, South Korea, Taiwan)
• Tool vendors for design automation and testing (USA)
• Design support service providers (various Asian countries outside Japan)
Source: Based on Ernst (2009: 25, Table 2)
6063 GEOGRAPHY WORLD ECON_PT_246x189 mm 22/01/2014 15:10 Page 298
increasingly competitive world markets seems to require at a minimum, in Petras’ (1984: 199)words: “a cohesive industrializing class linked to a coherent policy, promoting an internalmarket and selective insertion in the international market.” This together with a productivehousehold farming sector and government provided financial protections for developingindustries are what sets apart those countries that have successfully climbed up the “ladder”of global manufacturing industrialization from those that have not.
10.4 RISE AND FALL OF THE SOVIET MODEL OFINDUSTRIALIZATION
The experience of the former Soviet Union and its Eastern European satellites provides a verydifferent model of industrial development (although in terms of spatial organization, thedifferences between them and capitalist industrial countries were fewer than might be expected)that was influential throughout the world, particularly in poorer countries, from the 1940suntil the 1980s. It should be emphasized at the outset that the economies of the former SovietUnion and its satellites were not based on a true socialist or communist form of economicorganization in which the working class had democratic control over the processes of produc -tion, distribution, and development. Rather, they seem to have evolved as something of a hybrid,in which a bureaucratic class used state power to exploit workers and to compete for powerand economic advantage in the world economy. Social objectives aside, their experi ence canbe interpreted as the pragmatic response of latecomers whose leadership felt they could onlyindustrialize by disengaging from their semi-peripheral role in the world economy in order topursue modernization and economic development through highly centralized and rigidlyenforced government direction.
Eventually, the constraints imposed by excessive state control, the inherent disadvantagesthat resulted from (1) the absence of entrepreneurship and competition and (2) the dissentthat resulted from the lack of democracy, combined to bring the experiment to a sudden halt(in 1990). By then, parts of the Soviet world empire had been able to achieve a relativelyadvanced stage of industrial development; but none of the survivors of the experiment,including Russia, has achieved better than semi-peripheral status in the world economy.
REVOLUTIONARY ECONOMIC REORGANIZATION
Since the time of Peter the Great (around 1700), Tsarist Russia had been attempting tomodernize. By 1861, when Alexander II decreed the abolition of serfdom, Russia had builtup an internal core with a large bureaucracy, a substantial intelligentsia, and a sizeable groupof skilled workers. The abolition of feudal serfdom was designed to accelerate theindustrialization of the economy by compelling the peasantry to raise crops on a commercialbasis, the idea being that the profits from exporting grain would be used to import foreigntechnology and machinery. In many ways, the strategy seems to have been successful: Grainexports increased fivefold between 1860 and 1900, while manufacturing activity expandedrapidly. Further reforms, in 1906, helped to establish large, consolidated farms in place ofsome of the many small-scale peasant holdings. But the consequent flood of dispossessedpeasants to the cities created acute problems as housing conditions deteriorated and labormarkets became flooded.
These problems, to which the tsar remained indifferent despite the petitions of desperatemunicipal governments, nourished deep discontent, which eventually, aggravated by militarydefeats and the sufferings of the First World War, spawned the revolutionary changes of 1917.
10. INDUSTRIALIZATION: THE PATH TO PROGRESS? 299
6063 GEOGRAPHY WORLD ECON_PT_246x189 mm 22/01/2014 15:10 Page 299
It was not the peasantry or the oppressed provincial industrial proletariat, however, whichemerged from the chaos to take control. It was the Bolsheviks, a radical element drawn largelyfrom the professional and middle classes, whose orientation from the beginning favored astrategy of economic development in which the intelligentsia and skilled industrial workerswould play the key roles.
In the first instance, however, the ravages of war and the upheavals of revolution precludedthe possibility of planned economic reorganization of any kind. So the centralization of controlover production and the nationalization of industry resulted as much from the need for nationaland political survival as from ideological beliefs. Similarly, it was rampant inflation that ledto the virtual abolition of money, not revolutionary purism. By 1920 industrial productionwas still only 20 percent of the prewar level, crop yields were only 44 percent of the prewarlevel and national income per capita stood at less than 40 percent of the prewar level.
In 1921 the New Economic Policy was introduced in an attempt to catch up. Central controlof key industries, foreign trade and banking was codified under Gosplan, the central economicplanning commission. But in other spheres—and in agriculture in particular—a substantialdegree of freedom was restored, with heavy reliance on market mechanisms operated by“bourgeois specialists” from the old intelligentsia. Improvement in national economicperformance was immediate and sustained, with the result that recovery to prewar levels ofproduction was reached in 1926 for agriculture and the following year in the case of industry.
Soon afterwards, however, there occurred a major shift in power within the Soviet Union.This power shift swept aside both the New Economic Policy and its “bourgeois specialists.”They were replaced by a much more centralized allocation of resources: A command economyoperated by a new breed of engineers/managers/apparatchiks drawn from the new intelligentsiathat had developed among the membership of the Communist Party. With this shift there alsocame a more explicit strategy for industrial development. Like Japan, the Soviet Union choseto withdraw from the capitalist world-system as far as possible, relying instead on the capacityof its vast territories to produce the raw materials needed for rapid industrialization. As inMeiji Japan, the capital for creating manufacturing capacity and the required infrastructureand educational improvements was extracted from the agricultural sector. The foundation of Stalin’s industrialization drive was the collectivization of agriculture. This involved thecompulsory relocation of peasants into state or collective farms, on which their labor wasexpected to produce bigger yields. The state would then purchase the harvest at relatively low prices so that, in effect, the collectivized peasant was to pay for industrialization by “gifts” of labor.
In the event, the Soviet peasantry was somewhat reluctant to make these gifts, not leastbecause the wages they could earn on collective farms could not be spent on consumer goodsor services: Soviet industrialization was overwhelmingly geared towards manufacturingproducer goods such as machinery and heavy equipment. It proved very difficult to regimentthe peasants. Requisitioning parties and tax inspectors were met with violence, passiveresistance, and the slaughter of animals. At this juncture, Stalin employed police terror to compelthe peasantry to comply with the requirements of the Five-Year Plans that provided theframework for his industrialization drive. Severe exploitation required severe repression.Dissidents, along with enemies of the state uncovered by purges of the army, the bureaucracyand the Communist Party, provided convict (zek) labor for infrastructural projects. Together,some 10 million people were sentenced to serve in the zek workforce, to be imprisoned or tobe shot. The barbarization of Soviet society was the price paid for the modernization of theSoviet economy.
SPATIAL TRANSFORMATION OF CORE AND PERIPHERY300
6063 GEOGRAPHY WORLD ECON_PT_246x189 mm 22/01/2014 15:10 Page 300
ECONOMIC AND TERRITORIAL EXPANSION UNDER STATE SOCIALISM
The Soviet economy did modernize, however. Between 1928 and 1940 the rate of industrialgrowth increased steadily, reaching levels of over 10 percent per annum in the late 1930s:Rates that had never before been achieved and that have been equaled since only by Japanand China. The annual production of steel had increased from 4.3 million tons to 18.3 milliontons; coal production had increased nearly five times; and the annual production of metal-cutting machine tools had increased from 2,000 to 58,400. In short: “An Industrial Revolutionin the Western sense had been passed through in one decade” (Pollard, 1981: 299). When theGermans attacked the Soviet Union in 1941 they took on an economy that, in absolute terms(although not per capita), had output figures comparable with their own.
The Second World War cost the Soviet Union 25 million lives, the devastation of 1,700towns and cities and 84,000 villages and the loss of more than 60 percent of all industrialinstallations. In the aftermath, the Soviet Union gave first priority to national security. Thecordon sanitaire of independent east European countries that had been set up by the westernallies after the First World War was appropriated as a buffer zone by the Soviet Union. Becausethis buffer zone happened to be relatively well developed and populous it also provided thebasis of a Soviet world empire as an alternative to the capitalist world economy, which providedeconomic as well as military security.
However, the Soviet Union felt vulnerable to the growing influence and participation ofthe United States in world economic and political affairs, and Stalin felt compelled, in 1947,to intervene in Eastern Europe. In addition to the installation of the Iron Curtain, which severedmost economic linkages with the west, this intervention resulted in the complete nationalizationof the means of production, the collectivization of agriculture, and the imposition of rigidsocial and economic controls. The Communist Council for Mutual Economic Assistance (CMEAor COMECON) was also established to reorganize the eastern European economies in theStalinist mold—even to the point of striving for autarky for individual members, each pursuingindependent, centralized plans. This proved unsuccessful, however, and in 1958 COMECONwas reorganized by Stalin’s successor, Khrushchev. The goal of autarky was abandoned, mutualtrade among the Soviet bloc was fostered, and some trade with Western Europe was permitted.
Meanwhile, the whole Soviet bloc gave high priority to industrialization. Between 1950and 1955 output in the Soviet Union grew at nearly 10 percent per annum, although itsubsequently fell away to more modest levels until the fall of communism. The experience ofthe east European countries varied considerably, but, in general, rates of industrial growthwere high during the Soviet era. Equally important was the structural transformation of industry,for although producer goods remained dominant, the economic base of all Soviet bloc countriesexpanded to the point where per capita consumption of food, clothing, and other consumergoods came to be much closer to that of the capitalist core countries than to that of theperipheral and semi-peripheral countries of the capitalist world economy.
ECONOMIC GEOGRAPHY OF STATE SOCIALISM
As in western Europe, North America, and Japan, industrialization brought about radicalchanges in the economic landscapes of the Soviet Union and eastern Europe. But did the statesocialism, or statism, that guided Soviet bloc industrialization result in qualitatively differenteconomic landscapes? At face value, there were sound reasons for anticipating substantialdifferences. Central planning and control of economic development meant that ideologicalobjectives could be translated into administrative fiat, while the absence of a competitive market
10. INDUSTRIALIZATION: THE PATH TO PROGRESS? 301
6063 GEOGRAPHY WORLD ECON_PT_246x189 mm 22/01/2014 15:10 Page 301
eliminated risk and uncertainty, precluded the influence of powerful monopolies and facilitatedthe rapid dissemination of technological innovations.
In practice, however, spatial organization within the Soviet bloc did not exhibit any realdistinctive dimension. As in the industrial core regions of the west and Japan, the industriallandscape came to be dominated by the localization of manufacturing activity, by regionalspecialization, by core–periphery contrasts in levels of economic development and byagglomeration and functional differentiation within the urban system. The reasons for thiswere several:
1. At the most fundamental level was the unevenness of natural resources and the consequentunevenness of population and economic development inherited from the pre-socialist era.
2. The principles of rationality and the primacy of national economic growth took precedenceover ideological principles of spatial equality. As a result, Soviet planners applied the logic of agglomeration economies, developing territorial production complexes: Plannedgroupings of industries designed to exploit local energy resources and environmentalconditions. As developed by the Tenth Five-Year Plan (1976–1980), these territorialproduction complexes were broadly defined, designed to foster broad-scale agglomerationeconomies among specialized sub-regional territorial production complexes.
3. The extensive bureaucracy required by command economies meant that a pronounced“control hierarchy” developed:
Central places in the spatial control hierarchy will have disproportionate numbers of high-levelbusiness and party posts. This, along with the tendency for the world of culture, the arts andeducation to concentrate spatially, will create local élites, as in Moscow, enjoying livingstandards substantially better than those of the mass of people.
(D. Smith, 1979: 341–342)
Conversely, places at the lower end of the control hierarchy offered limited occupationalopportunities and limited access to upper level jobs.
4. Centralized economic planning was unable to redress unwanted spatial disparities becauselarge parts of the system came to be characterized by inertia, insensitivity, conservatism,and compartmentalization. As a result, resource allocation was strongly conditioned byincrementalism, whereby those places already well endowed by past allocations gotproportionally large shares of each successive round of budgeting.
5. Places and regions that were able to establish an initial advantage (by proximity to marketor raw materials, for instance) were generally able to maintain a significant competitiveadvantage over other regions. Turnock, reviewing the outcomes of socialist location prin -ciples, observed that: “Despite oft-repeated assertions forecasting the impending eliminationof backward regions, through appropriate allocations of investment under the system ofcentral planning, growth rates continue to show wide spatial disparities” (1984: 316).
We can briefly illustrate both the extent of the resultant unevenness in economic develop -ment and the degree to which the economic landscapes of industrial socialism, like those ofindustrial capitalism, were dominated by core–periphery contrasts.
Within the former Soviet Union, the major contrast was always between, on the one hand,the richly endowed, relatively densely peopled, highly urbanized core of the ManufacturingBelt that stretches across Russia from St. Petersburg (formerly Leningrad) in the north andeastern Ukraine in the south, through the Moscow and Volga regions to the Urals and, onthe other hand, the rest of the country. Within the latter, there are vast reaches in which physical
SPATIAL TRANSFORMATION OF CORE AND PERIPHERY302
6063 GEOGRAPHY WORLD ECON_PT_246x189 mm 22/01/2014 15:10 Page 302
isolation and harsh environmental considerations have prevented all but a veneer of moderneconomic development and where tribal folk still pursue local subsistence economies. Muchof the rest of what was Soviet Central Asia and the southern portion of Kazakhstan also laggedwell behind in terms of economic development, largely because of the fundamental problemof physical isolation. In addition, however, there were parts of the European portion of theformer Soviet Union that remained some way behind the levels of development achieved inthe center. These included Belorussia, eastern Latvia, Lithuania and western Ukraine—regionswith large rural populations that were systematically excluded from Stalin’s industrializationdrive.
Such inequalities eventually contributed to the vulnerability of the Soviet system as analternative model of economic development. The critical economic failure, however, was statesocialism’s inflexibility and its consequent inability to take advantage of the new technologysystem that was developing among capitalist core countries: “Soviet statism failed in its attempt. . . to a large extent because of the incapacity of statism to assimilate and use the principlesof informationalism embodied in new information technologies” (Castells, 2000: 13).
The dramatic failure of state socialism led to a period of radical change in the geographyof the former Soviet Union with many of the constituent republics breaking away to formseparate states. The former states of Yugoslavia and Czechoslovakia have been broken up intosmaller entities; East Germany has been absorbed into Germany; and many eastern Europeancountries (including Hungary, Poland, the Czech Republic, and the Baltic states) have beendrawn rapidly into the European Union’s sphere of influence.
Russia, meanwhile, has had to reconstitute its economic geography through a chaotictransition towards a market economy. In the process, all local and regional economies havebeen disrupted, leaving many Russian people to survive through a semi-formal “kioskeconomy.” Many accounts suggest that criminal business has flourished amid the chaos ofRussia’s transition, with one estimate putting the share of the country’s GDP generated byorganized crime at nearly 15 percent.
After well over a decade of transition and preoccupation with such pressing economic issues,Russia and the rest of the former Soviet Union have yet to address adequately the legacy ofenvironmental degradation and health problems created by Soviet bloc industrialization(although the countries of eastern Europe, in particular, have benefited from European Union(EU) funding for environmental planning and remediation). In Russia, government funds forsocial and environmental programs have been limited as overall GDP fell dramatically: By 29percent in 1992 and a further 13 and 13.5 percent each in 1993 and 1994, 4.2 percent in1995 and 3.5 percent in 1996. After a slight recovery (0.9 percent) in 1997 GDP fell again(by 5 percent) in 1998 (at a time when Russia devalued the ruble and defaulted on its IMFloan), before recovering to 5.4 percent in 1999 and 8.3 percent in 2000, due partly to the risein the price of oil and gas, Russia’s two main exports. Material production fell, as industrialproduction declined 9.6 percent throughout the 1990s.
Foreign capital has flowed into Russia, but it has been targeted mainly at the fuel and energysector, natural resources, and raw materials (which in 2000 accounted for more than two-thirds of Russia’s total exports) rather than manufacturing industry. By January 2001companies from the USA, the leading foreign direct investor into Russia, had invested $5.49billion in the fuel, transportation, engineering, and communications sectors. As a result, Russiabecame increasingly dependent on oil and gas reserves in Siberia and further east (includingoff the coast of Sakhalin Island in the Pacific and along the Arctic Ocean coast), which togetheraccounted for more than two-thirds of Russian exports by 2005. Industry is now almost entirelyconcentrated in European Russia and low levels of investment in manufacturing because of
10. INDUSTRIALIZATION: THE PATH TO PROGRESS? 303
6063 GEOGRAPHY WORLD ECON_PT_246x189 mm 22/01/2014 15:10 Page 303
more attractive outlets in resources and foreign markets mean that the costly forcedindustrialization of the Soviet Union is now leading to a slow deindustrialization and increasedinterregional income inequalities with state employment as the only growth factor in manyparts of contemporary Russia.
10.5 CHINA’S RISE IN THE WORLD ECONOMYChina is the economic development success story of the last few decades. With the largestpopulation of any country in the world, 1.3 billion, China had a growth in GDP that averagedabout 10 percent each year during the 1980s and 1990s respectively (against a 3.5 percentaverage for all LDCs during each of these decades). In the 1980s and 1990s China’s rates ofgrowth in GDP, agriculture, industry, manufacturing, and services were among the highest inthe world. The average annual rate of growth in manufacturing was particularly impressive.Only South Korea, Indonesia, and Thailand had growth rates similar to China’s 10.4 percentbetween 1980 and 1990. But these countries did not come close to matching China’s 13.9percent growth in manufacturing between 1990 and 1999. As a result, by 1994, China wasalready a little more advanced than South Korea had been in 1970 in terms of output percapita of some basic industrial products such as electricity, steel, cement, cotton fabrics, andcotton yarn. China, with one-fifth of the world’s population, is now only a generation behindthe older NIEs of East Asia in conventional indicators of economic development. As measuredby total GDP, by 2013 China already had the world’s second largest national economy, afterthe USA; almost 50 percent that of the USA. In per capita GDP terms, a more relevantcomparison, China’s economy is still relatively underdeveloped, ranking only 94th or so com -pared to all countries. This suggests the irony of the current situation: The world’s most dynamicmanufacturing hub is still a poor country. Unless the Chinese economy can successfully shiftfrom an export-oriented to a national consumption model this is likely to continue but withserious social consequences in terms of keeping average wages down at the same time thatsocial and geographical inequalities are growing and increasingly obvious.
Much of the growth of manufacturing has been concentrated in coastal China, especiallyin the zones around Shanghai and Hong Kong that have been opened to foreign investmentand in the vicinity of the capital, Beijing (see Figure 10.9). Originally experimental, as thecommunist leadership in Beijing worked out a new model for maintaining political controlover China while trying to absorb foreign capital, technology and management practices, thespecial economic zones (SEZs), such as Shenzhen in Guangdong Province on the border withHong Kong, have become the nodal points for reforming the Chinese economy as a whole.Under the leadership of Deng Xiaoping from 1978, China embarked on a thoroughgoingreorientation of its economy away from the autarchic China of the 1960s when agricultureand national economic self-sufficiency were the priorities. The new model involved privatizingcollective farms, closing or privatizing parts of state industry, dismantling central planning infavor of private entrepreneurship and market mechanisms, and fully integrating China intothe world economy. Economic growth has been elevated above class struggle.
Some 54 percent of Chinese, 657 million people in 2011, still live on the land. The firsteconomic reforms concentrated on privatizing peasant agriculture, taking a leaf out of thebook of their East Asian neighbors Japan, Taiwan, and South Korea in privileging rural landreform. This increased farm production and rural incomes tremendously, providing capitalfor industrialization and improvements in infrastructure in some restricted areas. “Worldstandards” were brought to bear on the economy through the establishment of SEZs to attractforeign technology and management. The dramatic success of Guangdong Province in southern
SPATIAL TRANSFORMATION OF CORE AND PERIPHERY304
6063 GEOGRAPHY WORLD ECON_PT_246x189 mm 22/01/2014 15:10 Page 304
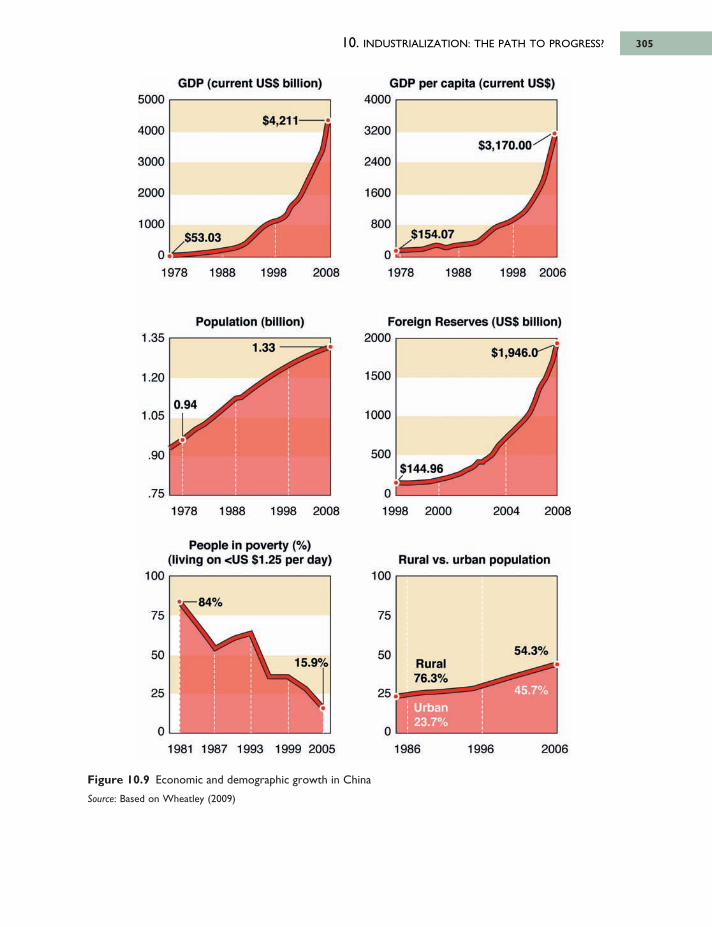
10. INDUSTRIALIZATION: THE PATH TO PROGRESS? 305
Figure 10.9 Economic and demographic growth in China
Source: Based on Wheatley (2009)
6063 GEOGRAPHY WORLD ECON_PT_246x189 mm 22/01/2014 15:10 Page 305
GDP (current USS billion) GDP per capita (current USS)4000
3200
2400
1600
800
0
$154.07
S3,170.00-"
1978 1988 1998 2006
$4,211-
5000
4000
3000
2000
1000
0,$53.03
1978 1988 1998 2008
Population (billion) Foreign Reserves (US$ billion)2000
1500
1000
500
1.35
1.20
1.05
.90
.75
0.94
1 .3 3 -
1978 1988 1998 200801998 2000 2004 2008
$144.96
$1,946.0-"
People in poverty (%) (living on <US $1.25 per day)
1 0 0
75
50
25
01981 1987 1993 1999 2005
15.9%
84%
Rural vs. urban population1 0 0
75
50
25
0
Rural76.3%
54.3%
45.7%Urban23.7%
1986 1996 2006
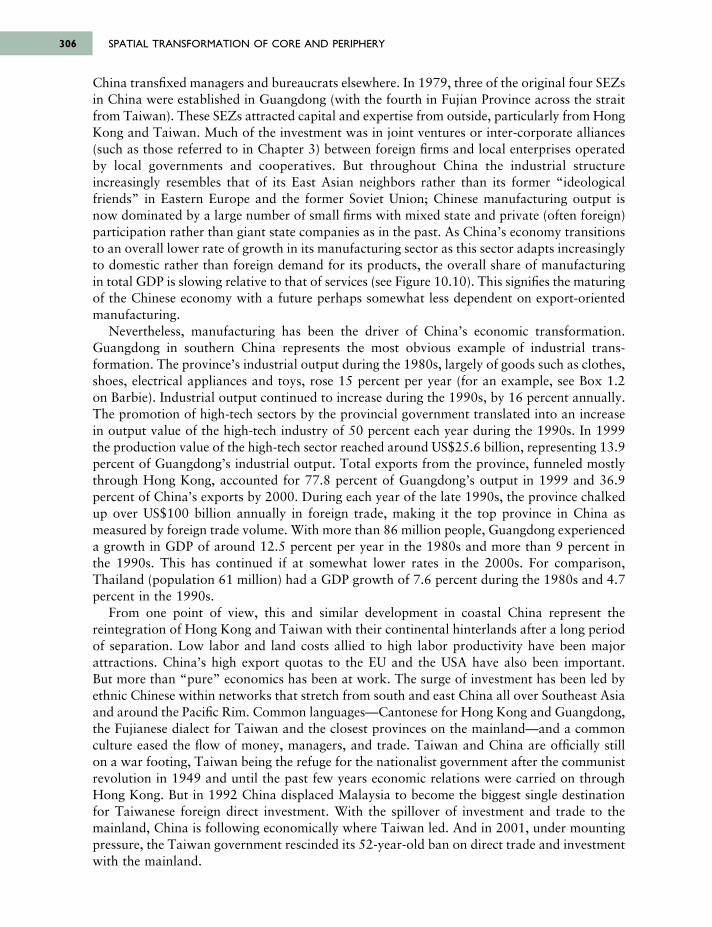
China transfixed managers and bureaucrats elsewhere. In 1979, three of the original four SEZsin China were established in Guangdong (with the fourth in Fujian Province across the straitfrom Taiwan). These SEZs attracted capital and expertise from outside, particularly from HongKong and Taiwan. Much of the investment was in joint ventures or inter-corporate alliances(such as those referred to in Chapter 3) between foreign firms and local enterprises operatedby local governments and cooperatives. But throughout China the industrial structureincreasingly resembles that of its East Asian neighbors rather than its former “ideologicalfriends” in Eastern Europe and the former Soviet Union; Chinese manufacturing output isnow dominated by a large number of small firms with mixed state and private (often foreign)participation rather than giant state companies as in the past. As China’s economy transitionsto an overall lower rate of growth in its manufacturing sector as this sector adapts increasinglyto domestic rather than foreign demand for its products, the overall share of manufacturingin total GDP is slowing relative to that of services (see Figure 10.10). This signifies the maturingof the Chinese economy with a future perhaps somewhat less dependent on export-orientedmanufacturing.
Nevertheless, manufacturing has been the driver of China’s economic transformation.Guang dong in southern China represents the most obvious example of industrial trans -formation. The province’s industrial output during the 1980s, largely of goods such as clothes,shoes, electrical appliances and toys, rose 15 percent per year (for an example, see Box 1.2on Barbie). Industrial output continued to increase during the 1990s, by 16 percent annually.The promotion of high-tech sectors by the provincial government translated into an increasein output value of the high-tech industry of 50 percent each year during the 1990s. In 1999the production value of the high-tech sector reached around US$25.6 billion, representing 13.9percent of Guangdong’s industrial output. Total exports from the province, funneled mostlythrough Hong Kong, accounted for 77.8 percent of Guangdong’s output in 1999 and 36.9percent of China’s exports by 2000. During each year of the late 1990s, the province chalkedup over US$100 billion annually in foreign trade, making it the top province in China asmeasured by foreign trade volume. With more than 86 million people, Guangdong experienceda growth in GDP of around 12.5 percent per year in the 1980s and more than 9 percent inthe 1990s. This has continued if at somewhat lower rates in the 2000s. For comparison,Thailand (population 61 million) had a GDP growth of 7.6 percent during the 1980s and 4.7percent in the 1990s.
From one point of view, this and similar development in coastal China represent thereintegration of Hong Kong and Taiwan with their continental hinterlands after a long periodof separation. Low labor and land costs allied to high labor productivity have been majorattractions. China’s high export quotas to the EU and the USA have also been important. But more than “pure” economics has been at work. The surge of investment has been led byethnic Chinese within networks that stretch from south and east China all over Southeast Asiaand around the Pacific Rim. Common languages—Cantonese for Hong Kong and Guangdong,the Fujianese dialect for Taiwan and the closest provinces on the mainland—and a commonculture eased the flow of money, managers, and trade. Taiwan and China are officially stillon a war footing, Taiwan being the refuge for the nationalist government after the communistrevolution in 1949 and until the past few years economic relations were carried on throughHong Kong. But in 1992 China displaced Malaysia to become the biggest single destinationfor Taiwanese foreign direct investment. With the spillover of investment and trade to themainland, China is following economically where Taiwan led. And in 2001, under mountingpressure, the Taiwan government rescinded its 52-year-old ban on direct trade and investmentwith the mainland.
SPATIAL TRANSFORMATION OF CORE AND PERIPHERY306
6063 GEOGRAPHY WORLD ECON_PT_246x189 mm 22/01/2014 15:10 Page 306
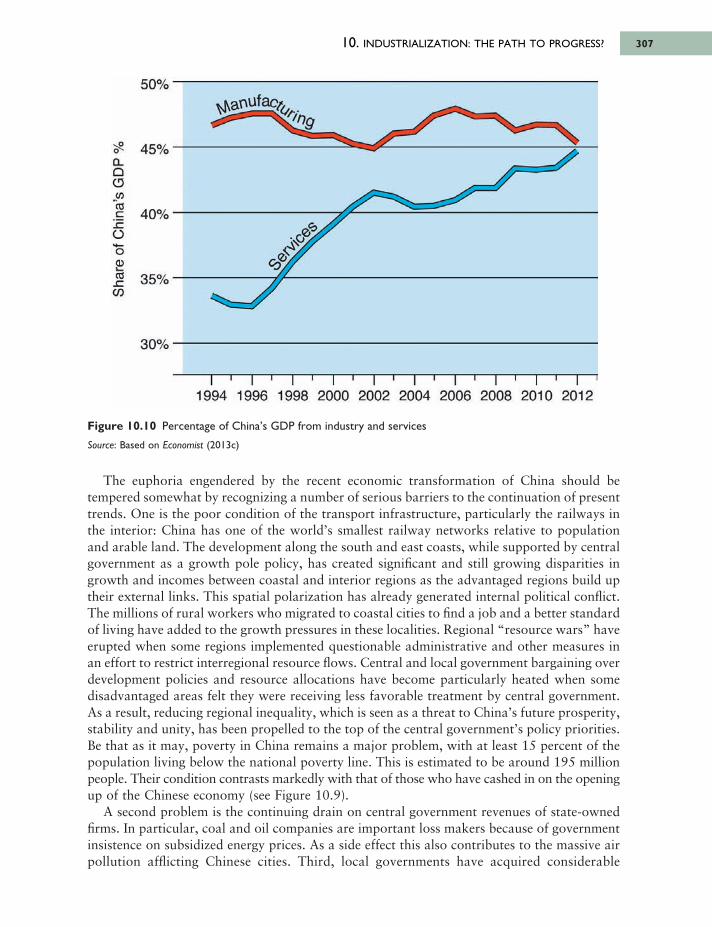
10. INDUSTRIALIZATION: THE PATH TO PROGRESS? 307
The euphoria engendered by the recent economic transformation of China should betempered somewhat by recognizing a number of serious barriers to the continuation of presenttrends. One is the poor condition of the transport infrastructure, particularly the railways inthe interior: China has one of the world’s smallest railway networks relative to populationand arable land. The development along the south and east coasts, while supported by centralgovernment as a growth pole policy, has created significant and still growing disparities ingrowth and incomes between coastal and interior regions as the advantaged regions build uptheir external links. This spatial polarization has already generated internal political conflict.The millions of rural workers who migrated to coastal cities to find a job and a better standardof living have added to the growth pressures in these localities. Regional “resource wars” haveerupted when some regions implemented questionable administrative and other measures inan effort to restrict interregional resource flows. Central and local government bargaining overdevelopment policies and resource allocations have become particularly heated when somedisadvantaged areas felt they were receiving less favorable treatment by central government.As a result, reducing regional inequality, which is seen as a threat to China’s future prosperity,stability and unity, has been propelled to the top of the central government’s policy priorities.Be that as it may, poverty in China remains a major problem, with at least 15 percent of thepopulation living below the national poverty line. This is estimated to be around 195 millionpeople. Their condition contrasts markedly with that of those who have cashed in on the openingup of the Chinese economy (see Figure 10.9).
A second problem is the continuing drain on central government revenues of state-ownedfirms. In particular, coal and oil companies are important loss makers because of governmentinsistence on subsidized energy prices. As a side effect this also contributes to the massive airpollution afflicting Chinese cities. Third, local governments have acquired considerable
Figure 10.10 Percentage of China’s GDP from industry and services
Source: Based on Economist (2013c)
6063 GEOGRAPHY WORLD ECON_PT_246x189 mm 22/01/2014 15:10 Page 307
50%
45%
40%
35%
30%
'SCLQCDCO
"<0c1cOoS>ШCCO
1994 1996 1998 2000 2002 2004 2006 2008 2010 2012
СЎЛ
A
nufac
rK
SPATIAL TRANSFORMATION OF CORE AND PERIPHERY308
Box 10.1 Dreaming the BRIC future
In 2007 economists at the U.S. investment bank, Goldman Sachs, predicted that over thenext 40 years, Brazil, Russia, India, and China—what they termed the BRIC economies—could become a major force in the world economy, primarily as manufacturing centers(particularly in the case of China and India) but also as major resource economies(particularly in the case of Russia and Brazil). Using a variety of economic indicators, theGoldman Sachs economists projected GDP growth and incomes per capita for the BRICs to2050. Although incomes are likely to be lower than the average for individuals in the G7(the USA, Japan, Germany, France, UK, Canada, and Italy), GDP growth rates would bemuch higher so that by 2050 the BRIC economies together would be larger than the G7(see Table 10.7). Relative growth in the size and skills of labor forces as well as the overallcompetitive advantage of the BRIC economies in crucial sectors are the motors driving thisvision of the future. The major overall assumption is that the BRICs must at least maintaintheir present levels of openness to the world economy and follow development policies thatprivilege their respective competitive advantages, such as Russia in natural gas, Brazil inagribusiness and certain manufacturing sectors, India in manufacturing and producer services,and China in manufacturing. Of course, declining populations (particularly as dramatic as thatin Russia), slower growth in the economies to which exports would be directed (such asEurope, the USA and Japan), and persistent problems such as massive underinvestment inroad and other public infrastructure in India, rapidly increasing income inequalities betweenregions as in China and Brazil, massive corruption (in all countries), and the lack ofsymmetry between the shifts in the location of basic economic activities and the persistentdominance of the G7 countries (particularly the USA) in financial and monetary matters willlimit the possibilities for a smooth transition to a truly new world economic order in whichthe core expands spectacularly to include the BRICs.
autonomy in pushing credit expansion and investment. This has led to an overheating of thenational economy as expanding credit chases a shrinking money supply controlled from thecenter. Fourth, for all of the success in creating a private economy there is still a level ofgovernment regulation without a guaranteed rule of law, which makes for an arbitraryapplication of rules and encourages corruption among civil servants. Finally, China’smanufacturing economy is increasingly dependent on importing resources from and exportingcapital to elsewhere. This has led to charges that China is “buying the world.” Although Chineseresource companies have been very active in land grabs and locked-in resource contracts insome places, particularly Sub-Saharan Africa, much Chinese investment is now following inthe tracks of that of other economic “powers”: To the businesses and stock markets of theworld’s financial centers such as London and New York. So, still a relatively, poor country,China has become a major source of capital to the “rich world” of the long established DCs.
At the root of many of these problems is the lack of political change paralleling the economicchange. Unlike the countries of Eastern Europe and the former Soviet Union, which haveundergone political change prior to economic reform, China has created an increasinglycapitalist economy within a still formally socialist state. The consensus view among professional“China watchers” is that the Chinese Communist Party is now largely irrelevant to economiclife and, as the revolt of the movement for greater political democracy that was violentlysuppressed in Tiananmen Square in Beijing in 1989 showed, its monopoly of state power is
6063 GEOGRAPHY WORLD ECON_PT_246x189 mm 22/01/2014 15:10 Page 308
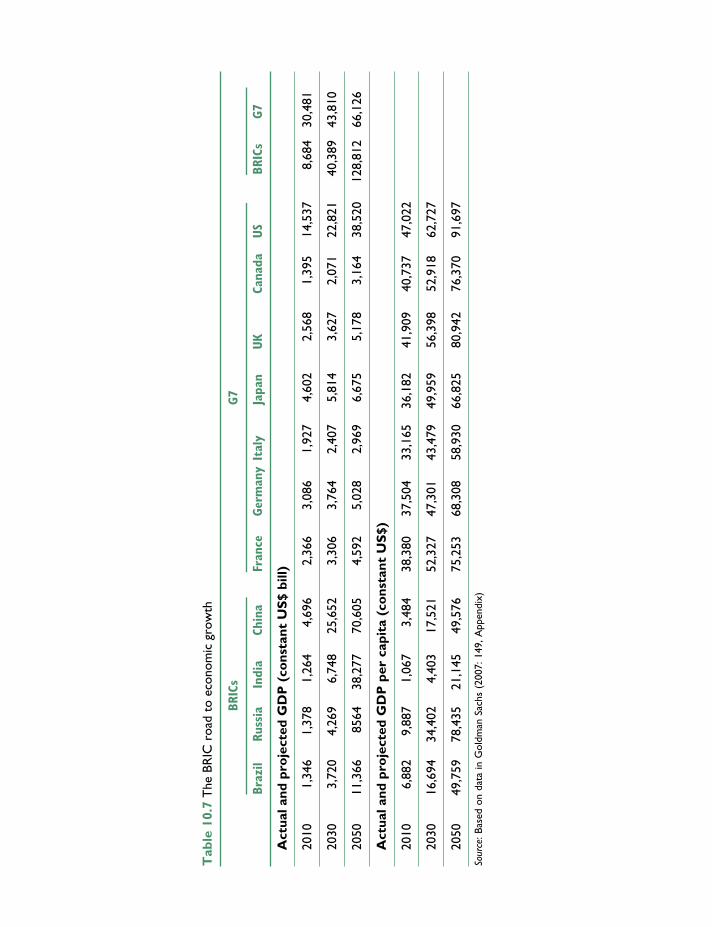
Tab
le 1
0.7
The
BR
IC r
oad
to e
cono
mic
gro
wth
BRIC
sG7
Braz
ilRu
ssia
Indi
aCh
ina
Fran
ceGer
man
yIt
aly
Japa
nUK
Cana
daUS
BRIC
sG7
Act
ual a
nd p
roje
cted
GD
P (
cons
tant
US
$ bi
ll)
2010
1,34
61,
378
1,26
44,
696
2,36
63,
086
1,92
74,
602
2,56
81,
395
14,5
378,
684
30,4
81
2030
3,72
04,
269
6,74
825
,652
3,30
63,
764
2,40
75,
814
3,62
72,
071
22,8
2140
,389
43,8
10
2050
11,3
6685
6438
,277
70,6
054,
592
5,02
82,
969
6,67
55,
178
3,16
438
,520
128,
812
66,1
26
Act
ual a
nd p
roje
cted
GD
P p
er c
apit
a (c
ons
tant
US
$)
2010
6,88
29,
887
1,06
73,
484
38,3
8037
,504
33,1
6536
,182
41,9
0940
,737
47,0
22
2030
16,6
9434
,402
4,40
317
,521
52,3
2747
,301
43,4
7949
,959
56,3
9852
,918
62,7
27
2050
49,7
5978
,435
21,1
4549
,576
75,2
5368
,308
58,9
3066
,825
80,9
4276
,370
91,6
97
Sour
ce: B
ased
on
data
in G
oldm
an S
achs
(20
07: 1
49, A
ppen
dix)
6063 GEOGRAPHY WORLD ECON_PT_246x189 mm 22/01/2014 15:10 Page 309
unacceptable to many. As one commentator expressed it: “Communism in China will prob-ably end not with a bang but a whimper” (MacFarquhar, 1992: 28). The capitalist genieunleashed in 1978 is probably too well established now to put back in the lamp of communistautarky.
Such internal political conflicts aside, China’s rapid economic growth has produced a degreeof political hysteria in some other countries, not least in the United States. Yet, access to China’spresumably gargantuan market has long been the prize most celebrated in the U.S. idea of aPacific Century. Now, however, the emergence of China as a major supplier of consumer goodsto the USA, the huge buildup of U.S. dollar reserves by the Chinese Central Bank (see Figure10.9) and the presumed base its high rate of economic growth will give China in thepolitical–military competition of Great Power politics have conspired to produce an increasingsense of threat in some quarters. The bilateral trade deficits between the USA and Europe, onthe one hand, and China, on the other, attract particular hostility when, in fact, this hostilityreflects calculations that ignore the complexity of contemporary production chains and theimbalances between currencies, which, in turn, reflect high Chinese savings and considerableU.S. and European profligacy or consumer spending beyond available incomes. At the sametime, China is seriously overrated as both an economic and a political challenge. At least duringthe Cold War, China was a “beacon for many in the LDCs. China now is a beacon for noone, and, indeed, an ally to no one. No other supposedly great power is as bereft of friends”(Segal, 1999: 25). China’s reliance on U.S. and other foreign export markets, the close linkageof the Chinese currency, the yuan, to the U.S. dollar, and the heavy dependence of Chineseeconomic growth until recently on foreign investment and technology now all limit its externalleverage. U.S. critics of China’s rise should rest more easily.
SUMMARYAccording to the World Bank (1983), the aggregate rate of growth of both industrial (mineralresources plus manufacturing) and manufacturing output were over 3 percent per annum for34 low-income countries (for example, Bangladesh, Cambodia, and Sierra Leone) and over 6percent per annum for 59 middle-income countries (for example, Mexico, Oman, and SouthKorea) over the period 1960–1981. These rates were higher than those for the DCs and,consequently, the share of the LDCs in the world’s manufacturing output rose somewhat: From17.6 percent in 1960 to 18.9 percent in 1981. Their combined share of world exports ofmanufactures rose from 3.9 percent to 8.2 percent in the same period. Or, from a slightlydifferent perspective, the LDCs’ share of the manufactured imports of all industrial countriesrose from 5.3 percent in 1962 to 13.1 percent in 1978. At the same time, the share of theGDP of the low-income countries coming from the industrial sector rose from 25 percent in1960 to 34 percent in 1981. For manufacturing the rise was only from 11 to 16 percent. Inthe middle-income group the changes were from 30 to 38 percent for industry, and from 20to 22 percent for manufacturing alone. Much of this growth was concentrated in a relativelysmall group of NIEs such as South Korea and Taiwan.
With some notable exceptions to the general trends, including China, the East Asian NIEs,and some Southeast Asian countries, the growth of manufacturing industry in the peripheryand its penetration of DC markets did not deepen much in the 1980s and 1990s, even thoughit spread somewhat beyond the older NIEs. Annual rates of growth in manufacturing averaged4.9 percent in the 1980s and 5.8 percent in the 1990s for all LDCs (7.7 percent average inthe 1980s and 2.7 percent in the 1990s for the low-income countries, and 4.6 percent in the1980s and 6.3 percent in the 1990s for the middle-income ones). The OECD (major
SPATIAL TRANSFORMATION OF CORE AND PERIPHERY310
6063 GEOGRAPHY WORLD ECON_PT_246x189 mm 22/01/2014 15:10 Page 310
industrialized) countries averaged 3.3 percent per annum through the decade of the 1980sand 3.6 percent annually between 1993 and 2002. At the same time the LDCs’ share of themanufactured imports into all industrial countries sank to 12.4 percent in 1999, having fallenfrom 12.9 percent in 1990, and 13.1 percent in 1978. In the 2000s the story has been one ofsignificant manufacturing growth largely in East Asia and in the BRICs. So, even though theglobal manufacturing picture today is radically different from that in the 1960s, it is one inwhich only certain specific parts of the world have been added to the older map.
These figures call into question the generally optimistic conclusion of Warren (1980) andothers (see Chapter 8) that a massive industrialization of the periphery was under way. Indeed,this chapter has suggested that there are significant constraints on the industrialization of theperiphery and the 1970s to 2000 provided a time period uniquely favorable to the type ofdevelopment that did take place. Indeed, even in that time period a number of economiesstagnated or deindustrialized (for example, Argentina). The economic problems of the industrialcore have not created inevitable advantages for industrialization in the global periphery. Anyadvantages have been created there rather than simply given from the outside. Indeed, astechnology substitutes for labor in many manufacturing sectors, manufacturing can be reshoredback to the DCs.
Some of the major conclusions are as follows:
• Industrialization plays a major role in national ideologies of modernization and is seen asa solution to various major practical economic and social problems.
• The spread and intensification of industrialization since the late 1960s coincided with thedeclining rate of profit for industrial companies in the industrial core.
• Much of the new industrialization is export oriented rather than directed (as in importsubstitution) to domestic markets.
• There are limits to the development of this industrialization: Such as improving profit ratesin the industrial core, protectionist measures in export markets, technological changes thatreduce the attractiveness of low-wage locations, incredible debt loads, and relatively limitedemployment effects. Most LDCs are either not industrializing or are industrializing onlyvery slowly.
• Export processing zones (EPZs) represent one geographical form taken by the new inter-national division of labor (NIDL), but offshore production of components or assembly isnot the only feature of peripheral industrialization. There are now important industriesengaged in the production of locally created final products.
• The new industrialization has favored existing metropolitan areas and coastal regions.Attempts at decentralization to growth poles have not met with much success.
• The profile of China’s industrialization reflects a conscious decision by the Chinesegovernment to re-engage with the world economy after a long period on its margins. As ageographical extension of the existing NIEs of East Asia, China represents the main wave of new industrialization in the world economy during the last few decades. This wasanything but a global trend. But some commentators suggest that China’s rapid growthwill soon be followed by that of some other very large semi-peripheral economies (the three other BRIC economies) that benefiting from economies of scale also have resourcesand capacities that could lead to a major shift in the balance of power within the worldeconomy.
10. INDUSTRIALIZATION: THE PATH TO PROGRESS? 311
6063 GEOGRAPHY WORLD ECON_PT_246x189 mm 22/01/2014 15:10 Page 311
KEY SOURCES AND SUGGESTED READINGAgnew, J.A., 2005. A New ‘Pacific Century’? North America and the Pacific Rim, in The USA and Canada
2005, 7th edn. London: Europa.Chen, X., 2005. As Borders Bend: Transnational spaces on the Pacific Rim. Lanham, MD: Rowman &
Littlefield.Economist, 2006. The Physical Internet: A survey of logistics, June 17.Economist, 2011. Let a Million Flowers Bloom: Entrepreneurship in China, March 12.Economist, 2013. China’s overseas investment, January 19.Goldman Sachs, 2007. The BRICs and Beyond. New York: Goldman Sachs.Naughton, B. 2007. The Chinese Economy: Transitions and growth. Cambridge, MA: MIT Press.Studwell, J., 2013. How Asia Works: Success and failure in the world’s most dynamic region. London:
Profile Books.UNDP, 2007. Human Development Report: Fighting climate change, human solidarity in a divided world.
New York: United Nations.UNIDO, 2005. Industrial Development: Global report. New York: United Nations.Wolf, M., 2006. The Answer to Asia’s Rise is not to Retreat from the World, Financial Times March
15, 15.Wood, T., 2007. Contours of the Putin Era, New Left Review 44, 53–68.
SPATIAL TRANSFORMATION OF CORE AND PERIPHERY312
6063 GEOGRAPHY WORLD ECON_PT_246x189 mm 22/01/2014 15:10 Page 312
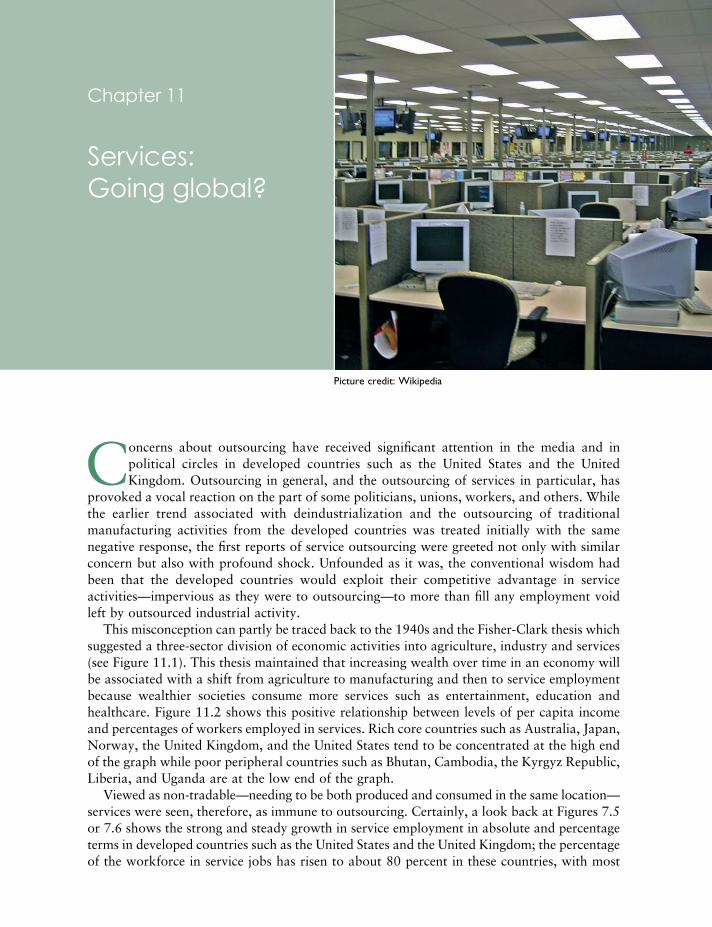
Concerns about outsourcing have received significant attention in the media and inpolitical circles in developed countries such as the United States and the UnitedKingdom. Outsourcing in general, and the outsourcing of services in particular, has
provoked a vocal reaction on the part of some politicians, unions, workers, and others. Whilethe earlier trend associated with deindustrialization and the outsourcing of traditionalmanufacturing activities from the developed countries was treated initially with the samenegative response, the first reports of service outsourcing were greeted not only with similarconcern but also with profound shock. Unfounded as it was, the conventional wisdom hadbeen that the developed countries would exploit their competitive advantage in serviceactivities—impervious as they were to outsourcing—to more than fill any employment voidleft by outsourced industrial activity.
This misconception can partly be traced back to the 1940s and the Fisher-Clark thesis whichsuggested a three-sector division of economic activities into agriculture, industry and services(see Figure 11.1). This thesis maintained that increasing wealth over time in an economy willbe associated with a shift from agriculture to manufacturing and then to service employmentbecause wealthier societies consume more services such as entertainment, education andhealthcare. Figure 11.2 shows this positive relationship between levels of per capita incomeand percentages of workers employed in services. Rich core countries such as Australia, Japan,Norway, the United Kingdom, and the United States tend to be concentrated at the high endof the graph while poor peripheral countries such as Bhutan, Cambodia, the Kyrgyz Republic,Liberia, and Uganda are at the low end of the graph.
Viewed as non-tradable—needing to be both produced and consumed in the same location—services were seen, therefore, as immune to outsourcing. Certainly, a look back at Figures 7.5or 7.6 shows the strong and steady growth in service employment in absolute and percentageterms in developed countries such as the United States and the United Kingdom; the percentageof the workforce in service jobs has risen to about 80 percent in these countries, with most
Picture credit: Wikipedia
Chapter 11
Services: Going global?
6063 GEOGRAPHY WORLD ECON_PT_246x189 mm 22/01/2014 15:10 Page 313
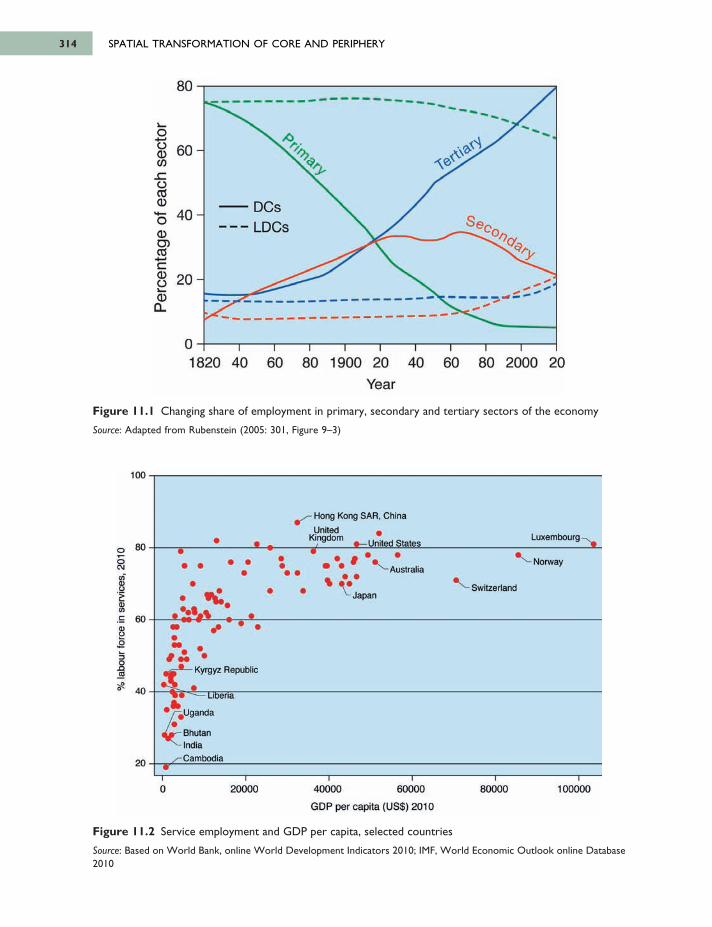
SPATIAL TRANSFORMATION OF CORE AND PERIPHERY314
Figure 11.1 Changing share of employment in primary, secondary and tertiary sectors of the economy
Source: Adapted from Rubenstein (2005: 301, Figure 9–3)
Figure 11.2 Service employment and GDP per capita, selected countries
Source: Based on World Bank, online World Development Indicators 2010; IMF, World Economic Outlook online Database2010
6063 GEOGRAPHY WORLD ECON_PT_246x189 mm 22/01/2014 15:10 Page 314
80
60
40
20
Ο
DCsLDCs
1820 40 60 80 1900 20 40 60 80 2000 20Year
/О
%а .
s «?<?0
Hong Kong SAR. China
United #Kingdom Luxembourg
Norway
- Switzerland
Australia
- Japan
Kyrgyz Republic
Liberia-Uganda
BhutanIndiaCambodia
Έв(Λс
8оз0 _о а1
100
80
60
40
20
0 20000 40000 60000 80000 100000
GDP per capita (US$) 2010
gro
wth
gro
wth
gro
wth
gro
wth
gro
wth
gro
wth
gro
wth
gro
wth
gro
wth
gro
wth
gro
wth
gro
wth
gro
wth
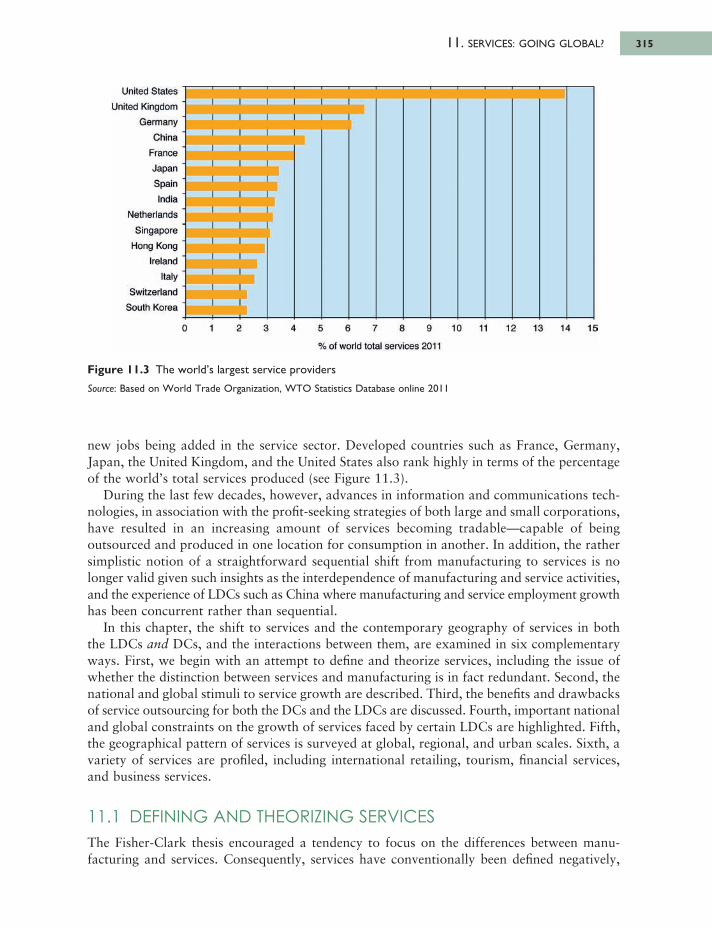
new jobs being added in the service sector. Developed countries such as France, Germany,Japan, the United Kingdom, and the United States also rank highly in terms of the percentageof the world’s total services produced (see Figure 11.3).
During the last few decades, however, advances in information and communications tech -nologies, in association with the profit-seeking strategies of both large and small corporations,have resulted in an increasing amount of services becoming tradable—capable of beingoutsourced and produced in one location for consumption in another. In addition, the rathersimplistic notion of a straightforward sequential shift from manufacturing to services is nolonger valid given such insights as the interdependence of manufacturing and service activities,and the experience of LDCs such as China where manufacturing and service employment growthhas been concurrent rather than sequential.
In this chapter, the shift to services and the contemporary geography of services in boththe LDCs and DCs, and the interactions between them, are examined in six complementaryways. First, we begin with an attempt to define and theorize services, including the issue ofwhether the distinction between services and manufacturing is in fact redundant. Second, thenational and global stimuli to service growth are described. Third, the benefits and drawbacksof service outsourcing for both the DCs and the LDCs are discussed. Fourth, important nationaland global constraints on the growth of services faced by certain LDCs are highlighted. Fifth,the geographical pattern of services is surveyed at global, regional, and urban scales. Sixth, avariety of services are profiled, including international retailing, tourism, financial services,and business services.
11.1 DEFINING AND THEORIZING SERVICESThe Fisher-Clark thesis encouraged a tendency to focus on the differences between manu -facturing and services. Consequently, services have conventionally been defined negatively,
11. SERVICES: GOING GLOBAL? 315
Figure 11.3 The world’s largest service providers
Source: Based on World Trade Organization, WTO Statistics Database online 2011
6063 GEOGRAPHY WORLD ECON_PT_246x189 mm 22/01/2014 15:10 Page 315
United States United Kingdom
Germany China
France Japan Spain India
Netherlands Singapore
Hong Kong Ireland
Italy Switzerland
South Korea
0 1 2 3 4 5 6 7 8 9 10 11 12 13 14 15
% of world total services 2011
comprising what remains after agriculture, mining, and manufacturing are excluded (CRIC,2006).
Certainly, some differences between manufacturing and services have important implicationsfor the LDCs and the DCs. The manufacturing and service labor markets, for example, differin a number of ways. Many services—including customer services, entertainment, and education—tend to be relatively more labor intensive and less easy to mechanize than manufacturing.Labor-intensive non-tradable services like hotels and restaurants will be more secure fromoutsourcing than tradable services like call centers or data entry. This has impli cations alsobecause of the difference in the gender composition of services compared to manufacturing. Inthe DCs, women, as well as minorities, have historically dominated lower paid so-called pink-collar jobs in the clerical, secretarial, retail, restaurant, teaching, and childcare fields. This isalso an issue in terms of concerns about the bifurcated nature of the income distribution inservices when contrasted with that for manufacturing. Despite the limited evidence for anydifference in the wage distribution between services and manufacturing (Stutz and Warf, 2007),the loss of factory jobs in manufacturing which had allowed a middle-income lifestyle, and thebifurcation between high-skilled high-paying service jobs in producer services such as financeor research and development (R&D) versus low-skilled low-paying service jobs in restaurantsand hotels, have been seen as promoting a polarization of income groups in the DCs.
The distinction between services and manufacturing also has implications for measuringand studying services. For example, should services be measured as a set of industries or aseries of occupations? A secretary who works in a factory and one who works in a bank mayhave similar duties. Categorized by industry, the secretary in the bank would be in servicesand the one in the factory would be in manufacturing; categorized by occupation, however,both secretaries would be in the service sector.
Although there is no generally agreed on definition, there is general agreement on the majorcomponents of the service sector (Bryson, Daniels, and Warf, 2004: 7). The following sevencomponents of the service sector can also be further categorized into private (marketed) andpublic (non-marketed) sectors. As a result of the private sector’s concern for the profit motiveof business operations, the internationalization of services has mostly entailed marketedservices (Bagchi-Sen and Sen, 1997):
1. Finance, insurance, and real estate (FIRE) including commercial and investment banking,insurance of all kinds (property, medical, casualty), and the residential and commercial realestate business.
2. Business services including legal services, advertising and marketing, public relations,accounting, research and development, personnel training, recruitment, architecture andengineering, and consulting.
3. Transportation and communications, including electronic media, trucking, shipping,railroads, airlines, and local transportation (buses, taxis, etc.).
4. Wholesale and retail trade, including major wholesalers that supply major retailers. Eatingand drinking establishments, personal services, and repair and maintenance businesses areclosely affiliated.
5. Entertainment, hotels, and motels—part of tourism.6. Public services at all government levels—only recently viewed as part of the service
economy—including public servants, the armed forces, public school teachers, publichealthcare professionals, and police and fire departments.
7. Nonprofit services, including churches, charities, museums, and nonprofit healthcareagencies.
SPATIAL TRANSFORMATION OF CORE AND PERIPHERY316
6063 GEOGRAPHY WORLD ECON_PT_246x189 mm 22/01/2014 15:10 Page 316
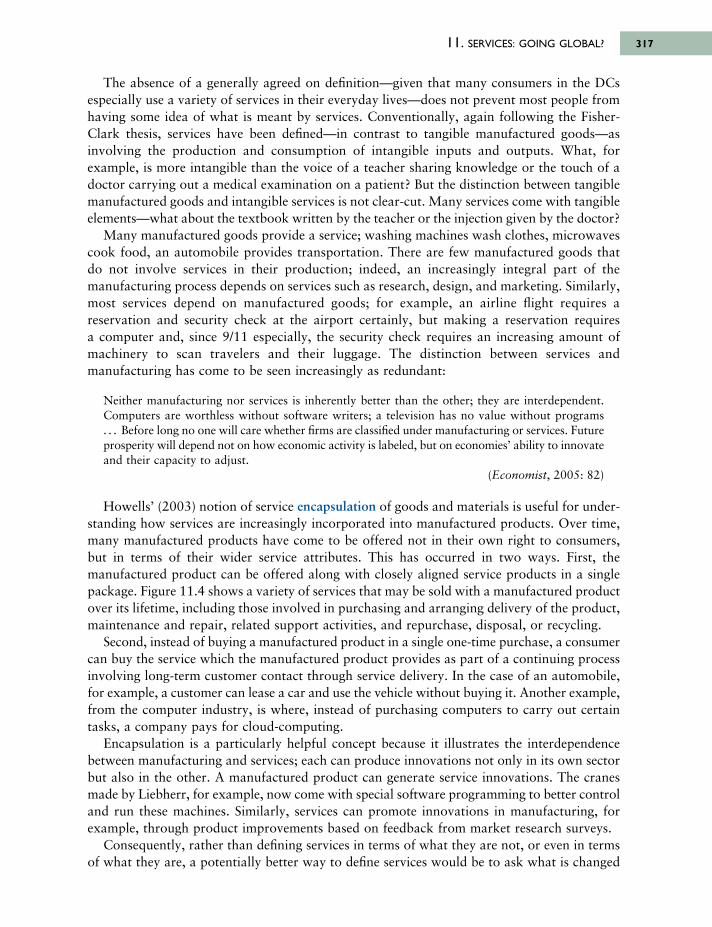
The absence of a generally agreed on definition—given that many consumers in the DCsespecially use a variety of services in their everyday lives—does not prevent most people fromhaving some idea of what is meant by services. Conventionally, again following the Fisher-Clark thesis, services have been defined—in contrast to tangible manufactured goods—asinvolving the production and consumption of intangible inputs and outputs. What, forexample, is more intangible than the voice of a teacher sharing knowledge or the touch of adoctor carrying out a medical examination on a patient? But the distinction between tangiblemanufactured goods and intangible services is not clear-cut. Many services come with tangibleelements—what about the textbook written by the teacher or the injection given by the doctor?
Many manufactured goods provide a service; washing machines wash clothes, microwavescook food, an automobile provides transportation. There are few manufactured goods thatdo not involve services in their production; indeed, an increasingly integral part of themanufacturing process depends on services such as research, design, and marketing. Similarly,most services depend on manufactured goods; for example, an airline flight requires areservation and security check at the airport certainly, but making a reservation requires a computer and, since 9/11 especially, the security check requires an increasing amount ofmachinery to scan travelers and their luggage. The distinction between services andmanufacturing has come to be seen increasingly as redundant:
Neither manufacturing nor services is inherently better than the other; they are interdependent.Computers are worthless without software writers; a television has no value without programs. . . Before long no one will care whether firms are classified under manufacturing or services. Futureprosperity will depend not on how economic activity is labeled, but on economies’ ability to innovateand their capacity to adjust.
(Economist, 2005: 82)
Howells’ (2003) notion of service encapsulation of goods and materials is useful for under-standing how services are increasingly incorporated into manufactured products. Over time,many manufactured products have come to be offered not in their own right to consumers,but in terms of their wider service attributes. This has occurred in two ways. First, themanufactured product can be offered along with closely aligned service products in a singlepackage. Figure 11.4 shows a variety of services that may be sold with a manufactured productover its lifetime, including those involved in purchasing and arranging delivery of the product,maintenance and repair, related support activities, and repurchase, disposal, or recycling.
Second, instead of buying a manufactured product in a single one-time purchase, a consumercan buy the service which the manufactured product provides as part of a continuing processinvolving long-term customer contact through service delivery. In the case of an automobile,for example, a customer can lease a car and use the vehicle without buying it. Another example,from the computer industry, is where, instead of purchasing computers to carry out certaintasks, a company pays for cloud-computing.
Encapsulation is a particularly helpful concept because it illustrates the interdependencebetween manufacturing and services; each can produce innovations not only in its own sectorbut also in the other. A manufactured product can generate service innovations. The cranesmade by Liebherr, for example, now come with special software programming to better controland run these machines. Similarly, services can promote innovations in manufacturing, forexample, through product improvements based on feedback from market research surveys.
Consequently, rather than defining services in terms of what they are not, or even in termsof what they are, a potentially better way to define services would be to ask what is changed
11. SERVICES: GOING GLOBAL? 317
6063 GEOGRAPHY WORLD ECON_PT_246x189 mm 22/01/2014 15:10 Page 317
SPATIAL TRANSFORMATION OF CORE AND PERIPHERY318
by the service and how. Whereas manufacturers change raw materials and energy intoproducts, services physically, spatially or temporally change a person, manufactured productor information. Some services transform people, as when a customer receives a haircut froma hairstylist or an operation in a hospital to remove an appendix. Other services can changemanufactured products by repairing them or by transporting them from one location to another.Still other services, such as financial services, transform information, such as the balance in aperson’s bank account (CRIC, 2006).
11.2 NATIONAL AND GLOBAL STIMULI TO THE GROWTH OFSERVICES
Bryson et al. (2004: 11–14) suggest six main forces that drive the growth of services. Theseforces operate at a number of spatial scales, including national and global, involve a range ofcontemporary and historical factors, and play out differently depending on national and localcontexts.
RISING PER CAPITA INCOMES
Rising incomes in most core and many semi-peripheral countries have contributed to an increasein service employment. Services have a high elasticity of demand—increases in personalincome generate a significant increase in domestic demand for services. As per capita incomerises, people tend to try to minimize the time they devote to everyday tasks. In core countries,for example, many people who can afford to will pay for services such as lawncare or home -cleaning; they may also eat in restaurants more frequently instead of cooking at home. Thegrowth of tourism has been fueled by the consumption of services with a particularly highelasticity of demand, such as transportation, hotels, and entertainment.
Figure 11.4 Service encapsulation
Source: Adapted from Howells (2003: 10, Figure 1)
6063 GEOGRAPHY WORLD ECON_PT_246x189 mm 22/01/2014 15:10 Page 318
ServicesMonitoring and
diagnostic services
Purchase/ finance and
leasing facilities; delivery у
Manufactured product
Maintenance and repair
Repurchase, disposal and
l recycling
Retrofitting and updating
Purchase and operation of related support activities; expert
advice/consultancy ^
11. SERVICES: GOING GLOBAL? 319
GROWING DEMAND FOR HEALTHCARE AND EDUCATIONAL SERVICES
The growth in domestic demand for healthcare and educational services, particularly in coreeconomies, has also contributed to the growth in services. Demographically, the aging of thepopulation in many core economies has meant that demand for healthcare has risen on thepart of middle-aged and elderly people who require relatively high levels of medical care. Atthe same time, factors such as the changing labor market, the need for advanced skills in theworkplace, and the possibility of taking classes online, to name a few, have resulted in greaterdemand for educational services.
AN INCREASINGLY COMPLEX DIVISION OF LABOR
An increasingly complex division of labor has helped fuel the growth in services in general,and producer services in particular. An ever more complicated commercial environment hasforced companies to depend on a variety of services, including accountancy, research anddevelopment, marketing and advertising, and public relations. High-tech equipment in modernoffice buildings requires skilled maintenance, repair, and security services.
THE SIZE AND ROLE OF THE PUBLIC SECTOR
The size and role of the public sector has been a factor in the growth of the service sector.First, despite efforts to curtail government employment through strategies such as privatization,public-sector employment remains significant; in some countries, public sector employees, fromnational to local levels, comprise the largest employee group. Second, government laws andregulations have created the need for legal, financial, and other experts to assist companies tonegotiate the increasingly complex legal environment.
INCREASING INTERNATIONAL TRADE IN SERVICES
The increase of trade in services among countries has also contributed to the growth in services.Globally, trade in services, including tourism and business services, has grown to about 20percent of all international trade. The opportunity for further major growth is considerableas more services become tradable (no longer needing to be produced and consumed in thesame location).
THE GROWTH IN OUTSOURCING SERVICE FUNCTIONS
The growth in outsourcing service functions from core to semi-peripheral countries (and morerecently from semi-peripheral to semi-peripheral countries) (see Box 11.5) by both large andsmall companies that have exploited advances in information and communications technologieshas also led to the growth in services.
11.3 SERVICES OUTSOURCING: BENEFITS AND DRAWBACKSFOR ALL?
Before discussing the outsourcing of tradable services, it is necessary to decipher the oftenconfusing terminology that is used in the academic and other literature. While it is helpful todifferentiate between the terms in order to understand the outsourcing process itself, a look
6063 GEOGRAPHY WORLD ECON_PT_246x189 mm 22/01/2014 15:10 Page 319
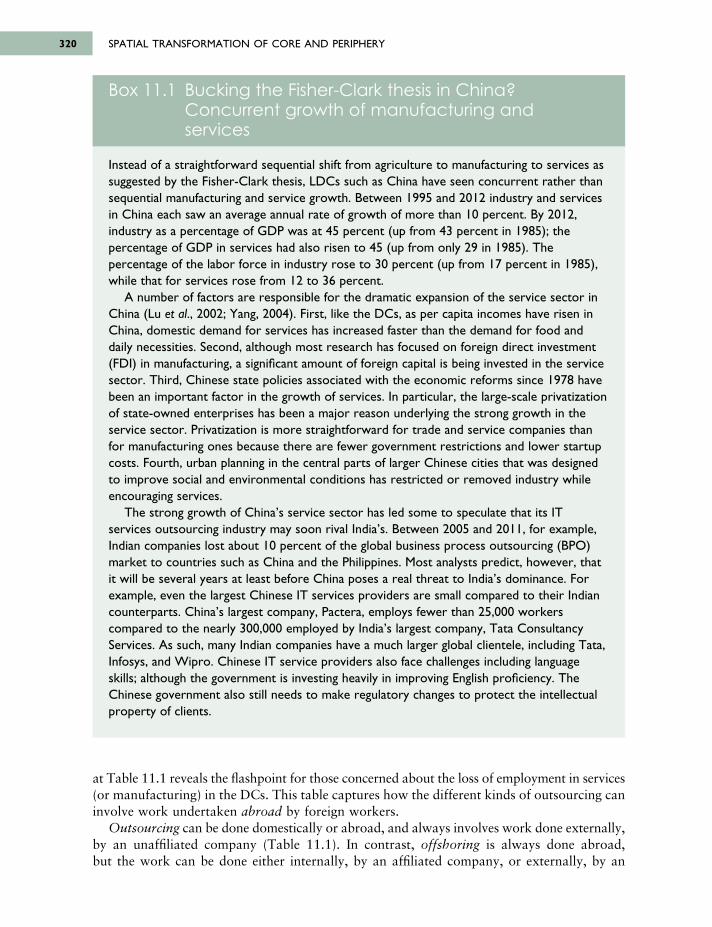
at Table 11.1 reveals the flashpoint for those concerned about the loss of employment in services(or manufacturing) in the DCs. This table captures how the different kinds of outsourcing caninvolve work undertaken abroad by foreign workers.
Outsourcing can be done domestically or abroad, and always involves work done externally,by an unaffiliated company (Table 11.1). In contrast, offshoring is always done abroad, but the work can be done either internally, by an affiliated company, or externally, by an
SPATIAL TRANSFORMATION OF CORE AND PERIPHERY320
Box 11.1 Bucking the Fisher-Clark thesis in China?Concurrent growth of manufacturing and services
Instead of a straightforward sequential shift from agriculture to manufacturing to services assuggested by the Fisher-Clark thesis, LDCs such as China have seen concurrent rather thansequential manufacturing and service growth. Between 1995 and 2012 industry and servicesin China each saw an average annual rate of growth of more than 10 percent. By 2012,industry as a percentage of GDP was at 45 percent (up from 43 percent in 1985); thepercentage of GDP in services had also risen to 45 (up from only 29 in 1985). Thepercentage of the labor force in industry rose to 30 percent (up from 17 percent in 1985),while that for services rose from 12 to 36 percent.
A number of factors are responsible for the dramatic expansion of the service sector inChina (Lu et al., 2002; Yang, 2004). First, like the DCs, as per capita incomes have risen inChina, domestic demand for services has increased faster than the demand for food anddaily necessities. Second, although most research has focused on foreign direct investment(FDI) in manufacturing, a significant amount of foreign capital is being invested in the servicesector. Third, Chinese state policies associated with the economic reforms since 1978 havebeen an important factor in the growth of services. In particular, the large-scale privatizationof state-owned enterprises has been a major reason underlying the strong growth in theservice sector. Privatization is more straightforward for trade and service companies thanfor manufacturing ones because there are fewer government restrictions and lower startupcosts. Fourth, urban planning in the central parts of larger Chinese cities that was designedto improve social and environmental conditions has restricted or removed industry whileencouraging services.
The strong growth of China’s service sector has led some to speculate that its ITservices outsourcing industry may soon rival India’s. Between 2005 and 2011, for example,Indian companies lost about 10 percent of the global business process outsourcing (BPO)market to countries such as China and the Philippines. Most analysts predict, however, thatit will be several years at least before China poses a real threat to India’s dominance. Forexample, even the largest Chinese IT services providers are small compared to their Indiancounterparts. China’s largest company, Pactera, employs fewer than 25,000 workerscompared to the nearly 300,000 employed by India’s largest company, Tata ConsultancyServices. As such, many Indian companies have a much larger global clientele, including Tata,Infosys, and Wipro. Chinese IT service providers also face challenges including languageskills; although the government is investing heavily in improving English proficiency. TheChinese government also still needs to make regulatory changes to protect the intellectualproperty of clients.
6063 GEOGRAPHY WORLD ECON_PT_246x189 mm 22/01/2014 15:10 Page 320
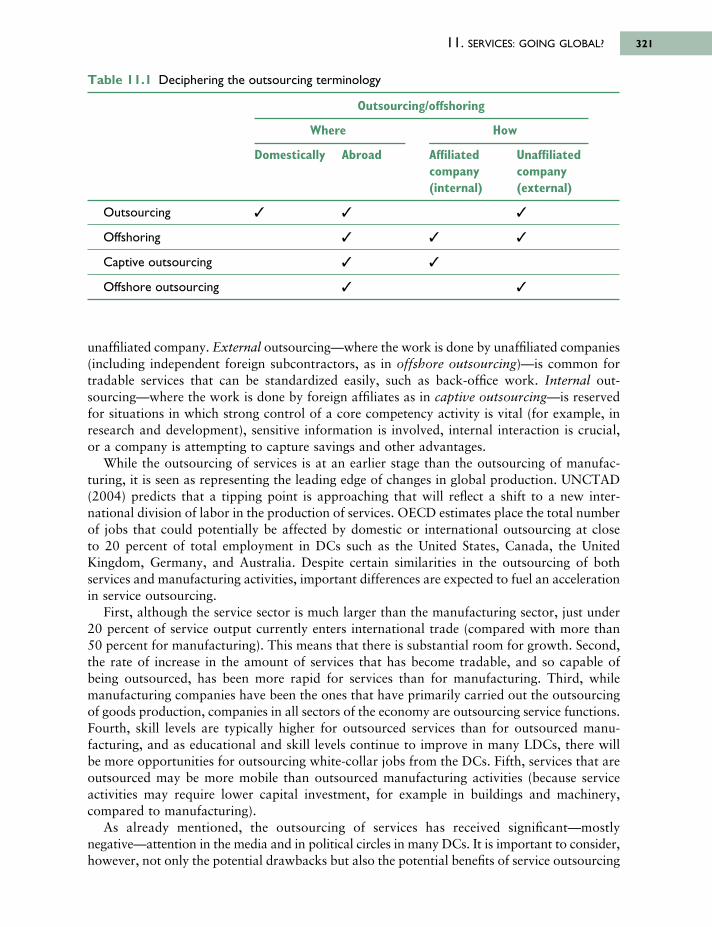
unaffiliated company. External outsourcing—where the work is done by unaffiliated companies(including independent foreign subcontractors, as in offshore outsourcing)—is common fortradable services that can be standardized easily, such as back-office work. Internal out-sourcing—where the work is done by foreign affiliates as in captive outsourcing—is reservedfor situations in which strong control of a core competency activity is vital (for example, inresearch and development), sensitive information is involved, internal interaction is crucial,or a company is attempting to capture savings and other advantages.
While the outsourcing of services is at an earlier stage than the outsourcing of manufac-turing, it is seen as representing the leading edge of changes in global production. UNCTAD(2004) predicts that a tipping point is approaching that will reflect a shift to a new inter-national division of labor in the production of services. OECD estimates place the total numberof jobs that could potentially be affected by domestic or international outsourcing at close to 20 percent of total employment in DCs such as the United States, Canada, the UnitedKingdom, Germany, and Australia. Despite certain similarities in the outsourcing of bothservices and manufacturing activities, important differences are expected to fuel an accelerationin service outsourcing.
First, although the service sector is much larger than the manufacturing sector, just under20 percent of service output currently enters international trade (compared with more than50 percent for manufacturing). This means that there is substantial room for growth. Second,the rate of increase in the amount of services that has become tradable, and so capable ofbeing outsourced, has been more rapid for services than for manufacturing. Third, whilemanufacturing companies have been the ones that have primarily carried out the outsourcingof goods production, companies in all sectors of the economy are outsourcing service functions.Fourth, skill levels are typically higher for outsourced services than for outsourced manu -facturing, and as educational and skill levels continue to improve in many LDCs, there willbe more opportunities for outsourcing white-collar jobs from the DCs. Fifth, services that areoutsourced may be more mobile than outsourced manufacturing activities (because serviceactivities may require lower capital investment, for example in buildings and machinery,compared to manufacturing).
As already mentioned, the outsourcing of services has received significant—mostlynegative—attention in the media and in political circles in many DCs. It is important to consider,however, not only the potential drawbacks but also the potential benefits of service outsourcing
11. SERVICES: GOING GLOBAL? 321
Table 11.1 Deciphering the outsourcing terminology
Outsourcing/offshoring
Where How
Domestically Abroad Affiliated Unaffiliatedcompany company(internal) (external)
Outsourcing
Offshoring
Captive outsourcing
Offshore outsourcing
6063 GEOGRAPHY WORLD ECON_PT_246x189 mm 22/01/2014 15:10 Page 321
for both the DCs and the LDCs. The likely drawbacks for the DCs, including the loss of servicesector jobs in particular, have received much more attention than the possible benefits. Yet anumber of scholars have pointed out that service outsourcing may allow companies in theDCs to enhance their competitiveness by reducing expenditures and improving quality anddelivery—with positive benefits for the companies and their national economies.
In a 2004 article about service outsourcing from DCs such as the United States, UdayKarmarker asked whether companies in the service sector in the DCs can survive theoutsourcing of service jobs. Karmarker acknowledged that there would be painful job lossesfor service workers in the DCs, but that the focus should not be on the loss of outsourcedservice jobs but on the benefits to the global competitiveness of companies in the service sectorin the DCs. A 2004 study by the Information Technology Association of America (ITAA) hasargued that outsourcing service jobs may ultimately create jobs, boost productivity, and lowerinflation in the United States. The labor cost savings from outsourcing may allow companiesto sell goods more cheaply or at a greater profit, allowing more capital for purchasing equip -ment, building facilities, and undertaking research and development. In addition, serviceoutsourcing may allow the DCs to restructure toward more productive and higher valueactivities that create higher wage jobs. The underlying argument is that the outsourcing ofcertain service activities and jobs should not be met with cries for protectionist policies in theDCs, but embraced, because outsourcing may contribute to the competitiveness of service sectorcompanies in the DCs by creating a new international division of labor in service production.
Although anxiety about the outsourcing from the DCs is high, the majority of service out-sourcing is still currently taking place domestically (UNCTAD, 2004). Most outsourcing isdone domestically, with much of the remainder going from the DCs to other DCs. Less than10 percent of all business process outsourcing (BPO)—such as insurance claims processing,billing services, credit card services, telemarketing, and research and development—is doneinternationally. The top ten destinations for international services outsourcing are Bangalore,Mumbai, Delhi, Chennai, Hyderabad, and Pune in India, Manila and Cebu City in thePhilippines, Dublin in Ireland, and Kraków in Poland.
The benefits of service outsourcing for LDCs such as India include the creation of higherskill jobs involving better pay, training, and transferable skills, and associated infrastructureinvestment that can contribute to further local job growth. The potential drawbacks for someLDCs include the possible relocation of outsourced service activities to other more competitiveLDC locations unless worker skills and local infrastructure are continuously upgraded. Thereare also the perceived negative impacts on culture and tradition of such a rapid increase inemployment opportunities for more educated young people, deepening any already entrenchedsocial divisions. Generous salaries by LDC standards are creating a class of western-styleconsumers. In countries such as India, young, urban women with well-paid back-office jobsare now considering the possibility of a career, rather than the traditional route to financialsecurity of early marriage.
11.4 LIMITS TO SERVICE EXPORT GROWTH IN THE SEMI-PERIPHERY AND PERIPHERY?
Not all services can be outsourced. Services with a low potential for being outsourced typicallyinclude the following features: a strong face-to-face servicing requirement; low informationcontent; a work process not depending on telecommunications and the Internet; low wagedifferentials relative to similar occupations in the DCs; high setup barriers; and significant
SPATIAL TRANSFORMATION OF CORE AND PERIPHERY322
6063 GEOGRAPHY WORLD ECON_PT_246x189 mm 22/01/2014 15:10 Page 322
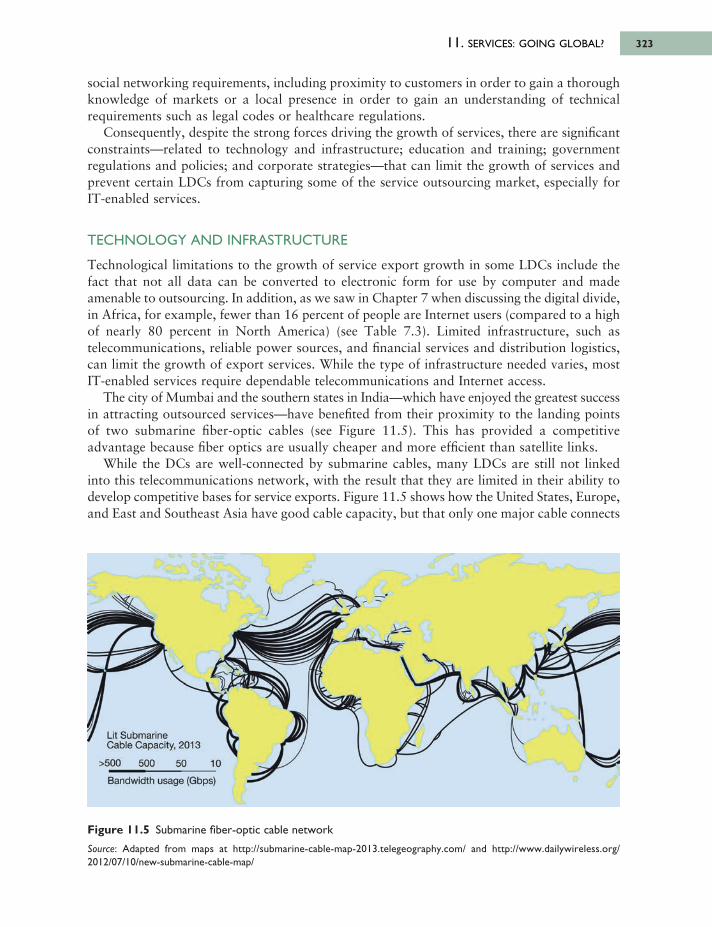
11. SERVICES: GOING GLOBAL? 323
social networking requirements, including proximity to customers in order to gain a thoroughknowledge of markets or a local presence in order to gain an understanding of technicalrequirements such as legal codes or healthcare regulations.
Consequently, despite the strong forces driving the growth of services, there are significantconstraints—related to technology and infrastructure; education and training; governmentregulations and policies; and corporate strategies—that can limit the growth of services andprevent certain LDCs from capturing some of the service outsourcing market, especially forIT-enabled services.
TECHNOLOGY AND INFRASTRUCTURE
Technological limitations to the growth of service export growth in some LDCs include thefact that not all data can be converted to electronic form for use by computer and madeamenable to outsourcing. In addition, as we saw in Chapter 7 when discussing the digital divide,in Africa, for example, fewer than 16 percent of people are Internet users (compared to a highof nearly 80 percent in North America) (see Table 7.3). Limited infrastructure, such astelecommunications, reliable power sources, and financial services and distribution logistics,can limit the growth of export services. While the type of infrastructure needed varies, mostIT-enabled services require dependable telecommunications and Internet access.
The city of Mumbai and the southern states in India—which have enjoyed the greatest successin attracting outsourced services—have benefited from their proximity to the landing pointsof two submarine fiber-optic cables (see Figure 11.5). This has provided a competitiveadvantage because fiber optics are usually cheaper and more efficient than satellite links.
While the DCs are well-connected by submarine cables, many LDCs are still not linkedinto this telecommunications network, with the result that they are limited in their ability todevelop competitive bases for service exports. Figure 11.5 shows how the United States, Europe,and East and Southeast Asia have good cable capacity, but that only one major cable connects
Figure 11.5 Submarine fiber-optic cable network
Source: Adapted from maps at http://submarine-cable-map-2013.telegeography.com/ and http://www.dailywireless.org/2012/07/10/new-submarine-cable-map/
6063 GEOGRAPHY WORLD ECON_PT_246x189 mm 22/01/2014 15:10 Page 323
Lit Submarine Cable Capacity, 2013
>500 500 50 10Bandwidth usage (Gbps)
parts of Africa to the rest of the world—the SAT-3 cable. In fact, in Sub-Saharan Africa, onlyAngola, Benin, Cameroon, Côte d’Ivoire, Gabon, Ghana, Nigeria, Senegal, and South Africaare linked directly to this cable.
EDUCATION AND TRAINING
Lack of education and training is a limiting factor in knowledge-intense services. While thekinds of skill needed differ depending on the kinds of service, most outsourced IT-enabledservices involve information processing of various kinds. The strong software exportperformance of India partly reflects government education and training policies that haveproduced a large pool of technically trained English-speaking workers. Most softwarecompanies are in Mumbai and Bangalore, where the software industry initially developed.With other growing urban centers, specifically New Delhi and its surroundings, Andhra Pradeshand Tamil Nadu, these five areas contain about 50 percent of India’s diploma-grantingtechnical institutions.
Special skills are also needed for more routine services. Call centers need workers not onlywith good language abilities but also solid customer support skills, telesales abilities, data entry,and processing skills.
But sustained strong growth in service outsourcing to India, the Philippines, and South Africadepends on the continued availability and low cost of the necessary worker skills. Despitesuccess so far, there is concern that LDCs such as India may not be able to keep pace withthe demand for qualified workers; shortages of trained workers can force wages up and makea country less attractive as an outsourcing destination.
GOVERNMENT REGULATION AND POLICIES
The regulatory and legal framework in some less developed countries can place limits on thegrowth of export services. There is a need for a competitive regulatory environment thatencourages competition among service providers, which includes a deregulated telecommuni -cations environment facilitating dependable and competitively priced service. Governments inLDCs such as China still need to address the concerns of many in the United States and theEuropean Union in particular about poor data security and intellectual property protection.Developed countries such as Ireland and Canada, as well as higher cost LDCs such asSingapore, emphasize their strong regulatory frameworks compared to those in China andeven India when competing for service outsourcing work.
The WTO’s General Agreement on Trade in Services (GATS) covers all internationally tradedservices. The goals of service liberalization in the GATS context are greater competition andnondiscrimination against foreign services and service providers. The liberalization of servicesinvolves the reduction or elimination of barriers that affect services certainly, but also theremoval of legally established monopolies or oligopolistic market structures, discriminatorytaxation, and limits on foreign investment in services. Further negotiations on the liberalizationof services, however, proceed slowly.
CORPORATE STRATEGIES
Corporate decision making can result in limited opportunities for service export growth insome LDCs. Companies differ on their perception of risk and assessment of the benefits ofinternationally outsourcing services. In some situations, for example, the information that is
SPATIAL TRANSFORMATION OF CORE AND PERIPHERY324
6063 GEOGRAPHY WORLD ECON_PT_246x189 mm 22/01/2014 15:10 Page 324
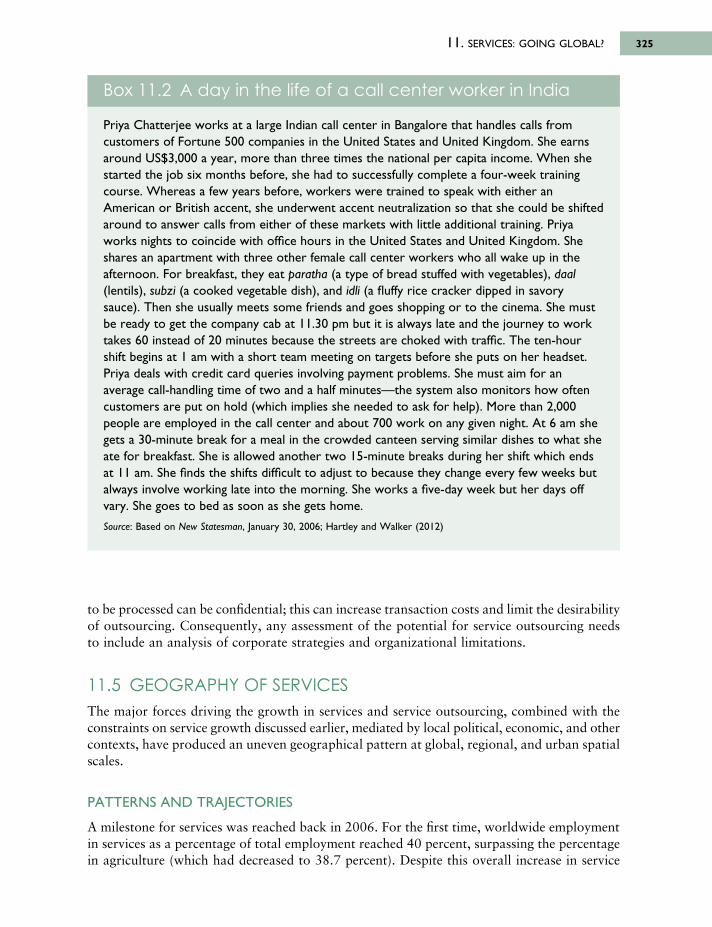
11. SERVICES: GOING GLOBAL? 325
to be processed can be confidential; this can increase transaction costs and limit the desirabilityof outsourcing. Consequently, any assessment of the potential for service outsourcing needsto include an analysis of corporate strategies and organizational limitations.
11.5 GEOGRAPHY OF SERVICESThe major forces driving the growth in services and service outsourcing, combined with theconstraints on service growth discussed earlier, mediated by local political, economic, and othercontexts, have produced an uneven geographical pattern at global, regional, and urban spatialscales.
PATTERNS AND TRAJECTORIES
A milestone for services was reached back in 2006. For the first time, worldwide employmentin services as a percentage of total employment reached 40 percent, surpassing the percentagein agriculture (which had decreased to 38.7 percent). Despite this overall increase in service
Box 11.2 A day in the life of a call center worker in India
Priya Chatterjee works at a large Indian call center in Bangalore that handles calls fromcustomers of Fortune 500 companies in the United States and United Kingdom. She earnsaround US$3,000 a year, more than three times the national per capita income. When shestarted the job six months before, she had to successfully complete a four-week trainingcourse. Whereas a few years before, workers were trained to speak with either anAmerican or British accent, she underwent accent neutralization so that she could be shiftedaround to answer calls from either of these markets with little additional training. Priyaworks nights to coincide with office hours in the United States and United Kingdom. Sheshares an apartment with three other female call center workers who all wake up in theafternoon. For breakfast, they eat paratha (a type of bread stuffed with vegetables), daal(lentils), subzi (a cooked vegetable dish), and idli (a fluffy rice cracker dipped in savorysauce). Then she usually meets some friends and goes shopping or to the cinema. She mustbe ready to get the company cab at 11.30 pm but it is always late and the journey to worktakes 60 instead of 20 minutes because the streets are choked with traffic. The ten-hourshift begins at 1 am with a short team meeting on targets before she puts on her headset.Priya deals with credit card queries involving payment problems. She must aim for anaverage call-handling time of two and a half minutes—the system also monitors how oftencustomers are put on hold (which implies she needed to ask for help). More than 2,000people are employed in the call center and about 700 work on any given night. At 6 am shegets a 30-minute break for a meal in the crowded canteen serving similar dishes to what sheate for breakfast. She is allowed another two 15-minute breaks during her shift which endsat 11 am. She finds the shifts difficult to adjust to because they change every few weeks butalways involve working late into the morning. She works a five-day week but her days offvary. She goes to bed as soon as she gets home.
Source: Based on New Statesman, January 30, 2006; Hartley and Walker (2012)
6063 GEOGRAPHY WORLD ECON_PT_246x189 mm 22/01/2014 15:10 Page 325
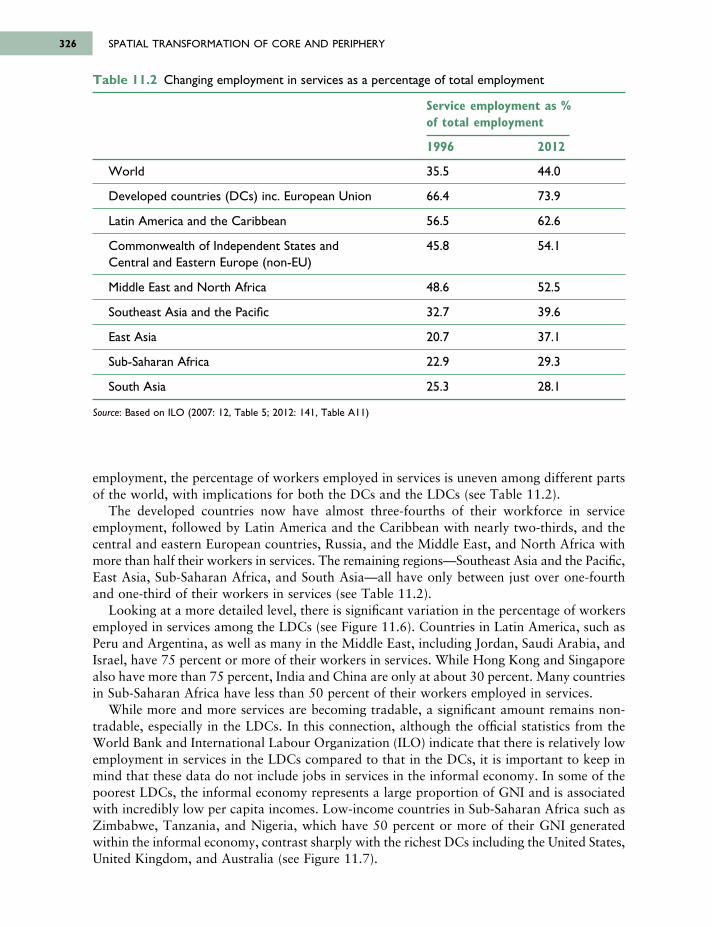
employment, the percentage of workers employed in services is uneven among different partsof the world, with implications for both the DCs and the LDCs (see Table 11.2).
The developed countries now have almost three-fourths of their workforce in serviceemploy ment, followed by Latin America and the Caribbean with nearly two-thirds, and thecentral and eastern European countries, Russia, and the Middle East, and North Africa withmore than half their workers in services. The remaining regions—Southeast Asia and the Pacific,East Asia, Sub-Saharan Africa, and South Asia—all have only between just over one-fourthand one-third of their workers in services (see Table 11.2).
Looking at a more detailed level, there is significant variation in the percentage of workersemployed in services among the LDCs (see Figure 11.6). Countries in Latin America, such asPeru and Argentina, as well as many in the Middle East, including Jordan, Saudi Arabia, andIsrael, have 75 percent or more of their workers in services. While Hong Kong and Singaporealso have more than 75 percent, India and China are only at about 30 percent. Many countriesin Sub-Saharan Africa have less than 50 percent of their workers employed in services.
While more and more services are becoming tradable, a significant amount remains non-tradable, especially in the LDCs. In this connection, although the official statistics from theWorld Bank and International Labour Organization (ILO) indicate that there is relatively lowemployment in services in the LDCs compared to that in the DCs, it is important to keep inmind that these data do not include jobs in services in the informal economy. In some of thepoorest LDCs, the informal economy represents a large proportion of GNI and is associatedwith incredibly low per capita incomes. Low-income countries in Sub-Saharan Africa such asZimbabwe, Tanzania, and Nigeria, which have 50 percent or more of their GNI generatedwithin the informal economy, contrast sharply with the richest DCs including the United States,United Kingdom, and Australia (see Figure 11.7).
SPATIAL TRANSFORMATION OF CORE AND PERIPHERY326
Table 11.2 Changing employment in services as a percentage of total employment
Service employment as %of total employment
1996 2012
World 35.5 44.0
Developed countries (DCs) inc. European Union 66.4 73.9
Latin America and the Caribbean 56.5 62.6
Commonwealth of Independent States and 45.8 54.1Central and Eastern Europe (non-EU)
Middle East and North Africa 48.6 52.5
Southeast Asia and the Pacific 32.7 39.6
East Asia 20.7 37.1
Sub-Saharan Africa 22.9 29.3
South Asia 25.3 28.1
Source: Based on ILO (2007: 12, Table 5; 2012: 141, Table A11)
6063 GEOGRAPHY WORLD ECON_PT_246x189 mm 22/01/2014 15:10 Page 326
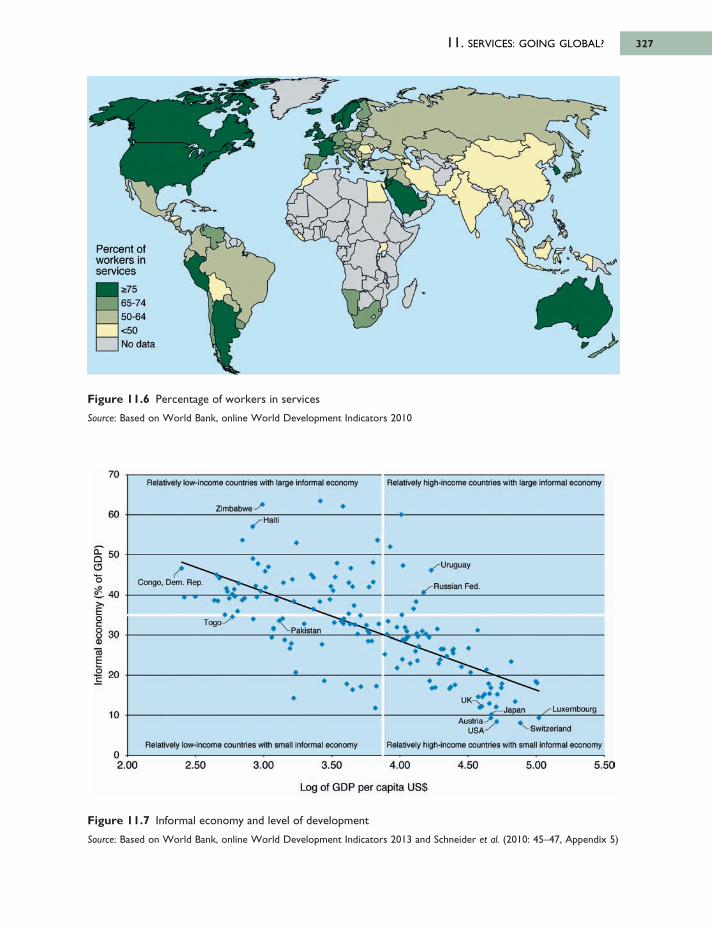
11. SERVICES: GOING GLOBAL? 327
Figure 11.6 Percentage of workers in services
Source: Based on World Bank, online World Development Indicators 2010
Figure 11.7 Informal economy and level of development
Source: Based on World Bank, online World Development Indicators 2013 and Schneider et al. (2010: 45–47, Appendix 5)
6063 GEOGRAPHY WORLD ECON_PT_246x189 mm 22/01/2014 15:10 Page 327
Percent of workers in services
г7 565-7450-64
<50No data
Relatively low-income countries with large informal economy Relatively high-income countries with large informal economy
Zimbabwe-Haiti
^Uruguay
Russian Fed.Congo. Dem. Rep.
Togo-' ψ-Pakistan
UK-i
Austria - USA-
-Japar - Luxembourg
Switzerland
Relatively high-income countries with small informal economyRelatively low-income countries with small informal economy
2.00 2.50 3.00 3.50 4.00 4.50 5.00 5.50
Log of GDP per capita US$
70
6C
50
40
30
20
10
0
Q.Cioo£>.Eoco<-><1)ШEoΈ
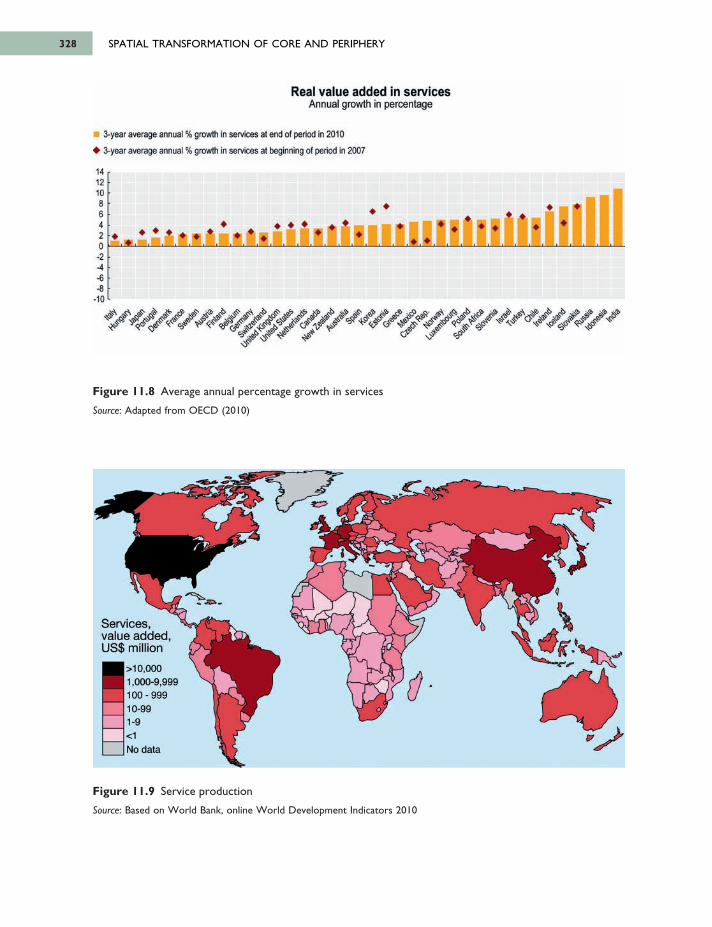
SPATIAL TRANSFORMATION OF CORE AND PERIPHERY328
Figure 11.8 Average annual percentage growth in services
Source: Adapted from OECD (2010)
Figure 11.9 Service production
Source: Based on World Bank, online World Development Indicators 2010
6063 GEOGRAPHY WORLD ECON_PT_246x189 mm 22/01/2014 15:10 Page 328
Real value added in servicesAnnual growth in percentage
З-year average annual % growth in services at end of penod in 2010
З-year average annual % growth in services at beginning of period in 2007
14121C864204A -Є -8
• 1Г
Services, value added, US$ million
> 10,000 1,000-9,999 100 - 999 10-99 1-9 <1
No data
grow
th gr
owth
grow
th
grow
th gr
owth
grow
th
grow
th
grow
th
grow
th
grow
th
grow
th gr
owth
grow
th grow
th
grow
th grow
th
grow
th grow
th
grow
th
grow
th grow
th
grow
th
grow
th
grow
th gr
owth
grow
th
grow
th
grow
th gr
owth gr
owth
grow
th grow
th gr
owth
grow
th grow
th
grow
th gr
owth
grow
th gr
owth
grow
th
grow
th
grow
th
grow
th
grow
th
grow
th gr
owth
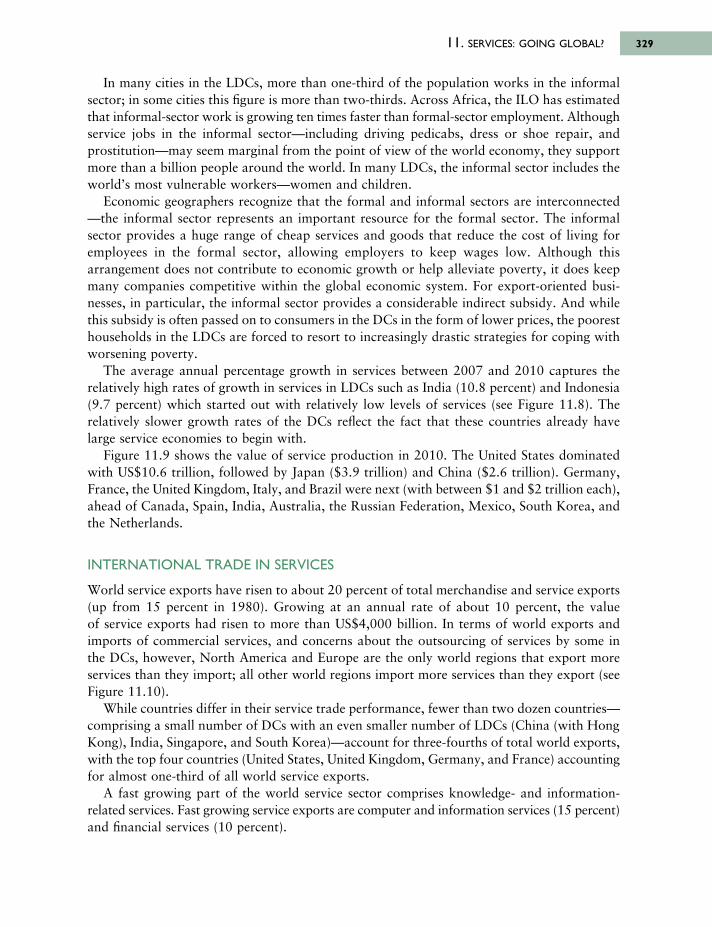
In many cities in the LDCs, more than one-third of the population works in the informalsector; in some cities this figure is more than two-thirds. Across Africa, the ILO has estimatedthat informal-sector work is growing ten times faster than formal-sector employment. Althoughservice jobs in the informal sector—including driving pedicabs, dress or shoe repair, andprostitution—may seem marginal from the point of view of the world economy, they supportmore than a billion people around the world. In many LDCs, the informal sector includes theworld’s most vulnerable workers—women and children.
Economic geographers recognize that the formal and informal sectors are interconnected—the informal sector represents an important resource for the formal sector. The informalsector provides a huge range of cheap services and goods that reduce the cost of living foremployees in the formal sector, allowing employers to keep wages low. Although thisarrangement does not contribute to economic growth or help alleviate poverty, it does keepmany companies competitive within the global economic system. For export-oriented busi -nesses, in particular, the informal sector provides a considerable indirect subsidy. And whilethis subsidy is often passed on to consumers in the DCs in the form of lower prices, the pooresthouseholds in the LDCs are forced to resort to increasingly drastic strategies for coping withworsening poverty.
The average annual percentage growth in services between 2007 and 2010 captures therelatively high rates of growth in services in LDCs such as India (10.8 percent) and Indonesia(9.7 percent) which started out with relatively low levels of services (see Figure 11.8). Therelatively slower growth rates of the DCs reflect the fact that these countries already havelarge service economies to begin with.
Figure 11.9 shows the value of service production in 2010. The United States dominatedwith US$10.6 trillion, followed by Japan ($3.9 trillion) and China ($2.6 trillion). Germany,France, the United Kingdom, Italy, and Brazil were next (with between $1 and $2 trillion each),ahead of Canada, Spain, India, Australia, the Russian Federation, Mexico, South Korea, andthe Netherlands.
INTERNATIONAL TRADE IN SERVICES
World service exports have risen to about 20 percent of total merchandise and service exports(up from 15 percent in 1980). Growing at an annual rate of about 10 percent, the value of service exports had risen to more than US$4,000 billion. In terms of world exports andimports of commercial services, and concerns about the outsourcing of services by some inthe DCs, however, North America and Europe are the only world regions that export moreservices than they import; all other world regions import more services than they export (seeFigure 11.10).
While countries differ in their service trade performance, fewer than two dozen countries—comprising a small number of DCs with an even smaller number of LDCs (China (with HongKong), India, Singapore, and South Korea)—account for three-fourths of total world exports,with the top four countries (United States, United Kingdom, Germany, and France) accountingfor almost one-third of all world service exports.
A fast growing part of the world service sector comprises knowledge- and information-related services. Fast growing service exports are computer and information services (15 percent)and financial services (10 percent).
11. SERVICES: GOING GLOBAL? 329
6063 GEOGRAPHY WORLD ECON_PT_246x189 mm 22/01/2014 15:10 Page 329
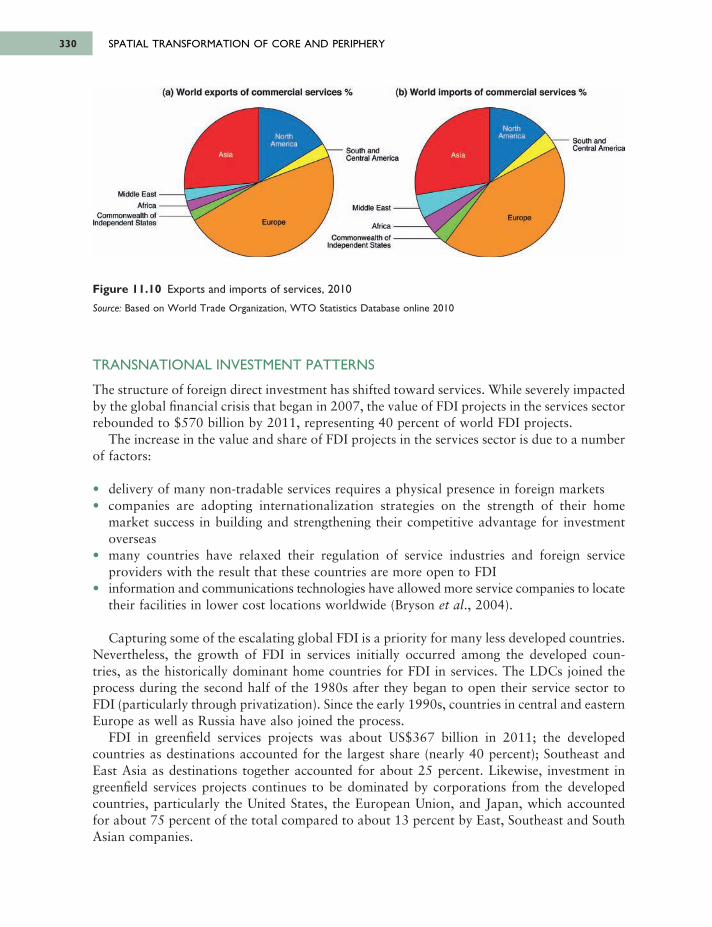
SPATIAL TRANSFORMATION OF CORE AND PERIPHERY330
TRANSNATIONAL INVESTMENT PATTERNS
The structure of foreign direct investment has shifted toward services. While severely impactedby the global financial crisis that began in 2007, the value of FDI projects in the services sectorrebounded to $570 billion by 2011, representing 40 percent of world FDI projects.
The increase in the value and share of FDI projects in the services sector is due to a numberof factors:
• delivery of many non-tradable services requires a physical presence in foreign markets• companies are adopting internationalization strategies on the strength of their home
market success in building and strengthening their competitive advantage for investmentoverseas
• many countries have relaxed their regulation of service industries and foreign serviceproviders with the result that these countries are more open to FDI
• information and communications technologies have allowed more service companies to locatetheir facilities in lower cost locations worldwide (Bryson et al., 2004).
Capturing some of the escalating global FDI is a priority for many less developed countries.Nevertheless, the growth of FDI in services initially occurred among the developed coun-tries, as the historically dominant home countries for FDI in services. The LDCs joined theprocess during the second half of the 1980s after they began to open their service sector toFDI (particularly through privatization). Since the early 1990s, countries in central and easternEurope as well as Russia have also joined the process.
FDI in greenfield services projects was about US$367 billion in 2011; the developedcountries as destinations accounted for the largest share (nearly 40 percent); Southeast andEast Asia as destinations together accounted for about 25 percent. Likewise, investment ingreenfield services projects continues to be dominated by corporations from the developedcountries, particularly the United States, the European Union, and Japan, which accountedfor about 75 percent of the total compared to about 13 percent by East, Southeast and SouthAsian companies.
Figure 11.10 Exports and imports of services, 2010
Source: Based on World Trade Organization, WTO Statistics Database online 2010
6063 GEOGRAPHY WORLD ECON_PT_246x189 mm 22/01/2014 15:10 Page 330
(a) W orld e xpo rts o f co m m erc ia l se rv ices % (b> W orld im o o rts o f com m erc ia l se rv ices %
South and Central America
NorthAmerica
Asia
Europe
South and Central America
Middle East -
AfricaCommonwealth of
Independent States
NorthAmerica
Asia
Europe
Middle East - Africa -
Commonwealth of - Independent States
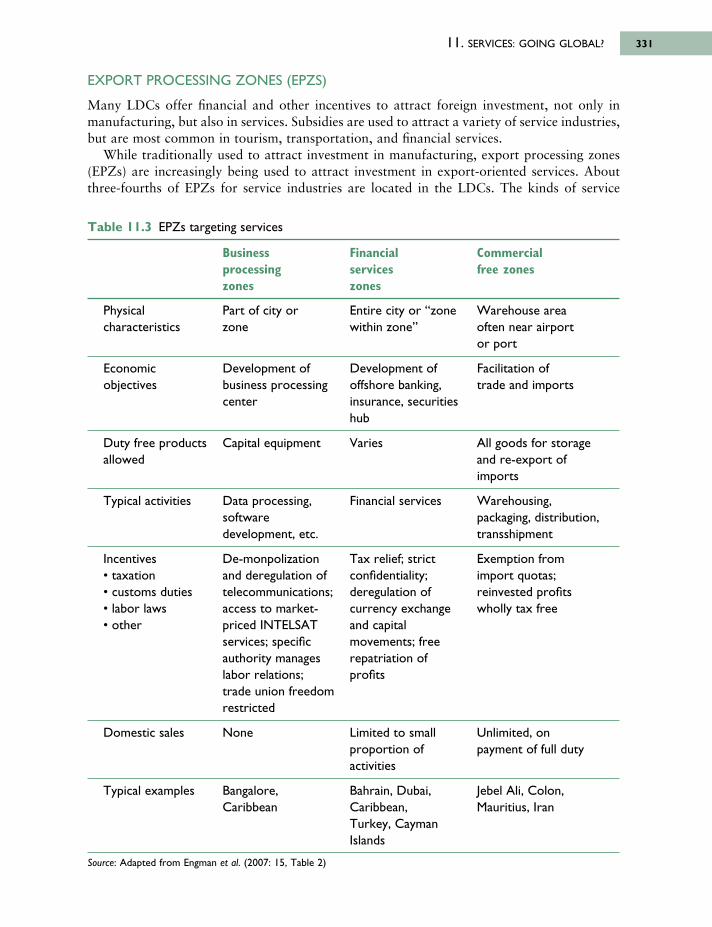
EXPORT PROCESSING ZONES (EPZS)
Many LDCs offer financial and other incentives to attract foreign investment, not only inmanufacturing, but also in services. Subsidies are used to attract a variety of service industries,but are most common in tourism, transportation, and financial services.
While traditionally used to attract investment in manufacturing, export processing zones(EPZs) are increasingly being used to attract investment in export-oriented services. Aboutthree-fourths of EPZs for service industries are located in the LDCs. The kinds of service
11. SERVICES: GOING GLOBAL? 331
Table 11.3 EPZs targeting services
Business Financial Commercialprocessing services free zoneszones zones
Physical Part of city or Entire city or “zone Warehouse area characteristics zone within zone” often near airport
or port
Economic Development of Development of Facilitation of objectives business processing offshore banking, trade and imports
center insurance, securitieshub
Duty free products Capital equipment Varies All goods for storageallowed and re-export of
imports
Typical activities Data processing, Financial services Warehousing, software packaging, distribution, development, etc. transshipment
Incentives De-monpolization Tax relief; strict Exemption from • taxation and deregulation of confidentiality; import quotas; • customs duties telecommunications; deregulation of reinvested profits• labor laws access to market- currency exchange wholly tax free• other priced INTELSAT and capital
services; specific movements; freeauthority manages repatriation oflabor relations; profitstrade union freedomrestricted
Domestic sales None Limited to small Unlimited, on proportion of payment of full dutyactivities
Typical examples Bangalore, Bahrain, Dubai, Jebel Ali, Colon,Caribbean Caribbean, Mauritius, Iran
Turkey, Cayman Islands
Source: Adapted from Engman et al. (2007: 15, Table 2)
6063 GEOGRAPHY WORLD ECON_PT_246x189 mm 22/01/2014 15:10 Page 331
attracted to these EPZs have grown rapidly, from commercial services and simple data entryto call centers, medical diagnoses, architectural, business, engineering, and financial services(see Table 11.3).
These EPZs offer a strong technology support infrastructure including modern communi -cation technologies, reliable power supplies, and a highly skilled workforce. Incentives include100 percent exemption from import duties and general sales taxes, full repatriation of earnings,and preferential customs clearance. The emphasis on the skills and language abilities of theworkers for IT-enabled service jobs contrasts with the low- or semi-skilled workers advertisedby the traditional manufacturing EPZs.
In India, many of the outsourced services have been attracted to dedicated technology parksfor IT services that were established by individual states. India’s first software technology parkswere set up in 1990 in Bangalore, Bhubaneshwar, and Pune. There are now dozens of theseparks, accounting for up to 75 percent of India’s software exports.
11.6 VARIETY IN THE INTERNATIONALIZATION OF SERVICES
As we have seen, there is a wide variety of marketed services ranging from producer services(FIRE and business services) to transportation and communications, wholesale and retail trade,to entertainment, hotels and motels (part of tourism). In concluding this chapter, we brieflyexamine the internationalization of some leading services, namely, retailing, tourism, andfinancial and business services.
THE INTERNATIONALIZATION OF RETAILING
On the supply side, since the 1970s, the sales of the world’s largest international retailers havegrown considerably. In 1976 the total sales of the then largest retail company in the world(Sears Roebuck) were less than US$15 billion (equivalent to more than $60 billion in 2013dollars). By 2013, Wal-Mart, the world’s largest retailer today, had sales of almost $370 billion.
The largest retail companies have been more conservative than many other tradable serviceswhen entering foreign markets (Bryson et al., 2004). The stores and receipts of many of thelargest retailers are largely domestic (including, in the United States, Lowe’s, Kroger, Walgreen,and Target). Based on the location of their stores, only a few of the world’s largest retailers—Wal-Mart (USA), Carrefour, PPR and Auchun (France), Metro, Aldi, Tengelmann, Rewe, Lidl& Schwarz (Germany), Ahold (Netherlands), Delhaize (Belgium), IKEA (Sweden), and Tesco(UK)—can be considered truly global operators. Of these, only IKEA, Arhold, and Delhaize,have more than 75 percent of their sales from foreign markets.
With the exception of Wal-Mart, most of the largest international retailers (with annualinternational sales of more than US$1 billion and operations in ten or more countries) arefrom Europe. In fact, Wal-Mart remained a domestic U.S. company until as late as 1991 whenit opened a Sam’s Club near Mexico City (see Box 11.3). It currently derives almost one-thirdof its sales from foreign countries.
Williams (1992) identified five major reasons why retailers typically decide to internation -alize their operations. First, growth-oriented goals in a highly competitive domestic market can lead companies to consider new foreign markets in order to maintain sales and profits.Second, there may be limited domestic market growth opportunities because of marketmaturity, saturation, exhausted, or unsuitable diversification possibilities and excessivegovernment regulations. Third, there may be opportunities to implement internationally
SPATIAL TRANSFORMATION OF CORE AND PERIPHERY332
6063 GEOGRAPHY WORLD ECON_PT_246x189 mm 22/01/2014 15:10 Page 332
appealing and innovative retail concepts in some LDC markets. Fourth, more passive, reactive,or subjective opportunities for enhanced sales and profits may arise from offers of joint venturesfrom foreign partners or through acquisition of foreign retail competitors. Fifth, seniormanagement may be driven to apply their retail know-how and techniques to foreign markets.In addition, technological breakthroughs, trade liberalization, and the opening-up of marketsto FDI are vitally important policy changes that allow companies to expand internationally.
The international expansion of the largest retailers has been uneven. With the importantexception of Africa, where smaller southern African retailers such as Shoprite and Pick’n’Paydominate, the largest global retailers are extending their presence primarily into Latin America,East Asia, and South Asia. Within these regions, these large retailers target the most attractivemarkets with the largest consumer bases. In Latin America, for example, much of this foreigninvestment is going to Brazil, Chile, Uruguay, and Peru; in East and Southeast Asia, theinvestment is going to Malaysia, Sri Lanka, Indonesia, and, increasingly, China; and in SouthAsia, the investment is going to India.
At the same time that these large retailers have been expanding into foreign markets, theyhave been internationalizing their supply networks. Gereffi’s (2001) notion of a buyer-drivencommodity chain is useful in conceptualizing this arrangement (see Figure 1.4). A commoditychain refers to the entire range of activities involved in the design, production and marketingof a product. Buyer-driven commodity chains cover those industries in which large retailers,marketers, and branded manufacturers play pivotal roles in establishing decentralized produc -tion networks in a number of usually LDC exporters. This pattern of trade-led industrializationhas become common in labor-intensive, consumer goods industries such as garments, footwear,toys, housewares, consumer electronics, and a variety of handicrafts. Production is usuallyundertaken by tiered networks of contractors in the LDCs who make finished goods for foreignbuyers. The product specifications are supplied by the large retailers or marketers who orderthe goods:
One of the main characteristics of the firms that fit the buyer-driven model, including retailers likeWal-Mart, Sears Roebuck, and J.C. Penney, athletic footwear companies like Nike and Reebok,and fashion-oriented apparel companies like Liz Claiborne and The Limited, is that these companiesdesign and/or market—but do not make—the branded products they order. They are part of anew breed of “manufacturers without factories” that separate the physical production of goodsfrom the design and marketing stages of the production process. Profits in buyer-driven chainsderive not from the scale, volume, and technological advances as in producer-driven chains, butrather from unique combinations of high-value research, design, sales, marketing, and financialservices that allow the retailers, designers, and marketers to act as strategic brokers in linkingoverseas factories and traders with evolving product niches in their main consumer markets.
(Gereffi, 1999: 1)
In general, buyer-driven commodity chains are designed to keep costs down and involveforcing consolidation at all stages of the commodity chain in the less developed countries.Some of the negative outcomes for suppliers and workers in the LDCs are captured by thisOxfam (2004: 6) quote:
[I]nternational mergers and acquisitions and aggressive pricing strategies have concentrated marketpower in the hands of a few major retailers, now building international empires. These companieshave tremendous power in their negotiations with producers and they use that power to push thecosts and risks of business down the supply chain. Their business model, focused on maximizingreturns for shareholders, demands increasing flexibility through “just-in-time” delivery, but tightercontrol over inputs and standards, and ever-lower prices.
11. SERVICES: GOING GLOBAL? 333
6063 GEOGRAPHY WORLD ECON_PT_246x189 mm 22/01/2014 15:10 Page 333
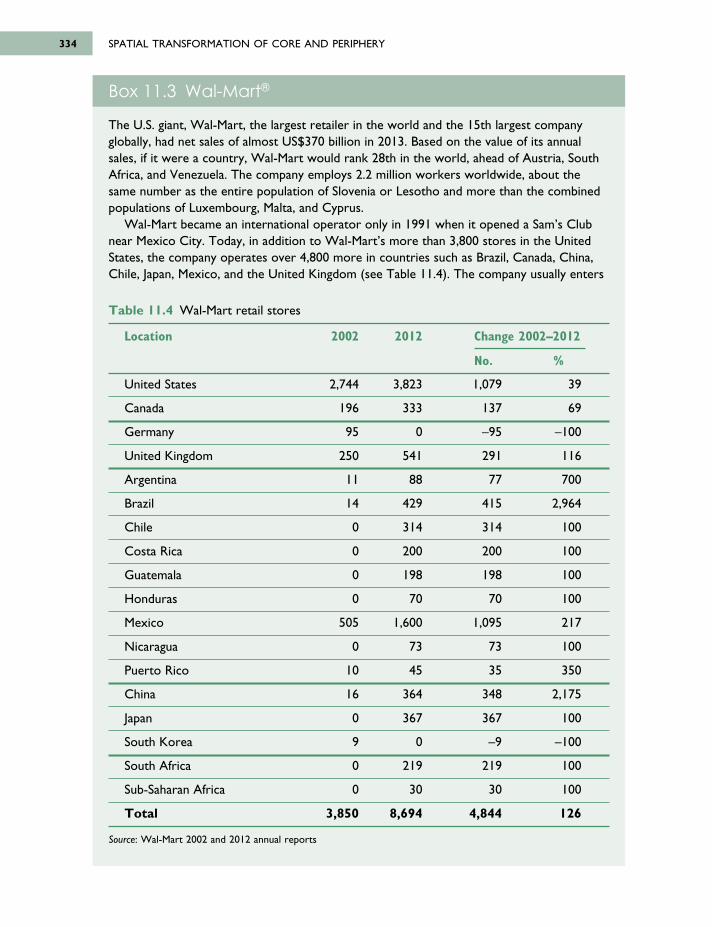
SPATIAL TRANSFORMATION OF CORE AND PERIPHERY334
Box 11.3 Wal-Mart®
The U.S. giant, Wal-Mart, the largest retailer in the world and the 15th largest companyglobally, had net sales of almost US$370 billion in 2013. Based on the value of its annualsales, if it were a country, Wal-Mart would rank 28th in the world, ahead of Austria, SouthAfrica, and Venezuela. The company employs 2.2 million workers worldwide, about thesame number as the entire population of Slovenia or Lesotho and more than the combinedpopulations of Luxembourg, Malta, and Cyprus.
Wal-Mart became an international operator only in 1991 when it opened a Sam’s Clubnear Mexico City. Today, in addition to Wal-Mart’s more than 3,800 stores in the UnitedStates, the company operates over 4,800 more in countries such as Brazil, Canada, China,Chile, Japan, Mexico, and the United Kingdom (see Table 11.4). The company usually enters
Table 11.4 Wal-Mart retail stores
Location 2002 2012 Change 2002–2012
No. %
United States 2,744 3,823 1,079 39
Canada 196 333 137 69
Germany 95 0 –95 –100
United Kingdom 250 541 291 116
Argentina 11 88 77 700
Brazil 14 429 415 2,964
Chile 0 314 314 100
Costa Rica 0 200 200 100
Guatemala 0 198 198 100
Honduras 0 70 70 100
Mexico 505 1,600 1,095 217
Nicaragua 0 73 73 100
Puerto Rico 10 45 35 350
China 16 364 348 2,175
Japan 0 367 367 100
South Korea 9 0 –9 –100
South Africa 0 219 219 100
Sub-Saharan Africa 0 30 30 100
Total 3,850 8,694 4,844 126
Source: Wal-Mart 2002 and 2012 annual reports
6063 GEOGRAPHY WORLD ECON_PT_246x189 mm 22/01/2014 15:10 Page 334
11. SERVICES: GOING GLOBAL? 335
Reardon et al. (2003) offer a typology for considering the supply network practices forsupermarkets that can usefully be applied to the buyer-driven commodity chains of the largestinternational retailers:
1. Centralized procurement using a distribution center serving multiple stores has replacedindividual store procurement. This reduces administrative costs and increases the efficiencyof the procurement network for retailers. It favors suppliers in the LDCs who can meet theretailers’ delivery, volume and quality requirements.
2. Logistics improvements have accompanied procurement consolidation. Retailers areapplying modern technologies to the supply chain in order to track inventory and delivery.Suppliers in the LDCs receive this technology transfer and training from the retailers them-selves or from local consultants.
new markets by acquiring foreign operators, such as ASDA in the United Kingdom and Seiyuin Japan.
The company is expected to concentrate increasingly on joint ventures since it wasforced to pull out of Germany in 2006 where it faced stiff competition from much largerlocal rivals such as Aldi and Lidl & Schwarz. Wal-Mart sold its 85 German stores to Metroafter it failed to repeat its extraordinary U.S. success in Europe’s largest economy. Analystsconcluded that Wal-Mart’s U.S. approach to business did not translate well into German. Inaddition to having to conform to strict German labor laws, Wal-Mart’s efforts tosuperimpose its own culture did not go smoothly. For example, Wal-Mart’s initialrequirement that its sales associates smile at customers was interpreted by male Germanshoppers as flirting; or requiring employees to bag groceries for customers was notappreciated by German customers who traditionally prefer to handle their own food andbag their own groceries. The consensus is that Wal-Mart learned important lessons inGermany.
Wal-Mart’s sales strategy—based on offering products at “everyday low prices” —allowsthe company to minimize extensive advertising and promotional campaigns. The companycan maintain low prices because it simplifies its purchasing activities and keeps costs downwith suppliers by offering a relatively narrow choice of the most popular products combinedwith some particularly high volume items.
In 2002, Wal-Mart established its Global Procurement Center to manage the company’sdirect import business and factory direct purchasing. This unit of the company is responsiblefor identifying new suppliers, sourcing new products, building partnerships with existingsuppliers and managing the global supply chain of Wal-Mart’s direct imports. Wal-Martsources its products from a large number of low-wage countries including Bangladesh,China, and Vietnam. Tight inventory management is maintained using computerization.
Wal-Mart has been criticized for a variety of practices including its extensive productsourcing in low-wage LDCs, and its low wages and poor worker benefits in its stores in theDCs, combined with its traditional resistance to union representation for its workers. A lowdegree of unionization, however, is not unique to Wal-Mart; it is something thatdistinguishes today’s service employers from the traditional manufacturing enterprises in thedeveloped countries in the past.
6063 GEOGRAPHY WORLD ECON_PT_246x189 mm 22/01/2014 15:10 Page 335
SPATIAL TRANSFORMATION OF CORE AND PERIPHERY336
3. Retailers are increasingly using local specialized wholesalers—sidestepping or transformingthe traditional wholesale system. Dealing directly with specialized wholesalers who arededicated to and capable of meeting the specific needs of the retailers reduces the retailers’costs and ensures greater control over quality and delivery.
4. The increasing use of quasi-formal and formal contracts with price controls has formalizedprocedures for local suppliers. The large retailers typically draw up short-term contractsthat give them the flexibility to adjust their supplier network and force LDC suppliers tobid for each new contract.
5. With little or no enforced public standards, the large retailers have imposed privatecertification and standards on their entire supplier network in order to harmonize productquality across LDC suppliers. Not surprisingly, many small LDC suppliers have found itimpossible to meet these requirements and have been dropped from the procurement listsof the major retailers.
On the demand side, the national and global stimuli to the growth in services, includingrising per capita incomes, have given rise to new shopping habits not only in the DCs but alsoin LDCs such as China and India. In addition, breakthroughs in information technology haveallowed consumers to access services using the Internet. E-shopping, from the likes of Amazonand eBay, has added an additional dimension to retailing that does not involve traditionalshopping venues, such as shopping malls and individual stores.
INTERNATIONAL TOURISM
The globalization of the world economy has been paralleled by a globalization of the touristindustry. Even in those parts of the world that do not have much of a base in primarycommodities, are not an important part of manufacturing commodity chains, and are not closelytied into the global financial network, international tourism can offer the otherwise unlikelyprospect of economic development. The growth of international tourism has been fuelled byrising incomes and the consumption of services with a particularly high elasticity of demand—including transportation, hotels and entertainment.
International tourism has reached an all-time high of about 1 billion international trips eachyear (up from just 147 million in 1970) (see Figure 11.11). Visitors from the more affluentcountries of the world—including the United States, United Kingdom, Japan, Canada, France,Italy—make many of these trips, although the number of Chinese international tourists is risingsharply. Since 1990, despite economic downturns, international tourist arrivals have increasedat an average rate of about 4 percent each year. About half of these trips are for leisure,recreation and vacations; one-sixth for business; and the remainder for other purposesincluding visiting friends and relatives, religious reasons such as pilgrimages, and healthtreatment. Top destinations for medical tourism by the more than 2 million patients fromDCs seeking treatment, usually for elective procedures like cosmetic surgery, at lower cost inLDCs include India, Mexico, Singapore, and Thailand.
International tourism earnings have reached more than US$1,000 billion annually (see Figure11.11). It is one of the world’s largest industries, with up to one in every ten workersworldwide involved (directly and indirectly) in transporting, feeding, housing, guiding, oramusing tourists. Tourism exports represent about 30 percent of the world’s exports ofcommercial services; for some LDCs, tourism is the main export and source of foreignexchange income. Tourism is estimated to contribute about 5 percent to world GDP.
6063 GEOGRAPHY WORLD ECON_PT_246x189 mm 22/01/2014 15:10 Page 336
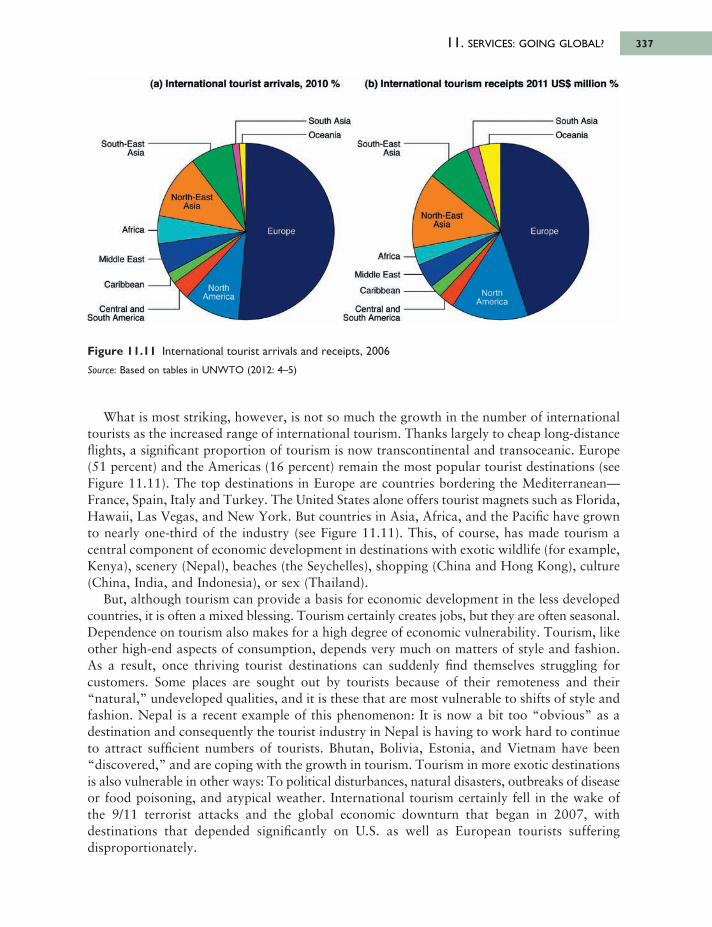
11. SERVICES: GOING GLOBAL? 337
Figure 11.11 International tourist arrivals and receipts, 2006
Source: Based on tables in UNWTO (2012: 4–5)
What is most striking, however, is not so much the growth in the number of internationaltourists as the increased range of international tourism. Thanks largely to cheap long-distanceflights, a significant proportion of tourism is now transcontinental and transoceanic. Europe(51 percent) and the Americas (16 percent) remain the most popular tourist destinations (seeFigure 11.11). The top destinations in Europe are countries bordering the Mediterranean—France, Spain, Italy and Turkey. The United States alone offers tourist magnets such as Florida,Hawaii, Las Vegas, and New York. But countries in Asia, Africa, and the Pacific have grownto nearly one-third of the industry (see Figure 11.11). This, of course, has made tourism acentral component of economic development in destinations with exotic wildlife (for example,Kenya), scenery (Nepal), beaches (the Seychelles), shopping (China and Hong Kong), culture(China, India, and Indonesia), or sex (Thailand).
But, although tourism can provide a basis for economic development in the less developedcountries, it is often a mixed blessing. Tourism certainly creates jobs, but they are often seasonal.Dependence on tourism also makes for a high degree of economic vulnerability. Tourism, likeother high-end aspects of consumption, depends very much on matters of style and fashion.As a result, once thriving tourist destinations can suddenly find themselves struggling forcustomers. Some places are sought out by tourists because of their remoteness and their“natural,” undeveloped qualities, and it is these that are most vulnerable to shifts of style andfashion. Nepal is a recent example of this phenomenon: It is now a bit too “obvious” as adestination and consequently the tourist industry in Nepal is having to work hard to continueto attract sufficient numbers of tourists. Bhutan, Bolivia, Estonia, and Vietnam have been“discovered,” and are coping with the growth in tourism. Tourism in more exotic destinationsis also vulnerable in other ways: To political disturbances, natural disasters, outbreaks of diseaseor food poisoning, and atypical weather. International tourism certainly fell in the wake ofthe 9/11 terrorist attacks and the global economic downturn that began in 2007, withdestinations that depended significantly on U.S. as well as European tourists sufferingdisproportionately.
6063 GEOGRAPHY WORLD ECON_PT_246x189 mm 22/01/2014 15:10 Page 337
South Asi<
OceaniaSouth-East
Asia
South Asia
OceaniaSouth-East
Asia
North-EastAsia
Europe
North-EastAsia
Europe
NorthAmerica
Africa -
Middle East
Caribbean
Central and South America
Africa
NorthAmerica
Middle East
Caribbean
Central and - South America
(a) International tourist arrivals, 2010 % (b) International tourism receipts 2011 USS m illion %
Although tourism is a multibillion-dollar industry, the financial returns for tourist areasare often not as high as might be expected. The greater part of the price of a package vacation,for example, stays with the organizing company and the airline. Typically, the tourist regionitself captures only 40 percent. If the package involves a foreign-owned hotel, this may fallbelow 25 percent. The costs and benefits of tourism, however, are not only economic. On thepositive side, tourism can help sustain indigenous lifestyles, regional cultures, arts and crafts,and provide incentives for wildlife preservation, environmental protection, and the conservationof historic buildings and sites. On the negative side, tourism can adulterate and debase indi -gen ous cultures, and bring unsightly development, pollution, and environmental degrada tion.Tourism can also involve exploitative relations that degrade traditional lifestyles and regionalcultural heritages as they become packaged for outsider consumption. Traditional ceremonies,which formerly had cultural significance for the performers, are now enacted solely to bewatched and photographed. In the process, indigenous cultures are edited, beautified, and alteredto suit outsiders’ tastes and expectations.
Such issues, coupled with the economic vulnerability of tourism, gave rise to ecotourismas a more sustainable strategy for economic development in the LDCs. Ecotourism emphasizesself-determination, authenticity, social harmony, preserving the environment, small-scaledevelopment, and greater use of local techniques, materials and architectural styles. Despitebeing a relatively poor country, Costa Rica, for example, has won high praise from environ -mentalists for protecting more than one-fourth of its territory in biosphere and wildlife
SPATIAL TRANSFORMATION OF CORE AND PERIPHERY338
Box 11.4 Abu Dhabi, a tourist Mecca?
Many semi-peripheral countries have made a significant transition toward becoming serviceeconomies. Of these, some oil-rich states in the Persian Gulf have deliberately attempted to diversify their oil-dominated economies toward services such as banking and hostingconventions. They have also tried to become tourist Meccas by investing in expensivetourist amenities, including luxury hotels, shopping malls, and golf courses. Saudi Arabia, for example, with about 20 million international visitors annually, ranks among the top 20international tourist destinations in the world.
The United Arab Emirates (UAE) is catching up following an aggressive policy to positionitself as a major Persian Gulf tourist destination. In 2007 the head of Abu Dhabi’s tourismagency and the French Culture Minister signed a 30-year agreement to open a LouvreMuseum outlet in this Persian Gulf boomtown. France will receive US$525 million alone forthe use of the Louvre brand name. The deal also involves a gift of $33 million to renovate awing of the Paris Louvre, which will house Islamic art and be named for the longtime UAEruler, Sheik Zayed bin Sultan Al Nahyan. In addition to the hundreds of millions of dollars inconstruction costs, a further $750 million will be spent to bring French staff and 300 loanedpieces of art to the Louvre Abu Dhabi for its opening in 2015. The waterfront museum isdesigned to be the centerpiece of a cultural district with the goal of attracting millions ofwell-heeled tourists each year.
Not everyone was happy about what some negatively saw as the globalization of Frenchculture. In France, opponents argued that the French government was exploiting art fortrade. The Louvre Abu Dhabi also has to overcome significant cultural barriers in the Islamicworld where representations of the human body, even fully clothed, can be a religioustaboo.
6063 GEOGRAPHY WORLD ECON_PT_246x189 mm 22/01/2014 15:10 Page 338
11. SERVICES: GOING GLOBAL? 339
preserves. The payoff for Costa Rica is the escalating number of tourists who come to visitits active volcanoes, palm-lined beaches, cloud forests and tropical parks. Costa Rica receivesmore than 2 million tourists every year. Tourism is the country’s largest source of foreignexchange, followed by bananas, pineapples, coffee, sugar, and, more recently, electroniccomponents and medical equipment.
THE INTERNATIONALIZATION OF FINANCE
Having addressed the patterns of international finance in earlier chapters (see, for example,Chapters 2 and 3) we focus here on the internationalization of finance from the perspectiveof the LDCs in terms of transnational banks and FDI in financial services, foreign exchangetransactions and offshore banking centers. Several factors—with implications for the LDCs—have reinforced the globalization of financial services. A particularly important factor has beenthe advances in information and telecommunications technologies, allowing the electronic flowof capital, which have significantly reduced the transaction and transmission costs associatedwith moving money. Another has been the institutionalization of savings in the developedcountries (through pension funds and the like), which has established a large pool of capitalmanaged by professional investors with few geographical allegiances or ties. Another has been the trend toward disintermediation—which involves borrowers (especially large corpora-tions) raising capital and making investments without going through the traditional,intermediary channels of financial institutions. Yet another, and probably more important,factor was the deregulation of financial markets that began in many developed countries inthe 1980s.
Financial services have traditionally accounted for a large share of FDI in greenfield services projects in many parts of the world. Despite the fallout from the global financial crisis,the value of FDI in greenfield financial services projects has reached more than $40 billionannually. In East and Southeast Asia, for example, the share of FDI greenfield services projectsrepresented by finance has risen to about 25 percent each year. Financial services cross-bordermergers and acquisitions (M&As), the primary means of foreign entry into LDC markets, haverisen to more than $36 billion annually. Not only are two-thirds of all financial M&As withinthe DCs, Europe and North America dominate the list of the 20 largest financial TNCs. TheEuropean Union (specifically France, Germany, the United Kingdom, Italy, the Netherlands,and Spain) has 65 percent of the top 20 financial conglomerates, followed by Switzerland with20 percent, the United States with 10 percent, and Japan with 5 percent (see Table 11.5).Therehas been a large increase in the presence of banks from the developed countries in the lessdeveloped countries, especially in East Asia and Latin America. Whereas foreign banks capturemarket shares (including deposits and profits) of about 20 percent in the DCs, the share isabout 50 percent in the LDCs. Market shares are more than 75 percent in LDCs such asCameroon, Senegal and Uganda in Africa and El Salvador, Nicaragua and Uruguay in LatinAmerica.
At the same time, it is estimated that as many as one-third of the world’s financial TNCsare from the less developed countries. Among these banks are some of the world’s largest,including China’s ICBC, China Construction Bank, Agricultural Bank of China and Bank ofChina, Brazil’s Itaú Unibanco, Banco do Brasil, and Banco Bradesco, and Russia’s Sberbank.Many LDC banks, however, tend to be relatively small by international standards and lessinternationally active (with a physical presence in relatively few foreign banking markets). A significant percentage of the foreign subsidiaries of these financial TNCs are concentratedwithin the region of the home LDC.
6063 GEOGRAPHY WORLD ECON_PT_246x189 mm 22/01/2014 15:10 Page 339
Nevertheless, just as some NIEs developed their own transnational corporations to competewith those of developed countries, so some have developed relatively large and aggressive bankswith an increasing interest in international opportunities. Singapore’s four largest banks, forexample, have more than 50 overseas branches, 20 overseas subsidiaries and affiliates, andmore than 30 representative offices in overseas locations including Beijing, Hong Kong,Jakarta, London, Los Angeles, Manila, New York, Seoul, Sydney, Taipei, Tokyo, andVancouver.
In addition, the effects of the rapid spread of e-finance in recent years are not limited tothe DCs. E-finance involves electronic financial services that are delivered online, for examplethrough smartphones or smart cards (embedded with a microprocessor and/or a memory chipallowing information on the card to be added, deleted, or otherwise manipulated). Some LDCswith underdeveloped financial systems use e-finance to leapfrog ahead in some areas offinance, including banking. In some African countries, for example, electronic cash and smartcards are being offered as savings and payment services for low-income customers who donot have access to traditional banks and conventional bank accounts. Evidence from Brazil,for example, indicates that e-finance can be introduced quickly even when basic financialinfrastructure is weak or non-existent.
At the same time, however, there is enormous variation in the extent of electronic bankingand shopping across both the DCs and the LDCs (see Table 11.6). This variation is not closely related to level of development however. In some countries, DC as well as LDC,electronic delivery of financial services remains in its infancy. Meanwhile, other countries haveexperienced the rapid penetration of e-finance. In Sweden, e-finance accounts for more thanone-third of financial transactions. In some LDCs, such as Mexico, e-finance penetration isquite high for some financial services (Table 11.6). At the same time, however, significantchallenges to the spread of e-finance in some LDCs relate not only to the availability oftechnology and infrastructure (including access to smartphones and the Internet) but also to the enabling regulatory environment, involving security and related infrastructure for e-transactions, information and privacy, and contract enforcement.
In addition, the increasing use of electronic money has changed the nature of internationalfinancial investments in ways that may not benefit the LDCs. For example, foreign investmentsare already beginning to shift away from more tangible FDI to intangible portfolio invest-ments such as stocks and bonds. The issue here is that whereas FDI can generate tangiblelevels of employment and facilitate technology transfer, portfolio investments typically createfew jobs (Bryson et al., 2004).
What is more, despite the dominance of electronic money flows, the majority of the foreignexchange transactions—more than 70 percent—are still made in only three currencies: the U.S.dollar, the euro, and the Japanese yen. Certainly the market opens each day in East Asia whileit is still evening in the United States; financial transactions then look west, travelling alongnew or upgraded fiber-optic cables, typically including Tokyo to Shanghai or Hong Kong toMumbai to Frankfurt or Zürich to London and then on to the United States (see Figure 11.12).But London has maintained its preeminence as the premier world center with about 35 percentof the volume of the more than US$4 trillion in foreign exchange transactions every day,followed by New York with 18 percent, and Tokyo with 6 percent.
Not all the needs of the global financial system, however, can be met by conventional financialservices. The need for secrecy and the desire for shelter from taxation and regulation haveresulted in the emergence of offshore banking centers. The incredible increase in the electronicflow of global capital has allowed many of these offshore banking centers to be located in theLDCs—in microstates and on islands (see Figure 11.13). There are five main specialized offshore
SPATIAL TRANSFORMATION OF CORE AND PERIPHERY340
6063 GEOGRAPHY WORLD ECON_PT_246x189 mm 22/01/2014 15:10 Page 340
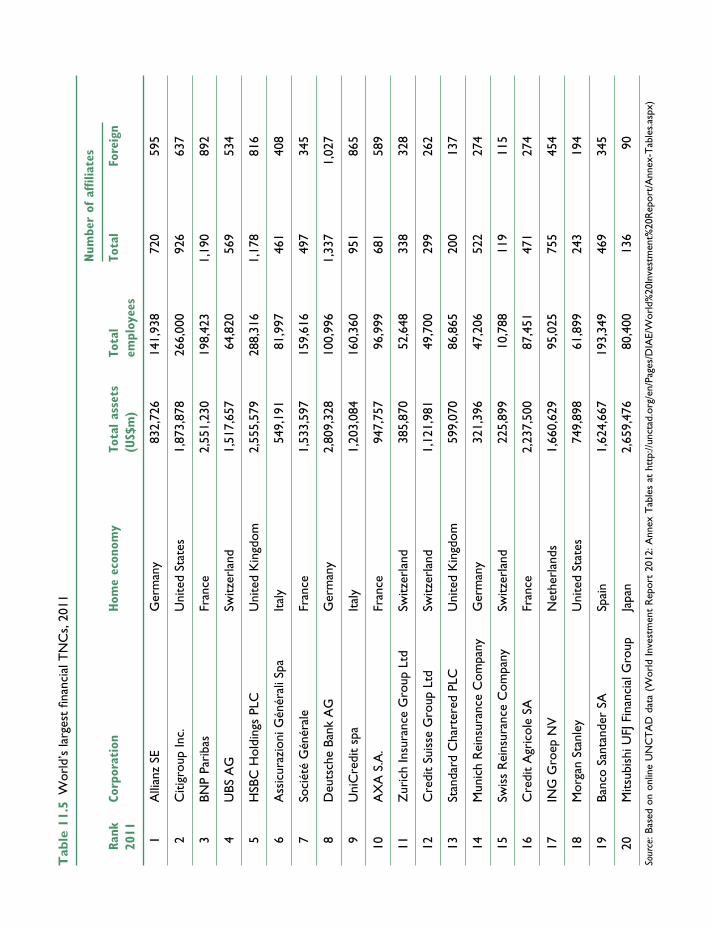
Tab
le 1
1.5
Wor
ld’s
larg
est
finan
cial
TN
Cs,
201
1
Num
ber
of a
ffilia
tes
Rank
Co
rpor
atio
nHom
e ec
onom
yTo
tal as
sets
To
tal
Tota
lFo
reig
n20
11(U
S$m
)em
ploy
ees
1A
llian
z SE
Ger
man
y83
2,72
614
1,93
872
059
5
2C
itigr
oup
Inc.
Uni
ted
Stat
es1,
873,
878
266,
000
926
637
3BN
P Pa
riba
sFr
ance
2,55
1,23
019
8,42
31,
190
892
4U
BS A
GSw
itzer
land
1,51
7,65
764
,820
569
534
5H
SBC
Hol
ding
s PL
CU
nite
d K
ingd
om2,
555,
579
288,
316
1,17
881
6
6A
ssic
uraz
ioni
Gén
éral
i Spa
Ital
y54
9,19
181
,997
461
408
7So
ciét
é G
énér
ale
Fran
ce1,
533,
597
159,
616
497
345
8D
euts
che
Bank
AG
Ger
man
y2,
809,
328
100,
996
1,33
71,
027
9U
niC
redi
t sp
aIt
aly
1,20
3,08
416
0,36
095
186
5
10A
XA
S.A
.Fr
ance
947,
757
96,9
9968
158
9
11Z
uric
h In
sura
nce
Gro
up L
tdSw
itzer
land
385,
870
52,6
4833
832
8
12C
redi
t Su
isse
Gro
up L
tdSw
itzer
land
1,12
1,98
149
,700
299
262
13St
anda
rd C
hart
ered
PLC
Uni
ted
Kin
gdom
599,
070
86,8
6520
013
7
14M
unic
h R
eins
uran
ce C
ompa
nyG
erm
any
321,
396
47,2
0652
227
4
15Sw
iss
Rei
nsur
ance
Com
pany
Switz
erla
nd22
5,89
910
,788
119
115
16C
redi
t A
gric
ole
SAFr
ance
2,23
7,50
087
,451
471
274
17IN
G G
roep
NV
Net
herl
ands
1,66
0,62
995
,025
755
454
18M
orga
n St
anle
yU
nite
d St
ates
749,
898
61,8
9924
319
4
19Ba
nco
Sant
ande
r SA
Spai
n1,
624,
667
193,
349
469
345
20M
itsub
ishi
UFJ
Fin
anci
al G
roup
Japa
n2,
659,
476
80,4
0013
690
Sour
ce: B
ased
on
onlin
e U
NC
TA
D d
ata
(Wor
ld In
vest
men
t R
epor
t 20
12: A
nnex
Tab
les
at h
ttp:
//unc
tad.
org/
en/P
ages
/DIA
E/W
orld
%20
Inve
stm
ent%
20R
epor
t/A
nnex
-Tab
les.
aspx
)
6063 GEOGRAPHY WORLD ECON_PT_246x189 mm 22/01/2014 15:10 Page 341
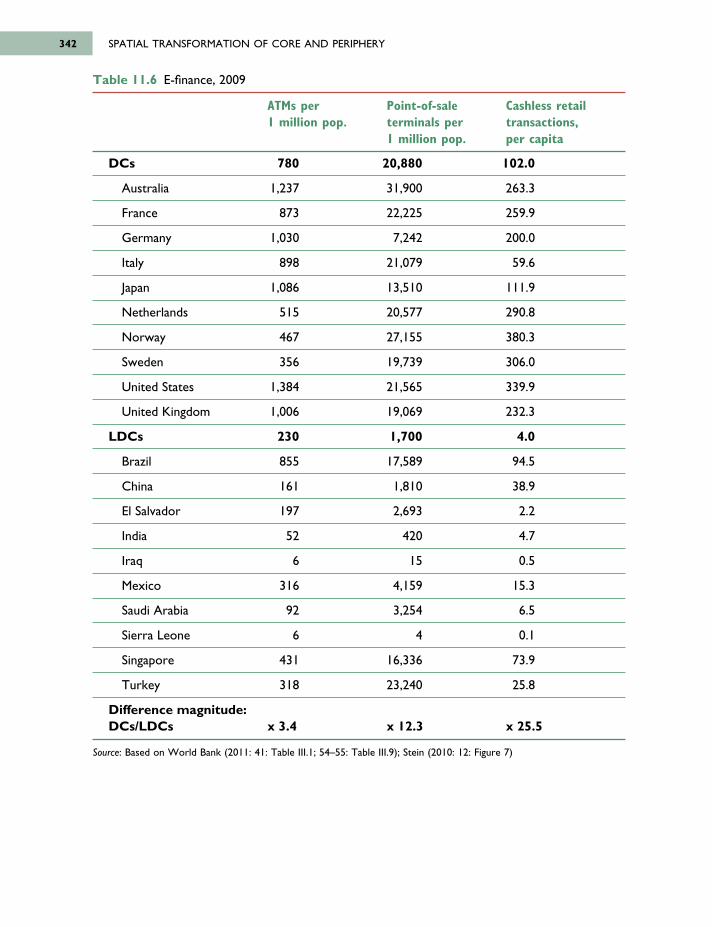
SPATIAL TRANSFORMATION OF CORE AND PERIPHERY342
Table 11.6 E-finance, 2009
ATMs per Point-of-sale Cashless retail 1 million pop. terminals per transactions,
1 million pop. per capita
DCs 780 20,880 102.0
Australia 1,237 31,900 263.3
France 873 22,225 259.9
Germany 1,030 7,242 200.0
Italy 898 21,079 59.6
Japan 1,086 13,510 111.9
Netherlands 515 20,577 290.8
Norway 467 27,155 380.3
Sweden 356 19,739 306.0
United States 1,384 21,565 339.9
United Kingdom 1,006 19,069 232.3
LDCs 230 1,700 4.0
Brazil 855 17,589 94.5
China 161 1,810 38.9
El Salvador 197 2,693 2.2
India 52 420 4.7
Iraq 6 15 0.5
Mexico 316 4,159 15.3
Saudi Arabia 92 3,254 6.5
Sierra Leone 6 4 0.1
Singapore 431 16,336 73.9
Turkey 318 23,240 25.8
Difference magnitude:DCs/LDCs x 3.4 x 12.3 x 25.5
Source: Based on World Bank (2011: 41: Table III.1; 54–55: Table III.9); Stein (2010: 12: Figure 7)
6063 GEOGRAPHY WORLD ECON_PT_246x189 mm 22/01/2014 15:10 Page 342
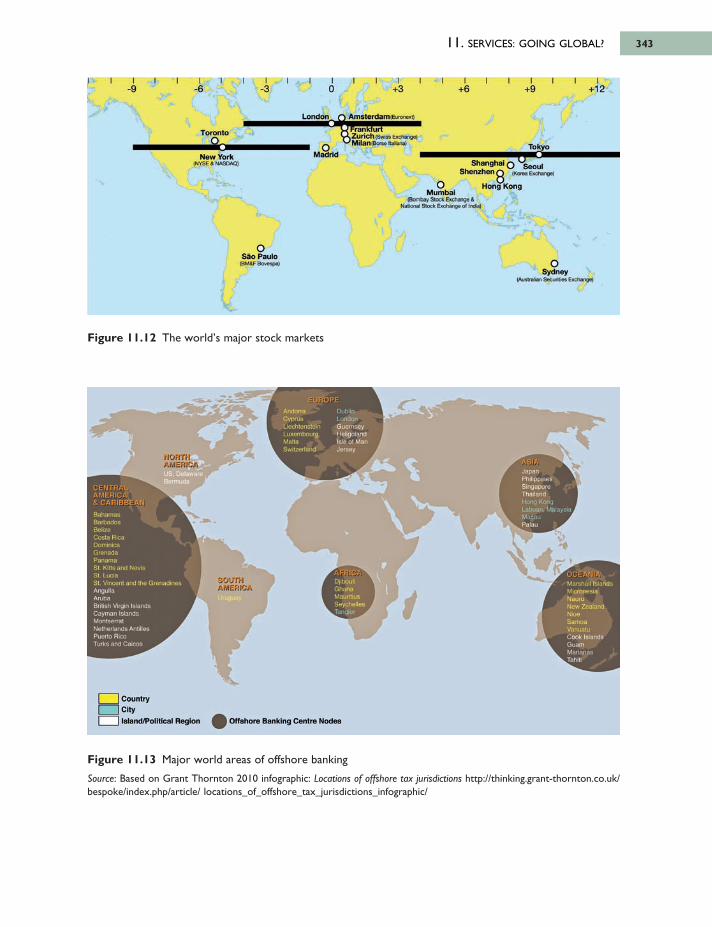
11. SERVICES: GOING GLOBAL? 343
Figure 11.12 The world’s major stock markets
Figure 11.13 Major world areas of offshore banking
Source: Based on Grant Thornton 2010 infographic: Locations of offshore tax jurisdictions http://thinking.grant-thornton.co.uk/bespoke/index.php/article/ locations_of_offshore_tax_jurisdictions_infographic/
6063 GEOGRAPHY WORLD ECON_PT_246x189 mm 22/01/2014 15:10 Page 343
London _ і Amsterdam(EL^*Mi>
У*\Zurich iSvnss Exchange) ^ Milan lBor*e lUiane)
Toronto
New York(NYSE ft NASDAQ)
MadridTokyo
Shanghai 0 s^outS h en zh en О (когм Etcnano»)
Hong Kong
-9 -6 -3 0 +3 +6 +9 +12
V rMumbai
(Bomfcay Stock Exchange ft National Stock Exchange of inAa)
Sydney(Auatrafean Secunt«9 Exdwnge)
Sao Paulo
EUROPE Andorra O ublin-jCypnjs I vMJonLiechtenstein GuernseyLuxembourg I ieUgo) andMalta Isle o< ManSwitzerland Jersey
- Щ У ' ^
o c ^ 'N ^Marshall islandsMicronesiaNauruNew ZealandNiueSamoaVanuatuCook IslandsGuamM ananu X
і i f
" ғ в ю с ™β|·: tfxjt· Ghana Mauritius Seychelles
^ J Λ
SOUTHAMERICA
NORTHAMERICA
f ΝΠ ΛAMERICA
BahamasBaibadosBelizeCosta RicaDominicaGrenadaPanamaSt Kitts and Nevis St LuciaSt. Vincent and the GrenadinesAnguHaArubaBritish Virgin IslandsCayman IslandsMontserrat .Netherlands AntillesPuerto RicoTurks and Caicos
^ ra n k iu rt
C EN T R A tiAM ERICA'& C A R IB gEM gl?
JapanPhilippinesSingaporeThailandHong Kon<j Labuan, Mfelaysu Macau Palau
CountryCitv
Is land/Politica l Region I O ffshore Banking Centre Nodes
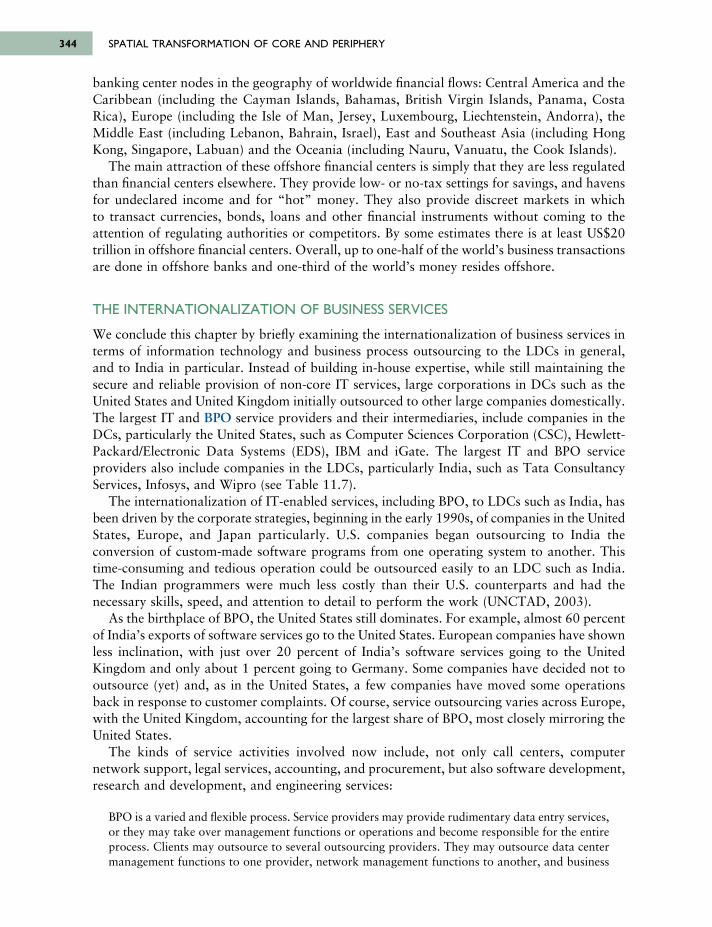
banking center nodes in the geography of worldwide financial flows: Central America and theCaribbean (including the Cayman Islands, Bahamas, British Virgin Islands, Panama, CostaRica), Europe (including the Isle of Man, Jersey, Luxembourg, Liechtenstein, Andorra), theMiddle East (including Lebanon, Bahrain, Israel), East and Southeast Asia (including HongKong, Singapore, Labuan) and the Oceania (including Nauru, Vanuatu, the Cook Islands).
The main attraction of these offshore financial centers is simply that they are less regulatedthan financial centers elsewhere. They provide low- or no-tax settings for savings, and havensfor undeclared income and for “hot” money. They also provide discreet markets in which to transact currencies, bonds, loans and other financial instruments without coming to theattention of regulating authorities or competitors. By some estimates there is at least US$20trillion in offshore financial centers. Overall, up to one-half of the world’s business transactionsare done in offshore banks and one-third of the world’s money resides offshore.
THE INTERNATIONALIZATION OF BUSINESS SERVICES
We conclude this chapter by briefly examining the internationalization of business services interms of information technology and business process outsourcing to the LDCs in general,and to India in particular. Instead of building in-house expertise, while still maintaining thesecure and reliable provision of non-core IT services, large corporations in DCs such as theUnited States and United Kingdom initially outsourced to other large companies domestically.The largest IT and BPO service providers and their intermediaries, include companies in theDCs, particularly the United States, such as Computer Sciences Corporation (CSC), Hewlett-Packard/Electronic Data Systems (EDS), IBM and iGate. The largest IT and BPO serviceproviders also include companies in the LDCs, particularly India, such as Tata ConsultancyServices, Infosys, and Wipro (see Table 11.7).
The internationalization of IT-enabled services, including BPO, to LDCs such as India, hasbeen driven by the corporate strategies, beginning in the early 1990s, of companies in the UnitedStates, Europe, and Japan particularly. U.S. companies began outsourcing to India theconversion of custom-made software programs from one operating system to another. Thistime-consuming and tedious operation could be outsourced easily to an LDC such as India.The Indian programmers were much less costly than their U.S. counterparts and had thenecessary skills, speed, and attention to detail to perform the work (UNCTAD, 2003).
As the birthplace of BPO, the United States still dominates. For example, almost 60 percentof India’s exports of software services go to the United States. European companies have shownless inclination, with just over 20 percent of India’s software services going to the UnitedKingdom and only about 1 percent going to Germany. Some companies have decided not tooutsource (yet) and, as in the United States, a few companies have moved some operationsback in response to customer complaints. Of course, service outsourcing varies across Europe,with the United Kingdom, accounting for the largest share of BPO, most closely mirroring theUnited States.
The kinds of service activities involved now include, not only call centers, computernetwork support, legal services, accounting, and procurement, but also software development,research and development, and engineering services:
BPO is a varied and flexible process. Service providers may provide rudimentary data entry services,or they may take over management functions or operations and become responsible for the entireprocess. Clients may outsource to several outsourcing providers. They may outsource data centermanagement functions to one provider, network management functions to another, and business
SPATIAL TRANSFORMATION OF CORE AND PERIPHERY344
6063 GEOGRAPHY WORLD ECON_PT_246x189 mm 22/01/2014 15:11 Page 344
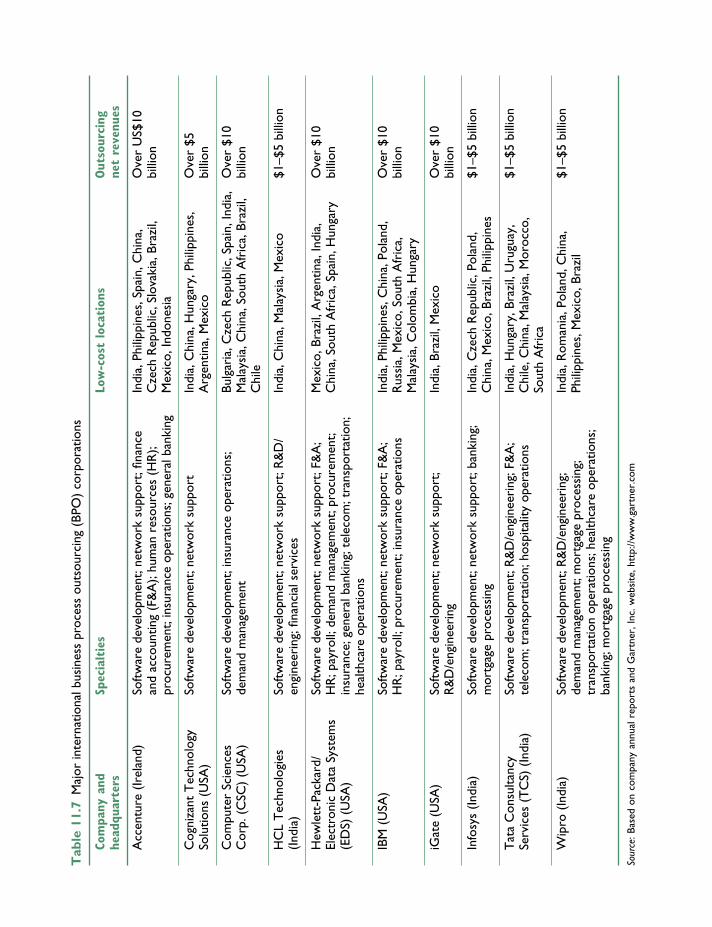
Tab
le 1
1.7
Maj
or in
tern
atio
nal b
usin
ess
proc
ess
outs
ourc
ing
(BPO
) co
rpor
atio
ns
Com
pany
and
Sp
ecia
ltie
sLo
w-c
ost
loca
tion
sOut
sour
cing
he
adqu
arte
rsne
t re
venu
es
Acc
entu
re (
Irel
and)
Soft
war
e de
velo
pmen
t; ne
twor
k su
ppor
t; fin
ance
In
dia,
Phi
lippi
nes,
Spa
in, C
hina
, O
ver
US$
10
and
acco
untin
g (F
&A
); hu
man
res
ourc
es (
HR
); C
zech
Rep
ublic
, Slo
vaki
a, B
razi
l, bi
llion
proc
urem
ent;
insu
ranc
e op
erat
ions
; gen
eral
ban
king
Mex
ico,
Indo
nesi
a
Cog
niza
nt T
echn
olog
y So
ftw
are
deve
lopm
ent;
netw
ork
supp
ort
Indi
a, C
hina
, Hun
gary
, Phi
lippi
nes,
O
ver
$5
Solu
tions
(U
SA)
Arg
entin
a, M
exic
obi
llion
Com
pute
r Sc
ienc
es
Soft
war
e de
velo
pmen
t; in
sura
nce
oper
atio
ns;
Bulg
aria
, Cze
ch R
epub
lic, S
pain
, Ind
ia,
Ove
r $1
0 C
orp.
(C
SC)
(USA
)de
man
d m
anag
emen
tM
alay
sia,
Chi
na, S
outh
Afr
ica,
Bra
zil,
billi
onC
hile
HC
L T
echn
olog
ies
Soft
war
e de
velo
pmen
t; ne
twor
k su
ppor
t; R
&D
/In
dia,
Chi
na, M
alay
sia,
Mex
ico
$1–$
5 bi
llion
(Indi
a)en
gine
erin
g; fi
nanc
ial s
ervi
ces
Hew
lett
-Pac
kard
/ So
ftw
are
deve
lopm
ent;
netw
ork
supp
ort;
F&A
; M
exic
o, B
razi
l, A
rgen
tina,
Indi
a,
Ove
r $1
0 El
ectr
onic
Dat
a Sy
stem
s H
R; p
ayro
ll; d
eman
d m
anag
emen
t; pr
ocur
emen
t; C
hina
, Sou
th A
fric
a, S
pain
, Hun
gary
billi
on(E
DS)
(U
SA)
insu
ranc
e; g
ener
al b
anki
ng; t
elec
om; t
rans
port
atio
n;
heal
thca
re o
pera
tions
IBM
(U
SA)
Soft
war
e de
velo
pmen
t; ne
twor
k su
ppor
t; F&
A;
Indi
a, P
hilip
pine
s, C
hina
, Pol
and,
O
ver
$10
HR
; pay
roll;
pro
cure
men
t; in
sura
nce
oper
atio
nsR
ussi
a, M
exic
o, S
outh
Afr
ica,
bi
llion
Mal
aysi
a, C
olom
bia,
Hun
gary
iGat
e (U
SA)
Soft
war
e de
velo
pmen
t; ne
twor
k su
ppor
t; In
dia,
Bra
zil,
Mex
ico
Ove
r $1
0 R
&D
/eng
inee
ring
billi
on
Info
sys
(Indi
a)So
ftw
are
deve
lopm
ent;
netw
ork
supp
ort;
bank
ing;
In
dia,
Cze
ch R
epub
lic, P
olan
d,
$1–$
5 bi
llion
mor
tgag
e pr
oces
sing
Chi
na, M
exic
o, B
razi
l, Ph
ilipp
ines
Tat
a C
onsu
ltanc
y So
ftw
are
deve
lopm
ent;
R&
D/e
ngin
eeri
ng; F
&A
; In
dia,
Hun
gary
, Bra
zil,
Uru
guay
, $1
–$5
billi
onSe
rvic
es (
TC
S) (
Indi
a)te
leco
m; t
rans
port
atio
n; h
ospi
talit
y op
erat
ions
Chi
le, C
hina
, Mal
aysi
a, M
oroc
co,
Sout
h A
fric
a
Wip
ro (
Indi
a)So
ftw
are
deve
lopm
ent;
R&
D/e
ngin
eeri
ng;
Indi
a, R
oman
ia, P
olan
d, C
hina
, $1
–$5
billi
onde
man
d m
anag
emen
t; m
ortg
age
proc
essi
ng;
Phili
ppin
es, M
exic
o, B
razi
ltr
ansp
orta
tion
oper
atio
ns; h
ealth
care
ope
ratio
ns;
bank
ing;
mor
tgag
e pr
oces
sing
Sour
ce: B
ased
on
com
pany
ann
ual r
epor
ts a
nd G
artn
er, I
nc. w
ebsi
te, h
ttp:
//ww
w.g
artn
er.c
om
6063 GEOGRAPHY WORLD ECON_PT_246x189 mm 22/01/2014 15:11 Page 345
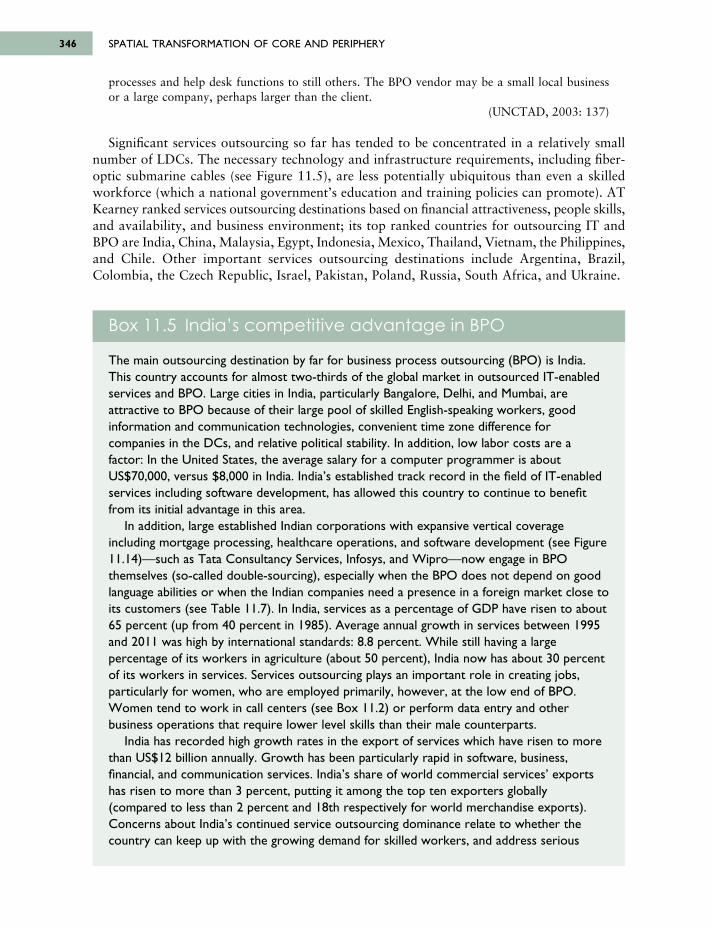
SPATIAL TRANSFORMATION OF CORE AND PERIPHERY346
processes and help desk functions to still others. The BPO vendor may be a small local businessor a large company, perhaps larger than the client.
(UNCTAD, 2003: 137)
Significant services outsourcing so far has tended to be concentrated in a relatively smallnumber of LDCs. The necessary technology and infrastructure requirements, including fiber-optic submarine cables (see Figure 11.5), are less potentially ubiquitous than even a skilledworkforce (which a national government’s education and training policies can promote). ATKearney ranked services outsourcing destinations based on financial attractiveness, people skills,and availability, and business environment; its top ranked countries for outsourcing IT andBPO are India, China, Malaysia, Egypt, Indonesia, Mexico, Thailand, Vietnam, the Philippines,and Chile. Other important services outsourcing destinations include Argentina, Brazil,Colombia, the Czech Republic, Israel, Pakistan, Poland, Russia, South Africa, and Ukraine.
Box 11.5 India’s competitive advantage in BPO
The main outsourcing destination by far for business process outsourcing (BPO) is India.This country accounts for almost two-thirds of the global market in outsourced IT-enabledservices and BPO. Large cities in India, particularly Bangalore, Delhi, and Mumbai, areattractive to BPO because of their large pool of skilled English-speaking workers, goodinformation and communication technologies, convenient time zone difference forcompanies in the DCs, and relative political stability. In addition, low labor costs are afactor: In the United States, the average salary for a computer programmer is aboutUS$70,000, versus $8,000 in India. India’s established track record in the field of IT-enabledservices including software development, has allowed this country to continue to benefitfrom its initial advantage in this area.
In addition, large established Indian corporations with expansive vertical coverageincluding mortgage processing, healthcare operations, and software development (see Figure11.14)—such as Tata Consultancy Services, Infosys, and Wipro—now engage in BPOthemselves (so-called double-sourcing), especially when the BPO does not depend on goodlanguage abilities or when the Indian companies need a presence in a foreign market close toits customers (see Table 11.7). In India, services as a percentage of GDP have risen to about65 percent (up from 40 percent in 1985). Average annual growth in services between 1995and 2011 was high by international standards: 8.8 percent. While still having a largepercentage of its workers in agriculture (about 50 percent), India now has about 30 percentof its workers in services. Services outsourcing plays an important role in creating jobs,particularly for women, who are employed primarily, however, at the low end of BPO.Women tend to work in call centers (see Box 11.2) or perform data entry and otherbusiness operations that require lower level skills than their male counterparts.
India has recorded high growth rates in the export of services which have risen to morethan US$12 billion annually. Growth has been particularly rapid in software, business,financial, and communication services. India’s share of world commercial services’ exportshas risen to more than 3 percent, putting it among the top ten exporters globally(compared to less than 2 percent and 18th respectively for world merchandise exports).Concerns about India’s continued service outsourcing dominance relate to whether thecountry can keep up with the growing demand for skilled workers, and address serious
6063 GEOGRAPHY WORLD ECON_PT_246x189 mm 22/01/2014 15:11 Page 346
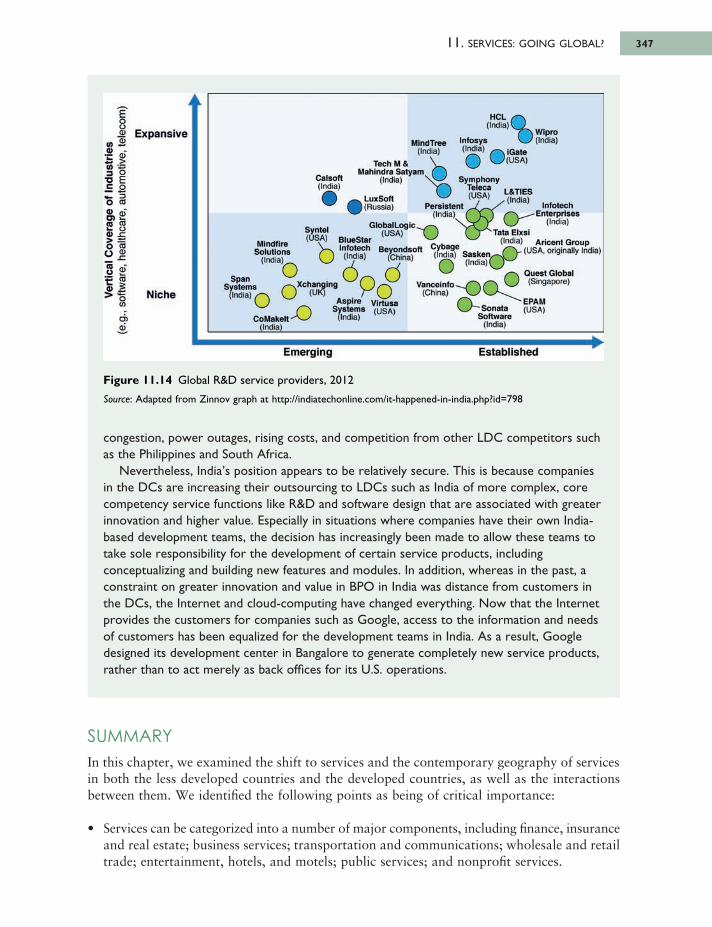
SUMMARYIn this chapter, we examined the shift to services and the contemporary geography of servicesin both the less developed countries and the developed countries, as well as the interactionsbetween them. We identified the following points as being of critical importance:
• Services can be categorized into a number of major components, including finance, insuranceand real estate; business services; transportation and communications; wholesale and retailtrade; entertainment, hotels, and motels; public services; and nonprofit services.
11. SERVICES: GOING GLOBAL? 347
congestion, power outages, rising costs, and competition from other LDC competitors suchas the Philippines and South Africa.
Nevertheless, India’s position appears to be relatively secure. This is because companiesin the DCs are increasing their outsourcing to LDCs such as India of more complex, corecompetency service functions like R&D and software design that are associated with greaterinnovation and higher value. Especially in situations where companies have their own India-based development teams, the decision has increasingly been made to allow these teams totake sole responsibility for the development of certain service products, includingconceptualizing and building new features and modules. In addition, whereas in the past, aconstraint on greater innovation and value in BPO in India was distance from customers inthe DCs, the Internet and cloud-computing have changed everything. Now that the Internetprovides the customers for companies such as Google, access to the information and needsof customers has been equalized for the development teams in India. As a result, Googledesigned its development center in Bangalore to generate completely new service products,rather than to act merely as back offices for its U.S. operations.
Figure 11.14 Global R&D service providers, 2012
Source: Adapted from Zinnov graph at http://indiatechonline.com/it-happened-in-india.php?id=798
6063 GEOGRAPHY WORLD ECON_PT_246x189 mm 22/01/2014 15:11 Page 347
C a lso fi(India)
Tech M & Mahindra Satyarr
(India)
MindTree(India)
Infosys(India)
HCL ,(India)'
\ Wipro'9 (India)
V (Gate'(USA)
SymphonyTeleca(USA) L&TIES
(India)LuxSoftI (Russia) Persistent
(India) tInfotech
Enterprises(India)
Aricent GroupUSA, originally India)
4 Tata Elxsi(India)
GlobalLogic(USA)Syntel
(USA) BlueStarInfotech
(India)Beyondsoft *
(China)Cybage(India) S a s k e n ^
(India) (Quest Global(Singapore)
MlndfireSolutions
(India)
SpanSystems
(India) ґ)Xchanging
(UK)
CoMakelt A _iln d ia i
AspireSystems(India)
/irtusa(USA)
Vanceinfo-(China)
" Sonata Software
(India)
" ЕРАМ(USA)
ε8Φ
<e 2 φ -
5 Ss iΟ E c o » - 3O reS, «2 8 0) s z > — O re0 ·5 2V - CX3
1 =o<0
d)Φ,
Niche
Expansive
Emerging Established
• The distinction between services and manufacturing has come to be seen increasingly asredundant. The notion of service encapsulation of goods and materials is useful for under-standing how services are increasingly incorporated into manufactured products.
• Major forces that drive the growth of services include rising per capita incomes; growingdemand for healthcare and educational services; an increasingly complex division of labor;the growing size and role of the public sector; increasing international trade in services;and the rapid growth in outsourcing service functions.
• Service outsourcing involves not only potential drawbacks but also potential benefits forthe developed countries and the less developed countries.
• There are significant constraints—related to technology and infrastructure; education andtraining; government regulations and policies; and corporate strategies—that can limit thegrowth of services and prevent certain LDCs from capturing some of the service outsourcingmarket, especially for IT-enabled services.
• In 2006 for the first time, worldwide employment in services as a percentage of totalemployment increased to 40 percent, surpassing the percentage in agriculture.
• The percentage of workers employed in services is uneven among different parts of the world.The developed countries have almost three-fourths of their workforce in services; followedby Latin America and the Caribbean with nearly two-thirds; and the central and easternEuropean countries, Russia, and the Middle East and North Africa with more than halftheir workers in services. The remaining regions of the world have only between just overone-fourth and one-third of their workers in services.
• There is significant variation in the percentage of workers employed in services among theLDCs. LDCs including Peru and Argentina, as well as many in the Middle East, includingJordan, Saudi Arabia, and Israel, have 75 percent or more of their workers in services. WhileHong Kong and Singapore also have more than 75 percent, India and China are only atabout 30 percent. Many countries in Sub-Saharan Africa are below 50 percent.
• LDCs including India and Indonesia have seen relatively high rates of growth in services.Nevertheless, the United States has the highest production of services; followed by Japan,China, Germany, France, the United Kingdom, Italy, and Brazil, ahead of Canada, Spain,India, Australia, the Russian Federation, Mexico, South Korea, and the Netherlands.
• World service exports have risen to more than US$4,000 billion or 20 percent of totalmerchandise and service exports each year. The United States, United Kingdom, Germany,and France together account for almost one-third of world service exports.
• The structure of foreign direct investment has shifted toward services. The developedcountries account for the largest shares of FDI in greenfield services projects.
• Export processing zones (EPZs) are increasingly being used to attract investment in export-oriented services by the LDCs.
• High value-added services, using skilled labor and tacit forms of knowledge, are highlyagglomerated in world cities. In contrast, relatively low value-added service functions, suchas back offices, call centers, and offshore banks, are increasingly dispersed to low wageLDCs.
• As the world’s largest retailers such as Wal-Mart have been expanding into foreign markets,they have been internationalizing their supply networks. Their buyer-driven commoditychains create opportunities and drawbacks for suppliers in the LDCs. E-shopping has addedan additional dimension to retailing that does not involve traditional shopping venues.
• International tourism reached an all-time high of more than 1 billion international tripsannually. Although tourism can provide a basis for economic development in many LDCs,
SPATIAL TRANSFORMATION OF CORE AND PERIPHERY348
6063 GEOGRAPHY WORLD ECON_PT_246x189 mm 22/01/2014 15:11 Page 348
it is often a mixed blessing. In contrast, ecotourism can offer a more sustainable strategyfor economic development in some LDCs.
• The internationalization of finance has created opportunities and challenges for the LDCsin terms of the operation of transnational banks and FDI in financial services, the continueddominance of London, New York, and Tokyo over foreign exchange transactions despitethe increasing use of electronic money, and the concentration of offshore banking centersin the LDCs.
• The internationalization of business services in terms of IT and business process outsourcingwas begun by U.S. TNCs. The kinds of service activities involved now include not only call centers, computer network support, legal services, accounting, and procurement, butalso software development, research and development, and engineering services. Majoroutsourcing destinations for BPO in the LDCs include India, the Philippines, and China.
KEY SOURCES AND SUGGESTED READINGAmiti, M. and Wei, S.-J., 2005. Fear of Service Outsourcing: Is it justified?, Economic Policy 42, 307–347.
(http://www.oecd.org/dataoecd/44/24/35333668.pdf)Bryson, J.R., Daniels, P.W., and Warf, B., 2004. Service Worlds: People, organizations, technologies.
London and New York: Routledge.CRIC, 2006. Innovation in Services. CRIC Briefing No. 2. Manchester: Centre for Research on Innovation
and Competition, University of Manchester.Cuadrado-Roura, J.R., Rubalcaba-Bermejo, L., and Bryson, J.R. (eds.), 2002. Trading Services in the
Global Economy. Cheltenham: Edward Elgar.Daniels, P.W. and Bryson, J.R., 2002. Manufacturing Services and Servicing Manufacturing: Knowledge-
based cities and changing forms of production, Urban Studies 39, 977–991.Economist, 2013. The Post-Industrial Future is Nigh, Economist February 19.Gereffi, G. and Christian, M., 2009. The Impacts of Wal-Mart: The rise and consequences of the world’s
dominant retailer, Annual Review of Sociology 35, 573–591.Karmarkar, U., 2004. Will you Survive the Services Revolution?, Harvard Business Review June, 82(6),
101–107.Stutz, F.P. and Warf, B., 2012. The World Economy: Geography, business and development, 6th edn.
Upper Saddle River, NJ: Pearson Education.Tickell, A., 1999, 2001, 2002. Progress in Human Geography [progress reports on the geography of
services]. Vol. 23: 633–639, Vol. 25: 283–292, Vol. 26: 791–801.UNCTAD, 2004. World Investment Report 2004: The shift towards services. New York and Geneva:
United Nations.
11. SERVICES: GOING GLOBAL? 349
6063 GEOGRAPHY WORLD ECON_PT_246x189 mm 22/01/2014 15:11 Page 349

6063 GEOGRAPHY WORLD ECON_PT_246x189 mm 22/01/2014 15:11 Page 350
This page intentionally left blank
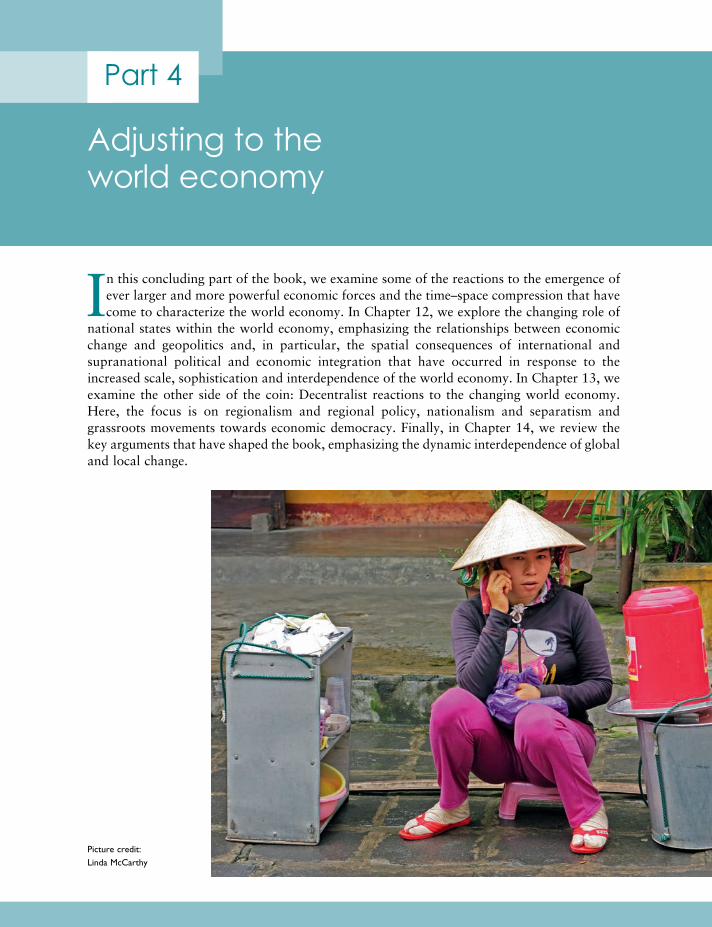
Part 4
Adjusting to the world economy
Picture credit: Linda McCarthy
In this concluding part of the book, we examine some of the reactions to the emergence ofever larger and more powerful economic forces and the time–space compression that havecome to characterize the world economy. In Chapter 12, we explore the changing role of
national states within the world economy, emphasizing the relationships between economicchange and geopolitics and, in particular, the spatial consequences of international andsupranational political and economic integration that have occurred in response to theincreased scale, sophistication and interdependence of the world economy. In Chapter 13, weexamine the other side of the coin: Decentralist reactions to the changing world economy.Here, the focus is on regionalism and regional policy, nationalism and separatism andgrassroots movements towards economic democracy. Finally, in Chapter 14, we review thekey arguments that have shaped the book, emphasizing the dynamic interdependence of globaland local change.
6063 GEOGRAPHY WORLD ECON_PT_246x189 mm 22/01/2014 15:11 Page 351

6063 GEOGRAPHY WORLD ECON_PT_246x189 mm 22/01/2014 15:11 Page 352
This page intentionally left blank
In this chapter, we return to the theme of the relationship between economic developmentand the role of the state. As Parts 2 and 3 have shown, nation-states have been crucial,both in the struggle for domination over the world economy within the core and as peripheral
and semi-peripheral economies have struggled to reduce their dependency on core economies.As the world economy has become more and more globalized, however, nation-states through -out the world economy have had to explore cooperative strategies involving international andsupranational (trading bloc) political and economic integration of various kinds. This chapteroutlines the rationale for these strategies, describes the scope of the major international andsupranational organizations and illustrates some of the more important spatial implicationsof international and supranational institutionalized integration. Arguably the most successfulof the attempts at supranational integration, the European Union, receives the most detailedexamination in this chapter simply because its impacts on the world economy have been thegreatest. Although it should be borne in mind that international institutions regulating trade,such as the World Trade Organization (WTO), have also become increasingly important ifless visible arbiters of the global economic integration process. This is why we also examinethe WTO in some detail.
12.1 ECONOMIC CHANGE AND GEOPOLITICSIn order to understand the emergence of international and supranational organizations, wemust first remind ourselves of the shifting economic and geopolitical foundations of the worldeconomy since the Second World War. In the aftermath of the war, the capitalist world economywas reordered as a more open system. It was a system without the economic barriers of thetrading empires that had been set up in the years previously. Instead, it was based on freemarket capitalism with stable monetary relations and rapidly diminishing barriers to trade.This required, first of all, an orderly world, internally peaceful and secure from outside threats.Second, it required leadership in providing and furthering mechanisms for establishing a stable
Picture credit: © European Community, 2013
Chapter 12
Internationalandsupranationalinstitutionalizedintegration
6063 GEOGRAPHY WORLD ECON_PT_246x189 mm 22/01/2014 15:11 Page 353
reserve standard for international currency exchange rates and for ensuring access to worldtrade markets. The one state that could provide military order—the United States—was alsothe only state economically strong enough to impose order on the economic system. The Sovietworld empire had turned inward in its attempt to restructure its economy and society alongdifferent ideological lines, but its existence was extremely important because (until its dissolu-tion in 1991) it served to mobilize an ideological reaction—anti-communism—that providedboth an economic stimulus and political solidarity within the core economies.
In short, the world economy was characterized by the hegemony of the United States. UnderU.S. hegemony, as we saw in Chapter 5, the world economy came to be characterized byFordism, the socioeconomic system that links mass production with mass consumption. A tensebut durable relationship among big business, big labor, and big government enabled Fordismto provide the basis for the long postwar boom and unprecedented rise in living standardsthroughout much of the capitalist world. This boom was also crucially dependent on the massiveexpansion of world trade and international investment flows made possible under the umbrellaof U.S. financial and military power. Following the Bretton Woods Agreement of 1944 thatmade the U.S. dollar the world’s reserve currency (see p. 54), Fordism was implanted in Europeand Japan, either directly, during the occupation phase, or indirectly, through the MarshallPlan and foreign direct investment (FDI) by U.S. companies. The consequent opening up offoreign trade, observes Harvey (1988: 4):
[P]ermitted surplus productive capacity (and potentially surplus labor reserves) to be absorbed inthe United States, while the progress of Fordism internationally meant the formation of globalmass markets and the absorption of the mass of the world’s population, outside the communistworld, into the global dynamics of a new kind of capitalism . . . At the input end, the opening upof foreign trade meant the globalization of supply and often ever cheaper raw material. This newinternationalism also brought a host of other activities in its wake—banking, insurance, hotels,airports, and, ultimately, tourism. It also meant a new international culture and a new global systemof gathering and evaluating information.
The immediate postwar period (1947–1960) saw, therefore, the rise of a series ofindustries—automobiles, steel, petrochemicals, rubber, etc.—that acted as the propulsiveengines of economic growth, coordinated through the collective powers of big labor, bigbusiness, and big government. And out of this there arose a series of grand production regionsin the world economy—the Midwest of the United States, the West Midlands of Britain, theRuhr in West Germany and the Tokyo-Yokohama production region in Japan—managed fromworldwide financial, and governmental centers such as New York and London and reachingout to dominate an increasingly homogeneous world market.
The logic of Fordist production also fostered, as we have seen (Chapter 6), transnationalcorporations (TNCs) with the capacity to move capital and technology rapidly from place to place, drawing opportunistically on resources, labor markets, and consumer markets indifferent parts of the world. TNCs have now gone far beyond the point where they can beseen simply as extensions of a specific national economy; and even some small firms have nowacquired both the capability and the propensity to operate globally. The significance of thisis that, although private companies are by no means absolute masters of their own fate, theydo have the ability (as compared with governmental units) to redefine their commitments andobjectives in response to the changing opportunities presented by the globalization of the worldeconomy.
ADJUSTING TO THE WORLD ECONOMY354
6063 GEOGRAPHY WORLD ECON_PT_246x189 mm 22/01/2014 15:11 Page 354
Within this context of political and economic interdependence, regional and internationalshifts in economic and political power began to occur, as we saw in Chapters 5 and 6: Shiftsthat the policies of particular governments seemed powerless to prevent by normal means.The ascent of the NIEs has brought a new dimension to the world economy and effectivelycreated a new hierarchical geopolitical system. Meanwhile, as the regional influence of NIEshas grown, so they have come to exert an independent effect on the landscapes of the world’score economies:
None has had a greater political/psychological effect on the major powers than the omnipresenceof persons, symbols and signs in Europe’s great cities, and in such American cities as New York,Miami, New Orleans and Los Angeles. In Europe, billboards advertising Asian, African and LatinAmerican Airlines, store signs in Arabic script, national airline offices and ethnic food restaurantsfrom three continents, a plethora of Arabic-language newspapers displayed prominently in kiosksand, above all, the businessman, tourist, shopper, student and adolescent youth from these newly-powerful countries demonstrate that the world has changed. They have joined the overseassymbols of American power—the Hilton, the Holiday Inn, Hertz, Avis, ESSO, Mobil, IBM, theEnglish-language newspaper, the American bar and restaurant, and the tourist, student andbusinessman—to share the landscape of sight, sound and taste with Americans.
(Cohen, 1982: 227)
In the core economies, meanwhile, the prosperity associated with Fordism had been replacedby uncertainty, destabilization and crisis resulting from the conjunction of an extended episodeof stagflation associated with the declining performance of many businesses at the same timethat labor was increasingly militant (1965–1979) and the 1973 OPEC oil embargo. This creatednational economic management problems that could not be solved without accelerating theinflation that had undermined the role of the U.S. dollar as the international reserve currency.
As a consequence, the role and relative power of nation-states began to change significantly.Economic circumstances reduced the ability of governments to deliver full employment as wellas a full range of welfare services; and the growth of the global financial system blunted thepower of individual countries to pursue independent fiscal and monetary policies with any degreeof success. In particular, the United States had to struggle hard to maintain its hegemony, runninga mounting trade deficit and an enormous public debt and having persistently to devalue thedollar in order to maintain competitiveness with Japan and Germany.
In the decentralized, restructured and consolidated world economy that emerged in the 1980s,new communications technologies, new forms of corporate organization, and new businessservices were intensifying time–space compression, decreasing the time horizons of both publicand private decision making and making it easier to spread those decisions over an ever widerspace. As we saw in Chapter 7, one result has been the acceleration of shifts in the patterningof uneven development as more flexible corporate organization and flexible production systemshave been able to quickly exploit particular local mixes of skills and resources. Another outcomeis that local governments are being forced to be much more competitive with one another asthey attempt not only to protect their economic base during a time of upheaval and transition,but also to identify and exploit some competitive edge with which to lure the newly flexibleflows of finance and production. This intergovernmental competition has bred so-called entre -preneurial cities, whose governments have been drawn beyond questions of tax policies,infrastructure provision, and service delivery to explore public/private partnerships, fosterfavorable business climates and initiate controls on labor through contract negotiations withmunicipal workers.
12. INTERNATIONAL AND SUPRANATIONAL INSTITUTIONALIZED INTEGRATION 355
6063 GEOGRAPHY WORLD ECON_PT_246x189 mm 22/01/2014 15:11 Page 355
12.2 INTERNATIONAL AND SUPRANATIONAL INSTITUTIONALINTEGRATION
It is within this changing economic and geopolitical context that we have to see the variousattempts to adjust to the world economy through strategies of international and supranationaleconomic and political integration. We should nevertheless remember that, as Parts 2 and 3of this book have shown, the dominant processes in both intra-core rivalry and in the struggleby the semi-periphery and periphery to escape from dependency have been dominated by conflictand competition. Economic nationalism, whether drawing on practical examples (for example,eighteenth-century Britain and nineteenth- and twentieth-century Japan; see Chapters 5 and10 respectively), political ideology (for example, Juan Péron in Argentina and Getúlio Vargasin Brazil in the 1940s and 1950s) or development theory (for example, the import substitutionindustrialization espoused by Raoul Prebisch), continues to dominate global economics andgeopolitics.
Having acknowledged this, however, we must also recognize the long-term trend amongthe world’s national economies towards the progressive integration and interdependence oflocal, regional, and national economic systems. What has happened is that the logic of theworld economy has in many ways transcended the scale of nation-states. The logic andapparatus of statehood are not conducive to international and supranational integration,economic or political; but the outcomes of flexible production have forced many states to explorecooperative strategies of various kinds. As a result, the world’s economic landscapes now bearthe imprint, in a variety of ways, of international and supranational economic and politicalintegration.
THE LOGIC OF INTEGRATION
The increased scale, sophistication, and interdependence of the world economy would not havebeen feasible were it not for the fact that new technologies and new forms of corporateorganization gradually made it possible to conquer several of the frictions that tend to operateagainst hierarchical flows of production and consumption. In addition to the obvious—forgeographers—friction of distance itself, these include the frictions associated with spatialvariations in social organization and culture. As railroads, the telegraph, automobiles, aircraft,computer networks, satellite communications systems, and fiber optics have successively“shrunk” the globe, Fordist principles of mass production have brought about a convergenceof patterns of social organization and radio and television have undermined local and regionalcultures and replaced them with an international culture characterized by the language andartifacts of consumerism: American Express, Benetton, Burger King, Coca-Cola, Gucci, LauraAshley, Marlboro, Mercedes Benz, MTV, Rolex, Sony, Visa, and so on.
The framework of nation-states, however, is a source of friction that has persisted. Themain reason for this, of course, is that the functional logic of statehood hinges on reinforcingdifferences between nations while reinforcing similarities within nations. In order to establishthe required feelings of common identity, even the oldest states have had to engage in theprocess of creating and diffusing a distinctive identity. Much of the ideology and symbolismof nation-states in Europe, for example, has centered on the systematic mythologizing of history,reinforced by the stereotyping of outsiders. One very important outcome of this was the jingoismand xenophobia that set the context for the First World War, nurtured the ambitions of theGerman Third Reich, and hampered postwar attempts to establish common economic andlegal frameworks.
ADJUSTING TO THE WORLD ECONOMY356
6063 GEOGRAPHY WORLD ECON_PT_246x189 mm 22/01/2014 15:11 Page 356
Among the more explicit functions of nation-states that have contributed to the frictionsaffecting the world economy are those relating to national security and the promotion of homo-geneous internal standards and conditions. The latter include controlling fiscal and monetarypolicy, upholding labor contracts, establishing standards for everything from education to ballbearings, and overseeing key industries such as telecommunications.
Once a significant amount of economic activity had spilled beyond national boundaries,however, countries had to confront the need to rethink these activities in order not to becomeisolated or to become even more vulnerable to underdevelopment. In short, it was theinternational trade system that provided the major impetus for countries to be drawn intovarious forms of institutionalized integration. For core countries, the objective was primarilyto protect and consolidate existing advantages through increased international security, access to wider markets, investment opportunities, and labor markets. For peripheral and semi-peripheral countries, the objective was primarily to minimize or reduce dependency throughharnessing more resources and more investment potential. In addition, most countries wereable to subscribe, in public at least, to the more lofty ideals of good international relationsand a more equitable international economic order.
The particular advantages of formalized international and supranational integration include:
1 potential for economies of scale, particularly for the smallest countries and the weakestnational economies
2 potential for creating multiplier effects from the existence of enlarged markets3 potential for strengthening regional interaction by easing the movement of labor, goods
and capital.
The particular disadvantages of formalized international and supranational integrationinclude:
1 potential loss of national sovereignty over a broad spectrum of issues2 potential for the intensification of internal inequalities as a wider geographical context makes
for more pronounced processes of uneven development.
TYPES AND LEVELS OF INTEGRATION
Figure 12.1 summarizes the “where” of international and supranational economic integrationsince 1945. In practice, integration can be pursued in a variety of ways and at different levels.It can be formal, involving an institutionalized set of rules and procedures (for example, UnitedNations, European Union (EU, formerly the European Community or EC), General Agreementon Tariffs and Trade (GATT), reorganized in 1995 as the World Trade Organization (WTO));or informal, involving coalitions of interests (UN voting blocs). It can be international,involving attempts to foster integration between countries (North Atlantic Treaty Organization(NATO); the African Union (AU), formerly the Organization of African Unity (OAU); theWorld Trade Organization (WTO)); or supranational, involving a commitment to aninstitutionalized body with certain powers over member states (EU). It can be economicallyoriented (WTO, the North American Free Trade Agreement (NAFTA)), strategic (NATO),political (UN voting blocs), sociocultural (United Nations Educational, Scientific and CulturalOrganization (UNESCO)), or mixed (EU, AU) in orientation. We distinguish all theseinstitutions from, for example, the IMF and World Bank, which are not oriented so muchtowards encouraging integration among states as to regulating state macroeconomic policies
12. INTERNATIONAL AND SUPRANATIONAL INSTITUTIONALIZED INTEGRATION 357
6063 GEOGRAPHY WORLD ECON_PT_246x189 mm 22/01/2014 15:11 Page 357
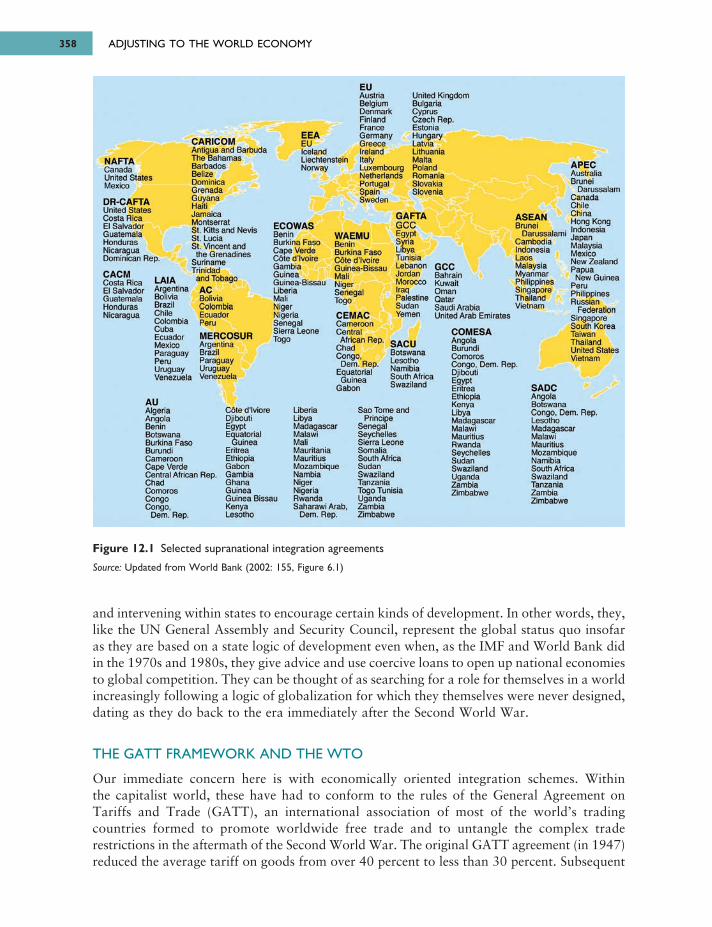
ADJUSTING TO THE WORLD ECONOMY358
and intervening within states to encourage certain kinds of development. In other words, they,like the UN General Assembly and Security Council, represent the global status quo insofaras they are based on a state logic of development even when, as the IMF and World Bank didin the 1970s and 1980s, they give advice and use coercive loans to open up national economiesto global competition. They can be thought of as searching for a role for themselves in a worldincreasingly following a logic of globalization for which they themselves were never designed,dating as they do back to the era immediately after the Second World War.
THE GATT FRAMEWORK AND THE WTO
Our immediate concern here is with economically oriented integration schemes. Within the capitalist world, these have had to conform to the rules of the General Agreement on Tariffs and Trade (GATT), an international association of most of the world’s tradingcountries formed to promote worldwide free trade and to untangle the complex traderestrictions in the aftermath of the Second World War. The original GATT agreement (in 1947)reduced the average tariff on goods from over 40 percent to less than 30 percent. Subsequent
Figure 12.1 Selected supranational integration agreements
Source: Updated from World Bank (2002: 155, Figure 6.1)
6063 GEOGRAPHY WORLD ECON_PT_246x189 mm 22/01/2014 15:11 Page 358
NAFTACanada United States Mexico
CARICOMAntigua and Barbude The Bahamas Barbados Belize Dominica Grenada Guyana Haiti Jamaica Montserrat St. Kitts and Nevis St. Lucia St. Vincent and
the Grenadines Suriname Trinidad
and Tobago
EEAEUIcelandLiechtensteirNorway
EUAustriaBelgiumDenmarkFinlandFranceGermanyGreeceIrelandItalyLuxembourgNetherlandsPortugalSpainSweden
United KingdomBulgariaCyprusCzech Rep.EstoniaHungaryLatviaLithuaniaMaltaPolandRomaniaSlovakiaSlovenia
DR-CAFTAUnited States Costa Rica El Salvador Guatemala Honduras Nicaragua Dominican Rep.
CACMCosta Rica El Salvador Guatemala Honduras Nicaragua
LAIAArgentinaBoliviaBrazilChileColombiaCubaEcuadorMexicoParaguayPeruUruguayVenezuela
ACBoliviaColombiaEcuadorPeru
MERCOSURArgentinaBrazilParaguayUruguayVenezuela
ECOWASBeninBurkina Faso Cape Verde C0te d'Ivoire Gambia GuineaGuinea-BissauLiberiaMaliNigerNigeriaSenegalSierra LeoneTogo
WAEMUBeninBurkina FascCote d ’IvoireGuinea-BissjMaliNigerSenegalTogo
CEMACCameroon Central
African Rep Chad Congo,
Dem. Rep. Equatorial
Cauinea Gabon
GAFTAGCCEgyplSyriaLibyaTunisiaLebanon GCCJordan BahrainMorocco KuwaitIraq OmanPalestine QatarSudan Saudi ArabiaYemen United Arab Emirates
ASEANBrunei
DarussalamiCambodiaIndonesiaLaosMalaysiaMyanmarPhilippinesSingaporeThailandVietnam
APECAustralia Brunei
Darussalam Canada Chile China Hong Kong
- Indonesia Japan Malaysia Mexico New Zealand Papua
New Guinea PeruPhilippines Russian
Federation Singapore South Korea Taiwan Thailand United States Vietnam
SADCAngolaBotswanaCongo, Dem. Rep.LesothoMadagascarMalawiMauritiusMozambiqueNamibiaSouth AfricaSwazilandTanzaniaZambiaZimbabwe
COMESAAngolaBurundiComorosCongo, Dem. Rep.DjiboutiEgyptEritreaEthiopiaKenyaLibyaMadagascarMalawiMauritiusRwandaSeychellesSudanSwazilandUgandaZambiaZimbabwe
SACUBotswana Lesotho Namibia South Africa Swaziland
AUAlgeriaAngolaBeninBotswanaBurkina FasoBurundiCameroonCape VerdeCentral African Rep.ChadComorosCongoCongo,
Dem. Rep.
C6te d’lviore Djibouti
.EquatorialGuinea
EritreaEthiopiaGabonGambiaGhanaGuineaGuinea BissauKenyaLesotho
LiberiaLibyaMadagascarMalawiMaliMauritania Mauritius Mozambique Nambia Niger Nigeria Rwanda Saharawi Arab
Dem. Rep.
Sao Tome and Principe
Senegal Seychelles Sierra Leone Somalia South Africa Sudan Swaziland Tanzania Togo Tunisia Uganda Zambia Zimbabwe
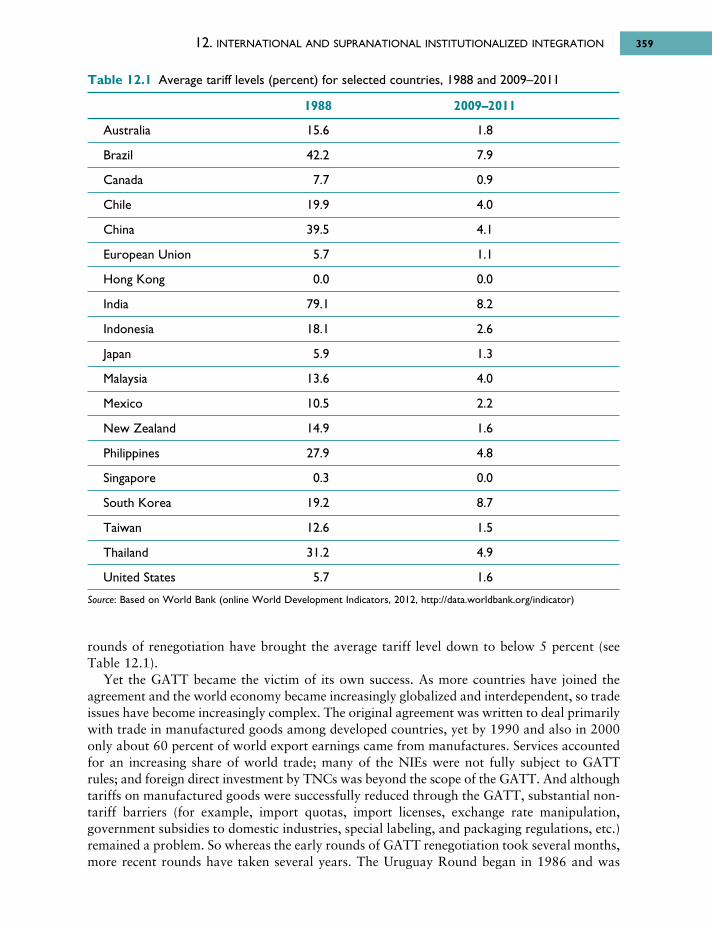
rounds of renegotiation have brought the average tariff level down to below 5 percent (seeTable 12.1).
Yet the GATT became the victim of its own success. As more countries have joined theagreement and the world economy became increasingly globalized and interdependent, so tradeissues have become increasingly complex. The original agreement was written to deal primarilywith trade in manufactured goods among developed countries, yet by 1990 and also in 2000only about 60 percent of world export earnings came from manufactures. Services accountedfor an increasing share of world trade; many of the NIEs were not fully subject to GATTrules; and foreign direct investment by TNCs was beyond the scope of the GATT. And althoughtariffs on manufactured goods were successfully reduced through the GATT, substantial non-tariff barriers (for example, import quotas, import licenses, exchange rate manipulation,government subsidies to domestic industries, special labeling, and packaging regulations, etc.)remained a problem. So whereas the early rounds of GATT renegotiation took several months,more recent rounds have taken several years. The Uruguay Round began in 1986 and was
12. INTERNATIONAL AND SUPRANATIONAL INSTITUTIONALIZED INTEGRATION 359
Table 12.1 Average tariff levels (percent) for selected countries, 1988 and 2009–2011
1988 2009–2011
Australia 15.6 1.8
Brazil 42.2 7.9
Canada 7.7 0.9
Chile 19.9 4.0
China 39.5 4.1
European Union 5.7 1.1
Hong Kong 0.0 0.0
India 79.1 8.2
Indonesia 18.1 2.6
Japan 5.9 1.3
Malaysia 13.6 4.0
Mexico 10.5 2.2
New Zealand 14.9 1.6
Philippines 27.9 4.8
Singapore 0.3 0.0
South Korea 19.2 8.7
Taiwan 12.6 1.5
Thailand 31.2 4.9
United States 5.7 1.6
Source: Based on World Bank (online World Development Indicators, 2012, http://data.worldbank.org/indicator)
6063 GEOGRAPHY WORLD ECON_PT_246x189 mm 22/01/2014 15:11 Page 359
not concluded until December 1993. The chief obstacle was disagreement between the UnitedStates and the European Union over nontariff barriers in the form of various subsidies that both were paying to their farmers. The most recent Doha Round has so far achieved very little indeed, with major divisions once more between the USA and the EU over trade inservices as well as agricultural goods and increasing hostility towards the GATT/WTO processfrom many of the world’s poorer countries whose primary products continue to be excludedfrom most core country markets by exclusionary tariffs and other restraints on trade. Increased membership and the movement of debate into areas of trade such as services andagriculture long given the status of “national priorities” by many rich countries suggest thatthe WTO may be coming up against its political limits. For example, unable to persuade theU.S. delegation to cut its incredibly high subsidies to American farmers, the Indian commerceminister spent much of his time at the WTO’s Doha Round of talks in July 2006 watchingthe soccer World Cup.
The crowning achievement of the Uruguay Round in 1993 was the creation of the WorldTrade Organization (WTO) in 1995 as a replacement for the GATT (which had become labeledby wags as the “General Agreement to Talk and Talk”). Whereas the GATT had little abilityto enforce its decisions, the WTO is a global body with both judicial and regulatory power.Its framework is a series of lengthy agreements that extend beyond trade in manufacturedgoods to cover investment, services and intellectual property rights. In the words of theorganization’s former director-general, Renato Ruggiero, the WTO “is writing the constitutionof a single global economy.” A significant step towards this was taken in February 1997 whenthe 68 original members of the WTO signed an agreement to free up their markets tointernational competition in telecommunications. By January 2013 the WTO had amembership of 159 countries, including China and Russia, with a waiting list of 24 others.Whether the “constitution” Ruggiero refers to is worth the paper it is written on remains tobe seen.
Many of the WTO’s agreements are derived from GATT rulings, including the provisionthat each member state shall extend most-favored-nation (MFN) treatment to all othermember countries. (So if, say, the USA were to lower its import duty on textile products fromCanada, it would immediately have to extend that same reduced rate to every other WTOmember.) There is, however, an exception to this principle for free trade associations andcustoms unions, members of which may reduce their tariffs against one another withoutextending such concessions to remaining WTO members. It is this exception that has providedthe basis for regional economic integration within the world economy. To proponents of globalfree trade it is precisely this exclusion that encourages the substitution of bilateral and regionaltrading agreements for the multilateral ones that they see as the key to continued globalization.They worry that trading blocs are forming that will merely scale up protectionism from thenational to the supranational level.
INSTITUTIONAL FORMS OF SUPRANATIONAL INTEGRATION
Supranational integration can take a number of different forms. In practice, some of these arealso more or less successful in meeting their objectives. As yet many types of integration arerelatively limited in both membership and efficacy. In a free trade association, membercountries eliminate tariff and quota barriers to trade from other member states, but eachindividual member continues to charge its regular duties on materials and products comingfrom outside the association. Membership of the European Free Trade Association (EFTA)dwindled to Iceland, Liechtenstein, Norway, and Switzerland when six of the original members
ADJUSTING TO THE WORLD ECONOMY360
6063 GEOGRAPHY WORLD ECON_PT_246x189 mm 22/01/2014 15:11 Page 360
left to join the EU (Austria, Denmark, Finland, Portugal, Sweden, and the United Kingdom)(see Figure 12.1). The Southern African Development Community (SADC) countries signed afree trade agreement in 2000.
Meanwhile, Canada, Mexico, and the United States, with over 443 million consumers today,established a trading zone in 1994 with the completion of the North American Free TradeAgreement (NAFTA). This was not only an unprecedented economic integration of corecountries and a semi-peripheral country but also the first instrument of economic integrationto liberalize trade in services. Since the establishment of NAFTA, trade and investmentbetween Canada, Mexico, and the USA has steadily increased. NAFTA’s phasing out of tariffsand other trade and investment barriers between these countries over 15 years is leading to areorganization of the economic geography of North America. Many labor-intensive manu -facturing jobs have already been switched from Canada and the USA to Mexico; while theexpanding Mexican market is now open to the kinds of product and service in which the USAand Canada have a competitive advantage, such as high-technology products, tele communi -cations, and financial services. Eventually, there will be total access in agricultural markets,which will rewrite the agricultural geography of Mexico and significantly modify agriculturalpatterns in the southwestern United States. The expected eventual expansion southwards ofNAFTA to include countries such as Argentina, Brazil, Chile, Colombia, Paraguay, Peru,Uruguay, and Venezuela will lead to a further reorganization of the economic geography ofthese countries. Currently, however, this possibility meets with considerable opposition inCentral and South America not least because the terms of trade are seen to favor U.S.businesses over local business and labor.
A customs union also involves the elimination of tariffs between member states, but has acommon protective wall against non-members, as in the case of the Southern African CustomsUnion (SACU). Where, in addition, internal restrictions on the movement of capital, goods,labor and enterprise are removed, the result is a common market. Most customs unions have gone at least some way towards common market status. Examples include the CentralAmerican Common Market (CACM), the Southern Cone Common Market (or MercadoComún Sudamericano (MERCOSUR)), the Andean Common Market (ANCOM) of theAndean Community (AC) (formerly the Andean Pact), the Caribbean Community andCommon Market (CARICOM), the Gulf Cooperation Council (GCC), the EconomicCommunity of West African States (ECOWAS), and the Common Market for Eastern andSouthern Africa (COMESA). The Arab Free Trade Area (AFTA) is considered an importantstep towards the ultimate goal of an Arab Common Market (Figure 12.1).
A still higher form of integration is the economic union, which, in addition to thecharacteristics of a common market, provides for integrated economic policies among memberstates. The members of WAEMU (the West African Economic and Monetary Union), forexample, have moved some way towards economic union with their shared single currencyand monetary policy. The Economic and Monetary Community of Central Africa (Com munautéÉconomique et Monétaire de l’Afrique Centrale (CEMAC)) also share a single currency.
The highest form of integration possible involves some form of supranational political union,with a single monetary system and a central bank, a unified fiscal system, a common foreigneconomic policy and a supranational authority with executive, judicial and legislative branches.Except for the supranational political union of the EU, however, free trade associations andcommon markets have found it difficult to overcome the obstacles imposed by membershipsthat include countries at very different levels of development and that involve enormousdistances and poorly developed transportation networks. It was in response to such problemsthat the GATT authorized, in 1971, the waiver of the Article I most-favored-nation (MFN)
12. INTERNATIONAL AND SUPRANATIONAL INSTITUTIONALIZED INTEGRATION 361
6063 GEOGRAPHY WORLD ECON_PT_246x189 mm 22/01/2014 15:11 Page 361
provision for LDCs offering concessions to other LDCs. As a result, Mexico, for example,could offer to reduce its duty on a product from Bolivia without having to extend the samelower rate to the USA. The GATT decision meant that LDCs were free to experiment with avariety of integration models without incorporating internal free trade as a legally bindingobligation. The result has been the emergence of a series of trade preference associations suchas the Association of Southeast Asian Nations (ASEAN) and the Latin American IntegrationAssociation (LAIA).
The increasing globalization of the world economy has broadened and deepened the trendtowards regional economic integration. In 1989, for example, the ASEAN countries joinedwith Australia, Canada, China, Hong Kong, Japan, New Zealand, South Korea, Taiwan, andthe United States to form the Asia Pacific Economic Cooperation group (APEC), with theobjective of promoting the liberalization of trade and promoting cooperation in trade andinvestment around the Pacific Rim. APEC members have reduced or eliminated some tradeand investment barriers as part of voluntary efforts in response to the 1994 Bogor Declaration(written by the Second Informal APEC Economic Leaders Meeting in Indonesia) and theInformation and Technology Agreement that came out of the 1996 WTO MinisterialConference in Singapore. But, so far, that is about it. In 1992 EFTA and the European Union agreed to establish a unified free trade zone, the European Economic Area (EEA), which has a combined market size today of over 495 million people. (The EEA took effect on January 1, 1993, without the Swiss, whose electorate voted against the agreement.) (SeeFigure 12.1.)
12.3 SPATIAL OUTCOMES OF ECONOMIC INTEGRATIONIt follows from the basic principles of economic geography that the enlargement of marketsand the removal of artificial barriers to trade will result in a realignment of patterns of economicactivity. Two main sets of effects can, in fact, be anticipated. The first relates to patterns oftrade. With international integration, the removal of trade barriers should lead to a morepronounced spatial division of labor, with each region in the larger association tending tospecialize in those activities in which it has the greatest comparative advantage. In effect,production is thereby reallocated from high- to low-cost settings and a great deal of trade isgenerated within the association. At the same time, lower costs can, theoretically, be passedon to consumers, which contributes to improved levels of living. These effects of integrationare generally referred to as trade creation effects.
Countries that do not belong to the association, however, tend to lose trade: The externaltariff wall prevents them from competing effectively with higher cost internal producers whoseoutput is able to circulate duty free within the association. To the extent that the old sourcesof supply were more efficient producers than the new ones, trade diversion will have takenplace, with the result that consumption is shifted away from lower cost external sources tohigher cost internal sources, consumers have to pay more for certain goods and levels of livingmay be depressed.
The extent to which trade creation might outweigh trade diversion depends on several factors,including the degree to which the range of goods produced in member states overlap and thedegree of pre-integration reliance on trade with countries outside the association. If integrationis successful in the long run in creating trade and accelerating economic growth, it is possiblethat consequent increases in demand for goods and raw materials will generate spread effects,which create a positive spillover effect for other economies.
ADJUSTING TO THE WORLD ECONOMY362
6063 GEOGRAPHY WORLD ECON_PT_246x189 mm 22/01/2014 15:11 Page 362
The second set of effects relates to patterns of regional development. Because of the needto exploit new patterns of competitive advantage, a certain amount of relocation of productionmust take place, with related activities tending to cluster together in the most efficient settings.The corollary is the disinvestments that take place as production is withdrawn from less effi-cient locations. Given the logic of cumulative causation, the net effect in terms of regionaldevelopment within the association will clearly be a tendency for spatial polarization as a resultof backwash effects. Because of the political dimension inherent to integration, this in turnprovides a powerful case for a strong regional policy.
Meanwhile, integration can also be expected to precipitate other changes in patterns ofregional development. A reorganization of patterns of production may occur where changesin patterns of comparative advantage are not sufficient to write off past investment or to promptrelocation, but are sufficient to justify intra-industry specialization. Steel-producing regions,for example, may come to specialize in certain kinds of steel product rather than producinga broad spectrum of steel products for a domestic national market; or agricultural regionsmay move from mixed farming to a more specialized set of outputs.
Another important consequence of integration is the stimulus that is provided for foreigndirect investment. Excluded by high external tariff barriers, foreign suppliers are likely to seekto open branch plants inside the association in order to get access to its market. If successful,this not only makes for a drain of capital when profits are repatriated, it also makes for adegree of external control of some local labor markets. Finally, we must consider theimplications of integration for patterns of regional development outside the association. Themost striking effects in this context will be those related to the dislocations experienced byspecialized regions whose exports are no longer competitive within the protected market ofthe association.
These same principles and tendencies mean that we should expect integration to reinforcethe dominant core–periphery patterns in the world’s economic landscapes at the macro scale.Patterns of trade between core economies, for instance, are already so strong that integrationis able to draw on a good deal of momentum. At the same time, it is relatively easy for corestates to meet the political, social and cultural prerequisites for successful economic integration.These include:
• similarity in the power of units joining the association• complementarity of élite value systems• existence of pluralistic power structures in member countries• positive perceptions concerning (a) the expected equity of the distribution of benefits from
integration and (b) the magnitude of the costs of integration• compatibility of states’ decision-making styles• adaptability, administrative capacity, and flexibility of member states’ governments and
bureaucracies.
The success of the European Union has dramatized how effective integration between corestates can be. Between 1959 and 1971 trade between the six original members—Belgium,France, Italy, Luxembourg, the Netherlands, and the former West Germany—increased nearlysixfold; by 2000 the expanded Union of 15 countries accounted for one-fifth of all world trade,excluding intra-Union trade. In 2000 the EU was the world’s largest exporter of goods andthe second largest importer, after the USA. The EU was the largest importer of commercialservices and the second largest exporter, again, after the USA. The enlargement of the EU in2004 to include a set of semi-peripheral economies in eastern and southern Europe, however,
12. INTERNATIONAL AND SUPRANATIONAL INSTITUTIONALIZED INTEGRATION 363
6063 GEOGRAPHY WORLD ECON_PT_246x189 mm 22/01/2014 15:11 Page 363
has set the organization on a different course. These ten countries (plus the addition of Bulgariaand Romania in 2007) all have much lower standards of living than the previous 15 members,many of them were until recently Soviet-style economies and all have serious economichandicaps of one sort or another (political corruption, lack of legal transparency, outdatedheavy industries, etc.). But just as the EU helped the economic growth of new members inprior rounds of enlargement, perhaps most notably Spain, Portugal, and Greece in their day,so too it will this time with a much larger group of new members. From one viewpoint,enlargement has been the most successful policy of the EU. Politically, its promise has stabil-ized states while they have been in transition from authoritarian rule and it has offered a broad range of potential economic benefits to countries whose economic growth has long lagged behind their potential, measured in terms of educational levels, adjacency to centers of economic growth, and technological sophistication. From another perspective, however,enlargement has undermined the process of “deepening” the central institutions of the EU bymaking them more transparent and accountable to the people already under the umbrella ofthe EU. The failure of Dutch and French referendums on a new European constitution in 2005can at least, in part, be put down to fears of further expansion to include Turkey and countriesin the western Balkans from which new immigrants might come, countries that are even moreeconomically underdeveloped than most countries included in the recent enlargements.
In the case of peripheral economies, by the same token, patterns of trade offer little realisticscope for the reallocation of output following the removal of trade barriers in trade preferenceorganizations, common markets, or free trade associations. As we have seen (Chapters 2, 9,and 10), most peripheral countries produce primary commodities that are exported to the coreeconomies rather than to each other and most are so short of capital that even pooled resourcesare likely to be insufficient to trigger economies of scale of sufficient magnitude to be able tobreak free from their functional dependency on trade with core economies. Experience hasshown, meanwhile, that it is difficult for peripheral and even semi-peripheral states to meetthe political, social, and cultural preconditions for successful economic integration. Of course,the EU experiment in eastward enlargement and NAFTA suggest that collaboration across thecore–semi-periphery divide can meet with some success. How great this is overall and whowins and who loses is something else again. The political strength of the EU and theredistributive policies this currently allows indicates that this may be the difference betweenthese two cases. NAFTA has undoubtedly failed to solve the most pressing of Mexico’s economicproblems—providing sufficient new jobs for its growing population—and so one of its maingoals, to reduce illegal immigration into the United States, remains unfulfilled. U.S. investmenthas never compensated for the loss of Mexican investment because of the removal of protectivetariffs and increased competition from China in many of its previously most successfulmanufacturing sectors. Indeed, total manufacturing employment in Mexico has declined since2000, suggesting that rather than helping Mexican development NAFTA has actuallyundermined it.
Some efforts at regional integration solely among semi-peripheral states suggest that simplysigning up to the organization is never going to be enough to make them a success. ASEAN,for example, despite having generated a growing sense of regional identity, has been unableto progress beyond a preliminary stage of economic regionalism during the last three decades.Regional projects such as the Asian Highway and the Mekong Basin Project have been dis -cussed and only tentative national responsibilities and commitments planned. In the early 1990sASEAN began working towards the introduction of the ASEAN Free Trade Area (AFTA) and the share of intra-ASEAN trade rose from 20 to almost 25 percent of total trade as tradein electrical appliances and machinery, mineral products, and chemicals increased. A large
ADJUSTING TO THE WORLD ECONOMY364
6063 GEOGRAPHY WORLD ECON_PT_246x189 mm 22/01/2014 15:11 Page 364
proportion of intra-ASEAN trade, however, is accounted for by exports that are transshippedthrough Singapore with only marginal value added by processing or packaging. A significantobstacle to significant intra-ASEAN trade growth is that these economies are more comple -mentary to those of Japan, the United States and Europe than they are to one another: ASEANitself cannot absorb all the primary commodities it produces and it is still dependent on thecore economies for capital, technology, and many consumer goods.
Consequently, as the ASEAN countries have struggled to recover from the Asian financialcrisis in the late 1990s, a hot topic of discussion has been increased East Asian trade, not onlywith Japan, but also with countries such as China and South Korea. But ASEAN’s continuedcommitment to a policy of non-interference in the affairs of other members and to decision-by-consensus continues to hinder progress. Until the political relationship between Japan andthe rest of Asia, reflecting the failure of Japanese governments to come to terms with theircountry’s imperial past in Asia, and the increasing military power of China are explicitlyaddressed, little progress in “deepening” ASEAN can be expected. This indicates the degreeto which successful economic integration has to have at least minimal political foundations.
Even less successful than ASEAN as an example of supranational integration has been theAndean Pact, whose efforts at moving beyond the initial agreement between member stateshave been truly half-hearted. Members have been unwilling to build integration into their owneconomic planning and policymaking and have been unable to reach agreement about theharmonization of policies with regard to foreign trade, industrial development, or fiscalaffairs. Although some progress has been made at diplomatic levels (on pronouncements infavor of human rights in Nicaragua, for instance) and some increase had been achieved inabsolute levels of intra-market trade, the negative effects of spatial and socioeconomicpolarization, particularly in Bolivia and Ecuador, have led to tensions. Meanwhile, there havebeen virtually no positive effects in terms of the promotion of new sectors of production orthe strengthening of existing regions of production. As a result, the import substitution modelwas abandoned and the Andean Community (AC) replaced the Andean Pact in 1997. Beginningwith the establishment of an executive body, council of presidents and council of foreignministers, the AC is moving towards a common market and, in theory, eventually to asupranational political union modeled on the European Union with a parliament directly electedby the more than 96 million citizens of its four member countries, despite the exit of Venezuela(Figure 12.1).
One important response to the problems of development, trade and regional integrationwithin the LDCs has been the so-called north–south dialogue. The most important platformfor this dialogue has been the United Nations Conference on Trade and Development(UNCTAD), launched in Geneva in 1964. By the end of the Geneva meetings, a degree ofpolitical solidarity had emerged among LDCs. Under the banner of the Group of 77 they issueda declaration:
The unity [of the developing countries in UNCTAD] has sprung out of the fact that facing thebasic problems of development they have a common interest in a new policy for internationaltrade and development. The developing countries have a strong conviction that there is a vitalneed to maintain, and further strengthen, this unity in the years ahead. It is an indispensableinstrument for securing the adoption of new attitudes and new approaches in the internationaleconomic field.
The Group of 77, which now has more than 130 members, has succeeded in articulatingdemands for a “new international economic order” (not to be confused with the new
12. INTERNATIONAL AND SUPRANATIONAL INSTITUTIONALIZED INTEGRATION 365
6063 GEOGRAPHY WORLD ECON_PT_246x189 mm 22/01/2014 15:11 Page 365
international division of labor). Central to the new order envisioned by the Group of 77 aredemands for fundamental changes in the marketing conditions of world trade in primarycommodities. These changes would require a variety of measures, including price andproduction agreements among producer countries, the creation of international buffer stocksof commodities financed by a common fund, multilateral long-term supply contracts and theindexing of prices of primary commodities against the price of manufactured goods. Suchchanges have been at the center of discussions in a series of UNCTAD conferences, specialsessions of the United Nations General Assembly, meetings of a specially convened Conferenceon International Economic Cooperation and successive meetings of the heads of state of theBritish Commonwealth. Throughout these discussions, however, the core countries in general,and the United States in particular, have been reluctant to do more than agree to generalstatements about the desirability of a new international economic order. As a result, Williams’observation (G. Williams, 1981: 99) remains true, that “the New International Economic Orderis still a dream.”
In practice, therefore, there have been two dominant sets of spatial outcomes of internationaland supranational economic integration. One has simply been the reinforcement of thedominant core–periphery structure of the world economy because of the relative success ofeconomic integration between core states. The second has been the imprint of this success onparticular regions. This imprint can be discerned: (1) in terms of the effects of trade creation,trade diversion, spatial polarization, regional policy and sociospatial tensions within core-basedassociations such as the EU, and (2) in terms of the dislocations experienced subsequently bynon-member states. In the remainder of this chapter we illustrate the importance and com -plexity of the second of these sets of spatial outcomes—the consequences of the success ofeconomic integration between core states—using the example of the European Union.
THE IMPRINT OF THE EUROPEAN UNION
The European Union had its origins in pragmatic responses to the changed economic climateof postwar Europe. The main objective was to recapture the core status within the worldeconomy that Europe had forfeited as a result of the war. But there was also a more idealisticimpulse to bind countries together so that the wars that had so bitterly divided Europe in thetwentieth century would never reoccur. This political motivation is important because it haslong made the EU more than simply a supranational economic organization. Although therewas a good deal of popular concern over the dominance of U.S.-based TNCs in Europe’spostwar economic recovery, the crux of the problem was that the center of technologicaladvance had moved to the United States. As a result, “The real challenge was to ensure thatEurope did not remain dependent on imported capital goods and that it began to generate itsown research so as to pre-empt the United States in any future technological cycle ofproduction” (George, 1991: 59).
The European Community (now European Union) was formed in 1957 by an amalgamationof three institutions that had been set up in the 1950s in order to promote progressive economicintegration along particular lines for six countries (Belgium, France, West Germany, Italy,Luxembourg, and the Netherlands): Euratom, the European Coal and Steel Community(ECSC) and the European Economic Community (EEC). This amalgamation fostered therecovery of core status:
[B]y providing favorable conditions for multinational investment, so bringing jobs and prosperityback to Europe; by encouraging the emergence of European multinationals that had cultural reasons
ADJUSTING TO THE WORLD ECONOMY366
6063 GEOGRAPHY WORLD ECON_PT_246x189 mm 22/01/2014 15:11 Page 366
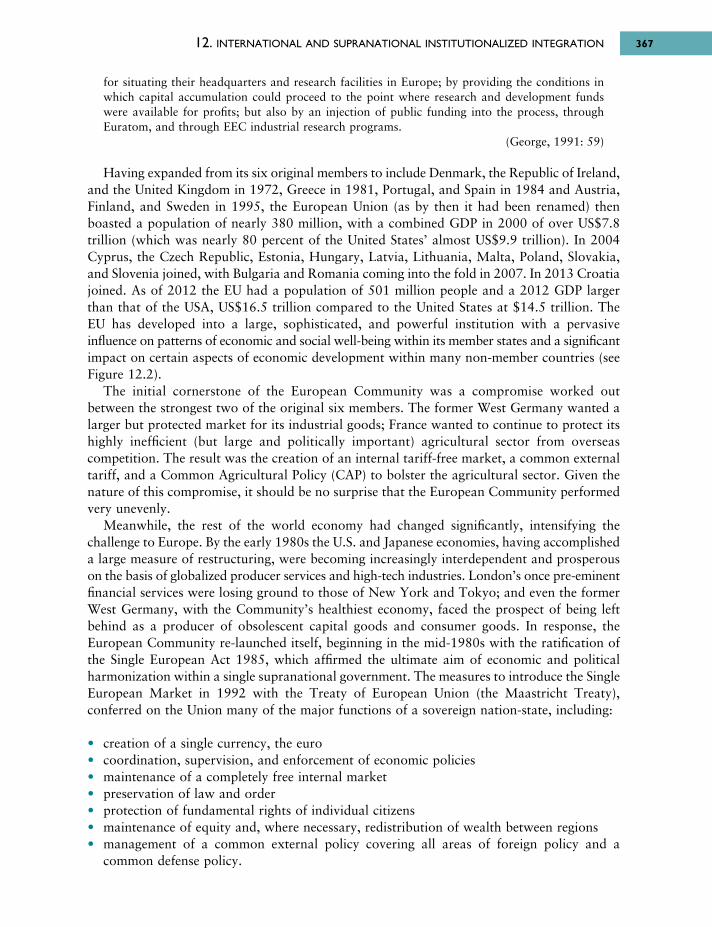
12. INTERNATIONAL AND SUPRANATIONAL INSTITUTIONALIZED INTEGRATION 367
for situating their headquarters and research facilities in Europe; by providing the conditions inwhich capital accumulation could proceed to the point where research and development fundswere available for profits; but also by an injection of public funding into the process, throughEuratom, and through EEC industrial research programs.
(George, 1991: 59)
Having expanded from its six original members to include Denmark, the Republic of Ireland,and the United Kingdom in 1972, Greece in 1981, Portugal, and Spain in 1984 and Austria,Finland, and Sweden in 1995, the European Union (as by then it had been renamed) thenboasted a population of nearly 380 million, with a combined GDP in 2000 of over US$7.8trillion (which was nearly 80 percent of the United States’ almost US$9.9 trillion). In 2004Cyprus, the Czech Republic, Estonia, Hungary, Latvia, Lithuania, Malta, Poland, Slovakia,and Slovenia joined, with Bulgaria and Romania coming into the fold in 2007. In 2013 Croatiajoined. As of 2012 the EU had a population of 501 million people and a 2012 GDP largerthan that of the USA, US$16.5 trillion compared to the United States at $14.5 trillion. TheEU has developed into a large, sophisticated, and powerful institution with a pervasiveinfluence on patterns of economic and social well-being within its member states and a significantimpact on certain aspects of economic development within many non-member countries (seeFigure 12.2).
The initial cornerstone of the European Community was a compromise worked out between the strongest two of the original six members. The former West Germany wanted alarger but protected market for its industrial goods; France wanted to continue to protect itshighly inefficient (but large and politically important) agricultural sector from overseascompetition. The result was the creation of an internal tariff-free market, a common externaltariff, and a Common Agricultural Policy (CAP) to bolster the agricultural sector. Given thenature of this compromise, it should be no surprise that the European Community performedvery unevenly.
Meanwhile, the rest of the world economy had changed significantly, intensifying thechallenge to Europe. By the early 1980s the U.S. and Japanese economies, having accomplisheda large measure of restructuring, were becoming increasingly interdependent and prosperouson the basis of globalized producer services and high-tech industries. London’s once pre-eminentfinancial services were losing ground to those of New York and Tokyo; and even the formerWest Germany, with the Community’s healthiest economy, faced the prospect of being leftbehind as a producer of obsolescent capital goods and consumer goods. In response, theEuropean Community re-launched itself, beginning in the mid-1980s with the ratification ofthe Single European Act 1985, which affirmed the ultimate aim of economic and politicalharmonization within a single supranational government. The measures to introduce the SingleEuropean Market in 1992 with the Treaty of European Union (the Maastricht Treaty),conferred on the Union many of the major functions of a sovereign nation-state, including:
• creation of a single currency, the euro• coordination, supervision, and enforcement of economic policies• maintenance of a completely free internal market• preservation of law and order• protection of fundamental rights of individual citizens• maintenance of equity and, where necessary, redistribution of wealth between regions• management of a common external policy covering all areas of foreign policy and a
common defense policy.
6063 GEOGRAPHY WORLD ECON_PT_246x189 mm 22/01/2014 15:11 Page 367
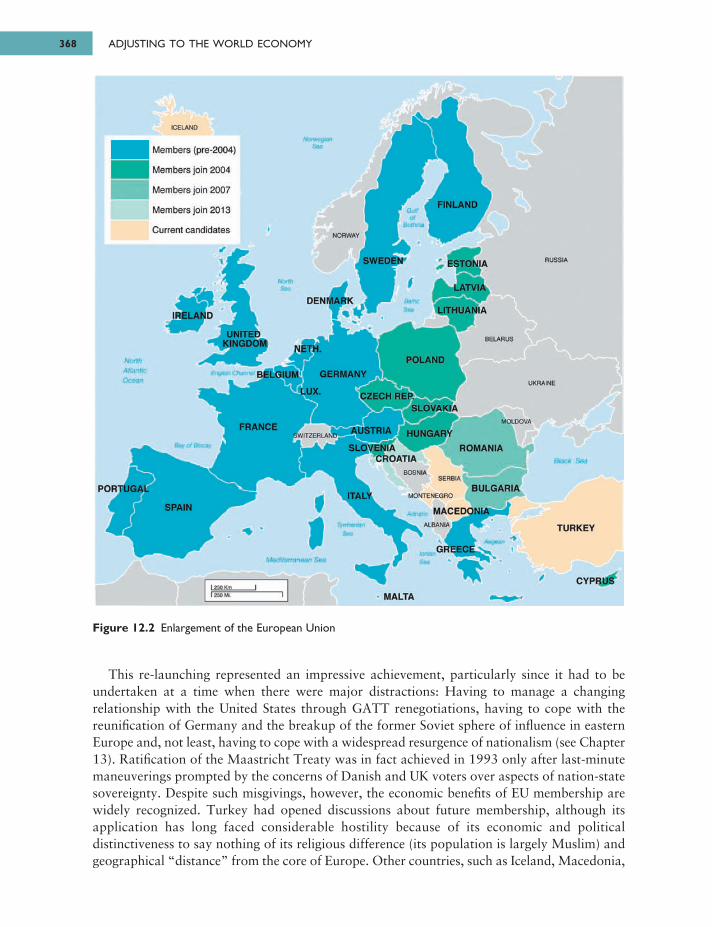
This re-launching represented an impressive achievement, particularly since it had to beundertaken at a time when there were major distractions: Having to manage a changingrelationship with the United States through GATT renegotiations, having to cope with thereunification of Germany and the breakup of the former Soviet sphere of influence in easternEurope and, not least, having to cope with a widespread resurgence of nationalism (see Chapter13). Ratification of the Maastricht Treaty was in fact achieved in 1993 only after last-minutemaneuverings prompted by the concerns of Danish and UK voters over aspects of nation-statesovereignty. Despite such misgivings, however, the economic benefits of EU membership arewidely recognized. Turkey had opened discussions about future membership, although itsapplication has long faced considerable hostility because of its economic and politicaldistinctiveness to say nothing of its religious difference (its population is largely Muslim) andgeographical “distance” from the core of Europe. Other countries, such as Iceland, Macedonia,
ADJUSTING TO THE WORLD ECONOMY368
Figure 12.2 Enlargement of the European Union
6063 GEOGRAPHY WORLD ECON_PT_246x189 mm 22/01/2014 15:11 Page 368
ICELAND
Members (pre-2004)
Members join 2004
Members join 2007
Members join 2013
Current candidates
IRELAND
N a t tA tla n ticOcean
BELGIUM
DENMARK
FINLAND
ESTONIA
LITHUANIA
POLAND
GERMANY
LUX
FRANCE
CZECH REP.SLOVAKIA
AUSTRIA
SLOVENIACROATIA
ROMANIA
BULG ARIA
TURKEY
CYPRUS
GREECE
MALTA
MACEDONIA
ITALYPORTUGAL
SPAIN
BELARUS
RUSSIA
NORWAY
SWITZERLAND;.
UKRAINE
MOLDOVA
Black S mFVYtNIIA
SERBIA
MONTENEGRO
ALBANIA!
Ktoditorranman S m
B *r o f Bacay
EnatM i CIMtKMl
MurffiSm
ВШПСSot
a t 1 BoWn· j
NonmgmnSot
Montenegro, and Serbia are also in the queue for membership at some time in the future.Among existing member states there is something of an “enlargement fatigue” particularlyassociated with incorporating 12 new members during 2004–2007, the failure to make muchprogress on making the European Commission in Brussels (the main bureaucracy of the EU)more responsive to public opinion or representative of the varying population size of thedifferent member states as the organization expands in membership and the increasingly liberaland less redistributive policies pursued in recent years that seem to augur, at least for somepeople, the specter of increased uneven development within the EU as businesses from richareas search out opportunities such as lower wages and standards of living in the poorer areas.Western contracts and investment have undoubtedly flooded into Eastern Europe. The biggestfuel for this boom has been wage costs that are typically still half that of western levels. Atthe same time there is also concern that membership is also increasingly à la carte with somemembers committed to all EU policies whereas others continue to opt out on such key issuesas a common currency (for example, Britain, Sweden) and common immigration and travelrules (for example, Britain). The common currency (now covering 17 member states) has madeit impossible for member governments to use monetary policies such as devaluations and interestrate shifts to manipulate their economies but it has boosted trade among them, if less thanoriginally envisaged. The fact that the countries that opted out of the euro—Britain, Denmarkand Sweden—have seen equivalent gains to within-EU trade suggests that in the future manyone-size-fits-all policies may face increasing pressure for opt-outs from member states.
For its part, the euro entered into a long crisis in the immediate aftermath of the globalfinancial crisis that began in 2007. The European Central Bank was faced with a run on thesovereign bonds of some Eurozone countries (Ireland, Greece, Spain, Portugal, and Cyprus)whose banks had taken on massive debts and whose general economic conditions haddeteriorated as the banking crisis took a toll on national finances. This persisting crisis, alliedto a perception that the EU could only survive the crisis through further institutional integrationsuch that fiscal and monetary policies could be managed together, had led by 2013 toincreasing hostility towards the EU from both previous enthusiasts for the project and itsnationalist enemies across member states.
TRADE CREATION AND DIVERSION
The economic benefits of membership were soon felt in the years after the EC’s creation. Evenby 1970, trade between member countries was 40–50 percent higher, overall, than it wouldhave been had the Community not been formed; by 1980 the figure had risen to a gain ofbetween 100 and 125 percent. While many trade liberalization measures to implement theSingle European Market in 1992 have still to take full effect, the most recent analyses by the EU indicate an increase in intra-EU trade of 4 to 5 percent in 1994, for example, due to the Single Market. The net benefits of these increases are far from clear, however, since itis generally acknowledged that the overall increase in intra-Union trade has been the productof a high degree both of trade creation and of trade diversion. While it is very difficult toisolate the effects of Union membership from other effects, such as TNC activity, overallincreases in intra-Union competition and trade have generated economies of scale for EUproducers; these have, in turn, stimulated further competition and trade, accelerated changesin industrial structure and corporate organizations and brought about efficiency gains in bothimporting and exporting countries. Owen (1983) estimated that these economic benefits couldbe more than half as great as the value of trade itself.
12. INTERNATIONAL AND SUPRANATIONAL INSTITUTIONALIZED INTEGRATION 369
6063 GEOGRAPHY WORLD ECON_PT_246x189 mm 22/01/2014 15:11 Page 369
SPATIAL POLARIZATION
It is also clear that these benefits have been associated with a significant amount of regionalchange within the Union, although once again it is difficult to isolate the effects of supra-national political union from others. In overall terms, the removal of internal barriers to labor,capital and trade has worked to the clear disadvantage of peripheral regions within memberstates and in particular to the disadvantage of those furthest from the European core (see Figure5.3) that is increasingly the “center of gravity” in terms of both production and consumption.At the same time, integration has accelerated and extended the processes of concentration andcentralization, creating structural as well as spatial inequalities. As Holland (1980: 8) put it:
[T]he market of the Community is essentially a capitalist market, uncommon and unequal in therecord of who gains what, where, why and when. Its mechanisms have already disintegrated majorindustries and regions in the Community and threaten to realize an inner and outer Europe of richand poor countries.
Slower growing member states with economies dominated by inefficient primary ormanufacturing industries are, in short, in danger of remaining problem regions within aprosperous EU. Evidence on trends in personal incomes supports this prognosis. Clusters ofricher and poorer member states are identifiable in terms of per capita income relative to theEU average. At the top end of the range, with above average incomes, are Austria, Belgium,Denmark, France, Germany, Italy, Luxembourg, the Netherlands, and Sweden. Just below theaverage are Finland, Ireland, and the United Kingdom, although the UK’s position has fallenduring the last 15 years while Ireland’s has risen. Per capita incomes in Spain, Portugal, andGreece, not to mention most of the most recent new members, have remained consistentlywell below the EU average. Of course, variations in income persist among the regions withineach member country, such as between the richer north and poorer south of Italy (see Figure7.8). Indeed, the enlargement of the EU to include a large number of countries in eastern Europewhose GDPs are much lower than the EU average is rewriting the pattern of spatial polarizationwithin the EU.
EFFECTS OF THE COMMON AGRICULTURAL POLICY (CAP)
The most striking changes in the regional geography of the EU, however, have been thoserelated to the operation of the CAP. It is the CAP that dominates the EU budget. For a longtime, it accounted for more than 70 percent of the EU’s total expenditures, and it still accountsfor more than 40 percent. Its operation has had a significant impact on rural economies, rurallandscapes, and rural levels of living and has even influenced urban living through its effectson food prices.
The basis of the CAP was a system of support for farmers’ incomes that was operated throughthe artificial support of wholesale prices for agricultural produce. While motivated mainly bypolitical considerations, the CAP provided a relatively risk-free environment in whichinvestment for farm modernization could be encouraged. At the same time, stable, guaranteedprices provided security and continuity of food supplies for consumers. Assured markets alsoallowed trends in product specialization and concentration by farm, region, and country toproceed at a faster rate than might otherwise have occurred, as Bowler (1985) showed in hissurvey of the geography of agriculture under the CAP. Not all products have been subject toCAP support, however. While regions specializing in crops and livestock subject to priceguarantees, intervention, and market regulation have been able to intensify their specialization,other regions have been subject to Union-wide competition.
ADJUSTING TO THE WORLD ECONOMY370
6063 GEOGRAPHY WORLD ECON_PT_246x189 mm 22/01/2014 15:11 Page 370
The overall result has been a realignment of production patterns, with a general withdrawalfrom mixed farming. Ireland, the United Kingdom, and Denmark, for example, have increasedtheir specialization in the production of wheat, barley, poultry, and milk; while France andGermany have increased their specialization in the production of barley, maize, and sugar beet.It is at regional and sub-regional scales that these changes have been most striking. CAP supportfor oilseeds, for example, made rapeseed a profitable break crop in cereal-producing regionsof the United Kingdom, with the bright yellow flowers of the crop bringing a remarkable changeto the summer landscapes of the countryside.
However, the reorganization of Europe’s agricultural geography under the CAP alsobrought some unwanted side-effects:
1. Environmental problems occurred because of the speed and scale of modernization,combined with farmers’ desire to capitalize on generous levels of guaranteed prices for arablecrops. In particular, moorlands, woodlands, wetlands, and hedgerows have come underthreat and some “vernacular” landscapes of small farms have been replaced by the prairie-style settings of specialized agribusiness.
2. Another serious problem with geographical implications concerns the large surplusesfostered by the price support system. These “mountains” of beef, butter, wheat, sugar, andmilk powder and “lakes” of olive oil and wine had to be sold off at a loss to neighboringcountries, dumped on world markets, donated as famine relief, or “denatured” (renderedunfit for human consumption) at a considerable cost.
3. A third set of problems arose from the income transfers caused by CAP policies. Price supportmechanisms involve a transfer of income from taxpayers to producers and from consumersto producers. There is plenty of evidence to show that these transfers are regressive withinmember countries and inequitable between them. Expenditure on food generally accountsfor a larger proportion of disposable income in poorer households than in better offhouseholds. Producers, contrariwise, benefit from price support policies in proportion totheir total production, so that the larger and more prosperous farmers receive a dispro -portionate share of the benefits. Spatial inequity arises because countries or regions thatare major producers of price-supported products receive the major share of the benefitswhile the costs of price support are shared among member states according to the overallsize of their agricultural sector. Furthermore, the CAP pricing system made no concessionsfor a long time to the variety of agricultural systems practiced on farms of different sizesand in different regions. As a result, areas with particularly large and/or intensive or special -ized farm units (such as northern France and the Netherlands) benefited most, together withregions specializing in the most strongly supported crops (cereals, sugar beet and dairyproducts). Effectively, this has meant that the most prosperous agricultural regions havebenefited most from the CAP, so that farm income differentials within member countrieshave been maintained, if not reinforced.
4. In addition to all this, the budgetary cost of the CAP escalated. By 1983 budgetary problemshad become acute; but reform of the CAP was hampered by domestic political considerationsin member countries that were the biggest beneficiaries of the CAP. The CAP became asource of serious disharmony, particularly in the United Kingdom, where, before EUmembership, food policies had been progressive, subsidizing lower income households.Embracing the CAP meant a higher and regressive system of food prices without anycompensatory benefits: Peasant farming and inefficient agricultural practices had beenpurged from the UK economy long before.
12. INTERNATIONAL AND SUPRANATIONAL INSTITUTIONALIZED INTEGRATION 371
6063 GEOGRAPHY WORLD ECON_PT_246x189 mm 22/01/2014 15:11 Page 371
Meanwhile, EC agricultural subsidies had become a serious issue in GATT and WTOnegotiations; and the re-launch of the EC/EU in the mid-1980s required a more open andcompetitive approach to internal markets in every sector, including agriculture. Together withincreasing awareness of the unwanted side-effects of the CAP, these considerations have ledto ongoing reforms of the CAP. Since 1992 the guaranteed prices that farmers receive for arablecrops, beef, dairy, and wine products have been cut gradually. To offset the lower guaranteedprices, direct payments to farmers have been increased, but the member states are nowallowed to target these payments to achieve specific national or regional production priorities.
REGIONAL POLICY
The United Kingdom’s accession to the Community in 1972 highlighted the lop-sidedness ofCommunity policy in favor of rural interests compared with those of industrial areas. Althoughthe Community had effectively operated regional policies through the ECSC and the EuropeanInvestment Bank (EIB) for some time, there had been no comprehensive, coordinatedframework within which to operate. The ECSC was limited to the “re-adaptation” of workersand the “conversion” of local economies in depressed coalmining and steel-producing regions.The EIB was a Community banking system designed to reduce intra-Community disparitiesin economic development by disbursing loans to selected projects in priority regions; butalthough it was particularly influential in sponsoring projects in marginal, cross-border regions,it was simply not equipped to deal with the casualties of regional economic restructuring withinan expanding common market.
The entry of the United Kingdom to the Community not only made for a significant increasein the scope and intensity of regional restructuring processes but also brought a legacy of chronicregional problems and, with them, a certain political resolve. Following an examination ofthe issues (Commission of the European Communities, Thompson Report, 1973), theCommunity launched the structural funds in 1975 with a relatively modest budget.
The addition of Portugal and Spain to the Community in 1984 changed both the natureand intensity of regional problems. The proportion of the EC population living in “leastfavored” regions (those where gross domestic product was under half the EC average) doubled,with most of the increase being accounted for by depressed rural regions. At the same time,the re-launch of the EC, with more open internal markets, brought the probability of intensifiedspatial polarization. This was recognized by the Single European Act (SEA), which raised“economic and social cohesion” to the status of a new policy objective within the Community.The SEA doubled the funding—in real terms—for regional development assistance from thestructural funds (from 7 billion European currency units (ECUs) to 14 billion ECUs at 1988prices). This was further reinforced by the budget for 1993–1997 (the so-called Delors IIPackage), which contained a real increase of 30 percent in the European Union’s budget,including 10 billion ECUs over five years for a cohesion fund to help Greece, Ireland, Portugal,and Spain achieve comparable levels of economic development to the rest of the EU by financingtransportation and environmental infrastructure projects. By 2000 the structural fundsaccounted for 35 percent of the overall EU budget.
Meanwhile, the re-launch of the Union, the reform of the CAP and the accessions of 15new members between 1995 and 2007 (Figure 12.2) provided the impetus for ongoing reformsof EU regional policy objectives. There are now three priority objectives to guide thedisbursement of regional development assistance grants from the structural and cohesion fundsbetween 2007 and 2013, as follows:
ADJUSTING TO THE WORLD ECONOMY372
6063 GEOGRAPHY WORLD ECON_PT_246x189 mm 22/01/2014 15:11 Page 372
12. INTERNATIONAL AND SUPRANATIONAL INSTITUTIONALIZED INTEGRATION 373
• Convergence: To promote the development of the most disadvantaged regions (with a GDPper capita less than 75 percent of the EU average) whose development is lagging behind(equivalent to the previous Objective 1 regions).
• Regional competitiveness and employment: To strengthen the competitiveness, employmentand attractiveness of selected regions (other than those which are the most disadvantaged).
• European territorial cooperation: To strengthen cross-border and interregional cooperation(based on the previous INTERREG initiative).
A number of funds address these priority objectives. The structural funds comprise theEuropean Regional Development Fund (ERDF), which supports productive investmentincluding transportation and communications infrastructure, and the European Social Fund(ESF), which supports education and training. The cohesion fund is intended to reduce socialand economic disparities. The convergence and regional competitiveness and employmentobjectives have an explicit regional dimension (see Figure 12.3).
These policies clearly represent a serious response to the spatial implications of economicintegration. It is difficult to assess how effective they can be in redressing the regionalrestructuring and spatial polarization that have accompanied the creation and enlargement ofthe European Union. Yet it is debatable whether regional policies can, in fact, do so, particularlysince the new reach and flexibility of TNCs can exploit cost advantages elsewhere in the worldthat the EU structural funds could never hope to match. What is clear, however, is that thefunds are not always put to use. For the period 2000–2006, percentages actually used variedfrom 48 percent in Portugal to only 16 percent in the Netherlands. Within countries, usagealso varies, seemingly in line with administrative capacity.
EXTERNAL EFFECTS OF THE EU
Meanwhile, the scale of the EU and its maintenance of a strongly protectionist agriculturalpolicy, as well as a protected EU market, have inevitably had a significant impact on non-member countries: Diverting trade and creating complex new layers of interdependence.Much of this complexity relates to the “pyramid of privilege” that has arisen from the EU’strade agreements with different groups of non-member countries. At the base of the pyramidis a generalized system of preferences negotiated through UNCTAD. This allows access to theEU market for a broad range of products from LDCs. Bilateral trade agreements also existwith some countries as a result of attempts by the EU to extend and diversify its trading patterns.The most favorable trading privileges are extended to a large group of countries in Africa, theCaribbean, and the Pacific (the ACP states), most of them former colonial territories of memberstates. Originally established as the Youndé Convention in 1963 and later extended at LoméConventions in 1975 and 1979, these privileges allow access to the EU market for tropicalagricultural products without having to provide reciprocal privileges to EU members orabandon trading agreements with other LDCs. They also involve an export revenue stabiliza -tion scheme—STABEX—that covers nearly 50 key primary products and raw materials.
In detail, the mechanics of these privileges are complex and it is very difficult to assess theirimpact on patterns of trade and development. It is clear, however, that the “privileges” extendedto non-members are essentially designed to enhance the position of the EU rather than tocontribute to a “new international economic order.” “Sensitive” products (specifically thosethat compete directly with EU agricultural and industrial products), for example, are excludedfrom preferential treatment or are subject to seasonal restrictions. Moreover, the net effect of
6063 GEOGRAPHY WORLD ECON_PT_246x189 mm 22/01/2014 15:11 Page 373
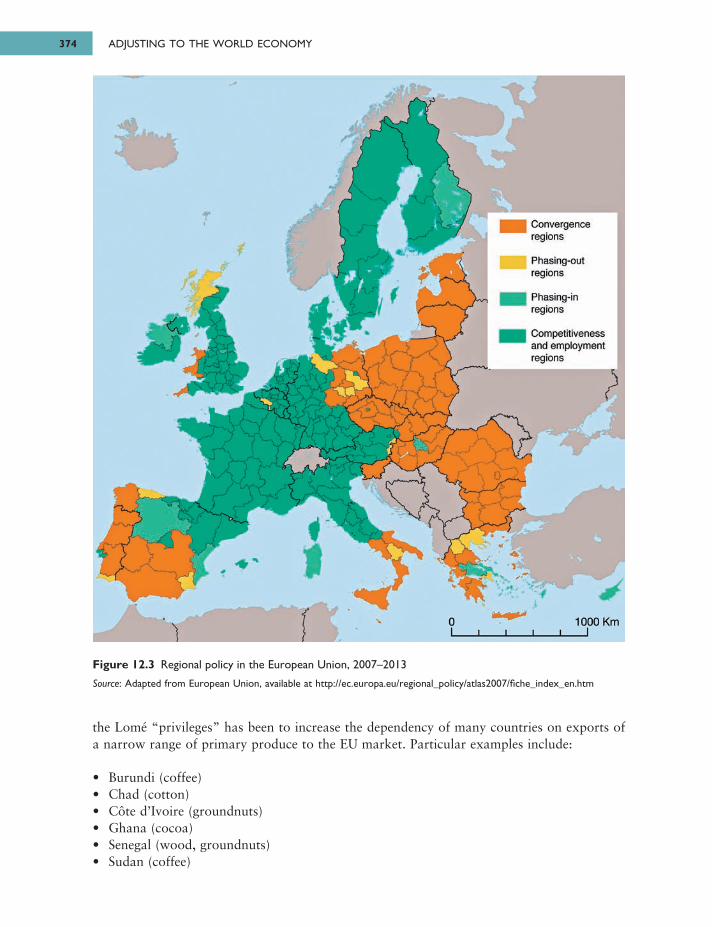
the Lomé “privileges” has been to increase the dependency of many countries on exports ofa narrow range of primary produce to the EU market. Particular examples include:
• Burundi (coffee)• Chad (cotton)• Côte d’Ivoire (groundnuts)• Ghana (cocoa)• Senegal (wood, groundnuts)• Sudan (coffee)
ADJUSTING TO THE WORLD ECONOMY374
Figure 12.3 Regional policy in the European Union, 2007–2013
Source: Adapted from European Union, available at http://ec.europa.eu/regional_policy/atlas2007/fiche_index_en.htm
6063 GEOGRAPHY WORLD ECON_PT_246x189 mm 22/01/2014 15:11 Page 374
Convergenceregions
Phasing-outregions
I Phasing-in regions
I Competitiveness and employment regions
0 1000 Km
• Tonga (copra)• Uganda (coffee).
As a result, EU relations with ACP countries have been interpreted as neo-imperialist, effectivelyextending the core–periphery structure of the world economy.
It is not only peripheral countries that have been affected by the EU, however. The EUrepresents an outcome of the struggle for economic power within the core and to preservepower in relation to the semi-periphery as much as it is an attempt to consolidate power inrelation to the periphery. EU trade relations with the United States have been fractious, whilethe EU has been forced to mount a “diplomatic assault” on Japan in an attempt to stem theimpact of Japanese direct investment in sophisticated manufacturing industries (automobiles,electronics, etc.) within the EU.
Core and semi-periphery countries have also been directly affected by the trade-divertingeffects of the EU’s protection of temperate climate agricultural products. Trade diversion effectsare particularly evident where EU subsidies have produced large surpluses for export. Forexample, EU exports of beef rose from 5 percent of world trade in 1977 to over 20 percentin 1980 and in so doing displaced Australian and Argentinian exports to Egypt and Uruguayanexports to Ghana. Of course, the outbreaks of so-called mad cow disease and foot and mouthdisease, which caused EU beef exports in 2001 to reach their lowest level for 20 years, createdserious disruptions in trade for the EU’s primary beef export markets of Egypt and Russia,which, like other countries, put a temporary ban on EU beef.
Other striking cases of trade diversion have occurred as specialist producers of temperateclimate products with strong traditional ties to European markets found themselves largelyexcluded by the EU’s external tariff wall. New Zealand is a good example. The United Kingdomused to take nearly all New Zealand’s butter, cheese, and lamb, so that after the United Kingdomjoined the EU, New Zealand agriculture had to be restructured, new products had to bedeveloped (a notable success here being the kiwi fruit) and new markets had to be penetratedin Latin America, India, and Japan—in the face of competition from the subsidized surplusesof dairy produce from the EU.
12. INTERNATIONAL AND SUPRANATIONAL INSTITUTIONALIZED INTEGRATION 375
Box 12.1 Genetically modified foods and U.S.–EU trade
“Not since the Green Revolution of the 1960s, when high-yielding wheat and rice varietieswere developed that increased harvests in Asia two-, five- and even tenfold, havetechnological advances had the potential to so affect world agricultural trade.” Theseoptimistic words touting the “promise of technology” came from James M. Murphy,Assistant U.S. Trade Representative in 1999. The proponents of bioengineered seeds andfood—genetically modified through biotechnology—argue that, compared to traditionalcrops, genetically modified ones require less water and fewer herbicides, produce higheryields and not only can taste better but may also be more nutritious and easily digested. Yetthe opponents of genetically modified food for human consumption contend that thetechnology has not been adequately tested scientifically. They point to the potential for newallergens and toxins to be produced, which could cause mild to potentially deadly allergicreactions or for antibiotic-resistant genes to be transferred to humans, leading to thegrowth of antibiotic-resistant disease strains.
6063 GEOGRAPHY WORLD ECON_PT_246x189 mm 22/01/2014 15:11 Page 375
ADJUSTING TO THE WORLD ECONOMY376
Since the mid-1990s, genetically modified foods have become a hot-button issue, not onlyin Europe, but also, increasingly, in the USA. In 1999 Cornell University researchersreported in Nature that laboratory tests showed that the use of genetically modified Bt-cornkilled not only intended pests such as the corn borer, but also Monarch butterfly larvae. InSeptember 2000 bioengineered food hit the newspaper headlines when Kraft Foods recalledtainted taco shells from supermarket shelves because they contained Star Link, a kind ofgenetically modified corn that was not approved for human consumption by the U.S. Foodand Drug Administration (FDA).
In the USA, however, consumer awareness, while growing, remains low. The FDA doesnot require testing of genetically modified foods and has not indicated that it intends tochange its existing voluntary labeling guidelines. U.S. agribusinesses (including Monsanto, themajor supplier of genetically modified seeds in the USA) remain staunchly against mandatorylabeling of genetically modified foods. Yet polls report that only between about 20 and 30percent of those surveyed are aware that genetically modified foods are being sold in U.S.supermarkets. At the same time, over 80 percent of those surveyed support the mandatorylabeling of genetically modified foods and would avoid buying them if they were clearlylabeled. It is estimated that between 60 and 70 percent of the foods eaten by U.S.consumers contain some genetically modified organisms (GMOs).
Europe since the mid-1980s has seen increasingly widespread public support for stricterhealth safety standards in conjunction with the strengthening of EU environmental andconsumer protection standards. More recently, there has been an undermining of publicconfidence following the highly visible failure of EU and national regulations to respondquickly enough to particular high-profile health and safety crises, most notably the outbreakof so-called mad cow disease. In response to protests and shoppers’ objections, somesupermarket chains in Britain and other European countries have refused to stockgenetically modified foods. A number of companies, including Frito Lay, Gerber, andMcDonald’s, announced that they would stop using foods that came from genetically alteredseeds in their products that are sold in Europe and the USA.
In 2001 the European Commission approved new rules requiring labeling of food oranimal feed that contains more than 1 percent genetically modified ingredients. The rulesalso establish mechanisms to trace GMOs through production to distribution—“from farmto table.” While these rules, considered to be the toughest in the world, remain to beapproved by EU member countries and the European Parliament, EU decisions such as thisare expected to have a major impact on U.S. farmers and producers who export food andanimal feed to Europe. The USA produces a significant proportion of the geneticallymodified food that is marketed throughout the world and is the world’s largest exporter ofwheat for animal as well as human consumption. More than three-fourths of the U.S.soybean crop and nearly 40 percent of the corn crop is grown from genetically modifiedseeds. Agribusiness in the USA has already lost millions of dollars in exports becauseindividual countries (such as Austria, France, and Luxembourg) have refused to acceptshipments of genetically modified crops and food despite the fact that they were approvedfor sale by the EU and their actions were in violation of WTO rules against vetoingproducts without a clear scientific basis. In 2007, however, the EU trade commissionerofficially urged member countries to comply with EU rules or face serious countermeasuresin the WTO.
6063 GEOGRAPHY WORLD ECON_PT_246x189 mm 22/01/2014 15:11 Page 376
12. INTERNATIONAL AND SUPRANATIONAL INSTITUTIONALIZED INTEGRATION 377
SUMMARYIn this chapter, we have shown how the imprint of international and supranational economicand political integration has begun to affect the world’s economic landscapes as nation-stateshave responded to the changing economic and geopolitical context of the world economy.This response has resulted in a variety of forms and levels of integration, but, in practice, thebasic principles of economic geography have resulted in three main outcomes:
1. reinforcement of the dominant core–periphery structure of the world economy2. spatial reorganization of production as trade creation and trade diversion affect both member
and non-member states3. creation and intensification of regional polarization as the economies of scale and multiplier
effects in regions most favored by integration create backwash effects elsewhere.
Yet, while it is important to acknowledge international and supranational integration as aresponse to the globalization of the world economy, it would be unwise to overstate its effects.International and supranational organizations are not about to replace countries and we mustrecognize their limits as contributors to the constant rewriting of the world’s economiclandscapes. The further integration of the EU, for example, is seriously hampered by a numberof issues that transcend its territory and jurisdiction, including its inability to reduce unem -ployment and significantly reduce income disparities between the richest and poorest regions.Moreover, as Nairn pointed out, spatial polarization within the EU has:
[S]ought out and found the buried fault lines of the area . . . Nationalism in the real sense is nevera historical accident, or a mere invention. It reflects the latent fracture lines of human society understrain.
(Nairn, 1977: 69)
Indeed, nationalism and localism can be seen to be intensifying, not only in response to thebackwash effects of international and supranational integration but also in response to theoverall globalization of the economy, the internationalization of culture and society, and theinsecurity and instability generated by the transition to advanced capitalism.
In the next chapter of the book, therefore, we turn to an examination of decentralist reactionsto the changing world economy.
Showing greater concern for the food and environmental plight of less developedcountries where poor soils and hunger are serious problems, the UN has called for a morebalanced approach (UNDP, 2001: 3–4):
The current debate in Europe and the United States over genetically modified crops mostlyignores the concerns and needs of the developing world. Western consumers who do not facefood shortages or nutritional deficiencies or work in fields are more likely to focus on foodsafety and the potential loss of biodiversity, while farming communities in developing countriesare more likely to focus on potentially higher yields and greater nutritional value, and on thereduced need to spray pesticides that can damage soil and sicken families.
6063 GEOGRAPHY WORLD ECON_PT_246x189 mm 22/01/2014 15:11 Page 377
KEY SOURCES AND SUGGESTED READINGAgnew, J., 2001. How many Europes? The European Union, eastward enlargement and uneven
development, European Urban and Regional Studies 8, 29–38.Artis, M. and Lee, N. (eds.), 1994. The Economics of the European Union. Oxford: Oxford University
Press.Foster, J.W., 2005. NAFTA after its First Decade, in The USA and Canada 2005. London: Europa
Publications.Gibb, R. and Michalak, W. (eds.), 1994. Continental Trading Blocs: The growth of regionalism in the
world economy. Chichester: John Wiley & Sons.Grant, C., 2006. Europe’s Blurred Boundaries: Rethinking enlargement and neighbourhood policy.
London: Centre for European Reform.Hardy, S., Hart, M., Albrechts, L., and Katos, A. (eds.), 1995. An Enlarged Europe: Regions in
competition? London: Regional Studies Association.Hoekman, B.M. and Kostecki, M.M., 1996. The Political Economy of the World Trading System: From
GATT to WTO. New York: Oxford University Press.Jacoby, W., 2004. The Enlargement of the European Union and NATO: Ordering from the menu in
central Europe. Cambridge: Cambridge University Press.Milio, S., 2007. Can Administrative Capacity explain Differences in Regional Performances? Evidence
from structural funds implementation in southern Italy, Regional Studies 41, 429–442.Peet, R., 2003. Unholy Trinity: The IMF, World Bank and WTO. London: Zed Books.Pinder, D., 1998. The New Europe. Chichester: John Wiley & Sons.Vogel, D., 2001. The Regulation of GMOs in Europe and the United States: A case-study of contemporary
European regulatory politics. Paper prepared for a workshop on trans-Atlantic differences in GMOregulation sponsored by the Council on Foreign Relations.
ADJUSTING TO THE WORLD ECONOMY378
6063 GEOGRAPHY WORLD ECON_PT_246x189 mm 22/01/2014 15:11 Page 378
Apersisting theme of this book is the existence of trends towards ever more powerful states and ever larger corporate structures. In the broader sweep of change within the world economy, these trends can appear to be inexorable and irreversible. Similarly, the
increasing prominence of international and supranational institutions and initiatives (such asthe EU, NAFTA, and the WTO) and transnational corporations (TNCs) can suggest apervasive bureaucratization of life under the control of fewer and fewer organizations andindividuals. Yet, while trends toward centralization, homogenization and standardization arereal enough, there is also evidence for persisting and even increasing differentiation anddecentralization: The peripheral industrialization that has come with the new internationaldivision of labor (NIDL) and the growth of the NIEs, the apparent reversal of previouslydepressed or underdeveloped local economies (for example, the Sunbelt phenomenon in theUSA), and the revival or creation of regional–national identities (for example, Ukraine,Quebec, Scotland, Catalonia, Lombardy, Punjab), for example.
The two sets of phenomena are often related. So, for example, it is the centralization ofeconomic power in TNCs that has often led to a decentralization of their productive activities(as noted in Chapters 3, 6, and 10); and it is attempts at political and cultural homogeniza-tion through international and supranational political unification that have generated resistanceat the local or regional level (as noted in Chapters 3 and 8). The end of the Cold War andthe collapse of the former Soviet Union gave an added stimulus to economic decentralizationand political fragmentation. It is still too early to say whether this signals for eastern Europeand the former Soviet Union a permanent trend or a temporary hiatus prior to renewedpolitical–economic centralization as evidenced by the accession of a number of east Euro-pean countries to the EU and Russia’s inclusion on the waiting list to become a member ofthe WTO.
However, a general trend all over the world in the wake of the increased integration of theworld economy has been an enhanced differentiation between places. So, even as the worldhas shrunk in real terms with respect to flows of goods, services and investments, small
Picture credit: Linda McCarthy
Chapter 13
Reassertion ofthe local in theage of theglobal: Regionsand localitieswithin the worldeconomy
6063 GEOGRAPHY WORLD ECON_PT_246x189 mm 22/01/2014 15:11 Page 379
differences in economic characteristics and cultural practices have taken on greater significance.As a result pressures towards a localizing of political decision-making power and politicalidentities have increased. Three kinds of decentralist reaction have been increasingly commonsince the 1970s.
First, national governments have had to satisfy local and regional constituencies that theyrepresent their best interests. When faced by geographically differentiated patterns of economicgrowth and decline, regional policies and regional devolution have been important responses.Since 1998, for example, certain powers formally vested in the UK’s parliament have beendevolved to legislative bodies in Scotland, Wales, and Northern Ireland. Under regionaldevolution, Scotland, Wales, and Northern Ireland have gained some measure of self-government, while remaining, with England, constituent parts of the UK and its nationalinstitutional framework. In Scotland, the responsibilities of the Scotland Office now includehealth, education, crime, housing, and economic development; the UK government has retainedresponsibility for a range of other issues for Scotland including employment, fiscal andeconomic policy, taxation, and social security.
Second, many countries are internally divided along cultural lines with regional/geographicalbases. This has sometimes led to nationalist–separatist movements directed towards achievingautonomy or independence for disaffected regions. Basque nationalist separatists consider sevenprovinces that straddle the Pyrenees, four in Spain and three in France, to be the Basque country.The almost 3 million people in this region are believed to be the oldest indigenous ethnic groupin Europe. During Franco’s dictatorship in Spain (1939–1975), the Basques lost any politicalautonomy they had previously enjoyed, their culture was suppressed, and the use of theirlanguage was forbidden. In an effort to accommodate the region’s separate national identity,the Spanish government has recognized since the early 1980s three Basque Provinces as anautonomous region, with its own parliament, police force, and separate language. While themajority of Basques in this region oppose the use of violence, up to 40 percent continue tosupport independence from Spain.
Third, and most generally, the growing globalization of the world economy has encourageddecentralization rather than centralization in the location of economic activities; whether in the form of the branch plants of big corporations or the localization and clustering ofspecialized small firms inherent in industrial districts. In particular, small-scale production hasbecome of increasing importance (batch production, etc., as noted in Chapters 6, 7, and 10).Ideas such as “basic needs,” “appropriate technology,” and “local control” have becomeincreasingly attractive in this context in framing the basic demands of new political movementscalling for economic as well as political democracy. Although usually dismissed as Utopian,such ideas have become especially attractive as global resource and pollution problems arisingas by-products of constant increases in global production and consumption have attracted moreattention.
13.1 REGIONALISM AND REGIONAL POLICYAs we have shown in previous chapters, processes of economic growth and decline are notgeographically neutral in their impact. In particular, the locational requirements of high-techmanufacturing production under the market-access regime and the growing service industries(such as finance) are likely to differ from those of established production (see Chapters 3, 6,and 10). It is in this context that appeals for governmental action arise to “help” a particularregion or set of regions either “adjust” to a changing economic situation or encourage compen-sating investment by means of fiscal measures such as tax breaks or relocation allowances.
ADJUSTING TO THE WORLD ECONOMY380
6063 GEOGRAPHY WORLD ECON_PT_246x189 mm 22/01/2014 15:11 Page 380
In the 1950s and 1960s there was widespread acceptance in many core countries of theneed to encourage regional “balance” in economic growth at a time when established regionaleconomies were beginning to experience challenges to their competitive advantage, and“poorer” regions (such as the Italian south or the U.S. South) were seen as lagging behindother regions. It is no coincidence that this acceptance flourished at a time of relative prosperity:Quite simply, affluent societies could afford to indulge in redistributive policies. In somecountries this took the form of revitalizing or establishing lower “regional” tiers of government.Regional governments were viewed as agents for maintaining or attracting private investment.In some countries, such as Italy, Norway, and, to a lesser degree, the United Kingdom, regionalauthorities were introduced to encourage regional economic planning and foster local industrialregeneration. In many countries, especially those with federal political systems (such as theUnited States, Canada, Australia, Switzerland, and Germany), lower tier governments havetraditionally played an important role in stimulating economic growth within their territories.
Two questions are especially pertinent with respect to the history of regional policy. Oneconcerns the extent to which regionalism, or explicit commitment to spatial or regional planning,has inspired regional policy. The second involves the impact, if any, of regional and localdevelopment policies organized by lower tiers of government.
REGIONAL PLANNING
With regard to the first, some countries, such as France, Germany, and Italy, have long-established traditions of regionalism. In particular, French programs of “territorialmanagement” and the Italian Cassa del Mezzogiorno (Southern Development Agency, replacedin 1987 by several smaller agencies) provide well-known examples. The United Kingdom andthe United States acquired formal regional policies in the 1930s but in neither case has therebeen the same political consensus in favor of such policies (or anything that smacks of formalplanning) as in other countries in Europe and elsewhere (for example, Japan, Brazil, India).In both cases earlier initiatives have largely been abandoned since the late 1960s in favor ofeither very localized programs, such as enterprise zones, or lower level government rather thannational-level policies.
This reflects, in part, the coming to national power of governments ill disposed on ideologicalgrounds to government intervention in the direction of economic activities to particularplaces. But it also reflects a negative appraisal of the effects of previous planning activities. Ifregional unemployment rates can be used as an indicator of regional “economic well-being,”the fact that such rates are highly correlated over time and across countries irrespective of thecommitment to regional policies suggests that such policies do not make much difference(Chisholm, 1990: 167–169). Incidentally, however, this also suggests a lack of evidence forthe long-run spatial equilibrium in the distribution of economic activities assumed in moststatic models of regional development (discussed in Chapters 7 and 10), and so for the ideologythat has often inspired the abandonment of regional policies.
REGIONAL AND LOCAL DEVELOPMENT POLICIES
The trend throughout the core countries over the past 30 years has been away from formalregionalism sponsored by national governments and towards the adoption of competitive spatial policies by regional and local governments. This has older roots, particularly in theUnited States where it dates back to the years immediately after the Second World War whensouthern states such as Tennessee and Mississippi began “attracting” firms from the northeast
13. REASSERTION OF THE LOCAL IN THE AGE OF THE GLOBAL 381
6063 GEOGRAPHY WORLD ECON_PT_246x189 mm 22/01/2014 15:11 Page 381
and Midwest with a mix of low production costs and fiscal advantages (especially low taxes).This approach spread widely in the USA with the onset of the massive restructuring of industryin the early 1970s. At the same time the narrow focus on attracting industry shifted to a broaderconcern with general local economic competitiveness, primarily through improving the overall“climate” for business and creating a mix of incentives for stimulating “new” industries withpotential multiplier effects.
Individual U.S. states and municipalities have created economic development agencies toattract industry and foster endogenous economic development. Particularly conspicuous havebeen public–private partnerships and government offices established abroad, in London,Tokyo, or Brussels, to entice foreign business to particular locations in the USA. This latterstrategy paid off handsomely for some states, such as Ohio and Kentucky, which succeededin beating off other U.S. states in attracting major Japanese auto-assembly plants to theirjurisdictions. Local government intervention of a similar type began to appear in the UK andother European countries in the 1980s, in part taking a leaf out of the United States book butalso reflecting the availability of EU structural funds for providing grants and cheap loans toprospective employers.
The overall effectiveness of these local development efforts remains in doubt. While “successstories,” such as that of Kentucky in the USA or the local government/small business linkagespresent in many parts of central and northeast Italy, are well known, evidence for the positiveimpact of these efforts in general is mixed. Frequently, local programs of tax abatements andsubsidized plant and equipment merely relocate industry from another state or municipalityrather than building fresh capacity and employment nationally. Ironically, given the usualassociation of “good” business climate with low taxes and limited public services, some evidencesuggests that in the USA, state and local education, training, and infrastructure expendituresare more beneficial in generating fresh investment and new businesses than are subsidies toindividual firms. Systematic fiscal reform, in the sense of aiming for low tax rates and broadtax bases, combined with efficient service delivery seems to offer the best formula for successfullocal development efforts in the USA. Specific tax subsidies to firms (including so-calledenterprise zone experiments) seem a much less successful route to job growth and overalleconomic development in local economies. The theoretical framework outlined in Chapter 3would suggest that the best local policies would be those that assist clustering by firms so asto increase transactional, learning, work training and other linkages. Otherwise competitionbetween states and localities might encourage a “race to the bottom” with jurisdictions suchas Mississippi becoming the norm against which states with long traditions of activegovernment intervention to regulate workplaces and encourage economic development basedon high-quality public services would find themselves at a disadvantage in the scramble toattract inward investment.
THE BALANCE SHEET ON REGIONAL PLANNING AND COMPETITIONPOLICIES
A basic dilemma remains unresolved, however. When local policies successfully promoteeconomic development, both the capital and the labor (when educated or skilled) that benefitedfrom the policies will probably act to undermine what the policies initially achieved. Capitalwill do this through takeovers and moving investment elsewhere; labor by migration to higherwage areas. This is the paradox of planning regional and local initiatives in the context of aworld economy that is dynamic and “placeless” in its orientation to securing improvementsin rates of return on investment. Yet, at the same time, rather than “rooting capital” in weak
ADJUSTING TO THE WORLD ECONOMY382
6063 GEOGRAPHY WORLD ECON_PT_246x189 mm 22/01/2014 15:11 Page 382
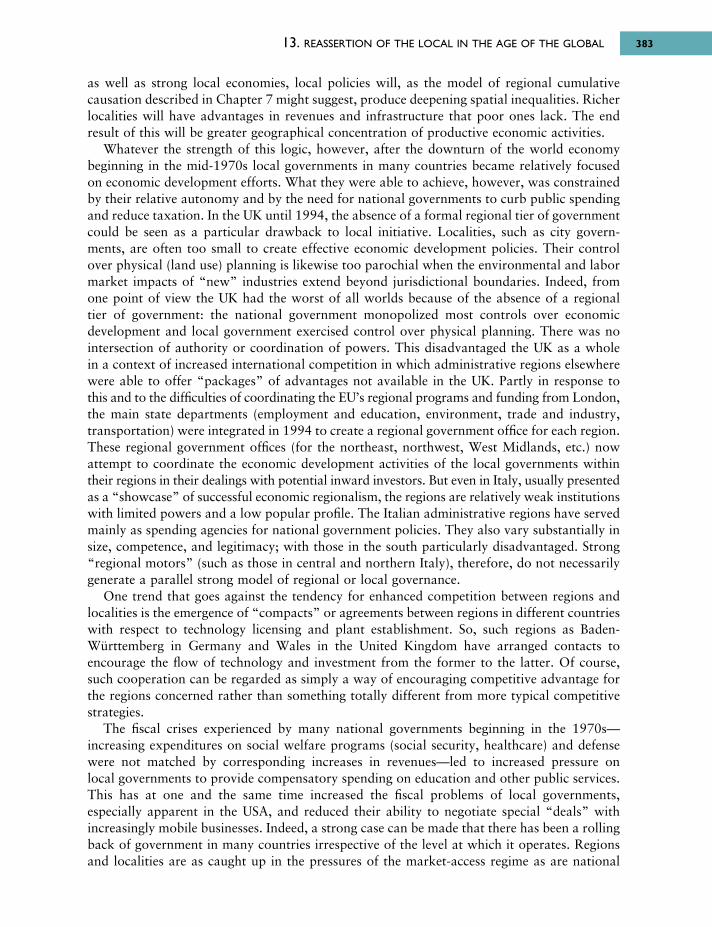
as well as strong local economies, local policies will, as the model of regional cumulativecausation described in Chapter 7 might suggest, produce deepening spatial inequalities. Richerlocalities will have advantages in revenues and infrastructure that poor ones lack. The endresult of this will be greater geographical concentration of productive economic activities.
Whatever the strength of this logic, however, after the downturn of the world economybeginning in the mid-1970s local governments in many countries became relatively focusedon economic development efforts. What they were able to achieve, however, was constrainedby their relative autonomy and by the need for national governments to curb public spendingand reduce taxation. In the UK until 1994, the absence of a formal regional tier of governmentcould be seen as a particular drawback to local initiative. Localities, such as city govern-ments, are often too small to create effective economic development policies. Their controlover physical (land use) planning is likewise too parochial when the environmental and labormarket impacts of “new” industries extend beyond jurisdictional boundaries. Indeed, fromone point of view the UK had the worst of all worlds because of the absence of a regional tier of government: the national government monopolized most controls over economicdevelopment and local government exercised control over physical planning. There was nointersection of authority or coordination of powers. This disadvantaged the UK as a wholein a context of increased international competition in which administrative regions elsewherewere able to offer “packages” of advantages not available in the UK. Partly in response tothis and to the difficulties of coordinating the EU’s regional programs and funding from London,the main state departments (employment and education, environment, trade and industry,transport ation) were integrated in 1994 to create a regional government office for each region.These regional government offices (for the northeast, northwest, West Midlands, etc.) nowattempt to coordinate the economic development activities of the local governments withintheir regions in their dealings with potential inward investors. But even in Italy, usually presentedas a “showcase” of successful economic regionalism, the regions are relatively weak institutionswith limited powers and a low popular profile. The Italian administrative regions have servedmainly as spending agencies for national government policies. They also vary substantially insize, competence, and legitimacy; with those in the south particularly disadvantaged. Strong“regional motors” (such as those in central and northern Italy), therefore, do not necessarilygenerate a parallel strong model of regional or local governance.
One trend that goes against the tendency for enhanced competition between regions andlocalities is the emergence of “compacts” or agreements between regions in different countrieswith respect to technology licensing and plant establishment. So, such regions as Baden-Württemberg in Germany and Wales in the United Kingdom have arranged contacts toencourage the flow of technology and investment from the former to the latter. Of course,such cooperation can be regarded as simply a way of encouraging competitive advantage forthe regions concerned rather than something totally different from more typical competitivestrategies.
The fiscal crises experienced by many national governments beginning in the 1970s—increasing expenditures on social welfare programs (social security, healthcare) and defensewere not matched by corresponding increases in revenues—led to increased pressure on local governments to provide compensatory spending on education and other public services.This has at one and the same time increased the fiscal problems of local governments,especially apparent in the USA, and reduced their ability to negotiate special “deals” withincreasingly mobile businesses. Indeed, a strong case can be made that there has been a rollingback of government in many countries irrespective of the level at which it operates. Regionsand localities are as caught up in the pressures of the market-access regime as are national
13. REASSERTION OF THE LOCAL IN THE AGE OF THE GLOBAL 383
6063 GEOGRAPHY WORLD ECON_PT_246x189 mm 22/01/2014 15:11 Page 383
governments. The primacy of market forces leads to an emphasis on entrepreneurialism, theimperative of flexibility and a “business localism” in which there is little or no popular oversightor control.
Direct central government intervention has still remained an important dimension of regional policy, if in some countries more than others. Substantial regional variations ineconomic development (especially when they are reflected in high regional unemployment rates)have been widely viewed as creating a national political problem, threatening the social andeconomic cohesion of the state itself. As a result, and beginning in the 1930s, nationalgovernments have felt it necessary to intervene in the economic geography of their territoriesby manipulating the costs of production.
The policies adopted have varied over time and by country. Some have sought to reducethe costs of fixed capital in declining regions by undertaking government investment ininfrastructure, providing subsidies for private investment, etc. (German and Italian policies,in particular, have emphasized such strategies.) Others have sought to reduce the costs of capital in declining regions through subsidies for labor costs in those regions or throughartificially increasing costs in “overheated” regions (in the 1960s French and British policiestended in this direction). The increased globalization of the world economy, however, haschallenged the relevance of such conventional regional policies. In the first place, the largestfirms no longer choose sites from among a single national set. There is no longer muchcorrespondence between the scale of economic–locational decision making and the spatial scaleover which governments can exert their fiscal powers. Indeed, in this context “the difficultiesof guaranteeing full employment nationally mean that the state has increasingly to focus itsattention on the national rather than the regional crisis; regional policy is in large part irrelevant”(Johnston, 1986: 274).
In the second place, the cost of subsidies raises government spending and produces amacroeconomic environment that is unattractive to global capital. Regional policy is then viewedas both an expensive luxury and an increasing liability. This was very much the view adoptedby the Thatcher/Major governments in the United Kingdom and the Reagan/Bush adminis -tra tions in the United States. Reducing state spending on regional policy was seen as anecessity for improving national competitiveness in a world economy. In the UK between 1979and 1985, for example, regional aid was cut from £842 million to £560 million, a cut in realterms of exactly one-third. Moreover, the areas eligible for aid were “rolled back” considerably(see Figure 13.1).
Third, and finally, as Doreen Massey (1984: 298) points out: “No longer is there really a ‘regional’ problem in the old sense. No longer is there a fairly straightforward twofold divisionbetween central prosperous areas and a decaying periphery.” Rather, because “it is notregions which interrelate, but the social relations of production which take place over space”(1984: 122); a new spatial division of labor based on spatial division of firms’ activities hasgiven rise to a changing and more localized pattern of spatial inequality. Her summary argumentis as follows:
The old spatial division of labor based on sector, on contrasts between industries, has gone intoaccelerated decline and in its place has arisen to dominance a spatial division of labor in which amore important component is the inter-regional spatial structuring of production within individualindustries. Relations between economic activity in different parts of the country are now a functionless of market relations between firms and rather more of planned relations within them.
(Massey, 1984: 295)
ADJUSTING TO THE WORLD ECONOMY384
6063 GEOGRAPHY WORLD ECON_PT_246x189 mm 22/01/2014 15:11 Page 384
13. REASSERTION OF THE LOCAL IN THE AGE OF THE GLOBAL 385
From this perspective regional policy no longer engages with economic reality. Rather thandiscrete regional economies in competition with one another: “[A] new spatial division of labormade possible by new information and communication technologies and new non-spatial scaleeconomies has created a localized pattern of restructuring” (Agnew, 1988: 131). In a worldin which exogenous links have become central to local development, area-based policies forendogenous development often can appear less and less fruitful.
As decentralist reactions, therefore, regional policy and, especially, regionalism appearincreasingly problematic. As Martin and Hodge (1983: 319) have argued with respect to theUnited Kingdom:
[H]owever much regional policies of the conventional type are strengthened, if they are pursuedagainst a background of continued unfavorable macro-economic conditions, their “social” rolewill be largely limited to simply spreading the misery of mass unemployment more “fairly” aroundthe country while providing little boost to total economic activity or employment.
It may be too early to write off regional policy entirely, even if regionalism, the commitmentto planning in a nationally coordinated fashion the economic development of fixed regionalunits, is largely in retreat. For one thing, to counterbalance its commitment to improving theoverall efficiency of European industry in global competition through enhanced Europeancompetition, the EU has placed renewed emphasis on regional incentives to compensate forlosses of traditional industries and employment (see Chapter 12). After declining steadily fromthe late 1950s, regional disparities in income increased throughout the EU from the mid-1970s,leveled off and fell slightly during the late 1980s, before rising again since 1990. In response,
Figure 13.1 The Thatcher government’s rolling back of regional aid, 1979–84
Source: Based on Martin (1986: 273, Figure 8.4)
6063 GEOGRAPHY WORLD ECON_PT_246x189 mm 22/01/2014 15:11 Page 385
June 1979 Auqust 1982 November 1984
Assisted Areas(defined by UK government (Department of Trade and Industry), ranked by economic decline, unemployment, and other measures of deprivation)
1. Special Development Areas
2. Development Areas
3. Intermediate Areas
Newcastle- upon
Tyne
Leeds
Glasgow
Manchester
•Birmingham
Cardiff
Plymouth
the European Commission has concentrated its spending on infrastructural projects andvocational training, while its competition policy attempts to restrict the provision of state aidssuch as grants and subsidies for private firms to within the “less favored” regions. Whetherthese are sufficient to rebalance regional disparities is questionable given the continued highrates of job loss in regions facing structural difficulties or where development is lagging behind.Second, some emerging industries enjoy economies of agglomeration (particularly localizationeconomies). Once established in specific areas such industries have a local dependence thatgenerates competitive advantage. Unfortunately, not everywhere can benefit from this. Thishas been the problem with proliferating growth poles, trying to mass produce the dynamismassociated with initial advantage at great public expense but without much of a return oninvestment. There can only be a limited number of Silicon Valleys and Silicon Fens. So thereis an economic return to early organization of specialized complexes. If a national economyis going to share in the potential for national economic development represented by these,then a national government will require a regional policy to encourage early response.
For example, Japanese regional policy is now centrally concerned with creating theconditions for early response in growing sectors such as computing and biotechnology. Thereis a network of 170 regional centers that channel support for innovation and research intocompanies with fewer than 300 employees. Three-fourths of the staff of these kohsetsushi centersare engineers who carry out applied research, and offer training and advice. The centersencourage small firms to collaborate with one another and with the large firms they oftensupply with components and services. The regional system provides an organizationalframework for Japanese economic innovation. Countries such as the United Kingdom and theUnited States have suffered from the absence of such government “priming” of the pump ofinnovation while waiting for firms to do it themselves. Firms, however, have had no incentiveto look beyond their own short-run interests to the interest of the country as a whole. Fromone point of view, that is what governments are for.
13.2 NATIONALIST SEPARATISMThe growth of industrial capitalism in the nineteenth century was accompanied by promotionof the nation-state and the growth of nationalism. The conviction grew among élites andpopulations at large that each state should be clearly bounded geographically, it should beorganized as an economy, and it should be as linguistically and culturally homogeneous aspossible. To many in Europe and North America, for example, the blessings of materialabundance and personal freedom became associated with the interrelated development ofcapitalism and the nation-state.
In the twentieth century, however, nationalism was regularly perverted into fascism.Dreadful wars were fought. National independence has been no guarantee of nationalprosperity. Even in the original founding states of Europe, such as Spain, France, and the UK,political movements rejecting established national claims and asserting political and economicrights for regional and ethnic populations have become widespread.
STATES VERSUS NATIONS
This last trend reflects the fact that state making and nationalism have never redounded equallyto the benefit of all the nominal citizens of a country. In particular, since their earliestformation, nation-states have contained a diversity of cultural groups within their boundaries.In the social science literature, the term ethnicity has come to signify the organization of cultural
ADJUSTING TO THE WORLD ECONOMY386
6063 GEOGRAPHY WORLD ECON_PT_246x189 mm 22/01/2014 15:11 Page 386
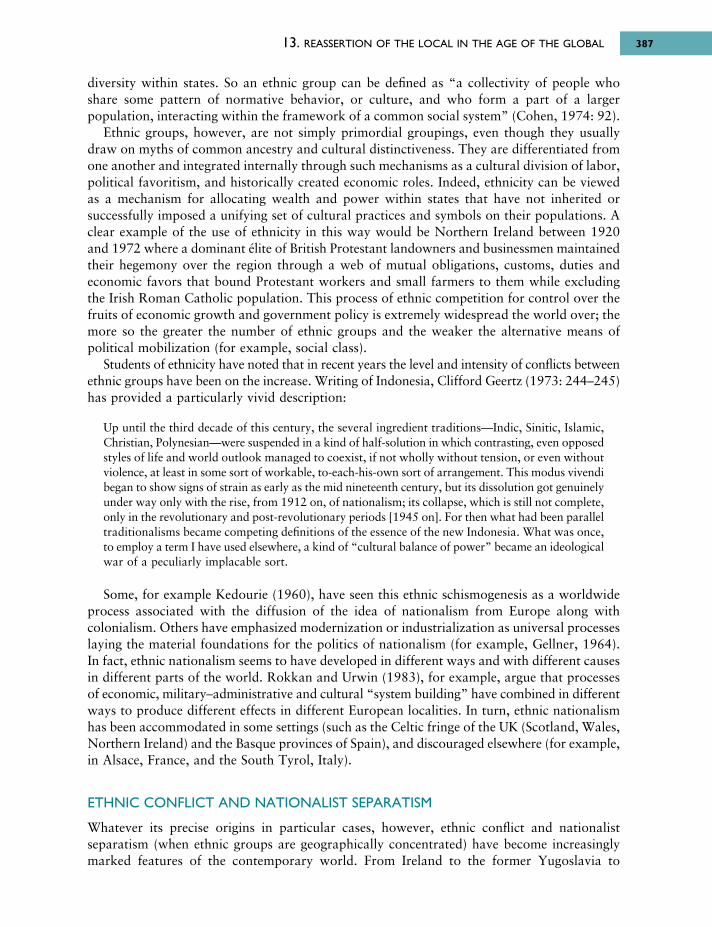
diversity within states. So an ethnic group can be defined as “a collectivity of people whoshare some pattern of normative behavior, or culture, and who form a part of a largerpopulation, interacting within the framework of a common social system” (Cohen, 1974: 92).
Ethnic groups, however, are not simply primordial groupings, even though they usuallydraw on myths of common ancestry and cultural distinctiveness. They are differentiated fromone another and integrated internally through such mechanisms as a cultural division of labor,political favoritism, and historically created economic roles. Indeed, ethnicity can be viewedas a mechanism for allocating wealth and power within states that have not inherited orsuccessfully imposed a unifying set of cultural practices and symbols on their populations. Aclear example of the use of ethnicity in this way would be Northern Ireland between 1920and 1972 where a dominant élite of British Protestant landowners and businessmen maintainedtheir hegemony over the region through a web of mutual obligations, customs, duties andeconomic favors that bound Protestant workers and small farmers to them while excludingthe Irish Roman Catholic population. This process of ethnic competition for control over thefruits of economic growth and government policy is extremely widespread the world over; themore so the greater the number of ethnic groups and the weaker the alternative means ofpolitical mobilization (for example, social class).
Students of ethnicity have noted that in recent years the level and intensity of conflicts betweenethnic groups have been on the increase. Writing of Indonesia, Clifford Geertz (1973: 244–245)has provided a particularly vivid description:
Up until the third decade of this century, the several ingredient traditions—Indic, Sinitic, Islamic,Christian, Polynesian—were suspended in a kind of half-solution in which contrasting, even opposedstyles of life and world outlook managed to coexist, if not wholly without tension, or even withoutviolence, at least in some sort of workable, to-each-his-own sort of arrangement. This modus vivendibegan to show signs of strain as early as the mid nineteenth century, but its dissolution got genuinelyunder way only with the rise, from 1912 on, of nationalism; its collapse, which is still not complete,only in the revolutionary and post-revolutionary periods [1945 on]. For then what had been paralleltraditionalisms became competing definitions of the essence of the new Indonesia. What was once,to employ a term I have used elsewhere, a kind of “cultural balance of power” became an ideologicalwar of a peculiarly implacable sort.
Some, for example Kedourie (1960), have seen this ethnic schismogenesis as a worldwideprocess associated with the diffusion of the idea of nationalism from Europe along withcolonialism. Others have emphasized modernization or industrialization as universal processeslaying the material foundations for the politics of nationalism (for example, Gellner, 1964).In fact, ethnic nationalism seems to have developed in different ways and with different causesin different parts of the world. Rokkan and Urwin (1983), for example, argue that processesof economic, military–administrative and cultural “system building” have combined in differentways to produce different effects in different European localities. In turn, ethnic nationalismhas been accommodated in some settings (such as the Celtic fringe of the UK (Scotland, Wales,Northern Ireland) and the Basque provinces of Spain), and discouraged elsewhere (for example,in Alsace, France, and the South Tyrol, Italy).
ETHNIC CONFLICT AND NATIONALIST SEPARATISM
Whatever its precise origins in particular cases, however, ethnic conflict and nationalistseparatism (when ethnic groups are geographically concentrated) have become increasinglymarked features of the contemporary world. From Ireland to the former Yugoslavia to
13. REASSERTION OF THE LOCAL IN THE AGE OF THE GLOBAL 387
6063 GEOGRAPHY WORLD ECON_PT_246x189 mm 22/01/2014 15:11 Page 387
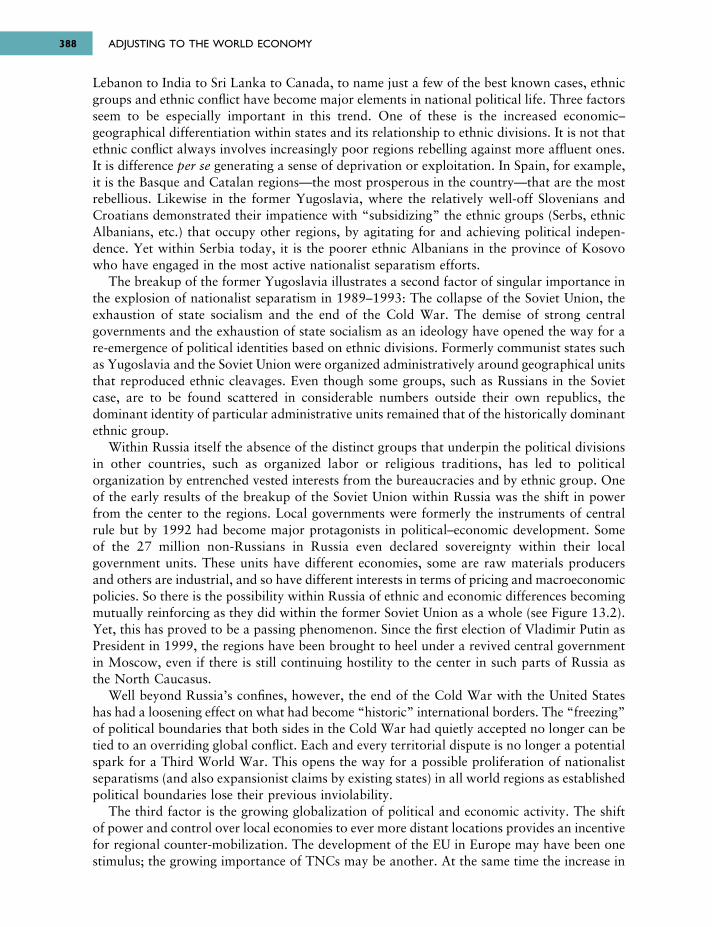
Lebanon to India to Sri Lanka to Canada, to name just a few of the best known cases, ethnicgroups and ethnic conflict have become major elements in national political life. Three factorsseem to be especially important in this trend. One of these is the increased economic–geographical differentiation within states and its relationship to ethnic divisions. It is not thatethnic conflict always involves increasingly poor regions rebelling against more affluent ones.It is difference per se generating a sense of deprivation or exploitation. In Spain, for example,it is the Basque and Catalan regions—the most prosperous in the country—that are the mostrebellious. Likewise in the former Yugoslavia, where the relatively well-off Slovenians andCroatians demonstrated their impatience with “subsidizing” the ethnic groups (Serbs, ethnicAlbanians, etc.) that occupy other regions, by agitating for and achieving political indepen -dence. Yet within Serbia today, it is the poorer ethnic Albanians in the province of Kosovowho have engaged in the most active nationalist separatism efforts.
The breakup of the former Yugoslavia illustrates a second factor of singular importance inthe explosion of nationalist separatism in 1989–1993: The collapse of the Soviet Union, theexhaustion of state socialism and the end of the Cold War. The demise of strong centralgovernments and the exhaustion of state socialism as an ideology have opened the way for are-emergence of political identities based on ethnic divisions. Formerly communist states suchas Yugoslavia and the Soviet Union were organized administratively around geographical unitsthat reproduced ethnic cleavages. Even though some groups, such as Russians in the Sovietcase, are to be found scattered in considerable numbers outside their own republics, thedominant identity of particular administrative units remained that of the historically dominantethnic group.
Within Russia itself the absence of the distinct groups that underpin the political divisionsin other countries, such as organized labor or religious traditions, has led to politicalorganization by entrenched vested interests from the bureaucracies and by ethnic group. Oneof the early results of the breakup of the Soviet Union within Russia was the shift in powerfrom the center to the regions. Local governments were formerly the instruments of centralrule but by 1992 had become major protagonists in political–economic development. Someof the 27 million non-Russians in Russia even declared sovereignty within their localgovernment units. These units have different economies, some are raw materials producersand others are industrial, and so have different interests in terms of pricing and macroeconomicpolicies. So there is the possibility within Russia of ethnic and economic differences becomingmutually reinforcing as they did within the former Soviet Union as a whole (see Figure 13.2).Yet, this has proved to be a passing phenomenon. Since the first election of Vladimir Putin asPresident in 1999, the regions have been brought to heel under a revived central governmentin Moscow, even if there is still continuing hostility to the center in such parts of Russia asthe North Caucasus.
Well beyond Russia’s confines, however, the end of the Cold War with the United Stateshas had a loosening effect on what had become “historic” international borders. The “freezing”of political boundaries that both sides in the Cold War had quietly accepted no longer can betied to an overriding global conflict. Each and every territorial dispute is no longer a potentialspark for a Third World War. This opens the way for a possible proliferation of nationalistseparatisms (and also expansionist claims by existing states) in all world regions as establishedpolitical boundaries lose their previous inviolability.
The third factor is the growing globalization of political and economic activity. The shiftof power and control over local economies to ever more distant locations provides an incentivefor regional counter-mobilization. The development of the EU in Europe may have been onestimulus; the growing importance of TNCs may be another. At the same time the increase in
ADJUSTING TO THE WORLD ECONOMY388
6063 GEOGRAPHY WORLD ECON_PT_246x189 mm 22/01/2014 15:11 Page 388
13. REASSERTION OF THE LOCAL IN THE AGE OF THE GLOBAL 389
Figure 13.2 Governmental decentralization of Russia, 1993
Source: Based on Economist (1992c: 25)
Box 13.1 International terrorism
One strategy used by some nationalists, following in the path of guerrilla movements informer colonies, has been to use terrorist methods to try to make the “occupation” of theirlands by others intolerable. These tactics have ranged from the bombs planted by IRA (Irish)and ETA (Basque) separatists to fully fledged warfare, as in Chechnya and other territoriesin the Northern Caucasus region of Russia.
Since the late 1990s, however, this largely nationalist terrorism has been supplementedby the growth of a brand of international terrorism interpreted by many, not least by theU.S. administration of G.W. Bush, as a war against the United States and the worldeconomy. Associated with such shadowy groups as the Islamic jihadist al Qaeda (which hasbeen linked to the attacks on the World Trade Center in New York on September 11,2001), this type of terrorism has been seen by some as a violent response to the spread ofglobalization, particularly by extreme elements in the Arab and Islamic worlds, even as itmakes use of the very technologies, such as cellphones and planes, that globalization entails.
Not only has terrorism taken on a global reach, however, it is also apparent that citieshave become a preferred location for large-scale terrorist attacks. Even before the terroristattacks on the World Trade Center in 2001, cities had become the central venues ofterrorist attacks. Between 1993 and 2000, for example, there had been over 500 terroristincidents in more than 250 cities around the world.
There are several reasons for this. First, cities—especially world cities—haveconsiderable symbolic value. They are not only dense agglomerations of people and buildingsbut also symbols of national prestige and military, political, and financial power. A bomb inLondon’s underground or a poison gas release in a Tokyo metro arouses internationalalarm. This kind of event will be communicated instantly to a world audience. Second, theassets of cities—densely packed and with a large mix of industrial and commercial
6063 GEOGRAPHY WORLD ECON_PT_246x189 mm 22/01/2014 15:11 Page 389
a d y g e i
В KARACHEVO-CHERKESS В KABARDINO-BALKARIA NORTH OSSETIA 0 CHECHNYA
] Republics
KALININGRADKARFI IA
KOMI YAKUTIA
BURYATIA
C H I N AM O N G O L I A
KHAKASSIAGORNO- TUVA
UDMURTIA
BASHKORTOSTAN
MARICHUVASHIA
M o sco w dORDOVIA 1
TATARSTANO R o s to i
I4
KALMYKIA
DAGESTAN K A Z A K H S T A N
ADJUSTING TO THE WORLD ECONOMY390
the flow of international migrants, especially into Europe, introduced ethnic groups, such asIndians in the United Kingdom, Turks in Germany, and Algerians in France, which bothstimulate the demands of indigenous ethnic groups and provide additional “out-groups” fornew rounds of ethnic conflict and nationalist politics.
With the exception of the former Soviet Union and some parts of eastern Europe (formerYugoslavia and Czechoslovakia) outright separatist movements have not met with success, atleast as measured in terms of political independence. During the Cold War the worldsuperpowers generally refused to back separatist movements, perhaps for fear of stimulatingthem at home or within their own spheres of influence. Often, political changes short of outrightindependence have proved satisfactory responses to regional–ethnic revolt. These includefederalism, regional devolution, and consociationalism (power sharing among ethnic groupsas in Switzerland and the Netherlands). What is clear, however, irrespective of the prospects
infrastructure—make them rich targets for terrorists. Third, cities have become nodes invast international networks of communications. This is a reflection not only of their power,but also of their vulnerability. A well-placed explosion can produce enormousreverberations, paralyze a city, and spread fear and economic dislocation. Finally, word gets around more quickly and socialization proceeds more rapidly in high-density localities.These kinds of environment can be an abundant source of recruits for terroristorganizations.
Terrorism takes a toll on cities in a variety of ways. The impacts of the 2001 terroristattacks on New York City have been significant—and not limited to the death anddestruction that was targeted on lower Manhattan. The time and cost of doing business inNew York has gone up, even for workers and companies quite distant from the attack site.
In this connection, central London has sought to reduce the threat of terrorist attacks.Physical and increasingly technological approaches to security have been adopted atincreasingly expanded scales. In 1993 a security cordon was put into place, securing allentrances to the central financial zone of the City of London (the Square Mile). The 30 entrances to the City were reduced to seven, with roadblocks manned by armed police. Over time the spatial scale of the security cordon was increased to cover 75 percent of the Square Mile. The security cordon, as a territorial approach to security, wasaugmented by retrofitting a closed circuit TV (CCTV) system. The police, through theirCamera Watch partnership effort, encouraged private companies to install CCTV. At theseven entrances to the security cordon, 24-hour automated number plate recording(ANPR) cameras, linked to police databases, were installed. Within a decade the City ofLondon had been transformed into the most surveiled space in the United Kingdom, andperhaps in the world, with more than 1,500 surveillance cameras in operation, many ofwhich are linked to the ANPR system.
Ultimately, the response to international terrorism mirrors the response to thenationalist use of terrorist methods that have been attempted in the past. Although bloodyin terms of loss of civilian lives, terrorism of all kinds is rather like the strategic bombingcampaigns carried out by air forces during the Second World War: It does not work tointimidate populations into surrender. Although often the seemingly only available “weaponof the weak,” it tends to create increased animosity and violence rather than achieve thepolitical outcomes desired.
6063 GEOGRAPHY WORLD ECON_PT_246x189 mm 22/01/2014 15:11 Page 390
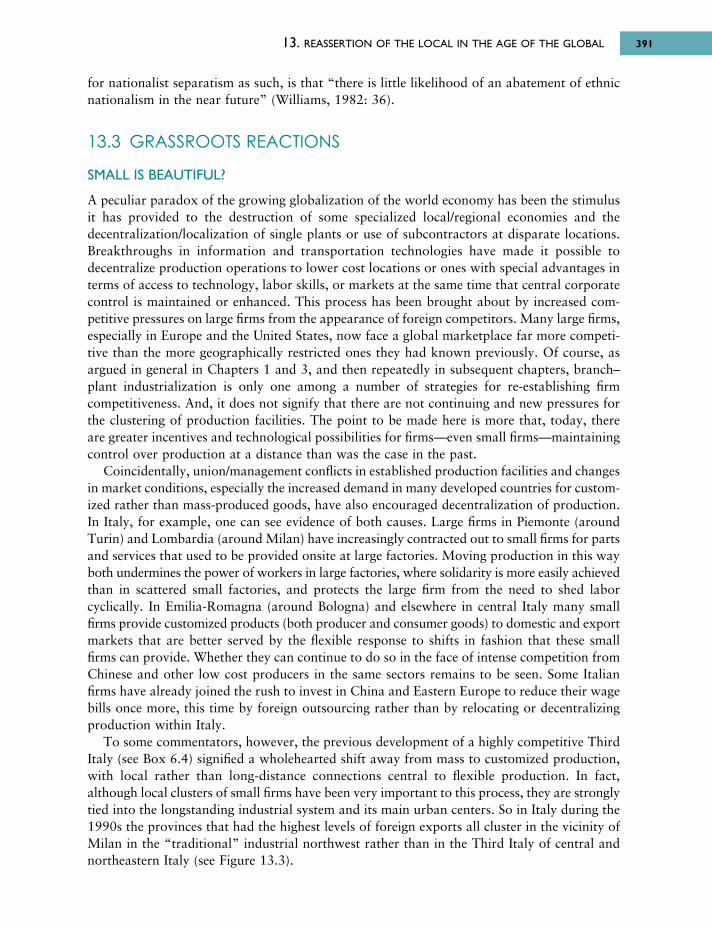
for nationalist separatism as such, is that “there is little likelihood of an abatement of ethnicnationalism in the near future” (Williams, 1982: 36).
13.3 GRASSROOTS REACTIONS
SMALL IS BEAUTIFUL?
A peculiar paradox of the growing globalization of the world economy has been the stimulusit has provided to the destruction of some specialized local/regional economies and thedecentralization/localization of single plants or use of subcontractors at disparate locations.Breakthroughs in information and transportation technologies have made it possible todecentralize production operations to lower cost locations or ones with special advantages interms of access to technology, labor skills, or markets at the same time that central corporatecontrol is maintained or enhanced. This process has been brought about by increased com -petitive pressures on large firms from the appearance of foreign competitors. Many large firms,especially in Europe and the United States, now face a global marketplace far more competi-tive than the more geographically restricted ones they had known previously. Of course, asargued in general in Chapters 1 and 3, and then repeatedly in subsequent chapters, branch–plant industrialization is only one among a number of strategies for re-establishing firmcompetitiveness. And, it does not signify that there are not continuing and new pressures forthe clustering of production facilities. The point to be made here is more that, today, thereare greater incentives and technological possibilities for firms—even small firms—maintainingcontrol over production at a distance than was the case in the past.
Coincidentally, union/management conflicts in established production facilities and changesin market conditions, especially the increased demand in many developed countries for custom -ized rather than mass-produced goods, have also encouraged decentralization of production.In Italy, for example, one can see evidence of both causes. Large firms in Piemonte (aroundTurin) and Lombardia (around Milan) have increasingly contracted out to small firms for partsand services that used to be provided onsite at large factories. Moving production in this wayboth undermines the power of workers in large factories, where solidarity is more easily achievedthan in scattered small factories, and protects the large firm from the need to shed laborcyclically. In Emilia-Romagna (around Bologna) and elsewhere in central Italy many smallfirms provide customized products (both producer and consumer goods) to domestic and exportmarkets that are better served by the flexible response to shifts in fashion that these smallfirms can provide. Whether they can continue to do so in the face of intense competition fromChinese and other low cost producers in the same sectors remains to be seen. Some Italianfirms have already joined the rush to invest in China and Eastern Europe to reduce their wagebills once more, this time by foreign outsourcing rather than by relocating or decentralizingproduction within Italy.
To some commentators, however, the previous development of a highly competitive ThirdItaly (see Box 6.4) signified a wholehearted shift away from mass to customized production,with local rather than long-distance connections central to flexible production. In fact,although local clusters of small firms have been very important to this process, they are stronglytied into the longstanding industrial system and its main urban centers. So in Italy during the1990s the provinces that had the highest levels of foreign exports all cluster in the vicinity ofMilan in the “traditional” industrial northwest rather than in the Third Italy of central andnortheastern Italy (see Figure 13.3).
13. REASSERTION OF THE LOCAL IN THE AGE OF THE GLOBAL 391
6063 GEOGRAPHY WORLD ECON_PT_246x189 mm 22/01/2014 15:11 Page 391
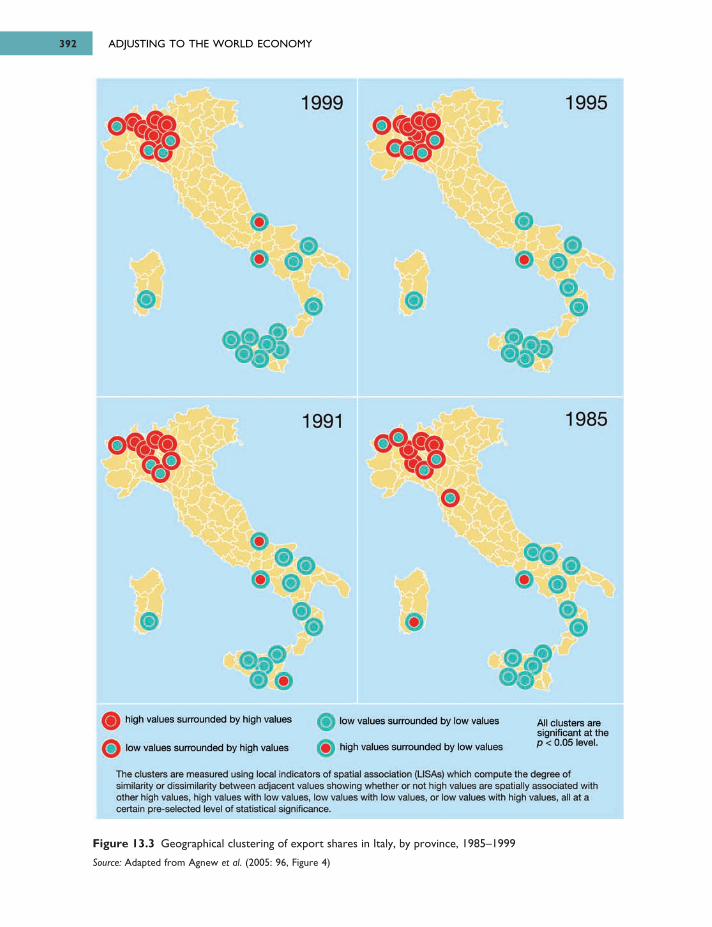
ADJUSTING TO THE WORLD ECONOMY392
Figure 13.3 Geographical clustering of export shares in Italy, by province, 1985–1999
Source: Adapted from Agnew et al. (2005: 96, Figure 4)
6063 GEOGRAPHY WORLD ECON_PT_246x189 mm 22/01/2014 15:11 Page 392
1999 1995
1991 1985
high values surrounded by high values low values surrounded by low values All clusters are significant at the p < 0.05 level.high values surrounded by low valueslow values surrounded by high values
The clusters are measured using local indicators of spatial association (USAs) which compute the degree of similarity or dissimilarity between adjacent values showing whether or not high values are spatially associated with other high values, high values with low values, low values with low values, or low values with high values, all at a certain pre-selected level of statistical significance.
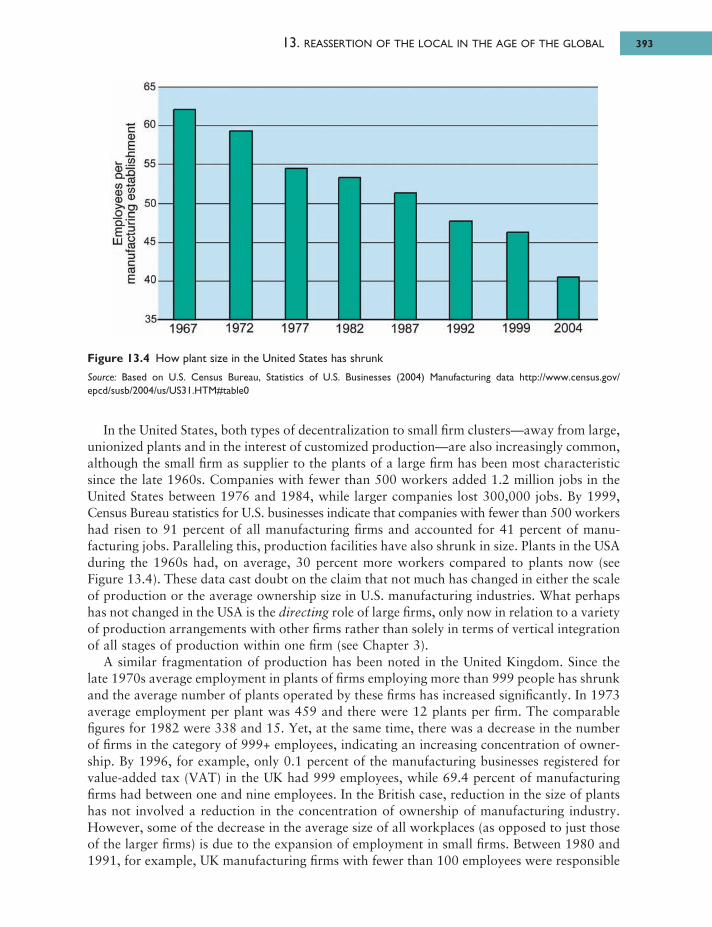
In the United States, both types of decentralization to small firm clusters—away from large,unionized plants and in the interest of customized production—are also increasingly common,although the small firm as supplier to the plants of a large firm has been most characteristicsince the late 1960s. Companies with fewer than 500 workers added 1.2 million jobs in theUnited States between 1976 and 1984, while larger companies lost 300,000 jobs. By 1999,Census Bureau statistics for U.S. businesses indicate that companies with fewer than 500 workershad risen to 91 percent of all manufacturing firms and accounted for 41 percent of manu -facturing jobs. Paralleling this, production facilities have also shrunk in size. Plants in the USAduring the 1960s had, on average, 30 percent more workers compared to plants now (seeFigure 13.4). These data cast doubt on the claim that not much has changed in either the scaleof production or the average ownership size in U.S. manufacturing industries. What perhapshas not changed in the USA is the directing role of large firms, only now in relation to a varietyof production arrangements with other firms rather than solely in terms of vertical integrationof all stages of production within one firm (see Chapter 3).
A similar fragmentation of production has been noted in the United Kingdom. Since thelate 1970s average employment in plants of firms employing more than 999 people has shrunkand the average number of plants operated by these firms has increased significantly. In 1973average employment per plant was 459 and there were 12 plants per firm. The comparablefigures for 1982 were 338 and 15. Yet, at the same time, there was a decrease in the numberof firms in the category of 999+ employees, indicating an increasing concentration of owner -ship. By 1996, for example, only 0.1 percent of the manufacturing businesses registered forvalue-added tax (VAT) in the UK had 999 employees, while 69.4 percent of manufacturingfirms had between one and nine employees. In the British case, reduction in the size of plantshas not involved a reduction in the concentration of ownership of manufacturing industry.However, some of the decrease in the average size of all workplaces (as opposed to just thoseof the larger firms) is due to the expansion of employment in small firms. Between 1980 and1991, for example, UK manufacturing firms with fewer than 100 employees were responsible
13. REASSERTION OF THE LOCAL IN THE AGE OF THE GLOBAL 393
Figure 13.4 How plant size in the United States has shrunk
Source: Based on U.S. Census Bureau, Statistics of U.S. Businesses (2004) Manufacturing data http://www.census.gov/epcd/susb/2004/us/US31.HTM#table0
6063 GEOGRAPHY WORLD ECON_PT_246x189 mm 22/01/2014 15:11 Page 393
60
55
50
45
40
65
35
cffiє
-C
щ o
ш ftQJ <u> - σ > o cO - i -Є -3ш TO
*5cCOE
1967 1972 1977 1982 1987 1992 1999 2004
for at least 50 percent of job creation, while firms with over 100 employees accounted for justover 60 percent of jobs lost. The expansion of employment in small manufacturing firms inthe United Kingdom, however, appears to lag well behind other countries such as Italy, Japan,and the United States.
The “decentralized economy,” however, is incredibly volatile. Patterns of new firm creation/destruction are extremely sensitive to minor cyclical fluctuations in demand from larger firmsand final markets. Many firms have tiny inventories and limited equity. Although advantageousfinancially, this introduces major limitations in terms of employee security and long-termcommitment to local economies. In this context, local rather than aggregate national conditionsare of increased significance for the welfare of populations. Political parties such as the LabourParty in the United Kingdom have supported the decentralization of some governmental powersover economic development as a reaction (in part, at least) to the increased localization ofeconomic activities. In Italy, the Communist Party (and since 1992 its successor party on theleft), excluded from national governments on a permanent basis during the Cold War, hasbeen a major sponsor of both economic and political decentralization in the central regions(Emilia-Romagna, Toscana and Umbria) where it dominates local government. Withoutsupportive national government policies, however, local economic initiatives organized on ageographical basis are problematic. Above all, they face the dilemma of protecting currentemployment while attempting to create local economies that can capture the benefits of“emerging” industries.
Perhaps local initiative and control or “small is beautiful” can only work when decision-making power is no longer vested in giant transnational corporations, as it still is even whensmall firms proliferate to serve them (as is the case even in many industrial districts). Forexample, the strategy for procuring components used by Ford in Europe involves the increaseduse of widely scattered and expendable suppliers. This approach is hardly amenable to eithergovernment controls or local economic development strategies geared towards long-termstability in employment. The lack of a “natural evolution” of economies towards greater securityof employment and increased participation in the benefits of economic growth has fuelled therevival of thinking about the possibility of wider popular participation in economic decisionmaking. The theme of economic democracy is especially strong in some recent proposals forstimulating the U.S. economy. Economic democracy refers to an egalitarian form ofpolitical–economic structure in which a serious attempt is made to democratize the economicsphere in general and workplaces in particular. The major point is to challenge the politicaland economic position of global capital and the commitment to it and its international roleby the major states (the UK, USA, etc.). It builds on the view characteristic of movements forparticipatory democracy that, to be more than a sham, democracy should be extended beyondepisodic political activities such as voting into the economic sphere.
ECONOMIC DEMOCRACY
Economic democracy differs from democratic capitalism (in both laissez-faire and welfare statemanifestations), in which democracy is limited to periodic involvement in electoral politicsand the means of production are largely privately owned. It also differs from conventionalstate socialism, especially of the now defunct Soviet variety, in which markets are prohibited(in public), there is little meaningful electoral politics and the means of production are ownedby the state.
There are a number of reasons why interest in both the theory and practice of economicdemocracy has increased in recent years. First, as the heavy “smokestack” industries in the
ADJUSTING TO THE WORLD ECONOMY394
6063 GEOGRAPHY WORLD ECON_PT_246x189 mm 22/01/2014 15:11 Page 394
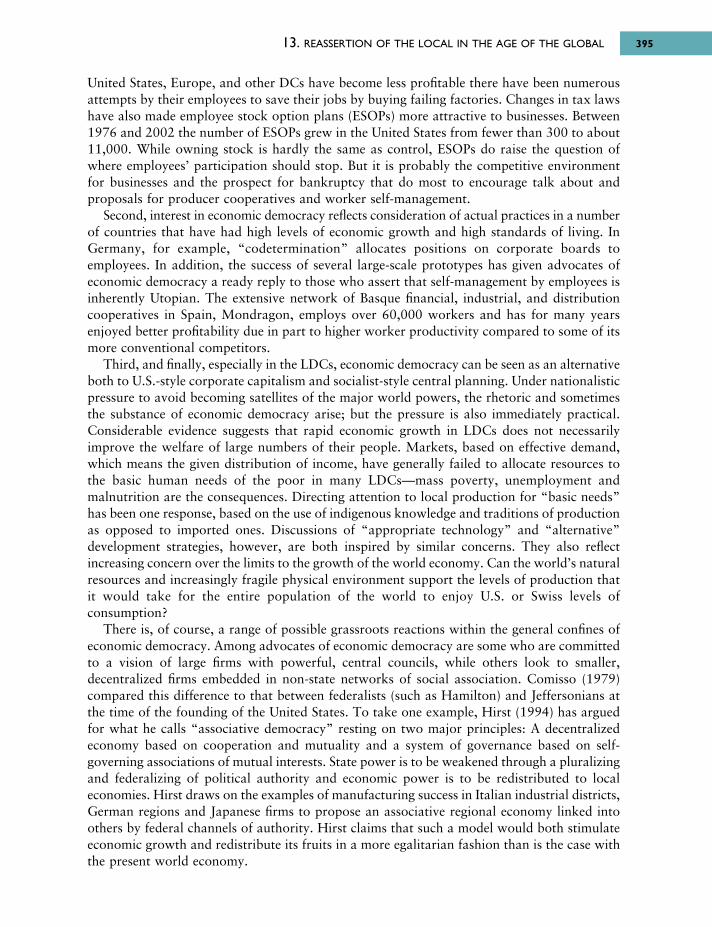
United States, Europe, and other DCs have become less profitable there have been numerousattempts by their employees to save their jobs by buying failing factories. Changes in tax lawshave also made employee stock option plans (ESOPs) more attractive to businesses. Between1976 and 2002 the number of ESOPs grew in the United States from fewer than 300 to about11,000. While owning stock is hardly the same as control, ESOPs do raise the question ofwhere employees’ participation should stop. But it is probably the competitive environmentfor businesses and the prospect for bankruptcy that do most to encourage talk about andproposals for producer cooperatives and worker self-management.
Second, interest in economic democracy reflects consideration of actual practices in a numberof countries that have had high levels of economic growth and high standards of living. InGermany, for example, “codetermination” allocates positions on corporate boards toemployees. In addition, the success of several large-scale prototypes has given advocates ofeconomic democracy a ready reply to those who assert that self-management by employees isinherently Utopian. The extensive network of Basque financial, industrial, and distributioncooperatives in Spain, Mondragon, employs over 60,000 workers and has for many yearsenjoyed better profitability due in part to higher worker productivity compared to some of itsmore conventional competitors.
Third, and finally, especially in the LDCs, economic democracy can be seen as an alternativeboth to U.S.-style corporate capitalism and socialist-style central planning. Under nationalisticpressure to avoid becoming satellites of the major world powers, the rhetoric and sometimesthe substance of economic democracy arise; but the pressure is also immediately practical.Considerable evidence suggests that rapid economic growth in LDCs does not necessarilyimprove the welfare of large numbers of their people. Markets, based on effective demand,which means the given distribution of income, have generally failed to allocate resources tothe basic human needs of the poor in many LDCs—mass poverty, unemployment andmalnutrition are the consequences. Directing attention to local production for “basic needs”has been one response, based on the use of indigenous knowledge and traditions of productionas opposed to imported ones. Discussions of “appropriate technology” and “alternative”development strategies, however, are both inspired by similar concerns. They also reflectincreasing concern over the limits to the growth of the world economy. Can the world’s naturalresources and increasingly fragile physical environment support the levels of production thatit would take for the entire population of the world to enjoy U.S. or Swiss levels ofconsumption?
There is, of course, a range of possible grassroots reactions within the general confines ofeconomic democracy. Among advocates of economic democracy are some who are committedto a vision of large firms with powerful, central councils, while others look to smaller,decentralized firms embedded in non-state networks of social association. Comisso (1979)compared this difference to that between federalists (such as Hamilton) and Jeffersonians atthe time of the founding of the United States. To take one example, Hirst (1994) has arguedfor what he calls “associative democracy” resting on two major principles: A decentralizedeconomy based on cooperation and mutuality and a system of governance based on self-governing associations of mutual interests. State power is to be weakened through a pluralizingand federalizing of political authority and economic power is to be redistributed to localeconomies. Hirst draws on the examples of manufacturing success in Italian industrial districts,German regions and Japanese firms to propose an associative regional economy linked intoothers by federal channels of authority. Hirst claims that such a model would both stimulateeconomic growth and redistribute its fruits in a more egalitarian fashion than is the case withthe present world economy.
13. REASSERTION OF THE LOCAL IN THE AGE OF THE GLOBAL 395
6063 GEOGRAPHY WORLD ECON_PT_246x189 mm 22/01/2014 15:11 Page 395
One important objection to economic democracy of all types, but especially the moredecentralized ones, is that they are Utopian dreams since those in power will not hear of them.The world is now bureaucratized; bureaucracies will not seriously consider participatorydemocracy. In particular, most states are run by oligarchies determined to fix the best dealsfor themselves from transnational corporations and the most powerful states. Williams (1981),however, has defended the need for utopias. He argues that:
[T]he purpose of a radical utopia is to create a tension in our souls . . . We must imagine somethingbetter. That defines us as people who offer our fellow citizens a meaningful choice about how wecan define and live our lives . . . Radicals must confront centralized nationalism and internationalismand begin to shake it apart, break it down, and imagine a humane and socially responsiblealternative. It simply will not do to define radicalism as changing the guard of the existing system.
(W.A. Williams, 1981: 95, 98)
In essence, this is what grassroots reactions inspired by a vision of economic democracy arereally all about.
A second objection is more by way of a critique of possibilities of successful long-term localdevelopment in the absence of a relatively strong state presence in economic regulation. Amin(1996: 309–310), for example, is critical of proponents of local “associative democracy”(particularly Hirst) for “failing to distinguish between different forms of state economicintervention and state practice,” and for undervaluing “the strategic and developmental roleplayed by the state in some of the most successful economies in the world.” In a somewhatdifferent vein, Donahue (1997) has claimed that a state defines something of a commons inwhich externalities across local and regional boundaries are so intense as to vitiate against thepossibility of ever successfully separating out groups of people into discrete geographicalcommunities that can be run as if the others did not exist. Federalism is about achieving a balance between the common and the particular. For Donahue (1997: 42), the “devil indevolution” is that, in the U.S. case, the dominant consensus:
[I]n favor of letting Washington [the U.S. federal government] fade while the states take the leadis badly timed. The public sector’s current trajectory—the devolution of welfare and otherprograms, legislative and judicial action circumscribing Washington’s authority, and the federalgovernment’s retreat to domestic role largely defined by writing checks to entitlement claimants,creditors, and state and local governments—–would make sense if economic and cultural tiesreaching across state lines were weakening over time. But state borders are becoming more, notless permeable.
SUMMARYIn this chapter, three types of decentralist reaction to the impact of the world economy havebeen described in the context of the trend towards globalization of economic activities.
Regionalism and regional policy under state sponsorship were common up until the 1960sbut their relevance has increasingly been questioned in the face of the changed relation-ship between national and world economies. In many countries, regional and local tiers ofgovernment have tended to displace the regionalism carried out under the sponsorship ofnational governments.
Nationalist separatism challenges existing states, international and supranational organiza -tions, and the existing distribution of economic activities. But most separatist movements willusually settle for something less than complete independence.
ADJUSTING TO THE WORLD ECONOMY396
6063 GEOGRAPHY WORLD ECON_PT_246x189 mm 22/01/2014 15:11 Page 396
Finally, recent trends in the world economy have generated renewed interest in the possibilityof economic democracy. Disillusionment with both U.S.-style corporate capitalism and Soviet-style socialism in the face of an increasingly volatile world economy has directed attention tothe possibility of people taking control of their economic activities and putting them to workfor them.
Whether or not decentralist reactions increase in importance depends in part on whetherthe world economy recovers from its present problems, especially the debt crisis, the slowingof growth in world trade and the lack of congruence between global production and globalconsumption, and whether or not the free market ideologies antithetical to many of thesereactions and associated for many years with the Reagan/Bush administrations in the USA,and the Thatcher/Major governments in the United Kingdom continue to find support aroundthe world and in international organizations such as the World Bank. Without some dramaticrebalancing of global patterns of production and consumption, and the geographical spreadof the benefits of globalization, the trend towards decentralist reactions may prove inexorableas people begin to take their fate into their own hands.
KEY SOURCES AND SUGGESTED READINGAmin, A. and Thrift, N., 1992. Neo-Marshallian Nodes in Global Networks, International Journal of
Urban and Regional Research 16, 571–587.Brusco, S. and Sabel, C., 1981. Artisan Production and Economic Growth, in F. Wilkinson (ed.), The
Dynamics of Labour Market Segmentation. London: Academic Press.Eisenschitz, A. and Gough, J., 1992. The Politics of Local Economic Policy: The problems and
possibilities of local initiative. London: Macmillan.Gause, F.G., 2005. Can Democracy stop Terrorism?, Foreign Affairs 84(5), 62–76.Harvie, C., 1994. The Rise of Regional Europe. London: Routledge.Johnston, R.J., 1986. The State, the Region, and the Division of Labor, in A.J. Scott and M. Storper
(eds.), Production, Work, Territory: The geographical anatomy of industrial capitalism. Boston, MA:Allen & Unwin.
Rokkan, S. and Urwin, D., 1983. Economy, Territory, Identity: Politics of west European peripheries.London: Sage.
Scott, A.J., 1998. Regions in the World Economy. Oxford: Oxford University Press.Shin, M.E., Agnew, J., Breau, S., and Richardson, P., 2006. Place and the Geography of Italian Export
Performance, European Urban and Regional Studies 13, 195–208.
13. REASSERTION OF THE LOCAL IN THE AGE OF THE GLOBAL 397
6063 GEOGRAPHY WORLD ECON_PT_246x189 mm 22/01/2014 15:11 Page 397
In this book, the task of making sense of the geographical pattern of economic activities around the world has been pursued using the geographical metaphor of core and periphery;this provides a basic model or way of seeing, against which actual patterns of economic
activities at a range of scales can be compared. Even at scales finer than the global, or worldregion like Europe, the core–periphery conceptualization can be useful in thinking about howthe core and periphery intersect locationally. The social, economic, and locational polarizationof migrant workers in world cities such as Los Angeles, for example, reflects a kind of peripheryor semi-periphery existing within the core. Significant pockets of wealth in some NIEs and oilrich semi-peripheral countries, in contrast, could be viewed as part of the core within the semi-periphery.
In this connection, geographers Stephen Graham and Simon Marvin identified an importanttendency in cities—splintering urbanism. Splintering urbanism is characterized by an intensegeographical differentiation, with individual cities and parts of cities engaged in different—and rapidly changing—ways in ever broadening and increasingly complex circuits of economicand technological exchange. The uneven evolution of networks of information and communi -cations technologies is forging dynamic landscapes of innovation, economic development, andcultural transformation, while at the same time intensifying social and economic inequalitieswithin and between cities.
In this book, a number of claims about the processes creating and recreating economiclandscapes have been investigated using a historical–geographical framework deriving froman evolutionary perspective on the development of the world economy. In this short concludingchapter, the key elements in the argument are drawn together as a way of summarizing thisperspective and pointing the reader back to the themes of the introductory chapters. A numberof controversial issues at the heart of contemporary academic and policy debates are alsointroduced to highlight the open-ended and exciting character of globalization.
First, the world economy is an open system that evolves over time. Although there is anobvious geographical path dependence to its motion, as illustrated by the return to initial
Picture credit: © European Union, 2013
Chapter 14
Conclusion
6063 GEOGRAPHY WORLD ECON_PT_246x189 mm 22/01/2014 15:11 Page 398
advantage produced through increasing returns to scale, there are also locational reversals andshifts in the way it works in different contexts. So although the core of the world economywas the first to industrialize on a massive scale, some other parts of the world have recentlyexperienced a substantial expansion in industrial and, more recently, service activities. Thisreflects the shifts in the operation of the world economy detailed in Chapters 4–11, especiallythe disintegration of Fordism that was important in the core for much of the twentieth century.The workings and outcomes of the world economy, therefore, are not set in stone but evolveand change over time. In particular, the evolution of the world economy is not best thoughtof as a cyclical repetition of what has happened previously only with different technologiesand countries. The mechanisms driving the world economy have also changed. Today, forexample, it is misleading to suppose, as some scholars still do, that the globalization ofproduction and finance is essentially indistinguishable from the territorialization of productionand trade within empires that characterized the world economy in the late nineteenth andearly twentieth centuries. These are different processes and should be seen as such.
Second, this dynamic understanding of the world economy allows us to combine a focuson general economic forces with a concern for the local variability that characterizes the world economy. The expansion of the world economy has incorporated regions with distinc-tive economic histories that are themselves changed in different ways as they engage with theinterests and influences emanating from organizations that span ever larger geographical areas.The growth of the world economy has produced difference rather than homogenization. Theuniqueness of different places is the result of interaction over space rather than of a singularityproduced by isolation. This approach challenges the assertion that globalization portends thedemise of uneven development or a progressive reduction of economic differences betweenplaces. The “end of geography” remains nowhere in sight. Indeed, recent trends indicate adeepening of differences between regions and localities within countries as well as betweencountries at a global scale. These reflect not only the impact of decisions by transnationalcorporations and major economic differences between countries but also the relative successof localities and regions in inserting themselves into the world economy.
Third, the evolution of the world economy has followed a number of long-term cyclicalfluctuations that correlate strongly with the emergence of distinctive technological systems. Avital dimension of change bringing about these shifts has been the transformation of the natureof capitalism. The earliest phase, that of competitive capitalism, lasted from the eighteenthcentury until the end of the nineteenth. The second phase, that of organized capitalism basedon close coordination between business, government and labor, dominated throughout muchof the twentieth century. However, we have now shifted to a third phase, that of advancedcapitalism, in which the geographical coincidence between production and consumption thatcharacterized the previous phase has unraveled. Rather than a sudden shift, however, thetransition has been gradual with some “old” and many more “emerging” sectors representingmost clearly the new forms of organization and production.
The focus on cycles can lead to the overemphasis of sharp breaks and the exaggeration ofthe suddenness of change. The idea of total change is open to doubt, as argued in the latterpart of Chapter 3 where the new “regional motors” of the world economy are placed in thecontext of a range of locational outcomes depending on the mix of externalities and spatialtransaction costs associated with different economic sectors. Mass production is still important,particularly in relation to LDC industrialization such as that in manufacturing export processingzones (EPZs). But it is a mistake to identify the continuance of some mass production with thepersistence of Fordism or with the absence of any break with the past in the essential structureof economic organization. What is also clear, however, is that the flexible production systems
14. CONCLUSION 399
of TNCs today (see Chapters 3 and 7) do not necessarily portend a stable and irreversible patternthat will extend indefinitely into the future.
Fourth, as the world economy has evolved so have the economic and locational principlesthat govern its operation. The perfect competition, transportation costs, factor endowments,and comparative advantage that were important in competitive capitalism and, to a lesser degree,with organized capitalism, have faded in relative significance. Today, monopolistic competition(sectors dominated by small numbers of large companies), macroeconomic regulation, themarket access form of international relations, position in the global urban hierarchy, globalfinancial networks, regional motors, industrial districts, economies of scope and coordination,and competitive advantage are all more important (Chapters 3–11). This means that thetraditional models of economic activities that identified, for example, transportation costs asthe key factor in determining location are misleading in contemporary circumstances. Suchstatic models—based on the presumed eternal significance of this or that factor, and so deafto history and geography—need to be adjusted or supplemented by more dynamicconceptualiza tions of change (in this connection, see Ron Martin’s (1999) critique of the “neweconomic geography” and the work of economists including Paul Krugman and Michael Porter).And during the last few years, there have been a number of promising theoretical reorientationsin economic geography (including the “relational turn,” as well as attention for the culturaleconomy (see Chapter 7)).
Fifth, although neglected by economic analysts in the past, the daunting environmentalproblems associated with such trends as the destruction of tropical rainforests, climate change,and increasing air, soil and water pollution are vitally important in understanding the worldeconomy. Despite the disproportionate per capita use of non-renewable resources by the corecountries, most of these threats are greatest in the world’s LDCs, and will intensify the contrastsbetween rich and poor regions. Environmental problems are inseparable from processes ofeconomic development and human welfare. These issues are alarming not only for the peoplein the affected regions but also for the people in the DCs; it is clear that environmental problemsare increasingly enmeshed in matters of national security and regional conflict. The main concernis that the continued prosperity of the DCs and the growing prosperity of the LDCs may dependon processes of globalization that are being disrupted by large-scale environmental disasters,unmanageable mass migrations, or breakdowns of economic and political stability in the worldas a whole.
Sixth, political regulation of economic activities is fundamentally important in understandingthe world economy, yet was typically neglected or ignored in conventional economic explan -ations. The achievement of competitive advantage by companies rests importantly on politicalorganization and coordination. The real world economy is not one of laissez-faire economicsbut of political economy. Macroeconomic policies regulating agriculture, industry, and serviceshave significant and often determining impacts on economic landscapes. The rise of differentnational economies within the world economy both historically and currently by the NIEsreflects in part the organizational and mobilization capabilities of governments. Financialsystems are particularly important in mediating between states and the investment decisionsof firms that are so important in influencing patterns of economic location (Chapter 3). Todaygovernments face the challenge of coping with trends towards globalization and localizationthat make economic management much more problematic than in the past. One reaction—creating trading blocs such as the European Union (see Chapter 12)—threatens both toreinforce economic inequities within the world trading system and, through its centralizationof decision making in distant seats of power, further stimulate the decentralist politics of varioustypes already under way around the world (see Chapter 13). Success in many sectors of the
ADJUSTING TO THE WORLD ECONOMY400
6063 GEOGRAPHY WORLD ECON_PT_246x189 mm 22/01/2014 15:11 Page 400

world economy also seems related to certain social and cultural attributes, such as high levelsof social trust and well-developed social networks supporting, for example, the links betweendominant firms and subcontractors. This strongly suggests that global analysts can no longerneglect consideration of the institutional, sociological and cultural bases of economic activity(see Chapter 7).
As we have tried to show throughout this book, the world economy is a complex andchanging intermeshing of institutions and markets producing different effects in different places,rather than a closed global isotropic plain governed by the same invariant determinantseverywhere and always. This is the central message we hope you take away from reading thisbook.
KEY SOURCES AND SUGGESTED READINGFlint, C.R. and Taylor, P.J., 2007. Political Geography: World-economy, nation-state and locality. Upper
Saddle River, NJ: Pearson Education.Jacobs, J., 2004. Dark Age Ahead. New York: Random House.Stutz, F.P. and Warf, B., 2012. The World Economy: Geography, business and development, 6th edn.
Upper Saddle River, NJ: Pearson Education.
14. CONCLUSION 401
6063 GEOGRAPHY WORLD ECON_PT_246x189 mm 22/01/2014 15:11 Page 401

6063 GEOGRAPHY WORLD ECON_PT_246x189 mm 22/01/2014 15:11 Page 402
This page intentionally left blank
advanced capitalism (disorganized capitalism, globalized capitalism) Label given to the mostrecent or advanced phase of capitalism that uses flexible production systems. Underadvanced capitalism, relationships between capital, labor, and government are more flexible,largely because a great deal of corporate activity has escaped the framework of nation-states and their institutions that still constrain organized labor and most governmentfunctions.
African Union (AU) The 53 members of the AU, formerly the Organization of African Unity(OAU), represent nearly all African countries. A treaty that entered into force in 1994 putthese countries on the road to a continent-wide African Economic Community (AEC).
agglomeration Clustering together of functionally related activities. This clustering allowsagglomeration economies—cost advantages that accrue to individual firms because of theirlocation among functionally related activities.
agglomeration economies Cost advantages that accrue to individual firms because of theirlocation clustered together among functionally related activities.
agribusiness An integrated, corporate system, involving all aspects of agriculture, from foodproduction, to processing and distribution. The direct corporate involvement of TNCs inagriculture is an aspect of the new international division of labor (NIDL).
Asian Tigers The four Asian Tigers—Hong Kong, Singapore, South Korea, Taiwan—are socalled because they adopted an export-driven model of economic development that allowedthem to maintain high rates of economic growth and industrialization during the later decadesof the twentieth century.
autarky National economic self-sufficiency and independence.back-office functions Record keeping and analytical functions that do not require frequent
personal contact with clients or business associates and so can be located in back officesin lower rent areas instead of the high-rent locations necessary for the front offices ofcompanies, such as banks.
backwash effects The negative spillover effects on a region (or regions) of the economic growthof some other region.
batch production Manufacturing production involving small batches (rather than continuousmass production) of similar items. Small-batch, just-in-time (JIT) production and distribu-tion systems can allow producers to reduce the costs of raw materials stockpiles, partsinventories, and warehousing.
BPO See business process outsourcingbranch plant A factory, often located in a low-cost country or region, that belongs to a company
that is headquartered elsewhere.branch–plant industrialization The growth of manufacturing employment in declining
industrial regions to which companies have moved some or all of their operations in orderto take advantage of reserves of skilled manual labor, cheap factory space, and an establishedinfrastructure. Branch–plant industrialization proper typically involves activities that requiresignificant inputs of technology and of skilled (or at least experienced) labor and that also
Glossary
6063 GEOGRAPHY WORLD ECON_PT_246x189 mm 22/01/2014 15:11 Page 403
require a certain degree of centrality in order to assemble and distribute raw materials andfinished products, such as light industries (car batteries, cash registers, and cameras to tires,watches, and light engineering), white-collar information processing and wholesalingfunctions.
Bretton Woods Agreement An effort to stimulate international trade by stabilizing currencyfluctuations between countries. The allies met for a conference in Bretton Woods, NewHampshire, in 1944 in order to make financial arrangements for the postwar periodfollowing the anticipated defeat of Germany and Japan. They established a system of fixed exchange rates that lasted until 1971. The U.S. dollar served as the convertible mediumof currency with a fixed relationship to the price of gold. The representatives of 44countries, including the Soviet Union, also agreed to establish the International Bank forReconstruction and Development (of the World Bank) and the International Monetary Fund(IMF).
BRICs The term comes from 2003 when economists at the U.S. investment bank, GoldmanSachs, predicted that during the following 50 years, Brazil, Russia, India and China—termedthe BRIC economies—could become a major force in the world economy, primarily asexport-oriented manufacturing centers (particularly in the cases of China and India) butalso as major export-oriented resource economies (particularly in the case of Russia andBrazil).
business process outsourcing (BPO) BPO is a cost-saving measure that involves the contractingout of business tasks—such as insurance claims processing, billing services, credit cardservices, telemarketing—to another company either domestically or internationally.
business services A subset of producer services. Business services include legal services,advertising and marketing, public relations, accounting, research and development,personnel training, recruitment, architecture and engineering, and consulting.
capital flight The withdrawal of liquid assets from a national economy by domestic and overseasinvestors or transnational corporations.
capital goods Producer goods that are “fixed,” e.g., machinery and heavy equipment, and usedto produce other goods.
capitalization The process whereby capital-intensive inputs such as technology are deployedby large firms and replace labor-intensive methods associated with smaller scale production.
captive outsourcing Captive outsourcing involves “internal” outsourcing where a companyfrom a country where labor and other costs are high has certain manufacturing or servicesactivities undertaken by an affiliated company in another country where the work can bedone more cheaply. See also offshore outsourcing, offshoring, outsourcing
carrying capacity Used in the context of food and agriculture, this term refers to the maximumpopulation that can be supported within a given territory on a minimum daily diet, giventhe quality of local soils and local climatic conditions and assuming the availability ofappropriate forms of mechanization.
cartel An organization of independent producers or traders who agree to restrict output, fixprices, or divide markets in order to improve the profitability of its members. A well-knowninternational cartel is the Organization of Petroleum Exporting Countries (OPEC).
cash crops Crops grown by farmers for trade or sale (as opposed to subsistence crops wheremost of what is produced is consumed by the farmers and their families).
Celtic Tiger Comparing Ireland’s incredible economic boom to that of the Asian Tigers (HongKong, Singapore, South Korea, Taiwan), economist Kevin Gardiner, working for the U.S.investment bank Morgan Stanley, coined this term to describe Ireland’s astonishing growthrates of between 5 and 10 percent of gross domestic product during the 1990s. By the end
GLOSSARY404
6063 GEOGRAPHY WORLD ECON_PT_246x189 mm 22/01/2014 15:11 Page 404
of the decade unemployment was down to 4.5 percent, the national debt was down andthe country’s GDP per capita had outstripped that of the UK and even Germany.
central place systems and central places Central places are urban centers (hamlets, villages,towns, cities) that provide goods and services to their surrounding hinterlands (market areas). A central place system comprises a hierarchy of central places—ranging from a smallnumber of very large central places (cities) that offer higher order goods (expensive andinfrequently purchased items, such as designer furniture and jewelry) at the top of thehierarchy, down to a large number of small central places (hamlets) that offer low-ordergoods (inexpensive, frequently purchased, everyday necessities, such as newspapers and milk).
centralization A trend towards corporate economic integration that involves the ownershipof private enterprise by progressively fewer corporations. It is the result of corporate mergersand takeovers and is characterized by diversified, conglomerate, transnational corporations(TNCs).
client states Countries that are dependent, economically or militarily, on larger and morepowerful countries.
collectivization of agriculture The creation of communal (collective ownership) farms.COMECON (also known as the Council for Mutual Economic Assistance (CMEA)) A
communist international organization established in 1949 to reorganize the eastern Euro -pean economies in the Stalinist mold—even to the point of striving for autarky for individualmembers, each pursuing independent, centralized plans. This proved unsuccessful, however,and in 1958 COMECON was reorganized by Stalin’s successor, Khrushchev. The goal ofautarky was abandoned, mutual trade among the Soviet bloc was fostered and some tradewith western Europe was permitted. COMECON was disbanded in 1991 because the fallof communism and the shift to democracy and capitalism in eastern Europe made itredundant.
command economy An economy commanded from a central administration, in which the meansof production are publicly owned. The central administration plans what and how manygoods will be produced and sets prices. Communist countries such as the former SovietUnion, North Korea, Vietnam, and Cuba established command economies; the commandeconomy model was imposed on the countries of eastern Europe that had been liberatedfrom German occupation by Soviet forces.
commodity chain A network of labor and production processes beginning with the extractionor production of raw materials and ending with the delivery of a finished commodity.
common market A form of international economic integration that involves the eliminationof tariffs and other trade barriers between members states, the removal of internalrestrictions on the movement of factors of production and the creation of a common setof trade agreements with non-member countries.
comparative advantage The principle used to explain patterns of trade and specialization: Ifeach region or country specializes in those economic activities they perform relatively betterthan others and imports goods for which their own production costs are relatively higher,each is likely to gain (transport costs and terms of trade notwithstanding).
competitive advantage The advantage acquired in economic competition by some locationsbecause of the benefits that accrue from an early start in production of a particular goodand the continuing defense of that historic base through superior organization andadaptability. Other locations can suffer from a competitive disadvantage due to the absenceof an initial advantage that would have allowed them to develop and maintain an ongoingcompetitive advantage.
GLOSSARY 405
6063 GEOGRAPHY WORLD ECON_PT_246x189 mm 22/01/2014 15:11 Page 405
competitive capitalism The early phase of industrial capitalism, lasting until about 1890,characterized by comparatively high levels of free market competition, with many small-scale producers, consumers, and workers who acted almost completely independently, andwith relatively little government intervention.
competitive disadvantage The disadvantage suffered in economic competition by some locationsbecause of the absence of an initial advantage that would have allowed them to developand maintain an ongoing competitive advantage.
concentration A trend towards the reduced numbers of firms in any given industry or economicsector. It is partly the result of the elimination of smaller weaker firms through competitionand partly the result of corporate mergers and takeovers.
consumer durables Goods intended to be used for a number of years, e.g., householdappliances.
consumer goods Commodities purchased by individuals or households for final consumption.Consumer goods comprise consumer durables (goods intended to be used for a number ofyears, e.g., household appliances, automobiles) and consumer non-durables (goods intendedfor relatively immediate consumption, e.g., fresh fruit, ice cream).
consumer services Personal services, including retailing, medical care, personal grooming, leisureand recreation, culture and entertainment.
containerization Automated cranes efficiently load and unload massive standardized containersfilled with large amounts of cargo between the ships and the flatbeds of nearby trains andtrucks. Before container cargo handling, ships, trains, and trucks sat in port while majoritems of cargo were loaded and unloaded individually by a sizeable intensive workforce.Containerization has improved the operation of cargo shipping and handling by reducingthe turnaround time at ports.
cordon sanitaire A chain of independent buffer countries set up to form a barrier (literally, a“sanitary line”) around a country that is considered hostile militarily or dangerousideologically.
creative destruction The withdrawal of investments from activities (and regions) that yield lowrates of profit, in order to reinvest in new activities (and new places).
crossover system of trade A system of multilateral trade established in the late nineteenthcentury, which lingered into the 1930s. Europe and North America bought raw materialsfrom less developed countries (LDCs). In return, Britain imported manufactures from andexported capital to Europe and North America. Britain’s assets were boosted by the returnon foreign investment and the export of manufactured goods to the LDCs (both coloniesand independent states).
cultural economy The cultural economy can be defined as a group of sectors (cultural productsindustries) that produce goods and services—including jewelry, live theatre, music recording,film production—whose symbolic value to consumers is high relative to their practicalpurpose.
cumulative causation A spiral buildup of advantages that occurs in specific geographic settingsas a result of the development of agglomeration economies, external economies of scale,and localization economies.
customs union A form of international economic integration that involves the elimination ofsome (but not necessarily all) trade barriers between member states and the creation of acommon set of trade barriers to non-member states.
debt trap The cycle of borrowing that results when the productivity gains from investmentsundertaken with borrowed capital are insufficient to meet interest repayments. Further loans
GLOSSARY406
6063 GEOGRAPHY WORLD ECON_PT_246x189 mm 22/01/2014 15:11 Page 406
and debt rescheduling provide temporary relief, but in the long term make it even moredifficult to achieve increases in productivity sufficient for self-sustaining growth.
deindustrialization Many authors use this term rather loosely. At the heart of the concept isa relative decline in industrial employment in a country or region in which industry hastraditionally been a significant component of the economy. It may be the result of climactericchanges or of secular shifts in an economy that are related to technological change and/orthe globalization of the economy. In some instances, such trends may involve not just arelative decline but an absolute one; and may involve declining industrial output as well asemployment.
demographic transition The evolution of vital rates—birth rates and death rates—over time,from high to low levels. The demographic transition model posits improved diets, publichealth and scientific medicine as causing a steady decline in death rates with increasing levelsof economic development over time. Birth rates decline later, and more slowly, associocultural practices take time to adjust to these new circumstances. The result is a sharpincrease in population growth, until birth rates fall to relatively low levels. This model isbased on the experience of DCs and so all LDCs should not be expected to follow thisexact demographic path.
dependence or dependency A high level of dependence by a country on foreign enterprises,investment or technology. External dependence for a country can mean that it is highlydependent on levels of demand and the overall economic climate of other countries.Dependency for a LDC, for example, can result in a narrow economic base in which thebalancing of national accounts and the generation of foreign exchange are dependent onthe export of one or two agricultural or mineral resources.
deskilling A reduction in the range and level of skills within a local labor market that is theresult of two trends: Increased mechanization and computerization of production processes(including management and management support functions) and the geographic consolida-tion and localization of higher skilled activities in world cities, major control centers andcenters of innovation (which leaves other labor markets with a preponderance of routinejobs in local offices and branch plants).
diagonal integration A form of business organization in which a company tries to diversifyits interests by using corporate mergers or acquisitions of firms that are engaged in separateand distinct enterprises, producing different goods or services for different markets. Anautomobile manufacturer, for example, may buy into energy, advertising, or entertainmentcompanies.
differential of contemporaneousness In regional economic development, new technologies, ideas, and market conditions may reach different regions at the same time, but they impactthe regions in very different ways because they were differently equipped to respond tothem.
diffuse industrialization The growth of manufacturing employment in rural regions, in whichcompanies decentralize some or all of their activities from established centers of operation,such as a major city, in response to the increasing shortage, cost, and militancy of laborthere and the availability of reserves of relatively cheap and non-unionized unskilled andsemi-skilled labor, less expensive/more available land, and lower taxes in rural areas.Typically, diffuse industrialization involves activities in which labor costs are an importantpart of overall production costs and in which there has been little scope for reducing laborcosts through technological change.
digital divide The digital divide refers to the gap in opportunities between individuals,households, businesses, and areas at different socioeconomic levels to access advanced
GLOSSARY 407
6063 GEOGRAPHY WORLD ECON_PT_246x189 mm 22/01/2014 15:11 Page 407
information and communication technologies (ICTs) for a variety of activities. The digitaldivide exists both within countries (for example, between urban and rural areas or betweenricher and poorer neighborhoods) and between countries or groups of countries (forexample, between the LDCs and the DCs). The primary concern is that lack of access toand development of information, communication and e-commerce technology will preventmany people from benefiting from the new knowledge-based economy.
diminishing returns (law of) The tendency for productivity to decline, after a certain point,with the continued application of capital and/or labor to a given resource base. A simpleexample is provided by agricultural productivity: A large farm will yield progressively higherlevels of output with the addition of more farm hands and more machinery, but there willbe a point at which productivity decreases as some of the labor and machinery is under-employed, people get in one another’s way, and coordination of activities becomes costly.
disorganized capitalism (advanced capitalism) The label given to the most recent or advancedphase of capitalism that uses flexible production systems. Under disorganized capitalism,the relationships between capital, labor, and government are more flexible, largely becausea great deal of corporate activity has escaped the framework of nation-states and theirinstitutions that still constrain organized labor and most government functions.
ecological footprint The World Wide Fund for Nature’s (WWF) measure of the humanpressures on the natural environment from the consumption of renewable resources andthe production of pollution. The ecological footprint indicates how much space a populationneeds compared to what is available. It changes in proportion to population size, averageconsumption per person, and the resource intensity of the technology being used. It ismeasured in “area units,” where one area unit is equivalent to one hectare of biologicallyproductive land with world average productivity. As land varies in productivity, a hectareof highly productive cropland would represent more area units than the same amount ofless productive grazing land.
economic union A form of international economic integration that involves the removal of allinternal barriers to trade and the movement of factors of production, the creation of acommon set of trade barriers, and trade agreements with non-member states and thecoordination of integrated economic policies within the union.
economies of scale Cost advantages for firms from large-scale production. Economies of scalein production are equivalent to increasing returns to scale. See also economies of scope,internal economies of scale
economies of scope Cost advantages from large-scale flexible organization. Economies createdby the capacity to provide entirely new products and/or services through the flexible useof the same production or service network.
elasticity of demand The degree to which levels of demand for a product or service change inresponse to changes in price. Where a relatively small change in price induces a significantchange in demand, elasticity is high; where levels of demand remain fairly stable in spiteof price changes, demand is said to be inelastic.
encapsulation Howells’ (2003) notion of service encapsulation of goods and materials illustrateshow services are increasingly incorporated into manufactured products. Manufacturedproducts are offered to consumers not in their own right but in terms of their wider serviceattributes. Either the manufactured product is offered along with closely aligned serviceproducts in a single package (e.g., finance, insurance, maintenance warranties with anautomobile purchase) or the consumer may not be offered the manufactured product itself
GLOSSARY408
6063 GEOGRAPHY WORLD ECON_PT_246x189 mm 22/01/2014 15:11 Page 408
in a single one-time purchase, but may be offered the service that the manufactured productoffers in a continuing process involving long-term customer contact through service delivery(e.g., automobile lease instead of purchase).
enterprise zone An officially designated economically distressed area where public fiscal andother incentives are available as an inducement to private companies to locate and createjobs there.
entrepôt A port that specializes in the trade of goods for re-export. Entrepôts operate primarilyas intermediary trading centers—they receive goods from foreign countries for re-export toother countries. Hong Kong, Singapore, and Rotterdam are the world’s top three entrepôts.
eurodollars U.S. currency that is held in banks located outside the United States, traditionallymostly in Europe, hence the name. Currently, China holds the largest amount—in thehundreds of billions. It is a pool of currency for which there is a distinctive and independentmarket, because it conventionally represented a fairly stable, hard currency that is beyondthe control of the U.S. government and its financial institutions. At the same time, the strengthof the U.S. economy and the value of the dollar affect investor confidence in eurodollars.
export processing zones (EPZs) Small, closely definable areas within which especially favorableinvestment and trading conditions are created by governments in order to attract export-oriented industries, usually foreign owned. These conditions include the absence of foreignexchange controls, the availability of factory space and warehousing at subsidized rents,low tax rates, and exemption from tariffs and export duties.
external control The term refers to situations in which employment opportunities and decisionsabout investment and production in a given plant or locality are controlled by corporatemanagers based in other cities, regions or countries.
external economies of scale The specific benefits that accrue to producers from associatingwith similar producers in places that offer services that they need.
externalities Side-effects or consequences (of an industrial or commercial activity) that affect other parties without being reflected in the current cost of the goods or servicesinvolved.
factors of production The fundamental components of any economic system: Land, labor, andcapital. Land includes not only space or territory but also the associated soils and naturalresources. Labor includes not only the size of the available workforce but also its skills,experience, and discipline. Capital includes not only money capital but also everythingdeliberately created for the purpose of production, such as factories and machinery (i.e.,“fixed” capital). A fourth factor, enterprise, is often recognized, although it may be missingfrom some forms of economic organization (e.g., subsistence economies), while it maylegitimately be regarded as one aspect of labor.
“fallow” agriculture or shifting cultivation Involves sowing or planting on scorched land usingslash-and-burn methods (cutting down the natural vegetation (e.g., forest) and burning itto release its nutrients into the soil). No special tools are required for such a system, neitheris weeding or fertilization necessary, provided that cultivation is shifted in a couple of yearsto another burned plot after a few crops have been taken from the old one, which is thenabandoned (left fallow) for a period of time.
feudalism and feudal systems Forms of economic organization based on a mode of productionin which the surplus product (i.e., the outputs of productivity in excess of subsistence levels)is appropriated through a hierarchy of sociopolitical ranks by institutionalized coercion. Inclassical feudal systems, lords allocate land to vassals in return for military service and/orlabor on the lord’s estate.
GLOSSARY 409
6063 GEOGRAPHY WORLD ECON_PT_246x189 mm 22/01/2014 15:11 Page 409
finance, insurance, and real estate (FIRE) A subset of producer services. Finance, insurance,and real estate (FIRE) includes commercial and investment banking, insurance of all kinds(property, medical, casualty) and the residential and commercial real estate business.
FIRE See finance, insurance, and real estate servicesflexible accumulation A phase of capitalist development (a regime of accumulation, in the
terminology of regulation theory) characterized by a set of production technologies, laborpractices, inter-firm relations, and consumption patterns that have evolved in order to allowgreater economic and geographic flexibility in economic affairs. Because it succeededFordism, flexible accumulation is also known as post- or neo-Fordism.
flexible production systems and flexible production Various practices whereby manufacturingoperations achieve flexibility in what they produce, when they produce it, how they produceit and where they produce it. These practices include the exploitation of various kinds ofenabling technology, greater use of subcontracting, the exploitation of different labormarkets, the exploitation of different market niches for products, and the development ofnew labor processes using flexible working hours, part-time workers, etc.
Fordism (Fordist regime of accumulation) A regime of accumulation that centers on the mutualreinforcement of mass production and mass consumption. Named after Henry Ford becauseof his innovations and philosophy concerning automobile manufacture, it features a highlyspecialized and differentiated division of labor with assembly-line production geared to theprovision of standardized, affordable goods for mass markets.
foreign direct investment (FDI) Direct investment in a company or companies in one or a numberof foreign countries (e.g., takeovers, new subsidiaries, etc., rather than portfolio investment)in order to achieve managerial and production control.
fracking A process of producing fractures in the rock formation that stimulate the flow ofnatural gas or oil, increasing the volumes that can be recovered. Fractures are created bypumping large quantities of fluids at high pressure down a wellbore and into the targetrock formation. Once the injection process is completed, the internal pressure of the rockformation causes fluid to return to the surface through the wellbore.
franchise A business that has a license to manufacture or sell a product or service under thename of the original company, e.g., a retail outlet that is not owned by Benetton but thathas a franchise agreement to use the company’s name for the store and to sell the company’sproducts.
free trade association A form of international economic integration that involves the eliminationof some (but not necessarily all) trade barriers between member states, but where eachmember state continues to set its own tariffs and quotas as trade barriers to non-memberstates.
geoengineering The amelioration of global warming by deliberately altering the climate of theearth.
geographical path dependence The historical relationship between the present economicactivities associated with a place and its past experience.
global currencies Currencies used in international transactions. The U.S. dollar is the mostimportant one today, although its use is challenged to a certain extent by the euro and theJapanese yen.
global sourcing Use of multiple sources in different countries for the components of a particularproduct that is assembled elsewhere.
globalized capitalism (advanced capitalism or disorganized capitalism) The label given to themost recent or advanced phase of capitalism that uses flexible production systems. Under
GLOSSARY410
6063 GEOGRAPHY WORLD ECON_PT_246x189 mm 22/01/2014 15:11 Page 410
globalized capitalism, the relationships between capital, labor, and government are moreflexible, largely because a great deal of corporate activity has escaped the framework ofnation-states and their institutions that still constrain organized labor and most governmentfunctions.
Green Revolution An agricultural program in the 1960s and 1970s to tackle hunger in theLDCs by transferring methods of modern agricultural technology to traditional farmingregions. A package of measures to improve yields of food crops such as wheat, maize, andrice involved the application of greater mechanization, chemical fertilizers and pesticides,and irrigation water to genetically improved high-yield seeds. While many Asian and someLatin American countries achieved significantly increased crop yields, the strategy was not embraced to the same extent in Sub-Saharan Africa. The Green Revolution has beencriticized for benefiting wealthier farmers at the expense of smaller landowners who cannotafford the costs of initial inputs, especially fertilizers and irrigation water. Production hasalso leveled out in recent years.
gross domestic product (GDP) When gross national income (GNI) is adjusted to remove thevalue of profits from overseas investments and the “leakage” of profits accruing to foreigninvestors, the result is a measure of gross domestic product (GDP).
gross national income (GNI) Also known as gross national product (GNP), this is a measureof the market value of the production of a given economy in a given period (usually a year).It is based on the market price of finished products and includes the value of subsidies; itincludes the value of profits from overseas investments and profits accruing to foreigninvestors but does not take into account the costs of replacing fixed capital.
gross national product (GNP) See gross national income (GNI)gross value added (GVA) Gross value added is equal to GDP minus taxes on products plus
subsidies on products. In other words, GVA plus taxes on products minus subsidies onproducts is equal to GDP.
growth pole A growth pole, which can be unplanned or planned, benefits from agglomerationeconomies and can spread prosperity to nearby regions through spread effects. Examplesof efforts to plan growth poles to stimulate regional development by generating spread effectsinclude the industrial complexes located in Taranto and Bari in the Mezzogiorno (south)of Italy or the eight metropoles d’équilibre (balancing metropolises) in France, such as Lyon,Marseille, and Bordeaux, which were intended also to redirect some economic activity awayfrom Paris and reduce its primacy.
hearth area An area of origin of people, ideas, or technologies that then spread to other areas.hegemony A difficult and controversial concept, hegemony is often applied to the dominance
of one country or region or group over others. Greek for “leadership,” this term wasoriginally applied to the dominance of one Greek city-state over others. In addition to militarydominance, the hegemonic power must also have economic and cultural dominance to setand enforce the rules of conduct that it prefers.
horizontal integration A form of business organization in which a company tries to capturethe market for a single stage of production, a single good or service, or an entire industryand achieve economies of scale, by using corporate mergers or acquisitions of firms thatformerly competed in the same market(s) with similar goods or services. A successfulautomobile manufacturer, for example, might buy out other automobile manufacturers.
hydraulic fracturing. See frackingimperialism The extension of the power of a country through direct or indirect control of the
economic and political life of other territories.
GLOSSARY 411
6063 GEOGRAPHY WORLD ECON_PT_246x189 mm 22/01/2014 15:11 Page 411
import penetration This describes the result of a significant share of domestic markets for aparticular product or service being lost by domestic firms in the face of competition fromforeign sources.
import substitution Development of domestic firms capable of producing goods or servicesformerly provided by foreign firms.
increasing returns to scale Cost advantages from large-scale production. Increasing returns to scale in production are equivalent to economies of scale. An increase in inputs (rawmaterials, labor, etc.) by x percent results in an increase in output by more than x percent.
industrial production In addition to manufacturing, industrial production includes mining andpower generation.
infant industries Industries at an early stage of development that are protected by tariffs andother trade barriers until they can survive foreign competition without protection.
inflation A decline in the value of money because prices keep rising. A number of economictheories have been formulated to explain why inflation occurs. In the eighteenth century Humetheorized that prices rise as the supply of money rises. And a reduction in the pur chas-ing power of money can occur when a national government increases the supply of money.Keynes assumed that inflation takes place when demand outstrips the supply of goods andservices (resulting in the need for a national government to intervene to control inflation byadjusting spending, tax and interest rate levels). In the cost–push theory, the price–wage spiralcauses inflation—worker demands for higher wages necessitate an increase in prices, whichresult in demands for higher wages, and so on. Structural theory suggests that structuralfactors can cause a country’s currency to lose value so that prices rise, such as when an LDChas poor terms of trade where the price of imports keep rising relative to the price of exports.
informal sector Economic activities that are undertaken without any formal systems ofregulation or remuneration. In addition to domestic labor, these activities include strictlyillegal activities such as drug peddling and prostitution as well as a wide variety of legalactivities such as casual labor in construction crews, on docks or on farms; domestic piecework; street trading; scavenging; and providing personal services such as shoe shining orletter writing.
information economy A mode of economic production and management in which productivityand competitiveness rely heavily on generating new knowledge and accessing and processingappropriate information.
initial advantage Advantage acquired in economic competition by some locations because ofthe benefits that accrue from an early start in production of a particular good.
intermediate goods Producer goods for manufacturing, processing or resale (e.g., raw materialsand semi-finished items for use in the production of other goods or services rather than forfinal consumption), such as shoelaces for shoe manufacturing, hinges for furnituremanufacturing, and tires for automobile manufacturing.
intermodal transportation Transportation using more than one means of conveyance, e.g., truckand ship, air and rail, etc.
internal economies of scale The specific benefits that accrue to producers from large-scaleproduction within a company. As a company increases production, the average cost of eachproduct begins to fall for that company.
international division of labor The idea of the organization of spatial divisions of labor,organized principally at the national scale until the late twentieth century, in which eachcountry specialized in certain sectors of the economy, such as industry in the UK or agri -culture and raw materials in many African countries.
GLOSSARY412
6063 GEOGRAPHY WORLD ECON_PT_246x189 mm 22/01/2014 15:11 Page 412
International Monetary Fund (IMF) The IMF is a United Nations affiliate established in 1945to help encourage international monetary cooperation, to ensure international currencyexchange stability, to promote economic and employment growth and, while not a develop-ment bank, to provide temporary economic assistance to countries experiencing balance ofpayment problems. In early 2007 the IMF had about U.S.$28 billion in credit and loansto 74 of its more than 180 member countries. The IMF and the World Bank are differentorganizations but share the same member countries.
involuntary labor The term for labor that is obtained under threat or penalty and that theworker does not offer voluntarily, such as bonded, indentured, or forced labor.
isotropic Homogenous in all respects.just-in-time (JIT) production “Lean” production employing vertical disintegration within large
formerly functionally integrated firms such as automobile manufacturers in which daily and even hourly deliveries of parts and other supplies from smaller (often non-union) sub -contractors and suppliers now arrive “just in time” to maintain “last-minute” and “zero”inventories. A computer system is used to adjust deliveries at short notice to meet changingdemand. The goal is to reduce costs by eliminating waste from overproduction andminimizing warehousing.
keiretsu Keiretsu is a Japanese form of corporate organization. A keiretsu is a grouping ofaffiliated companies that form a business network to work towards each other’s mutualbenefit. The keiretsu system also involves central government setting up favorable tradepolicies, technology policies, and fiscal policies to help Japanese industry competesuccessfully in the world economy.
Keynesianism Specifically, this refers to a doctrine of macroeconomic management that is closelyassociated with British economist, John Maynard Keynes, who advocated the use of fiscalpolicy (e.g., budget deficits) and the exploitation of economic multiplier effects in order toachieve and maintain full employment. The term is also used to denote the mode of regulationassociated with the Fordist regime of accumulation.
kin-ordered system (or societies) A system of social organization based on relationshipsbetween people who are related either biologically or by other arrangements such asthrough marriage or adoption.
Knowledge economy. See information economyKondratiev cycles Cyclical waves of 50–55 years in duration that have characterized the rate
of change in price inflation within the capitalist world economy for the past 250 years.Their origins and significance remain controversial, but in recent years they have been widelyrecognized to be closely tied in to distinctive phases of political–economic development.
Kuznets cycles Business cycles of approximately 25 years in duration that have characterizedthe pattern of acceleration and deceleration in economic growth. Named after Ukrainian-born economist Simon Kuznets, who established their existence in the 1920s, they are cyclesof activity in investment and building.
land tenure A system of land use rights and transfer mechanisms. The major types of landtenure include owner occupation, cash tenancy, share cropping (a form of tenancy in whichrent is paid in kind), use rights (where there is no codified legal owner and a person orgroup establishes a right to the land by using it), and collectivism (in which individual farmerswork in cooperatives that own the land).
latifundia Large farms or estates farmed by laborers—found predominantly in Latin America,where they originated as imperial land grants to new settlers.
less developed countries (LDCs) Peripheral and semi-peripheral countries within the world-system, with low economic output and per capita incomes, which tend to have politically
GLOSSARY 413
6063 GEOGRAPHY WORLD ECON_PT_246x189 mm 22/01/2014 15:11 Page 413
weak states and low-wage, labor-intensive production. Since the end of the Cold War andthe economic growth of the newly industrializing economies (NIEs) and other formerlyperipheral countries, the designation of “Third World” is no longer as useful in distin guish-ing the LDCs from either the capitalist, economically developed countries such as the U.S.and the UK (the “First World”) or the former communist countries in what was the Sovietbloc (the “Second World”).
localization economies Cost savings that accrue to firms as the output of their particularindustries increase as a result of clustering together at a specific location.
machinofacture A form of organization of industrial production that is capital intensive, withlabor tending machines rather than operating them directly. It was the basis for the regimeof accumulation that preceded Fordism.
maquiladoras Literally, “mills” in Spanish. These are export processing zones (EPZs) in Mexico,located mainly near the U.S. border.
Marshall Plan A U.S.-financed program that provided almost US$13 billion in economic aidto its war-torn European allies after the Second World War. Conceived as a self-help planthat would foster a healthy world economy, the funds were used to promote economicrecovery and political stability in Europe.
Mercantilism The basis of this economic ideology adhered to from the sixteenth to the early18th century in most European countries was that national wealth was to be measured interms of gold or silver and that the fundamental source of economic growth was apersistently favorable balance of trade. This was the economic “logic” that justified notonly overseas colonization but also the coercion of plantation labor and the prohibition ofmanufacturing in the colonies. It was also the logic that, on the domestic front, promotedthrift and saving as a means of accumulating capital for overseas investment. It required ahigh degree of economic regulation, sponsorship, and protection by the government.
merchant capitalism The label given to the initial phase of capitalism. As the feudal systemdisintegrated, it was replaced by an economy that was dominated by market exchange, inwhich communities came to specialize in the production of the goods and commodities thatthey could produce most efficiently in comparison with other communities. The key actorsin this system were the merchants who supplied the capital required to initiate the flow oftrade—hence the label merchant capitalism.
minisystems Local societies with a simple division of labor within a single cultural framework,such as hunter–gatherer and some agricultural societies.
mode of production A fundamental form of economic organization, such as feudalism orcapitalism, which has distinctive relationships between the main factors of production (land,labor, and capital). The concept is derived from Marxian economics (a body of theoryoriginally derived from the work of Karl Marx) but now has much wider use.
mode of regulation The terminology of regulationist theories for a collection of structural forms(political, economic, social, cultural) and institutional arrangements that define the “rulesof the game” for individual and collective behavior within a specific regime of accumulationor phase of economic development. The mode of regulation gives expression to, and servesto reproduce, fundamental social relations.
monetarism A doctrine of macroeconomic management that disavows demand managementand regards the money supply as the most important determinant of economic stability.Important in the U.S. and UK in the late 1970s and early 1980s, it reasserted the relevanceof price theory and the importance of free markets.
monoculture The agricultural practice in which one crop is grown intensively over a large areaof land.
GLOSSARY414
6063 GEOGRAPHY WORLD ECON_PT_246x189 mm 22/01/2014 15:11 Page 414
most-favored-nation (MFN) treatment This non-discrimination principle means that a country treats all trading partners in a manner equal to that accorded to the most favorednation. This is a method for promoting free trade by ensuring equal trading opportunitiesamong countries, especially as they relate to import duties and freedom of investment.Members of the World Trade Organization (WTO) negotiate this kind of tariff and tradearrangement.
multiplier effects The extra industries, firms, incomes and employment generated by a newactivity can be said to result from that activity’s multiplier effects. Such effects can be localizedand give rise to a growth pole or occur in a more diffuse manner.
nation A group of people with a common identity based on such shared characteristics asorigins, history, customs, and, frequently, language—a nationality. The terms country, nation,nation-state, and state are often used interchangeably.
nation-state A state that corresponds for the most part with the people of only one nation.
nationalism Devotion and loyalty to one’s nation. Nationalist feelings and movements, forexample, often arose in opposition to colonialism in African and Asian countries in thetwentieth century based on a desire for national independence.
nationalist separatism A nation or group’s autonomy or independence from a larger group orpolitical unit.
neoclassical economics Forms the basis of a particular conceptualization of how economicactivity operates in capitalist society. The economy comprises many small producers andconsumers. All act rationally, although none is large enough to affect significantly theoperation of the market. Firms are seen as atomistic agents with full information in a worldof pure markets (with no entry barriers) and all have exactly the same resources, techno -logical capability and market power with deviations regarded as market “imperfections.”Firms utilize factors of production (land, labor, capital) in order to maximize their profits.Consumers sell their factors of production (especially labor) in order to purchase goodsand services that maximize their individual preferences. The market is an abstract space inwhich firms and consumers set the prices. The forces of supply and demand cause economicresources to be used in the most efficient way possible. Neoclassical economics involvesnormative model building—constructing simplified versions of how the real world oughtto operate.
Neo-Fordism Sometimes referred to as “post-Fordism” or flexible accumulation, this termidentifies the regime of accumulation that has succeeded Fordism within parts of theworld’s economies. Rather than being predicated on the mutual reinforcement of massproduction and mass consumption, it depends on flexible production systems to exploitspecific market segments and/or niches.
neoliberalism Neoliberalism involved a shift in the 1970s away from the egalitarian liberalism(and the Keynesian welfare state) that had dominated public policy in DCs like the U.S.and the UK since the 1930s and a selective return to the ideas of classical liberalism. Theprocess involves “rollback” neoliberalization (e.g., deregulation of finance and industry,cutbacks in welfare programs) and “rollout” neoliberalization (e.g., public–private partner -ships, workfare requirements, privatization of government services). The net effect has beento “hollow out” the capacity of the central governments while forcing local governmentsto become entrepreneurial in pursuit of jobs and revenues and pro-business in their expend -itures. The “free markets” associated with neoliberalism have intensified uneven relation -ships among places, the inevitable result being an intensification of economic inequality atevery scale, from the neighborhood to the nation-state.
GLOSSARY 415
6063 GEOGRAPHY WORLD ECON_PT_246x189 mm 22/01/2014 15:11 Page 415
Neolithic period Literally, the “New Stone” age, between about 7000 and 5500 BCE,characterized by the use of stone tools produced by grinding or polishing, and an agriculturalrevolution involving the switch from hunting and gathering to food production based onthe domestication of plants and animals.
New Deal The domestic program in response to the Great Depression introduced by PresidentFranklin D. Roosevelt in the 1930s to promote economic recovery. Roosevelt promised “a new deal for the American people” in his acceptance speech for the 1932 presidentialnomination. New Deal legislation included the establishment of the Civil Works Adminis -tration to address unemployment, the National Recovery Administration to restore industrialproduction and the Agricultural Adjustment Administration to bolster farm production.
New Deal era The 1933–1938 period of the New Deal in the United States during whichPresident Franklin D. Roosevelt introduced a domestic program to promote economicrecovery in response to the Great Depression. See also New Deal
new international division of labor (NIDL) The idea of the reorganization of spatial divisionsof labor, formerly organized principally at the national scale, to a global scale based oninternational production and marketing systems.
newly industrializing economies (NIEs) Countries, formerly peripheral within the world-system, that have acquired a significant industrial sector, usually through foreign directinvestment (FDI).
non-tariff barriers Policy instruments (other than import taxes) designed to protect domesticindustry from foreign competition (e.g., import quotas, import licensing requirements, specialstandards and regulations, exchange rate manipulation, government subsidies to domesticindustries, and special labeling and packaging regulations).
offshore financial centers Islands or micro-states that have become specialized nodes in thegeography of worldwide financial flows. They are attractive because they provide no- orlow-tax settings for savings and are less regulated than financial centers elsewhere.
offshore outsourcing External outsourcing, where a company has certain manufacturing orservices activities undertaken by an unaffiliated company in another country where the workcan be done more cheaply. See also captive outsourcing, offshoring, outsourcing
offshoring Offshoring involves a company having certain manufacturing or services activitiesundertaken by an affiliated or unaffiliated company in another country where the work canbe done more cheaply. See also captive outsourcing, offshore outsourcing, outsourcing
Organization for Economic Cooperation and Development (OECD) The OECD is anorganization of 30 industrialized countries that include the U.S., Canada, Japan, Australia,New Zealand, South Korea, and European countries such as the UK, France, Switzerland,and the Czech Republic. It was founded in 1961 to stimulate economic growth and worldtrade (taking over from the Organization for European Economic Cooperation (OEEC),which had been established to administer U.S. and Canadian postwar reconstruction aidin Europe under the Marshall Plan). The OECD defines itself as an international organiza -tion of countries that share a commitment to democratic government and the market econ -omy. Its mission is to help governments tackle the economic, social and governancechallenges of the global economy. Based in Paris, the OECD is probably best known as asource of economic statistics and publications.
Organization of Petroleum Exporting Countries (OPEC) OPEC is an international cartel of12 oil-exporting countries. It was created in 1960 to coordinate oil output and fix pricesin an effort to improve profitability and reduce market volatility. Its members are all LDCs: Algeria, Angola, Indonesia, Iran, Iraq, Kuwait, Libya, Nigeria, Qatar, Saudi Arabia,
GLOSSARY416
6063 GEOGRAPHY WORLD ECON_PT_246x189 mm 22/01/2014 15:11 Page 416
UAE, and Venezuela. In 2005 OPEC produced nearly 31 million barrels of crude oil eachday or almost 43 percent of the world’s output of nearly 72 million daily barrels. OPECholds more than 78 percent of the world’s estimated proven crude oil reserves of more than1 trillion barrels.
organized capitalism The later phase of industrial capitalism that was characterized bycomparatively highly structured relationships between labor, government, and corporateenterprise. These relationships were mediated through legal and legislative instruments,formal agreements, and public institutions.
outsourcing In the global economy, outsourcing typically involves a company, often in a DCwhere labor and other costs are high, having certain manufacturing or services activitiesundertaken by an unaffiliated company (e.g., an independent subcontractor) either domestic -ally or in another country. See also captive outsourcing, offshore outsourcing, offshoring
outsourcing, captive See captive outsourcingoveraccumulation A distinctive phase in the long-term dynamics of capitalist economies,
characterized by unused or underutilized capital and labor. It is an inevitable outcome ofthe difficulty of matching supply to demand under changing conditions and it represents acritical moment for the political economy of capitalism. It can be recognized by theappearance of idle productive capacity, excess inventories, gluts of commodities, surplusmoney capital, and high levels of unemployment.
positional goods Consumer goods that are acquired (in part, at least) in order to denoteaffluence, social status, and/or style.
primary commodities See primary productionprimary production Primary production and its commodities are derived from natural
resources, as in agriculture, mining, forestry, and fishing.primate cities/primacy A primate city is a country’s leading city as evidenced by measures of
this primacy including its significantly larger population compared to other cities (beingmore than twice as large as the country’s second largest city) and by other characteristicsreflecting the primate city’s national importance and influence, such as economic activity,political activity, and power.
privatization The sale of government assets (such as key industries) to private owners and thecontracting out of services formerly provided by government to private companies in aneffort to increase government efficiency and save public money.
producer goods Manufactured goods used in the production of other goods and services ratherthan for final consumption. Producer goods comprise intermediate goods (e.g., raw materialsand semi-finished items) and fixed capital goods (e.g., machinery and heavy equipment).
producer services Services that enhance the productivity or efficiency of other firms’ activitiesor that enable them to maintain their specialized roles. Usually subdivided into (a) businessservices, including legal services, advertising and marketing, public relations, accounting,research and development, personnel training, recruitment, architecture and engineering,and consulting and (b) finance, insurance, and real estate (FIRE), including commercial andinvestment banking, insurance of all kinds (property, medical, casualty), and the residentialand commercial real estate business.
product lifecycle Locational requirements for production change as products move from beingnovel and expensive to being standardized and cheaper. In particular, labor costs can becomemore important than adjacency to markets.
Progressive Era The 1890–1920 period in the United States of social activism and politicalreform.
GLOSSARY 417
6063 GEOGRAPHY WORLD ECON_PT_246x189 mm 22/01/2014 15:11 Page 417
public–private partnerships Coalitions of private sector businesses and/or business leaders andpublic sector officials and agencies, with others such as unions and chambers of commerce,which seek to promote economic growth and the well-being of an area.
purchasing power parity (PPP) When making international comparisons of economicprosperity, it is vital to take into account differences in national price levels. PPP does this by measuring how much of a common “market basket” of goods and services eachcountry’s currency can purchase locally.
rank redistribution and rank-redistributive societies A form of economic organization that isdominated by the redistribution of surplus product from one social group to another (e.g.,feudalism), usually through an institutional framework such as one established by the state.
Reaganomics The application of supply-side economics to the management of the U.S.economy in the 1980s. Supply-side economics is similar to monetarism in its disavowal ofdemand management; rather, the key to economic stability and well-being is seen to be theenhancement of aggregate supply. Reaganomics consisted of a set of objectives that includedtax reduction, deregulation of business, increased government spending on defense, anddecreased government spending on social welfare.
regime of accumulation The terminology of regulationist theories for a particular way oforganizing economic production, income distribution, consumption, and public goods andservices.
regional devolution The transfer of certain powers from national government to one or moreregional units of government within a country. Under devolution, the region or regionsremain part of the country while gaining some measure of self-government within the overallnational institutional framework (in contrast to independence where the regions would nolonger be constituent parts of the country).
regionalism The commitment to planning in a nationally coordinated fashion the economicdevelopment of fixed regional units that are designated as the basis for allocating economicactivities by central government. Regionalism also refers to the ideology of politicalmovements.
resource curse Rather than a blessing, overreliance on a primary commodity, such as oil, forwhich there is major world demand creates negative effects such as encouragement ofcorruption (particularly when state-owned companies have a monopoly), a rise in theexchange rate between the country’s currency and others that can then raise inflation andsqueeze out investment in agriculture and manufacturing, and pressure to share revenuesby investing in prestige projects and providing subsidies that do not stimulate long-termeconomic growth.
resource grabbing When outside forces (either national or international, such as TNCS) takevaluable resources (such as water) for their own profit, and, as a result deprive localcommunities of livelihoods that depended on these resources or of the benefits of using orcontrolling these resources themselves.
returns to scale, increasing See increasing returns to scalesexual divisions of labor The division, specialization, and different rewards between
occupations predominantly occupied by either men or women.share cropping A type of farming in which the rent for the land that tenants pay to the
landowner is in agricultural produce rather than in cash. Landlords often provide inputssuch as seeds and fertilizer in return for a fixed percentage of what is produced.
shifting cultivation or “fallow” agriculture Involves sowing or planting on scorched land usingslash-and-burn methods (cutting down the natural vegetation (e.g., forest) and burning itto release its nutrients into the soil). No special tools are required for such a system, neither
GLOSSARY418
6063 GEOGRAPHY WORLD ECON_PT_246x189 mm 22/01/2014 15:11 Page 418
is weeding or fertilization necessary, provided that cultivation is shifted in a couple of yearsto another burned plot after a few crops have been taken from the old one, which is thenabandoned (left fallow) for a period of time.
socialism A system of social and economic organization in which private property and incomedistribution are subject to social control. In state socialism, or statism, the central govern-ment has responsibility for social control. In the former Soviet Union, for example, marketswere prohibited (in public), there was little meaningful electoral politics and the means ofproduction were owned by the state.
sovereignty Sovereignty is a notion that is interrelated with other concepts, such as state,government, independence, democracy, nation-state, and nationalism, to name a few.Sovereignty in government is the ultimate and independent authority—the absolute rightto govern—as held or claimed by a state or nation. It involves the international independenceof a state or nation—the right and authority to regulate its internal affairs without outsideinterference.
space–process relationship The idea that different types of firm activity are carried out atdifferent locations within a hierarchy of places, from world cities to various peripheries.
spatial division of labor Regional economic specialization, based on the distribution ofresources and markets and on the exploitation of agglomeration economies, economies ofscale, and localization economies.
spread effects The positive spillover effects on a region (or regions) of the economic growthof some other region.
stagflation Episodes of economic recession accompanied by comparatively high rates of priceinflation.
state Political organization of society (requiring a state bureaucracy, a state religion, a judicialapparatus, a military establishment, and a police force) with a defined territory over whichit has complete sovereignty to use the rule of law to maintain order and security on behalfof the nation or nations inhabiting that territory.
strategic alliances Commercial agreements between transnational corporations, usuallyinvolving shared technologies, marketing networks, market research, or product develop-ment.
structural adjustment program Structural adjustment programs involve policy changes thatare stipulations for getting new loans from the International Monetary Fund (IMF) or theWorld Bank or for obtaining lower interest rates on existing loans. Structural adjustmentprograms were created with the primary goal of reducing the borrowing country’s macro-economic imbalances. In general, loans from both the World Bank and the IMF aredesigned to promote economic growth, to generate income and to pay off the debt that thecountries have accumulated. Structural adjustment programs are based on fiscal andmonetary restraint, combined with deregulation and liberalization of national markets. Theyhave been criticized for exacerbating the hardships experienced by ordinary citizens duringthe structural adjustments.
subsistence economies An economic system, usually of farming, in which the producers(farmers), and their families, consume most of what is produced, leaving little surplus fortrade or sale.
supply side Related to the economic theory that increasing the availability (supply) of capitalfor investment in an economic system by reducing marginal tax rates will promote long-term growth by providing the incentive necessary to increase overall economic activity,productivity, and income.
GLOSSARY 419
6063 GEOGRAPHY WORLD ECON_PT_246x189 mm 22/01/2014 15:11 Page 419
supranational political union A form of international economic integration that extendsbeyond economic union to a unified fiscal and monetary system controlled by a supra nationalauthority with executive, judicial, and legislative powers.
sustainable development A pattern of resource use and economic development that does notjeopardize nonrenewable resources, damage existing ecosystems or harm individual species.
tariffs The schedules of duties or taxes imposed by a government on exported or, more typically,imported goods and services.
Taylorism The name given (after analyst F.W. Taylor) to forms of organization inmanufacturing industries wherein the planning and control of work are given over entirelyto management, leaving production workers to be allocated specialized tasks that are subjectto careful analysis—“scientific management”—using techniques such as time-and-motionstudies.
technology systems Distinctive “packages” of technologies, energy sources, and political–economic structures that represent the most efficient means for the organization ofproduction at any given phase of economic development. Based on key sets of interdependenttechnologies, they represent the underpinnings of successive modes of regulation andregimes of accumulation.
technopole A planned development, within a concentrated area, for technologically innovative,industrial-related production. Technopoles include science parks, science cities, and otherhigh-tech industrial complexes.
terms of trade The ratio of the prices at which exports and imports are exchanged. When theprice of exports rises relative to the price of imports, the terms of trade reflect animprovement for the exporting country.
time–space compression The reduction in barriers to decision making and action as a resultof transportation and communications improvements that have allowed the pace of life toaccelerate. Increasingly, key economic activities, such as the circulation of capital and goods, can occur more rapidly. Time–space compression involves more than the traditionalnotion of time–space convergence, which identified how new systems of transportation andcommunications, such as the railway replacing the stagecoach, while not changing absolutedistance over space, made places closer when distance is measured in time.
TNCs See transnational corporationstrade creation effects The positive effects of international economic integration, resulting from
the free movement of factors of production and free trade, which allows each country orregion to specialize according to its comparative advantage, so leading to a greater overallproductivity and internal trade.
trade diversion The displacement of pre-existing trade flows as a result of international andsupranational economic integration.
trade preference associations Loose forms of international economic integration that involvereduced trade barriers between member states.
trading blocs Groups of countries with formalized systems of trading agreements.transnational corporations (TNCs) Also known as multinational corporations (MNCs), these
companies operate in a number of countries. Many of the headquarters of the largest TNCsare concentrated in the world cities of London, New York, and Tokyo. Production is carriedout at a global scale in such a way as to maximize profits. For example, as part of a globalassembly system, a low-skill labor-intensive stage of the production process may be locatedin a less developed country where wages and unionization levels are low.
GLOSSARY420
6063 GEOGRAPHY WORLD ECON_PT_246x189 mm 22/01/2014 15:11 Page 420
undeveloped technically recoverable resource (UTRR) Oil and gas that may be produced asa consequence of natural pressure, artificial lift, pressure maintenance, or other secondaryrecovery methods, but without any consideration of economic viability. Primarily locatedoutside known fields.
undiscovered resources Resources postulated, on the basis of geologic knowledge and theory,to exist outside known fields or accumulations.
unequal exchange Biases in the international trade system promote the unequal exchange ofcommodities between countries, which results in some countries gaining more and othersless. Goods produced in peripheral countries (especially agricultural products), for example,command low prices on the international market compared to the amount of intensive laborthat went into producing them, thereby transferring value from peripheral countries to corecountries.
uneven development The spatial outcome, within and between countries, of the continuoussee-sawing of capital from one set of opportunities to another on the basis of particularlocal mixes of skills and resources. Capital is invested unevenly over time and across spacebecause, whenever possible, development will occur wherever businesses judge that theirinvestment will yield the highest return. When businesses try to exploit differences betweenplaces, they create a continuously variable geometry of labor, capital, production, markets,and management.
unproven reserves Quantities of hydrocarbon resources that are assessed based on geologicand engineering information similar to that used in developing estimates of proven reserves,but technical, contractual, economic, or regulatory uncertainty precludes such reserves frombeing classified as proved.
UTRR See undeveloped technically recoverable resourcevertical disintegration A form of business organization in which specialized firms are created
and operate as part of a network of subcontractors and suppliers within industries formerlydominated by large, functionally integrated firms. As part of a flexible production system,an automobile manufacturer, for example, may subcontract parts and other supplies tosmaller specialized firms.
vertical integration A form of business organization in which a company tries to control allaspects of the same industry or enterprise and capture a greater proportion of the final sellingprice by using corporate mergers or acquisitions of firms that were formerly engaged indifferent stages of the same industry or enterprise (from production to sale). A carmanufacturer, for example, may take over companies that make specialized componentssuch as engines or car navigation systems or that distribute or sell automobiles.
wage labor When people work in exchange for monetary payment rather than bartered goods,military protection or as a result of enslavement.
World Bank The World Bank (and its main component, the International Bank forReconstruction and Development) is a United Nations affiliate established in 1948 to financeproductive projects that further the economic development of its more than 180 membercountries from Afghanistan to Uganda. In fiscal year 2005 the World Bank loaned U.S.$22.3billion to less developed countries for 278 projects.
world city One of the cities that dominate world finance and serve as headquarters totransnational corporations. Typically, London, New York, and Tokyo are identified as theleading tier of world cities, although other cities such as Chicago, Frankfurt, Paris, LosAngeles, and Zürich also have important global roles.
GLOSSARY 421
6063 GEOGRAPHY WORLD ECON_PT_246x189 mm 22/01/2014 15:11 Page 421

world-system Any spatially extensive economic system that has a single division of labor butmultiple cultural systems.
xenophobia Xenos and phobos are the Greek words for “stranger” and “fear”: Xenophobiais a rejection of strangers or foreigners or of anything that is foreign or unknown basedsimply on feelings of fear or hatred.
GLOSSARY422
6063 GEOGRAPHY WORLD ECON_PT_246x189 mm 22/01/2014 15:11 Page 422
Aarebrot, F.H. 1982. On the structural basis of regional mobilization in Europe, in B. De Marchi andA.M. Boileau (eds.) Boundaries and Minorities in Western Europe. Milan: Franco Angeli.
Achebe, C. 1975. Morning Yet on Creation Day. London: Faber.Adelman, I. 1984. Beyond export-led growth, World Development 12, 937–949.Agnew, J.A. 1987. The United States in the World Economy: A regional geography. Cambridge:
Cambridge University Press.Agnew, J.A. 1988. Beyond core and periphery: the myth of regional political–economic restructuring
and a new sectionalism in American politics, Political Geography Quarterly 7, 127–139.Agnew, J.A. 1992. The United States and American hegemony, in P.J. Taylor (ed.) The Political
Geography of the Twentieth Century. London: Belhaven Press.Agnew, J.A. 1993. Trading blocs or a world that knows no boundaries? in C.H. Williams (ed.) The
Political Geography of the New World Order. London: Belhaven Press.Agnew, J.A. and Corbridge, S. 1995. Mastering Space: Hegemony, territory and international political
economy. London: Routledge.Agnew, J.A. and Grant, R.J. 1997. Falling out of the world economy? Theorizing “Africa” in world
trade, in R. Lee and J. Wills (eds.) Geographies of Economies. London: Edward Arnold.Agnew, J.A., Shin, M., and Richardson, P. 2005. The saga of the “Second Industrial Divide” and the
history of the “Third Italy”: evidence from export data, Scottish Geographical Journal 121, 83–101.Albrechts, L. and Swyngedouw, E. 1989. The challenges for regional policy under a flexible regime of
accumulation, in L. Albrechts, F. Moulaert, R. Roberts, and E. Swyngedouw (eds.) Regional Policyat the Crossroads. London: Jessica Kingsley.
Allen, J. 1988. Fragmented firms, disorganised labour? in J. Allen and D. Massey (eds.) RestructuringBritain: The economy in question. London: Sage.
Amin, A. (ed.) 1994. Post-Fordism. A reader. Cambridge, MA: Blackwell.Amin, A. 1996. Beyond associative democracy, New Political Economy 1, 309–333.Amin, A. and Robins, K. 1990. The re-emergence of regional economies? The mythical geography of
flexible accumulation, Society and Space 8, 7–34.Amin, A. and Thrift, N. 1992. Neo-Marshallian nodes in global networks, International Journal of Urban
and Regional Research 16, 571–587.Amin, A. and Thrift, N. (eds.) 1994. Globalization, Institutions, and Regional Development in Europe.
Oxford: Oxford University Press.Amiti, M. and Wei, S.-J. 2005. Fear of service outsourcing: is it justified? Economic Policy 42, 307–347;
available at http://www.oecd.org/dataoecd/44/24/35333668.pdfAmsden, A. 1989. Asia’s Next Giant: South Korea and late industrialization. New York: Oxford
University Press.Anderson, A.B. 1990. Smokestacks in the rainforest: industrial development and deforestation in the
Amazon Basin, World Development 18, 1191–1205.Andrews, J. 1992. A change of face: a survey of Taiwan, Economist, October 10.Aoyama, Y. 2000. Networks, keiretsu, and locations of the Japanese electronics industry in Asia,
Environment and Planning A, 32, Pion Limited, London, 223–244.Armstrong, W. and McGee, T. 1986. Theatres of Accumulation: Studies in Asian and Latin American
urbanization. London: Methuen.Arthur, W.B. 1989. Competing technologies, increasing returns, and lock-in by historical events,
Economic Journal 99, 116–131.
Bibliography
6063 GEOGRAPHY WORLD ECON_PT_246x189 mm 22/01/2014 15:11 Page 423
Artis, M. and Lee, N. (eds.) 1994. The Economics of the European Union. Oxford: Oxford UniversityPress.
Aryeetey-Attoh, S. (ed.) 1997. Geography of Sub-Saharan Africa. Upper Saddle River, NJ: Prentice Hall.Auty, R.M. 1991. Third world response to global processes: the mineral economies, Professional
Geographer 43, 68–76.Baer, W., da Fonseca, M.A.R., and Guilhoto, J.J.M. 1987. Structural changes in Brazil’s industrial
economy, 1960–80, World Development 15, 275–286.Bagchi-Sen, S. and Sen, J. 1997. The current state of knowledge in international business in producer
services, Environment and Planning A 39, 1153–74.Bain, J.S. 1959. Industrial Organization. New York: John Wiley & Sons.Bairoch, P. 1982. International industrialization levels from 1750 to 1980, European Journal of
Economic History 11, 269–333.Balassa, B. 1979. The Changing International Division of Labor in Manufactured Goods. Washington,
DC: World Bank, Working Paper 329.Baldwin, R.E. 1994. Towards an Integrated Europe. London: Centre for Economic Policy Research.Banco de España. 2012. Nota Informativa: Balanza de pagos en marzo 2012, May 31; available at
http://www.bde.es/f/webbde/GAP/Secciones/SalaPrensa/NotasInformativas/12/Arc/Fic/presbe2012_17.pdf
Bank for International Settlements. 2010. Triennial Central Bank Survey: Report on global foreignexchange market activity in 2010. Basel: BIS, Monetary and Economic Department.
Barff, R. 1995. It’s gotta be da shoes, Environment and Planning A 27, 55–79.Barnes, M. and Haskel, J. 2001. Job Creation, Job Destruction and Small Firms: Evidence from the UK.
Queen Mary, University of London Research Paper.Barnet, R.J. and Cavanagh, J. 1994. Global Dreams. Imperial corporations and the new world order.
New York: Simon & Schuster.Barratt Brown, M. 1993. Fair Trade: Reform and realities in the international trading system. London:
Zed Books.Bates, R.H. 1983. Essays on the Political Economy of Rural Africa. Cambridge: Cambridge University
Press.Bayoumi, T. 1989. Saving-Investment Correlations. Washington, DC: IMF Working Paper 89/66.Bayoumi, T. and Lipworth, G. 1997. Japanese foreign direct investment and regional trade, Finance &
Development September, 11–13.BEA (Bureau of Economic Analysis). 2012. Summary Estimates for Multinational Companies. New release.
Washington, DC: US Department of Commerce, April 18; available at http://www.bea.gov/newsreleases/international/mnc/mncnewsrelease.htm
Beenstock, M. 1983. The World Economy in Transition. London: Allen & Unwin.Belderbos, R. and Zou, J. 2006. Foreign investment, divestment and relocation by Japanese electronics
firms in East Asia, Asian Economic Journal 20, 1–27.Bellini, N. 1996. Regional economic policies and the non-linearity of history, European Planning Studies
4, 63–73.Belussi, F. 1996. Local systems, industrial districts and institutional networks: towards a new evolutionary
paradigm of industrial economics?, European Planning Studies 4, 5–26.Beneria, L. 1981. Conceptualising the labour force: the underestimation of women’s activities, Journal
of Development Studies 17, 10–27.Benko, G. and Dunford, M. (eds.) 1991. Industrial Change and Regional Development: The
transformation of new industrial spaces. London: Belhaven Press.Berg, E.J. 1965. The development of the labor force in sub-Saharan Africa, Economic Development and
Cultural Change 13, 394–412.Berry, B.J.L. 1991. Long Wave Rhythms in Economic Development and Political Behavior. Baltimore,
MD: Johns Hopkins University Press.Berry, B.J.L., Conkling, E.C., and Ray, D.M. 1976. The Geography of Economic Systems. Englewood
Cliffs, NJ: Prentice Hall.
BIBLIOGRAPHY424
6063 GEOGRAPHY WORLD ECON_PT_246x189 mm 22/01/2014 15:11 Page 424
Beyon, J. and Dunkerley, D. (eds.) 2000. Globalization: The reader. New York: Routledge.Biersteker, T.J. 1995. The “triumph” of liberal economic ideas in the developing world, in B. Stallings
(ed.) Global Change, Regional Response: The new international context of development. Cambridge:Cambridge University Press.
Bingham, R.D. and Hill, E.W. (eds.) 1997. Global Perspectives on Economic Development. NewBrunswick, NJ: Center for Urban Policy Research.
Birch, D.L. 1979. The Job Generation Process. Cambridge, MA: MIT Program on Neighborhood andRegional Change.
BISNIS (Business Information Service for the Newly Independent States). 2001. Russia: Fact sheet, July2001; available at http://www.bisnis.doc.gov/bisnis/country/RussiaFactsheet–2001.htm
Blinder, A.S. 2006. Offshoring: the next industrial revolution?, Foreign Affairs, March/April.Bluestone, B. and Harrison, B. 1982. The Deindustrialization of America. New York: Basic
Books.Boggs, J.S. and Rantisi, N.M. 2003. The “relational turn” in economic geography, Journal of Economic
Geography 3, 109–116.Bonacich, E., Chen, L., Chinchilla, N., Hamilton, N., and Ong, P. 1994. Global Production: The apparel
industry in the Pacific Rim. Philadelphia, PA: Temple University Press.Borchert, J.R. 1967. American metropolitan evolution, Geographical Review 57, 301–332.Borchert, J.R. 1978. Major control points in American economic geography, Annals of the Association
of American Geographers 68, 214–232.Boserup, E. 1981. Population and Technology. Oxford: Blackwell.Bourgin, F. 1989. The Great Challenge: The Myth of Laissez-Faire in the Early Republic. New York:
George Braziller.Bowler, I. 1985. Agriculture under the Common Agricultural Policy. Manchester: Manchester University
Press.Boyte, H. 1980. The Backyard Revolution: Understanding the new citizen movement. Philadelphia, PA:
Temple University Press.Bradford, C.I. 1987. Trade and structural change: NICs and next-tier NICs as transitional economies,
World Development 15, 299–316.Bradley, P.N. and Carter, S.E. 1989. Food production and distribution—and hunger, in R.J. Johnston
and P.J. Taylor (eds.) A World in Crisis?, 2nd edn. Oxford: Blackwell.Bradshaw, M. 1991. The Soviet Union: A new regional geography? London: Belhaven Press.Braudel, F. 1972. The Mediterranean and the Mediterranean World in the Age of Phillip II (trans.
S. Reynolds). New York: Harper & Row.Brenner, R. 1977. The origins of capitalist development: a critique of neo-Smithian Marxism, New Left
Review 104, 25–91.Brockett, C.D. 1988. Land, Power, and Poverty: Agrarian transformation and political conflict in
Central America. Boston, MA: Unwin Hyman.Brundenius, C. 1984. Revolutionary Cuba: The challenge of economic growth with equity. Boulder, CO:
Westview.Brunn, S. (ed.) 2006. Wal-Mart World: The world’s biggest corporation in the global economy. New
York and London: Routledge.Brusco, S. and Sabel, C. 1981. Artisan production and economic growth, in F. Wilkinson (ed.) The
dynamics of labour market segmentation. London: Academic Press.Bryson, J.R., Daniels, P.W., Henry, N., and Pollard, J. (eds.) 2000. Knowledge, Space, Economy. London:
Routledge.Bryson, J.R., Daniels, P.W., and Warf, B. 2004. Service Worlds: People, organisations, technologies.
London and New York: Routledge.Bryson, J.R., Henry, N., Keeble, D., and Martin, R. (eds.) 1999. The Economic Geography Reader.
New York: John Wiley & Sons.Buchanan, K. 1972. The Geography of Empire. London: Spokesman Books.Burbach, R. and Flynn, P. 1980. Agribusiness in the Americas. New York: Monthly Review Press.
BIBLIOGRAPHY 425
6063 GEOGRAPHY WORLD ECON_PT_246x189 mm 22/01/2014 15:11 Page 425
Busse, M. 2002. Competition Intensity, Potential Competition and Transaction Cost Economics. HWWADiscussion Paper 183. Hamburg: Hamburg Institute of International Economics.
Buzzetti, L. 1996. Efforts to reorganize the state within the new international framework, in A. Vallega,R.C. de Azevedo, L. Buzzetti, A. Celant, P. Landini, B. Cardinale et al. (eds.) The Geography ofDisequilibrium: Global issues and restructuring in Italy. Rome: Societa Geografica Italiana.
Cameron, R. 1973. The logistics of European economic growth: a note on historical periodization, Journalof European Economic History 2, 145–158.
Carter, H. 1983. An Introduction to Urban Historical Geography. London: Edward Arnold.Castells, M. 1988. High technology and urban dynamics in the United States, in M. Dogan and J. Kasarda
(eds.) The Metropolis Era. Vol. 1: A world of giant cities. Newbury Park, CA: Sage.Castells, M. 2000. The Information Age: Economy, society and culture. Vol. I: The rise of the network
society, 2nd edn. Oxford: Blackwell.Castells, M. and Hall, P. 1994. Technopoles of the World. The making of 21st century industrial
complexes. London: Routledge.Celant, A. 1996. Italy’s foreign trade: economic and territorial characteristics, in A. Vallega, R.C. de
Azevedo, L. Buzzetti, A. Celant, P. Landini, B. Cardinale et al. (eds.) The Geography of Disequilibrium:Global issues and restructuring in Italy. Rome: Societa Geografica Italiana.
Champion, A.G. and Townsend, A.R. 1990. Contemporary Britain. London: Edward Arnold.Chandler, A.D. 1992. Organizational capabilities and the economic history of the industrial enterprise,
Journal of Economic Perspectives 6, 79–100.Chaunu, P. 1969. L’expression européenne du XIIIe au XVe siècle. Collection Nouvelle Clio 26. Paris:
Presses Universitaires de France.Chernesky, R.J. 2006. Strategic Alliances. Dayton, OH: Chernesky, Heyman & Kress PLL.Cheshire, P.C., D’Arcy, E., and Giussani, B. 1992. Purpose built for failure? Local, regional and national
government in Britain, Environment and Planning C: Government and Policy 10, 355–369.Childe, V.G. 1950. The urban revolution, Town Planning Review 21, 3–17.China Sourcing Blog. 2012. Textile and apparel sourcing: the rise of South East Asia. China Sourcing
Blog. January 30; available at http://www.chinasourcingblog.org/2012/01/textile-and-apparel-sourcing-t-1.html
Chisholm, M. 1982. Modern World Development. Totowa, NJ: Barnes & Noble.Chisholm, M. 1990. Regions in Recession and Resurgence. London: Unwin Hyman.Christopher, A.J. 1984. Colonial Africa. Beckenham: Croom Helm.Christopherson, S. 1989. Flexibility in the US service economy and the emerging spatial division of labour,
Transactions of the Institute of British Geographers 14, 131–143.Christopherson, S. 1995. Changing women’s status in a global economy, in R.J. Johnston, P.J. Taylor,
and M.J. Watts (eds.) Geographies of Global Change. Oxford: Blackwell.CIA (US Central Intelligence Agency). 1999. Handbook of International Economic Statistics. Washington,
DC: Directorate of Intelligence.CIA. 2001. World Factbook 2001. Washington, DC: Directorate of Intelligence.CIA. 2012. World Factbook 2012. Washington, DC: Directorate of Intelligence; available at https://
www.cia.gov/library/publications/the-world-factbook/geos/xx.htmlCipolla, C. 1981. Before the Industrial Revolution. European society and economy, 1000–1700, 2nd
edn. London: Methuen.Claessens, S., Glaessner, T., and Klingebiel, D. 2002. Electronic Finance: A new approach to financial
sector development? World Bank Discussion Paper No. 431. Washington, DC: World Bank.Claessens, S. and Jansen, M. (eds.) 2000. The Internationalization of Financial Services: Issues and lessons
for developing countries. London: Kluwer Law International.Clark, C. 1977. World Prehistory in New Perspective. Cambridge: Cambridge University Press.Clark, G.L. 1993. Global interdependence and regional development: business linkages and corporate
governance in a world of financial risk, Transactions of the Institute of British Geographers 18,309–325.
BIBLIOGRAPHY426
6063 GEOGRAPHY WORLD ECON_PT_246x189 mm 22/01/2014 15:11 Page 426
Clark, G., Feldman, M., and Gertler, M.S. (eds.) 2000. The Oxford Handbook of Economic Geography.New York: Oxford University Press.
Cline, W.R. 1982. Can the East Asian model of development be generalized? World Development 10, 81–90.Coaffee, J. 2004. Rings of steel, rings of concrete and rings of confidence: designing out terrorism in Central
London pre and post September 11th, International Journal of Urban and Regional Research 28,201–211.
Coffey, W.J. 2000. The geographies of producer services [progress report], Urban Geography 21,170–183.
Coghlan, A. 1993. Dying for innovation, New Scientist 137, 12–14.Cohen, A. 1974. Two-Dimensional Man: An essay on the anthropology of power and symbolism in
complex society. Berkeley, CA: University of California Press.Cohen, R.B. 1981. The new international division of labor, multinational corporations and the urban
hierarchy, in M. Dear and A.J. Scott (eds.) Urbanization and Urban Planning in Capitalist Society.London: Methuen.
Cohen, S.B. 1982. A new map of global geopolitical equilibrium: a developmental approach, PoliticalGeography Quarterly 1, 233–241.
Cohen, S.S. and Zysman, J. 1987. Manufacturing Matters: The myth of the post-industrial economy. NewYork: Basic Books.
Comisso, E. 1979. Workers’ Control under Plan and Market. New Haven, CT: Yale University Press.Commission of the European Communities. 1973. Report on the Regional Problem in the Enlarged
Community (Thompson Report). Brussels: Commission of the European Communities.Competitiveness Clusters Agency of the French Government. 2011. Competitiveness Clusters in France.
Paris: Competitiveness Clusters Agency of the French Government; available at http://competitivite.gouv.fr/
Conzen, M.P. 1981. The American urban system in the nineteenth century, in D.T. Herbert and R.J. Johnston (eds.) Geography and the Urban Environment: Progress in research and applications.Vol. IV. Chichester: John Wiley & Sons.
Cook, P. and Kirkpatrick, C. 1997. Globalization, regionalization and third world development, RegionalStudies 31, 55–66.
Cooke, P. 1988. Flexible integration, scope economies, and strategic alliances: social and spatialmediations, Society and Space 6, 281–300.
Cooke, P. 1992. Regional innovation systems: competitive regulation in the new Europe, Geoforum 23,65–82.
Cooper, F. 1980. From Slaves to Squatters: Plantation labour and agriculture in Zanzibar and coastalKenya, 1890–1925. New Haven, CT: Yale University Press.
Cooper, W.H. 2013. EU-U.S. Economic Ties: Framework, scope, and magnitude. Washington, DC:Congressional Research Service.
Corbridge, S. 1982. Urban bias, rural bias, and industrialisation: an appraisal of the work of MichaelLipton and Terry Byres, in J. Harriss (ed.) Rural Development: Theories of peasant economic andagrarian change. London: Hutchinson.
Corbridge, S. 1986. Capitalist World Development: A critique of radical development geography.London: Macmillan.
Corbridge, S. 1993. Debt and Development. Oxford: Blackwell.Corbridge, S.E. and Agnew, J.A. 1991. The US trade and budget deficits in global perspective: an essay
in geopolitical economy, Society and Space 9, 71–90.Cornford, A. 2004. The WTO Negotiations on Financial Services: Current issues and future directions.
Geneva: UNCTAD.CorpTech. 2000. CorpTech Directory of Technology Companies, 15th US edn. Woburn, MA: Corporate
Technology Information Services.Council of Economic Advisors. 1991. Economic Report of the President. Washington, DC: US Govern-
ment Printing Office.
BIBLIOGRAPHY 427
6063 GEOGRAPHY WORLD ECON_PT_246x189 mm 22/01/2014 15:11 Page 427
Cowhey, P.F. and Aronson, J.D. 1993. Managing the World Economy: The consequences of corporatealliances. New York: Council on Foreign Relations Press.
Cox, K.R. (ed.) 1997. Spaces of Globalization: Reasserting the power of the local. New York: GuilfordPress.
CRIC. 2006. Innovation in Services. CRIC Briefing No. 2. Manchester, Centre for Research on Innovationand Competition, University of Manchester.
Crook, C. 1991. Sisters in the wood: a survey of the IMF and the World Bank, Economist, October 12.Crossley, J.C. 1983. The River Plate countries, in H. Blakemore and C.T. Smith (eds.) Latin America:
Geographical perspectives, 2nd edn. London: Methuen.Crow, B. and Thomas, A. 1985. Third World Atlas. Milton Keynes: Open University Press.Cuadrado-Roura, J.R., Rubalcaba-Bermejo, L., and Bryson, J.R. (eds.) 2002. Trading Services in the
Global Economy. Cheltenham: Edward Elgar.Cumings, B. 1984. The origins and development of the Northeast Asian political economy: industrial
sectors, product cycles and political consequences, International Organization 38, 1–40.Cunningham, S. 1986. Multinationals and restructuring in Latin America, in C.J. Dixon, D.W. Drakakis-
Smith, and H.D. Watts (eds.) Multinational Corporations and the Third World. Boulder, CO:Westview.
Currah, A. and Wrigley, N. 2004. Networks of organizational learning and adaptation in retail TNCs,Global Networks 4, 1–23.
Curtin, P., Feierman, S., Thompson, L., and Vansina, J. 1978. African History. Boston, MA: Little, Brown.Dalton, D.H. and Serapio, M.G. 1999. Globalizing Industrial Research and Development. Washington,
DC: US Department of Commerce, Technology Administration Office of Technology Policy.Daniels, P.W. 1985. Service Industries: Growth and location. London: Methuen.Daniels, P.W. 1991. A world of services?, Geoforum 22, 359–376.Daniels, P.W. and Bryson, J.R. 2002. Manufacturing services and servicing manufacturing: knowledge-
based cities and changing forms of production, Urban Studies 39, 977–991.Daniels, P. and Lever, W.F. (eds.) 1996. The Global Economy in Transition. New York: Addison Wesley
Longman.Dawson, A.H. 1993. A Geography of European Integration. London: Belhaven Press.Day, G. and Rees, G. (eds.) 1991. Regions, Nations, and European Integration: Remaking the Celtic
periphery. Cardiff: University of Wales Press.De Janvry, A. 1984. The role of land reform in economic development: policies and politics, in
C.K. Eicher and J.M. Staatz (eds.) Agricultural Development in the Third World. Baltimore, MD:Johns Hopkins University Press.
De Vries, J. 1976. Economy of Europe in an Age of Crisis, 1600–1750. Cambridge: CambridgeUniversity Press.
De Vroey, M. 1984. A regulation approach to interpretation of the present crisis, Capital and Class 23,45–66.
DeGeer, S. 1927. The American manufacturing belt, Geografiska Annaler 9, 233–359.Deininger, K. and Byerlee, D. 2011. Rising Global Interest in Farmland: Can it yield sustainable and
equitable benefits? Washington, DC: World Bank; available at http://siteresources.worldbank.org/DEC/Resources/Rising-Global-Interest-in-Farmland.pdf
Destler, I.M. 1992. American Trade Politics, 2nd edn. Washington, DC: Institute for InternationalEconomics.
Deudney, D. and Ikenberry, G.J. 1991/92. The international sources of Soviet change, InternationalSecurity 16, 74–118.
Diakosavvas, D. and Scandizzo, P. 1991. Trends in the terms of trade of primary commodities, 1900–1982: the controversy and its origins, Economic Development and Cultural Change 39, 231–264.
Diamandi, Z., Dubey, A., Pleasance, D., and Vora, A. 2011. Winning in the SMB Cloud: Charting apath to success. San Francisco: McKinsey & Company; available at http://www.google.com/url?sa=t&rct=j&q=&esrc=s&source=web&cd=1&ved=0CDkQFjAA&url=http%3A%2F%2Fwww.mckinsey.com%2F~%2Fmedia%2FMcKinsey%2Fdotcom%2Fclient_service%2FHigh%2520Tech%2FPDFs%2F
BIBLIOGRAPHY428
6063 GEOGRAPHY WORLD ECON_PT_246x189 mm 22/01/2014 15:11 Page 428
Winning_in_the_SMB_Cloud.ashx&ei=RJS3Uc3gG4nA9gSqpIH4AQ&usg=AFQjCNENYj9YqQIskL2hLbjQlQ19gDDhuA&bvm=bv.47534661,d.eWU
Diamond, J. 1997. Guns, Germs, and Steel. New York: W.W. Norton.Dicken, P. 1992. International production in a volatile regulatory environment: the influence of national
regulatory policies on the spatial strategies of transnational corporations, Geoforum 23, 303–316.Dicken, P. 1994. Global-local tensions: firms and states in the global space-economy, Economic
Geography 70, 101–127.Dicken, P. 1998. Global Shift: Transforming the world economy, 3rd edn. New York and London:
Guilford Press.Dicken, P. 2007. Global Shift: Mapping the changing contours of the world economy, 5th edn. New
York and London: Guilford Press.Dicken, P. and Thrift, N. 1992. The organization of production and the production of organization:
why business enterprises matter in the study of geographical industrialization, Transactions of theInstitute of British Geographers 17, 279–291.
Dobb, M. 1963. Studies in the Development of Capitalism. London: Routledge & Kegan Paul.Donahue, J.D. 1997. The devil in devolution, American Prospect 32, 42–47.Dosi, G. 1988. Sources, procedure and microeconomic effects of innovation, Journal of Economic
Literature 26, 1–12.Duignan, P. and Gann, L.H. 1985. The United States and Africa: A history. Cambridge: Cambridge
University Press.Duncan, K. and Rutledge, I. 1977. Introduction: patterns of agrarian capitalism in Latin America, in
K. Duncan and I. Rutledge (eds.) Land and Labor in Latin America. Cambridge: Cambridge University Press.
Dunford, M. 1990. Theories of regulation, Society and Space 8, 297–321.Dunford, M. 2002. Cohesion and Enlargement, paper presented at a Round Table on European Regional
Disparities and the Cohesion and Structural EU Policy, Jean Monnet Graduate School in EuropeanLaw and Economics, Belvedere di San Leucio, San Leucio, Caserta, Italy, May 8.
Dunford, M. and Kafkalas, G. 1992. The global-local interplay, corporate geographies and spatialdevelopment strategies in Europe, in M. Dunford and G. Kafkalas (eds.) Cities and Regions in theNew Europe. London: Belhaven Press.
Dunford, M. and Perrons, D. 1983. The Arena of Capital. London: Macmillan.Dunford, M. and Smith, A. 2000. Catching up or falling behind? Economic performance and regional
trajectories in the “New Europe,” Economic Geography 76, 169–195.Dunning, J.H. 1979. Explaining changing patterns of international production: in defence of the eclectic
theory, Oxford Bulletin of Economics and Statistics 41, 269–296.Dunning, J.H. 1983. Changes in the level and structure of international production: the last one hundred
years, in M. Casson (ed.) The Growth of International Business. London: Allen & Unwin.Dunning, J.H. (ed.) 1997. Governments, Globalization, and International Business. New York: Oxford
University Press.Dunning, J.H. and Norman, G. 1987. The location choice of offices of international companies,
Environment & Planning A 19, 613–631.Durham, K.F. 1977. Expansion of Agricultural Settlement in the Peruvian Rainforest: The role of the
market and the role of the state, paper presented at the Latin American Studies Association, Houston,TX, November 2–5.
Economist. 1983. Hard pounding this, gentlemen: a survey of the world economy, September 24.Economist. 1987. The rag trade: on the road to Mandalay, June 27, 67–68.Economist. 1992a. Net financial flows to developing countries, September 14, 120.Economist. 1992b. Zero inflation: how low is low enough?, November 7, 23–26.Economist. 1992c. Survey: Russian reborn, September 24, 25.Economist. 1993a. The global firm: RIP, February 6, 69.Economist. 1993b. The final frontier, February 20, 63.Economist. 1996a. Getting together, June 29, 42–43.
BIBLIOGRAPHY 429
6063 GEOGRAPHY WORLD ECON_PT_246x189 mm 22/01/2014 15:11 Page 429
Economist. 1996b. How poor is China?, October 12, 35–36.Economist. 1996c. The buying and selling of Brazil Inc., November 9, 83–84.Economist. 1997. The last emperor, February 22, 21–25.Economist. 2001. The technology industry: big is beautiful again, July 21, 51–52.Economist. 2005. Industrial metamorphosis, September 29, 81–82.Economist. 2006. The euro and trade, June 24, 90.Economist. 2010a. Small island for sale, March 25.Economist. 2010b. Leaving home, November 18.Economist. 2012a. Space invaders, January 7.Economist. 2012b. The new maker rules, November 24.Economist. 2013a. O for a beaker full of the warm south, January 19.Economist. 2013b. Herd instinct, January 19.Economist. 2013c. The post-industrial future is nigh, February 23.Economist. 2013d. The next big thing, January 19.Edquist, C. 1985. Capitalism, Socialism, and Technology: A comparative study of Cuba and Jamaica.
London: Zed Books.Edwards, C. 1985. The Fragmented World: Competing perspectives on trade, money and crisis. London:
Methuen.EIA (Environmental Information Agency). 2011a Analysis and Projections: World shale gas resources:
An initial assessment of 14 regions outside the United States. Washington, DC: US Department ofEnergy, April; available at http://www.eia.gov/analysis/studies/ worldshalegas/ archive/2011/pdf/fullreport.pdf?zscb=73375579
EIA. 2011b. International Energy Outlook 2011. Report Number: DOE/EIA-0484(2011). Washington,DC: US Department of Energy, September 19; available at http://www.eia.gov/forecasts/ieo/world.cfm
EIA. 2012. Energy in Brief: What is shale gas and why is it important? (website), December 5; availableat http://www.eia.gov/energy_in_brief/article/about_shale_gas.cfm
Eichengreen, B. 1996. Globalizing Capital: A history of the international monetary system. Princeton,NJ: Princeton University Press.
Eicher, C.K. 1984. Facing up to Africa’s food crisis, in C.K. Eicher and J.M. Staatz (eds.) AgriculturalDevelopment in the Third World. Baltimore, MD: Johns Hopkins University Press.
Eisenschitz, A. and Gough, J. 1992. The Politics of Local Economic Policy: The problems and possibilitiesof local initiative. London: Macmillan.
Eisenschitz, A. and Gough, J. 1996. The contradictions of neo-Keynesian local economic strategy, Reviewof International Political Economy 3, 434–458.
Eisold, E. 1984. Young Women Workers in Export Industries: The case of the semiconductor industryin South East Asia. Geneva: Working Paper, ILO World Employment Programme.
Elbaum, B. 1990. Cumulative or comparative advantage? British competitiveness in the early 20th century,World Development 18, 1255–1272.
Emmanuel, A. 1972. Unequal Exchange: A study of the imperialism of trade. London: New Left Books.
Engman, M., Onodera, O., and Pinali, E. 2007. Export Processing Zones: Past and future role in tradeand development. OECD Trade Policy Working Paper No. 53. Paris: OECD.
Epstein, G. 1992. Political economy and comparative central banking, Review of Radical PoliticalEconomics 24, 1–30.
Ernst, Dieter. 2009. A New Geography of Knowledge in the Electronics Industry? Asia’s role in globalinnovation networks. Policy Studies, No. 54. Honolulu, Hawaii: East-West Center.
Esser, S. 2001. Globalizing the board of directors, Corporate Board 22, 1–5.Ettlinger, N. 1991. The roots of competitive advantage in California and Japan, Annals of the Association
of American Geographers 81, 391–407.Ettlinger, N. 1997. An assessment of the small-firm debate in the United States, Environment and Planning
A 29, 419–442.
BIBLIOGRAPHY430
6063 GEOGRAPHY WORLD ECON_PT_246x189 mm 22/01/2014 15:11 Page 430
Eurostat. 2012a. Eurostat Regional Yearbook 2012. Luxembourg: Publications Office of the EuropeanUnion; available at http://epp.eurostat.ec.europa.eu/portal/page/portal/ publications/regional_yearbookEurostat. 2012b. Regional GDP per capita in 2009: seven capital regions in the first ten places. News Release 38/12. March 13; available at http://epp.eurostat.ec.europa.eu/cache/ITY_PUBLIC/1–13032012-AP/EN/1–13032012-AP-EN.PDF
Evans, D. and Alizadeh, P. 1984. Trade, industrialization and the visible hand, in R. Kaplinsky (ed.)Third World Industrialisation in the 1980s: Open economies in a closing world. London: Cass.
Evans, P. 1979. Dependent Development: The alliance of multinational, state, and local capitalism inBrazil. Princeton, NJ: Princeton University Press.
Evans, P. 1987. Dependency and the state in recent Korean development: some comparisons with LatinAmerican NICs, in K.D. Kim (ed.) Dependency Issues in Korean Development: Comparativeperspectives. Seoul: Seoul National University Press.
Evenson, R.E. 1984. Benefits and obstacles in developing appropriate agricultural technology, in C.K. Eicher and J.M. Staatz (eds.) Agricultural Development in the Third World. Baltimore, MD:Johns Hopkins University Press.
FAO (Food and Agricultural Organization of the United Nations) 1992. World Food Conference: Report.Rome: FAO.
FAO. 1995. World Agriculture: Towards 2010. Rome: FAO; available at http://www.fao.org/docrep/v4200e/v4200e00.htm
FAO. 2000. The State of Food Insecurity in the World, 2000. Rome: FAO.FAO. 2001. The State of Food Insecurity in the World, 2001. Rome: FAO.FAO. 2004. The State of Agricultural Commodity Markets. Rome: FAO.FAO. 2005. Summary of World Food and Agricultural Statistics. Rome: FAO.FAO. 2010. Global Forest Resources Assessment. Rome: FAO.FAO. 2011. The State of Food Insecurity in the World. Rome: FAO.Farrell, D. (ed.) 2005. The Emerging Global Labor Market. San Francisco: McKinsey Global Institute.Feder, E. 1978. Strawberry Imperialism. Mexico City: Editorial Campesina.Fiala, R. and Kamens, D. 1986. Urban growth and the world polity in the nineteenth and twentieth
centuries: a research agenda, Studies in Comparative International Development 21, 23.Fine, B. 1994. Towards a political economy of food, Review of International Political Economy 3,
519–545.Fisher, P.S. and Peters, A.S. 1997. Tax and spending incentives and enterprise zones, New England
Economic Review March/April, 109–130.Fisher, R.C. 1997. The effects of state and local services on economic development, New England
Economic Review March/April, 53–67.Flannery, K.V. 1969. Origin and ecological effects of early domestication, in P.J. Ucko and G.W. Dimbleby
(eds.) The Domestication and Exploitation of Plants and Animals. London: Duckworth.Florida, R. and Smith, D.F. Jr. 1993. Venture capital formation, investment and regional industrialization,
Annals of the Association of American Geographers 83, 434–451.Foek, A. 1997. Sweat-shop Barbie, Humanist 57, 9–13.Forbes, D. and Thrift, N. 1987. International impacts on the urbanization process in the Asian region:
a review, in R.J. Fuchs, G.W. Jones, and E.M. Pernia (eds.) Urbanization and Urban Policies in PacificAsia. Boulder, CO: Westview.
Forbes Global 2000; available at http://www.forbes.com/global2000/list/Fortune. 2002. Fortune magazine’s Global 500 in 2000 (the world’s largest corporations); available at
http://www.fortune.comFothergill, S. and Guy, J. 1990. Retreat from the Regions: Corporate change and the closure of factories.
London: Regional Studies Association.Frank, A.G. 1967. Capitalism and Underdevelopment in Latin America. New York: Monthly Review
Press.Frankman, M.T. 1974. Sectoral policy preferences of the Peruvian government, 1946–1968, Journal of
Latin American Studies 6, 289–300.
BIBLIOGRAPHY 431
6063 GEOGRAPHY WORLD ECON_PT_246x189 mm 22/01/2014 15:11 Page 431
Freund, C. and Spatafora, N. 2005. Remittance: Transaction costs, determinants, and informal flows.World Bank Policy Research Working Paper 3704, September. Washington, DC: World Bank.
Fridell, G. 2006. Fair trade and neoliberalism: assessing emerging perspectives, Latin AmericanPerspectives 33, 8–28.
Friedman, B. 1989. Day of Reckoning: The consequences of American economic policy. New York:Random House.
Friedmann, H. 1991. Changes in the international division of labor: agro-food complexes and exportagriculture, in W.H. Friedland, L. Busch, F.H. Buttel, and A.P. Rudy (eds.) Towards a New PoliticalEconomy of Agriculture. Boulder, CO: Westview.
Friedmann, J. 1956. Locational aspects of economic development, Land Economics 32, 213–227.Friedmann, J. 1986. The world city hypothesis, Development and Change 17, 69–84.Friedmann, J. 1995. Where we stand: a decade of world city research, in P.L. Knox and P.J. Taylor
(eds.) World Cities in a World-system. Cambridge: Cambridge University Press.Friedmann, J. and Weaver, C. 1979. Territory and Function. Berkeley, CA: University of California Press.Fröbel, F., Heinrichs, J., and Kreye, O. 1977. Die neue internationale Arbeitsteilung. Reinbeck: Rowhohlt.Fuchs, R.J. and Pernia, E.M. 1987. External economic forces and national spatial development: Japanese
direct investment in Pacific Asia, in R.J. Fuchs, G.W. Jones, and E.M. Pernia (eds.) Urbanization andUrban Policies in Pacific Asia. Boulder, CO: Westview.
Galbraith, J.K. 1977. The Affluent Society. Boston, MA: Houghton-Mifflin.Galbraith, R. 2001. Leaner, more innovative, Italian footwear springs back to fore, International Herald
Tribune, June 27.Galor, O. and Weil, D. 2000. Population, technology, and growth: from Malthusian stagnation to the
demographic transition and beyond, American Economic Review 90, 806–828.Gann, L.H. and Duignan, P. 1978. The Rulers of British Africa, 1870–1914. Stanford, CA: Stanford
University Press.Geertz, C. 1973. The Interpretation of Cultures. New York: Basic Books.Gellner, E. 1964. Thought and Change. London: Weidenfeld & Nicolson.George, S. 1991. European political cooperation: a world-systems perspective, in M. Holland (ed.) The
Future of European Political Cooperation. Essays on theory and practice. New York: St. Martin’sPress.
George, S. 1992. The Debt Boomerang: How third world debt harms us all. London: Pluto Press.Gereffi, G. 1995. Global production systems and third world development, in B. Stallings (ed.) Global
Change, Regional Response: The new international context of development. Cambridge: CambridgeUniversity Press.
Gereffi, G. 1999. A Commodity Chains Framework for Analyzing Global Industries. Durham, NC: DukeUniversity.
Gereffi, G. 2001. Shifting governance structures in global commodity chains, with special reference tothe internet, American Behavioural Scientist 44, 1616–1637.
Gereffi, G. and Fernandez-Stark, K. 2010. The Offshore Services Value Chain. North Carolina: DukeUniversity, Center on Globalization, Governance, and Competitiveness (CGGC); available at http://www.cggc.duke.edu/pdfs/CGGC_CORFO_The_Offshore_Services_Global_Value_Chain_March_1_2010.pdf
Gereffi, G. and Korzeniewicz, M. (eds.) 1993. Commodity Chains and Global Capitalism. Westport,CT: Greenwood Press.
Gertler, M.S. 1986. Discontinuities in regional development, Society and Space 4, 71–84.Gertler, M.S. 1992. Flexibility revisited: districts, nation-states, and the forces of production, Transactions
of the Institute of British Geographers 17, 259–278.Gibb, R. and Michalak, W. (eds.) 1994. Continental Trading Blocs: The growth of regionalism in the
world economy. Chichester: John Wiley & Sons.Gibson, M.L. and Ward, M.D. 1992. Export orientation: pathway or artifact?, International Studies
Quarterly 36, 331–344.
BIBLIOGRAPHY432
6063 GEOGRAPHY WORLD ECON_PT_246x189 mm 22/01/2014 15:11 Page 432
Gifford, P. and Louis, W.R. (eds.) 1971. France and Britain in Africa: Imperial rivalry and colonial rule.New Haven, CT: Yale University Press.
Gill, S. 1990. American Hegemony and the Trilateral Commission. Cambridge: Cambridge UniversityPress.
Glasmeier, A. 1990. The role of merchant wholesalers in industrial agglomeration formation, Annals ofthe Association of American Geographers 80, 394–417.
Glyn, A., Hughes, A., Lipietz, A., and Singh, A. 1990. The rise and fall of the Golden Age, in S.A. Marglinand J.B. Schor (eds.) The Golden Age of Capitalism: Reinterpreting the postwar experience. Oxford:Clarendon Press.
Goldberg, M. 1987. The Chinese Connection: Getting plugged in to the Pacific Rim real estate, tradeand capital markets. Vancouver: University of British Columbia Press.
Goldman Sachs. 2007. The BRICs and Beyond. New York: Goldman Sachs.Goldsbrough, D. 1985. Foreign direct investment in developing countries: trends, policy issues, and
prospects, Finance and Development 22, 31–34.Gomes, C. and Perez, A. 1979. The process of modernization in Latin American agriculture, CEPAL
Review 8, 55–74.Goodman, M.K. 2004. Reading fair trade: political ecological imaginary and the moral economy of fair
trade foods, Political Geography 23, 891–915.Gordon, D.M. 1979. The Working Poor: Toward a state agenda. Washington, DC: Council of State
Planning Agencies.Gordon, D. 1988. The global economy: new edifice or crumbling foundations?, New Left Review 68,
24–64.Gordon, L. 2001. Brazil’s Second Chance: En route toward the first world. Washington, DC: Brookings
Institution Press.Gore, C. 1984. Regions in Question: Space, development theory and regional policy. London: Methuen.Gough, J. 1996. Not flexible accumulation—contradictions of value in contemporary economic
geography: 1. Workplace and interfirm relations, Environment and Planning A 28, 2063–2079.Graham, S. and Marvin, S. 2001. Splintering Urbanism. New York: Routledge.Grant, R.J. and Agnew, J.A. 1996. Representing Africa: the geography of Africa in world trade,
1960–1992, Annals of the Association of American Geographers 86, 729–744.Grant, R.J., Papadakis, M.C., and Richardson, J.D. 1993. Global trade flows: old structures, new issues,
empirical evidence, in C.F. Bergsten and M. Noland (eds.) Pacific Dynamism and the InternationalEconomic System. Washington, DC: Institute for International Economics.
Green, A.E. 1988. The north–south divide in Great Britain: an examination of the evidence, Transactionsof the Institute of British Geographers 13, 178–198.
Greener, R. 2004. The impact of HIV/AIDS on poverty and inequality, in M. Haacker (ed.) TheMacroeconomics of HIV/AIDS. Washington DC: International Monetary Fund.
Griffin, K. 1974. The Political Economy of Agrarian Change. Cambridge, MA: Harvard University Press.
Griffith-Jones, S. 1980. The growth of multinational banking, the Eurocurrency markets and their effects on the developing countries, Journal of Development Studies 16, 96–109.
Griffith-Jones, S. and Rodriguez, E. 1984. Private international finance and industrialization in LDCs,in R. Kaplinsky (ed.) Third World Industrialization in the 1980s: Open economies in a closing world.London: Cass.
Griffith-Jones, S. and Stallings, B. 1995. New global financial trends: implications for development, inB. Stallings (ed.) Global Change, Regional Response: The new international context of development.Cambridge: Cambridge University Press.
Grindle, M.S. 1986. State and Countryside: Development policy and agrarian politics in Latin America.Baltimore, MD: Johns Hopkins University Press.
Grote, M.H. and Täube, F.A. 2006. Offshoring the financial services industry: implications for theevolution of Indian IT clusters, Environment and Planning A 38, 1287–1305.
BIBLIOGRAPHY 433
6063 GEOGRAPHY WORLD ECON_PT_246x189 mm 22/01/2014 15:11 Page 433
Gugler, J. 1980. A minimum of urbanism and a maximum of ruralism: the Cuban experience, Inter -national Journal of Urban and Regional Research 4, 516–536.
Gugler, J. and Flanagan, W.G. 1978. Urbanization and Social Change in West Africa. Cambridge:Cambridge University Press.
Haggett, P. 1983. Geography: A modern synthesis, 3rd edn. London: Harper & Row.Hall, D. and Danta, D. (eds.) 2000. Europe Goes East: EU enlargement, diversity and uncertainty. London:
Stationery Office.Hall, P. 1981. The geography of the fifth Kondratieff cycle, New Society 55, 535–536.Hall, T.D. 1986. Incorporation in the world-system: toward a critique, American Sociological Review
51, 390–402.Hamilton, C. 1983. Capitalist industrialisation in the four little tigers of East Asia, in P. Limqueco and
B. McFarlane (eds.) Neo-Marxist Theories of Development. Beckenham: Croom Helm.Hamilton, F.E.I. 1978. Multinational enterprise and the European Economic Community, in F.E.I.
Hamilton (ed.) Industrial Change: International experience and public policy. London: Longman.Hamilton, F.E.I. 1984. Industrial restructuring: an international problem, Geoforum 15, 349–364.Hammond, R. 1994. A geography of overseas aid, Geography 79, 210–221.Hancock, M.D., Logue, J., and Schiller, B. 1991. Managing Modern Capitalism: Industrial renewal and
workplace democracy in the United States and Europe. Westport, CT: Praeger.Hansen, G. and Prescott, E. 2002. Malthus to Solow, American Economic Review 94(2), 1205–1217.Hansen, N. 1981. Mexico’s border industry and the international division of labor, Annals of Regional
Science 15, 1–12.Hansson, K. 1952. A general theory of the system of multilateral trade, American Economic Review 42,
59–88.Hardy, S., Hart, M., Albrechts, L., and Katos, A. (eds.) 1995. An Enlarged Europe: Regions in
competition? London: Regional Studies Association.Hargittai, E. and Centeno, M.A. 2001. Introduction: defining a global geography, American Behavioral
Scientist 44, 1545–1560.Harrigan, J. and Martin, P. 2002. Terrorism and the resilience of cities, Economic Policy Review 8,
97–116.Harris, C. 1982. The urban and industrial transformation of Japan, Geographical Review 72,
50–89.Harris, N. 1978. The Mandate of Heaven: Marx and Mao in modern China. London: Quartet.Harris, N. 1986. The End of the Third World: Newly industrializing countries and decline of an ideology.
London: I.B. Tauris.Harris, N. 1996. The New Untouchables: Immigration and the new world worker. London: Penguin.Harrison, B. 1992. Industrial districts: old wine in new bottles?, Regional Studies, 26, 469–483.Harrison, B. 1994. Lean and Mean: The changing landscape of corporate power in the age of flexibility.
New York: Basic Books.Harrison, B. 1997. Comments on “The effects of state and local public policies on economic
development,” New England Economic Review, March/April, 140–141.Harrison, B. and Bluestone, B. 1990. Wage polarization in the US and the “flexibility” debate, Cambridge
Journal of Economics 14, 351–373.Hart, K. 1982. The Political Economy of Agriculture in West Africa. Cambridge: Cambridge University
Press.Hartley, M. and Walker, C. 2012. The culture shock of India’s call centers, Forbes Magazine, December
16.Harvey, D. 1990. The Condition of Postmodernity. Oxford: Blackwell.Harvey, D.W. 1988. The geographical and geopolitical consequences of the transition from Fordist to
flexible accumulation, in G. Sternlieb and J.W. Hughes (eds.) America’s New Market Geography:Nation, region, and metropolis. New Brunswick, NJ: Center for Urban Policy Research.
Harvie, C. 1994. The Rise of Regional Europe. London: Routledge.Hauchler, I. and Kennedy, P.M. 1994. Global Trends. New York: Continuum.
BIBLIOGRAPHY434
6063 GEOGRAPHY WORLD ECON_PT_246x189 mm 22/01/2014 15:11 Page 434
Hayami, Y. 1984. Assessment of the green revolution, in C.K. Eicher and J.M. Staatz (eds.) AgriculturalDevelopment in the Third World. Baltimore, MD: Johns Hopkins University Press.
Hayes, S.L. and Hubbard, P.M. 1990. Investment Banking: A tale of three cities. Cambridge, MA: HarvardBusiness School Press.
Haywood, J. 1998. Historical Atlas of the 19th Century World 1783–1914. New York: Barnes & Noble.Heim, C.E. 1991. Dimensions of Decline: Industrial regions in Europe, the US, and Japan in the 1970s
and 1980s, paper presented at the Social Science History Association, Annual Meeting, New Orleans,November.
Held, D. and McGrew, A. (eds.) 2000. The Global Transformations Reader. Malden, MA: Blackwell.Hellerstein, R., Daly, D., and Marsh, C. 2006. Have U.S. import prices become less responsive to changes
in the dollar?, Current Issues in Economics and Finance 12(6).Henderson, J. 1989. The Globalization of High Technology Production: Society, space and
semiconductors in the restructuring of the modern world. London: Routledge.Henry, N. and Pinch, S. 2000. (The) industrial agglomeration (of Motor Sport Valley): a knowledge,
space, economy approach, in J.R. Bryson, P.W. Daniels, N. Henry, and J. Pollard (eds.) Knowledge,Space, Economy. London: Routledge.
Hepworth, M. 1992. Geography of the Information Economy. London: Belhaven Press.Herzog, H.W. and Schlottmann, A.M. (eds.) 1991. Industry Location and Public Policy. Knoxville, TN:
University of Tennessee Press.Hewett, E.A. and Gaddy, C.G. 1992. Open for Business: Russia’s return to the global economy.
Washington, DC: Brookings Institution.Hicks, J.R. 1959. Essays in World Economics. Oxford: Oxford University Press.Hill, P. 1986. Development Economics on Trial: The anthropological case for the prosecution.
Cambridge: Cambridge University Press.Hirschman, A.O. 1958. The Strategy of Economic Development. New Haven, CT: Yale University Press.Hirschman, A. 1992. Industrialization and its manifold discontents: west, east and south, World
Development 20, 1225–1232.Hirst, P. 1994. Associative Democracy. Cambridge: Polity Press.Hirst, P. and Zeitlin, J. (ed.) 1989. Reversing Economic Decline: Industrial structure and policy in Britain
and her competitors. Oxford: Berg.Hobsbawm, E.J. 1968. Industry and Empire. New York: Pantheon.Hoekman, B.M. and Kostecki, M.M. 1996. The Political Economy of the World Trading System: From
GATT to WTO. New York: Oxford University Press.Holland, S. 1980. UnCommon Market. London: Macmillan.Holloway, S.R. and Pandit, K. 1992. The disparity between the level of economic development and human
welfare, Professional Geographer 44, 57–71.Hopkins, A.G. 1973. An Economic History of West Africa. London: Longman.Hopkins, M. 1983. Employment trends in developing countries, 1960–80 and beyond, International
Labour Review 122, 461–478.Hopkins, T.K. and Wallerstein, I. 1979. Cyclical rhythms and secular trends of the capitalist world-
economy, Review 2, 483–500.Hossain, M. 1982. Agrarian reform in Asia—a review of recent experience in selected countries, in S.
Jones, M. Murmis, and C. Joshi (eds.) Rural Poverty and Agrarian Reform. New Delhi: Allied.Howells, J. 2003. Innovation, Consumption and Knowledge: Services and encapsulation. CRIC
Discussion Paper No. 62. Manchester: University of Manchester, Centre for Research on Innovationand Competition.
Howells, J. and Wood, M. 1993. The Globalisation of Production and Technology. London: BelhavenPress.
Hsu, R.C. 1982. Agricultural financial policies in China, 1949–80, Asian Survey 22, 638–658.Hudson, R. 1983. Regional labour reserves and industrialization in the EEC, Area 15, 223–230.Hugill, P. 1993. World Trade Since 1431. Geography, technology, and capitalism. Baltimore, MD: Johns
Hopkins University Press.
BIBLIOGRAPHY 435
6063 GEOGRAPHY WORLD ECON_PT_246x189 mm 22/01/2014 15:11 Page 435
Hugill, P. 1999. Global Communications since 1844: Geography, technology, and capitalism. Baltimore,MD: Johns Hopkins University Press.
Hutton, W. 1995. The State We’re In. London: Jonathan Cape.Hutton, W. and Giddens, A. (eds.) 2000. Global Capitalism. New York: New Press.Hymer, S. 1972. The multinational corporation and the law of uneven development, in J.N. Bhagwati
(ed.) Economics and World Order. London: Macmillan.IFAD (International Fund for Agricultural Development). 2001. Rural Poverty Report 2001: The
challenge of ending rural poverty. Rome: IFAD.IFAD. 2002. Regional Strategy Paper: IFAD strategy for rural poverty reduction in Asia and the Pacific.
Rome: IFAD.ILO (International Labour Office). 2000. HIV/AIDS: A threat to decent work, productivity and
development. Geneva: ILO.ILO. 2000. Yearbook of Labour Statistics. Geneva: ILO.ILO. 2004. World Employment Report 2004–05. Geneva: ILO.ILO. 2007. Global Employment Trends. January brief. Geneva: ILO.ILO. 2010. International Labour Migration: A rights-based approach. Geneva: ILO.IMF (International Monetary Fund). 1991. World Imports and Exports. Washington, DC: International
Monetary Fund.IMF. 2001. World Economic Outlook: The information technology revolution. Washington, DC: IMF
Publication Services.IMF. 2011. Changing Patterns of Global Trade. Washington, DC: IMF; available at http://www.imf.org/
external/np/pp/eng/2011/061511.pdfIndependent Commission on International Development Issues. 1980. North–South: A programme for
survival (the Brandt Report). Oxford: Oxford University Press.Independent Commission on International Development Issues. 1983. Common Crisis: North–south
cooperation for world recovery (Brandt II). London: Pan Books.Jackson, R.H. 1986. Conclusion, in P. Duignan and R.H. Jackson (eds.) Politics and Government in
African States, 1960–1985. Beckenham: Croom Helm.Jackson, R.H. 1990. Quasi-States. Cambridge: Cambridge University Press.Jacobs, J. 1969. The Economy of Cities. New York: Random House.Jacobs, J. 1984. Cities and the wealth of nations, Atlantic Monthly March, 41–66.Jacquemin, A. 1987. The New Industrial Organization. Oxford: Clarendon Press.JAMA (Japan Automobile Manufacturers Association, Inc). 2012. Japan Automobile Manufacturers:
Creating economic growth and jobs in America. Tokyo, Japan: JAMA; available at http://www.jama-english.jp/publications/30025_JAMA_Spreads.pdf
Jenkins, R.O. 1988. Transnational Corporations and Uneven Development: The internationalization ofcapital and the third world. London: Methuen.
Jessop, B. 1992. Post-Fordism and flexible specialization. Incommensurable, contradictory, or just plaindifferent perspectives?, in H. Ernste and V. Meier (eds.) Regional Development and ContemporaryIndustrial Response. London: Belhaven Press.
Joekes, S.P. 1987. Women in the World Economy. New York: Oxford University Press.Johnson, A.W. and Earle, T. 1987. The Evolution of Human Societies: From foraging group to agrarian
state. Stanford, CA: Stanford University Press.Johnston, R.J. 1980. City and Society. Harmondsworth: Penguin.Johnston, R.J. 1984. The world is our oyster, Transactions of the Institute of British Geographers 9,
443–459.Johnston, R.J. 1986. The state, the region, and the division of labor, in A.J. Scott and M. Storper (eds.)
Production, Work, Territory: The geographical anatomy of industrial capitalism. Boston, MA: Allen& Unwin.
Johnston, R.J. 1992. The rise and decline of the corporate-welfare state: a comparative analysis in globalcontext, in P.J. Taylor (ed.) The Political Geography of the Twentieth Century. London: BelhavenPress.
BIBLIOGRAPHY436
6063 GEOGRAPHY WORLD ECON_PT_246x189 mm 22/01/2014 15:11 Page 436
Johnston, R.J., Taylor, P.J., and Watts, M. (eds.) 2002. Geographies of Global Change: Remapping theworld, 2nd edn. Cambridge, MA: Blackwell.
Jones, R.S., King, R.E., and Klein, M. 1993. Economic integration between Hong Kong, Taiwan andthe coastal provinces of China, OECD Economic Studies 20, 115–144.
Jones, S. 1982. Introduction, in S. Jones, M. Murmis, and C. Joshi (eds.) Rural Poverty and AgrarianReform. New Delhi: Allied.
Jones, S., Murmis, M., and Joshi, C. (eds.) 1982. Rural Poverty and Agrarian Reform. New Delhi: Allied.
Kaimowitz, D. 1995. Livestock and Deforestation in Central America in the 1980s and 1990s: A policyperspective. EPTD Discussion Paper No. 9. Washington, DC: Environment and Production TechnologyDivision, International Food Policy Research Institute.
Kai-Sun, K., Leung-Chuen, C., Lui, F.T., and Qiu, L.D. 2001. Industrial Development in Singapore,Taiwan, and South Korea. River Edge, NJ: World Scientific.
Kaplinsky, R. 1984. Automation: The technology and society. London: Longman.Kapur, D. and Ramamurti, R. 2001. India’s emerging competitive advantage in services, Academy of
Management Executive 15, 20–32.Karmarkar, U. 2004. Will you survive the services revolution?, Harvard Business Review 82, 101–107.Katouzian, H. 1983. Shi’ism and Islamic economics: Sadr and Bani Sadr, in N.R. Keddie (ed.) Religion
and Politics in Iran: Shi’ism from quietism to revolution. New Haven, CT: Yale University Press.Kedourie, E. 1960. Nationalism. London: Hutchinson.Kirchner, J. 1983. Supercomputing seen as key to economic success, Computerworld, October 3, 8.Knox, P.L. 1984. The Geography of Western Europe: A socio-economic survey. Beckenham: Croom
Helm.Knox, P.L. 1994. Urbanization: An introduction to urban geography. Englewood Cliffs, NJ: Prentice
Hall.Knox, P.L. 1995. World cities in a world-system, in P.L. Knox and P.J. Taylor (eds.) World Cities in a
World-System. Cambridge: Cambridge University Press.Knox, P.L., Bartels, E.H., Bohland, J.R., Holcomb, B., and Johnston, R.J. 1988. The US: A contemporary
human geography. London: Longman.Knox, P.L. and Taylor, P.J. (eds.) 1995. World Cities in a World-System. Cambridge: Cambridge University
Press.Kopytoff, I. 1987. The African Frontier: The reproduction of traditional African societies. Bloomington,
IN: Indiana University Press.Kornhauser, D. 1989. Japan: Geographical background to urban and industrial development, 2nd edn.
London: Longman.Kosters, M.H. 1992. Workers and Their Wages. Washington, DC: American Enterprise Institute.Krebs, G. 1982. Regional inequalities during the process of national economic development: a critical
approach, Geoforum 13, 71–81.Krueger, A. 1978. Alternative trade strategies and employment in developing countries, American
Economic Review 68, 523–536.Krugman, P. 1990. The Age of Diminished Expectations: US economic policy in the 1990s. Cambridge,
MA: MIT Press.Krugman, P. 1991. Geography and Trade. Cambridge, MA: MIT Press.Krugman, P. 1994. The myth of Asia’s miracle, Foreign Affairs 73, 62–78.Krugman, P. 1995. The localization of the world economy, New Perspectives Quarterly Winter, 34–38.Laird, S. and Yeats, A. 1990. Trends in non-tariff barriers of developed countries, 1966–1986,
Weltwirtschaftliches Archiv. Review of World Economies 126, 299–325.Land Matrix. 2012a. Public database of land deals; available at http://landportal.info/Land Matrix. 2012b. Transnational Land Deals for Agriculture in the Global South; available at
http://landportal.info/landmatrix/get-the-detail#analytical-reportLandes, D.S. 1999. The Wealth and Poverty of Nations. New York: W.W. Norton.Landsberger, H.A. 1969. Latin American Peasant Movements. Ithaca, NY: Cornell University Press.
BIBLIOGRAPHY 437
6063 GEOGRAPHY WORLD ECON_PT_246x189 mm 22/01/2014 15:11 Page 437
Langley, L.D. 1983. The Banana Wars: An inner history of American empire, 1900–1934. Lexington,KY: University Press of Kentucky.
Lanvin, B. 1991. Services and new industrial strategies: what is at stake for developing countries?, inP.W. Daniels and F. Moulaert (eds.) The Changing Geography of Advanced Producer Services:Theoretical and empirical perspectives. London: Belhaven Press.
Lardy, N.R. 1984. Prices, markets, and the Chinese peasant, in C.K. Eicher and J.M. Staatz (eds.)Agricultural Development in the Third World. Baltimore, MD: Johns Hopkins University Press.
Lash, S. and Urry, J. 1987. The End of Organized Capitalism. Cambridge: Polity Press.Latham, A.J.H. 1978. The International Economy and the Undeveloped World, 1865–1914. Beckenham:
Croom Helm.Lavrov, S.B. and Sdasnyk, G.V. 1982. The growth pole concept and the regional planning experience
of developing countries, Development Dialogue 3, 15–27.Lechner, F.J. and Boli, J. (eds.) 2000. The Globalization Reader. Malden: Blackwell.Lee, R. and Wills, J. (eds.) 1997. Geographies of Economies. London: Edward Arnold.Lele, U. 1984. Rural Africa: modernization, equity, and long term development, in C.K. Eicher and
J.M. Staatz (eds.) Agricultural Development in the Third World. Baltimore, MD: Johns HopkinsUniversity Press.
Lessard, D.R. and Williamson, J. 1987. Capital Flight and Third World Debt. Washington, DC: Institutefor International Economics.
Lesser, A. 1961. Social fields and the evolution of society, Southwestern Journal of Anthropology 17,40–48.
Leung, C.K. and Chin, S.S.K. (eds.) 1983. China in Readjustment. Hong Kong: Centre for Asian Studies,University of Hong Kong.
Levy, F. and Murnane, R.J. 1992. US earnings levels and earnings inequality: a review of recent trendsand proposed explanations, Journal of Economic Literature 30, 1333–1381.
Levy, F. and Murnane, R.J. 2004. The New Division of Labor: How computers are creating the nextjob market. New York: Russell Sage Foundation.
Lewis, P. 1988. Third world funds: wrong way flow, New York Times, 11 February, D1, D9.Lewis, W.A. 1978. Growth and Fluctuations 1870–1913. London: Allen & Unwin.Leyshon, A. and Thrift, N. 1997. Money/Space: Geographies of monetary transformation. London:
Routledge.Light, I. 1983. Cities in World Perspective. New York: Macmillan.Linge, G.J.R. and Hamilton, F.E.I. 1983. Industrial systems, in F.E.I. Hamilton and G.J.R. Linge (eds.)
Spatial Analysis, Industry and the Industrial Environment. Chichester: John Wiley & Sons.Lipietz, A. 1986. Behind the crisis: the exhaustion of a regime of accumulation. A “regulation school”
perspective on some French empirical works, Review of Radical Political Economics 18, 13–32.Little, I. 1982. Economic Development: Theory, policy, and international relations. New York: Basic
Books.Lloyd, P. and Meegan, R. 1996. Contested governance: European exposure in the English regions,
European Planning Studies 4, 75–97.Locatelli, R.L. 1985. Industrializacao, Crescimento e Empregno: Uma avaliacao da experiencia Brasileira.
Rio de Janeiro: IPEA/INPES.Lonsdale, J. 1985. The European scramble and conquest in African history, in R. Oliver and G.N.
Sanderson (eds.) The Cambridge History of Africa. Vol. 6: From 1870 to 1905. Cambridge: CambridgeUniversity Press.
Loup, J. 1983. Can the Third World Survive? Baltimore, MD: Johns Hopkins University Press.Lu, M., Fan, J., Liu, S. and Yan, Y. 2002. Employment restructuring during China’s economic transition,
Monthly Labor Review August, 25–31.McCarthy, L. 2000. European integration, urban economic change, and public policy responses,
Professional Geographer 52, 191–205.McDowell, L. 1991. Life without father or Ford: the new gender order of post-Fordism, Transactions
of the Institute of British Geographers 16, 400–419.
BIBLIOGRAPHY438
6063 GEOGRAPHY WORLD ECON_PT_246x189 mm 22/01/2014 15:11 Page 438
MacFarquhar, R. 1992. Deng’s last campaign, New York Review of Books, December 17, 22–28.McGowan, K. 2001. Lessons from around the world, American Demographics 23, 50–53.McGranahan, D.V., Richard-Proust, C., Sovani, N.V., and Subramanian, M. 1970. Content and
Measurement of Socio-Economic Development. Geneva: UNRISD.MacLaughlin, J.G. and Agnew, J.A. 1986. Hegemony and the regional question: the political geography
of regional industrial policy in Northern Ireland 1945–1972, Annals of the Association of AmericanGeographers 76, 247–261.
McMichael, P. 1994. Agro-food restructuring in the Pacific Rim: a comparative-international perspectiveon Japan, South Korea, the United States, Australia, and Thailand, in R.A. Palat (ed.) Pacific-Asiaand the Future of the World-system. Westport, CT: Greenwood Press.
McMichael, P. 1996. Development and Social Change: A global perspective. Thousand Oaks, CA: PineForge Press.
McMichael, P., Petras, J., and Rhodes, R. 1974. Imperialism and the contradictions of development,New Left Review 85, 83–104.
Maddison, A. 1983. A comparison of levels of GDP per capita in developed and developing countries,1700–1980, Journal of Economic History 43, 27–41.
Maddison, A. 2001. The World Economy: A millennial perspective. Paris: OECD Development CentreStudies.
Malassis, L. 1975. Agriculture and the Development Process. Paris: UNESCO.Malecki, E. 1979. Locational trends in R&D by large US corporations, 1965–1976, Economic Geography
55, 308–323.Malecki, E. 1991. Technology and Economic Development. The dynamics of local, regional and national
change. London: Longman.Malmberg, A. and Maskell, P. 1997. Towards an explanation of regional specialization and industry
agglomeration, European Planning Studies 5, 25–41.Mankiw, N.G. and Swagel, P. 2006. The Politics and Economics of Outsourcing. Working Paper 12398.
Cambridge, MA: National Bureau of Economic Research.Marks, S. and Rathbone, R. (ed.) 1982. Industrialization and Social Change in South Africa. London:
Longman.Markusen, A. 1983. High tech jobs, markets, and economic development prospects, Built Environment
9, 18–27.Marshall, A. 1920. Principles of Economics. London: Macmillan.Marston, S.A., Knox, P.L., and Liverman, D.M. 2008. World Regions in Global Context: Peoples, places,
and environments, 3rd edn. Upper Saddle River, NJ: Pearson Education.Martin, R.L. 1986. Thatcherism and Britain’s industrial landscape, in R.L. Martin and B. Rowthorne
(eds.) The Geography of Deindustrialization. London: Methuen.Martin, R.L. 1988. The political economy of Britain’s north–south divide, Transactions of the Institute
of British Geographers 13, 389–418.Martin, R.L. 1999. The new “geographical turn” in economics: some critical reflections, Cambridge
Journal of Economics 23, 65–91.Martin, R.L. and Hodge, J.S.C. 1983. The reconstruction of Britain’s regional policy, 2: towards a new
agenda, Environment and Planning C: Government and Policy 1, 317–340.Martin, R.L. and Rowthorn, B. (eds.) 1986. The Geography of De-Industrialisation. London: Macmillan.Mason, M. 1992. American Multinationals and Japan: The political economy of Japanese capital
controls, 1899–1980. Cambridge, MA: Harvard University Press.Massey, D. 1984. Spatial Divisions of Labour. London: Methuen.Massey, D. 2005. For Space. London: Sage.Massey, D. and Meegan, R. 1989. Spatial divisions of labour in Britain, in D. Gregory and R. Walford
(eds.) Horizons in Human Geography. Totowa, NJ: Barnes & Noble.Mattera, P. 1985. Off the Books: The rise of the underground economy. New York: St. Martin’s Press.Meadows, D.H., Meadows, D.L., Randers, J., and Behrens, W.W. 1972. The Limits to Growth. London:
Earth Island.
BIBLIOGRAPHY 439
6063 GEOGRAPHY WORLD ECON_PT_246x189 mm 22/01/2014 15:11 Page 439
Meier, G.M. and Baldwin, R.E. 1957. Economic Development. New York: John Wiley & Sons.Menzel, U. and Senghaas, D. 1987. NICs defined: a proposal for indicators evaluating threshold
countries, in K.D. Kim (ed.) Dependency Issues in Korean Development: Comparative perspectives.Seoul: Seoul National University Press.
Metcalf, D. 1969. The Economics of Agriculture. Harmondsworth: Penguin.METI. 2001. White Paper on International Trade 2001: External economic policy challenges in the 21st
century. Tokyo: Ministry of Economy, Trade and Industry.Meyer, D.R. 1983. Emergence of the manufacturing belt: an interpretation, Journal of Historical
Geography 9, 145–174.Mintz, S. 1985. Sweetness and Power: The place of sugar in modern history. New York: Viking.Mishra, P. 2007. Impasse in India, New York Review of Books, June 28, 48–51.Mittelman, J.H. 2000. The Globalization Syndrome: Transformation and resistance. Princeton, NJ:
Princeton University Press.Morello, T. 1983. Sweatshops in the sun?, Far Eastern Economic Review, September 15, 88–89.Morris, M.D. 1980. Measuring the Condition of the World’s Poor. New York: Pergamon.Moudoud, E. 1986. The Rise and Fall of the Growth Pole Approach. Department of Geography Discussion
Paper No. 89. Syracuse, NY: Syracuse University.Münz, P., Straubhaar, T., Vadean, F., and Vadean, N. 2007. What are the Migrants’ Contributions to
Employment and Growth? A European approach. Hamburg: Hamburg Institute of InternationalEconomics, Migration Research Group.
Murata, K. 1980. An Industrial Geography of Japan. London: Bell & Hyman.Murphey, R. 1980. The Fading of the Maoist Vision. London: Methuen.Myrdal, G. 1957. Economic Theory and Underdeveloped Regions. London: Duckworth.Nairn, A. 1981. Guatemala, Multinational Monitor 2, 12–14.Nairn, T. 1977. Super-power or failure? in T. Nairn (ed.) Atlantic Europe? Amsterdam: Transnational
Institute.Nakane, C. 1970. Japanese Society. London: Weidenfeld & Nicolson.NASA, Earth Observatory. 2008. Aquatic Dead Zones, January 1; available at http://earthobservatory.
nasa.gov/IOTD/view.php?id=44677National Science Board. 2012. Science and Engineering Indicators 2012. (NSB 12–01) Arlington, VA:
National Science Foundation.Nau, H.R. 1990. The Myth of America’s Decline: Leading the world economy into the 1990s. New
York: Oxford University Press.Nayar, A. 2012. African land grab hinders sustainable development, Nature.com; available at http://
www.nature.com/news/african-land-grabs-hinder-sustainable-development-1.9955Nelson, R. 1995. Recent evolutionary theorizing about economic change, Journal of Economic Literature
33, 1089–1098.Nelson, R. and Winter, S. 1982. An Evolutionary Theory of Economic Change. Cambridge, MA: Belknap
Press of the Harvard University Press.Neuman, S.G. 1984. International stratification and third world military industries, International
Organization 38, 167–198.New Economics Foundation. 2012. The Happy Planet Index: 2012 report: A global index of sustainable
well-being. London: NEF.Noor, M. 2008. Many families limiting themselves to a single car, New York Times, July 27; available
at http://www.nytimes.com/2008/07/27/nyregion/nyregionspecial2/27Ronecar.htmlNewby, H. 1980. Rural sociology, Current Sociology 28, 1–141.Nolan, P. 1983. De-collectivization of agriculture in China, 1979–82: a long-term perspective, Cambridge
Journal of Economics 7, 381–403.Oakland Institute. 2011. Understanding land investment deals in Africa; available at http://www.
oaklandinstitute.org/sites/oaklandinstitute.org/files/OI_brief_land_grabs_leave_africa_thirsty_1.pdfO’Brien, P. 1982. European economic development: the contribution of the periphery, Economic History
Review 35, 1–18.
BIBLIOGRAPHY440
6063 GEOGRAPHY WORLD ECON_PT_246x189 mm 22/01/2014 15:11 Page 440
O’Brien, R. 1992. Global Financial Integration: The end of geography. New York: Council on ForeignRelations Press.
O’Connor, A.M. 1978. The Geography of Tropical African Development: A study of spatial patternsof economic change since independence, 2nd edn. Oxford: Pergamon.
ODCCP (United Nations Office for Drug Control and Crime Prevention). 2000. Global Illicit Drug Trends2000. Vienna: ODCCP.
OECD (Organization for Economic Cooperation and Development). 1979. The Impact of the NICs onProduction and Trade in Manufactures. Paris: Organization for Economic Cooperation andDevelopment.
OECD. 1996. The Knowledge-Based Economy. Paris: OECD.OECD. 2001a. OECD in Figures, 2001: Statistics on the member countries. Paris: OECD Observer.OECD. 2001b. Understanding the Digital Divide. Paris: OECD.OECD. 2006. OECD in Figures, 2006–07 Edition: Statistics on the member countries. Paris: OECD
Observer.OECD. nd. Poverty reduction and social development: migration and the brain drain phenomenon;
available at http://www.oecd.org/dev/poverty/migrationandthebraindrainphenomenon.htmOECD iLibrary. 2010. OECD Factbook 2010: Economic, environmental and social statistics, Paris:
OECD; available at http://www.oecd-ilibrary.org/sites/factbook-2010-en/02/04/02/02–04–02-g3.html?contentType=&itemId=/content/chapter/factbook-2010–20-en&containerItemId=/content/serial/18147364&accessItemIds=&mimeType=text/html
O’Farrell, P.N. and Wood, P.A. 1998. Internationalisation by business service firms: towards a newregionally based conceptual framework, Environment and Planning A 30, 109–128.
O hUallacháin, B. 1996. Vertical integration in American manufacturing: evidence for the 1980s,Professional Geographer 48, 343–356.
O’Loughlin, J. 1989. World power competition and local conflicts in the third world, in R.J. Johnstonand P.J. Taylor (eds.) A World in Crisis? Geographical perspectives, 2nd edn. Oxford: Blackwell.
O’Meara, P., Mehlinger, H.D., and Krain, M. (eds.) 2000. Globalization and the Challenges of a NewCentury. Bloomington, IN: Indiana University Press.
Orwell, G. 1962 (1937). The Road to Wigan Pier. Harmondsworth: Penguin.Owen, N. 1983. Economies of Scale, Competitiveness, and Trade Patterns within the European
Community. Oxford: Clarendon Press.Oxfam. 2002. Rigged Rules and Double Standards: Trade, globalisation, and the fight against poverty.
Oxford: Oxfam International.Oxfam. 2004. Trading Away our Rights: Women working in global supply chains. Oxford: Oxfam
International.Parboni, R. 1988. US economic strategies against western Europe: from Nixon to Reagan, Geoforum
19, 45–54.Parker, J. 1992. Survey: Russia reborn, Economist, December 5, 58.Pauly, L.W. and Reich, S. 1997. National structures and multinational corporate behavior: enduring
differences in the age of globalisation, International Organization 51, 1–30.Payer, C. 1974. The Debt Trap. Harmondsworth: Penguin.Pearse, A. 1975. The Latin American Peasant. London: Cass.Pearse, A. 1979. Seeds of Plenty, Seeds of Want. London: Oxford University Press.Peck, J. and Tickell, A. 2002. Neoliberalizing space, in N. Brenner and N. Theodore (eds.) Spaces of
Neoliberalism. Urban restructuring in North America and western Europe. Oxford: Blackwell.Peet, R. 1987. Industrial devolution, underconsumption and the third world debt crisis, World
Development 15, 777–788.Peet, R. 1991. Global Capitalism: Theories of societal development. New York: Routledge.Perez, C. 1983. Structural change and assimilation of new technologies in economic-social systems, Futures
10, 357–375.Perkins, D. and Yusuf, S. 1984. Rural Development in China. Baltimore, MD: Johns Hopkins University
Press.
BIBLIOGRAPHY 441
6063 GEOGRAPHY WORLD ECON_PT_246x189 mm 22/01/2014 15:11 Page 441
Perroux, F. 1955. Note sur la notion de pole de croissance, in I. Livingstone (ed.) (pub. 1979)Development Economics and Policy: Selected readings. London: Allen & Unwin.
Perroux, F. 1961. La firme motrice dans la région et la région motrice, Théorie et Politique de la ExpansionRegionale. Liège: Université de Liège.
Petras, J. 1984. Toward a theory of industrial development in the third world, Journal of ContemporaryAsia 14, 182–203.
Pew Charitable Trusts. 2013. Who’s Winning the Clean Energy Race? Pew: Philadelphia and Washington,DC: Pew.
Picciotto, S. 1991. The internationalization of the state, Review of Radical Political Economics 22, 28–44.
Pinder, D. 1998. The New Europe. Chichester: John Wiley & Sons.Piore, M. and Sabel, C. 1984. The Second Industrial Divide. New York: Basic Books.Plant, R. 1998. Indigenous Peoples and Poverty Reduction: A case study of Guatemala. Washington,
DC: Inter-American Development Bank.Polanyi, K. 1957. The place of economies in societies, in K. Polanyi, C. Maynadier Arensberg, and
H.W. Pearson (eds.) Trade and Markets in the Early Empires. Glencoe, IL: Free Press.Pollard, S. 1981. Peaceful Conquest: The industrialization of Europe, 1760–1970. Oxford: Oxford
University Press.Popke, J. 2006. Geography and ethics: everyday mediations through care and consumption, Progress in
Human Geography 30, 504–512.Porter, M.E. (ed.) 1986. Competition in Global Industries. Cambridge, MA: Harvard Business School
Press.Porter, M.E. 1990. The Competitive Advantage of Nations. New York: Free Press.Powell, A. 1991. Commodity and developing country terms of trade: what does the long run show?,
Economic Journal 101, 1485–1496.Puyana de Palacios, A. 1982. Economic Integration among Unequal Partners: The case of the Andean
group. New York: Pergamon.Rada, J. 1984. International Division of Labor and Technology. Geneva: ILO.Ranger, T. 1976. From humanism to the science of man: colonialism in Africa and the understanding
of alien societies, Transactions of the Royal Historical Society 26, 115–141.Reardon, T., Timmer, C.P., Barrett, C.B., and Berdegué, J. 2003. The rise of supermarkets in Africa,
Asia and Latin America, American Journal of Agricultural Economics 85, 1140–1146.Reich, R. 1991. The Work of Nations: Preparing ourselves for 21st century capitalism. New York: Vintage
Books.Reid, M. 1996. Mercosur: remapping South America, Economist, October 12.Reitsma, H.A. and Kleinpenning, J.M.G. 1985. The Third World in Perspective. Totowa, NJ: Rowman
& Allanheld.Reynolds, R. 1961. Europe Emerges. Transition toward an industrial world-wide society. Madison,
WI: University of Wisconsin Press.Richardson, R. and Belt, V. 2001. Saved by the bell? Call centres and economic development in less
favoured regions, Economic and Industrial Democracy 22, 67–98.Roberts, S. 1994. Fictitious capital, fictitious spaces: the geography of offshore financial flows, in
S. Corbridge, R. Martin, and N. Thrift (eds.) Money, Power, and Space. Oxford: Blackwell.Rodriguez, E. and Griffith-Jones, S. (eds.) 1992. Cross-Conditionality, Banking Regulation and Third
World Debt. London: Macmillan.Rogoff, K. 1992. Dealing with developing country debt in the 1990s, The World Economy 15, 475–492.Rokkan, S. 1980. Territories, centres and peripheries, in J. Gottmann (ed.) Centre and Periphery. London:
Sage.Rokkan, S. and Urwin, D. 1983. Economy, Territory, Identity: Politics of west European peripheries.
London: Sage.Rondinelli, D.A. 1983. Dynamics of growth of secondary cities in developing countries, Geographical
Review 73, 42–57.
BIBLIOGRAPHY442
6063 GEOGRAPHY WORLD ECON_PT_246x189 mm 22/01/2014 15:11 Page 442
Roosevelt, A.C. 1992. Secrets of the forest: an archaeologist appraises the past—and the future—ofAmazonia, The Sciences, November/December, 22–28.
Rose, R. 1984. Understanding Big Government. London: Sage.Ross, R. 1982. Regional illusion, capitalist reality, Democracy 2, 93–99.Rowher, J. 1992. When China wakes: a survey, Economist, November 28.Rowher, J. 1993. A billion consumers: a survey of Asia, Economist, October 30.Rubenstein, J.M. 2005. The Cultural Landscape: An introduction to human geography, 8th edn. Upper
Saddle River, NJ: Pearson/Prentice Hall.Rudolph, L.I. and Rudolph, S.H. 1987. In Pursuit of Lakshmi: The political economy of the Indian
state. Chicago, IL: University of Chicago Press.Ruggie, J.G. 1983. International regimes, transactions and change: embedded liberalism in the postwar
economic order, in S.D. Krasner (ed.) International Regimes. Ithaca, NY: Cornell University Press.
Sabel, C.F. 1982. Work and Politics: The division of labor in industry. New York: Cambridge UniversityPress.
Sachar, A. and Öberg, S. (eds.) 1990. The World Economy and the Spatial Organization of Power.Brookfield, VT: Gower.
Sadler, D. 1992a. Industrial policy of the European Community: strategic deficits and regional dilemmas,Environment & Planning A 24, 1711–1730.
Sadler, D. 1992b. The Global Region. Tarrytown, NY: Pergamon.Samuelson, P. 1964. Economics. New York: McGraw-Hill.Sanders, R. 1987. Towards a geography of informal activity, Socio-Economic Planning Sciences 21,
229–237.Santiago, C.E. 1987. The impact of foreign direct investment on employment structure and employment
generation, World Development 15, 317–328.Sassen, S. 2001. The Global City: New York, London, Tokyo, rev. edn. Princeton, NJ: Princeton University
Press.Savitch, H.V. and Ardashev, G. 2001. Does terror have an urban future?, Urban Studies 38, 2515–2533.Saxenian, A. 1994. Regional Advantage: Culture and competition in Silicon Valley and Route 128.
Cambridge, MA: Harvard University Press.Sayer, A. 1985. Industry and space: a sympathetic critique of radical research, Society and Space 3, 3–29.Sayer, A. and Walker, R. 1992. The New Social Economy: Reworking the division of labor. Cambridge,
MA: Blackwell.Schejtman, A. 1982. Land reform and entrepreneurial structure in rural Mexico, in S. Jones, M. Murmis,
and C. Joshi (eds.) Rural Poverty and Agrarian Reform. New Delhi: Allied.Schiffer, J. 1981. The changing post-war pattern of development: the accumulated wisdom of Samir
Amin, World Development 9, 515–537.Schoenberger, E. 1990. US manufacturing investments in western Europe: markets, corporate strategy,
and the competitive environment, Annals of the Association of American Geographers 80, 379–393.Scott, A.J. 1986. Industrial organization and location: division of labor, the firm, and spatial process,
Economic Geography 62, 215–231.Scott, A.J. 1987. The semi-conductor industry in Southeast Asia: organization, location, and the
international division of labour, Regional Studies 21, 143–160.Scott, A.J. 1988a. Flexible production systems and regional development. The rise of new industrial spaces
in Europe and North America, International Journal of Urban and Regional Research 12, 171–186.Scott, A.J. 1988b. New Industrial Spaces. London: Pion.Scott, A.J. 1992. The role of large producers in industrial districts: a case study of high technology systems
houses in southern California, Regional Studies 26, 265–275.Scott, A.J. 1993. Technopolis: High-technology industry and regional development in southern California.
Berkeley and Los Angeles: University of California Press.Scott, A.J. 1996. Regional motors of the global economy, Futures 28, 391–411.Scott, A.J. 1998. Regions in the World Economy. Oxford: Oxford University Press.
BIBLIOGRAPHY 443
6063 GEOGRAPHY WORLD ECON_PT_246x189 mm 22/01/2014 15:11 Page 443
Scott, A.J. 2000. The Cultural Economy of Cities: Essays on the geography of image-producing industries.London: Sage.
Scott, A.J. 2001. Global City-Regions: Trends, theory, policy. New York: Oxford University Press.Scott, A.J. 2005. On Hollywood: The place, the industry. Princeton, NJ: Princeton University Press.Scott, A.J. 2010. Creative cities: the role of culture, Revue d’Économie Politique 1, 181–204.Scott, A.J. and Storper, M.J. (eds.) 1986. Production, Work, Territory. London: Allen & Unwin.Seattle Times. 2006. Boeing’s outsourcing for the 787 Dreamliner, Seattle Times, September 29.Schneider, F., Buehn, A., and Montenegro, C.E. 2010. Shadow Economies All over the World: New
estimates for 162 countries from 1999 to 2007. Washington, DC: World Bank.Seers, D. 1979. The periphery of Europe, in D. Seers, B. Schaeffer, and M.-L. Kiljunen (eds.)
Underdeveloped Europe: Studies in core–periphery relations. Hassocks: Harvester Press.Segal, G. 1999. Does China matter?, Foreign Affairs 78, 24–36.Seiber, M.J. 1982. International Borrowing by Developing Countries. New York: Pergamon.Sen, A. 1981a. Poverty and Famines: An essay on entitlement and deprivation. Oxford: Clarendon Press.Sen, A. 1981b. Public action and the quality of life in developing countries, Oxford Bulletin of Economics
and Statistics 43, 111–123.Sender, J. and Smith, S. 1986. The Development of Capitalism in Africa. London: Methuen.Shaw, D. 1999. Russia in the Modern World, 2nd edn. Oxford: Blackwell.Shiba, T. and Shimotami, M. (eds.) 1997. Beyond the Firm: Business groups in international and historical
perspective. New York: Oxford University Press.Shunzan, Y. 1987. Urban policies and urban housing programs in China, in R.J. Fuchs, G.W. Jones,
and E.M. Pernia (eds.) Urbanization and Urban Policies in Pacific Asia. Boulder, CO: Westview.Shutt, J. and Whittington, R. 1987. Fragmentation strategies and the rise of small units: cases from the
north west, Regional Studies 21, 13–23.SIA. 2007. Global chip sales hit record $247.7 billion in 2006, Semiconductor Industry Association
February 2; available at http://www.sia-online.org/pre_release.cfm?ID=426SIPRI (Stockholm International Peace Research Institute). 2013. SIPRI military expenditure database;
available at http://www.sipri.org/research/armaments/milex/milex_databaseSirbu, M.A. Jr, Treitel, R., Yorsz, W., and Roberts, E.B. 1976. The Formation of a Technology-Oriented
Complex. Cambridge, MA: MIT Center for Policy Alternatives.Skocpol, T. 1976. France, Russia, China: a structural theory of social revolution, Comparative Studies
in Society and History 18, 181–196.Slater, D. 1992. On the borders of social theory: learning from other regions, Society and Space 10,
307–327.Smeeding, T., O’Higgins, M., and Rainwater, L. (eds.) 1990. Poverty, Inequality, and Income Distribution
in Comparative Perspective: The Luxembourg income study. London: Harvester Wheatsheaf.Smith, D. 1979. Where the Grass is Greener. Harmondsworth: Penguin.Smith, I. 1979. The effects of external takeover and manufacturing employment change in the northern
region, 1963–1973, Regional Studies 13, 421–436.Smith, R. and Walter, I. 1996. Global Banking. New York: Oxford University Press.Smith, T. 1979. The underdevelopment of development literature: the case of dependency theory, World
Politics 31, 247–288.Smith, T. 1981. The Pattern of Imperialism: The United States, Great Britain, and the late-industrializing
world since 1815. Cambridge: Cambridge University Press.South, R.B. 1990. Transnational “maquiladora” location, Annals of the Association of American
Geographers 80, 549–570.Stallings, B. 1990. The role of foreign capital in economic development, in G. Gereffi and D.L. Wyman
(eds.) Manufacturing Miracles: Paths of industrialization in Latin America and East Asia. Princeton,NJ: Princeton University Press.
Stein, A.A. 1984. The hegemon’s dilemma: Great Britain, the United States, and the international economicorder, International Organization 38, 355–386.
BIBLIOGRAPHY444
6063 GEOGRAPHY WORLD ECON_PT_246x189 mm 22/01/2014 15:11 Page 444
Stein, P. 2010. Inclusive Finance, paper presented at the Korea-World Bank High Level Conference onPost-Crisis Growth and Development, June, Busan, South Korea; available at http://siteresources.worldbank.org/DEC/Resources/84797–1275071905763/Inclusive_Finance-Stein.pdf
Stokes, E. 1959. The English Utilitarians and India. London: Oxford University Press.Storper, M. 1987. The new industrial geography, Urban Geography 8, 585–598.Storper, M.J. and Harrison, B. 1991. Flexibility, hierarchy and regional development: the changing
structure of industrial production systems and their forms of governance in the 1990s, Research Policy20, 407–422.
Storper, M.J. and Scott, A.J. (eds.) 1992. Pathways to Industrialization and Regional Development.London: Routledge.
Streeten, P. 1968. A poor nation’s guide to getting aid, New Society 18, 154–156.Studwell, J. 2013. How Asia Works: Success and failure in the world’s most dynamic region. London:
Profile Books.Stutz, F.P. and Warf, B. 2007. The World Economy: Resources, location, trade and development, 5th
edn. Upper Saddle River, NJ: Pearson Education.Suhartono, F.X. 1987. Growth Centers in the Context of Indonesia’s Urban and Regional Development
Program, MA thesis, Social Science Program, Syracuse University.Sukhotin, I. 1994. Stabilization of the economy and social contrasts, Problems of Economic Transition,
November, 44–61.Sutcliffe, R.B. 1971. Industry and Underdevelopment. London: Addison-Wesley.Sutcliffe, R.B. 1984. Industry and underdevelopment re-examined, in R. Kaplinsky (ed.) Third World
Industrialization in the 1980s: Open economies in a closing world. London: Cass.Svedberg, P. 1991. The export performance of sub-Saharan Africa, Economic Development and
Cultural Change 39, 549–566.Swindell, K. 1985. Farm Labour. Cambridge: Cambridge University Press.Sylvester, D. 2001. Recession seen as painful cure for excesses of dot.com era, Mercury News,
October 1.Szczepanik, E. 1969. The size and efficiency of agricultural investment in selected developing countries,
FAO Monthly Bulletin of Agricultural Economics and Statistics, December, 2.Tata, R.J. and Schultz, R.R. 1988. World variation in human welfare: a new index of development status,
Annals of the Association of American Geographers 78, 580–593.Taussig, M. 1978. Peasant economies and the development of capitalist agriculture in the Cauca Valley,
Colombia, Latin American Perspectives 18, 62–91.Taylor, A. 2000. Bumpy roads for global automakers, Fortune, December 18.Taylor, M.J. and Thrift, N.J. 1983. Business organisation, segmentation and location, Regional Studies
17, 445–465.Taylor, P.J. (ed.) 1992. Political Geography of the Twentieth Century: A global analysis. Harlow: Pearson
Education.Taylor, P.J. 2000. Political Geography: World-economy, nation-state, and locality, 4th edn. London:
Longman.Taylor, P.J. 2004. World City Network: A global urban analysis. London: Routledge.Taylor, P.J. 2007. Cities within spaces of flows: theses for a materialist understanding of the external
relations of cities, in P.J. Taylor, B. Derudder, P. Saey, and F. Witlox (eds.) Cities in Globalization:Practices, policies and theories. London: Routledge.
Taylor, P.J., Derudder, B., Saey, P., and Witlox, F. (eds.) 2007. Cities in Globalization: Practices, policiesand theories. London: Routledge.
Tempest, R. 1996. Barbie and the world economy, Los Angeles Times, September 22, A1, A12.Terlouw, C.P. 1989. World-system theory and regional geography, Tijdschrift voor Economische en Sociale
Geografie 80, 206–221.Terlouw, C.P. 1992. The Regional Geography of the World-System: External arena, periphery,
semiperiphery, core. Utrecht: Netherlands Geographical Studies, No. 144.
BIBLIOGRAPHY 445
6063 GEOGRAPHY WORLD ECON_PT_246x189 mm 22/01/2014 15:11 Page 445
Tharpa, G. and Gaiha, R. 2011. Smallholder Farming in Asia and the Pacific: Challenges and oppor -tunities. Rome, Italy: International Fund for Agricultural Development (IFAD).
Thiesenhusen, A. 1989. Searching for Agrarian Reform in Latin America. Boston, MA: Unwin Hyman.
Thomas, T. 1996. Africa for the Africans, Economist, September 7.Thrift, N. 1989. The geography of international economic disorder, in R.J. Johnston and P.J. Taylor
(eds.) A World in Crisis?, 2nd edn. Oxford: Blackwell.Thrift, N.J. 2002. A hyperactive world, in R.J. Johnston, P.J. Taylor, and M. Watts (eds.) Geographies
of Global Change: Remapping the world, 2nd edn. Oxford: Blackwell.Thurow, L. 1993. Head to Head: The coming economic battle among Japan, Europe, and America.
New York: Warner Books.Tickell, A. 1999; 2001; 2002. Progress in Human Geography progress reports on the geography of services,
23, 633–639; 25, 283–292; 26, 791–801.Tickell, A. and Peck, J.A. 1992. Accumulation, regulation and the geographies of post-Fordism, Progress
in Human Geography 16, 190–218.Tilly, C. (ed.) 1975. The Formation of National States in Western Europe. Princeton, NJ: Princeton
University Press.Tilly, C. 1992. Coercion, Capital, and European States. Cambridge, MA: Blackwell.Timmer, C.P. and Falcon, W.P. 1975. The political economy of rice production and trade in Asia, in
L.G. Reynolds (ed.) Agriculture in Development Theory. New Haven, CT: Yale University Press.Tosh, J. 1980. The cash crop revolution in Africa: an agricultural reappraisal, African Affairs 79, 79–94.Toyota. 2001. Corporate Profile 2001, Tokyo: Toyota; available at http://toyota.irweb.jp/IRweb/
corp_info/datacenter/2001/2001databook.pdfTunstall, J. 1986. Communications Deregulation. Oxford: Blackwell.Tuong, H.D. and Yeats, A.J. 1981. Market disruption, the new protectionism, and developing countries:
a note on empirical evidence from the US, The Developing Economies 19, 107–118.Turits, R. 1987. Trade, debt, and the Cuban economy, World Development 15, 163–180.Turnock, D. 1984. Postwar studies on the human geography of eastern Europe, Progress in Human
Geography 8, 315–345.Turnock, D. (ed.) 2001. East Central Europe and the Former Soviet Union: Environment and society.
London: Arnold.Turton, A. 1982. Poverty, reform and class struggle in rural Thailand, in S. Jones, M. Murmis, and
C. Joshi (eds.) Rural Poverty and Agrarian Reform. New Delhi: Allied.Tylecote, A. 1992. The Long Wave in the World Economy: The current crisis in historical perspective.
London: Routledge.Tyler, W.G. 1976. Manufactured exports and employment creation in developing countries: some
empirical evidence, Economic Development and Cultural Change 24, 355–373.Tyler, W.G. 1981. Growth and export expansion in developing countries: some empirical evidence, Journal
of Development Economics 9, 121–130.Tyler, W.G. 1986. Stabilization, external adjustment, and recession in Brazil: perspectives on the mid-
1980s, Studies in Comparative International Development 21, 5–33.Tyson, L.D. 1992. Who’s Bashing Whom? Trade conflict in high technology industries. Washington,
DC: Institute for International Economics.UK Office of the Deputy Prime Minister. 2004. The English Indices of Deprivation 2004 (revised). London:
HMSO; available at http://www.viral.info/iod/iodpdf/odpm_urbpol_029534.pdfUN (United Nations). 2000. Economic Vulnerability Index: Explanatory note. New York: UN Committee
for Development Policy; available at http://www.un.org/esa/analysis/devplan/cdp00p21.pdfUN. 2001a. 2001 Report on the World Social Situation. New York: Economic and Social Council.UN. 2001b. World Economic and Social Survey 2001: Trends and policies in the world economy. New
York: UN Department of Economic and Social Affairs.UN. 2010. World Population Prospects 2009; available at http://esa.un.org/unpd/wpp/Excel-Data/
population.htm
BIBLIOGRAPHY446
6063 GEOGRAPHY WORLD ECON_PT_246x189 mm 22/01/2014 15:11 Page 446
UN Centre for Human Settlements (Habitat). 2001. Cities in a Globalizing World: Global report onhuman settlements 2001. Nairobi: UN.
UN Centre for Human Settlements (Habitat). 2012. State of the World’s Cities 2010/2011: Cities forall: Bridging the urban divide. New York: United Nations.
UN Economic Commission for Europe 1972. Economic Survey of Europe in 1971. New York: UnitedNations.
UN Economic Commission for Europe 1979. The European Economy in 1978. New York: UnitedNations.
UN Economic Commission for Europe. 1989. Economic Survey of Europe in 1988–89. New York: UnitedNations.
UNAIDS (Joint United Nations Programme on HIV/AIDS). 1999. The UNAIDS Report. Geneva:UNAIDS.
UNAIDS. 2003. HIV/AIDS: It’s your business. Geneva: UNAIDS.UNAIDS. 2006. Report on the Global AIDS Epidemic. Geneva: UNAIDS.UNAIDS. 2010. Global Report. Geneva: UNAIDS.UNAIDS. 2011. World Aids Day Report. Geneva: UNAIDS.UNCTAD (United Nations Conference on Trade and Development). 1987. Commodity Yearbook. Geneva:
UNCTAD.UNCTAD. 1994. Commodity Yearbook. Geneva and New York: UNCTAD.UNCTAD. 2000. Handbook of Statistics. New York and Geneva: UN.UNCTAD. 2001. Economic Development in Africa: Performance, prospects and policy issues. New York
and Geneva: UN (UNCTAD/GDS/AFRICA/1TB/B/48/12).UNCTAD. 2001. World Investment Report 2001. New York and Geneva: United Nations.UNCTAD. 2003. E-Commerce and Development Report 2003. New York and Geneva: United Nations.UNCTAD. 2004a. World Investment Report 2004: The shift towards services. New York and Geneva:
United Nations.UNCTAD. 2004b. Globalisation and Development: Facts and figures. New York and Geneva: United
Nations.UNCTAD. 2006. World Investment Report 2006: FDI from developing and transition economies:
Implications for development. New York and Geneva: United Nations.UNCTAD. 2011. World Investment Report: Non-equity modes of international production and
development. New York and Geneva: United Nations.UNDP (United Nations Development Programme). 2001. Human Development Report 2001: Making
new technologies work for human development. New York and Oxford: Oxford University Press.UNDP. 2005. Human Development Report 2005: International cooperation at a crossroads. New York:
UNDP.UNDP. 2006. Human Development Report 2006: Beyond scarcity: Power, poverty and the global water
crisis. New York and Oxford: Oxford University Press.UNDP. 2007. Human Development Report: Fighting climate change, human solidarity in a divided world.
New York: United Nations.UNDP. 2009. Human Development Report 2009: Overcoming barriers: Human mobility and
development. New York: United Nations Development Programme; available at http://hdr.undp.org/en/media/HDR_2009_EN_Chapter4.pdf
UNEP (United Nations Environment Programme). 2002. Vital Water Graphics: An overview of the stateof the world’s fresh and marine waters. New York: UNEP.
UNFPA (United Nations Population Fund). 2001. The State of World Population 2001. New York:UNFPA.
UNIDO (United Nations Industrial Development Organization). Various issues. Industrial Development:Global report. Oxford: Oxford University Press.
UNIDO. 1981. A Statistical Review of the World Industrial Situation, 1980. Vienna: United NationsIndustrial Development Organization.
UNIDO. 2000. UNIDO Round Table—Marginalization versus Prosperity. Vienna: UNIDO.
BIBLIOGRAPHY 447
6063 GEOGRAPHY WORLD ECON_PT_246x189 mm 22/01/2014 15:11 Page 447
UNWTO (UN World Tourism Organization). 2012. UNWTO Tourism Highlights: 2012 edition.Madrid: UNWTO.
Urry, J. 1985. Social relations, space and time, in D. Gregory and J. Urry (eds.) Social Relations andSpatial Structures. London: Macmillan.
US Bureau of Labor Statistics. 2010. International Comparisons of Manufacturing Productivity and UnitLabor Cost Trends 2009, Supplementary Tables 1950–2009. Washington, DC: US BLS.
US Census Bureau. 1999. Statistics of US Businesses: 1999, manufacturing. Washington, DC: USDepartment of Commerce; available at http://www.census.gov/epcd/susb/1999/us/US31.HTM
US Census Bureau. 2007. International Data Base. Washington, DC: US Department of Commerce;available at http://www.census.gov/
US Census Bureau. 2013. Characteristics of new housing: characteristics of new single family housingcompleted: median and average square feet by location; available at http://www.census.gov/construction/chars/pdf/medavgsqft.pdf
US Department of Agriculture (USDA). 2002. Agricultural Outlook. AGO-293, August. Washington,DC: USDA Economic Research Service.
US Department of Commerce, Bureau of Economic Analysis. 1999. Preliminary Results from 1999 ForeignDirect Investment in the United States: Operations of US affiliates of foreign companies. Washington,DC: BEA.
US Department of Commerce. 2000. Digital Economy 2000. Washington, DC: Economics and StatisticsAdministration.
US Department of Housing and Urban Development. 1982. The President’s National Urban Policy Report1982. Washington, DC: US Government Printing Office.
US Department of Labor. 2001a. International Comparisons of Hourly Compensation Costs forProduction Workers in Manufacturing, 2000. Washington, DC: Bureau of Labor Statistics.
US Department of Labor. 2001b. International Comparisons of Manufacturing Productivity and UnitLabor Cost Trends, 2000. Washington, DC: Bureau of Labor Statistics.
US Department of Labor. 2002. Comparative Civilian Labor Force Statistics, Ten Countries, 1959–2001.Washington, DC: Bureau of Labor Statistics.
USDA. 2010. Food Availability per Capita Data System; available at http://www.ers.usda.gov/data-products/food-availability-%28per-capita%29-data-system.aspx#.Ubdgo5ziLKE
Vance, J. Jr. 1970. The Merchant’s World: The geography of wholesaling. Englewood Cliffs, NJ:Prentice Hall.
Venables, A.J. 2006. Shifts in economic geography and their causes, Federal Reserve Bank of KansasCity Economic Review 31, 61–85.
Verhulst, A. 1999. The Rise of Cities in North-West Europe. Cambridge: Cambridge University Press.Vernon, R. 1966. International investment and international trade in the product cycle, Quarterly Journal
of Economics 80, 190–207.Vogel, D. 2001. The Regulation of GMOs in Europe and the United States: A case-study of contemporary
European regulatory politics, paper prepared for a workshop on trans-Atlantic differences in GMOregulation sponsored by the Council on Foreign Relations.
Vogel, E. 1980. Japan as Number 1: Lessons for America. New York: Harper & Row.Wachtel, H.M. 1987. Currency without a country: the global funny money game, The Nation 245,
December 26, 784–790.Walker, R. 1988. The geographical organization of production-systems, Society and Space 6, 377–408.Wallerstein, I. 1974. The Modern World-System: Capitalist agriculture and the origins of the European
world-economy in the sixteenth century. New York: Academic Press.Wallerstein, I. 1979a. The Capitalist World-Economy. Cambridge: Cambridge University Press.Wallerstein, I. 1979b. Underdevelopment and phase-B, in W. Woldfrank (ed.) The World-System of
Capitalism: Past and present. Beverly Hills, CA: Sage.Wallerstein, I. 1980. The Modern World-System II: Mercantilism and the consolidation of the world-
economy 1600–1750. London: Academic Press.Wallerstein, I. 1984. The Politics of the World-Economy. Cambridge: Cambridge University Press.
BIBLIOGRAPHY448
6063 GEOGRAPHY WORLD ECON_PT_246x189 mm 22/01/2014 15:11 Page 448
Wallerstein, I. 1991. Geopolitics and Geoculture. Essays on the changing world-system. Cambridge:Cambridge University Press.
Warf, B. 1990. US employment in foreign-owned high-technology firms, Professional Geographer 42,421–432.
Warf, B. 1995. Telecommunications and the changing geographies of knowledge transmission in thelate 20th century, Urban Studies 32, 361–378.
Warf, B. 2001. Segueways into cyberspace: multiple geographies of the digital divide, Environment andPlanning B: Planning and Design 28, 3–19.
Warf, B. 2007. Embodied information, actor-networks, and global value-added services, in J. Brysonand P. Daniels (eds.) The Handbook of Service Industries. London: Edward Elgar.
Warman, A. 1980. “We Come to Object”: The peasants of Morelos and the national state. Baltimore,MD: Johns Hopkins University Press.
Warren, B. 1980. Imperialism, Pioneer of Capitalism. London: Verso.Wasylenko, M. 1991. Empirical evidence on interregional business location decisions and the role of
fiscal incentives in economic development, in H.W. Herzog and A.W. Schlottmann (eds.) IndustryLocation and Public Policy. Knoxville, TN: University of Tennessee Press.
Wasylenko, M. 1997. Taxation and economic development: the state of the economic literature, NewEngland Economic Review, March/April, 37–52.
Watts, M. 1994. Life under contract: contract farming, agrarian restructuring and flexible accumulation,in P.D. Little and M.J. Watts (eds.) Living Under Contract: Contract farming and agrariantransformation in sub-Saharan Africa. Madison, WI: University of Wisconsin Press.
Webb, M.C. 1991. International economic structures, government interests, and internationalcoordination of macroeconomic adjustment policies, International Organization 45, 309–342.
Webber, M.J. and Rigby, D.L. 1996. The Golden Age Illusion: Rethinking postwar capitalism. NewYork: Guilford Press.
Wei, Y.D. 2000. Regional Development in China: States, globalization, and inequality. London and NewYork: Routledge.
Wells, L.T. 1972. International trade: the product lifecycle approach, in L.T. Wells (ed.) The ProductLife-Cycle and International Trade. Boston, MA: Harvard University Press.
Wells, P. and Rawlinson, M. 1992. New procurement regimes and the spatial distribution of suppliers:the case of Ford in Europe, Area 24, 380–390.
Wheatley, A. 2009. World Bank cuts China 2009 GDP forecast to 6.5 percent, Reuters, March 18; availableat http://www.reuters.com/article/2009/03/18/us-china-economy-worldbank-idUSTRE52H0PU20090318
White, G. 1987. Cuban planning in the mid-1980s: centralization, decentralization and participation,World Development 15, 153–161.
WHO (World Health Organization). 2012. Children: Reducing mortality, Fact Sheet 178. September;available at http://www.who.int/mediacentre/factsheets/fs178/en/
Wigen, K. 1992. The geographic imagination in early modern Japanese history, Journal of Asian Studies51, 3–29.
Williams, A.M. 1994. The European Community, 2nd edn. Oxford: Blackwell.Williams, C.H. (ed.) 1982. National Separatism. Cardiff: University of Wales Press.Williams, D.E. 1992. Motives for retailer internationalisation: their impact, structure and implications,
Journal of Marketing Management 8, 269–285.Williams, G. 1981. Third World Political Organizations. Montclair, NJ: Allenheld, Osmun.Williams, K., Cutler, T., Williams, J., and Haslam, C. 1987. The end of mass production?, Economy
and Society 16, 405–439.Williams, R. 1983. The Year 2000: A radical look at the future and what we can do to change it. New
York: Pantheon.Williams, R.G. 1986. Export Agriculture and the Crisis in Central America. Chapel Hill, NC: University
of North Carolina Press.Williams, W.A. 1981. Radicals and regionalism, Democracy 1, 87–98.
BIBLIOGRAPHY 449
6063 GEOGRAPHY WORLD ECON_PT_246x189 mm 22/01/2014 15:11 Page 449
Williamson, J.G. 1965. Regional inequality and the process of national development, EconomicDevelopment & Cultural Change 13, 3–45.
Williamson, O.E. 1985. The Economic Institutions of Capitalism. New York: Free Press.Wilson, P. 2011. Maintaining US Leadership in Semiconductors, presentation at AAAS Annual Meeting,
Washington, DC, February 18; available at http://www.aaas.org/spp/rd/presentations/20110218PatrickWilson.pdf
Wise, M. and Gibb, R. 1993. Single Market to Social Europe. London: Longman.Wolf, E.R. 1968. Peasant Wars of the Twentieth Century. New York: Harper & Row.Wolf, E.R. 1982. Europe and the People without History. Berkeley, CA: University of California
Press.Wong, K.Y. 1987. China’s special economic zone experiment: an appraisal, Geografiska Annaler, B 69,
27–40.Woolley, L. 1963. The urbanisation of society, in J. Hawkes and L. Woolley (eds.) History of Mankind.
Vol. 1: Part 2: The beginnings of civilisation. Paris: UNESCO.World Bank. 1979. World Trade and Output of Manufactures. Staff Working Paper, January.World Bank. 1982. World Development Report 1982. New York: Oxford University Press.World Bank. 1983. World Development Report 1983. New York: Oxford University Press.World Bank. 1991. World Development Report 1991. New York: Oxford University Press.World Bank. 1992. World Development Report 1992. New York: Oxford University Press.World Bank. 1995. World Development Report 1995: Workers in an integrating world. Oxford: Oxford
University Press.World Bank. 1996. World Development Report 1996: From plan to market. New York: Oxford
University Press.World Bank. 1998. MIGA: The first ten years. Washington, DC: Multilateral Investment Guarantee
Agency.World Bank. 2000. World Development Report 2000/2001: Attacking poverty. Oxford: Oxford
University Press.World Bank. 2001a. A Study of Alternative Special and Differential Arrangements for Small Economies.
Washington, DC: World Bank.World Bank. 2001b. Global Development Finance 2001. Washington, DC: World Bank.World Bank. 2001c. World Development Indicators 2001. Washington, DC: World Bank.World Bank. 2001d. World Development Report 2001. Washington, DC: World Bank.World Bank. 2002. Globalization, Growth, and Poverty: Building an inclusive world economy. New
York: Oxford University Press.World Bank. 2006. World Development Indicators 2006. Washington, DC: World Bank.World Bank. 2007. World Development Report 2006: Development and the next generation. Oxford:
Oxford University Press.World Bank. 2008. Special Economic Zones: Performance, lessons learned, and implications for zone
development. Washington, DC: World Bank Group.World Bank. 2011. Migration and Remittances Factbook, 2011, 2nd edn. Washington, DC: World Bank.World Bank. 2012. Migration and Remittance Brief, April 23. Washington, DC: World Bank.World Commission on Environment and Development. 1987. Our Common Future. New York: Oxford
University Press.World Resources Institute. 1996. World Resources 1996–97. New York: Oxford University Press.World Resources Institute. 2000. World Resources 2000–2001: People and ecosystems: The fraying web
of life. Oxford: Elsevier Science and World Resources Institute; available at http://www.wri.org/wr2000/
Wortman, S. and Cummings, R.W. 1978. To Feed This World. Baltimore, MD: Johns Hopkins UniversityPress.
WTO (World Trade Organization). 2001. International Trade Statistics 2001. Geneva: WTO.WTO. 2004. Developing Countries in the WTO Services Negotiations. Staff working paper ERSD-
2004–06. Geneva: Economic Research and Statistics Division.
BIBLIOGRAPHY450
6063 GEOGRAPHY WORLD ECON_PT_246x189 mm 22/01/2014 15:11 Page 450
WTO. 2006. World Trade Report 2006: Exploring the links between subsidies, trade and the WTO.Geneva: WTO; available at http://www.wto.org/english/res_e/booksp_e/anrep_e/world_trade_report06_e.pdf
WTO. 2012a. World Trade 2011, Prospects for 2012: Trade growth to slow in 2012 after strong decelera -tion in 2011. Press release, April 12. Geneva: WTO; available at http://www.wto.org/english/news_e/pres12_e/pr658_e.htm
WTO. 2012b. International Trade Statistics 2012. Geneva: WTO.WWF (World Wide Fund for Nature). 2000. Living Planet Report 2000. Gland: WWF.WWF. 2006. Living Planet Report 2006. Gland: WWF.WWF. 2010. Living Planet Report 2010: Biodiversity, biocapacity and development. Gland: WWF.Yang, D. 1994. Reform and the restructuring of central-local relations, in D.S.G. Goodman and G. Segal
(eds.) China Deconstructs: Politics, trade and regionalism. London: Routledge.Yang, F. 2004. Services and metropolitan development in China: the case of Guangzhou, Progress in
Planning 61, 181–209.Yapa, L. 1979. Ecopolitical economy of the Green Revolution, Professional Geographer 31, 371–376.Yapa, L. 1980. The concept of the basic goods theory, in R.L. Singh and R.P.B. Singh (eds.) Rural Habitat
Transformation in World Frontiers. Varanasi: National Geographical Society of India.Yates, R.L. 1959. Forty Years of Foreign Trade. London: Allen & Unwin.Yusuf, F. 2001. The East Asian miracle at the millennium, in J.E. Stiglitz and S. Yusuf (eds.) Rethinking
the East Asian Miracle. Washington, DC and New York: World Bank and Oxford University Press.Ziegler, C. 2007. Favored Flowers: Culture and economy in a global system. Durham, NC: Duke University
Press.Zimbalist, A. 1987. Cuban industrial growth, 1965–84, World Development 15, 83–93.Zimbalist, A. and Eckstein, S. 1987. Patterns of Cuban development, World Development 15, 5–22.Zinnov. 2005. Outsourcing: Product innovation from India; available at RealInnovation.comZysman, J. 1983. Government, Markets and Growth: Financial systems and the politics of industrial
change. Ithaca, NY: Cornell University Press.
BIBLIOGRAPHY 451
6063 GEOGRAPHY WORLD ECON_PT_246x189 mm 22/01/2014 15:11 Page 451

6063 GEOGRAPHY WORLD ECON_PT_246x189 mm 22/01/2014 15:11 Page 452
This page intentionally left blank
Abu Dhabi 338AC (Andean Community) 361, 365accumulation, primitive 97Achebe, C. 226actor-network theory 192Adelman, I. 276ADLI (agriculture-demand-led-industrialization)
276advanced capitalism 141, 145–59, 179–81,
187–90, 194–7, 211, 403Advanced Research Projects Agency (ARPA) 150advertising 9, 316, 319, 336affluence 146, 152–3Africa 5, 160, 199, 224, 254, 255, 335
colonization 219, 220Sub-Saharan 254–8, 274, 308, 326, 335telegraph system 221, 222
African Union (AU) 357, 403AFTA (Arab Free Trade Area) 361, 364agency, human 94agglomeration 136, 166, 187–94, 201, 205,
295–9, 403economies 161, 172, 204, 207, 386urban 90
Agnew, J.A. 225, 385Agreement on Textiles and Clothing (ATC) 293agribusiness 263–7, 308, 371, 376, 403Agricultural Bank of China (ABC) 339Agricultural Development Bank (ADB) 253–4agricultural regions, world 38–9Agricultural Revolution 96–7agriculture 126–7, 233–5, 263, 276–7, 313–15,
346–8, 370–3arable land, world’s 36
Asia 248, 270–2Bangladesh 246, 258–9, 271, 272beef boom, Central America 268–70, 375capitalization of 245, 262–73cash crops 113, 254, 255, 404China 256, 259–62coffee 248, 250, 253, 267collectivization of 262, 300, 301, 405
commercial 228, 247, 251, 254, 257–9, 269,273
commercialization of 270–3commodities 17concerns 245–73cultivable land 37development 95–6, 260–2, 276drug crops 268employment 38–9, 247–8, 272–3, 325export-oriented 40, 111, 235, 253, 256, 266fallow 96, 267, 409food 256, 257food production 96–7, 245–9genetically modified organisms (GMOs) 5,
375–6Green Revolution 245–7, 253, 257–60, 270–2,
375, 411hearth areas 96–7, 100, 411imports 250improvements 98, 131intensive 36investment 264labor 254, 270latifundia 246, 413Latin America 36, 246, 247, 250, 251–4, 258,
273Malaysia 249, 258, 270monoculture 113, 214, 267, 414Neolithic period 96, 416organization 246–8, 273patterns 37–40periphery, in 246–51production 5, 30, 40, 101, 104, 119–20, 255,
272profitability 8rice 101, 271scientific 270–3seed 96settled 97share cropping 246, 258–9, 267, 272, 418shifting cultivation 96, 409, 418–19specialization 12
Index
Note: Page numbers in bold type refer to figures. Page numbers in italic type refer to tables. Pagenumbers in blue type refer to definitions in the Glossary
6063 GEOGRAPHY WORLD ECON_PT_246x189 mm 22/01/2014 15:11 Page 453
subsistence economics 6, 18, 267, 419Taiwan 259, 260–2, 271, 283, 304technology in 270–2unsustainable 30women and 246–7, 256, 273world 37–8see also land
agriculture-demand-led-industrialization (ADLI)276
aid 29, 237, 283bilateral 59, 279food 256foreign 236international 58–9multilateral 279organizations 250, 333regional 385state 386
AIDS see HIV/AIDSal Qaeda 389alliances, strategic (among firms) 86, 91, 164–6,
169, 280, 419Amin, A. 396
and Robins, K. 205Amsden, A. 74Andean Common Market (ANCOM) 361Andean Community (AC) 361, 365Andean Pact (1997) 365antitrust legislation/laws 68, 82, 156apartheid 66APEC (Asia Pacific Economic Cooperation) 294,
362Arab Common Market 361Arab Free Trade Area (AFTA) 361, 364Arab Spring 5Argentina 221, 223aristocracy, European 226Aronson, J.D., and Cowhey, P.F. 84ARPA (Advanced Research Projects Agency)
150ASEAN (Association of South East Asian
Nations) 49, 362–4Asia 102, 109, 147, 165, 168, 199, 224, 232,
258–60agriculture 248, 270–2telegraph system 221, 222
Asia Pacific Economic Cooperation (APEC) 294,362
Asian financial crisis (1997) 239–41, 280, 288,365
Asian Tigers 67, 202, 403, 404assets 53
corporate 53industrial, European 125
Association of South East Asian Nations(ASEAN) 49, 362–4
ATC (Agreement on Textiles and Clothing) 293
Atlantic system of trade (1650–1850) 218, 219
AU (African Union) 357, 403austerity measures, national 133Australia 342, 359autarky 50, 301, 304, 403
communist 310economic 106
authoritarianism 364automobile industry
foreign in US 184, 184labor process 290, 290
autonomyAsia 109farms, of 263financial institutions, of 71Japanese economy 130lack of, Asian towns 102markets, of 71states, of 138
baby-boomers 153back-office functions 90, 173, 186, 403backwash effects 136, 210, 363, 377, 403Bairoch, P. 215Baldwin, R.E., and Meier, G.M. 20–1Bangladesh
agriculture 246, 258–9, 271, 272clothing industry 154, 167, 292footwear industry 234
banking 120, 137commercial 316crisis 369investment 316offshore 331, 339–40, 343–4, 343, 349transnational 339, 349
bankruptcy 120, 395Barbie 16Barnet, R., and Cavanagh, J. 54, 153barriers 135
investment 361–2non-tariff 359–60, 416removal of 370tariff 363trade 159, 170, 241, 293, 353, 360–1, 364
barter 97terms of trade 230–1, 232, 235, 240
Basel Ban Amendment (e-waste) 33Basques 124–5, 380, 387, 388, 389, 395batch production 169, 403
INDEX454
6063 GEOGRAPHY WORLD ECON_PT_246x189 mm 22/01/2014 15:11 Page 454
Bayoumi, T., and Lipworth, G. 294beef boom 268–80, 375Better Life Index (OECD) 26biodiversity 377biofuels 264biotechnology 196, 199, 375, 386Black Death (bubonic plague) 102Blinder, A.S. 14Bluestone, B., and Harrison, B. 146, 158Boeing 787 Dreamliner 165Bogor Declaration (APEC, 1994) 362boosterism 126, 188, 211Borchert, J. 126, 190borderless world 83Boserup, E. 96, 97Bowler, I. 370BPO see business process outsourcingbrain drain 42–5, 107, 277branch-plant industrialization 183, 201, 391,
403–4Brazil 45, 266, 284, 286, 335, 359Bretton Woods Agreement (1944) 54, 57, 70, 80,
130, 158, 354, 404BRICs 108, 308, 30, 311, 404 see also Brazil;
Russia; India; ChinaBritain see United Kingdombrokerage system, colonial 226Brown, M.B. 250Brundtland Report (Our Common Future, 1987)
32Bryson, J.R., et al 318budgets 302, 372
deficits 70, 180, 283Bundesbank, Germany (central bank) 78bureaucracy 77, 136, 299–302, 306, 363, 379,
388imperial 101national 81, 139–40state 101
Bush, G.W. 384, 389, 397business
climate 78, 382organization 154
business process outsourcing (BPO) 173, 186–7,187, 320–2, 344–9, 403–4
business services 90, 171, 172, 173, 186, 190–1,192–3, 197, 316, 319, 355, 404
international finance and 53–5internationalization 344–7, 349
CACM (Central American Common Market) 361call centers 173,183, 192, 324, 325, 346Canada 278, 335, 359CAP see Common Agricultural Policy (EU)
capital 57–8, 119–21, 136–8, 248, 251–60, 308,322
accumulation of 108–9, 117, 124, 367circulation of 225commercial 137costs 384crisis 169, 278development 101drain 363exports 214, 285financial 80fixed 201, 384flight 57, 238, 240, 404flows 57, 65, 161, 210, 242, 339foreign 232, 254, 264, 279, 303–4, 320global 190, 242, 340, 384, 394globalization of 237–9goods 146, 233, 293, 367, 404growth 169, 216–18, 278human 7, 100imperial 131imports 122, 131investment 106, 134, 159, 182, 218, 264, 285local 232movement 20, 70, 357, 361natural, Earth’s 37physical 7pool of 171productive 279redeployment of 159risk 188“rooting capital” 382–3shortage of 364start-up 56state 126venture 86, 193
capitalism 65–6, 130, 138, 246, 254, 300–3,308–10, 353–4
advanced 141, 145–59, 179–81, 187–90,194–7, 211, 403
agricultural 252, 260–2British 138competitive 7–9, 138, 242, 399–400, 406contemporary 89corporate 397democratic 394development of 101, 262disorganized 9–10, 181, 408European 214evolution of 8–12expansion of 214–16exports within 267foreign 242free market 9, 353
INDEX 455
6063 GEOGRAPHY WORLD ECON_PT_246x189 mm 22/01/2014 15:11 Page 455
French 138global 67, 130, 145, 177, 180, 216, 250–1industrial 93, 109, 119–21, 126–7, 130–2,
143–5, 212liberal 213, 242–4local 242market 229, 242merchant 7, 93, 99–113, 116–17, 143, 414monopolistic 131organized 7–9, 76, 137–44, 279, 399–400,
417pre-capitalist institutions 229rural 264transformation of 138, 399world-systems 159, 300
capitalization 253, 270–3, 404agriculture, of 245, 262–73
captive outsourcing 321, 404, 417carbon fuels 5CARICOM (Caribbean Community and
Common Market) 361carrying capacity 37, 404cartels 138, 181, 234, 243,cash crops 113, 254, 255, 404casino economy 54Cassa del Mezzogiorno (Southern Development
Agency) 381Castells, M. 191–3, 199, 303
and Hall, P. 179Castro, A.N. de 111Cavanagh, J., and Barnet, R. 54, 153Celtic Tiger (Ireland) 202, 404–5CEMAC (Economic and Monetary Community
of Central Africa) 361Central American beef boom 268–80Central American Common Market (CACM)
361Central Europe see Europe, east-centralcentral places 190, 302, 405central place systems 405centralization
agriculture, of 263corporate 155, 379–80, 405EU 400
centres of innovation 193–4Cereal Partners Worldwide (CPW) 164change 113
climate 35, 234, 265, 400economic 3–19, 8, 96, 101–2, 113, 126–30,
209, 351–5geopolitical 115, 143market 234–5political 6, 308regional 180–2, 370
spatial 1, 6–12, 6, 18, 116–17, 142technological 6, 29, 118, 143, 147urban 180–2
Chaunu, P. 102Chavez, H. 243child labor 167China, People’s Republic of 45, 243, 249, 262,
335, 339, 359agriculture 256, 259–62Barbie 16business process outsourcing (BPO) 320, 322clothing industry 167, 292, 293communism 308, 310early innovatory economic change failure
101–2economic and demographic growth 304, 305GDP (industry and services) 306, 307hearth area 96land reform 262poverty 260, 307rice 101, 271special economic zones (SEZs) 4, 46, 304–6Tiananmen Square (1989) 308women, and work 16
China Construction Bank (CCB) 339Chinese Central Bank 310Chinese Communist Party (CCP) 308Chisholm, M. 142Cipolla, C. 102, 112class (social) 33
middle 33, 137, 300struggle 12, 304working 253
classical world, urbanization 98–9, 99client states 141, 405climate 97, 142
change 35, 234, 265, 400Cline, W.R. 281clothing industry 154, 167–8, 168, 290, 290,
292, 293clustering (spatial)
corporate 89–90, 403exports, of (Italy) 392
clusters (competitiveness, national), France199–200
CMEA see Council for Mutual EconomicAssistance
“codetermination” (in economic democracy) 395
coffee 248, 250, 253, 267Cohen, A. 387Cohen, S.B. 355cohesion 63, 372–3
economic (of the state) 384
INDEX456
6063 GEOGRAPHY WORLD ECON_PT_246x189 mm 22/01/2014 15:11 Page 456
Cold War (1947–91) 58–9, 74–5, 133, 243, 310,388–90, 394
effects 237collaborative ventures see strategic alliancescollectivization of agriculture 262, 300, 301, 405colonialism 126, 141, 177, 226–30, 243, 254,
259competitive 218–19end 230–3, 237Japanese 74, 283market 225new 214post- 228, 241power 227pre-colonial institutions 229pre-capitalist 214and urban settlement patterns 114, 115
colonization 63, 100–1, 109, 141, 215–16, 216,220
Africa 219, 220overseas 108Western 246
COMECON (Council for Mutual EconomicAssistance) 301, 405
COMESA (Common Market for Eastern andSouthern Africa) 361
Comisso, E. 395command economy 242, 300, 405commercial agriculture 228, 247, 251, 254,
257–9, 269, 270–3commodities 62, 68, 80, 217–18, 231, 246, 267
agricultural 17diversification 235economic 216exports 221–2, 252flows 129prices 225, 234, 250, 265primary 233–7, 240, 243–5, 252–3, 336, 366,
417trade in 79, 104
commodity chains 15–17, 15, 167–8, 248,333–4, 348, 405
commodity concentration of exports, index of 52,53
Common Agricultural Policy (CAP) (EU) 367,372
effects 370–2common market 361, 364, 365, 372, 405Common Market for Eastern and Southern
Africa (COMESA) 361communication 50, 227, 243, 303, 316, 347
complex (by workers) 193costs 88improvements 126
innovation 52internal (national) 134international 88national 134networks 218poor 119services 346technology 83, 117, 149, 315, 319, 330–2, 339
communism 125, 299–301, 304–6, 310, 354, 388anti- 354spread 133
Communist Party 300, 394Chinese 308
comparative advantage 81, 112, 115, 119, 129,141, 143, 194, 214–16, 281, 362–3, 405
competition 170capitalist 7–9, 138, 242, 399–400, 406colonial 218–19economic 382international 170market 10competition 382–6structural 181zero-sum 78
competitive advantage 12, 62, 79, 82, 90, 133,154, 192, 204, 216, 294, 302, 308, 323,346, 361, 363, 400, 405
competitive disadvantage 120, 405, 406competitiveness clusters, France 199, 200concentration, corporate 155–6, 406conflict 277
armed 120economic 218ethnic 218, 386–7, 391global 388political 277, 310regional 400
conservatism 180, 276, 302consolidation
merchant capitalism, of 106–7spatial/regional 179, 183, 187–94
consumer demand 153–5, 164, 201, 202, 229,251
consumer durables 406consumer goods 233, 367, 406consumer non-durables 406consumer services 13, 406consumption 3, 64conspicuous 122
demand 153–5, 201, 229, 251domestic 252energy 35–6, 35integration of 244market 81, 89, 145, 158, 354
INDEX 457
6063 GEOGRAPHY WORLD ECON_PT_246x189 mm 22/01/2014 15:11 Page 457
mass 152, 162, 354national 304patterns 152–5per capita 301spread 241
containerization 406Cook, P., and Kirkpatrick, C. 238–9Cooper, F. 229cordon sanitaire 301, 406core see core countriescore countries 116–44, 159–61, 179–212, 240–1,
353–5, 363–6, 375–7“fixed industrial” 213spatial reorganization of 182–7
core-periphery patterns 20–1, 26, 140, 205, 206,210, 211, 215, 237, 35, 398
core-periphery polarization/contrasts 20, 35, 4,139, 143, 205, 210, 240–2, 320–3
corporations see transnational corporations(TNCs)
corporate centralization 155, 379–80, 405corporate concentration 155–6, 406corporate control centres 190–2corporate restructuring 147, 174, 188, 201corruption perceptions index 63, 63Council for Mutual Economic Assistance
(COMECON) 301, 405Cowhey, P.F., and Aronson, J.D. 84CPW (Cereal Partners Worldwide) 164creative destruction 10, 208credit policy 273crisis 139, 145, 355
Asian financial (1997) 239–41, 280, 288, 365banking 369capital 169, 278debt 54, 58, 78–80, 139, 239, 244, 397feudal system 102–4fiscal 78, 383Fordism, of 146–7, 174, 211global financial (2007–8) 56–7, 68–70, 239,
288, 330, 337–8, 369political (Japan) 136pre-2008 global financial 68profit, of 281
crops 247, 254–7, 266, 271–2, 370–2, 375–6drug 268exports of 225, 246, 259, 264, 270imports of 270industrial 217market 267production of 254–5, 273rotation of 102, 257, 267water-intensive 265yields 260
crossover system of trade 224, 225, 230, 243,406
crude oil 77, 171cultivable land 37cultivation
slash-and-burn 96shifting 96, 409, 418–19
cultural economy 204–5, 400, 406cultural integration 228–30cumulative causation model (Myrdal) 196,
207–9, 210, 210, 406currency 68, 159, 367–9
floating 70global 410manipulation of 123customs unions 360, 361, 406
DCs see developed countriesdead zones, marine 30–1debt 4, 29, 43, 70, 142, 239–40, 311
crisis 54, 58, 78–80, 139, 239, 244, 397cycle 270foreign 58global 244government 54, 55growth of 282international 55, 239national 202per capita 2reduction in 202repayment 58, 238, 269short-term 56trap 55–8, 241, 406–7
decentralization 179, 182–3, 201, 211–12,379–80, 385, 394–7
economic 184, 394governmental 389inter-metropolitan 186–8metropolitan 185–8regional 183–5, 188Russian government 388, 389spatial 183–7
decolonization 215, 243, 278decommodification 250defetishization 250–1deforestation 30–6, 269deindustrialization 180–1, 195–7, 215, 298, 304,
311, 407demand 153
consumer 153–5, 164, 201, 202, 229, 251for education 319elasticity of 55, 142, 231, 245, 252, 318, 336,
408patterns 152–5
INDEX458
6063 GEOGRAPHY WORLD ECON_PT_246x189 mm 22/01/2014 15:11 Page 458
democracy 73, 126, 226, 229, 299associative 395, 396capitalist 394economic 18, 351, 394–7electoral 64participatory 396political 308, 380social 242
Demographic Transition (model) 40–1, 41, 42,45, 407
demographics 6, 23, 40–5, 113, 143, 305dependence 12, 20–1, 36, 51–2, 59–60, 63,
90, 133, 142, 146, 235, 241, 310, 337,356–7, 407
dependency see dependencedeprivation index, UK 206, 207deregulation 56, 77, 171–2, 181, 339design-intensive industry 203deskilling 149, 407destabilization, economic 158, 355Deutsche Bank 54, 172, 266developed countries (DCs) 39–46, 51–9,
231–40, 274–82, 308–17, 320–30, 335–40
economic change 8, 8exports with less-developed countries (LDCs)
236, 237development 25, 48, 365, 373, 386
agricultural 95–6, 260–2, 276alternate models of 242–3capital 101commercial 227economic 113–15, 124–6, 208–11, 239–40,
302–4, 380–6, 398–400endogenous 385global 241impasse 242industrial 122, 130–1, 208, 258, 276,
299–300, 365international 365local 381–2metropolitan 136national 230–3, 237, 242, 386patterns of 373political-economic 388regional 194, 363, 381–2rural-agricultural 276strategies 230–3sustainable 24, 32–4, 237, 244, 420theory 356uneven 64, 79, 180, 209–10, 355, 357, 369,
399, 421urban 106
developmental plasticity 271
devolution 380, 390regional 139, 380, 390, 418
diagonal integration 155–6, 407Diamandi, Z., et al 152differential of contemporaneousness 152, 407diffuse industrialization 183, 407digital divide, the 33, 198, 407–8diminishing returns 100, 107, 113, 117, 143,
408disasters, natural 5, 35, 272, 337disease 32, 217
absence 24outbreak 337
disintegrationvertical 86, 163, 164, 201, 421
disintermediation 339dislocation 122–3disorganized capitalism 9–10, 181, 408division of labor
international 56, 412sexual 229, 418
Dobb, M. 102Doha Development Round of the GATT (WTO)
360Donahue, J.D. 396droughts 98, 272drug crops 268Duignan, P., and Gann, L. 227–8
e-finance 340, 342e-waste 33Earth Summit (UN, 1992) 32–4earthquakes 272EC see European Union (EU)ECB (European Central Bank, EU) 76, 202, 369ecological footprint 26, 29, 37–9, 39, 408economic
change 3–19, 8, 96, 101–2, 113, 126–30, 209,351–5
cohesion (of the state) 384conflict 218competition 382decline 196, 285, 303, 380destabilization 158, 355growth 74–6, 129–33, 137–9, 208–10, 235–7,
240–2, 394–5organization 6–12, 6, 100, 118–20, 129–30,
139–43, 169, 299policy 225, 361, 380specialization 137
Economic Community of West African States(ECOWAS) 361
Economic and Monetary Community of CentralAfrica (CEMAC) 361
INDEX 459
6063 GEOGRAPHY WORLD ECON_PT_246x189 mm 22/01/2014 15:11 Page 459
economiesexternal 86, 89, 197, 209market 78, 91, 207, 303national 65, 91–3, 202, 215, 322, 358, 386scale, of 117, 143, 203, 211, 262–3, 357, 408scope, of 85, 147–52, 169, 203, 400, 408
Economist 36, 173, 317economy 1
aestheticization of the 204commodities, and 216continental 127cultural 204–5, 400, 406decentralized 184, 394democratic 18, 351, 394–7development, and 113–15, 124–6, 208–11,
239–40, 302–4, 380–6, 398–400difference, global 399European 125evolution (of industrial) 138global 17, 145–75, 218–25increasing pace of the 69industrial 47, 116, 138–9inequality within 207–11informal and development level of 326, 327information 171–2integration of the 50, 90, 351–3, 360–6, 373,
379interdependence of the 91, 355international 157liberal 9management of the 308marginal 110political 131, 206power of 91, 110–12, 124, 355, 375prosperity, and 23public 118, 139–41reforms, and 304, 308, 320regional 93, 196, 294, 364, 383reorganization of the 299–300resource-oriented 243rights and the 386shifting fortunes of the 61, 62stable 202transformation in the 306urban 222well-being and the 129, 179–80, 187, 381
ecotourism 338ECOWAS (Economic Community of West
African States) 361ECSC (European Coal and Steel Community)
366, 372education 23–6, 44, 198, 202, 228–9, 321–4, 348
colonial 229demand for 319
free 63higher 193low achievement and 206reforms of 132technical 170
EEA (European Economic Area) 362EEC (European Economic Community) (now EU)
366–7EFTA (European Free Trade Association) 360–2egalitarian liberalism 9, 76–7egalitarian political-economic structure 259–60,
394EIA (Energy Information Association) 29–30,
34–5EIB (European Investment Bank, of the EU) 372elasticity of demand 55, 142, 231, 245, 318, 336,
408electronic finance (e-finance) 340, 342electronic waste (e-waste) 33electronics industry 201, 291, 291, 292, 297,
297, 298Emilia-Romagna see Third Italyempires 95, 97
trading 141, 353employee stock option plans (ESOPs) 395employment 206, 286, 297, 313–14, 314, 340,
348, 384agriculture 38–9, 247–8, 272–3, 325creation 285expansion 393formal-sector 326industrial 295insourcing and outsourcing of (US) 14, 14manufacturing 279UK 194, 195USA 194–5, 196
encapsulation (of goods and materials) 317, 348,408–9
End Poverty campaign (UN, by 2015) 24energy 35–7
consumption 35–6, 35nonrenewable 35
Energy Information Administration (US, EIA)29–30, 34–5
England see United Kingdom (UK)enterprise zones (EZs) 381, 409entrepôts 109, 112, 190, 228, 409environment 29–32
activism and 276degradation of 5, 32, 269, 303, 338pollution 30–2, 260, 307, 338, 400protection of 147, 338
environmentalism 338EPZs see export processing zones
INDEX460
6063 GEOGRAPHY WORLD ECON_PT_246x189 mm 22/01/2014 15:11 Page 460
equity markets 68equity, social 367ERDF (European Regional Development Fund,
of the EU) 373ESF (European Social Fund, of the EU) 373ESOPs (employee stock option plans) 395ethnic conflict 218, 386–7, 391ethnic nationalism 387, 391EU see European Unioneuro-zone countries, government debt, and 54,
55eurodollars 17, 54, 171, 238, 239, 409Europe
in 1875 121core and periphery 124east-central 99, 113, 121, 122growth rates 123political control (1500–1950) 213–14, 214second-wave industrialization 119–20third-wave industrialization 120–1
European Central Bank (ECB, of the EU) 76,202, 369
European Coal and Steel Community (ECSC)366, 372
European Economic Area (EEA) 362European Economic Community (EEC, now EU)
366–7European Free Trade Association (EFTA) 360–2European Investment Bank (EIB, of the EU)
372European Regional Development Fund (ERDF,
of the EU) 373European Social Fund (ESF, of the EU) 373European Union (EU) 78–9, 160–1, 232–3, 306,
353, 360–74economy 125enlargement 367, 368euro (single European currency) 54, 55external effects 373–7industrialization 62members 42, 363–4, 367, 368–70polarization 370regional inequality 205–6, 206regional policy 373, 374Single European Act (SEA) 372Single European Market (1992) 367–9Structural Adjustment Program 70, 419trade 254US foreign direct investment (FDI) 53
exchange 398economic and technological, circuits of 398foreign 49, 52, 253, 283, 337–40, 349market 65, 106rates 54, 238–9
stock 54unequal 142, 250, 421
expansion 106–7, 130, 141, 225dynamic 110global 214industrial 120overseas 109
exploitationeconomic 66
export processing zones (EPZs) 48, 49, 234,288–91, 294, 295, 311, 331, 332, 348, 399,409
exporters, intra- vs inter-regional connectedness52
exports 48, 51, 52–3, 160–1, 243–5, 253, 272agricultural 40, 111, 235, 253, 256, 266capital 214, 285capitalist 267commodities 221–2, 252commodity concentration index 52, 53crops 225, 246, 259, 264, 270developed and less-developed countries 236,
237earnings 248expansion 74, 247foreign 391growth 282manufactures 241, 284–5, 306market 235, 254, 281, 310–11, 391services 322–5, 329–30, 330shares 392world 224, 329
external control 183–7, 211, 363, 409external economies 86, 89, 197, 209externalization 164, 181, 188, 201EZs see enterprise zones
factors of production 12, 91, 149, 155, 216, 405, 408, 409, 414, 415, 420
fair trade 248–51Fair Trade (Brown) 250Fair Trade Labeling Organizations International
(FLO) 250fallow agriculture 96, 267, 409famines 5, 271, 371FAO (UN Food and Agriculture Organization)
36–7, 246, 256farming see agriculturefascism 386favouritism, political 278, 387FDA (US Food and Drug Administration) 376FDI see foreign direct investmentfederalism 390, 395–6Fertile Crescent 97
INDEX 461
6063 GEOGRAPHY WORLD ECON_PT_246x189 mm 22/01/2014 15:11 Page 461
feudal system crisis 102–4feudalism 6, 18, 99–104, 130–2, 246, 260, 409
spread 95fiber-optic cable network, submarine 323, 323filesharing, peer-to-peer (P2P) 157finance 129
electronic (e-finance) 340, 342infrastructure 340international 53–5patterns of 45–59system of 68–70
finance, insurance, and real estate (FIRE) 316,410
financial centers 71, 90, 172, 340, 349, 367offshore 17, 416
financial crisis, global 56–7, 57, 68–70, 239, 288,330, 337–8, 369
First World 230fiscal crisis 78, 383fiscal policy 135, 355–7, 380fiscal reform 382Fisher-Clark thesis 313–17, 320Five-Year Plans (Soviet) 300–2Flanagan, W., and Gugler, J. 222flexibility 147
corporate 166–70flexible accumulation 410, 415flexible production 79, 162–6, 181, 182,
410market 77, 173
FLO (Fair Trade Labeling OrganizationsInternational) 250
floods 98, 217, 270–2food 257
aid 256deficit 257production 96–7, 245–9
Food and Agriculture Organization (UN FAO)36–7, 246, 256
Food and Drug Administration (US FDA) 376footwear industry 234Ford, H. 5, 9, 126Fordism 9–12, 80, 125–30, 143–5, 169–70,
201–3, 354–6crisis 146–7, 174, 211disintegration 399
foreign direct investment (FDI) 53, 67–9, 225,243, 264–5, 279–82, 292–4, 339–40, 348
British (1860–1959) 219, 220inflows 69foreign policy 75, 361, 367
forestry 30, 36fossil fuels 34fracking 5, 29, 410
fragmentation 182of forests 30political 379
France 220, 220, 286, 341–2capitalism 138competitiveness clusters 199, 200
franchises 248, 268, 410Franco, F. 380free markets 9, 77, 298, 353, 367, 397free trade 52, 63, 70, 91, 139, 250, 256
associations 361, 364, 410internal 362zones 48–9, 77
freshwater supplies 36, 38Fridell, G. 250Friedmann, J. 190–1
and Weaver, C. 129fuels 5, 34, 36
G7 countries 308, 309G8 countries 58, 70G77 countries 365–6, 373Galbraith, J.K. 146Gann, L., and Duignan, P. 227–8Gardiner, K. 202gateway ports 110, 126GATS (General Agreement on Trade in Services)
324GATT see General Agreement on Tariffs and
TradeGCC (Gulf Cooperation Council) 361GDP see gross domestic productGeertz, C. 387General Agreement on Tariffs and Trade (GATT)
71, 233, 268, 282, 358–62, 368, 372General Agreement on Trade in Services (GATS)
324genetically modified organisms (GMOs) 5,
375–6Genuine Progress Indicator (GPI) 26geoengineering 34, 410geographical path dependence 90, 398–9, 410geographical tiers 63–4, 91geopolitics 61, 74, 283, 351–5, 377
change 115, 143rivalry 75
George, S. 366–7Gereffi, G. 333Germany 78, 220, 286, 335, 341–2Ghana 256Glasmeier, A. 172global assembly systems 15, 162, 164, 172, 420global cities, world cities 90, 136, 154, 190–2,
191, 349, 420, 421
INDEX462
6063 GEOGRAPHY WORLD ECON_PT_246x189 mm 22/01/2014 15:11 Page 462
global commodity chains see commodity chains
global currencies 239, 410global financial crisis (2007–8) 56–7, 68–70, 239,
288, 330, 337–8, 369global foreign exchange market 17, 17global highway, transportation and
communications costs 88global interdependence 50, 141–2global office 171–2“global” reach of transnational corporations
(TNCs) 49global shift 67, 73–4global shopping mall 153global sourcing 233–4, 263, 275, 281, 410global warming 32, 34, 410globalization 13–18, 53–4, 77–81, 90–3, 192–4,
396–400capitalist 190, 237–9, 242, 340, 384, 394economic 17, 145–75, 218–25export-oriented 275food production and 263growth 388, 391patterns 20–60, 159–74process 61of supply 354violent response to 389
GMOs (genetically modified organisms) 5, 375–6
GNI see gross national incomeGNP (gross national product) 411Golden Age, 16th century 108goods 11, 62, 161
capital 146, 233, 293, 367, 404consumer 233, 367, 406demand for 127–8exports 275flow 160, 242, 379intermediate 233, 412, 417manufactures 233, 317movement 357, 361positional 152, 417producer 233, 417
governmentdebt 54, 55intervention 381–4Russian decentralization 388, 389
Graham, S., and Martin, S. 398grassroots movement 351, 391–6Great Britain see United KingdomGreat Depression (1929–34) 9, 123, 129, 225,
230, 253Great Pacific Garbage Patch 32Greater East Asian Co-Prosperity Sphere 133
Greek Empire 98Green Revolution 245–7, 253, 257–60, 270–2,
375, 411Grindle, M.S. 267gross domestic product (GDP) 21–3, 50–2,
50, 134–5, 157–9, 272–4, 284–8, 303–10
per capita 22, 23, 118, 202, 205, 305, 313,314
gross national income (GNI) 21, 25, 49, 59, 130,326, 411
gross national product (GNP) 411gross value added (GVA) 411growth 12, 64, 123, 189
economic 74–6, 129–33, 137–9, 208–10,235–7, 240–2, 394–5
Europe, rates of 123globalization and 388, 391income 241, 318industrial 122, 129, 298, 301manufacturing 304market 67, 125, 332–3metropolitan 172national 76output, of 118outsourcing, of 348poles 210–11, 307, 411population, of 102, 132, 159, 259, 265, 272,
283–5postwar 133–7regional 129, 298services 318–19trade 50–1, 50, 79, 233urban 106
Guatemala 267–8Gugler, J., and Flanagan, W. 222Gulf Cooperation Council (GCC) 361Gutenberg, J. 107GVA (gross value added) 411
Hall, P. 199and Castells, M. 179
Hall, T.D. 64Hamilton, F.E.I. 127Hanseatic League 104–5, 105Hansen, G., and Prescott, E. 116Happy Planet Index (HPI) 26–7, 27Harrison, B. 86
and Bluestone, B. 146, 158Harvey, D.W. 354HDI (UN Human Development Index) 25–8, 27,
28, 284health 23–6, 139, 229, 241, 313, 323, 348
economic 140
INDEX 463
6063 GEOGRAPHY WORLD ECON_PT_246x189 mm 22/01/2014 15:11 Page 463
poor 206public 140
hearth areas, agricultural 96–7, 100, 411hegemony 64–5, 91, 411
American 354British 214political 235
Henry, N., and Pinch, S. 189Henshel, H.B. 158Hicks, J.R. 210high-tech manufacturing 80, 82, 86, 89, 136,
152, 169, 172, 197, 203, 211, 380high technology complexes 5, 89, 169, 201,
297hinterlands
gateway ports, of 110, 126metropolitan 90, 222regional 119, 161, 306
Hirschman, A. 210Hirst, P. 395HIV/AIDS 5, 24, 41, 160Hodge, J.S., and Martin, R.L. 385Holland, S. 370“hollowing-out” of national government 77,
181Hollywood 204–5homeland, European 110, 115homesourcing 183homogenization 379, 399
spatial 174Honduras 247, 269, 290Hong Kong 74, 202, 240, 283, 291, 306
Barbie 16clothing industry 292–3East Asian G4 281electronics industry 292foreign direct investment (FDI) 292–4industrial complexes 297manufacturing 304newly industrializing economy (NIE) 288,
232, 236, 279–80, 288services 326, 348tourism 337world city 90, 191
Hopkins, A.G. 226horizontal integration 155–6, 163, 411Howells, J. 317HPI (Happy Planet Index) 26–7human agency 94human capital 7, 100Human Development Index (UN HDI) 25–8,
27, 28, 284Hundred Years War (1337–1453) 102hunger, food deficit 257
hunter-gatherers 95–7hydraulic fracturing see frackinghydroelectricity 34Hymer, S. 86–7
Iceland, and global financial crisis 56, 57ILO (International Labour Organization) 41–2,
326IMF see International Monetary Fundimmigration 46
brain drain (flow of highly-skilled workers)42–5, 107, 277
to Central American plantations 217within China 46illegal, US 364increase to EU 5remittances to families 43top destinations 42to US 46, 125see also migration
imperialism 8, 63–4, 112, 141, 365, 411anti-imperialist rhetoric 235Chinese 101European 226Japanese 131local “imperialisms” 219neo- 375power 12, 130Spanish 112
imports 51, 160, 161, 237, 258, 293, 331agricultural 250capital 122, 131crops 270foreign 74, 299manufactured 311market 235penetration and 147, 148, 412quotas 233, 293, 306, 359services 322–5, 329–30, 330substitution and 115, 275–6, 279, 295, 412
income 25, 55, 70, 307distribution 137, 283, 316growth 241, 318inequality 5, 242interregional 208low 206national 240per capita 205, 209, 241, 308, 318–20, 325–6,
348polarization 18security 139tax 78
increasing returns to scale 12, 204, 211, 399,408, 412
INDEX464
6063 GEOGRAPHY WORLD ECON_PT_246x189 mm 22/01/2014 15:11 Page 464
incrementalism (in resource allocation in theUSSR) 302
independence 70, 259, 380national 386political 388
index of commodity concentration of exports 52, 53
India 45, 187, 286, 342, 359industrial capitalism 93, 109, 119–21, 126–7,
130–2, 143–5industrial complexes, new 295–9industrial districts, new 166, 170industrial evolution 294–5industrial growth 122, 129, 298, 301industrial policy 70, 73Industrial Revolution 41, 101, 112–13, 116–18,
127, 138–41, 144, 214–15, 301industrial spaces 201
new 179, 196–7, 203old 194–6, 201
industrialization 17–18, 116–26, 129–32, 141–5,224–5, 241–3, 276, 298–300
American 125–30, 144branch-plant 183, 201, 391, 403–4diffuse 183, 407EU 67export-oriented 282first-wave (Britain) 119–21, 126Japanese 130–7, 144limits to 280–5national 276, 277in periphery 280, 294–5, 311, 379progress 274–312proto- 100, 119, 130rationale for 277–80second-wave (Europe) 119–20Soviet model 245, 299–304spread of 119, 120, 144stimuli 275–80third-wave (Europe) 120–1three tests of 286–8, 287trade-led 333
industry 194decline of 194design-intensive 203development of 122, 130–1, 208, 258, 276,
299–300, 365economy and 47, 116, 138–9evolution of 294–5infant 232, 295, 296, 412investment and 73, 262, 276labor-intensive 212, 218, 234, 273, 290, 295,
333mass-markets and 113
patterns of 45–59production 7, 8, 45, 54, 77, 161, 194, 218,
263, 275, 300, 303, 412, 414, 416promotion of 232relocation of 141technology-intensive 296
inequality 207economic 207–11inter-regional 208regional 205–11, 307spatial 383–4
infant industries 232, 295, 296, 412inflation 56–7, 146, 171, 208, 235, 300, 322,
412informal economy 326–7information 161
economy 150, 171–2, 179, 205, 211, 412information technology (IT) 319, 330, 339,
344Information and Technology Agreement (WTO,
1996) 362Information Technology Association of America
(ITAA) 322infrastructure 141, 292, 323–4, 383
investment in 139, 250, 322well-developed 203
initial advantage 11, 127, 139, 209, 210, 216,281, 302, 346, 405, 412
innovation 50, 85, 100, 106, 119–21, 197, 386centers of 193–4communications and 52introduction of 147Japanese 133policy 170political crisis 136production and 128technological 29, 96, 107, 125–6, 138, 185,
253waves 295
instability 239–40, 283political 292
institutional integration 369institutionalization of savings 339integration 363
business and 126consumption of 244cultural 228–30diagonal 155, 156, 407economic 50, 90, 351–3, 360–6, 373, 379horizontal 155–6, 163, 411institutional 369international 353–78logic and 356–7political 95, 126, 351
INDEX 465
6063 GEOGRAPHY WORLD ECON_PT_246x189 mm 22/01/2014 15:11 Page 465
production, of 244regional 360, 364–5spatial 221supranational 353–78, 358territorial 129vertical 80, 154–6, 163, 195, 393, 421
intellectual property (IP) 320protection 324
interdependence 70, 125, 230, 351, 356dynamics of 213–44economic 91, 355global 50, 141–2government and 137international 47political 355systematic 136
intermediate goods 233, 412, 417intermediation 71inter-metropolitan decentralization 182–3intermodal transportation 150, 412internal economies of scale 117, 187, 412Internal Revenue Service (US IRS) 55international and supranational organizations 81,
353–78, 396international corporate alliances (ICAs) 84international division of labor 56, 412International Labour Organization (ILO) 41–2,
326International Monetary Fund (IMF) 57–8, 68–70,
73, 202, 258, 282, 357structural adjustment programs 70, 419
International Telecommunications Union (ITU)198
international terrorism see terrorisminternationalization 50–4, 74, 145, 172, 237,
243–4, 330business services, of 344–7, 249finance, of 339–44retailing, of 332–4services, of 332–47
Internet users 149, 150intervention, government, by 381–4investment 80–2, 158, 202, 218–19, 306–8, 348,
360agriculture and 264banking and 316barriers to 361–2British foreign 219, 220capital 106, 134, 159, 182, 218, 264, 285direct 225, 262, 294–7, 375flows 294, 379–80, 383foreign direct (FDI) 67–9, 218–20, 220, 243,
252, 264–5, 275, 279–82, 292–4, 298, 324,331–3, 339–40, 348
indirect 262industrial 73, 262, 276infrastructure 139, 250, 322international 54, 202, 340, 354inward 382, 383national 76overseas 108, 330portfolio 225, 264private 239, 384productive 277, 373professional 171, 339regulation of 71restricted 136spatial distribution of 143strategic 115technological 146transnational 292–4, 330–1
irrigation 98, 259, 265IRS (US Internal Revenue Service) 55Islam 242, 244, 338, 389isolationism (US) 50isotropic plain 401, 413Italy 111, 341, 342
export shares 391, 392ITU (International Telecommunications Union)
198
Jacobs, J. 97, 106, 115Japan 63, 132–3, 286, 335, 342, 359
colonialism 74, 283electronics industry 297, 297industrialization and 130–7, 144innovation and 133METI (Ministry of Economy, Trade and
Industry) 75, 84, 135MITI (Ministry of International Trade and
Industry) 75, 84, 135modernization and 131Pacific Corridor, megapolitan Japan 135–6see also Tokyo
Japan Development Bank (DBJ) 135Jessop, B. 181JIT production (just-in-time production) 164,
281, 333, 413Joekes, S.P. 285Johnston, R. 20, 94, 98, 104, 113, 187, 384Journal of Economic Geography 189just-in-time (JIT) production 164, 281, 333, 413justice (during colonial period) 229
Karmarker, U. 322Katouzian, H. 242Kedourie, E. 387keiretsu 84, 135, 413
INDEX466
6063 GEOGRAPHY WORLD ECON_PT_246x189 mm 22/01/2014 15:11 Page 466
Kenya 256Keynes, J.M. 9, 130Keynesianism 9, 77, 130, 181, 413Khrushchev, N. 301kin-ordered system 97, 413kiosk economy (in Russia) 303Kirkpatrick, C., and Cook, P. 238–9knowledge economy 10, 413Kondratiev cycles 413Korea, Republic of see South KoreaKorean War (1950–3) 133Kornhauser, D. 133Kraft Foods 68, 156, 376Krebs, G. 208Krugman, P. 211Kuznets cycles 413
labor 10–12, 62, 180, 217, 245, 251–60, 300agricultural 254, 270automobile industry 290, 290cheap 158, 167, 186, 210, 281child 167costs 146–7, 159, 183, 188, 201, 280, 292cultural division of 387demands 109, 270division of 12–18, 55–6, 135, 180–2, 201–5,
229, 348, 362exploitation of 21field 109flexible 164flows 210force 85, 125, 170, 245–6, 263, 267, 308free (during colonial period) 228global 216intensity (in mass production) 83international 55–6involuntary 33, 413local 241manual 109markets 143, 161, 181, 203, 229–30, 298,
319migrant 167–8, 259militant 149movements 357organized 388pools 86, 166, 209power 99, 142, 216productivity 245relations 85rigidity 203skilled 8–10, 111, 135, 159, 174, 179, 183slave 65, 109surplus 183unions 9, 77, 117, 144–6, 170
unskilled 13, 159, 183, 281, 285, 293wage 117, 228–9, 243, 246–8, 256, 267, 421
labor-intensive industry 212, 218, 234, 273, 290,295, 333
Labour Party (UK) 394LAIA (Latin American Integration Association)
362laissez-faire policy 8, 139, 400land 7, 245, 246, 247, 251–60, 267
arable 35–7cheap 210clearing 30costs 188, 306cultivable 37grabs 264–5marginal 248privatization of 262redistribution of 260, 262reforms 74, 245, 259–62, 273, 282, 283tenure 38, 413
landholding 251–3, 258–60Langley, L.D. 230Lash, S., and Urry, J. 138, 181latifundia 246, 413Latin America 214, 215, 227–8, 230, 283
agribusiness 264–6agriculture 36, 246, 247, 250, 251–4, 258,
273arable land 36banks 339capital outflow 238–9drug crops 268export processing zones (EPZs) 291food production 272foreign direct investment (FDI) 225Green Revolution 411growth 41, 241Happy Planet Index 26Human Development Index (HDI) 25industrialization 276instability 29Internet users 199land reform 260, 262–3, 273latifundia 413manufacturing 279, 279, 295maquiladoras 4, 290, 414markets 158, 375migration in 246, 253, 267–8new agricultural country 262–3newly industrializing economy (NIE) 411,
288retailers 333services 326, 348trade 49, 142, 224
INDEX 467
6063 GEOGRAPHY WORLD ECON_PT_246x189 mm 22/01/2014 15:11 Page 467
Latin American Integration Association (LAIA)362
law 308, 367public 100taxation 395
law of diminishing returns 100, 107, 113, 117,143
LDCs see less developed countriesless developed countries (LDCs) 21–5, 31–6,
39–45, 50–9, 224–5, 231–51, 268–93,320–49
exports with developed countries (DCs) 236,237
Levy, F., and Murnane, R. 192liberalism 77
classical 77economic 9egalitarian 9, 76–7
liberalization 256service and 324of trade 233, 275, 281, 333, 361–2, 369
Light, I. 131Lipworth, G., and Bayoumi, T. 294Little, I. 245livestock 246, 255, 266–7, 370Living Planet Report 2012 (WWF) 37loans 57, 80, 240–2
cheap 295, 382repayments 239
localism 377localization 91, 391, 400localization economies 16, 207, 209, 386, 406,
414locational hierarchies 161–2Lomé Conventions (EU) 373–4London 18, 124, 206, 217, 227, 349, 354
capital of core country 168financial center 71, 90, 340, 367terrorism 390world city 191, 191, 349, 420, 421
Long Depression (1883–96) 215–16Lonsdale, J. 229Los Angeles 90, 168, 186, 196, 421Los Angeles School 170Los Angeles Times 16Lugard, F. (Lord) 226
M&As (mergers and acquisitions) 339Maastricht Treaty (1992) 367–8MacFarquhar, R. 310machinofacture 8, 117–25, 143–4, 414macroeconomics 70, 130, 235, 240–2, 357–8,
385, 388policymaking 75–6
Malassis, L. 246Malaysia 41, 64, 232, 364
electronics industry 201, 291, 291, 292, 297agriculture 249, 258, 270food production 249foreign direct investment (FDI) 333manufacturing 274newly industrializing economy (NIE) 21, 281transnational corporations (TNCs) 291women’s employment 291
Malecki, E. 193–4Mankiw, N.G. 14manor, medieval 102, 103manufacturing 17–18, 183–4, 277–9, 286–8,
286, 295, 298–9, 306–10, 315–21,clothing 168economy and 308employment 279exports 241, 284–5, 306global 47, 278, 299, 311goods 233, 317growth 304high-tech 80, 82, 86, 89, 136, 152, 169, 172,
197, 203, 211, 380imports 311labor-intensive 46output 288, 289outsourcing 173production index 134spread (Europe) 91traditional 313value added (MVA) 45–6, 274, 298world 46, 54
Manufacturing Belt (US) 78, 127–9, 196, 212maquiladoras 4, 290, 299, 414marine dead zones 30, 31“market access” 79–91market power 82, 333marketing 282, 316, 317, 319markets 48, 122, 180, 252, 375
autonomous 71capitalist 229, 242changes and 234–5colonial 225common 361, 364–5, 372competition and 10consumer 81, 89, 145, 158, 354deregulation 172discreet 344domestic 48, 145, 258, 311, 391dominance and 216economic 78, 91, 207, 303equity 68evolving 21
INDEX468
6063 GEOGRAPHY WORLD ECON_PT_246x189 mm 22/01/2014 15:11 Page 468
exchange and 65, 106expanded (in Asia) 132export 235, 254, 281, 310–11, 391external 89failure and 77financial 70flexibility and 77, 173foreign 84–5, 266, 280, 304, 310, 330–3,
346–8free 9, 77, 298, 353, 367, 397global 3, 79, 89–90growth of 67, 125, 332–3homogenization of 153import 235internalized 82international 3, 130, 299knowledge of 323labor 143, 161, 181, 203, 229–30, 298, 319local 203, 256, 363mass 113, 128, 152, 167, 281, 354national 17, 117, 129, 172niche 153oligopolistic structures 324overseas 117protection and 247regional 13, 117regulation and 63, 137, 181, 370saturation of 152, 155stagnation of 241stock 129, 133, 239, 340, 343well-developed 119
Markusen, A. 197, 201Marshall, A. 166Marshall Plan (1948) 58, 125, 130, 158, 354,
414Martin, R.L. 189
and Hodge, J.S. 385Martin, S., and Graham, S. 398Marxism 250–1mass consumption see Fordismmass production see Fordismmass markets 113, 128, 152, 167, 281, 354Massey, D. 12, 384materialism 153Mauritius 288Meat Import Act (US, 1979) 269mechanization 8, 246–7, 253, 263mediation (of world economy by national
governments) 71–4medical tourism 336medieval manor 102, 103megacities 192Meier, G.M., and Baldwin, R.E. 20–1mercantilism see merchant capitalism
merchant capitalism 7, 93, 99–113, 105, 116–17,143, 414
growth 109–11rise 105transoceanic rim settlements 109–10, 110
mergers 156–7, 197and acquisitions (M&As) 339
Metcalf, D. 263METI (Ministry of Economy, Trade and
Industry, Japan) 75, 84, 135metropolitan decentralization 182–3metropolitan growth 172Mexico 4, 13, 42, 58, 159, 236, 239, 253–4,
264, 267, 335export processing zone (EPZ) 291less developed country (LDC) 34maquiladoras 299, 414and NAFTA 361–2, 364
Meyer, D.R. 128MFA (Multifiber Agreement) 233, 293MFN (most favored nation) 360–2, 415middle class 33, 137, 300migrant labor 167–8, 259migration 5, 14, 40–5, 126
external flows within Sub-Saharan Africa (forlabor) 254, 256, 257
in Guatemala 267–8international 277, 390in Latin America 246, 253, 267–8long-distance 256, 267rural-to-urban 45, 246, 253, 277seasonal 268from Yemen 298see also immigration
militarism 100, 115, 143militarization 237military 120, 225, 253
growth 277–8power 365security and 301
Millennium Development Goals (UN) 24minifundia 246minimum wage 291mining 315Ministry of Economy, Trade and Industry
(METI, Japan) 75, 84, 135Ministry of International Trade and Industry
(MITI, Japan) 75, 84, 135minisystems 95, 414MITI (Ministry of International Trade and
Industry, Japan) 75, 84, 135MNCs (multinational corporations) 68, 179mobilization, political 387mode of production 6, 409, 414
INDEX 469
6063 GEOGRAPHY WORLD ECON_PT_246x189 mm 22/01/2014 15:11 Page 469
mode of regulation 413, 414modernism 137modernity 112modernization 132, 275–7, 299, 311, 371, 387
Japanese 131pace of 120
Mondragon 395monetarism 58, 414monetary policy 75, 353–61, 369monoculture 113, 214, 267, 414monopoly 78, 182, 267, 324, 400
capitalist 131state power and 308–9
most favored nation (MFN) 360–2, 415Motherland (colonial) 219, 228Multifiber Agreement (MFA) 233, 293multinational corporations (MNCs) 68, 179multinationality 82multiplier effects 276, 283, 291, 377, 415Murnane, R., and Levy, F. 192Murphy, J.M. 375MVA (manufacturing value added) 45–6, 274,
298Myrdal, G. 207, 210
cumulative causation model 210, 210
NAFTA see North American Free TradeAgreement
Nairn, T. 377nanotechnology 196Napoleonic Wars (1803–15) 120nation-states 353, 356–7, 386, 415
sovereign 367nationalism 79, 136–7, 229–30, 253, 306, 377,
387–9active 253economic 356ethnic 387, 391political 390resurgence of 368
nationalist separatism 386–91, 396, 415nationalization (of the means of production)
301NATO (North Atlantic Treaty Organization) 64,
158natural disasters 5, 35, 272, 337natural resources 26, 35, 125, 302
distribution of 29, 143extraction of 34
neo-Fordism 410, 415neoclassicism 14, 415neocolonialism 131neoliberalism 76–7, 181, 415Neolithic period 96, 416
Nestlé 49, 85, 164, 248, 263Netherlands 112, 342networking, social 322–3, 401networks, production 85–6, 87New Deal (US) 9, 129, 416New Economic Policy (Russia, 1921) 300new industrial complexes 295–9new industrial districts 166, 170New International Division of Labor (NIDL)
86–7, 162, 278, 311, 322, 384–5, 416New International Economic Order (NIEO)
(Group of 77) 365–6, 373New York 78, 90, 194, 203, 354
clothing industry 154, 167–8control center 190–1financial centre 340, 349, 367international terrorism 389–90Three Mile Island 30world city 90, 154, 420, 421
New Zealand 76, 110, 142, 164, 268, 375, 416Newby, H. 263newly industrializing economies (NIEs) 3, 21, 41,
54, 74, 157–8, 213–15, 232, 235–7, 240–3,279–89, 293–5, 310–11, 411, 416
share in LDC exports 288, 289NGOs (nongovernmental organizations) 23, 33,
251, 265NIDL (New International Division of Labor)
86–7, 162, 278, 311, 322, 384–5, 416NIEO (New International Economic Order)
(Group of 77) 365–6, 373NIEs see newly industrializing economiesNigerian Civil War (1967–70) 235Nike 154, 333non-governmental organizations (NGOs) 23, 33,
251, 265non-profit organizations 247non-tariff barriers 359–60, 416non-tradable services 316, 330North America see United States of AmericaNorth American Free Trade Agreement (NAFTA)
49, 79, 290–1, 361–2, 364North Atlantic Treaty Organization (NATO) 64,
158
OAU (formerly African Union) 357, 403Öberg, S., and Sachar, A. 152O’Brien, R. 70ODA (official development assistance) 59OECD see Organization for Economic
Cooperation and DevelopmentOEEC (Organization for European Economic
Cooperation) 130official development assistance (ODA) 59
INDEX470
6063 GEOGRAPHY WORLD ECON_PT_246x189 mm 22/01/2014 15:11 Page 470
offshore banking 331, 339–40, 343–4, 343, 349
offshore financial centers 17, 416offshore outsourcing 187, 292, 293, 416offshoring 320, 321, 416oil 16, 34, 35, 188, 213, 238, 241, 338, 398
crude 77, 171embargo (1973) 355
OPEC 57–9, 153, 238, 243, 282, 416–17prices 80, 145, 146, 153, 171, 235, 239, 241,
277, 303oligarchy 396oligopolistic market structures 324On Hollywood (Scott) 204OPEC see Organization of the Petroleum
Exporting CountriesOpium Wars (1839–42 & 1856–60) 268organization 144
agricultural 246–8, 273business 154economic 6–12, 100, 118–20, 129–30, 139–43,
169, 299spatial 127, 131
Organization of African Unity (OAU), nowAfrican Union (AU) 357, 403
Organization for Economic Cooperation andDevelopment (OECD) 25–6, 45, 146, 202,310–11, 321, 416
Organization for European EconomicCooperation (OEEC) 130
Organization of the Petroleum ExportingCountries (OPEC) 57–9, 153, 238, 243, 282,416–17
oil embargo (1973) 355organizations
aid 250, 333international and supranational 81, 353–78,
396organized capitalism 7–9, 76, 137–44, 279,
399–400, 417Our Common Future, see Brundtland Reportoutsourcing 173, 193, 197, 313–15, 319–25,
344–6, 417anti- 173captive 321, 404, 417external 321growth in 348internal 321manufactures and 173offshore 187, 292, 293, 416services and 319–24, 329, 348
overaccumulation 417Owen, N. 369Oxfam 250, 333
Pacific Corridor, megapolitan Japan 135–6Paris Club 58path dependence see geographical path
dependencepatriarchy 131patronage 278Peace of Westphalia (1648) 66peasantry 104, 131–2, 246–8, 252–5, 260, 270,
299–300Peck, J., and Tickell, A. 77peer-to-peer (P2P) filesharing 157peripheral countries 124–5, 140–3, 157–9,
210–12, 231, 244–8, 322–5, 357, 363–6,375–7
and agriculture 246–51contemporary 251disparity and 235–7industrialization and 280, 294–5, 311, 379transformation of 213–44
periphery see peripheral countriesPerroux, F. 210Perry, M.C. (Admiral) 131Petras, J. 299Philippines 236, 249, 359phonesourcing 183Pinch, S., and Henry, N. 189plantations 65, 246–55, 259, 264, 268, 273pluralism 182polarization 210, 240–1, 283
core-periphery 20, 35, 4, 139, 143, 205, 210,240–2, 320–3
European Union 370income 18regional 377social 398spatial 363, 366, 370–3
policy 273, 365competition 382–6credit 273economic 225, 361, 380fiscal 135, 355–7, 380foreign 75, 361, 367industrial 70, 73market-access 244monetary 75, 353–61, 369regional 140, 180, 351, 363, 366, 372–3, 374,
380–1, 384–6, 396Nsocial (Nordic) 63tariffs 71taxation 256, 355
political climate 102, 140political economy131, 206
political integration see integrationpolitical mobilization 387
INDEX 471
6063 GEOGRAPHY WORLD ECON_PT_246x189 mm 22/01/2014 15:11 Page 471
political stability 234, 400political crisis (Japan) 136politics 50
change and 6, 308conflict and 277, 310democratic 308, 380division and 388favoritism 278, 387fragmentation and 379hegemony and 235independent 388instability and 237interdependent 355lobbying and 282nationalist 390power and 38, 129, 216, 226, 230, 254, 355reforms and 133stability and 234, 400
Pollard, S. 118–22pollution 30–2, 260, 307, 338, 400
environmental 30–2, 260, 307, 338, 400water 260, 400
Popke, J. 250population 29, 140, 274
density, international 40expansion, international 41growth 102, 132, 159, 259, 265, 272,
283–5increase 32, 241, 255–7movements 125patterns 29–45
positional goods 152, 417post-Fordism (neo-Fordism) 410, 415poverty 32, 36, 107, 125, 251, 305–7, 329
alleviation of 329decline in 241, 260mass 395
power 77, 198, 228–9, 271, 390balance of 205, 311colonial 227decentralization of 242devolution of 139economic 91, 110–12, 124, 355, 375hegemonic 64imperial 12, 130labor 99, 142, 216market 82, 333military 365national 181political 38, 129, 216, 226, 230, 254, 355purchasing 58, 111, 142, 146, 240–1state and the 67–8
PPP (purchasing power parity) 205, 418Prebisch, R. 356
preindustrial foundations (of the world economy)95–115
Prescott, E., and Hansen, G. 116price elasticity of demand 55primacy/primate city 222, 295, 417primary commodities 233–7, 240, 243–5, 252–3,
336, 366, 417primary production 13, 83, 122, 231, 277, 417primitive accumulation 97private sector 316privatization 68, 256, 319, 417
land 262large-scale 320
procurement (corporate) 335, 345producer cartels 234producer goods 233, 417producer services 82, 171–2, 203, 205, 206, 211,
294, 308, 316, 319, 332, 367, 404, 410, 417product development 166product life cycle 83production 3, 11, 282
agricultural 5, 30, 40, 101, 104, 119–20, 255,272
batch 169, 403capital-intensive 16, 21chains 195collapse 112costs 281crops and 254–5, 273decentralization of 89development of 85factors of 12, 91, 149, 155, 216, 405, 408,
409, 414, 415, 420flexible 79, 162–6, 181, 182, 410flows 65food and 96–7, 245–9forces 7global 162hierarchy 174industrial 7, 8, 45, 54, 77, 104, 161, 194, 218,
263, 275, 300, 303, 412, 414, 416innovation and 128integration of 244just-in-time (JIT) 164, 281, 333, 413lifecycle and 82–3, 417mass 82–3, 152, 162, 170, 354mode of 6, 409, 414networks 85–6, 87per capita 249, 255primary 13, 83, 122, 231, 277, 417scale and 393services and 171, 329, 417specialization of 231technology and 151, 162
INDEX472
6063 GEOGRAPHY WORLD ECON_PT_246x189 mm 22/01/2014 15:11 Page 472
profit 8, 21, 53, 61, 252, 311, 322, 331agricultural 8crisis and 281cycles 280–1decline 146, 278transfer 43
Progressive Era (US) 144, 417property rights 77propulsive industries 203, 210–11,prosperity 1, 21, 110–12, 125, 212, 317, 355
economic 23national 386pre-war (WWII, Europe) 125relative 381
protectionism 236, 256, 281, 322, 360, 373proto-industrialization 119public economy 118, 139, 140–1public law 100public relations 319public sector 316, 319, 348public-private partnerships 77, 181, 382, 418purchasing power 58, 111, 142, 146, 240–1purchasing power parity (PPP) 205, 418Putin, V. 243, 388
quality of life 25, 26, 34, 199, 241
R&D see research and developmentrailways 121–2, 127, 132, 150, 221, 227Ranger, T. 226rank redistribution 7, 418raw materials 12–15, 158, 183, 214–15, 232,
234, 237Reagan, R. 76, 180, 384, 397Reaganomics 58, 418Reardon, T., et al 335reconstruction
postwar (WWII) 133–7redeployment, international, corporate 161–2reforms 299, 304, 372
economic 304, 308, 320educational 132fiscal 382land 74, 245, 259–62, 273, 283liberal 242political 133social 133trade 279
regime of accumulation 410, 414, 415, 418regional change 180–2, 370regional cumulative causation see cumulative
causationregional decentralization 183–5, 188regional devolution 139, 380, 390, 418
regional dispersal 13regional economic motors see regional motorsregional inequality 205–11
China 307core economies 205–6European Union 205–6, 206
national economic development and 208–9regional linkages 294–5regional motors 79–81, 85–6, 89, 161, 295, 383,
399, 400regional policy 140, 180, 351, 363, 366, 372–3,
374, 380–1, 384–6, 396Nregional specialization 13, 215–18, 243, 247,
302regionalism 18, 380–6, 396, 418
economic 93, 196, 294, 364, 383formal 381
regulation 67, 71government 308, 324market 63, 137, 181, 370mode of 413, 414monetary system and 118state 242–3wages and 118
regulationist theories 414Reich, R. 3religion 112, 242, 368, 388relocation, industrial 141remittance flows 43, 43, 44reorganization 179
corporate 179, 186economic 299–300spatial 179–212
research and development (R&D) 82–4, 169–70,184–5, 188–90, 193–4, 199–201, 347–9
global service providers 346, 347United States 184–5, 185
resource curse 235, 418resource grabbing 5, 418resource-based industry 298resources 163
flows 307natural 26, 29, 34, 35, 125, 143, 302patterns 29–45shale gas 29, 30, 31undiscovered 29, 421
restructuring, corporate 147, 174, 188, 201retailing 88, 332–4returns to scale, increasing 12, 204, 211, 399,
408, 412revenue 235, 383
federal 140Reynolds, R. 95, 109, 268–9Ricardo, D. 216
INDEX 473
6063 GEOGRAPHY WORLD ECON_PT_246x189 mm 22/01/2014 15:11 Page 473
rice 101, 271Rigby, D.L., and Webber, M.J. 279rights 386
economic 386political 386property 77protection of 23–4
Robins, K., and Amin, A. 205Rokkan, S., and Urwin, D. 387Roman Empire 98–9Rondinelli, D.A. 222Ruggiero, R. 360rural consolidation 99–100rural-to-urban migration 45, 246, 253, 277Russia 7, 29, 45, 58, 70, 93, 159, 164, 243, 275,
303–4, 339, 379BRICs 308, 309, 404,government decentralization 388, 389kiosk economy 303New Economic Policy (1921) 300Tsarist 299
Russian Federation 36, 42, 240Russian Revolution (1917) 66
Sachar, A., and Öberg, S. 152SACU (South African Customs Union) 361SADC (South African Development Community)
361San Francisco
high-technology industries 197services 186transnational corporations (TNCs) 264world city 191
Sassen, S. 191savings, institutionalization of 339scale economies 117, 143, 203, 211, 262–3, 357,
408schismogenesis 387Schumpeter, J.A. 10Scott, A. 89, 161, 166, 169, 201–4, 291, 297SEA (Single European Act) of the EU 372Second World 230security 23–4, 319, 324, 340, 390
income 139international 357military 301national 301, 357, 400social 380
Segal, G. 310self-sufficiency 275, 304semi-peripheral countries 21–2, 141–5, 152–3,
322–5, 339, 353, 356–7semi-periphery see semi-peripheral countriessemiconductor industry, labor process 290, 290
Sen, A. 257Sender, J., and Smith, S. 229, 235separatism 79, 351, 380
nationalist 386–91, 396, 415serfdom 299service providers 315
global R & D 346, 347services 11, 161, 186
annual growth 328, 329consumer 13, 406employment and GDP 313, 314encapsulation 317, 318exports 322–5, 329–30, 330financial 315global 313–49growth 318–19imports 322–5, 329–30, 330internationalization 332–47outsourcing 319–24, 329, 348producer 82, 171–2, 203, 205, 206, 211, 294,
308, 316, 319, 332, 367, 404, 410, 417production 171, 329, 417trade performance 329workers in 326, 327see also business services
settlement, urban patterns and colonialism 114,115
sexual divisions of labor 229, 418SEZs (Special Economic Zones) in China 4, 46,
304–6shale gas resources 29, 30, 31share cropping 246, 258–9, 267, 272, 418shifting cultivation shifting 96, 409, 418–19shopping mall, global 153Silicon Valley (California) 90, 172, 189,
197–201, 212, 297, 386Singapore 159,240, 271, 294, 409
Asian Tiger 67, 202, 403banking 340East Asian G4 281electronics industry 292, 297, 298export processing zone (EPZ) 288, 291foreign direct investment (FDI) 53growth rate 47intra-ASEAN trade 365medical tourism 336newly industrializing economy (NIE) 3, 21, 41,
54, 74, 232, 279–80, 283–4, 288services 326, 329, 348technopole 199transnational corporations (TNCs) 49, 292world city 90, 191
Single European Act (SEA) of the EU 372Single European Market (1992) of the EU 367–9
INDEX474
6063 GEOGRAPHY WORLD ECON_PT_246x189 mm 22/01/2014 15:11 Page 474
slash-and-burn cultivation 96slave labor 65, 109slavery 6–7, 18, 214SMBs (small and medium businesses) 152Smith, A. 14, 216, 276Smith, D. 302Smith, S., and Sender, J. 229, 235Smith, T. 226social class see class (social)social equity 367social networking 322–3, 401social policy, Nordic 63socialism 6–7, 18, 21, 261, 299–303, 308, 419
industrial 302Soviet-style 397state 301–4, 388, 394
soil erosion 32–4, 267, 270sourcing, global 233–4, 263, 275, 281, 410South Africa 66, 335South African Customs Union (SACU) 361South America
River Plate region road and railways 221, 223see also Latin America
South Korea 159, 239, 265, 335, 359export processing zones (EPZs) 288export-orientated industrial development
296industries 295land reform 259, 260, 262, 304newly industrializing country (NIE) 74, 283Samsung Group 157
Southern African Development Community(SADC) 361
sovereignty 367, 388, 419national/state 66, 357
Soviet model of industrialization 245, 299–304Soviet Union 299–304
Five-Year Plans 300–2socialism 397spheres of influence 237, 238see also Russia; Russian Federation
space-process relationship within firms (Hymer)419
Spain 286economic power and 111imperialism and 112
spatial change 1, 6–12, 6, 18, 116–17, 142spatial decentralization see decentralizationspatial division of labor 95, 113, 142–3, 419spatial homogenization 174, 379, 399spatial inequality 383–4spatial polarization 363, 366, 370–3spatial reorganization 179–212spatial transaction costs 88, 89, 91, 399
Special Economic Zones (SEZs), China 4, 46,304–6
specialization 166, 170, 221agricultural 12economic 137flexible 166, 263international 23local 174production 231regional 13, 215–18, 243, 247, 302
splintering urbanism 398spread effects (Myrdal) 362, 419stability, political 234, 400stagflation 123, 146, 153, 158, 355, 419stagnation 64, 110, 133, 269, 280, 311
markets and 241prices, of 231
Stalin, J. 300, 301, 303states 66–79, 419
aid and 386autonomous 138bureaucracy and 101capital and 126client 141, 405hierarchy of 67nation 353, 356–7, 367, 386, 415new 230, 231policy and 63power and 67–8quasi- 74regulation and 242–3socialist 301–4, 388, 394sovereignty and 66system of 62–3, 91territorial 78welfare 64, 79, 139, 180–1
statism 301–3steamships 218
routes 221, 221Stein, P. 225stock markets 129, 133, 239, 340, 343Stokes, E. 226strategic alliances (among firms) 86, 91, 164- 6,
169, 280, 419structural adjustment programs (IMF and World
Bank) 70, 419Studwell, J. 240, 259Sub-Saharan Africa 254–8, 274, 308, 326, 335
external flows within (for labor) 254, 256, 257
subcontracting 61,140, 167, 172, 173, 275, 277,280, 410
submarine fiber-optic cable network 323, 323subsistence economics 6, 18, 267, 419
INDEX 475
6063 GEOGRAPHY WORLD ECON_PT_246x189 mm 22/01/2014 15:11 Page 475
suburbanization 186Sunbelt, the 141,186, 188,196, 379supply side 130, 181, 332, 418, 419supranational integration 357–78, 358, 379supranational organizations 81, 353–78, 396supranational political union 31, 365, 370, 420sustainable development 24, 32–4, 237, 344, 420Sutcliffe, R.B. 286Swindell, K. 256
Taiwan 237, 240, 274agriculture 259, 260–2, 271, 283, 304APEC, and 362Asian Tiger 67, 202, 403Barbie 16export-oriented industrial development 276,
279, 283–4export processing zones (EPZs) 288, 291foreign direct investment (FDI) 292newly industrializing economy (NIE) 3, 74,
213, 232, 236, 283–4protectionism 281special economic zones (SEZs) 306transnational corporations (TNCs) 159, 280,
292tariffs 62, 73, 133–5, 139, 360–2, 420
average 358, 359, 359barriers and 363policy and 71
taxation 131–2, 183, 202, 276, 298–300, 331,371, 380–3
codes 4concessions 295discriminatory 324incentives 170income of 77–8laws 395policy 256, 355sales and 332
Taylor, F.W. 9Taylor, P.J. 191–2Taylorism 9, 126–30, 420tea 108, 215, 216, 217–18technology 10–12, 18, 50, 136, 180, 323–4, 354,
365access to 38, 281–2advances in 5agriculture 270–2breakthroughs 150–1, 313changes 6, 29, 118, 143, 147communications and 83, 117, 149, 315, 319,
330–2, 339exchange 398flows 383
high- 203improvements in 98, 131–2industrial 121, 127–8, 132information and 319, 330, 339, 344innovation and 29, 96, 107, 125–6, 138, 185,
253investment 146production 151, 162promise of 375systems 399, 420transport and 80, 83, 149, 180, 391
technology-intensive industry 296technopoles 197–200, 420telecommunications 73, 147, 298, 323–4, 357
technology 180telegraph system, Asia and Africa 221, 222telemarketing 322Tempest, R. 16Terman, F. 197terms of trade 230–1, 232, 235, 240territory 79, 81, 143, 399
colonial 226conquest and 214division of 62expansion and 98–101, 107–9, 113, 126,
301integration of 129policy and 133states and 78
terrorism 75, 337, 389–90textiles, labor processes and 290, 290Thatcher, M. 76, 180, 384–5, 385, 397Third Italy 86, 90, 166, 169–70, 203, 391Third Reich 356Third World 230, 237–8Three Mile Island (New York) 30Thrift, N.J. 145Tiananmen Square (1989) 308Tickell, A., and Peck, J. 77time-space compression 180, 351, 420TNCs see transnational corporationsTokyo 5, 90, 131, 154, 157–8, 161
financial centre 172, 340, 349, 367high-technology industries 169technopole 199terrorism 389Tokaido Megalopolis 135–6world city 90, 136,190–1, 420topography 142, 198
tourism 315, 316–18, 331international 334–8, 349medical 336
tourists, international 337, 337Toxic Threads report (Greenpeace 2012) 155
INDEX476
6063 GEOGRAPHY WORLD ECON_PT_246x189 mm 22/01/2014 15:11 Page 476
trade 51, 59, 63, 73, 75, 80–2, 85, 97, 108, 112,134, 142, 218–19, 231, 232, 240, 277, 359,370
agreements 123Andean Pact 365anti- 235Atlantic system 218, 219barriers 159, 170, 241, 293, 353, 360–1, 364bilateral 360, 373blocs 49–50, 420commercial 228commodities and 79, 104cooperation and 362creation 362, 366, 369, 377crossover system of 224, 225, 230, 243, 406decline 112, 225deficits 16, 161, 171, 224, 239, 310, 355diversion 294, 366, 373–7, 420ethical 250European 254fair 248–51flows 50, 159, 233, 306foreign 20, 51, 111, 306, 365free 48–9, 52, 63, 70, 77, 91, 139, 250, 256,
361, 362, 364, 41global see internationalgrowth 50–1, 50, 79, 233increase 106, 237, 319intensification 224international 9, 29, 49–58, 104, 133, 141, 202,
216, 224, 233, 319–21, 329–30, 348, 365interregional 172–3intra-ASEAN 365intra-regional 52, 127intra-EU 363, 369liberalization and 233, 275, 281, 333, 361–2,
369merchandise growth and GDP 50–1, 50multilateral 225negotiations 82patterns 49–53, 104, 109, 363–4, 373policy 68, 71, 242, 256preference associations 362, 420realignment 224–5reform 279regional 50, 104, 360regulation 71, 353relations 160, 375restraints 227, 360resurgence 100, 104–6retail 316, 347routes 106Soviet 301specialization 233
support 48surplus 16, 160–1terms of 230–1, 232, 235, 240transoceanic 112triangular system of 218–19world 50–1, 62, 79–81, 232, 238, 268–70,
363trade unions 137, 229trading blocs 49–50, 68, 79, 91, 360, 400, 420trading empires 141, 353trading stations 109traditional manufacturing industry 313traditionalism 215, 387transactions 169
costs and 88–9volume of 171
transnational banking 339, 349transnational corporations (TNCs) 155–9,
242–5, 260–4, 267–9, 272–5, 278–82,291–2, 394–6
“global” reach 49roles 233–4state-owned 73
transnational investment patterns 292–4, 330–1transoceanic rim settlements, mercantile era
109–10, 110transport 11–13, 129, 139–41, 218, 221, 303,
316–18costs 88, 211, 233, 400global see internationalimprovements 186infrastructure 283, 307intermodal 150, 412international 88, 150modern 228routes 219–22steamship 218technology 80, 83, 149, 180, 391
Treaty of European Union (Maastricht Treaty1992) 367–8
Turkey 111, 342Turnock, D. 302
UK see United KingdomUNCED (United Nations Conference on
Environment and Development) 32–4UNCTAD see United Nations (UN), Conference
on Trade and Developmentunderdevelopment 21, 23, 65, 192, 215, 357undiscovered resources 29, 421UNDP (United Nations Development
Programme) 25–8, 36, 43unemployment 77, 146, 202, 206, 281, 385,
395
INDEX 477
6063 GEOGRAPHY WORLD ECON_PT_246x189 mm 22/01/2014 15:11 Page 477
unequal exchange 142, 250, 421uneven development 64, 79, 180, 209–10, 355,
357, 369, 399, 421UNFPA (United Nations Population Fund)
247unionization 65, 85, 167–9, 183, 336unions
labor 9, 77, 117, 144–6, 170organization and 285trade 137, 229
United Kingdom (UK) 148, 195, 220, 278, 286,335, 341–2
British foreign investment 219, 220capitalism and 138deindustrialization and 148deprivation index 206, 207economic power 112employment 194, 195first-wave industrialization 119–21,hegemony 214Labour Party 394regional aid 384, 385see also London
United Nations (UN) 40–1, 45, 64, 198, 246,256, 260
Conference on Environment and Development(UNCED) 32–4
Conference on Trade and Development(UNCTAD) 47, 51–3, 159, 321, 346, 365–6,373
Development Programme (UNDP) 25–8, 36,43
Food and Agriculture Organization (UN FAO)36–7, 246, 256
General Assembly 358, 366Human Development Index (HDI) 25–8, 27,
28, 284Millennium Development Goals (MDGs) 24Population Fund (UNFPA) 247Security Council 358
United States of America (USA) 50, 160, 196,248, 278–9, 286, 341–2, 359
automobile industry, foreign 184, 184capitalism and 138, 218Census Bureau 156Defense Department 150employment 194–5, 196Food and Drug Administration (FDA) 376hegemony and 354income, per capita, regional 208, 209industrialization 125–30, 144insourcing and outsourcing 14, 14Internal Revenue Service (IRS) 55Islam 242, 244, 338, 389
Manufacturing Belt (1880s -1960s) 78, 128,129
military 76, 156New Deal 9, 129, 416plant size 393, 393product life cycles 83regional per capita incomes 208, 209Research & Development (R&D) 184–5, 185shale gas resources 29, 30Silicon Valley (California) 90, 172, 189,
197–201, 212, 297, 386spheres of influence 237, 238see also Los Angeles; New York; San Francisco
unproven reserves 29, 421urban settlement patterns, and colonialism 114,
115urbanism, splintering 398urbanization 97–9, 126, 135, 190, 222, 229
classical world 98–9, 99Urry, J., and Lash, S. 138, 181Uruguay Round (GATT) 359–60Urwin, D., and Rokkan, S. 387USSR see Soviet Union
venture capital 86, 193Vernon, R. 82vertical disintegration 86, 163, 164, 201, 421vertical integration 80, 154–6, 163, 195, 393,
421violence 228, 269
rural 253
Wachtel, H.M. 238WAEMU (West African Economic and Monetary
Union) 361wages 140, 167, 291
labor and 117, 228–9, 243, 246–8, 256, 267,421
regulation and 118Wal-Mart 332–6, 348Wallerstein, I. 21, 95, 192war 111, 133, 228, 268, 272, 300, 306
resources 307see also World War I; World War II
warehousing 129Warf, B. 192, 198Warman, A. 267Warren, B. 311waste 33, 37water 11, 29, 32, 35–7, 56, 122, 270, 411
fresh 29, 36, 38, 265pollution 260, 400
water power 118, 119WDI (World Development Indicators) 23
INDEX478
6063 GEOGRAPHY WORLD ECON_PT_246x189 mm 22/01/2014 15:11 Page 478
wealth 18, 38, 104, 198, 271, 398redistribution 367
Weaver, C., and Friedmann, J. 129Webber, M.J., and Rigby, D.L. 279welfare 78, 182, 189, 395–6
corporate 76government (state) 64, 79, 139, 180–1human 32, 400policy 137services 355social 34, 147, 383
welfare state 64, 79, 139, 145, 180–1well-being 26, 40, 139
economic 129, 179–80, 187, 381West African Economic and Monetary Union
(WAEMU) 361Western colonization 246Western Europe, output growth (500–1990)
118Westphalian system 66–7wholesaling 88, 129, 172, 316, 347
merchant 173Williams, C.H. 391Williams, D.E. 332Williams, G. 366Williams, R.G. 269Williams, W.A. 396Williamson, J.G. 208Wolf, E.R. 217–18women
and agriculture 246–7, 256, 273and work 16, 291
workfare state 181working class 253World Bank 39–40, 57–8, 68–70, 236, 283, 326,
357–8structural adjustment programs 70, 419World Development Indicators (WDI) 23
world cities 90, 136, 154, 190–2, 349, 420, 420,421
system 191World Commission on Environment and
Development (Brundtland Report) 32World Development Indicators (WDI) (World
Bank) 23world empires 95, 97world products 153World Research Institute (WRI) 149world system see world-systemWorld Trade Organization (WTO) 64, 71, 251,
292–4, 358–60, 372, 376World War I (1914–18) 12, 132, 299, 301, 356
disruption 122post- 125
World War II (1939–45) 63–4, 145, 204, 230–1,266–7, 353, 358
post- 71, 81, 225recovery 123–5
World Wide Fund for Nature (WWF) 37world-system 22, 95, 108, 422
capitalist 159, 300European-based 100–12
world-systems theory 21–2, 192WRI (World Research Institute) 149WTO see World Trade OrganizationWWF (World Wide Fund for Nature) 39
xenophobia 131, 356, 422
Yavorosky, B. 26, 33, 56, 265Yemen, migration from 298Youndé Convention (EU, 1963) 373
see alsoLomé Conventionszaibatsu133–5, 144Zambia 256zero-sum competition 78
INDEX 479
6063 GEOGRAPHY WORLD ECON_PT_246x189 mm 22/01/2014 15:11 Page 479
Related Documents