The Genomic HyperBrowser: inferential genomics at the sequence level Sandve et al. Sandve et al. Genome Biology 2010, 11:R121 http://genomebiology.com/2010/11/12/R121 (23 December 2010)

Welcome message from author
This document is posted to help you gain knowledge. Please leave a comment to let me know what you think about it! Share it to your friends and learn new things together.
Transcript

The Genomic HyperBrowser: inferential genomicsat the sequence levelSandve et al.
Sandve et al. Genome Biology 2010, 11:R121http://genomebiology.com/2010/11/12/R121 (23 December 2010)

SOFTWARE Open Access
The Genomic HyperBrowser: inferential genomicsat the sequence levelGeir K Sandve1, Sveinung Gundersen2, Halfdan Rydbeck1,3,5, Ingrid K Glad4, Lars Holden3, Marit Holden3,Knut Liestøl1,5, Trevor Clancy2, Egil Ferkingstad3, Morten Johansen6, Vegard Nygaard6, Eivind Tøstesen6,Arnoldo Frigessi3,7, Eivind Hovig1,2,3,6*
Abstract
The immense increase in the generation of genomic scale data poses an unmet analytical challenge, due to a lackof established methodology with the required flexibility and power. We propose a first principled approach tostatistical analysis of sequence-level genomic information. We provide a growing collection of generic biologicalinvestigations that query pairwise relations between tracks, represented as mathematical objects, along thegenome. The Genomic HyperBrowser implements the approach and is available at http://hyperbrowser.uio.no.
RationaleThe combination of high-throughput molecular techni-ques and deep DNA sequencing is now generatingdetailed genome-wide information at an unprecedentedscale. As complete human genomic information at thedetail of the ENCODE project [1] is being made avail-able for the full genome, it is becoming possible toquery relations between many organizational and infor-mational elements embedded in the DNA code. Theseelements can often best be understood as acting in con-cert in a complex genomic setting, and research intofunctional information typically involves integrationalaspects. The knowledge that may be derived from suchanalyses is, however, presently only harvested to a smalldegree. As is typical in the early phase of a new field,research is performed using a multitude of techniquesand assumptions, without adhering to any establishedprincipled approaches. This makes it more difficult tocompare, reproduce and realize the full implications ofthe various findings.The available toolbox for generic genome scale anno-
tation comparison is presently relatively small. Amongthe more prominent tools are those embedded withinthe genome browsers, or associated with them, such asGalaxy [2], BioMart [3], EpiGRAPH [4] and UCSC Can-cer Genomics Browser [5]. BioMart at this point mostly
offers flexible export of user-defined tracks and regions.Galaxy provides a richer, text-centric suite of operations.EpiGraph presents a solid set of statistical routines focusedon analysis of user-defined case-control regions. Therecently introduced UCSC Cancer Genomics Browservisualizes clinical omics data, as well as providing patient-centric statistical analyses.We have developed novel statistical methodology and
a robust software system for comparative analysis ofsequence-level genomic data, enabling integrative sys-tems biology, at the intersection of genomics, computa-tional science and statistics. We focus on inferentialinvestigations, where two genomic annotations, ortracks, are compared in order to find significant devia-tion from null-model behavior. Tracks may be definedby the researcher or extracted from the sizable libraryprovided with the system. The system is open-ended,facilitating extensions by the user community.
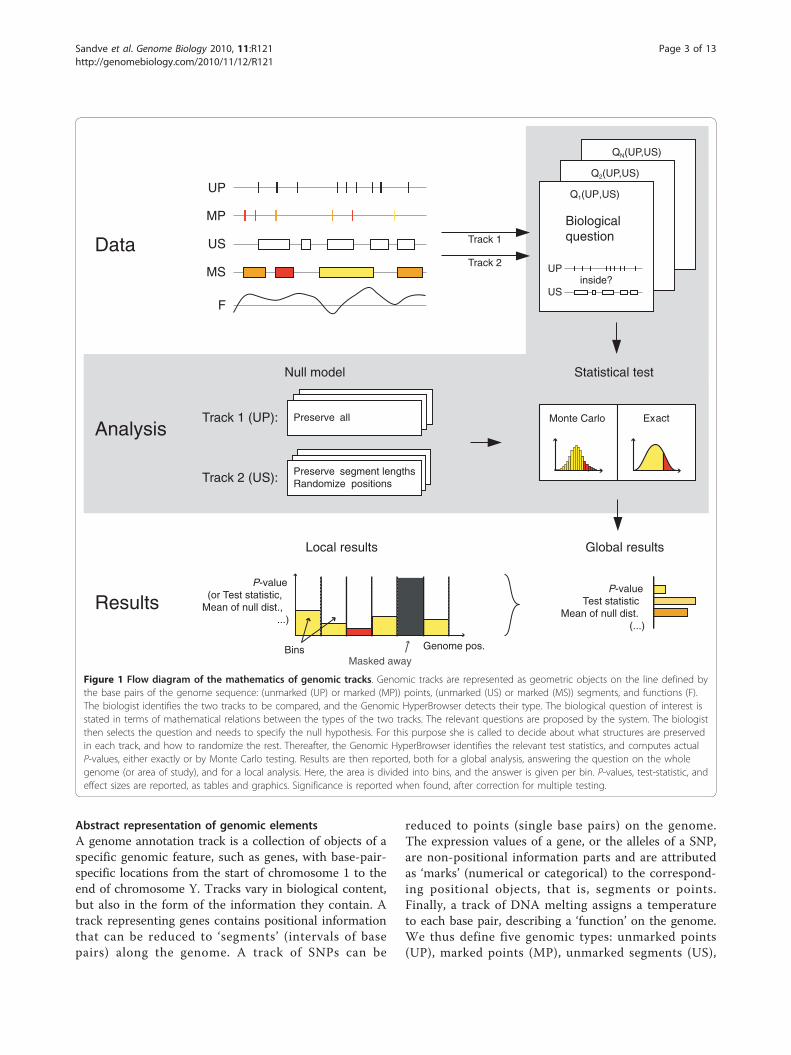
ResultsOverviewOur system is based on an abstract representation of gen-eric genomic elements as mathematical objects. Hypoth-eses of interest are translated into mathematical relations.Concepts of randomization and track structure preserva-tion are used to build complex problem-specific null mod-els of the relation between two tracks. Formal inference isperformed at a global or local scale, taking confoundertracks into account when necessary (Figure 1).
* Correspondence: [email protected] of Informatics, University of Oslo, Blindern, 0316 Oslo, NorwayFull list of author information is available at the end of the article
Sandve et al. Genome Biology 2010, 11:R121http://genomebiology.com/2010/11/12/R121
© 2010 Sandve et al.; licensee BioMed Central Ltd. This is an open access article distributed under the terms of the Creative CommonsAttribution License (http://creativecommons.org/licenses/by/2.0), which permits unrestricted use, distribution, and reproduction inany medium, provided the original work is properly cited.
Abstract representation of genomic elementsA genome annotation track is a collection of objects of aspecific genomic feature, such as genes, with base-pair-specific locations from the start of chromosome 1 to theend of chromosome Y. Tracks vary in biological content,but also in the form of the information they contain. Atrack representing genes contains positional informationthat can be reduced to ‘segments’ (intervals of basepairs) along the genome. A track of SNPs can be
reduced to points (single base pairs) on the genome.The expression values of a gene, or the alleles of a SNP,are non-positional information parts and are attributedas ‘marks’ (numerical or categorical) to the correspond-ing positional objects, that is, segments or points.Finally, a track of DNA melting assigns a temperatureto each base pair, describing a ‘function’ on the genome.We thus define five genomic types: unmarked points(UP), marked points (MP), unmarked segments (US),
F
UP
MS
MP
US Track 1
Track 2
QN(UP,US)
Q2(UP,US)
Q1(UP,US)
Biologicalquestion
UP
USinside?
Data
Analysis
Preserve segment lengthsRandomize positions
Preserve allTrack 1 (UP):
Track 2 (US):
Null model
Monte Carlo Exact
Statistical test
Results
Global results
P-valueTest statistic
Mean of null dist.(...)
Local results
Genome pos.
Masked away
P-value(or Test statistic,
Mean of null dist.,...)
Bins
Figure 1 Flow diagram of the mathematics of genomic tracks. Genomic tracks are represented as geometric objects on the line defined bythe base pairs of the genome sequence: (unmarked (UP) or marked (MP)) points, (unmarked (US) or marked (MS)) segments, and functions (F).The biologist identifies the two tracks to be compared, and the Genomic HyperBrowser detects their type. The biological question of interest isstated in terms of mathematical relations between the types of the two tracks. The relevant questions are proposed by the system. The biologistthen selects the question and needs to specify the null hypothesis. For this purpose she is called to decide about what structures are preservedin each track, and how to randomize the rest. Thereafter, the Genomic HyperBrowser identifies the relevant test statistics, and computes actualP-values, either exactly or by Monte Carlo testing. Results are then reported, both for a global analysis, answering the question on the wholegenome (or area of study), and for a local analysis. Here, the area is divided into bins, and the answer is given per bin. P-values, test-statistic, andeffect sizes are reported, as tables and graphics. Significance is reported when found, after correction for multiple testing.
Sandve et al. Genome Biology 2010, 11:R121http://genomebiology.com/2010/11/12/R121
Page 3 of 13

marked segments (MS) and functions (F). These fivetypes completely represent every one-dimensionalgeometry with marks.
Catalogue of investigationsWe translate biological hypotheses of interest into astudy of mathematical relations between genomic tracks,leading to a large collection of possible genericinvestigations.Consider the relation between histone modifications
and gene expression, as investigated by visual inspectionin [6] (Figure S1 in Additional file 1). The question iswhether the number of nucleosomes with a given his-tone modification (represented as type UP), counted ina region around the transcription start site (TSS) of agene, correlates with the expression of the gene. Thesecond track is represented as marked segments (MS).This study of histone modifications and gene expres-sions can then be phrased as a generic investigationbetween a pair of tracks (T1, T2) of type UP and MS:are the number of T1 points inside T2 segments corre-lated with T2 marks? Figure 2 shows the results whenrepeating this analysis for all histone modificationsstudied in [6], and different regions around the TSS. SeeSection 1 in Additional file 1 for a more detailed exam-ple investigation, analyzing the genome coverage bydifferent gene definitions.In the context of the catalogue of investigations, thegenomic types are minimal models of information con-tent. In the above example, nucleosome modificationsare only used for counting, and thus consideredunmarked points (UP), even though they are typicallyrepresented in the file system as marked or unmarkedsegments. As the gene-related properties of interest arethe genome segments in which the nucleosomes arecounted, as well as the corresponding gene expressionvalues (marks), T2 is of the type marked segments (MS).The choice of genomic type clarifies the content of atrack, and also restricts which analyses are appropriate.Investigations regarding the length of the elements of atrack are, for instance, relevant for genes, but not forSNPs and DNA melting temperatures.The five genomic types lead to 15 unordered pairs (T1,
T2) of track type combinations, with each combinationdefining a specific set of relevant analyses. For instance,the UP-US combination defines several investigations ofpotential interest: are the T1 points falling inside the T2segments more than expected by chance? Do the pointsaccumulate more at the borders of the segments, insteadof being spread evenly within? Do the points fall closer tothe segments than expected? A growing collection ofabstract mathematical versions of biological questions isprovided. We have currently implemented 13 differentanalyses, filling 8 of the 15 possible combinations of track
types (see Additional file 2 for mathematical details).Note that information reduction of a track to a simplertype (for example, segments to points) may open up addi-tional analytical opportunities, and are handled dynami-cally by the system - for example, by treating segments astheir middle points.
Global and local inferenceA global analysis investigates if a certain relation betweentwo tracks is found in a domain as a whole. A local analy-sis is based on partitioning the domain into smaller units,called bins, and performing the analysis in each unitseparately. Local analysis can be used to investigate if andwhere two tracks display significant concordant or dis-cordant behavior, and thus be used to generate hypoth-eses on the existence of biological mechanismsexplaining such perturbations. Local investigations mayalso be used to examine global results in more detail.The length of each bin defines the scale of the analysis.Inference is then based on the computation of P-values,locally in each bin, or globally, under the null model.To illustrate the value of local analysis, we consider
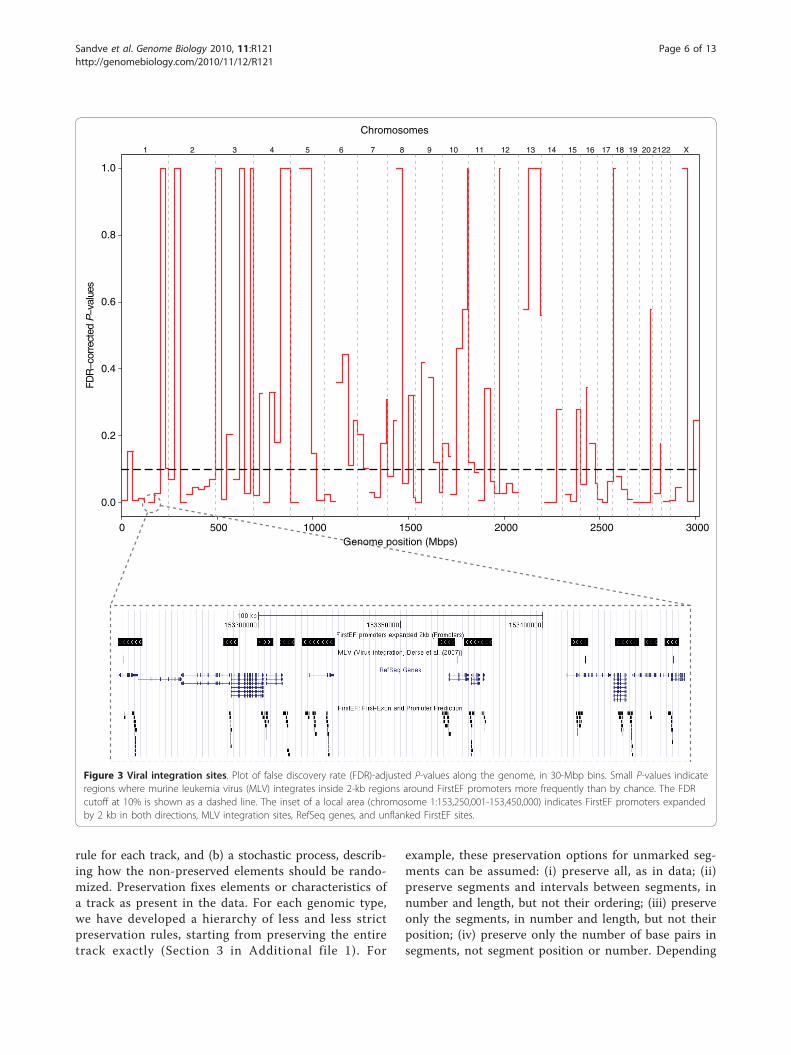
viral integration events in the human genome. Thesemay result in disease and may also be a consequence ofretroviral gene therapy. Derse et al. [7] examined inte-gration for six types of retroviruses, with different viralintegrases, thus having different integration sites (typeUP). Using these data, we asked whether there are hot-spots of integration inside 2-kb flanking regions of pre-dicted promoters (type US), that is, whether and wherethe points are falling inside the segments more thanexpected by chance. Figure 3 displays the hotspots ascalculated P-values in bins across the genome, using thesubset of murine leukemia virus (MLV) sites. We findlocations of increased integration, thus generatinghypotheses on the role of integration site sequences andtheir context.Local analysis may be used to avoid drawing incorrect
conclusions from global investigations. Consider therepressive histone modification H3K27me3 as studied in[8]. Data from ChIP-chip experiments on mouse chro-mosome 17 were analyzed, finding that H3K27me3 fallsin domains that are enriched in short interspersednuclear element (SINE) and depleted in long interspersednuclear element (LINE) repeats. Using the line of enquiryraised in [8], we asked whether H3K27me3 regions (typeUS) significantly overlap with SINE repeats (type US),but here using formal statistical testing at the base pairlevel. The chosen null model only allows local rearrange-ments of genomic elements (for more detail, see next sec-tion). This preserves local biological structure, but allowsfor some controlled level of randomness.Performing this test globally on the whole chromosome
17 leads to rejection of the null hypothesis (P = 10-4),
Sandve et al. Genome Biology 2010, 11:R121http://genomebiology.com/2010/11/12/R121
Page 4 of 13

in line with [8]. However, a local analysis leads to a dee-per understanding. At a 5-Mbp scale, no significant find-ings were obtained in any of the 19 bins (10% falsediscovery rate (FDR)-corrected). The frequency ofH3K27me3 segments varies considerably along chromo-some 17 (Figure S2 in Additional file 1), which may causethe observed discrepancy between local and globalresults.
Precise specification of null modelsA crucial aspect of an investigation is the precise forma-lization of the null model, which should reflect the com-bination of stochastic and selective events thatconstitutes the evolution behind the observed genomicfeature.Consider again the example of H3K27me3 versus
repeating elements. In the chosen null model, we pre-served the repeat segments exactly, but permuted thepositions of the H3K27me3 segments, while preservingsegment and intersegment lengths. We then computedthe total overlap between the segments, and used aMonte Carlo test to quantify the departure from thenull model. The effect of using alternative null models is
shown in Table 1. The null model examined in the firstcolumn, which does not preserve the dependencybetween neighboring base pairs, produces lowerP-values. Unrealistically simple null models may thuslead to false positives. In fact, two simulated indepen-dent tracks may appear to have a significant associationif their individual characteristics are not appropriatelymodeled (Section 2 in Additional file 1). In this example,the choice between the biologically more reasonable nullmodels is difficult. The two other columns of Table 1include models that preserve more of the biologicalstructure. The fact that these models do not lead toclear rejection of the null hypotheses suggests that we inthis case lack strong evidence against the null hypoth-esis. Thus, examining the results obtained for a set ofdifferent null models may often contribute importantinformation. The null model should reflect biologicalrealism, but also allow sufficient variation to permit theconstruction of tests. A set of simulated synthetic tracksis provided as an aid for assessing appropriate null mod-els (Additional file 3).The Genomic HyperBrowser allows the user to define
an appropriate null model by specifying (a) a preservation
● ●
●
● ●
●
●
●
●
●
● ●
● ●
●
●
●● ● ●
●
● ●● ● ● ●
●●
●●
● ●●
●●
● ● ●● ●
●
●●
●
●
●
●
●
●
●
● ● ●
●●
●
●
● ●
●
●
●
● ●
● ●● ●
●
●
●●
● ●
● ●
●●
● ●
●
●
●
●
●
●
●
●
●
Figure 2 Gene regulation by histone modifications. The correlation between occupancy of 21 different histone modifications and geneexpression within 4 different regions around the TSS (up- and downstream, 1 and 20 kb), sorted by correlation in 1-kb upstream regions. Sixteenof 21 histone modifications show significant correlation in 1-kb upstream regions, while inspection of the actual value of Kendall’s tau (Table S1in Additional file 1) shows very little effect size for 6 of these 16 (<0.1).
Sandve et al. Genome Biology 2010, 11:R121http://genomebiology.com/2010/11/12/R121
Page 5 of 13
rule for each track, and (b) a stochastic process, describ-ing how the non-preserved elements should be rando-mized. Preservation fixes elements or characteristics ofa track as present in the data. For each genomic type,we have developed a hierarchy of less and less strictpreservation rules, starting from preserving the entiretrack exactly (Section 3 in Additional file 1). For
example, these preservation options for unmarked seg-ments can be assumed: (i) preserve all, as in data; (ii)preserve segments and intervals between segments, innumber and length, but not their ordering; (iii) preserveonly the segments, in number and length, but not theirposition; (iv) preserve only the number of base pairs insegments, not segment position or number. Depending
0 500 1000 1500 2000 2500 3000
0.0
0.2
0.4
0.6
0.8
1.0
seulav−P detcerroc−
RDF
1 2 3 4 5 6 7 8 9 10 11 12 13 14 15 16 17 18 19 20 2122 X
Chromosomes
Genome position (Mbps)
Figure 3 Viral integration sites. Plot of false discovery rate (FDR)-adjusted P-values along the genome, in 30-Mbp bins. Small P-values indicateregions where murine leukemia virus (MLV) integrates inside 2-kb regions around FirstEF promoters more frequently than by chance. The FDRcutoff at 10% is shown as a dashed line. The inset of a local area (chromosome 1:153,250,001-153,450,000) indicates FirstEF promoters expandedby 2 kb in both directions, MLV integration sites, RefSeq genes, and unflanked FirstEF sites.
Sandve et al. Genome Biology 2010, 11:R121http://genomebiology.com/2010/11/12/R121
Page 6 of 13

on the test statistic T, the level of preservation and thechosen randomization, P-values are computed exactly,asymptotically or by standard or sequential MonteCarlo [9,10].
Confounder tracksThe relation between two tracks of interest may oftenbe modulated by a third track. Such a third track mayact as a confounder, leading, if ignored, to dubious con-clusions on the relation between the two tracks ofinterest.Consider the relation of coding regions to the melting
stability of the DNA double helix. Melting forks havebeen found to coincide with exon boundaries [11-15].Although few studies have reported statistical measuresof such correlation [11], the correlation is confirmed bya straightforward investigation. Tracks (type F) repre-senting the probabilities of melting fork locations [16] inSaccharomyces cerevisiae, were compared to tracks con-taining all exon boundaries (Figure 4). We asked if themelting fork probabilities (P) were higher than expectedat the exon boundaries (E) than elsewhere. In the nullmodel, the function was conserved, while points wereuniformly randomized in each chromosome. MonteCarlo testing was carried out on the chromosomes sepa-rately, giving P-values <0.0005 (Table S3 in Additional
file 1). In the absence of a confounder, it is thus tempt-ing to conclude that there is an interesting relationbetween DNA melting and coding regions, for whichfunctional implications have been previously discussed[15,17,18].An alternative view is that the GC content, being
higher inside exons than outside, contains informationabout exon location that is simply carried over, ordecoded, by a melting analysis, thus acting as a confoun-der. We have developed a methodology to investigatesuch situations further. Non-preserved elements of anull model can be randomized according to a non-homogeneous Poisson process with a base-pair-varyingintensity, which can depend on a third (or several) mod-ulating genomic tracks [19,20]. We have defined analgebra for the construction of intensities, where tracksare combined, to allow rich and flexible constructions ofrandomness (see Materials and methods).To investigate the influence of GC content on the
exon-melting relation, we first generated a pair ofcustom tracks (type F), assigning to each base the valuegiven by the GC content in the 100-bp left and rightflanking regions, respectively, weighted by a linearlydecreasing function. These two functions were used,together with the exon boundary track, to create anintensity curve proportional to the probability of exonpoints, given GC content (see Materials and methods).When performing the same analysis as before, but nowusing the null model based on this intensity curve (ratherthan assuming uniformity), a significant relationshipwas found in only one yeast chromosome (Table S3 inAdditional file 1). In conclusion, there is a melting-exonrelationship in yeast, but it may simply be a conse-quence of differences in GC content at the exon bound-aries (high GC inside, low GC outside), which may existfor biological reasons not involving melting forklocations.
Resolving complexity: system architectureThe Genomic HyperBrowser is an integrated, open-source system for genome analysis. It is continuallyevolving, supporting 28 different analyses for signifi-cance testing, as well as 62 different descriptive
Table 1 Significant bins of the overlap test between H3K27me3 segments and SINE repeats under various null models
Tracks torandomize
Preserve total number of basepairs covered
Preserve segment lengths, butrandomize position
Preserve segment and intersegment lengths, butrandomize positions
H3K27me3 10/19 1/19 0/19
SINE 10/19 5/19 4/19
H3K27me3 andSINE
10/19 5/19 4/19
The number of significant bins of the overlap test between H3K27me3 segments and SINE repeats under different preservation and randomization rules for thenull model. The test was performed in 19 bins on mouse chromosome 17, with the MEFB1 cell line. (Use of the MEFF cell line gave similar results; Table S2 inAdditional file 1). In this case, less preservation of biological structure leads to smaller P-values. Also, randomizing the SINE track gave smaller P-values thanrandomizing the H3K27me3 track (or both).
0
0.1
0.2
0.3
0.4
0.5
0.6
141000 142000 143000 144000 145000 0
0.25
0.5
0.75
Mel
ting
fork
pro
babi
lity
GC
con
tent
Position on chr I (bp)
RR LR L RLR L GCPLPR
Figure 4 Comparison of exon boundary locations and meltingfork probability peaks. Independent analyses were carried out onleft and right exon boundaries as compared to left- and right-facingmelting forks, respectively. In the upper part, dashed vertical linesindicate left (L, red) and right (R, blue) exon boundaries. In thelower part, probabilities of left- and right-facing melting forksappear as red and blue peaks, respectively. The black curve showsthe GC content in a 100-bp sliding window (values on right axis).
Sandve et al. Genome Biology 2010, 11:R121http://genomebiology.com/2010/11/12/R121
Page 7 of 13

statistics. The system currently hosts 184,500 tracks.Most of these represent literature-based information,previously mostly utilized in network-based approaches[21]. As natural language based text mining allows forthe identification of a wide variety of biological entities,we have generated tracks representing genomic locationsassociated with terms for the complete gene ontologytree, all Medical Subject Heading (MeSH) terms, chemi-cals, and anatomy.The system is implemented in Python [22], a high-
level programming language that allows fast and robustsoftware development. A main weakness of Python com-pared to languages like C++ is its slower performance.Thus, a two-level architecture has been designed. At thehighest level, Python objects and logic have been usedextensively to provide the required flexibility. At thebase-pair level, data are handled as low-level vectors,combining near-optimal storage with efficient indexing,allowing the use of vector operations to ensure speed.Interoperability with standard file formats in the field[23] is provided by parallel storage of original file for-mats and preprocessed vector representations. Toreduce the memory footprint of analyses on genome-wide data, an iterative divide-and-conquer algorithm isautomatically carried out when applicable. A furtherspeedup is achieved by memoizing intermediate resultsto disk, automatically retrieving them when needed forthe same or different analyses on the same track(s) atany subsequent time, by any user.The system provides a web-based user interface with a
low entry point. However, the complex interdependen-cies between the large body of available tracks, a num-ber of syntactically different analyses, and a range ofchoices for constructing null models, all pose challengesto the concepts of simplicity and ease of use. In order tosimplify the task of making choices, a step-wiseapproach has been implemented, displaying only therelevant options at each stage. This guided approachhides unnecessary complexities from the researcher,while confronting her with important design choices asneeded. We rely on a dynamic system to infer appropri-ate options, aiding maintenance. The list of selectabletracks is based on scans of available files on disk. Thelist of relevant questions is based on short runs of allimplemented analyses, using a minimal part of theactual data from the selected tracks. For each analysis, aset of relevant options is defined. The dynamics of thesystem also provides automatic removal of analyses thatfail to run, enhancing system robustness.Allowing extensibility along with efficiency and system
dynamics is a challenge. The complexities of the soft-ware solutions are hidden in the backbone of thesystem, simplifying coding of statistical modules. Eachmodule declares the data types it supports and which
results are needed from other modules. The backboneautomatically checks whether the selected tracks meetthe requirements, and if so, makes sure the intermediatecomputations are carried out in correct order. Redun-dant computations are avoided through the use of aRAM-based memoization scheme. The system also pro-vides a component-based framework for Monte Carlotests, where any test statistic can be combined with anyrelevant randomization algorithm, simplifying develop-ment. In addition, a framework for writing unit andintegration tests [24] is included. Further details on thesystem architecture are provided in Section 4 in Addi-tional file 1.
Step-by-step guide to HyperBrowser analysisOne of the main goals of the Genomic HyperBrowser isto facilitate sophisticated statistical analyses. A range oftextual guides and screencasts are available in the helpsection at the web page, demonstrating execution of var-ious analyses, how to work with private data, and more.To give an impression of the user experience, we hereprovide a step-by-step guide to the analysis of broadlocal enrichment (BLOC) segments versus SINE repeats,as discussed in the section on ‘Precise specification ofnull models’.First, we open ‘hyperbrowser.uio.no’ in a web browser
and we select the ‘Perform analysis’ tool under ‘TheGenomic HyperBrowser’ in the left-hand menu. Weselect the mouse genome (mm8) and continue to selecttracks of interest. As the first track, we select ‘Chroma-tin’-’Histone modifications’-’BLOC segments’-’MEFB1’.These are the BLOC segments according to the algo-rithm of Pauler et al. [8] for the MEFB1 cell line. As thesecond track, we select ‘Sequence’-’Repeating elements’-’SINE’. Now that both tracks have been selected, a listof relevant investigations is presented in the interface(that is, investigations that are compatible with thegenomic types of the two tracks: US versus US). Weselect the question of ‘Overlap?’ in the ‘Hypothesis test-ing’ category, and the options relevant for this analysisare subsequently displayed in the interface. The differentchoices for ‘Null model’ will produce the various num-bers in Table 1 (six different choices are directly avail-able from the list. The other variants can be achieved byreversing the selection order of the tracks). The originalBLOC paper [8] focused on chromosome 17. We wantto perform a local analysis along this chromosome,avoiding the first three megabases that are centromeric.Under ‘Region and scale’ we thus choose to ‘Compare in’a custom specified region, writing ‘chr17:3m-’ as ‘Regionof the genome’ and writing ‘5 m’ (5 megabases) as ‘Binsize’. Clicking the ‘Start analysis’ button will then performan appropriate statistical test according to the selectednull model assumption, and output textual and graphical
Sandve et al. Genome Biology 2010, 11:R121http://genomebiology.com/2010/11/12/R121
Page 8 of 13

results to a new Galaxy history element. Figure 5ashows the user interface covering all selections above andFigure 5b shows the answer page that results from thisanalysis.This example assumed the BLOC segments were
already in the system. If not, they could simply be
uploaded to the Galaxy history and then selected in thefirst track menu as ‘– From history (bed, wig) –’-’[yourBLOC history element]’. For information on how to usethe Galaxy system, we refer to the Galaxy web site [25].
DiscussionThe current leap in high-throughput sequencing tech-nology is opening the way for a range of genome-wideannotations beyond the presently abundant gene-centricdata. Not least, chromatin-related data are becomingincreasingly important for understanding higher-levelorganization and regulation of the genome [26].As is typical for a subfield that has not reached
maturation, analysis of new massive sequence-level datais performed on a per-project basis. For instance, apaper on the ENCODE project describes how inferencecan be done by Monte Carlo testing, sampling bins forone of the real tracks at random genome locationsunder the null hypothesis [1]. Independently, a newerstudy of histone modifications instead permuted bins ofdata for one of the tracks [27]. Although genomic visua-lization tools have been available for several years, fewgeneric tools exist for inference at the sequence level.The following aspects distinguish our work from
currently available systems. First, we focus on genomicinformation of a sequential nature, that is, with specificbase-pair locations on a genome, and thus not restrictedto only genes. Second, it focuses on the comparison ofpairs of genomic tracks, possibly taking others intoaccount through the concept of intensity tracks. Third,all comparisons are performed using formal statisticaltesting. Fourth, we provide analyses on any scale, fromgenome-wide studies to miniature investigations on par-ticular loci. Fifth, we offer flexible choices of null modelsfor exploration and choice where relevant. Finally, weprovide a user interface where the user describes thedata and the null models, while the system based onthis chooses the appropriate statistical test. Comparingthis to the EpiGRAPH and Galaxy frameworks, whichwe believe are the closest existing systems, we find thatboth require substantial technical expertise when choos-ing the correct analysis and options. EpiGRAPH isfocused on a specific type of scenario that, according toour cataloguing, amounts to the comparison ofunmarked points or segments versus categoricallymarked segments (with mark being case or control).Galaxy provides a simple user interface, is rich in toolsfor manipulating and analyzing datasets of diverse for-mats, but has little support for formal statistical testing.Note also that our system is tightly connected to Galaxyand can make use of all the tools provided withinGalaxy.We provide tools for abstraction and cataloguing of
what we believe are typical questions of broad interest.
Figure 5 Screenshots of the Genomic HyperBrowser. (a)Screenshot of the main interface for selecting analysis options. Theselections for the example relating H3K27me3 BLOCs to SINErepeats have been pre-selected. In the interface, the user selects agenome build followed by two tracks. A list of relevantinvestigations is then presented, based on the genomic types of thetwo tracks. After selecting an investigation, the interface presentsthe user with a choice of null models, alternative hypotheses andother relevant options. (b) Screenshot of the results of the analysis.The question asked by the user is presented at the top, in this case:‘Are ‘MEFB1 (BLOC segments)’ overlapping ‘SINE (Repeatingelements)’ more than expected by chance?’ A first, simplistic answeris then presented: ‘No support from data for this conclusion in anybin’. A more precise answer follows, detailing any global P-values, asummary of local FDR-corrected P-values, the particular set of nulland alternative hypotheses tested, in addition to a legend of thetest statistic that has been used. Further links to a PDF filecontaining the statistical details of the test, and to more detailedtables of relevant statistics for both the global and the local analysisare also included. The global result table also includes links to plotsand export opportunities for the individual statistics.
Sandve et al. Genome Biology 2010, 11:R121http://genomebiology.com/2010/11/12/R121
Page 9 of 13
The abstractions of genomic data, the proposing of pro-totype investigations, and the careful attention given tonull models simplifies statistical inference for a range ofpossible research topics. Our approach invites research-ers to build relevant null models in a controlled manner,so that specific biological assumptions can be realisti-cally represented by preservation, randomness andintensity based confounders. In addition, time used forrepetitive tasks like file parsing and calculation ofdescriptive statistics may be significantly reduced.Our system is highly extensible. The software is open
source, inviting the community to add new investiga-tions and tools. Attention has been given to compo-nent-based coding and simple interfaces, facilitatingextensions of the system.The highly specialized nature of many research inves-
tigations poses a major challenge for a generic systemsuch as the one presented here. Even though a range ofanalyses and options are provided, chances are that at agiven level of complexity, functionality beyond what isprovided by a generic system will be needed. Still, thetime and effort used to reach such a point may be shor-tened considerably, and it should in many cases be pos-sible to meet demands through custom extensions.Genomic mechanisms commonly involve more than
two tracks, and the current focus on pair-wise interroga-tions is limiting. Our methodology allows the incorpora-tion of additional tracks through the concept of anintensity track that modulates the null hypothesis, actingas a confounder. However, the investigation of genuinemulti-track interactions is not yet possible within thesystem, as complex modeling and testing of multipledependencies will be required.Attention should be given to the trade-off between
fine resolution and lack of precision. When large binsare considered, there may be too little homogeneity,while small bins may contain too little data. There isalso an unresolved trade-off relating to preservation oftracks in null-hypotheses construction: too little preser-vation may give unrealistically small P-values, while toostrong preservation may give too limited randomness.On a more specific note, a set of tissue-specific analy-
tical options would be beneficial with respect to manytypes of experimental data - for example, chromatin,expression and also gene subset tracks. Such options arenow under development.Novel sequencing technologies are instrumental in
realizing the personalized genomes [28], and with themthe task of identifying phenotype-associated informationcontained in each genome. An imminent challenge inunderstanding cellular organization is that of the threedimensions of the genome. While a number of genomeshave been sequenced, and a number of important cellu-lar elements have been mapped on a linear scale, the
mapping of the three-dimensional organization of theDNA and chromatin in the nucleus is still only in itsbeginnings. Consequently, the impact of this organiza-tion on cell regulation is still largely unresolved. How-ever, the advent of methods like Hi-C [29] permitsdetailed maps of three-dimensional DNA interactions tobe combined with coarser methods of mapping of otherelements. It appears that looking simultaneously at mul-tiple scales seems important for understanding thedynamics of different functional aspects, from chromo-somal domains down to the nucleosome scale. The needfor taking multiple scales into account has recently beenemphasized in both theoretical and analytical settings[30,31]. Consequently, statistical genomics needs to con-sider several scales when proper analytical routines aredeveloped. Our approach is open to three-dimensionalextensions, where the bins, which are flexibly selected inthe system, will become three-dimensional volumes, andlocal comparison will be within each volume. Whatappears much more complex is the level of dependenceof such volumes. But as the three-dimensional organiza-tion of the genome will become increasingly known,appropriate volume topologies will be possible, so thatneighboring volumes representing three-dimensionalcontiguity may be used as a basis for statistical tests.
ConclusionsBy introducing a generic methodology to genome analy-sis, we find that a range of genomic data sets can berepresented by the same mathematical objects, and thata small set of such objects suffice to describe the bulkof current data sets. Similarly, a range of biologicalinvestigations can be reduced to similar statistical ana-lyses. The need for precise control of assumptions andother parameters can furthermore be met by genericconcepts such as preservation and randomization, localanalysis (binning) and confounder tracks.Applying these ideas on a sample set of genomic
investigations underlines that the generic concepts fitnaturally to concrete analyses, and that such a generictreatment may expose vagueness of biological conclu-sions or expose unforeseen issues. A re-analysis of therelation between BLOC segments of histone modifica-tion and SINE repeats shows that conclusions regardingdirect overlap at the base-pair level depends on the ran-domizations used in the significance analysis. Using bio-logically reasonable null models, the correspondencebetween BLOC segments and SINE repeats appears notto be due to overlap at the base-pair level, but ratherseems to be due to local variation in intensities of bothtracks. This does not directly oppose the original con-clusions, but brings further insight into the nature ofthe relation. Similarly, an analysis of the relationbetween DNA melting and exon location confirms the
Sandve et al. Genome Biology 2010, 11:R121http://genomebiology.com/2010/11/12/R121
Page 10 of 13

conclusion from previous studies that exon boundariescoincide with gradients of melting temperature. How-ever, taking GC content into account as a possible con-founder, the analysis does not suggest a directfunctional relation between melting and exons. Instead,it suggests that the association is due to the relationshipof both exons and melting tracks to GC content.We believe the generic concepts and challenges identi-
fied by our work will trigger community efforts toimprove genome analysis methodology. The GenomicHyperBrowser demonstrates the feasibility of applyingour approach to large-scale genomic datasets, providinga concrete basis for further research and development ininferential genomics. We thus consider the solutionspresented here more like a start than an end of thisimportant endeavor.
Materials and methodsStatistical methodsA track is defined over the whole genome or only in partsof it, masking away the rest. In a local analysis, statisticaltests are performed in each bin with sufficient samplesize. Resizing of bins allows for localization of events(similarities, differences, and so on, between the twotracks) with flexible precision. Preservation rules leads toconditional P-values that are not necessarily ordered,even if the preservation mechanism is incremental. Sta-tistical tests have been tried on simulated data, also whenmodel assumptions are not completely fulfilled. StandardMonte Carlo requires deciding on the number of MonteCarlo samples. We suggest at least two to five times thenumber of tests, in order to allow for FDR adjustment.Additionally, we adopt sequential Monte Carlo, wherethe algorithm continues sampling until the observedstatistic has been exceeded a given number of times (say20) [9]. This gives better estimates of small P-values withoverall reduced computations. Intensity tracks are usedto define non-standard null hypothesis. Several strategiesfor building intensity curves are described in Section 3 inAdditional file 1. Intensity curves allow performing ran-domizations that mimic another track (or a combinationof tracks), useful to account for confounding effects. Forunmarked points, the intensity curve can be any regularfunction l0(b) where b is the position along, say, a chro-mosome. If l0(b) = c (constant), points are uniformly dis-tributed. As another example, l0(b) can be a kerneldensity estimate based on the track of observed points. Ingeneral, the intensity l0(b) may depend on several differ-ent tracks g1, g2, ..., gk, through a function s, so that l0(b)= s(g1(b), g2(b), ..., gk(b)), for example, l0(b) = c + Σbigi(b). An important case that requires a special choice ofintensity track is when the comparison between two tracksT1 and T2 might be confounded by a third, confounder,track T3. This is discussed in further detail in Section 5
in Additional file 1 for the melting-exon example,where each track depends on a function of the GCcontent.
Software systemThe Genomic HyperBrowser [30] is implemented inPython [22], version 2.7. It runs as a stand-alone applica-tion tightly connected to the Galaxy framework [2], usingthe version dated 2010-10-04. The user interface is basedon Mako templates for Python [32], version 0.2.5, andJavascript library Jquery [33], version 1.4.2. The softwareuses NumPy [34], version 1.5.1rc1, for disk based vectormapping and fast vector operations. R [35], version2.10.1, is used for plotting and basic statistical routines,using the RPy API [36], version 1.0.3. The software isopen source and freely available, using GPL [37] version3, and can be downloaded from [30]. The GenomicHyperBrowser runs on a dedicated Linux server, withlarge computations offloaded to the Titan cluster [38].
Biological example: histone modifications versus geneexpressionRaw histone modification data [39] were preprocessedusing the NPS (Nucleosome Positioning from Sequen-cing) software [40], using peak detection, leading tonucleosome positioning information as short segments,treated as unmarked points (UP). Raw microarrayexpression values [41] were used to represent geneexpression, in line with [6]. Direct comparison of theexpression levels of individual probes is not generallyjustified. As Barski et al. [6] compares sets of 1,000genes each, the direct comparison of values betweengroups may be justified by noise averaging (although notdiscussed in [6]). Using Kendall’s rank correlation test, asimilar reduction of error is obtained. Detailed correla-tion values for the different histone modifications aregiven in Table S1 in Additional file 1. The distributionof histone modifications relative to TSS is given for twodifferent modifications in Figure S4 in Additional file 1.
Biological example: histone modifications versusrepeating elementsChIP-seq data on histone modification [39,42] were pre-processed using the SICER software [43], which returnsclusters of neighboring nucleosomes as islands unlikelyto have appeared by chance, using an appropriate ran-dom background model. These clusters are treated asunmarked segments (US). The ChIP-chip data ofH3K27me3 positions were obtained directly from Pauleret al. [8], and were preprocessed by them using theirBLOCs software, which returns broad local enrichments,also treated as unmarked segments (US). Detailed overlapresults between repeats and different histone modifica-tion sources are given in Table S2 in Additional file 1.
Sandve et al. Genome Biology 2010, 11:R121http://genomebiology.com/2010/11/12/R121
Page 11 of 13

Biological example: exons versus DNA meltingThe melting fork probability tracks PL(x) and PR(x) usedin this study were obtained using the Poland-Scheragamodel [44]. To make the correction for GC content, apair of GC-based function tracks, L(x) and R(x), werecreated using a moving window approach. Let EL (ER)be the left (right) exon boundaries. For testing the melt-ing-exon relation in tracks (EL, PL), an intensity trackwas created based on L(x), R(x) and EL.(and similarly fortracks (ER, PR)). See Section 5 in Additional file 1 formore details.
Additional material
Additional file 1: Supplementary material. Miscellaneoussupplementary material: gene coverage example. On the importance ofrealistic null models. On mathematics of genomic tracks. On systemarchitecture. On Exon DNA melting example. Supplementary figures andtables.
Additional file 2: Statistical tests. Detailed description of the statisticaltests implemented in the software system.
Additional file 3: Supplementary note on simulation. Description ofbasic algorithms for simulating synthetic tracks, used to assess statisticaltests.
AbbreviationsBLOC: broad local enrichment; bp: base pair; F: function; FDR: false discoveryrate; kb: kilo base pairs; LINE: long interspersed nuclear element; Mbp: megabase pairs; MP: marked point; MS: marked segment; SINE: short interspersednuclear element; SNP: single-nucleotide polymorphism; TSS: transcriptionstart site; UP: unmarked point; US: unmarked segment.
AcknowledgementsWe gratefully acknowledge ChIP-chip data provision from Florian M Pauler,and helpful comments on the manuscript from Magnus Lie Hetland, SylviaRichardson and Håvard Rue. Gro Nilsen is acknowledged for some plottingfunctions, and Peter Wiedswang for administrative assistance. We thank theScientific Computing Group at USIT for providing friendly and helpfulassistance on system administration. We also thank PubGene, Inc. for kindassistance in the development of literature tracks. Additional funding waskindly provided by EMBIO, UiO and Helse Sør-Øst. This work was performedin association with ‘Statistics for Innovation’, a Centre for Research-BasedInnovation funded by the Research Council of Norway.
Author details1Department of Informatics, University of Oslo, Blindern, 0316 Oslo, Norway.2Department of Tumor Biology, The Norwegian Radium Hospital, OsloUniversity Hospital, Montebello, 0310 Oslo, Norway. 3Statistics For Innovation,Norwegian Computing Center, 0314 Oslo, Norway. 4Department ofMathematics, University of Oslo, Blindern, 0316 Oslo, Norway. 5Centre forCancer Biomedicine, The Norwegian Radium Hospital, Oslo UniversityHospital, Montebello, 0310 Oslo, Norway. 6Institute for Medical Informatics,The Norwegian Radium Hospital, Oslo University Hospital, Montebello, 0310Oslo, Norway. 7Department of Biostatistics, Institute of Basic MedicalSciences, University of Oslo, Blindern, 0317 Oslo, Norway.
Authors’ contributionsGKS, AF and EH conceived the approach, GKS, SG and MJ developed thesoftware, GKS, SG, HR, TC, VN and EH developed novel track types, IKG, LH,MH, KL, EF and AF developed the statistical concepts, GKS, SG and HR testedand validated the system, and GKS, SG, HR, ET and EH developed thebiological examples. All authors participated in the manuscript development,and read and approved the final manuscript.
Competing interestsEivind Hovig is a shareholder of PubGene, Inc. All other authors declare thatthey have no competing interests.
Received: 27 August 2010 Revised: 8 December 2010Accepted: 23 December 2010 Published: 23 December 2010
References1. The ENCODE (ENCyclopedia Of DNA Elements) Project. Science 2004,
306:636-640.2. Giardine B, Riemer C, Hardison RC, Burhans R, Elnitski L, Shah P, Zhang Y,
Blankenberg D, Albert I, Taylor J, Miller W, Kent WJ, Nekrutenko A: Galaxy:a platform for interactive large-scale genome analysis. Genome Res 2005,15:1451-1455.
3. Pruess M, Kersey P, Apweiler R: The Integr8 project–a resource forgenomic and proteomic data. In Silico Biol 2005, 5:179-185.
4. Bock C, Halachev K, Buch J, Lengauer T: EpiGRAPH: user-friendly softwarefor statistical analysis and prediction of (epi)genomic data. Genome Biol2009, 10:R14.
5. Zhu J, Sanborn JZ, Benz S, Szeto C, Hsu F, Kuhn RM, Karolchik D, Archie J,Lenburg ME, Esserman LJ, Kent WJ, Haussler D, Wang T: The UCSC CancerGenomics Browser. Nat Methods 2009, 6:239-240.
6. Barski A, Cuddapah S, Cui K, Roh TY, Schones DE, Wang Z, Wei G,Chepelev I, Zhao K: High-resolution profiling of histone methylations inthe human genome. Cell 2007, 129:823-837.
7. Derse D, Crise B, Li Y, Princler G, Lum N, Stewart C, McGrath CF, Hughes SH,Munroe DJ, Wu X: Human T-cell leukemia virus type 1 integration targetsites in the human genome: comparison with those of otherretroviruses. J Virol 2007, 81:6731-6741.
8. Pauler FM, Sloane MA, Huang R, Regha K, Koerner MV, Tamir I, Sommer A,Aszodi A, Jenuwein T, Barlow DP: H3K27me3 forms BLOCs over silentgenes and intergenic regions and specifies a histone banding patternon a mouse autosomal chromosome. Genome Res 2009, 19:221-233.
9. Besag J, Clifford P: Sequential Monte Carlo p-values. Biometrika 1991,78:301-304.
10. Manly BFJ: Randomization, Bootstrap and Monte Carlo Methods in BiologyBoca Raton, FL: Chapman and Hall; 2007.
11. Jost D, Everaers R: Genome wide application of DNA melting analysis. JPhys Condensed Matter 2009, 21:034108.
12. King GJ: Stability, structure and complexity of yeast chromosome III.Nucleic Acids Res 1993, 21:4239-4245.
13. Liu F, Tostesen E, Sundet JK, Jenssen TK, Bock C, Jerstad GI, Thilly WG,Hovig E: The human genomic melting map. PLoS Comput Biol 2007, 3:e93.
14. Suyama A, Wada A: Correlation between thermal stability maps andgenetic maps of double-stranded DNAs. J Theor Biol 1983, 105:133-145.
15. Yeramian E: Genes and the physics of the DNA double-helix. Gene 2000,255:139-150.
16. Tøstesen E, Sandve GK, Liu F, Hovig E: Segmentation of DNA sequencesinto twostate regions and melting fork regions. J Phys Condensed Matter2009, 21:034109.
17. Carlon E, Malki ML, Blossey R: Exons, introns, and DNA thermodynamics.Phys Rev Lett 2005, 94:178101.
18. Hanai R, Suyama A, Wada A: Vestiges of lost introns in the thermalstability map of DNA. FEBS Lett 1988, 226:247-249.
19. Cox DR, Isham V: Point Processes Boca Raton, FL: Chapman and Hall; 1980.20. Grandell J: Mixed Poisson Processes Boca Raton, FL: Chapman and Hall; 1997.21. Jenssen TK, Laegreid A, Komorowski J, Hovig E: A literature network of
human genes for high-throughput analysis of gene expression. NatGenet 2001, 28:21-28.
22. Python Reference Manual. [http://docs.python.org/release/2.5.2/ref/ref.html].
23. Kent WJ, Sugnet CW, Furey TS, Roskin KM, Pringle TH, Zahler AM,Haussler D: The human genome browser at UCSC. Genome Res 2002,12:996-1006.
24. Beck K: Test Driven Development London: Addison-Wesley Profession; 2002.25. Galaxy. [http://main.g2.bx.psu.edu/].26. Lieberman-Aiden E, van Berkum NL, Williams L, Imakaev M, Ragoczy T,
Telling A, Amit I, Lajoie BR, Sabo PJ, Dorschner MO, Sandstrom R,Bernstein B, Bender MA, Groudine M, Gnirke A, Stamatoyannopoulos J,Mirny LA, Lander ES, Dekker J: Comprehensive mapping of long-range
Sandve et al. Genome Biology 2010, 11:R121http://genomebiology.com/2010/11/12/R121
Page 12 of 13

interactions reveals folding principles of the human genome. Science2009, 326:289-293.
27. Wang Z, Zang C, Rosenfeld JA, Schones DE, Barski A, Cuddapah S, Cui K,Roh TY, Peng W, Zhang MQ, Zhao K: Combinatorial patterns of histoneacetylations and methylations in the human genome. Nat Genet 2008,40:897-903.
28. 1000Genomes. [http://www.1000genomes.org/].29. Lieberman-Aiden E, van Berkum NL, Williams L, Imakaev M, Ragoczy T,
Telling A, Amit I, Lajoie BR, Sabo PJ, Dorschner MO, Sandstrom R,Bernstein B, Bender MA, Groudine M, Gnirke A, Stamatoyannopoulos J,Mirny LA, Lander ES, Dekker J: Comprehensive mapping of long-rangeinteractions reveals folding principles of the human genome. Science2009, 326:289-293.
30. Naumova N, Dekker J: Integrating one-dimensional and three-dimensional maps of genomes. J Cell Sci 123:1979-1988.
31. Knoch TA, Goker M, Lohner R, Abuseiris A, Grosveld FG: Fine-structuredmulti-scaling long-range correlations in completely sequenced genomes- features, origin, and classification. Eur Biophys J 2009, 38:757-779.
32. Mako. [http://www.makotemplates.org].33. JQuery. [http://jquery.com].34. Oliphant TE: In Guide to NumPy. Edited by: Spanish Fork UT. Trelgol
Publishing; 2006:.35. Team R: R: A Language and Environment for Statistical Computing Vienna:
Austria; R Foundation for Statistical Computing; 2006.36. RPy a robust Python interface to the R Programming Language. [http://
rpy.sf.net].37. GPL. [http://www.gnu.org/copyleft/gpl.html].38. Titan. [http://www.notur.no/hardware/titan/].39. Barski A, Zhao K: Genomic location analysis by ChIP-Seq. J Cell Biochem
2009, 107:11-18.40. Zhang Y, Shin H, Song JS, Lei Y, Liu XS: Identifying positioned
nucleosomes with epigenetic marks in human from ChIP-Seq. BMCGenomics 2008, 9:537.
41. Su AI, Wiltshire T, Batalov S, Lapp H, Ching KA, Block D, Zhang J, Soden R,Hayakawa M, Kreiman G, Cooke MP, Walker JR, Hogenesch JB: A gene atlasof the mouse and human protein-encoding transcriptomes. Proc NatlAcad Sci USA 2004, 101:6062-6067.
42. Mikkelsen TS, Ku M, Jaffe DB, Issac B, Lieberman E, Giannoukos G, Alvarez P,Brockman W, Kim TK, Koche RP, Lee W, Mendenhall E, O’Donovan A,Presser A, Russ C, Xie X, Meissner A, Wernig M, Jaenisch R, Nusbaum C,Lander ES, Bernstein BE: Genome-wide maps of chromatin state inpluripotent and lineage-committed cells. Nature 2007, 448:553-560.
43. Zang C, Schones DE, Zeng C, Cui K, Zhao K, Peng W: A clusteringapproach for identification of enriched domains from histonemodification ChIP-Seq data. Bioinformatics 2009, 25:1952-1958.
44. Poland D, Scheraga HA: Theory of Helix-Coil Transitions in Biopolymers NewYork: Academic Press; 1970.
45. Pruitt KD, Harrow J, Harte RA, Wallin C, Diekhans M, Maglott DR, Searle S,Farrell CM, Loveland JE, Ruef BJ, Hart E, Suner MM, Landrum MJ, Aken B,Ayling S, Baertsch R, Fernandez-Banet J, Cherry JL, Curwen V, Dicuccio M,Kellis M, Lee J, Lin MF, Schuster M, Shkeda A, Amid C, Brown G,Dukhanina O, Frankish A, Hart J, et al: The consensus coding sequence(CCDS) project: Identifying a common protein-coding gene set for thehuman and mouse genomes. Genome Res 2009, 19:1316-1323.
46. Pruitt KD, Tatusova T, Klimke W, Maglott DR: NCBI Reference Sequences:current status, policy and new initiatives. Nucleic Acids Res 2009, 37:D32-36.
47. Hubbard T, Barker D, Birney E, Cameron G, Chen Y, Clark L, Cox T, Cuff J,Curwen V, Down T, Durbin R, Eyras E, Gilbert J, Hammond M, Huminiecki L,Kasprzyk A, Lehvaslaiho H, Lijnzaad P, Melsopp C, Mongin E, Pettett R,Pocock M, Potter S, Rust A, Schmidt E, Searle S, Slater G, Smith J,Spooner W, Stabenau A, et al: The Ensembl genome database project.Nucleic Acids Res 2002, 30:38-41.
48. Wilming LG, Gilbert JG, Howe K, Trevanion S, Hubbard T, Harrow JL: Thevertebrate genome annotation (Vega) database. Nucleic Acids Res 2008,36:D753-760.
49. Yamasaki C, Murakami K, Fujii Y, Sato Y, Harada E, Takeda J, Taniya T,Sakate R, Kikugawa S, Shimada M, Tanino M, Koyanagi KO, Barrero RA,Gough C, Chun HW, Habara T, Hanaoka H, Hayakawa Y, Hilton PB,Kaneko Y, Kanno M, Kawahara Y, Kawamura T, Matsuya A, Nagata N,Nishikata K, Noda AO, Nurimoto S, Saichi N, Sakai H, et al: The H-
Invitational Database (H-InvDB), a comprehensive annotation resourcefor human genes and transcripts. Nucleic Acids Res 2008, 36:D793-799.
doi:10.1186/gb-2010-11-12-r121Cite this article as: Sandve et al.: The Genomic HyperBrowser: inferentialgenomics at the sequence level. Genome Biology 2010 11:R121.
Submit your next manuscript to BioMed Centraland take full advantage of:
• Convenient online submission
• Thorough peer review
• No space constraints or color figure charges
• Immediate publication on acceptance
• Inclusion in PubMed, CAS, Scopus and Google Scholar
• Research which is freely available for redistribution
Submit your manuscript at www.biomedcentral.com/submit
Sandve et al. Genome Biology 2010, 11:R121http://genomebiology.com/2010/11/12/R121
Page 13 of 13
Related Documents


