1 The Genetics of Carbon Allocation and Partitioning in Populus Gerald A. Tuskan 1,4 Wellington Muchero 1 , Priya Ranjan 1,2 , Stephen DiFazio 3 , Tim Tschaplinski 1 , Paul Abraham 1,2 , Jay Chen 1 , Jeremy Schmutz 5 , Dan Rokshar 4 , Udaya Kalluri 1 , Nancy Engle, and many others!!! 1 Oak Ridge National Laboratory, Oak Ridge, TN 2 University of Tennessee, Knoxville, TN 3 West Virginia University, Morgantown, WV 4 Joint Genome Institute, Walnut Creek, CA 5 HudsonAlpha, Huntsville, AL

Welcome message from author
This document is posted to help you gain knowledge. Please leave a comment to let me know what you think about it! Share it to your friends and learn new things together.
Transcript

1
The Genetics of Carbon Allocation and
Partitioning in Populus
Gerald A. Tuskan1,4
Wellington Muchero1, Priya Ranjan1,2, Stephen DiFazio3, Tim Tschaplinski1, Paul Abraham1,2, Jay Chen1, Jeremy Schmutz5, Dan Rokshar4, Udaya Kalluri1, Nancy Engle, and many others!!!
1 Oak Ridge National Laboratory, Oak Ridge, TN
2 University of Tennessee, Knoxville, TN
3 West Virginia University, Morgantown, WV
4 Joint Genome Institute, Walnut Creek, CA
5 HudsonAlpha, Huntsville, AL
• Carbon Allocation and Partitioning
• QTL Analyses
─ Carbon allocation
─ Carbon Partitioning
• GWAS Analyses
─ Aboveground Carbon Partitioning
● Host-driven Microbiome
Overview and Content of the Talk
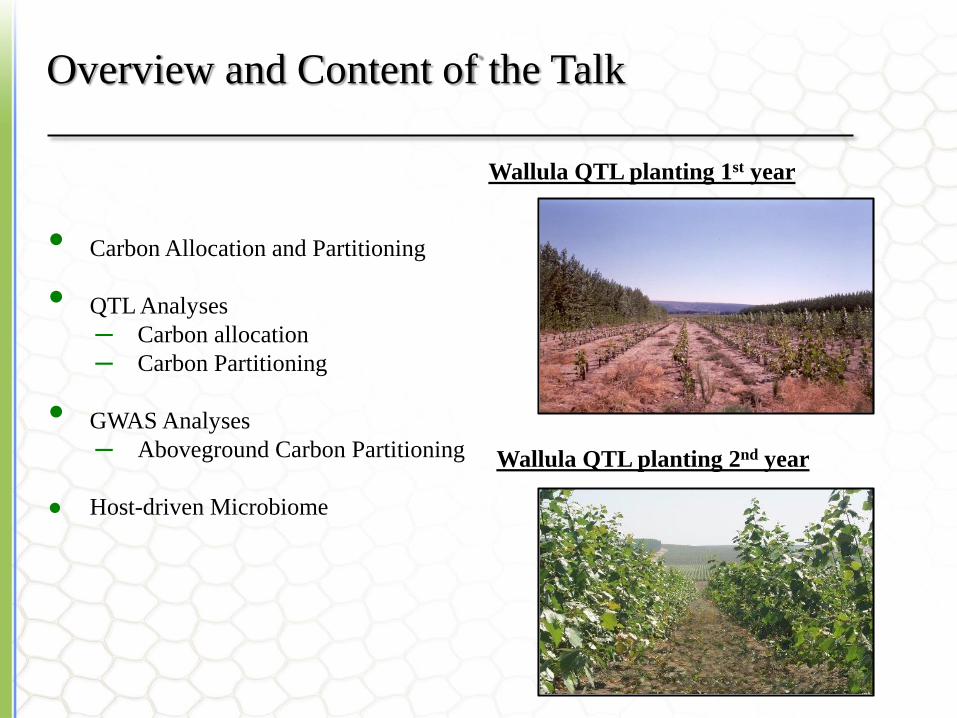
Wallula QTL planting 1st year
Wallula QTL planting 2nd year

Carbon Allocation Above and Below Ground
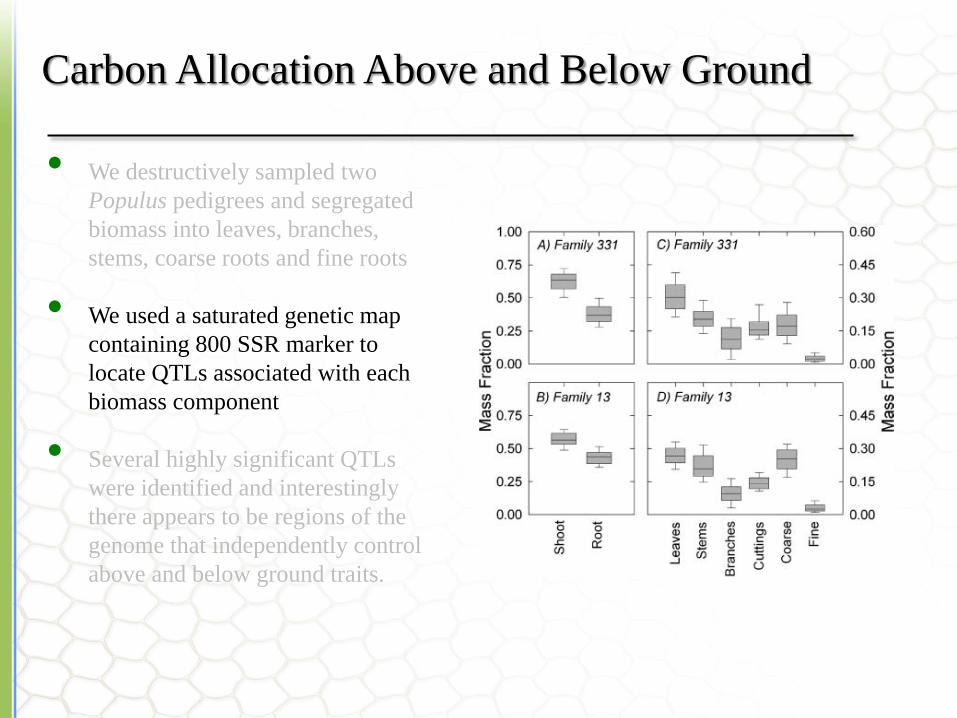
• We destructively sampled two
Populus pedigrees and segregated
biomass into leaves, branches,
stems, coarse roots and fine roots
• We used a saturated genetic map
containing 800 SSR marker to
locate QTLs associated with each
biomass component
• Several highly significant QTLs
were identified and interestingly
there appears to be regions of the
genome that independently control
above and below ground traits.
Carbon Allocation Above and Below Ground

Carbon Allocation Above and Below Ground
Wullschleger et al. (2005) Canadian J Forest Research 35:1779-1789.
Muchero et al. (2013) PloS ONE 8(1):e54468.
• We destructively sampled two
Populus pedigrees and segregated
biomass into leaves, branches,
stems, coarse roots and fine roots
• We used a saturated genetic map
containing 800 SSR marker to
locate QTLs associated with each
biomass component
• Several highly significant QTLs
were identified and interestingly
there appears to be regions of the
genome that independently control
above and below ground traits.
Carbon Partitioning QTL study
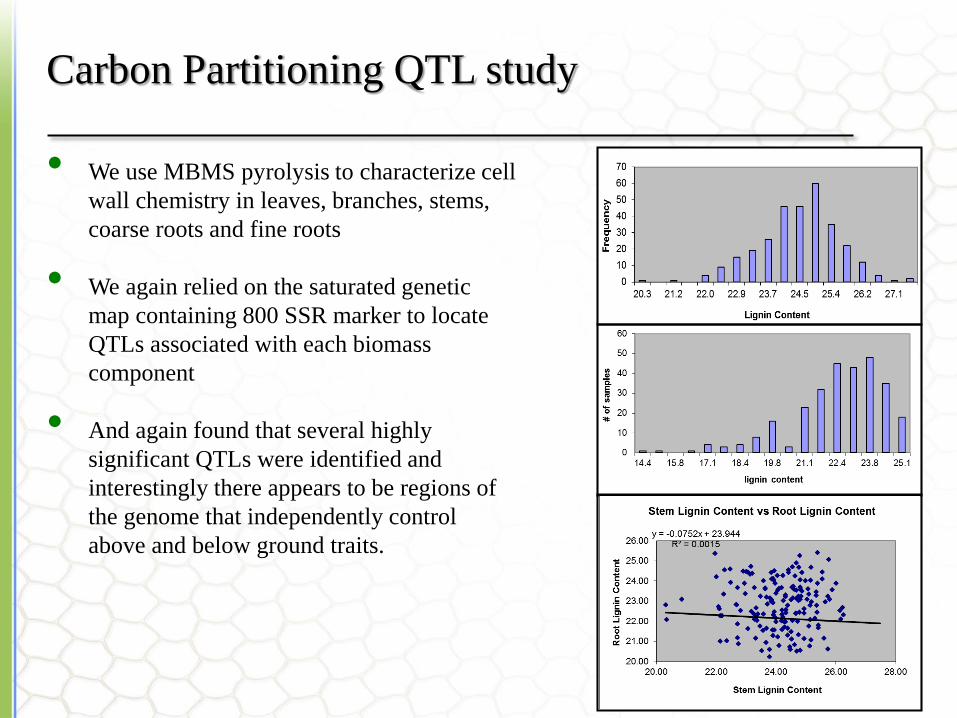
• We use MBMS pyrolysis to characterize cell
wall chemistry in leaves, branches, stems,
coarse roots and fine roots
• We again relied on the saturated genetic
map containing 800 SSR marker to locate
QTLs associated with each biomass
component
• And again found that several highly
significant QTLs were identified and
interestingly there appears to be regions of
the genome that independently control
above and below ground traits.
Carbon Partitioning QTL study
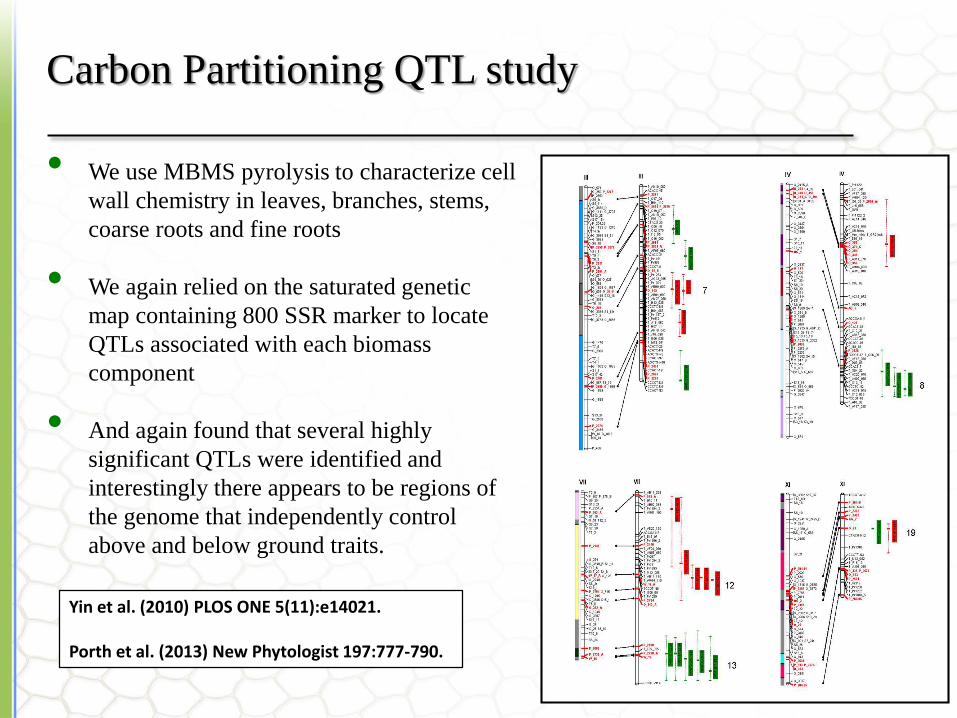
Yin et al. (2010) PLOS ONE 5(11):e14021.
Porth et al. (2013) New Phytologist 197:777-790.
• We use MBMS pyrolysis to characterize cell
wall chemistry in leaves, branches, stems,
coarse roots and fine roots
• We again relied on the saturated genetic
map containing 800 SSR marker to locate
QTLs associated with each biomass
component
• And again found that several highly
significant QTLs were identified and
interestingly there appears to be regions of
the genome that independently control
above and below ground traits.
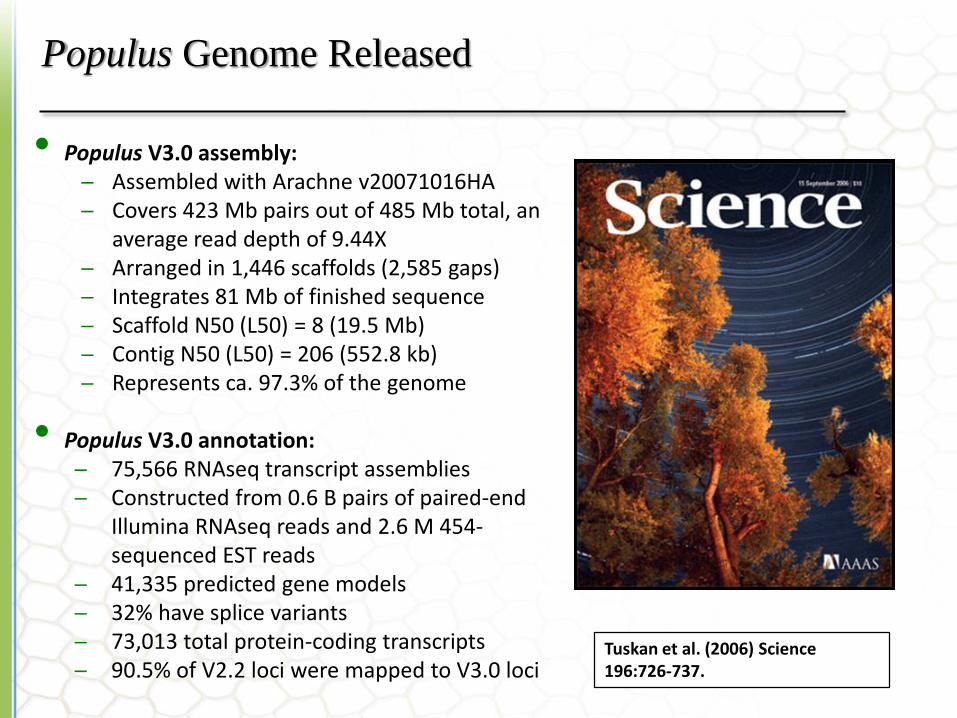
• Populus V3.0 assembly: ─ Assembled with Arachne v20071016HA─ Covers 423 Mb pairs out of 485 Mb total, an
average read depth of 9.44X ─ Arranged in 1,446 scaffolds (2,585 gaps)─ Integrates 81 Mb of finished sequence─ Scaffold N50 (L50) = 8 (19.5 Mb)─ Contig N50 (L50) = 206 (552.8 kb)─ Represents ca. 97.3% of the genome
• Populus V3.0 annotation: ─ 75,566 RNAseq transcript assemblies ─ Constructed from 0.6 B pairs of paired-end
Illumina RNAseq reads and 2.6 M 454-sequenced EST reads
─ 41,335 predicted gene models─ 32% have splice variants─ 73,013 total protein-coding transcripts─ 90.5% of V2.2 loci were mapped to V3.0 loci
Populus Genome Released
Tuskan et al. (2006) Science 196:726-737.

GWAS Population and SNP Detection
Agassiz, BC – Northern, Riparian
Clatskanie, OR – Coastal
Placerville, CA – Xeric
Corvallis, OR – Inland Valley
• 1084 unrelated genotypes clonally replicated in four contrasting environments
• Each genotype has been resequenced to a minimum 18X depth
• There are ca. 48 millions SNPs in the population, with a nucleotide variant every 10 bp
Slavov et al. (2012) New Phytologist 196:726-737.
Geraldes et al. (2013) Molecular Ecology Resources In press.

Variation in Lignin Composition and Content
Extreme variation contained in native populations of Populusdetected in common garden experiments are linked to genes using Association Genetics
Assemble a population
GWAS Analysis
Create a SNP library
Phenotype the population
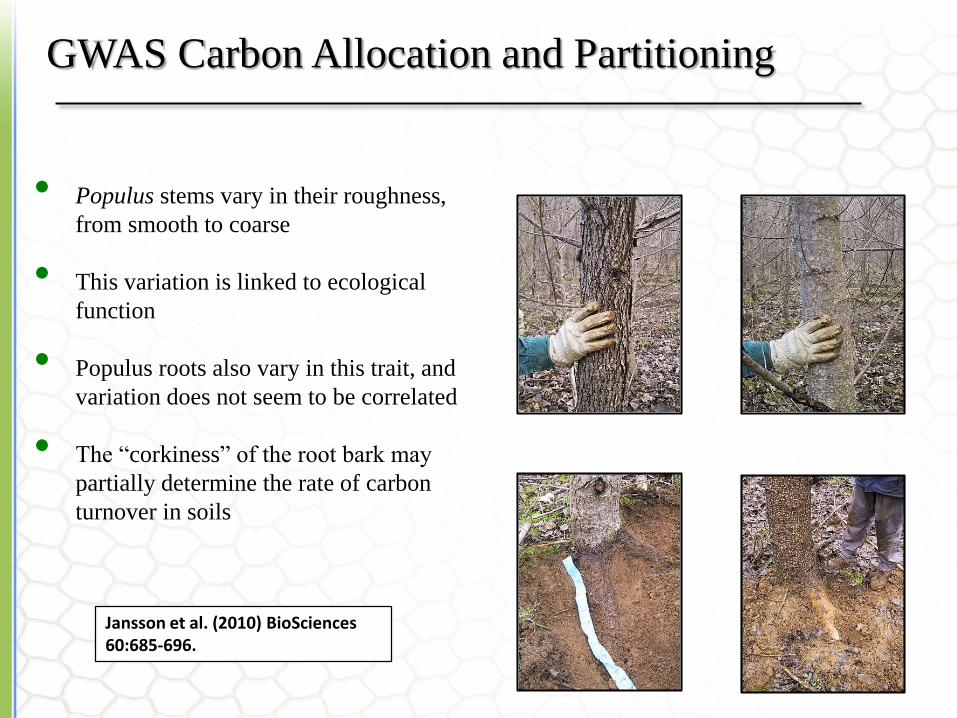
• Populus stems vary in their roughness,
from smooth to coarse
• This variation is linked to ecological
function
• Populus roots also vary in this trait, and
variation does not seem to be correlated
• The “corkiness” of the root bark may
partially determine the rate of carbon
turnover in soils
GWAS Carbon Allocation and Partitioning
Jansson et al. (2010) BioSciences 60:685-696.

GWAS Results for Carbon Allocation

GWAS Carbon Partitioning
BESC113
SQMB25-4
BESC416
BESC421
BESC269
Chr 6 [Potri.006G171200 - UDP-glucosyl transferase 78D2] (*confirms major mQTL)Chr 3 [Potri.003G049600 - Plant PDR ABC transporter associated]
trichocarpinene
trichocarpin
+ glucose
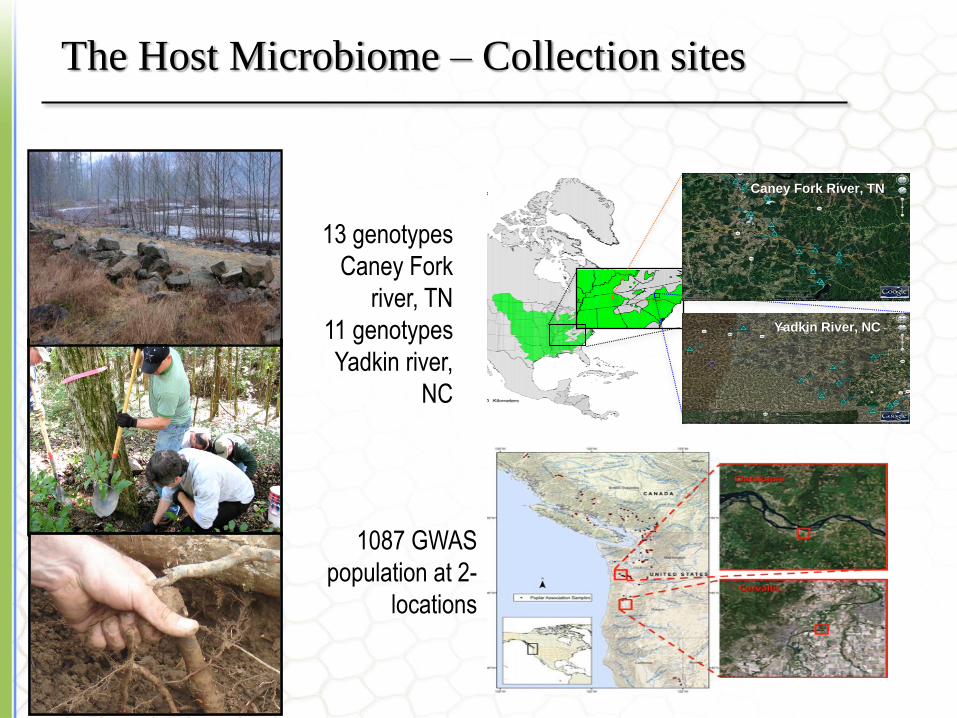
The Host Microbiome – Collection sites
Caney Fork River, TN
Yadkin River, NC
13 genotypes
Caney Fork
river, TN
11 genotypes
Yadkin river,
NC
1087 GWAS
population at 2-
locations
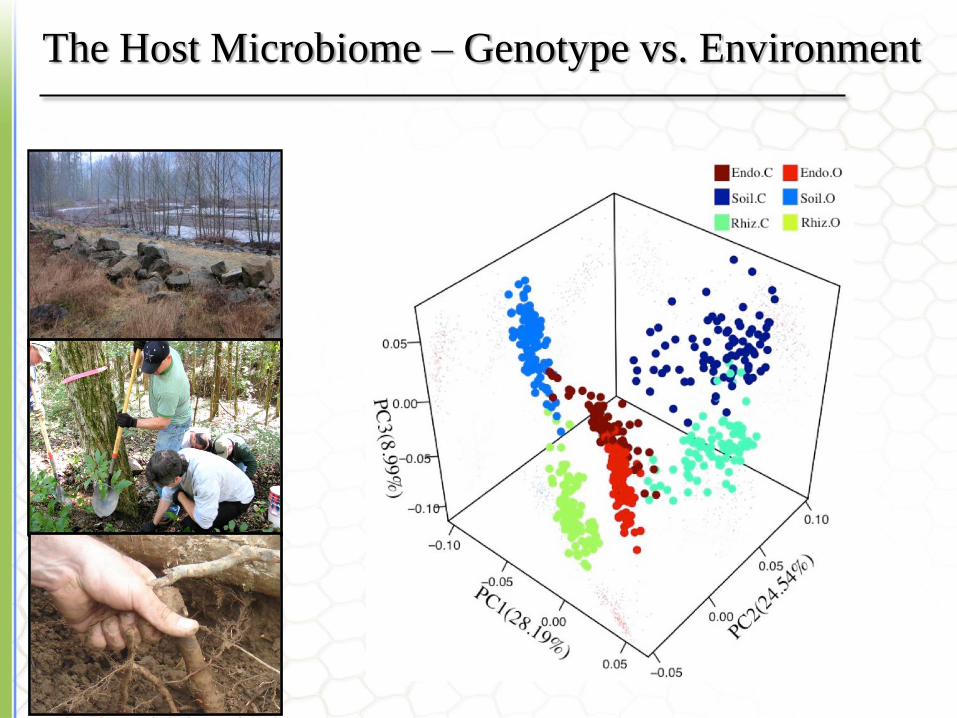
The Host Microbiome – Genotype vs. Environment
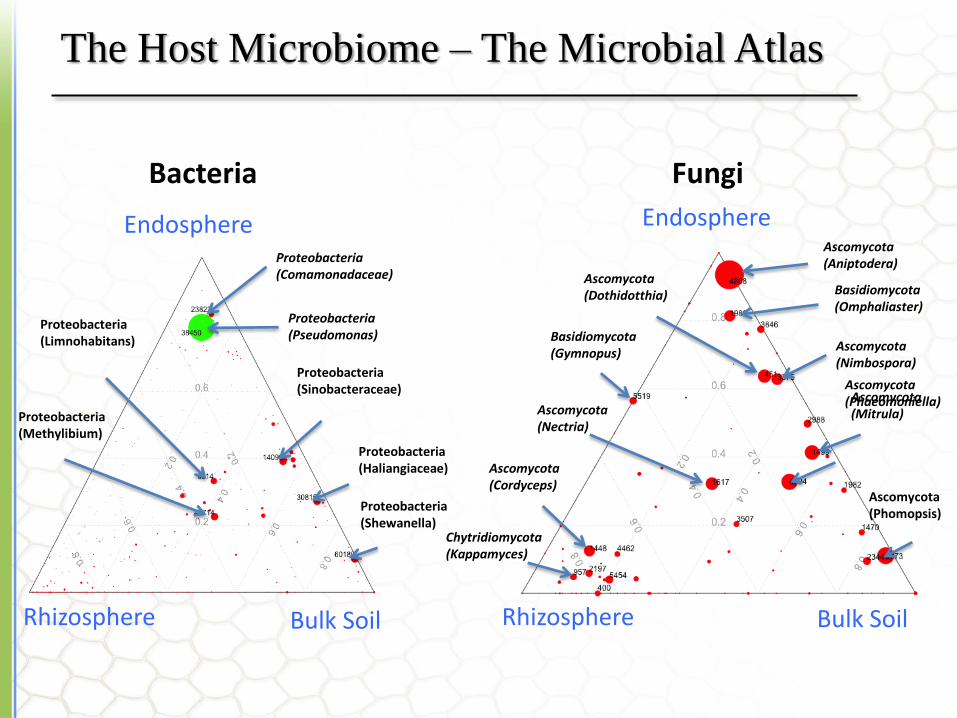
Rhizosphere Bulk Soil
Endosphere
Proteobacteria(Pseudomonas)
Proteobacteria(Sinobacteraceae)
Bacteria
Proteobacteria(Haliangiaceae)
Proteobacteria(Comamonadaceae)
Proteobacteria(Shewanella)
Proteobacteria(Limnohabitans)
Proteobacteria(Methylibium)
Ascomycota(Aniptodera)
Basidiomycota(Omphaliaster)
Ascomycota(Phomopsis)
Fungi
Rhizosphere Bulk Soil
Endosphere
Ascomycota(Dothidotthia)
Ascomycota(Nimbospora)
Basidiomycota(Gymnopus)
Ascomycota(Nectria)
Chytridiomycota(Kappamyces)
Ascomycota(Cordyceps)
Ascomycota(Phaeomoniella)Ascomycota(Mitrula)
The Host Microbiome – The Microbial Atlas

Phenolic Content Impacts Endophytes
• Used broad-spectrum GC-MS
profiling to identify candidate
genes controlling metabolite
production
• Developed an algorithm to
quantify ~430 peaks
• Identified pathways can be
targeted for the over-production of
metabolites of interest
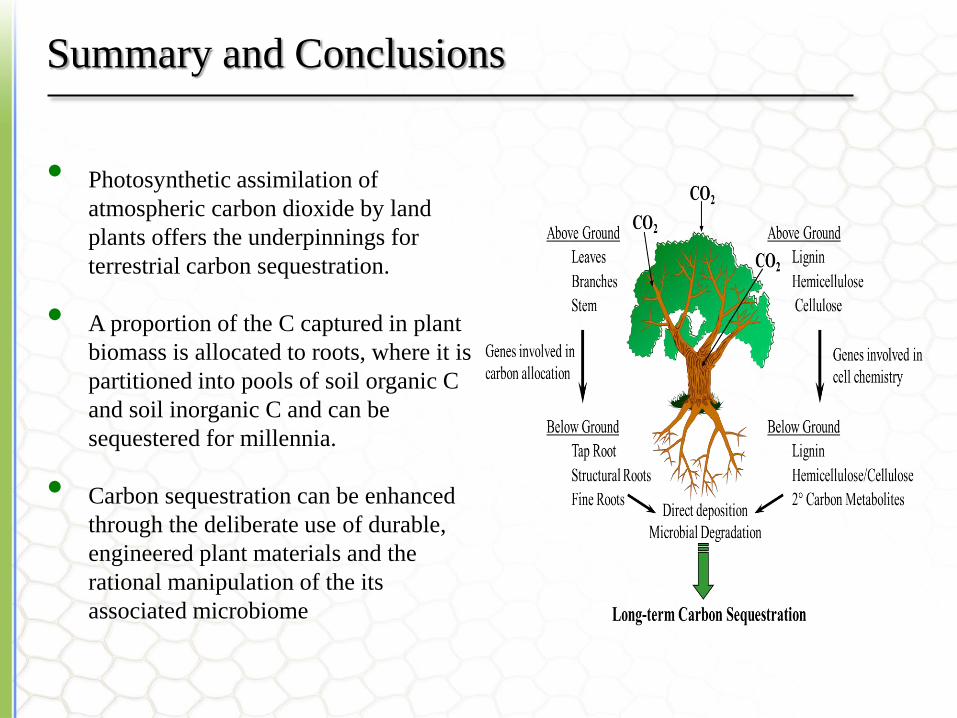
• Photosynthetic assimilation of
atmospheric carbon dioxide by land
plants offers the underpinnings for
terrestrial carbon sequestration.
• A proportion of the C captured in plant
biomass is allocated to roots, where it is
partitioned into pools of soil organic C
and soil inorganic C and can be
sequestered for millennia.
• Carbon sequestration can be enhanced
through the deliberate use of durable,
engineered plant materials and the
rational manipulation of the its
associated microbiome
Summary and Conclusions
Related Documents