RESEARCH Open Access The GENCODE pseudogene resource Baikang Pei 1† , Cristina Sisu 1,2† , Adam Frankish 3 , Cédric Howald 4 , Lukas Habegger 1 , Xinmeng Jasmine Mu 1 , Rachel Harte 5 , Suganthi Balasubramanian 1,2 , Andrea Tanzer 6 , Mark Diekhans 5 , Alexandre Reymond 4 , Tim J Hubbard 3 , Jennifer Harrow 3 and Mark B Gerstein 1,2,7* Abstract Background: Pseudogenes have long been considered as nonfunctional genomic sequences. However, recent evidence suggests that many of them might have some form of biological activity, and the possibility of functionality has increased interest in their accurate annotation and integration with functional genomics data. Results: As part of the GENCODE annotation of the human genome, we present the first genome-wide pseudogene assignment for protein-coding genes, based on both large-scale manual annotation and in silico pipelines. A key aspect of this coupled approach is that it allows us to identify pseudogenes in an unbiased fashion as well as untangle complex events through manual evaluation. We integrate the pseudogene annotations with the extensive ENCODE functional genomics information. In particular, we determine the expression level, transcription-factor and RNA polymerase II binding, and chromatin marks associated with each pseudogene. Based on their distribution, we develop simple statistical models for each type of activity, which we validate with large- scale RT-PCR-Seq experiments. Finally, we compare our pseudogenes with conservation and variation data from primate alignments and the 1000 Genomes project, producing lists of pseudogenes potentially under selection. Conclusions: At one extreme, some pseudogenes possess conventional characteristics of functionality; these may represent genes that have recently died. On the other hand, we find interesting patterns of partial activity, which may suggest that dead genes are being resurrected as functioning non-coding RNAs. The activity data of each pseudogene are stored in an associated resource, psiDR, which will be useful for the initial identification of potentially functional pseudogenes. Background Pseudogenes are defined as defunct genomic loci with sequence similarity to functional genes but lacking cod- ing potential due to the presence of disruptive muta- tions such as frame shifts and premature stop codons [1–4]. The functional paralogs of pseudogenes are often referred to as parent genes. Based on the mechanism of their creation, pseudogenes can be categorized into three large groups: (1) processed pseudogenes, created by retrotransposition of mRNA from functional protein- coding loci back into the genome; (2) duplicated (also referred to as unprocessed) pseudogenes, derived from duplication of functional genes; and (3) unitary pseudogenes, which arise through in situ mutations in previously functional protein-coding genes [1,4–6]. Different types of pseudogenes exhibit different geno- mic features. Duplicated pseudogenes have intron-exon- like genomic structures and may still maintain the upstream regulatory sequences of their parents. In con- trast, processed pseudogenes, having lost their introns, contain only exonic sequence and do not retain the upstream regulatory regions. Processed pseudogenes may preserve evidence of their insertion in the form of polyadenine features at their 3’ end. These features of processed pseudogenes are shared with other genomic elements commonly known as retrogenes [7]. However, retrogenes differ from pseudogenes in that they have intact coding frames and encode functional proteins [8]. The composition of different types of pseudogenes var- ies among organisms [9]. In the human genome, pro- cessed pseudogenes are the most abundant type due to * Correspondence: [email protected] † Contributed equally 1 Program in Computational Biology and Bioinformatics, Yale University, Bass 432, 266 Whitney Avenue, New Haven, CT 06520, USA Full list of author information is available at the end of the article Pei et al. Genome Biology 2012, 13:R51 http://genomebiology.com/2012/13/9/R51 © 2012 Pei et al.; licensee BioMed Central Ltd. This is an open access article distributed under the terms of the Creative Commons Attribution License (http://creativecommons.org/licenses/by/2.0), which permits unrestricted use, distribution, and reproduction in any medium, provided the original work is properly cited.

Welcome message from author
This document is posted to help you gain knowledge. Please leave a comment to let me know what you think about it! Share it to your friends and learn new things together.
Transcript

RESEARCH Open Access
The GENCODE pseudogene resourceBaikang Pei1†, Cristina Sisu1,2†, Adam Frankish3, Cédric Howald4, Lukas Habegger1, Xinmeng Jasmine Mu1,Rachel Harte5, Suganthi Balasubramanian1,2, Andrea Tanzer6, Mark Diekhans5, Alexandre Reymond4,Tim J Hubbard3, Jennifer Harrow3 and Mark B Gerstein1,2,7*
Abstract
Background: Pseudogenes have long been considered as nonfunctional genomic sequences. However, recentevidence suggests that many of them might have some form of biological activity, and the possibility offunctionality has increased interest in their accurate annotation and integration with functional genomics data.
Results: As part of the GENCODE annotation of the human genome, we present the first genome-widepseudogene assignment for protein-coding genes, based on both large-scale manual annotation and in silicopipelines. A key aspect of this coupled approach is that it allows us to identify pseudogenes in an unbiasedfashion as well as untangle complex events through manual evaluation. We integrate the pseudogene annotationswith the extensive ENCODE functional genomics information. In particular, we determine the expression level,transcription-factor and RNA polymerase II binding, and chromatin marks associated with each pseudogene. Basedon their distribution, we develop simple statistical models for each type of activity, which we validate with large-scale RT-PCR-Seq experiments. Finally, we compare our pseudogenes with conservation and variation data fromprimate alignments and the 1000 Genomes project, producing lists of pseudogenes potentially under selection.
Conclusions: At one extreme, some pseudogenes possess conventional characteristics of functionality; these mayrepresent genes that have recently died. On the other hand, we find interesting patterns of partial activity, whichmay suggest that dead genes are being resurrected as functioning non-coding RNAs. The activity data of eachpseudogene are stored in an associated resource, psiDR, which will be useful for the initial identification ofpotentially functional pseudogenes.
BackgroundPseudogenes are defined as defunct genomic loci withsequence similarity to functional genes but lacking cod-ing potential due to the presence of disruptive muta-tions such as frame shifts and premature stop codons[1–4]. The functional paralogs of pseudogenes are oftenreferred to as parent genes. Based on the mechanism oftheir creation, pseudogenes can be categorized intothree large groups: (1) processed pseudogenes, createdby retrotransposition of mRNA from functional protein-coding loci back into the genome; (2) duplicated (alsoreferred to as unprocessed) pseudogenes, derived fromduplication of functional genes; and (3) unitary
pseudogenes, which arise through in situ mutations inpreviously functional protein-coding genes [1,4–6].Different types of pseudogenes exhibit different geno-
mic features. Duplicated pseudogenes have intron-exon-like genomic structures and may still maintain theupstream regulatory sequences of their parents. In con-trast, processed pseudogenes, having lost their introns,contain only exonic sequence and do not retain theupstream regulatory regions. Processed pseudogenesmay preserve evidence of their insertion in the form ofpolyadenine features at their 3’ end. These features ofprocessed pseudogenes are shared with other genomicelements commonly known as retrogenes [7]. However,retrogenes differ from pseudogenes in that they haveintact coding frames and encode functional proteins [8].The composition of different types of pseudogenes var-ies among organisms [9]. In the human genome, pro-cessed pseudogenes are the most abundant type due to
* Correspondence: [email protected]† Contributed equally1Program in Computational Biology and Bioinformatics, Yale University, Bass432, 266 Whitney Avenue, New Haven, CT 06520, USAFull list of author information is available at the end of the article
Pei et al. Genome Biology 2012, 13:R51http://genomebiology.com/2012/13/9/R51
© 2012 Pei et al.; licensee BioMed Central Ltd. This is an open access article distributed under the terms of the Creative CommonsAttribution License (http://creativecommons.org/licenses/by/2.0), which permits unrestricted use, distribution, and reproduction inany medium, provided the original work is properly cited.

a burst of retrotranspositional activity [10] in the ances-tral primates 40 million years ago [11–13].Pseudogenes have long been considered as nonfunc-
tional genomic sequences. However, evidence of tran-scription and conservation of some pseudogenes led tothe speculation that they might be functional [14,15],and several estimates of the number of transcribed pseu-dogenes have been published in recent years [14,16,17].More recently, studies have shown that, in some cases,expressed pseudogenes can perform crucial regulatoryroles through their RNA products [18–21].Pseudogenes have been suggested to exhibit different
types of activity. Firstly, they can regulate the expressionof their parent gene by decreasing the mRNA stabilityof the functional gene through their over-expression. Agood example is the MYLKP1 pseudogene, which is up-regulated in cancer cells [22]. The transcription ofMYLKP1 creates a non-coding RNA (ncRNA) that inhi-bits the mRNA expression of its functional parent,MYLK. Moreover, studies in Drosophila and mouse haveshown that small interfering RNA (siRNA) derived fromprocessed pseudogenes can regulate gene expression bymeans of the RNA-interference pathway [19,20,23–25],thus acting as endogenous siRNAs. In addition, it hasalso been hypothesized that pseudogenes with highsequence homology to their parent genes can regulatetheir expression through the generation of anti-sensetranscripts. A recent study by Hawkins and Morris [26]has shown that knocking down a ncRNA antisense toan Oct4 pseudogene increases the expression of bothOct4 and its pseudogene. Finally, pseudogenes can com-pete with their parent genes for microRNA (miRNA)binding, thereby modulating the repression of the func-tional gene by its cognate miRNA. For example, thepseudogene of PTEN, a crucial tumor suppressor, regu-lates the expression of its parent gene following thismechanism [19]. The 3’ UTR of the transcript originat-ing from the pseudogene, PTENP1, acts as a decoy forthe miRNA that represses the parent gene. It has beensuggested that this could be a general mechanism ofregulation in cancer [27].While the above examples clearly illustrate that some
pseudogenes indeed have a functional role, the extent ofthis phenomenon is not clear. The large corpus of func-tional data from the ENCODE consortium provides uswith an opportunity to study pseudogene transcriptionand activity in a systematic and comprehensive manner.It is of interest to study whether these examples are justsporadic exceptions, or indeed represent a genericmechanism for gene regulation.As a part of the GENCODE project, which aims to
annotate all evidence-based human gene features withhigh accuracy [28,29], we carried out a comprehensiveand accurate pseudogene annotation for the entire
human genome. We combined automated pipelines andmanual curation into a production annotation workflow.This allowed us to precisely annotate pseudogene lociand create a consensus set of pseudogenes.We identified potential transcribed pseudogenes from
locus-specific transcription evidence (that is, EST andmRNA data) and high throughput sequencing data (forexample, RNA-Seq) [30]. Candidate transcribed pseudo-genes were assessed by large-scale RT-PCR-Seq. Theexperimental results can serve as a benchmark for com-putational models of pseudogene transcription. Finally,for each tissue tested, a list of transcribed pseudogeneswas obtained. The results indicate that pseudogene tran-scription is predominantly tissue-specific. Using thefunctional genomics data from the ENCODE consor-tium together with the pseudogene annotation, wefound that the transcribed pseudogenes tend to associatewith a more active chromatin state and maintain moreactive promoter regions, compared to their non-tran-scribed counterparts. Both the transcription and regula-tion of pseudogenes exhibit tissue specificity.Alongside ‘fully active’ pseudogenes, we also found
evidence for pseudogenes showing partial activity pat-terns. One hypothesis is that these pseudogenes are theresult of genomic elements in the process of either los-ing or gaining function. Thus, we consider pseudogenesshowing partial activity as products of ‘dying’ genes orundergoing a ‘resurrection’ process. Two well-knownexamples of ‘dying’ and ‘resurrected’ pseudogenes areACYL3 [31] and XIST [32], respectively. Partially activepseudogenes form an interesting group of case studiesfor the evolution and dynamics of function develop-ment. There can be different patterns of pseudogenepartial activity. For example, duplicated pseudogenesthat arise from ‘dying’ genes may lack transcriptionalevidence, but retain some of the upstream control ele-ments from their parents - for example, active transcrip-tion factor binding sites (TFBSs) and various levels ofchromatin activity. However, these genomic elementsmay no longer be evolutionarily constrained. Similarly,we can envision a scenario where processed pseudo-genes that do not have their parental upstream regula-tory sequences might gain functionality when they areinserted into a region of the genome favorable for tran-scription. Such pseudogenes may gain upstream regula-tory sequences and hence transcriptional potentialresulting in novel ncRNAs. The resurrection motif waspreviously used by Vinckenbosch et al. [7] and Kaess-mann et al. [33] to describe the transition of retrogenesto fully functional genes. The authors suggest that retro-genes ‘hitch-hike’ on the regulatory apparatus of nearbygenes in order to obtain transcription potential.All the pseudogene activity data generated by this
study are recorded in a pseudogene annotation resource
Pei et al. Genome Biology 2012, 13:R51http://genomebiology.com/2012/13/9/R51
Page 2 of 26

file where each pseudogene is ‘decorated’ with metadataregarding transcription status, functional genomicsinformation, and selection pressure derived from corre-sponding data. The annotation file is available online[34,35].
ResultsAssignment of pseudogenesGenome-wide pseudogene identificationThe annotation of all pseudogenes in the human refer-ence genome is part of the wider effort by the GEN-CODE consortium that also aims to identify all protein-coding, long non-coding RNA (lncRNA) and short RNAgenes [28,29]. Similar to the annotation of other func-tional classes, the annotation of pseudogenes containsmodels that have been created by the Human and Ver-tebrate Analysis and Annotation (HAVANA) team, anexpert manual annotation team at the Wellcome TrustSanger Institute. This is informed by, and checkedagainst, computational pseudogene predictions by thePseudoPipe [36] and RetroFinder [37] pipelines (detailsin Materials and methods). These computational pseu-dogene predictions provide hints to manual annotatorsduring the first-pass of annotation and identify potentialmissing features, flagging them for manual re-investiga-tion (Figure 1).A ‘level’ index is used to represent the supportive evi-
dence of each pseudogene from the annotation proce-dure. Level 1 indicates pseudogenes that have beenconfirmed by both manual and automatic annotationpipelines. Level 2 highlights elements that have beenannotated by manual inspection only. We also definelevel A as pseudogenes determined by automated anno-tation. This is represented as PseudoPipe-specific (A-P),RetroFinder-specific (A-R) and a ‘2-way’ consensus setderived from predictions of both pipelines (2-way).Table 1 gives a summary of the pseudogenes used inGENCODE v7 based on their annotation level.The pseudogenes are annotated with different biotypes
(for example, processed or duplicated) based on themechanism by which they arose and their evolutionaryhistories. The pseudogene biotypes are explained indetail in Table 2.The GENCODE protein-coding and pseudogene anno-
tation is completely integrated. Each potential pseudo-gene locus is investigated for protein-coding potential(and vice versa) and all loci are strictly described aseither protein-coding or pseudogenic, but never both(Figure S0 in Additional file 1). Protein-coding lociderived via retrotransposition may be misidentified asprocessed pseudogenes due to the structural differenceswhen compared to their parent loci (reviewed by Kaess-mann et al. [33]). However, we distinguish retrogenesfrom processed pseudogenes by careful manual
annotation (Table S0 in Additional file 1). For example,the retrotransposed protein-coding loci USP26, KLF14and PGK2 are all protein-coding biotypes in the GEN-CODE geneset.In this study, we focused on a pseudogene set com-
posed of manually annotated pseudogenes (a union oflevels 1 and 2). Polymorphic pseudogenes, which arecoding genes that are pseudogenic due to the presenceof a polymorphic premature stop codon in the referencegenome (GRCh37), were excluded from our study inorder to avoid the likelihood that they may have codingpotential in the cell lines and tissues studied by otherENCODE groups. We call these 11,216 pseudogenes the‘surveyed set’. The set contains 138 unitary pseudogenes.For the purpose of this paper, only the processed andduplicated pseudogenes will be discussed in detail.The workflow used to identify the pseudogenes in this
dataset is described in Figure 1. In addition to the11,216 pseudogenes, the ‘2-way’ consensus set derivedfrom the automated pipeline annotations includes anadditional 1,910 pseudogenes (including 3 level 1 poly-morphic pseudogenes). As manual annotation is done ina chromosome-by-chromosome fashion, it is not biasedrelative to any particular genomic feature. Thus, we feelthat our ‘surveyed set’ is the best representative of thetotal pseudogene complement in the genome.Pseudogene statisticsThe number of manually annotated pseudogenes in thehuman genome has grown along with the developmentof the GENCODE project. Figure 2 follows the variationof the total number of pseudogenes in the human gen-ome with the development of GENCODE annotationfrom v1 to v7. Over all the GENCODE releases, thetotal number of pseudogenes follows a linear growthrate. Extrapolating from this tendency, we estimate thatthe entire human genome contains approximately12,683 protein pseudogenes. Alternatively, using the cur-rent manually annotated pseudogenes as a benchmark,we can estimate the accuracy of the automated pipe-lines, and then extrapolate it to the whole genome.With this approach, we estimated that the number ofpseudogenes in the human genome is 14,112 (Figure 2).Details of both approaches are described in Materialsand methods.The estimated number of pseudogenes in this study is
smaller than that predicted from the pilot study, wherewe identified 201 pseudogenes in 1% of the human gen-ome. One reason is that the pilot study included biasedgenomic regions - there was a single region containing alarge cluster of olfactory receptor pseudogenes - and isnot representative of the entire human genome [16].These estimates are smaller than previous computa-tional analyses reported by Torrents et al. [11] andZhang et al. [38] that predicted the presence of 19,724
Pei et al. Genome Biology 2012, 13:R51http://genomebiology.com/2012/13/9/R51
Page 3 of 26

Figure 1 Pseudogene annotation flowchart. A flowchart to describe the GENCODE pseudogene annotation procedure and the incorporationof functional genomics data from the 1000 Genomes (1000G) project and ENCODE. This is an integrated procedure including manualannotation done by the HAVANA team and two automated prediction pipelines: PseudoPipe and RetroFinder. The loci that are annotated byboth PseudoPipe and RetroFinder are collected in a subset labeled as ‘2-way consensus’, which is further intersected with the manuallyannotated HAVANA pseudogenes. The intersection results in three subsets of pseudogenes. Level 1 pseudogenes are loci that have beenidentified by all three methods (PseudoPipe, RetroFinder and HAVANA). Level 2 pseudogenes are loci that have been discovered throughmanual curation and were not found by either automated pipeline. Delta 2-way contains pseudogenes that have been identified only bycomputational pipelines and were not validated by manual annotation. As a quality control exercise to determine completeness of pseudogeneannotation in chromosomes that have been manually annotated, 2-way consensus pseudogenes are analyzed by the HAVANA team to establishtheir validity and are included in the manually annotated pseudogene set if appropriate. The final set of pseudogenes is compared withfunctional genomics data from ENCODE and genomic variation data from the 1000 Genomes project.
Pei et al. Genome Biology 2012, 13:R51http://genomebiology.com/2012/13/9/R51
Page 4 of 26
and 19,293 pseudogenes, respectively. This is due toimprovement in the genome assembly and the geneannotation datasets. The number of genes annotated inthe genome has steadily dropped with the improvementin annotation [39]. Consequently, the total number ofpseudogenes decreased due to a smaller and more accu-rate number of parent proteins. Thus, spurious pseudo-gene annotations due to erroneous gene models are nolonger present in the current pseudogene dataset.Difficulties in pseudogene annotationThe hybrid approach of pseudogene identification com-bining manual and automated annotation allows us totake advantage of the strengths of both methods. Auto-mated pipelines for the detection of pseudogenes havesignificant strengths, such as fast speed, comprehensivecoverage and ability to detect weak homologies revealinghighly degraded or truncated pseudogenes. In addition,the pipelines can be combined with comparative analysisto highlight the evolutionary origin of pseudogenes (forexample, to determine whether a single exon pseudo-gene has arisen due to duplication or a de novo retro-transposition event). However, automated methods arelikely to introduce or propagate errors due to eithermis-annotation of parent loci or lack of a genome-widehigh-quality annotation of protein-coding genes. Thelatter fact probably accounts for the large number ofpseudogenes in the initial pipeline surveys.
One difficult case for pseudogene annotation is theidentification of partially spliced pseudogenes, derivedvia the retrotransposition of a transcript that retains atleast one intron for the parent locus. We have identifieda total of eight such partially processed pseudogenesthrough computational analysis followed by carefulmanual examination (Table S3 in Additional file 1).Manual intervention allows the assessment of the
validity of a protein-coding locus used as a parent by anautomated pseudogene prediction method. It is alsoessential in both identifying and elucidating thoseinstances where pseudogenes intersect with other tran-script biotypes, that is, protein-coding loci and lncRNAs,such as in the case of resurrected pseudogenes. Thesepseudogenes often require only relatively small changesin structure, like a single exon skip or shifted splicejunction, to restore coding potential and thus are chal-lenging to detect computationally. Several cases wherepseudogenes intersect with functional loci are discussedbelow.Pseudogene sequences used by other functional lociPseudogenes can contribute sequences to other loci,including coding exons, 5’ UTR, 3’ UTR and polyade-nine signals, via their insertion in either the sense orantisense orientation. Such loci range in complexityfrom simple cases where a single pseudogene is over-lapped by one transcript to instances of greater com-plexity where multiple pseudogenes are overlapped bymultiple transcripts, and transcriptional read-throughfrom proximal protein-coding and lncRNA loci (Figure3). For example, MST1P9 (Figure S1 in Additional file1), whose translation is supported by mass spectrometrydata, is a potential ‘resurrected’ pseudogene that hasgained a novel function and therefore has been re-anno-tated as a new protein-coding locus [29]. Another exam-ple is the PTEN pseudogene [19], which has beenresurrected as a functioning lncRNA that regulates itsparent locus via an intermediate pathway involvingshared miRNAs. In all these cases, good annotationhighlights the evolutionary history of pseudogene-
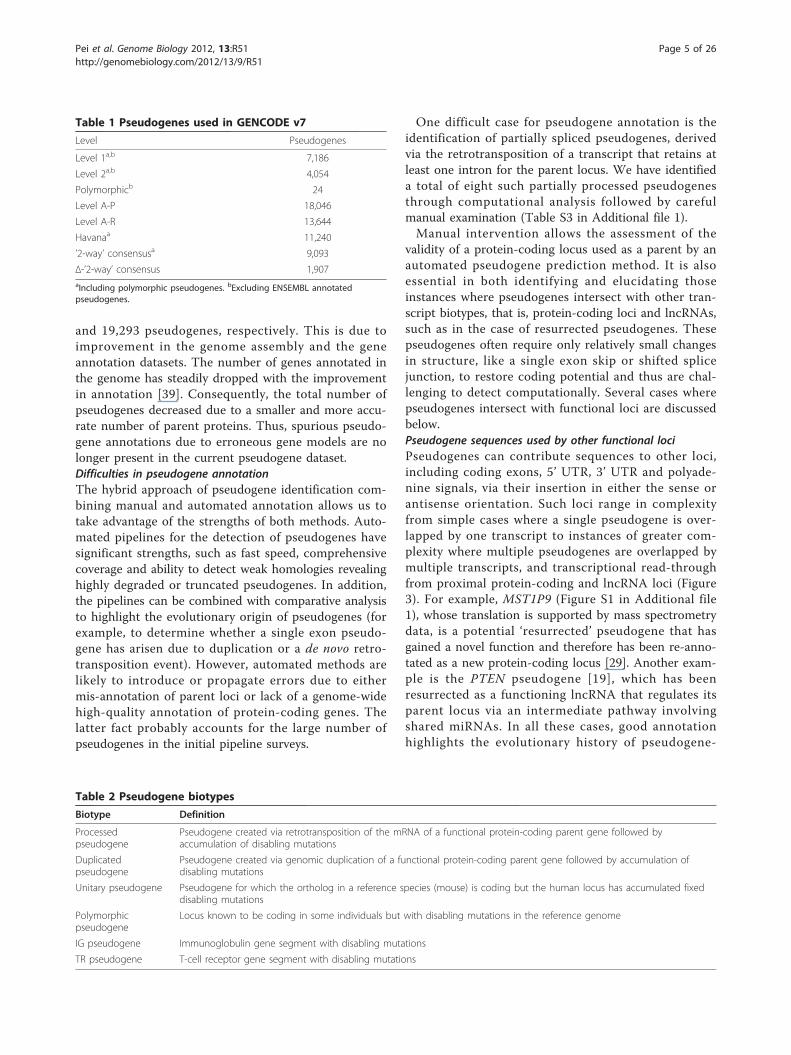
Table 1 Pseudogenes used in GENCODE v7
Level Pseudogenes
Level 1a,b 7,186
Level 2a,b 4,054
Polymorphicb 24
Level A-P 18,046
Level A-R 13,644
Havanaa 11,240
’2-way’ consensusa 9,093
Δ-’2-way’ consensus 1,907aIncluding polymorphic pseudogenes. bExcluding ENSEMBL annotatedpseudogenes.
Table 2 Pseudogene biotypes
Biotype Definition
Processedpseudogene
Pseudogene created via retrotransposition of the mRNA of a functional protein-coding parent gene followed byaccumulation of disabling mutations
Duplicatedpseudogene
Pseudogene created via genomic duplication of a functional protein-coding parent gene followed by accumulation ofdisabling mutations
Unitary pseudogene Pseudogene for which the ortholog in a reference species (mouse) is coding but the human locus has accumulated fixeddisabling mutations
Polymorphicpseudogene
Locus known to be coding in some individuals but with disabling mutations in the reference genome
IG pseudogene Immunoglobulin gene segment with disabling mutations
TR pseudogene T-cell receptor gene segment with disabling mutations
Pei et al. Genome Biology 2012, 13:R51http://genomebiology.com/2012/13/9/R51
Page 5 of 26

derived loci, which may give insight into any potentiallynew function.We manually examined 131 pseudogene models over-
lapping protein-coding genes. Within this set, 80 pseu-dogenes are annotated on the same strand as theprotein-coding gene, of which 52 are duplicated and 28are processed pseudogenes. Pseudogenes overlappingannotations on different strands comprise 20 duplicatedand 31 processed pseudogenes. All the pseudogenesoverlapping protein-coding genes fell into one of the fol-lowing categories (Figures S2 and S3 in Additional file1): (1) part of the pseudogene sequence is used to createa new alternatively spliced internal exon in the protein-coding gene (Figure S2a in Additional file 1); (2) thepseudogene sequence contributes the 5’ terminal exonof the protein-coding gene (Figure S2b in Additional file1); (3) the pseudogene sequence contributes the 3’ term-inal exon of the protein-coding gene (Figure S2c inAdditional file 1).The role of processed pseudogenes in the evolution of
protein-coding genes has already been described [37].Here we have found the same to be true for duplicatedpseudogenes. Further analysis is required to determinewhether the translation of the acquired exon is in thesame or different frame to the coding sequence of thepseudogene’s parent and to determine whether splicesites are shared between the overlapping genes.
Pseudogene Decoration Resource (psiDR)There is a large amount of information related topseudogene annotation that goes considerably beyondsimple genomic coordinates. To facilitate the study ofpseudogene activity, we have created a resource to‘decorate’ the pseudogene annotation with additionalinformation - the Pseudogene Decoration Resource
(psiDR). To create this resource, we consistently col-lected and organized a large variety of genomic infor-mation relating to each pseudogene in a consistentmanner, such as transcriptional activity, chromatin fea-tures, functional genomics and evolutionary constraint.As described in the following sections, various modelsand filters were applied to the corresponding data tocharacterize biological features of pseudogenes. Wecharacterized the transcriptional state of pseudogenesusing the integration of three pipelines. Furthermore,we used simple statistical models to partition the pseu-dogenes based on various genomic features. The distri-bution of functional genomics and selection signalswas compared between transcribed and non-tran-scribed pseudogenes. Finally, quantifiers were assignedto each pseudogene according to the output of themodel, such as whether it has an active chromatinstate, associates with active promoter regions, and soon. Tissue/cell line-specific information was recordedwherever applicable.Overall, psiDR provides a variety of activity informa-
tion for all the surveyed pseudogenes. It is a valuableresource for pseudogene activity studies that can providepotential targets for further experimental follow-up.Table 3 contains a detailed description of the pseudo-gene information featured in psiDR. In the followingsections, we describe each component in detail.
Parents of pseudogenesIdentification of pseudogene parentsWe refer to the functional paralog with the greatestsequence similarity to a pseudogene as its parent gene.Identifying pseudogene parents is critical for the studyof a pseudogene’s evolutionary history and its potentialregulatory functions. Currently, we have successfully
Figure 2 Growth of pseudogene annotation. The numbers of pseudogenes present in the GENCODE dataset from version 1 to version 7 areplotted. The three colors - purple, green and yellow - represent processed, duplicated and other types of pseudogenes, respectively. Thepseudogenes were annotated manually and/or using the automated pipelines PseudoPipe and RetroFinder. The gray bar indicates the estimatednumber of pseudogenes (± standard deviation present in the human genome.
Pei et al. Genome Biology 2012, 13:R51http://genomebiology.com/2012/13/9/R51
Page 6 of 26
identified parents for 9,368 pseudogenes, whereas theparents for the remaining 1,848 pseudogenes are stillambiguous and may require further manual annotation.It is important to note, however, that it is not alwayspossible to identify the true parent of a pseudogene withcertainty. For example, when a pseudogene is highlydegraded and is derived from a parent gene with highly
similar paralogs, or when the parent contains a com-monly found functional domain.The total number of parent genes for all the pseudo-
genes is 3,391. While most parents (2,071) have just onepseudogene, some of them are associated with a largenumber of pseudogenes, among which are ribosomalprotein L21 (RPL21; 143 pseudogenes) and
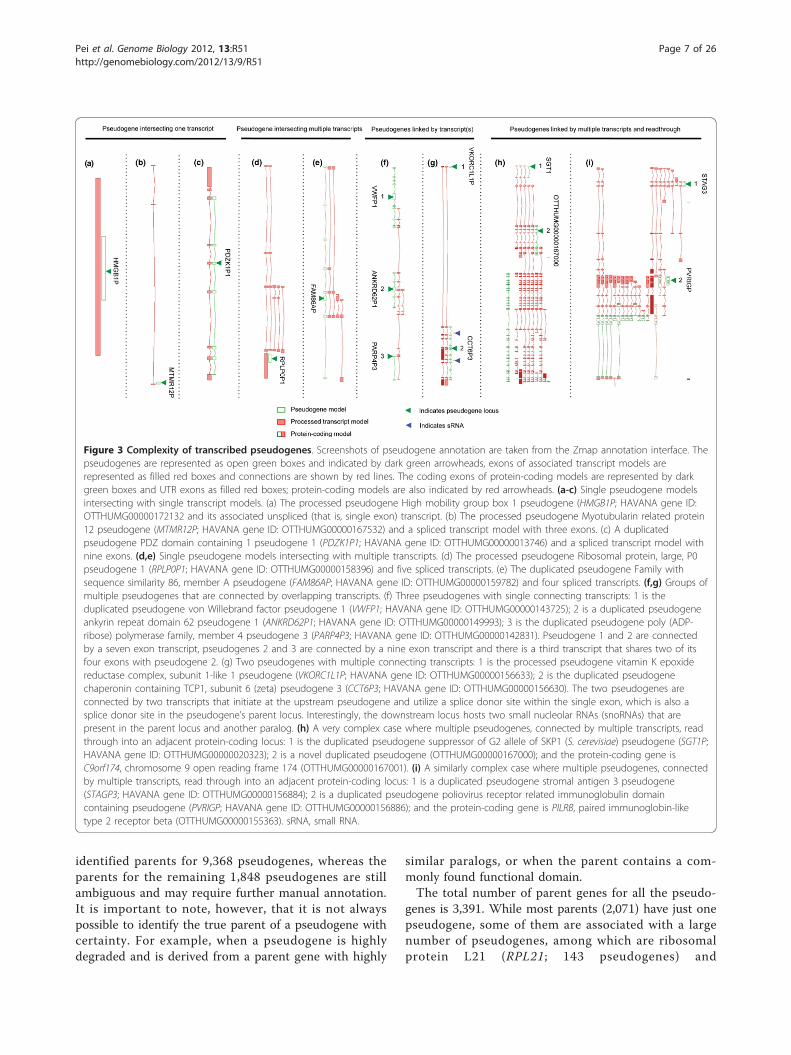
Figure 3 Complexity of transcribed pseudogenes. Screenshots of pseudogene annotation are taken from the Zmap annotation interface. Thepseudogenes are represented as open green boxes and indicated by dark green arrowheads, exons of associated transcript models arerepresented as filled red boxes and connections are shown by red lines. The coding exons of protein-coding models are represented by darkgreen boxes and UTR exons as filled red boxes; protein-coding models are also indicated by red arrowheads. (a-c) Single pseudogene modelsintersecting with single transcript models. (a) The processed pseudogene High mobility group box 1 pseudogene (HMGB1P; HAVANA gene ID:OTTHUMG00000172132 and its associated unspliced (that is, single exon) transcript. (b) The processed pseudogene Myotubularin related protein12 pseudogene (MTMR12P; HAVANA gene ID: OTTHUMG00000167532) and a spliced transcript model with three exons. (c) A duplicatedpseudogene PDZ domain containing 1 pseudogene 1 (PDZK1P1; HAVANA gene ID: OTTHUMG00000013746) and a spliced transcript model withnine exons. (d,e) Single pseudogene models intersecting with multiple transcripts. (d) The processed pseudogene Ribosomal protein, large, P0pseudogene 1 (RPLP0P1; HAVANA gene ID: OTTHUMG00000158396) and five spliced transcripts. (e) The duplicated pseudogene Family withsequence similarity 86, member A pseudogene (FAM86AP; HAVANA gene ID: OTTHUMG00000159782) and four spliced transcripts. (f,g) Groups ofmultiple pseudogenes that are connected by overlapping transcripts. (f) Three pseudogenes with single connecting transcripts: 1 is theduplicated pseudogene von Willebrand factor pseudogene 1 (VWFP1; HAVANA gene ID: OTTHUMG00000143725); 2 is a duplicated pseudogeneankyrin repeat domain 62 pseudogene 1 (ANKRD62P1; HAVANA gene ID: OTTHUMG00000149993); 3 is the duplicated pseudogene poly (ADP-ribose) polymerase family, member 4 pseudogene 3 (PARP4P3; HAVANA gene ID: OTTHUMG00000142831). Pseudogene 1 and 2 are connectedby a seven exon transcript, pseudogenes 2 and 3 are connected by a nine exon transcript and there is a third transcript that shares two of itsfour exons with pseudogene 2. (g) Two pseudogenes with multiple connecting transcripts: 1 is the processed pseudogene vitamin K epoxidereductase complex, subunit 1-like 1 pseudogene (VKORC1L1P; HAVANA gene ID: OTTHUMG00000156633); 2 is the duplicated pseudogenechaperonin containing TCP1, subunit 6 (zeta) pseudogene 3 (CCT6P3; HAVANA gene ID: OTTHUMG00000156630). The two pseudogenes areconnected by two transcripts that initiate at the upstream pseudogene and utilize a splice donor site within the single exon, which is also asplice donor site in the pseudogene’s parent locus. Interestingly, the downstream locus hosts two small nucleolar RNAs (snoRNAs) that arepresent in the parent locus and another paralog. (h) A very complex case where multiple pseudogenes, connected by multiple transcripts, readthrough into an adjacent protein-coding locus: 1 is the duplicated pseudogene suppressor of G2 allele of SKP1 (S. cerevisiae) pseudogene (SGT1P;HAVANA gene ID: OTTHUMG00000020323); 2 is a novel duplicated pseudogene (OTTHUMG00000167000); and the protein-coding gene isC9orf174, chromosome 9 open reading frame 174 (OTTHUMG00000167001). (i) A similarly complex case where multiple pseudogenes, connectedby multiple transcripts, read through into an adjacent protein-coding locus: 1 is a duplicated pseudogene stromal antigen 3 pseudogene(STAGP3; HAVANA gene ID: OTTHUMG00000156884); 2 is a duplicated pseudogene poliovirus receptor related immunoglobulin domaincontaining pseudogene (PVRIGP; HAVANA gene ID: OTTHUMG00000156886); and the protein-coding gene is PILRB, paired immunoglobin-liketype 2 receptor beta (OTTHUMG00000155363). sRNA, small RNA.
Pei et al. Genome Biology 2012, 13:R51http://genomebiology.com/2012/13/9/R51
Page 7 of 26

glyceraldehyde-3-phosphate dehydrogenase (GAPDH; 68pseudogenes). These results are consistent with previousstudies showing that housekeeping genes tend to havemore pseudogenes [13,40,41].Sequence identity to parent genesRecent studies have shown that some pseudogenes canregulate their parent genes’ activity at the transcriptlevel [19,20,23–25]. For example, the pseudogene tran-script sequence homologous to the parent may eitherhybridize with the parent mRNA to generate endogen-ous siRNAs or act as a decoy to buffer the binding of amiRNA to parent gene transcripts. Pseudogenes withsuch functionalities are expected to exhibit highsequence identity to their parent genes’ coding exonsand/or 3’ UTR sequences. Therefore, for each pseudo-gene, it is of interest to examine the sequence identityto its parent in these particular regions.We calculated sequence identity between pseudogenes
and their parents by examining the alignment of theirexon sequences (see Materials and methods). Processedand duplicated pseudogenes were shown, on average, tohave similar sequence identity to their parents’ codingsequences (CDSs), with mean identities of 80.3%(±13.2%) and 76.9% (±13.9%), respectively. However, thetwo classes of pseudogenes exhibit different sequenceidentity distribution patterns. Processed pseudogeneshave a unimodal distribution, with a specific groupshowing high sequence identity to their parents (around90%). Duplicated pseudogenes, in contrast, show a moreuniform distribution of sequence identities to their
parents’ CDSs (Figure 4a). These results are in accor-dance with previous data showing a burst of retrotran-sposition events in the recent evolutionary history of thehuman genome that generated a large number of youngprocessed pseudogenes [13,42,43]. The relatively highernumber of duplicated pseudogenes with low sequenceidentity (approximately 65%) to their parents can be anindication of a minor burst in the creation of duplicatedpseudogenes in ancient time. Both duplicated and pro-cessed pseudogenes show no significant difference insequence identity to the 3’ UTR of their parent genes.The mean sequence identity is 68.4% (±24.9%) for pro-cessed pseudogenes and 61.0% (±24.2%) for duplicatedpseudogenes. Both processed and duplicated pseudo-genes exhibit a bimodal distribution for the 3’ UTRsequence identity (Figure 4b), implying that the CDSand 3’ UTR of pseudogenes may be under different evo-lutionary constraints.We next compared the CDS and 3’ UTR sequence
identity of each pseudogene to its parent. While mostpseudogenes have comparable sequence identities to thetwo genomic regions, there are pseudogenes that exhibithigh sequence identity to the 3’ UTR but poor identityto CDS, or vice versa (Figure 4c). This inconsistencyimplies that mutations were rejected by natural selectionnon-randomly. Certain regions in the sequence may beunder higher evolutionary constraint than the others.We identified 998 pseudogenes showing a high (>80%)sequence identity to parent CDS and simultaneouslypoor (<60%) sequence identity to the 3’ UTR, and 36
Table 3 Fields for pseudogene features in the psiDR annotation file
Field Explanation psiDR value
Transcript ID Pseudogene ID from GENCODE annotation. Used for cross-referencing
Parent Protein ID, Gene ID, chromosome, start, end and strand. Detailed in section ’Parents ofpseudogenes’
Sequencesimilarity
The percentage of pseudogene sequence preserved from parent
Transcription Evidence for pseudogene transcription and validation results. May be tagged as EST, BodyMap,RT-PCR or None, which represent pseudogene expression evidence from corresponding datasources. Multiple tags are separated by commas. Detailed in section ’Transcription ofpseudogenes’
1, transcription; 0, otherwise
DNaseIhypersensitivity
A categorical result indicating whether the pseudogene has easily accessible chromatin,predicted by a model integrating DNaseI hypersensitivity values within 4 kb genomic regionsupstream and downstream of the 5’ end of pseudogenes. Detailed in section ’Chromatinsignatures of pseudogenes’
1, has Dnase hypersensitivity inupstream; 0, otherwise
Chromatinstate
Whether a pseudogene maintains an active chromatin state, as predicted by a model usingSegway segmentation. Detailed in section ’Chromatin signatures of pseudogenes’
1, active chromatin; 0, otherwise
Active Pol2*binding
Whether Pol2 binds to the upstream region of a pseudegene. Detailed in section ’Upstreamregulatory elements’
1, active binding site; 0, otherwise
Activepromoterregion
Whether there are active promoter regions in the upstream of pseudogenes. Detailed insection ’Upstream regulatory elements’
1, active binding site; 0, otherwise
Conservation Conservation of pseudogenes is derived from the divergence between human, chimp andmouse DNA sequences. Detailed in section ’Evolutionary constraint on pseudogenes’
1, conserved; 0, otherwise
*Pol2, RNA polymerase II.
Pei et al. Genome Biology 2012, 13:R51http://genomebiology.com/2012/13/9/R51
Page 8 of 26
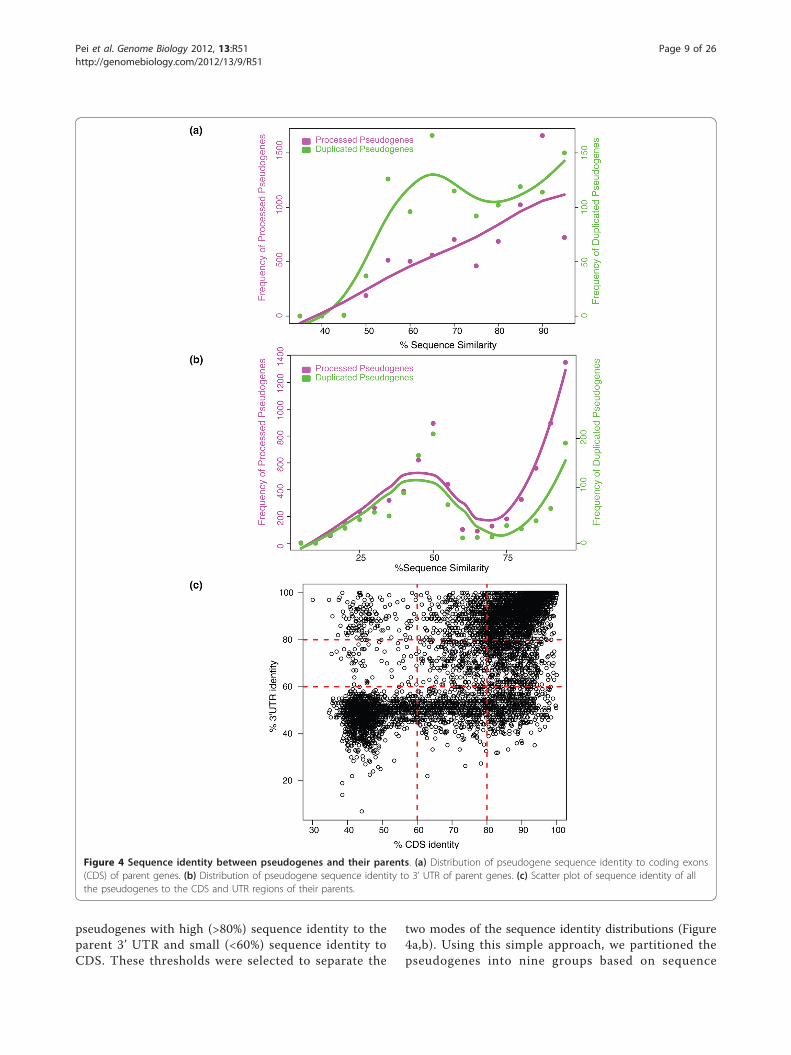
pseudogenes with high (>80%) sequence identity to theparent 3’ UTR and small (<60%) sequence identity toCDS. These thresholds were selected to separate the
two modes of the sequence identity distributions (Figure4a,b). Using this simple approach, we partitioned thepseudogenes into nine groups based on sequence
Figure 4 Sequence identity between pseudogenes and their parents. (a) Distribution of pseudogene sequence identity to coding exons(CDS) of parent genes. (b) Distribution of pseudogene sequence identity to 3’ UTR of parent genes. (c) Scatter plot of sequence identity of allthe pseudogenes to the CDS and UTR regions of their parents.
Pei et al. Genome Biology 2012, 13:R51http://genomebiology.com/2012/13/9/R51
Page 9 of 26

identity between the pseudogenes and the parent genesat CDS and 3’ UTR levels. Each pseudogene has a labelcorresponding to one of the nine classes, which isrecorded in psiDR.
Transcription of pseudogenesWe identified pseudogene transcription on a genome-wide scale by combining computational pipelines (Figure5a) and high-throughput wet-lab experiments. Tran-scribed pseudogenes were identified with computationalmodels, from which a selected group was then evaluatedexperimentally via RT-PCR-Seq techniques (Figure 5b).Pseudogene transcription identified by a sequence ofcomputational pipelinesThree computational pipelines were combined to iden-tify transcribed pseudogenes using various data sources;a pseudogene was considered transcribed and its statuswas recorded in psiDR if it passed the selection criteria
of at least one of the three (Figure 5a). Thus, 876 tran-scribed pseudogenes were identified that include 531processed and 345 duplicated ones. We consider this tobe a conservative estimate of the total number of tran-scribed pseudogenes, since each of the pipelines hadfairly stringent selection parameters. The three pipelinesare described as follows.The first pipeline examined manually annotated pseu-
dogenes with locus-specific transcription evidencederived from databases of ESTs and mRNAs [30]. Thelocus-specific transcription evidence consists of a best-in-genome alignment in the pseudogene locus and cleardifferences when compared to the parent locus. Usingthis approach, 422 pseudogenes were classified astranscribed.The second pipeline focused on the total RNA-Seq
data, which is available for only two ENCODE cell lines:GM12878 and K562. One advantage of using a total
Figure 5 Transcription of pseudogenes. (a) Pipeline for computational identification of transcribed pseudogenes (Pgenes). The ‘OR’ gate(binary operator) indicates the acceptance criteria for a candidate to enter the transcribed pseudogene pool. Expressed pseudogene candidatesshowing transcription evidence in ESTs/mRNAs, total RNA-Seq data, and BodyMap data were sent for wet-lab validation by RT-PCR or RT-PCR-Seq. (b) Process flow of experimental evaluation of pseudogene transcription. (c) User interface of PseudoSeq for identifying transcribedpseudogenes with BodyMap data. (d) Transcribed pseudogenes identified using Human BodyMap data. (e) Experimental validation resultsshowing the transcription of pseudogenes in different tissues.
Pei et al. Genome Biology 2012, 13:R51http://genomebiology.com/2012/13/9/R51
Page 10 of 26
RNA sample lies in its comprehensive inclusion of tran-scription products such as both mRNAs and smallRNAs. In this method, we considered a pseudogene astranscribed if one of the following two criteria was ful-filled: (1) there were reads mapped to the pseudogenesequence and no reads mapped to the parent; or (2)both the pseudogene and the parent were covered byreads but they had a low sequence similarity (<90%).Using this conservative approach, we identified 110transcribed pseudogenes.The third pipeline was targeted at pseudogenes show-
ing some transcriptional evidence but not fulfilling therequirements of the second selection pipeline. In thisapproach we used the PseudoSeq pipeline to analyze thedata from the Illumina Human BodyMap 2.0 project.PseudoSeq analyzed the expression patterns of a pseu-dogene and its parent gene using RNA-Seq data acrossmultiple tissues (Figure 5c). Pseudogenes with discor-dant expression patterns from those of the parent geneswere considered as transcribed. The potential of a map-ping artifact was ruled out by the difference in theirexpression patterns. Using this approach, we identified344 pseudogenes with transcription evidence (Figure5d).Experimental validationWe have experimentally tested the transcription evi-dence of 469 transcribed pseudogenes predicted bycomputational approaches (see Materials and methods).We used RT-PCR-Seq, a method that combines RT-PCR amplification with a highly multiplexed sequencingreadout, that reaches sensitivities of 92% and 79% forknown coding and non-coding transcripts, respectively[44].Targeted pseudogenes can be divided into three
classes: (1) multiexonic models in which we assessed anexon-exon junction between exons less than 90% identi-cal to the parent (and other duplicated pseudogenecopies); (2) monoexonic models where pseudogene-spe-cific primers could be designed (that is, primers areunable to amplify the parent gene because they map toregions possessing a large number of substitutionsbetween parent and pseudogene); and (3) monoexonicmodels, where it was not feasible to design specific pri-mers. Therefore, the resulting amplification of both par-ent and pseudogene transcripts must be discriminatedby substitutions present in the amplicon. As monoexo-nic models are sensitive to genomic DNA contamina-tion, they were assessed by amplification of cDNA inwhich a dNTP analog was incorporated as described in[45]. Each of these three categories was consideredexperimentally validated using different criteria (seeMaterials and methods) [44]. The criteria were adjustedto take advantage of the pseudogene-specific substitu-tions, as well as to consider the possibility that
sequencing reads mapping to the pseudogenes couldresult from co-amplified expressed parental genes. Wevalidated 7 out of 10 monoexonic pseudogenes targetedwith specific primers, and 333 out of 418 regular mono-exonic pseudogenes (Figure 5e). The validation did notreach 100%, probably due to fact that some pseudogeneswere not being transcribed in the eight tissues tested.Among the 82 multiexonic pseudogenes, only 18 were
experimentally confirmed (41 pseudogenes were alsotested with the monoexonic model). This lower valida-tion rate is explained by the fact that the transcribedpseudogenes probably function as lncRNAs rather thanbeing translated into proteins. Thus, it is probable thatmultiexon pseudogenes will not be spliced in identicalfashion to their parent proteins. This is consistent withthe results that among the 41 pseudogenes that weretested by both the multiexonic model and the monoexo-nic model, 4 were validated by both models, 35 werevalidated by the monoexonic model only, and 2 werenot validated by either model.The testis transcriptome showed the highest complex-
ity (highest percentage of validated expressed pseudo-gene models at 64% from all three classes combined),which is consistent with the high level of transcriptionreported in this tissue [44,46]. The expression patternsdetermined by RT-PCR-Seq are highly correlated withthe expression reported by RNA-Seq. For example, theexpression patterns of all the monoexonic pseudogenes,validated with specific primers, are fully replicated byRT-PCR-Seq.
Evolutionary constraint on pseudogenesBeyond transcription, we next focused on the evolution-ary constraint of human pseudogenes. Constraint ongenomic sequences has also been regarded as an indica-tor of biological function [15]. The availability of wholegenome sequencing data and personal genome sequen-cing data allowed us to carry out an evolutionary con-straint study on human pseudogenes at a genome-widescale from both divergence and diversity perspectives.Firstly, we analyzed the sequence preservation between
human pseudogenes and their orthologs in 15 differentorganisms ranging from chimpanzee to lizard, where theorthologs were derived from the multiple sequencealignments available from the University of California atSanta Cruz (UCSC) genome browser. Figure 6 shows foreach species the preservation rates of protein-codingsequences, duplicated pseudogenes and processed pseu-dogenes. While the preservation of duplicated pseudo-genes decreases gradually with the increase ofevolutionary distance of the species from human, thepreservation of processed pseudogenes exhibits anabrupt decrease from macaque to mouse and remainslow within the species more divergent than mouse.
Pei et al. Genome Biology 2012, 13:R51http://genomebiology.com/2012/13/9/R51
Page 11 of 26

These results are in agreement with previous findingsshowing that most processed pseudogenes in humansand mice are lineage-specific, arising from distinct retro-transposition bursts happening in the two organismsafter they diverged [13,41].Secondly, we studied the evolutionary selection on
human pseudogenes by integrating the annotation withthe variation data from the 1000 Genomes pilot project[47]. We computed the densities of SNPs, indels andstructural variations in pseudogene sequences and theirrespective derived allele frequencies. The densities sug-gested a weak signal for differential selection on tran-scribed versus non-transcribed pseudogenes (Figure S6in Additional file 1). However, no significant differenceswere found in the derived allele frequency spectra(DAF) (Figure 7), and it is possible that the difference inthe densities may be due to confounding factors such asvariation in mutation rates in the genome. Thus, we
cannot make a strong statement about selection in thehuman population on transcribed pseudogenes.Next we analyzed the pseudogenes’ divergence using
sequence identity to orthologs in the chimpanzee gen-ome, where higher sequence identity implies lowerdivergence and negative selection. The distribution ofpseudogenes’ divergence was calculated and the resultsindicate that a fraction of the pseudogenes exhibitinglower divergence are under evolutionary constraint (Fig-ure S5 in Additional file 1).Divergence and diversity results indicate that although
pseudogenes, as a group, are under low selection pres-sure, a small subset may exhibit higher evolutionaryconstraint. To identify these pseudogenes, we analyzedthe divergence to orthologs in the chimp and the mousegenome under the assumption that the conserved pseu-dogenes will show significantly lower divergence thanneutral background (see Materials and methods). There
Figure 6 Preservation of human coding sequences, processed pseudogenes and duplicated pseudogenes. Sequences orthologous tohuman genomic regions from different species were studied. The sequence preservation rate was calculated as the percentage of sequencesaligned to human sequence from each species. The calculation was based on a MultiZ multiple genome sequence alignment.
Figure 7 (a) SNP-, (b) indel-, and (c) SV-derived allele frequency spectra are shown for transcribed and non-transcribed pseudogenes.The distributions of variant DAFs in transcribed and non-transcribed pseudogenes are not statistically different.
Pei et al. Genome Biology 2012, 13:R51http://genomebiology.com/2012/13/9/R51
Page 12 of 26
are 1,019 conserved pseudogenes identified in thehuman genome. The conserved group is enriched withtranscribed pseudogenes (195 conserved pseudogenesare transcribed, P-value = 1.19 × 10⁻³⁵), strongly imply-ing biological function. Duplicated and processed pseu-dogenes are differentially conserved; 28.1% of duplicatedpseudogenes and 3.4% of processed pseudogenes areconserved. This difference is due to the fact that mostprocessed pseudogenes are lineage-specific, and also thatmost of them are dead on arrival. Evolutionary con-straint information of all the pseudogenes is collected inthe psiDR.
Chromatin signatures of pseudogenesFollowing the study of the canonical signatures of tran-scription and selection of pseudogenes, we focused onthe more elusive indications of ‘partial activity’ - chro-matin marks and upstream transcription factor binding.In particular, we intersected the annotated pseudogenelocations in the human genome with the extensiveamount of functional genomics data from the ENCODEproduction project. We were able to correlate theseresults with the transcription and conservation informa-tion of pseudogenes discussed previously, to identifypseudogene cases consistent with partial activity.In this section, we present the results pertaining to
chromatin state. Chromatin accessibility, histone modifi-cation and genome-wide segmentation pattern onENCODE cell lines were studied and results for theK562 cell line are described and shown here as anexample.Chromatin accessibility and histone marks of pseudogenesWe compared the chromatin accessibility around thetranscription start site (TSS) for active coding genes,transcribed and non-transcribed pseudogenes. DNaseIhypersensitivity signals along 8 kb regions surroundingthe TSSs were averaged across all the genomicsequences in each of the three different groups. Tran-scribed pseudogenes show enhanced DNaseI hypersensi-tivity compared to non-transcribed pseudogenes onaverage, although, as expected, both signal profiles werelower than that for the coding genes (Figure 8).A series of histone marks was also analyzed in the
same manner as for the chromatin accessibility (Figure8). In general, we found that the transcribed pseudo-genes show more enhanced signals for active histonemarks such as H3K4me1 and H3K4me3 than the non-transcribed pseudogenes, while they show little differ-ence between the signals for repressive histone marks,such as H3K27me3. Our results show that, on average,the transcribed pseudogenes possess more transcrip-tional potential than non-transcribed ones, and theirregulation mechanism may be similar to that of protein-coding genes.
Chromatin state segmentationThere is a large variety of chromatin marks available.Therefore, we decided to use the chromatin states as ahigher level feature in order to summarize all thesedescriptors. The chromatin states were assessed using theSegway segmentation pattern as defined by [48]. Segwayannotates the genome using 25 different labels (Table S1in Additional file 1) representing active and repressivemarks. The genome-wide distribution of the segmentsshows a higher density of repressive markers compared tothose indicating transcriptional activity. We analyzed thefrequency of Segway markers for transcribed and non-transcribed pseudogenes, and their respective parent genes(Figure 9). We note that the non-transcribed pseudogenesshow a depletion of TSS marks compared to transcribedpseudogenes, but enrichment in repressive marks. Theseresults are in accordance with the trends noted earlier forhistone modifications and chromatin accessibility.The pattern of a high frequency of TSSs and gene body
marks exhibited by the parent gene was considered a hall-mark of active chromatin. Based on this observation, wedeveloped a model using two selection criteria to pinpointpseudogenes with active chromatin states: (1) the fre-quency of the TSS is three times higher than the frequencyof any repressive markers; (2) the gene body start (GS),gene body middle (GM) and gene body end (GE) frequen-cies are two times larger than the frequency of the repres-sive markers. The selection criteria were chosen to matchthe segmentation behavior of the active genes. We identi-fied 915 pseudogenes with active chromatin (92 using thefirst selection criterion and 823 using the second criterion)in the K562 cell line. Examples of pseudogenes with activechromatin states are shown in Figure 10. The pseudogenesselected using the above criteria are indicated in the psiDRfor each cell line analyzed.
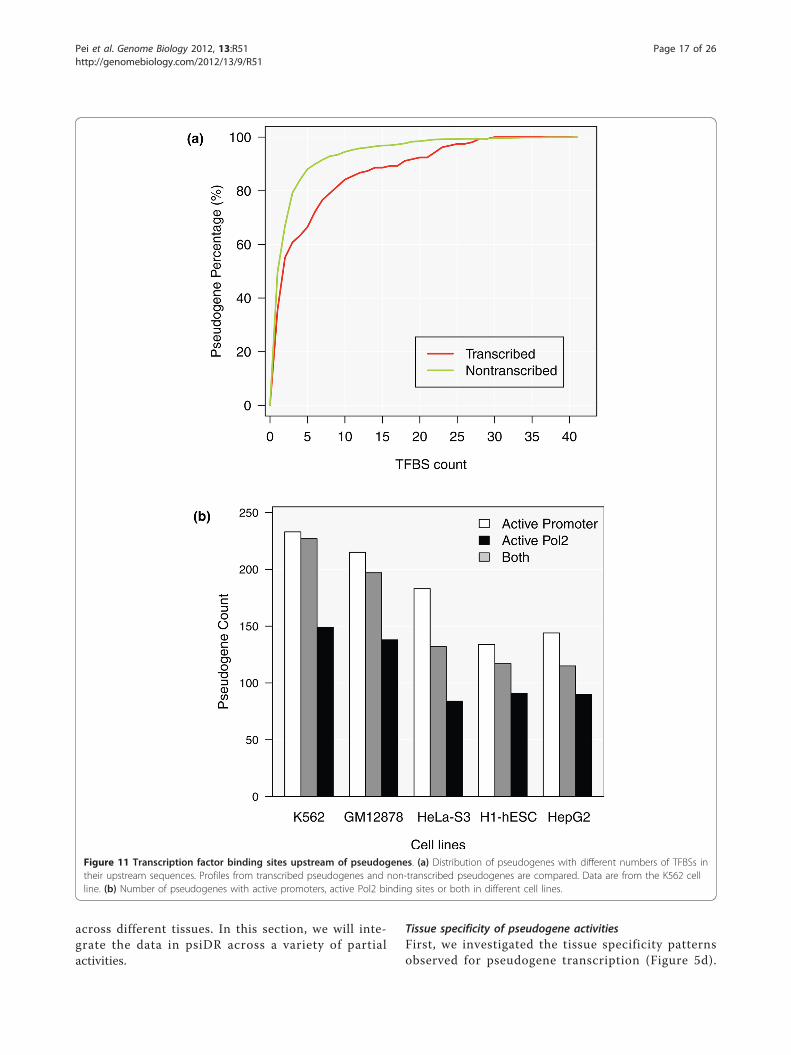
Upstream regulatory elementsGiven the importance of transcription in understandingpseudogene function and biological behavior, we focusedour next analysis on the regulatory elements present inthe upstream sequences of pseudogenes. More specifi-cally, we investigated TFBSs, active RNA polymerase II(Pol2) binding sites and the active promoters of pseudo-genes. All the information regarding the upstream regu-latory elements of each pseudogene is recorded in psiDR.Identification of transcription factor binding sitesWe examined the TFBSs located in the upstreamregions of all pseudogenes. A large fraction of pseudo-genes contain no TFBSs in their upstream sequences(that is, 91.0%, 86.7%, 92.0%, 92.7% and 86.7% inGm12878, K562, Helas3, H1-hesc and Hepg2 cell lines,respectively). This is consistent with the previous resultsshowing most pseudogenes are not transcribed and haveunfavorable chromatin structures.
Pei et al. Genome Biology 2012, 13:R51http://genomebiology.com/2012/13/9/R51
Page 13 of 26

Figure 8 Chromatin signatures: DNaseI hypersensitivity and histone modification. Average chromatin accessibility profiles and varioushistone modifications surrounding the TSS for coding genes, transcribed pseudogenes, and non-transcribed pseudogenes. The coding genehistone modification profiles around the TSS follow known patterns - for example, enrichment of H3K4me1 around 1 kb upstream of the TSSand the H3K4me3 peaks close to the TSS [63]. Transcribed pseudogenes also show stronger H3K4 signals than non-transcribed pseudogenes.H3K27me3, a marker commonly associated with gene repression [64], showed depletion around the TSS for the coding gene and a distinctivepeak in the same region for the pseudogenes. H3K36me3 also shows a similar pattern as H3K27me3 at TSSs, which may relate to nucleosomedepletion.
Pei et al. Genome Biology 2012, 13:R51http://genomebiology.com/2012/13/9/R51
Page 14 of 26

Transcription factors that bind to the upstreamregions of transcribed and non-transcribed pseudogeneswere examined. Compared to the non-transcribed pseu-dogenes, the transcribed pseudogenes tend to have moreTFBSs in the K562 cell line, although in both groups,the majority of pseudogenes contain no or very few (oneor two) binding sites in their upstream regions (Figure11). The difference between the number of TFBSs in thetranscribed and non-transcribed pseudogenes is smallbut statistically significant (Wilcoxon rank-sum test, P-value = 3.8 × 10⁻³ in K562). Similar results can be seenin the other four cell lines (Figure S7 in Additional file1).Pol2 binding sitesPseudogenes were also examined in each cell line forpotential Pol2 binding sites in their upstream sequences.To alleviate the potential mapping artifacts from theChIP-Seq analysis, we applied a filter on Pol2 binding
peaks to retain only the strong signals (see Materialsand methods). Three selection criteria were used toidentify pseudogenes with active Pol2 signals: (1) thewidth of a Pol2 binding peak is larger than the top 5%of all Pol2 peak widths across the ENCODE cell lines -the threshold based on ENCODE 2011 January freezedata is 519 bp; (2) the signal value of a Pol2 bindingpeak is larger than the top 5% of all Pol2 signal valuesacross all the studied ENCODE cell lines - the thresholdbased on ENCODE 2011 January freeze data is 2.38; (3)at least one of the Pol2 cofactors included in theENCODE project (Taf1, Taf7, Tbp, Nelfe, Gtf2f1, Gtf2band Ccnt2) also binds to the upstream sequence of thepseudogene being studied.A pseudogene that satisfied criteria 1 and 2 or satis-
fied criterion 3 was considered to have active Pol2 bind-ing sites. In the K562, Gm12878, Helas3, H1hesc andHepg2 cell lines, 227, 197, 132, 117 and 115
Figure 9 Segmentation: comparison of chromatin segmentations associated with pseudogenes and parent genes. The transcribedpseudogenes were selected based on the following criteria: there is transcription evidence from GENCODE, BodyMap or mass spectrometrystudies; there is no known overlap with annotated coding genes; and there are no neighboring protein-coding gene TSSs 4 kb upstream ordownstream of the pseudogene start.
Pei et al. Genome Biology 2012, 13:R51http://genomebiology.com/2012/13/9/R51
Page 15 of 26

pseudogenes, respectively, have been shown to haveactive Pol2 binding sites. Active Pol2 binding sites weresignificantly enriched in the transcribed pseudogenes,where the P-values were 1.95 × 10⁻⁹ (K562), 3.57 × 10⁻¹³
(Gm12878), 7.38 × 10⁻¹² (Helas3), 3.24 × 10⁻¹⁰ (H1hesc)and 1.96 × 10⁻¹⁰ (Hepg2).Active promoters for pseudogenesWe used the random forest model developed by Yip etal. [49] to predict active promoter regions for all thepseudogenes in each cell line. The objective of thismodel is to capture general properties of genomicregions, such as regulatory modules, by integratingapproximately 500 ChIP-Seq experiments for more than100 transcription and related factors. It calculates thelikelihood of a region being an active promoter basedon the chromatin accessibility data (from both DNase Ihypersensitivity and FAIRE (formaldehyde-assisted
isolation of regulatory elements) experiments), histonemodifications, transcription factor binding, and conser-vation [49]. By intersecting the resultant set of activepromoters from the model with pseudogene upstreamsequences, we found that 233, 215, 183, 134, and 144pseudogenes from K562, Gm12878, Helas3, H1hesc, andHegp2 cell lines, respectively, possess active promoters.In all the cell lines, active promoters were significantlyenriched in the transcribed pseudogenes, where the P-values were 1.19 × 10⁻⁵ (K562), 1.95 × 10⁻¹² (Gm12878),4.45 × 10-10 (Helas3), 1.22 × 10⁻¹¹ (H1hesc) and 7.20 ×10⁻¹² (Hepg2).
Data integration in psiDRAs shown in the previous sections, pseudogenes main-tain diversified and complicated activity patterns, andthe same pseudogene may exhibit different activities
Figure 10 Examples of pseudogenes with active chromatin states. (a) Processed pseudogenes (Ensembl gene ID: ENST00000495909;genomic location chr5: 90650295-90650751). This pseudogene shows marks of activity based on segmentation-activity selection criterion 2. (b)Transcribed duplicated pseudogene (Ensembl gene ID: ENST00000412397.1; genomic location chr1: 998456-1004735). This pseudogene showsmarks of activity based on segmentation-activity selection criterion 1.
Pei et al. Genome Biology 2012, 13:R51http://genomebiology.com/2012/13/9/R51
Page 16 of 26
across different tissues. In this section, we will inte-grate the data in psiDR across a variety of partialactivities.
Tissue specificity of pseudogene activitiesFirst, we investigated the tissue specificity patternsobserved for pseudogene transcription (Figure 5d).
Figure 11 Transcription factor binding sites upstream of pseudogenes. (a) Distribution of pseudogenes with different numbers of TFBSs intheir upstream sequences. Profiles from transcribed pseudogenes and non-transcribed pseudogenes are compared. Data are from the K562 cellline. (b) Number of pseudogenes with active promoters, active Pol2 binding sites or both in different cell lines.
Pei et al. Genome Biology 2012, 13:R51http://genomebiology.com/2012/13/9/R51
Page 17 of 26
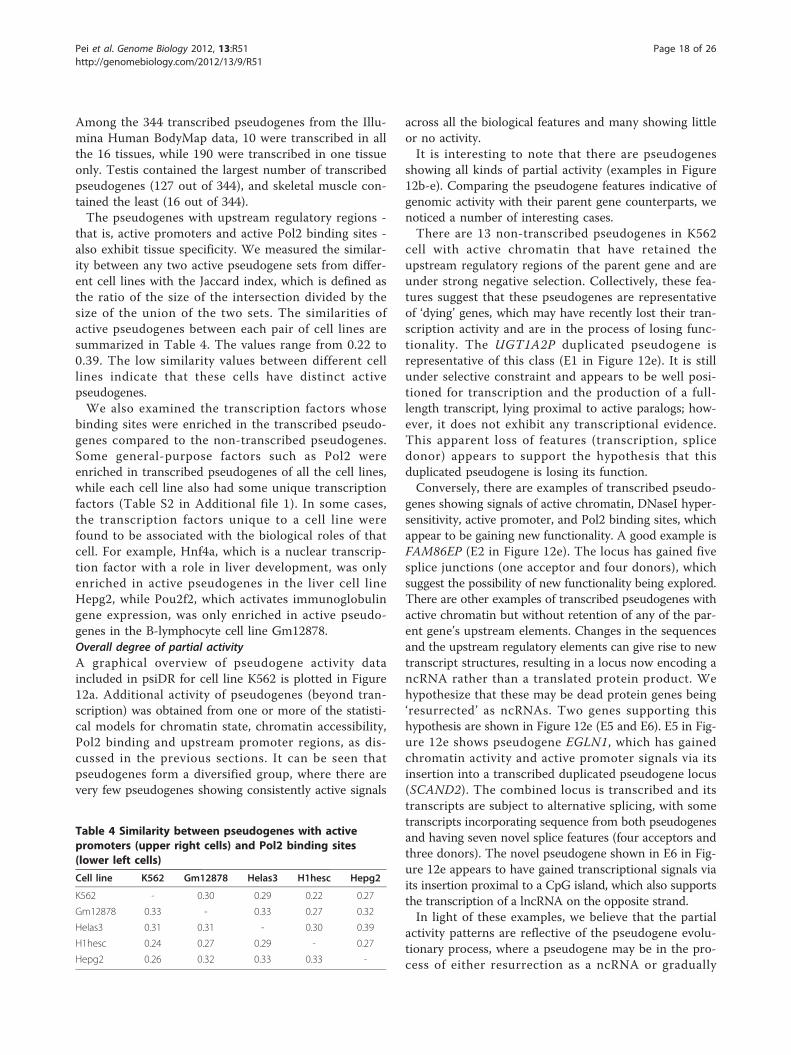
Among the 344 transcribed pseudogenes from the Illu-mina Human BodyMap data, 10 were transcribed in allthe 16 tissues, while 190 were transcribed in one tissueonly. Testis contained the largest number of transcribedpseudogenes (127 out of 344), and skeletal muscle con-tained the least (16 out of 344).The pseudogenes with upstream regulatory regions -
that is, active promoters and active Pol2 binding sites -also exhibit tissue specificity. We measured the similar-ity between any two active pseudogene sets from differ-ent cell lines with the Jaccard index, which is defined asthe ratio of the size of the intersection divided by thesize of the union of the two sets. The similarities ofactive pseudogenes between each pair of cell lines aresummarized in Table 4. The values range from 0.22 to0.39. The low similarity values between different celllines indicate that these cells have distinct activepseudogenes.We also examined the transcription factors whose
binding sites were enriched in the transcribed pseudo-genes compared to the non-transcribed pseudogenes.Some general-purpose factors such as Pol2 wereenriched in transcribed pseudogenes of all the cell lines,while each cell line also had some unique transcriptionfactors (Table S2 in Additional file 1). In some cases,the transcription factors unique to a cell line werefound to be associated with the biological roles of thatcell. For example, Hnf4a, which is a nuclear transcrip-tion factor with a role in liver development, was onlyenriched in active pseudogenes in the liver cell lineHepg2, while Pou2f2, which activates immunoglobulingene expression, was only enriched in active pseudo-genes in the B-lymphocyte cell line Gm12878.Overall degree of partial activityA graphical overview of pseudogene activity dataincluded in psiDR for cell line K562 is plotted in Figure12a. Additional activity of pseudogenes (beyond tran-scription) was obtained from one or more of the statisti-cal models for chromatin state, chromatin accessibility,Pol2 binding and upstream promoter regions, as dis-cussed in the previous sections. It can be seen thatpseudogenes form a diversified group, where there arevery few pseudogenes showing consistently active signals
across all the biological features and many showing littleor no activity.It is interesting to note that there are pseudogenes
showing all kinds of partial activity (examples in Figure12b-e). Comparing the pseudogene features indicative ofgenomic activity with their parent gene counterparts, wenoticed a number of interesting cases.There are 13 non-transcribed pseudogenes in K562
cell with active chromatin that have retained theupstream regulatory regions of the parent gene and areunder strong negative selection. Collectively, these fea-tures suggest that these pseudogenes are representativeof ‘dying’ genes, which may have recently lost their tran-scription activity and are in the process of losing func-tionality. The UGT1A2P duplicated pseudogene isrepresentative of this class (E1 in Figure 12e). It is stillunder selective constraint and appears to be well posi-tioned for transcription and the production of a full-length transcript, lying proximal to active paralogs; how-ever, it does not exhibit any transcriptional evidence.This apparent loss of features (transcription, splicedonor) appears to support the hypothesis that thisduplicated pseudogene is losing its function.Conversely, there are examples of transcribed pseudo-
genes showing signals of active chromatin, DNaseI hyper-sensitivity, active promoter, and Pol2 binding sites, whichappear to be gaining new functionality. A good example isFAM86EP (E2 in Figure 12e). The locus has gained fivesplice junctions (one acceptor and four donors), whichsuggest the possibility of new functionality being explored.There are other examples of transcribed pseudogenes withactive chromatin but without retention of any of the par-ent gene’s upstream elements. Changes in the sequencesand the upstream regulatory elements can give rise to newtranscript structures, resulting in a locus now encoding ancRNA rather than a translated protein product. Wehypothesize that these may be dead protein genes being‘resurrected’ as ncRNAs. Two genes supporting thishypothesis are shown in Figure 12e (E5 and E6). E5 in Fig-ure 12e shows pseudogene EGLN1, which has gainedchromatin activity and active promoter signals via itsinsertion into a transcribed duplicated pseudogene locus(SCAND2). The combined locus is transcribed and itstranscripts are subject to alternative splicing, with sometranscripts incorporating sequence from both pseudogenesand having seven novel splice features (four acceptors andthree donors). The novel pseudogene shown in E6 in Fig-ure 12e appears to have gained transcriptional signals viaits insertion proximal to a CpG island, which also supportsthe transcription of a lncRNA on the opposite strand.In light of these examples, we believe that the partial
activity patterns are reflective of the pseudogene evolu-tionary process, where a pseudogene may be in the pro-cess of either resurrection as a ncRNA or gradually
Table 4 Similarity between pseudogenes with activepromoters (upper right cells) and Pol2 binding sites(lower left cells)
Cell line K562 Gm12878 Helas3 H1hesc Hepg2
K562 - 0.30 0.29 0.22 0.27
Gm12878 0.33 - 0.33 0.27 0.32
Helas3 0.31 0.31 - 0.30 0.39
H1hesc 0.24 0.27 0.29 - 0.27
Hepg2 0.26 0.32 0.33 0.33 -
Pei et al. Genome Biology 2012, 13:R51http://genomebiology.com/2012/13/9/R51
Page 18 of 26

losing its functionality. Understanding why pseudogenesshow partial activity may shed light on pseudogene evo-lution and function.
DiscussionPseudogene annotationIn this study, we describe a set of human pseudogenesat the genome-wide scale. The pseudogene dataset iscreated by manual annotation with the assistance of
computational pipelines. The surveyed set of 11,216consensus pseudogenes is the first comprehensive effortof manual annotation of human pseudogenes at thewhole genome level.
Pseudogenes and their parentsWe combined manual annotation and sequence identitydata to identify parent genes for approximately 86% ofpseudogenes (9,636 out of 11,216). The numbers of
Figure 12 Summary of pseudogene annotation and case studies. (a) A heatmap showing the annotation for transcribed pseudogenesincluding active chromatin segmentation, DNaseI hypersensitivity, active promoter, active Pol2, and conserved sequences. Raw data were fromthe K562 cell line. (b) A transcribed duplicated pseudogene (Ensembl gene ID: ENST00000434500.1; genomic location, chr7: 65216129-65228323)showing consistent active chromatin accessibility, histone marks, and TFBSs in its upstream sequences. (c) A transcribed processed pseudogene(Ensembl gene ID: ENST00000355920.3; genomic location, chr7: 72333321-72339656) with no active chromatin features or conserved sequences.(d) A non-transcribed duplicated pseudogene showing partial activity patterns (Ensembl gene ID: ENST00000429752.2; genomic location, chr1:109646053-109647388). (e) Examples of partially active pseudogenes. E1 and E2 are examples of duplicated pseudogenes. E1 shows UGT1A2P(Ensembl gene ID: ENST00000454886), indicated by the green arrowhead. UTG1A2P is a non-transcribed pseudogene with active chromatin andit is under negative selection. Coding exons of protein-coding paralogous loci are represented by dark green boxes and UTR exons by filled redboxes. E2 shows FAM86EP (Ensembl gene ID: ENST00000510506) as open green boxes, which is a transcribed pseudogene with active chromatinand upstream TFBSs and Pol2 binding sites. The transcript models associated with the locus are displayed as filled red boxes. Black arrowheadsindicate features novel to the pseudogene locus. E3 and E4 show two unitary pseudogenes. E3 shows DOC2GP (Ensembl gene ID:ENST00000514950) as open green boxes, and transcript models associated with the locus are shown as filled red boxes. E4 shows SLC22A20(Ensembl gene ID: ENST00000530038). Again, the pseudogene model is represented as open green boxes, transcript models associated with thelocus as filled red boxes, and black arrowheads indicate features novel to the pseudogene locus. E5 and E6 show two processed pseudogenes.E5 shows pseudogene EGLN1 (Ensembl gene ID: ENST00000531623) inserted into duplicated pseudogene SCAND2 (Ensembl gene ID:ENST00000541103), which is a transcribed pseudogene showing active chromatin but no upstream regulatory regions as seen in the parentgene. The pseudogene models are represented as open green boxes, transcript models associated with the locus are displayed as filled redboxes, and black arrowheads indicate features novel to the pseudogene locus. E6 shows a processed pseudogene RP11-409K20 (Ensembl geneID: ENST00000417984; filled green box), which has been inserted into a CpG island, indicated by an orange arrowhead. sRNA, small RNA.
Pei et al. Genome Biology 2012, 13:R51http://genomebiology.com/2012/13/9/R51
Page 19 of 26
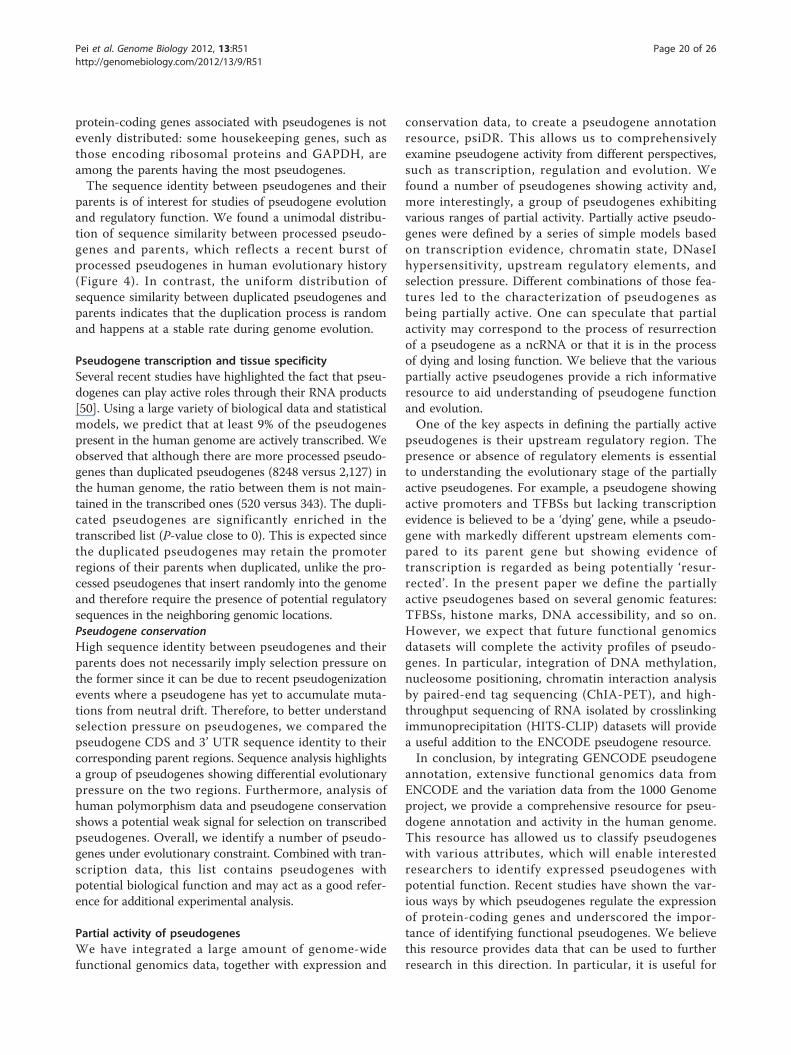
protein-coding genes associated with pseudogenes is notevenly distributed: some housekeeping genes, such asthose encoding ribosomal proteins and GAPDH, areamong the parents having the most pseudogenes.The sequence identity between pseudogenes and their
parents is of interest for studies of pseudogene evolutionand regulatory function. We found a unimodal distribu-tion of sequence similarity between processed pseudo-genes and parents, which reflects a recent burst ofprocessed pseudogenes in human evolutionary history(Figure 4). In contrast, the uniform distribution ofsequence similarity between duplicated pseudogenes andparents indicates that the duplication process is randomand happens at a stable rate during genome evolution.
Pseudogene transcription and tissue specificitySeveral recent studies have highlighted the fact that pseu-dogenes can play active roles through their RNA products[50]. Using a large variety of biological data and statisticalmodels, we predict that at least 9% of the pseudogenespresent in the human genome are actively transcribed. Weobserved that although there are more processed pseudo-genes than duplicated pseudogenes (8248 versus 2,127) inthe human genome, the ratio between them is not main-tained in the transcribed ones (520 versus 343). The dupli-cated pseudogenes are significantly enriched in thetranscribed list (P-value close to 0). This is expected sincethe duplicated pseudogenes may retain the promoterregions of their parents when duplicated, unlike the pro-cessed pseudogenes that insert randomly into the genomeand therefore require the presence of potential regulatorysequences in the neighboring genomic locations.Pseudogene conservationHigh sequence identity between pseudogenes and theirparents does not necessarily imply selection pressure onthe former since it can be due to recent pseudogenizationevents where a pseudogene has yet to accumulate muta-tions from neutral drift. Therefore, to better understandselection pressure on pseudogenes, we compared thepseudogene CDS and 3’ UTR sequence identity to theircorresponding parent regions. Sequence analysis highlightsa group of pseudogenes showing differential evolutionarypressure on the two regions. Furthermore, analysis ofhuman polymorphism data and pseudogene conservationshows a potential weak signal for selection on transcribedpseudogenes. Overall, we identify a number of pseudo-genes under evolutionary constraint. Combined with tran-scription data, this list contains pseudogenes withpotential biological function and may act as a good refer-ence for additional experimental analysis.
Partial activity of pseudogenesWe have integrated a large amount of genome-widefunctional genomics data, together with expression and
conservation data, to create a pseudogene annotationresource, psiDR. This allows us to comprehensivelyexamine pseudogene activity from different perspectives,such as transcription, regulation and evolution. Wefound a number of pseudogenes showing activity and,more interestingly, a group of pseudogenes exhibitingvarious ranges of partial activity. Partially active pseudo-genes were defined by a series of simple models basedon transcription evidence, chromatin state, DNaseIhypersensitivity, upstream regulatory elements, andselection pressure. Different combinations of those fea-tures led to the characterization of pseudogenes asbeing partially active. One can speculate that partialactivity may correspond to the process of resurrectionof a pseudogene as a ncRNA or that it is in the processof dying and losing function. We believe that the variouspartially active pseudogenes provide a rich informativeresource to aid understanding of pseudogene functionand evolution.One of the key aspects in defining the partially active
pseudogenes is their upstream regulatory region. Thepresence or absence of regulatory elements is essentialto understanding the evolutionary stage of the partiallyactive pseudogenes. For example, a pseudogene showingactive promoters and TFBSs but lacking transcriptionevidence is believed to be a ‘dying’ gene, while a pseudo-gene with markedly different upstream elements com-pared to its parent gene but showing evidence oftranscription is regarded as being potentially ‘resur-rected’. In the present paper we define the partiallyactive pseudogenes based on several genomic features:TFBSs, histone marks, DNA accessibility, and so on.However, we expect that future functional genomicsdatasets will complete the activity profiles of pseudo-genes. In particular, integration of DNA methylation,nucleosome positioning, chromatin interaction analysisby paired-end tag sequencing (ChIA-PET), and high-throughput sequencing of RNA isolated by crosslinkingimmunoprecipitation (HITS-CLIP) datasets will providea useful addition to the ENCODE pseudogene resource.In conclusion, by integrating GENCODE pseudogene
annotation, extensive functional genomics data fromENCODE and the variation data from the 1000 Genomeproject, we provide a comprehensive resource for pseu-dogene annotation and activity in the human genome.This resource has allowed us to classify pseudogeneswith various attributes, which will enable interestedresearchers to identify expressed pseudogenes withpotential function. Recent studies have shown the var-ious ways by which pseudogenes regulate the expressionof protein-coding genes and underscored the impor-tance of identifying functional pseudogenes. We believethis resource provides data that can be used to furtherresearch in this direction. In particular, it is useful for
Pei et al. Genome Biology 2012, 13:R51http://genomebiology.com/2012/13/9/R51
Page 20 of 26

understanding the regulatory role of pseudogenes, espe-cially in cancer and other developmental processes. Thecomprehensive annotation of human pseudogenes alsoallows their comparison with pseudogenes from othermodel organisms, such as mouse, worm, fly, and cress,which can provide valuable information on genomeevolution.
Materials and methodsManual annotationThe manual annotation is based on protein data fromthe UniProt database, which is aligned to the individualbacterial artificial chromosome (BAC) clones that makeup the reference genome sequence using BLAST [51].Gene models are manually extrapolated from the align-ments by annotators using the ZMAP annotation inter-face and the otterlace annotation system [52].Alignments were navigated using the Blixem alignmentviewer [53]. Visual inspection of the dot-plot outputfrom the Dotter tool [53] is used to resolve any align-ment with the genomic sequence that is unclear in, orabsent from, Blixem. A model is defined as a pseudo-gene if it possesses one or more of the following charac-teristics unless there is evidence (transcriptional,functional, publication) showing that the locus repre-sents a protein-coding gene with structural/functionaldivergence from its parent (paralog): (1) a prematurestop codon relative to parent CDS - can be introducedby nonsense or frame-shift mutation; (2) a frame-shift ina functional domain - even where the length of theresulting CDS is similar to that of the parent CDS; (3) atruncation of the 5’ or 3’ end of the CDS relative to theparent CDS; (4) a deletion of an internal portion of theCDS relative to the parent CDS. Processed pseudogeneloci lacking disabling mutations are annotated as ‘pseu-dogene’ when they lack locus-specific transcriptionalevidence
PseudoPipePseudoPipe identifies pseudogenes by searching forhomology to all known protein sequences in the genome(defined in Ensembl) using a six-frame translationalBLAST, followed by removal of redundancies and mer-ging of the overlapping and continuous BLAST hits.Functional paralogs (parents) of the resulting pseudo-genes are determined by sequence similarity, and thedisablements in pseudogenes are identified throughalignment to the parent genes. A non-redundant set of18,046 pseudogenes was obtained using the humanreference genome (GRch37, ENSEMBL gene release 60).Pseudogenes are categorized into different classes asprocessed, duplicated or ambiguous based on theirgenomic structures. While duplicated pseudogenes haveintron-exon like structures, processed pseudogenes
contain only continuous exon sequences with no intronsand have traces of polyadenine tails at the 3’ end.Ambiguous pseudogenes indicate processed pseudo-genes with decayed sequences.
RetroFinderRetroFinder is unique among pseudogene predictionmethods for using mRNA alignments to identify retro-genes, including processed pseudogenes [37]. HumanmRNA and RefSeq sequences are aligned using theLastz [54] alignment program (based on Blastz [55]),which is very sensitive, allowing alignment down tothe level of 65% identity, whereas BLAT [56] worksbetter for sequences where identity is greater than95%. If one of these transcripts aligns more than once,and one of the alignments is to a known gene locus,then the additional alignments are scored on a numberof features indicative of retrotransposition: multiplecontiguous exons with the parent gene intronsremoved; negatively scored introns that are distin-guished from repeat insertions (SVA elements, longinterspersed nucleotide elements (LINEs), short inter-spersed nucleotide elements (SINEs), Alu elements);lack of conserved splice sites; break in synteny withmouse and dog genomes using the syntenic net align-ments [57] from the UCSC Genome Browser [58];polyadenine tail insertion.Parents based on immunoglobulin and zinc finger
genes are filtered out since these large gene familiescause false positives. The score threshold is set at 550based on training with VEGA [59] processed pseudo-genes. Note that for human, VEGA genes are includedin the manually annotated genes of GENCODE. Furtherdetails of the method can be found in [37].
Consensus of manual and automated annotationTo obtain a consensus set of pseudogenes, we verifiedeach pseudogene locus from manual annotation againstthose predicted by either of the two automated pipelines(PseudoPipe and RetroFinder), using a 50 bp overlap cri-terion. A pseudogene passing these overlapping tests isclassified as: a ‘level 1’ pseudogene if it passes tests ofmanual annotation against both automated pipelines; ora ‘2-way consensus’ pseudogene if it only passes the testbetween the two automated pipelines.As a quality control exercise to determine complete-
ness of pseudogene annotation in chromosomes thathave been manually annotated, 2-way consensus pseudo-genes are re-checked to establish their validity and addedto the manually annotated pseudogene set as appropriate.
Pseudogene extrapolationWe estimated the total number of pseudogenes in thegenome using the knowledge from PseudoPipe and
Pei et al. Genome Biology 2012, 13:R51http://genomebiology.com/2012/13/9/R51
Page 21 of 26

manual annotation. Using manual annotation from thechromosomes that were completely annotated as a goldstandard, we estimated the number of false positivesand false negatives in PseudoPipe predictions. We usedthis information to extrapolate to the entire human gen-ome to obtain an estimate of the number of pseudo-genes in the reference genome.Chromosomes 1 to 11, 20, 21, 22, X, Y and the p arm
of 12 are fully annotated in GENCODE v7. On thesechromosomes, there are 9,776 and 12,501 pseudogenespredicted by manual inspection and by PseudoPipe,respectively. PseudoPipe assigned 18,046 pseudogenes inthe entire genome. Based on this, the number of manu-ally identified pseudogenes in the genome will be (9,776× 18,046)/12,501 ≈ 14,112.Alternatively, we used a simple linear extrapolation to
correlate the number of pseudogenes with the size ofchromosomes on which the pseudogenes are annotated.With this method, the number of nucleotides from thefully annotated regions is 2,383,814,825, while the totalnumber of nucleotides in the genome is 3,092,688,347.Therefore, the predicted number of pseudogenes for theentire human genome is (9,776 × 3,092,688,347)/2,383,814,825 ≈ 12,683.
Identification of the parents of pseudogenes andsequence similarity to the parentWe derived parents of pseudogenes from the correspon-dence between pseudogenes and query sequences usedby different pipelines (that is, UniProt proteins for man-ual annotation and Ensembl peptides for PseudoPipe),together with the sequence alignments of pseudogenesagainst the whole human genome. The procedure wascarried out using the following steps: first, use corre-spondence between parents and pseudogenes derived bythe manual annotation; second, one-to-one sequencealignment between pseudogenes and coding regions inthe human genome by BLAT (sequence similarity >90%); third, use parent gene information provided byPseudoPipe.When the parent identity for a pseudogene is incon-
sistent across different data resources, we assign the par-ent based on the highest ranked data in the followingorder: manual annotation, BLAT alignment, and auto-mated curation.Parents of 9,368 pseudogenes were unambiguously
identified, while it is difficult to uniquely identify theparent genes for 1,848 pseudogenes. The two most sig-nificant factors that confound our ability to confidentlyidentify a pseudogene parent are the degree of degrada-tion of the pseudogene and the number of closelyrelated paralogs to the true parent gene. Therefore, forgene families with many closely related members, even arelatively small number of mutations can render
accurate identification of the true parent difficult; whilefor more degraded pseudogenes from large families withcommon functional domains (for example, zinc fingers),the number and similarity of the potential parents makeprediction impossible.To calculate the sequence identity between pseudo-
genes and their parents, each pseudogene sequence wasextended by 2 kb at its 3’ end for a higher coverage of3’ UTR of its parent and then aligned to its parentsequence. Only exons of parent and pseudogenesequences were used. The alignment was carried outusing ClustalW2, with default parameters. To adapt tothe large size of 3’ UTR and much smaller size of smallRNA targets in that region, a sliding window of 100 bpwas used for sequence identity for a more accurate localidentity. The window with the highest sequence identitywas taken as representative of the 3’ UTR and used inthe following tests.
Pseudogene transcription evidence from RNA-Seq dataThe pseudogenes in GENCODE v7 were tested for tran-scription evidence using the following workflow. First, weextracted the genomic coordinates of the processed andduplicated pseudogenes from GENCODE v7 (gene_type= ‘pseudogene’ AND transcript_type = ‘processed_pseu-dogene’ OR transcript_type = ‘unprocessed_pseudogene’).From this step we obtained 8,107 processed and 1,860duplicated pseudogenes. Second, we obtained the under-lying genomic sequence for each pseudogene by concate-nating the sequences of their pseudoexons. Third, wealigned each pseudogene sequence to the human refer-ence genome using BLAT [56] (with default parameters)to find all similar regions in the genome. Fourth, weassigned each pseudogene alignment to one of four cate-gories: pseudogenes with no similar regions in the gen-ome (presumably these pseudogenes are more ancientand have accumulated many mutations, and thereforethey have a low sequence similarity compared to the par-ent gene); pseudogenes giving rise to one alignment pair(most likely the parent gene); pseudogenes with two tofive alignments; pseudogenes giving rise to more thanfive sequence alignments.For the 9,967 pseudogenes analyzed, we obtained the
following counts: 3,198 pseudogenes with zero align-ments, 1,907 pseudogenes with one alignment, 2,150pseudogenes with two to five alignments and 2,712pseudogenes with more than five alignments.In order to check for evidence of pseudogene tran-
scription, we examined the expression pattern of eachpseudogene and its similar regions using the IlluminaHuman BodyMap RNA-Seq data set consisting of 16 tis-sues. First, we aligned the reads for each tissue to thehuman genome reference sequence in conjunction witha splice junction library using Bowtie [60] and
Pei et al. Genome Biology 2012, 13:R51http://genomebiology.com/2012/13/9/R51
Page 22 of 26
RSEQtools [61]. There was no preference given for agenome match over other matches. Second, we gener-ated a signal track of the mapped reads for each tissue.Third, for a given pseudogene and its similar regions inthe human genome, we extracted the signal track ofmapped reads from all 16 tissues as shown in Figure 5c.After a number of filtering steps we obtained a list of
potentially transcribed pseudogenes. For example, theset of 3,198 pseudogenes with no similar regions in thegenome was reduced to 344 pseudogenes by requiringthat each pseudogene is covered by at least two readsacross half of its length in at least one tissue.
Transcribed pseudogenes subject to experimentalvalidationOut of the 469 pseudogenes subjected to experimentalvalidation, 94 pseudogenes were randomly selected fromthe manual pipeline output (pipeline 1 in section ‘Pseu-dogene Transcription Identified by Sequence of Computa-tional Pipelines’); 271 pseudogenes were selected atrandom from the PseudoSeq pipeline output (pipeline 3in the same section as above), and 97 pseudogenes wereselected at random from the TotalRNA pipeline output(pipeline 2 in the same section as above). The remainingseven pseudogenes (containing seven loci to be vali-dated), were manually chosen by examining the expres-sion patterns of pseudogenes and their parents usingBodyMap data and PseudoSeq (Figure 5c). At the timeof writing, the remainder of transcribed pseudogenes areundergoing experimental validation and the results willbe constantly updated in the psiDR.
Multiple sequence alignment, pseudogene preservationand polymorphisms in the human populationSequence alignmentGenomic sequence alignments of 16 species, includingprimates, mammals, and vertebrates, were extractedfrom the original 46-way vertebrate sequence alignmentsobtained from the UCSC genome browser. Genomesfrom all the species were aligned using BlastZ with asynteny filter followed by the MultiZ method.Assembled sequences for the 2X mammal data areexcluded from the current study due to their low qualityand possible false positive alignment to pseudogenesfrom the high-quality assemblies.Selection pressureGenomic variation data consisting of SNPs, indels, andstructural variations were from 60 individuals in theCEU population (Utah residents with ancestry fromnorthern and western Europe) from the 1000 Genomesproject pilot data release [47].Pseudogene conservationChimp orthologs to human pseudogenes were derivedfrom whole genome sequence alignments. Only
pseudoexons were used in the ortholog identificationand the following analyses. The divergence is calculatedas the ratio of mutated nucleotides in the chimp gen-ome to the length of human pseudogenes. We assumethe occurrence of substitution follows a Poisson distri-bution and the background substitution rate (nullhypothesis mean) was set at 1.5%. The P-value for pseu-dogene conservation was derived as the probability ofthat pseudogene having equal or fewer nucleotide muta-tions than it really has under the null hypothesis. Weadjusted P-values for multiple hypotheses testing usingthe Benjamini and Hochberg approach [62]. All thepseudogenes were ranked by their P-values from themost significant to the least significant. Pseudogeneswith P-values less than (False discovery rate × Rank/COUNT) were taken as significant, where false discov-ery rate is set to 0.05 and COUNT is the total numberof pseudogenes tested. Conserved pseudogenes frommouse orthologs were calculated in the same manner,except the background substitution rate was set to 5%.
Chromatin segmentation using segwaySegway segmentation labels the genome using 25 differ-ent markers. Half of them are indicative of genomicactivity (for example, transcription factor activity, genebody, enhancers), while the other half are repressive (forexample, CTCF). We calculated the frequency of eachmarker in the pseudogenes and parent genes in a gen-ome-wide fashion. All the frequencies were normalizedwith respect to the total segment distribution across theentire genome. Two different trends were observedglobally for the parent genes: (a) TSS mark frequency isat least one order of magnitude larger than the fre-quency of the repressive marks; and (b) the frequency ofthe GE, GM and GS marks is, on average, five times lar-ger than the frequency of the repressive marks. The seg-ment distribution of the parent genes indicatedenrichment in TSS, GS, e/GM (enhancer/gene bodymiddle) and GE marks and was considered as a standardindicator for active chromatin.
Transcription factor binding sites in the upstream regionsTFBSs were studied using data from ENCODE ChIP-Seq experiments. In this study, we used the transcriptionfactor occupancy data from the ENCODE 2011 Januarydata freeze. The binding peaks of all the transcriptionfactors were called by PeakSeq, with optimal settings toreduce the false negative results due to weak/poor biolo-gical replicates. A pseudogene was considered to have aTFBS if the majority of a peak for that transcription fac-tor is located within the genomic region 2 kb upstreamof the pseudogene.ENCODE tier 1 and tier 2 cell lines (Gm12878, K562,
Helas3, H1-hesc and Hepg2) with ChIP-Seq data for at
Pei et al. Genome Biology 2012, 13:R51http://genomebiology.com/2012/13/9/R51
Page 23 of 26
least 40 transcription factors were included in this ana-lysis. To avoid confusion with the transcription factorbinding signals from neighboring genomic loci, 693pseudogenes whose 5’ ends are less than 4 kb awayfrom the TSS of protein-coding genes were excluded. Inthe end, this study focused on 10,523 pseudogenes,where 876 are transcribed pseudogenes.One confounding factor in the analysis is the different
number of transcription factors studied in each cell line.However, we argue that the numbers here reflect thetrue tendency of TFBSs for pseudogenes since fairlycomprehensive lists of transcription factors have beenstudied (74, 114, 53, 40 and 61 transcription factors inGm12878, K562, Helas3, H1-hesc and Hepg2, respec-tively) and the results are consistent across all the differ-ent cell lines.
Additional material
Additional file 1: Supplementary tables and figures.
Abbreviationsbp: base pair; CDS: coding sequence; ChIP: chromatin immunoprecipitation;EST: expressed sequence tag; GE: gene body end; GM: gene body middle; e/GM: enhancer/gene body middle; GS: gene body start; HAVANA: Human andVertebrate Analysis and Annotation; lncRNA: long non-coding RNA; miRNA:microRNA; ncRNA: non-coding RNA; Pol2: RNA polymerase II; psiDR:Pseudogene Decoration Resource; RT-PCR: reverse transcription polymerasechain reaction; siRNA: small interfering RNA; SNP: single nucleotidepolymorphism; SV: structural variants; TFBS: transcription factor binding site;TSS: transcription start site; UCSC: University of California at Santa Cruz;UTR:untranslated region.
AcknowledgementsWe thank the ENCODE Project Consortium and the Illumina Human BodyMap project for making their data publicly available and members of theLausanne Genomic Technologies Facility for technical help. We thank theHAVANA team for their efforts on the manual annotation of pseudogenes.This work was funded by National Human Genome Research Institute(NHGRI)/National Institutes of Health (NIH) grants to the GENCODE (U54HG004555) subgroup of the ENCODE project. We acknowledge grants fromthe Swiss National Science Foundation to AR and from the Wellcome Trust(WT077198/Z/05/Z) to JH, AF and TH.
Author details1Program in Computational Biology and Bioinformatics, Yale University, Bass432, 266 Whitney Avenue, New Haven, CT 06520, USA. 2Department ofMolecular Biophysics and Biochemistry, Yale University, 266 Whitney Ave,New Haven, CT 06520, USA. 3Wellcome Trust Sanger Institute, WelcomeTrust Campus, Hinxton, Cambridge CB10 1SA, UK. 4Center for IntegrativeGenomics, University of Lausanne, Genopode building, Lausanne, 1015,Switzerland. 5Center for Biomolecular Science and Engineering University ofCalifornia, 1156 High Street, Santa Cruz, CA 95064, USA. 6Centre for GenomicRegulation (CRG) and UPF, Dr, Aiguader, 08003 Barcelona, Catalonia, Spain.7Department of Computer Science, Yale University, 51 Prospect Street, NewHaven, CT 06511, USA.
Authors’ contributionsBP, CS and MG conceived of the study. BP carried out pseudogene parentanalysis and upstream analysis, participated in chromatin signature andpseudogene conservation studies and drafted the manuscript. CS carried outchromatin segmentation studies and participated in pseudogene parent
analysis and revision of the manuscript. AF, TH and JH carried out themanual annotation of pseudogenes. CH, AT and AR performed theexperimental validation of transcribed pseudogenes. LH carried out theautomated identification of transcribed pseudogenes. XJM carried out theevolutionary selection studies. RH and MD participated in the pseudogeneannotation. SB participated in pseudogene annotation and revision of themanuscript. MG participated in revision of the manuscript and coordinatedthe whole study. All the authors read and approved the final manuscript.
Competing interestsThe authors declare that they have no competing interests.
Received: 23 March 2012 Revised: 30 May 2012Accepted: 25 June 2012 Published: 5 September 2012
References1. Mighell AJ, Smith NR, Robinson PA, Markham AF: Vertebrate pseudogenes.
FEBS Lett 2000, 468:109-114.2. Harrison PM, Echols N, Gerstein MB: Digging for dead genes: an analysis
of the characteristics of the pseudogene population in theCaenorhabditis elegans genome. Nucleic Acids Res 2001, 29:818-830.
3. Echols N, Harrison PM, Balasubramanian S, Luscombe NM, Bertone P,Zhang Z, B GM: Comprehensive analysis of amino acid and nucleotidecomposition in eukaryotic genomes comparing genes andpseudogenes. Nucleic Acids Res 2002, 30:2515-2523.
4. Balakirev E, Ayala F: Pseudogenes: are they “junk” or functional DNA?Annu Rev Genet 2003, 37:123-151.
5. Zhang ZD, Frankish A, Hunt T, Harrow J, Gerstein MB: Identification andanalysis of unitary pseudogenes: historic and contemporary gene lossesin humans and other primates. Genome Biol 2010, 11:R26.
6. Harrison PM, Gerstein M: Studying genomes through the aeons: proteinfamilies pseudogenes and proteome evolution. J Mol Biol 2002,318:1155-1174.
7. Vinckenbosch N, Dupanloup I, Kaessmann H: Evolutionary fate ofretroposed gene copies Evolutionary fate of retroposed gene copies inthe human genome. Proc Natl Acad Sci USA 2006, 103:3220-3225.
8. Ding W, Lin L, Chen B, Dai J: L1 elements processed pseudogenes andretrogenes in mammalian genomes. IUBMB Life 2006, 58:677-685.
9. Karro JE, Yan Y, Zheng D, Zhang Z, Carriero N, Cayting P, Harrison PM,Gerstein M: Pseudogene.org: a comprehensive database and comparisonplatform for pseudogene annotation. Nucleic Acids Res 2007, 35:D55-D60.
10. Ohshima K, Hattori M, Yada T, Gojobori T, Sakaki Y, Okada N: Whole-genome screening indicates a possible burst of formation of processedpseudogenes and Alu repeats by particular L1 subfamilies in ancestralprimates. Genome Biol 2003, 4:R74.
11. Torrents D, Suyama M, Zdobnov E, Bork P: A genome-wide survey ofhuman pseudogenes. Genome Res 2003, 13:2559-2567.
12. Zhang Z, Gerstein M: Large-scale analysis of pseudogenes in the humangenome. Curr Opin Genet Dev 2004, 14:328-335.
13. Balasubramanian S, Zheng D, Liu YJ, Fang G, Frankish A, Carriero N,Robilotto R, Cayting P, Gerstein M: Comparative analysis of processedribosomal protein pseudogenes in four mammalian genomes. GenomeBiol 2009, 10:R2.
14. Harrison PM, Zheng D, Zhang Z, Carriero N, Gerstein M: Transcribedprocessed pseudogenes in the human genome: an intermediate form ofexpressed retrosequence lacking protein-coding ability. Nucleic Acids Res2005, 33:2374-2383.
15. Svensson Ö, Arvestad L, Lagergren J: Genome-wide survey for biologicallyfunctional pseudogenes. PLoS Comput Biol 2006, 2:e46.
16. Zheng D, Frankish A, Baertsch R, Kapranov P, Reymond A, Woh Choo S, Y L,Denoeud F, Antonarakis SE, Snyder M, Ruan Y, Wei CL, Gingeras TR,Guigó R, Harrow J, Gerstein MB: Pseudogenes in the ENCODE regions:consensus annotation analysis of transcription and evolution. GenomeRes 2007, 17:839-851.
17. Firth MC, Wilming LG, Forrest A, Kawaji H, Tan SL, Washlestedt C, Bajic VB,Kai C, Kawai J, Carninci P, Hayashizaki Y, Bailey TL, Huminiecki L: Pseudo-messenger RNA: phantoms of the transcriptome. PLoS Genet 2006, 2:e23.
18. Enrique MM, Nancy M, Miguel AA: Functional evidence of post-transcriptional regulation by pseudogenes. Biochimie 2011,93:1916-1921.
Pei et al. Genome Biology 2012, 13:R51http://genomebiology.com/2012/13/9/R51
Page 24 of 26
19. Poliseno L, Salmena L, Zhang J, Carver B, Haveman WJ, Pandolfi PP: Acoding-independent function of gene and pseudogene mRNAsregulates tumour biology. Nature 2010, 465:1033-1038.
20. Tam OH, Aravin AA, Stein P, Girard A, Murchison EP, Cheloufi S, Hodges E,Anger M, Sachidanandam R, Schultz RM, Hannon GJ: Pseudogene-derivedsmall interfering RNAs regulate gene expression in mouse oocytes.Nature 2008, 453:534-538.
21. Piehler AP, Hellum M, Wenzel JJ, Kaminski E, Haug KB, Kierulf P,Kaminski WE: The human ABC transporter pseudogene family: Evidencefor transcription and gene-pseudogene interference. BMC Genomics 2008,9:165.
22. Han YJ, Ma SF, Yourek G, Park YD, Garcia JG: A transcribed pseudogene ofMYLK promotes cell proliferation. FASEB J 2011, 25:2305-2312.
23. Watanabe T, Totoki Y, Toyoda A, Kanedo M, Kuramochi-Miyagawa S,Obata Y, Chiba H, Kohara Y, Kono T, Nakano T, Surani MA, Sakaki Y,Sasaki H: Endogenous siRNAs from naturally formed dsRNAs regulatetranscripts in mouse oocytes. Nature 2008, 453:539-543.
24. Sasidharan R, Gerstein M: Genomics: Protein fossils live on as RNA. Nature2008, 453:729-731.
25. Guo X, Zhang Z, Gerstein MB, Zheng D: Small RNAs originated frompseudogenes: cis- or trans-acting?. PLoS Comput Biol 2009, 5:e1000449.
26. Hawkins PG, Morris KV: Transcriptional regulation of Oct4 by a long non-coding RNA antisense to Oct4-pseudogene 5. Transcription 2010,1:165-175.
27. Salmena L, Carracedo A, Pandolfi PP: Tenets of PTEN Tumor Suppression.Cell 2008, 133:403-414.
28. Harrow J, Denoeud F, Frankish A, Reymond A, Chen CK, Chrast J, Lagarde J,Gilbert JG, Storey R, Swarbreck D, Rossier D, Ucla C, Hubbard T,Antonarakis SE, Guigo R: GENCODE: producing a reference annotation forENCODE. Genome Biol 2006, 7:S4.1-S4.9.
29. Harrow J, Frankish A, Gonzalez JM, Tapanari E, Diekhans M, Kokocinski F,Aken B, Barrell D, Zadissa A, Searle S, Barnes I, Bignell A, Boychenko V,Hunt T, Kay M, Mukherjee G, Rajan J, Despacio-Reyes G, Saunders G,Steward C, Harte R, Lin M, Howald C, Tanzer A, Derrien T, Chrast J,Walters N, Balasubramanian S, Pei B, Tress M, et al: GENCODE: Thereference human genome annotation for the ENCODE project. GenomeRes 2012.
30. Cochrane G, Karsch-Mizarchi I, Nakamura Y, International NucleotideSequence Database Collaboration: The International Nucleotide SequenceDatabase Collaboration. Nucleic Acids Res 2011, 39:D15-D18.
31. Zhu J, Sanborn JZ, Diekhans M, Lowe CB, Pringle TH, Haussler D:Comparative genomics search for losses of long-established genes onthe human lineage. PLoS Comput Biol 2007, 3:e247.
32. Duret L, Chureau C, Samain S, Weissenbach J, Avner P: The Xist RNA geneevolved in eutherians by pseudogenization of a protein-coding gene.Science 2006, 312:1653-1655.
33. Kaessmann H, Vinckenbosch N, Long M: RNA-based gene duplication:mechanistic and evolutionary insights. Nat Rev Genet 2010, 10:19-31.
34. PsiDr - The Pseudogene Decoration Resource. [www.pseudogenes.org/psidr].
35. PsiDr - The Pseudogene Decoration Resource mirror. [www.gencodegenes.org/psidr].
36. Zhang Z, Carriero N, Zheng D, Karro J, Harrison PM, Gerstein MB:PseudoPipe: an automated pseudogene identification pipeline.Bioinformatics 2006, 22:1437-1439.
37. Baertsch R, Diekans M, Kent WJ, Haussler D, Brosius J: Retrocopycontributions to the evolution of the human genome. BMC Genomics2008, 9:466.
38. Zhang Z, Carriero N, Gerstein M: Comparative analysis of processedpseudogenes in the mouse and human genomes. Trends Genet 2004,20:62-67.
39. Clamp M, Fry B, Kamal M, Xie X, Cuff J, Lin MF, Kellis M, Lindblad-Toh K,Lander ES: Distinguishing protein-coding and noncoding genes in thehuman genome. Proc Natl Acad Sci USA 2007, 104:19428-19433.
40. Zhang Z, Harrison P, Gerstein M: Identification and analysis of over 2000ribosomal protein pseudogenes in the human genome. Genome Res2002, 12:1466-1482.
41. Liu YJ, Zheng D, Balasubramanian S, Carriero N, Khurana E, Robilotto R,Gerstein MB: Comprehensive analysis of the pseudogenes of glycolyticenzymes in vertebrates: the anomalously high number of GAPDH
pseudogenes highlights a recent burst of retrotrans-positional activity.BMC Genomics 2009, 10:480.
42. Zhang Z, Carriero N, Gerstein MB: Comparative analysis of processedpseudogenes in the mouse and human genomes. Trends Genet 2004,20:62-67.
43. Kim PM, Lam HY, Urban AE, Korbel JO, Affourtit J, Grubert F, Chen X,Weissman S, Snyder M, Gerstein MB: Analysis of copy number variantsand segmental duplications in the human genome: Evidence for achange in the process of formation in recent evolutionary history.Genome Res 2008, 18:1865-1874.
44. Howald C, Tanzer A, Chrast J, Kokocinski F, Derrien T, Walters N,Gonzalez JM, Frankish A, Aken BL, Hourlier T, Vogel JH, White S, Searle MJ,Harrow J, Hubbard T, Guigo R, Reymond A: Experimental validation of theGENCODE annotation reveals that RNAseq transcriptome profilingpinpoints a large number of new linc genes but commonly misses raretranscripts. Genome Res 2012, doi: 10.1101/gr.134478.111.
45. Washietl S, Pedersen JS, Korbel JO, Stocsits C, Gruber AR, Hackermüller J,Hertel J, Lindemeyer M, Reiche K, Tanzer A, Ucla C, Wyss C, Antonarakis SE,Denoeud F, Lagarde J, Drenkow J, Kapranov P, Gingeras TR, Guigó R,Snyder M, Gerstein MB, Reymond A, Hofacker IL, Stadler PF: StructuredRNAs in the ENCODE selected regions of the human genome. GenomeRes 2007, 17:852-864.
46. Denoeud F, Kapranov P, Ucla C, Frankish A, Castelo R, Drenkow J, Lagarde J,Alioto T, Manzano C, Chrast J, Dike S, Wyss C, Henrichsen CN, Holroyd N,Dickson MC, Taylor R, Hance Z, Foissac S, Myers RM, Rogers J, Hubbard T,Harrow J, Guigó R, Gingeras TR, Antonarakis SE, Reymond A: Prominent useof distal 5’ transcription start sites and discovery of a large number ofadditional exons in ENCODE regions. Genome Res 2007, 17:746-759.
47. The 1000 Genomes Project Consortium: A map of human genomevariation from population-scale sequencing. Nature 2010, 467:1061-1073.
48. Hoffman M, Ernst J, Wilder S, Harris B, Dunham I, Hardison R, Birney E,Kellis M, Stafford Noble W: Unsupervised segmentation of ENCODEchromatin data. Genome Res 2012, GRCP011.
49. Yip KY, Cheng C, Bhardwaj N, Brown JB, Leng J, Kundaje A, Rozowsky J,Birney E, Bickel PJ, Snyder M, Gerstein MB: Genome-wide analysis of thebinding sites of more than 100 transcription-related factors definesdifferent types of genomic regions with distinct biological properties.Genome Res 2012, GRPC033.
50. Zheng D, Gerstein MB: The ambiguous boundary between genes andpseudogenes: the dead rise up or do they?. Trends Genet 2007,23:219-224.
51. Altschul SF, Madden TL, Schäffer AA, Zhang J, Zhang Z, Miller W,Lipman DJ: Gapped BLAST and PSI-BLAST: a new generation of proteindatabase search programs. Nucleic Acids Res 1997, 25:3389-3402.
52. Searle SM, Gilbert J, Iyer V, Clamp M: The otter annotation system. GenomeRes 2004, 14:963-970.
53. Sonnhammer ELL, Durbin R: A workbench for large scale sequencehomology analysis. Comput Appl Biosci 1994, 10:301-307.
54. Harris R: Improved pairwise alignment of genomic DNA. PhD ThesisPennsylvania State University; 2007.
55. Schwartz S, Kent WJ, Smit A, Zhang Z, Baertsch R, Hardison RC, Hausler D,Miller W: Human-mouse alignments with BLASTZ. Genome Res 2003,13:103-107.
56. Kent WJ: BLAT - the BLAST-like alignment tool. Genome Res 2002,12:656-664.
57. Kent WJ, Baertsch R, Hinrichs A, Miller W, Hausler D: Evolution’s cauldron:Duplication deletion and rearrangement in the mouse and humangenomes. Proc Natl Acad Sci USA 2003, 100:11484-11489.
58. Fujita PA, Rhead B, Zweig AS, Hinrichs AS, Karolchik D, Cline MS,Goldman M, Barber GP, Clawson H, Coelho A, Diekhans M, Dreszer TR,Giardine BM, Harte RA, Hillman-Jackson J, Hsu F, Kirkup V, Kuhn RM,Learned K, Li CH, Meyer LR, Pohl A, Raney BJ, Rosenbloom KR, Smith KE,Haussler D, Kent WJ: The UCSC Genome Browser database: update 2011.Nucleic Acids Res 2010, 39: 1-7.
59. Wilming LG, Gilbert JG, Howe K, Trevanion S, Hubbard T, Harrow JL: Thevertebrate genome annotation (Vega) database. Nucleic Acids Res 2008,36:D753-D760.
60. Langmead B, Trapnell C, Pop M, Salzberg SL: Ultrafast and memory-efficient alignment of short DNA sequences to the human genome.Genome Biol 2009, 10:R25.
Pei et al. Genome Biology 2012, 13:R51http://genomebiology.com/2012/13/9/R51
Page 25 of 26
61. Habegger L, Sboner A, Gianoulis TA, Rozowsky J, Agarwal A, Snyder M,Gerstein MB: RSEQtools: a modular framework to analyze RNA-Seq datausing compact anonymized data summaries. Bioinformatics 2011,27:281-283.
62. Benjamini Y, Hochberg Y: Controlling the false discovery rate: a practicaland powerful approach to multiple testing. J Roy Stat Soc B 1995,57:289-300.
63. Heintzman ND, Stuart RK, Fu Y, Ching CW, Hawkins RD, Barrera LO, VanCalcar S, Qu C, Ching KA, Wang W, Weng Z, Green RD, Crawford GE, Ren B:Distinct and predictive chromatin signatures of transcriptionalpromoters and enhancers in the human genome. Nat Genet 2007,39:311-318.
64. Barski A, Cuddapah S, Cui K, Roh TY, Schones DE, Wang Z, Wei G,Chepelev I, Zhao K: High-resolution profiling of histone methylations inthe human genome. Cell 2007, 129:823-837.
doi:10.1186/gb-2012-13-9-r51Cite this article as: Pei et al.: The GENCODE pseudogene resource.Genome Biology 2012 13:R51.
Submit your next manuscript to BioMed Centraland take full advantage of:
• Convenient online submission
• Thorough peer review
• No space constraints or color figure charges
• Immediate publication on acceptance
• Inclusion in PubMed, CAS, Scopus and Google Scholar
• Research which is freely available for redistribution
Submit your manuscript at www.biomedcentral.com/submit
Pei et al. Genome Biology 2012, 13:R51http://genomebiology.com/2012/13/9/R51
Page 26 of 26
Related Documents