The global distribution and burden of dengue The Harvard community has made this article openly available. Please share how this access benefits you. Your story matters Citation Bhatt, S., P. W. Gething, O. J. Brady, J. P. Messina, A. W. Farlow, C. L. Moyes, J. M. Drake, et al. 2013. “The global distribution and burden of dengue.” Nature 496 (7446): 504-507. doi:10.1038/nature12060. http://dx.doi.org/10.1038/nature12060. Published Version doi:10.1038/nature12060 Citable link http://nrs.harvard.edu/urn-3:HUL.InstRepos:11878919 Terms of Use This article was downloaded from Harvard University’s DASH repository, and is made available under the terms and conditions applicable to Other Posted Material, as set forth at http:// nrs.harvard.edu/urn-3:HUL.InstRepos:dash.current.terms-of- use#LAA

Welcome message from author
This document is posted to help you gain knowledge. Please leave a comment to let me know what you think about it! Share it to your friends and learn new things together.
Transcript
The global distributionand burden of dengue
The Harvard community has made thisarticle openly available. Please share howthis access benefits you. Your story matters
Citation Bhatt, S., P. W. Gething, O. J. Brady, J. P. Messina, A. W. Farlow, C. L.Moyes, J. M. Drake, et al. 2013. “The global distribution and burdenof dengue.” Nature 496 (7446): 504-507. doi:10.1038/nature12060.http://dx.doi.org/10.1038/nature12060.
Published Version doi:10.1038/nature12060
Citable link http://nrs.harvard.edu/urn-3:HUL.InstRepos:11878919
Terms of Use This article was downloaded from Harvard University’s DASHrepository, and is made available under the terms and conditionsapplicable to Other Posted Material, as set forth at http://nrs.harvard.edu/urn-3:HUL.InstRepos:dash.current.terms-of-use#LAA
The global distribution and burden of dengue
Samir Bhatt1, Peter W. Gething1, Oliver J. Brady1,2, Jane P. Messina1, Andrew W. Farlow1,Catherine L. Moyes1, John M. Drake1,3, John S. Brownstein4, Anne G. Hoen5, OsmanSankoh6,7,8, Monica F. Myers1, Dylan B. George9, Thomas Jaenisch10, G.R. WilliamWint1,11, Cameron P. Simmons12,13, Thomas W. Scott9,14, Jeremy J. Farrar12,13,15, andSimon I. Hay1,9
1Spatial Ecology and Epidemiology Group, Tinbergen Building, Department of Zoology, Universityof Oxford, South Parks Road, Oxford OX1 3PS, United Kingdom.2Oxitec Limited, Milton Park, Abingdon OX14 4RX, United Kingdom.3Odum School of Ecology, University of Georgia, Athens, Georgia 30602, United States ofAmerica.4Department of Pediatrics, Harvard Medical School and Children’s Hospital Informatics Program,Boston Children’s Hospital, Boston, Massachusetts 02115, United States of America.5Department of Community and Family Medicine, Geisel School of Medicine, Dartmouth College,Hanover, New Hampshire 03755, United States of America.6INDEPTH Network Secretariat, East Legon, P.O. Box KD 213, Accra, Ghana.7School of Public Health, University of the Witwatersrand, Braamfontein 2000, Johannesburg,South Africa.8Institute of Public Health, Heidelberg University, Heidelberg, Germany.9Fogarty International Center, National Institutes of Health, Bethesda, Maryland 20892, UnitedStates of America.10Section Clinical Tropical Medicine, Department of Infectious Diseases, Heidelberg UniversityHospital, INF 324, D 69120 Heidelberg, Germany.11Environmental Research Group Oxford (ERGO), Tinbergen Building, Department of Zoology,University of Oxford, South Parks Road, Oxford OX1 3PS, United Kingdom.12Oxford University Clinical Research Unit, Hospital for Tropical Diseases, Ho Chi Minh City,Vietnam.13Centre for Tropical Medicine, University of Oxford, Churchill Hospital, Oxford OX3 7LJ, UnitedKingdom.14Department of Entomology, University of California Davis, Davis, California 95616, UnitedStates of America.
Correspondence and requests for materials should be addressed to SIH ([email protected]). .
Supplementary Information is linked to the online version of the paper at www.nature.com/nature.
Author Contributions SIH and JJF conceived the research. SB and SIH drafted the manuscript. SB drafted the supplemental materialwith significant support on A (OJB, CLM), B (JPM, GRWW), C (PWG), D (OJB, TWS) and OJB wrote E. JSB and AGH providedHealthmap occurrence data and advice on its provenance. OJB reviewed all the occurrence data. SB did the modelling and analysiswith advice from JMD, PWG and SIH. JPM created all maps. All authors discussed the results and contributed to the revision of thefinal manuscript.
Author Information Reprints and permission information is available at www.nature.com/reprints.
NIH Public AccessAuthor ManuscriptNature. Author manuscript; available in PMC 2013 October 25.
Published in final edited form as:Nature. 2013 April 25; 496(7446): 504–507. doi:10.1038/nature12060.
NIH
-PA Author Manuscript
NIH
-PA Author Manuscript
NIH
-PA Author Manuscript
15Department of Medicine, National University of Singapore, Singapore.
AbstractDengue is a systemic viral infection transmitted between humans by Aedes mosquitoes1. For somepatients dengue is a life-threatening illness2. There are currently no licensed vaccines or specifictherapeutics, and substantial vector control efforts have not stopped its rapid emergence and globalspread3. The contemporary worldwide distribution of the risk of dengue virus infection4 and itspublic health burden are poorly known2,5. Here we undertake an exhaustive assembly of knownrecords of dengue occurrence worldwide, and use a formal modelling framework to map theglobal distribution of dengue risk. We then pair the resulting risk map with detailed longitudinalinformation from dengue cohort studies and population surfaces to infer the public health burdenof dengue in 2010. We predict dengue to be ubiquitous throughout the tropics, with local spatialvariations in risk influenced strongly by rainfall, temperature and the degree of urbanisation.Using cartographic approaches, we estimate there to be 390 million (95 percent credible interval284-528) dengue infections per year, of which 96 million (67-136) manifest apparently (any levelof clinical or sub-clinical severity). This infection total is more than three times the dengue burdenestimate of the World Health Organization2. Stratification of our estimates by country allowscomparison with national dengue reporting, after taking into account the probability of an apparentinfection being formally reported. The most notable differences are discussed. These new riskmaps and infection estimates provide novel insights into the global, regional and national publichealth burden imposed by dengue. We anticipate that they will provide a starting point for a widerdiscussion about the global impact of this disease and will help guide improvements in diseasecontrol strategies using vaccine, drug and vector control methods and in their economicevaluation. [285]
Dengue is an acute systemic viral disease that has established itself globally in both endemicand epidemic transmission cycles. Dengue virus infection in humans is often inapparent1,6
but can lead to a wide range of clinical manifestations, from mild fever to potentially fataldengue shock syndrome2. The lifelong immunity developed after infection with one of thefour virus types is type-specific1 and progression to more serious disease is frequently, butnot exclusively, associated with secondary infection by heterologous types2,5. No effectiveantiviral agents yet exist to treat dengue infection and treatment therefore remainssupportive2. Furthermore, no licensed vaccine against dengue infection is available, and themost advanced dengue vaccine candidate did not meet expectations in a recent large trial7,8.Current efforts to curb dengue transmission focus on the vector, using combinations ofchemical and biological targeting of Aedes mosquitoes and management of breeding sites2.These control efforts have failed to stem the increasing incidence of dengue fever epidemicsand expansion of the geographical range of endemic transmission9. While the historicalexpansion of this disease is well documented, the potentially large burden of ill-healthattributable to dengue across much of the tropical and sub-tropical world remains poorlyenumerated.
Knowledge of the geographical distribution and burden of dengue is essential forunderstanding its contribution to global morbidity and mortality burdens, in determininghow to allocate optimally the limited resources available for dengue control and inevaluating the impact of such activities internationally. Additionally, estimates of bothapparent and inapparent infection distributions form a key requirement for assessing clinicalsurveillance and for scoping reliably future vaccine demand and delivery strategies.Previous maps of dengue risk have used various approaches combining historical occurrencerecords and expert opinion to demarcate areas at endemic risk10-12. More sophisticated riskmapping techniques have also been implemented13,14, but the empirical evidence-base hassince been improved, alongside advances in disease modelling approaches. Furthermore, no
Bhatt et al. Page 2
Nature. Author manuscript; available in PMC 2013 October 25.
NIH
-PA Author Manuscript
NIH
-PA Author Manuscript
NIH
-PA Author Manuscript
studies have used a continuous global risk map as the foundation for dengue burdenestimation.
The first global estimates of total dengue virus infections were based on an assumedconstant annual infection rate amongst a crude approximation of the population at risk (10%in 1 billion5 or 4% in 2 billion15), yielding figures of 80-100 million infections per yearworldwide in 19885,15. As more information was collated on the ratio of denguehaemorrhagic fever to dengue fever cases and the ratio of deaths to dengue haemorrhagicfever cases, the global figure was revised to 50-100 million infections16,17, although largerestimates of 100-200 million have also been made10 (Figure 1). These estimates wereintended solely as approximations but, in the absence of better evidence, the resulting figureof 50-100 million infections per year is widely cited and currently used by the World HealthOrganization (WHO). As the methods employed were informal, these estimates werepresented without confidence intervals, and no attempt was made to assess geographical ortemporal variation in incidence or the inapparent infection reservoir.
Here we present the outcome of a new project to derive an evidence-based map of denguerisk and estimates of apparent and inapparent infections worldwide based on the globalpopulation in 2010. We compiled a database of 8,309 geo-located records of dengueoccurrence from a systematic search, resulting from 2,838 published literature sources aswell as newer online resources18 (see Supplementary Information A; the full bibliography4
and occurrence data are available from authors on request). Using these occurrence recordswe: chose a set of gridded environmental and socioeconomic covariates known, orhypothesised, to affect dengue transmission (see Supplementary Information B);incorporated recent work assessing the strength of evidence on national and sub-national-level dengue present/absent status4 (Figure 2A); and built a boosted regression tree (BRT)statistical model of dengue risk that addressed the limitations of previous risk maps (seeSupplementary Information C) to define the probability of occurrence of dengue infection(dengue risk) within each 5km × 5km pixel globally (Figure 2B). The model was run 336times to reflect parameter uncertainty and an ensemble mean map was created (seeSupplementary Information C). We then combined this ensemble map with detailedlongitudinal information on dengue infection incidence from cohort studies and built a non-parametric Bayesian hierarchical model to describe the relationship between dengue risk andincidence (see Supplementary Information D). Finally, we used the estimated relationship topredict the number of apparent and inapparent dengue infections in 2010 (seeSupplementary Information E). Our definition of an apparent infection is consistent with thatused by the cohort studies: an infection with sufficient severity to modify a person’s regularschedule, such as attending school. This definition encompasses any level of severity of thedisease, including both clinical and sub-clinical manifestations.
We predict that dengue transmission is ubiquitous throughout the tropics with the highestrisk zones in the Americas and Asia (Figure 2B). Validation statistics indicated highpredictive performance of the BRT ensemble mean map with area under the receiveroperating characteristic (AUC) of 0.81 (±0.02 SD, n = 336) (see Supplementary InformationC). Predicted risk in Africa, though more unevenly distributed than in other tropical endemicregions, is much more widespread than suggested previously. Africa has the poorest recordof occurrence data and, as such, increased information from this continent would help tobetter define the spatial distribution of dengue within it and to improve derivative burdenestimates. We found high levels of precipitation and temperature suitability for denguetransmission to be most strongly associated among the variables considered with elevateddengue risk, although low precipitation was not found to strongly limit transmission (seeSupplementary Information C). Proximity to low-income urban and peri-urban centres wasalso linked to greater risk, particularly in highly connected areas, suggesting that human
Bhatt et al. Page 3
Nature. Author manuscript; available in PMC 2013 October 25.
NIH
-PA Author Manuscript
NIH
-PA Author Manuscript
NIH
-PA Author Manuscript

movement between population centres is an important facilitator of dengue spread. Theseassociations have previously been cited9, but have not been demonstrated at the global scaleand highlight the importance of including socioeconomic covariates when assessing denguerisk.
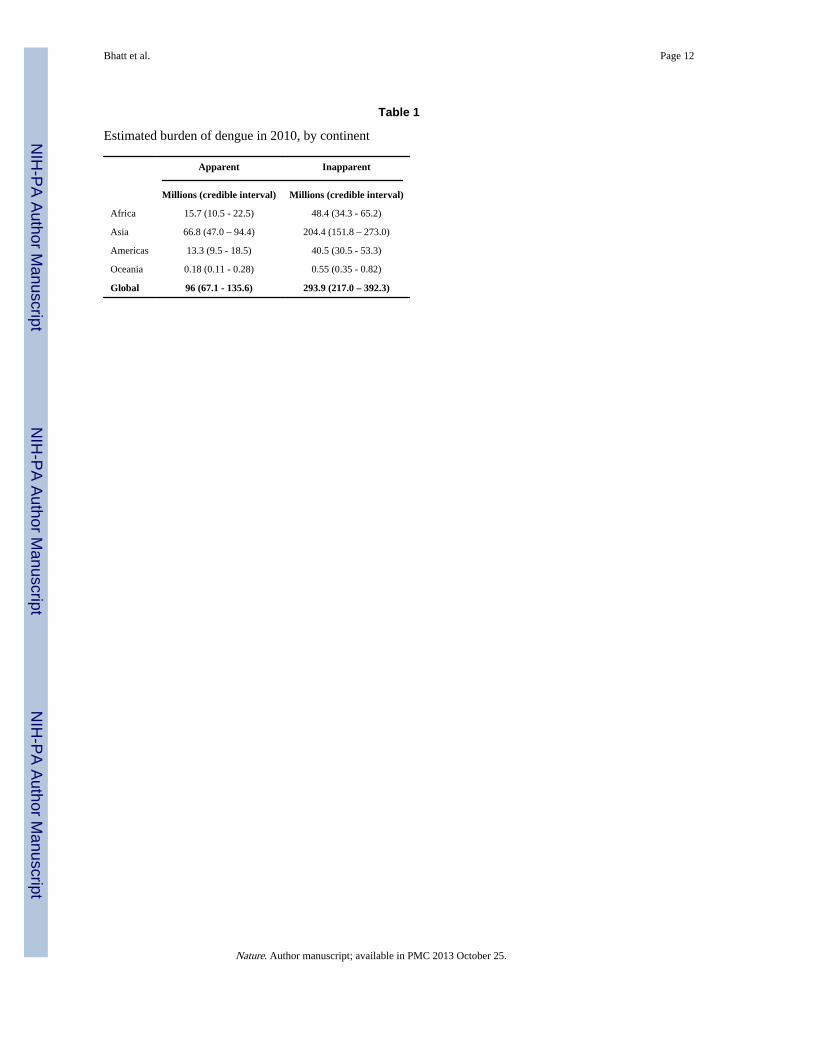
We estimate that there were 96 million apparent dengue infections globally in 2010 (Table1). Asia bore 70% (67 [47-94] million infections) of this burden, and is characterised bylarge swathes of densely populated regions coinciding with very high suitability for diseasetransmission. India19,20 alone contributed 34% (33 [24-44] million infections) of the globaltotal. The disproportionate infection burden borne by Asian countries is emphasized in thecartogram shown in Figure 2C. The Americas contributed 14% (13 [9-18] millioninfections) of apparent infections worldwide, of which over half occurred in Brazil andMexico. Our results indicate that Africa’s dengue burden is nearly equivalent to that of theAmericas (16 (11–22) million infections, 16% of the global total), representing asignificantly larger burden than previously estimated. This disparity supports the notion of alargely hidden African dengue burden, being masked by symptomatically similar illnesses,under-reporting and highly variable treatment-seeking behaviour6,9,20. The countries ofOceania contributed less than 0.2% of global apparent infections.
We estimate that an additional 294 (217–392) million inapparent infections occurredworldwide in 2010. These mild ambulatory or asymptomatic infections are not detected bythe public health surveillance system and have no immediate implications for clinicalmanagement. However, the presence of this huge potential reservoir of infection hasprofound implications for: (i) correctly enumerating economic impact (for example, howmany vaccinations are needed to avert an apparent infection) and triangulating withindependent assessments of disability adjusted life years (DALYs)21; (ii) elucidating thepopulation dynamics of dengue viruses22; and (iii) hypothesising about population effects offuture vaccine programmes23 (volume, targeting efficacy, impacts in combination withvector control), which will need to be administered to maximise cross-protection andminimize post-vaccination susceptibility.
The absolute uncertainties in the national burden estimates are inevitably a function ofpopulation size, with the greatest uncertainties in India, Indonesia, Brazil and China (see fullrankings in Supplementary E table T4). In addition, comparing the ratio of the mean to thewidth of the confidence interval24 revealed the greatest contributors to relative uncertainty(see full rankings in Supplementary E table T4). These were countries with sparseoccurrence points and low evidence consensus on dengue presence, such as Afghanistan orRwanda (see Figure 2A), or those with ubiquitous high risk, such as Singapore or Djibouti,for which our burden prediction confidence interval is at its widest (see Figure SD2 inSupplementary D). Therefore, increasing evidence consensus and occurrence dataavailability in low consensus countries and assembling new cohort studies, particularly inareas of high transmission, will reduce uncertainty in future burden estimates. Our approach,uniquely, provides new evidence to help maximize the value and cost-effectiveness ofsurveillance efforts, by indicating where limited resources can be targeted to have theirmaximum possible impact in improving our knowledge of the global burden and distributionof dengue.
Our estimates of total infection burden (apparent and inapparent) are more than three timeshigher than the WHO predicted figure (Supplementary Information E). Our definition of anapparent infection is broad, encompassing any disruption to the daily routine of the infectedindividual, and consequently is an inclusive measurement of the total population affectedadversely by the disease. Within this broad class, the severity of symptoms will affecttreatment-seeking behaviours and the probability of a correct diagnosis in response to a
Bhatt et al. Page 4
Nature. Author manuscript; available in PMC 2013 October 25.
NIH
-PA Author Manuscript
NIH
-PA Author Manuscript
NIH
-PA Author Manuscript

given infection. Our definition is therefore more comprehensive than those of traditionalsurveillance systems, which, even in the most efficient system, report a much narrowerrange of dengue infections. By reviewing our database of longitudinal cohort studies, inwhich total infections in the community were documented exhaustively, we find that thebiggest source of disparity between actual and reported infection numbers is the lowproportion of individuals with apparent infections seeking care from formal health facilities(see Figure SE5 and Supplementary Information E for full analysis). Additional biases areintroduced by misdiagnosis and the systematic failure of health management informationsystems to capture and report presenting dengue cases. By extracting the average magnitudeof each of these sequential disparities from published cohort and clinical studies, we canrecreate a hypothetical reporting chain with idealised reporting and arrive at estimates thatare broadly comparable to those countries reported to the WHO. This is most clear in morereliable reporting regions such as the Americas. Systemic underreporting and lowhospitalisation rates have important implications, for example, in the evaluation of vaccineefficacy based on reduced hospitalised caseloads. Inferences about these biases may bemade from the comparison of estimated versus reported infection burdens in 2010,highlighting areas where particularly poor reporting might be strengthened (seeSupplementary Information E).
We have strived to be exhaustive in the assembly of contemporary data on dengueoccurrence and clinical incidence and have applied new modelling approaches to maximisethe predictive power of these data. It remains the case, however, that the empirical evidencebase for global dengue risk is more limited than that available, for example, for Plasmodiumfalciparum25 and P. vivax26 malaria. Records of disease occurrence carry less informationthan those of prevalence and, as databases of the latter become more widespread, futureapproaches should focus on assessing relationships between seroprevalence and clinicalincidence as a means of assessing risk27. Additional cartographic refinements are alsorequired to help differentiate endemic- from epidemic-prone areas, to determine thegeographic diversity of dengue virus types and to predict the distributions of future riskunder scenarios of socioeconomic and environmental change.
The global burden of dengue is formidable and represents a growing challenge to publichealth officials and policymakers. Success in tackling this growing global threat is, in part,contingent on strengthening the evidence base on which control planning decisions and theirimpact are evaluated. It is hoped that this evaluation of contemporary dengue riskdistribution and burden will help to advance that goal. [1935].
MethodsAssembly of the occurrence database and its quality control
Occurrence data comprised of point or polygon locations of confirmed dengue infectionpresence derived from both peer-reviewed literature and HealthMap alerts18,31 (seeSupplementary Information A). An occurrence was defined as one or more laboratory orclinically confirmed infection(s) of dengue occurring at a unique location (a 5km × 5kmpixel) within one calendar year. All occurrence data underwent manual review andautomatic quality control to ensure information fidelity and precise geo-positioning. In total,9,648 and 1,622 occurrence locations were obtained from literature searches and HealthMaprespectively. After the quality control procedures, our final dataset contained 8,309occurrence locations (5,216 point locations and 3,093 small polygon centroids) spanning aperiod from 1960 to 2012. We assume any record of dengue occurrence, regardless of itsage, represented an environment permissible for the disease, since dengue has expandedfrom a focal disease in Asia to a cosmopolitan disease of the tropics.
Bhatt et al. Page 5
Nature. Author manuscript; available in PMC 2013 October 25.
NIH
-PA Author Manuscript
NIH
-PA Author Manuscript
NIH
-PA Author Manuscript
Explanatory covariatesWe assembled gridded global data for a suite of eight explanatory covariates. The covariateswere chosen based on factors known or hypothesised to contribute to suitability for denguetransmission (see Supplementary Information B). These covariates included: (i) annualmaximum and minimum precipitation variables from a Fourier processed32 synoptic annualseries interpolated from global meteorological stations33; (ii) a biological model combiningthe effects of temperature on the extrinsic incubation period of dengue virus and life-span ofthe Aedes aegypti vector to quantify the dengue-specific temperature suitability fortransmission28,34,35; (iii) Fourier-processed annual average normalised difference vegetationindex36 (iv); categorical demarcations of urban and peri-urban areas37; (v) an urbanaccessibility metric defining the travel time to nearest city of 50,000 people or more by land-or water-based travel38; and (vi) an indicator of relative poverty derived from the finestgeographic scale data available for economic productivity and adjusted for purchasingpower parity39. No covariate grids were shown to be adversely affected by multicollinearity(see Supplementary Information B) and were standardised to ensure identical spatialresolution, extent and boundaries. For point records, covariate values corresponded to thepixel value containing the location of the point. For polygon occurrence records, covariatevalues were averaged across the whole polygon.
Predicting the probability of occurrence (risk) of dengue transmissionWe used a boosted regression tree (BRT) approach to establish a multivariate empiricalrelationship between the probability of occurrence of a dengue virus infection and theenvironmental conditions sampled at each site from the covariate suite. The BRT methodhas been shown to fit complicated response functions efficiently, while guarding againstoverfitting, and is therefore widely used for vector and disease distribution mapping40,41.The BRT approach combines regression trees42 with gradient boosting43, whereby an initialregression tree is fitted and iteratively improved upon in a forward stagewise manner(boosting) by minimising the variation in the response not explained by the model at eachiteration (see Supplementary Information C).
Like other niche mapping approaches, the BRT models require not only presence data butalso absence data defining areas of disease absence and potentially unsuitable environmentalconditions at unsampled locations. Since data on absence of disease are not-definitive,pseudo-absence data estimate areas of disease absence instead. No consensus approach hasbeen developed to optimise the generation of pseudo-absence data and we therefore createdan evidence-based probabilistic framework for generating pseudo-absences, incorporatingthe main biasing factors in pseudo-absence generation, namely: (i) geographical extent; (ii)number; (iii) contamination bias; and (iv) sampling bias. To represent areas of absence, napseudo-absence points29,44,45 were randomly generated based on dengue presence orabsence certainty measures at a national or subnational level4. Pseudo-absence locationswere restricted to a maximum distance μ from any recorded presence site46,47. Additionally,to compensate for “contamination” of true but unobserved presences within the generatedpseudo-absences48, np pseudo-presence points were generated using the same procedureused to generate the pseudo-absences. Variation in the parameter set π = {μ, μa, μp}resulted in independent samples of the possible states of the real distribution, with allparameter combinations representing a null distribution of possible states. Therefore, ratherthan using an individual parameter combination from π, we created an ensemble49 of 336BRT models spanning reasonable ranges in π and evaluated the central tendency as themean across all 336 BRT models (see Supplementary Information C). The final ensembleBRT model was used to predict a global map of the probability of occurrence of denguevirus infection at a 5km × 5km resolution.
Bhatt et al. Page 6
Nature. Author manuscript; available in PMC 2013 October 25.
NIH
-PA Author Manuscript
NIH
-PA Author Manuscript
NIH
-PA Author Manuscript
Estimation of dengue burden and populations at riskFormal literature searches were conducted for serological dengue virus incidence surveys.Inclusion criteria were restricted to longitudinal surveys of seroconversion to dengue virus-specific antibodies carried out in parallel with active symptom surveillance in a definedcohort. The surveys were abstracted, standardised and geopositioned (see SupplementaryInformation D). In total, 54 dengue incidence surveys were collected. Of these, 39 containedinformation about the ratio of inapparent to apparent infections.
The empirical relationship between incidence and the probability of occurrence wasrepresented using a Bayesian hierarchical model. We defined a negative binomial likelihoodfunction50 with constant dispersion and a rate characterised by a highly flexible data-drivenGaussian process prior51. The Gaussian process prior was parameterised with a quadraticmean function and a squared exponential covariance function51. Uninformative hyperpriorswere assigned hierarchically to the prior parameters and the full posterior distributiondetermined by Markov Chain Monte Carlo (MCMC) sampling52. The entire model wasfitted separately for apparent and inapparent infection incidences, with missing inapparent toapparent ratio values imputed in the MCMC. Using human population gridded data for theyear 201053, estimates of apparent and inapparent dengue infections were calculatednationally, regionally and globally. These estimates were then compared to national clinicalcases reported to the WHO and differences between our cartographic estimates and theWHO surveillance estimates were reconciled in a comparative analysis addressing keyfactors in traditional surveillance underreporting (see Supplementary Information E). [973].
Supplementary MaterialRefer to Web version on PubMed Central for supplementary material.
AcknowledgmentsSIH is funded by a Senior Research Fellowship from the Wellcome Trust (#095066) which also supports SB andPWG. CPS is also funded by a Senior Research Fellowship from the Wellcome Trust (#084368). OJB is funded bya BBSRC Industrial CASE studentship. JPM, AWF, TJ, GRWW, CPS, TWS and SIH received funding from andwith SB, PWG, OJB and JJF acknowledge the contribution of the International Research Consortium on DengueRisk Assessment Management and Surveillance (IDAMS, #21803, http://www.idams.eu). This work was funded inpart by EU grant 2011- 261504 EDENEXT and the paper is catalogued by the EDENEXT Steering Committee asEDENEXT. SIH and TWS also acknowledge funding support from the RAPIDD program of the Science &Technology Directorate, Department of Homeland Security, and the Fogarty International Center, NationalInstitutes of Health.
References1. Simmons CP, Farrar JJ, van Vinh Chau N, Wills B. Dengue. N. Engl. J. Med. 2012; 366:1423–1432.
[PubMed: 22494122]
2. W.H.O. Dengue: guidelines for diagnosis, treatment, prevention and control. WHO/HTM/NTD/DEN/2009.1. World Health Organization; 2009.
3. Tatem AJ, Hay SI, Rogers DJ. Global traffic and disease vector dispersal. Proc. Natl. Acad. Sci. U.S. A. 2006; 103:6242–6247. [PubMed: 16606847]
4. Brady OJ, et al. Refining the global spatial limits of dengue virus transmission by evidence-basedconsensus. PLoS Negl. Trop. Dis. 2012; 6:e1760. [PubMed: 22880140]
5. Halstead SB. Pathogenesis of dengue: challenges to molecular biology. Science. 1988; 239:476–481. [PubMed: 3277268]
6. Endy TP, et al. Determinants of inapparent and symptomatic dengue infection in a prospective studyof primary school children in Kamphaeng Phet, Thailand. PLoS Negl. Trop. Dis. 2011; 5:e975.[PubMed: 21390158]
Bhatt et al. Page 7
Nature. Author manuscript; available in PMC 2013 October 25.
NIH
-PA Author Manuscript
NIH
-PA Author Manuscript
NIH
-PA Author Manuscript
7. Sabchareon A, et al. Protective efficacy of the recombinant, live-attenuated, CYD tetravalent denguevaccine in Thai schoolchildren: a randomised, controlled phase 2b trial. Lancet. 2012
8. Halstead SB. Dengue vaccine development: a 75% solution? Lancet. 2012
9. Gubler DJ. Dengue and dengue hemorrhagic fever. Clin. Microbiol. Rev. 1998; 11:480–469.[PubMed: 9665979]
10. Beatty ME, Letson GW, Margolis HS. Estimating the global burden of dengue. Am. J. Trop. Med.Hyg. 2009; 81(5 Suppl 1):231.
11. Van Kleef E, Bambrick H, Hales S. The geographic distribution of dengue fever and the potentialinfluence of global climate change. TropIKA.net. 2009:1–22.
12. W.H.O. International travel and health: situation as on 1 January 2012. World Health Organization;2012.
13. Hales S, de Wet N, Maindonald J, Woodward A. Potential effect of population and climatechanges on global distribution of dengue fever: an empirical model. Lancet. 2002; 360:830–834.[PubMed: 12243917]
14. Rogers DJ, Wilson AJ, Hay SI, Graham AJ. The global distribution of yellow fever and dengue.Adv. Parasitol. 2006; 62:181–220. [PubMed: 16647971]
15. Monath TP. Yellow fever and dengue-the interactions of virus, vector and host in the re-emergenceof epidemic disease. Sem Virol. 1994; 5:133–145.
16. Rigau-Perez JG, et al. Dengue and dengue haemorrhagic fever. Lancet. 1998; 352:971–977.[PubMed: 9752834]
17. Rodhain F. La situation de la dengue dans le monde. Bull Soc Pathol Exot. 1996; 89:87–90.[PubMed: 8924780]
18. Freifeld CC, Mandl KD, Reis BY, Brownstein JS. HealthMap: global infectious disease monitoringthrough automated classification and visualization of Internet media reports. J. Am. Med. Inform.Assoc. 2008; 15:150–157. [PubMed: 18096908]
19. Chakravarti A, Arora R, Luxemburger C. Fifty years of dengue in India. Trans. R. Soc. Trop. Med.Hyg. 2012; 106:273–282. [PubMed: 22357401]
20. Kakkar M. Dengue fever is massively under-reported in India, hampering our response. Br. Med. J.2012; 345:e8574. [PubMed: 23255584]
21. Murray CJL, et al. Disability-adjusted life years (DALYs) for 291 diseases and injuries in 21regions, 1990-2010: a systematic analysis for the Global Burden of Disease Study 2010. TheLancet. 2012; 380:2197–2223.
22. Cummings DA, et al. The impact of the demographic transition on dengue in Thailand: insightsfrom a statistical analysis and mathematical modeling. PLoS Med. 2009; 6:e1000139. [PubMed:19721696]
23. Johansson MA, Hombach J, Cummings DA. Models of the impact of dengue vaccines: a review ofcurrent research and potential approaches. Vaccine. 2011; 29:5860–5868. [PubMed: 21699949]
24. Hay SI, et al. Estimating the global clinical burden of Plasmodium falciparum malaria in 2007.PLoS Med. 2010; 7:e1000290. [PubMed: 20563310]
25. Gething PW, et al. A new world malaria map: Plasmodium falciparum endemicity in 2010. Malar.J. 2011; 10:378. [PubMed: 22185615]
26. Gething PW, et al. A long neglected world malaria map: Plasmodium vivax endemicity in 2010.PLoS Negl. Trop. Dis. 2012; 6:e1814. [PubMed: 22970336]
27. Anders KL, Hay SI. Lessons from malaria control to help meet the rising challenge of dengue.Lancet Infect. Dis. 2012; 12:977–984. [PubMed: 23174383]
28. Gething PW, et al. Modelling the global constraints of temperature on transmission of Plasmodiumfalciparum and P. vivax. Parasit. Vectors. 2011; 4:92. [PubMed: 21615906]
29. Chefaoui RM, Lobo JM. Assessing the effects of pseudo-absences on predictive distribution modelperformance. Ecol. Model. 2008; 210:478–486.
30. TDR/W.H.O.. Report of the Scientific Working Group on Dengue, 2006. TDR/SWG/08. TDR/World Health Organization; 2006.
Bhatt et al. Page 8
Nature. Author manuscript; available in PMC 2013 October 25.
NIH
-PA Author Manuscript
NIH
-PA Author Manuscript
NIH
-PA Author Manuscript

31. Brownstein JS, Freifeld CC, Reis BY, Mandl KD. Surveillance sans frontieres: internet-basedemerging infectious disease intelligence and the HealthMap project. PLoS Med. 2008; 5:e151.[PubMed: 18613747]
32. Scharlemann JPW, et al. Global data for ecology and epidemiology: a novel algorithm for temporalFourier processing MODIS data. PLoS One. 2008; 3:e1408. [PubMed: 18183289]
33. Hijmans RJ, Cameron SE, Parra JL, Jones PG, Jarvis A. Very high resolution interpolated climatesurfaces for global land areas. Int. J. Climatol. 2005; 25:1965–1978.
34. Focks DA, Haile DG, Daniels E, Mount GA. Dynamic life table model for Aedes aegypti (Diptera:Culcidae): analysis of the literature and model development. J. Med. Entomol. 1993; 30:1003–1017. [PubMed: 8271242]
35. Focks DA, Haile DG, Daniels E, Mount GA. Dynamic life table model for Aedes aegypti (Diptera:Culicidae): simulation and validation. J. Med. Entomol. 1993; 30:1018–1028. [PubMed: 8271243]
36. Hay SI, Tatem AJ, Graham AJ, Goetz SJ, Rogers DJ. Global environmental data for mappinginfectious disease distribution. Adv. Parasitol. 2006; 62:37–77. [PubMed: 16647967]
37. Hay SI, et al. A world malaria map: Plasmodium falciparum endemicity in 2007. PLoS Med. 2009;6:e1000048. [PubMed: 19323591]
38. Nelson, A. Estimated travel time to the nearest city of 50,000 or more people in year 2000. GlobalEnvironment Monitoring Unit - Joint Research Centre of the European Commission; 2008. (http://bioval.jrc.ec.europa.eu/products/gam
39. Nordhaus WD. Geography and macroeconomics: new data and new findings. Proc. Natl. Acad.Sci. U. S. A. 2006; 103:3510–3517. [PubMed: 16473945]
40. Elith J, et al. Novel methods improve prediction of species’ distributions from occurrence data.Ecography. 2006; 29:129–151.
41. Stevens KB, Pfeiffer DU. Spatial modelling of disease using data- and knowledge-drivenapproaches. Spat. Spatiotemporal Epidemiol. 2011; 2:125–133. [PubMed: 22748172]
42. Breiman, L. Classification and regression trees. Chapman & Hall / CRC Press LLC; 1984.
43. Friedman JH. Greedy function approximation: a gradient boosting machine. Ann. Stat. 2001;29:1189–1232.
44. Stokland JN, Halvorsen R, Stoa B. Species distribution modelling. Effect of design and sample sizeof pseudo-absence observations. Ecol. Model. 2011; 222:1800–1809.
45. Lobo JM, Tognelli MF. Exploring the effects of quantity and location of pseudo-absences andsampling biases on the performance of distribution models with limited point occurrence data. J.Nat. Conserv. 2011; 19:1–7.
46. VanDerWal J, Shoo LP, Graham C, William SE. Selecting pseudo-absence data for presence-onlydistribution modeling: how far should you stray from what you know? Ecol. Model. 2009;220:589–594.
47. Barbet-Massin M, Jiguet F, Albert CH, Thuiller W. Selecting pseudo-absences for speciesdistribution models: how, where and how many? Methods Ecol. Evol. 2012; 3:327–338.
48. Ward G, Hastie T, Barry S, Elith J, Leathwick JR. Presence-only data and the EM algorithm.Biometrics. 2009; 65:554–563. [PubMed: 18759851]
49. Araújo MB, New M. Ensemble forecasting of species distributions. Trends Ecol. Evol. 2007;22:42–47. [PubMed: 17011070]
50. Hilbe, JM. Negative binomial regression. 2nd Edition. Cambridge University Press; 2011. p. 251
51. Banerjee, S.; Carlin, BP.; Gelfand, AE. Hierarchical modeling and analysis for spatial data.Monographs on Statistics and Applied Probability 101. Chapman & Hall / CRC Press LLC; 2004.
52. Patil A, Huard D, Fonnesbeck CJ. PyMC: Bayesian stochastic modelling in Python. J. Stat. Softw.2010; 35:e1000301.
53. Balk DL, et al. Determining global population distribution: methods, applications and data. Adv.Parasitol. 2006; 62:119–156. [PubMed: 16647969]
Bhatt et al. Page 9
Nature. Author manuscript; available in PMC 2013 October 25.
NIH
-PA Author Manuscript
NIH
-PA Author Manuscript
NIH
-PA Author Manuscript

Figure 1. Global estimates of total dengue infectionsComparison of previous estimates of total global dengue infections in individuals of all ages,1985 to 2010: Halstead et al. 19885, Monath et al. 199415, Rodhain et al. 199617, Rigau-Perez et al. 199816, TDR/WHO. scientific working group 200630, Beatty et al.200910, apparent infections from this study. Estimates are aligned to the year of estimateand, if not stated, aligned to the publication date. Red shading marks the credible interval ofour current estimate, for comparison. Error bars from ref. 10 and ref. 16 replicated theconfidence intervals provided in these publications.
Bhatt et al. Page 10
Nature. Author manuscript; available in PMC 2013 October 25.
NIH
-PA Author Manuscript
NIH
-PA Author Manuscript
NIH
-PA Author Manuscript
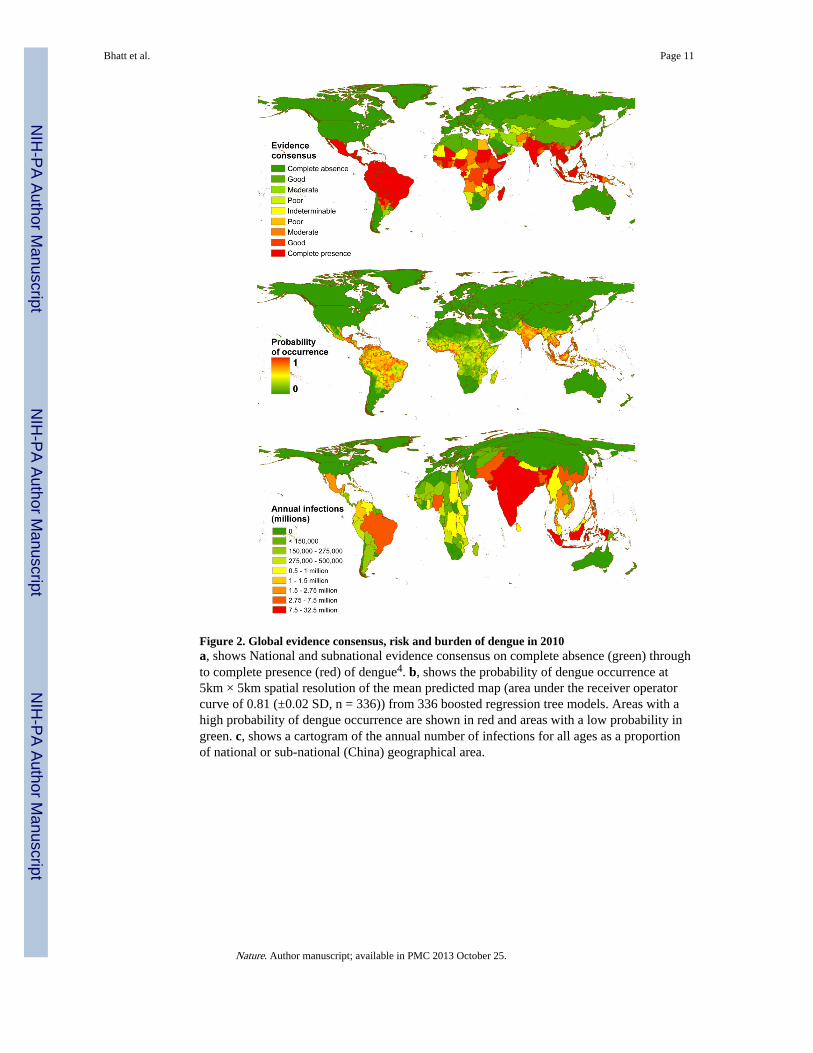
Figure 2. Global evidence consensus, risk and burden of dengue in 2010a, shows National and subnational evidence consensus on complete absence (green) throughto complete presence (red) of dengue4. b, shows the probability of dengue occurrence at5km × 5km spatial resolution of the mean predicted map (area under the receiver operatorcurve of 0.81 (±0.02 SD, n = 336)) from 336 boosted regression tree models. Areas with ahigh probability of dengue occurrence are shown in red and areas with a low probability ingreen. c, shows a cartogram of the annual number of infections for all ages as a proportionof national or sub-national (China) geographical area.
Bhatt et al. Page 11
Nature. Author manuscript; available in PMC 2013 October 25.
NIH
-PA Author Manuscript
NIH
-PA Author Manuscript
NIH
-PA Author Manuscript
NIH
-PA Author Manuscript
NIH
-PA Author Manuscript
NIH
-PA Author Manuscript
Bhatt et al. Page 12
Table 1
Estimated burden of dengue in 2010, by continent
Apparent Inapparent
Millions (credible interval) Millions (credible interval)
Africa 15.7 (10.5 - 22.5) 48.4 (34.3 - 65.2)
Asia 66.8 (47.0 – 94.4) 204.4 (151.8 – 273.0)
Americas 13.3 (9.5 - 18.5) 40.5 (30.5 - 53.3)
Oceania 0.18 (0.11 - 0.28) 0.55 (0.35 - 0.82)
Global 96 (67.1 - 135.6) 293.9 (217.0 – 392.3)
Nature. Author manuscript; available in PMC 2013 October 25.
Related Documents