The Future of Transportation: Baseball, Hot Dogs, Apple Pie and Livability? Steven E. Polzin, PhD. Center for Urban Transportation Research University of South Florida September 2010

The Future of Transportation: Baseball, Hot Dogs, Apple Pie and Livability ? Steven E. Polzin, PhD. Center for Urban Transportation Research University.
Dec 16, 2015
Welcome message from author
This document is posted to help you gain knowledge. Please leave a comment to let me know what you think about it! Share it to your friends and learn new things together.
Transcript
The Future of Transportation: Baseball,
Hot Dogs, Apple Pie and Livability?
Steven E. Polzin, PhD. Center for Urban Transportation ResearchUniversity of South Florida September 2010
Disclaimer: The observations are those of the author.
Based on comments from :
9th Annual New Partners for Smart Growth:Building Safe, Healthy, and Livable CommunitiesFebruary 2010And TRB Executive Committee Retreat “Red Meat” Session on LivabilityJune 2010
Outline
Some observations on travel behavior
Some observations on transportation and land use.

Uncertainty in The Future
While the level of understanding and the amount of data regarding travel behavior have never been better.
We haven’t been able to predict Who will win the next election, Which movie or TV show will be popular, What will be the hot Christmas gift, or, Which stocks (if any) will do well this year.
Therefore we shouldn’t apologize for uncertainty regarding future travel or land use forecasts.
But we should plan for uncertainty.
Polzin, CUTR 2010
Growth in · Income· Knowledge
Social and Economic Interactions Create Demand for Travel
Specialization in· Employment· Consumption· Socialization· Time use
Growth in · Person Travel · Commerce· Communication
Time
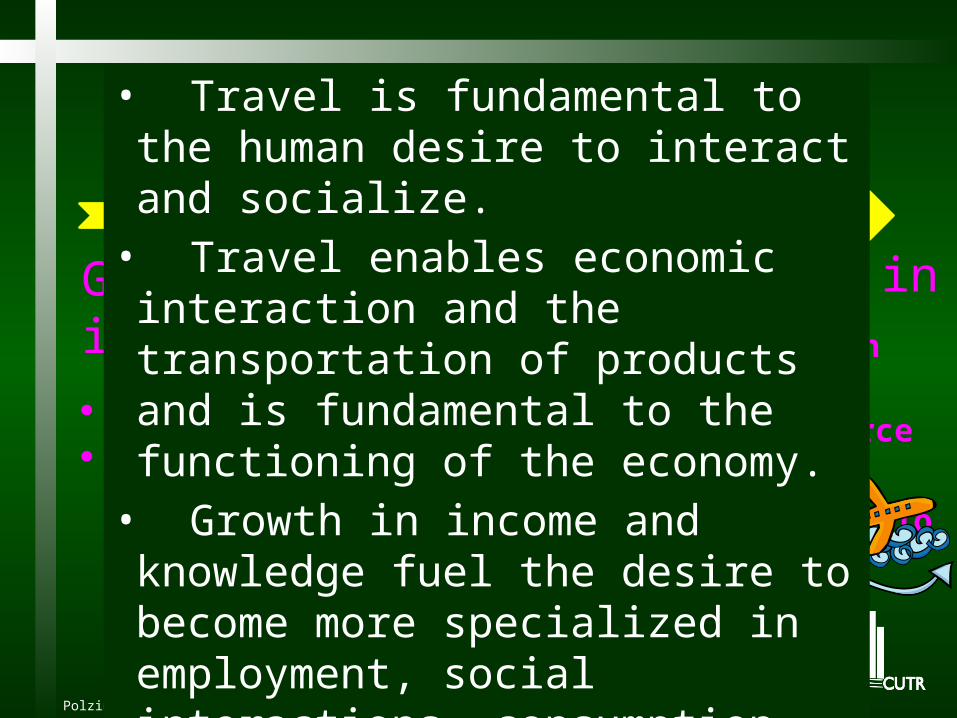
• Travel is fundamental to the human desire to interact and socialize.
• Travel enables economic interaction and the transportation of products and is fundamental to the functioning of the economy.
• Growth in income and knowledge fuel the desire to become more specialized in employment, social interactions, consumption and time use.
• This creates demand for more travel.
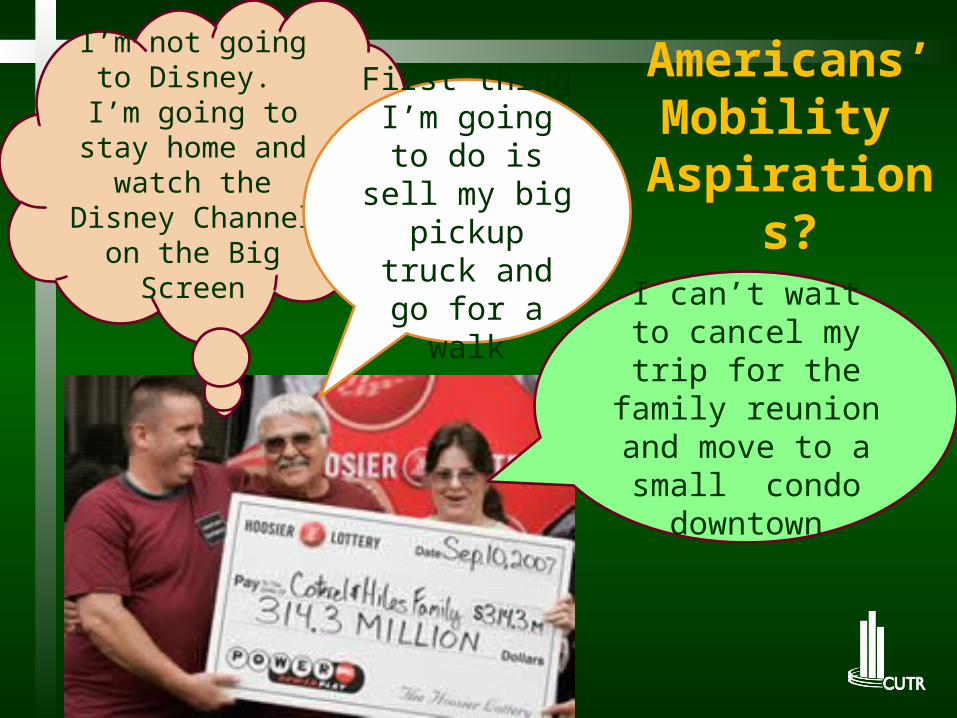
I can’t wait to cancel my trip for the family reunion and
move to a small condo downtown
I’m not going to Disney. I’m
going to stay home and watch
the Disney Channel on the
Big Screen
First thing I’m going to do is sell my big pickup
truck and go for a walk
Americans’ Mobility
Aspirations?
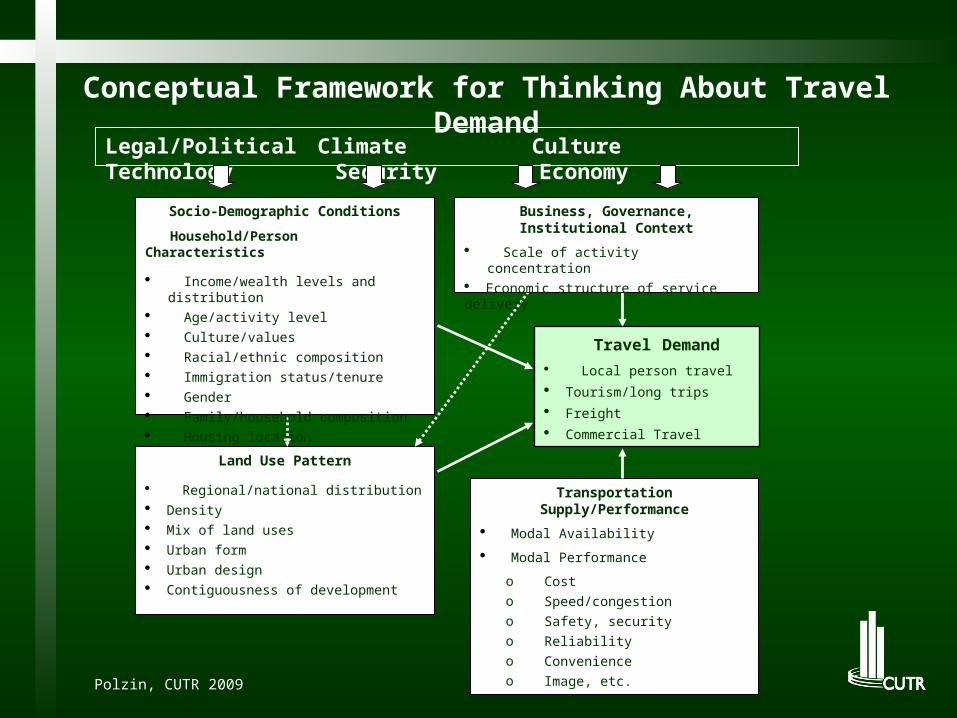
Land Use Pattern
· Regional/national distribution· Density· Mix of land uses· Urban form· Urban design· Contiguousness of development
Conceptual Framework for Thinking About Travel Demand
Travel Demand
· Local person travel
· Tourism/long trips
· Freight
· Commercial Travel
Socio-Demographic Conditions
Household/Person Characteristics
· Income/wealth levels and distribution· Age/activity level · Culture/values· Racial/ethnic composition· Immigration status/tenure· Gender· Family/household composition· Housing location
Transportation Supply/Performance
· Modal Availability
· Modal Performance
o Costo Speed/congestiono Safety, securityo Reliabilityo Convenienceo Image, etc.o Multi-tasking opportunities
Legal/Political Climate Culture Technology Security Economy
Business, Governance, Institutional Context
· Scale of activity concentration· Economic structure of service delivery
Polzin, CUTR 2009
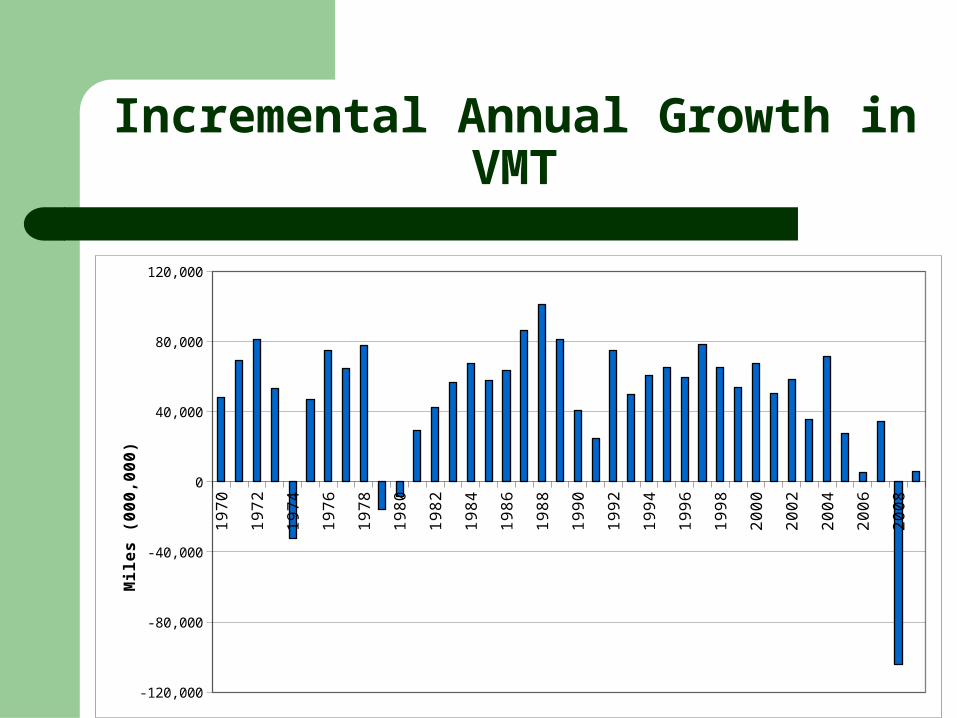
Incremental Annual Growth in VMT1
97
01
97
11
97
21
97
31
97
41
97
51
97
61
97
71
97
81
97
91
98
01
98
11
98
21
98
31
98
41
98
51
98
61
98
71
98
81
98
91
99
01
99
11
99
21
99
31
99
41
99
51
99
61
99
71
99
81
99
92
00
02
00
12
00
22
00
32
00
42
00
52
00
62
00
7*
20
08
20
09
-120,000
-80,000
-40,000
0
40,000
80,000
120,000
Mile
s (
00
0,0
00
)

VMT and Population Growth Trends19
7019
7119
7219
7319
7419
7519
7619
7719
7819
7919
8019
8119
8219
8319
8419
8519
8619
8719
8819
8919
9019
9119
9219
9319
9419
9519
9619
9719
9819
9920
0020
0120
0220
0320
0420
0520
0620
07*
2008
2009
-4%
-2%
0%
2%
4%
6%
8%
VMT Change (each year) VMT Change (annualized 5-yr. Avg.) Population Change

Per Capita VMT
10
7,500
8,000
8,500
9,000
9,500
10,000
10,500
0
500,000
1,000,000
1,500,000
2,000,000
2,500,000
3,000,000
3,500,000
19
90
19
91
19
92
19
93
19
94
19
95
19
96
19
97
19
98
19
99
20
00
20
01
20
02
20
03
20
04
20
05
20
06
20
07
20
08
20
09
Per C
apita
Ann
ual V
MT
Tota
l VM
T (0
00,0
00)
Total VMT and VMT per capita
VMT
VMT per capita

11
Factors Contributing to US VMT Growth 1977-2001
Source: CUTR analysis of NHTS and NPTS
Trip Length
10%
Mode Shifts16%
Trip Frequency
46%
Population28%

Trip Rate and Length
12
1975 1980 1985 1990 1995 2000 2005 20100
200
400
600
800
1000
1200
1400
1600
6.0
7.0
8.0
9.0
10.0
11.0
12.0
13.0
14.0
8.87 8.689.29
9.00
9.80 9.85
994
978
1272
1457 1483
1297
Person Trips Per Person Per Year
Person Miles of Travel Per Person Trip
An
ua
l Tri
ps
Tri
p L
en
gth

NPTS and NHTS Work Trip Walking Mode Shares
13
0%
1%
2%
3%
4%
5%
6%
0.045
0.04
0.023
0.02920.032
Series15.00%
4.60%4.10%
3.70%2.60%
2.81%2.80%
Work Trip "Usual Mode"
Work Trip Actual ModePe
rce
nt
Wa
lkin
g t
o w
ork
Walk is 10.95% of all trips in 2008

Census Work Trip Percent Walking to Work Mode Share
14
1960 1965 1970 1975 1980 1985 1990 1995 2000 20050%
2%
4%
6%
8%
10%
12%
10.40%
7.40%
5.60%
3.90%
2.90%
2.82%
Pe
rce
nt W
alk
ing
to W
ork
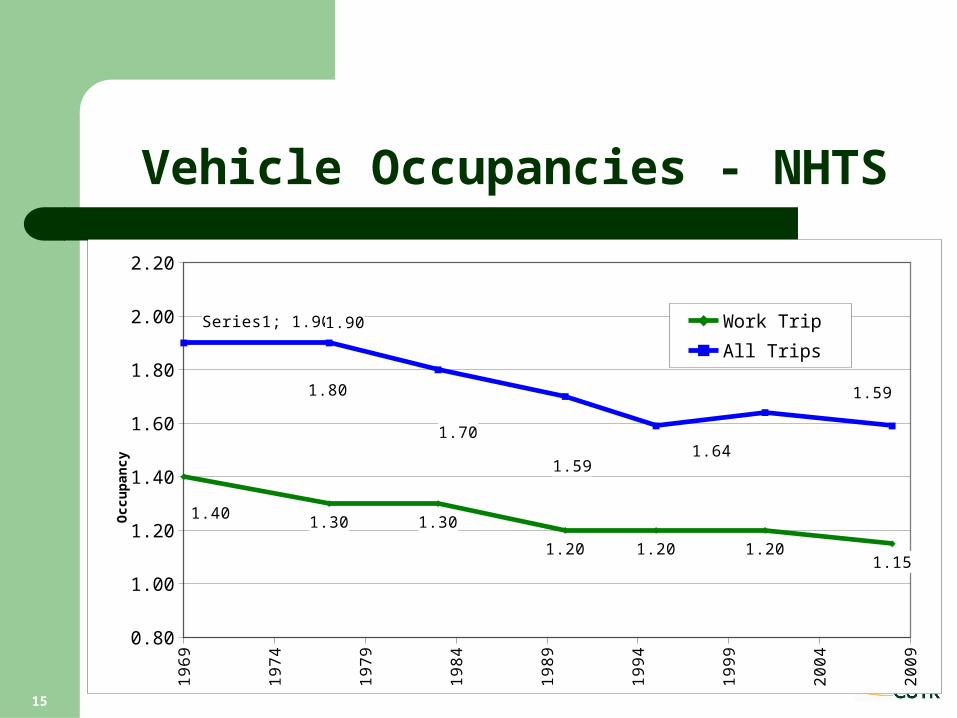
Vehicle Occupancies - NHTS
15
19
69
19
74
19
79
19
84
19
89
19
94
19
99
20
04
20
09
0.80
1.00
1.20
1.40
1.60
1.80
2.00
2.20
Series1; 1.90 1.90
1.80
1.70
1.591.64
1.59
1.40 1.30 1.30
1.20 1.20 1.201.15
Work Trip
All Trips
Occ
up
ancy
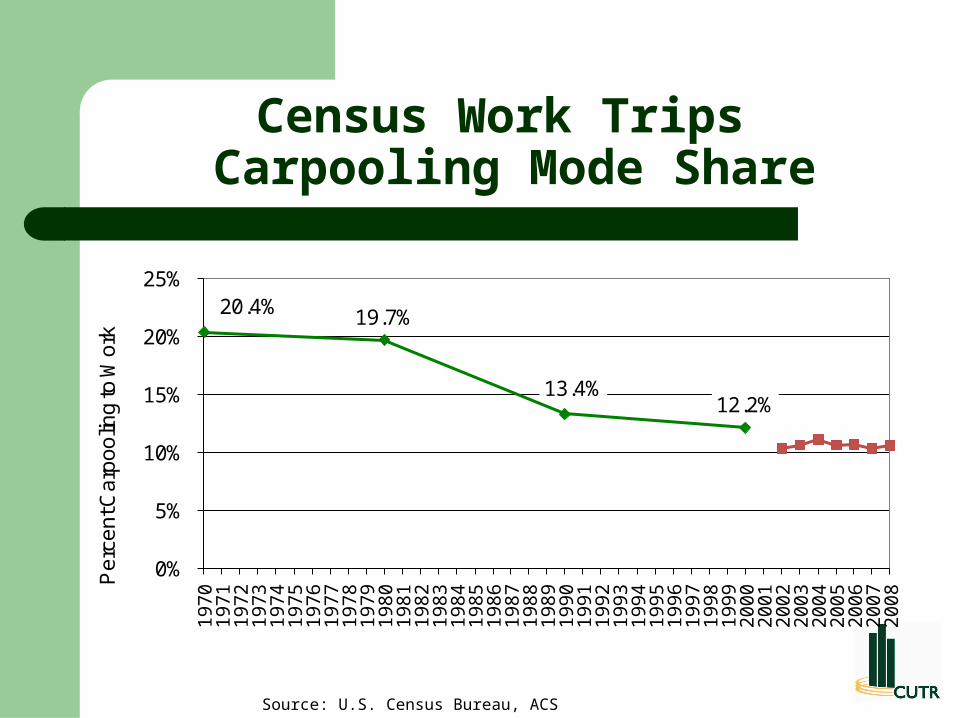
Census Work Trips Carpooling Mode Share
20.4% 19.7%
13.4%12.2%
0%
5%
10%
15%
20%
25%
19
70
19
71
19
72
19
73
19
74
19
75
19
76
19
77
19
78
19
79
19
80
19
81
19
82
19
83
19
84
19
85
19
86
19
87
19
88
19
89
19
90
19
91
19
92
19
93
19
94
19
95
19
96
19
97
19
98
19
99
20
00
20
01
20
02
20
03
20
04
20
05
20
06
20
07
20
08P
erc
en
t Ca
rpo
olin
g to
Wo
rk
Source: U.S. Census Bureau, ACS

Transit Mode Share Trends
17
1968197019721974197619781980198219841986198819901992199419961998200020022004200620080%
1%
2%
3%
4%
5%
6%
7%
8%
9%
10%
0.05110.0505
0.0536
1.76%
3.40%
2.70% 2.70% 2.20% 1.81% 1.56%
2.27%
0.046
0.0356 0.03670.0406
8.90%
6.40%
5.30%
4.70%
Census Journey to Work, Usual Mode
NPTS/NHTS Work Trips, Survey Day
NPTS/NHTS All Trips
NHTS 2001 Adjusted
NHTS Work Trip, Work Trip Usual Mode
Pe
rce
nt o
n T
ran
sit

Minutes of Travel per Person 5+ per Day
18
1983 1990 adj. 1995 2001 20080
10
20
30
40
50
60
70
80
90
49.2
62.8
71.2
83.9
75.7
Min
ute
s
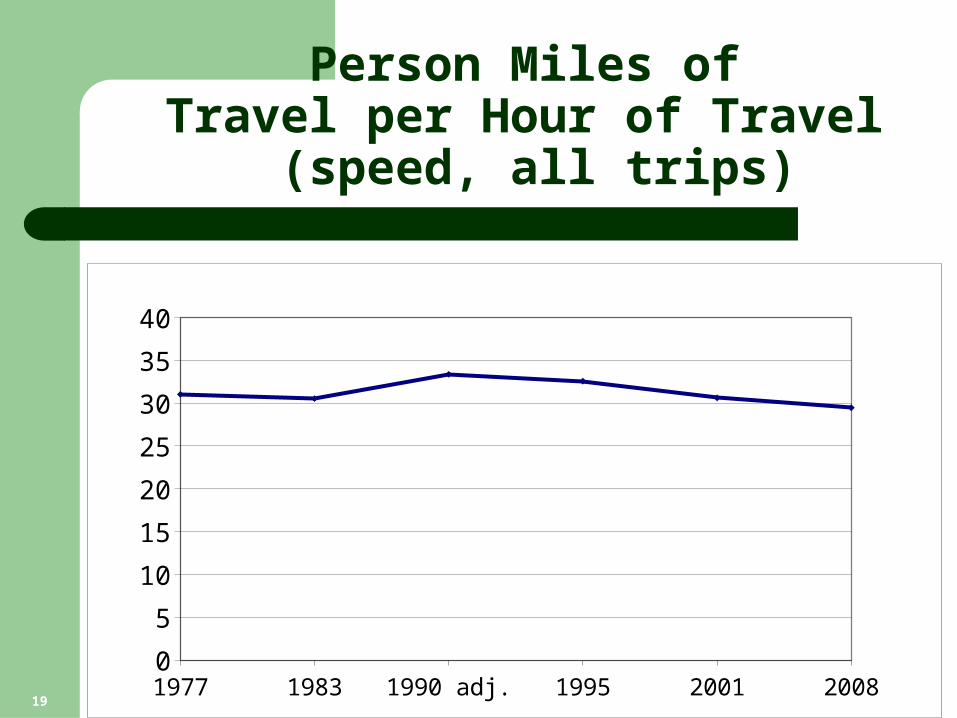
Person Miles of Travel per Hour of Travel
(speed, all trips)
191977 1983 1990 adj. 1995 2001 20080
5
10
15
20
25
30
35
40

Vehicle Availability
20
1969 1974 1979 1984 1989 1994 1999 2004 20090
0.2
0.4
0.6
0.8
1
1.2
1.4
1.6
Vehicles per workerVehicles per person 16 and olderVehicles per driver
Ve
hic
les
pe
r
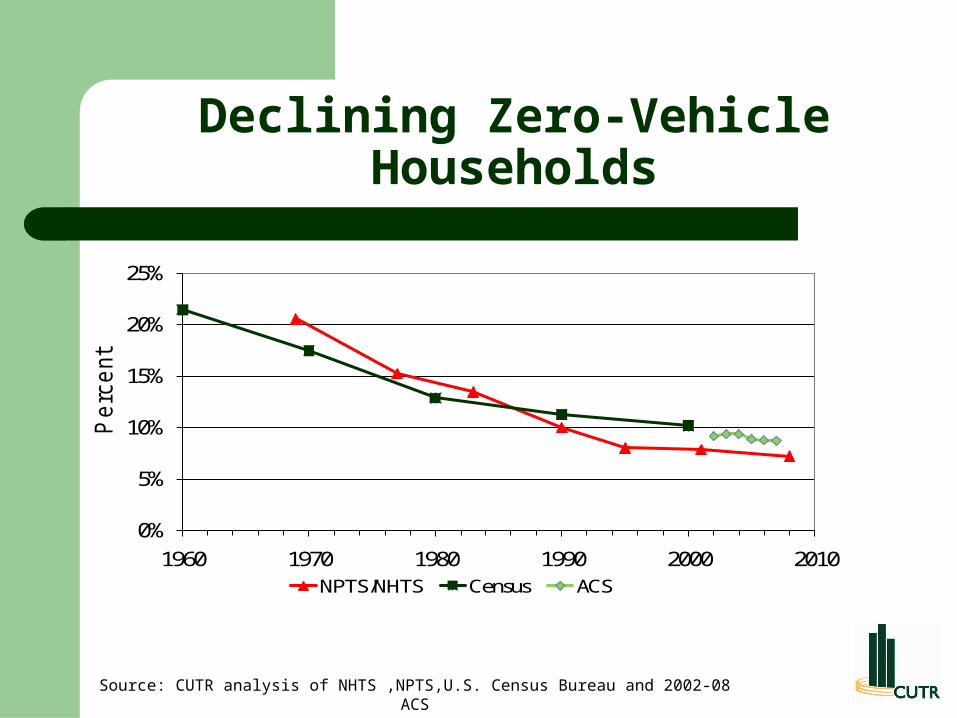
Declining Zero-Vehicle Households
0%
5%
10%
15%
20%
25%
1960 1970 1980 1990 2000 2010
Perc
ent
NPTS/NHTS Census ACS
Source: CUTR analysis of NHTS ,NPTS,U.S. Census Bureau and 2002-08 ACS
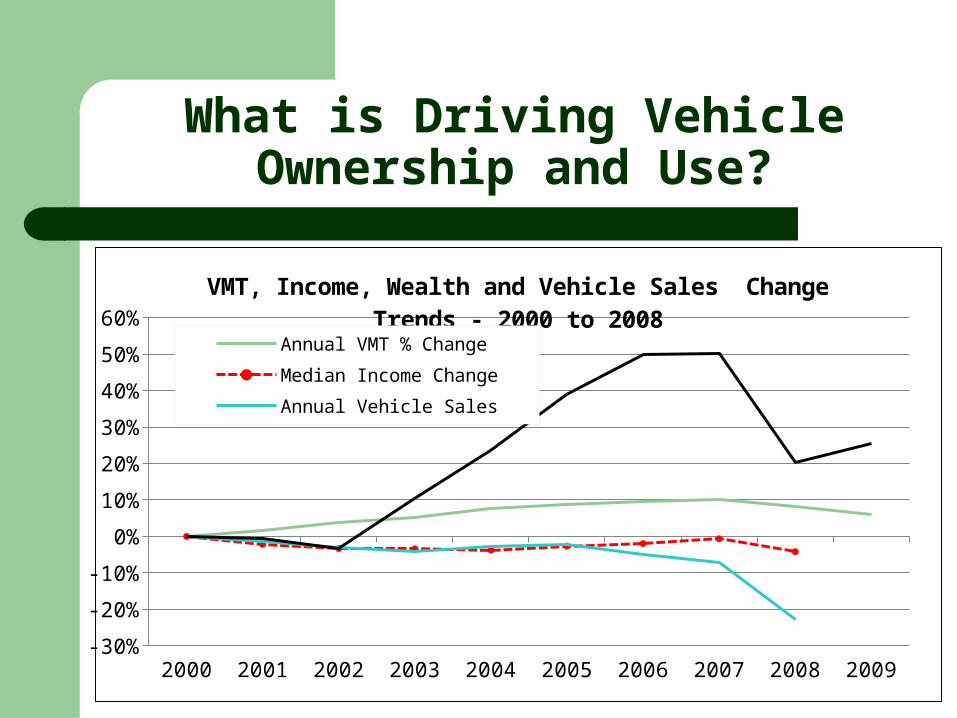
What is Driving Vehicle Ownership and Use?
2000 2001 2002 2003 2004 2005 2006 2007 2008 2009-30%
-20%
-10%
0%
10%
20%
30%
40%
50%
60%
VMT, Income, Wealth and Vehicle Sales Change Trends - 2000 to 2008
Annual VMT % ChangeMedian Income ChangeAnnual Vehicle SalesHousehold Wealth

Transportation and Land Use
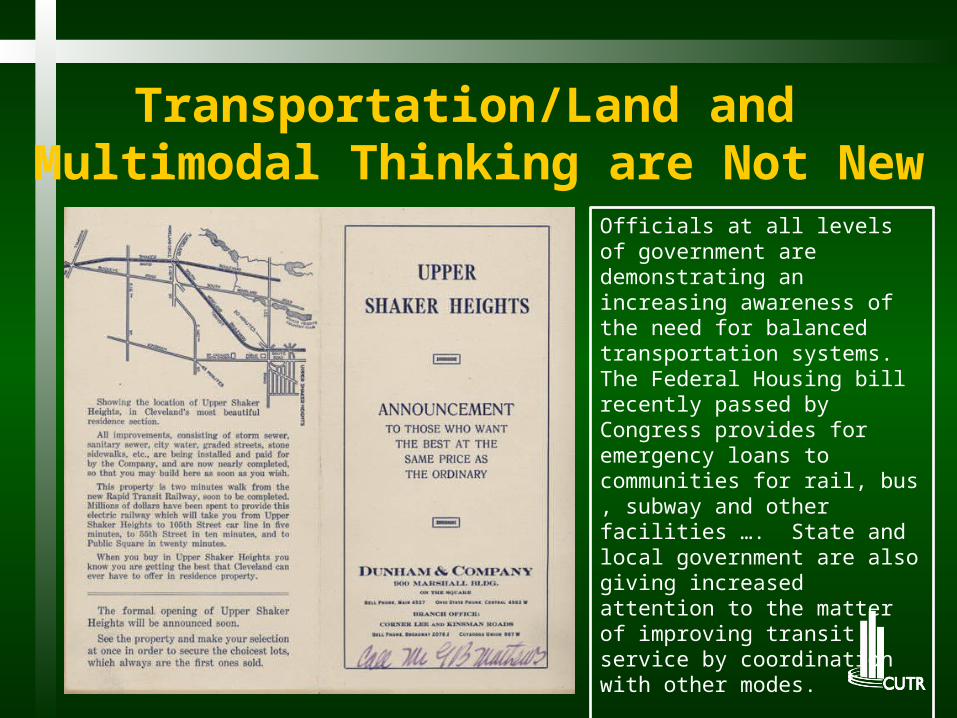
Transportation/Land and Multimodal Thinking are Not New
Officials at all levels of government are demonstrating an increasing awareness of the need for balanced transportation systems. The Federal Housing bill recently passed by Congress provides for emergency loans to communities for rail, bus , subway and other facilities …. State and local government are also giving increased attention to the matter of improving transit service by coordination with other modes.
Wilbur S. Smith, ASCE Annual Meeting October 1961
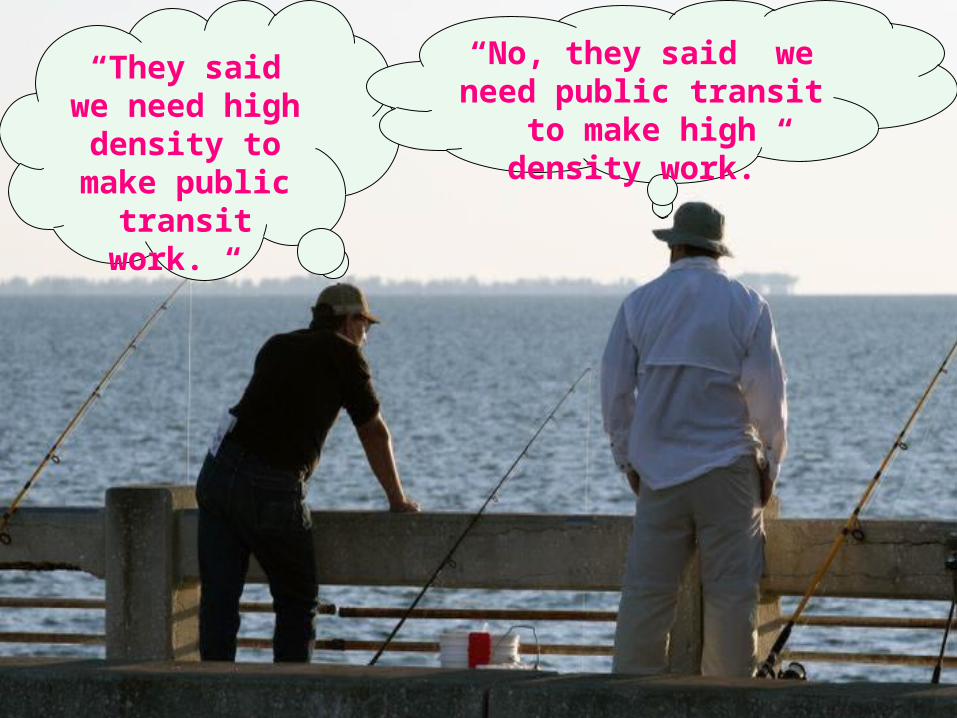
25
“They said we need high
density to make public transit
work. “
“No, they said we need public transit to make high density work.”
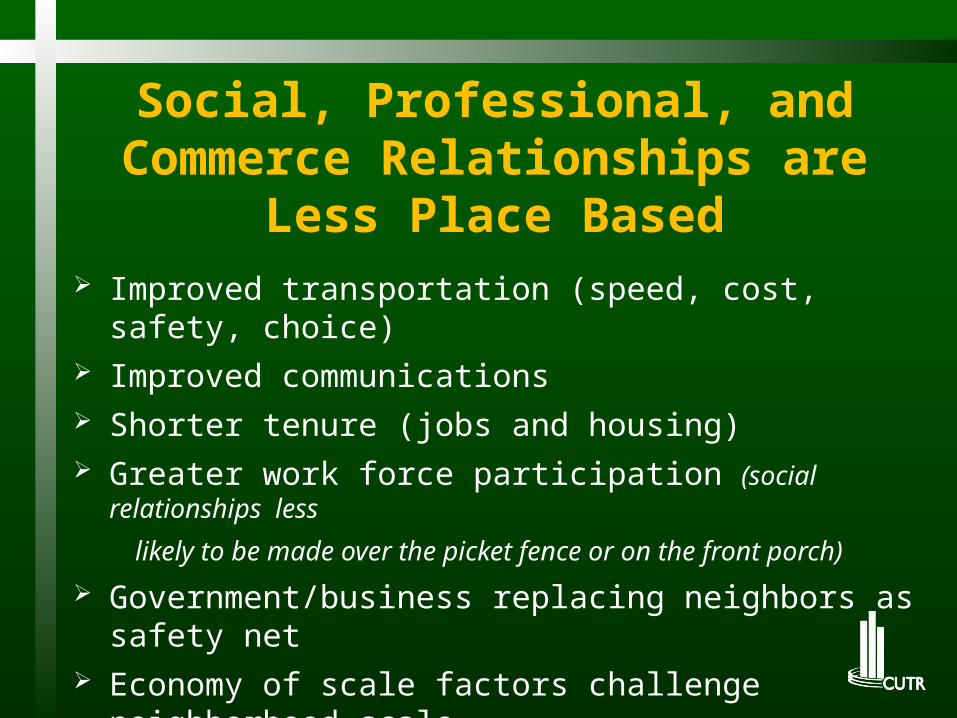
Social, Professional, and Commerce Relationships are
Less Place Based Improved transportation (speed, cost, safety,
choice) Improved communications Shorter tenure (jobs and housing) Greater work force participation (social relationships
less
likely to be made over the picket fence or on the front porch)
Government/business replacing neighbors as safety net
Economy of scale factors challenge neighborhood-scale
businesses and enterprises. (Technology and government regulation enhance the strength of economy of scale. )
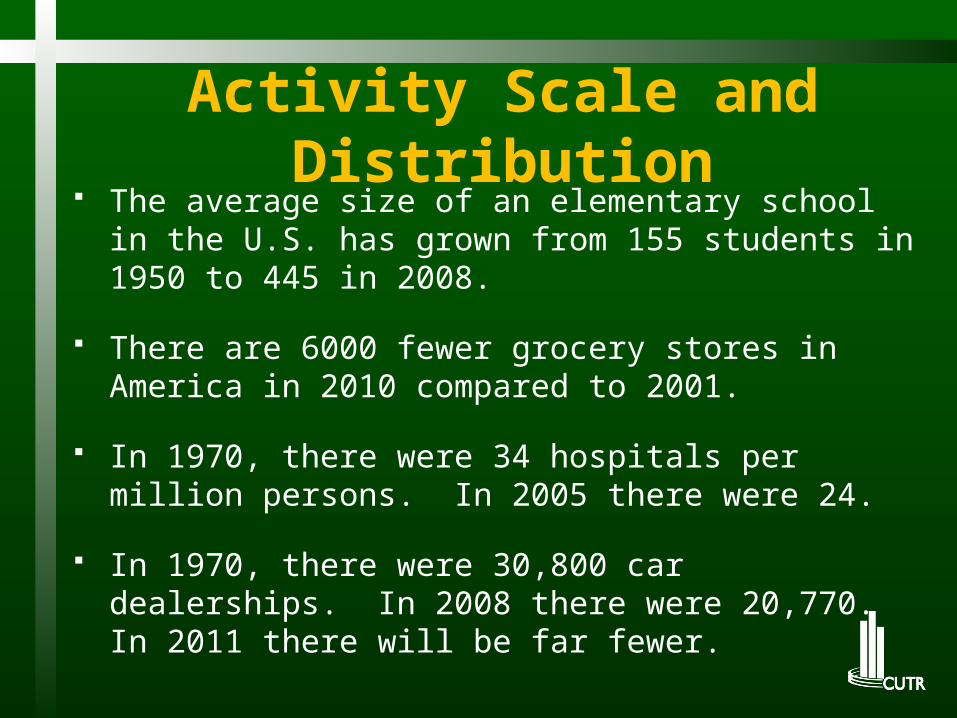
Activity Scale and Distribution
The average size of an elementary school in the U.S. has grown from 155 students in 1950 to 445 in 2008.
There are 6000 fewer grocery stores in America in 2010 compared to 2001.
In 1970, there were 34 hospitals per million persons. In 2005 there were 24.
In 1970, there were 30,800 car dealerships. In 2008 there were 20,770. In 2011 there will be far fewer.

Do Business Economics Contradict Travel
Minimization 1940 - Went to the Doctor
2010 - Went to the general practitioner, referred you to the specialist, sent to lab, scanning center, pharmacist, and the physical therapist (and not the closest one but the one covered by your health plan).
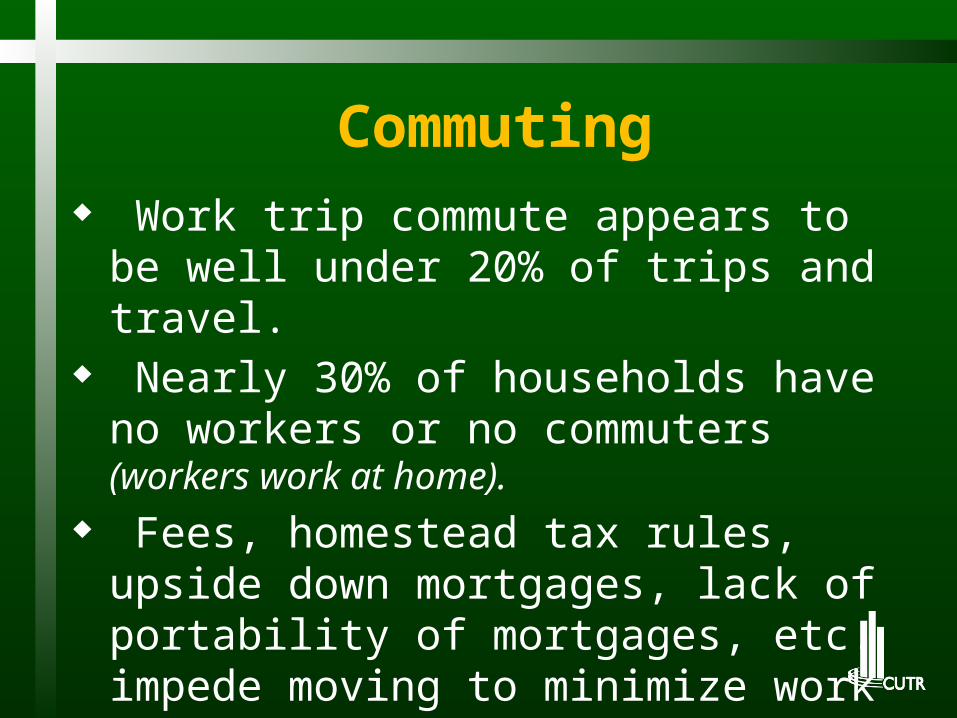
Commuting Work trip commute appears to be
well under 20% of trips and travel. Nearly 30% of households have no
workers or no commuters (workers work at home).
Fees, homestead tax rules, upside down mortgages, lack of portability of mortgages, etc. impede moving to minimize work trip length.
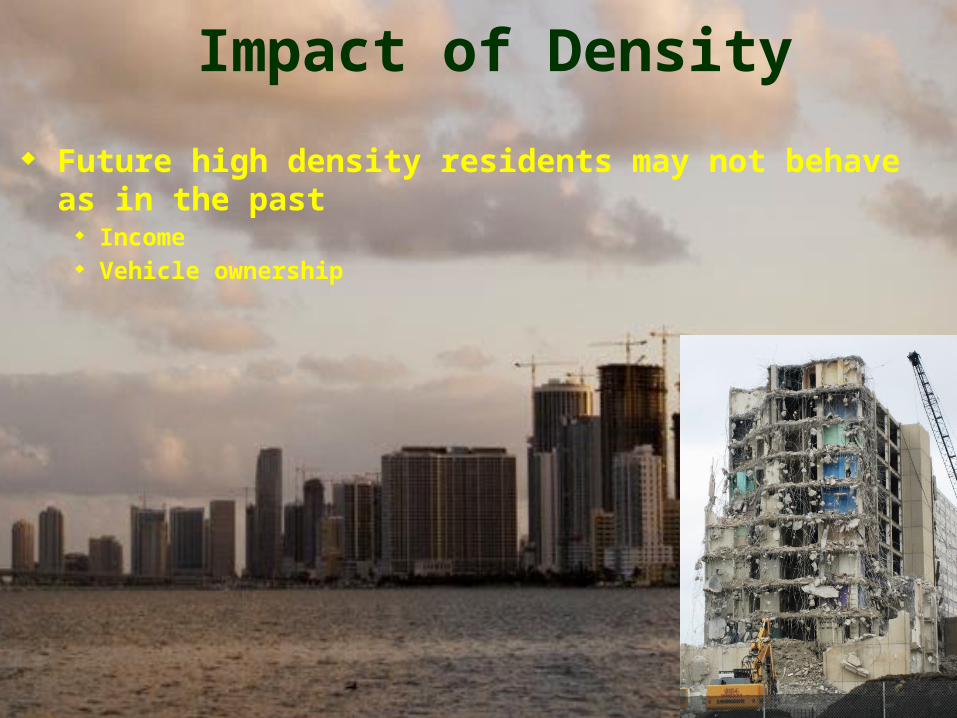
Impact of Density Future high density residents may not behave
as in the past Income Vehicle ownership
Impact of Density
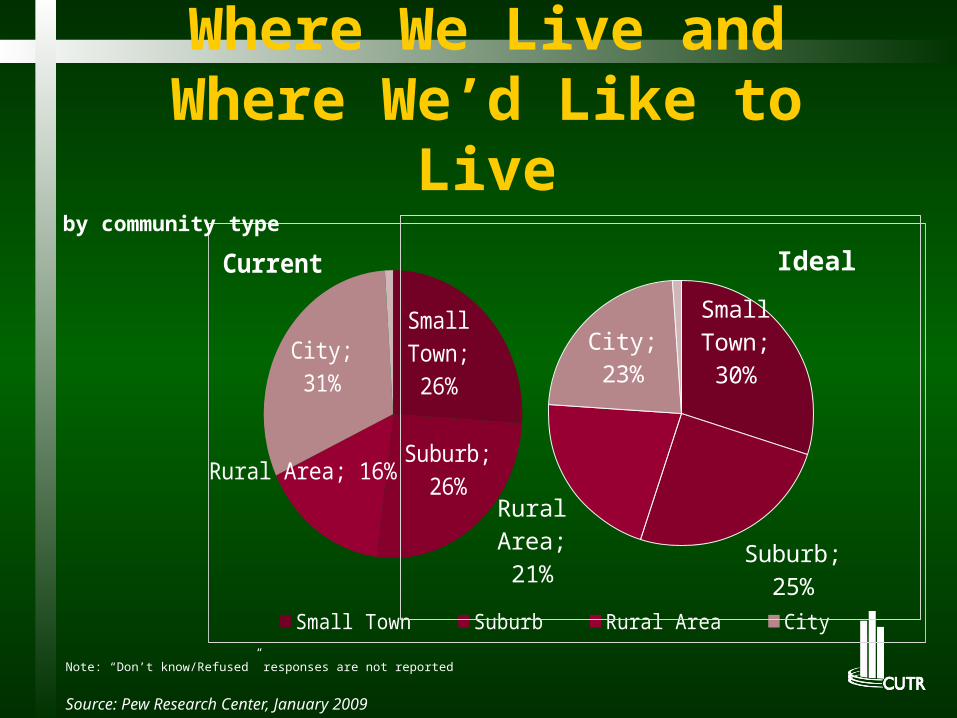
Where We Live and Where We’d Like to
Live
Note: “Don’t know/Refused” responses are not reported
Small Town; 26%
Suburb; 26%
Rural Area; 16%
City; 31%
Current
Small Town Suburb Rural Area City
Small Town; 30%
Suburb; 25%
Rural Area; 21%
City; 23%
Ideal
Source: Pew Research Center, January 2009
by community type
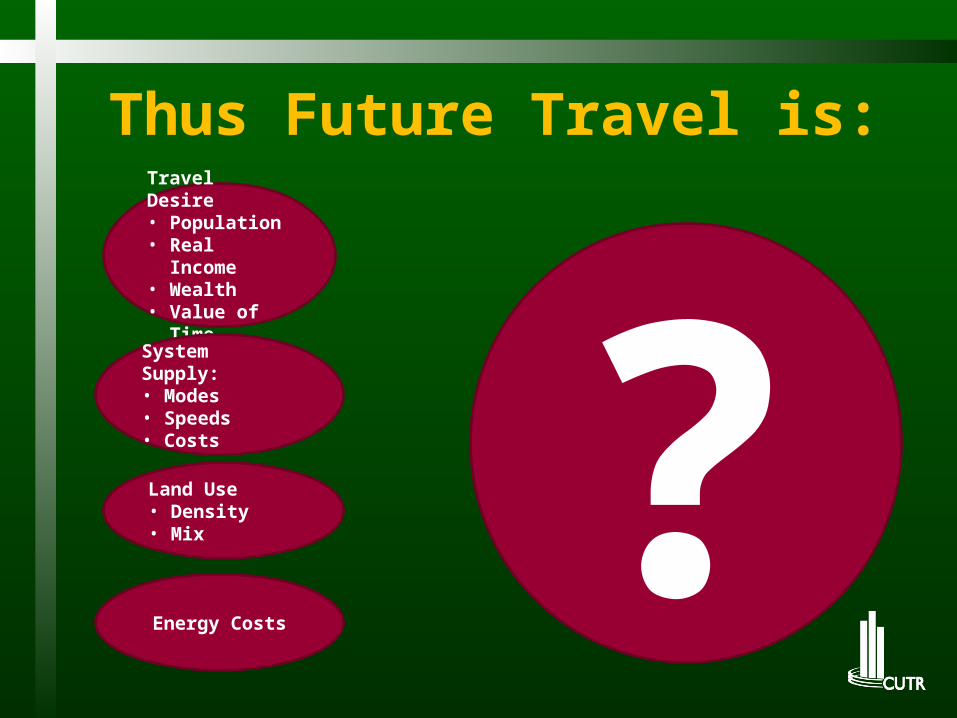
Thus Future Travel is:
Energy Costs
?Land Use• Density• Mix
Travel Desire• Population• Real
Income• Wealth• Value of
Time
System Supply:• Modes• Speeds• Costs

Comments on Non-Urban Travel?
One vacation is equivalent to up to a 10 mile per day longer commute
How does city rebuilding compare to other mobility accommodating strategies? (Is a country that won’t raise gas taxes a dime willing to transform urban America?)
Managing regional growth versus urban growth.
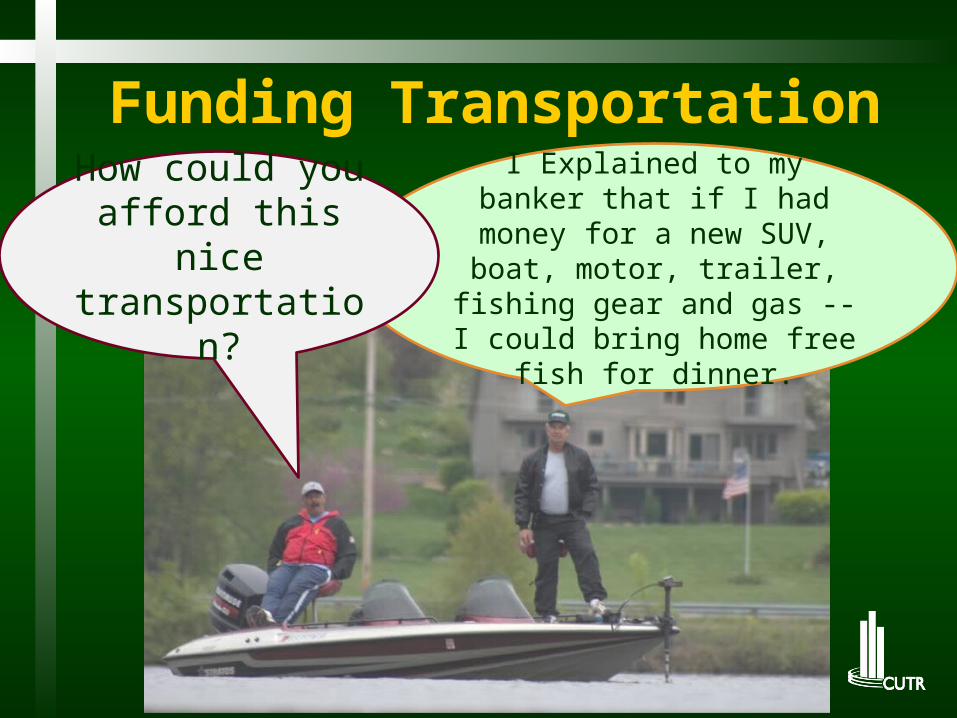
Funding Transportation
I Explained to my banker that if I had money for a new SUV, boat, motor,
trailer, fishing gear and gas -- I could bring home free
fish for dinner.
How could you afford this nice transportation?

$100,000 worth of Tata NanosSteven E. Polzin, Ph.D.Center for Urban Transportation [email protected]

36
Future Travel Demand in Hillsborough County: How Much Demand Could be Handled by Rail?
Based on Daily Person Miles of Travel (PMT)
Transit 2005
New travel by vehicle 2025
New Transit 2025
Person travel by vehicle 2005
Denver LRT
Salt Lake LRTDallas LRTAll Other U.S. LRT
Source: NTD, Hills. MPO 2025 LRP
Portland LRT
The total travel on all the U.S. LRT systems is equivalent to about 1/3 of the expected growth in travel in Hillsborough County.
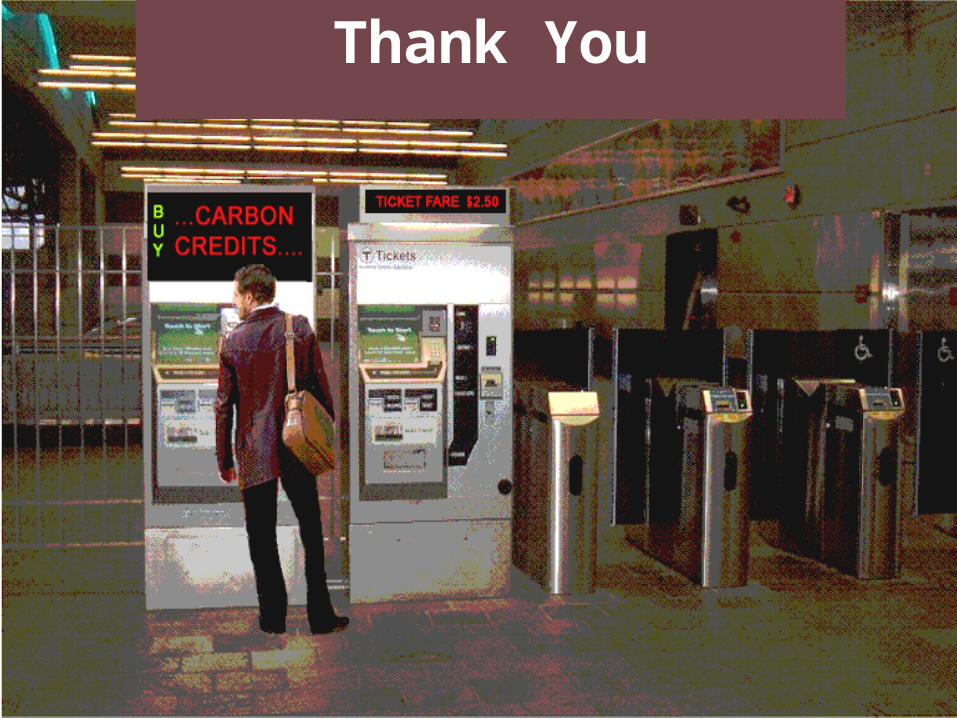
Thank You
38
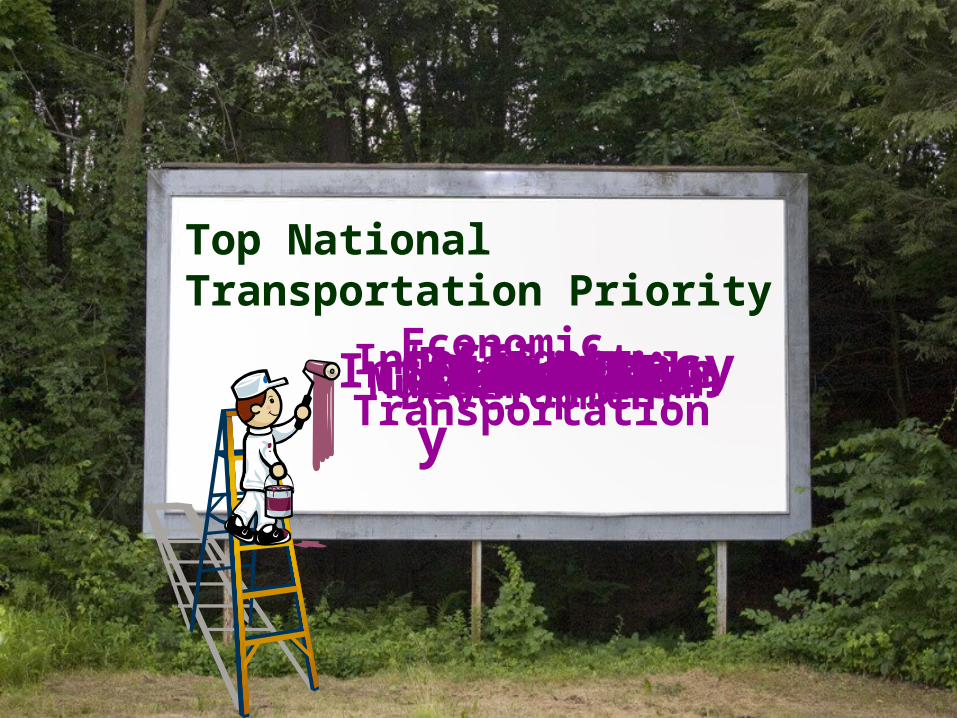
Top National Transportation Priority
SafetyMultimodalismSustainableIntermodalismCoordinationOne DOTEconomic DevelopmentEfficiencyIntelligent
Transportation LivabilityJobs
Related Documents