THE FUTURE OF PRODUCTIVITY Dan Andrews (Economics Department) Chiara Criscuolo (Directorate for Science, Technology and Innovation) Global Dialogue on The Future of Productivity Mexico City | 6 July 2015 … productivity isn't everything, but in the long run it is almost everything. Paul Krugman, 1994

The-future-of-productivity-global-dialogue-on-the-future-of-productivity-mexico-city-6-july-2015
Aug 05, 2015
Welcome message from author
This document is posted to help you gain knowledge. Please leave a comment to let me know what you think about it! Share it to your friends and learn new things together.
Transcript

THE FUTURE OF PRODUCTIVITY
Dan Andrews (Economics Department)
Chiara Criscuolo (Directorate for Science, Technology and Innovation)
Global Dialogue on The Future of ProductivityMexico City | 6 July 2015
… productivity isn't everything, but in the long run it is almost everything.
Paul Krugman, 1994

2
1. Productivity: now more than ever
2. Thinking about productivity: frontier firms and diffusion
3. Productivity in a globalised world: structural and policy drivers
4. Policy messages and issues for future research
Outline

3
PRODUCTIVITY: NOW MORE THAN EVER

4
Differences in GDP per capita
Percentage differences compared with the upper half of OECD countries, 2013
Source: OECD Going for Growth Database.

5
Differences in GDP per capita mostly reflect labour productivity gaps
Percentage differences compared with the upper half of OECD countries, 2013
Source: OECD Going for Growth Database.

6
Productivity growth slowed across the OECD, even before the crisis
Labour productivity growth since 1990GDP per hour worked (China and India refer to GDP per worker)
Source: OECD calculations based on the Conference Board Total Economy Database.

7
• Techno-pessimists vs techno-optimists
• Given this uncertainty, we need to find sources of productivity growth where there is large and sure scope for improvement.
• Two key sources of growth emerge:
1. Effective diffusion
2. Efficient resource allocation, especially skills.
• Effective diffusion and skill matching can be good for both growth and equity.
Productivity will be the key driver of future growth but uncertain outlook

8
THINKING ABOUT PRODUCTIVITY: FRONTIER FIRMS AND DIFFUSION

9
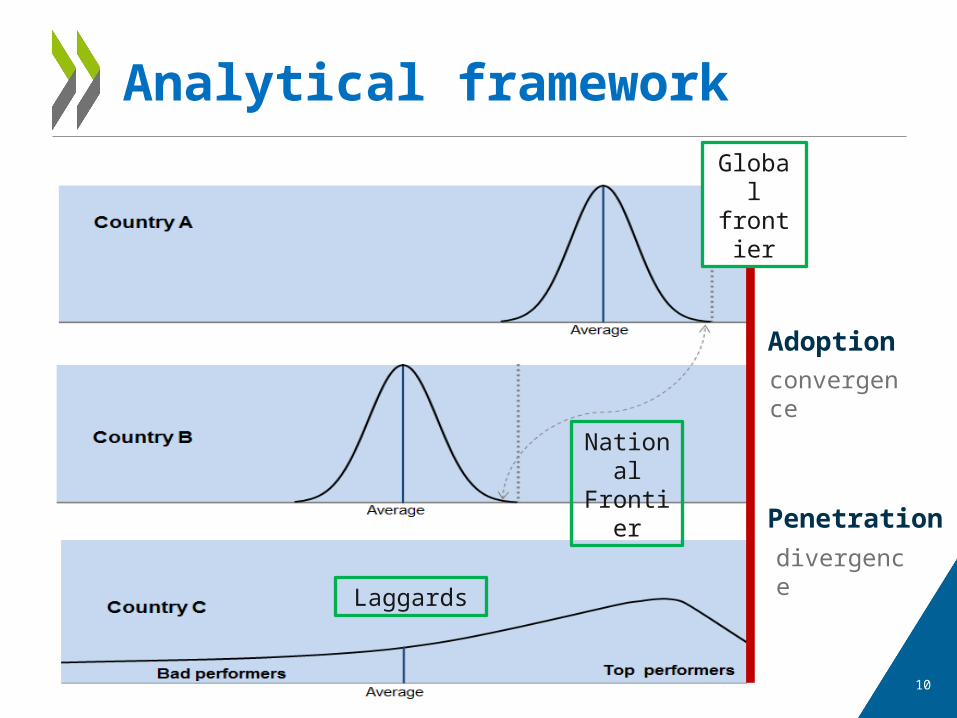
1. Widespread heterogeneity: very high MFP and very low MFP firms coincide within narrowly-defined industries.
2. Adoption lags for new technologies across countries have fallen, but long-run penetration rates once technologies are adopted have diverged (Comin & Mestieri, 2013).
3. MFP growth of laggard firms is more closely related to productivity developments at the national frontier (NF), as opposed to the global frontier (GF).
New GF technologies do not immediately diffuse to all firms. They are first adopted by NF firms, and diffuse to laggards once they are adapted to national circumstances.
Analytical framework
10
Analytical framework
Global frontier
National Frontier
Laggards
Adoptionconvergence
Penetrationdivergence

11
The breakdown of the diffusion machine
Solid growth at the global productivity frontier but spillovers disappointedLabour productivity; index 2001=0
Source: Andrews, D. C. Criscuolo and P. Gal (2015), “Frontier firms, technology diffusion and public policy: micro evidence from OECD countries”, OECD Mimeo.
12
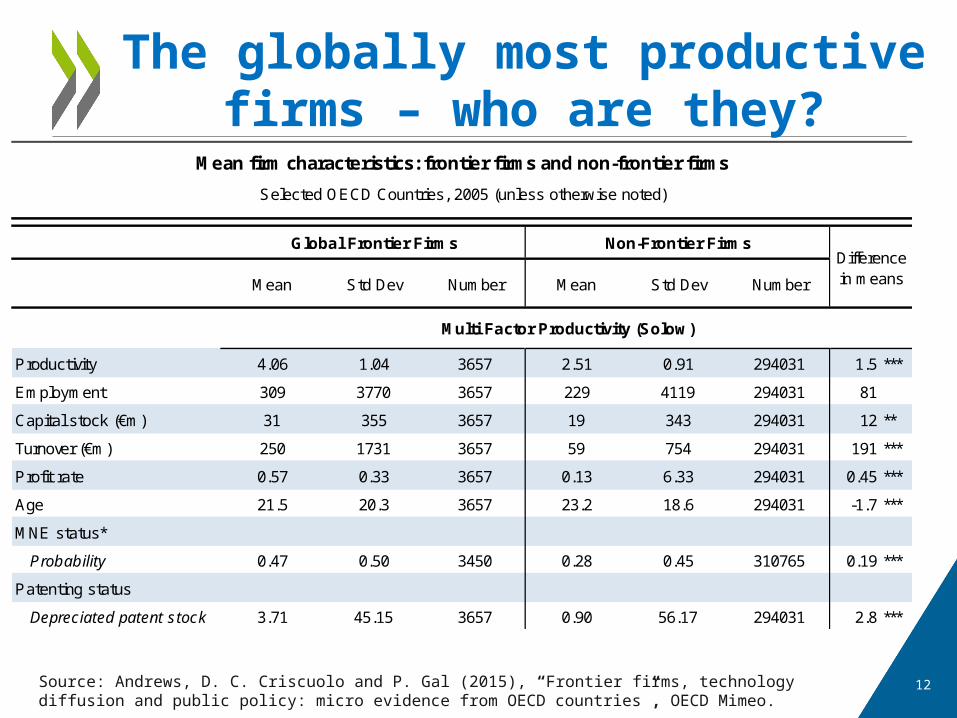
The globally most productive firms – who are they?
Source: Andrews, D. C. Criscuolo and P. Gal (2015), “Frontier firms, technology diffusion and public policy: micro evidence from OECD countries”, OECD Mimeo.
Mean Std Dev Number Mean Std Dev Number
Productivity 4.06 1.04 3657 2.51 0.91 294031 1.5 ***
Employment 309 3770 3657 229 4119 294031 81
Capital stock (€m) 31 355 3657 19 343 294031 12 **
Turnover (€m) 250 1731 3657 59 754 294031 191 ***
Profit rate 0.57 0.33 3657 0.13 6.33 294031 0.45 ***
Age 21.5 20.3 3657 23.2 18.6 294031 -1.7 ***
MNE status*
Probability 0.47 0.50 3450 0.28 0.45 310765 0.19 ***
Patenting status
Depreciated patent stock 3.71 45.15 3657 0.90 56.17 294031 2.8 ***
Multi Factor Productivity (Solow)
Selected OECD Countries, 2005 (unless otherwise noted)
Global Frontier Firms Non-Frontier FirmsDifference in means
Mean firm characteristics: frontier firms and non-frontier firms

13
Firms at the global productivity frontier have become older
Average age (years) of firms in the frontier and non-frontier groups
Source: Andrews, D. C. Criscuolo and P. Gal (2015), “Frontier firms, technology diffusion and public policy: micro evidence from OECD countries”, OECD Mimeo.
Manufacturing Services
TFPnace2Solow W4_ManufacturingTFPnace2Solow W4_ServicesTFPnace2Solow W4_ManufacturingTFPnace2Solow W4_Services
Notes: Frontier is measured by the top 100 f irms in each 2-digit industry and each year, based on Solow residual-based MFP.
15
20
25
30Non-frontier Frontier
15
20
25
30Non-frontier Frontier
14
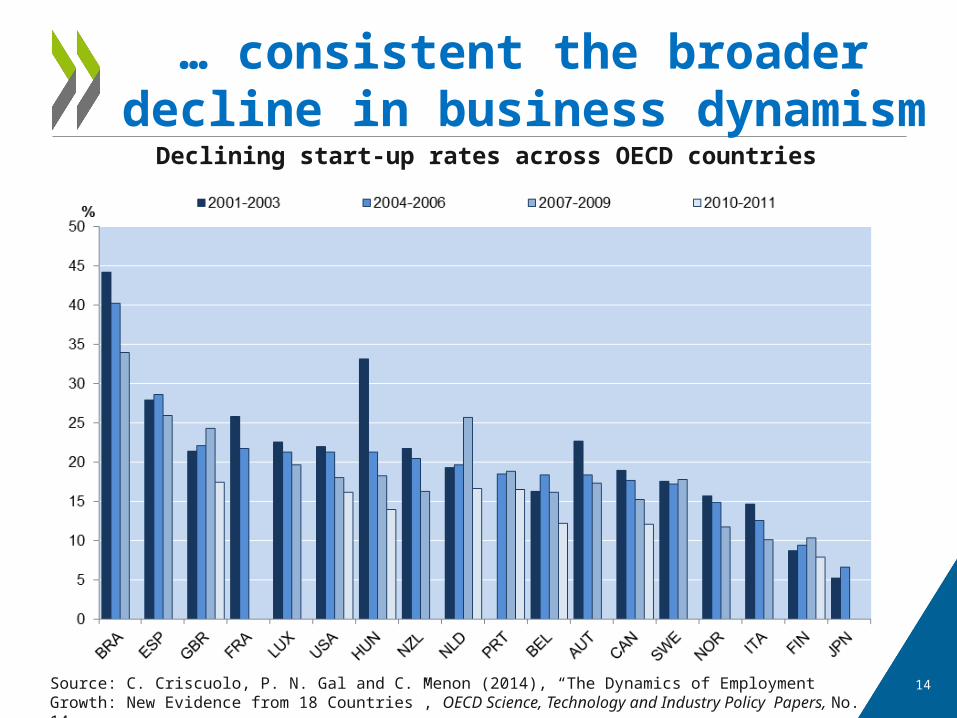
… consistent the broader decline in business dynamism
Declining start-up rates across OECD countries
Source: C. Criscuolo, P. N. Gal and C. Menon (2014), “The Dynamics of Employment Growth: New Evidence from 18 Countries”, OECD Science, Technology and Industry Policy Papers, No. 14.

15
PRODUCTIVITY IN A GLOBALISED WORLD: STRUCTURAL & POLICY DRIVERS

16
Three areas for policy:
1. Pushing out the global frontier
2. Reviving the diffusion machine
3. More efficient resource allocation, especially skills.
Note: #2 partly depends on getting #3 right
How to revive productivity growth?

17
• Higher and more efficient public investment in basic research.– Role for international co-operation?
• Enabling experimentation of firms with new technologies and business models.– Reduce barriers to firm entry and exit to
enable high productivity firms to grow and low productivity firms to exit.
Pushing the frontier: keep the innovation engine running

18
Reviving the diffusion machine: structural factors shape diffusion
Estimated frontier spillover (% pa) associated with a 2% point increase in MFP growth at the global productivity frontier
Source: Saia, A., D. Andrews and S. Albrizio (2015), “Public Policy and Spillovers From the Global Productivity Frontier: Industry Level Evidence”, OECD Economics Department Working Papers, No. 1238.
Globalisation Reallocation Knowledge-Based Capital

19
Services are the oil that greases the wheels of globalisation
A: Value added share of domestic services in gross exports has been rising
Upshot: an inefficient domestic services sector can erode the productivity benefits of globalisation. Here, there is a big role for policy.
B: Resource misallocation in services is a problem
Source: Panel A OECD TiVA Database. Panel B: Andrews, D. and F. Cingano (2014), “Public Policy and Resource Allocation: Evidence from Firms in OECD Countries”, Economic Policy, 29(78), pp. 253-296.
20
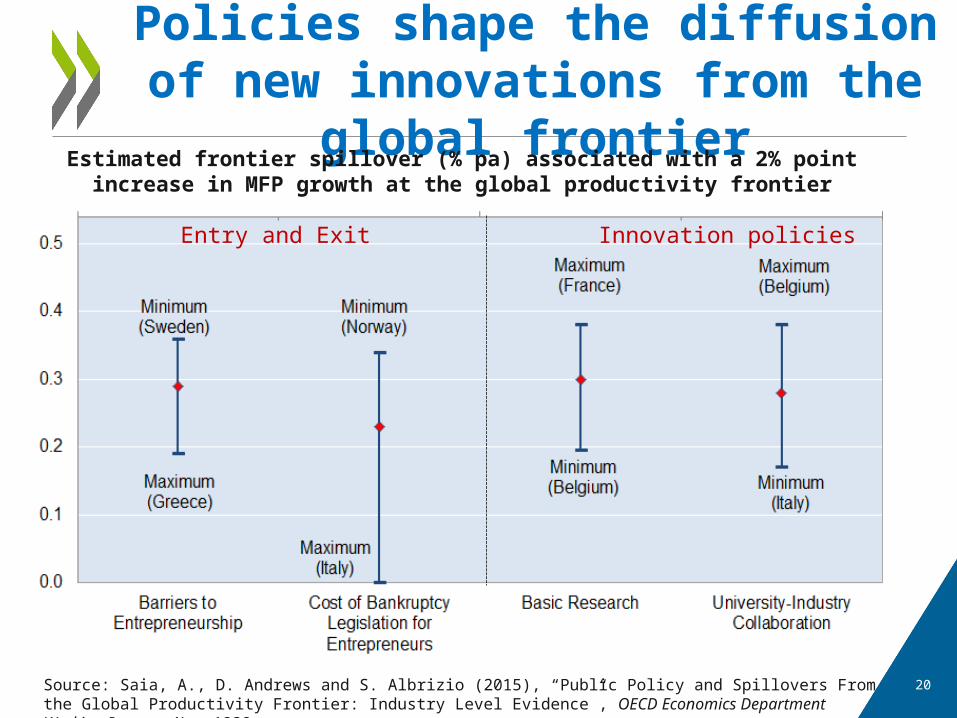
Policies shape the diffusion of new innovations from the global frontier
Estimated frontier spillover (% pa) associated with a 2% point increase in MFP growth at the global productivity frontier
Source: Saia, A., D. Andrews and S. Albrizio (2015), “Public Policy and Spillovers From the Global Productivity Frontier: Industry Level Evidence”, OECD Economics Department Working Papers, No. 1238.
Entry and Exit Innovation policies

21
Policies to facilitate the catch-up of laggards to the national frontier
Impact of policy reforms on the MFP growth of laggard firms, 2005Reducing PMR from high level in Greece to the OECD average % difference between industries with high and low firm churning
Source: Andrews, D. C. Criscuolo and P. Gal (2015), “Frontier firms, technology diffusion and public policy: micro evidence from OECD countries”, OECD Mimeo.

22
Aggregate gains from diffusion is magnified by efficient reallocation
Source: Andrews, Criscuolo and Gal (2015), “Frontier firms, technology diffusion and public policy: micro evidence from OECD countries ” OECD Mimeo.
How much higher would overall manufacturing sector labour productivity be if NF firms were as productive and large as GF firms?
NF firms in Italy have productivity levels close to the GF but they are relatively small

23
… but up-scaling can be difficult
Post-entry growth - average size of young and old firms
Source: C. Criscuolo, P. N. Gal and C. Menon (2014), “The Dynamics of Employment Growth: New Evidence from 18 Countries”, OECD Science, Technology and Industry Policy Papers, No. 14.
Manufacturing Services
0
10
20
30
40
50
60
70
80
Startups (0-2) Old (>10)Employees
0
10
20
30
40
50
60
70
80
Startups (0-2) Old (>10)Employees

24
Skill mismatch as a constraint on the growth of innovative
firms
Source: Adalet McGowan, M and D. Andrews (2015), “Labour market mismatch and labour productivity: evidence from PIAAC data ” OECD Economics Department Working Paper, No. 1209.
Skill mismatch, particularly over-skilling, is harmful for productivity because it constrains the ability of innovative firms to attract skilled workers and grow.

25
Policies to support efficient resource allocation
OECD research shows that efficient resource allocation is promoted by: Low administrative burdens on start-up firms Less stringent employment protection legislation Bankruptcy legislation that does not excessively
penalise business failure Availability of seed and early stage financing

26
Reducing skill mismatch requires a range of policies
The probability of skill mismatch and public policies
Source: Adalet McGowan, M and D. Andrews (2015), “Skill mismatch and public policy in OECD countries” OECD Economics Department Working Paper, No. 1210.
Entry and Exit Labour mobility Education

27
POLICY MESSAGES& ISSUES FOR FUTURE RESEARCH

28
Framework policies
1. Pro-competition product market reforms, esp. in services
2. Exit matters: bankruptcy legislation that does not
excessively penalise failure
3. Policies that do not inhibit labour and residential mobility
4. Education & social policies to help workers adapt to
technological change and the costs of reallocation
Innovation policies
5. Public investment in basic research
6. Collaboration between firms and universities
7. R&D fiscal incentives and IPRs but design is crucial
Policies to revive productivity growth
29
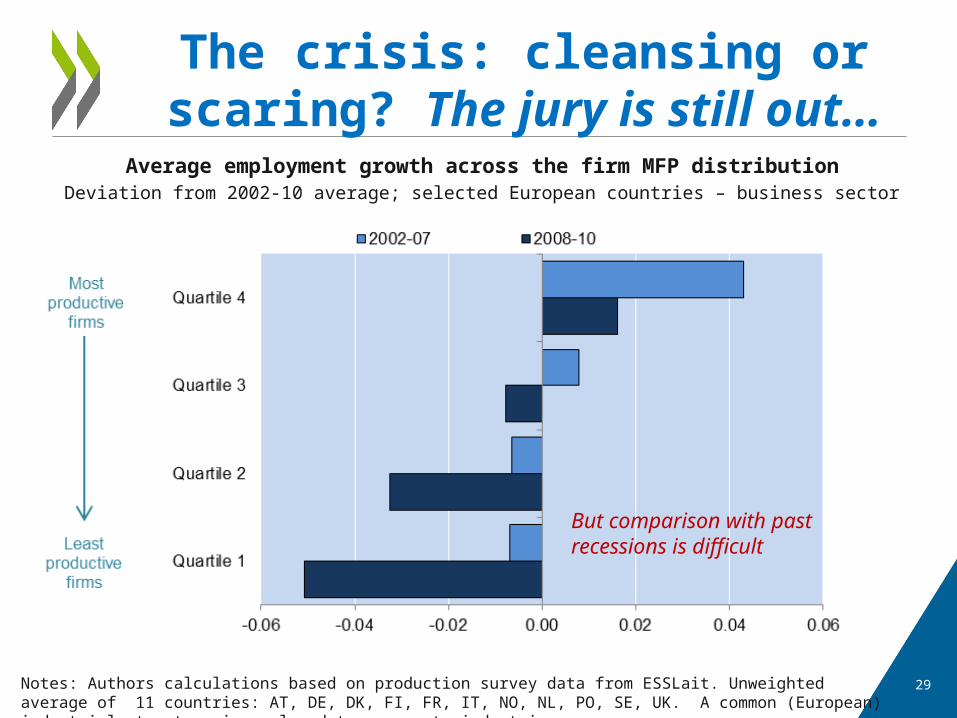
The crisis: cleansing or scaring? The jury is still out…
Average employment growth across the firm MFP distributionDeviation from 2002-10 average; selected European countries – business sector
Notes: Authors calculations based on production survey data from ESSLait. Unweighted average of 11 countries: AT, DE, DK, FI, FR, IT, NO, NL, PO, SE, UK. A common (European) industrial structure is employed to aggregate industries.
But comparison with past recessions is difficult

30
The crisis: most jobs were destroyed by the downsizing of old incumbents
Contributions to aggregate net job creation by entrants, young/old exitors, and young/old incumbents.
-8
-6
-4
-2
0
2
4
6
8
Co
ntr
ibu
tio
n t
o a
gg
reg
ate
ne
t jo
b c
rea
tio
n
Young (entry) Young (exit) Young (incumbents)
Old (exits) Old (incumbents) Total%
Source: C. Criscuolo, P. N. Gal and C. Menon (2014), “The Dynamics of Employment Growth: New Evidence from 18 Countries”, OECD Science, Technology and Industry Policy Papers, No. 14.

31
New harmonized and representative data to study the micro drivers of aggregate productivity.
– creative destruction process across countries and its contribution to productivity growth;
– Within-sector productivity dispersion and efficient allocation of resources.
New questions: link between productivity with wage inequality and their trends
Develop better policy indicators:– Bankruptcy legislation;
– IP systems.
New cross-country data sources

32
More information…
http://www.oecd.org/eco/the-future-of-productivity.htm
Related Documents