VU Research Portal The Future of E-Health is Mobile Grua, Eoin Martino 2021 document version Publisher's PDF, also known as Version of record Link to publication in VU Research Portal citation for published version (APA) Grua, E. M. (2021). The Future of E-Health is Mobile: Combining AI and Self-Adaptation to Create Adaptive E- Health Mobile Applications. General rights Copyright and moral rights for the publications made accessible in the public portal are retained by the authors and/or other copyright owners and it is a condition of accessing publications that users recognise and abide by the legal requirements associated with these rights. • Users may download and print one copy of any publication from the public portal for the purpose of private study or research. • You may not further distribute the material or use it for any profit-making activity or commercial gain • You may freely distribute the URL identifying the publication in the public portal ? Take down policy If you believe that this document breaches copyright please contact us providing details, and we will remove access to the work immediately and investigate your claim. E-mail address: [email protected] Download date: 26. May. 2022

Welcome message from author
This document is posted to help you gain knowledge. Please leave a comment to let me know what you think about it! Share it to your friends and learn new things together.
Transcript
VU Research Portal
The Future of E-Health is Mobile
Grua, Eoin Martino
2021
document versionPublisher's PDF, also known as Version of record
Link to publication in VU Research Portal
citation for published version (APA)Grua, E. M. (2021). The Future of E-Health is Mobile: Combining AI and Self-Adaptation to Create Adaptive E-Health Mobile Applications.
General rightsCopyright and moral rights for the publications made accessible in the public portal are retained by the authors and/or other copyright ownersand it is a condition of accessing publications that users recognise and abide by the legal requirements associated with these rights.
• Users may download and print one copy of any publication from the public portal for the purpose of private study or research. • You may not further distribute the material or use it for any profit-making activity or commercial gain • You may freely distribute the URL identifying the publication in the public portal ?
Take down policyIf you believe that this document breaches copyright please contact us providing details, and we will remove access to the work immediatelyand investigate your claim.
E-mail address:[email protected]
Download date: 26. May. 2022
The Future of E-Health is MobileCombining AI and Self-Adaptation to Create Adaptive
E-Health Mobile Applications
Eoin Martino GruaMSc.
Department of Computer ScienceFaculty of Sciences, Vrije Universiteit Amsterdam
2021

SIKS Dissertation Series No. 2021-25The research reported in this thesis has been carried out under the auspices ofSIKS, the Dutch Research School for Information and Knowledge Systems.
Copyright © 2021 by Eoin Martino Grua
VRIJE UNIVERSITEIT AMSTERDAM
The Future of E-Health is MobileCombining AI and Self-Adaptation to Create Adaptive
E-Health Mobile Applications
ACADEMISCH PROEFSCHRIFT
ter verkrijging van de graad Doctor of Philosophyaan de Vrije Universiteit Amsterdam,
op gezag van de rector magnificusprof.dr. C.M. van Praag,
in het openbaar te verdedigenten overstaan van de promotiecommissievan de Faculteit der Bètawetenschappenop vrijdag 3 december 2021 om 9.45 uurin een bijeenkomst van de universiteit,
De Boelelaan 1105
door
Eoin Martino Grua
geboren te Cork, Ierland

promotoren: prof.dr. P. Lagoprof.dr. A.E. Eiben
copromotoren: prof.dr. M. Hoogendoorndr. I. Malavolta
promotiecommissie: prof.dr. L. Fuentesdr. R. Spalazzeseprof.dr. B. Funkprof.dr. M.M. Riperprof.dr. K.V. Hindriks

Contents
Acknowledgements . . . . . . . . . . . . . . . . . . . . . . . . . . . . 5Summary . . . . . . . . . . . . . . . . . . . . . . . . . . . . . . . . . 7Samenvatting . . . . . . . . . . . . . . . . . . . . . . . . . . . . . . . 9
1 Introduction 111.1 Motivation . . . . . . . . . . . . . . . . . . . . . . . . . . . . . 121.2 Thesis Research Questions . . . . . . . . . . . . . . . . . . . . . 151.3 Scope . . . . . . . . . . . . . . . . . . . . . . . . . . . . . . . . 151.4 Contributions . . . . . . . . . . . . . . . . . . . . . . . . . . . . 201.5 Extra Publications . . . . . . . . . . . . . . . . . . . . . . . . . 24
I Reinforcement learning and machine learning for per-sonalisation and engagement in e-Health 27
2 Reinforcement Learning for Personalisation 292.1 Introduction . . . . . . . . . . . . . . . . . . . . . . . . . . . . . 302.2 Reinforcement learning for personalisation . . . . . . . . . . . . 322.3 Algorithms . . . . . . . . . . . . . . . . . . . . . . . . . . . . . 372.4 A classification of personalisation settings . . . . . . . . . . . . 482.5 A systematic literature review . . . . . . . . . . . . . . . . . . . 512.6 Results . . . . . . . . . . . . . . . . . . . . . . . . . . . . . . . . 552.7 Discussion . . . . . . . . . . . . . . . . . . . . . . . . . . . . . . 652.8 Appendix A. Queries . . . . . . . . . . . . . . . . . . . . . . . . 692.9 Appendix B. Tabular view of data . . . . . . . . . . . . . . . . 71
3 Cluster-based Reinforcement Learning 813.1 Introduction . . . . . . . . . . . . . . . . . . . . . . . . . . . . . 823.2 Related Work . . . . . . . . . . . . . . . . . . . . . . . . . . . . 843.3 Approach . . . . . . . . . . . . . . . . . . . . . . . . . . . . . . 853.4 Simulator . . . . . . . . . . . . . . . . . . . . . . . . . . . . . . 903.5 Experimental Setup . . . . . . . . . . . . . . . . . . . . . . . . 913.6 Results . . . . . . . . . . . . . . . . . . . . . . . . . . . . . . . . 94
i
ii CONTENTS
3.7 Discussion and Future Work . . . . . . . . . . . . . . . . . . . . 101
4 Clustering Growing Timeseries 1034.1 Introduction . . . . . . . . . . . . . . . . . . . . . . . . . . . . . 1044.2 Approach . . . . . . . . . . . . . . . . . . . . . . . . . . . . . . 1064.3 Experimental Setup . . . . . . . . . . . . . . . . . . . . . . . . 1104.4 Results . . . . . . . . . . . . . . . . . . . . . . . . . . . . . . . . 1124.5 Discussion and Future Work . . . . . . . . . . . . . . . . . . . . 117
5 Predicting User Engagement 1215.1 Introduction . . . . . . . . . . . . . . . . . . . . . . . . . . . . . 1225.2 Background . . . . . . . . . . . . . . . . . . . . . . . . . . . . . 1255.3 Modelling User Engagement of Mobile Apps . . . . . . . . . . . 1315.4 Evaluation of Predicting User Engagement of Mobile Apps . . . 1365.5 Discussion . . . . . . . . . . . . . . . . . . . . . . . . . . . . . . 1435.6 Summary and Future Work . . . . . . . . . . . . . . . . . . . . 145
II Self-adaptation in mobile applications 147
6 Self-adaptation in Mobile Applications 1496.1 Introduction . . . . . . . . . . . . . . . . . . . . . . . . . . . . . 1506.2 Self-Adaptation in Mobile Applications . . . . . . . . . . . . . . 1526.3 Study Design . . . . . . . . . . . . . . . . . . . . . . . . . . . . 1546.4 Results . . . . . . . . . . . . . . . . . . . . . . . . . . . . . . . . 1626.5 Discussion . . . . . . . . . . . . . . . . . . . . . . . . . . . . . . 1716.6 Threats To Validity . . . . . . . . . . . . . . . . . . . . . . . . 1756.7 Related Work . . . . . . . . . . . . . . . . . . . . . . . . . . . . 1766.8 Conclusions and Future Work . . . . . . . . . . . . . . . . . . . 177
III Creating self-adaptive and personalised e-Healthmobile applications 179
7 A Reference Architecture for e-Health mobile applications 1817.1 Introduction . . . . . . . . . . . . . . . . . . . . . . . . . . . . . 1827.2 Background . . . . . . . . . . . . . . . . . . . . . . . . . . . . . 1857.3 Related Work . . . . . . . . . . . . . . . . . . . . . . . . . . . . 1877.4 Reference Architecture . . . . . . . . . . . . . . . . . . . . . . . 1887.5 Components supporting Self-adaptation . . . . . . . . . . . . . 1947.6 Goal Model . . . . . . . . . . . . . . . . . . . . . . . . . . . . . 1997.7 Methodology . . . . . . . . . . . . . . . . . . . . . . . . . . . . 202

CONTENTS iii
7.8 Viewpoint Definition . . . . . . . . . . . . . . . . . . . . . . . . 2047.9 Scenario-based Evaluation . . . . . . . . . . . . . . . . . . . . . 2087.10 Discussion . . . . . . . . . . . . . . . . . . . . . . . . . . . . . . 2137.11 Conclusions and Future Work . . . . . . . . . . . . . . . . . . . 215
8 Empirical Evaluation 2178.1 Introduction . . . . . . . . . . . . . . . . . . . . . . . . . . . . . 2188.2 Study Design . . . . . . . . . . . . . . . . . . . . . . . . . . . . 2208.3 Results . . . . . . . . . . . . . . . . . . . . . . . . . . . . . . . . 2378.4 Discussion . . . . . . . . . . . . . . . . . . . . . . . . . . . . . . 2488.5 Threats to Validity . . . . . . . . . . . . . . . . . . . . . . . . . 2528.6 Related Work . . . . . . . . . . . . . . . . . . . . . . . . . . . . 2548.7 Conclusions . . . . . . . . . . . . . . . . . . . . . . . . . . . . . 257
9 Conclusion 2599.1 Discussion . . . . . . . . . . . . . . . . . . . . . . . . . . . . . . 2609.2 Thesis Research Questions Answered . . . . . . . . . . . . . . . 2649.3 Future Work . . . . . . . . . . . . . . . . . . . . . . . . . . . . 266
Bibliography 269
SIKS Dissertatiereeks 317

List of Tables
2.1 Framework to categorise personalisation settings by. . . . . . . 502.2 Data items in SLR. The last column relates data items to aspects
of setting from Table 2.1 where applicable. . . . . . . . . . . . . 562.3 Number of Publications by aspects of setting. . . . . . . . . . . 582.4 Algorithm usage for all algorithms that were used in more than
one publication. . . . . . . . . . . . . . . . . . . . . . . . . . . . 622.5 Number of models and the inclusion of user traits. . . . . . . . 632.6 Comparison of settings with realistic and other evaluation. . . . 652.7 Table containing all included publications. The first column
refers to the data items in Table 2.2. . . . . . . . . . . . . . . . 71
3.1 Number of clusters returned by each experimental case (for theDistinct Profile case) . . . . . . . . . . . . . . . . . . . . . . . . 95
3.2 Number of clusters returned by each experimental case (for theOverlapping Profile case) . . . . . . . . . . . . . . . . . . . . . 96
3.3 Cumulative Average Daily Reward for all experimental cases(Distinct) . . . . . . . . . . . . . . . . . . . . . . . . . . . . . . 97
3.4 Table of returned Wilcoxon p-values for all of the selected exper-imental methods (Distinct) . . . . . . . . . . . . . . . . . . . . 98
3.5 Cumulative Average Daily Reward for all experimental cases(Overlapping) . . . . . . . . . . . . . . . . . . . . . . . . . . . . 99
3.6 Table of returned Wilcoxon p-values for all of the selected exper-imental methods (Overlapping) . . . . . . . . . . . . . . . . . . 101
4.1 Execution times (in seconds) for Clustream-GT and ODAC onall executed tests . . . . . . . . . . . . . . . . . . . . . . . . . . 118
5.1 Selection of predictors and their respective mean decrease inaccuracy (MDA) . . . . . . . . . . . . . . . . . . . . . . . . . . 142
6.1 Classification framework utilised for the data extraction . . . . 159
v
vi LIST OF TABLES
7.1 Goal model syntax. . . . . . . . . . . . . . . . . . . . . . . . . . 2007.2 RA according to the three dimensions: context, goals, design . 2037.3 Final match of our RA to one of the five types identified in [14]. 2047.4 Elements of the MSaPS Viewpoint . . . . . . . . . . . . . . . . 2047.5 Stakeholders and Related Concerns . . . . . . . . . . . . . . . . 208
8.1 Table showing the initial subject selection, number of participantswhom dropped-out and final group numbers for each user study. 229

List of Figures
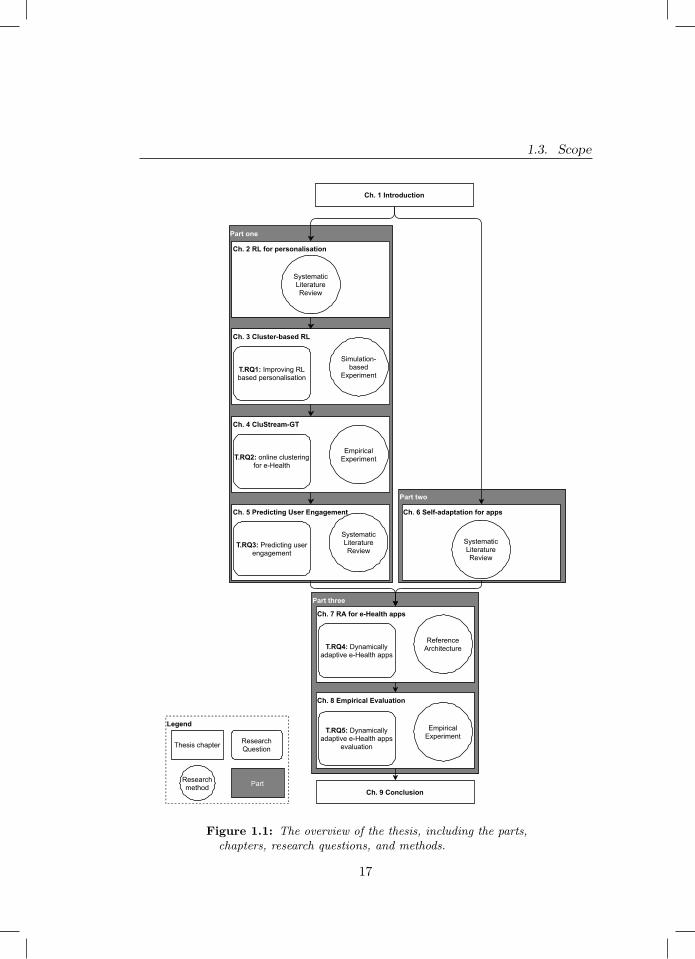
1.1 The overview of the thesis, including the parts, chapters, researchquestions, and methods. . . . . . . . . . . . . . . . . . . . . . . 17
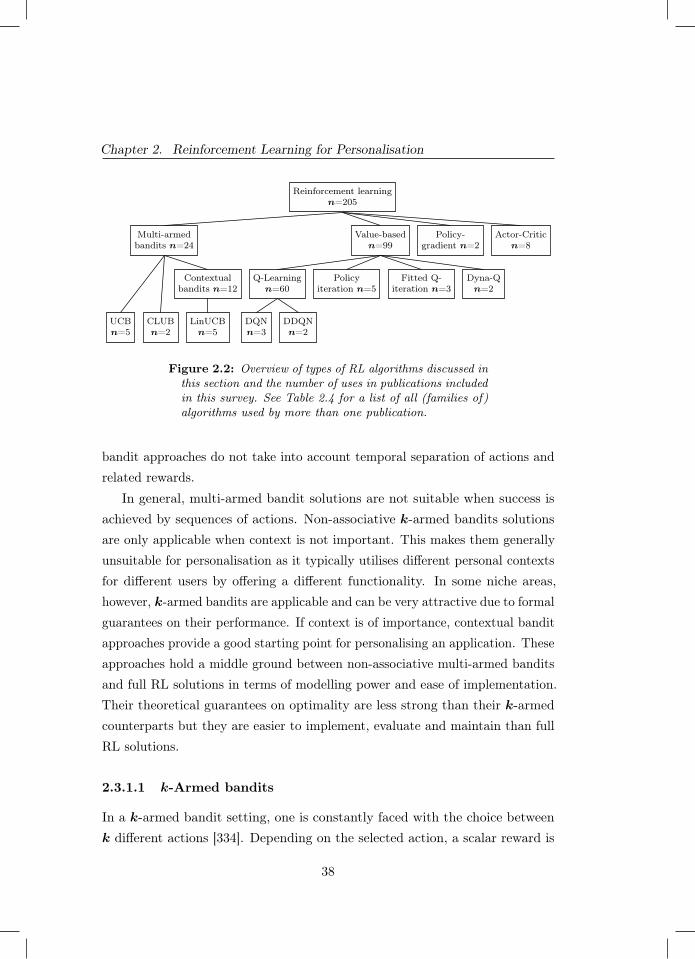
2.1 The agent-environment in RL for personalisation from [334]. . . 332.2 Overview of types of RL algorithms discussed in this section and
the number of uses in publications included in this survey. SeeTable 2.4 for a list of all (families of) algorithms used by morethan one publication. . . . . . . . . . . . . . . . . . . . . . . . . 38
2.3 Overview of the SLR process. . . . . . . . . . . . . . . . . . . . 532.4 Distribution of included papers over time and over domains. Note
that only studies published prior to the query date of June 6,2018 were included. . . . . . . . . . . . . . . . . . . . . . . . . . 57
2.5 Popularity of domains for the five most recent years. . . . . . . 582.6 Availability of user responses over time (a), and mentions of
safety as a concern over domains (b). . . . . . . . . . . . . . . . 592.7 New interactions with users can be sampled with ease. . . . . . 612.8 Distribution of algorithm usage frequencies. . . . . . . . . . . . 612.9 Occurrence of different solution architectures (a) and usage of
simulators in training (b). For (a), publications that comparearchitectures are represented in the ‘multiple’ category. . . . . . 61
2.10 Number of papers with a ‘live’ evaluation or evaluation usingdata on user responses to system behaviour. . . . . . . . . . . . 64
2.11 Number of papers that include any comparison between solutionsover time. . . . . . . . . . . . . . . . . . . . . . . . . . . . . . . 65
3.1 Plot of the Average Daily Reward over time for the four betterperforming clustering methods . . . . . . . . . . . . . . . . . . 97
3.2 Plot of the Average Daily Reward over time comparing the twoselected clustering methods and the two non-clustering methods(Separate and Pooled) . . . . . . . . . . . . . . . . . . . . . . . 98
3.3 Plot of the Average Daily Reward over time for the four betterperforming clustering methods . . . . . . . . . . . . . . . . . . 100
vii
viii LIST OF FIGURES
3.4 Plot of the Average Daily Reward over time comparing the twoselected clustering methods and the two non-clustering methods(Separate and Pooled) . . . . . . . . . . . . . . . . . . . . . . . 100
4.1 Decrease of the the average silhouette score using CluStream-GTcompared to k-means (Base Case) . . . . . . . . . . . . . . . . 114
4.2 Decrease of the the average execution time using CluStream-GTcompared to k-means (Base Case) . . . . . . . . . . . . . . . . 115
4.3 Decrease of the the average silhouette score using CluStream-GTcompared to k-means (Advanced Case) . . . . . . . . . . . . . . 115
4.4 Decrease of the average execution time using CluStream-GTcompared to k-means (Advanced Case) . . . . . . . . . . . . . . 116
4.5 Decrease of the average silhouette score using CluStream-GTcompared to k-means (Real Case) . . . . . . . . . . . . . . . . . 116
4.6 Decrease of the average execution time using CluStream-GTcompared to k-means (Real Case) . . . . . . . . . . . . . . . . . 117
5.1 Overview of UE life cycle. The arrows indicate the possible placesof interaction with technology. Figure inspired in the four-stepengagement process proposed by [263] and [262] . . . . . . . . . 126
5.2 Sketch of users lifespan over time. The red lines indicate cus-tomers engaged after the end of the training period. . . . . . . 130
5.3 Pearson-γ correlation for the AHC - optimised (blue) and stan-dard (red) - against the number of clusters. . . . . . . . . . . . 138
5.4 ROC curves for the CPH model based on the testing set. TP andFP indicate true positive and false positive, respectively. Thelegend indicates the different time spans. . . . . . . . . . . . . . 138
5.5 ROC curves for the NB model. The legend indicates the datasets.The timespan is fixed to 14 days. . . . . . . . . . . . . . . . . . 140
5.6 Comparison between the number of events predicted (black) andobserved (red) for the different sets, as indicated in the headers.The time span is fixed to 14 days. . . . . . . . . . . . . . . . . . 140
5.7 ROC curves for the RF model. The test set curve is shown inred, followed by the Validation 1,2, and 3 sets in green, blue, andcyan, respectively. . . . . . . . . . . . . . . . . . . . . . . . . . 141
5.8 ROC curves for the XGBoost model. The test set curve is shownin red, followed by the Validation 1,2, and 3 sets in green, blue,and cyan, respectively. . . . . . . . . . . . . . . . . . . . . . . . 143
6.1 Overview of a mobile-enabled system . . . . . . . . . . . . . . . 1536.2 The search and selection process of this study . . . . . . . . . . 1566.3 Characteristics of the goals of self-adaptation . . . . . . . . . . 163
List of Figures
6.4 Characteristics of the changes triggering the self-adaptation pro-cess . . . . . . . . . . . . . . . . . . . . . . . . . . . . . . . . . 165
6.5 Characteristics of the mechanisms for self-adaptation . . . . . . 1676.6 Characteristics of the effects of the self-adaptation process . . . 170
7.1 Methodology for the design of our RA[14] . . . . . . . . . . . . 1867.2 Reference architecture for Personalised and Self-adaptive e-Health
Apps . . . . . . . . . . . . . . . . . . . . . . . . . . . . . . . . . 1897.3 AI Personalization Adaptation MAPE loop. . . . . . . . . . . . 1947.4 User Driven Adaptation Manager MAPE loop. . . . . . . . . . 1967.5 Smart Objects Manager MAPE loop. . . . . . . . . . . . . . . . 1977.6 Internet Connectivity Manager MAPE loop. . . . . . . . . . . . 1987.7 Environment Driven Adaptation Manager MAPE loop. . . . . . 1997.8 Scenarios 1-3 . . . . . . . . . . . . . . . . . . . . . . . . . . . . 2107.9 Scenarios 4-6 . . . . . . . . . . . . . . . . . . . . . . . . . . . . 211
8.1 Study Design . . . . . . . . . . . . . . . . . . . . . . . . . . . . 2208.2 Figures describing the components of the RA used and the RE-
LATE architecture . . . . . . . . . . . . . . . . . . . . . . . . . 2248.3 Tables listing all of the surveys used in our user study and each
question’s relationship to the specified research questions . . . 2318.4 Execution of one repetition of the experiment . . . . . . . . . . 2368.5 Recorded ratings for the final survey for both user studies. . . . 2398.6 All plots related to performance measurements for the LG smart-
phone . . . . . . . . . . . . . . . . . . . . . . . . . . . . . . . . 2448.7 All plots related to performance measurements for the Samsung
smartphone . . . . . . . . . . . . . . . . . . . . . . . . . . . . . 2458.8 All plots for the energy usage measured . . . . . . . . . . . . . 247
1


Dedicated to my mum Gemma, my late father Claudio, and to my wife Kara.
3

Acknowledgements
Firstly I would like to thank my mum for her support over the years! I wouldalso like to thank Kara, for all of the support and patience she has given me,especially in the final stretch! I want to thank Mark Hoogendoorn, Gusz Eiben,Ivano Malavolta, and Patricia Lago for their support and supervision duringmy doctorate years. Doing this kind of interdisciplinary project has been achallenge but thanks to your guidance and patience we got there in the end!
I want to thank all of the colleagues I have met and worked with in theComputational Intelligence and Qualitative Data Analytics groups at the VrijeUniversiteit Amsterdam. We had some amazing times together sharing meals,watching movies and dancing! Thank you Julien, Milan, Jakub, Daan, Gongjin,Karine, Masoume, Diederik, Luca, Emile, Bart, Frank, Ward, Jacqueline,Vincent, Lucas, Eliseo, Matteo, Tarik, Fuda, Jan, Floris, David, Luis, Alessandro,and Ali!
I, of course, want to also thank all of my colleagues from the S2 Group atthe Vrije Universiteit Amsterdam. I will always remember our talks in front ofthe coffee machine, mensa, and out eating a pizza! Thank you Fahimeh, Robert,Paolo, Giuseppe, Grace, Nelly, Ilias, Emitz, Jaap, Antony, Michel, Kousar,Remco, Fadime, Razieh, Anjana, Tanjina, Robin, Lara, and Roberto!
5

Summary
With the current digitisation of our world, we have witnessed a surge in thepresence and use of mobile devices. Consequently, there has been a naturalincrease in the use of mobile applications (apps). A category of app that hasbeen growing in popularity is e-Health apps. However, even though popular,e-Health apps have many shortcomings that need to be addressed. Most notably,the rules and mechanisms employed by current day e-Health apps do not usethe full potential of context and features they have access to. Leading to appsthat are too rigid and not well tailored to the users’ needs and goals.
In this thesis we look at overcoming this rigidity and sub-optimal tailoringof e-Health apps. To reach this goal, we propose combining AI-based person-alisation and software self-adaptation. For personalisation, we choose to usereinforcement learning (RL) as it is a good fit in providing personalisation inthe e-Health domain. We explore the current state of the art by conducting asystematic literature review. With this review we identify two main weaknessesof RL: it requires a lot of data to reach an optimal policy and exploration canlead to user disengagement. To tackle the former, we propose cluster-basedRL. We then further improve our proposed solution by developing an onlineclustering algorithm designed for e-Health. For the latter, we explore howmachine learning can be used to predict user engagement. To better under-stand software self-adaptation in the domain of apps, we conduct a systematicliterature review. In the review, we classify the current approaches and identifyseveral shortcomings relevant to e-Health apps. Lastly, to tackle the identifiedshortcomings and combine personalisation and self-adaptation, we introduce
7
a reference architecture for personalised and self-adaptive e-Health apps. Weexplore the benefits that said architecture can have on social sustainabilityand empirically evaluate an app implemented following this architecture. Forthe empirical evaluation two experiments were performed: a user study and ameasurement-based experiment. With the user study, we better understand theeffects of the implemented app on the end users’ perception and usability. Withthe measurement-based experiment, we investigate the effects that the app hason performance and energy consumption. Our results are promising, as the userstudy shows improved end users’ usability and no significant drawback in endusers’ perception as well as no perceivable increase in energy consumption ordecrease in performance.
8
Samenvatting
Met de huidige digitalisering van onze wereld zijn we getuige geweest van eentoename van de aanwezigheid en het gebruik van mobiele apparaten. Hierdooris er een natuurlijke stijging van het gebruik van mobiele applicaties (apps). Eencategorie apps die steeds populairder wordt, zijn e-Health-apps. Hoewel popu-laire e-Health-apps veel tekortkomingen hebben die moeten worden aangepakt.Het meest opvallende is dat de regels en mechanismen die worden gebruikt doorhedendaagse e-gezondheidsapps niet het volledige potentieel van context enfuncties gebruiken waartoe ze toegang hebben. Dit leidt tot apps die te rigidezijn en niet goed zijn afgestemd op de behoeften en doelen van de gebruikers.
In dit proefschrift kijken we naar manieren om deze rigiditeit te overwinnenen suboptimale afstemming van e-Health-apps te verebeteren. Om dit doelte bereiken, stellen we voor om de combinatie AI-gebaseerde personalisatie ensoftware-zelfaanpassing te gebruiken.
Voor personalisatie kiezen we voor Reinforcement Learning (RL) omdatdit goed past bij het bieden van personalisatie in het e-Health domein. Weverkennen de huidige stand van deze techniek door een systematische literatu-urstudie uit te voeren. Met deze studie identificeren we twee belangrijke zwakkepunten van RL: het vereist veel gegevens om tot een optimaal beleid te komenen verkenning kan leiden tot terugtrekking van gebruikers. Om het eerste puntaan te pakken, stellen we cluster-gebaseerde RL voor. Vervolgens verbeteren weonze voorgestelde oplossing door een online clusteringalgoritme te ontwikkelendat is ontworpen voor e-Health. Voor dat laatste onderzoeken we hoe MachineLearning kan worden gebruikt om gebruikersbetrokkenheid te voorspellen. Om
9
de zelfaanpassing van software in het domein van apps beter te begrijpen, voerenwe een systematisch literatuuronderzoek uit. In de review classificeren we dehuidige benaderingen en identificeren we een aantal tekortkomingen die relevantzijn voor e-Health apps. Om de geïdentificeerde tekortkomingen aan te pakkenen personalisatie en zelfaanpassing te combineren, introduceren we ten slotte eenreferentiearchitectuur voor gepersonaliseerde en zelf-adaptieve e-Health-apps.We onderzoeken de voordelen die deze architectuur kan hebben op sociale du-urzaamheid en evalueren empirisch een app die is geïmplementeerd volgens dezearchitectuur. Voor de empirische evaluatie zijn twee experimenten uitgevoerd:een gebruikersonderzoek en een meetexperiment. Met het gebruikersonderzoekbegrijpen we beter wat de effecten zijn van de geïmplementeerde app op debeleving en bruikbaarheid van de eindgebruikers. Met het meetexperimentonderzoeken we welke effecten de app heeft op prestaties en energieverbruik.Onze resultaten zijn veelbelovend, aangezien het in het gebruikersonderzoekeen verbeterde bruikbaarheid van eindgebruikers laat zien en geen significantnadeel in de perceptie van eindgebruikers, evenals geen waarneembare toenamevan het energieverbruik of afname van de prestaties.
10
1Introduction
Preamble. We live in a world with more data and technology than ever. Mostof us these days, have an incredibly compact and powerful computer in theirpockets in the form of a smartphone. By being almost always on our person,it has the possibility of collecting very precise data about our behaviours andcontext. This kind of information, when used in the best interest of the user,can have greatly positive consequences. E-Health mobile applications, have thatpotential. If we can use the full extent of the collected data to personaliseand adapt e-Health mobile applications and their interventions, we could helpimprove the well being of any person who owns a mobile device. This thesisaims at contributing to the creation of personalised and adaptive e-Health mobileapplications, for a better future.
11
Chapter 1. Introduction
1.1 Motivation
With the digitisation of our world the use of mobile devices is becoming ubiqui-tous. Consequently comes an increase of collected and stored electronic data.No exception to this trend is the Health domain, where the use of mobile devicesand software systems is becoming widespread. This new form of electronicHealthcare is called e-Health. Silber et al. define e-Health as “... the applicationof information and communications technologies (ICT) across the whole rangeof functions that affect health” [320].
A thriving area of e-Health is the domain of e-Health mobile applications, oth-erwise referred to as e-Health apps. In the past years the expansion of e-Healthapps has been increasing with a projected market growth of US$102.3Billionby 2023 [134]. E-Health apps offer a wide range of medical services for theirusers, e.g., lifestyle improvement, fitness, and mental health [269]. E-Healthapps differ from other e-Health systems by being able to collect user data withthe onboard sensors present on the smartphone on which the app is installedon. Furthermore, e-Health apps have a wide potential user base with a lowinfrastructure investment as many potential users already own a smartphoneor another form of smart mobile device. Lastly, in contrast to other e-Healthsystems, apps are able to leverage all of the intrinsic characteristics of a mobilemedium (such as, being always on, always carried by the user, and personal)to provide timely and in-context services [119]. Although e-Health apps havethe potential to use context and their other inherent features to the user’sadvantage, the rules and mechanisms employed by current day e-Health appsare too rigid and not fully tailored to the individual. In this context, we proposepersonalisation together with software self-adaptation as effective tools tobetter the level of engagement and tailoring that e-Health apps can offer tothe user.
We start by explaining the work done in the field of personalisation.For this thesis we built on the definition given by Fan and Poole and definepersonalisation as: “a process that changes a system to increase its personalrelevance to an individual or a category of individuals”. Researchers working in
12
1.1. Motivation
e-Health have been developing ways to help health workers deliver personalisedhealth care, as it is shown to improve the effectiveness of the health interventionsgiven [11; 29; 153; 253; 371; 294; 157]. When working in e-Health, especiallywith e-Health apps, reinforcement learning (RL) has been shown to be a goodfit [160]. This is because RL is the algorithm of choice for solving sequentialdecision-making problems. To be able to improve a user’s well-being, a e-Healthapp has to periodically give health interventions with the goal of changing theuser’s behaviour. The nature of this scenario makes it a sequential decision-making process as many interventions are sequentially given to a user overtime. This and the difficulty that comes with observing the outcomes of theinterventions only later in the future, play perfectly to RL’s strengths. However,RL does have two major downsides: 1) it takes a lot of data to reach a goodpolicy and 2) exploring user undesired or ineffective interventions can lead totheir disengagement.
A possible solution to the first difficulty can be the use of clustering. By usingclustering, the data of like minded people is grouped together. This providesus with a larger dataset from which we can create better personalisationstrategies, effective for the entire cluster. However, a large amount of theseclustering techniques are done in an off-line fashion (i.e., the clusters are doneon a fixed dataset and once created they can not be changed in real time).Whilst there are some clustering algorithms created for online clustering, theyhave limitations that make them a bad fit for the health domain.
To help tackle the second shortcoming of RL, i.e., disengagement, machinelearning can be used to predict the engagement of a user and when they aregoing to disengage from an app. There is, however, still work that must be donein understanding which models are most effective and which set of features havethe highest predictive value.
Whilst personalisation will help in tackling the poor tailoring techniquesin e-Health apps, it cannot tackle their current rigidity and minimal use ofusers’ context. In order to adapt to the context of the user as they are utilisingthe app, developers can apply various software strategies. A common andwell researched technique is the use of software self-adaptation [277]. Self-
13
Chapter 1. Introduction
adaptation techniques allow the software system to “...modify their behaviorat run-time due to changes in the system, its requirements, or the environmentin which it is deployed.” [9]. This type of adaptation can allow apps tomaintain or achieve certain set quality goals, such as adapting to minimiseenergy consumption or improving performance when required. There is, however,room for improvement in this field, particularly for achieving goals pertinentto the e-Health domain. Only a minimal amount of the current state of theart performs self-adaptation with the aim of achieving non-technical goals, likepromoting user behavioural change and lifestyle improvements. Furthermore,whilst self-adaptation is ideal for adapting to the user context, only a minimalnumber of the current state of the art adapt due to changes detected fromthird-party apps and smart-objects (e.g., a user’s smart watch). The latter, inparticular, can capture important information about the user context and hasbecome more prevalent in sub-domains of e-Health, such as fitness.
Whilst some of the techniques described, both in AI and software engineering,have been separately used within the domain of e-Health, little work has beendone to combine them together. Their combination, under one architecturedesigned for e-Health apps, could lead to the solving of many of the challengesand shortcomings identified within this field.
14
1.2. Thesis Research Questions
1.2 Thesis Research Questions
The goal of this thesis is to understand how AI-based personalisation andself-adaptation can be used together for designing and developing e-Healthmobile apps. We propose RL and clustering techniques to improve the dataefficiency and efficacy of e-Health interventions and machine learning models topredict user engagement. We also propose to combine these AI techniques withstate of the art software self-adaptation methodologies to explore how e-Healthapps can dynamically adapt to the user and their context. For the purpose ofthis thesis we define dynamic adaptation as the result of the combination ofAI-based personalisation and software self-adaptation. As a result, we formulatethe following thesis research questions noted as T.RQs, so to not be confusedwith chapter research questions (identified simply as RQs):
T.RQ1 How can RL-based personalisation for e-Health be improved?
T.RQ2 How can online-clustering be used to efficiently and effectively clustere-Health data?
T.RQ3 How can we predict user engagement in apps?
T.RQ4 How can AI-based personalisation and self-adaptation be used to createe-Health apps that dynamically adapt to the user and their context?
T.RQ5 How do dynamically adaptive e-Health apps affect users and their mobiledevices?
1.3 Scope
This thesis was created by collecting all of the papers written over the four yearsof my doctorate degree. Each paper is presented in a separate chapter. Theincluded papers might have had minor changes done to them to better suit thelayout of this document (e.g., table or figure resizing). We also define three mainparts that collectively create the scope of this thesis, these are: 1) reinforcementlearning and machine learning for personalisation and engagement in e-Health,
15
Chapter 1. Introduction
2) self-adaptation in mobile applications, and 3) creating self-adaptive andpersonalised e-Health mobile applications. In this section we elaborate on eachpart and list each paper’s contribution to their respective part. Lastly, anoverview of this thesis is presented with Figure 1.1.
Part one answers T.RQ1, T.RQ2, T.RQ3, part two gives important back-ground to part three which answers T.RQ4 and T.RQ5.
1.3.1 Reinforcement learning and machine learning forpersonalisation and engagement in e-Health
This part answers T.RQ1, T.RQ2, and T.RQ3 and aims to understand howRL and machine learning techniques can be used to better personalisation andengagement in the domain of e-Health. In paper [V] we perform a systematicliterature review study. Within this review we explore the various settings,including e-Health, in which RL has been used for personalisation. We do so byproposing a framework of evaluation settings, as well as reviewing the solutionsand evaluation strategies adopted. During our investigation, we observed thatthe majority of the RL models found were either used by applying one modelto all of the data (i.e., one-size-fits-all) or by using one model per user (i.e., onan individual level). Little work was found on the idea of pooling data togetherof similar users (i.e., clustering) and training RL models on that data, so thateach pooled group has their own policy.
In paper [I] we bring forth a contribution to RL for personalisation by sys-tematically exploring how different clustering techniques and distance metricscan improve conventional RL. Within this work we use a simulation environ-ment to empirically study how cluster-based RL differs from RL used on anindividual level or a one-size-fits-all approach. Our results show that clusteringconfigurations using high-level features significantly outperform the other twonon cluster-based RL techniques. An example of a high-level feature, would bethe average number of times a user works out in a week. To further improvecluster-based RL approaches, in paper [IV], we address limitations within the do-main of online clustering by developing a novel algorithm called CluStream-GT.
16
1.3. Scope
Part three
Part two
Part one
Ch. 2 RL for personalisation
Ch. 9 Conclusion
Ch. 6 Self-adaptation for apps
Ch. 3 Cluster-based RL
Ch. 4 CluStream-GT
Ch. 5 Predicting User Engagement
Ch. 7 RA for e-Health apps
Ch. 8 Empirical Evaluation
SystematicLiteratureReview
Simulation-based
Experiment
EmpiricalExperiment
SystematicLiteratureReview
SystematicLiteratureReview
ReferenceArchitecture
EmpiricalExperiment
T.RQ1: Improving RLbased personalisation
T.RQ2: online clusteringfor e-Health
T.RQ3: Predicting userengagement
T.RQ4: Dynamicallyadaptive e-Health apps
T.RQ5: Dynamicallyadaptive e-Health apps
evaluation
Legend
Thesis chapter
Researchmethod
ResearchQuestion
Part
Ch. 1 Introduction
Figure 1.1: The overview of the thesis, including the parts,chapters, research questions, and methods.
17
Chapter 1. Introduction
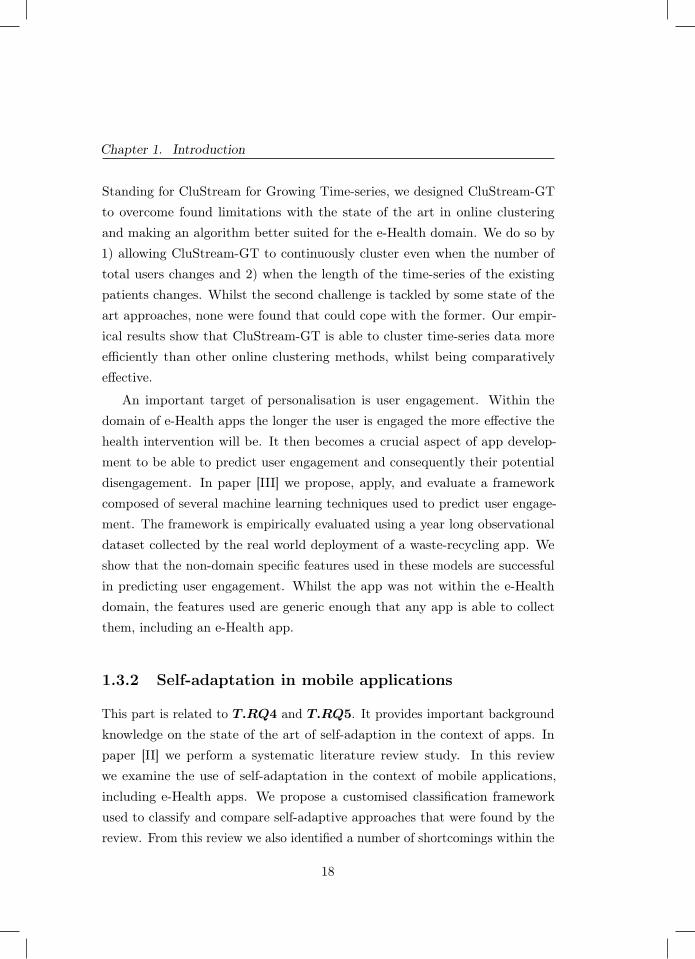
Standing for CluStream for Growing Time-series, we designed CluStream-GTto overcome found limitations with the state of the art in online clusteringand making an algorithm better suited for the e-Health domain. We do so by1) allowing CluStream-GT to continuously cluster even when the number oftotal users changes and 2) when the length of the time-series of the existingpatients changes. Whilst the second challenge is tackled by some state of theart approaches, none were found that could cope with the former. Our empir-ical results show that CluStream-GT is able to cluster time-series data moreefficiently than other online clustering methods, whilst being comparativelyeffective.
An important target of personalisation is user engagement. Within thedomain of e-Health apps the longer the user is engaged the more effective thehealth intervention will be. It then becomes a crucial aspect of app develop-ment to be able to predict user engagement and consequently their potentialdisengagement. In paper [III] we propose, apply, and evaluate a frameworkcomposed of several machine learning techniques used to predict user engage-ment. The framework is empirically evaluated using a year long observationaldataset collected by the real world deployment of a waste-recycling app. Weshow that the non-domain specific features used in these models are successfulin predicting user engagement. Whilst the app was not within the e-Healthdomain, the features used are generic enough that any app is able to collectthem, including an e-Health app.
1.3.2 Self-adaptation in mobile applications
This part is related to T.RQ4 and T.RQ5. It provides important backgroundknowledge on the state of the art of self-adaption in the context of apps. Inpaper [II] we perform a systematic literature review study. In this reviewwe examine the use of self-adaptation in the context of mobile applications,including e-Health apps. We propose a customised classification frameworkused to classify and compare self-adaptive approaches that were found by thereview. From this review we also identified a number of shortcomings within the
18
1.3. Scope
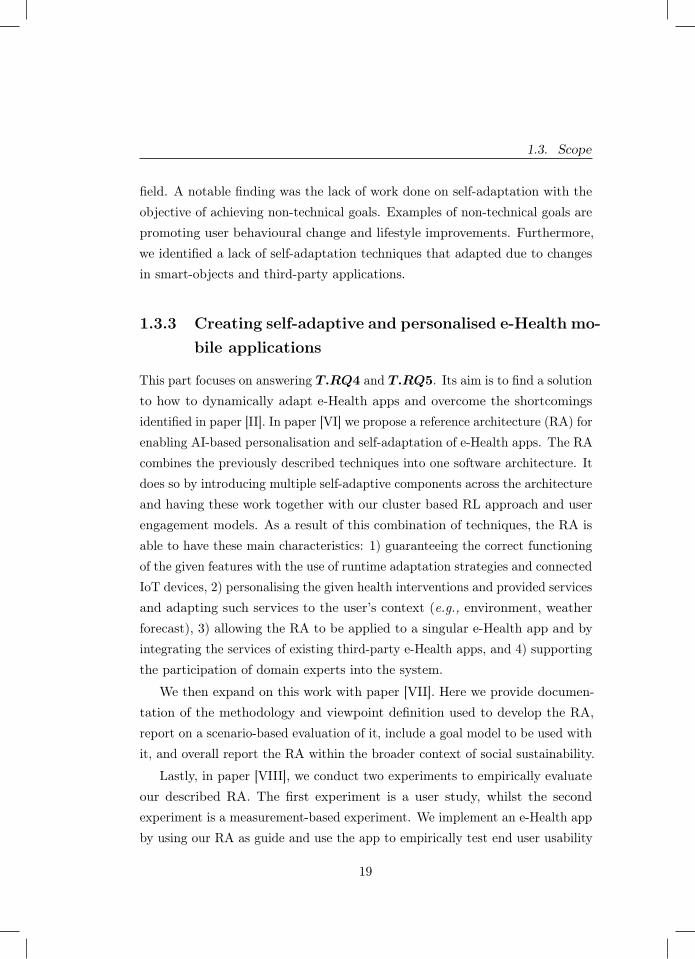
field. A notable finding was the lack of work done on self-adaptation with theobjective of achieving non-technical goals. Examples of non-technical goals arepromoting user behavioural change and lifestyle improvements. Furthermore,we identified a lack of self-adaptation techniques that adapted due to changesin smart-objects and third-party applications.
1.3.3 Creating self-adaptive and personalised e-Health mo-bile applications
This part focuses on answering T.RQ4 and T.RQ5. Its aim is to find a solutionto how to dynamically adapt e-Health apps and overcome the shortcomingsidentified in paper [II]. In paper [VI] we propose a reference architecture (RA) forenabling AI-based personalisation and self-adaptation of e-Health apps. The RAcombines the previously described techniques into one software architecture. Itdoes so by introducing multiple self-adaptive components across the architectureand having these work together with our cluster based RL approach and userengagement models. As a result of this combination of techniques, the RA isable to have these main characteristics: 1) guaranteeing the correct functioningof the given features with the use of runtime adaptation strategies and connectedIoT devices, 2) personalising the given health interventions and provided servicesand adapting such services to the user’s context (e.g., environment, weatherforecast), 3) allowing the RA to be applied to a singular e-Health app and byintegrating the services of existing third-party e-Health apps, and 4) supportingthe participation of domain experts into the system.
We then expand on this work with paper [VII]. Here we provide documen-tation of the methodology and viewpoint definition used to develop the RA,report on a scenario-based evaluation of it, include a goal model to be used withit, and overall report the RA within the broader context of social sustainability.
Lastly, in paper [VIII], we conduct two experiments to empirically evaluateour described RA. The first experiment is a user study, whilst the secondexperiment is a measurement-based experiment. We implement an e-Health appby using our RA as guide and use the app to empirically test end user usability
19

Chapter 1. Introduction
and perception in the first experiment, and energy and performance impact inthe second experiment. These experiments were conducted to explore how anapp complying to our RA behaves in real world scenarios and how successfulour proposed RA can be in guiding the development of dynamically adaptinge-Health apps.
1.4 Contributions
The main contributions present in this thesis to the fields of AI and SoftwareEngineering, applied to e-Health mobile applications are:
1. A rigorous map into the current state of the art use of RL forpersonalisation: An overview and categorisation of RL applicationsused for personalisation across application domains, including e-Health.This is presented together with a framework for classifying personalisationsettings. This contribution relates to the part of reinforcement learningand machine learning for personalisation and engagement in e-Health andhelps answer T.RQ1.
2. Data-efficient and effective techniques for personalisation: Asystematic exploration of which clustering techniques and distance metricsperform best in aiding RL in delivering better policies for personalisationwhilst increasing the initial learning speed and overcoming the cold startproblem. Design, implementation and evaluation of a state of the artalgorithm for online clustering of time series data for the e-Health domain.This contribution relates to reinforcement learning and machine learningfor personalisation and engagement in e-Health and helps answer T.RQ1
and T.RQ2.
3. Machine Learning models to predict user engagement in mobileapps: Design and implementation of a reusable framework for predictinguser engagement in mobile apps. An empirical evaluation of variousmachine learning models used to characterise user engagement in mobile
20
1.4. Contributions
apps. This contribution relates to reinforcement learning and machinelearning for personalisation and engagement in e-Health and answersT.RQ3.
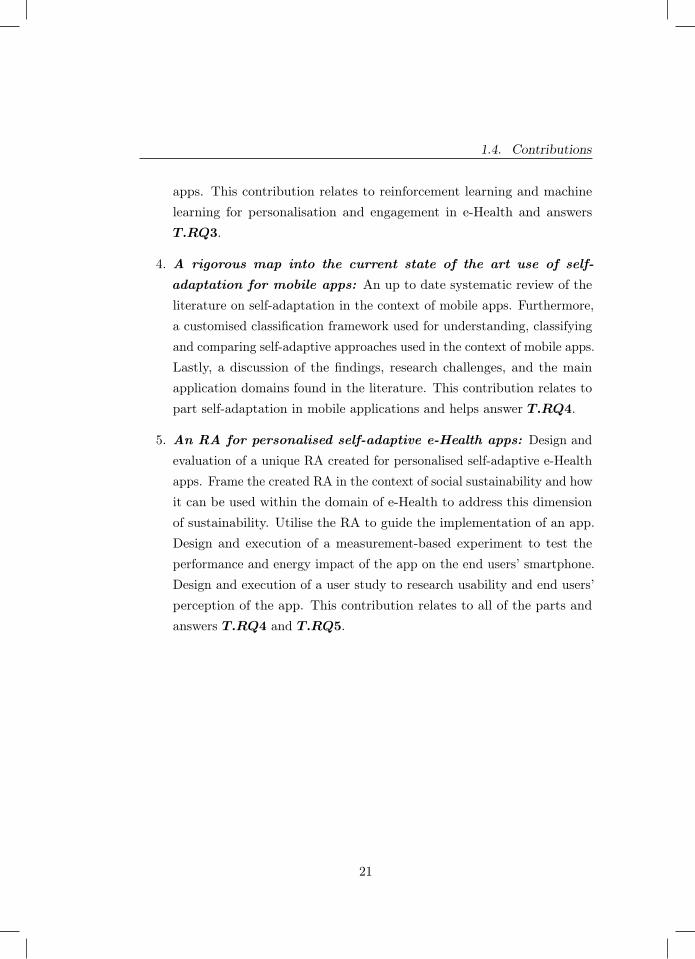
4. A rigorous map into the current state of the art use of self-adaptation for mobile apps: An up to date systematic review of theliterature on self-adaptation in the context of mobile apps. Furthermore,a customised classification framework used for understanding, classifyingand comparing self-adaptive approaches used in the context of mobile apps.Lastly, a discussion of the findings, research challenges, and the mainapplication domains found in the literature. This contribution relates topart self-adaptation in mobile applications and helps answer T.RQ4.
5. An RA for personalised self-adaptive e-Health apps: Design andevaluation of a unique RA created for personalised self-adaptive e-Healthapps. Frame the created RA in the context of social sustainability and howit can be used within the domain of e-Health to address this dimensionof sustainability. Utilise the RA to guide the implementation of an app.Design and execution of a measurement-based experiment to test theperformance and energy impact of the app on the end users’ smartphone.Design and execution of a user study to research usability and end users’perception of the app. This contribution relates to all of the parts andanswers T.RQ4 and T.RQ5.
21
Chapter 1. Introduction
List of Papers
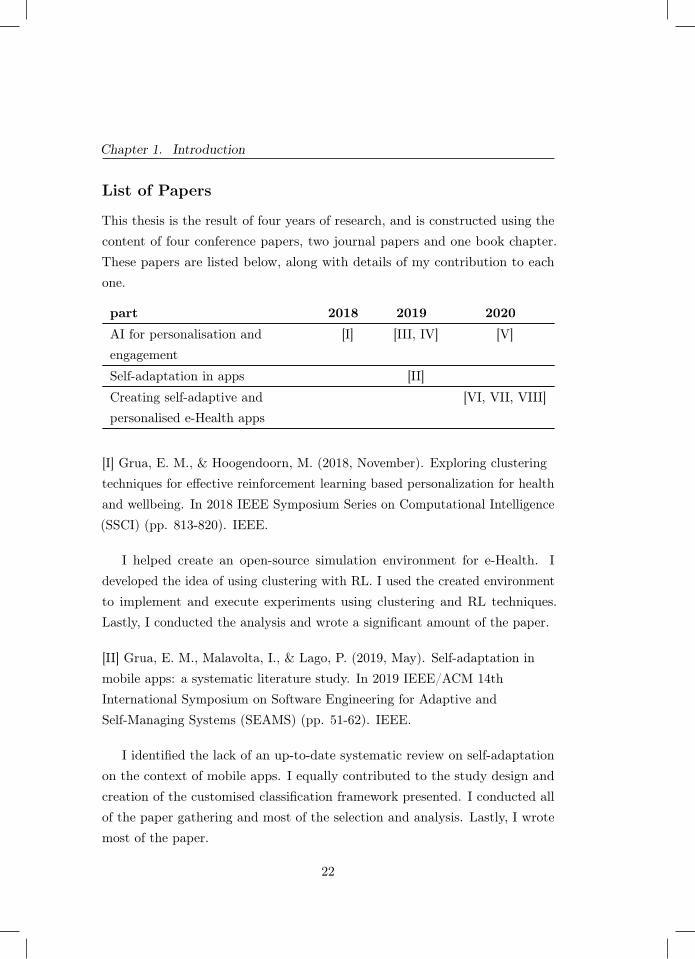
This thesis is the result of four years of research, and is constructed using thecontent of four conference papers, two journal papers and one book chapter.These papers are listed below, along with details of my contribution to eachone.
part 2018 2019 2020
AI for personalisation andengagement
[I] [III, IV] [V]
Self-adaptation in apps [II]
Creating self-adaptive andpersonalised e-Health apps
[VI, VII, VIII]
[I] Grua, E. M., & Hoogendoorn, M. (2018, November). Exploring clusteringtechniques for effective reinforcement learning based personalization for healthand wellbeing. In 2018 IEEE Symposium Series on Computational Intelligence(SSCI) (pp. 813-820). IEEE.
I helped create an open-source simulation environment for e-Health. Ideveloped the idea of using clustering with RL. I used the created environmentto implement and execute experiments using clustering and RL techniques.Lastly, I conducted the analysis and wrote a significant amount of the paper.
[II] Grua, E. M., Malavolta, I., & Lago, P. (2019, May). Self-adaptation inmobile apps: a systematic literature study. In 2019 IEEE/ACM 14thInternational Symposium on Software Engineering for Adaptive andSelf-Managing Systems (SEAMS) (pp. 51-62). IEEE.
I identified the lack of an up-to-date systematic review on self-adaptationon the context of mobile apps. I equally contributed to the study design andcreation of the customised classification framework presented. I conducted allof the paper gathering and most of the selection and analysis. Lastly, I wrotemost of the paper.
22
1.4. Contributions
[III] Barbaro, E., Grua, E. M., Malavolta, I., Stercevic, M., Weusthof, E., &van den Hoven, J. (2020). Modelling and predicting User Engagement inmobile applications. Data Science, (Preprint), 1-17.
The idea of using machine learning models to predict user engagement wasof the first author. A few of the machine learning models were implementedby other authors. I replicated and validated these models. I then selected,implemented and ran all other machine learning models present in the paper.I conducted the data analysis and extracted the results. I contributed in thewriting and revision of the whole paper.
[IV] Grua, E. M., Hoogendoorn, M., Malavolta, I., Lago, P., & Eiben, A. E.(2019, October). Clustream-GT: online clustering for personalization in thehealth domain. In IEEE/WIC/ACM International Conference on WebIntelligence (pp. 270-275).
I identified the lack of an online clustering algorithm fit for the healthdomain. I created and implemented a novel algorithm for online clustering forthe health domain. I then designed and implemented the evaluation approach.Lastly, I conducted the analysis of the results and wrote most of the paper.
[V] den Hengst, F., Grua, E. M., el Hassouni, A., & Hoogendoorn, M. (2020).Reinforcement learning for personalization: A systematic literature review.Data Science (pp. 1-41).
The idea of conducting this systematic literature review (SLR) was of thefirst author. I, however, guided the first author in the process of conducting theSLR and helped him with understanding the PRISMA standard for reportingon the SLR and its components. I contributed equally to the other authorsto the screening phases. I then contributed equally to the first author in thedata collection phase. I helped with the data analysis and equally contributedin examining results and extrapolating the identified shortcomings. Lastly, Ihelped with writing and reviewing several sections of the paper.
23
Chapter 1. Introduction
[VI] Grua, E. M., De Sanctis, M., & Lago, P. (2020, September). A ReferenceArchitecture for Personalized and Self-adaptive e-Health Apps. In EuropeanConference on Software Architecture (pp. 195-209). Springer, Cham.
I proposed the idea of a RA for personalised and self-adaptive e-Health apps.I performed most of the design of the RA. Lastly, I wrote most of the paper.
[VII] Grua, E. M., De Sanctis, M., Malavolta, I., Hoogendoorn, M., & Lago, P.(2021). Social Sustainability in the e-Health Domain via Personalized andSelf-adaptive Mobile Apps. Software Sustainability. Springer, Cham. Toappear (book chapter).
As an extension to paper [VI], I proposed and conducted the scenario basedevaluation as well as defining our RA in the scope of social sustainability. Icontributed to the viewpoint definition and wrote most of the paper.
[VIII] Grua, E. M., De Sanctis, M., Malavolta, I., Hoogendoorn, M., & Lago, P.(2021). An Evaluation of the Effectiveness of Personalization andSelf-Adaptation for e-Health Apps. Elsevier. Under review (journal).
As an extension to papers [VI, VII], I used our RA to guide the implementa-tion of an app. I mostly designed two experiments to evaluate the implementedapp. I conducted both experiments and performed the analyses on the collectedresults. Lastly, I wrote most of the paper.
1.5 Extra Publications
Schneider, A. F., Matinfar, S., Grua, E. M., Casado-Mansilla, D., &Cordewener, L. (2018, May). Towards a sustainable business model forsmartphones: Combining product-service systems with modularity. In ICT4S(pp. 82-99).
I contributed equally to the forming of the idea proposed, as well as thewriting of the paper.
24

1.5. Extra Publications
Chan-Jong-Chu, K., Islam, T., Exposito, M. M., Sheombar, S., Valladares, C.,Philippot, O., Grua, E.M., & Malavolta, I. (2020). Investigating the correlationbetween performance scores and energy consumption of mobile web apps. InProceedings of the International Conference on Evaluation and Assessment onSoftware Engineering (EASE), pp. 190–199.
I contributed in the idea forming phase. Furthermore, I helped with operatingthe tool used for the experiments and with the methodology of the analysis.
Malavolta, I., Grua, E. M., Lam, C. Y., De Vries, R., Tan, F., Zielinski, E.,Peters, & Kaandorp, L. (2020, September). A framework for the automaticexecution of measurement-based experiments on android devices. InProceedings of the 35th IEEE/ACM International Conference on AutomatedSoftware Engineering Workshops (pp. 61-66).
I implemented parts of the framework. I helped with the design of otherparts of the framework. Lastly, I tested and revised a significant amountof the framework. Furthermore, it is this framework that was used in themeasurement-based experiment conducted in Chapter 8.
25

Part I
Reinforcement learning and
machine learning for
personalisation and
engagement in e-Health
27

2Reinforcement Learning for
Personalisation
Chapter 2 was published as:
den Hengst, F., Grua, E. M., el Hassouni, A., & Hoogendoorn, M. (2020). Reinforcementlearning for personalization: A systematic literature review. Data Science (pp. 1-41).
29

Chapter 2. Reinforcement Learning for Personalisation
Abstract - This chapter provides important background knowledge whichwill be used to answer T.RQ1. The major application areas of reinforcementlearning (RL) have traditionally been game playing and continuous control. Inrecent years, however, RL has been increasingly applied in systems that interactwith humans. RL can personalise digital systems to make them more relevantto individual users. Challenges in personalisation settings may be different fromchallenges found in traditional application areas of RL. An overview of workthat uses RL for personalisation, however, is lacking. In this work, we introducea framework of personalisation settings and use it in a systematic literaturereview. Besides setting, we review solutions and evaluation strategies. Resultsshow that RL has been increasingly applied to personalisation problems andrealistic evaluations have become more prevalent. RL has become sufficientlyrobust to apply in contexts that involve humans and the field as a whole isgrowing. However, it seems not to be maturing: the ratios of studies thatinclude a comparison or a realistic evaluation are not showing upward trendsand the vast majority of algorithms are used only once. This review can beused to find related work across domains, provides insights into the state of thefield and identifies opportunities for future work.
2.1 Introduction
For several decades, both academia and commerce have sought to developtailored products and services at low cost in various application domains. Thesereach far and wide, including medicine [132; 16], human-computer interaction[218; 118], product, news, music and video recommendations [293; 295; 368]and even manufacturing [278; 85]. When products and services are adaptedto individual tastes, they become more appealing, desirable, informative, e.g.relevant to the intended user than one-size-fits all alternatives. Such adaptationis referred to as personalisation [109].
Digital systems enable personalisation on a grand scale. The key enabler isdata. While the software on these systems is identical for all users, the behaviourof these systems can be tailored based on experiences with individual users. For
30
2.1. Introduction
example, Netflix’s1 digital video delivery mechanism includes tracking of viewsand ratings. These ease the gratification of diverse entertainment needs as theyenable Netflix to offer instantaneous personalised content recommendations. Theability to adapt system behaviour to individual tastes is becoming increasinglyvaluable as digital systems permeate our society.
Recently, reinforcement learning (RL) has been attracting substantial at-tention as an elegant paradigm for personalisation based on data. For anyparticular environment or user state, this technique strives to determine thesequence of actions to maximise a reward. These actions are not necessarilyselected to yield the highest reward now, but are typically selected to achieve ahigh reward in the long term. Returning to the Netflix example, the companymay not be interested in having a user watch a single recommended videoinstantly, but rather aim for users to prolong their subscription after havingenjoyed many recommended videos. Besides the focus on long-term goals inRL, rewards can be formulated in terms of user feedback so that no explicitdefinition of desired behaviour is required [26; 149].
RL has seen successful applications to personalisation in a wide variety ofdomains. Some of the earliest work, such as [314], [312] and [394] focused on webservices. More recently, [198] showed that adding personalisation to an existingonline news recommendation engine increased click-through rates by 12.5%.Applications are not limited to web services, however. As an example from thehealth domain, [398] achieve optimal per-patient treatment plans to addressadvanced metastatic stage IIIB/IV non-small cell lung cancer in simulation.They state that ‘there is significant potential of the proposed methodology fordeveloping personalised treatment strategies in other cancers, in cystic fibrosis,and in other life-threatening diseases’. An early example of tailoring intelligenttutor behaviour using RL can be found in [227]. A more recent example inthis domain, [137], compared the effect of personalised and non-personalisedaffective feedback in language learning with a social robot for children andfound that personalisation significantly impacts psychological valence.
Although the aforementioned applications span various domains, they are
1 https://www.netflix.com
31
Chapter 2. Reinforcement Learning for Personalisation
similar in solution: they all use traits of users to achieve personalisation, andall rely on implicit feedback from users. Furthermore, the use of RL in contextsthat involve humans poses challenges unique to this setting. In traditionalRL subfields such as game-playing and robotics, for example, simulators canbe used for rapid prototyping and in-silico benchmarks are well established[181; 103; 32; 44]. Contexts with humans, however, may be much harder tosimulate and the deployment of autonomous agents in these contexts may comewith different concerns regarding for example safety. When using RL for apersonalisation problem, similar issues may arise across different applicationdomains. An overview of RL for personalisation across domains, however, islacking. We believe this is not to be attributed to fundamental differences insetting, solution or methodology, but stems from application domains workingin isolation for cultural and historical reasons.
This chapter provides an overview and categorisation of RL applications forpersonalisation across a variety of application domains. It thus aids researchersand practitioners in identifying related work relevant to a specific personalisationsetting, promotes the understanding of how RL is used for personalisation andidentifies challenges across domains. We first provide a brief introduction of theRL framework and formally introduce how it can be used for personalisation.We then present a framework to classify personalisation settings by. The purposeof this framework is for researchers with a specific setting to identify relevantrelated work across domains. We then use this framework in a systematicliterature review (SLR). We investigate in which settings RL is used, whichsolutions are common and how they are evaluated: Section 2.5 details the SLRprotocol, results and analysis are described in Section 8.3. All data collectedhas been made available digitally [96]. Finally, we conclude with current trendschallenges in Section 4.5.
2.2 Reinforcement learning for personalisation
RL considers problems in the framework of Markov decision processes or MDPs.In this framework, an agent collects rewards over time by performing actions in
32

2.2. Reinforcement learning for personalisation
Agent
Environment
actionat
rewardrt
statest
t t+ 1
Figure 2.1: The agent-environment in RL for personalisa-tion from [334].
an environment as depicted in Figure 2.1. The goal of the agent is to maximisethe total amount of collected rewards over time. In this section, we formallyintroduce the core concepts of MDPs and RL and include some strategies topersonalisation without aiming to provide an in depth introduction to RL.Following [334], we consider the related multi-armed and contextual banditproblems as special cases of the full RL problem where actions do not affect theenvironment and where observations of the environment are absent or presentrespectively. We refer the reader to [334], [376] and [336] for a full introduction.
An MDP is defined as a tuple 〈S,A, T,R, γ〉 where S ∈ {s1, . . . , sn}is a finite set of states, A ∈ {a1, . . . , am} a finite set of system actions,T : S ×A× S → [0, 1] a probabilistic transition function, R : S ×A→ Ra reward function and γ ∈ [0, 1] a factor to discount future rewards. Ateach time step t, the system is confronted with some state st, performs someaction at which yields a reward rt+1 : R(st, at) and some state st+1 follow-ing the probability distribution T (st, at). A series of these states, actionsand rewards from the onset to some terminal state T is called a trajectorytr : 〈st0 , at0 , rt1 , st1 , . . . , sT−1, aT−1, rT , sT 〉. These trajectories typicallycontain the interaction histories for users with the system. A single trajectorycan describe a single session of the user interacting with the system or cancontain many different separate sessions. Multiple trajectories may be availablein a data set D ∈ {tr1, . . . , tr`}. The goal is to find a policy π∗ out of allΠ : S ×A→ [0, 1] that maximises the sum of future rewards at any t, given
33
Chapter 2. Reinforcement Learning for Personalisation
an end time T :
Gt :
T−1∑k=t
γk−trk+1 (2.1)
If some expectation Eπ over the future reward for some policy π can beformulated, a value can be assigned to some state s given that policy:
Vπ(s) = Eπ[Gt|st = s] (2.2)
Similarly, a value can be assigned to an action a in a state s:
Qπ(s, a) = Eπ[Gt|st = s, at = a] (2.3)
Now the optimal policy π∗ should satisfy ∀s ∈ S, ∀π ∈ Π : Vπ∗(s) ≥ Vπ(s)
and ∀s ∈ S, a ∈ A, ∀π ∈ Π : Qπ∗(s, a) ≥ Qπ(s, a). Assuming a suitableEπ∗ [G], π∗ consists of selecting the action that is expected to yield the highestsum of rewards:
π∗(s) = arg maxa
Qπ∗(s, a), ∀s ∈ S, a ∈ A (2.4)
With these definitions in place, we now turn to methods of finding π∗. Suchmethods can be categorised by considering which elements of the MDP areknown. Generally, S, A and γ are determined upfront and known. T and R,on the other hand, may or may not be known. If they are both known, theexpectation Eπ[G] is directly available and a corresponding π∗ can be foundanalytically. In some settings, however, T and R may be unknown and π∗
must be found empirically. This can be done by estimating T , R, V , Q andfinally π∗ or a combination thereof using data set D. Thus, if we includeapproximations in Eq. (2.4), we get:
π∗(s)|D = arg maxa
Qπ∗(s, a)|D, ∀s ∈ S, a ∈ A (2.5)
As D may lack the required trajectories for a reasonable Eπ∗ [G] and may evenbe empty initially, exploratory actions can be selected to enrich D. Such actions
34

2.2. Reinforcement learning for personalisation
need not follow π∗ as in Eq. (2.5) but may be selected through some othermechanism such as sampling from the full action set A randomly.
Having introduced RL briefly, we continue by exploring some strategies inapplying this framework to the problem of personalising systems. We returnto our earlier example of a video recommendation task and consider a setof n users U ∈ {u1, . . . , un}. A first way to adapt software systems toan individual users’ needs is to define a separate environment, correspondingMDP and RL agent for each user. The overall goal becomes to find a set ofoptimal policies {π∗
1, . . . , π∗n} for a set of environments formalised as MDPs
M : {M1 : 〈S1, A1, T1, R1, γ1〉, . . . ,Mn : 〈Sn, An, Tn, Rn, γn〉}. Inthe case of approximations as in Eq. (2.5), these are made per MDP basedon data set Di with trajectories only involving that environment. In therunning example, videos would be recommended to a user based on previousvideo recommendations and selections of that particular user. The benefitof isolated MDPs is that differences between Ti and Tj or between Ri andRj for MDPs Mi 6= Mj are handled naturally, e.g. such differences do notmake Eπi [G] incorrect. On the other hand, similarities between Ti, Tj andRi, Rj cannot be used. For example, consider a video recommendation taskwith Sij = {morning, afternoon, night}. If two users ui 6= uj are bothusing a video service in the morning state, they may both like to watch abreakfast news broadcast whereas in the night state they may both prefera talk show. Learning such patterns for each environment individually mayrequire a substantial number of trajectories and may be infeasible in somesettings, such as those where users cannot be identified across trajectories orthose where each user is expected to contribute only one trajectory to Di.
An alternative approach is to define is a single agent and MDP with user-specific information in the state space S and learn a single π∗ for all users[97]. In some settings, users can be described using a function that returnsa vector representation of the l features that characterise a user φ : U →〈φ1(U), . . . , φl(U)〉. Such a vector could for example contain age, favouritegenre and viewing history. If two users uj 6= ui have both enjoyed the first“Lord of the Rings” movie and viewer uj has followed up on a recommendation of
35

Chapter 2. Reinforcement Learning for Personalisation
its sequel by the system then this sequel may be a suitable recommendation forthe other viewer ui as well. Generally, this approach can be valuable when it isunclear which elements of trajectories of users uj should be used in determiningπ∗i . Conceptually, finding π∗ now includes determining ui’s preference for
actions given a state and determining the relationship between user preferences.This approach should therefore be able to overcome the negative transfer problemdescribed below when enough trajectories are available. The growth in statespace size, on the other hand, may require an exorbitant number of trajectoriesin D due to the curse of dimensionality [34]. Thus, φ is to be carefully designedor dimensionality reduction techniques are to be used in approaches followingthis strategy. As a closing remark on this approach to personalisation, wenote that the distinction between task-related and user-specific information issomewhat artificial as S may already contain φ(U) in many practical settingsand we stress that the distinction is made for illustrative purposes here.
A third category of approaches can be considered as a middle ground betweenlearning a single π∗ and learning a π∗
i per user. It is motivated by the ideathat users and corresponding environments may be similar. If this is the case,then trajectories Dj from some similar environment Mj 6= Mi may proveuseful in estimating Eπi [G]. One such an approach is based on clustering[227; 337; 145; 107]. Formally, it requires q ≤ n groups G ∈ {g1, . . . , gq} anda mapping function Φ : M → G. In practice, this mapping function is typicallydefined on the level of users U or the feature representation φ(U). An RL agentis defined for every gp and interacts with all environments Mi,Mj,Φ(Mi) =
Φ(Mj) = gp. Trajectories in Di and Dj are concatenated or pooled to form asingle Dp which is used to approximate Eπp [G] for all Mi,Mj . A combinedDp may be orders of magnitude bigger than an isolated Di, which may resultin a much better approximation Eπp [G]|Dp and a resulting π∗
p(s)|Dp thatyields a higher reward in all environments. For example, users of the videorecommendation service may be clustered by age and users in the ‘infant’ clustermay generally prefer children’s movies over history documentaries. A relatedapproach similarly uses trajectories Dj of other environments Mj 6= Mi butstill aims to find environment-specific π∗
i . Trajectories in Dj are weighted during
36
2.3. Algorithms
estimation of Eπi [G] using some weighting scheme. This can be understood asa generalisation of the pooling approach. First, recall that Φ : M → G for thepooling approach and note that it can be rewritten to Φ : M ×M → {0, 1}.The weighting scheme, now, is a generalisation where Φ : M ×M → R.Finding a suitable Φ can be challenging in itself and depends on the availabilityof user features, trajectories and the task at hand. Typical strategies are to defineΦ in terms of similarity of feature representations of users [φ(ui), φ(uj)] orsimilarity of Di, Dj . The two previous approaches work under the assumptionthat Ti, Tj and Ri, Rj are similar and that Φ is suitable. If either of theseassumptions is not met, pooling data may result in a policy that is suboptimalfor both Mi and Mj . This phenomenon is typically referred to as the negativetransfer problem [267].
2.3 Algorithms
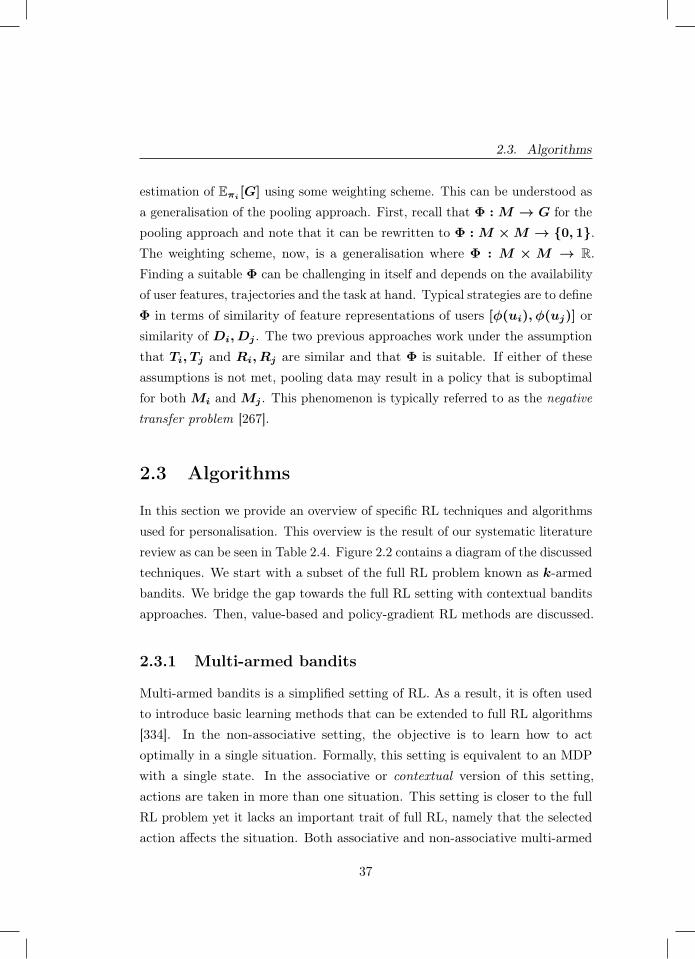
In this section we provide an overview of specific RL techniques and algorithmsused for personalisation. This overview is the result of our systematic literaturereview as can be seen in Table 2.4. Figure 2.2 contains a diagram of the discussedtechniques. We start with a subset of the full RL problem known as k-armedbandits. We bridge the gap towards the full RL setting with contextual banditsapproaches. Then, value-based and policy-gradient RL methods are discussed.
2.3.1 Multi-armed bandits
Multi-armed bandits is a simplified setting of RL. As a result, it is often usedto introduce basic learning methods that can be extended to full RL algorithms[334]. In the non-associative setting, the objective is to learn how to actoptimally in a single situation. Formally, this setting is equivalent to an MDPwith a single state. In the associative or contextual version of this setting,actions are taken in more than one situation. This setting is closer to the fullRL problem yet it lacks an important trait of full RL, namely that the selectedaction affects the situation. Both associative and non-associative multi-armed
37
Chapter 2. Reinforcement Learning for Personalisation
Reinforcement learningn=205
Multi-armedbandits n=24
UCBn=5
CLUBn=2
Contextualbandits n=12
LinUCBn=5
Value-basedn=99
Q-Learningn=60
DQNn=3
DDQNn=2
Policyiteration n=5
Fitted Q-iteration n=3
Dyna-Qn=2
Policy-gradient n=2
Actor-Criticn=8
Figure 2.2: Overview of types of RL algorithms discussed inthis section and the number of uses in publications includedin this survey. See Table 2.4 for a list of all (families of)algorithms used by more than one publication.
bandit approaches do not take into account temporal separation of actions andrelated rewards.
In general, multi-armed bandit solutions are not suitable when success isachieved by sequences of actions. Non-associative k-armed bandits solutionsare only applicable when context is not important. This makes them generallyunsuitable for personalisation as it typically utilises different personal contextsfor different users by offering a different functionality. In some niche areas,however, k-armed bandits are applicable and can be very attractive due to formalguarantees on their performance. If context is of importance, contextual banditapproaches provide a good starting point for personalising an application. Theseapproaches hold a middle ground between non-associative multi-armed banditsand full RL solutions in terms of modelling power and ease of implementation.Their theoretical guarantees on optimality are less strong than their k-armedcounterparts but they are easier to implement, evaluate and maintain than fullRL solutions.
2.3.1.1 k-Armed bandits
In a k-armed bandit setting, one is constantly faced with the choice betweenk different actions [334]. Depending on the selected action, a scalar reward is
38
2.3. Algorithms
obtained. This reward is drawn from a stationary probability distribution. It isassumed that an independent probability distribution exists for every action.The goal is to maximise the expected total reward over a certain period of time.Still considering the k-armed bandit setting, we assign a value Q(a) to each ofthe k actions and define this value as the expected reward given that the actionwas selected. The expected reward given that an action a is selected is definedas follows:
Q(a) = E[rt|at = a]. (2.6)
In a trivial problem setting, one knows the exact value of each action andselecting the action with the highest value would constitute the optimal policy.In more realistic problems, it is fair to assume that one cannot know the valuesof the actions exactly. In this case, one can estimate the value of an action. Wedenote this estimated value with Q(a) and our goal is to have estimate Q(a)
as close to the true Q(a) as possible.
At each time step t, estimates of the values of actions are obtained. Alwaysselecting the actions with the highest estimated value is called greedy actionselection. In this case we are exploiting the knowledge we have built about thevalues of the actions. When we select actions with a lower expected value, wesay we are exploring. In this case we are improving the estimates of values forthese actions. In the balancing act of exploration and exploitation, we opt forexploitation to maximise the expected total reward for the next step, whileopting for exploration could results in higher expected total reward in the longrun.
2.3.1.2 Action-value methods for multi-armed bandits
Action-value methods [334] denote a collections of methods used for estimatingthe values of actions. The most natural way of estimating the action-values isto average the rewards that were observed. This method is called the sample-
39
Chapter 2. Reinforcement Learning for Personalisation
average method. The value estimate Qπ(a) is then defined as:
Q(a) =
∑t−1i=1 ri · 1ai=a∑t−1
i=1 1ai=a
(2.7)
where 1ai=a is 1 when ai = a is true and 0 otherwise. A default value isassigned to Q(a) when the denominator is zero. As the denominator approachesinfinity, the estimate Q(a) converges to the true Q(a). Again, the most basicway of selecting actions is the greedy action selection method. Here the actionwith the highest value is selected. In the case of a tie, one action is selectedusing tie-breaking methods such as random selection. Greedy action selectionis defined as follows for any time point t:
at = arg maxa
Q(a). (2.8)
Greedy action selection only exploits knowledge built up using the action-value method and only maximises the immediate reward. This can lead toincorrect action-value approximations because actions with e.g. low estimatedbut high actual values are not sampled. An improvement over this greedy actionselection is to randomly explore with a small probability ε. This method isnamed the ε-greedy action selection. A benefit of this method is that, while it isrelatively simple, in the limit Q(a) will converge to Q(a) [334]. This indicatesthat the probability of selecting the optimal action is then greater than 1− ε
which is near certainty.
2.3.1.3 Incremental Implementation
In Section 2.3.1.2 we discussed a method to estimate action-values using sample-averaging. To ensure the usability of these method in real-world applications,we need to be able to compute these values in an efficient way. Assume a settingwith one action. At each iteration j a reward rtj is obtained after selecting anaction. Let Qn(a) denote the estimate value of the action after n−1 iterations.
40
2.3. Algorithms
We can then define:
Qn(a) =rt1 + rt2 + rt3 + ... + rtn−1
n− 1. (2.9)
Using this approach would mean storing the values of all the rewards torecalculate Qn(a) from scratch at every iteration. There is however a moreefficient way for calculating Qn(a) that is constant in memory and computationtime. Rewriting it yields the following update rule:
Qn+1(a) = Qn(a) +1
n[rtn − Qn(a)], (2.10)
where the term Qn(a) represents the old estimate, [rn − Qn(a)] the error inthe estimate we made of the reward and 1
nthe learning rate.
2.3.1.4 UCB: Upper-Confidence Bound
The greedy and ε-greedy action selection methods were discussed in Sec-tion 2.3.1.2 and it was introduced that exploration is required to establishgood action-value estimates. Although ε-greedy explores all actions eventually,it does so randomly. A better way of exploration would take into account theaction-value’s proximity to the optimal value and the uncertainty in the valueestimations. Intuitively, we want a selected action a to either provide a goodimmediate reward or else some very useful information in updating Q(a). Anapproach that uses this idea is the upper confidence bound action selection(UCB) method [334; 19; 125]. UCB is defined as follows at time step t:
at = arg maxa
[Qn(a) + c ·
√ln t
Nt(a)
](2.11)
where Nt(a) is how often action a was chosen up to time t and c > 0 is aparameter to control the rate of exploration. The square root term denotes thelevel of uncertainty in the approximation of the value of action a. Hence, UCBprovides an upper bound for the true value of the action a. Here, c is used todefine the confidence level. When the action a is selected often, Nt(a) will
41
Chapter 2. Reinforcement Learning for Personalisation
become larger which leads the uncertainty term to decrease. On the other hand,if the action a is not selected very often, t increases and so does the uncertaintyterm.
k-Armed bandit approaches address the trade-off between exploitation andexploration directly. It has been shown that the difference between the obtainedrewards and optimal rewards, or the regret, is at best logarithmic in the numberof iterations n in the absence of prior knowledge of the action value distributionsand in the absence of context [190]. UCB algorithms with a regret logarithmic inand uniformly distributed over n exist [19]. This makes them a very interestingchoice when strong theoretical guarantees on performance are required.
Whether these algorithms are suitable, however, depends on the settingat hand. If there is a large number of actions to choose from or when thetask is not stationary k-armed bandits are typically too simplistic. In a newsrecommendation task, for example, exploration may take longer than an itemstays relevant. Additionally, k-armed bandits are not suitable when action valuesare conditioned on the situation at hand, that is: when a single action resultsin a different reward based on e.g. time-of-day or user-specific information suchas in Section 2.2. In these scenarios, the problem formalisation of contextualbandits and the use of function approximation are of interest.
2.3.1.5 Contextual bandits
In the previous sections, action-values where not associated with differentsituations. In this section we extend the non-associative bandit setting tothe associative setting of contextual bandits. Assume a setting with n k-armed bandits problems. At each time step t one encounters a situation with arandomly selected k-armed bandits problem. We can use some of the approachesthat were discussed to estimate the action values. However, this is only possibleif the true action-values change slowly between the different n problems [334].Add to this setting the fact that now at each time t a distinctive piece ofinformation is provided about the underlying k-armed bandit which is not theactual action value. Using this information we can now learn a policy that usesthe distinctive information to associate the k-armed bandit with the best action
42
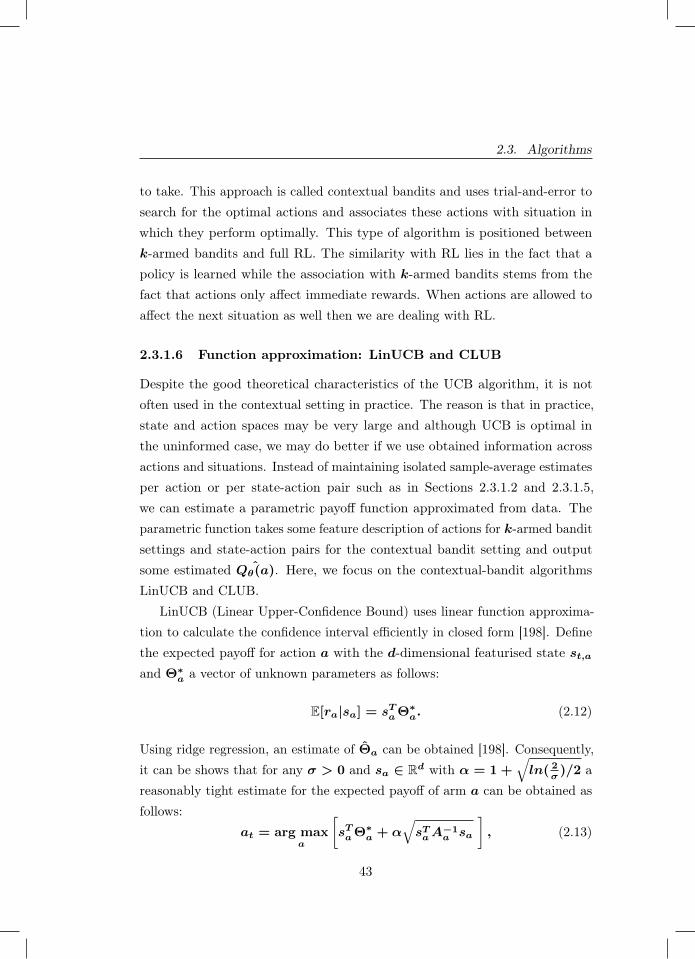
2.3. Algorithms
to take. This approach is called contextual bandits and uses trial-and-error tosearch for the optimal actions and associates these actions with situation inwhich they perform optimally. This type of algorithm is positioned betweenk-armed bandits and full RL. The similarity with RL lies in the fact that apolicy is learned while the association with k-armed bandits stems from thefact that actions only affect immediate rewards. When actions are allowed toaffect the next situation as well then we are dealing with RL.
2.3.1.6 Function approximation: LinUCB and CLUB
Despite the good theoretical characteristics of the UCB algorithm, it is notoften used in the contextual setting in practice. The reason is that in practice,state and action spaces may be very large and although UCB is optimal inthe uninformed case, we may do better if we use obtained information acrossactions and situations. Instead of maintaining isolated sample-average estimatesper action or per state-action pair such as in Sections 2.3.1.2 and 2.3.1.5,we can estimate a parametric payoff function approximated from data. Theparametric function takes some feature description of actions for k-armed banditsettings and state-action pairs for the contextual bandit setting and outputsome estimated ˆQθ(a). Here, we focus on the contextual-bandit algorithmsLinUCB and CLUB.
LinUCB (Linear Upper-Confidence Bound) uses linear function approxima-tion to calculate the confidence interval efficiently in closed form [198]. Definethe expected payoff for action a with the d-dimensional featurised state st,a
and Θ∗a a vector of unknown parameters as follows:
E[ra|sa] = sTaΘ∗a. (2.12)
Using ridge regression, an estimate of Θa can be obtained [198]. Consequently,it can be shows that for any σ > 0 and sa ∈ Rd with α = 1 +
√ln( 2
σ)/2 a
reasonably tight estimate for the expected payoff of arm a can be obtained asfollows:
at = arg maxa
[sTaΘ
∗a + α
√sTaA
−1a sa
], (2.13)
43

Chapter 2. Reinforcement Learning for Personalisation
where A−1a = DT
aDa + Id and Da a design matrix of dimension m x d
whose rows are the m contexts that are observed, ba ∈ Rm the correspondingresponse vector and Id the d x d identity matrix [198].
Similar to LinUCB, CLUB (Clustering of bandits) utilises the linear banditalgorithm for payoff estimation [129]. In contrast to LinUCB, CLUB usesadaptive clustering in order to speed up the learning process. The main ideais to use confidence balls of user models estimate user similarity and sharefeedback across similar users. CLUB can thus be understood as a cluster-basedalternative (see Section 2.2) to LinUCB algorithm.
2.3.2 Value-based RL
In value based RL, we learn an estimate V of the optimal value function Vπ∗ fora given policy π. We do this with the aim of finding π∗. Temporal-difference(TD) prediction is a method that learns from raw experiences without havingto build a model of the environment the policy is interacting with [334]. In thissection, we discuss various RL algorithms based on TD prediction.
2.3.2.1 Sarsa: on-policy temporal-difference RL
Sarsa is an on-policy temporal-difference method that learns an action-valuefunction [334; 325]. Given the current behaviour policy π, we estimate Qπ(a)
∀ s, and a. This is done using transitions from state-action pair to state-actionpair. Events of the form 〈st, at, rt+1, st+1, at+1〉 are used in the followingupdate rule to estimate the state-action values:
Qπ(st, at) = Qπ(st, at) + α[rt+1 + γQπ(st+1, at+1)− Qπ(st, at)
].
(2.14)
This update rule is applied after every transition from st to st+1. In casest+1 is a terminal state, a value of zero is assigned. By doing this we are ensuringthat the estimate Qπ for a behaviour policy π while resulting in changes in π
given Qπ. Sarsa will converge to an optimal action-value function Qπ∗ andhence an optimal policy π∗ in the limit given that all possible state-action pairs
44
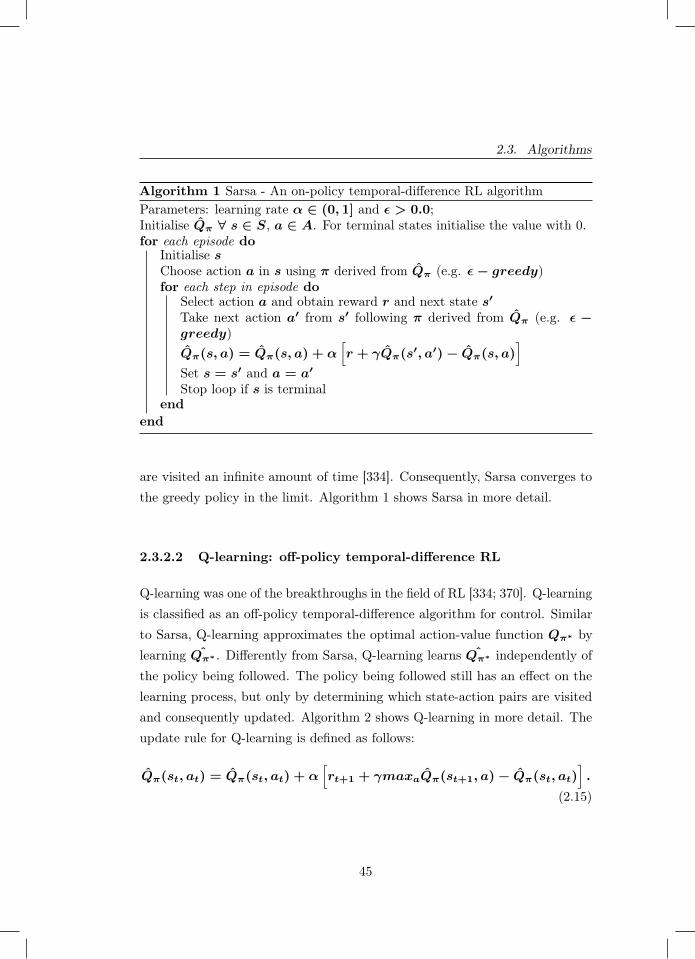
2.3. Algorithms
Algorithm 1 Sarsa - An on-policy temporal-difference RL algorithmParameters: learning rate α ∈ (0, 1] and ε > 0.0;Initialise Qπ ∀ s ∈ S, a ∈ A. For terminal states initialise the value with 0.for each episode do
Initialise sChoose action a in s using π derived from Qπ (e.g. ε− greedy)for each step in episode do
Select action a and obtain reward r and next state s′
Take next action a′ from s′ following π derived from Qπ (e.g. ε −greedy)Qπ(s, a) = Qπ(s, a) + α
[r + γQπ(s
′, a′)− Qπ(s, a)]
Set s = s′ and a = a′
Stop loop if s is terminalend
end
are visited an infinite amount of time [334]. Consequently, Sarsa converges tothe greedy policy in the limit. Algorithm 1 shows Sarsa in more detail.
2.3.2.2 Q-learning: off-policy temporal-difference RL
Q-learning was one of the breakthroughs in the field of RL [334; 370]. Q-learningis classified as an off-policy temporal-difference algorithm for control. Similarto Sarsa, Q-learning approximates the optimal action-value function Qπ∗ bylearning Qπ∗ . Differently from Sarsa, Q-learning learns Qπ∗ independently ofthe policy being followed. The policy being followed still has an effect on thelearning process, but only by determining which state-action pairs are visitedand consequently updated. Algorithm 2 shows Q-learning in more detail. Theupdate rule for Q-learning is defined as follows:
Qπ(st, at) = Qπ(st, at) + α[rt+1 + γmaxaQπ(st+1, a)− Qπ(st, at)
].
(2.15)
45
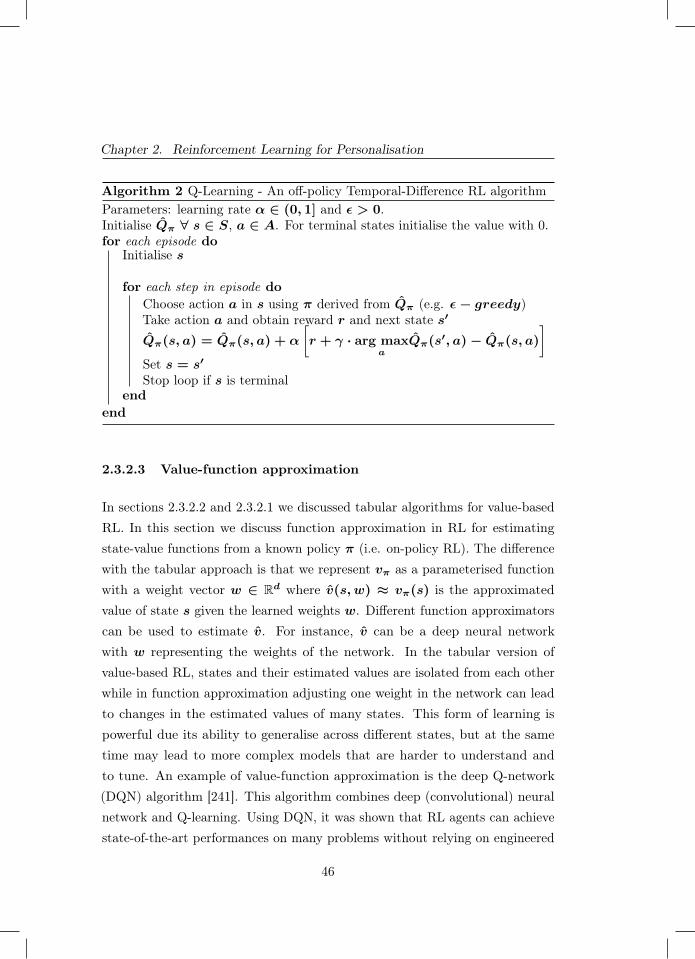
Chapter 2. Reinforcement Learning for Personalisation
Algorithm 2 Q-Learning - An off-policy Temporal-Difference RL algorithmParameters: learning rate α ∈ (0, 1] and ε > 0.Initialise Qπ ∀ s ∈ S, a ∈ A. For terminal states initialise the value with 0.for each episode do
Initialise s
for each step in episode doChoose action a in s using π derived from Qπ (e.g. ε− greedy)Take action a and obtain reward r and next state s′
Qπ(s, a) = Qπ(s, a) + α
[r + γ · arg max
aQπ(s
′, a)− Qπ(s, a)
]Set s = s′
Stop loop if s is terminalend
end
2.3.2.3 Value-function approximation
In sections 2.3.2.2 and 2.3.2.1 we discussed tabular algorithms for value-basedRL. In this section we discuss function approximation in RL for estimatingstate-value functions from a known policy π (i.e. on-policy RL). The differencewith the tabular approach is that we represent vπ as a parameterised functionwith a weight vector w ∈ Rd where v(s, w) ≈ vπ(s) is the approximatedvalue of state s given the learned weights w. Different function approximatorscan be used to estimate v. For instance, v can be a deep neural networkwith w representing the weights of the network. In the tabular version ofvalue-based RL, states and their estimated values are isolated from each otherwhile in function approximation adjusting one weight in the network can leadto changes in the estimated values of many states. This form of learning ispowerful due its ability to generalise across different states, but at the sametime may lead to more complex models that are harder to understand andto tune. An example of value-function approximation is the deep Q-network(DQN) algorithm [241]. This algorithm combines deep (convolutional) neuralnetwork and Q-learning. Using DQN, it was shown that RL agents can achievestate-of-the-art performances on many problems without relying on engineered
46
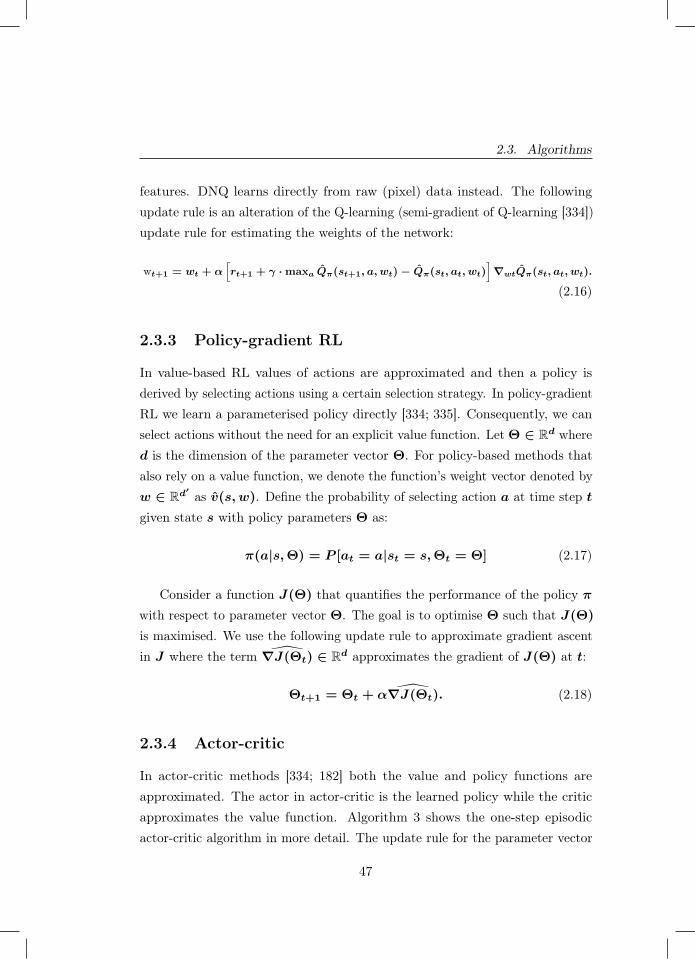
2.3. Algorithms
features. DNQ learns directly from raw (pixel) data instead. The followingupdate rule is an alteration of the Q-learning (semi-gradient of Q-learning [334])update rule for estimating the weights of the network:
wt+1 = wt + α[rt+1 + γ ·maxa Qπ(st+1, a, wt)− Qπ(st, at, wt)
]∇wtQπ(st, at, wt).
(2.16)
2.3.3 Policy-gradient RL
In value-based RL values of actions are approximated and then a policy isderived by selecting actions using a certain selection strategy. In policy-gradientRL we learn a parameterised policy directly [334; 335]. Consequently, we canselect actions without the need for an explicit value function. Let Θ ∈ Rd whered is the dimension of the parameter vector Θ. For policy-based methods thatalso rely on a value function, we denote the function’s weight vector denoted byw ∈ Rd′
as v(s, w). Define the probability of selecting action a at time step t
given state s with policy parameters Θ as:
π(a|s,Θ) = P [at = a|st = s,Θt = Θ] (2.17)
Consider a function J(Θ) that quantifies the performance of the policy π
with respect to parameter vector Θ. The goal is to optimise Θ such that J(Θ)
is maximised. We use the following update rule to approximate gradient ascentin J where the term ∇J(Θt) ∈ Rd approximates the gradient of J(Θ) at t:
Θt+1 = Θt + α∇J(Θt). (2.18)
2.3.4 Actor-critic
In actor-critic methods [334; 182] both the value and policy functions areapproximated. The actor in actor-critic is the learned policy while the criticapproximates the value function. Algorithm 3 shows the one-step episodicactor-critic algorithm in more detail. The update rule for the parameter vector
47
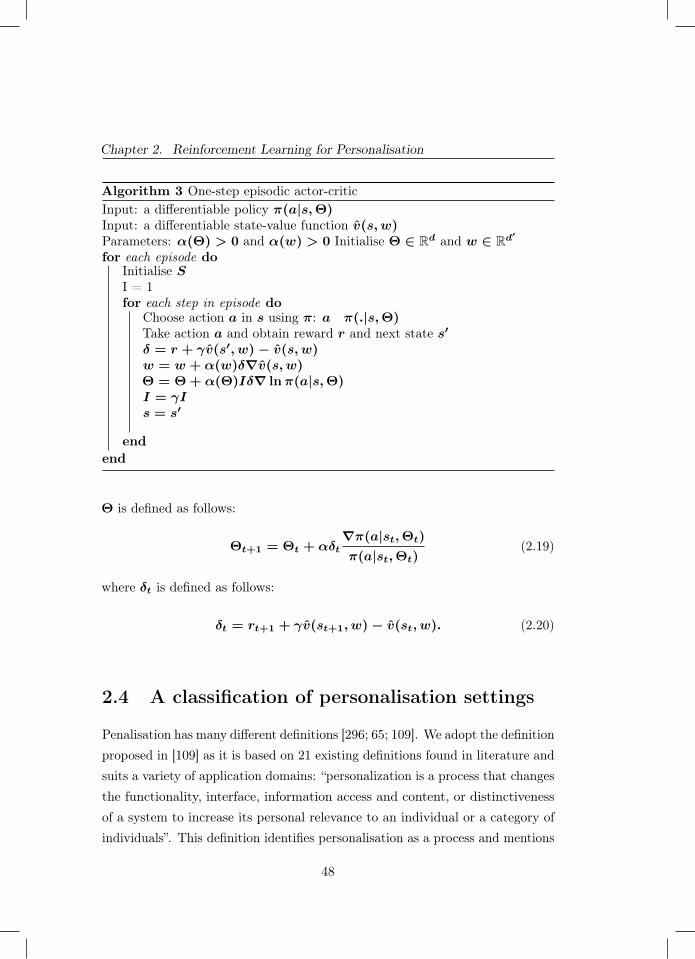
Chapter 2. Reinforcement Learning for Personalisation
Algorithm 3 One-step episodic actor-criticInput: a differentiable policy π(a|s,Θ)Input: a differentiable state-value function v(s, w)Parameters: α(Θ) > 0 and α(w) > 0 Initialise Θ ∈ Rd and w ∈ Rd′
for each episode doInitialise SI = 1for each step in episode do
Choose action a in s using π: a π(.|s,Θ)Take action a and obtain reward r and next state s′
δ = r + γv(s′, w)− v(s, w)w = w + α(w)δ∇v(s, w)Θ = Θ + α(Θ)Iδ∇ lnπ(a|s,Θ)I = γIs = s′
endend
Θ is defined as follows:
Θt+1 = Θt + αδt∇π(a|st,Θt)
π(a|st,Θt)(2.19)
where δt is defined as follows:
δt = rt+1 + γv(st+1, w)− v(st, w). (2.20)
2.4 A classification of personalisation settings
Penalisation has many different definitions [296; 65; 109]. We adopt the definitionproposed in [109] as it is based on 21 existing definitions found in literature andsuits a variety of application domains: “personalization is a process that changesthe functionality, interface, information access and content, or distinctivenessof a system to increase its personal relevance to an individual or a category ofindividuals”. This definition identifies personalisation as a process and mentions
48
2.4. A classification of personalisation settings
an existing system subject to that process. We include aspects of both thedesired process of change and existing system in our framework. Section 2.5.4further details how this framework was used in a SLR.
Table 2.1 provides an overview of the framework. On a high level, wedistinguish three categories. The first category contains aspects of suitabilityof system behaviour. We differentiate settings in which suitability of systembehaviour is determined explicitly by users and settings in which it is inferredby the system after observing user behaviour [309]. For example, a user canexplicitly rate suitability of a video recommendation; a system can also infersuitability by observing whether the user decides to watch the video. Whetherimplicit or explicit feedback is preferable depends on availability and qualityof feedback signals [309; 168]. Besides suitability, we consider safety of systembehaviour. Unaltered RL algorithms use trial-and-error style exploration tooptimise their behaviour yet this may not suit a particular domain. For example,tailoring the insulin delivery policy of an artificial pancreas to the metabolismof an individual requires trial insulin delivery action but these should only besampled when their outcome is within safe certainty bounds [93]. If safety isa significant concern in the systems’ application domain, specifically designedsafety-aware RL techniques may be required, see [271] and [124] for overviewsof such techniques.
Aspects in the second category deal with the availability of upfront knowledge.Firstly, knowledge of how users respond to system actions may be capturedin user models. Such models open up a range of RL solutions that requireless or no sampling of new interactions with users [154]. As an example, userpain models are used to predict suitability of exercises in an adaptive physicalrehabilitation curriculum manager a priori[354]. Models can also be used tointeract with the RL agent in simulation. For example, dialogue agent modulesmay be trained by interacting with a simulated chatbot user [97]. Secondly,upfront knowledge may be available in the form of data on human responsesto system behaviour. This data can be used to derive user models and can beused to optimise policies directly and provide high-confidence evaluations ofsuch policies [204; 349].
49
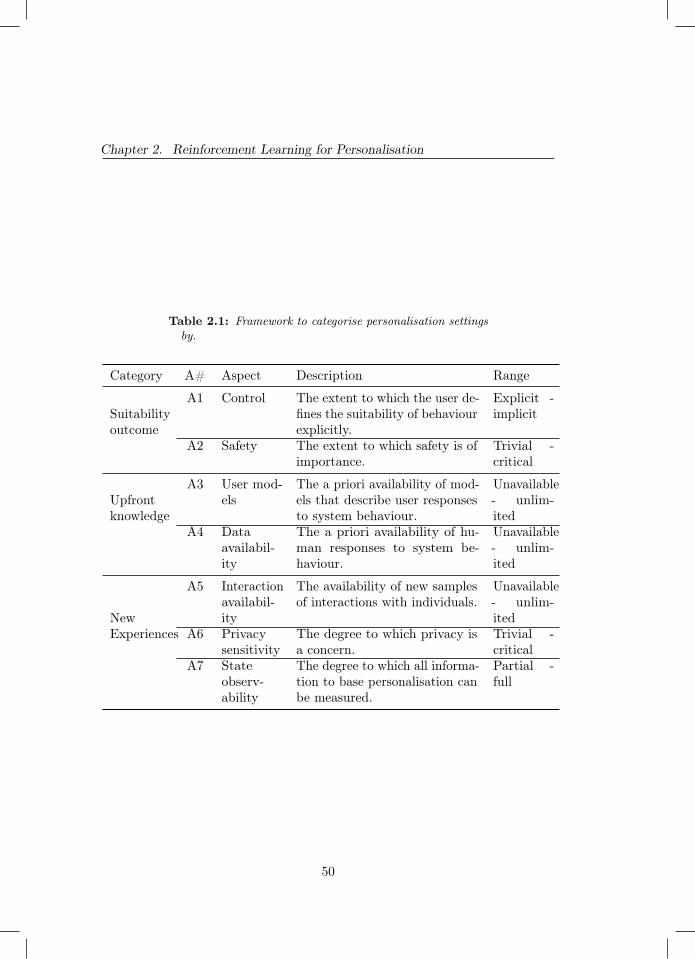
Chapter 2. Reinforcement Learning for Personalisation
Table 2.1: Framework to categorise personalisation settingsby.
Category A# Aspect Description Range
Suitabilityoutcome
A1 Control The extent to which the user de-fines the suitability of behaviourexplicitly.
Explicit -implicit
A2 Safety The extent to which safety is ofimportance.
Trivial -critical
Upfrontknowledge
A3 User mod-els
The a priori availability of mod-els that describe user responsesto system behaviour.
Unavailable- unlim-ited
A4 Dataavailabil-ity
The a priori availability of hu-man responses to system be-haviour.
Unavailable- unlim-ited
NewExperiences
A5 Interactionavailabil-ity
The availability of new samplesof interactions with individuals.
Unavailable- unlim-ited
A6 Privacysensitivity
The degree to which privacy isa concern.
Trivial -critical
A7 Stateobserv-ability
The degree to which all informa-tion to base personalisation canbe measured.
Partial -full
50
2.5. A systematic literature review
The third category details new experiences. Empirical RL approaches haveproven capable of modelling extremely complex dynamics, however, this typicallyrequires complex estimators that in turn need substantial amounts of trainingdata. The availability of users to interact with is therefore a major considerationwhen designing an RL solution. A second aspect that relates to the use ofnew experiences is privacy sensitivity of the setting. Privacy sensitivity is ofimportance as it may restrict sharing, pooling or any other specific usage of data[21]. Finally, we identify the state observability as a relevant aspect. In somesettings, the true environment state cannot be observed directly but must beestimated using available observations. This may be common as personalisationexploits differences in mental [46; 368; 175] and physical state [128; 228]. Forexample, recommending appropriate music during running involves matchingsongs to the user emotional state and e.g. running pace. Both mental andphysical state may be hard to measure accurately [37; 4; 274].
Although aspects in Table 2.1 are presented separately, we explicitly notethat they are not mutually independent. Settings where privacy is a majorconcern, for example, are expected to typically have less existing and newinteractions available. Similarly, safety requirements will impact new interactionavailability. Presence of upfront knowledge is mostly of interest in settingswhere control lies with the system as it may ease the control task. In contrast,user models may be marginally important if desired behaviour is specified bythe user in full. Finally, a lack of upfront knowledge and partial observabilitycomplicates adhering to safety requirements.
2.5 A systematic literature review
A SLR is ‘a form of secondary study that uses a well-defined methodologyto identify, analyse and interpret all available evidence related to a specificresearch question in a way that is unbiased and (to a degree) repeatable’ [48].PRISMA is a standard for reporting on SLRs and details eligibility criteria,article collection, screening process, data extraction and data synthesis [246].This section contains a report on this SLR according to the PRISMA statement.
51
Chapter 2. Reinforcement Learning for Personalisation
This SLR was a collaborative work to which all authors contributed. We denoteauthors by abbreviation of their names, e.g. FDH, EG, AEH and MH.
2.5.1 Inclusion criteria
Studies in this SLR were included on the basis of three eligibility criteria. To beincluded, articles had to be published in a peer-reviewed journal or conferenceproceedings in English. Secondly, the study had to address a problem fitting toour definition of personalisation as described in Section 2.4. Finally, the studyhad to use a RL algorithm to address such a personalisation problem. Here,we view contextual bandit algorithms as a subset of RL algorithms and thusincluded them in our analysis. Additionally, we excluded studies in which a RLalgorithm was used for purposes other than personalisation.
2.5.2 Search strategy
Figure 2.3 contains an overview of the SLR process. The first step is to run aquery on a set of databases. For this SLR, a query was run on Scopus, IEEEXplore, ACM’s full-text collection, DBLP and Google Scholar on June 6, 2018.These databases were selected as their combined index spans a wide range,and their combined result set was sufficiently large for this study. Scopus andIEEE Xplore support queries on title, keywords and abstract. ACM’s full-text collection, DBLP and Google scholar do not support queries on keywordsand abstract content. We therefore ran two kinds of queries: we queriedon title only for ACM’s full-text collection, DBLP and Google Scholar andwe extended this query to keywords and abstract content for Scopus andIEEE Xplore. The query was constructed by combining techniques of interestand keywords for the personalisation problem. For techniques of interest theterms ‘reinforcement learning’ and ‘contextual bandits’ were used. For thepersonalisation problem, variations on the words ‘personalized’, ‘customized’,‘individualized’ and ‘tailored’ were included in British and American spelling.All queries are listed in Appendix 2.8. Query results were de-duplicated andstored in a spreadsheet.
52
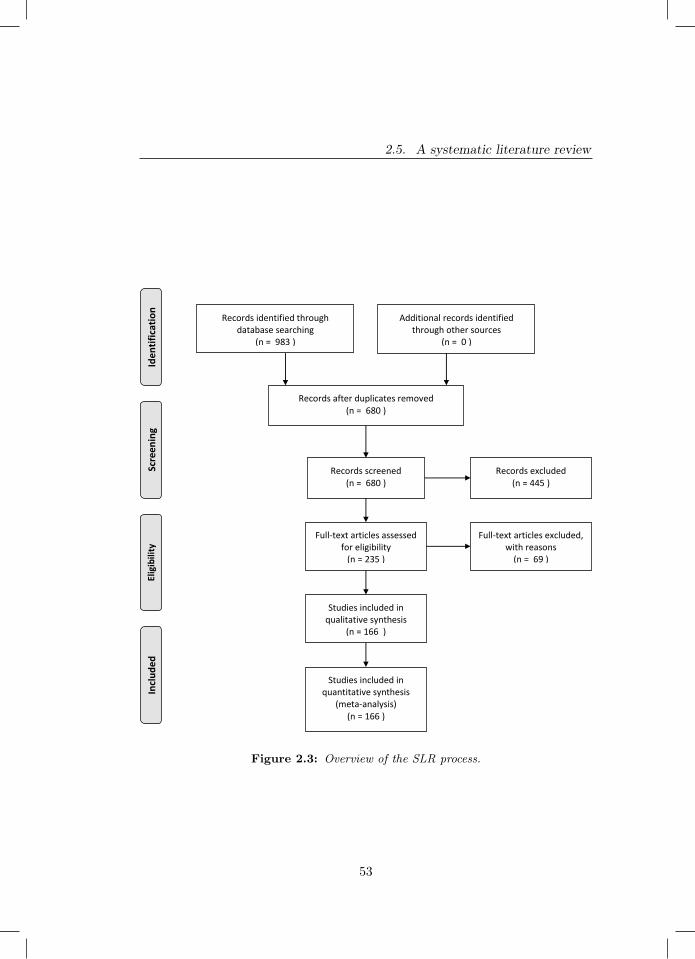
2.5. A systematic literature review
Records identified through database searching
(n = 983 )
Scre
enin
g In
clu
ded
El
igib
ility
Id
enti
fica
tio
n
Additional records identified through other sources
(n = 0 )
Records after duplicates removed (n = 680 )
Records screened (n = 680 )
Records excluded (n = 445 )
Full-text articles assessed for eligibility
(n = 235 )
Full-text articles excluded, with reasons
(n = 69 )
Studies included in qualitative synthesis
(n = 166 )
Studies included in quantitative synthesis
(meta-analysis) (n = 166 )
Figure 2.3: Overview of the SLR process.
53
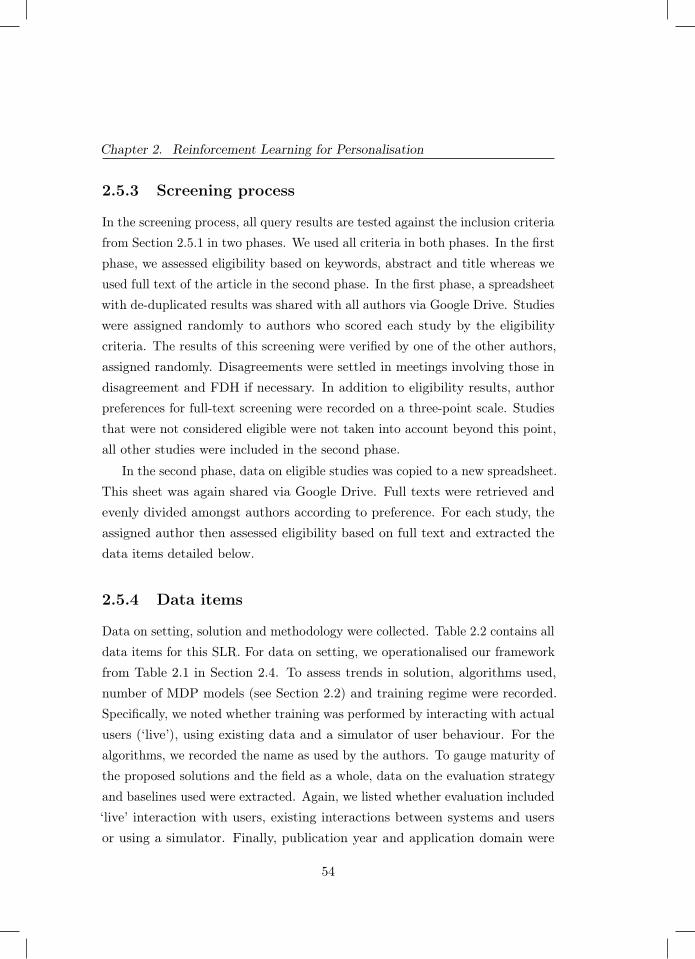
Chapter 2. Reinforcement Learning for Personalisation
2.5.3 Screening process
In the screening process, all query results are tested against the inclusion criteriafrom Section 2.5.1 in two phases. We used all criteria in both phases. In the firstphase, we assessed eligibility based on keywords, abstract and title whereas weused full text of the article in the second phase. In the first phase, a spreadsheetwith de-duplicated results was shared with all authors via Google Drive. Studieswere assigned randomly to authors who scored each study by the eligibilitycriteria. The results of this screening were verified by one of the other authors,assigned randomly. Disagreements were settled in meetings involving those indisagreement and FDH if necessary. In addition to eligibility results, authorpreferences for full-text screening were recorded on a three-point scale. Studiesthat were not considered eligible were not taken into account beyond this point,all other studies were included in the second phase.
In the second phase, data on eligible studies was copied to a new spreadsheet.This sheet was again shared via Google Drive. Full texts were retrieved andevenly divided amongst authors according to preference. For each study, theassigned author then assessed eligibility based on full text and extracted thedata items detailed below.
2.5.4 Data items
Data on setting, solution and methodology were collected. Table 2.2 contains alldata items for this SLR. For data on setting, we operationalised our frameworkfrom Table 2.1 in Section 2.4. To assess trends in solution, algorithms used,number of MDP models (see Section 2.2) and training regime were recorded.Specifically, we noted whether training was performed by interacting with actualusers (‘live’), using existing data and a simulator of user behaviour. For thealgorithms, we recorded the name as used by the authors. To gauge maturity ofthe proposed solutions and the field as a whole, data on the evaluation strategyand baselines used were extracted. Again, we listed whether evaluation included‘live’ interaction with users, existing interactions between systems and usersor using a simulator. Finally, publication year and application domain were
54
2.6. Results
registered to enable identification of trends over time and across domains. Thelist of domains was composed as follows: during phase one of the screeningprocess, all authors recorded a domain for each included paper, yielding a highlyinconsistent initial set of domains. This set was simplified into a more consistentset of domains which was used during full-text screening. For papers thatdid not fall into this consistent set of domains, two categories were added: a‘Domain Independent’ and an ‘Other’ category. The actual domain was recordedfor the five papers in the ‘Other’ category. These domains were not furtherconsolidated as all five papers were assigned to unique domains not encounteredbefore.
2.5.5 Synthesis and analysis
To facilitate analysis, reported algorithms were normalised using simple textnormalisation and key-collision methods. The resulting mappings are availablein the dataset release [96]. Data was summarised using descriptive statisticsand figures with an accompanying narrative to gain insight into trends withrespect to settings, solutions and evaluation over time and across domains.
2.6 Results
The quantitative synthesis and analyses introduced in Section 2.5.5 were appliedto the collected data. In this section, we present insights obtained. We focuson the major insights and encourage the reader to explore the tabular view inAppendix 2.9 or the collected data for further analysis [96].
Before diving into the details of the study in light of the classification schemewe have proposed, let us first study some general trends. Figure 2.4 shows thenumber of publications addressing personalisation using RL techniques overtime. A clear increase can be seen. With over forty entries, the health domaincontains by far the most articles, followed by entertainment, education andcommerce with all approximately just over twenty five entries. Other domainscontain less than twelve papers in total. Figure 2.5a shows the popularity of
55
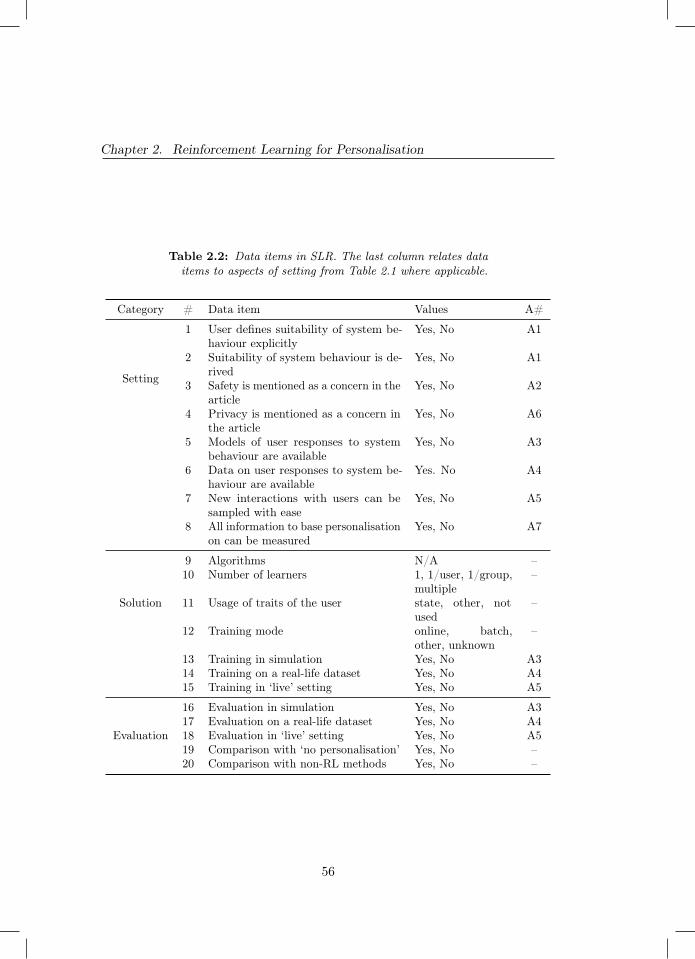
Chapter 2. Reinforcement Learning for Personalisation
Table 2.2: Data items in SLR. The last column relates dataitems to aspects of setting from Table 2.1 where applicable.
Category # Data item Values A#
Setting
1 User defines suitability of system be-haviour explicitly
Yes, No A1
2 Suitability of system behaviour is de-rived
Yes, No A1
3 Safety is mentioned as a concern in thearticle
Yes, No A2
4 Privacy is mentioned as a concern inthe article
Yes, No A6
5 Models of user responses to systembehaviour are available
Yes, No A3
6 Data on user responses to system be-haviour are available
Yes. No A4
7 New interactions with users can besampled with ease
Yes, No A5
8 All information to base personalisationon can be measured
Yes, No A7
Solution
9 Algorithms N/A –10 Number of learners 1, 1/user, 1/group,
multiple–
11 Usage of traits of the user state, other, notused
–
12 Training mode online, batch,other, unknown
–
13 Training in simulation Yes, No A314 Training on a real-life dataset Yes, No A415 Training in ‘live’ setting Yes, No A5
Evaluation
16 Evaluation in simulation Yes, No A317 Evaluation on a real-life dataset Yes, No A418 Evaluation in ‘live’ setting Yes, No A519 Comparison with ‘no personalisation’ Yes, No –20 Comparison with non-RL methods Yes, No –
56
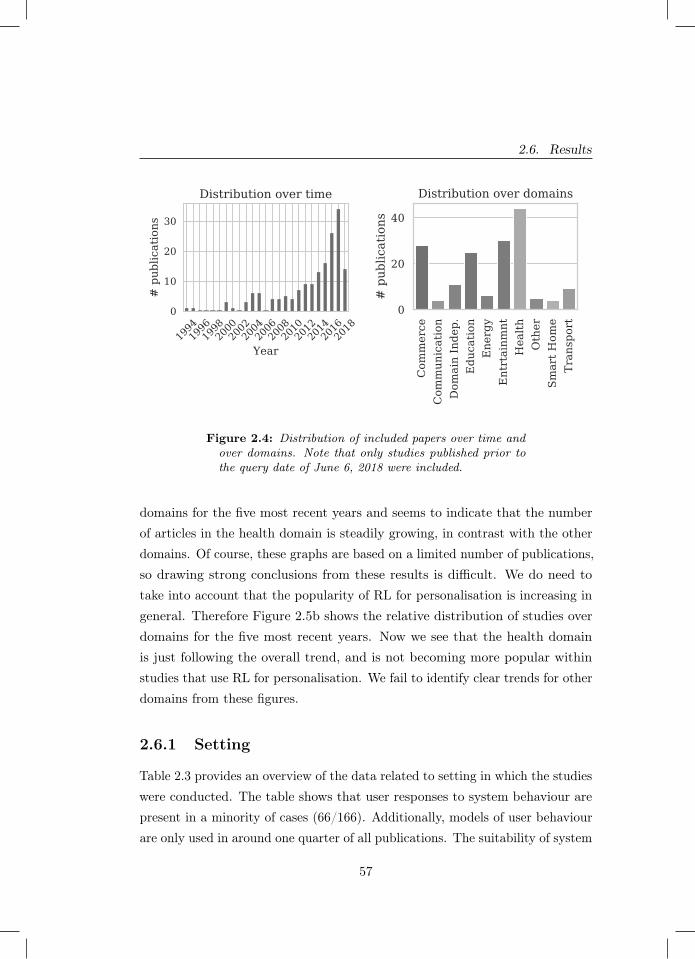
2.6. Results
1994199619982000200220042006200820102012201420162018
Year
0
10
20
30
# pub
lications
Distribution over time
Com
merce
Com
mun
ication
Dom
ain Inde
p.Edu
catio
nEne
rgy
Entrtainm
ntHea
lthOther
Smart H
ome
Tran
sport
0
20
40
# pub
lications
Distribution over domains
Figure 2.4: Distribution of included papers over time andover domains. Note that only studies published prior tothe query date of June 6, 2018 were included.
domains for the five most recent years and seems to indicate that the numberof articles in the health domain is steadily growing, in contrast with the otherdomains. Of course, these graphs are based on a limited number of publications,so drawing strong conclusions from these results is difficult. We do need totake into account that the popularity of RL for personalisation is increasing ingeneral. Therefore Figure 2.5b shows the relative distribution of studies overdomains for the five most recent years. Now we see that the health domainis just following the overall trend, and is not becoming more popular withinstudies that use RL for personalisation. We fail to identify clear trends for otherdomains from these figures.
2.6.1 Setting
Table 2.3 provides an overview of the data related to setting in which the studieswere conducted. The table shows that user responses to system behaviour arepresent in a minority of cases (66/166). Additionally, models of user behaviourare only used in around one quarter of all publications. The suitability of system
57
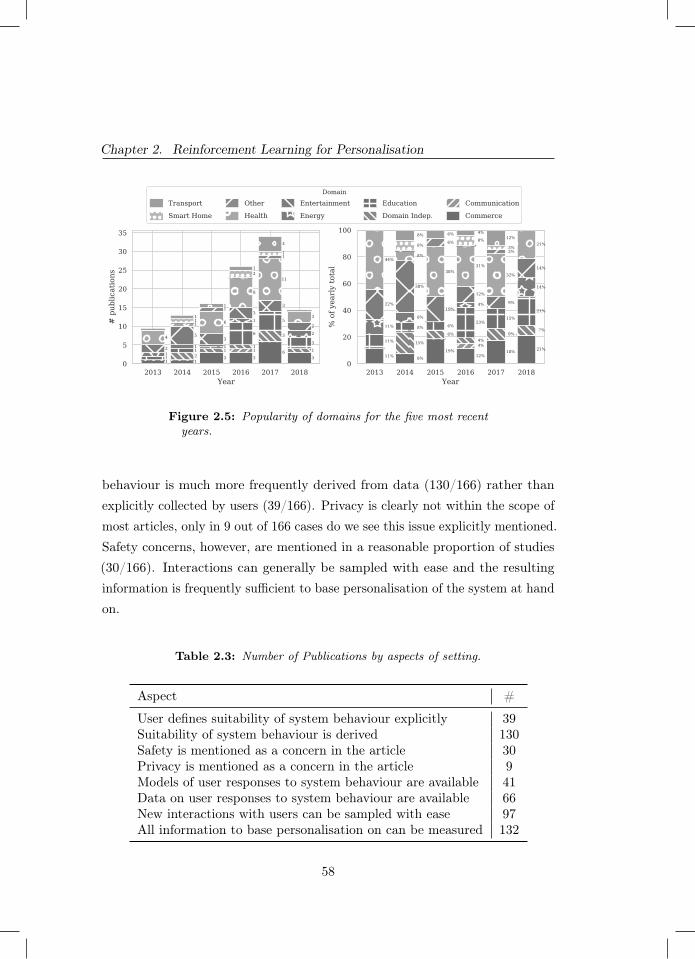
Chapter 2. Reinforcement Learning for Personalisation
2013 2014 2015 2016 2017 2018Year
0
5
10
15
20
25
30
35
# p
ublic
atio
ns
1 1 3 3
6 3
1 2
1 1
3
1
1
1 1
6
5
3
1
1
1
2
2
5 3
3
3
2
4
1 6
8
11
3
1
1
1
2
1
1
1
1
4
2013 2014 2015 2016 2017 2018Year
0
20
40
60
80
100
% o
f yea
rly
tota
l
11% 8%
19%12%
18% 21% 4%15%
6% 4%
9% 7%
11%
8% 6%23%
15%
21%
11%
8%
4%
14%
22%
38%
19%
12%
9%
14%
44% 8%
38%31%
32%
21% 6%
3% 8%
8%
3%
8% 6% 4%12%
Domain
Transport
Smart Home
Other
Health
Entertainment
Energy
Education
Domain Indep.
Communication
Commerce
Figure 2.5: Popularity of domains for the five most recentyears.
behaviour is much more frequently derived from data (130/166) rather thanexplicitly collected by users (39/166). Privacy is clearly not within the scope ofmost articles, only in 9 out of 166 cases do we see this issue explicitly mentioned.Safety concerns, however, are mentioned in a reasonable proportion of studies(30/166). Interactions can generally be sampled with ease and the resultinginformation is frequently sufficient to base personalisation of the system at handon.
Table 2.3: Number of Publications by aspects of setting.
Aspect #
User defines suitability of system behaviour explicitly 39Suitability of system behaviour is derived 130Safety is mentioned as a concern in the article 30Privacy is mentioned as a concern in the article 9Models of user responses to system behaviour are available 41Data on user responses to system behaviour are available 66New interactions with users can be sampled with ease 97All information to base personalisation on can be measured 132
58
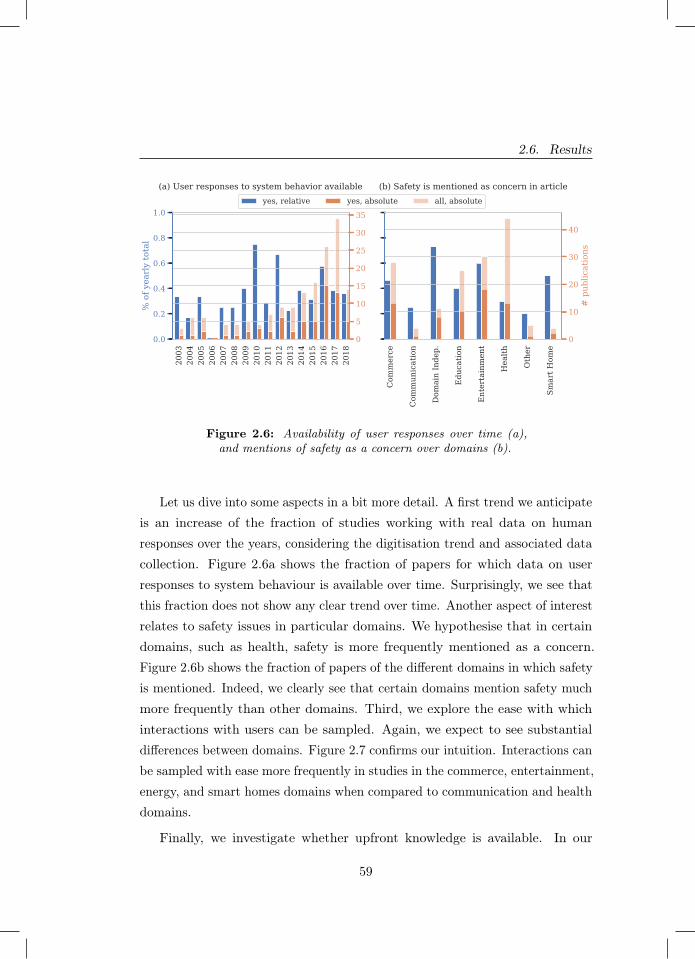
2.6. Results
2003
2004
2005
2006
2007
2008
2009
2010
2011
2012
2013
2014
2015
2016
2017
2018
0.0
0.2
0.4
0.6
0.8
1.0
% o
f yea
rly
tota
l
(a) User responses to system behavior available
Com
mer
ce
Com
mun
icat
ion
Dom
ain
Inde
p.
Edu
catio
n
Ent
erta
inm
ent
Hea
lth
Oth
er
Smar
t Hom
e
(b) Safety is mentioned as concern in article
0
5
10
15
20
25
30
35
0
10
20
30
40
# p
ublic
atio
ns
yes, relative yes, absolute all, absolute
Figure 2.6: Availability of user responses over time (a),and mentions of safety as a concern over domains (b).
Let us dive into some aspects in a bit more detail. A first trend we anticipateis an increase of the fraction of studies working with real data on humanresponses over the years, considering the digitisation trend and associated datacollection. Figure 2.6a shows the fraction of papers for which data on userresponses to system behaviour is available over time. Surprisingly, we see thatthis fraction does not show any clear trend over time. Another aspect of interestrelates to safety issues in particular domains. We hypothesise that in certaindomains, such as health, safety is more frequently mentioned as a concern.Figure 2.6b shows the fraction of papers of the different domains in which safetyis mentioned. Indeed, we clearly see that certain domains mention safety muchmore frequently than other domains. Third, we explore the ease with whichinteractions with users can be sampled. Again, we expect to see substantialdifferences between domains. Figure 2.7 confirms our intuition. Interactions canbe sampled with ease more frequently in studies in the commerce, entertainment,energy, and smart homes domains when compared to communication and healthdomains.
Finally, we investigate whether upfront knowledge is available. In our
59
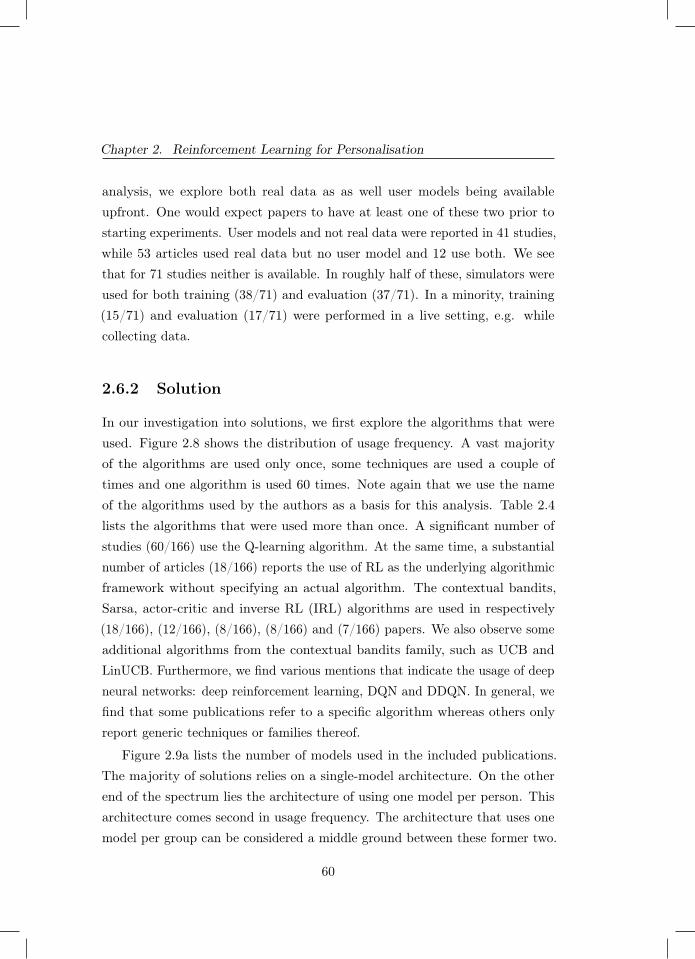
Chapter 2. Reinforcement Learning for Personalisation
analysis, we explore both real data as as well user models being availableupfront. One would expect papers to have at least one of these two prior tostarting experiments. User models and not real data were reported in 41 studies,while 53 articles used real data but no user model and 12 use both. We seethat for 71 studies neither is available. In roughly half of these, simulators wereused for both training (38/71) and evaluation (37/71). In a minority, training(15/71) and evaluation (17/71) were performed in a live setting, e.g. whilecollecting data.
2.6.2 Solution
In our investigation into solutions, we first explore the algorithms that wereused. Figure 2.8 shows the distribution of usage frequency. A vast majorityof the algorithms are used only once, some techniques are used a couple oftimes and one algorithm is used 60 times. Note again that we use the nameof the algorithms used by the authors as a basis for this analysis. Table 2.4lists the algorithms that were used more than once. A significant number ofstudies (60/166) use the Q-learning algorithm. At the same time, a substantialnumber of articles (18/166) reports the use of RL as the underlying algorithmicframework without specifying an actual algorithm. The contextual bandits,Sarsa, actor-critic and inverse RL (IRL) algorithms are used in respectively(18/166), (12/166), (8/166), (8/166) and (7/166) papers. We also observe someadditional algorithms from the contextual bandits family, such as UCB andLinUCB. Furthermore, we find various mentions that indicate the usage of deepneural networks: deep reinforcement learning, DQN and DDQN. In general, wefind that some publications refer to a specific algorithm whereas others onlyreport generic techniques or families thereof.
Figure 2.9a lists the number of models used in the included publications.The majority of solutions relies on a single-model architecture. On the otherend of the spectrum lies the architecture of using one model per person. Thisarchitecture comes second in usage frequency. The architecture that uses onemodel per group can be considered a middle ground between these former two.
60
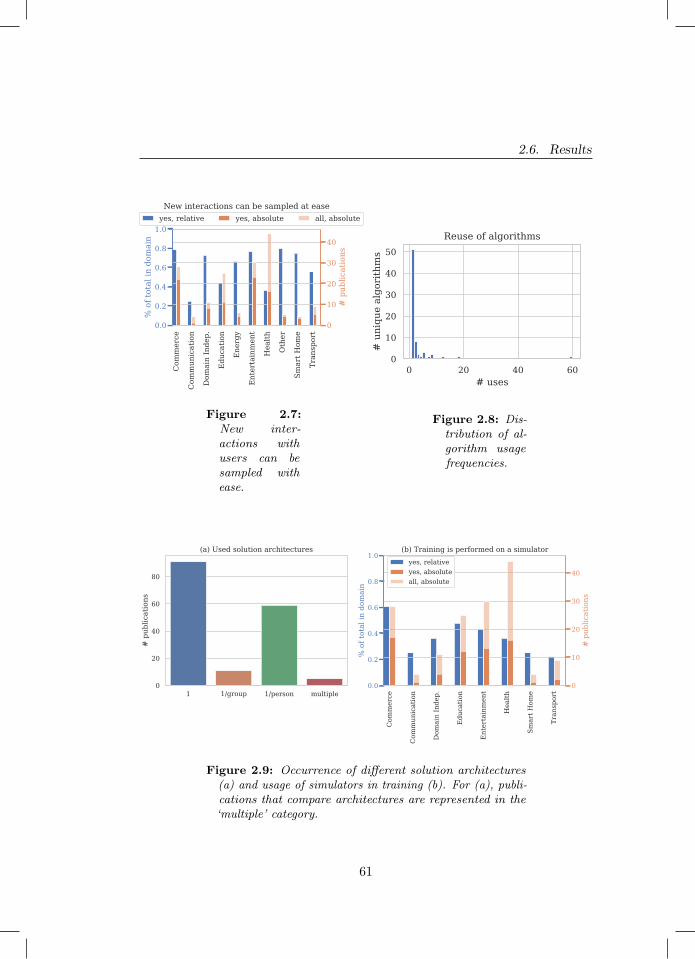
2.6. Results
Com
mer
ce
Com
mun
icat
ion
Dom
ain
Inde
p.
Edu
catio
n
Ene
rgy
Ent
erta
inm
ent
Hea
lth
Oth
er
Smar
t Hom
e
Tran
spor
t0.0
0.2
0.4
0.6
0.8
1.0
% o
f tot
al in
dom
ain
New interactions can be sampled at ease
0
10
20
30
40
# p
ublic
atio
ns
yes, relative yes, absolute all, absolute
Figure 2.7:New inter-actions withusers can besampled withease.
0 20 40 60# uses
0
10
20
30
40
50
# u
niqu
e al
gori
thm
s
Reuse of algorithms
Figure 2.8: Dis-tribution of al-gorithm usagefrequencies.
1 1/group 1/person multiple0
20
40
60
80
# p
ublic
atio
ns
(a) Used solution architectures
Com
mer
ce
Com
mun
icat
ion
Dom
ain
Inde
p.
Edu
catio
n
Ent
erta
inm
ent
Hea
lth
Smar
t Hom
e
Tran
spor
t
0.0
0.2
0.4
0.6
0.8
1.0
% o
f tot
al in
dom
ain
(b) Training is performed on a simulator
0
10
20
30
40
# p
ublic
atio
ns
yes, relativeyes, absoluteall, absolute
Figure 2.9: Occurrence of different solution architectures(a) and usage of simulators in training (b). For (a), publi-cations that compare architectures are represented in the‘multiple’ category.
61
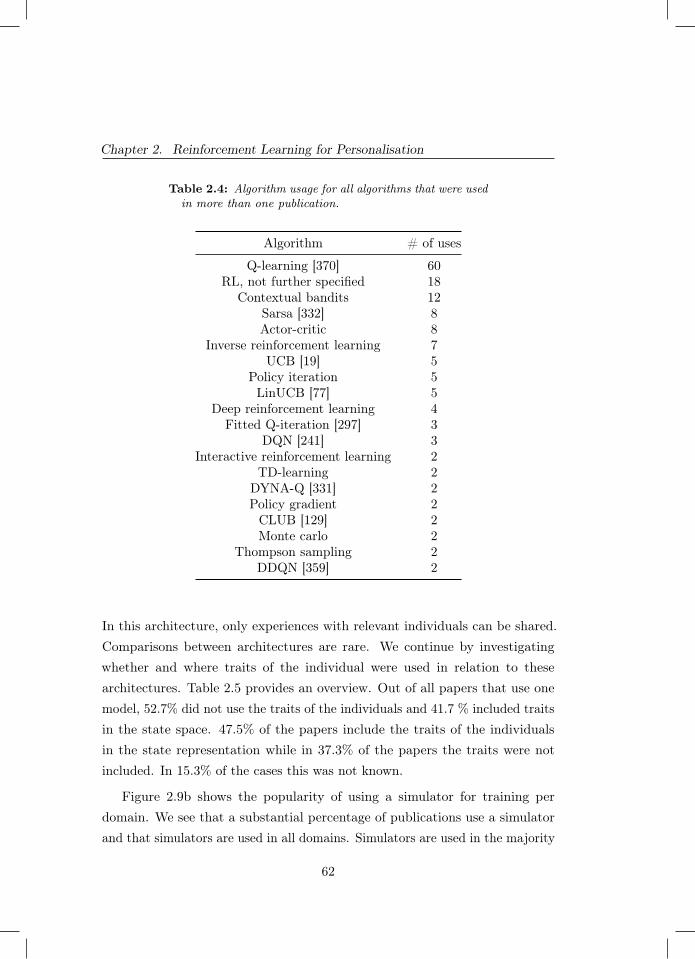
Chapter 2. Reinforcement Learning for Personalisation
Table 2.4: Algorithm usage for all algorithms that were usedin more than one publication.
Algorithm # of uses
Q-learning [370] 60RL, not further specified 18
Contextual bandits 12Sarsa [332] 8Actor-critic 8
Inverse reinforcement learning 7UCB [19] 5
Policy iteration 5LinUCB [77] 5
Deep reinforcement learning 4Fitted Q-iteration [297] 3
DQN [241] 3Interactive reinforcement learning 2
TD-learning 2DYNA-Q [331] 2Policy gradient 2
CLUB [129] 2Monte carlo 2
Thompson sampling 2DDQN [359] 2
In this architecture, only experiences with relevant individuals can be shared.Comparisons between architectures are rare. We continue by investigatingwhether and where traits of the individual were used in relation to thesearchitectures. Table 2.5 provides an overview. Out of all papers that use onemodel, 52.7% did not use the traits of the individuals and 41.7 % included traitsin the state space. 47.5% of the papers include the traits of the individualsin the state representation while in 37.3% of the papers the traits were notincluded. In 15.3% of the cases this was not known.
Figure 2.9b shows the popularity of using a simulator for training perdomain. We see that a substantial percentage of publications use a simulatorand that simulators are used in all domains. Simulators are used in the majority
62
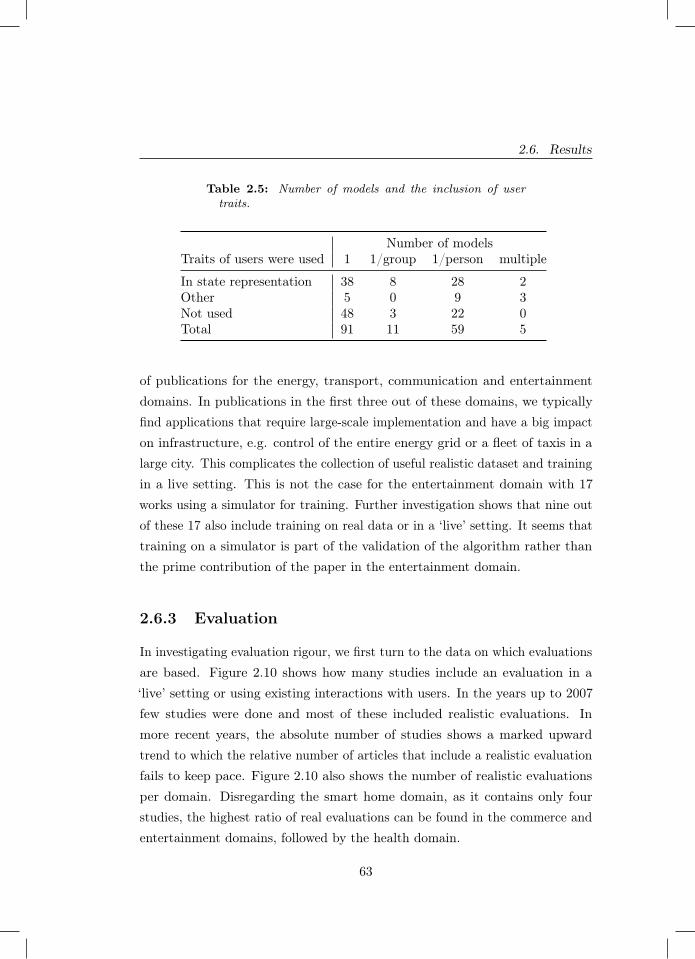
2.6. Results
Table 2.5: Number of models and the inclusion of usertraits.
Number of modelsTraits of users were used 1 1/group 1/person multiple
In state representation 38 8 28 2Other 5 0 9 3Not used 48 3 22 0Total 91 11 59 5
of publications for the energy, transport, communication and entertainmentdomains. In publications in the first three out of these domains, we typicallyfind applications that require large-scale implementation and have a big impacton infrastructure, e.g. control of the entire energy grid or a fleet of taxis in alarge city. This complicates the collection of useful realistic dataset and trainingin a live setting. This is not the case for the entertainment domain with 17works using a simulator for training. Further investigation shows that nine outof these 17 also include training on real data or in a ‘live’ setting. It seems thattraining on a simulator is part of the validation of the algorithm rather thanthe prime contribution of the paper in the entertainment domain.
2.6.3 Evaluation
In investigating evaluation rigour, we first turn to the data on which evaluationsare based. Figure 2.10 shows how many studies include an evaluation in a‘live’ setting or using existing interactions with users. In the years up to 2007few studies were done and most of these included realistic evaluations. Inmore recent years, the absolute number of studies shows a marked upwardtrend to which the relative number of articles that include a realistic evaluationfails to keep pace. Figure 2.10 also shows the number of realistic evaluationsper domain. Disregarding the smart home domain, as it contains only fourstudies, the highest ratio of real evaluations can be found in the commerce andentertainment domains, followed by the health domain.
63
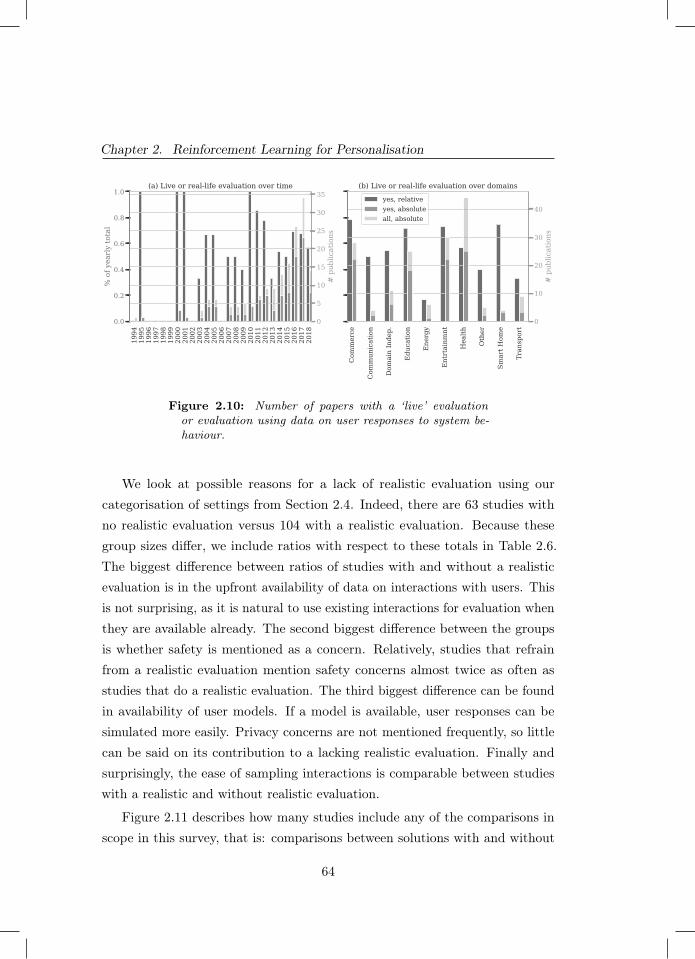
Chapter 2. Reinforcement Learning for Personalisation19
9419
9519
9619
9719
9819
9920
0020
0120
0220
0320
0420
0520
0620
0720
0820
0920
1020
1120
1220
1320
1420
1520
1620
1720
18
0.0
0.2
0.4
0.6
0.8
1.0
% o
f yea
rly
tota
l
(a) Live or real-life evaluation over time
Com
mer
ce
Com
mun
icat
ion
Dom
ain
Inde
p.
Edu
catio
n
Ene
rgy
Ent
rtai
nmnt
Hea
lth
Oth
er
Smar
t Hom
e
Tran
spor
t
(b) Live or real-life evaluation over domains
0
5
10
15
20
25
30
35
# p
ublic
atio
ns0
10
20
30
40
# p
ublic
atio
ns
yes, relativeyes, absoluteall, absolute
Figure 2.10: Number of papers with a ‘live’ evaluationor evaluation using data on user responses to system be-haviour.
We look at possible reasons for a lack of realistic evaluation using ourcategorisation of settings from Section 2.4. Indeed, there are 63 studies withno realistic evaluation versus 104 with a realistic evaluation. Because thesegroup sizes differ, we include ratios with respect to these totals in Table 2.6.The biggest difference between ratios of studies with and without a realisticevaluation is in the upfront availability of data on interactions with users. Thisis not surprising, as it is natural to use existing interactions for evaluation whenthey are available already. The second biggest difference between the groupsis whether safety is mentioned as a concern. Relatively, studies that refrainfrom a realistic evaluation mention safety concerns almost twice as often asstudies that do a realistic evaluation. The third biggest difference can be foundin availability of user models. If a model is available, user responses can besimulated more easily. Privacy concerns are not mentioned frequently, so littlecan be said on its contribution to a lacking realistic evaluation. Finally andsurprisingly, the ease of sampling interactions is comparable between studieswith a realistic and without realistic evaluation.
Figure 2.11 describes how many studies include any of the comparisons inscope in this survey, that is: comparisons between solutions with and without
64
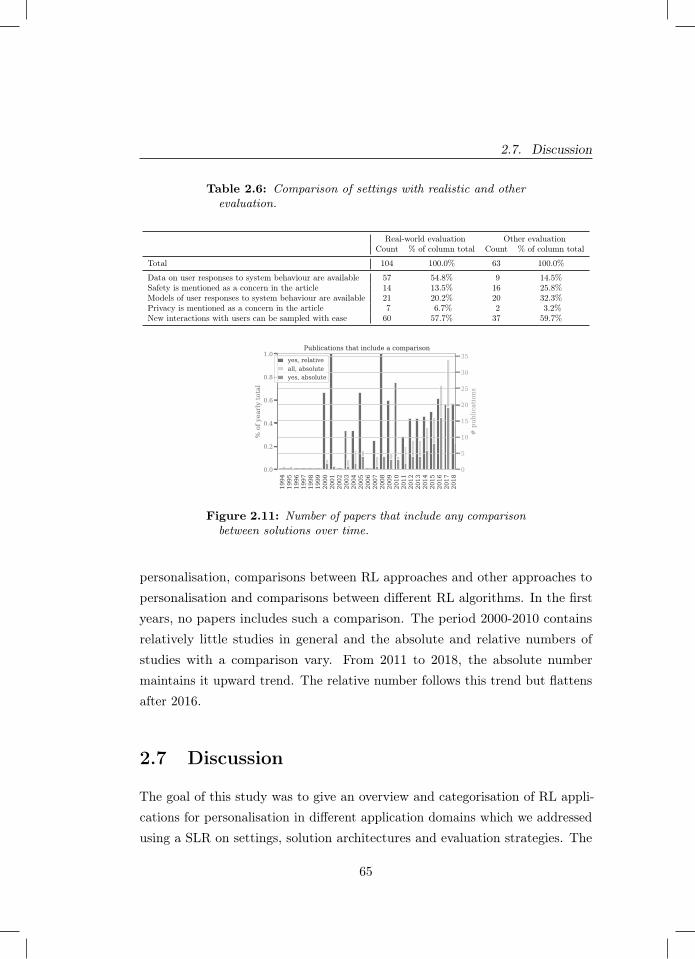
2.7. Discussion
Table 2.6: Comparison of settings with realistic and otherevaluation.
Real-world evaluation Other evaluationCount % of column total Count % of column total
Total 104 100.0% 63 100.0%
Data on user responses to system behaviour are available 57 54.8% 9 14.5%Safety is mentioned as a concern in the article 14 13.5% 16 25.8%Models of user responses to system behaviour are available 21 20.2% 20 32.3%Privacy is mentioned as a concern in the article 7 6.7% 2 3.2%New interactions with users can be sampled with ease 60 57.7% 37 59.7%
1994
1995
1996
1997
1998
1999
2000
2001
2002
2003
2004
2005
2006
2007
2008
2009
2010
2011
2012
2013
2014
2015
2016
2017
2018
0.0
0.2
0.4
0.6
0.8
1.0
% o
f yea
rly
tota
l
Publications that include a comparison
0
5
10
15
20
25
30
35
# p
ublic
atio
ns
yes, relativeall, absoluteyes, absolute
Figure 2.11: Number of papers that include any comparisonbetween solutions over time.
personalisation, comparisons between RL approaches and other approaches topersonalisation and comparisons between different RL algorithms. In the firstyears, no papers includes such a comparison. The period 2000-2010 containsrelatively little studies in general and the absolute and relative numbers ofstudies with a comparison vary. From 2011 to 2018, the absolute numbermaintains it upward trend. The relative number follows this trend but flattensafter 2016.
2.7 Discussion
The goal of this study was to give an overview and categorisation of RL appli-cations for personalisation in different application domains which we addressedusing a SLR on settings, solution architectures and evaluation strategies. The
65
Chapter 2. Reinforcement Learning for Personalisation
main result is the marked increase in studies that use RL for personalisationproblems over time. Additionally, techniques are increasingly evaluated onreal-life data. RL has proven a suitable paradigm for adaptation of systems toindividual preferences using data.
Results further indicate that this development is driven by various techniques,which we list in no particular order. Firstly, techniques have been developed toestimate the performance of deploying a particular RL model prior to deployment.This helps in communicating risks and benefits of RL solutions with stakeholdersand moves RL further into the realm of feasible technologies for high-impactapplication domains [348]. For single-step decision making problems, contextualbandit algorithms with theoretical bounds on decision-theoretic regret havebecome available. For multi-step decision making problems, methods that canestimate the performance of some policy based on data generated by anotherpolicy have been developed [77; 349; 169]. Secondly, advances in the field of deeplearning have wholly or partly removed the need for feature engineering [106].This may be especially challenging for sequential decision-making problems asdifferent features may be of importance in different states encountered overtime. Finally, research on safe exploration in RL has developed means to avoidharmful actions during exploratory phases of learning [124]. How any thesetechniques are best applied depends on setting. The collected data can be usedto find suitable related work for any particular setting [96].
Since the field of RL for personalisation is growing in size, we investigatedwhether methodological maturity is keeping pace. Results show that the growthin the number of studies with a real-life evaluation is not mirrored by growthof the ratio of studies with such an evaluation. Similarly, results show noincrease in the relative number of studies with a comparison of approachesover time. These may be signs that the maturity of the field fails to keeppace with its growth. This is worrisome, since the advantages of RL overother approaches or between RL algorithms cannot be understood properlywithout such comparisons. Such comparisons benefit from standardised tasks.Developing standardised personalisation datasets and simulation environmentsis an excellent opportunity for future research [206; 164].
66
2.7. Discussion
We found that algorithms presented in literature are reused infrequently.Although this phenomenon may be driven by various different underlyingdynamics that cannot be untangled using our data, we propose some possibleexplanations here without particular order. Firstly, it might be the case thatseparate applications require tailored algorithms to the extend that these canonly be used once. This raises the question on the scientific contribution of sucha tailored algorithm and does not fit with the reuse of some well-establishedalgorithms. Another explanation is that top-ranked venues prefer contributionsthat are theoretical or technical in nature, resulting in minor variations towell-known algorithms being presented as novel. Whether this is the case isout of scope for this research and forms an excellent avenue for future work.A final explanation for us to propose, is the myriad axes along which any RLalgorithm can be identified, such as whether and where estimation is involved,which estimation technique is used and how domain knowledge is encoded inthe algorithm. This may yield a large number of unique algorithms, constructedout of a relatively small set of core ideas in RL. An overview of these core ideaswould be useful in understanding how individual algorithms relate to each other.
On top of algorithm reuse, we analysed which RL algorithms were usedmost frequently. Generic and well-established (families of) algorithms suchas Q-learning are the most popular. A notable entry in the top six most-used techniques is inverse reinforcement learning (IRL). Its frequent usage issurprising, as the only viable application area of IRL under a decade ago wasrobotics [181]. Personalisation may be one of the other useful application areasof this branch of RL and many existing personalisation challenges may stillbenefit from an IRL approach. Finally, we investigated how many RL modelswere included in the proposed solutions and found that the majority of studiesresorts to using either one RL model in total or one RL model per user. Inspiredby common practice of clustering in the related fields such as e.g. recommendersystems, we believe that there exists opportunities in pooling data of similarusers and training RL models on the pooled data. We are going to be exploringthis idea further in the next chapter of this thesis, where we answer T.RQ1.
Besides these findings, we contribute a categorisation of personalisation
67
Chapter 2. Reinforcement Learning for Personalisation
settings in RL. This framework can be used to find related work based on thesetting of a problem at hand. In designing such a framework, one has to balancespecificity and usefulness of aspects in the framework. We take the aspectof ‘safety’ as an example: any application of RL will imply safety concernsat some level, but they are more prominent in some application areas. Theframework intentionally includes a single ambiguous aspect to describe a broadrange ‘safety sensitivity levels’ in order for it to suit its purpose of navigatingliterature. A possibility for future work is to extend the framework with other,more formal, aspects of problem setting such as those identified in [304].
68
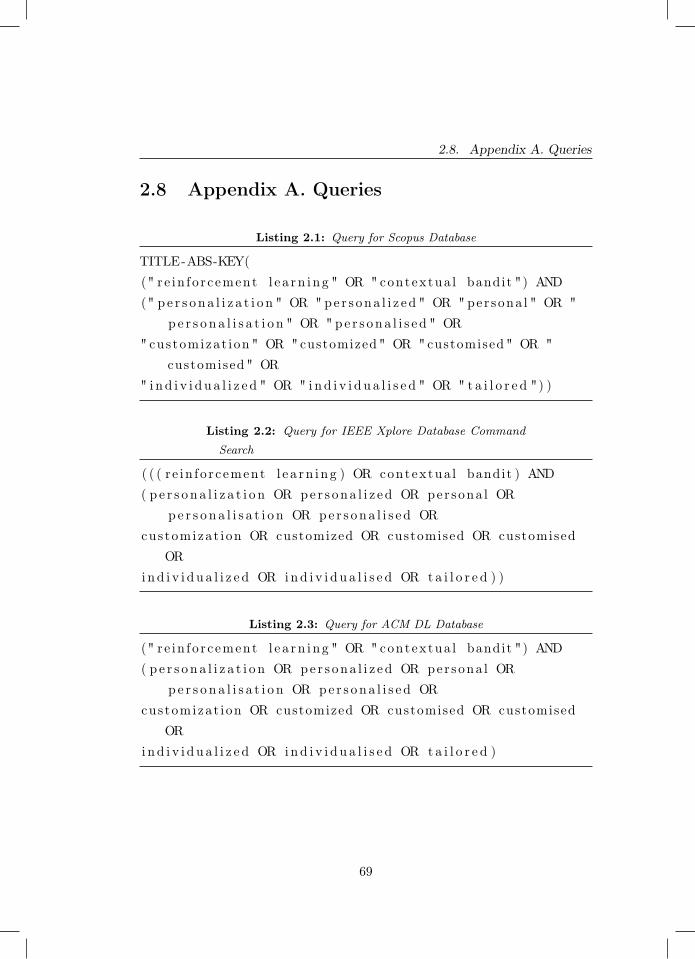
2.8. Appendix A. Queries
2.8 Appendix A. Queries
Listing 2.1: Query for Scopus Database
TITLE-ABS-KEY((" re in fo r c ement l e a rn i ng " OR " contextua l bandit ") AND(" p e r s on a l i z a t i o n " OR " pe r s ona l i z ed " OR " per sona l " OR "
p e r s o n a l i s a t i o n " OR " pe r s ona l i s e d " OR" customizat ion " OR "customized " OR " customised " OR "
customised " OR" i nd i v i d u a l i z e d " OR " i nd i v i d u a l i s e d " OR " t a i l o r e d ") )
Listing 2.2: Query for IEEE Xplore Database Command
Search
( ( ( r e in fo r cement l e a rn i ng ) OR contextua l bandit ) AND( p e r s on a l i z a t i o n OR pe r s ona l i z ed OR per sona l OR
pe r s o n a l i s a t i o n OR pe r s ona l i s e d ORcustomizat ion OR customized OR customised OR customised
ORind i v i d u a l i z e d OR i nd i v i d u a l i s e d OR t a i l o r e d ) )
Listing 2.3: Query for ACM DL Database
(" r e in fo r c ement l e a rn i ng " OR " contextua l bandit ") AND( p e r s on a l i z a t i o n OR pe r s ona l i z ed OR per sona l OR
pe r s o n a l i s a t i o n OR pe r s ona l i s e d ORcustomizat ion OR customized OR customised OR customised
ORind i v i d u a l i z e d OR i nd i v i d u a l i s e d OR t a i l o r e d )
69
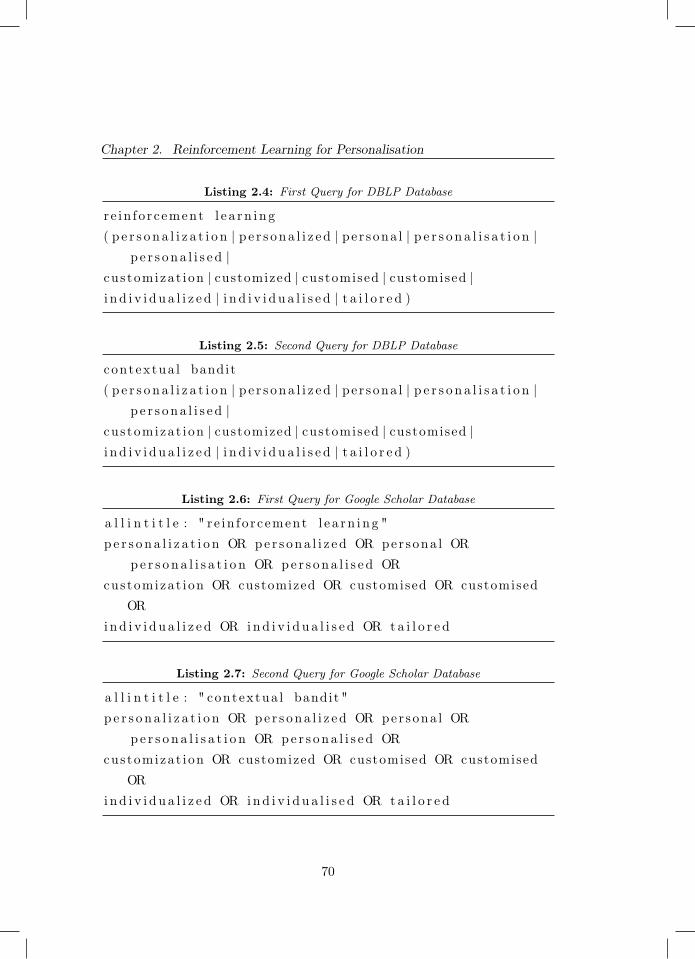
Chapter 2. Reinforcement Learning for Personalisation
Listing 2.4: First Query for DBLP Database
r e in fo r cement l e a rn i ng( p e r s o n a l i z a t i o n | p e r s ona l i z ed | pe r sona l | p e r s o n a l i s a t i o n |
p e r s ona l i s e d |cus tomizat ion | customized | customised | customised |i n d i v i d u a l i z e d | i n d i v i d u a l i s e d | t a i l o r e d )
Listing 2.5: Second Query for DBLP Database
contextua l bandit( p e r s o n a l i z a t i o n | p e r s ona l i z ed | pe r sona l | p e r s o n a l i s a t i o n |
p e r s ona l i s e d |cus tomizat ion | customized | customised | customised |i n d i v i d u a l i z e d | i n d i v i d u a l i s e d | t a i l o r e d )
Listing 2.6: First Query for Google Scholar Database
a l l i n t i t l e : " r e in fo r cement l e a rn i n g "p e r s on a l i z a t i o n OR pe r s ona l i z ed OR per sona l OR
pe r s o n a l i s a t i o n OR pe r s ona l i s e d ORcustomizat ion OR customized OR customised OR customised
ORind i v i d u a l i z e d OR i nd i v i d u a l i s e d OR t a i l o r e d
Listing 2.7: Second Query for Google Scholar Database
a l l i n t i t l e : " contextua l bandit "p e r s o n a l i z a t i o n OR pe r s ona l i z ed OR per sona l OR
pe r s o n a l i s a t i o n OR pe r s ona l i s e d ORcustomizat ion OR customized OR customised OR customised
ORind i v i d u a l i z e d OR i nd i v i d u a l i s e d OR t a i l o r e d
70
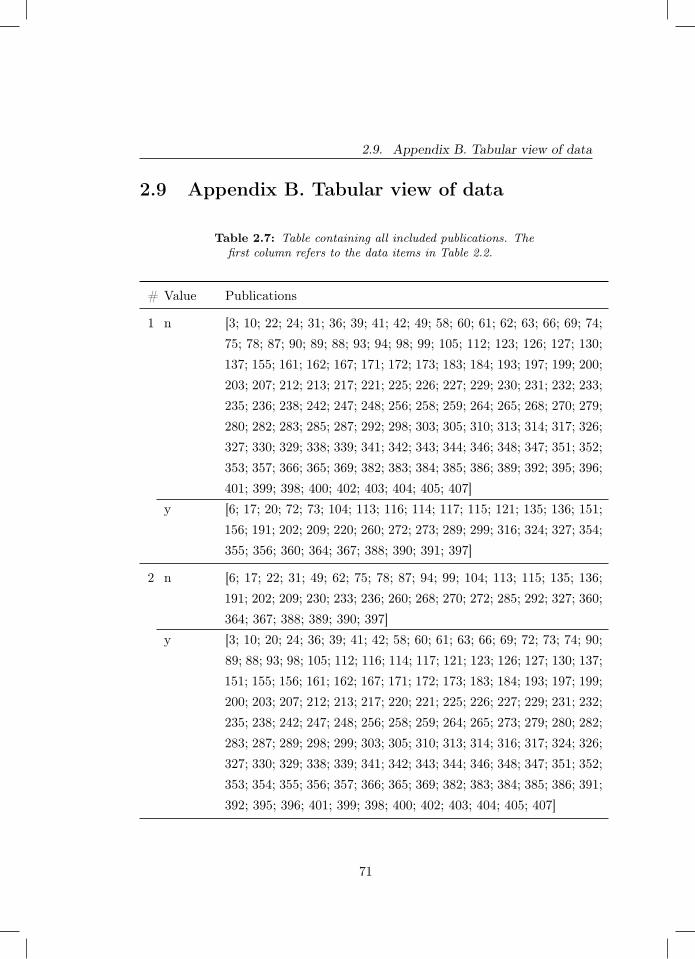
2.9. Appendix B. Tabular view of data
2.9 Appendix B. Tabular view of data
Table 2.7: Table containing all included publications. Thefirst column refers to the data items in Table 2.2.
# Value Publications
1 n [3; 10; 22; 24; 31; 36; 39; 41; 42; 49; 58; 60; 61; 62; 63; 66; 69; 74;75; 78; 87; 90; 89; 88; 93; 94; 98; 99; 105; 112; 123; 126; 127; 130;137; 155; 161; 162; 167; 171; 172; 173; 183; 184; 193; 197; 199; 200;203; 207; 212; 213; 217; 221; 225; 226; 227; 229; 230; 231; 232; 233;235; 236; 238; 242; 247; 248; 256; 258; 259; 264; 265; 268; 270; 279;280; 282; 283; 285; 287; 292; 298; 303; 305; 310; 313; 314; 317; 326;327; 330; 329; 338; 339; 341; 342; 343; 344; 346; 348; 347; 351; 352;353; 357; 366; 365; 369; 382; 383; 384; 385; 386; 389; 392; 395; 396;401; 399; 398; 400; 402; 403; 404; 405; 407]
y [6; 17; 20; 72; 73; 104; 113; 116; 114; 117; 115; 121; 135; 136; 151;156; 191; 202; 209; 220; 260; 272; 273; 289; 299; 316; 324; 327; 354;355; 356; 360; 364; 367; 388; 390; 391; 397]
2 n [6; 17; 22; 31; 49; 62; 75; 78; 87; 94; 99; 104; 113; 115; 135; 136;191; 202; 209; 230; 233; 236; 260; 268; 270; 272; 285; 292; 327; 360;364; 367; 388; 389; 390; 397]
y [3; 10; 20; 24; 36; 39; 41; 42; 58; 60; 61; 63; 66; 69; 72; 73; 74; 90;89; 88; 93; 98; 105; 112; 116; 114; 117; 121; 123; 126; 127; 130; 137;151; 155; 156; 161; 162; 167; 171; 172; 173; 183; 184; 193; 197; 199;200; 203; 207; 212; 213; 217; 220; 221; 225; 226; 227; 229; 231; 232;235; 238; 242; 247; 248; 256; 258; 259; 264; 265; 273; 279; 280; 282;283; 287; 289; 298; 299; 303; 305; 310; 313; 314; 316; 317; 324; 326;327; 330; 329; 338; 339; 341; 342; 343; 344; 346; 348; 347; 351; 352;353; 354; 355; 356; 357; 366; 365; 369; 382; 383; 384; 385; 386; 391;392; 395; 396; 401; 399; 398; 400; 402; 403; 404; 405; 407]
71
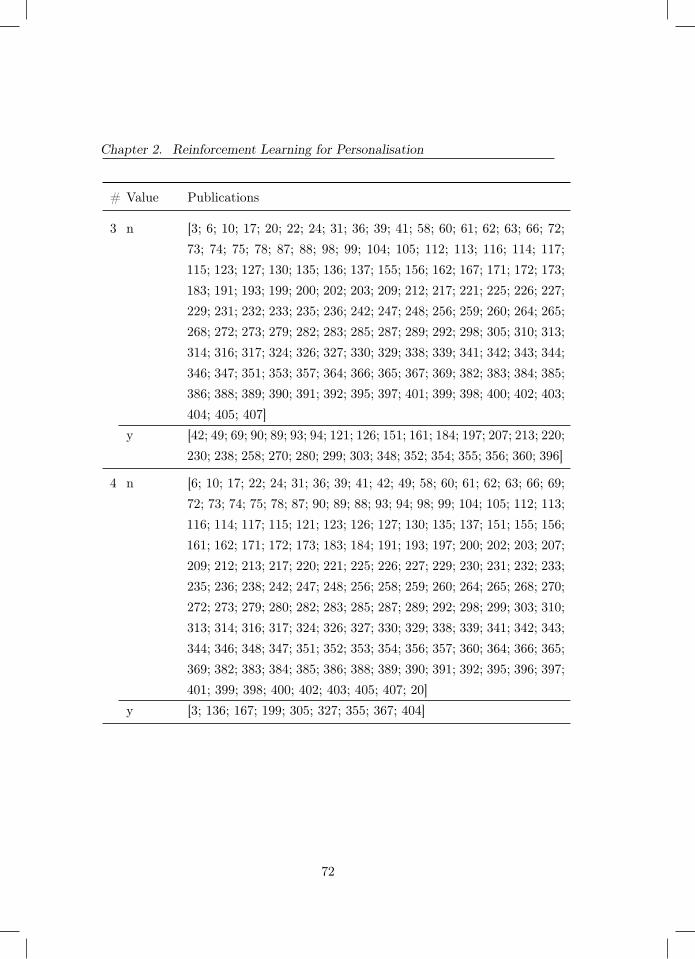
Chapter 2. Reinforcement Learning for Personalisation
# Value Publications
3 n [3; 6; 10; 17; 20; 22; 24; 31; 36; 39; 41; 58; 60; 61; 62; 63; 66; 72;73; 74; 75; 78; 87; 88; 98; 99; 104; 105; 112; 113; 116; 114; 117;115; 123; 127; 130; 135; 136; 137; 155; 156; 162; 167; 171; 172; 173;183; 191; 193; 199; 200; 202; 203; 209; 212; 217; 221; 225; 226; 227;229; 231; 232; 233; 235; 236; 242; 247; 248; 256; 259; 260; 264; 265;268; 272; 273; 279; 282; 283; 285; 287; 289; 292; 298; 305; 310; 313;314; 316; 317; 324; 326; 327; 330; 329; 338; 339; 341; 342; 343; 344;346; 347; 351; 353; 357; 364; 366; 365; 367; 369; 382; 383; 384; 385;386; 388; 389; 390; 391; 392; 395; 397; 401; 399; 398; 400; 402; 403;404; 405; 407]
y [42; 49; 69; 90; 89; 93; 94; 121; 126; 151; 161; 184; 197; 207; 213; 220;230; 238; 258; 270; 280; 299; 303; 348; 352; 354; 355; 356; 360; 396]
4 n [6; 10; 17; 22; 24; 31; 36; 39; 41; 42; 49; 58; 60; 61; 62; 63; 66; 69;72; 73; 74; 75; 78; 87; 90; 89; 88; 93; 94; 98; 99; 104; 105; 112; 113;116; 114; 117; 115; 121; 123; 126; 127; 130; 135; 137; 151; 155; 156;161; 162; 171; 172; 173; 183; 184; 191; 193; 197; 200; 202; 203; 207;209; 212; 213; 217; 220; 221; 225; 226; 227; 229; 230; 231; 232; 233;235; 236; 238; 242; 247; 248; 256; 258; 259; 260; 264; 265; 268; 270;272; 273; 279; 280; 282; 283; 285; 287; 289; 292; 298; 299; 303; 310;313; 314; 316; 317; 324; 326; 327; 330; 329; 338; 339; 341; 342; 343;344; 346; 348; 347; 351; 352; 353; 354; 356; 357; 360; 364; 366; 365;369; 382; 383; 384; 385; 386; 388; 389; 390; 391; 392; 395; 396; 397;401; 399; 398; 400; 402; 403; 405; 407; 20]
y [3; 136; 167; 199; 305; 327; 355; 367; 404]
72
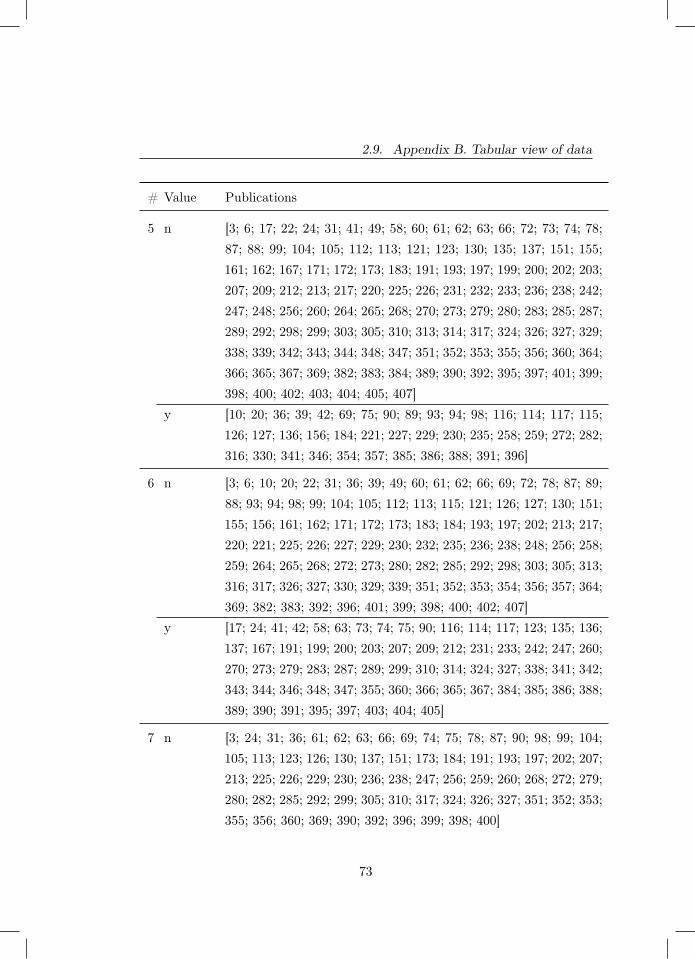
2.9. Appendix B. Tabular view of data
# Value Publications
5 n [3; 6; 17; 22; 24; 31; 41; 49; 58; 60; 61; 62; 63; 66; 72; 73; 74; 78;87; 88; 99; 104; 105; 112; 113; 121; 123; 130; 135; 137; 151; 155;161; 162; 167; 171; 172; 173; 183; 191; 193; 197; 199; 200; 202; 203;207; 209; 212; 213; 217; 220; 225; 226; 231; 232; 233; 236; 238; 242;247; 248; 256; 260; 264; 265; 268; 270; 273; 279; 280; 283; 285; 287;289; 292; 298; 299; 303; 305; 310; 313; 314; 317; 324; 326; 327; 329;338; 339; 342; 343; 344; 348; 347; 351; 352; 353; 355; 356; 360; 364;366; 365; 367; 369; 382; 383; 384; 389; 390; 392; 395; 397; 401; 399;398; 400; 402; 403; 404; 405; 407]
y [10; 20; 36; 39; 42; 69; 75; 90; 89; 93; 94; 98; 116; 114; 117; 115;126; 127; 136; 156; 184; 221; 227; 229; 230; 235; 258; 259; 272; 282;316; 330; 341; 346; 354; 357; 385; 386; 388; 391; 396]
6 n [3; 6; 10; 20; 22; 31; 36; 39; 49; 60; 61; 62; 66; 69; 72; 78; 87; 89;88; 93; 94; 98; 99; 104; 105; 112; 113; 115; 121; 126; 127; 130; 151;155; 156; 161; 162; 171; 172; 173; 183; 184; 193; 197; 202; 213; 217;220; 221; 225; 226; 227; 229; 230; 232; 235; 236; 238; 248; 256; 258;259; 264; 265; 268; 272; 273; 280; 282; 285; 292; 298; 303; 305; 313;316; 317; 326; 327; 330; 329; 339; 351; 352; 353; 354; 356; 357; 364;369; 382; 383; 392; 396; 401; 399; 398; 400; 402; 407]
y [17; 24; 41; 42; 58; 63; 73; 74; 75; 90; 116; 114; 117; 123; 135; 136;137; 167; 191; 199; 200; 203; 207; 209; 212; 231; 233; 242; 247; 260;270; 273; 279; 283; 287; 289; 299; 310; 314; 324; 327; 338; 341; 342;343; 344; 346; 348; 347; 355; 360; 366; 365; 367; 384; 385; 386; 388;389; 390; 391; 395; 397; 403; 404; 405]
7 n [3; 24; 31; 36; 61; 62; 63; 66; 69; 74; 75; 78; 87; 90; 98; 99; 104;105; 113; 123; 126; 130; 137; 151; 173; 184; 191; 193; 197; 202; 207;213; 225; 226; 229; 230; 236; 238; 247; 256; 259; 260; 268; 272; 279;280; 282; 285; 292; 299; 305; 310; 317; 324; 326; 327; 351; 352; 353;355; 356; 360; 369; 390; 392; 396; 399; 398; 400]
73
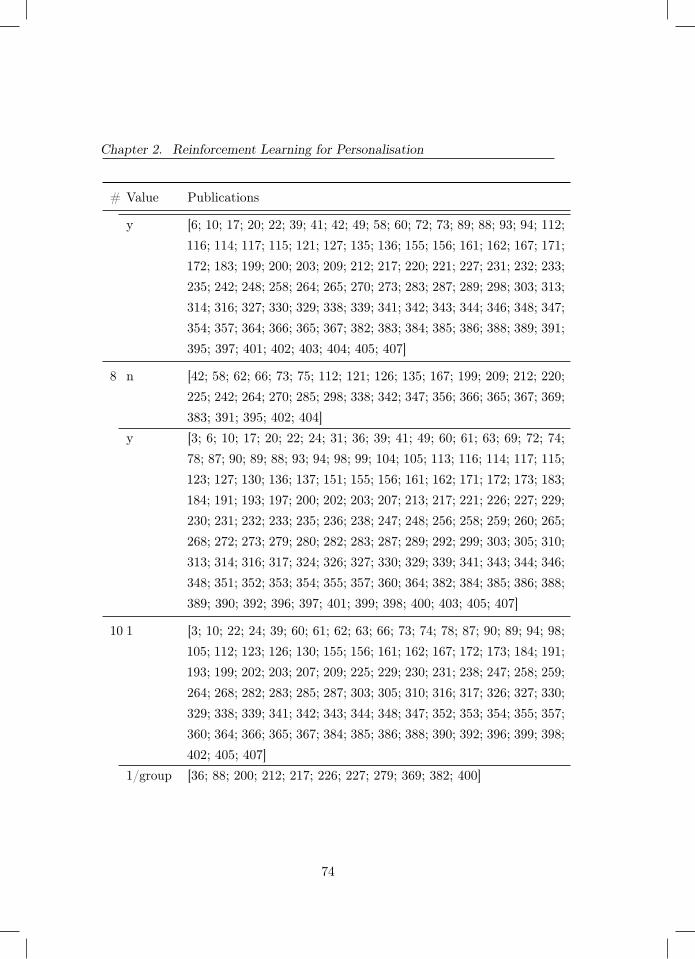
Chapter 2. Reinforcement Learning for Personalisation
# Value Publications
y [6; 10; 17; 20; 22; 39; 41; 42; 49; 58; 60; 72; 73; 89; 88; 93; 94; 112;116; 114; 117; 115; 121; 127; 135; 136; 155; 156; 161; 162; 167; 171;172; 183; 199; 200; 203; 209; 212; 217; 220; 221; 227; 231; 232; 233;235; 242; 248; 258; 264; 265; 270; 273; 283; 287; 289; 298; 303; 313;314; 316; 327; 330; 329; 338; 339; 341; 342; 343; 344; 346; 348; 347;354; 357; 364; 366; 365; 367; 382; 383; 384; 385; 386; 388; 389; 391;395; 397; 401; 402; 403; 404; 405; 407]
8 n [42; 58; 62; 66; 73; 75; 112; 121; 126; 135; 167; 199; 209; 212; 220;225; 242; 264; 270; 285; 298; 338; 342; 347; 356; 366; 365; 367; 369;383; 391; 395; 402; 404]
y [3; 6; 10; 17; 20; 22; 24; 31; 36; 39; 41; 49; 60; 61; 63; 69; 72; 74;78; 87; 90; 89; 88; 93; 94; 98; 99; 104; 105; 113; 116; 114; 117; 115;123; 127; 130; 136; 137; 151; 155; 156; 161; 162; 171; 172; 173; 183;184; 191; 193; 197; 200; 202; 203; 207; 213; 217; 221; 226; 227; 229;230; 231; 232; 233; 235; 236; 238; 247; 248; 256; 258; 259; 260; 265;268; 272; 273; 279; 280; 282; 283; 287; 289; 292; 299; 303; 305; 310;313; 314; 316; 317; 324; 326; 327; 330; 329; 339; 341; 343; 344; 346;348; 351; 352; 353; 354; 355; 357; 360; 364; 382; 384; 385; 386; 388;389; 390; 392; 396; 397; 401; 399; 398; 400; 403; 405; 407]
10 1 [3; 10; 22; 24; 39; 60; 61; 62; 63; 66; 73; 74; 78; 87; 90; 89; 94; 98;105; 112; 123; 126; 130; 155; 156; 161; 162; 167; 172; 173; 184; 191;193; 199; 202; 203; 207; 209; 225; 229; 230; 231; 238; 247; 258; 259;264; 268; 282; 283; 285; 287; 303; 305; 310; 316; 317; 326; 327; 330;329; 338; 339; 341; 342; 343; 344; 348; 347; 352; 353; 354; 355; 357;360; 364; 366; 365; 367; 384; 385; 386; 388; 390; 392; 396; 399; 398;402; 405; 407]
1/group [36; 88; 200; 212; 217; 226; 227; 279; 369; 382; 400]
74

2.9. Appendix B. Tabular view of data
# Value Publications
1/person [17; 20; 31; 41; 42; 49; 58; 69; 72; 75; 93; 104; 113; 116; 114; 117;115; 121; 127; 135; 136; 137; 151; 171; 183; 197; 213; 220; 221; 232;233; 235; 236; 248; 256; 260; 265; 270; 272; 273; 280; 289; 292; 298;299; 313; 314; 324; 346; 351; 356; 383; 389; 391; 395; 397; 401; 403]
multiple [6; 99; 242; 327; 404]
11 notused
[17; 20; 22; 31; 36; 39; 49; 60; 62; 66; 72; 73; 74; 78; 87; 90; 88; 93;94; 105; 113; 115; 123; 127; 130; 135; 155; 156; 161; 167; 172; 173;183; 191; 193; 202; 209; 212; 220; 225; 231; 232; 238; 247; 248; 264;265; 268; 273; 285; 299; 303; 310; 317; 326; 327; 330; 338; 339; 346;348; 351; 357; 360; 364; 367; 383; 384; 388; 390; 401; 403; 405]
other [6; 41; 58; 136; 137; 235; 236; 242; 272; 280; 283; 289; 342; 344;392; 396; 404]
staterepre-senta-tion
[3; 10; 24; 42; 61; 63; 69; 75; 89; 98; 99; 104; 112; 116; 114; 117;121; 126; 151; 162; 171; 184; 197; 199; 200; 203; 207; 213; 217; 221;226; 227; 229; 230; 233; 256; 258; 259; 260; 270; 273; 279; 282; 287;292; 298; 305; 313; 314; 316; 324; 327; 329; 341; 343; 347; 352; 353;354; 355; 356; 366; 365; 369; 382; 385; 386; 389; 391; 395; 397; 399;398; 400; 402; 407]
12 batch [3; 73; 74; 87; 99; 104; 112; 116; 114; 117; 115; 136; 167; 184; 191;200; 213; 225; 226; 227; 229; 230; 233; 258; 259; 272; 282; 283; 292;324; 327; 330; 329; 338; 339; 343; 344; 346; 348; 347; 352; 366; 365;384; 391; 392; 399; 398; 400; 402; 404; 407]
n [383]online [17; 20; 39; 41; 42; 49; 58; 60; 63; 69; 72; 75; 89; 94; 98; 113; 121;
126; 127; 130; 135; 151; 162; 171; 172; 173; 183; 197; 199; 202; 203;207; 209; 212; 220; 221; 232; 235; 236; 238; 247; 248; 260; 264; 265;270; 273; 289; 298; 299; 303; 305; 310; 313; 314; 316; 326; 341; 342;354; 356; 357; 360; 367; 385; 386; 388; 389; 390; 397; 401; 403; 405]
other [93; 137; 155; 242; 256; 279; 369; 395]
75
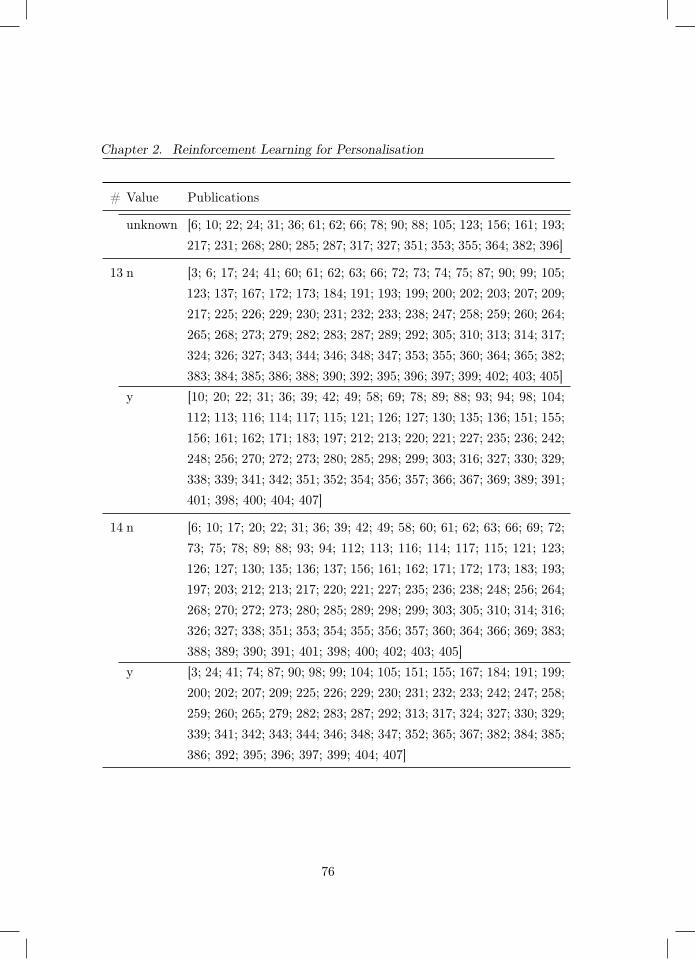
Chapter 2. Reinforcement Learning for Personalisation
# Value Publications
unknown [6; 10; 22; 24; 31; 36; 61; 62; 66; 78; 90; 88; 105; 123; 156; 161; 193;217; 231; 268; 280; 285; 287; 317; 327; 351; 353; 355; 364; 382; 396]
13 n [3; 6; 17; 24; 41; 60; 61; 62; 63; 66; 72; 73; 74; 75; 87; 90; 99; 105;123; 137; 167; 172; 173; 184; 191; 193; 199; 200; 202; 203; 207; 209;217; 225; 226; 229; 230; 231; 232; 233; 238; 247; 258; 259; 260; 264;265; 268; 273; 279; 282; 283; 287; 289; 292; 305; 310; 313; 314; 317;324; 326; 327; 343; 344; 346; 348; 347; 353; 355; 360; 364; 365; 382;383; 384; 385; 386; 388; 390; 392; 395; 396; 397; 399; 402; 403; 405]
y [10; 20; 22; 31; 36; 39; 42; 49; 58; 69; 78; 89; 88; 93; 94; 98; 104;112; 113; 116; 114; 117; 115; 121; 126; 127; 130; 135; 136; 151; 155;156; 161; 162; 171; 183; 197; 212; 213; 220; 221; 227; 235; 236; 242;248; 256; 270; 272; 273; 280; 285; 298; 299; 303; 316; 327; 330; 329;338; 339; 341; 342; 351; 352; 354; 356; 357; 366; 367; 369; 389; 391;401; 398; 400; 404; 407]
14 n [6; 10; 17; 20; 22; 31; 36; 39; 42; 49; 58; 60; 61; 62; 63; 66; 69; 72;73; 75; 78; 89; 88; 93; 94; 112; 113; 116; 114; 117; 115; 121; 123;126; 127; 130; 135; 136; 137; 156; 161; 162; 171; 172; 173; 183; 193;197; 203; 212; 213; 217; 220; 221; 227; 235; 236; 238; 248; 256; 264;268; 270; 272; 273; 280; 285; 289; 298; 299; 303; 305; 310; 314; 316;326; 327; 338; 351; 353; 354; 355; 356; 357; 360; 364; 366; 369; 383;388; 389; 390; 391; 401; 398; 400; 402; 403; 405]
y [3; 24; 41; 74; 87; 90; 98; 99; 104; 105; 151; 155; 167; 184; 191; 199;200; 202; 207; 209; 225; 226; 229; 230; 231; 232; 233; 242; 247; 258;259; 260; 265; 279; 282; 283; 287; 292; 313; 317; 324; 327; 330; 329;339; 341; 342; 343; 344; 346; 348; 347; 352; 365; 367; 382; 384; 385;386; 392; 395; 396; 397; 399; 404; 407]
76

2.9. Appendix B. Tabular view of data
# Value Publications
15 n [3; 6; 20; 22; 24; 31; 36; 39; 41; 49; 58; 61; 62; 66; 69; 73; 74; 78;87; 90; 89; 88; 93; 94; 98; 99; 104; 105; 112; 113; 115; 121; 126;127; 130; 136; 151; 156; 161; 167; 171; 183; 184; 191; 199; 200; 202;207; 209; 212; 213; 217; 221; 225; 226; 227; 229; 230; 231; 232; 233;235; 236; 242; 247; 248; 256; 258; 259; 260; 265; 268; 270; 272; 273;279; 280; 282; 283; 285; 292; 298; 299; 303; 313; 316; 317; 324; 327;330; 329; 338; 339; 341; 342; 344; 348; 347; 351; 352; 353; 354; 355;356; 357; 364; 366; 365; 369; 382; 383; 384; 385; 386; 391; 392; 396;397; 399; 398; 400; 402; 404; 407]
y [10; 17; 42; 60; 63; 72; 75; 116; 114; 117; 123; 135; 137; 155; 162;172; 173; 193; 197; 203; 220; 238; 264; 273; 287; 289; 305; 310; 314;326; 327; 343; 346; 360; 367; 388; 389; 390; 395; 401; 403; 405]
16 n [3; 6; 17; 24; 41; 60; 61; 62; 63; 66; 72; 73; 74; 75; 87; 99; 105; 123;137; 151; 162; 167; 172; 173; 184; 191; 193; 199; 200; 203; 207; 209;217; 225; 226; 229; 230; 231; 232; 233; 238; 247; 258; 259; 260; 264;265; 268; 273; 279; 282; 283; 287; 289; 292; 305; 310; 313; 314; 317;324; 326; 327; 343; 344; 346; 348; 347; 353; 355; 356; 360; 364; 365;382; 383; 384; 385; 386; 388; 390; 395; 396; 397; 399; 402; 403; 405]
y [10; 20; 22; 31; 36; 39; 42; 49; 58; 69; 78; 90; 89; 88; 93; 94; 98;104; 112; 113; 116; 114; 117; 115; 121; 126; 127; 130; 135; 136; 155;156; 161; 171; 183; 197; 202; 212; 213; 220; 221; 227; 235; 236; 242;248; 256; 270; 272; 273; 280; 285; 298; 299; 303; 316; 327; 330; 329;338; 339; 341; 342; 351; 352; 354; 357; 366; 367; 369; 389; 391; 392;401; 398; 400; 404; 407]
77
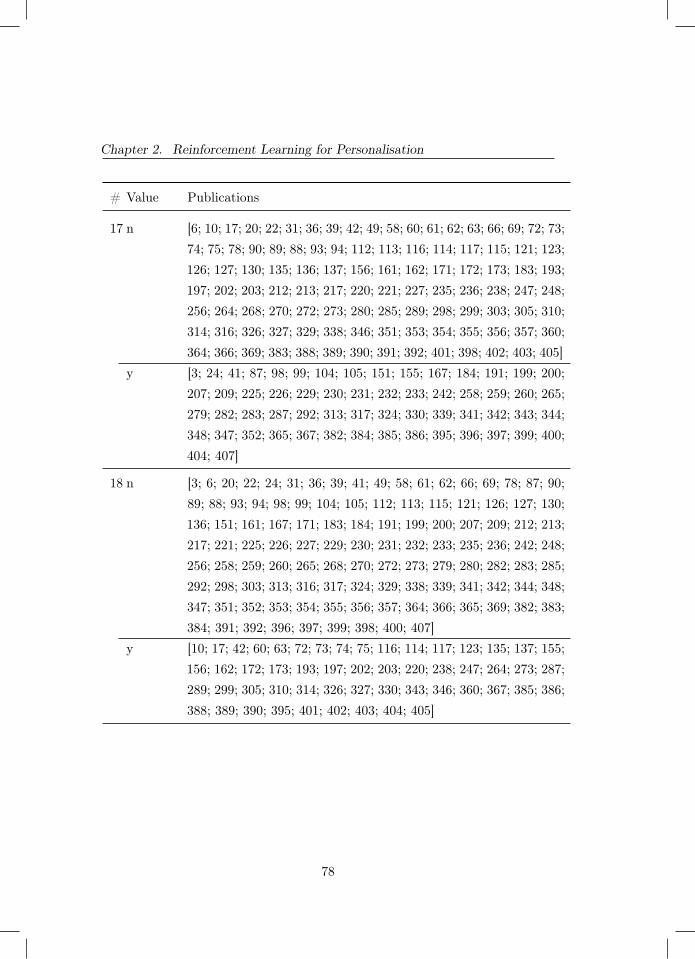
Chapter 2. Reinforcement Learning for Personalisation
# Value Publications
17 n [6; 10; 17; 20; 22; 31; 36; 39; 42; 49; 58; 60; 61; 62; 63; 66; 69; 72; 73;74; 75; 78; 90; 89; 88; 93; 94; 112; 113; 116; 114; 117; 115; 121; 123;126; 127; 130; 135; 136; 137; 156; 161; 162; 171; 172; 173; 183; 193;197; 202; 203; 212; 213; 217; 220; 221; 227; 235; 236; 238; 247; 248;256; 264; 268; 270; 272; 273; 280; 285; 289; 298; 299; 303; 305; 310;314; 316; 326; 327; 329; 338; 346; 351; 353; 354; 355; 356; 357; 360;364; 366; 369; 383; 388; 389; 390; 391; 392; 401; 398; 402; 403; 405]
y [3; 24; 41; 87; 98; 99; 104; 105; 151; 155; 167; 184; 191; 199; 200;207; 209; 225; 226; 229; 230; 231; 232; 233; 242; 258; 259; 260; 265;279; 282; 283; 287; 292; 313; 317; 324; 330; 339; 341; 342; 343; 344;348; 347; 352; 365; 367; 382; 384; 385; 386; 395; 396; 397; 399; 400;404; 407]
18 n [3; 6; 20; 22; 24; 31; 36; 39; 41; 49; 58; 61; 62; 66; 69; 78; 87; 90;89; 88; 93; 94; 98; 99; 104; 105; 112; 113; 115; 121; 126; 127; 130;136; 151; 161; 167; 171; 183; 184; 191; 199; 200; 207; 209; 212; 213;217; 221; 225; 226; 227; 229; 230; 231; 232; 233; 235; 236; 242; 248;256; 258; 259; 260; 265; 268; 270; 272; 273; 279; 280; 282; 283; 285;292; 298; 303; 313; 316; 317; 324; 329; 338; 339; 341; 342; 344; 348;347; 351; 352; 353; 354; 355; 356; 357; 364; 366; 365; 369; 382; 383;384; 391; 392; 396; 397; 399; 398; 400; 407]
y [10; 17; 42; 60; 63; 72; 73; 74; 75; 116; 114; 117; 123; 135; 137; 155;156; 162; 172; 173; 193; 197; 202; 203; 220; 238; 247; 264; 273; 287;289; 299; 305; 310; 314; 326; 327; 330; 343; 346; 360; 367; 385; 386;388; 389; 390; 395; 401; 402; 403; 404; 405]
78
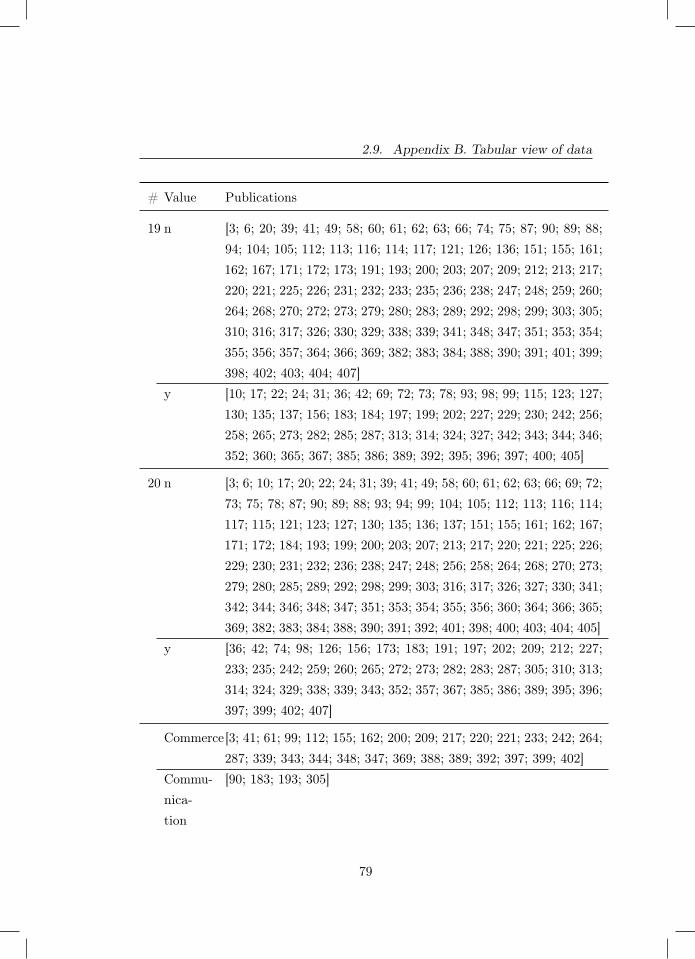
2.9. Appendix B. Tabular view of data
# Value Publications
19 n [3; 6; 20; 39; 41; 49; 58; 60; 61; 62; 63; 66; 74; 75; 87; 90; 89; 88;94; 104; 105; 112; 113; 116; 114; 117; 121; 126; 136; 151; 155; 161;162; 167; 171; 172; 173; 191; 193; 200; 203; 207; 209; 212; 213; 217;220; 221; 225; 226; 231; 232; 233; 235; 236; 238; 247; 248; 259; 260;264; 268; 270; 272; 273; 279; 280; 283; 289; 292; 298; 299; 303; 305;310; 316; 317; 326; 330; 329; 338; 339; 341; 348; 347; 351; 353; 354;355; 356; 357; 364; 366; 369; 382; 383; 384; 388; 390; 391; 401; 399;398; 402; 403; 404; 407]
y [10; 17; 22; 24; 31; 36; 42; 69; 72; 73; 78; 93; 98; 99; 115; 123; 127;130; 135; 137; 156; 183; 184; 197; 199; 202; 227; 229; 230; 242; 256;258; 265; 273; 282; 285; 287; 313; 314; 324; 327; 342; 343; 344; 346;352; 360; 365; 367; 385; 386; 389; 392; 395; 396; 397; 400; 405]
20 n [3; 6; 10; 17; 20; 22; 24; 31; 39; 41; 49; 58; 60; 61; 62; 63; 66; 69; 72;73; 75; 78; 87; 90; 89; 88; 93; 94; 99; 104; 105; 112; 113; 116; 114;117; 115; 121; 123; 127; 130; 135; 136; 137; 151; 155; 161; 162; 167;171; 172; 184; 193; 199; 200; 203; 207; 213; 217; 220; 221; 225; 226;229; 230; 231; 232; 236; 238; 247; 248; 256; 258; 264; 268; 270; 273;279; 280; 285; 289; 292; 298; 299; 303; 316; 317; 326; 327; 330; 341;342; 344; 346; 348; 347; 351; 353; 354; 355; 356; 360; 364; 366; 365;369; 382; 383; 384; 388; 390; 391; 392; 401; 398; 400; 403; 404; 405]
y [36; 42; 74; 98; 126; 156; 173; 183; 191; 197; 202; 209; 212; 227;233; 235; 242; 259; 260; 265; 272; 273; 282; 283; 287; 305; 310; 313;314; 324; 329; 338; 339; 343; 352; 357; 367; 385; 386; 389; 395; 396;397; 399; 402; 407]
Commerce[3; 41; 61; 99; 112; 155; 162; 200; 209; 217; 220; 221; 233; 242; 264;287; 339; 343; 344; 348; 347; 369; 388; 389; 392; 397; 399; 402]
Commu-nica-tion
[90; 183; 193; 305]
79
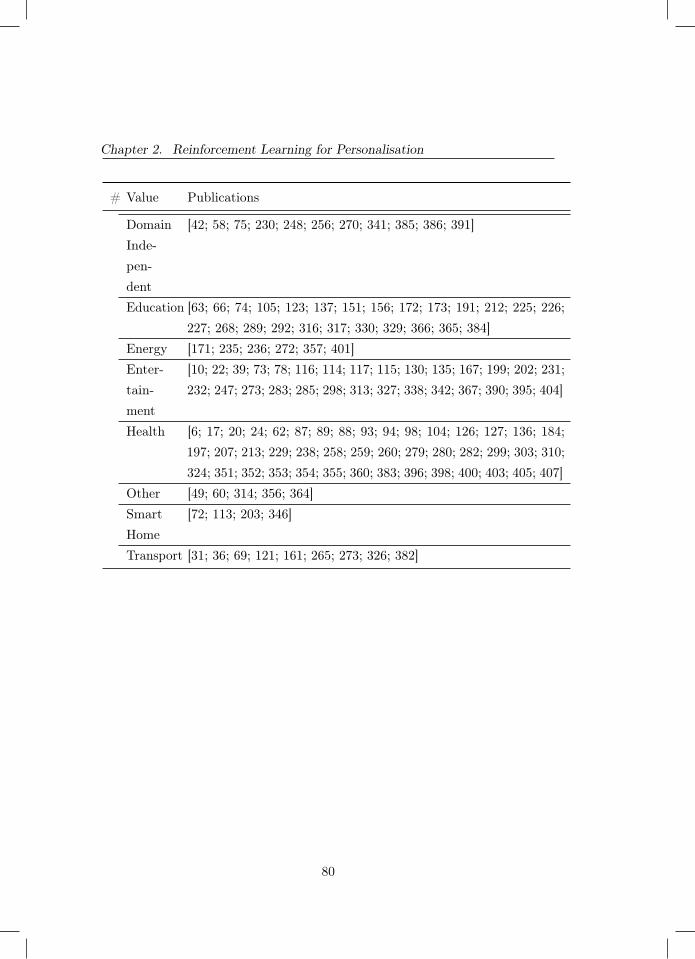
Chapter 2. Reinforcement Learning for Personalisation
# Value Publications
DomainInde-pen-dent
[42; 58; 75; 230; 248; 256; 270; 341; 385; 386; 391]
Education [63; 66; 74; 105; 123; 137; 151; 156; 172; 173; 191; 212; 225; 226;227; 268; 289; 292; 316; 317; 330; 329; 366; 365; 384]
Energy [171; 235; 236; 272; 357; 401]Enter-tain-ment
[10; 22; 39; 73; 78; 116; 114; 117; 115; 130; 135; 167; 199; 202; 231;232; 247; 273; 283; 285; 298; 313; 327; 338; 342; 367; 390; 395; 404]
Health [6; 17; 20; 24; 62; 87; 89; 88; 93; 94; 98; 104; 126; 127; 136; 184;197; 207; 213; 229; 238; 258; 259; 260; 279; 280; 282; 299; 303; 310;324; 351; 352; 353; 354; 355; 360; 383; 396; 398; 400; 403; 405; 407]
Other [49; 60; 314; 356; 364]SmartHome
[72; 113; 203; 346]
Transport [31; 36; 69; 121; 161; 265; 273; 326; 382]
80
3Cluster-based Reinforcement Learning
Chapter 3 was published as:
Grua, E. M., & Hoogendoorn, M. (2018, November). Exploring clustering techniques foreffective reinforcement learning based personalization for health and wellbeing. In 2018IEEE Symposium Series on Computational Intelligence (SSCI) (pp. 813-820). IEEE.
81
Chapter 3. Cluster-based Reinforcement Learning
Abstract - In this chapter we answer T.RQ1, namely: How can RL-based personalisation for e-Health be improved? For the domain of health andwellbeing personalisation can contribute to better interventions and improvedhealth states of users. In order for personalisation to be effective in thisdomain, it needs to be performed quickly and with minimal impact on the users.Reinforcement learning is one of the techniques that can be used to establishsuch personalisation, but it is not known to be very fast at learning. Cluster-based reinforcement learning has been proposed to improve the learning speed.Here, users who show similar behaviour are clustered and one policy is learnedfor each individual cluster. An important factor in this effort is the methodused for clustering, which has the potential to influence the benefit of suchan approach. In this chapter, we propose three distance metrics based on thestate of the users (Euclidean distance, Dynamic Time Warping, and high-levelfeatures) and apply different clustering techniques given these distance metricsto study their impact on the overall performance. We evaluate the differentmethods in a simulator with users spawned from very distinct user profiles aswell as overlapping user profiles. The results show that clustering configurationsusing high-level features significantly outperform regular reinforcement learningwithout clustering (which either learn one policy for all or one policy perindividual).
3.1 Introduction
Personalisation is defined by [109] as “a process that changes the functionality,interface, information access and content, or distinctiveness of a system toincrease its personal relevance to an individual or a category of individuals".Personalisation has become omnipresent in our society (e.g. [361; 95; 76; 160]).While applications were historically limited to web shops and alike, a wholerange of applications can nowadays be seen.
What technique is best suited to obtain personalisation depends greatly onthe task at hand. Take personalisation for health and wellbeing. In such asetting one aims to perform actions to influence the behaviour and physical
82
3.1. Introduction
state of the user to improve the overall health state. The health setting ischallenging: consequences and appropriateness of actions cannot be observedimmediately. Some actions might have a negative impact at first, only showingbenefit in the distant future. In addition, the appropriateness of actions islikely very dependent on the user context. One technique which can be used forpersonalisation fits this setting very well is reinforcement learning (cf. [160]).Unfortunately it does have its downsides: the learning process can be very slow(requiring a lot of experiences) and exploring undesired or ineffective parts ofthe action space can lead to user disengagement.
Several approaches have been proposed to overcome these problems. Oneset of approaches includes the usage of transfer learning, i.e. reusing previouslygenerated policies (cf. [345]). Alternatively, [406] have proposed to cluster usersto make the reinforcement learning process more effective while still enablinga level of personalisation. In the case of [108], users are assigned to a clusterafter some initial period, and a policy is learned per cluster. While the initialresults are promising, the results highly depend on the quality of the clustering(cf. [108]), i.e. whether the users in a cluster are sufficiently alike in terms ofthe policy that works best for them.
In this chapter, we explore cluster-based reinforcement learning more indepth, focusing on the approach to cluster users. We define different distancemetrics based on the states of the users (based on the Euclidean distance, Dy-namic Time Warping cf. [35], and by deriving high-level features), and combinethem with two well-known clustering techniques (Agglomerative Clusteringand K-Medoids). Next, we study the influence of the choice upon the overallperformance in terms of personalisation. In addition, we investigate how thepresence or absence of very distinct groups of users impacts the benefit of usingcluster-based reinforcement learning. We make use of an existing simulationenvironment [108] which allows the simulation of users in a health context(focused on getting people to perform sufficient daily physical exercise). Usingsuch a simulator allows us to easily manipulate users, their behaviour and theexistence of distinct profiles, hence, it allows us to purely focus on the clusteringtechniques themselves.
83
Chapter 3. Cluster-based Reinforcement Learning
This chapter is organised as follows. First, we will describe related work inSection 3.2. Section 3.3 details our proposed clustering approach, while Section3.4 briefly describes the simulator we use for our experiments. The experimentalsetup is described in Section 3.5 and the results in Section 3.6.
3.2 Related Work
As discussed in the introduction we use reinforcement learning as a mean tolearn when to give the intervention to the user (in our case the generated agent).Reinforcement learning has not been applied frequently in health interventionsettings while it is well suited for these types of problems (see e.g. [377; 333]).There are however some papers that have already explored its suitability.
[158] proposed the use of reinforcement learning to help decide on the correcttype of message needed to be sent to users of a mobile application affected withdiabetes type 2 to encourage physical activity. The role of the reinforcementlearner was to correctly choose the type of message that would most effectivelyencourage the patient to increase his/her physical activity (which is beneficialfor patients with diabetes type 2). This case is an example of a one-size fits allmodel.
[406] addresses the problem with using either a one-size fits all policy andusing individual learning. They suggest the use of clustering to achieve abalance between the amount of data available to the learner and the individualpersonalisation. They show that with the cluster-based reinforcement learning,they manage to achieve higher values of reward compared to both other methods,though they assumed a fixed clustering approach and the action space waslimited.
Whilst the previous studies have commonalities with our work, the mostsimilar study is [108]. Here the authors expand on the work of [406] and built adedicated simulator to evaluate the approach for more difficult scenarios. Thatsame simulator is used in our study. Furthermore, we wish to employ the settingused by [108] whilst expanding the clustering analysis component.
Lastly, our work also contains similarities to transfer learning [345] where a
84
3.3. Approach
learned policy from one task can be transferred to another, which in our casecould apply to the use of the learned policy from one user (or group of users)to a new user. This is not done in our particular study due to the assumptionof a universal timeline for all agents generated.
3.3 Approach
As explained before, we exploit cluster-based reinforcement learning to improvethe learning speed of reinforcement learning algorithms in a health and well-being context. Here, we focus on learning how to provide the most effectiveinterventions to improve the future health state of the user. Our precise casestudy will be explained in the next section. In this section, we focus on thereinforcement learning component first. As a starting point, we formulate theproblem. We will use a model-free reinforcement learning formulation. Afterwe have defined this formally, we will focus on learning reinforcement learningpolicies for users. Then we will go to the main contribution of this chapter,namely the introduction of different clustering approaches to cluster users andlearn policies over such clusters to improve the learning speed and quality.
3.3.1 Reinforcement Learning Problem Formulation
The problem we are facing is a control problem, which we model using a MarkovDecision Process (MDP) [377]. This formulation follows (cf. [108]). In ourformulation, we identify a user with the subscript u (with u ∈ U). The MDPfor our problem can be specified as Mu = 〈Su, I, Tu, Ru〉. Here, Su specifiesthe user states, and I represents the interventions that can be selected (i.e.actions in reinforcement learning terms). Tu specifies the probabilistic transitionfunction of a user u and is defined as follows Tu :: Su× I×Su → [0, 1]. Thisfunction expresses the probability of moving from one user state to another,provided that we have selected an intervention from I. Ru is the reward function,which assigns a reward based on the observed state su and the interventioni ∈ I provided to user u. Since we are dealing with human subjects in our
85

Chapter 3. Cluster-based Reinforcement Learning
setting, we cannot assume complete knowledge. Tu cannot be directly accessed(i.e. we assume it to be unknown). Furthermore, we cannot observe the full state,but only a vector of features φ derived from the state su ∈ Su. Consideringp features we specify this vector as follows: φ(su) = 〈φ1(su), . . . , φp(su)〉.While we cannot know up front whether the process in fact satisfies the Markovproperty, we assume the process to be sufficiently close such that we can employstandard reinforcement learning algorithms.
Given this problem formulation, we want to learn a policy πu per user, thatexpresses what intervention should be selected in which state π :: Su → I. Ap-plying such a policy results in experiences for each time point t: 〈φ(stu), rtu, it〉.Here, we use t to identify the specific time point. These experiences togetheraccumulate in traces (referred to as Σ) for each user u: Σu (with T being thelast time point):
〈φ(stu), rtu, i
t, φ(st+1u ), rt+1
u , it+1, . . . , φ(sTu), rTu , i
T 〉 (3.1)
We define the value of doing intervention i in state s as:
Qπ(s, i) = Eπ{∞∑k=0
γkrt+k+1|st = s, it = i} (3.2)
γ is a discount factor for future rewards. Then, the policy we strive to findmaximizes this value (i.e. selects the best interventions in each state):
π′(s) = argmaxi
Qπ(s, i), ∀s ∈ S (3.3)
To find such a policy, we deploy an off-policy reinforcement learning algo-rithm, namely Least Square Policy Iteration (LSPI) [189]. This uses the featurevector of the state (φ(s)) and finds a linear approximation of the Q functionby means of a weight vector 〈w1, . . . , wp〉 containing a weight for each of ourp features from a batch of experiences. Different alternatives are possible, butthis is outside the scope of this chapter. The techniques explained below arehowever independent of the specific reinforcement learning algorithm that is
86
3.3. Approach
selected.
3.3.2 Learning Policies
One of the problems when dealing with human users is that there is hardlyroom for an exploratory phase in which a lot of different actions can be tried.Furthermore, the state space (even when using our feature vector φ) is potentiallyvery large. When we learn our policy, we can make a choice how user specificwe want to learning such a policy. We can:
− learn one policy over all users (Pooled approach)
− learn one policy per user (Separate approach)
− learn one policy per group of similar users (Clustering approach)
The first two options are simple. For learning, we can simply vary whatexperiences we feed to our reinforcement learning algorithm. For learning onepolicy over all users, we provide Σ = {Σu|u ∈ U} and generate a singlepolicy across all users. For learning a policy for a single user, we only providethe experience for that user: Σ = {Σu}. Both options come with downsides.Learning one policy across all users will highly likely result in insufficientlytailored interventions, while learning per individual will suffer from a lack ofexperiences to learn a reasonable policy in a short time frame. We therefore studylearning across groups of users that seem to be relatively alike (following [108]).We define these groups using clustering techniques, and want to learn policiesper cluster. We provide the learning algorithm with the following experiences:Σ = {Σu|u ∈ C}. While learning across such clusters has already shown tobe beneficial (cf. [108]), the impact of the clustering approach itself has notbeen studied in depth.
3.3.3 Clustering
In order to define clusters, we need to have (1) a clustering technique, and (2)a distance metric. Let us consider the distance metric first. We will refer to
87
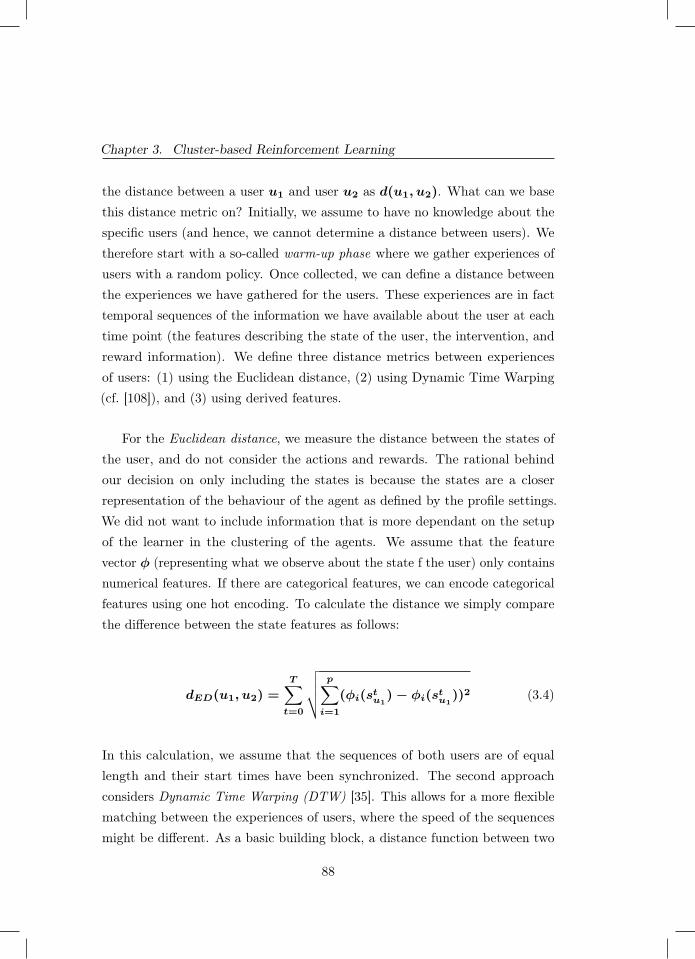
Chapter 3. Cluster-based Reinforcement Learning
the distance between a user u1 and user u2 as d(u1, u2). What can we basethis distance metric on? Initially, we assume to have no knowledge about thespecific users (and hence, we cannot determine a distance between users). Wetherefore start with a so-called warm-up phase where we gather experiences ofusers with a random policy. Once collected, we can define a distance betweenthe experiences we have gathered for the users. These experiences are in facttemporal sequences of the information we have available about the user at eachtime point (the features describing the state of the user, the intervention, andreward information). We define three distance metrics between experiencesof users: (1) using the Euclidean distance, (2) using Dynamic Time Warping(cf. [108]), and (3) using derived features.
For the Euclidean distance, we measure the distance between the states ofthe user, and do not consider the actions and rewards. The rational behindour decision on only including the states is because the states are a closerrepresentation of the behaviour of the agent as defined by the profile settings.We did not want to include information that is more dependant on the setupof the learner in the clustering of the agents. We assume that the featurevector φ (representing what we observe about the state f the user) only containsnumerical features. If there are categorical features, we can encode categoricalfeatures using one hot encoding. To calculate the distance we simply comparethe difference between the state features as follows:
dED(u1, u2) =
T∑t=0
√√√√ p∑i=1
(φi(stu1)− φi(stu1
))2 (3.4)
In this calculation, we assume that the sequences of both users are of equallength and their start times have been synchronized. The second approachconsiders Dynamic Time Warping (DTW) [35]. This allows for a more flexiblematching between the experiences of users, where the speed of the sequencesmight be different. As a basic building block, a distance function between two
88
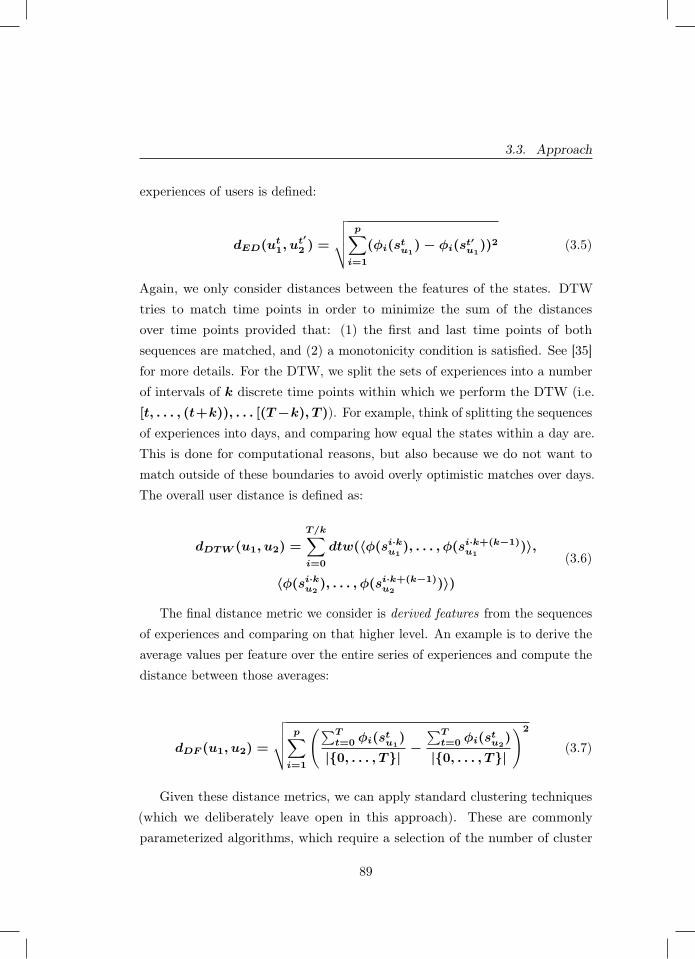
3.3. Approach
experiences of users is defined:
dED(ut1, u
t′
2 ) =
√√√√ p∑i=1
(φi(stu1)− φi(st
′u1
))2 (3.5)
Again, we only consider distances between the features of the states. DTWtries to match time points in order to minimize the sum of the distancesover time points provided that: (1) the first and last time points of bothsequences are matched, and (2) a monotonicity condition is satisfied. See [35]for more details. For the DTW, we split the sets of experiences into a numberof intervals of k discrete time points within which we perform the DTW (i.e.[t, . . . , (t+k)), . . . [(T−k), T )). For example, think of splitting the sequencesof experiences into days, and comparing how equal the states within a day are.This is done for computational reasons, but also because we do not want tomatch outside of these boundaries to avoid overly optimistic matches over days.The overall user distance is defined as:
dDTW (u1, u2) =
T/k∑i=0
dtw(〈φ(si·ku1), . . . , φ(si·k+(k−1)
u1)〉,
〈φ(si·ku2), . . . , φ(si·k+(k−1)
u2)〉)
(3.6)
The final distance metric we consider is derived features from the sequencesof experiences and comparing on that higher level. An example is to derive theaverage values per feature over the entire series of experiences and compute thedistance between those averages:
dDF (u1, u2) =
√√√√ p∑i=1
(∑Tt=0 φi(stu1
)
|{0, . . . , T}|−∑T
t=0 φi(stu2)
|{0, . . . , T}|
)2
(3.7)
Given these distance metrics, we can apply standard clustering techniques(which we deliberately leave open in this approach). These are commonlyparameterized algorithms, which require a selection of the number of cluster
89
Chapter 3. Cluster-based Reinforcement Learning
(e.g. k in K-Medoids clustering) or a threshold to be set which in fact determinesthe number of clusters (e.g. in Hierarchical Clustering). To select the bestvalue for a parameter, we use an evaluation metric commonly used in clusteringto evaluate the quality of the clusters: the silhouette (cf. [302]). We run theclustering algorithms for various parameter settings and select the setting whichresults in the highest quality clustering with this metric.
3.4 Simulator
To test our approach, we utilize a simulation environment1 which is able togenerate realistic behaviour of human-like agents for a health and wellbeingsetting. The simulator we use is described more extensively in [108]. It focuseson trying to coach people towards a healthier lifestyle by engaging them morein sports, a common goal among health apps available in the iTunes or GooglePlay store [321]. The simulator emulates the behavior of human beings bygenerating their activities throughout the day (e.g. working, eating, workingout) as well as their responses to interventions they receive in the form ofmessages that encourage them to work out. How schedules and responses aregenerated is based on certain generic profiles (e.g. think of an average workingperson). States are observed once per hour. The features of the state (φ) arethe current day of the week, the current hour of the day, if the agent has workedout within the current day, the fatigue level and which of the possible activitieshe performed in the captured hour.
As said, the acceptance of the intervention depends on the schedule of theagent, their fatigue level, as well as their profile. The reward is given based ona few conditions. If the agent accepts the intervention given, a reward of +1 isrecorded, whilst if the intervention is rejected then a negative reward of -0.5 isreturned. If the intervention was accepted an extra reward of +10 is given whenthe workout is completed. The duration of the workout can also be consideredbut for our setup we have decided not to do so. The final condition that canscore reward is the level of fatigue of the agent. The amount of negative reward1 ‘https://github.com/EMGrua/MultiAgentSimulation-MultiClusterVariation’
90
3.5. Experimental Setup
recorded increases with the amount of fatigue. For our case fatigue is definedas an incremental integer that starts from 0 and increases for every consecutiveworkout. The moment the agent skips, rejects or is not told to workout thefatigue level is reset to 0. As an example, if an agent works out three days ina row (each day working out once) its current fatigue level is equal to three.When the fourth day the agent does not workout the fatigue level gets reset.
For our investigation, we use sets of three profiles from which agents arespawned. The technicalities of each profile used are explained in subsection3.5.3. The simulator has been implemented in Python3.
3.5 Experimental Setup
In order to evaluate our approach, we perform a number of experiments. Inthis section, we explain the different experimental conditions, the performanceevaluation, and the parameters and simulator settings.
3.5.1 Experimental Conditions
We are interested in studying the performance of our cluster based learningapproach compared to the two alternative variations we mentioned in Section3.3.2 (pooled and separate). In addition, we want to understand how thedistance metric and the selected clustering algorithm impacts performance. Weuse our three distance functions and combine these with two commonly knownclustering algorithms, namely K-Medoids clustering [170] and HierarchicalClustering (Agglomerative Clustering, using the complete linkage criterion)[393]. While more advanced clustering algorithms are available, we want to startwith relatively simple approaches which can also easily be combined with thevarious distance functions chosen. Overall, this results in 2× 3 = 6 variationsfor the clustering. Thus we have 8 variations of the reinforcement learningalgorithm in total.
How easily groups of users can be distinguished (and whether they arepresent or not) is likely to have a severe impact on the advantage of using a
91

Chapter 3. Cluster-based Reinforcement Learning
cluster-based approach. To study this influence, we try two different setupsof our simulation environment. One setup features three highly distinctiveprofiles (both in terms of their daily schedules and responses to the receivedinterventions) while the second setup will again be three profiles but with twobeing very difficult to distinguish. Subsection 3.5.3 shows the specification ofthe profiles used in both settings.
3.5.2 Performance Evaluation
To evaluate the performance of the algorithms, we focus on two aspects.
To study the performance of the clustering itself, we apply clustering tothe traces of experiences we collect during the warm-up phase in which weapply a random policy. We study the users residing in the resulting clustersand consider the original profiles they were spawned from. A desirable outcomewould be to see low diversity of profiles within a single cluster. We performfive runs per clustering algorithm as the results are highly dependent on therandom initialization of the centres (certainly for K-Medoids).
The second evaluation is the performance of the reinforcement learningalgorithm and the resulting reward. Hereto, we consider the average reward weobtain. Next to the aforementioned warm-up period, we apply a learning periodduring which we measure the reward. For all variants, after the warm-up dayswe create a policy using LSPI and train each LSPI instance over the traces ofthe associated agents. Each policy is then updated on a daily basis over theremaining learning period and used to select the interventions. We computethe average daily rewards over all runs, agents and time points per day (calledthe average daily reward).
The best performing clustering configurations will be selected and comparedto both the separate and the pooled cases. To determine whether the differencebetween trends is statistically significant we used the Wilcoxon signed-rank test.We define various levels of significance: one star (?: P ≤ 0.05); 2 stars (??: P≤ 0.01), and three stars (? ? ?: P ≤ 0.001).
92

3.5. Experimental Setup
3.5.3 Parameter and Simulator Settings
For each experiment the simulation was ran with a constant set of parameters.These parameters were chosen based on preliminary experiments and feasibilityof the run times. The parameters chosen were:
− Number of agents: the number of agents for all runs was set to 100, withthe agent profiles being equally distributed among them, so we alwaysexpect a profile distribution of 33-33-34.
− Warm-up phase: the ‘warm-up phase’ was set for all runs to 7 days.
− Learning phase: the ‘learning phase’ was set to 60 days (which is enoughto obtain a stable policy).
The simulation parameters that were changed according to the executed ex-periment were the profile types. Below we list the two sets used (distinct andoverlapping) as well as the key differences between each type of profile. Thedistinct profiles are:
− Worker : works 5 days a week plus he has a 80% of working on the sixthday (Saturday). The Worker starts anywhere from 8 a.m. to 9 a.m. andworks for 10 to 11 hours. Gets fatigued after 2 consecutive workouts andhas a 10% chance of accepting a second workout in the same day.
− Athlete: works 3 days a week (Monday, Tuesday and Thursday) startingfrom around 9 a.m. for 8 hours. The athlete gets fatigued after 4consecutive workouts and has a 50% chance of accepting a second workoutin the same day.
− Retired : never works. The retiree gets fatigued after one workout and willnever accept a second workout on the same day.
The overlapping profiles are:
− newWorker : identical to Worker but does not have a chance of workinga sixth day. The newWorker is also identical in the way it behaves withworking out and fatigue pattern.
93

Chapter 3. Cluster-based Reinforcement Learning
− newAthlete: identical to the athlete but has a 60% chance of working onWednesday and a equal chance of working on Friday. NewAthlete is alsoidentical to Athlete in the fatigue and workout settings.
− Athlete: identical to the previously described athlete.
It is important to remember that apart from these differences all of theprofiles include routine actions, such as eating (breakfast, lunch, dinner) andsleeping.
3.6 Results
In this section, we present the results we obtained using the experimental setupwe have just described. We start with the analysis of the clusters, followed bythe performance of the reinforcement learning techniques2.
3.6.1 Clustering Analysis
Let us analyse the clusters found for the two different profile setups.
3.6.1.1 Distinct Profiles
Let us first consider the distinct profile case. Table 3.1 provides an overviewof the results we obtained. Each row represents one of these variations whilstthe first 5 columns show the number of clusters found per run. The followingcolumns show the mode value/s of the number of clusters for the set of runsand the median. In order to keep the following tables and graphs clear andcompact we have abbreviated the various experimental cases as follows:
k : is used when the clustering technique used was K-medoids.
h : is used for when Hierarchical Clustering was utilised
eu : stands for the Euclidean distance metric2 The data can be found here:‘http://doi.org/10.5281/zenodo.1215905’
94
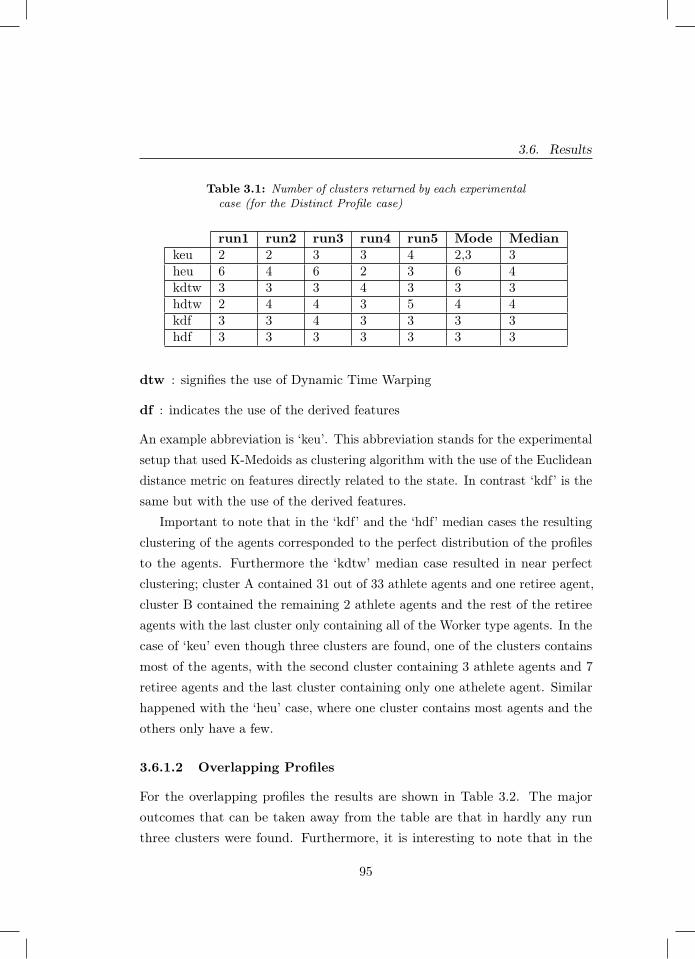
3.6. Results
Table 3.1: Number of clusters returned by each experimentalcase (for the Distinct Profile case)
run1 run2 run3 run4 run5 Mode Mediankeu 2 2 3 3 4 2,3 3heu 6 4 6 2 3 6 4kdtw 3 3 3 4 3 3 3hdtw 2 4 4 3 5 4 4kdf 3 3 4 3 3 3 3hdf 3 3 3 3 3 3 3
dtw : signifies the use of Dynamic Time Warping
df : indicates the use of the derived features
An example abbreviation is ‘keu’. This abbreviation stands for the experimentalsetup that used K-Medoids as clustering algorithm with the use of the Euclideandistance metric on features directly related to the state. In contrast ‘kdf’ is thesame but with the use of the derived features.
Important to note that in the ‘kdf’ and the ‘hdf’ median cases the resultingclustering of the agents corresponded to the perfect distribution of the profilesto the agents. Furthermore the ‘kdtw’ median case resulted in near perfectclustering; cluster A contained 31 out of 33 athlete agents and one retiree agent,cluster B contained the remaining 2 athlete agents and the rest of the retireeagents with the last cluster only containing all of the Worker type agents. In thecase of ‘keu’ even though three clusters are found, one of the clusters containsmost of the agents, with the second cluster containing 3 athlete agents and 7retiree agents and the last cluster containing only one athelete agent. Similarhappened with the ‘heu’ case, where one cluster contains most agents and theothers only have a few.
3.6.1.2 Overlapping Profiles
For the overlapping profiles the results are shown in Table 3.2. The majoroutcomes that can be taken away from the table are that in hardly any runthree clusters were found. Furthermore, it is interesting to note that in the
95
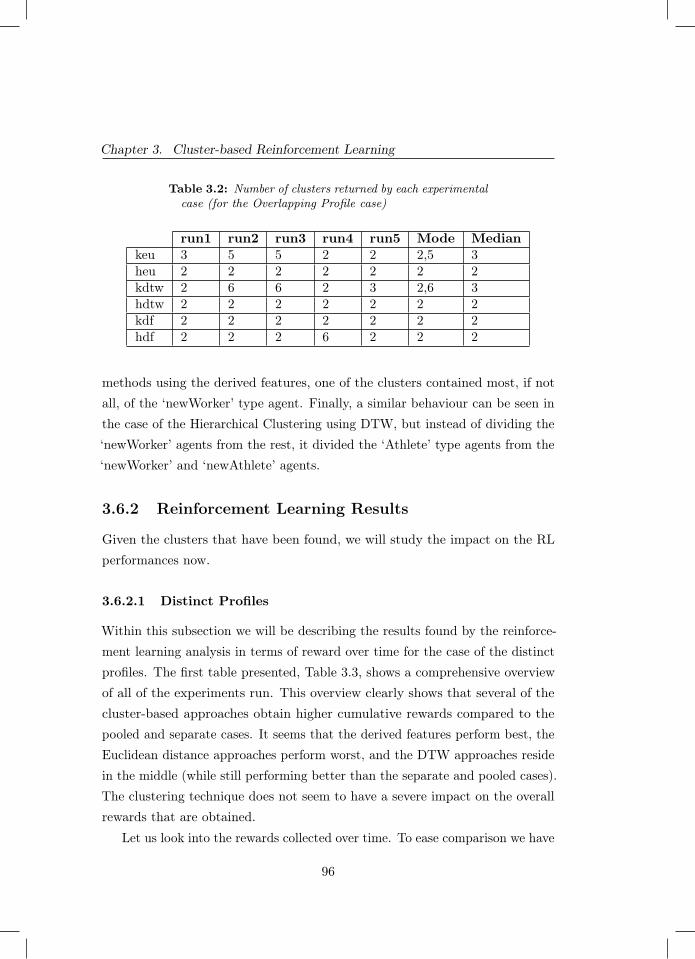
Chapter 3. Cluster-based Reinforcement Learning
Table 3.2: Number of clusters returned by each experimentalcase (for the Overlapping Profile case)
run1 run2 run3 run4 run5 Mode Mediankeu 3 5 5 2 2 2,5 3heu 2 2 2 2 2 2 2kdtw 2 6 6 2 3 2,6 3hdtw 2 2 2 2 2 2 2kdf 2 2 2 2 2 2 2hdf 2 2 2 6 2 2 2
methods using the derived features, one of the clusters contained most, if notall, of the ‘newWorker’ type agent. Finally, a similar behaviour can be seen inthe case of the Hierarchical Clustering using DTW, but instead of dividing the‘newWorker’ agents from the rest, it divided the ‘Athlete’ type agents from the‘newWorker’ and ‘newAthlete’ agents.
3.6.2 Reinforcement Learning Results
Given the clusters that have been found, we will study the impact on the RLperformances now.
3.6.2.1 Distinct Profiles
Within this subsection we will be describing the results found by the reinforce-ment learning analysis in terms of reward over time for the case of the distinctprofiles. The first table presented, Table 3.3, shows a comprehensive overviewof all of the experiments run. This overview clearly shows that several of thecluster-based approaches obtain higher cumulative rewards compared to thepooled and separate cases. It seems that the derived features perform best, theEuclidean distance approaches perform worst, and the DTW approaches residein the middle (while still performing better than the separate and pooled cases).The clustering technique does not seem to have a severe impact on the overallrewards that are obtained.
Let us look into the rewards collected over time. To ease comparison we have
96
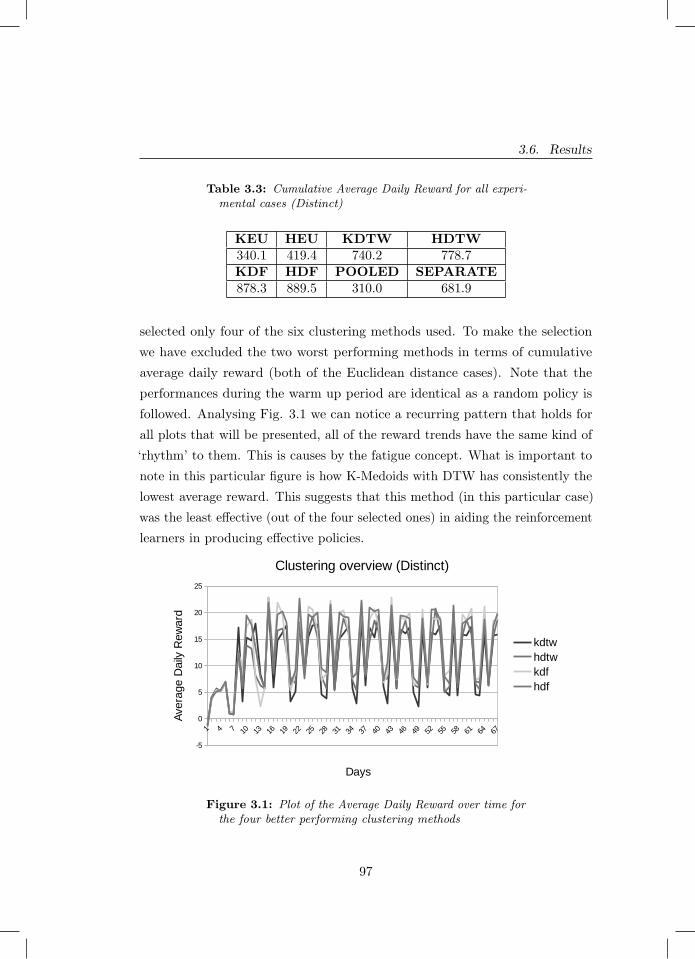
3.6. Results
Table 3.3: Cumulative Average Daily Reward for all experi-mental cases (Distinct)
KEU HEU KDTW HDTW340.1 419.4 740.2 778.7KDF HDF POOLED SEPARATE878.3 889.5 310.0 681.9
selected only four of the six clustering methods used. To make the selectionwe have excluded the two worst performing methods in terms of cumulativeaverage daily reward (both of the Euclidean distance cases). Note that theperformances during the warm up period are identical as a random policy isfollowed. Analysing Fig. 3.1 we can notice a recurring pattern that holds forall plots that will be presented, all of the reward trends have the same kind of‘rhythm’ to them. This is causes by the fatigue concept. What is important tonote in this particular figure is how K-Medoids with DTW has consistently thelowest average reward. This suggests that this method (in this particular case)was the least effective (out of the four selected ones) in aiding the reinforcementlearners in producing effective policies.
1 74 10 13 16 19 22 25 28 31 34 37 40 43 46 49 52 55 58 61 64 67
-5
0
5
10
15
20
25
Clustering overview (Distinct)
kdtwhdtwkdfhdf
Days
Ave
rage
Dai
ly R
ewar
d
Figure 3.1: Plot of the Average Daily Reward over time forthe four better performing clustering methods
97

Chapter 3. Cluster-based Reinforcement Learning
1 74 10 13 16 19 22 25 28 31 34 37 40 43 46 49 52 55 58 61 64 67
-10
-5
0
5
10
15
20
25
HDTW vs KDF vs SEPARATE vs POOLED (Distinct)
hdtwkdfseparatepooled
Days
Ave
rage
Dai
ly R
ewar
d
Figure 3.2: Plot of the Average Daily Reward over timecomparing the two selected clustering methods and the twonon-clustering methods (Separate and Pooled)
Figure 3.2 illustrates the final two selected clustering methods and comparesit to the pooled and separate approaches. To have a comprehensive comparison,we chose the best clustering technique for the non-derived features and the bestone for the derived features. In this figure we can easily notice how poorly thepooled aided at the creation of a good policy. Furthermore, the daily averagereward resulting from separate appears to always be below our selected methods.
In order to draw critical conclusions from the comparison we used theWilcoxon signed-rank test on all possible combinations of the selected methodsto find potential statistical differences (as reported in Table 3.4).
Table 3.4: Table of returned Wilcoxon p-values for all ofthe selected experimental methods (Distinct)
hdtw vs kdf pvalue=3.0675e-06???
hdtw vs separate pvalue=8.2819e-07???
hdf vs separate pvalue=3.0421e-10???
separate vs pooled pvalue=5.1079e-12???
hdtw vs pooled pvalue=4.8880e-12???
kdf vs pooled pvalue=5.8275e-12???
98
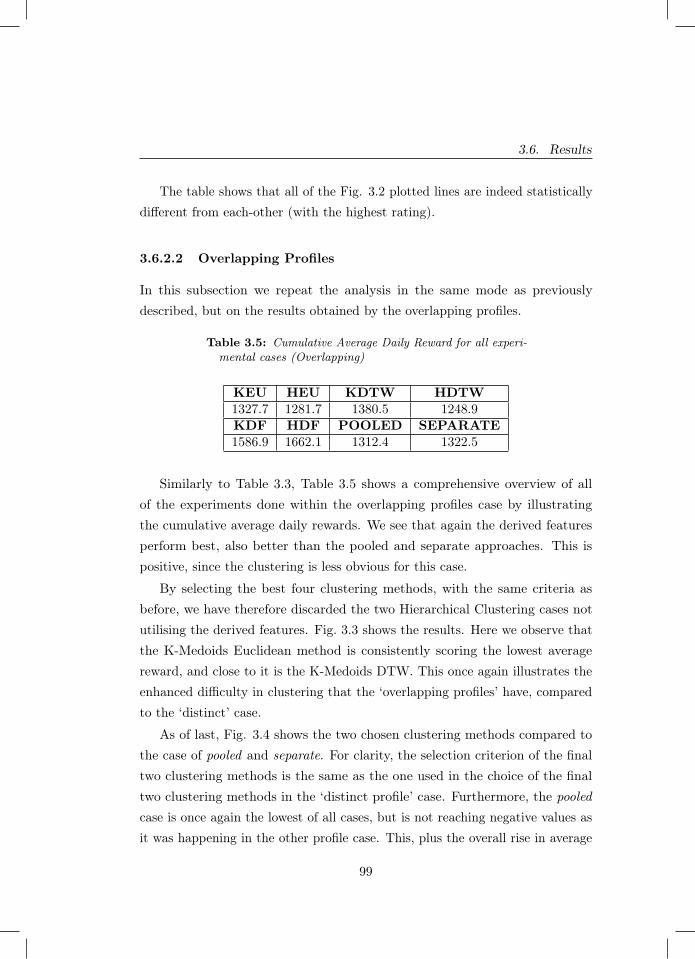
3.6. Results
The table shows that all of the Fig. 3.2 plotted lines are indeed statisticallydifferent from each-other (with the highest rating).
3.6.2.2 Overlapping Profiles
In this subsection we repeat the analysis in the same mode as previouslydescribed, but on the results obtained by the overlapping profiles.
Table 3.5: Cumulative Average Daily Reward for all experi-mental cases (Overlapping)
KEU HEU KDTW HDTW1327.7 1281.7 1380.5 1248.9KDF HDF POOLED SEPARATE1586.9 1662.1 1312.4 1322.5
Similarly to Table 3.3, Table 3.5 shows a comprehensive overview of allof the experiments done within the overlapping profiles case by illustratingthe cumulative average daily rewards. We see that again the derived featuresperform best, also better than the pooled and separate approaches. This ispositive, since the clustering is less obvious for this case.
By selecting the best four clustering methods, with the same criteria asbefore, we have therefore discarded the two Hierarchical Clustering cases notutilising the derived features. Fig. 3.3 shows the results. Here we observe thatthe K-Medoids Euclidean method is consistently scoring the lowest averagereward, and close to it is the K-Medoids DTW. This once again illustrates theenhanced difficulty in clustering that the ‘overlapping profiles’ have, comparedto the ‘distinct’ case.
As of last, Fig. 3.4 shows the two chosen clustering methods compared tothe case of pooled and separate. For clarity, the selection criterion of the finaltwo clustering methods is the same as the one used in the choice of the finaltwo clustering methods in the ‘distinct profile’ case. Furthermore, the pooledcase is once again the lowest of all cases, but is not reaching negative values asit was happening in the other profile case. This, plus the overall rise in average
99
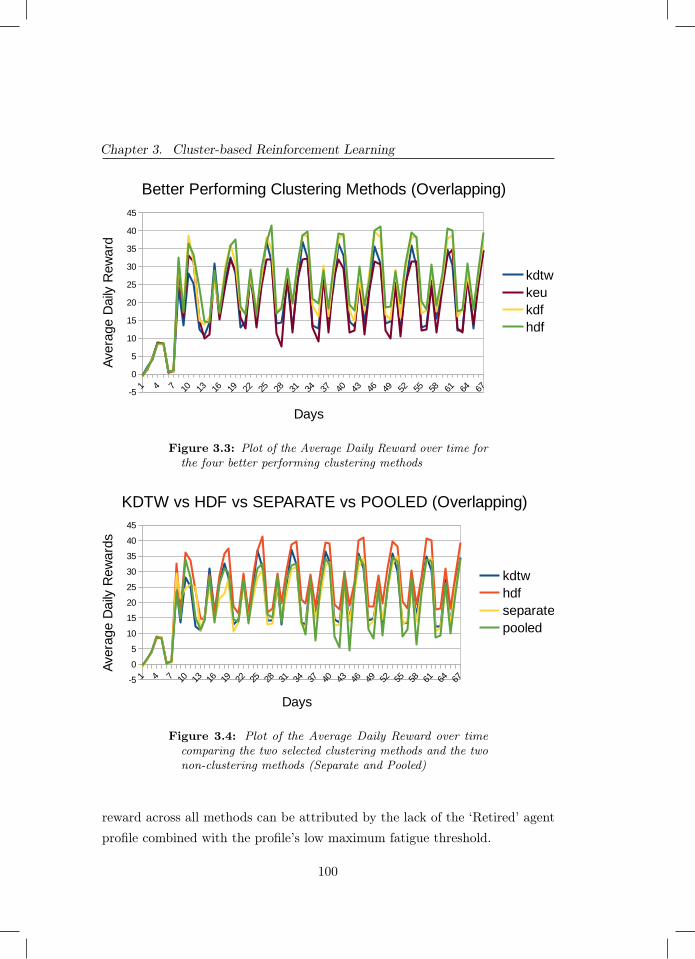
Chapter 3. Cluster-based Reinforcement Learning
1 74 10 13 16 19 22 25 28 31 34 37 40 43 46 49 52 55 58 61 64 67-5
0
5
10
15
20
25
30
35
40
45
Better Performing Clustering Methods (Overlapping)
kdtwkeukdfhdf
Days
Ave
rage
Dai
ly R
ewar
d
Figure 3.3: Plot of the Average Daily Reward over time forthe four better performing clustering methods
1 74 10 13 16 19 22 25 28 31 34 37 40 43 46 49 52 55 58 61 64 67-5
0
5
10
15
20
25
30
35
40
45
KDTW vs HDF vs SEPARATE vs POOLED (Overlapping)
kdtwhdfseparatepooled
Days
Ave
rage
Dai
ly R
ewar
ds
Figure 3.4: Plot of the Average Daily Reward over timecomparing the two selected clustering methods and the twonon-clustering methods (Separate and Pooled)
reward across all methods can be attributed by the lack of the ‘Retired’ agentprofile combined with the profile’s low maximum fatigue threshold.
100
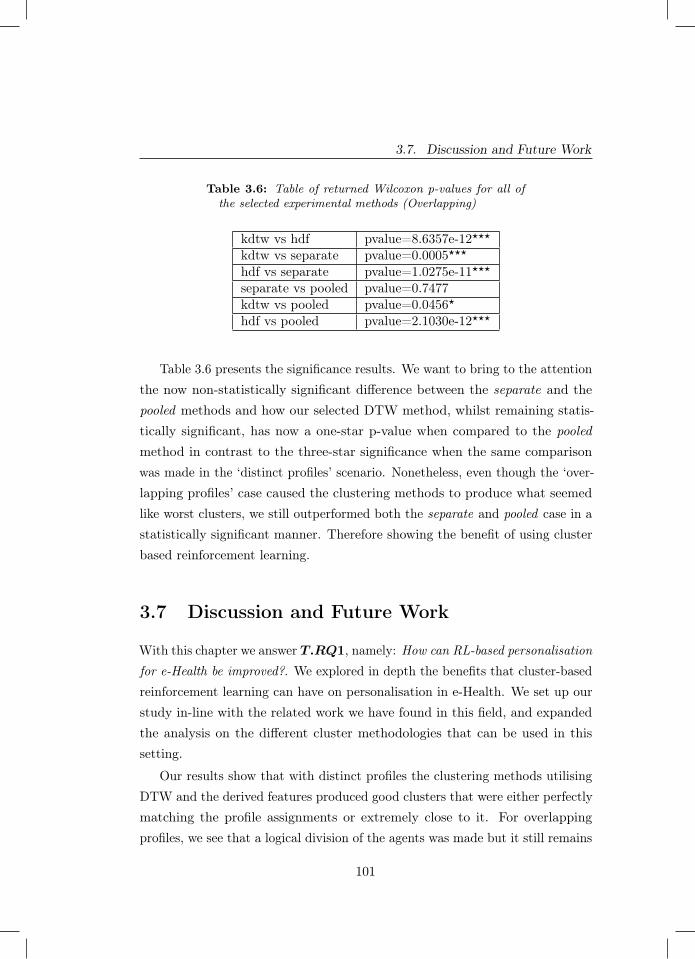
3.7. Discussion and Future Work
Table 3.6: Table of returned Wilcoxon p-values for all ofthe selected experimental methods (Overlapping)
kdtw vs hdf pvalue=8.6357e-12???
kdtw vs separate pvalue=0.0005???
hdf vs separate pvalue=1.0275e-11???
separate vs pooled pvalue=0.7477kdtw vs pooled pvalue=0.0456?
hdf vs pooled pvalue=2.1030e-12???
Table 3.6 presents the significance results. We want to bring to the attentionthe now non-statistically significant difference between the separate and thepooled methods and how our selected DTW method, whilst remaining statis-tically significant, has now a one-star p-value when compared to the pooledmethod in contrast to the three-star significance when the same comparisonwas made in the ‘distinct profiles’ scenario. Nonetheless, even though the ‘over-lapping profiles’ case caused the clustering methods to produce what seemedlike worst clusters, we still outperformed both the separate and pooled case in astatistically significant manner. Therefore showing the benefit of using clusterbased reinforcement learning.
3.7 Discussion and Future Work
With this chapter we answer T.RQ1, namely: How can RL-based personalisationfor e-Health be improved?. We explored in depth the benefits that cluster-basedreinforcement learning can have on personalisation in e-Health. We set up ourstudy in-line with the related work we have found in this field, and expandedthe analysis on the different cluster methodologies that can be used in thissetting.
Our results show that with distinct profiles the clustering methods utilisingDTW and the derived features produced good clusters that were either perfectlymatching the profile assignments or extremely close to it. For overlappingprofiles, we see that a logical division of the agents was made but it still remains
101

Chapter 3. Cluster-based Reinforcement Learning
one that does not match the original assignment of the profiles to the agents.For both cases we outperform the separate and the pooled reinforcement learningapproaches. Here, the derived features approach performs best, but the dynamictime warping also performs reasonably well. This seems even more remarkablegiven the somewhat poor clustering that resulted in the case of the overlappingagent profiles. This finding supports our initial intuition and the findingsbrought forth by [406; 108].
As future work it would be good to expand on our study and test othertypes of clustering techniques to see how the reinforcement learner reacts topotentially different patterns in the clusters. Another interesting variationto study would be to dynamically change the clusters over the course of thesimulation, similarly as the reinforcement learner is continuously updating itspolicy over time. To do this we would need to use an online-clustering algorithm.To the best of our knowledge, there is currently a lack of online clusteringalgorithms tailored for e-Health. In the next chapter we will be tackling thislimitation.
102
4Clustering Growing Timeseries
Chapter 4 was published as:
Grua, E. M., Hoogendoorn, M., Malavolta, I., Lago, P., & Eiben, A. E. (2019, October).Clustream-GT: online clustering for personalization in the health domain. InIEEE/WIC/ACM International Conference on Web Intelligence (pp. 270-275).
103
Chapter 4. Clustering Growing Timeseries
Abstract - The goal of this chapter is to answer our T.RQ2, namely: Howcan online-clustering be used to efficiently and effectively cluster e-Health data?Clustering of users underlies many of the personalisation algorithms that are inuse nowadays. Such clustering is mostly performed in an offline fashion. For ahealth and wellbeing setting, offline clustering might however not be suitable,as limited data is often available and patient states can also quickly evolveover time. Existing online clustering algorithms are not suitable for the healthdomain due to the type of data that involves multiple time series evolvingover time. In this chapter we propose a new online clustering algorithm calledCluStream-GT that is suitable for health applications. By using both artificialand real datasets, we show that the approach is far more efficient compared toregular clustering, with an average speedup of 93%, while only losing 12% inthe accuracy of the clustering with artificial data and 3% with real data.
4.1 Introduction
Personalisation in the health domain can contribute greatly to an improvedwellbeing among patients [371; 294; 157]. For example, personalisation entailsselecting a dedicated intervention for a patient that is most likely to improve thepatients health state. Applications vary from more medical cases in hospitals [7]to mobile health apps such as sport trackers [239] or apps to battle depression[281] . Performing personalisation in the health domain is challenging: badsuggestions are highly undesirable, data can be limited for specific types ofhealth-related domains, and doing real life experiments to collect more data isnot trivial at all.
Clustering is often considered a valuable step in providing personalisedsupport or recommendations to users (see e.g. [177; 81]) in order to have enoughdata to base recommendations on. Using clustering, like-minded users aregrouped, and recommendations (or the aforementioned interventions) are foundthat are relevant for the users in the group. Mostly, this clustering is done inan offline fashion, i.e., once the clusters are determined they do not change inreal-time and are only updated in a batch mode over possibly long intervals.
104

4.1. Introduction
While this is fine for companies such as Netflix and Amazon with a user base ofmillions and without rapid changes of user preferences, for the health domainthis might come with severe disadvantages: (1) the number of users could bevery limited and one would want to exploit the most recent data of all patients,and (2) the health state of users can vary greatly and change rapidly over time.Hence, clustering in a real-time fashion is much more desirable.
In the literature, there are various algorithms that allow for the onlineupdating of clusters. Well-known examples include CluStream [5], ODAC [301],and others [57; 70]. They do however not fit the health domain well.
In the health domain, we mostly consider measurements over time perpatient, and intend to cluster on a patient level. This means that onlineclustering approaches need to cope with: (1) new patients arriving, and (2)new data of known patients coming in. Both situations potentially require anupdate of clusters, while in existing approaches only the second case is tackled,assuming the number of data points (in our case patients) do not change astime progresses. In this chapter, we present an online clustering approach forthe health care domain that is called CluStream-GT (standing for: CluStreamfor Growing Timeseries). It is able to online cluster patients with evolving timeseries (i.e. an increasing amount of data per patient over time). This approachis an extension of the popular CluStream approach. CluStream-GT onlineclusters inputted time-series by first checking if the data is meant as an updateof an already clustered patient or is categorising a new one. In the formercase it then decides if the newly updated time-series has to be re-clustered orcan be kept in the already assigned cluster. Whilst in the latter case it willalways decide which cluster is better suited to include the new patient data.In order to evaluate the CluStream-GT, we use both real medical EEG dataand artificial data. We compare the quality of the clusters found by CluStream-GT to k-means (cf. [216]) and ODAC (as it is the closest existing method toCluStream-GT) by having both algorithms re-cluster at each timepoint andstoring the average silhouette score [302]. We also compare the total executiontime of the approaches. We therefore analysed the two metrics and found abeneficial trade-off in the use of CluStream-GT.
105
Chapter 4. Clustering Growing Timeseries
4.2 Approach
In this section, we formally define the problem we are addressing, followed byan explanation of the proposed algorithm.
4.2.1 Problem Description
We assume that we have a set of users U : u1, . . . , uk (patients in our case)which can generate health related data. The health data contains a number offeatures that are measured around the users at each time point: {f1, . . . , fn}.The domain of each feature fi is denoted by Fi. The values of these features aremeasured over time, we assume that at each time point when a measurement isperformed, all feature values are measured. For a measurement at time point t
for user ui, the value of the feature fj is noted as v(ui, fj, t). We use St1t0 (ui)
to denote the time series of a user ui, containing vectors of values of all featuresover all time point between t0 and t1. Furthermore, tstart(ui) is used to specifythe time when the time series started for user ui and tend(ui) when it ended.
Our task is to cluster the series of values over all features for the users.Here, the start, end, and length of the series of the users can vary freely acrossthe users. In order to specify our algorithm, we assume that some aggregationfunction a is available that summarises the the entire time series into a singlenumber that can be compared to other time series (i.e. this is our distancemetric). We require the following property of the function (to simplify, weassume one feature fj here):
a(Stkt0(ui)) = a(a(Stk−1
t0 (ui)), Stktk(ui))) (4.1)
This property allows updating the aggregate of the time series withouthaving to maintain a history of all values.
106
4.2. Approach
4.2.2 CluStream-GT algorithm
To solve the clustering problem, we deploy an approach similar to CluStream.CluStream works based on microclusters. These are used as intermediate stepbefore the clustering of the entire dataset is used. They are initialised offlinewith a small sub-sample of the dataset. Microclusters are specified by means offive components that summarise the data within the microcluster:
− the sum of all values of the datapoints
− the sum of all squared values of the datapoints
− the sum of all time points associated with the datapoints
− the sum of the squared values of all time points associated with thedatapoints
− the number of datapoints contained in the microcluster
Given our formal notation before, we slightly adjust the microcluster defini-tion to make it suitable for our setting:
− the sum of all values of the aggregation function of the users in themicrocluster:∑
∀u∈Uia(S
tend(u)tstart(u)(u))
− the sum of all squared values of the aggregation function:∑∀u∈Ui
(a(S
tend(u)tstart(u)(u))
)2− the sum of the last time points for all users:∑
∀u∈Uitend(u)
− the sum of the squared values of the last time points for all users:∑∀u∈Ui
(tend(u))2
− the set of users contained in the microcluster (Ui ⊂ U)
107
Chapter 4. Clustering Growing Timeseries
As a second step, these microclusters are used as datapoints in a standardclustering approach resulting in macroclusters. Having the microclusters as anintermediate step saves valuable storage space, but also computational effortin the clustering. Of course, it is essential to have appropriate microclustersthat group users in a suitable way. CluStream therefore, when new data arrives,assigns the new data point to an existing microcluster if it is sufficiently alike,or its own microcluster in case it is too different. In the latter case, two existingmicroclusters are merged. Microclusters containing too many old datapointscan also be removed. In our setting, life becomes slightly more complicatedas data points are now time series. Hence, we can have two cases: (1) a newdatapoint arrives in a time series of an existing user/patient, or (2) a datapointarrives of a new patient. We need to accommodate for both cases. Algorithm 4shows our adjusted version of CluStream to accommodate for this setting.
In our extension, we consider the update when a new patient arrives thesame as with CluStream (of course, using our aggregation function again).In case a new datapoint for an existing patient arrives we only update theproperties of the microcluster that patient had already been assigned to in caseit results in a minor adjustment of the aggregate value. Otherwise, we go toa full blown re-clustering. This process can be seen in line 7 of Algorithm 4where the adjustment is judged against a threshold value δ.
In the pseudocode, the additions that were made to CluStream are seenfrom line 1 to 9 in Algorithm 4. We also assume that within the health domainwe want to retain the information of all the clustered time-series, no matter howold they are. If they would ever have to be deleted, the user of the algorithmcan do so manually, but we do not want to give permission to the algorithm toautomatically remove information. Therefore we have removed the possibilityof the algorithm deleting micro-clusters.
For the offline cluster creation (or macro-clustering process) CluStream-GTworks similarly to CluStream. It uses k-means but uses the micro-clusters asthe input data. Furthermore, the centroids are chosen as the k most populatedmicro-clusters. This can be easily achieved by analysing the last element ofeach micro-cluster tuple and choosing the k highest ones. This macro-clustering
108
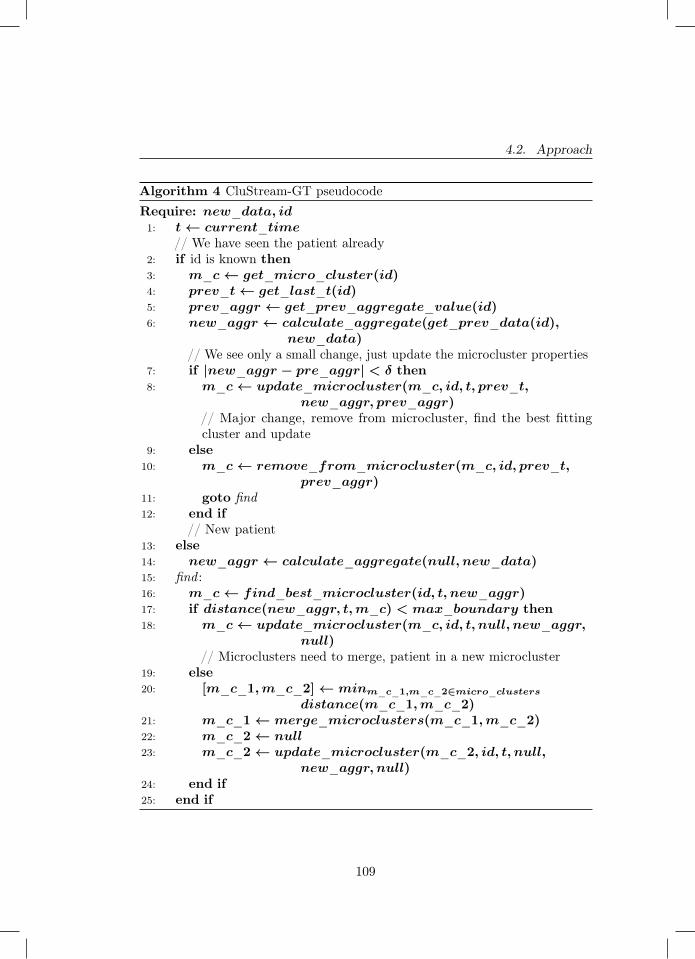
4.2. Approach
Algorithm 4 CluStream-GT pseudocodeRequire: new_data, id1: t← current_time
// We have seen the patient already2: if id is known then3: m_c← get_micro_cluster(id)4: prev_t← get_last_t(id)5: prev_aggr ← get_prev_aggregate_value(id)6: new_aggr ← calculate_aggregate(get_prev_data(id),
new_data)// We see only a small change, just update the microcluster properties
7: if |new_aggr − pre_aggr| < δ then8: m_c← update_microcluster(m_c, id, t, prev_t,
new_aggr, prev_aggr)// Major change, remove from microcluster, find the best fittingcluster and update
9: else10: m_c← remove_from_microcluster(m_c, id, prev_t,
prev_aggr)11: goto find12: end if
// New patient13: else14: new_aggr ← calculate_aggregate(null, new_data)15: find :16: m_c← find_best_microcluster(id, t, new_aggr)17: if distance(new_aggr, t,m_c) < max_boundary then18: m_c← update_microcluster(m_c, id, t, null, new_aggr,
null)// Microclusters need to merge, patient in a new microcluster
19: else20: [m_c_1,m_c_2]← minm_c_1,m_c_2∈micro_clusters
distance(m_c_1,m_c_2)21: m_c_1← merge_microclusters(m_c_1,m_c_2)22: m_c_2← null23: m_c_2← update_microcluster(m_c_2, id, t, null,
new_aggr, null)24: end if25: end if
109
Chapter 4. Clustering Growing Timeseries
process has the clear advantage of not requiring storage of the whole time-seriesdataset as we use only use the micro-clusters, making our approach better suitedfor cases with limited resources.
4.3 Experimental Setup
In this section we explain the experimental conditions and evaluations we haveused to test CluStream-GT’s performance. We compare CluStream-GT againsttwo alternatives: (1) k-means clustering in each iteration, and (2) ODAC(cf. [301]).
4.3.0.0.1 Scenarios To assess the difference in performance we performedtests for three scenarios: two were done with generated synthetic data and onewith the use of a real world dataset. For the generated data conditions weutilised sine functions to generate our time-series. In the first test (henceforthreferred to as: the base case) we had each time-series associated to a specificset of parameters inputted in the sine function. This includes the function itselfand noise surrounding the curve. In the second test (henceforth referred to as:the advanced case) each time-series started with an associated set of parameters,analogous to the base case. However, at each timestep the considered time-series had a 10% chance of changing its parameters and therefore have its datagenerated by a different sine function. This extra factor was introduced as amethod of representing the potential change in behaviour that can be observedin time series associated with human behaviour, especially within the healthdomain (e.g. vital signs getting better, mood improving, more frequent physicalactivity, etc.). To add a more practical test scenario we have also used of a realdataset. This dataset is a collection of EEG recordings that were published byAndrzejak et al. in 2001 [13].
4.3.0.0.2 Performance metrics The two aspects investigated across allof our tests were accuracy of the clustering and speed of execution. To assesclustering accuracy, we decided to utilise the silhouette score [302]. For the
110
4.3. Experimental Setup
execution time, we kept track of the total length of the execution of thealgorithms thereby performing the experiments on the same machine with noother processes open in order to minimise potential variance.
4.3.0.0.3 Algorithm setup All of the tests are set up to represent a re-alistic scenario for all techniques (CluStream-GT, k-means and ODAC). Wetherefore update at every single timestep as in the health care domain datacan be scarce and therefore all available data should be exploited as much aspossible to create the most up-to-date clusters. This means that we re-clusterevery time any form of new data is given to the algorithm. That includes botha new time-series and any amount of new data related to an already clusteredone.
The k-means used as benchmark clustered using the means of each time-series present in the dataset. The mean was used since it was also utilised asour selected aggregate function (described in Section 4.2) for distance compu-tation during the online phase of CluStream-GT. Both ClusStream-GT andk-means clustering require the number of clusters to be set. To make the resultscomparable we fixed this value to k = 3 for both cases as initial experimentshave shown this to be the best value for all scenarios. Our replication packagecontains the full experimental setup implemented in Python as used to performthese experiments1.
4.3.0.0.4 Experimental Conditions For both generated cases, we had astarting population of 120 time-series uniformly distributed over three clusters.The experiments were performed over the course of 30, 60 and 90 simulateddays, with each case repeated 30 times. At each day there was a 50% chance ofadding new time-series to the dataset (simulating the addition of a new patient).The amount added ranged from one to five chosen with the use of a uniformdistribution. It is important to note that this feature of our experiment was notused whilst testing ODAC. This is because ODAC cannot work on datasets withchanging numbers of timeseries. Per day, each generated time-series consisted
1 https://github.com/EMGrua/CluStream-GT
111

Chapter 4. Clustering Growing Timeseries
of 24 points. This was selected to simulate pooling done once at each hour ofthe day.
For the real dataset, we ran tests on three cases: 100, 200 and 300 totalpatients. Each patient had a time-series containing 4097 individual datapoints.Each one of these scenarios was repeated five times. ODAC was run only asingle time as it lacks stochasticity and therefore would always return the sameresults.
4.4 Results
Section 4.4.1 illustrates the results we gathered from the two generated datatest cases, whilst Section 4.4.2 does so with the EEG dataset results. As wecould never compute the silhouette score for ODAC we illustrate those resultsseparately (see Section 4.4.3).
4.4.1 Results from the generated data
We will first discuss the results for the base case. Figure 4.1 illustrates thedistribution of the average silhouette scores obtained for each of the test scenarios.The CluStream-GT mean averages at 0.86 and the median to 0.9, whilst thek-means mean and median average at 0.93. Secondly, it is interesting to notethe skewed distribution occurring for all cases of CluStream-GT. Furthermore,we can observe some runs that result in differences deviant enough from themean to be classified as outliers. The potential cause of this behaviour could beattributed to poor initialisation of the micro-clusters within those runs, whichthen followed with worse overall clustering and therefore a lower silhouette score.Nevertheless, the distributions favour a smaller difference with the IQR rangingfrom the smallest Q1 equal to 0.84 to the highest Q3 equal to 0.92. Differentlyis the execution time trends of the two techniques (shown in Figure 4.2). Weclearly observe that with the growing amount of data the saved execution timealso grows. This can be certainly attributed to the use of the micro-cluster tuplesfor the generation of the macro-clusters, which caps the amount of data used to
112

4.4. Results
cluster. Therefore, the time increase is only due to the higher number of runsof the online component needed by CluStream-GT to update the micro-clusters.No matter the amount of data, CluStream-GT provides at least a 90% speedup.
Examining now the silhouette score for the advanced case, we observea bigger difference between CluStream-GT and k-means, and a less skeweddistribution for all the scenarios of CluStream-GT (as shown in Figure 4.3)as compared to the base case. In this case we observe a number of outliers,although smaller than with the base case. The overall higher difference betweenthe two approaches is to be expected as CluStream-GT is trying to cluster anow far more complex time-series with only the use of the meta-data containedin the micro-cluster tuples. This provides somewhat of an advantage to ourbenchmark k-means which has access to the mean of each time-series present inthe generated dataset.
Finally, we examine the execution times recorded for each scenario of theadvanced case (shown in Figure 4.4). Similar to the execution times of the basecase, CluStream-GT minimally grows as the data does, whilst the execution timeof k-means continues to grow. This indicates that the more data is clusteredand the higher is the speed gain achieved by using CluStream-GT. In fact inthe 90 days test case we achieve an average 94.7% speed-up.
4.4.2 Results from the real dataset
We start by analysing the results collected from the silhouette scores (shownin Figure 4.5). The mean values recorded from both algorithms are extremelysimilar, with only a small loss in the silhouette score by CluStream-GT comparedto k-means. Furthermore, the standard deviation for each case was minimal.This suggests reliable clustering over repetitions and therefore reliable clusteringoverall. This is somewhat in contrast with the generated data, where bothCluStream-GT and k-means showed wider standard deviations, reinforcing ourassumption that the deviation in the generated data is due to the noisier natureof said data. Moving to execution times we observe the huge advantage thatusing CluStream-GT gives over k-means. In Figure 4.6 we see that whilst
113

Chapter 4. Clustering Growing Timeseries
30 60 90Number of days
0.5
0.6
0.7
0.8
0.9
1.0
Silh
ouet
te sc
ore
Base Case - Silhouette scoresCluStream-GTK-Means
Figure 4.1: Decrease of the the average silhouette scoreusing CluStream-GT compared to k-means (Base Case)
k-means drastically increases its execution time with the increase of data,CluStream-GT barely increases. This leads to a difference in execution timethat becomes more substantial the bigger the dataset is. Taking the case of 300patients the average execution time for k-means is of 20000 seconds (5 hoursand 33 minutes) whilst CluStream-GT’s average execution time is only 1036seconds (17 minutes and 20 seconds). This effectively is a 95% improvement.
4.4.3 Results obtained by the use of ODAC
Over all tests, ODAC consistently maintained only one node of its tree structure,hence clustering all data under one cluster. As a result, it was impossible forus to measure the silhouette score. In order to make such measure, ODACwould have had to result in at least two separate clusters. The reason for thisbehaviour seems to stem from the algorithm stalling on the first node, splittingand aggregating consecutively. This type of behaviour has also been reportedby the authors of ODAC as well [300]. A cause could be that updates are
114
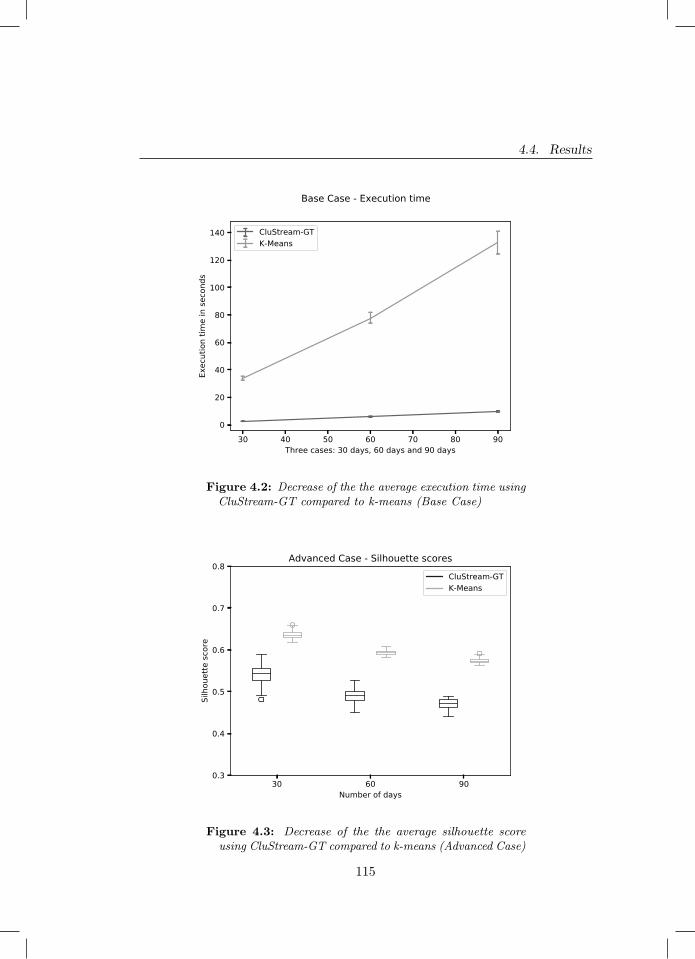
4.4. Results
30 40 50 60 70 80 90Three cases: 30 days, 60 days and 90 days
0
20
40
60
80
100
120
140
Exec
utio
n tim
e in
seco
nds
CluStream-GTK-Means
Base Case - Execution time
Figure 4.2: Decrease of the the average execution time usingCluStream-GT compared to k-means (Base Case)
30 60 90Number of days
0.3
0.4
0.5
0.6
0.7
0.8
Silh
ouet
te sc
ore
Advanced Case - Silhouette scoresCluStream-GTK-Means
Figure 4.3: Decrease of the the average silhouette scoreusing CluStream-GT compared to k-means (Advanced Case)
115
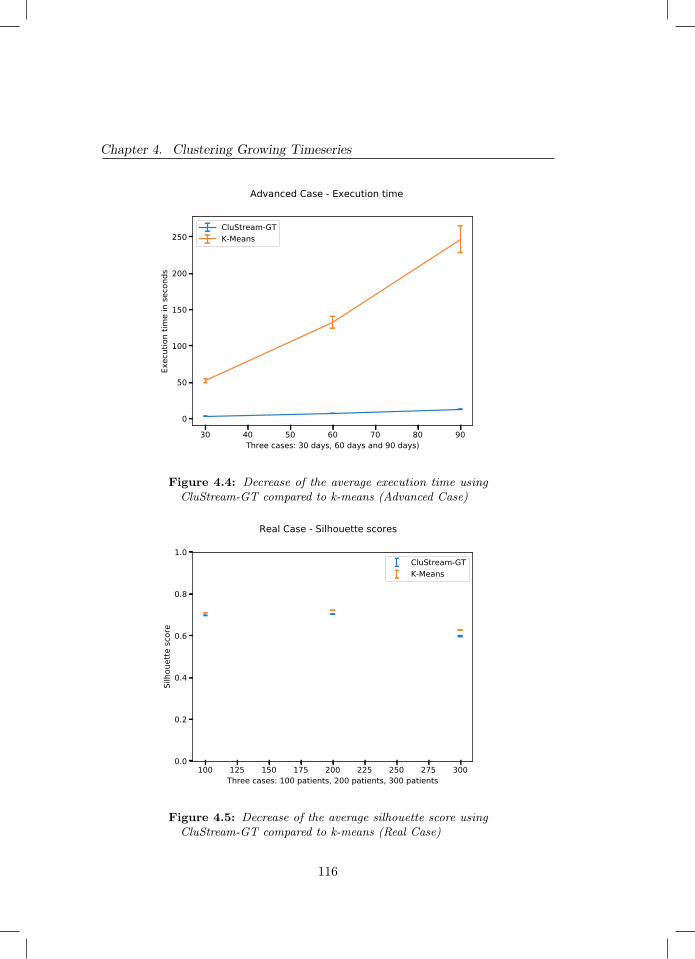
Chapter 4. Clustering Growing Timeseries
30 40 50 60 70 80 90Three cases: 30 days, 60 days and 90 days)
0
50
100
150
200
250
Exec
utio
n tim
e in
seco
nds
CluStream-GTK-Means
Advanced Case - Execution time
Figure 4.4: Decrease of the average execution time usingCluStream-GT compared to k-means (Advanced Case)
100 125 150 175 200 225 250 275 300Three cases: 100 patients, 200 patients, 300 patients
0.0
0.2
0.4
0.6
0.8
1.0
Silh
ouet
te sc
ore
CluStream-GTK-Means
Real Case - Silhouette scores
Figure 4.5: Decrease of the average silhouette score usingCluStream-GT compared to k-means (Real Case)
116
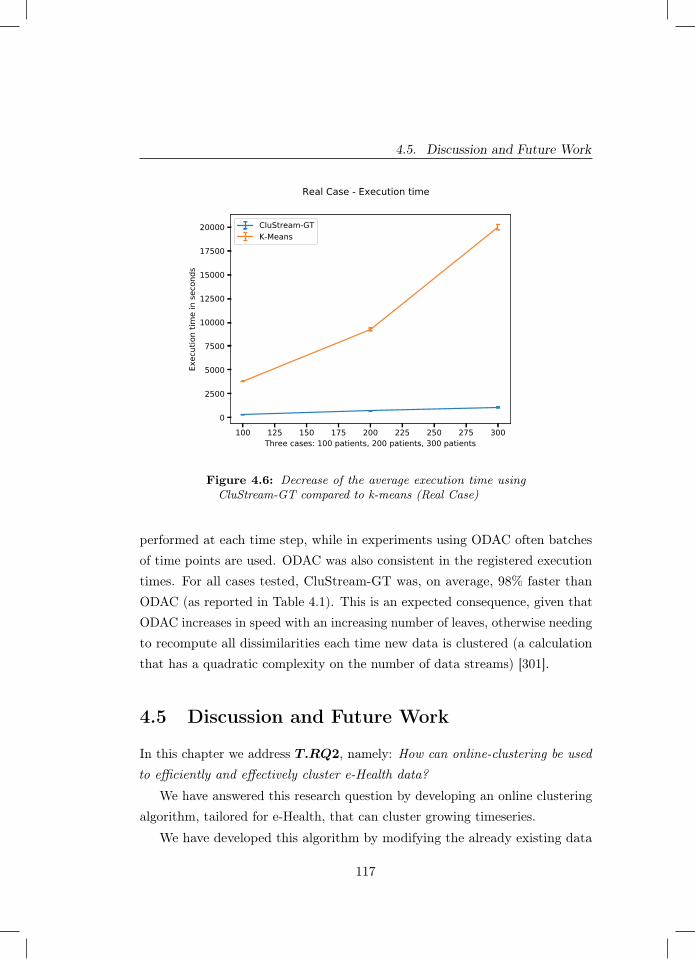
4.5. Discussion and Future Work
100 125 150 175 200 225 250 275 300Three cases: 100 patients, 200 patients, 300 patients
0
2500
5000
7500
10000
12500
15000
17500
20000
Exec
utio
n tim
e in
seco
nds
CluStream-GTK-Means
Real Case - Execution time
Figure 4.6: Decrease of the average execution time usingCluStream-GT compared to k-means (Real Case)
performed at each time step, while in experiments using ODAC often batchesof time points are used. ODAC was also consistent in the registered executiontimes. For all cases tested, CluStream-GT was, on average, 98% faster thanODAC (as reported in Table 4.1). This is an expected consequence, given thatODAC increases in speed with an increasing number of leaves, otherwise needingto recompute all dissimilarities each time new data is clustered (a calculationthat has a quadratic complexity on the number of data streams) [301].
4.5 Discussion and Future Work
In this chapter we address T.RQ2, namely: How can online-clustering be usedto efficiently and effectively cluster e-Health data?
We have answered this research question by developing an online clusteringalgorithm, tailored for e-Health, that can cluster growing timeseries.
We have developed this algorithm by modifying the already existing data
117
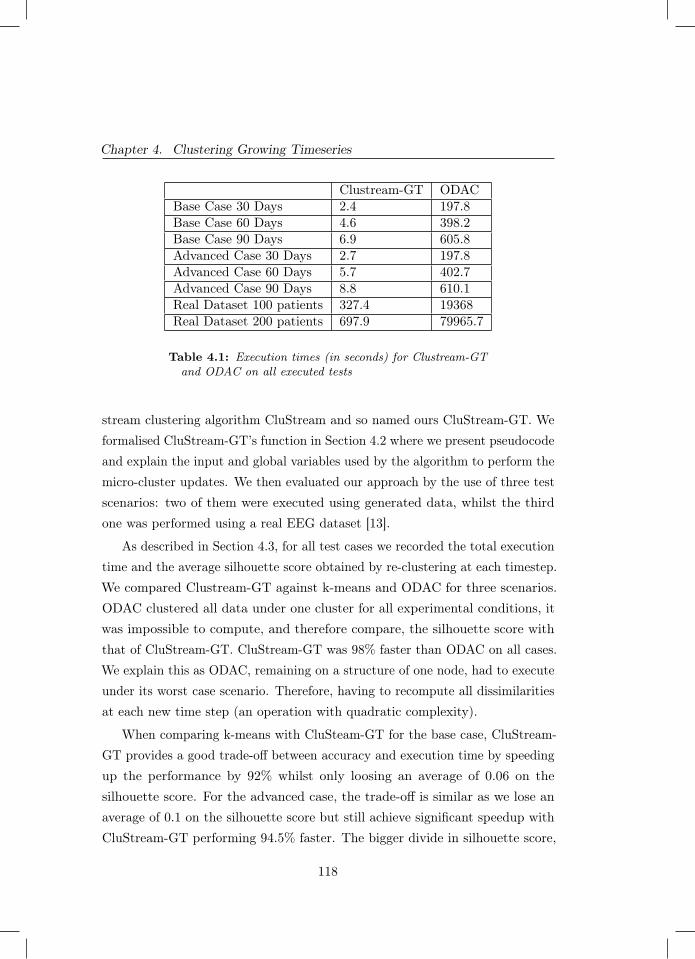
Chapter 4. Clustering Growing Timeseries
Clustream-GT ODACBase Case 30 Days 2.4 197.8Base Case 60 Days 4.6 398.2Base Case 90 Days 6.9 605.8Advanced Case 30 Days 2.7 197.8Advanced Case 60 Days 5.7 402.7Advanced Case 90 Days 8.8 610.1Real Dataset 100 patients 327.4 19368Real Dataset 200 patients 697.9 79965.7
Table 4.1: Execution times (in seconds) for Clustream-GTand ODAC on all executed tests
stream clustering algorithm CluStream and so named ours CluStream-GT. Weformalised CluStream-GT’s function in Section 4.2 where we present pseudocodeand explain the input and global variables used by the algorithm to perform themicro-cluster updates. We then evaluated our approach by the use of three testscenarios: two of them were executed using generated data, whilst the thirdone was performed using a real EEG dataset [13].
As described in Section 4.3, for all test cases we recorded the total executiontime and the average silhouette score obtained by re-clustering at each timestep.We compared Clustream-GT against k-means and ODAC for three scenarios.ODAC clustered all data under one cluster for all experimental conditions, itwas impossible to compute, and therefore compare, the silhouette score withthat of CluStream-GT. CluStream-GT was 98% faster than ODAC on all cases.We explain this as ODAC, remaining on a structure of one node, had to executeunder its worst case scenario. Therefore, having to recompute all dissimilaritiesat each new time step (an operation with quadratic complexity).
When comparing k-means with CluSteam-GT for the base case, CluStream-GT provides a good trade-off between accuracy and execution time by speedingup the performance by 92% whilst only loosing an average of 0.06 on thesilhouette score. For the advanced case, the trade-off is similar as we lose anaverage of 0.1 on the silhouette score but still achieve significant speedup withCluStream-GT performing 94.5% faster. The bigger divide in silhouette score,
118
4.5. Discussion and Future Work
as compared to the base case, can be explained by the increase in noise thatthe advanced case brings to the data due to the chance of timeseries suddenlyswitching behaviour and therefore making the clustering a more challengingtask. This is especially apparent for CluStream-GT since it only uses thedescriptive data contained in the micro-clusters for the formation of the finalmacro-clusters.
Lastly, in the test case performed with the EEG dataset CluStream-GTperformed excellently. The speed-up was of at least 91% with it improvingto 95% with the 300 patients run. This meant that on the machine used fortesting k-means it took a total of 5 and a half hours whilst CluStream-GT onlytook a little more than 17 minutes. This was achieved with an extremely smalltrade-off on the silhouette score, with the worst case being the 300 patients runin which CluStream-GT had on average 0.028 less on the silhouette score.
For future work we would like to augment CluStream-GT with a mechanismto detect poor micro-cluster initialisation at an early stage. Whilst it was not aproblem for the less noisy EEG data, we did record a few outlier cases in someof the runs in the generated data. We therefore aim to create such a mechanismin order to reduce or remove the possibility of such outliers appearing andtherefore increasing the average silhouette score obtained.
Furthermore, as mentioned in Section 4.3 we measure execution time bymeasuring the time difference with the python module Time. Whilst we min-imised the risk of variance with repeated runs and assuring that the machinehad no other processes open apart from our experiment, it would be desirableto repeat the experiments on other machines in order to further validate ourfindings.
Lastly, we have mentioned throughout our work that the execution timegap increases with the size of the data and have explained this phenomenonby CluStream-GT’s use of the micro-clusters and lack of needing to store theentire dataset. However, we have not investigated how much more efficientCluStream-GT can be on storage space. This would be an interesting fact toinvestigate especially for CluStream-GT’s therefore potential use on lower spechardware, such as mobile devices.
119

5Predicting User Engagement
Chapter 5 was published as:
Barbaro, E., Grua, E. M., Malavolta, I., Stercevic, M., Weusthof, E., & van den Hoven, J.(2020). Modelling and predicting User Engagement in mobile applications. Data Science,(Preprint), 1-17.
121
Chapter 5. Predicting User Engagement
Abstract - The mobile ecosystem is dramatically growing towards anunprecedented scale, with an extremely crowded market and fierce competitionamong app developers. Today, keeping users engaged with a mobile app iskey for its success since users can remain active consumers of services and/orproducers of new contents. However, users may abandon a mobile app atany time due to various reasons, e.g., the success of competing apps, decreaseof interest in the provided services, etc. In this context, predicting when auser may get disengaged from an app is an invaluable resource for developers,creating the opportunity to apply intervention strategies aiming at recoveringfrom disengagement (e.g., sending push notifications with new contents).
The goal of this chapter is to answer T.RQ3, namely: How can we predictuser engagement in apps? To achieve our answer we propose, apply, and evaluatea framework to model and predict User Engagement (UE) in mobile applicationsvia different numerical models. The proposed framework is composed of anoptimised agglomerative hierarchical clustering model coupled to (i) a Coxproportional hazards, (ii) a negative binomial, (iii) a random forest, and (iv) aboosted-tree model.
The proposed framework is empirically validated by means of a year-longobservational dataset collected from a real deployment of a waste recycling app.Our results show that in this context the optimised clustering model classifiesusers adequately and improves UE predictability for all numerical models. Also,the highest levels of prediction accuracy and robustness are obtained by applyingeither the random forest classifier or the boosted-tree algorithm.
5.1 Introduction
Mobile applications (hereinafter “apps”) dominate the digital world today, reach-ing incredible numbers and showing no signs of slowing down its market growthanytime soon [195]. For example, as of March 2018, there are more than 3.3million Android applications available [328], with more than one thousand appsbeing published everyday [195]. Mobile apps are not only being published inlarge numbers, but are also being consumed by users in large numbers, with
122
5.1. Introduction
more than 1.5 billion downloads from Google Play Store every month [12]. Amedium of such a large scale leads to a crowded market with strong competition.Under this perspective, mobile app developers must keep their users active overa sufficiently long period of time to be considered successful. Recognising andunderstanding user motivations are key to leading to a greater app usage [178].To date, despite significant efforts, over 95% of smartphone owners stop usingan app by the end of the third month of download [288]. In other words, the ma-jority of mobile solutions fail to achieve long-term usage. This can be explainedby a variety of reasons, such as lack of personalisation, user context, and finallyfailure to seamlessly integrate with other apps or technologies [363; 340; 323].
A high disengagement rate is obviously non desirable to app developers,whose success depends on the usage of their app. Furthermore, it is also aproblem for researchers and other professionals who use apps to provide servicesaimed at improving the user’s quality of life. For example, waste recycling hasbeen shown to be a positive practice for improving sustainability and diminishingcarbon emissions [237; 186]. Waste recycling apps can be used as an effectivetool to help users engage in recycling [40]. They can achieve this with game-likefeatures that remind and reward the user for consistently recycling. However,for the app to succeed, it must be regularly utilised by the user. Hence, as acrucial quality, it must be engaging. Crafting personal “smart interactions” isan effective way to ensure that users remain active, on-line, and motivated [53].Furthermore, tailored interactions aim to maintain, encourage and ultimatelyincrease app usage over time. Take people tracking as an example: mobilelocation tracking has to be used on a opt-in basis, due to privacy issues [322].However, once a device is being tracked, apps may send out alerts when thetracking is turned off aiming to prevent the user to go off-line. The natureof these interactions may vary wildly, since it is likely that users react verydifferently to such interventions [18].
In the context of this study, UE can be intuitively defined as the assessmentof the response of the user to some type of activity or service provided bythe mobile app. For example, in social networking apps (e.g., Facebook orTwitter) UE is about user’s posts, comments, and interaction with other users;
123
Chapter 5. Predicting User Engagement
differently, in shopping apps (e.g., Amazon or Wish) UE is about the productsbeing purchased, being listed, saved for later purchases, and so on.
Despite there being a good understanding of what is UE in different domainsand which factors contribute to it, there seems to be a lack of literature onwhether it is possible to predict UE in mobile apps and how different methodsperform.
In this study, we provide evidence that it is possible to predict theengagement of mobile app users with good levels of accuracy. Weachieve this result by characterising and evaluating a framework for predictinguser engagement of mobile apps. The framework is based on the applicationof different types of numerical models, i.e., survival, counts, and classification.The numerical models take as input a minimal set of information about theuser, which are relatively straightforward to collect at run-time, e.g., thecurrent point balance of the user (assuming the app is employing a potentiallyimplicit gamification mechanism), the time of the last interaction with theapp, geographic position, etc. In this study, we explore four different types ofnumerical models, namely: (i) survival analysis, (ii) negative binomial regression,(iii) random forest, and (iv) gradient-boosted trees. In order to complete ourapproach, one of the most important steps to achieve better predictions is togroup users based on their past behaviour [208]. In that way, it is possible toseparate - or “cluster” - users based on how (often) they interact with the mobileapp. Therefore, we also incorporate a clustering algorithm to our proposedframework, aiming at targeting user interactions more accurately by means ofdrawing similarities between users [208].
We empirically evaluate the performance of our proposed numerical frame-work in predicting UE on an industrial dataset, which has been built in thecontext of a real mobile app in the area of waste recycling. The dataset iscomposed of approximately 27,000 entries distributed over 1,500 unique users.
Summarising, the main contributions of this study are:
− a reusable framework for modelling and predicting UE in mobile apps;
− a characterisation of UE by means of 4 different types of numerical models;
124
5.2. Background
− the empirical evaluation of the prediction accuracy of the 4 different typesof numerical models in the context of a waste recycling mobile app.
The contributions above benefit both mobile apps developers and researchers.Developers can re-use the proposed framework for accurately predicting theengagement of their users at run-time and counteract it in a timely fashion(e.g., by sending a push notification for triggering new conversions) - see [319],and (ii) learn from the evaluated numerical models which one is better suitedfor their own mobile app. We support researchers since we (i) provide evidenceabout how various numerical models can accurately estimate UE in mobile appsand (ii) provide a framework for modelling and predicting UE, which can befurther extended or used in other scientific studies.
It is important to note that the the aim of this study is not to providea general solution for predicting UE for all mobile apps, instead we aim atproviding (i) evidence that it is possible to predict UE with good levels ofaccuracy and (ii) a flexible framework for modelling and predicting UE inmobile apps which can be re-used by both researchers and practitioners inother projects, provided that it will be customised according to the app underconsideration, its usage scenarios, and the available data.
The remainder of this chapter is organised as follows. Section 5.2 presentsthe fundamental background needed throughout this research. Section 5.3presents the modelling framework, whereas the results of the evaluation of theprediction accuracy of the modelling framework are reported in Section 5.4.Finally, Section 5.5 discusses and puts into context the obtained results andSection 5.6 closes the chapter.
5.2 Background
In this section we provide background information about the definition of userengagement in the context of mobile apps (Section 5.2.1) and present the wasterecycling app dataset (Section 5.2.2).
125
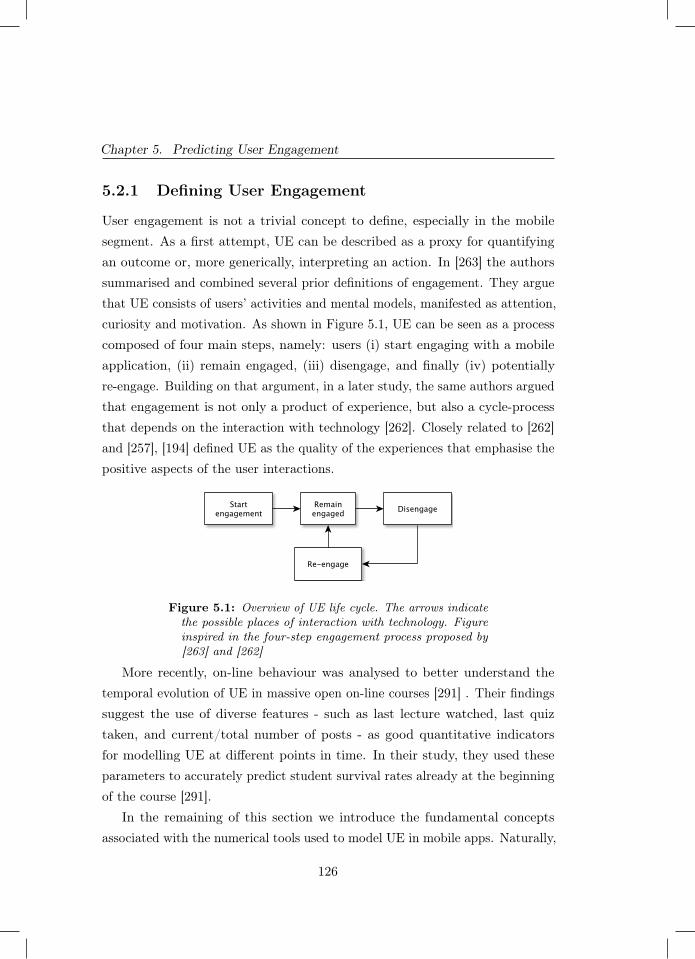
Chapter 5. Predicting User Engagement
5.2.1 Defining User Engagement
User engagement is not a trivial concept to define, especially in the mobilesegment. As a first attempt, UE can be described as a proxy for quantifyingan outcome or, more generically, interpreting an action. In [263] the authorssummarised and combined several prior definitions of engagement. They arguethat UE consists of users’ activities and mental models, manifested as attention,curiosity and motivation. As shown in Figure 5.1, UE can be seen as a processcomposed of four main steps, namely: users (i) start engaging with a mobileapplication, (ii) remain engaged, (iii) disengage, and finally (iv) potentiallyre-engage. Building on that argument, in a later study, the same authors arguedthat engagement is not only a product of experience, but also a cycle-processthat depends on the interaction with technology [262]. Closely related to [262]and [257], [194] defined UE as the quality of the experiences that emphasise thepositive aspects of the user interactions.
Figure 5.1: Overview of UE life cycle. The arrows indicatethe possible places of interaction with technology. Figureinspired in the four-step engagement process proposed by[263] and [262]
More recently, on-line behaviour was analysed to better understand thetemporal evolution of UE in massive open on-line courses [291] . Their findingssuggest the use of diverse features - such as last lecture watched, last quiztaken, and current/total number of posts - as good quantitative indicatorsfor modelling UE at different points in time. In their study, they used theseparameters to accurately predict student survival rates already at the beginningof the course [291].
In the remaining of this section we introduce the fundamental conceptsassociated with the numerical tools used to model UE in mobile apps. Naturally,
126
5.2. Background
the first point to address here is to properly classify if a customer is engaged ornot at the present time. Different definitions can be used - or combined - toaddress that. Here, we discuss:
− The application is still installed on their phone after a certain number ofdays;
− The number of user activities is bigger than a given threshold;
− The frequency of user activities is higher than a given threshold.
One of the simplest definitions available is called User Engagement Index(UEI). The UEI compares the time of inactivity with the time the customerhas been engaged. Mathematically it reads:
UEI =LastEvent− FirstEvent
Today − FirstEvent, (5.1)
where all the terms on the right-hand side are dates. We see in Equation 5.1the ratio of the time difference between both last event and present time to thetime of the first interaction. If UEI > 0.5 (where 0.5 is a threshold defined apriori) the user is considered engaged today.
Another possible way to determine UE is by defining a threshold on therecency (R). This threshold has to be calculated to determine if the timebetween actions is (long)short enough for the user to be considered (dis)engaged.Recency is trivially defined in Equation 5.2:
R = ∆t, (5.2)
where ∆t is the time past between one action and its subsequent action. Indoing so, user engagement based on recency (UER) can be calculated for everyinteraction, and not only for the last one as in UEI .
We base the choice of threshold to determine UER on the statistical distri-bution of R. The threshold is set as being at the edge of one standard deviationfrom the average recency. By doing so, we ensure that to be considered disen-gaged the user’s recency has to be less than around 32% of our entire sample
127

Chapter 5. Predicting User Engagement
recency. That is a compromise between allowing for later re-engagement (bynot tackling only users at the very end of the distribution, i.e. almost totallydisengaged) and not sending too re-engagement messages to still engaged users(users close to the centre of the distribution). Similarly to UER, we explore thefact that user engagement can also be defined by setting a threshold on thetotal number of actions (AT ) a user performed within a given time frame.Mathematically, it reads:
AT =
tN∑t0
A(t), (5.3)
where t0 and tN are respectively the initial and final times of the counting.Every user surpassing a given threshold can be considered engaged.
5.2.2 The Waste Recycling App Dataset
In this study, we use a dataset from a mobile app that promotes waste recycling.The app grants points every time an event is performed by the user, e.g.,disposing trash in their selected bins, reading educational material, or invitingfriends to join the app. These points can then be redeemed for rewards atselected partners, such as savings on local shops or discounts on sustainablegoods. Extending the framework described in [252] for tablets, we argue thatthe app needs to be designed and optimised having in mind that the user ismost likely on their mobile phone either redeeming points at a shop or collectingpoints at the recycle bin. That is fundamental to create an intuitive interfacethat facilitates these activities and promotes engagement.
The dataset contains approximately 27,000 entries distributed over 1500unique users and 122 variables. The data was collected between April 2015 andJanuary 2016. Each entry of the dataset contains the following 6 features:
1. the current point balance of the user,
2. the time of the user’s last event within the app,
3. the number of days since the last event,
128
5.2. Background
4. the current weekday,
5. the current ZIP code,
6. the current geographical position of the user in terms of latitude andlongitude.
We expand each of the 27,000 entries of the dataset to contain 122 uniquevariables in total. We achieve that by first generating combinations of thesevariables, e.g. number of days since the first event during weekdays or time ofthe user’s last event within the app during a weekday/weekend. We then proceedto calculate the following statistics (max/min/mean/med/sum/sd) for all of thevariables. That allows for more feature creation, e.g. standard deviation of thenumber of days since the first event during weekdays. We calculate the mostsimple statistics such as mean of the current point balance or minimum numberof days since last event, but also combinations of variables with statistics - suchas median of the minutes since last event per user in a certain zip code, or thestandard deviation of the number of days since the first event during weekdays.Note that geographical position provides more detailed information than justzip-code, given that there may be more than one recycle bin in a given area.
Figure 5.2 shows the strategy that we follow for splitting the dataset intofour main subsets, namely: training, test, cross-validation, and validation sets[102].
Specifically, a fraction of the dataset (60%) is used to train our models andthe remaining data to test (20%) and cross-validate (20%) their performance.The last three parts (observation 1,2,3) are the validation sets. They also startat the beginning of the dataset (April, 24) and continue after the end of thetraining period - as shown in Figure 5.21. It is important to mention thatthe validation sets only contain users that remained active, or started newinteractions after the training period. Those are depicted in red in Figure 5.2.We highlight that this setup is general/flexible enough to be used by all ournumerical models.1 For simplicity, we extrapolate the use of the term training period to indicate the periodbetween April 24 and Dec 1, 2015.
129
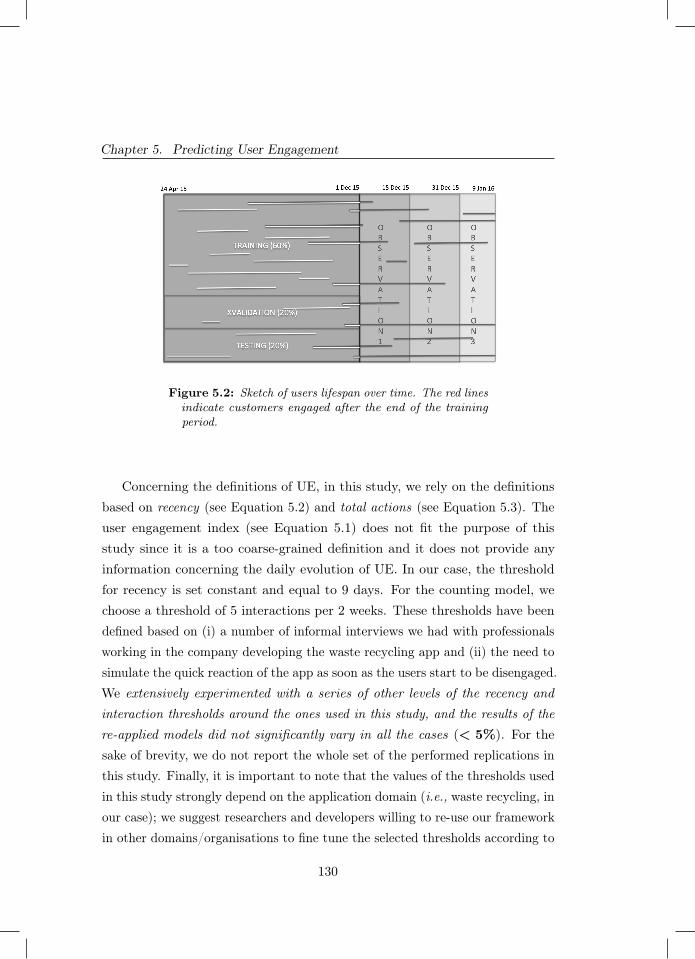
Chapter 5. Predicting User Engagement
Figure 5.2: Sketch of users lifespan over time. The red linesindicate customers engaged after the end of the trainingperiod.
Concerning the definitions of UE, in this study, we rely on the definitionsbased on recency (see Equation 5.2) and total actions (see Equation 5.3). Theuser engagement index (see Equation 5.1) does not fit the purpose of thisstudy since it is a too coarse-grained definition and it does not provide anyinformation concerning the daily evolution of UE. In our case, the thresholdfor recency is set constant and equal to 9 days. For the counting model, wechoose a threshold of 5 interactions per 2 weeks. These thresholds have beendefined based on (i) a number of informal interviews we had with professionalsworking in the company developing the waste recycling app and (ii) the need tosimulate the quick reaction of the app as soon as the users start to be disengaged.We extensively experimented with a series of other levels of the recency andinteraction thresholds around the ones used in this study, and the results of there-applied models did not significantly vary in all the cases (< 5%). For thesake of brevity, we do not report the whole set of the performed replications inthis study. Finally, it is important to note that the values of the thresholds usedin this study strongly depend on the application domain (i.e., waste recycling, inour case); we suggest researchers and developers willing to re-use our frameworkin other domains/organisations to fine tune the selected thresholds according to
130
5.3. Modelling User Engagement of Mobile Apps
the specific characteristics of the app under consideration and its typical usagescenarios (e.g., social media users may be considered disengaged much earlierthan after 9 days of total inactivity). In addition to that, note the modellingresults - especially the quantitative component - discussed here remain specificfor this dataset. Hence, it should not be directly transferred to other applicationdomains. Instead, the main contribution of this chapter lies on the fact that weshow, by means of different types of algorithms, that it is possible to accuratelypredict user engagement as well as a reusable framework that can be used tobetter understand UE in mobile apps.
5.3 Modelling User Engagement of Mobile Apps
In this Section, we detail our modelling strategy and explain the multiple stepsand assumptions we make to predict UE or counts (actions) until disengagement.Here, despite the numerical model we choose, the first step is to describe theprocess of assigning our users to different groups, the so-called clustering process.In doing so, we are firstly grouping similar users together in order to reduceuncertainties and improve the predictability of our numerical models [208].
5.3.1 The clustering model
In this study, we use a modified Agglomerative Hierarchical Clustering (AHC)model [91]. That means, we assign each data point to one exclusive cluster, andthen combine the two clusters that are closest to each other. This process isrepeated until there is only one cluster left - containing all the observations.We utilise average linkage to perform the clustering, i.e., the average distancebetween each point in one cluster to every point in the other cluster. We use theso-called Pearson-γ correlation as our criterion to select an appropriate numberof clusters [8; 152]. This metric looks at the correlation of all the distancesbetween data points and a binary matrix, that is equal to zero for every pair ofobservations in the same cluster and equal to 1 in case points are in differentclusters.
131
Chapter 5. Predicting User Engagement
Hierarchical clustering methods require a distance metric to define similaritybetween two observations. Here, we implement the so-called Gower’s metric [139]with optimal weights, as proposed in [358]. This metric allows for the calculationof the dissimilarity between rows of our dataset for nominal, binary, and ordinalvariables. The optimization is done with the intent to maximise the copheneticcorrelation coefficient (CPCC), see [308]. The CPCC is the correlation betweenthe distance matrix used for the clustering and the cophenetic distance matrixof the resulting hierarchical clustering. This cophenetic distance matrix iscalculated as the distance at which two observations are combined into onecluster.
The optimisation of the CPCC is done through the use of the L-BFGS-Bmethod (Limited-memory Broyden-Fletcher-Goldfarb-Shanno algorithm withBounds), a Quasi-Newton algorithm which uses the first order derivative of agiven function and an approximation of its second-order derivative to obtain theextrema of the given function (non-linear optimisation) - see [261]. We applythis method to iteratively search for an optimal set of weights to Gower’s metricto optimise the CPCC of the resulting agglomerative hierarchical clustering.The bounds of the L-BGFS-B method are set to [0,1] to ensure no weight isnegative. Next to that, we also use an approximation of the analytical derivativeof the CPCC with respect to the weights to ensure we do not have to use finitedifferences for the L-BFGS-B method, hence significantly reducing computationtime [358].
As the last part for the configuration of our clustering, we choose whichvariables we consider to be used for clustering. The variables we pick determinewhat our clusters represent. As an initial set of variables for our clusteringalgorithm, we choose all 122 variables mentioned above. In this context, ourclusters represent different characteristics of the users and their behaviour,ranging from regional data to frequency of use and point collection. Users inthe same cluster are thus expected to be more similar when it comes to appbehaviour and geographical location compared to those in other clusters. Hence,these clusters capture useful information for our different user engagementmodels to use in their predictions.
132
5.3. Modelling User Engagement of Mobile Apps
With our users set to a particular cluster, we use these results as a predictorof UE improving modelling results [358]. In the next subsections, we explainthe numerical models we use to predict UE for every user. We detail the threedifferent model types - survival, counts, and classification - to evaluate thepotential of each approach and the validity of their assumptions.
5.3.2 The Cox proportional hazards model
In this subsection, we explore the Cox Proportional Hazards model [82]. TheCox Proportional Hazards (CPH) model is a very popular regression model thatcalculates survival times based on the effect of selected predictors. It becomesespecially useful here since our predictors are (highly) non-linearly related andwe may not know their distributions beforehand. Another advantage of theCPH model is the fact that it is able to handle missing observations, i.e. sparseuser interactions. The CPH model only requires as independent parameters(i) the time of the analysis and (ii) the engagement status. In our case, thestatus indicates if disengagement happened or not at any particular time. Withthese two parameters, we estimate two functions called conditional survivaland baseline hazard. The former provides the probability of not experiencingdisengagement while the latter gives the probability that disengagement willoccur up to a given time - see [83]. In our context, the term proportionalhazard indicates that the hazard ratio comparing two observations is constant inbetween events. Furthermore, the impact of the different factors on the hazardremains constant over time [33]. We use a threshold equal to 0.5 to determineengagement/disengagement and follow [150] to ensure monotonic ReceiverOperating Characteristic (ROC) curves by means of the nearest neighbourmethod.
5.3.3 The negative binomial model
Here, we describe a regression model with count data (negative binomial model).This approach is interesting because, in contrast to the CPH model, it allowsus to model re-engagement. Here, rather than the time of disengagement, we
133
Chapter 5. Predicting User Engagement
aim to predict the total number of actions before disengagement. The ideais to target smart interactions aiming to keep the user engaged if the actualcounts fall too close from the prediction of disengagement. Briefly, the negativebinomial (NB) distribution is the distribution of the number of trials (actions)needed to get a fixed number of failures (in our case disengagement) - see[205]. This distribution describes the probabilities of the occurrence of integersgreater than or equal to 0. By analysing the distribution function, we can seta threshold on the probability of disengagement and extract the number ofcounts before disengagement. NB is specially suitable to model over-dispersedcount variables. This specific regression method is implemented by fitting ageneralised linear model using a boosting algorithm based on component-wiseunivariate linear models - see [52; 50], and [51]. In each boosting iteration, asimple linear model is fitted (without intercept) to the negative gradient vectorand in the update step only the best-fitting linear model is used. This machinelearning method optimises prediction accuracy and carries out variable selection.In our case, we perform 500 non-centered boosting iterations with a step lengthequal to 0.05.
5.3.4 The random forest model
The RF model [43] basically creates many random independent subsets of thedataset containing features and a training class. In our case, the features are theinformation about the user, e.g. number of interactions and type of interaction,and the class is simply a flag indicating engaged or disengaged at that particularmoment. These subsets are used to create a ranking of classifiers. It is importantto state that RF models are typically accurate and computationally efficient.The randomness component ensures the RF model to generalise well, and to beless likely to overfit [201].
In contrast to the other approaches, the RF model is not predicting days(CPH) or counting actions to disengagement (NB). Here, based on past be-haviour, we use the RF algorithm as a classifier (engaged/disengaged) at themoment. That means, we obtain as outcome a probability value ranging between
134
5.3. Modelling User Engagement of Mobile Apps
0 and 1. With that in hand, we define a cutoff threshold to determine if theuser is engaged or disengaged. For our dataset, the cutoff threshold is chosenas equal to 0.42 as it maximises the F1 score [138].
Interestingly, the RF classification has a predictive component. This isbecause the RF model simulates UER. As shown in Section 5.2.2, this metric isdefined as the difference in days between an action now and in the next 9 days.Due to that, we assume that our results are “valid” not only at the moment butwithin the recency threshold as well. Note that this links the validity of the RFmodel to the recency threshold. This further motivates the choice of a shortrecency time, just enough to allow the app developer to send re-engagementnotifications and monitor their effectiveness.
To build this random forest model, we use 1000 non-stratified trees withreplacement (to decrease variance without increasing bias). The number ofvariables randomly sampled as candidates at each split equal to 10. We usea 10-fold cross validation with 5 repeats to augment model accuracy withoutincreasing bias. The cross validation involves splitting our dataset into 10
subsets. Each subset is then put apart and the model is trained on the leftoversubsets. The overall accuracy of our model is then determined after averagingthe results obtained with the 5 individual repeats.
5.3.5 The XGBoost Model
The last approach used to predict UE takes advantage of boosted-trees al-gorithms. XGBoost is a very popular and scalable end-to-end tree-boostingsystem [67] currently applied to several different fields of knowledge, such asPhysics, stock market prediction, biology and language networks, among others[68; 100; 350; 64]. In a nutshell, this classifier constructs trees to make thepredictions, but unlike RF, where every tree provides a definite answer andthe final result is obtained by a voting process (i.e., bagging), every tree inXGBoost contains a continuous score, which are combined to provide an answer(i.e., boosting). Despite differences with the RF algorithm, the implementationand the use of XGBoost, however, is done very similarly. We utilise the same
135
Chapter 5. Predicting User Engagement
features to train the model and the output is also a probability percentageindicating whether the user is disengaged at the moment. We use a smalllearning rate equal to 0.001 to ensure convergence and error minimisation. Themaximum depth of each tree is capped at 15 and the maximum number of treesis fixed at 1000 (similar to RF).
5.4 Evaluation of Predicting User Engagement
of Mobile Apps
In this section we report on the empirical evaluation of the proposed modellingframework in the context of a waste recycling mobile app. Specifically, we aimat answering the following research questions:
− RQ1 – To what extent using a clustering algorithm impacts the accuracyof UE prediction?
− RQ2 – Which types of numerical models provide the most accurate UEprediction?
· RQ2.1 – What is the prediction accuracy of the Cox proportionalhazards model?
· RQ2.2 – What is the prediction accuracy of the negative binomialmodel?
· RQ2.3 – What is the prediction accuracy of the random forest model?
· RQ2.4 – What is the prediction accuracy of the XGBoost model?
We begin by showing the performance of our AHC algorithm followed bythe predictions of UE for our other numerical models. We highlight that adirect comparison between numerical models is not always possible due to theirdifferent natures - classification and regression. Thus, we aim to characterise andevaluate them mostly individually. When possible, we try to place our resultsin a broader perspective. To keep to the brief character of this manuscript wesummarise our model results in terms of ROC curves [110]. These are plots
136
5.4. Evaluation of Predicting User Engagement of Mobile Apps
that illustrate the performance of a binary classifier, outlining their overallperformance. The true positives are defined as the engaged users who werecorrectly classified as engaged by our model. False negatives represent theengaged users incorrectly classified as disengaged. The area under the ROCcurve (AUC) represents the model accuracy, where unity means a perfect modeland 0.5 indicates a random result. We use the ROC curve as our performanceindicator - similarly to [257] - because it evaluates the performance of the modelsacross all possible thresholds. In addition, AUC delivers a result comparableacross all our model approaches and is threshold independent. This is importantin our case since the impact of a false positive vs false negative is comparable.
5.4.1 Impact of the clustering model (RQ1)
Implementing the weight-optimised Gower’s metric - as described by [358] -augments the CPCC by around 15% (from 0.84 to 0.97) if compared with thecase where all weights are set to unity. We calculate the Pearson-γ correlationfor our dataset to further investigate the benefits of our optimised clusteringmethodology. The results are shown in Figure 5.3.
Implementing the optimised weights for Gower’s metric increases the Pearson-γ correlation by around 11%. That, together with the 15% improvement in theCPCC, indicates that our methodology to optimise weight works significantlybetter than the standard procedure. We note a slight decrease in the Pearson-γcorrelation for the AHC optimised results at 4 clusters followed by a sharpdecrease at 13 clusters. From the 13 clusters with a high Pearson-γ correlation,4 main clusters contain around 98% of the total amount of unique users.Nevertheless, we include all 13 clusters in our analysis to ensure that theseoutliers do not influence these main 4 clusters.
5.4.2 Prediction accuracy of the Cox proportional haz-ards model (RQ2.1)
In Figure 5.4 we show our results for the CPH model. We do so, by means of aROC plot for four different time spans within the testing set.
137
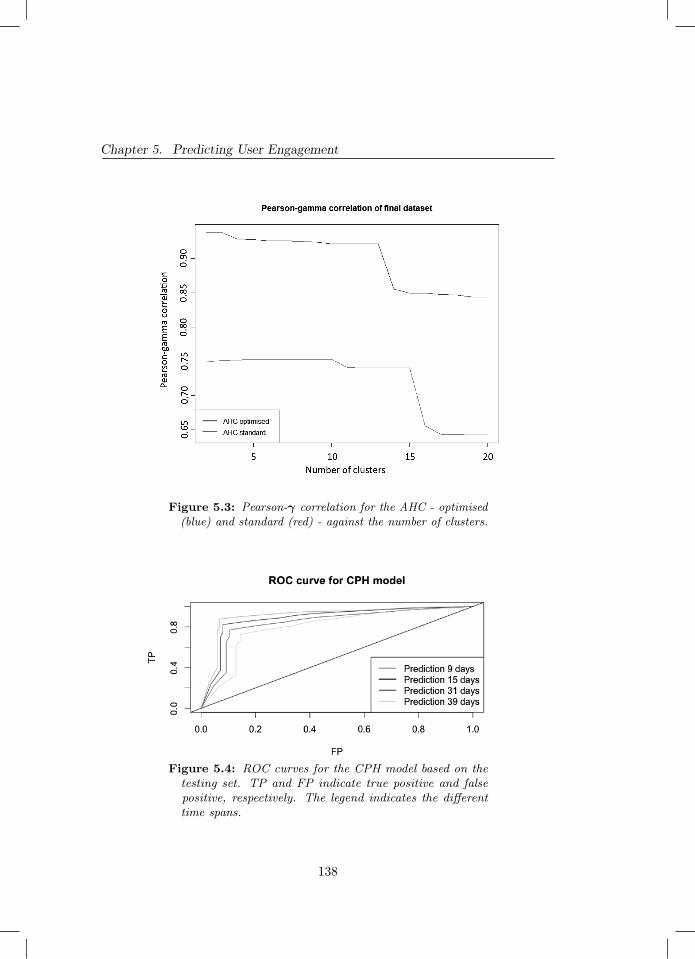
Chapter 5. Predicting User Engagement
Figure 5.3: Pearson-γ correlation for the AHC - optimised(blue) and standard (red) - against the number of clusters.
Figure 5.4: ROC curves for the CPH model based on thetesting set. TP and FP indicate true positive and falsepositive, respectively. The legend indicates the differenttime spans.
138
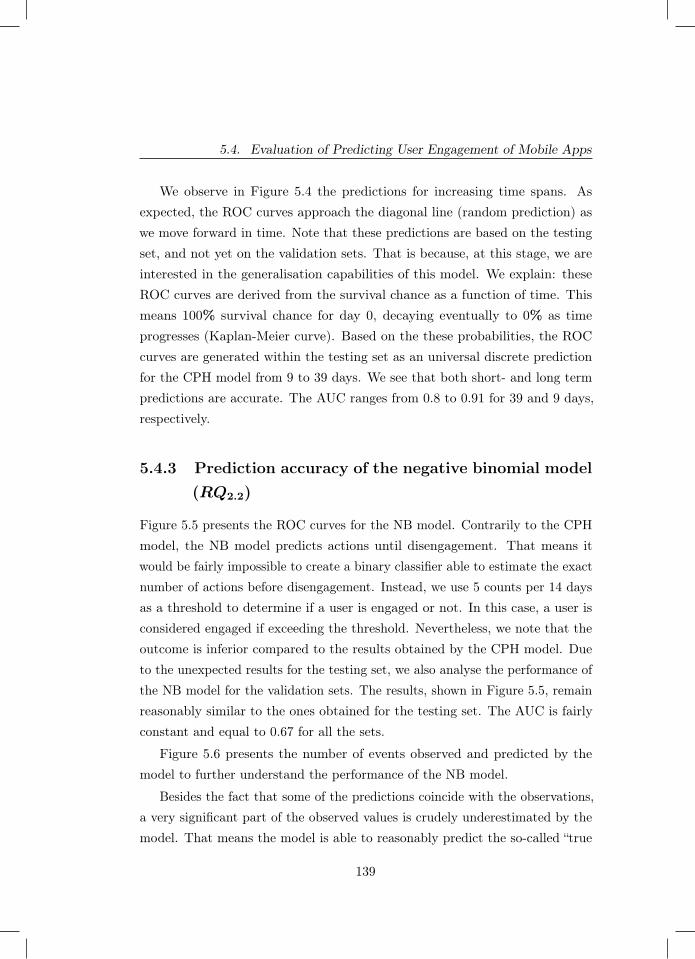
5.4. Evaluation of Predicting User Engagement of Mobile Apps
We observe in Figure 5.4 the predictions for increasing time spans. Asexpected, the ROC curves approach the diagonal line (random prediction) aswe move forward in time. Note that these predictions are based on the testingset, and not yet on the validation sets. That is because, at this stage, we areinterested in the generalisation capabilities of this model. We explain: theseROC curves are derived from the survival chance as a function of time. Thismeans 100% survival chance for day 0, decaying eventually to 0% as timeprogresses (Kaplan-Meier curve). Based on the these probabilities, the ROCcurves are generated within the testing set as an universal discrete predictionfor the CPH model from 9 to 39 days. We see that both short- and long termpredictions are accurate. The AUC ranges from 0.8 to 0.91 for 39 and 9 days,respectively.
5.4.3 Prediction accuracy of the negative binomial model(RQ2.2)
Figure 5.5 presents the ROC curves for the NB model. Contrarily to the CPHmodel, the NB model predicts actions until disengagement. That means itwould be fairly impossible to create a binary classifier able to estimate the exactnumber of actions before disengagement. Instead, we use 5 counts per 14 daysas a threshold to determine if a user is engaged or not. In this case, a user isconsidered engaged if exceeding the threshold. Nevertheless, we note that theoutcome is inferior compared to the results obtained by the CPH model. Dueto the unexpected results for the testing set, we also analyse the performance ofthe NB model for the validation sets. The results, shown in Figure 5.5, remainreasonably similar to the ones obtained for the testing set. The AUC is fairlyconstant and equal to 0.67 for all the sets.
Figure 5.6 presents the number of events observed and predicted by themodel to further understand the performance of the NB model.
Besides the fact that some of the predictions coincide with the observations,a very significant part of the observed values is crudely underestimated by themodel. That means the model is able to reasonably predict the so-called “true
139
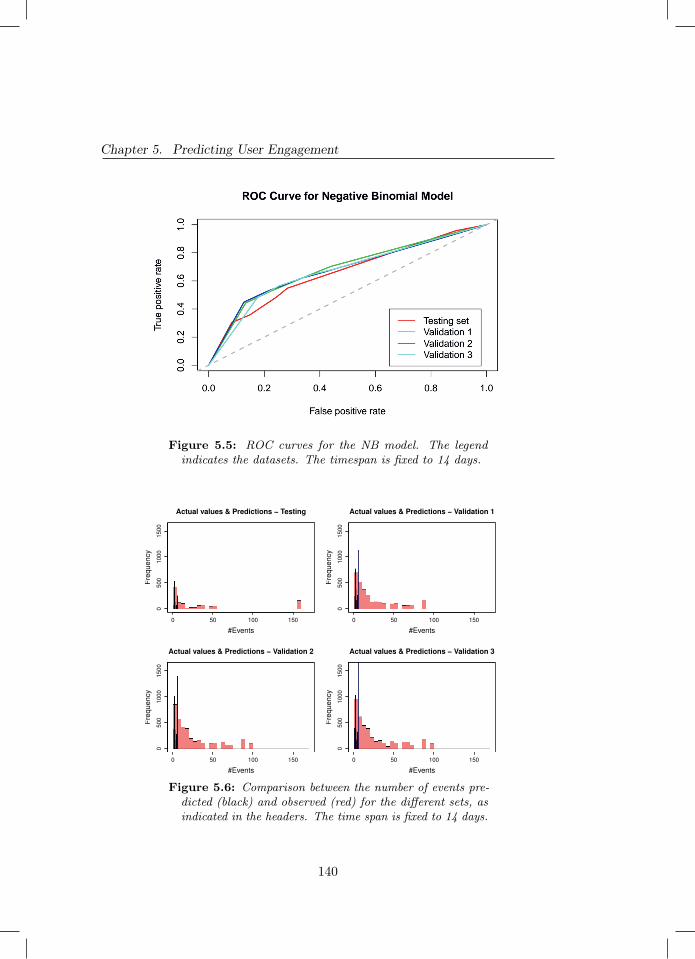
Chapter 5. Predicting User Engagement
Figure 5.5: ROC curves for the NB model. The legendindicates the datasets. The timespan is fixed to 14 days.
Actual values & Predictions − Testing
#Events
Fre
quency
0 50 100 150
0500
1000
1500
Actual values & Predictions − Validation 1
#Events
Fre
quency
0 50 100 150
0500
1000
1500
Actual values & Predictions − Validation 2
#Events
Fre
quency
0 50 100 150
0500
1000
1500
Actual values & Predictions − Validation 3
#Events
Fre
quency
0 50 100 150
0500
1000
1500
Figure 5.6: Comparison between the number of events pre-dicted (black) and observed (red) for the different sets, asindicated in the headers. The time span is fixed to 14 days.
140
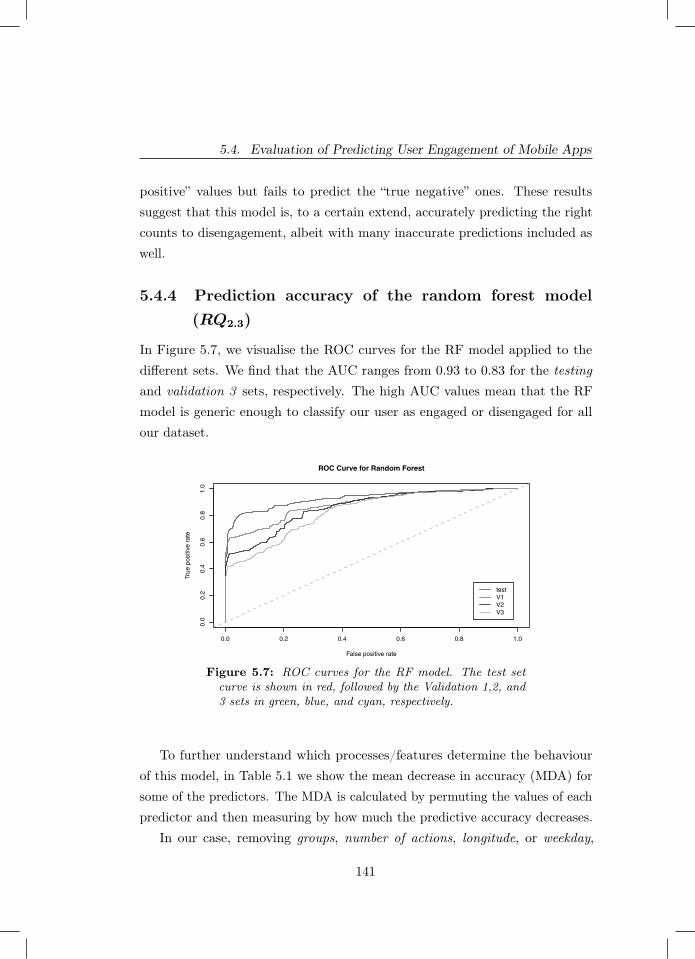
5.4. Evaluation of Predicting User Engagement of Mobile Apps
positive” values but fails to predict the “true negative” ones. These resultssuggest that this model is, to a certain extend, accurately predicting the rightcounts to disengagement, albeit with many inaccurate predictions included aswell.
5.4.4 Prediction accuracy of the random forest model(RQ2.3)
In Figure 5.7, we visualise the ROC curves for the RF model applied to thedifferent sets. We find that the AUC ranges from 0.93 to 0.83 for the testingand validation 3 sets, respectively. The high AUC values mean that the RFmodel is generic enough to classify our user as engaged or disengaged for allour dataset.
ROC Curve for Random Forest
False positive rate
True
pos
itive
rat
e
0.0 0.2 0.4 0.6 0.8 1.0
0.0
0.2
0.4
0.6
0.8
1.0
test V1V2V3
Figure 5.7: ROC curves for the RF model. The test setcurve is shown in red, followed by the Validation 1,2, and3 sets in green, blue, and cyan, respectively.
To further understand which processes/features determine the behaviourof this model, in Table 5.1 we show the mean decrease in accuracy (MDA) forsome of the predictors. The MDA is calculated by permuting the values of eachpredictor and then measuring by how much the predictive accuracy decreases.
In our case, removing groups, number of actions, longitude, or weekday,
141
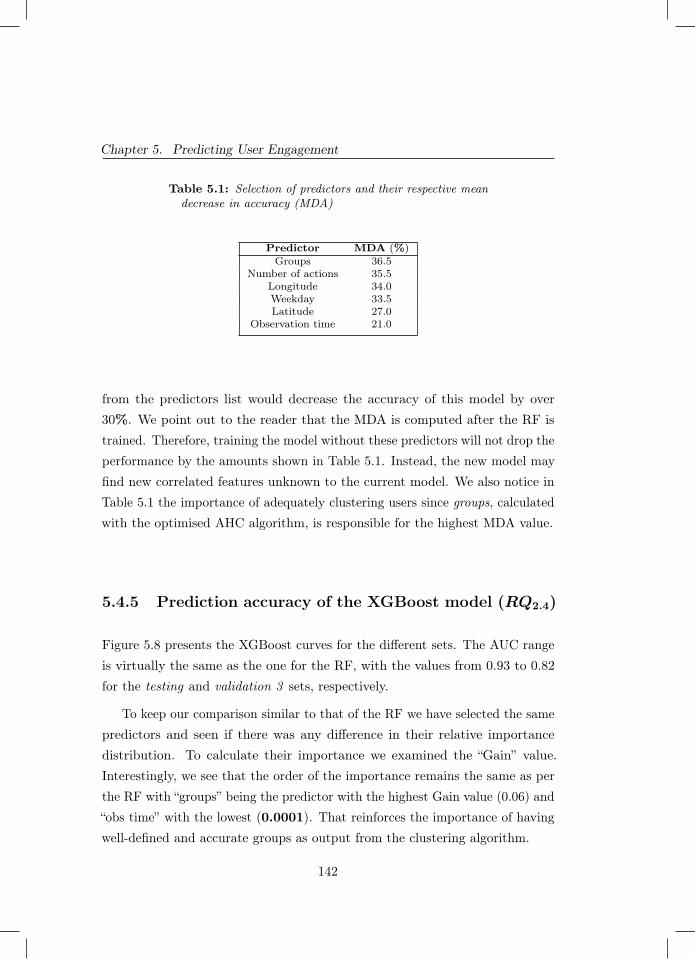
Chapter 5. Predicting User Engagement
Table 5.1: Selection of predictors and their respective meandecrease in accuracy (MDA)
Predictor MDA (%)Groups 36.5
Number of actions 35.5Longitude 34.0Weekday 33.5Latitude 27.0
Observation time 21.0
from the predictors list would decrease the accuracy of this model by over30%. We point out to the reader that the MDA is computed after the RF istrained. Therefore, training the model without these predictors will not drop theperformance by the amounts shown in Table 5.1. Instead, the new model mayfind new correlated features unknown to the current model. We also notice inTable 5.1 the importance of adequately clustering users since groups, calculatedwith the optimised AHC algorithm, is responsible for the highest MDA value.
5.4.5 Prediction accuracy of the XGBoost model (RQ2.4)
Figure 5.8 presents the XGBoost curves for the different sets. The AUC rangeis virtually the same as the one for the RF, with the values from 0.93 to 0.82for the testing and validation 3 sets, respectively.
To keep our comparison similar to that of the RF we have selected the samepredictors and seen if there was any difference in their relative importancedistribution. To calculate their importance we examined the “Gain” value.Interestingly, we see that the order of the importance remains the same as perthe RF with “groups” being the predictor with the highest Gain value (0.06) and“obs time” with the lowest (0.0001). That reinforces the importance of havingwell-defined and accurate groups as output from the clustering algorithm.
142
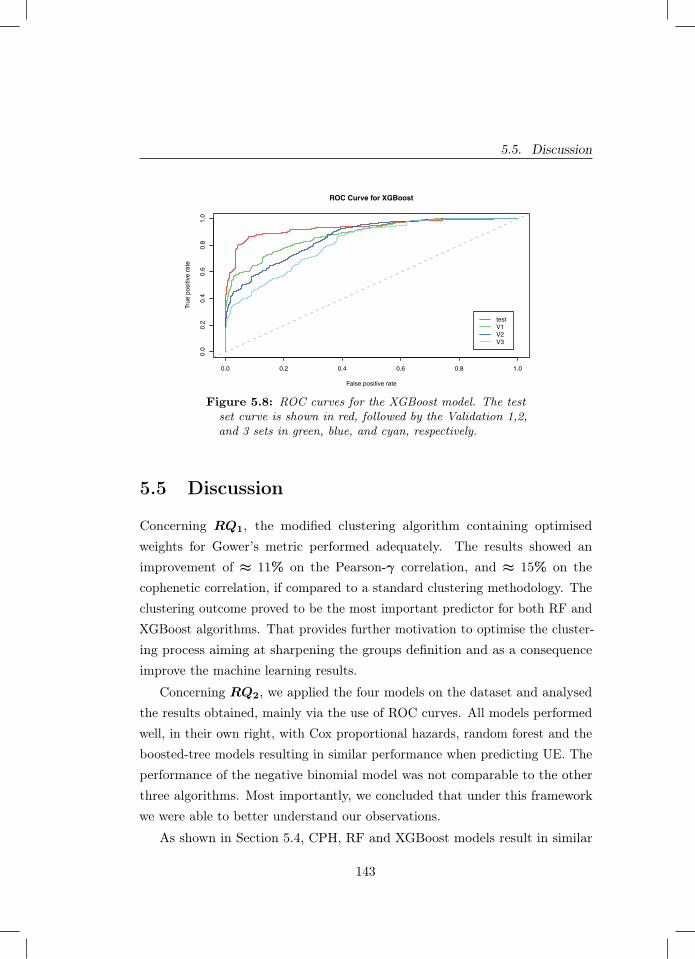
5.5. Discussion
ROC Curve for XGBoost
False positive rate
True
pos
itive
rat
e
0.0 0.2 0.4 0.6 0.8 1.0
0.0
0.2
0.4
0.6
0.8
1.0
test V1V2V3
Figure 5.8: ROC curves for the XGBoost model. The testset curve is shown in red, followed by the Validation 1,2,and 3 sets in green, blue, and cyan, respectively.
5.5 Discussion
Concerning RQ1, the modified clustering algorithm containing optimisedweights for Gower’s metric performed adequately. The results showed animprovement of ≈ 11% on the Pearson-γ correlation, and ≈ 15% on thecophenetic correlation, if compared to a standard clustering methodology. Theclustering outcome proved to be the most important predictor for both RF andXGBoost algorithms. That provides further motivation to optimise the cluster-ing process aiming at sharpening the groups definition and as a consequenceimprove the machine learning results.
Concerning RQ2, we applied the four models on the dataset and analysedthe results obtained, mainly via the use of ROC curves. All models performedwell, in their own right, with Cox proportional hazards, random forest and theboosted-tree models resulting in similar performance when predicting UE. Theperformance of the negative binomial model was not comparable to the otherthree algorithms. Most importantly, we concluded that under this frameworkwe were able to better understand our observations.
As shown in Section 5.4, CPH, RF and XGBoost models result in similar
143
Chapter 5. Predicting User Engagement
values of accuracy. Their AUC values are similar, ranging roughly from 0.8to 0.9. Our fourth model, the NB model, resulted in an AUC of 0.67. It isimportant to re-iterate that this AUC values should be taken as individualmeasures of performance and not used to compare models, as the manner ofpredicting and even the element of prediction is different according to thealgorithm used.
Even with a high AUC score, there are still, however, a number of caveatsconcerning the generalisation of the CPH model. More specifically, the resultsobtained with this model vary significantly for different sets of predictors.Interestingly, the good results found by the RF and XGBoost models can bepartially explained by their generality. We will take advantage of this featureand use these models to “classify” UE in the future as well.
We are also interested to model re-engagement. Given the fact that theCPH model is unable to do so (since it predicts survival times), a Markov-likestochastic model becomes then a plausible replacement. The reason is that thesemodels are able to provide the transition paths between engaged-disengaged andto obtain the rate parameter of these transitions. We emphasise that the RFand XGBoost models are also able to model re-engagement. In the near future,we aim to compare in detail the results obtained by the RF and XGBoost, withthe transition model.
Finally, it is important to note that the accuracy we obtained in our evalua-tion is specific to the dataset related to the waste recycling app and cannot bedirectly transferred to other mobile apps or application domains. Indeed, theaim of this study is not to provide a general solution for all mobile apps in alldomains, but rather, we focus on (i) providing evidence that it is possible to pre-dict when app users are getting disengaged with good levels of accuracy and (ii)providing a reusable modelling framework for UE in mobile apps. Researchersand practitioners in application domains other than waste recycling can re-useour proposed framework and its underlying techniques, provided that they willbe customised according to (i) the characteristics of their specific app domain(e.g., a user of a social media app may be considered as disengaged after 1 dayof inactivity, instead of 9 days) and (ii) the performance of the trained models
144
5.6. Summary and Future Work
(e.g., in a different domain the negative binomial model may perform the best.)
5.6 Summary and Future Work
In this chapter we answer T.RQ3, specifically: How can we predict userengagement in apps? We achieve this result by proposing and evaluating aframework to model and predict user engagement in mobile applications. Theframework consists of a modified clustering model that serves as baseline forother four numerical models: (i) a Cox proportional hazards, (ii) a negativebinomial, (iii) a random forest, and (iv) a boosted-tree algorithm. These modelswere trained and validated against an observational dataset obtained from areal waste recycling mobile application. Our results show that in our case bothmachine learning approaches (RF and XGBoost) are adequate to model userengagement for the considered app. In this study, we tested our frameworkon data obtained from a waste recycling app. Hence, our findings would likelyremain valid only for applications with usage dynamics and features similar tothose within the waste recycling domain. Specifically, geographical informationplays a crucial role to determine different user behaviours (as seen in our study)and hence a successful application of this methodology to a different domainwould most likely be dependent of a strong tie to location. As an example,domains such as fitness or language learning [15; 311], tend to have dailyactivities presented to the user in a game-like manner and have a strong tieto the user’s location. Given these were key features used to train our models,it is plausible that this framework could be applied to these and other similardomains.
Analysing user behaviour to predict and prevent disengagement certainlyposes a significant challenge, both from the methodological and analyticalpoints of view. Due to the complexity of this task, we limited this studyto characterising and evaluating our methodology to predict UE. In a follow-up study, we will investigate how to ultimately influence user behaviour byincreasing re-engagement rates and decreasing disengagement. Moreover, furtherresearch will touch upon studying the re-engagement process. We then intend to
145
Chapter 5. Predicting User Engagement
use push notification information - extending on the work of [319] - to ultimatelydetermine the most appropriate interaction for each user at any given time,aiming to augment usage (maintain engagement) and prevent disengagement.Understanding the role gamification plays in mobile apps is also crucial. It canbe done by further investigating how people redeem their points earned (e.g.immediately after achieving a minimum threshold or after some accumulation).That information helps in determining the type of notification that can be sentto each user.
Acknowledgements
All the authors thank the Amsterdam Network Institute for partially fundingthis research and Coen Jonker for his remarks on the initial version of themanuscript. Eduardo Barbaro thanks Mobiquity Inc. for the support and thehours available throughout the research.
146
Part II
Self-adaptation in mobile
applications
147


6Self-adaptation in Mobile Applications
Chapter 6 was published as:
Grua, E. M., Malavolta, I., & Lago, P. (2019, May). Self-adaptation in mobile apps: asystematic literature study. In 2019 IEEE/ACM 14th International Symposium onSoftware Engineering for Adaptive and Self-Managing Systems (SEAMS) (pp. 51-62).IEEE.
149
Chapter 6. Self-adaptation in Mobile Applications
Abstract - With their increase, smartphones have become more integralcomponents of our lives but due to their mobile nature it is not possible todevelop a mobile application the same way another software system would bebuilt. In order to always provide the full service, a mobile application needs tobe able to detect and deal with changes of context it may be presented with. Asuitable method to achieve this goal is self-adaptation. However, as of todayit is difficult to have a clear view of existing research on self-adaptation in thecontext of mobile applications.
In this chapter, we apply the systematic literature review methodology onselected peer-reviewed papers focusing on self-adaptability in the context ofmobile applications. Out of 607 potentially relevant studies, we select 44 primarystudies via carefully-defined exclusion and inclusion criteria. We use knownmodelling dimensions for self-adaptive software systems as our classificationframework, which we apply to all selected primary studies. From the synthesiseddata we obtained, we produce an overview of the state of the art. The resultsof this chapter give important background information, which is used to answerT.RQ4. Furthermore, these results also give researchers and developers a solidfoundation to plan for future research and practice on engineering self-adaptivemobile applications.
6.1 Introduction
Since the announcement of the iPhone in 2007 and the sale of Android basedsmartphones, the number of mobile applications has been increasing and so isthe number of mobile users [195; 328].
With their increase, smartphones have become more integral components ofour lives but do to their mobile nature it is not possible to develop a mobileapplication the same way another software system would be built. In order toalways provide the full service, a mobile application needs to be able to detectand deal with changes of context it may be presented with. A suitable methodto achieve this goal is self-adaptation [277].
While there is a lot of work that has been done in the field of self-adaptation
150

6.1. Introduction
[387], to the best of our knowledge there is no published literature reviewthat explores self-adaptation in the specific context of mobile applications.Within this context we can identify several questions related to the mostcommon goals that the self-adaptive systems are aiming to achieve, what kindof changes can trigger adaptation processes, how is it achieved in currentpublished work and what would be the outcomes and effects of the adaptationto the mobile application. Unveiling the above mentioned aspects will givea better understanding of the current landscape of self-adaptation for mobileapplications.
In this study we aim to fill the knowledge gap present with self-adaptivesystems in the context of mobile applications. To do so, we apply the systematicliterature review methodology [180] and target peer-reviewed papers focusingon self-adaptability in the context of mobile applications. Out of 607 potentiallyrelevant studies, we select 44 primary studies via carefully-defined selectioncriteria. We then utilise and customise known modelling dimensions for self-adaptive software systems [9] and use them as our classification framework,which we apply to all selected primary studies.
Obtained results reveal that the most common sources of change arehardware (which includes the battery of the device) and the internet connectivity.Most analysed approaches perform the self-adaptation in an autonomous mannerand adaptation happens within the application itself, with sometimes the useof the backend (e.g., cloud offloading systems). Furthermore, in all primarystudies adaptation is event triggered and performed in a best-effort manner,without a strict guarantee on the duration of the self-adaptation process. Mostof the approaches are not specific to any application domain, with a lack of casestudy evaluation.
The main contributions of this study are:
− an up-to-date systematic review of the literature on self-adaptation in thecontext of mobile applications;
− a customised classification framework for understanding, classifying, andcomparing approaches for self-adaptation in the context of mobile apps;
151
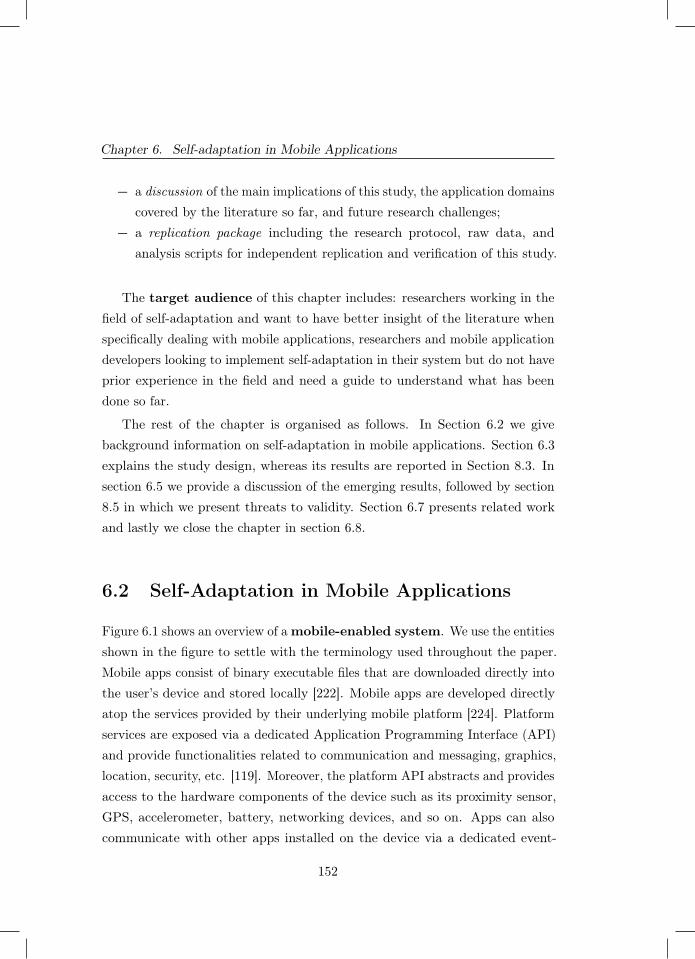
Chapter 6. Self-adaptation in Mobile Applications
− a discussion of the main implications of this study, the application domainscovered by the literature so far, and future research challenges;
− a replication package including the research protocol, raw data, andanalysis scripts for independent replication and verification of this study.
The target audience of this chapter includes: researchers working in thefield of self-adaptation and want to have better insight of the literature whenspecifically dealing with mobile applications, researchers and mobile applicationdevelopers looking to implement self-adaptation in their system but do not haveprior experience in the field and need a guide to understand what has beendone so far.
The rest of the chapter is organised as follows. In Section 6.2 we givebackground information on self-adaptation in mobile applications. Section 6.3explains the study design, whereas its results are reported in Section 8.3. Insection 6.5 we provide a discussion of the emerging results, followed by section8.5 in which we present threats to validity. Section 6.7 presents related workand lastly we close the chapter in section 6.8.
6.2 Self-Adaptation in Mobile Applications
Figure 6.1 shows an overview of a mobile-enabled system. We use the entitiesshown in the figure to settle with the terminology used throughout the paper.Mobile apps consist of binary executable files that are downloaded directly intothe user’s device and stored locally [222]. Mobile apps are developed directlyatop the services provided by their underlying mobile platform [224]. Platformservices are exposed via a dedicated Application Programming Interface (API)and provide functionalities related to communication and messaging, graphics,location, security, etc. [119]. Moreover, the platform API abstracts and providesaccess to the hardware components of the device such as its proximity sensor,GPS, accelerometer, battery, networking devices, and so on. Apps can alsocommunicate with other apps installed on the device via a dedicated event-
152
6.2. Self-Adaptation in Mobile Applications
based communication system (e.g., Android intents and broadcast receivers1).Smart objects such as fitness trackers, smart headphones, external sensors, andsmartwatches can be connected to the mobile device either via short-rangecommunication protocols (e.g., Bluetooth) or by passing through the Internet.
Mobile device
Hardware (including sensors,battery, display, etc.)
Mobile platform (OS + APIs)
App
3rd-partyapps
usesEnd user
Backend
manages
Platform vendor
develops develops
Developer
3rd-partyservices3rd-party
services3rd-partyservices
3rd-partyapps
3rd-partyapps
Smartobjects
Smartobjects
Smartobjects
App store
Internet
Figure 6.1: Overview of a mobile-enabled system
The vast majority of mobile apps send and receive data to their remotebackends in order to persist data across usage sessions, share data across appsinstances, etc. The communication between the app and its backend is usuallyperformed in a RESTful fashion via the HTTP protocol [1; 214]. Similarly, appscan also communicate with 3rd-party services, for example for authenticationvia Facebook, accessing the mapping services of Google Maps, sharing data tosocial networks. Mobile apps are distributed via dedicated app stores, such asthe Google Play Store for Android apps and the Apple app store for iOS apps.App stores are managed by platform vendors like Google and Apple [119].
Self-adaptation can happen in any part of a mobile-based system (e.g., inthe app itself, in the backend, in a smart object) and can be applied to different
1 https://developer.android.com/guide/components/broadcasts
153
Chapter 6. Self-adaptation in Mobile Applications
levels of the technology stack of computing systems (e.g.,, at the hardware level,at the platform level, in the business logic of the app). In the context of thisstudy, a self-adaptive system is defined as a system that can autonomouslyhandle changes and uncertainties in its environment, the system itself and itsgoals [373]. A self-adaptive system is internally composed of two parts: onehas the responsibility of performing the business capabilities of the system (i.e.,the operations for which the system is built), whereas the second part interactswith the first one and is responsible for the adaptation process [373]. As anexample of a self-adaptive mobile application we take the one described byMoghaddam et al. [243]. The work describes a framework built to enhanceenergy efficiency in mobile apps. The framework was built with the MAPEmodel functionalities and consists of a scheduler that is in charge of allocatingresources in real-time. In this particular implementation case the authors focuson the network scheduling strategies.
6.3 Study Design
In this section we present the design of this study. We firstly present the researchquestions (Section 6.3.1) and then we explain our search and selection process inSection 6.3.2. We report on the data extraction process and the framework usedto classify the information extracted from our primary studies in Section 6.3.3.Lastly, we explain how we synthesised the main findings from the extracteddata in Section 6.3.4.
The replication package is publicly available to researchers interested inreplicating and independently verifying the study [142]. The replication packageincludes the raw data of the search and selection phases of the study, the rawdata extracted from each primary study, and the full list of all primary studies.
6.3.1 Goal and Research Questions
Below we show the formalisation of the goal of this study according to theGoal-Question-Metric approach [54].
154
6.3. Study Design
Purpose Identify, classify, and evaluateIssue the characteristicsObject of existing approaches for self-adaptation in
mobile appsViewpoint from the researcher’s and practitioner’s point
of view.
By building on the modelling dimensions for self-adaptive software systemsproposed by Andersson et al. [9], we can elicit the following research questionstargeted by our study.
RQ1 What are the goals of self-adaptation in the context of mobile apps?Answering this question we aim to identify the characteristics of the goalsthat self-adaptation should achieve in the context of mobile apps. Asan example, the the self-adaptation mechanism proposed in the primarystudy by Moghaddam et al. [243] has the main goal of reducing the energyconsumption of the application in order to prolong the smartphone’sbattery life.
RQ2 What are the changes triggering the self-adaptation in the context ofmobile apps?By answering this question we want to gain insight on the characteristicsof the changes triggering self-adaptation in mobile apps. For example,referring back to the previously mentioned study by Moghaddam et al., oneof the possible sources of a change is the event in which a new applicationrequests to transfer data since it requires adaptation on resource schedulingwithin the whole mobile device.
RQ3 What are the mechanisms used for self-adaptation in the context ofmobile apps?Answering this question will allow us to better understand the character-istics of the mechanisms for self-adaptation within the context of mobileapplications. For example, in the case of Moghaddam et al., the mechanismfor adaptation is structural since adaptation involves the reconfigurationof the overall architecture of the whole system.
155
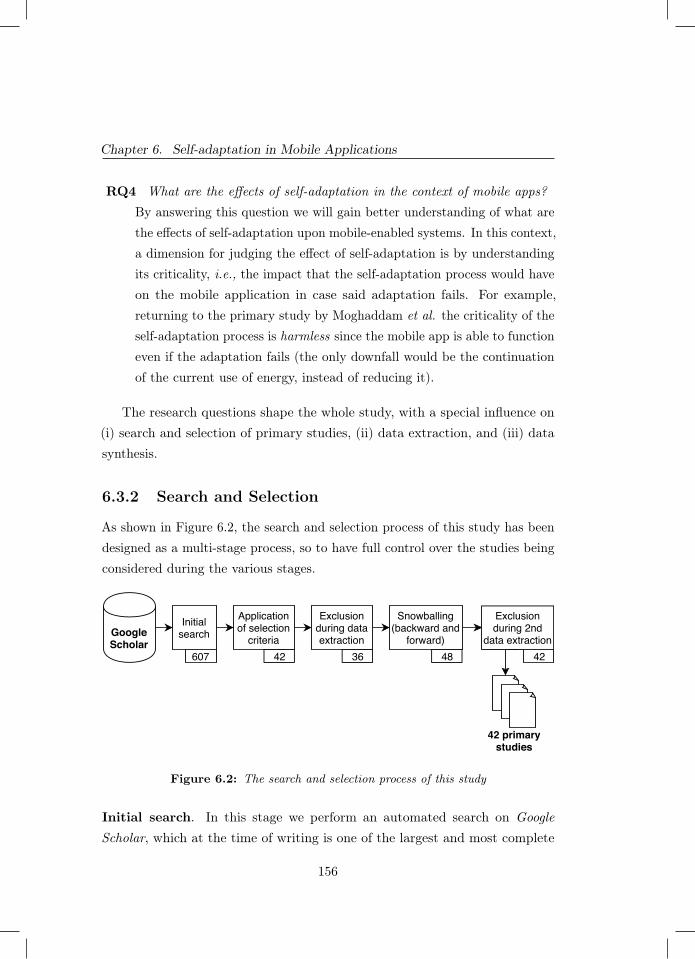
Chapter 6. Self-adaptation in Mobile Applications
RQ4 What are the effects of self-adaptation in the context of mobile apps?By answering this question we will gain better understanding of what arethe effects of self-adaptation upon mobile-enabled systems. In this context,a dimension for judging the effect of self-adaptation is by understandingits criticality, i.e., the impact that the self-adaptation process would haveon the mobile application in case said adaptation fails. For example,returning to the primary study by Moghaddam et al. the criticality of theself-adaptation process is harmless since the mobile app is able to functioneven if the adaptation fails (the only downfall would be the continuationof the current use of energy, instead of reducing it).
The research questions shape the whole study, with a special influence on(i) search and selection of primary studies, (ii) data extraction, and (iii) datasynthesis.
6.3.2 Search and Selection
As shown in Figure 6.2, the search and selection process of this study has beendesigned as a multi-stage process, so to have full control over the studies beingconsidered during the various stages.
GoogleScholar
Initialsearch
Applicationof selection
criteria
Exclusionduring dataextraction
Snowballing(backward and
forward)607 42 36 48
42 primarystudies
Exclusionduring 2nd
data extraction42
Figure 6.2: The search and selection process of this study
Initial search. In this stage we perform an automated search on GoogleScholar, which at the time of writing is one of the largest and most complete
156
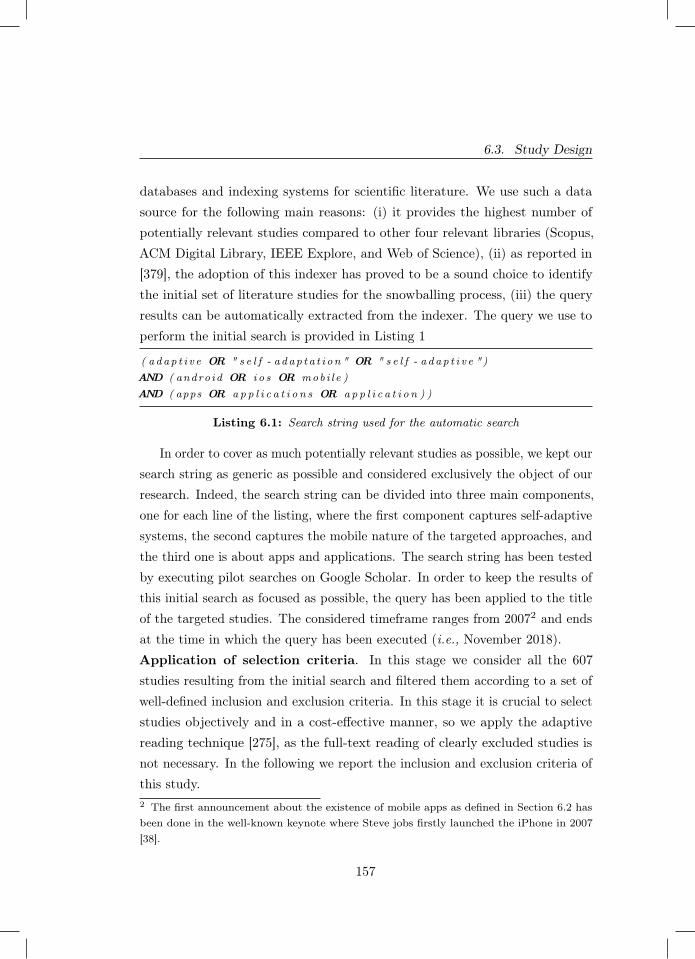
6.3. Study Design
databases and indexing systems for scientific literature. We use such a datasource for the following main reasons: (i) it provides the highest number ofpotentially relevant studies compared to other four relevant libraries (Scopus,ACM Digital Library, IEEE Explore, and Web of Science), (ii) as reported in[379], the adoption of this indexer has proved to be a sound choice to identifythe initial set of literature studies for the snowballing process, (iii) the queryresults can be automatically extracted from the indexer. The query we use toperform the initial search is provided in Listing 1
( adap t i v e OR " s e l f - adap t a t i on " OR " s e l f - a dap t i v e ")AND ( andro id OR i o s OR mobi l e )AND ( apps OR a p p l i c a t i o n s OR a p p l i c a t i o n ) )
Listing 6.1: Search string used for the automatic search
In order to cover as much potentially relevant studies as possible, we kept oursearch string as generic as possible and considered exclusively the object of ourresearch. Indeed, the search string can be divided into three main components,one for each line of the listing, where the first component captures self-adaptivesystems, the second captures the mobile nature of the targeted approaches, andthe third one is about apps and applications. The search string has been testedby executing pilot searches on Google Scholar. In order to keep the results ofthis initial search as focused as possible, the query has been applied to the titleof the targeted studies. The considered timeframe ranges from 20072 and endsat the time in which the query has been executed (i.e., November 2018).Application of selection criteria. In this stage we consider all the 607studies resulting from the initial search and filtered them according to a set ofwell-defined inclusion and exclusion criteria. In this stage it is crucial to selectstudies objectively and in a cost-effective manner, so we apply the adaptivereading technique [275], as the full-text reading of clearly excluded studies isnot necessary. In the following we report the inclusion and exclusion criteria ofthis study.2 The first announcement about the existence of mobile apps as defined in Section 6.2 hasbeen done in the well-known keynote where Steve jobs firstly launched the iPhone in 2007[38].
157

Chapter 6. Self-adaptation in Mobile Applications
Inclusion criteria:
1. The study focuses on self-adaptability, as defined in [9].
2. The study focuses on mobile applications, as defined in Section 6.2.
Exclusion criteria:
1. Secondary or tertiary studies (e.g., systematic literature reviews, surveys,etc.).
2. Studies in the form of editorials, tutorial, poster papers, because they donot provide enough information.
3. Studies that have not been published in English language.
4. Duplicate papers or extensions of already included papers.
5. Studies that have not been peer reviewed.
6. Papers that are not available, as we cannot inspect them.
Each paper is included as primary study if it satisfies all inclusion criteria,and it is discarded if it meets any exclusion criterion. The definition of theabove mentioned criteria has been incrementally refined and tested by tworesearchers by considering a set of pilot studies. It is important to note thatwe excluded secondary studies because of the first exclusion criterion, but wediscuss them in our related work section (see Section 6.7).Exclusion during data extraction. When going through each primary studyin detail for extracting information, we agreed that 6 analysed studies weresemantically out of the scope of this research and we excluded them, leading toa set of 36 potentially relevant studies.Snowballing. To reduce potential bias introduced with the use of our selectedsearch string we also carry out a snowballing process[141]. The main goal ofthis stage is to enlarge the set of potentially relevant studies by considering eachstudy selected in the previous stages, and focusing on those papers either citingand cited by it. More technically, we perform a closed recursive backward and
158
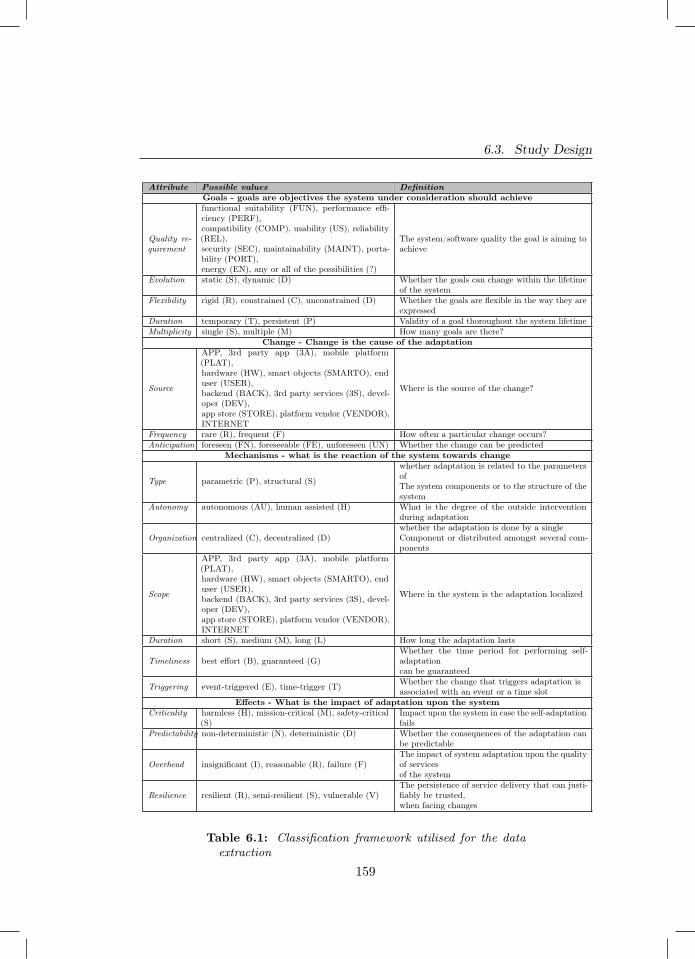
6.3. Study Design
Attribute Possible values DefinitionGoals - goals are objectives the system under consideration should achieve
Quality re-quirement
functional suitability (FUN), performance effi-ciency (PERF),compatibility (COMP), usability (US), reliability(REL),security (SEC), maintainability (MAINT), porta-bility (PORT),energy (EN), any or all of the possibilities (?)
The system/software quality the goal is aiming toachieve
Evolution static (S), dynamic (D) Whether the goals can change within the lifetimeof the system
Flexibility rigid (R), constrained (C), unconstrained (D) Whether the goals are flexible in the way they areexpressed
Duration temporary (T), persistent (P) Validity of a goal thoroughout the system lifetimeMultiplicity single (S), multiple (M) How many goals are there?
Change - Change is the cause of the adaptation
Source
APP, 3rd party app (3A), mobile platform(PLAT),hardware (HW), smart objects (SMARTO), enduser (USER),backend (BACK), 3rd party services (3S), devel-oper (DEV),app store (STORE), platform vendor (VENDOR),INTERNET
Where is the source of the change?
Frequency rare (R), frequent (F) How often a particular change occurs?Anticipation foreseen (FN), foreseeable (FE), unforeseen (UN) Whether the change can be predicted
Mechanisms - what is the reaction of the system towards change
Type parametric (P), structural (S)
whether adaptation is related to the parametersofThe system components or to the structure of thesystem
Autonomy autonomous (AU), human assisted (H) What is the degree of the outside interventionduring adaptation
Organization centralized (C), decentralized (D)whether the adaptation is done by a singleComponent or distributed amongst several com-ponents
Scope
APP, 3rd party app (3A), mobile platform(PLAT),hardware (HW), smart objects (SMARTO), enduser (USER),backend (BACK), 3rd party services (3S), devel-oper (DEV),app store (STORE), platform vendor (VENDOR),INTERNET
Where in the system is the adaptation localized
Duration short (S), medium (M), long (L) How long the adaptation lasts
Timeliness best effort (B), guaranteed (G)Whether the time period for performing self-adaptationcan be guaranteed
Triggering event-triggered (E), time-trigger (T) Whether the change that triggers adaptation isassociated with an event or a time slot
Effects - What is the impact of adaptation upon the systemCriticality harmless (H), mission-critical (M), safety-critical
(S)Impact upon the system in case the self-adaptationfails
Predictability non-deterministic (N), deterministic (D) Whether the consequences of the adaptation canbe predictable
Overhead insignificant (I), reasonable (R), failure (F)The impact of system adaptation upon the qualityof servicesof the system
Resilience resilient (R), semi-resilient (S), vulnerable (V)The persistence of service delivery that can justi-fiably be trusted,when facing changes
Table 6.1: Classification framework utilised for the dataextraction
159
Chapter 6. Self-adaptation in Mobile Applications
forward snowballing activity [380]. In both backward and forward snowballingthe initial screening of additional studies is based on their title only, whereasthe final decision about their inclusion into the set of primary studies is basedon their full text and on the selection criteria discussed above. Duplicates havebeen removed at each iteration of the snowballing activity.
Exclusion during 2nd data extraction. In this phase we extract data fromthe 12 additional papers resulting from the snowballing activity and agree that6 of them are semantically out of the scope of this research and we excludethem. This final check leads to the final set of 42 primary studies, which arethen analysed in details for answering our research questions.
6.3.3 Data Extraction
In this section we present how we perform the data extraction on the selectedprimary studies. The main goal of this phase is to collect data from each primarystudy, so to be able to suitably compare them in the subsequent data synthesisphase. The data extraction phase is executed collaboratively by two of theauthors of this study. In order to have a rigorous data extraction process andto ease the management of the extracted data, a well-structured classificationframework has been designed upfront.
As anticipated, we build our classification framework on the modellingdimensions for self-adaptive software systems presented by Andersson et al. [9].In order to better fit the framework to the characteristics of mobile applications,we customise the modelling dimensions for self-adaptive systems presented in[9]. The customisation of the classification framework has been performed asfollows: (i) firstly we selected a subset of 10 pilot studies from the 42 primarystudies, (ii) then two researchers independently extracted the data from the10 pilot studies by using the original version of the self-adaptation modellingdimensions proposed in [9], (iii) the two researchers then discussed the resultsof the data extraction, with a special focus on too generic/abstract attributes,those attributes which did not fully fit with the characteristics of the primarystudies, attributes whose values were redundant, (iv) based on the discussion,
160

6.3. Study Design
the self-adaptive modelling dimensions have been customised into the finalversion of the classification framework, and lastly (iv) the final version of theclassification framework has been applied to all 42 primary studies.
The customised classification framework is presented in Table 6.1. Specif-ically, as part of the Goals dimension, we add an attribute called qualityrequirement so to keep track of the system/software quality requirement thatself-adaptation aims to achieve [166] (e.g., security, usability, functional suit-ability, etc.). Here we are not considering how the (potentially multiple) goalsof self-adaptation are related to each other, i.e., the dependency attribute, asthis attribute resulted to be too fine grained for the objective of our study.For the Changes dimension, we extend the attribute source so to directly mapit to the main elements of mobile-enabled systems as they are depicted inFigure 6.1. Also, we are not considering the attribute type, which originally wasdistinguishing between functional or non-functional changes, since we noticethat in our primary studies it was strictly contained by the quality requirementattribute. For the Mechanisms dimension, the only change we made is relatedto the extension of the attribute scope, which we are also mapping to the mainelements of Figure 6.1. Lastly, we reuse the Effects dimension just as defined inthe original framework presented by Andersson et al.
6.3.4 Data Synthesis
The data synthesis activity involves collating and summarising the data extractedfrom the primary studies [180] with the main goal of understanding, analysing,and classifying current research on self-adaptation in the context of mobileapplications. Specifically, we performed a combination of content analysis(for categorising and coding the studies under broad thematic categories) andnarrative synthesis (for explaining in details and interpreting the findings comingfrom the content analysis). This phase is performed by all of the authors of thisstudy.
161
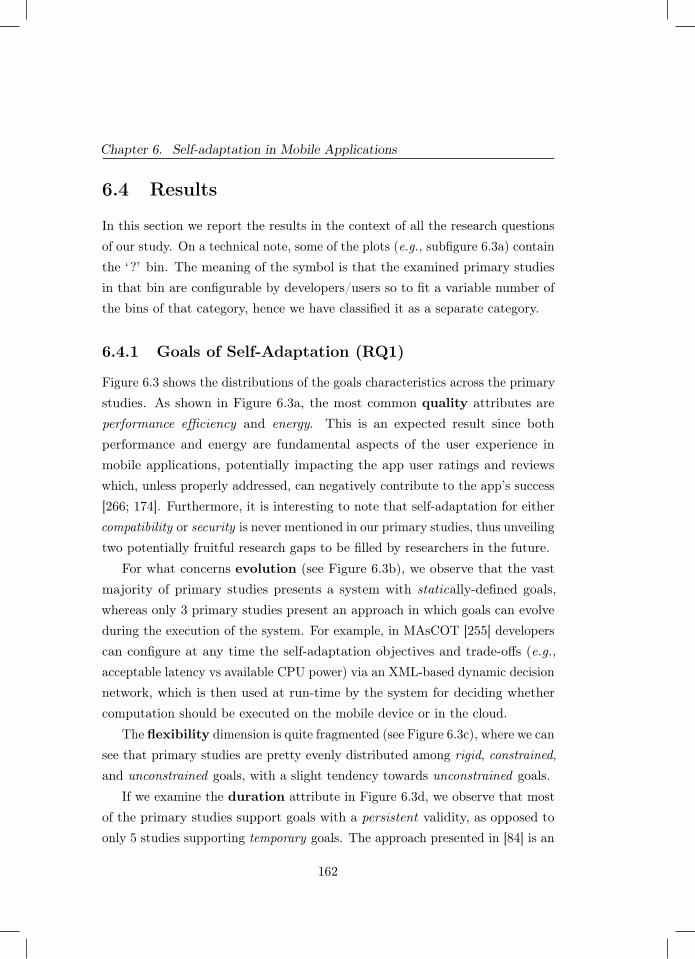
Chapter 6. Self-adaptation in Mobile Applications
6.4 Results
In this section we report the results in the context of all the research questionsof our study. On a technical note, some of the plots (e.g., subfigure 6.3a) containthe ‘?’ bin. The meaning of the symbol is that the examined primary studiesin that bin are configurable by developers/users so to fit a variable number ofthe bins of that category, hence we have classified it as a separate category.
6.4.1 Goals of Self-Adaptation (RQ1)
Figure 6.3 shows the distributions of the goals characteristics across the primarystudies. As shown in Figure 6.3a, the most common quality attributes areperformance efficiency and energy. This is an expected result since bothperformance and energy are fundamental aspects of the user experience inmobile applications, potentially impacting the app user ratings and reviewswhich, unless properly addressed, can negatively contribute to the app’s success[266; 174]. Furthermore, it is interesting to note that self-adaptation for eithercompatibility or security is never mentioned in our primary studies, thus unveilingtwo potentially fruitful research gaps to be filled by researchers in the future.
For what concerns evolution (see Figure 6.3b), we observe that the vastmajority of primary studies presents a system with statically-defined goals,whereas only 3 primary studies present an approach in which goals can evolveduring the execution of the system. For example, in MAsCOT [255] developerscan configure at any time the self-adaptation objectives and trade-offs (e.g.,acceptable latency vs available CPU power) via an XML-based dynamic decisionnetwork, which is then used at run-time by the system for deciding whethercomputation should be executed on the mobile device or in the cloud.
The flexibility dimension is quite fragmented (see Figure 6.3c), where we cansee that primary studies are pretty evenly distributed among rigid, constrained,and unconstrained goals, with a slight tendency towards unconstrained goals.
If we examine the duration attribute in Figure 6.3d, we observe that mostof the primary studies support goals with a persistent validity, as opposed toonly 5 studies supporting temporary goals. The approach presented in [84] is an
162
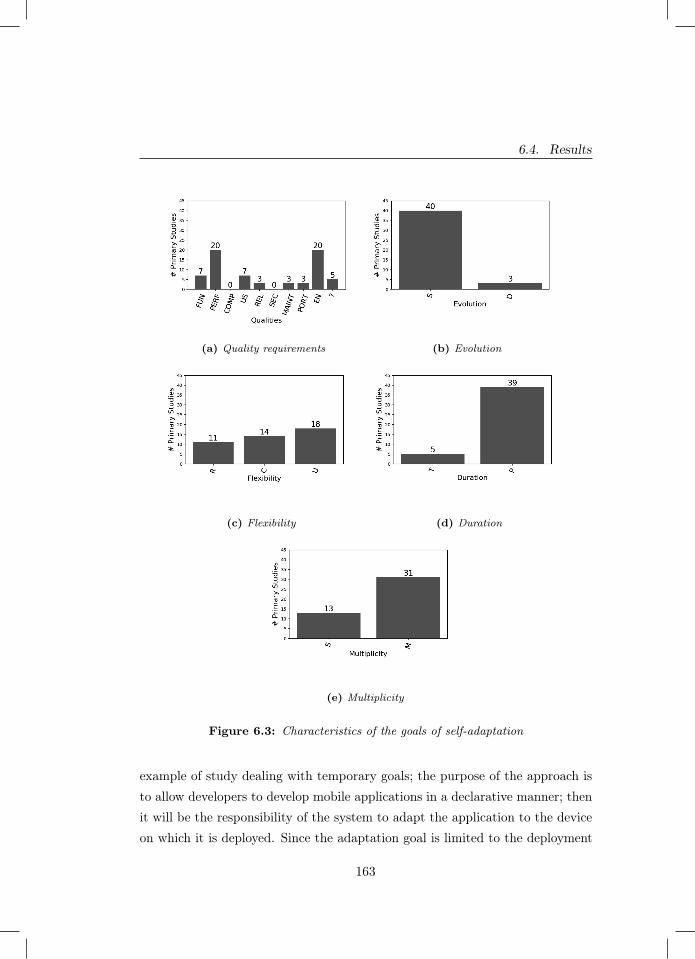
6.4. Results
(a) Quality requirements (b) Evolution
(c) Flexibility (d) Duration
(e) Multiplicity
Figure 6.3: Characteristics of the goals of self-adaptation
example of study dealing with temporary goals; the purpose of the approach isto allow developers to develop mobile applications in a declarative manner; thenit will be the responsibility of the system to adapt the application to the deviceon which it is deployed. Since the adaptation goal is limited to the deployment
163

Chapter 6. Self-adaptation in Mobile Applications
phase, we can consider it as temporary.
Lastly, if we focus on goals multiplicity, in figure 6.3e we can observe thatthe majority of primary studies have multiple goals. This result has to do withmost systems employing self-adaptation not only to optimize the system interms of a single dimension (e.g., to reduce battery consumption), but theyfocus on the trade-off among different dimensions and types of resources, suchas Internet connectivity, CPU usage, user experience, etc.
6.4.2 Changes Triggering Self-Adaptation (RQ2)
In Figure 6.4a we can notice that the most common source of changes is thehardware of the device, with close second being Internet connectivity. Thisresult can be due to the vary nature of mobile applications being deployedon smartphones; as such, a common concern for developers is to optimize theutilization of the hardware the application is installed on and to provide thebest service at all times (e.g., to do not consume too much battery at runtimeor to react to sensors faults). Furthermore, we can explain the fact that Internetis the second most common source of changes in the primary studies because ofa significant number of studies dealing with cloud offloading. In those cases, thesystem decides to offload computation to the cloud depending on the availablebandwidth (among other parameters) and adapts its behaviour accordingly. Asa last remark on this attribute, we can observe that none of the primary studiesconsider as a source of change the following entities of mobile-enabled systems:third-party services, developers, app store, and platform vendor. Among them,it comes as a surprise that no primary study considers third-party services as asource of changes. Indeed, it is quite common that third-party services changetheir provided APIs (e.g., Facebook changing the signature of its GraphAPI3
endpoint for sharing a link) and it may be interesting to investigate on howself-adaptation techniques can help in automatically keeping the calling apps asreliable as possible, despite those (potentially unforeseen) changes.
The second examined attribute is frequency, where we observe that the
3 https://developers.facebook.com/docs/graph-api
164
6.4. Results
(a) Source (b) Frequency
(c) Anticipation
Figure 6.4: Characteristics of the changes triggering theself-adaptation process
most common type of changes are frequent (see Figure 6.4a). This result wasexpected, especially after having observed that the two most common sourcesof changes are hardware and Internet availability and that by their own naturetheir status can drastically change in a matter of nanoseconds.
For what concerns the anticipation of changes, as shown in Figure 6.4c,changes are mostly foreseen, followed by fewer occurrences of approaches sup-porting foreseeable changes. It is important to note that in self-adaptive systemsforeseen changes are known at design time and considered as expected to oc-cur during the normal operation of the system [192]; examples of foreseeablechanges we encountered in the primary studies include: a drop of availablebandwidth [120], the user reaching its home address [240], the mobile device
165
Chapter 6. Self-adaptation in Mobile Applications
getting in proximity of a smart object [80], the user starting to drive a car[306]. Differently, changes are foreseeable when they are not known at designtime, but they can be resolved at runtime and there is a plan for managingthem during the execution of the system [192]. Examples of foreseeable changesinclude: the backend of the app has a failure [59], the GPS sensors of themobile device produces incorrect data [84], etc. Finally, it is interesting to notethat no primary study considers unforeseen changes, i.e., drastic changes thathave been not planned for and that are unknown until their first occurrence[192]. Unforeseen changes are extremely challenging to be managed due to theirintrinsic level of uncertainty, both at design time and runtime. We speculatethat investigating on how to incorporate them into self-adaptive mobile-enabledsystems will be a scientifically challenging research area of the future.
6.4.3 RQ3 – Mechanisms for Self-Adaptation (RQ3)
The type of self-adaptation supported in more than half of the primary studiesis structural (see Figure 6.5a), i.e., the adaptation involves structural changesin software architecture of the system [9]. This result can be explained bythe high number of primary studies focussing on communication middleware,generic frameworks and meta-approaches which allow the self-adaptation processto reconfigure the architecture of the system at run-time and are, therefore,structural in nature. In 13 primary studies the self-adaptation is parametric,i.e., the adaptation process involves only the policy files and configuration ofspecific components of the system, without changing its overall organization[9]. Examples of primary studies supporting structural self-adaptation includeapproaches for autonomously adapting the bitrate of the video streaming to theapp [244], approaches for sending personalized notifications to the user whichautomatically adapt to his/her stress levels [210], etc.
For what concerns autonomy, we can observe that nearly all approachesare autonomous (see Figure 6.5b). This result is most likely influenced by thedefinition of self-adaptation that we have used throughout this study, in whichthe system has to be able to self-adapt and therefore can only have minimal
166
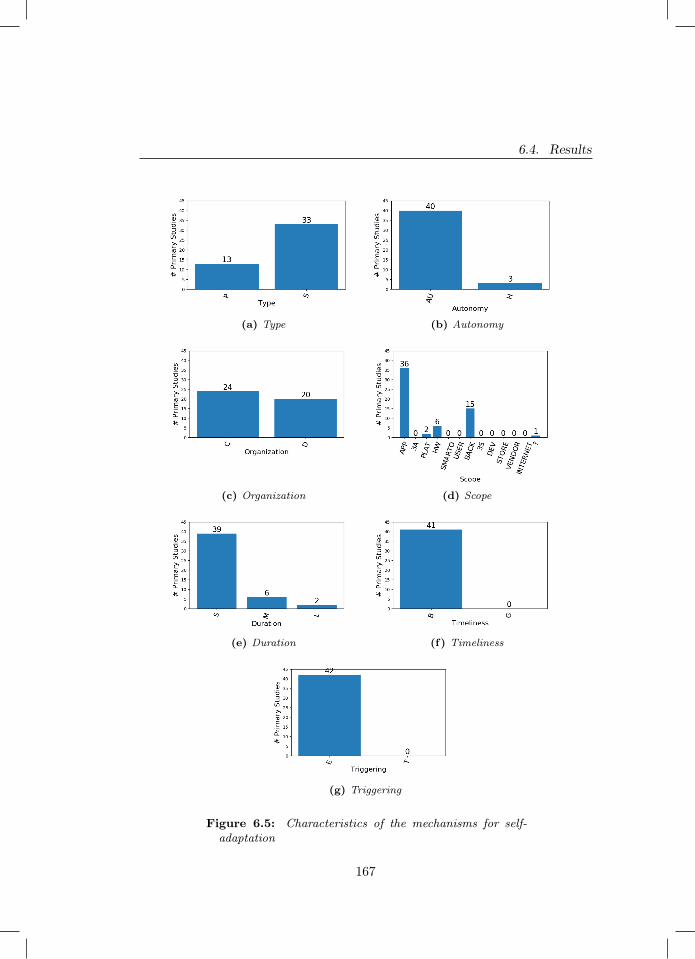
6.4. Results
(a) Type (b) Autonomy
(c) Organization (d) Scope
(e) Duration (f) Timeliness
(g) Triggering
Figure 6.5: Characteristics of the mechanisms for self-adaptation
167
Chapter 6. Self-adaptation in Mobile Applications
human assistance in the process. Nonetheless, we have found 3 primary studiespresenting human assisted approaches. For example, the approach presentedin [290] aims at improving the user experience of the app with the use of anadaptive user interface. This approach is human aided because it needs theuser to participate in a brief test in order to determine where the elements ofthe user interface should be positioned and their dimensions in the graphicallayout of the app. This is obviously in contrast with a fully automated systemthat would monitor user actions in background and adapt accordingly, withoutrequiring the initial test performed explicitly by the user.
The organization attribute is almost evenly split among our primary studies(see Figure 6.5c). This implies that we have nearly just as many primary studieswhere the adaptation is centralized into a single component as systems whereadaptation is distributed among several components. An example of centralizedself-adaptation is [372], where there is a single software component which is incharge of adapting the user interface of the app to the preferences, knowledge,and skills of the user. An example of distributed self-adaptation is presented in[120], where both the app and its backend are involved in the code offloadingprocess.
Considering our mobile-enabled system in Figure 6.1 and examining thescope of self-adaptation, we notice that the vast majority of the self-adaptationmechanisms are executed in the application itself (see Figure 6.5d). Quite afew approaches also have mechanisms executing in the back-end of the app,where a significant part is due to the fact that the primary studies deal withcloud offloading (such as the previously given example). Furthermore, we haveobserved that some studies have self-adaptation mechanisms executing in thehardware and the platform of the mobile device. This result is a confirmationthat in a mobile-enabled system the intelligent entities are either the app, itsbackend, or the software stack on which the app is running on the client side.
Regarding the duration of the mechanism (see Figure 6.5e), we noticethat the vast majority of the mechanisms have a short duration, followed by 6approaches having a medium duration, and only 2 approaches having a longduration. As an example of a long duration mechanism, the authors of [133]
168
6.4. Results
monitor user actions and apply a set of algorithms to perform self-adaptationfor adapting the items in the graphical menus of the app according to theusage patterns exhibited by the user. In this way, the app is enhanced witha transformable and movable menu component with adaptable and adaptivefeatures, which improves the overall efficiency of the user when using the app.Due to the fact that the app is constantly learning the usage patterns of theuser, the mechanism presented in [133] can be considered as having a longadaptation duration.
As shown in Figure 6.5f, the timeliness attribute falls fully in the best-effortbin (i.e., the time for executing the adaptation is not guaranteed) and there areno primary studies proposing a guaranteed time for the self-adaptation process.This result is extremely interesting since in some application domains (e.g.,emergency-related, post-disaster apps) it may be a strict requirement to knowand respect upper bounds on the execution time of the self-adaptation process,thus guaranteeing the timeliness associated with self-adaptation.
For what concerns self-adaptation triggering (see figure 6.5g), all theprimary studies are based on event triggered mechanisms. This result is quiteexpected, given that mobile apps are mostly front-end software reacting eitherto user- or system-generated events.
6.4.4 RQ4 – Effects of Self-Adaptation (RQ4)
Starting with criticality (see Figure 6.6a), we observe that the majority ofprimary studies describe a self-adaptation process that has a harmless impacton the system in the case such adaptation were to fail. Fourteen and sevenstudies can have mission-critical and safety-critical consequences, respectively.Furthermore, we can also observe that safety-critical consequences are highlydependent on the domain in which the approach is being applied. This is logical,as, for example, a video-streaming adaptation process would most likely notrun the risk of hurting its users in case of a failed adaptation.
In terms of predictability, the majority of the self-adaptation approachesare deterministic (see Figure 6.6b), followed by twelve approaches with non-
169
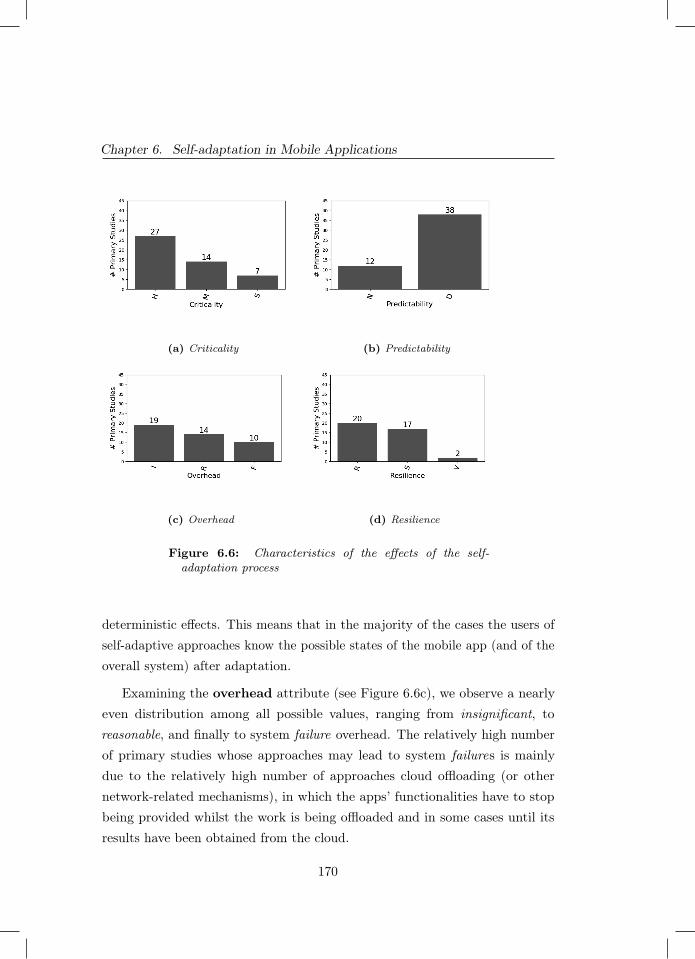
Chapter 6. Self-adaptation in Mobile Applications
(a) Criticality (b) Predictability
(c) Overhead (d) Resilience
Figure 6.6: Characteristics of the effects of the self-adaptation process
deterministic effects. This means that in the majority of the cases the users ofself-adaptive approaches know the possible states of the mobile app (and of theoverall system) after adaptation.
Examining the overhead attribute (see Figure 6.6c), we observe a nearlyeven distribution among all possible values, ranging from insignificant, toreasonable, and finally to system failure overhead. The relatively high numberof primary studies whose approaches may lead to system failures is mainlydue to the relatively high number of approaches cloud offloading (or othernetwork-related mechanisms), in which the apps’ functionalities have to stopbeing provided whilst the work is being offloaded and in some cases until itsresults have been obtained from the cloud.
170
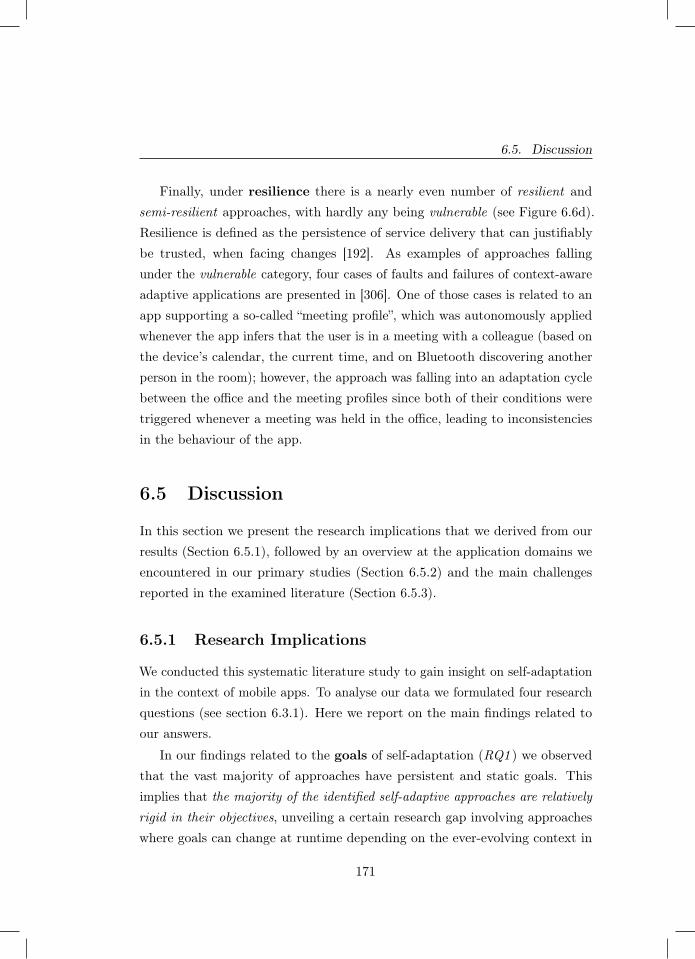
6.5. Discussion
Finally, under resilience there is a nearly even number of resilient andsemi-resilient approaches, with hardly any being vulnerable (see Figure 6.6d).Resilience is defined as the persistence of service delivery that can justifiablybe trusted, when facing changes [192]. As examples of approaches fallingunder the vulnerable category, four cases of faults and failures of context-awareadaptive applications are presented in [306]. One of those cases is related to anapp supporting a so-called “meeting profile”, which was autonomously appliedwhenever the app infers that the user is in a meeting with a colleague (based onthe device’s calendar, the current time, and on Bluetooth discovering anotherperson in the room); however, the approach was falling into an adaptation cyclebetween the office and the meeting profiles since both of their conditions weretriggered whenever a meeting was held in the office, leading to inconsistenciesin the behaviour of the app.
6.5 Discussion
In this section we present the research implications that we derived from ourresults (Section 6.5.1), followed by an overview at the application domains weencountered in our primary studies (Section 6.5.2) and the main challengesreported in the examined literature (Section 6.5.3).
6.5.1 Research Implications
We conducted this systematic literature study to gain insight on self-adaptationin the context of mobile apps. To analyse our data we formulated four researchquestions (see section 6.3.1). Here we report on the main findings related toour answers.
In our findings related to the goals of self-adaptation (RQ1 ) we observedthat the vast majority of approaches have persistent and static goals. Thisimplies that the majority of the identified self-adaptive approaches are relativelyrigid in their objectives, unveiling a certain research gap involving approacheswhere goals can change at runtime depending on the ever-evolving context in
171
Chapter 6. Self-adaptation in Mobile Applications
which mobile apps are used today. Furthermore, the most frequently pursuedgoals are related to technical quality properties of mobile-enabled systems, suchas performance and energy consumption. Interestingly, there are few approachestargeting non-technical goals, such as promoting user behavioural change andlifestyle improvement. Researchers in the field can direct their future studiestowards filling this identified gap in the state of the art of self-adaptive mobile-enabled systems. For developers working on self-adaptive apps with static goals,the set of primary studies could represent a valuable source of knowledge.
In analysing the changes that trigger self-adaptation (RQ2 ), we observethat the majority of approaches adapt due to changes within the hardwareof the mobile device or its Internet connectivity. This result unveils a veryinteresting research gap related to potential self-adaptive approaches whichcan adapt their behaviour or structural configuration to changes occurring inthird-party applications running on the mobile device, in third-party servicesrunning in the cloud, or in smart objects surrounding the user of the app. Theabove gap points to a potential unexplored market: developers looking forinnovative self-adaptive apps could consider developing apps that adapt due totheir third-party services, e.g., to provide a better user experience, as opposedto competing apps that use these services without self-adaptation.
When discussing the adaptation mechanisms (RQ3 ), we observe someinteresting findings as well. Firstly, the majority of approaches perform theadaptation in an autonomous manner, and therefore do not need a human inthe loop or any other forms of human assistance to accomplish their adaptation.Moreover, in most cases the adaptation is performed by the application itself,with only sometimes requiring the help of the backend (such as in the case ofcloud offloading applications). Secondly, all of the analysed adaptations areevent-triggered and perform in a best-effort manner; therefore they do not havea guarantee on the duration of the self-adaptation process. This can be justifiedby the overwhelming short and medium duration of the adaptation processes wehave studied, which by their nature are nearly impossible to guarantee in theirtimeliness. Nevertheless, an interesting research direction is about self-adaptiveapproaches where formal and rigorous reasoning plays a central role into making
172

6.5. Discussion
self-adaptation feasible also for apps belonging to critical domains (e.g., energy,defence, transportation). Some works into this direction are starting to emergein other fields, such as for the Internet of Things [374; 251], but the applicationof formal reasoning in the context of self-adaptive mobile applications still seemsto be an under-explored research area.
Lastly, we need to discuss the effects of the self-adaptation process (answer-ing RQ4 ). However, before doing so we must note that the reported informationon effects was challenging to collect as it was rarely explicitly stated within theprimary studies and, most of the time, had to be deduced by the descriptionof the self-adaptation process and the analysed software system. We adviceresearchers working on self-adaptive software systems to pay special attentionto the effects dimension of self-adaptation, so to provide a clear and completeoverview of their proposed solutions. Having disclosed this, we nonetheless havea few noticeable results with the most prominent finding being that most ofthe analysed approaches had predictable consequences to their self-adaptationapproach. Furthermore, the majority of analysed adaptation mechanisms had aharmless effect on the app in case the adaptation failed. However, we also foundcases in which this effect was mission-critical or even safety-critical, and havenoticed that there seems to be a strong link between a system being mission-or safety-critical and its application domain. This seems reasonable as e.g.,failed adaptation in the health domain is more likely to be safety-critical asopposed to a video streaming application, which poses no threat to the safetyof the user in case of failed adaptation. This emerging link between domain andlevel of criticality, should be considered carefully by any developer working onself-adapting apps in mission/safety-critical domains.
6.5.2 Application Domains
When analysing the primary studies we also traced the application domains inwhich the self-adaptive mobile apps have been applied. Of the cited applicationdomains, health is the most popular with 7 primary studies. Other applicationdomains in which self-adaptive mobile apps have been applied include: tourism,
173
Chapter 6. Self-adaptation in Mobile Applications
e-learning, mapping, education, science, conferencing, e-commerce, social net-works, smart city, art, video streaming, image manipulation, and emergencymanagement. Overall, such a high number of application domains hints to thegeneral applicability of self-adaptive mechanisms, provided that the contextand specifics of the application domain are taken into consideration (e.g., appsshould respect the intrinsic privacy-related concerns of domains like health ande-learning).
On the other hand, 22 primary studies do not mention any particularapplication domain. This indicates that a substantial amount of research hasfocused on self-adaptation mechanisms regardless of their application domain.This could be due to such mechanisms being broad enough to be applied ingeneral. In the future, it might be interesting for researchers to investigate ifthere exist categories of self-adaptation techniques that are application-specificand others that are general-purpose.
6.5.3 Emerging Challenges
By extracting meaningful paragraphs from ‘future work’ and ‘challenges’ sectionsof our primary studies and then analysing them, we have managed to find somecommon points of interest both for researchers and practitioners. Specifically:
− 12 primary studies mention the need or to further improve the implemen-tation of their approach in order to reduce bias or eliminate potentiallywrongful assumptions and of these studies 4 specifically mention onlyhaving implemented a research prototype;
− 9 of our primary studies mention the need of performing a more robustevaluation of their proposed approach;
− 4 primary studies mention the need to test their proposed approach oncase studies as it was only tried in simulation or just theoretically;
− 3 primary studies mention the need for performing an in-depth comparisonbetween their approach and the ones proposed by other researchers.
174
6.6. Threats To Validity
The information we have extracted seems to be reinforcing our previouslygiven observation in subsection 6.5.2. It would seem as a significant numberof primary studies are working on a more theoretical level, therefore in a stateof still needing further improvement and testing on practical scenarios andreal-world applications. From this, we would therefore suggest that futureresearch effort should be devoted not only to the improvement of the existingtheoretical underpinnings of self-adaptation for mobile apps, but also to itsapplication in real-world, realistic scenarios, at best by applying empirical casestudies in industrial settings [381].
6.6 Threats To Validity
The following reports on the potential threats to validity of this study accordingto [381].
Internal Validity. We mitigated internal threats to validity by using alreadyestablished modelling dimensions [9] as our classification framework. For thevalidity of the synthesis of the collected data, we utilised well assessed descriptivestatistics in order to minimise potential threats.
External Validity. In our study the main external threat to validity maycome from our primary studies not being representative of the whole research onself-adaptation in the context of mobile applications. In order to mitigate suchrisk, we employed a search strategy including of both automatic search as wellas backward-forward snowballing of the selected primary studies found withthe automatic search. Furthermore, we chose to consider only peer-reviewedpapers and excluded any work that could be defined as grey literature. We donot foresee this criterion to have impacted our study as the considered papersneed to have undergone a rigorous peer-review process, which is an establishedrequirement for quality publications. Lastly, we applied well defined inclusionand exclusion criteria, which we have rigorously followed during our manualselection phase.
Construct Validity. To be sure that the found primary studies would be ableto competently answer the chosen research questions we manually carried out
175
Chapter 6. Self-adaptation in Mobile Applications
the selection process using the chosen inclusion and exclusion criteria, reportedin subsection 6.3.2. Such results were then further expanded by also conductingforward and backwards snowballing on those same selected studies.
Conclusion Validity. In order to reduce potential bias our classificationframework is based on established modelling dimensions found in [9]. Thisway we can confidently guarantee that the data extraction process was alignedwith our chosen research questions. Furthermore we reduced potential threatsto conclusion by following well-known systematic literature review guidelines[179; 276; 381].
6.7 Related Work
Works related to ours are secondary studies on self-adaptation.
Yang et al. [387] focused on requirements modelling and analysis for self-adaptive systems. They carried out a systematic literature review of 101 primarystudies, from which they elicited 16 modelling methods and 10 requirementquality attributes. They observed that some of the modelling methods needfurther study, and most qualitative studies need better evaluation.
Krupitzer et al. [185] survey the engineering approaches found for self-adaptive systems. To this aim, they use a taxonomy for self-adaptation extendedwith the “context perspective”, i.e., the ability of systems to adapt their context.The survey identifies and classifies several approaches used to build self-adaptivesystems.
Macias-Escriva et al. [215] analyse self-adaptability from the perspectiveof computer science and cybernetics, and examine the approaches found inthe literature, to gain an overview of the state-of-the-art techniques used forself-adaptation. As one of the main conclusions, they identify feedback controland artificial intelligence as enabling fields to help further develop self-adaptivesystems.
Both Krupitzer et al. and Macias-Escriva et al. do not report on the numberof studies used in the data extraction for the surveys.
Mahdavi-Hezavehi et al. [219] conducted a systematic literature review
176
6.8. Conclusions and Future Work
of 54 primary studies, with the goal of understanding ‘the state-of-the-art ofarchitecture-based methods for handling multiple quality attributes (QAs) inself-adaptive systems’. They found that the most frequently addressed QAsare performance and cost, and the most common domains are robotics andweb-based system.
Muccini et al. [250] focused on self-adaptation in the context of cyber-physical systems, and analysed 42 primary studies. As part of their main resultsthe authors found MAPE (Monitor-Analyze-Plan-Execute) as the most commonmechanism used to perform adaptation in this context, and energy as that themost common application domain.
Lastly, Weyns et al. [375] examine the claims that are associated withself-adaptation. They analysed 96 primary studies identified from the SEAMSconference series between 2006 and 2011, and the papers published in 2008 in[71]. They observe that (i) the main focus is on architecture and models, (ii) themost common application domain is service-based systems, and (iii) at the timeof publishing only a few empirical studies were performed with no industrialevidence.
In spite of the relatively large number of secondary studies on self-adaptationand self-adaptive systems, none explored the state of the art of self-adaptationin the context of mobile applications. Our study certainly fills this gap, whichwith the increasing pervasiveness of mobile software in all application domainsis turning into a necessity.
6.8 Conclusions and Future Work
This paper presents a systematic literature review on self-adaptation in thecontext of mobile applications as defined in section 6.2. Starting from 607possibly relevant studies, we found 44 primary studies which we analysed viathe presented classification framework, in order to answer our chosen researchquestions. By answering these questions, we give an in-depth look at the field ofself-adaptation in the mobile application context, and therefore provide valuableinformation for researchers and developers who wish to work in the future within
177
Chapter 6. Self-adaptation in Mobile Applications
this area.As future work, we will perform a longitudinal analysis across the various
dimensions of our classification framework as it would help discover morecomplex (and hidden) patterns among the analysed approaches. Furthermore,a more in-depth analysis of the contents of the primary studies could contributein better understanding the current research gaps about self-adaptation in thecontext of mobile applications. Finally, in our next chapter we present ourwork on the use of cluster-based reinforcement learning and self-adaptationto automatically adapt and personalise e-Health mobile apps. Allowing theseapps to better support users in following medical advice and improving theirwellbeing.
178
Part III
Creating self-adaptive and
personalised e-Health mobile
applications
179


7A Reference Architecture for e-Health
mobile applications
Part of chapter 7 was published as:
Grua, E. M., De Sanctis, M., & Lago, P. (2020, September). A Reference Architecturefor Personalized and Self-adaptive e-Health Apps. In European Conference on SoftwareArchitecture (pp. 195-209). Springer, Cham.
Furthermore, this chapter will appear as a book chapter:Grua, E. M., De Sanctis, M., Malavolta, I., Hoogendoorn, M., & Lago, P. (2021). SocialSustainability in the e-Health Domain via Personalized and Self-adaptive Mobile Apps.Software Sustainability. Springer, Cham. To appear (book chapter).
181
Chapter 7. A Reference Architecture for e-Health mobile applications
Abstract - Within software engineering, social sustainability is the di-mension of sustainability that focuses on the ‘support of current and futuregenerations to have the same or greater access to social resources by pursuingsocial equity’. An important domain that strives to achieve social sustainabilityis e-Health, and more recently e-Health mobile apps.A wealth of e-Health mobile apps are available for many purposes, such aslife style improvement, mental coaching, etc. The interventions, prompts, andencouragements of e-Health apps sometimes take context into account (e.g.,previous interactions or geographical location of the user), but they still tendto be rigid, e.g., apps use fixed sets of rules or they are not sufficiently tailoredtowards individuals’ needs.Personalisation to the different users’ characteristics and run-time adaptationto their changing needs and context provide a great opportunity for gettingusers continuously engaged and active, eventually leading to better physicaland mental conditions.The overall goal of this chapter and it’s contents is to answer T.RQ4, namely:How can AI-based personalisation and self-adaptation be used to create e-Healthapps that dynamically adapt to the user and their context? To this goal, wepresent a reference architecture for enabling AI-based personalisation and self-adaptation of mobile apps for e-Health. The reference architecture makes use ofa dedicated goal model and multiple MAPE loops operating at different levelsof granularity and for different purposes.The proposed reference architecture is instantiated in the context of a fitness-based mobile application and exemplified through a series of typical usagescenarios extracted from our industrial collaborations.
7.1 Introduction
E-Health mobile apps are designed for assisting end users in tracking andimproving their own health-related activities [378]. With a projected marketgrowth to US$102.3 Billion by 2023, e-Health apps represent a significantmarket [134] providing a wide spectrum of services, i.e., life style improvement,
182
7.1. Introduction
mental coaching, sport tracking, recording of medical data [269]. The uniquecharacteristics of e-Health apps w.r.t. other health-related software systemsare that e-Health apps (i) can take advantage of smartphone sensors, (ii) canreach an extremely wide audience with low infrastructural investments, and(iii) can leverage the intrinsic characteristics of the mobile medium (i.e., beingalways-on, personal, and always-carried by the user) for providing timely andin-context services [119].
However, even if the interventions, prompts, and encouragements of cur-rent e-Health apps take context into account (e.g., previous interactions orgeographical location of the user), they still tend to be rigid and not fullytailored to individual users, e.g., by using fixed rule sets or by not consideringthe unique traits and behavioural characteristics of the user. In this context,we see personalisation [109] and self-adaptation [147; 373; 387] as effective in-struments for getting users continuously engaged and active, eventually leadingto better physical and mental conditions. The addition of intervention tailoring(via personalisation and self-adaptation) is a crucial step in addressing themain sustainability concern that e-Health mobile apps want to achieve: socialsustainability. By providing better interventions, we are not only more likelyto have the user interested in maintaining engagement with the app but alsohelp the user achieve better physical and mental conditions; allowing the appto better address the personal needs and by extension the social ones too.
In this work, we combine personalisation and software self-adaptation toprovide users of mobile e-Health apps with a better, more engaging and effectiveexperience. To this aim, we propose a reference architecture that combinesdata-driven personalisation with self-adaptation. The main design drivers thatmake the proposed reference architecture unique are:
− the combination of multiple Monitor - Analyze - Plan - Execute(MAPE) loops [163] operating at different levels of granularity and fordifferent purposes, e.g., to suggest users the most suitable and timelyactivities according to their (evolving) health-related characteristics (e.g.,active vs. less active), but also to cope with technical aspects (e.g.,connectivity hiccups, availability of IoT devices and third-party apps on
183
Chapter 7. A Reference Architecture for e-Health mobile applications
the user’s device) and the characteristics of the physical environment(e.g., indoor vs. outdoor, weather);
− a dedicated goal model for representing health-related goals via adescriptive concise language accessible by healthcare professionals (e.g.,fitness coaches, psychologists);
− the exploitation of our online clustering algorithm for efficiently man-aging the evolution of the behaviour of users as multiple time seriesevolving over time. This online clustering algorithm has been already ex-tensively tested in a previously published article [146], showing promisingresults by doing better than the current state-of-the-art.
The main characteristics of the proposed reference architecture are thefollowing: (i) it caters the personalisation of provided services to the specificuser preferences (e.g., preferred sport activities); (ii) it guarantees the correctfunctioning of the provided features via the use of connected IoT devices (e.g.,a smart-bracelet) and runtime adaptation strategies; (iii) it adapts the providedservices depending on contextual factors such as environmental conditionsand weather; (iv) it supports a smooth participation of domain experts (e.g.,psychologists) in the personalisation and self-adaptation processes; and (v) itcan be applied in the context of a single e-Health app and by integrating theservices of third-party e-Health apps (e.g., already installed sport trackers). Allof the above mentioned characteristics are shown in this work by evaluating thereference architecture and the goal model with fitness coaching scenarios. Wewant to emphasise how most characteristics have been engineered with the maingoal of achieving social sustainability. A possible exception are characteristics(ii) and (v) which more specifically addresses technical sustainability of thereference architecture. Our emphasis on social sustainability will be furtherexplained and explored throughout the paper.
Lastly, in a previous study [143] we reported a preliminary version of ourReference Architecture. Here we extend the work by: (i) framing the work inthe overall context of social sustainability, (ii) document the methodology usedto design our Reference Architecture, (iii) report a scenario-based evaluation
184
7.2. Background
of our Reference Architecture, (iv) provide a goal model to be used with theReference Architecture, (v) a viewpoint definition used to create the view ofour Reference Architecture.
7.2 Background
The notion of reference architecture (RA) is borrowed from Volpato et al.[362], who define it as “a special type of software architectures that providea characterisation of software systems functionalities in specific applicationdomains”, e.g., SOA for service orientation and AUTOSAR for automotive. Inthe context of this study, a self-adaptive software system is defined as a systemthat can autonomously handle changes and uncertainties in its environment,the system itself and its goals [373].
For the definition of personalisation we build on that by Fan and Poole[109] and define it as “a process that changes a system to increase its personalrelevance to an individual or a category of individuals”. Furthermore, to enhancepersonalisation, we use CluStream-GT (standing for: CluStream for GrowingTime-series). CluStream-GT was chosen for this RA as it is the state-of-the-artclustering algorithm for time-series data (especially within the Health domain).CluStream-GT works in two phases: offline and online. First, the offline phaseinitialises the algorithm with a small initial dataset; this is done either at designtime or at the start of runtime. After, during the online phase the algorithmclusters the data that is being collected at runtime. Clustering allows the RA togroup similar users together; where similarity is determined by the data gatheredfrom the apps. This gives the RA a more sustainable and scalable method ofpersonalisation, without requiring to create individual personalisation strategiesbut maintaining a suitable degree of personalisation [146; 177]. For a more indepth explanation of the algorithm and how clustering can aid personalisationwe refer the reader back to Chapters 3 and 4.
The methodology used for the design of our RA is the one presented byAngelov et al. [14] (see Fig. 7.1), where the authors present their RA Frameworkto facilitate software architects in the design of congruent RAs, i.e., RAs where
185
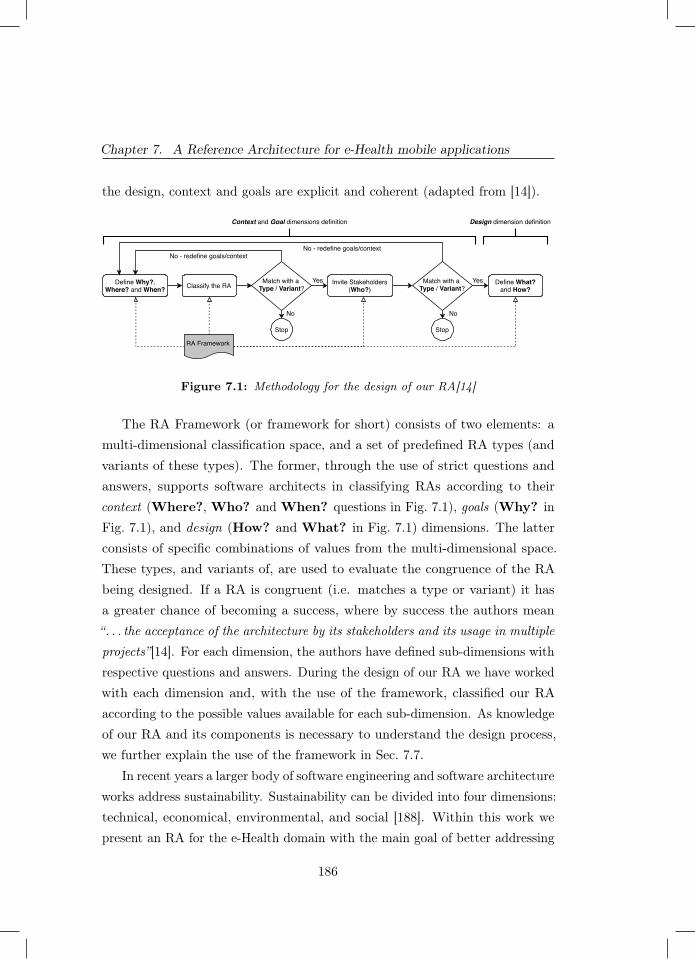
Chapter 7. A Reference Architecture for e-Health mobile applications
the design, context and goals are explicit and coherent (adapted from [14]).
Define Why?,Where? and When?
Invite Stakeholders(Who?)
Match with a Type / Variant?
Define What?and How?
Stop
Classify the RA
RA Framework
Context and Goal dimensions definition Design dimension definition
Match with a Type / Variant?
Stop
No No
Yes Yes
No - redefine goals/contextNo - redefine goals/context
Figure 7.1: Methodology for the design of our RA[14]
The RA Framework (or framework for short) consists of two elements: amulti-dimensional classification space, and a set of predefined RA types (andvariants of these types). The former, through the use of strict questions andanswers, supports software architects in classifying RAs according to theircontext (Where?, Who? and When? questions in Fig. 7.1), goals (Why? inFig. 7.1), and design (How? and What? in Fig. 7.1) dimensions. The latterconsists of specific combinations of values from the multi-dimensional space.These types, and variants of, are used to evaluate the congruence of the RAbeing designed. If a RA is congruent (i.e. matches a type or variant) it hasa greater chance of becoming a success, where by success the authors mean“. . . the acceptance of the architecture by its stakeholders and its usage in multipleprojects”[14]. For each dimension, the authors have defined sub-dimensions withrespective questions and answers. During the design of our RA we have workedwith each dimension and, with the use of the framework, classified our RAaccording to the possible values available for each sub-dimension. As knowledgeof our RA and its components is necessary to understand the design process,we further explain the use of the framework in Sec. 7.7.
In recent years a larger body of software engineering and software architectureworks address sustainability. Sustainability can be divided into four dimensions:technical, economical, environmental, and social [188]. Within this work wepresent an RA for the e-Health domain with the main goal of better addressing
186
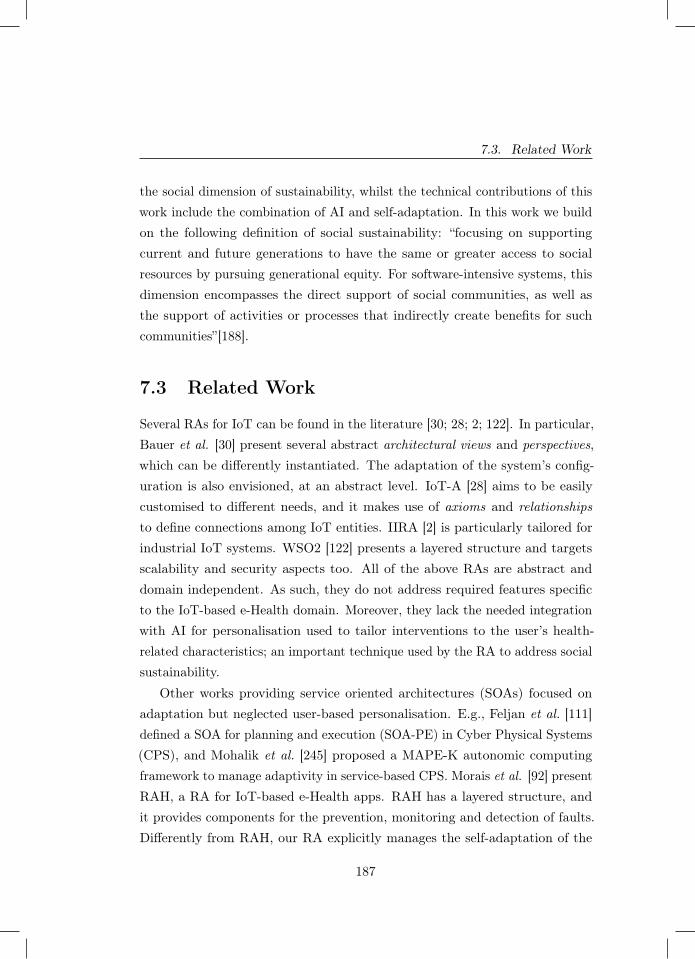
7.3. Related Work
the social dimension of sustainability, whilst the technical contributions of thiswork include the combination of AI and self-adaptation. In this work we buildon the following definition of social sustainability: “focusing on supportingcurrent and future generations to have the same or greater access to socialresources by pursuing generational equity. For software-intensive systems, thisdimension encompasses the direct support of social communities, as well asthe support of activities or processes that indirectly create benefits for suchcommunities”[188].
7.3 Related Work
Several RAs for IoT can be found in the literature [30; 28; 2; 122]. In particular,Bauer et al. [30] present several abstract architectural views and perspectives,which can be differently instantiated. The adaptation of the system’s config-uration is also envisioned, at an abstract level. IoT-A [28] aims to be easilycustomised to different needs, and it makes use of axioms and relationshipsto define connections among IoT entities. IIRA [2] is particularly tailored forindustrial IoT systems. WSO2 [122] presents a layered structure and targetsscalability and security aspects too. All of the above RAs are abstract anddomain independent. As such, they do not address required features specificto the IoT-based e-Health domain. Moreover, they lack the needed integrationwith AI for personalisation used to tailor interventions to the user’s health-related characteristics; an important technique used by the RA to address socialsustainability.
Other works providing service oriented architectures (SOAs) focused onadaptation but neglected user-based personalisation. E.g., Feljan et al. [111]defined a SOA for planning and execution (SOA-PE) in Cyber Physical Systems(CPS), and Mohalik et al. [245] proposed a MAPE-K autonomic computingframework to manage adaptivity in service-based CPS. Morais et al. [92] presentRAH, a RA for IoT-based e-Health apps. RAH has a layered structure, andit provides components for the prevention, monitoring and detection of faults.Differently from RAH, our RA explicitly manages the self-adaptation of the
187
Chapter 7. A Reference Architecture for e-Health mobile applications
e-Health mobile app, both at users- and architectural levels. Mizouni et al.[240] propose a framework for designing and developing context-aware adaptivemobile apps. Their framework lacks other types of adaptation, i.e., adaptationfor user personalisation and adaptation with other IoT devices – which ispossible with our RA.
Lopez and Condori-Fernandez [210] propose an architectural design for anadaptive persuasive mobile app with the goal of improving medication adherence.Accordingly, the adaptation is here focused only on the messages given to the userand lacks the other levels of adaptation (environment adaptation, etc.) that ourRA covers. Kim [176] proposes a general RA that can be used when developingadaptive apps and implements a e-Health app as an example. However, beingit general, the RA lacks the level of detail present in our work, the integrationof AI for personalisation, and a way for involving domain experts in the appdesign and operation, which is essential in adaptive e-Health.
In summary, to the best of our knowledge, ours is the first RA for e-Healthmobile apps that simultaneously supports (i) personalisation for the differentusers, by exploiting the users’ smart objects and preferences to dynamically getdata about e.g., their mood and daily activities, and (ii) runtime adaptation tothe user-needs and context in order to keep them engaged and active, so thatwe can better address social sustainability.
7.4 Reference Architecture
Fig. 7.2 shows our RA with the following stakeholders and components. Section7.8 defines the corresponding viewpoint.
Users provide and generate the Data gathered by the e-Health app. At thefirst installation, the users are asked to input information to better understandtheir aptitudes. After an initial usage phase and data collection, the systemhas enough information to assign them to a cluster.
Smartphone is the host where the self-adaptive e-Health app is installed.In the mobile app, four components, namely User Driven Adaptation Manager,Environment Driven Adaptation Manager, Smart Objects Manager and Inter-
188
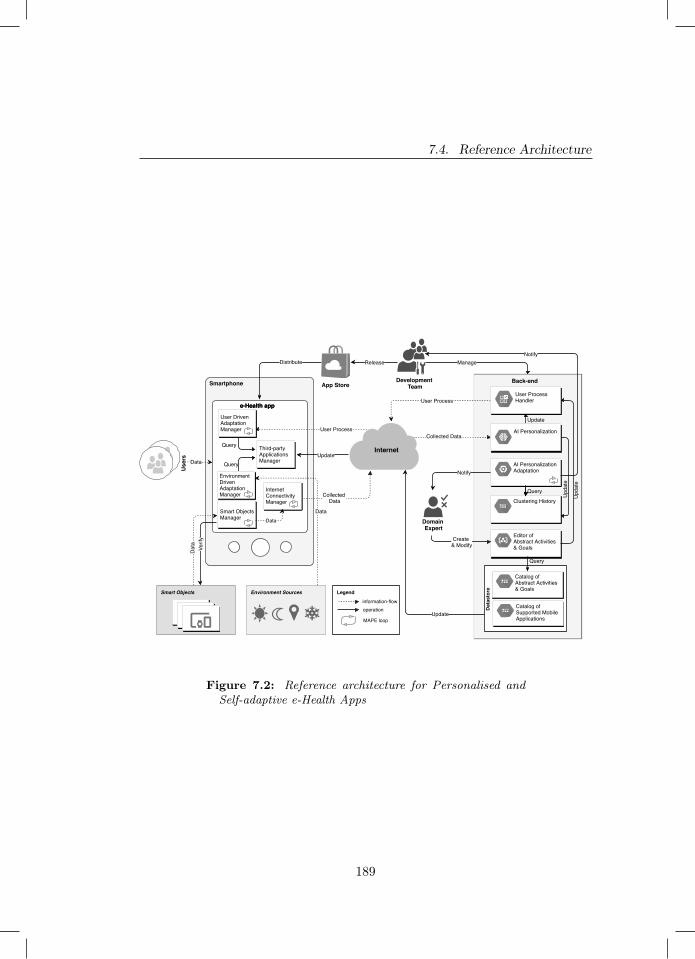
7.4. Reference Architecture
Smartphone
e-Health app
Smartphone
e-Health app
User Process
Smart Objects
Internet
Environment Sources
App StoreBack-end
Domain Expert
Development Team
Data
Use
rs
Distribute
Collected Data
Release
Data
Dat
a
AI Personalization Adaptation
Editor of Abstract Activities & Goals
Clustering History
Query
Create & Modify
Collected Data
User Process
Notify
Notify
Back-end
Upd
ate
Verif
y
Legend
information-flowoperation
MAPE loop
Update
Catalog of Abstract Activities & Goals
Catalog of Supported MobileApplications
Query
Datastore
Query
Query
Update
Update
Upd
ate
Manage
User ProcessHandler
AI Personalization
Internet Connectivity Manager
Smart Objects Manager
Environment Driven Adaptation Manager
User Driven Adaptation Manager
Third-party Applications Manager
Data
Figure 7.2: Reference architecture for Personalised andSelf-adaptive e-Health Apps
189
Chapter 7. A Reference Architecture for e-Health mobile applications
net Connectivity Manager implement a MAPE loop to dynamically performadaptation. The Third-party Applications Manager, in turn, is responsible forthe communication with third-party apps supported by the RA that can beexploited by the e-Health app both during its nominal execution and whenadaptation is performed. It is also responsible for storing the user’s preferences.Further details on these components are given in Sec. 7.5.
Smart Objects are devices, other than the smartphone, that the app cancommunicate with. They are used to gather additional data about the users aswell as augmenting the data collected by the smartphone sensors. For instance,a smart-watch would be used by the app to track the user’s heart-rate, thereforeadding extra information on the real-time performance of the user.
Environment is the physical location of the user, and its measurableproperties. It is used by the e-Health app to make runtime adaptations accordingto its current operational context and to the user’s scheduled activities, asdescribed in Sec. 7.5.5.
The back-end of our RA (right-hand side of Fig. 7.2) is Managed by aDevelopment team. It additionally exposes an interface to the Domain Expertthat is also involved in the e-Health app design and operation. The back-endcontains the components needed to store the collected user data and to managethe user clusters. It also hosts components supporting the general functioningof the app.
User Process Handler is in charge of sending User Processes to theusers, by taking care of sending the same User Process to all users of thesame cluster. A User Process is composed of one or more Abstract Activities.These activities are inspired by the ones introduced in [47], although they differboth in the structure and in the way they are refined, as later explained. AnAbstract Activity is defined by a vector of one or more Activity categories and anassociated goal, with each vector entry representing a day of the week. Examplesof Abstract Activities are discussed later in section 7.9.
Each Abstract Activity is defined by the Domain Expert via the Editor ofAbstract Activities & Goals and later stored in the Catalog of Abstract Activities& Goals. Each Activity category identifies the kind of activity the user should
190
7.4. Reference Architecture
perform. As an example, the user can receive either a Cardio or Strength Activitycategory and so should perform an activity of that kind. More precisely, for eachuser, the Activity categories are converted to Concrete Activities at run-timevia the use of the User Driven Adaptation Manager and based on the user’spreferences. For instance, a cardio Activity category can be instantiated intodifferent Concrete Activities such as running, swimming and walking. Moreover,if an Abstract Activity is composed of multiple Activity categories, all or someof type Cardio, they can be converted into different Concrete Activities. Thisimplies that users who receive the same User Process will still be likely tohave different Concrete Activities, therefore personalising the experience to theindividual user (this is further discussed in Sec. 7.5.2).
The goals associated with an Abstract Activity are also important for distin-guishing between Abstract Activities, besides for converting them into ConcreteActivities. Two Abstract Activities containing the same vector of Activitycategories can be different solely based on their associated goal. More detailson the goal model are given in Sec. 7.6.
The User Process Handler receives Updates from (i) the AI Personalizationand (ii) the Editor of Abstract Activities & Goals in order to send User Processesto their associated users. The AI Personalization Updates the User ProcessHandler every time a user moves from one cluster to another, while the Editorof Abstract Activities & Goals Updates it every time new clusters are analyzedby the Domain Expert (along with the new associated User Process). Theseupdates guarantee that the User Process Handler remains up to date aboutthe User Processes and their associated users.
AI Personalization sends an Update to the Clustering History componentwhenever a change occurs in the clusters. The AI Personalization componentuses the CluStream-GT algorithm to cluster users into clusters in a real-timeand online fashion [146]. It receives the input data from the e-Health app (seeCollected Data in Fig. 7.2). More than one instance of CluStream-GT can berunning at the same time. In fact, there is one instance per category of data.E.g., if the e-Health app is recording both ecological momentary assessment[318] and biometric data, one for the purpose of monitoring mood and the
191
Chapter 7. A Reference Architecture for e-Health mobile applications
other for fitness, there will be two running instances of the algorithm.
AI Personalization Adaptation is in charge of monitoring the evolutionof clusters and detecting if any change occurs. Examples include the mergingof two clusters or the generation of a new one. To do so, it periodically Queriesthe Clustering History database. If one or more new clusters are detected, thiscomponent will Notify both the Development Team and the Domain Expert.The Domain Expert will examine the new information and add the appropriateUser Process to the Catalog of Abstract Activities & Goals via the dedicatededitor. In turn, the Development Team is notified just as a precaution sothat it can verify if the new cluster is not an anomaly. The specifics of thecorresponding MAPE loop are described in Sec. 7.5.1.
The role played by AI via the CluStream-GT algorithm is relevant in ourRA as it strongly supports both personalisation and self-adaptation, thusguaranteeing a continuous user engagement that is crucial in e-Health apps.Specifically, personalisation is achieved by clustering the users based on theirpreferences and their physical and mental condition. This supports the RA inassigning appropriate User Processes to each user, and further adapt them tocontinuously cope with the current status of the user and by doing so betteraddressing social sustainability concerns.
Clustering History is a database of all the clusters created by the AIPersonalization component. For each cluster it keeps all of the composingmicro-clusters with all of their contained information.
Editor of Abstract Activities & Goals allows the Domain Expert tocreate and modify Abstract Activities (and their associated goals) and to combinethem as User Processes. This is achieved via a web-based interactive UI andthe editor’s ability to Query the Catalog of Abstract Activities & Goals. It isalso the editor’s responsibility to update the User Process Handler if any newUser Process has been created and is currently in use.
Catalog of Abstract Activities & Goals is a database of all User Pro-cesses that the Domain Expert has created for each unique current and pastcluster. When a new cluster is defined, the Domain Expert can assign to it anexisting User Process from this catalog, or create a new one and store it.
192
7.4. Reference Architecture
Catalog of Supported Mobile Applications is a database containingthe metadata needed for interacting with supported third-party mobile appsinstalled on users’ devices. This database stores information such as the specifictypes of Android intents (and their related extra data) needed for launchingeach third-party app, the data it produces after a tracking session, etc. Indeed,our e-Health app does not provide any specific functionality for executing theactivities suggested to the user (e.g., running, swimming); rather, it bringsup third-party apps (e.g., Strava1 for running and cycling, Swim.com2 forswimming) and collects the data produced by the apps after the user performsthe physical activities. The main reasons for this design decision are: (i) wedo not want to disrupt the users’ habits and preferences in terms of apps usedfor tracking their activities, (ii) we want to build on existing large user bases,(iii) we do not want to reinvent the wheel by re-implementing functionalitiesalready supported by development teams with years-long experience.
Whenever the e-Health app evolves by supporting new applications (orno longer supporting certain applications), the Catalog of Supported MobileApplications Updates, through the Datastore, the Third-party ApplicationsManager. The Third-party Applications Manager responsibility is to keepthe list of supported mobile apps up to date and provide the correspondingmetadata to the User Driven Adaptation Manager and the Environment DrivenAdaptation Manager, when needed.
The e-Health app and back-end communicate via the Internet. Specifically,the communication from the e-Health app to the back-end is REST-based andit is performed by the Internet Connectivity Manager, which is responsiblefor sending the Collected Data to the AI Personalization component in theback-end. Communication from the back-end to the e-Health app is performedby the User Process Handler which is in charge of sending the User Process tothe e-Health app via push notifications.
1 http://strava.com 2 http://swim.com
193
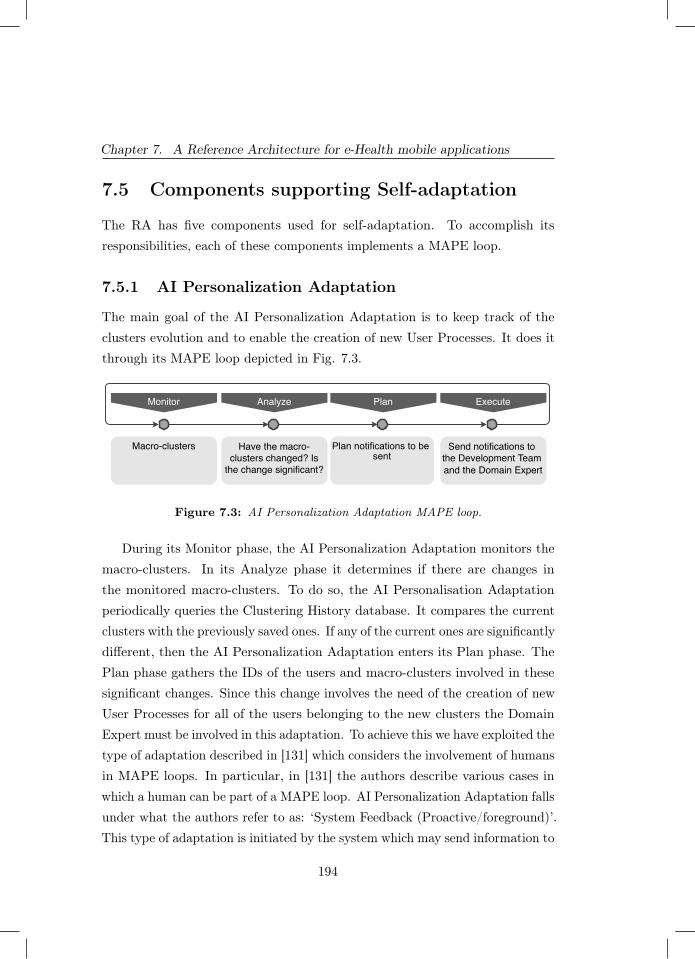
Chapter 7. A Reference Architecture for e-Health mobile applications
7.5 Components supporting Self-adaptation
The RA has five components used for self-adaptation. To accomplish itsresponsibilities, each of these components implements a MAPE loop.
7.5.1 AI Personalization Adaptation
The main goal of the AI Personalization Adaptation is to keep track of theclusters evolution and to enable the creation of new User Processes. It does itthrough its MAPE loop depicted in Fig. 7.3.
Monitor Plan
Macro-clusters Have the macro-clusters changed? Is
the change significant?
Plannotificationstobesent
Send notifications to the Development Team and the Domain Expert
Analyze Execute
Figure 7.3: AI Personalization Adaptation MAPE loop.
During its Monitor phase, the AI Personalization Adaptation monitors themacro-clusters. In its Analyze phase it determines if there are changes inthe monitored macro-clusters. To do so, the AI Personalisation Adaptationperiodically queries the Clustering History database. It compares the currentclusters with the previously saved ones. If any of the current ones are significantlydifferent, then the AI Personalization Adaptation enters its Plan phase. ThePlan phase gathers the IDs of the users and macro-clusters involved in thesesignificant changes. Since this change involves the need of the creation of newUser Processes for all of the users belonging to the new clusters the DomainExpert must be involved in this adaptation. To achieve this we have exploited thetype of adaptation described in [131] which considers the involvement of humansin MAPE loops. In particular, in [131] the authors describe various cases inwhich a human can be part of a MAPE loop. AI Personalization Adaptation fallsunder what the authors refer to as: ‘System Feedback (Proactive/foreground)’.This type of adaptation is initiated by the system which may send information to
194
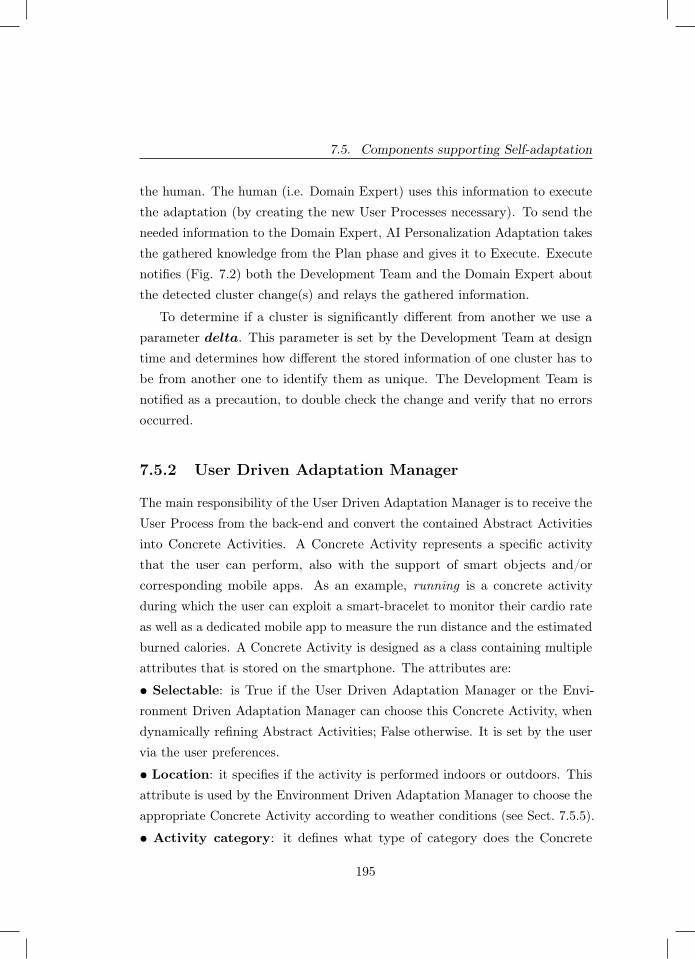
7.5. Components supporting Self-adaptation
the human. The human (i.e. Domain Expert) uses this information to executethe adaptation (by creating the new User Processes necessary). To send theneeded information to the Domain Expert, AI Personalization Adaptation takesthe gathered knowledge from the Plan phase and gives it to Execute. Executenotifies (Fig. 7.2) both the Development Team and the Domain Expert aboutthe detected cluster change(s) and relays the gathered information.
To determine if a cluster is significantly different from another we use aparameter delta. This parameter is set by the Development Team at designtime and determines how different the stored information of one cluster has tobe from another one to identify them as unique. The Development Team isnotified as a precaution, to double check the change and verify that no errorsoccurred.
7.5.2 User Driven Adaptation Manager
The main responsibility of the User Driven Adaptation Manager is to receive theUser Process from the back-end and convert the contained Abstract Activitiesinto Concrete Activities. A Concrete Activity represents a specific activitythat the user can perform, also with the support of smart objects and/orcorresponding mobile apps. As an example, running is a concrete activityduring which the user can exploit a smart-bracelet to monitor their cardio rateas well as a dedicated mobile app to measure the run distance and the estimatedburned calories. A Concrete Activity is designed as a class containing multipleattributes that is stored on the smartphone. The attributes are:
• Selectable: is True if the User Driven Adaptation Manager or the Envi-ronment Driven Adaptation Manager can choose this Concrete Activity, whendynamically refining Abstract Activities; False otherwise. It is set by the uservia the user preferences.
• Location: it specifies if the activity is performed indoors or outdoors. Thisattribute is used by the Environment Driven Adaptation Manager to choose theappropriate Concrete Activity according to weather conditions (see Sect. 7.5.5).
• Activity category: it defines what type of category does the Concrete
195
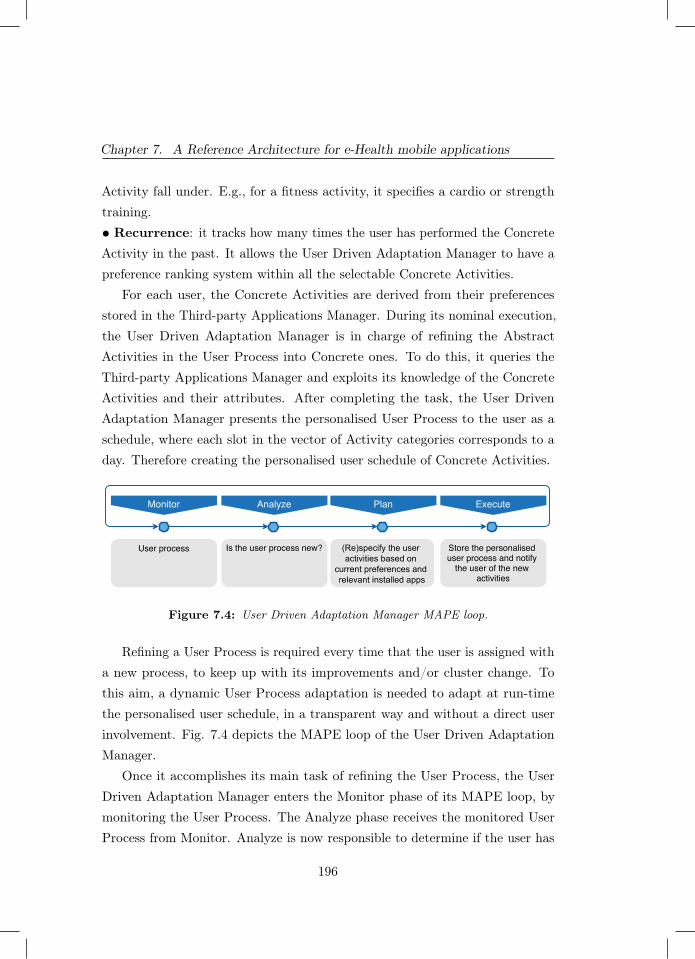
Chapter 7. A Reference Architecture for e-Health mobile applications
Activity fall under. E.g., for a fitness activity, it specifies a cardio or strengthtraining.• Recurrence: it tracks how many times the user has performed the ConcreteActivity in the past. It allows the User Driven Adaptation Manager to have apreference ranking system within all the selectable Concrete Activities.
For each user, the Concrete Activities are derived from their preferencesstored in the Third-party Applications Manager. During its nominal execution,the User Driven Adaptation Manager is in charge of refining the AbstractActivities in the User Process into Concrete ones. To do this, it queries theThird-party Applications Manager and exploits its knowledge of the ConcreteActivities and their attributes. After completing the task, the User DrivenAdaptation Manager presents the personalised User Process to the user as aschedule, where each slot in the vector of Activity categories corresponds to aday. Therefore creating the personalised user schedule of Concrete Activities.
Monitor Plan
User process Is the user process new? (Re)specifytheuseractivitiesbasedon
currentpreferencesandrelevantinstalledapps
Store the personalised user process and notify
the user of the new activities
Analyze Execute
Figure 7.4: User Driven Adaptation Manager MAPE loop.
Refining a User Process is required every time that the user is assigned witha new process, to keep up with its improvements and/or cluster change. Tothis aim, a dynamic User Process adaptation is needed to adapt at run-timethe personalised user schedule, in a transparent way and without a direct userinvolvement. Fig. 7.4 depicts the MAPE loop of the User Driven AdaptationManager.
Once it accomplishes its main task of refining the User Process, the UserDriven Adaptation Manager enters the Monitor phase of its MAPE loop, bymonitoring the User Process. The Analyze phase receives the monitored UserProcess from Monitor. Analyze is now responsible to determine if the user has
196

7.5. Components supporting Self-adaptation
been assigned a new User Process. If so, the User Driven Adaptation Managerconverts the Abstract Activities in this new User Process into Concrete ones,taking into account the user preferences. It makes this conversion by findingsuitable Concrete activities during the Plan phase. As all of the AbstractActivities have been matched with a corresponding Concrete activity, theExecute phase makes the conversion, storing this newly created personalisedUser Process and notifying the user about the new activity schedule.
7.5.3 Smart Objects Manager
This component aims to maintain the connection with the user’s smart objectsand, if not possible, find alternative sensors to make the e-Health app ableto continuously collect user’s data, thus to perform optimally. To this aim, itimplements a MAPE loop, shown in Fig. 7.5, supporting the dynamic adaptationat the architectural level of the smart objects.
Monitor Plan
Connection status ofthe smart objects
Has the connectionstatus (on/off)
changed?
Execute the plan in asequential manner
Analyze Execute
Create a plan ofaction(s) to solve theconnection problem
Figure 7.5: Smart Objects Manager MAPE loop.
The Monitor phase is devoted to the run-time monitoring of the connectionstatus with the smart objects. Connection problems can be due to either thesmart objects themselves, which can be out of battery, or to missing internet,Bluetooth or Bluetooth low energy connectivity. The Analyze phase is in chargeof verifying the current connection status (received by Monitor) and see ifthe connection status with any of the smart objects has changed. During thePlan phase the MAPE will create a sequential plan of actions that the Executewill have to perform. All of the actions are aimed at re-establishing the lostconnection or at finding a new source of data (e.g. reconnect, notify the user,
197

Chapter 7. A Reference Architecture for e-Health mobile applications
find a new source of data). For instance, if the smart-watch connected to thesmartphone runs out of battery and the attempts to reconnect to it fail, theSmart Objects Manager will switch to sensors inbuilt in the smartphone (suchas the accelerometer).
7.5.4 Internet Connectivity Manager
The main purposes of the Internet Connectivity Manager are to (i) send theCollected Data to the back-end and store them locally when the connection ismissing, and (ii) provide resilience to the e-Health app’s internet connectivity.
As shown in the MAPE loop in Fig. 7.6, during the Monitor phase theInternet Connectivity Manager runtime monitors the quality of the smartphone’sinternet connection.
Monitor Plan
Internet connectionquality
Has the qualitysignificantly altered?
Changethemeanofconnectionorstorethedatalocallyandsend
whenpossible
Establish new connection or
store/send data
Analyze Execute
Figure 7.6: Internet Connectivity Manager MAPE loop.
Analyze is then in charge of detecting whether a significant connectionquality alteration is taking place. If so, the Internet Connectivity Managerenters the Plan phase and it plans for an alternative. The alternative can includeswitching the connection type or storing the currently collected data locally onthe smartphone. As a new connection can be established, the component sendsthe data to the back-end to be used by the AI Personalization.
7.5.5 Environment Driven Adaptation Manager
One of the objectives of the e-Health app is keeping the users constantly engaged,to ensure that they execute their planned schedule of activities. To this aim,
198
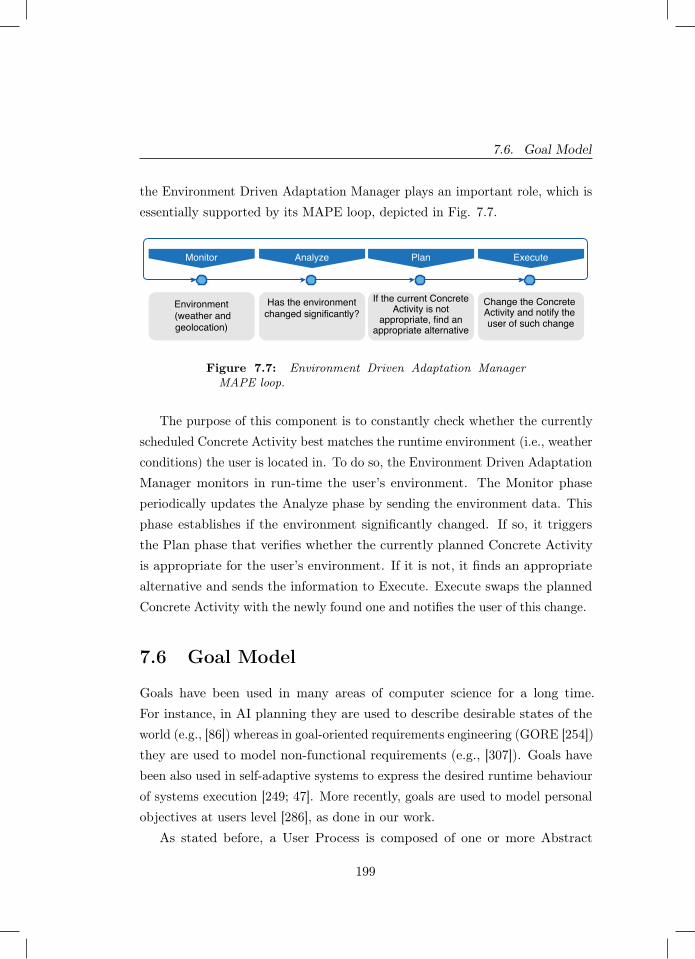
7.6. Goal Model
the Environment Driven Adaptation Manager plays an important role, which isessentially supported by its MAPE loop, depicted in Fig. 7.7.
Monitor Plan
Environment (weather andgeolocation)
Has the environmentchanged significantly?
Change the Concrete Activity and notify the user of such change
Analyze Execute
If the current ConcreteActivity is not
appropriate, find anappropriate alternative
Figure 7.7: Environment Driven Adaptation ManagerMAPE loop.
The purpose of this component is to constantly check whether the currentlyscheduled Concrete Activity best matches the runtime environment (i.e., weatherconditions) the user is located in. To do so, the Environment Driven AdaptationManager monitors in run-time the user’s environment. The Monitor phaseperiodically updates the Analyze phase by sending the environment data. Thisphase establishes if the environment significantly changed. If so, it triggersthe Plan phase that verifies whether the currently planned Concrete Activityis appropriate for the user’s environment. If it is not, it finds an appropriatealternative and sends the information to Execute. Execute swaps the plannedConcrete Activity with the newly found one and notifies the user of this change.
7.6 Goal Model
Goals have been used in many areas of computer science for a long time.For instance, in AI planning they are used to describe desirable states of theworld (e.g., [86]) whereas in goal-oriented requirements engineering (GORE [254])they are used to model non-functional requirements (e.g., [307]). Goals havebeen also used in self-adaptive systems to express the desired runtime behaviourof systems execution [249; 47]. More recently, goals are used to model personalobjectives at users level [286], as done in our work.
As stated before, a User Process is composed of one or more Abstract
199
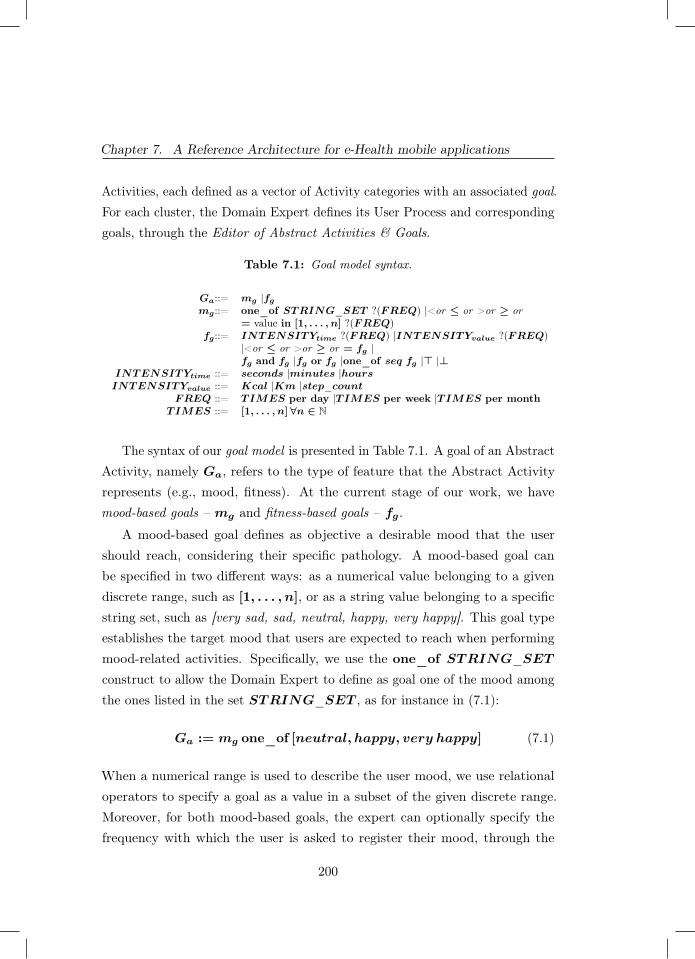
Chapter 7. A Reference Architecture for e-Health mobile applications
Activities, each defined as a vector of Activity categories with an associated goal.For each cluster, the Domain Expert defines its User Process and correspondinggoals, through the Editor of Abstract Activities & Goals.
Table 7.1: Goal model syntax.
Ga::= mg |fg
mg::= one_of STRING_SET ?(FREQ) |<or ≤ or >or ≥ or= value in [1, . . . , n] ?(FREQ)
fg::= INTENSITYtime ?(FREQ) |INTENSITYvalue ?(FREQ)|<or ≤ or >or ≥ or = fg |fg and fg |fg or fg |one_of seq fg |> |⊥
INTENSITYtime ::= seconds |minutes |hoursINTENSITYvalue ::= Kcal |Km |step_count
FREQ ::= TIMES per day |TIMES per week |TIMES per monthTIMES ::= [1, . . . , n] ∀n ∈ N
The syntax of our goal model is presented in Table 7.1. A goal of an AbstractActivity, namely Ga, refers to the type of feature that the Abstract Activityrepresents (e.g., mood, fitness). At the current stage of our work, we havemood-based goals – mg and fitness-based goals – fg.
A mood-based goal defines as objective a desirable mood that the usershould reach, considering their specific pathology. A mood-based goal canbe specified in two different ways: as a numerical value belonging to a givendiscrete range, such as [1, . . . , n], or as a string value belonging to a specificstring set, such as [very sad, sad, neutral, happy, very happy]. This goal typeestablishes the target mood that users are expected to reach when performingmood-related activities. Specifically, we use the one_of STRING_SET
construct to allow the Domain Expert to define as goal one of the mood amongthe ones listed in the set STRING_SET , as for instance in (7.1):
Ga := mg one_of [neutral, happy, very happy] (7.1)
When a numerical range is used to describe the user mood, we use relationaloperators to specify a goal as a value in a subset of the given discrete range.Moreover, for both mood-based goals, the expert can optionally specify thefrequency with which the user is asked to register their mood, through the
200
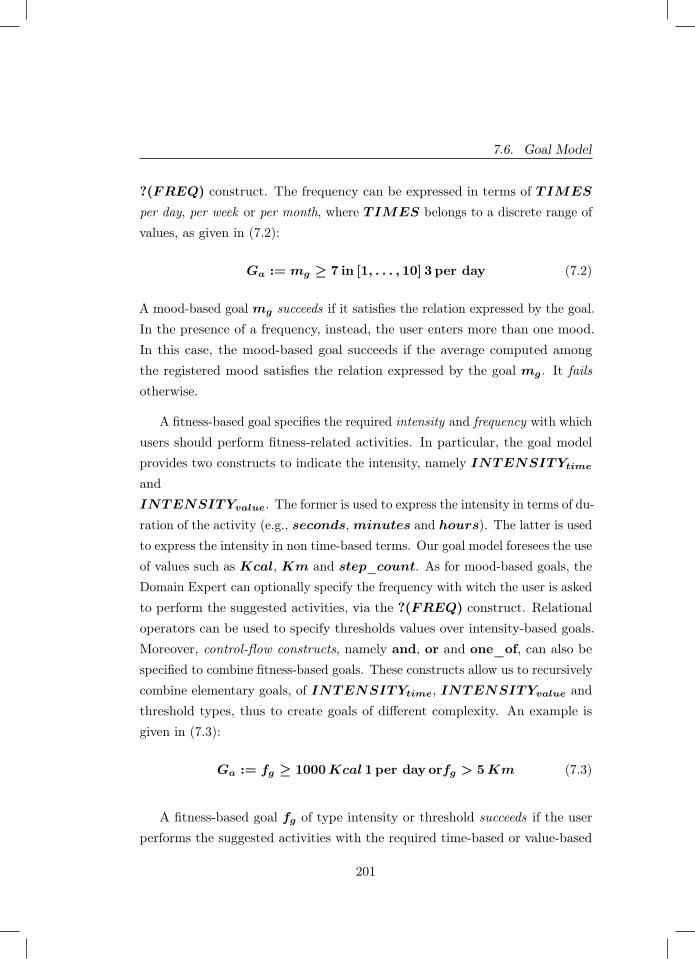
7.6. Goal Model
?(FREQ) construct. The frequency can be expressed in terms of TIMES
per day, per week or per month, where TIMES belongs to a discrete range ofvalues, as given in (7.2):
Ga := mg ≥ 7 in [1, . . . , 10] 3 per day (7.2)
A mood-based goal mg succeeds if it satisfies the relation expressed by the goal.In the presence of a frequency, instead, the user enters more than one mood.In this case, the mood-based goal succeeds if the average computed amongthe registered mood satisfies the relation expressed by the goal mg. It failsotherwise.
A fitness-based goal specifies the required intensity and frequency with whichusers should perform fitness-related activities. In particular, the goal modelprovides two constructs to indicate the intensity, namely INTENSITYtime
andINTENSITYvalue. The former is used to express the intensity in terms of du-ration of the activity (e.g., seconds, minutes and hours). The latter is usedto express the intensity in non time-based terms. Our goal model foresees the useof values such as Kcal, Km and step_count. As for mood-based goals, theDomain Expert can optionally specify the frequency with witch the user is askedto perform the suggested activities, via the ?(FREQ) construct. Relationaloperators can be used to specify thresholds values over intensity-based goals.Moreover, control-flow constructs, namely and, or and one_of, can also bespecified to combine fitness-based goals. These constructs allow us to recursivelycombine elementary goals, of INTENSITYtime, INTENSITYvalue andthreshold types, thus to create goals of different complexity. An example isgiven in (7.3):
Ga := fg ≥ 1000Kcal 1 per day orfg > 5Km (7.3)
A fitness-based goal fg of type intensity or threshold succeeds if the userperforms the suggested activities with the required time-based or value-based
201
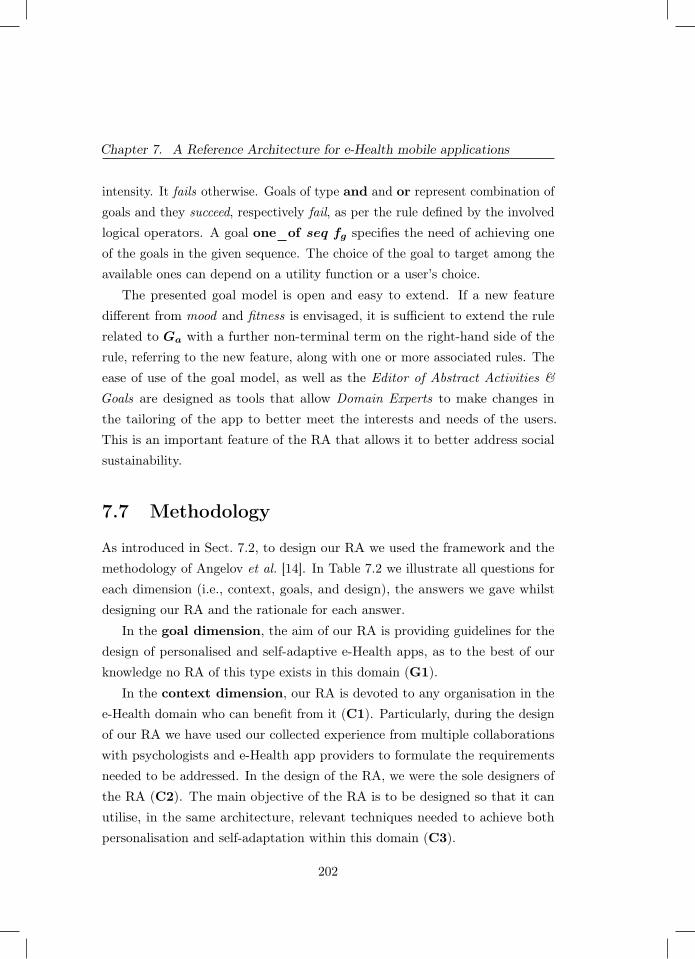
Chapter 7. A Reference Architecture for e-Health mobile applications
intensity. It fails otherwise. Goals of type and and or represent combination ofgoals and they succeed, respectively fail, as per the rule defined by the involvedlogical operators. A goal one_of seq fg specifies the need of achieving oneof the goals in the given sequence. The choice of the goal to target among theavailable ones can depend on a utility function or a user’s choice.
The presented goal model is open and easy to extend. If a new featuredifferent from mood and fitness is envisaged, it is sufficient to extend the rulerelated to Ga with a further non-terminal term on the right-hand side of therule, referring to the new feature, along with one or more associated rules. Theease of use of the goal model, as well as the Editor of Abstract Activities &Goals are designed as tools that allow Domain Experts to make changes inthe tailoring of the app to better meet the interests and needs of the users.This is an important feature of the RA that allows it to better address socialsustainability.
7.7 Methodology
As introduced in Sect. 7.2, to design our RA we used the framework and themethodology of Angelov et al. [14]. In Table 7.2 we illustrate all questions foreach dimension (i.e., context, goals, and design), the answers we gave whilstdesigning our RA and the rationale for each answer.
In the goal dimension, the aim of our RA is providing guidelines for thedesign of personalised and self-adaptive e-Health apps, as to the best of ourknowledge no RA of this type exists in this domain (G1).
In the context dimension, our RA is devoted to any organisation in thee-Health domain who can benefit from it (C1). Particularly, during the designof our RA we have used our collected experience from multiple collaborationswith psychologists and e-Health app providers to formulate the requirementsneeded to be addressed. In the design of the RA, we were the sole designers ofthe RA (C2). The main objective of the RA is to be designed so that it canutilise, in the same architecture, relevant techniques needed to achieve bothpersonalisation and self-adaptation within this domain (C3).
202
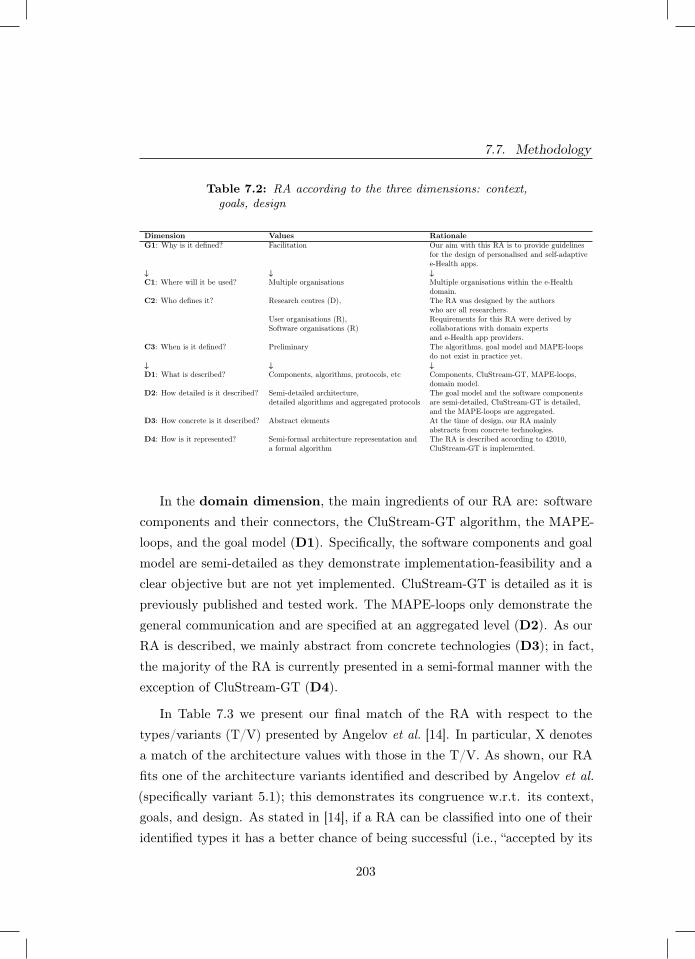
7.7. Methodology
Table 7.2: RA according to the three dimensions: context,goals, design
Dimension Values RationaleG1: Why is it defined? Facilitation Our aim with this RA is to provide guidelines
for the design of personalised and self-adaptivee-Health apps.
↓ ↓ ↓C1: Where will it be used? Multiple organisations Multiple organisations within the e-Health
domain.C2: Who defines it? Research centres (D), The RA was designed by the authors
who are all researchers.User organisations (R),Software organisations (R)
Requirements for this RA were derived bycollaborations with domain expertsand e-Health app providers.
C3: When is it defined? Preliminary The algorithms, goal model and MAPE-loopsdo not exist in practice yet.
↓ ↓ ↓D1: What is described? Components, algorithms, protocols, etc Components, CluStream-GT, MAPE-loops,
domain model.D2: How detailed is it described? Semi-detailed architecture,
detailed algorithms and aggregated protocolsThe goal model and the software componentsare semi-detailed, CluStream-GT is detailed,and the MAPE-loops are aggregated.
D3: How concrete is it described? Abstract elements At the time of design, our RA mainlyabstracts from concrete technologies.
D4: How is it represented? Semi-formal architecture representation anda formal algorithm
The RA is described according to 42010,CluStream-GT is implemented.
In the domain dimension, the main ingredients of our RA are: softwarecomponents and their connectors, the CluStream-GT algorithm, the MAPE-loops, and the goal model (D1). Specifically, the software components and goalmodel are semi-detailed as they demonstrate implementation-feasibility and aclear objective but are not yet implemented. CluStream-GT is detailed as it ispreviously published and tested work. The MAPE-loops only demonstrate thegeneral communication and are specified at an aggregated level (D2). As ourRA is described, we mainly abstract from concrete technologies (D3); in fact,the majority of the RA is currently presented in a semi-formal manner with theexception of CluStream-GT (D4).
In Table 7.3 we present our final match of the RA with respect to thetypes/variants (T/V) presented by Angelov et al. [14]. In particular, X denotesa match of the architecture values with those in the T/V. As shown, our RAfits one of the architecture variants identified and described by Angelov et al.(specifically variant 5.1); this demonstrates its congruence w.r.t. its context,goals, and design. As stated in [14], if a RA can be classified into one of theiridentified types it has a better chance of being successful (i.e., “accepted by its
203
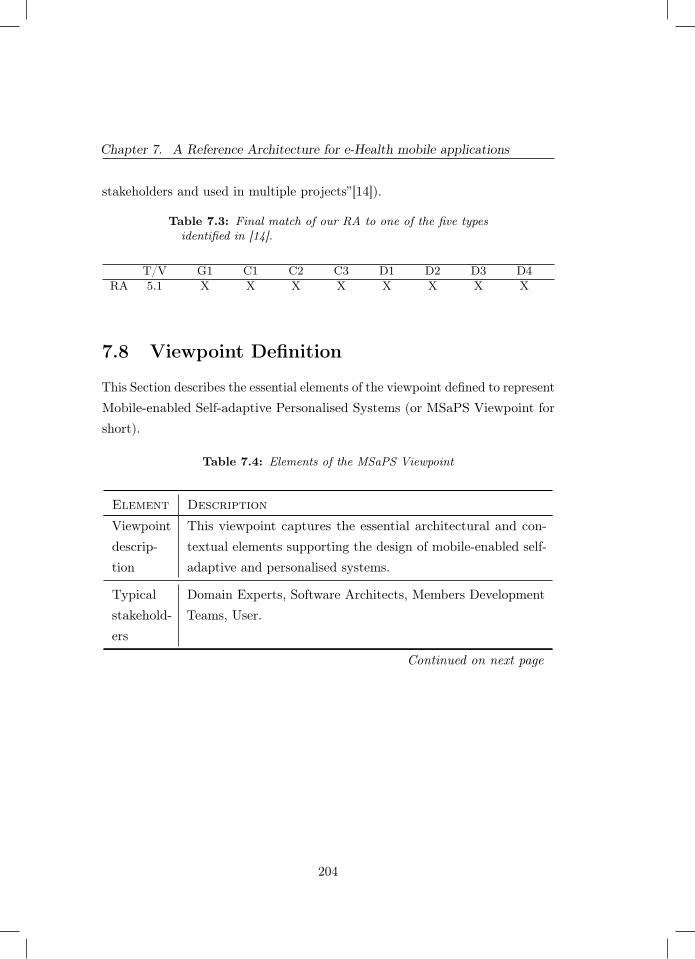
Chapter 7. A Reference Architecture for e-Health mobile applications
stakeholders and used in multiple projects”[14]).
Table 7.3: Final match of our RA to one of the five typesidentified in [14].
T/V G1 C1 C2 C3 D1 D2 D3 D4RA 5.1 X X X X X X X X
7.8 Viewpoint Definition
This Section describes the essential elements of the viewpoint defined to representMobile-enabled Self-adaptive Personalised Systems (or MSaPS Viewpoint forshort).
Table 7.4: Elements of the MSaPS Viewpoint
Element Description
Viewpointdescrip-tion
This viewpoint captures the essential architectural and con-textual elements supporting the design of mobile-enabled self-adaptive and personalised systems.
Typicalstakehold-ers
Domain Experts, Software Architects, Members DevelopmentTeams, User.
Continued on next page
204
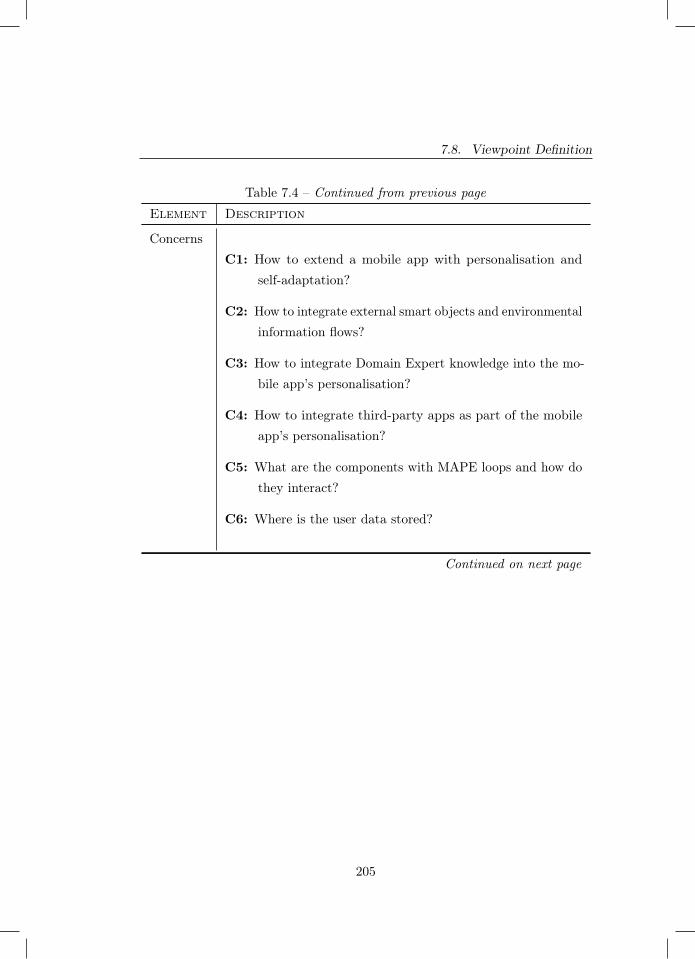
7.8. Viewpoint Definition
Table 7.4 – Continued from previous page
Element Description
ConcernsC1: How to extend a mobile app with personalisation and
self-adaptation?
C2: How to integrate external smart objects and environmentalinformation flows?
C3: How to integrate Domain Expert knowledge into the mo-bile app’s personalisation?
C4: How to integrate third-party apps as part of the mobileapp’s personalisation?
C5: What are the components with MAPE loops and how dothey interact?
C6: Where is the user data stored?
Continued on next page
205
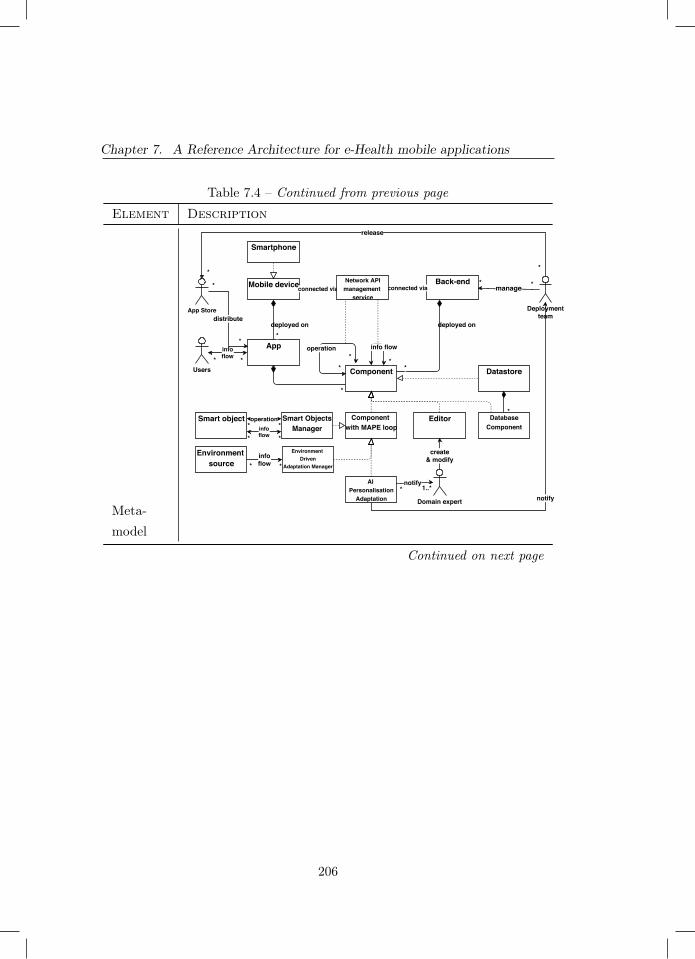
Chapter 7. A Reference Architecture for e-Health mobile applications
Table 7.4 – Continued from previous page
Element Description
Meta-model
Environment source
Smart object
Mobile device
Smartphone
App*
deployed on
Back-end
Datastore
deployed on
Users Component
Component with MAPE loop
connected via connected via
*
operation
**
info flow
*
infoflow* *
*
Environment Driven
Adaptation Manager
Smart ObjectsManager
operation* *
infoflow **
infoflow* *
manage* *
Deploymentteam
notify
AI Personalisation
Adaptation Domain expert
distribute
*
App Store
notify1..**
Editor
create& modify
Network APImanagement
service
release
**
*Database
Component
*
Continued on next page
206
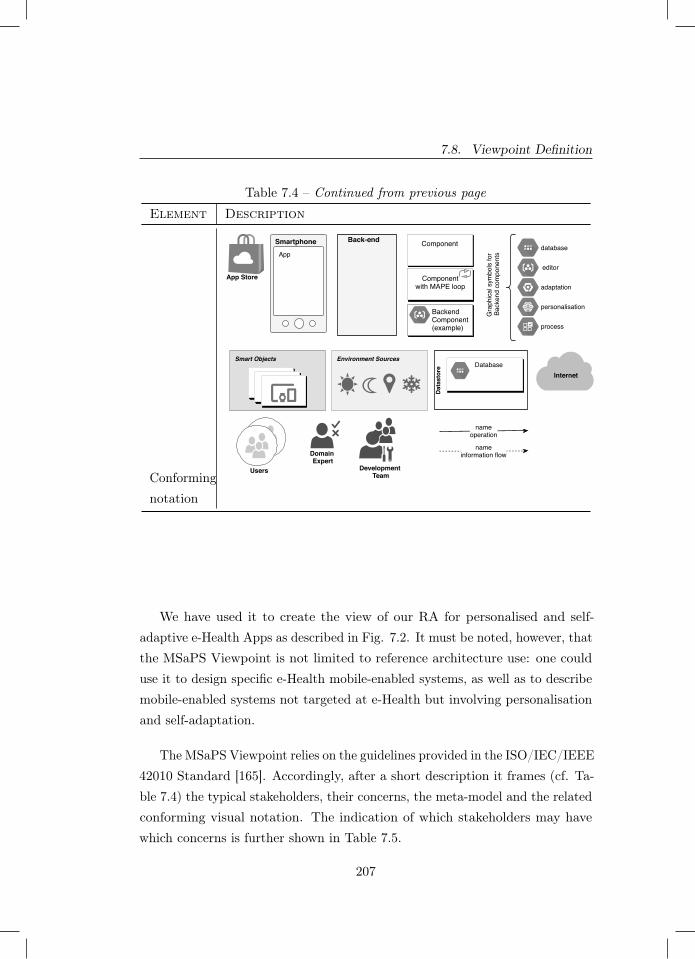
7.8. Viewpoint Definition
Table 7.4 – Continued from previous page
Element Description
Conformingnotation
Domain Expert
App Store
nameoperation
Componentwith MAPE loop
SmartphoneApp
Back-end
nameinformation flow
Development Team
Datastore
DatabaseSmart Objects
Internet
Users
Component
BackendComponent(example)
database
editor
personalisation
adaptation
process
Gra
phic
al s
ymbo
ls fo
r Ba
cken
d co
mpo
nent
s
Environment Sources
We have used it to create the view of our RA for personalised and self-adaptive e-Health Apps as described in Fig. 7.2. It must be noted, however, thatthe MSaPS Viewpoint is not limited to reference architecture use: one coulduse it to design specific e-Health mobile-enabled systems, as well as to describemobile-enabled systems not targeted at e-Health but involving personalisationand self-adaptation.
The MSaPS Viewpoint relies on the guidelines provided in the ISO/IEC/IEEE42010 Standard [165]. Accordingly, after a short description it frames (cf. Ta-ble 7.4) the typical stakeholders, their concerns, the meta-model and the relatedconforming visual notation. The indication of which stakeholders may havewhich concerns is further shown in Table 7.5.
207
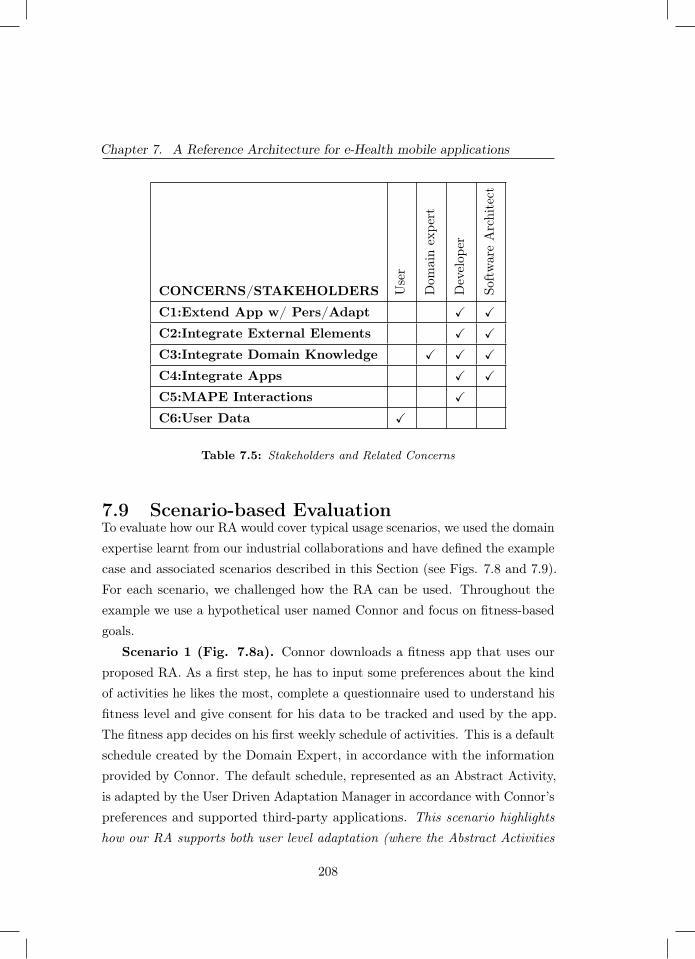
Chapter 7. A Reference Architecture for e-Health mobile applications
CONCERNS/STAKEHOLDERS Use
r
Dom
ain
expe
rt
Dev
elop
er
Soft
war
eA
rchi
tect
C1:Extend App w/ Pers/Adapt X X
C2:Integrate External Elements X X
C3:Integrate Domain Knowledge X X X
C4:Integrate Apps X X
C5:MAPE Interactions X
C6:User Data X
Table 7.5: Stakeholders and Related Concerns
7.9 Scenario-based EvaluationTo evaluate how our RA would cover typical usage scenarios, we used the domainexpertise learnt from our industrial collaborations and have defined the examplecase and associated scenarios described in this Section (see Figs. 7.8 and 7.9).For each scenario, we challenged how the RA can be used. Throughout theexample we use a hypothetical user named Connor and focus on fitness-basedgoals.
Scenario 1 (Fig. 7.8a). Connor downloads a fitness app that uses ourproposed RA. As a first step, he has to input some preferences about the kindof activities he likes the most, complete a questionnaire used to understand hisfitness level and give consent for his data to be tracked and used by the app.The fitness app decides on his first weekly schedule of activities. This is a defaultschedule created by the Domain Expert, in accordance with the informationprovided by Connor. The default schedule, represented as an Abstract Activity,is adapted by the User Driven Adaptation Manager in accordance with Connor’spreferences and supported third-party applications. This scenario highlightshow our RA supports both user level adaptation (where the Abstract Activities
208
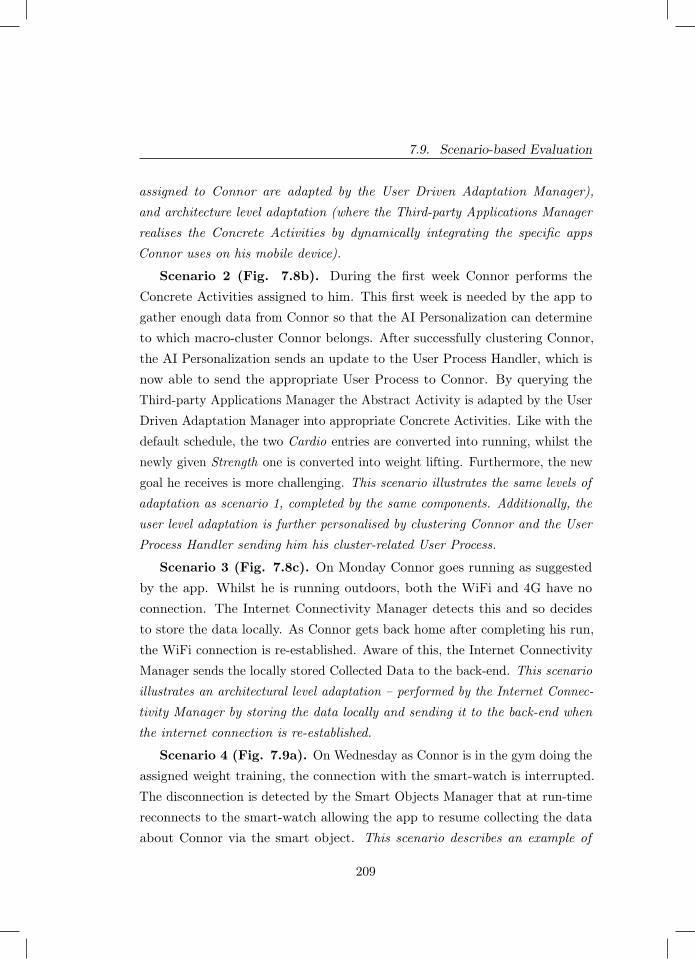
7.9. Scenario-based Evaluation
assigned to Connor are adapted by the User Driven Adaptation Manager),and architecture level adaptation (where the Third-party Applications Managerrealises the Concrete Activities by dynamically integrating the specific appsConnor uses on his mobile device).
Scenario 2 (Fig. 7.8b). During the first week Connor performs theConcrete Activities assigned to him. This first week is needed by the app togather enough data from Connor so that the AI Personalization can determineto which macro-cluster Connor belongs. After successfully clustering Connor,the AI Personalization sends an update to the User Process Handler, which isnow able to send the appropriate User Process to Connor. By querying theThird-party Applications Manager the Abstract Activity is adapted by the UserDriven Adaptation Manager into appropriate Concrete Activities. Like with thedefault schedule, the two Cardio entries are converted into running, whilst thenewly given Strength one is converted into weight lifting. Furthermore, the newgoal he receives is more challenging. This scenario illustrates the same levels ofadaptation as scenario 1, completed by the same components. Additionally, theuser level adaptation is further personalised by clustering Connor and the UserProcess Handler sending him his cluster-related User Process.
Scenario 3 (Fig. 7.8c). On Monday Connor goes running as suggestedby the app. Whilst he is running outdoors, both the WiFi and 4G have noconnection. The Internet Connectivity Manager detects this and so decidesto store the data locally. As Connor gets back home after completing his run,the WiFi connection is re-established. Aware of this, the Internet ConnectivityManager sends the locally stored Collected Data to the back-end. This scenarioillustrates an architectural level adaptation – performed by the Internet Connec-tivity Manager by storing the data locally and sending it to the back-end whenthe internet connection is re-established.
Scenario 4 (Fig. 7.9a). On Wednesday as Connor is in the gym doing theassigned weight training, the connection with the smart-watch is interrupted.The disconnection is detected by the Smart Objects Manager that at run-timereconnects to the smart-watch allowing the app to resume collecting the dataabout Connor via the smart object. This scenario describes an example of
209
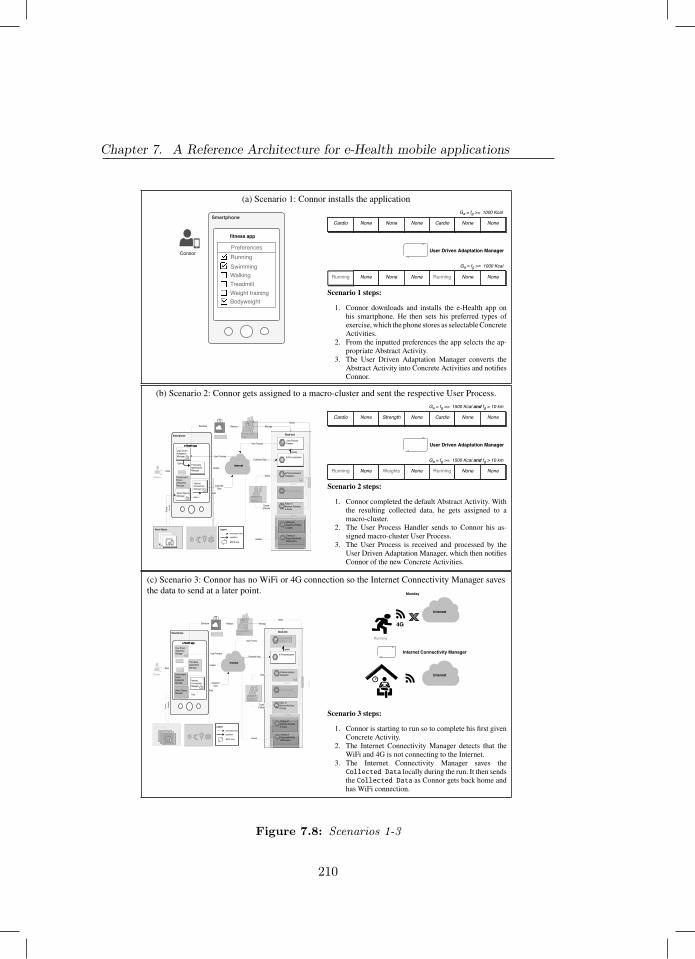
Chapter 7. A Reference Architecture for e-Health mobile applications
(a) Scenario 1: Connor installs the application
Smartphone
fitness app
PreferencesRunningSwimmingWalkingTreadmillWeight trainingBodyweight
Connor
Cardio None None None Cardio None None
Ga = fg >= 1000 Kcal
Running None None None Running None None
Ga = fg >= 1000 Kcal
User Driven Adaptation Manager
Scenario 1 steps:
1. Connor downloads and installs the e-Health app onhis smartphone. He then sets his preferred types ofexercise, which the phone stores as selectable ConcreteActivities.
2. From the inputted preferences the app selects the ap-propriate Abstract Activity.
3. The User Driven Adaptation Manager converts theAbstract Activity into Concrete Activities and notifiesConnor.
(b) Scenario 2: Connor gets assigned to a macro-cluster and sent the respective User Process.
Smartphone
e-Health app
Smartphone
e-Health app
User Process
Smart Objects
Internet
Environment Sources
App StoreBack-end
Domain Expert
Development Team
Data
Distribute
Collected Data
Release
Data
Dat
a
AI Personalization Adaptation
Editor of Abstract Activities & Goals
Clustering History
Query
Create & Modify
Collected Data
User Process
Notify
Notify
Back-end
Upd
ate
Ver
ify
Legend
information-flowoperation
MAPE loop
Update
Catalog of Abstract Activities & Goals
Catalog of Supported MobileApplications
Query
Datastore
Query
Query
Update
Update
Update
Manage
User ProcessHandler
AI Personalization
Internet Connectivity Manager
Smart Objects Manager
Environment Driven Adaptation Manager
User Driven Adaptation Manager
Third-party Applications Manager
Data
Connor
Cardio None Strength None Cardio None None
Ga = fg >= 1500 Kcal and fg > 10 km
Running None Weights None Running None None
Ga = fg >= 1500 Kcal and fg > 10 km
User Driven Adaptation Manager
Scenario 2 steps:
1. Connor completed the default Abstract Activity. Withthe resulting collected data, he gets assigned to amacro-cluster.
2. The User Process Handler sends to Connor his as-signed macro-cluster User Process.
3. The User Process is received and processed by theUser Driven Adaptation Manager, which then notifiesConnor of the new Concrete Activities.
(c) Scenario 3: Connor has no WiFi or 4G connection so the Internet Connectivity Manager savesthe data to send at a later point.
Environment Sources
Smart Objects Manager
Smartphone
e-Health app
Smartphone
e-Health app
User Process
Internet
Back-end
Data
Collected Data
Data
Dat
a
Collected Data
User Process
Ver
ify
Legend
information-flowoperation
MAPE loop
Update
Query
Query
Update
User ProcessHandler
AI Personalization
Internet Connectivity Manager
Environment Driven Adaptation Manager
User Driven Adaptation Manager
Third-party Applications Manager
Data
Smart Objects
Connor
Domain Expert
AI Personalization Adaptation
Editor of Abstract Activities & Goals
Clustering History
Query
Create & Modify
Notify
Upd
ate
Catalog of Abstract Activities & Goals
Catalog of Supported MobileApplications
Query
Datastore
Update
Update
App StoreDevelopment Team
Distribute ReleaseNotify
Back-end
Manage
Internet Connectivity Manager
Internet
Internet
4G
Running
Monday
Scenario 3 steps:
1. Connor is starting to run so to complete his first givenConcrete Activity.
2. The Internet Connectivity Manager detects that theWiFi and 4G is not connecting to the Internet.
3. The Internet Connectivity Manager saves theCollected Data locally during the run. It then sendsthe Collected Data as Connor gets back home andhas WiFi connection.
Figure 7.8: Scenarios 1-3
210
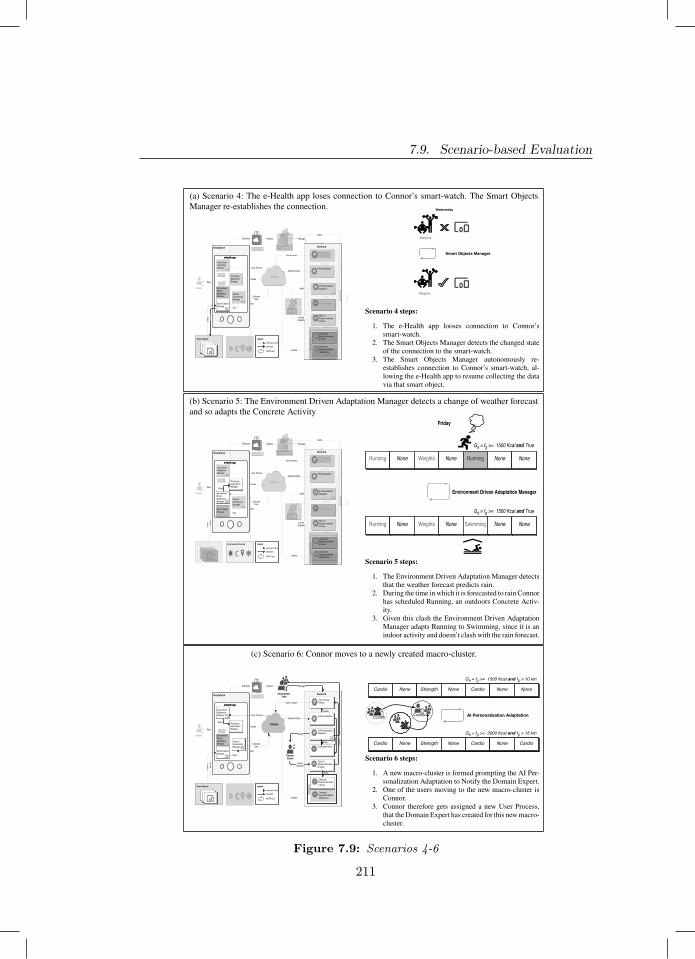
7.9. Scenario-based Evaluation
(a) Scenario 4: The e-Health app loses connection to Connor’s smart-watch. The Smart ObjectsManager re-establishes the connection.
Internet Connectivity Manager
Environment Sources
Smartphone
e-Health app
Smartphone
e-Health app
User Process
Internet
Back-end
Data
Collected Data
Data
Collected Data
User Process
Legend
information-flowoperation
MAPE loop
Update
Query
Query
Update
User ProcessHandler
AI Personalization
Environment Driven Adaptation Manager
User Driven Adaptation Manager
Third-party Applications Manager
Data
Connor
Domain Expert
AI Personalization Adaptation
Editor of Abstract Activities & Goals
Clustering History
Query
Create & Modify
Notify
Upd
ate
Catalog of Abstract Activities & Goals
Catalog of Supported MobileApplications
Query
Datastore
Update
Update
App StoreDevelopment Team
Distribute ReleaseNotify
Back-end
Manage
Smart Objects
Dat
aV
erify
Smart Objects Manager
Smart Objects Manager
Wednesday
Weights
Weights
Scenario 4 steps:
1. The e-Health app looses connection to Connor’ssmart-watch.
2. The Smart Objects Manager detects the changed stateof the connection to the smart-watch.
3. The Smart Objects Manager autonomously re-establishes connection to Connor’s smart-watch, al-lowing the e-Health app to resume collecting the datavia that smart object.
(b) Scenario 5: The Environment Driven Adaptation Manager detects a change of weather forecastand so adapts the Concrete Activity
Internet Connectivity Manager
Smartphone
e-Health app
Smartphone
e-Health app
User Process
Internet
Back-end
Data
Collected Data
Collected Data
User Process
Legend
information-flowoperation
MAPE loop
Update
Query
Update
User ProcessHandler
AI Personalization
User Driven Adaptation Manager
Data
Connor
Domain Expert
AI Personalization Adaptation
Editor of Abstract Activities & Goals
Clustering History
Query
Create & Modify
Notify
Upd
ate
Catalog of Abstract Activities & Goals
Catalog of Supported MobileApplications
Query
Datastore
Update
Update
App StoreDevelopment Team
Distribute ReleaseNotify
Back-end
Manage
Environment SourcesSmart Objects
Data
Environment Driven Adaptation Manager
Third-party Applications ManagerQuery
Smart Objects Manager
Dat
aV
erify Running None Weights None Swimming None None
Ga = fg >= 1500 Kcal and True
Environment Driven Adaptation Manager
Running None Weights None Running None None
Ga = fg >= 1500 Kcal and True
Friday
Scenario 5 steps:
1. The Environment Driven Adaptation Manager detectsthat the weather forecast predicts rain.
2. During the time in which it is forecasted to rain Connorhas scheduled Running, an outdoors Concrete Activ-ity.
3. Given this clash the Environment Driven AdaptationManager adapts Running to Swimming, since it is anindoor activity and doesn’t clash with the rain forecast.
(c) Scenario 6: Connor moves to a newly created macro-cluster.
Environment Sources
Smartphone
e-Health app
Smartphone
e-Health app
Internet
Back-end
Data
Collected Data
Data
Collected Data
Ver
ify
Legend
information-flowoperation
MAPE loop
Query
Update
Internet Connectivity Manager
Environment Driven Adaptation Manager
Connor
Update
App Store
Distribute Release
User Driven Adaptation Manager
Third-party Applications Manager
Smart Objects Manager
AI Personalization Adaptation
Editor of Abstract Activities & Goals
Clustering History
Query
Back-end
Upd
ate
Update
Upd
ate
User ProcessHandler
AI Personalization
ManageNotify
Catalog of Abstract Activities & Goals
Catalog of Supported MobileApplications
Query
Datastore
Create & Modify
Notify
Domain Expert
Development Team
User Process
User Process
Query
Data
Dat
a
Smart Objects
Cardio None Strength None Cardio None None
Ga = fg >= 1500 Kcal and fg > 10 km
Cardio None Strength None Cardio None Cardio
Ga = fg >= 2000 Kcal and fg > 15 km
AI Personalisation AdaptationConnor Connor
Scenario 6 steps:
1. A new macro-cluster is formed prompting the AI Per-sonalization Adaptation to Notify the Domain Expert.
2. One of the users moving to the new macro-cluster isConnor.
3. Connor therefore gets assigned a new User Process,that the Domain Expert has created for this new macro-cluster.
Figure 7.9: Scenarios 4-6
211
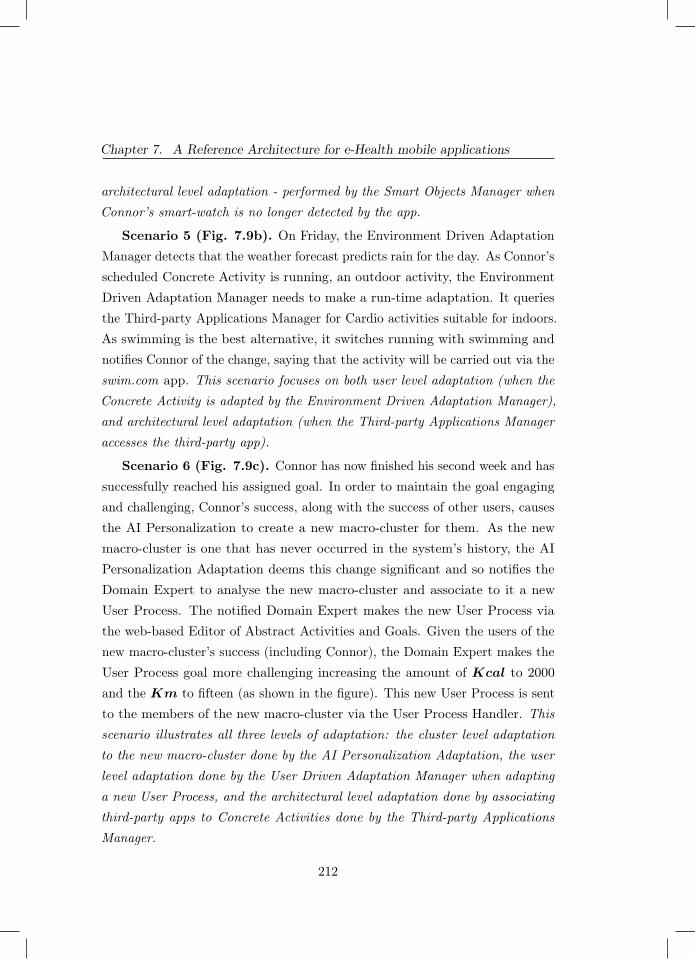
Chapter 7. A Reference Architecture for e-Health mobile applications
architectural level adaptation - performed by the Smart Objects Manager whenConnor’s smart-watch is no longer detected by the app.
Scenario 5 (Fig. 7.9b). On Friday, the Environment Driven AdaptationManager detects that the weather forecast predicts rain for the day. As Connor’sscheduled Concrete Activity is running, an outdoor activity, the EnvironmentDriven Adaptation Manager needs to make a run-time adaptation. It queriesthe Third-party Applications Manager for Cardio activities suitable for indoors.As swimming is the best alternative, it switches running with swimming andnotifies Connor of the change, saying that the activity will be carried out via theswim.com app. This scenario focuses on both user level adaptation (when theConcrete Activity is adapted by the Environment Driven Adaptation Manager),and architectural level adaptation (when the Third-party Applications Manageraccesses the third-party app).
Scenario 6 (Fig. 7.9c). Connor has now finished his second week and hassuccessfully reached his assigned goal. In order to maintain the goal engagingand challenging, Connor’s success, along with the success of other users, causesthe AI Personalization to create a new macro-cluster for them. As the newmacro-cluster is one that has never occurred in the system’s history, the AIPersonalization Adaptation deems this change significant and so notifies theDomain Expert to analyse the new macro-cluster and associate to it a newUser Process. The notified Domain Expert makes the new User Process viathe web-based Editor of Abstract Activities and Goals. Given the users of thenew macro-cluster’s success (including Connor), the Domain Expert makes theUser Process goal more challenging increasing the amount of Kcal to 2000and the Km to fifteen (as shown in the figure). This new User Process is sentto the members of the new macro-cluster via the User Process Handler. Thisscenario illustrates all three levels of adaptation: the cluster level adaptationto the new macro-cluster done by the AI Personalization Adaptation, the userlevel adaptation done by the User Driven Adaptation Manager when adaptinga new User Process, and the architectural level adaptation done by associatingthird-party apps to Concrete Activities done by the Third-party ApplicationsManager.
212
7.10. Discussion
7.10 Discussion
It is important to note that our RA is extensible so to support other domainsbeyond fitness and mood. Specifically, the goal model has been designed suchthat supporting an additional domain can be achieved by adding (i) a newnon-terminal term in the root rule Ga and (ii) one or more rules describing thegoal within the new domain. Also, many of the existing rules (e.g., FREQ) aregeneric enough to be reused by newly-added rules. On the client side no changesare required, whereas the only components which may need to be customised toa new application domain are: (i) the Editor of Abstract Activities & Goals, sothat it is tailored to the different domain experts and the extended goal model;and (ii) the Catalog of Supported Mobile Applications, so that it now describesthe interaction points with different third-party apps.
Abstract Activities allow Domain Experts to define incremental goals span-ning over the duration of the whole User Process. In addition, User Processesare defined at the cluster level (potentially including thousands of users) andcan cover large time spans (e.g., weeks or months). Those features make theoperation of the RA sustainable from the perspective of Domain Experts, whoare not required to frequently intervene for defining new goals or User Processes.Furthermore, these features make the apps adopting our RA socially sustainableon multiple levels. The cluster level defined User Processes allow for tailoringto a ‘community’ of similar users, empowering them to achieve a better life. Onan individual level, the app fine tunes the User Processes to better suite theuser’s needs and interests; this allows the individual user to better achieve theirgoals both in the immediate and in the systemic (as defined in [187]). Lastly,these features allow for the larger group of users utilising this RA to all reachthe same level of health benefits, as the interventions have been specificallytailored for them for this goal.
Through the conversion from Activity Categories to Concrete Activities,which takes place during the dynamic Abstract Activities refinement, we accom-modate both Type-to-Type adaptation (e.g., from the Cardio Activity Categoryto the Running Concrete Activity) and the most common Type-to-Instance
213
Chapter 7. A Reference Architecture for e-Health mobile applications
adaptation (e.g., by using the Strava mobile app as an instance of the RunningConcrete Activity). Similarly, a Type-to-Type adaptation is reported by Cali-nescu et al. [55] presenting an approach where elements are replaced with otherelements providing the same functionality but showing a superior quality todeal with changing conditions (e.g., dynamic replacement of service instancesin service-based systems). However, we go beyond, by replacing activities withothers providing different functionality to deal with changing conditions. Tothe best of our knowledge, this adaptation type is uncommon in self-adaptivearchitectures, despite quite helpful.
The components of the RA running on the smartphone can be deployedin two different ways, each leading to a different business case. Firstly, thosecomponents can be integrated into an existing e-Health app (e.g., Endomondo3)so to provide personalisation and self-adaptation capabilities to its services. Inthis case the development team of the app just needs to deploy the client-sidecomponents of the RA as a third-party library, suitably integrate the originalapp with the added library, and launch the server-side components. The secondbusiness case regards the creation of a new meta-app integrating the servicesof third-party apps, similarly to what apps like IFTTT4 do. In this case, themeta-app makes an extensive usage of the Third-party Applications Managercomponent and orchestrates the execution of the other apps already installedon the user device.
Finally, we are aware that our RA is responsible for managing highly-sensitiveuser data, which may raise severe privacy concerns. In order to mitigate potentialprivacy threats, the communication between the mobile app and the back-endis TLS-encrypted and the payload of push notifications is encrypted as well,e.g., by using the Capillary Project [159] for Android apps, which supportsstate-of-the-art encryption algorithms, such as RSA and Web Push encryption.Eventually, according to the privacy level required, the components runningin the back-end can be deployed either on premises or in the Cloud, e.g., bybuilding on public Cloud services like Amazon AWS and execute them behindadditional authentication and authorisation layers.
3 http://endomondo.com 4 http://ifttt.com
214
7.11. Conclusions and Future Work
7.11 Conclusions and Future Work
The aim of this chapter was to answer T.RQ4, namely: How can AI-basedpersonalisation and self-adaptation be used to create e-Health apps that dy-namically adapt to the user and their context? We do so by proposing a RAfor personalised and self-adaptive e-Health mobile apps. The RA achievesself-adaptation on three levels: (i) adaptation to the users and their environ-ment, (ii) adaptation to smart objects and third-party applications, and (iii)adaptation according to the data of the AI-based personalisation, ensuring thatusers receive personalised activities that evolve with the users’ run-time changesin behaviour. This work emphasises how personalisation and self-adaptationwithin the e-Health domain can be beneficial in addressing social sustainability.By tailoring user interventions we empower mobile app developers to betterhelp their users in achieving better physical and mental health; this leads toincreased support for the community of people who suffer from mental andphysical illness and are working on increasing their health. The RA thereforeachieves what is defined as the core principal of social sustainability in the realmof software-intensive systems. In the next chapter we implement a prototypeapp using the RA as guidance. We then design and execute two controlledexperiments to evaluate its effects on users and users’ mobile devices.
215

8Empirical Evaluation
Chapter 8 is under review as a journal paper:
Grua, E. M., De Sanctis, M., Malavolta, I., Hoogendoorn, M., & Lago, P. (2021). AnEvaluation of the Effectiveness of Personalization and Self-Adaptation for e-Health Apps.Elsevier. Under review (journal).
217
Chapter 8. Empirical Evaluation
Abstract - Context. There are many e-Health mobile apps on the appsstore, from apps to improve a user’s lifestyle to mental coaching. Whilst theseapps might consider user context when they give their interventions, prompts,and encouragements, they still tend to be rigid e.g., not using user context andexperience to tailor themselves to the user.
Objective. To better engage and tailor to the user, in the previous chapterwe proposed a Reference Architecture for enabling self-adaptation and AI-based personalisation in e-Health apps. In this chapter we will answer T.RQ5,specifically: How do dynamically adaptive e-Health apps affect users and theirmobile devices? To answer this research question, we evaluate the end users’perception, usability, performance impact, and energy consumption contributedby this Reference Architecture.
Method. We do so by implementing a Reference Architecture compliantapp and conducting two experiments: a user study and a measurement-basedexperiment.
Results. Although limited in the number of participants, the results of ouruser study show that usability of the Reference Architecture compliant appis similar to the control app. Users’ perception was found to be positivelyinfluenced by the compliant app when compared to the control group. Resultsof our measurement-based experiment showed some differences in performanceand energy consumption measurements between the two apps. The differencesare, however, deemed minimal.
Conclusions. Our experiments show promising results for an app imple-mented following our proposed Reference Architecture. This is preliminaryevidence that the use of personalization and self-adaptation techniques can bebeneficial within the domain of e-Health apps.
8.1 Introduction
E-health apps have some components that make them unique compared to otherhealth-related systems i.e., (i) can take advantage of smartphone sensors, (ii)can reach an extremely wide audience with low infrastructural investments, and
218
8.1. Introduction
(iii) can leverage the intrinsic characteristics of the mobile medium (i.e., beingalways-on, personal, and always-carried by the user) for providing timely andin-context services [119]. However, even with all of these tools available to them,e-Health apps still tend to be rigid and not tailored in their interventions andprompts to the user, e.g., the apps are using a fixed rule set to construct theirinterventions and not considering unique traits and behaviours of the individualuser. To solve this problem, we previously proposed a reference architecture(RA) that combines data-driven personalisation with self-adaptation [143; 144].In this paper we extend on this research line by:
− utilising our RA to guide the implementation of an app.
− designing and conducting a user study to investigate end users’ concernsrelated to both usability and perception of an app complying to our RA.
− designing and conducting a measurement-based experiment to investigatethe impact on performance and energy consumption that an app complyingto our RA has.
− discussing the newly found results and frame them in the broader context ofe-Health mobile apps and the usage of personalisation and self-adaptationtechniques in this domain.
We conduct two experiments that investigate some concerns that developersand end users of our implemented app would have. To this end, we haveformulated four main research questions to empirically assess the impact ofpersonalisation and self-adaptation from (i) the users’ perspective and (ii) thesystem perspective. Our experiment results show that for the user perspectivepersonalisation and self-adaptation techniques have an overall positive impact onthe end users’ perception of e-Health mobile apps. We saw no apparent impactof these techniques on usability of e-Health mobile apps. From the systemperspective our results have found some statistically significant differences inapp performance. These differences are too small to realistically impact the userexperience of an Android app. Furthermore, our experiments provide evidence
219

Chapter 8. Empirical Evaluation
that the impact of personalisation and self-adaptation on energy consumptionof e-Health mobile apps is negligible.
The chapter is structured as follows.
Section 8.2 describes our study design, with Section 8.2.1 showing how anapp was implemented following the guidelines of our RA, and Sections 8.2.2and 8.2.3 describing the design of our experiments. Section 8.3 explains theresults for both experiments. In Section 8.4 we discuss the results. Section 8.5explains the threats to validity. Section 8.6 describes the related work. Lastly,Section 8.7 concludes the chapter.
8.2 Study Design
As shown in Figure 8.1, our study is composed of three main phases, namely: theinstantiation of the RA, the user study (Experiment 1), and the measurement-based experiment (Experiment 2). We describe each step of all phases, itsobjective, expected input and output, and number of involved researchers.
RA instantiation
Appready?
1.1 - Featuresidentification
1.2 - Appimplementation
1.3 - Piloting
Experiment 2: Measurement-based experiment
Experiment 1: User study
No
5 researchers 1 researcher
2 researchers
App features
eHealthRA Referencearchitecture
RELATE app
Yes
2.1 - Design ofuser study
2.2 - Subjectsselection
2.4 - DataAnalysis
2.3 - Executionof user study
ResultsRaw data5 researchers
1 researcher
5 researchers
15 participantsParticipants
guide
2.5 - Design ofexperiment
2.7 - DataAnalysis
2.6 - Executionof experiment
Measures Results
1 researcher
Figure 8.1: Study Design
The goal of the RA instantiation phase is to design and develop an instanceof the RA, which is used in the two experiments. This phase is composed of
220
8.2. Study Design
three main steps: the identification of the features of the app (step 1.1), itsimplementation for the Android platform (step 1.2), and its piloting (step 1.3).– Features identification (step 1.1). This step is conducted by all five researchersand has the goal of identifying the features that need to be present in the appimplementation. This activity is carried out by taking into consideration ourneed of keeping the app reasonably simple (so to be used by multiple participantswithout requiring extensive training), while still having room for personalisationand self-adaptation at runtime. The main output of this step is the list of theapp features:
− F1. The app needs to provide a list of weekly physical activities to theuser.
− F2. The user is able to selected their preferred physical activities from alist of available ones.
− F3. The app has to be able to determine the environment of the user.
− F4. The app needs to change recommended physical activities in accor-dance to the user environment.
– App implementation (step 1.2). The implementation is named RELATE,standing for peRsonalized sELf-AdapTive E-health. RELATE is implementedin Android and its back-end is implemented in Python. The details of theimplementation process are discussed in Section 8.2.1.– Piloting (step 1.3). We pilot the implemented app in order to ensure that itcan be successfully used in the two experiments. Two researchers different fromthe one implementing RELATE are involved in this step and they carry out thepiloting activities independently from each other. Each researcher installs theapp on their mobile device and simulates typical usage scenarios according tothe features identified in step 1.1. During usage, they note down apparent bugsand problems and discuss them with the researchers implementing the app. Theapp would then go back to implementation, to correct the found issues. Thiscycle continues until the app is deemed ready to be used for the experiments.This step took a total of 14 days.
221
Chapter 8. Empirical Evaluation
Once the implementation of the RELATE app is completed and piloted,we can proceed with the design and execution of the two experiments. Thecomplementary nature of the two experiments allows us to carry them out inparallel.
We organise the user study into four main phases: the design of theuser study, subjects selection, the execution, and the data analysis. Below wedescribe how the four phases fit together, whereas their detailed description isgiven in Section 8.2.2.
– Design of user study (step 2.1). The goal of this phase is to design a userstudy that would allow us to understand the impact of personalisation and self-adaptation techniques on the usability and end users’ perception of our e-Healthmobile app. The design is carried out collaboratively by all five researchers. Inaddition to the formulation of the goal, research questions and other details,the main observable output of this phase is the Participants guide. We handout the Participants guide to each participant. The Participants guide containsinstructions on how to install RELATE on their own personal smartphones,links and instructions on how to fill in the participant surveys, where RELATEcan be downloaded from, contact e-mail for participants in need of help.
– Subjects selection (step 2.2). After completing the study design we conductour subjects selection. This step is further detailed in Section 8.2.2.2.
– Execution of user study (step 2.3). As we are interested in understanding theinfluence of the introduction of self-adaptation and personalisation techniquesin our e-Health mobile app, we split the set of participants into two groups. Onegroup uses a baseline version of our RELATE app, whilst the other group usesa version containing the aforementioned techniques. We ask both groups to usetheir app for four consecutive weeks. During this user study, each participantcompletes three different types of surveys, namely: (i) an initial one-time surveyfor the demographics, (ii) a daily survey reporting their activities and theirperception with respect to their app during the whole four-weeks period, and(iii) a final one-time survey about the overall usability and perception of thetwo versions of the RELATE app. The details about the structure and contentsof the surveys are reported in Section 8.2.2.3 and Section 8.2.2.5, respectively.
222
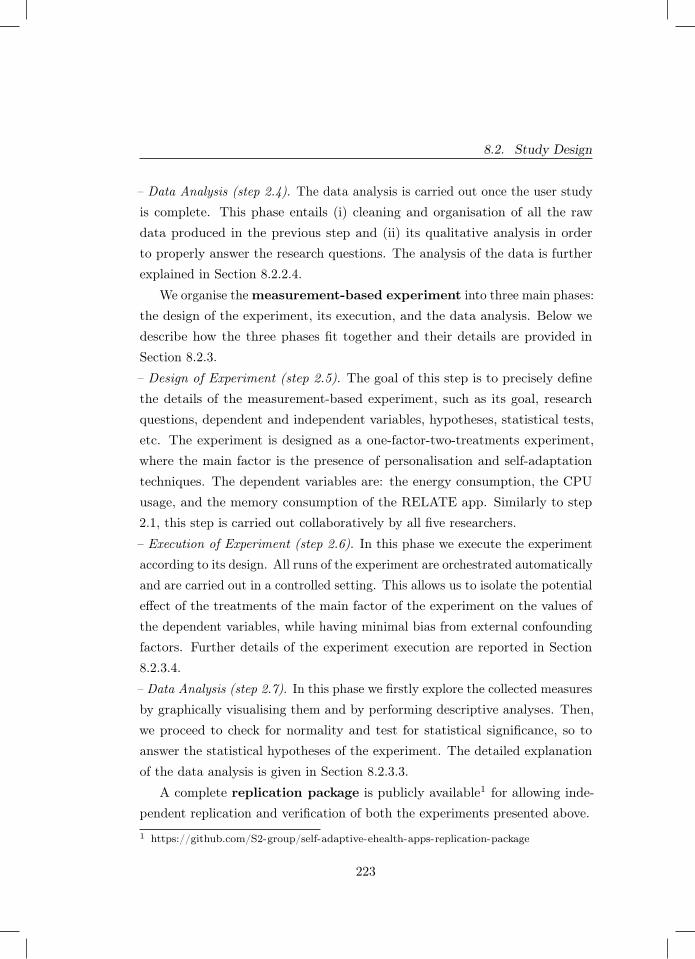
8.2. Study Design
– Data Analysis (step 2.4). The data analysis is carried out once the user studyis complete. This phase entails (i) cleaning and organisation of all the rawdata produced in the previous step and (ii) its qualitative analysis in orderto properly answer the research questions. The analysis of the data is furtherexplained in Section 8.2.2.4.
We organise the measurement-based experiment into three main phases:the design of the experiment, its execution, and the data analysis. Below wedescribe how the three phases fit together and their details are provided inSection 8.2.3.
– Design of Experiment (step 2.5). The goal of this step is to precisely definethe details of the measurement-based experiment, such as its goal, researchquestions, dependent and independent variables, hypotheses, statistical tests,etc. The experiment is designed as a one-factor-two-treatments experiment,where the main factor is the presence of personalisation and self-adaptationtechniques. The dependent variables are: the energy consumption, the CPUusage, and the memory consumption of the RELATE app. Similarly to step2.1, this step is carried out collaboratively by all five researchers.
– Execution of Experiment (step 2.6). In this phase we execute the experimentaccording to its design. All runs of the experiment are orchestrated automaticallyand are carried out in a controlled setting. This allows us to isolate the potentialeffect of the treatments of the main factor of the experiment on the values ofthe dependent variables, while having minimal bias from external confoundingfactors. Further details of the experiment execution are reported in Section8.2.3.4.
– Data Analysis (step 2.7). In this phase we firstly explore the collected measuresby graphically visualising them and by performing descriptive analyses. Then,we proceed to check for normality and test for statistical significance, so toanswer the statistical hypotheses of the experiment. The detailed explanationof the data analysis is given in Section 8.2.3.3.
A complete replication package is publicly available1 for allowing inde-pendent replication and verification of both the experiments presented above.
1 https://github.com/S2-group/self-adaptive-ehealth-apps-replication-package
223
Chapter 8. Empirical Evaluation
8.2.1 Implementation of the e-Health app
Smartphone
e-Health app
Smartphone
e-Health app
User Process
Smart Objects
Internet
Environment Sources
App StoreBack-end
Domain Expert
Development Team
Data
Use
rsDistribute
Collected Data
Release
Data
Dat
a
AI Personalization Adaptation
Editor of Abstract Activities & Goals
Clustering History
Query
Create & Modify
Collected Data
User Process
Notify
Notify
Back-end
Upd
ate
Verif
y
Legend
information-flowoperation
MAPE loop
Update
Catalog of Abstract Activities & Goals
Catalog of Supported MobileApplications
Query
Dat
asto
re
Query
Query
Update
Update
Upd
ate
Manage
User ProcessHandler
AI Personalization
Internet Connectivity Manager
Smart Objects Manager
Environment Driven Adaptation Manager
User Driven Adaptation Manager
Third-party Applications Manager
Data
(a) All of the RA components implemented by RELATE (the gray ones have beenomitted)
UI
Back-end
User Process Handler
Smartphone
User Driven Adaptation Manager
HTTP
Internet Connectivity Manager
Third-party ApplicationsManager
Smart Objects Manager
Environment Driven AdaptationManager
Legend
ActivityPreference
UserProcess
Activity
ServiceDB
MainActivity FirstScreenSettingsActivity
User DrivenAdaptation Manager
Firebase CloudMessaging
REST API
Internet ConnectivityManager
REST API
Smart ObjectsManager
Class
WeatherFetch
ThirdPartyAppData
Internal Communication Remote Communication
User Tokens
Environment DrivenAdaptation Manager
RELATE
RA compliant UI
MAPE loop
(b) RELATE architecture
Figure 8.2: Figures describing the components of the RAused and the RELATE architecture
224

8.2. Study Design
In this section we describe the implementation of the RA compliant e-Health app,named RELATE, that we used for our experiments. RELATE is implementedin Android, as Android mobile devices cover the majority of the mobile devicesector and the majority of scientific research on mobile software engineering isdone on Android [25; 223]. For an explanation of the app’s flow the reader isdirected to the online material in the replication package.
Figure 8.2b shows RELATE’s architecture, whose mapping with the RAcomponents is shown in Figure 8.2a. There are three activities in RELATE thattogether form the UI: the MainActivity, the SettingsActivity and the FirstScreenactivity.
– FirstScreen. This is the first activity displayed to the user. The sole responsi-bility of this activity is to present the user with the list of available physicalactivities and have them choose their preferred ones. After they have madetheir preference they are redirected to the Main Screen, which is managed bythe MainActivity.
– MainActivity. This activity is in charge of displaying the Main Screen to theuser, as well as instantiating and communicating to most other componentspresent in RELATE. It is also from here that the user can choose to access thesettings.
– SettingsActivity. This activity is in charge of displaying the app’s settings tothe user and redirecting them to either adjust their preferred physical activities,read the about page or go back to the Main Screen. Whenever the user makesa change to their preferred activities, the SettingsActivity stores the preferenceslocally, so that they are available even after the application has been closed bythe user.
RELATE contains two services on the user side: the User Driven AdaptationManager and the Internet Connectivity Manager.
– User Driven Adaptation Manager. This service has two main responsibilities:it creates a unique identifier token at installation which it sends to the Back-endand it converts each User Process received from the Back-end. The uniquetoken is used by the Back-end to send the User Process to the correctly paireduser. The conversion of the User Process is done by the User Driven Adaptation
225
Chapter 8. Empirical Evaluation
Manager in accordance to the self-adaptive loop described in Section 7.2.
The responsibility of sending the token to the Back-end is a deviation fromthe RA. In the RA the only component to send information to the Back-endis the Internet Connectivity Manager. This change was made to optimize theinformation flow of RELATE. As with the current implementation of RELATEwe don’t have the AI Personalization in the Back-end, we decided to use thealready created information flow from the User Process Handler to the UserDriven Adaptation Manager and add the task of receiving the user token.
– Internet Connectivity Manager. This service is started by the MainActivitywhenever the app is opened in the foreground. Its main purpose is to monitorand manage the connection to the internet via its self-adaptive loop as describedin Section 7.2.
RELATE contains four classes: Smart-Objects Manager, EnvironmentDriven Adaptation Manager, ThirdPartyAppData, and WeatherFetch.
– Smart Objects Manager. This class is initialized by the MainActivity wheneverthe app is launched and has two main purposes: ask the user for the runtimepermission for the Bluetooth usage and, monitor and manage the connection toexternal devices via the self-adaptive loop, in accordance to the RA’s description.
– Environment Driven Adaptation Manager. This class is also initialized bythe MainActivity whenever the app is launched by the user. It has two mainpurposes: to check what the weather forecast is for the current day and toconvert the daily suggested activity if the current user environment calls for it.The class determines the daily weather forecast with the help of WeatherFetch.The Environment Driven Adaptation Manager can also perform a change insuggested activity, as described in the RA, which it then displays to the uservia a push-notification.
– WeatherFetch. The main resposibility of this class is to determine the weatherforecast and deliver that information to the Environment Driven AdaptationManager. To determine the forecast, it uses the OpenWeather API2 to retrievea .json file containing information on the weather forecast for that day. Itprocesses the file and sends the parsed information to the Environment Driven2 https://openweathermap.org/api
226
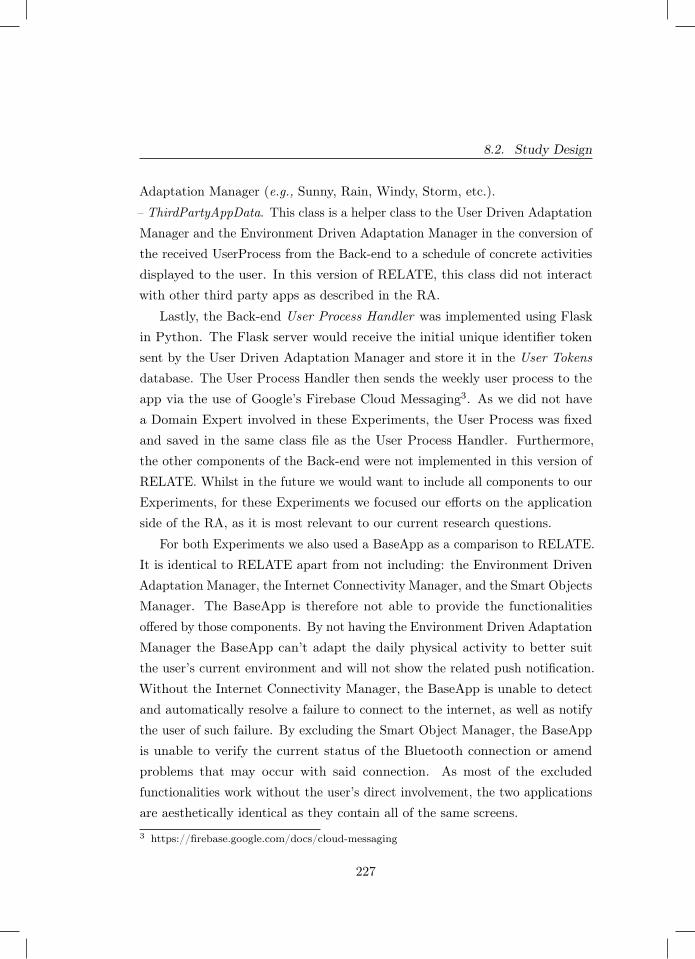
8.2. Study Design
Adaptation Manager (e.g., Sunny, Rain, Windy, Storm, etc.).
– ThirdPartyAppData. This class is a helper class to the User Driven AdaptationManager and the Environment Driven Adaptation Manager in the conversion ofthe received UserProcess from the Back-end to a schedule of concrete activitiesdisplayed to the user. In this version of RELATE, this class did not interactwith other third party apps as described in the RA.
Lastly, the Back-end User Process Handler was implemented using Flaskin Python. The Flask server would receive the initial unique identifier tokensent by the User Driven Adaptation Manager and store it in the User Tokensdatabase. The User Process Handler then sends the weekly user process to theapp via the use of Google’s Firebase Cloud Messaging3. As we did not havea Domain Expert involved in these Experiments, the User Process was fixedand saved in the same class file as the User Process Handler. Furthermore,the other components of the Back-end were not implemented in this version ofRELATE. Whilst in the future we would want to include all components to ourExperiments, for these Experiments we focused our efforts on the applicationside of the RA, as it is most relevant to our current research questions.
For both Experiments we also used a BaseApp as a comparison to RELATE.It is identical to RELATE apart from not including: the Environment DrivenAdaptation Manager, the Internet Connectivity Manager, and the Smart ObjectsManager. The BaseApp is therefore not able to provide the functionalitiesoffered by those components. By not having the Environment Driven AdaptationManager the BaseApp can’t adapt the daily physical activity to better suitthe user’s current environment and will not show the related push notification.Without the Internet Connectivity Manager, the BaseApp is unable to detectand automatically resolve a failure to connect to the internet, as well as notifythe user of such failure. By excluding the Smart Object Manager, the BaseAppis unable to verify the current status of the Bluetooth connection or amendproblems that may occur with said connection. As most of the excludedfunctionalities work without the user’s direct involvement, the two applicationsare aesthetically identical as they contain all of the same screens.
3 https://firebase.google.com/docs/cloud-messaging
227
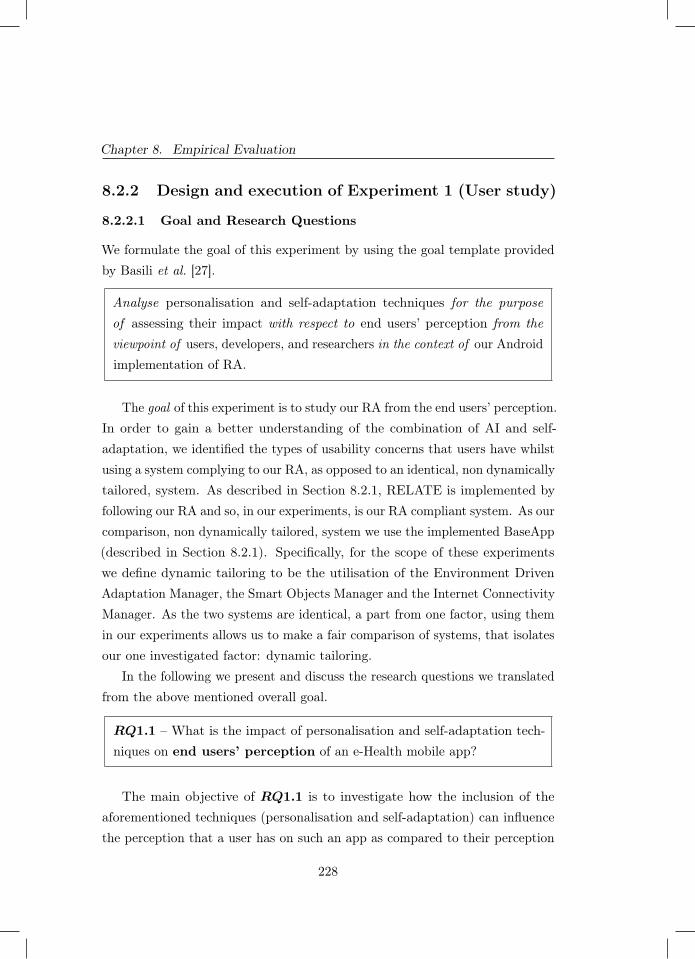
Chapter 8. Empirical Evaluation
8.2.2 Design and execution of Experiment 1 (User study)
8.2.2.1 Goal and Research Questions
We formulate the goal of this experiment by using the goal template providedby Basili et al. [27].
Analyse personalisation and self-adaptation techniques for the purposeof assessing their impact with respect to end users’ perception from theviewpoint of users, developers, and researchers in the context of our Androidimplementation of RA.
The goal of this experiment is to study our RA from the end users’ perception.In order to gain a better understanding of the combination of AI and self-adaptation, we identified the types of usability concerns that users have whilstusing a system complying to our RA, as opposed to an identical, non dynamicallytailored, system. As described in Section 8.2.1, RELATE is implemented byfollowing our RA and so, in our experiments, is our RA compliant system. As ourcomparison, non dynamically tailored, system we use the implemented BaseApp(described in Section 8.2.1). Specifically, for the scope of these experimentswe define dynamic tailoring to be the utilisation of the Environment DrivenAdaptation Manager, the Smart Objects Manager and the Internet ConnectivityManager. As the two systems are identical, a part from one factor, using themin our experiments allows us to make a fair comparison of systems, that isolatesour one investigated factor: dynamic tailoring.
In the following we present and discuss the research questions we translatedfrom the above mentioned overall goal.
RQ1.1 – What is the impact of personalisation and self-adaptation tech-niques on end users’ perception of an e-Health mobile app?
The main objective of RQ1.1 is to investigate how the inclusion of theaforementioned techniques (personalisation and self-adaptation) can influencethe perception that a user has on such an app as compared to their perception
228
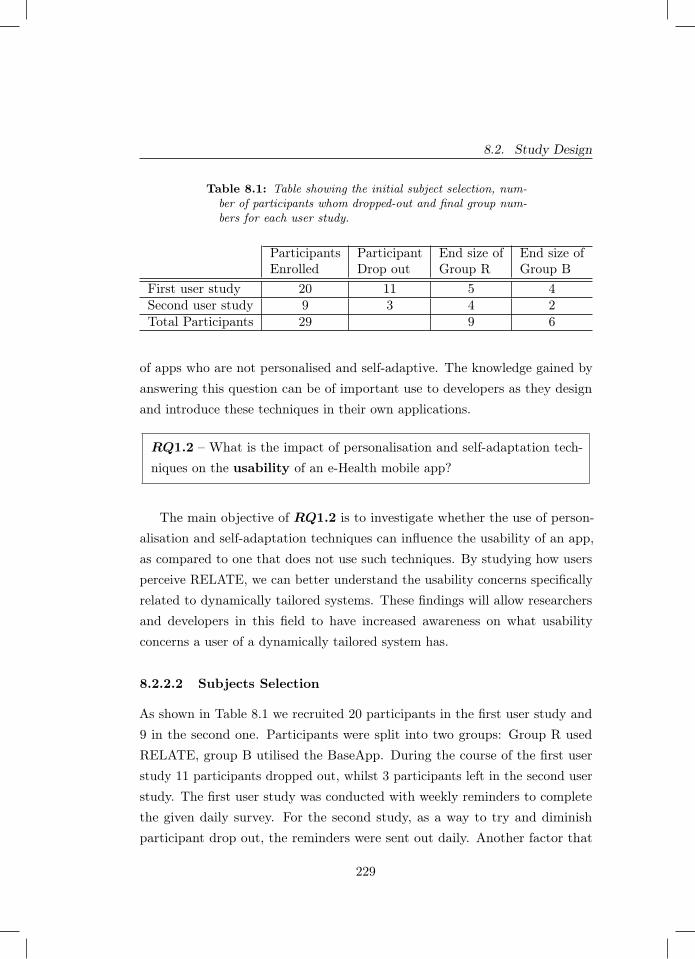
8.2. Study Design
Table 8.1: Table showing the initial subject selection, num-ber of participants whom dropped-out and final group num-bers for each user study.
ParticipantsEnrolled
ParticipantDrop out
End size ofGroup R
End size ofGroup B
First user study 20 11 5 4Second user study 9 3 4 2Total Participants 29 9 6
of apps who are not personalised and self-adaptive. The knowledge gained byanswering this question can be of important use to developers as they designand introduce these techniques in their own applications.
RQ1.2 – What is the impact of personalisation and self-adaptation tech-niques on the usability of an e-Health mobile app?
The main objective of RQ1.2 is to investigate whether the use of person-alisation and self-adaptation techniques can influence the usability of an app,as compared to one that does not use such techniques. By studying how usersperceive RELATE, we can better understand the usability concerns specificallyrelated to dynamically tailored systems. These findings will allow researchersand developers in this field to have increased awareness on what usabilityconcerns a user of a dynamically tailored system has.
8.2.2.2 Subjects Selection
As shown in Table 8.1 we recruited 20 participants in the first user study and9 in the second one. Participants were split into two groups: Group R usedRELATE, group B utilised the BaseApp. During the course of the first userstudy 11 participants dropped out, whilst 3 participants left in the second userstudy. The first user study was conducted with weekly reminders to completethe given daily survey. For the second study, as a way to try and diminishparticipant drop out, the reminders were sent out daily. Another factor that
229
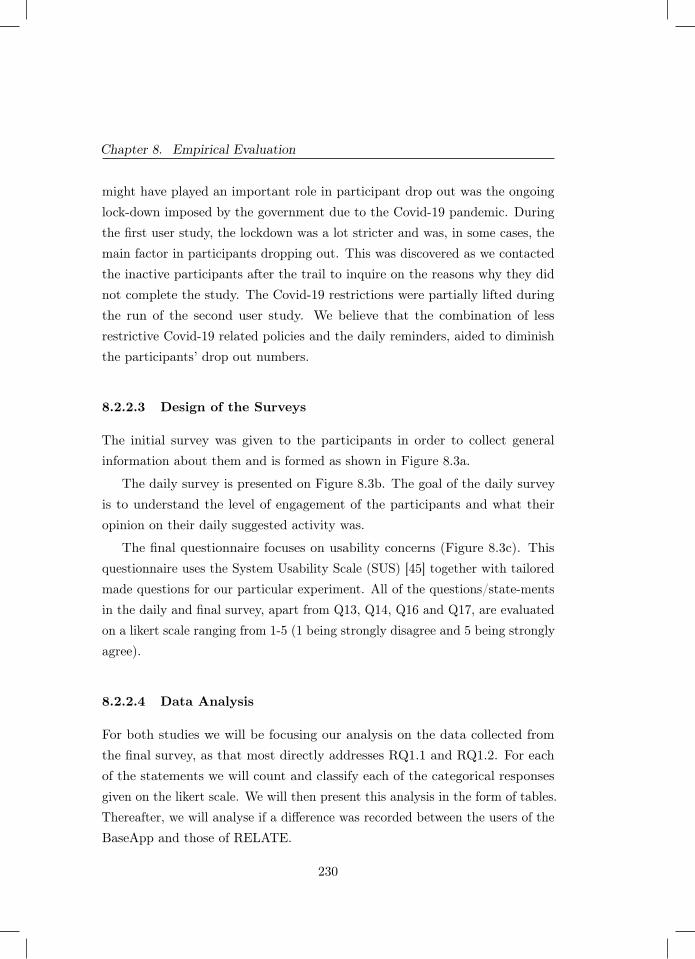
Chapter 8. Empirical Evaluation
might have played an important role in participant drop out was the ongoinglock-down imposed by the government due to the Covid-19 pandemic. Duringthe first user study, the lockdown was a lot stricter and was, in some cases, themain factor in participants dropping out. This was discovered as we contactedthe inactive participants after the trail to inquire on the reasons why they didnot complete the study. The Covid-19 restrictions were partially lifted duringthe run of the second user study. We believe that the combination of lessrestrictive Covid-19 related policies and the daily reminders, aided to diminishthe participants’ drop out numbers.
8.2.2.3 Design of the Surveys
The initial survey was given to the participants in order to collect generalinformation about them and is formed as shown in Figure 8.3a.
The daily survey is presented on Figure 8.3b. The goal of the daily surveyis to understand the level of engagement of the participants and what theiropinion on their daily suggested activity was.
The final questionnaire focuses on usability concerns (Figure 8.3c). Thisquestionnaire uses the System Usability Scale (SUS) [45] together with tailoredmade questions for our particular experiment. All of the questions/state-mentsin the daily and final survey, apart from Q13, Q14, Q16 and Q17, are evaluatedon a likert scale ranging from 1-5 (1 being strongly disagree and 5 being stronglyagree).
8.2.2.4 Data Analysis
For both studies we will be focusing our analysis on the data collected fromthe final survey, as that most directly addresses RQ1.1 and RQ1.2. For eachof the statements we will count and classify each of the categorical responsesgiven on the likert scale. We will then present this analysis in the form of tables.Thereafter, we will analyse if a difference was recorded between the users of theBaseApp and those of RELATE.
230
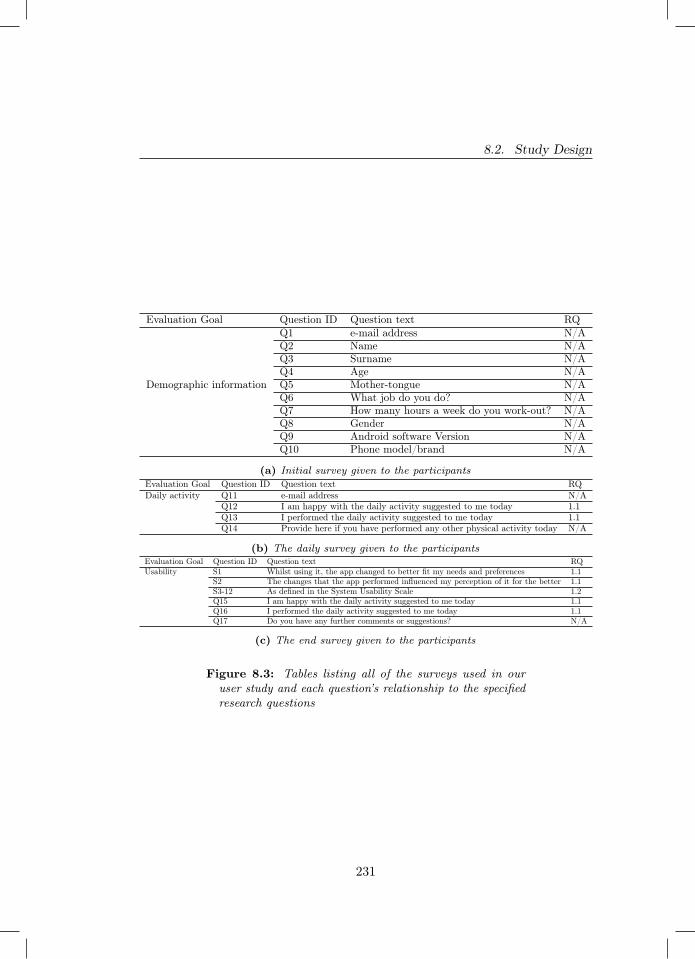
8.2. Study Design
Evaluation Goal Question ID Question text RQQ1 e-mail address N/AQ2 Name N/AQ3 Surname N/AQ4 Age N/A
Demographic information Q5 Mother-tongue N/AQ6 What job do you do? N/AQ7 How many hours a week do you work-out? N/AQ8 Gender N/AQ9 Android software Version N/AQ10 Phone model/brand N/A
(a) Initial survey given to the participantsEvaluation Goal Question ID Question text RQDaily activity Q11 e-mail address N/A
Q12 I am happy with the daily activity suggested to me today 1.1Q13 I performed the daily activity suggested to me today 1.1Q14 Provide here if you have performed any other physical activity today N/A
(b) The daily survey given to the participantsEvaluation Goal Question ID Question text RQUsability S1 Whilst using it, the app changed to better fit my needs and preferences 1.1
S2 The changes that the app performed influenced my perception of it for the better 1.1S3-12 As defined in the System Usability Scale 1.2Q15 I am happy with the daily activity suggested to me today 1.1Q16 I performed the daily activity suggested to me today 1.1Q17 Do you have any further comments or suggestions? N/A
(c) The end survey given to the participants
Figure 8.3: Tables listing all of the surveys used in ouruser study and each question’s relationship to the specifiedresearch questions
231

Chapter 8. Empirical Evaluation
8.2.2.5 Experiment Execution
Following the initial stage of recruitment, we had the interested participants fillin the initial survey. After, we randomly divided the participants into two groups.Group R used RELATE and Group B used the BaseApp. The participantswere then sent an e-mail with attached the .apk file for their system, as wellas instructions on how to install it on their own Android devices. Once allparticipants informed us of the successful installation of the app, we sent themaccess to the daily survey and sent them their first weekly activity schedule.During the course of the study, we sent e-mail remainders to the participants tofill in their daily surveys. After one month the study was ended. At the end ofthe study the participants completed the final survey. This designed experimentwas executed twice. Once over the month of December 2020 and the secondfrom mid January to mid February 2021. Both executions of the experimentlasted 4 weeks and in both cases the participants were selected via conveniencesampling. Due to the Covid-19 pandemic, both studies were conducted with nophysical interaction between us and the participants. All correspondence wasdone via e-mail.
8.2.3 Design and execution of Experiment 2 (Measurement-Based Experiment)
8.2.3.1 Goal and Research Questions
Similarly to the previous experiment, we formulate the goal of this experimentby using the goal template provided by Basili et al. [27].
Analyse personalisation and self-adaptation techniques for the purpose ofassessing their impact with respect to resource consumption at runtime fromthe viewpoint of users, developers, and researchers in the context of ourAndroid implementation of RA.
In the following we present and discuss the research questions we translatedfrom the above mentioned overall goal.
232
8.2. Study Design
RQ2.1 – What is the impact of personalisation and self-adaptation tech-niques on the performance of an e-Health mobile app?
The main objective of RQ2.1 is to investigate how the use of personalisationand self-adaptation could impact the performance of a e-Health mobile appas opposed to one that does not include such techniques. For the purpose ofour experiment, we measure performance impact by measuring the CPU usageand memory consumed by the mobile device whilst operating one of the testedsystems (either RELATE or the BaseApp). This knowledge can help developersand users of personalised and self-adaptive e-Health mobile apps as performanceproblems are easily noticed by a user and impact to their experience. Theseperformance problems can be perceived by the user as app sluggishness andnon-responsiveness which can lead to user abandonment as they uninstall theapp due to frustration and dissatisfaction.
RQ2.2 – What is the impact of personalisation and self-adaptation tech-niques on the energy consumption of an e-Health mobile app?
The main objective of RQ2.2 is to investigate if the use of personalisationand self-adaptation can have a significant impact on the energy consumptionthat a e-Health mobile app draws as compared to an identical e-Health appthat does not use these techniques. Answering this research question givesimportant insight to the developer and the user of such apps. The amount ofenergy consumed by a single app can have great impact on the users’ experience,as it could potentially hinder the users’ ability of utilising their mobile deviceall together. If the introduction of these techniques would lead to a highenough energy consumption, it could potentially discourage users from choosinge-Health mobile apps containing personalisation and self-adaptation, somethingthat would be undesirable to a developer.
233
Chapter 8. Empirical Evaluation
8.2.3.2 Variables and Hypotheses
This section explains both the independent and dependent variables present inour experiment.
The independent variables in this experiment are two: the type ofsmartphone used and the type of system installed on it. The type of smartphoneused has two treatments: low-end and middle-end. For our low-end device weused a LG Nexus 5X and for the middle-end device we used a Samsung GalaxyJ7 Duo (further details on the two smartphones are reported in Section 8.2.2.5).The type of system installed on the smartphone has also two treatments: thesystem with no dynamic tailoring (the BaseApp) and the system with dynamictailoring (RELATE). For each execution of one of these systems we measurethe below reported dependent variables.
The dependent variables in this experiment are the energy consumed(reported in Joules), the cpu usage (reported as the percentage amount used overthe total amount available) and the memory consumed (reported in kilobytes)by either the BaseApp or RELATE.
For each of the above listed dependent variables we formulate the followinghypotheses:
− H1: We define CPUB to be the measured CPU usage of the BaseAppand CPUR to be the measured CPU usage of RELATE. The null andthe alternative hypotheses are formulated as follows:H10 : CPUB = CPUR
H11 : CPUB 6= CPUR
− H2: We define MEMB to be the measured memory consumption ofthe BaseApp and MEMR to be the measured consumption of RELATE.The null and alternative hypotheses are formulated as follows:H20 : MEMB = MEMR
H21 : MEMB 6= MEMR
− H3: We define ECB to be the measured energy consumption of theBaseApp and ECR to be the measured energy consumption of RELATE.
234
8.2. Study Design
The null and alternative hypotheses are formulated as follows:H30 : ECB = ECR
H31 : ECB 6= ECR
H1 and H2 investigate the dependent variables for answering RQ2.1, whileH3 aims at answering RQ2.2. All three hypotheses are separately assessed foreach of the two smartphones used.
8.2.3.3 Data Analysis
In this experiment we are going to answer each of our research questions in fourphases: exploration, normality checks, hypotheses testing, effect size estimation.
Exploration. In this first phase we get an indication of the data collectedvia the use of descriptive statistics (i.e., mean, median and standard deviation)and boxplots.
Normality checks. We measure the distribution of each data type collectedto understand whether we can apply parametric or non-parametric statisticaltests. We check whether the data is normally distributed by first visuallyanalysing it with a Q-Q plot and the applying a Shapiro-Wilks statistical test[315] with an α = 0.05. As we report in Section 8.3.2, the collected data isnot normally distributed.
Hypotheses testing. Given the non normal distribution of the datacollected we test our hypotheses by the use of the Mann Whitney U test (withan α = 0.05). The Mann Whitney U (also known as the Wilcoxon rank-sumtest) is a non-parametric statistical test used to check whether the populationof two distributions are statistically equal [234].
Effect size estimation. To statistically test the effect size of the differencefound between samples we use the Cliff’s Delta statistical test [79]. Cliff’s Deltais a non-parametric statistical tool used to calculate the effect size withoutmaking assumptions on the distributions compared.
235
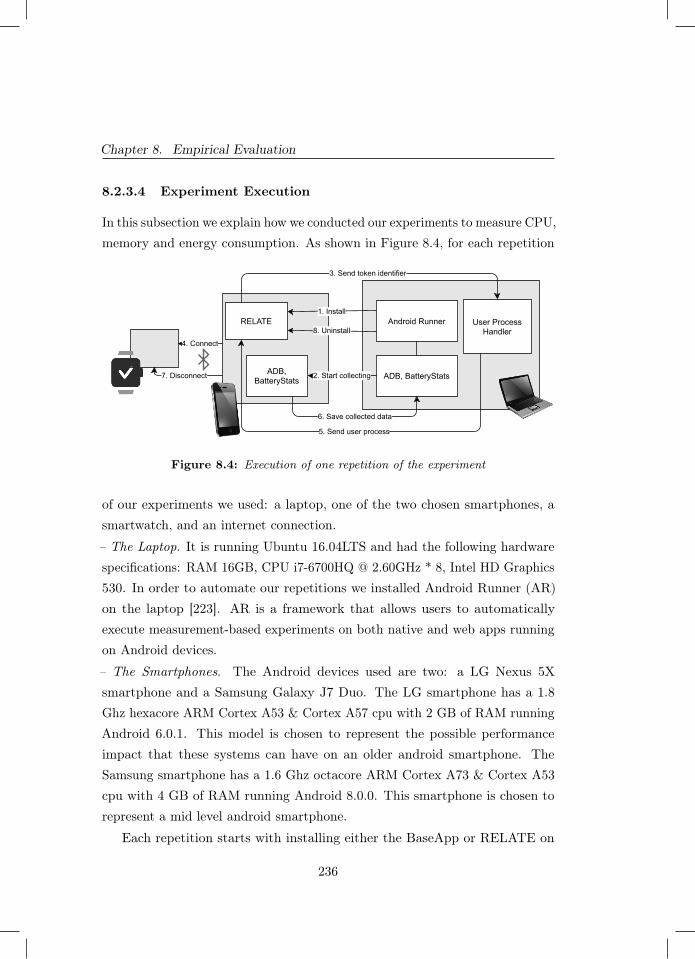
Chapter 8. Empirical Evaluation
8.2.3.4 Experiment Execution
In this subsection we explain how we conducted our experiments to measure CPU,memory and energy consumption. As shown in Figure 8.4, for each repetition
Android Runner1. Install
RELATE
4. Connect
User ProcessHandler
3. Send token identifier
5. Send user process
ADB, BatteryStatsADB,BatteryStats 2. Start collecting
6. Save collected data
7. Disconnect
8. Uninstall
Figure 8.4: Execution of one repetition of the experiment
of our experiments we used: a laptop, one of the two chosen smartphones, asmartwatch, and an internet connection.
– The Laptop. It is running Ubuntu 16.04LTS and had the following hardwarespecifications: RAM 16GB, CPU i7-6700HQ @ 2.60GHz * 8, Intel HD Graphics530. In order to automate our repetitions we installed Android Runner (AR)on the laptop [223]. AR is a framework that allows users to automaticallyexecute measurement-based experiments on both native and web apps runningon Android devices.
– The Smartphones. The Android devices used are two: a LG Nexus 5Xsmartphone and a Samsung Galaxy J7 Duo. The LG smartphone has a 1.8Ghz hexacore ARM Cortex A53 & Cortex A57 cpu with 2 GB of RAM runningAndroid 6.0.1. This model is chosen to represent the possible performanceimpact that these systems can have on an older android smartphone. TheSamsung smartphone has a 1.6 Ghz octacore ARM Cortex A73 & Cortex A53cpu with 4 GB of RAM running Android 8.0.0. This smartphone is chosen torepresent a mid level android smartphone.
Each repetition starts with installing either the BaseApp or RELATE on
236
8.3. Results
the smartphone (step 1). Once installed, AR starts measuring the system’sconsumption of CPU, memory and energy (step 2). For measuring the CPU andmemory consumption AR uses Android Debug Bridge4 (adb). For measuringthe energy consumption it instead uses the Android Batterystats profiler [101].AR then follows a series of screen taps and gestures that are engineered to beindicative of a worst case scenario. Within the profiling session, the scenario goesthrough the completion of the initial screen, giving of the necessary run-timepermissions, the re-connection to the paired smartwatch (step 4), the receivingof the weekly user activities (step 5). When the scenario is terminated, AR stopsprofiling the Android device (step 6). After profiling, AR makes the necessarysteps to set the device back to how it was before the installation of the system(step 7 and 8). Lastly, AR waits 2 minutes before running another repetition ofthe experiment. This wait is introduced to allow the device to ’cool-off’ and goback to an idle state; this break minimises inconsistencies between repetitions.We ran 50 repetitions for each combination of system and smartphone, leadingto a total of 200 repetitions.
8.3 Results
In this section we report on the results for both Experiments 1 and 2.
8.3.1 Results of Experiment 1 (User study)
We will now discuss the results of our user studies, organised by researchquestion and following the method and tools described in Section 8.2.2.4. Theresults of the final survey for the first user study are shown in Figure 8.5a.The participants answering the final survey could rate each statement fromagreement (by rating it a 5) to disagreement (by rating it a 1). It is importantto note that the scoring can mean something different per statement. For somestatements disagreement is desired and for other statements we are lookingfor user agreement. Participants in Group R used RELATE and Group B
4 https://developer.android.com/studio/command-line/adb
237
Chapter 8. Empirical Evaluation
participants used the BaseApp. Figure 8.5b illustrates the final survey resultsfor the second user study.
8.3.1.1 Investigating end users’ perception (RQ1.1)
The statements related to RQ1.1 are S1 and S2 shown in Figure 8.5, and Q12,Q15, Q13, and Q16 defined in Figures 8.3c and 8.3b.– Whilst using it, the app changed to better fit my needs and preferences (S1).In both user studies participants in Group R tended to agree more with thisstatement. Participants in Group B did instead agree less. This means thatgenerally participants in Group B did not find the app to change for the better,implying that they either did not think the app changed or that it changed forthe worse.– The changes that the app performed influenced my perception of it for the better(S2). In the first user study participants in Group R rated this statement witheither disagreement or neutrality. Whilst members of Group B showed moreagreement to the statement. In the second user study members of both groupsshowed their opinion to be either neutral or in agreement. These findings implythat in the first user study participants using RELATE did not believe that thechanges performed by the app influenced their opinion of it for the better. Thiscould mean that either the changes they perceived didn’t impact their opinionof RELATE or shifted their opinion for the worse. On the contrary, membersof Group B as well as all participants in the second user study seemed to havereceived the perceived changes positively. This indicates that, especially forusers of RELATE in the second study, the changes offered and perceived by theusers are considered a positive aspect of the app.– I am happy with the daily activity suggested to me today (Q12 and Q15). Wehave grouped Q12 and Q15 as they are the same question but posed in twodifferent surveys (i.e., the daily and the final surveys). For the first user study,we gathered the following average (median) and standard deviation for GroupB: 4.290 (5) and 1.062. Whilst, for Group R we gathered the following average(median) and standard deviation of 3.9256 (4) and 1.039. In the second userstudy, we gathered the following results of average (median) and standard
238
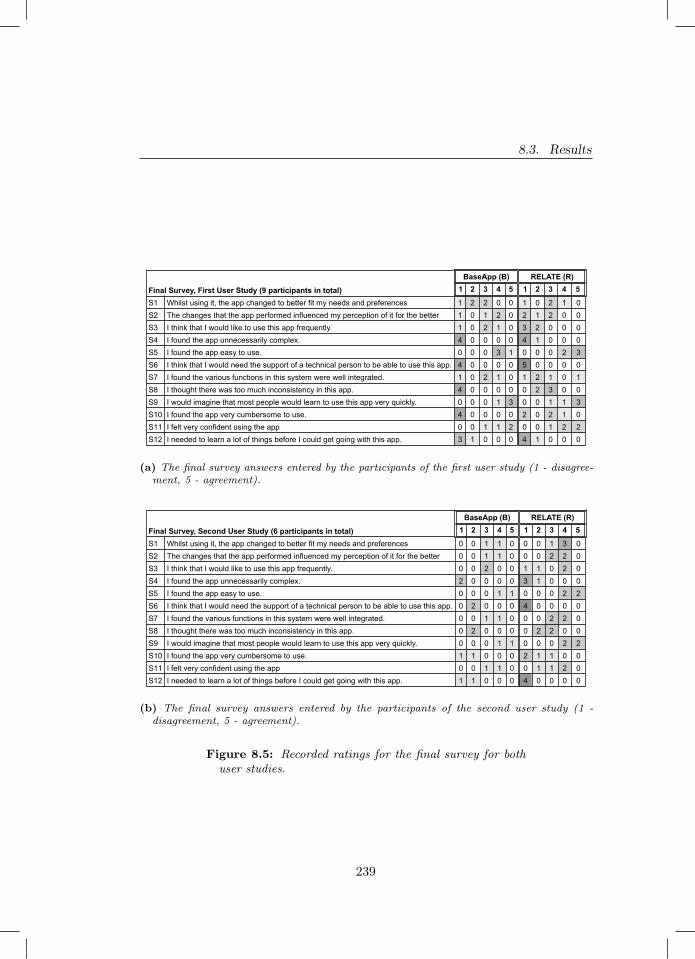
8.3. Results
Final Survey, First User Study (9 participants in total)
BaseApp (B) RELATE (R)1 2 3 4 5 1 2 3 4 5
S1 Whilst using it, the app changed to better fit my needs and preferences 1 2 2 0 0 1 0 2 1 0S2 The changes that the app performed influenced my perception of it for the better 1 0 1 2 0 2 1 2 0 0S3 I think that I would like to use this app frequently. 1 0 2 1 0 3 2 0 0 0S4 I found the app unnecessarily complex. 4 0 0 0 0 4 1 0 0 0S5 I found the app easy to use. 0 0 0 3 1 0 0 0 2 3S6 I think that I would need the support of a technical person to be able to use this app. 4 0 0 0 0 5 0 0 0 0S7 I found the various functions in this system were well integrated. 1 0 2 1 0 1 2 1 0 1S8 I thought there was too much inconsistency in this app. 4 0 0 0 0 0 2 3 0 0S9 I would imagine that most people would learn to use this app very quickly. 0 0 0 1 3 0 0 1 1 3S10 I found the app very cumbersome to use. 4 0 0 0 0 2 0 2 1 0S11 I felt very confident using the app 0 0 1 1 2 0 0 1 2 2S12 I needed to learn a lot of things before I could get going with this app. 3 1 0 0 0 4 1 0 0 0
(a) The final survey answers entered by the participants of the first user study (1 - disagree-ment, 5 - agreement).
Final Survey, Second User Study (6 participants in total)
BaseApp (B) RELATE (R)1 2 3 4 5 1 2 3 4 5
S1 Whilst using it, the app changed to better fit my needs and preferences 0 0 1 1 0 0 0 1 3 0S2 The changes that the app performed influenced my perception of it for the better 0 0 1 1 0 0 0 2 2 0S3 I think that I would like to use this app frequently. 0 0 2 0 0 1 1 0 2 0S4 I found the app unnecessarily complex. 2 0 0 0 0 3 1 0 0 0S5 I found the app easy to use. 0 0 0 1 1 0 0 0 2 2S6 I think that I would need the support of a technical person to be able to use this app. 0 2 0 0 0 4 0 0 0 0S7 I found the various functions in this system were well integrated. 0 0 1 1 0 0 0 2 2 0S8 I thought there was too much inconsistency in this app. 0 2 0 0 0 0 2 2 0 0S9 I would imagine that most people would learn to use this app very quickly. 0 0 0 1 1 0 0 0 2 2S10 I found the app very cumbersome to use. 1 1 0 0 0 2 1 1 0 0S11 I felt very confident using the app 0 0 1 1 0 0 1 1 2 0S12 I needed to learn a lot of things before I could get going with this app. 1 1 0 0 0 4 0 0 0 0
(b) The final survey answers entered by the participants of the second user study (1 -disagreement, 5 - agreement).
Figure 8.5: Recorded ratings for the final survey for bothuser studies.
239
Chapter 8. Empirical Evaluation
deviation from Group B: 3.706 (4) and 0.47. For Group R we got an average(median) and standard deviation of 3.655 (4) and 0.971. In both user studies theresults gathered indicate a minimal difference in happiness with the suggesteddaily activities, with the participants in Group B seemingly happier.
– I performed the daily activity suggested to me today (Q13 and Q16). Forthese questions we calculated the percentage of times that participants of agroup reported performing their suggested physical activity of the day. In thefirst user study participants of Group B reported following the suggested dailyactivity 82.26% of the time. Participants of Group R reported performing theirsuggested activity 73.4% of the time. In the second study, the participants ofGroup B reported performing their daily suggested activity 58.82% of the time,whilst participants of Group R agreed with the suggested activity 66.37% ofthe time. These findings show that in the first user study, participants usingRELATE recorded performing their suggested activities less often than thosenot using this app. The opposite can be seen from the results of the seconduser study.
8.3.1.2 Investigating usability (RQ1.2)
In this section we report on the data obtained to answer RQ1.2. The statementsrelated to this research question are S3 to S12 shown in Figure 8.5. We havegrouped the statements together per overarching topic: ease of use of the app,app cohesiveness, and likely hood of using the app in the future. – Ease of useof the app. This topic groups the following statements:
− I found the app unnecessarily complex. (S4)
− I found the app easy to use. (S5)
− I think that I would need the support of a technical person to be able touse this app. (S6)
− I would imagine that most people would learn to use this app very quickly.(S9)
240

8.3. Results
− I felt very confident using the app. (S11)
− I needed to learn a lot of things before I could get going with this app.(S12)
For this group of statements, we find that the participants rated their utilisedapps easy to use (S5, S6, S9, S11) and understand (S4, S6, S12). This is trueno matter if the participants are from Group R or Group B. Furthermore, thereis no significant difference in opinion between the participants of the first userstudy as compared to those of the second user study. As participants from bothgroups had no significant difference in scoring their version of the app, we alsounderstand that dynamic tailoring did not make it harder for the user to useand understand the app.– App cohesiveness. This group is comprised of the following statements:
− I found the various functions in this system were well integrated. (S7)
− I thought there was too much inconsistency in this app. (S8)
The findings for S7 in the first user study show that, no matter which groupthe participants belonged to, they were split across the scale. The opposite isseen for the results of the second user study, here the opinion on the integrationof system functionalities was more focused and seen more positively. Morecohesive are the results of S8. For both user studies the participants found theirapps to not have too much inconsistency. In particular users of RELATE weremore neutral towards this statement than the users of the BaseApp, which allrated the statement with disagreement.– Likelihood of using the app in the future. Lastly, in this topic we group thefollowing statements:
− I think that I would like to use this app frequently. (S3)
− I found the app very cumbersome to use. (S10)
The findings for S3 are non homogeneous and inconsistent across the two userstudies. In the first one, most participants either disagreed with the statement
241
Chapter 8. Empirical Evaluation
of were neutral about it. In the second one, half of Group R disagreed withthe statement, whilst the other half agreed; the members of Group B all ratedthe statement neutrally. These findings show a non homogeneous consent inthe opinions of the participants. We, instead, find cohesion in the results givenfor S10, as in both user studies the majority of participants did not find theirversion of the app to be cumbersome to use. We further elaborate on theseresults in Section 8.5.4.
8.3.2 Results of Experiment 2 (Measurement-Based Ex-periment)
In this section we report on the results obtained for the measurement-basedexperiment. We will be discussing the results per research question answered,following the procedure reported in Section 8.2.3.3.
8.3.2.1 Impact on performance (RQ2.1)
Exploration. The performance data measured for the LG smartphone areshown on Figure 8.6. For the CPU measurements, we see no clear differencebetween the two apps. The mean (median) and standard deviation for theBaseApp are: 14.24 % (10.55 %) and 7.90 %, whilst for RELATE they are:13.69 % (11.00 %) and 7.15 % respectively.
We can observe a difference between the distribution of the memory usage ofthe two apps, with RELATE consuming more memory. The mean (median) andstandard deviation of the BaseApp are 65266.40 kB (64675.35 kB) and 1140.62kB, respectively, and the descriptive statistics of RELATE are: 67912.26 kB(67859.79 kB) and 519.67 kB, respectively.
The performance measured for the Samsung smartphone are shown in Figure8.7. As shown in subfigure 8.7a, we have found no difference in CPU usage bythe two systems. The mean (median) and standard deviation of the BaseAppare: 13.90 % (11.96 %) and 9.34 %. Similarly, the descriptive statistics for theCPU consumption of RELATE are: 12.61 % (11.00 %) and 7.93 %. Similar tothe LG smartphone, in this case RELATE tends to use more memory than the
242
8.3. Results
BaseApp (seen in subfigure 8.7b). The mean (median) and standard deviationfor the BaseApp are: 47963.58 kB (44531.24 kB) and 6363.78 kB, respectively.Differently, RELATE reported a mean (median) and standard deviation of:55492.90 kB (54478.22 kB) and 2898.77 kB, respectively.
Check for normality. Figure 8.6 shows the Q-Q plot against the normaldistribution for both the CPU and the memory consumption data measuredon the LG smartphone. Several measures fall far away from the referenceline, indicating that the collected measures are not normally distributed. Tofurther confirm our observation we carried out the Shapiro-Wilks test on allfour datasets. For RELATE CPU measurements the test returned a p-valueof 3.545e-08 and, for the BaseApp we achieved a p-value of 4.72e-09. For thememory measurements of RELATE we obtained a p-value = 0.03345 and forthe BaseApp the p-value is 1.89e-05. Therefore, in all cases, we can reject thenull hypothesis stating that these samples come from a normal distribution.
With Figure 8.7 we illustrate the Q-Q plots for the performance measure-ments taken on the Samsung smartphone.
Our Shapiro-Wilks tests confirm the Q-Q plots. With a returned p-value of6.262e-10 for the CPU measurements of RELATE and a p-value of 4.161e-09for the BaseApp. For the memory usage RELATE had a p-value = 1.285e-11and the BaseApp returned a p-value of 4.661e-07. We can therefore reject thenull hypothesis stating that the Samsung smartphone CPU usage data comesfrom a normal distribution.
Hypothesis testing. As stated in subsection 8.2.3.3, we utilise the non-parametric Mann–Whitney U test to determine whether we can reject ourstated null hypotheses (formulated in subsection 8.2.3.2). Starting by examiningthe measurements collected for the LG smartphone; the p-value returned for thecomparison between BaseApp and AdaptiveSystem on the CPU consumption isequal to 0.48. As this p-value is above the significance threshold (α=0.05), wecannot reject the null hypothesis H10. When applying the statistical test tothe memory consumption values of the two apps we obtain a returned p-valueof 2.54814e-17. As this value is smaller than our chosen α, we can rejectour null hypothesis H20. The above findings are similar for the Samsung
243
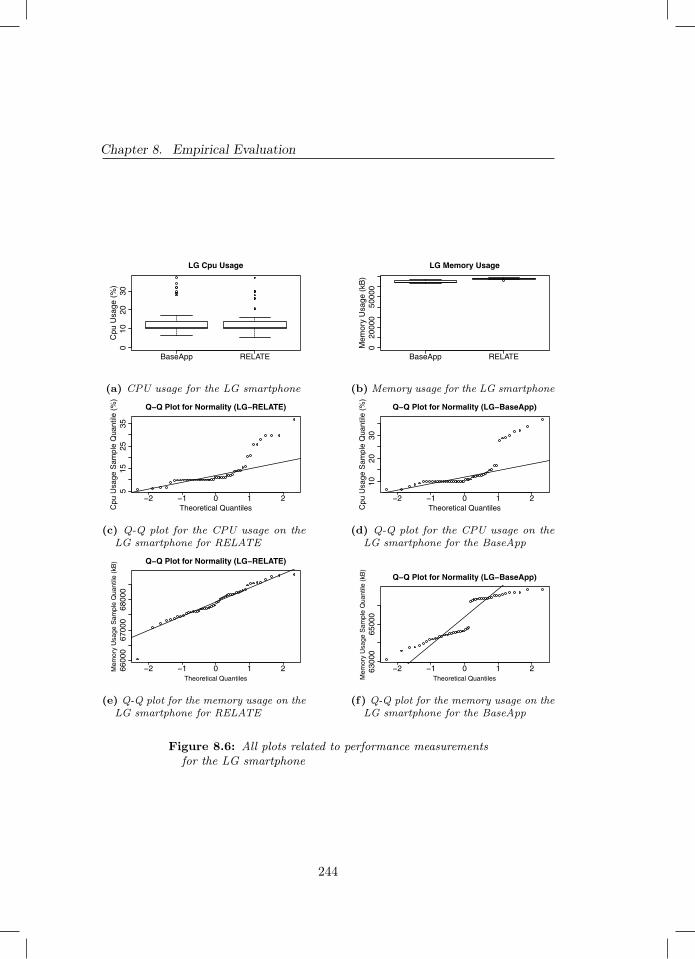
Chapter 8. Empirical Evaluation
BaseApp RELATE
010
2030
LG Cpu Usage
Cpu
Usa
ge (
%)
(a) CPU usage for the LG smartphone
BaseApp RELATE
020
000
5000
0
LG Memory Usage
Mem
ory
Usa
ge (
kB)
(b) Memory usage for the LG smartphone
−2 −1 0 1 2
515
2535
Q−Q Plot for Normality (LG−RELATE)
Theoretical QuantilesCpu
Usa
ge S
ampl
e Q
uant
ile (
%)
(c) Q-Q plot for the CPU usage on theLG smartphone for RELATE
−2 −1 0 1 2
1020
30
Q−Q Plot for Normality (LG−BaseApp)
Theoretical QuantilesCpu
Usa
ge S
ampl
e Q
uant
ile (
%)
(d) Q-Q plot for the CPU usage on theLG smartphone for the BaseApp
−2 −1 0 1 26600
067
000
6800
0
Q−Q Plot for Normality (LG−RELATE)
Theoretical Quantiles
Mem
ory
Usa
ge S
ampl
e Q
uant
ile (
kB)
(e) Q-Q plot for the memory usage on theLG smartphone for RELATE
−2 −1 0 1 26300
065
000
Q−Q Plot for Normality (LG−BaseApp)
Theoretical QuantilesMem
ory
Usa
ge S
ampl
e Q
uant
ile (
kB)
(f) Q-Q plot for the memory usage on theLG smartphone for the BaseApp
Figure 8.6: All plots related to performance measurementsfor the LG smartphone
244
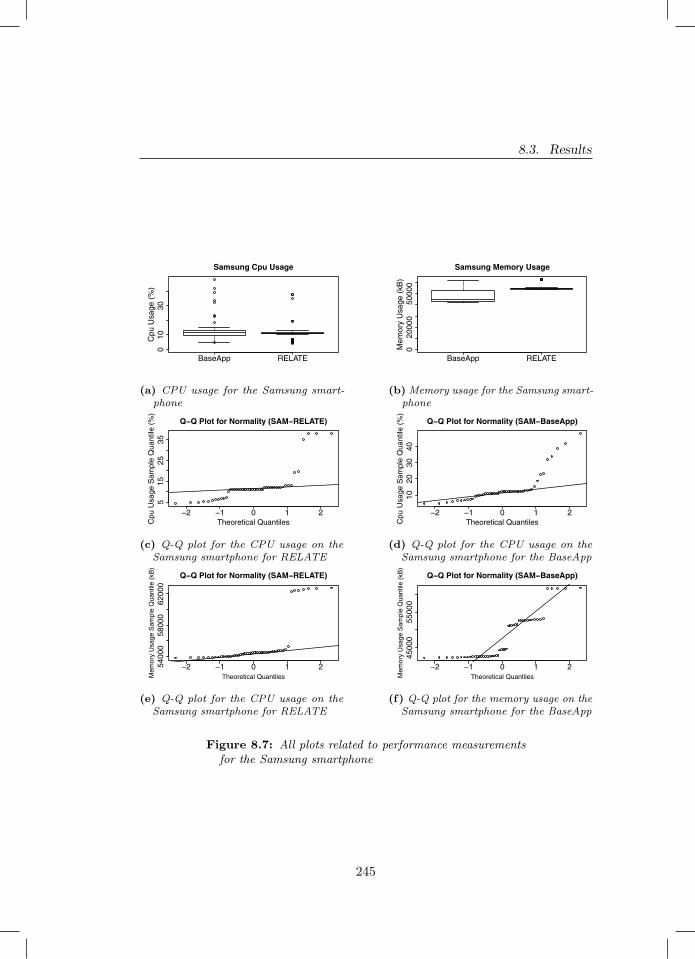
8.3. Results
BaseApp RELATE
010
30
Samsung Cpu Usage
Cpu
Usa
ge (
%)
(a) CPU usage for the Samsung smart-phone
BaseApp RELATE
020
000
5000
0
Samsung Memory Usage
Mem
ory
Usa
ge (
kB)
(b) Memory usage for the Samsung smart-phone
−2 −1 0 1 2
515
2535
Q−Q Plot for Normality (SAM−RELATE)
Theoretical QuantilesCpu
Usa
ge S
ampl
e Q
uant
ile (
%)
(c) Q-Q plot for the CPU usage on theSamsung smartphone for RELATE
−2 −1 0 1 2
1020
3040
Q−Q Plot for Normality (SAM−BaseApp)
Theoretical QuantilesCpu
Usa
ge S
ampl
e Q
uant
ile (
%)
(d) Q-Q plot for the CPU usage on theSamsung smartphone for the BaseApp
−2 −1 0 1 25400
058
000
6200
0
Q−Q Plot for Normality (SAM−RELATE)
Theoretical QuantilesMem
ory
Usa
ge S
ampl
e Q
uant
ile (
kB)
(e) Q-Q plot for the CPU usage on theSamsung smartphone for RELATE
−2 −1 0 1 2
4500
055
000
Q−Q Plot for Normality (SAM−BaseApp)
Theoretical QuantilesMem
ory
Usa
ge S
ampl
e Q
uant
ile (
kB)
(f) Q-Q plot for the memory usage on theSamsung smartphone for the BaseApp
Figure 8.7: All plots related to performance measurementsfor the Samsung smartphone
245
Chapter 8. Empirical Evaluation
smartphone, where the returned p-values for the comparison of the two apps onCPU consumption and memory usage are 0.36 and 9.67143e-13, respectively.This means that we cannot reject the null hypothesis H10, but we can rejectthe null hypothesis H20.
Effect size estimation. As a follow up to the use of the Mann-WhitneyU test, we determine the effect size of the differences found. As stated insubsection 8.2.3.3, we use Cliff’s Delta to do so. A large effect size is foundwhen investigating the difference in memory consumption between the BaseAppand AdaptiveSystem for both the Lg smartphone (0.98) and the Samsungsmartphone (0.83).
8.3.2.2 Impact on energy consumption (RQ2.2)
Exploration. Figure 8.8b shows the distribution of the energy consumption ofthe two apps running on the LG smartphone. We see no apparent difference inthe energy consumption between the two apps. Indeed the mean (median) andstandard deviation for the BaseApp are: 139.54 J (133.53 J) and 15.34 J. ForRELATE the mean (median) and standard deviation are: 139.32 J (132.95 J)and 18.78 J.
For the Samsung smartphone we observe a slight difference in energy con-sumption between the two systems (shown in Figure 8.8a). We can observe thatRELATE consumes less energy than the BaseApp; we will be further discussingthis finding in Section 8.4. The mean (median) and standard deviation of theenergy consumption for the baseline app are: 137.51 J (134.83 J) and 9.99 J;whilst the descriptive statistic for RELATE are: 133.96 J (131.85 J) and 8.28 Jrespectively.
Check for normality. Figures 8.8d and 8.8f show the Q-Q plots against thenormal distribution for the energy consumption measured on the LG smartphone.Both plots show that the data collected is not normally distributed. To furthercorroborate our finding, the Shapiro-Wilks test done on RELATE’s datasetreturns a p-value of 6.115e-12 and the BaseApp case gives a p-value of 5.904e-09.Therefore we can reject the null hypothesis of the data belonging to a normaldistribution.
246
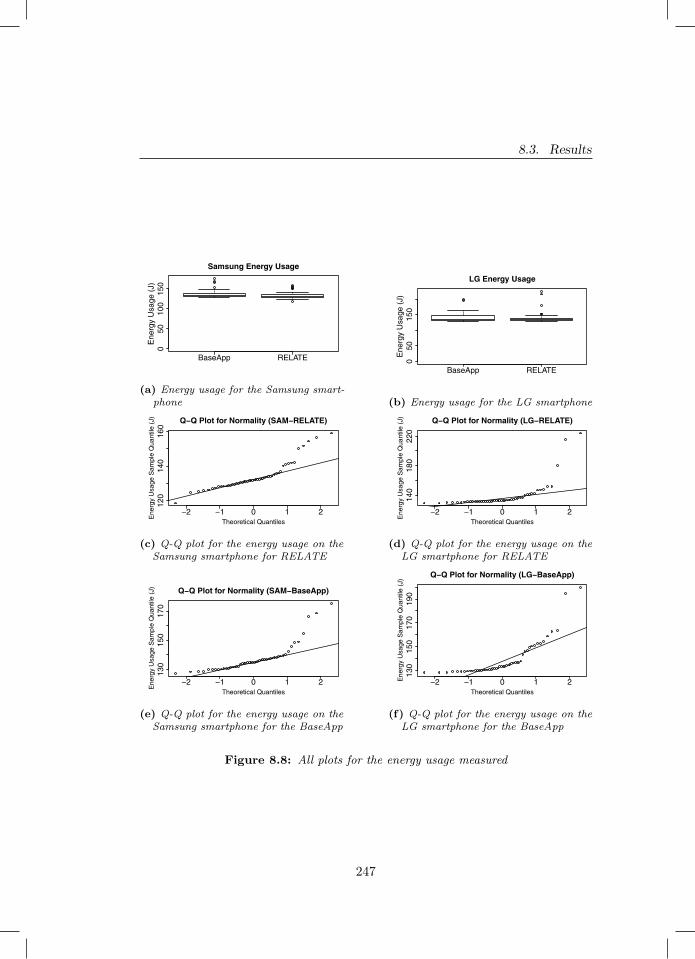
8.3. Results
BaseApp RELATE
050
100
150
Samsung Energy Usage
Ene
rgy
Usa
ge (
J)
(a) Energy usage for the Samsung smart-phone
BaseApp RELATE
050
150
LG Energy Usage
Ene
rgy
Usa
ge (
J)(b) Energy usage for the LG smartphone
−2 −1 0 1 2
120
140
160
Q−Q Plot for Normality (SAM−RELATE)
Theoretical Quantiles
Ene
rgy
Usa
ge S
ampl
e Q
uant
ile (
J)
(c) Q-Q plot for the energy usage on theSamsung smartphone for RELATE
−2 −1 0 1 2
140
180
220
Q−Q Plot for Normality (LG−RELATE)
Theoretical Quantiles
Ene
rgy
Usa
ge S
ampl
e Q
uant
ile (
J)
(d) Q-Q plot for the energy usage on theLG smartphone for RELATE
−2 −1 0 1 2
130
150
170
Q−Q Plot for Normality (SAM−BaseApp)
Theoretical Quantiles
Ene
rgy
Usa
ge S
ampl
e Q
uant
ile (
J)
(e) Q-Q plot for the energy usage on theSamsung smartphone for the BaseApp
−2 −1 0 1 2
130
150
170
190
Q−Q Plot for Normality (LG−BaseApp)
Theoretical Quantiles
Ene
rgy
Usa
ge S
ampl
e Q
uant
ile (
J)
(f) Q-Q plot for the energy usage on theLG smartphone for the BaseApp
Figure 8.8: All plots for the energy usage measured
247

Chapter 8. Empirical Evaluation
Figures 8.8c and 8.8e illustrate the Q-Q plots against the normal distributionfor the energy consumption measured on the Samsung smartphone. As theplots indicates, the data is not normally distributed. This is confirmed bythe Shapiro-Wilks test, as RELATE returned a p-value of 1.258e-05 and theBaseApp returned a p-value equal to 3.329e-08. We can therefore reject thenull hypothesis that the energy consumption measured from the Samsungsmartphone comes from a normal distribution.
Hypothesis testing. We start by using the Mann–Whitney U test onthe energy consumption data collected on the Lg smartphone. The p-valuereturned by the test is 0.73, as this value is above our chosen α, we cannot rejectthe null hypothesis H30 and therefore we find that the difference in energyconsumption between the BaseApp and RELATE on the Lg smartphone is notstatistically significant. When running the test on the energy consumption datafor the Samsung smartphone we obtain a p-value of 0.009. As the p-value isbelow our α threshold, we can reject the null hypothesis H30 and find thatthe difference in energy consumption between the BaseApp and RELATE isstatistically significant.
Effect size estimation. Here we use Cliff’s Delta to follow up on thefindings gathered in our hypothesis testing. The difference found on the Samsungsmartphone can be classified as small (i.e., -0.30).
8.4 Discussion
8.4.1 Discussion on Experiment 1 (User study)
We start by discussing the results on the end users’ perception (RQ1.1). Partic-ipants using RELATE tend to agree more than those using the BaseApp thatthe app changed to better fit their needs and preference (S1). This result isinteresting, as it suggests that users of RELATE (i) noticed the adaptation ofthe app and (ii) found those changes to be useful.
Most participants rated the statement “the changes that the app performedinfluenced my perception of it for the better” neutrally or approvingly (S2).
248
8.4. Discussion
Only the users of RELATE in the first user study also stated disagreementwith the statement. The disagreement with the statement can either meanthat the participants found the changes to modify their perception of RELATEfor the worse or that they did not make a difference in their perception ofthe app. Given the agreement recorded for the previous statement (S1), wefind it unlikely for the disagreement on this statement, S2, to have a negativeconnotation: as this would contradict the positive implications found with S1.Therefore, we can conclude that the changes performed by the app were overallseen as either non impactful to the users’ perception of the app or as a positiveinfluence.
Regarding how happy the users were with their daily activities,our results found little difference between users using the BaseAppand those using RELATE in both user studies. The only difference seemsto be the fact that participants in Group B appeared to be somewhat happier.This, however, is not reflected in the adherence to performing the suggestedactivities. Here, the two user studies show opposite results with the first oneshowing participants in Group B performing their suggested activities more often,whereas the second user study showed Group R more often performing their dailyactivities. Therefore, these last results seem to be inconclusive. This could bedue to the simplicity of the suggested daily activities and the minimal dynamictailoring that is done with them in this current version of the implemented apps.As future work, it would be important to include all of the Back-end componentsin the RA in order to be able to better personalize the daily suggested activitiesto the participants using RELATE. This further implementation of dynamictailoring could lead to a wider observed difference between the two groups ofparticipants as the two apps will be further distinguished from each other.
In summary, the results we have obtained indicate that personalisationand self-adaptation techniques have an overall positive impact on theend users’ perception of e-Health mobile apps. Therefore, developersand researchers whom are interested in end users’ perception, can successfullyadopt these techniques in their own e-Health apps.
Lastly, privacy was a relevant concern during our experiments. We addressed
249
Chapter 8. Empirical Evaluation
privacy concerns by having all of our participants give us their personal informa-tion willingly and understand that it would be saved and used for the purposesof this work. To respect privacy regulations, the data presented to the public,via the replication package, has been anonymised.
We will discuss now the results related to our investigation on the usabilityof our e-Health mobile app (RQ1.2). Across all of the statements analysed, wesee a pattern of agreement between all of the participants, no matter the groupthey were assigned to. This is interesting, as it points to dynamic tailoring notbeing a determining factor to how the participants responded to the survey.We observed only with statements S3 (i.e., “I think that I would like to usethis app frequently”) and S7 (i.e., “I found the various functions in this systemwere well integrated”) that the participants did not show a clear trend orconsensus, and were instead more distributed along the Likert scale. Giventhese results, we can conclude that there seems to be no apparent impactcaused by personalisation and self-adaptation techniques on usabilityof e-Health mobile apps. As discussed previously, a future implementationof RELATE containing the complete Back-end components from our RA mighthelp surface differences that were not recorded in this study, as this new versionof RELATE would include the full range of dynamic tailoring advocated by ourRA and would therefore increase the difference between our two tested systems(RELATE and our BaseApp).
8.4.2 Discussion on Experiment 2 (Measurement-BasedExperiment)
We start the discussion by elaborating on our results for RQ2.1, namely: “What isthe impact of personalisation and self-adaptation techniques on the performanceof e-Health mobile apps?”. For both devices, RELATE tends to use more memorythan the BaseApp. This is understandable, as RELATE contains the adaptivecomponents that the BaseApp does not (i.e., Environment Driven AdaptationManger, Smart Objects Manager, and Internet Connectivity Manager). Thesecomponents require the utilisation of the smartphone’s memory in order to carry
250
8.4. Discussion
out their business logic. As an example, the Environment Driven AdaptationManager needs to assess what current day of the week it is, what the weatherforecast for that day is and if it needs to change the currently recommendeddaily activity. Having said so, the difference of the amounts of used memory isnegligible when put into the context of the total amount of memory that thesedevices have. The difference between the averages for the LG smartphone is2645.9 kB (over a total of 2 GB available) and for the Samsung smartphone is7529.3 kB (over a total of 4 GB available). This difference, whilst shown to bestatistically significant, has no practical implication over the user experience ofthe apps. We can therefore conclude that the ’price’ paid in terms of memoryconsumption for the benefits of adding dynamic tailoring is worthwhile.
Our results also show a difference in the CPU usage levels between thetwo examined apps on the Samsung smartphone. However, RELATE seemsto be the one consuming the least amount of CPU. If we take the differencebetween RELATE CPU usage average and the one of the BaseApp we geta difference of -1.288 (the CPU measurement is quantified as a percentageof the total amount of CPU). Whilst our analysis has shown this differenceto be statistically significant, we argue that such a small difference in CPUusage would have no impact on the user experience. In conclusion, whilst ourresults have found some statistically significant differences in appperformance, these differences are too small to realistically impactthe user experience of an Android app.
Regarding RQ2.2, namely: “What is the impact of personalisation andself-adaptation techniques on the energy consumption of e-Health mobile apps?”.Only for the Samsung smartphone we found a statistically significant differencein energy consumption between the two apps. This difference is, however,not expected as it shows RELATE to be consuming less energy than theBaseApp. Upon closer inspection, we notice that the difference in averageenergy consumption between the BaseApp and RELATE is equal to 3.6 J. Justlike with the differences found for the memory and the CPU, this discovereddifference is so small that it will not impact the user experience in a practicalsense. In conclusion, our experiments provide evidence that the im-
251
Chapter 8. Empirical Evaluation
pact of personalisation and self-adaptation techniques on the energyconsumption of e-Health mobile apps is negligible.
Overall, our findings for RQ2.1 and RQ2.2 show that using personalisationand self-adaptation techniques in e-Health mobile apps has no adverse effecton both performance an energy consumption. This should encourage appdevelopers and researchers working in this field to adopt these techniques intheir own e-Health apps as they provide a great range of extra functionalitieswith little to no impact on the resources of the user’s smartphone.
8.5 Threats to Validity
8.5.1 External Validity
– Experiment 1 (User study). There is a threat to generalisability as the sampleof participants for our experiment was limited. Because of this, the presentedresults are not meant to be final but rather as an exploration of these topics.Further work with a larger sample of participants would be needed to drawmore conclusive results.– Experiment 2 (Measurement-Base Experiment). To minimise the threat toexternal validity we ran our experiment on two different types of smartphone.The smartphones chosen are intended to be a representation of a low-end anda middle-end device. This diversification of devices should better capture thereal world scenario. Having said so, the use of a newer smartphone couldpossibly lead to different results and conclusions. We therefore encouragefurther experiments to further minimise this threat to validity.
8.5.2 Internal Validity
– Experiment 1 (User study). To mitigate the threat to internal validity weimplemented the two applications to be as close as possible, leaving dynamictailoring as the sole difference. Furthermore, the participants for both groupsR and B were recruited in the same manner and are all of a comparabledemographic (therefore mitigating possible selection bias).
252
8.5. Threats to Validity
– Experiment 2 (Measurement-Base Experiment). There are a number of factorsthat can influence the measurements we have collected in our experimentsi.e., brightness of the screen, distance to the internet router, distance to theBluetooth smartwatch and background processes. We designed our experimentsso to minimise as much as possible these factors. We maintained the brightnessof the screen, the distance to the internet router and the distance to theBluetooth smartwatch fixed across all repetitions. To mitigate the impactof uncontrollable background processes we performed 50 repetitions for eachexperiment case, mitigating the bias that one spike in background processescan have over our overall readings. Lastly, maturation can influence the datacollected in the experiments. In our case maturation is the changes that occurin the smartphone as the experiment is running (e.g., memory usage, CPU heatgeneration and impact on its performance). In order to mitigate it, we imposeda waiting time of 2 minutes between each repetition. We also cleared any datathat was gathered during the course of a repetition, to maintain the status ofthe smartphone identical across experiments.
8.5.3 Construct Validity
– Experiment 1 (User study). To minimise the threat to construct validity, wedefined all of the details regarding our experiment design a priori (e.g., researchquestions, data analysis methodology, variables).
– Experiment 2 (Measurement-Base Experiment). Here we also defined everythingregarding our experiment design and methodology a priori.
8.5.4 Conclusion Validity
– Experiment 1 (User study). To mitigate the threat to conclusion validity, wehad all 5 researchers involved in the data analysis of the results obtained forthis experiment. This mitigates an individual bias and interpretation of theresults. Furthermore, we offer a complete replication package to the public.Allowing for independent replication of our experiment.
– Experiment 2 (Measurement-Base Experiment). To minimise the threat to
253
Chapter 8. Empirical Evaluation
conclusion validity we have used statistical analysis to more objectively draw ourconclusions on the experiment. Lastly, we offer a complete replication packageto the public. Allowing for independent replication of our experiment.
8.6 Related Work
The literature does not provide studies like ours about the empirical evaluationof self-adaptive (e-Health) mobile apps. However, we could identify severalworks close to our research area, namely self-adaptive mobile apps in eHealth.
Self-adaptation represents a suitable method to detect and deal with (poten-tially impactful) unexpected context changes. In the field of mobile apps, it iseven more challenging due to, i.e., mobile phones resource constraints (e.g., bat-tery level, network traffic). Grua et al. [148] give an overview of self-adaptabilityfor mobile apps by providing a classification framework for understanding, classi-fying, and comparing approaches. In the same field, Grassi and Mirandola [140]proposed a new perspective for looking at known approaches, to make mobileapps resilient and anti-fragile to changes. They suggest to look at distinct andcomplementary approaches (e.g., self-adaptation and cyber foraging [196]), oftenconsidered separately, from the Tao perspective (e.g., Yin and Yang strategies),to fully exploit their respective potential.
The need for runtime adaptation is exacerbated in the eHealth domainwhere adapting to the user-needs and context may be of crucial importance,i.e., to properly and promptly react to monitored patients activities. Ballesteroset al. [23] present a wearable patient-monitoring system for tele-rehabilitation,supporting traditional rehabilitation therapies by providing valuable informationfor the evaluation, monitoring, and treatment of patients. The system followsa goal-oriented self-adaptation approach based on dynamic software productlines (DSPL) and it makes use of a set of self-adaptation policies enabling itto dynamically self-configure its internal behaviour to the current context ofthe patient, while maintaining the system efficiency (e.g., optimising batteryconsumption). Differently than our RELATE app, the used adaptation policiesdo not influence the usability or end users’ perception, since end users do not
254
8.6. Related Work
directly interact with the system. They only make use of the system’s devicesand wearable (e.g., knee motion sensor), used to monitor and recognise theactivity the user is performing and to collect data to trigger re-configuration.
Mizouni et al. [240] focus on the design and development of self-adaptiveapplications that sense and react to contextual changes (e.g., environment,device status) to provide a value-added user experience. The authors presenta framework defining a systematic approach to model dynamic adaptation ofmobile apps behaviour at runtime by using SPL concepts and offering featurepriority based dynamic adaptability. The framework is evaluated throughan application supporting doctors on the move to have access to patients’files, report medical conditions, prepare for intervention and advise hospitalabout patient needs and arrival. A similar application targeting doctors onthe move is proposed by Preuveneers et al. [284]. In this study, the authorsfocus on how to deliver the right patient’s information at the right time undervariable connectivity and limited resource availability. Probabilistic modelsand dynamic decision networks are used to improve the user experience andon-device resource utilisation. Differently than [240], we have defined a referencearchitecture for personalised and self-adaptive e-health apps, by leaving a certaindegree of freedom to developers about design decisions and adaptation strategies.Moreover, in contrast to both [240] and [284], our RELATE app is not intendedfor healthcare professionals and caregivers, but for end-users. For this reason,usability and users’ perception concerns are quite relevant, since they mightimpact the constant and active commitment of end users.
Lopez et al. [211] make use of non-obtrusive monitoring technology intheir context-aware mobile app delivering self-adaptive persuasive messagesthat stimulate the medication adherence, by exploiting real-time physiologicaldata (e.g., heart rate). In our e-Health app, in contrast, runtime adaptationand personalisation are used to create the best possible conditions for usersto keep active in their activities, by considering their current context andpreferences (e.g., by suggesting their preferred indoor activities if it is raining),by guaranteeing a good level of usability.
Usability of e-Health mobile apps is also a matter of the user experience
255

Chapter 8. Empirical Evaluation
provided by the apps’ user interface. In this context, Raheel [290] proposes aset of adaptive mechanisms able to monitoring the user’s behaviour w.r.t. amobile phone (e.g., determining the distance between the user and the screen)and adapting the interface accordingly. For evaluation purposes, the authorpresents a medical adaptive mobile app aiming to help the elderly remembertaking their medicine at specific times. Experiments show the effectiveness ofadaptive user interface in improving usability and acceptance of the mobileapp. Improving usability is also one of the aim of our RELATE app. However,our RA brings other instruments in support of usability that go beyond theusability of the user interface (e.g., the goal model, user process adaptation,architectural adaptation) and, simultaneously, it aims to guarantee that thepersonalisation and self-adaptation techniques we use do not degrade the appusability.
All the above reviewed studies share with our work the exploitation ofself-adaptation techniques in eHealth mobile apps. Similarly to us, some ofthem especially focus on the usability of the apps, from the perspectives ofthe end users (e.g., [211; 290]) and the experts (e.g., [240; 284]). However,in the context of mobile apps, adaptation engines must satisfy the energyefficiency requirement. According to Cañete et al. [56], energy consumption alsodepends on the execution context (environment, devices status) and how theuser interacts with the application. Indeed, despite the hardware consumes theenergy, the software (e.g., adaptation mechanisms) is responsible for managinghardware resources and its functionality, thus affecting the energy consumption.This demands for energy-efficient adaptation. Although some of the reviewedwork (e.g., [23; 284]) aim to maintain the system efficiency, differently fromthem, our study investigates the impact of the used personalisation and self-adaptation techniques on the performance and energy consumption of an e-Health app. This is made through an empirical evaluation and by comparingtwo instances of our RELATE app, with and without personalisation and self-adaptation, respectively. Results clearly show that applications built on topof our RA, exploiting several MAPE loops and dynamic, personalised userprocesses, guarantee energy-efficient adaptation.
256
8.7. Conclusions
8.7 Conclusions
The goal of this chapter was to answer T.RQ5, namely: How do dynamicallyadaptive e-Health apps affect users and their mobile devices? We do so bybuilding upon the RA and test an implemented prototype app that complies toit. We call this prototype RELATE, standing for peRsonalized sELf-AdapTiveE-health. We designed and executed two experiments: a user study, to testuser concerns regarding usability and app perception, and a measurement-basedexperiment to test concerns related to performance and energy consumption.Both experiments focused on studying the impact of self-adaptation and person-alisation on their respective independent variables. To be able to isolate thesevariables, RELATE was tested again an identical app, lacking dynamic tailoring,which we named BaseApp. In our user study, our results show that end users’usability and perception is not harmed by the introduction of dynamic tailoringand is instead made better for the case of usability whilst for user perception wecouldn’t find any significant difference. In our measurement-based experiment,we concluded that for both performance and energy consumption the differencesmeasured were never at such a scale to cause real world usage consequences.
257

9Conclusion
The research presented in this thesis aimed at investigating how we can helpovercome the rigidity and partial tailoring currently seen in e-Health mobileapplications (e-Health apps). We proposed that AI-based personalisation andsoftware self-adaptation can be used together to achieve this research goal.We started by analysing the current state of the art in reinforcement learning(RL) for personalisation and classified the used techniques, their propertiesand their shortcomings. We identified two shortcomings relevant to e-Health:the need to obtain large amounts of data to reach an optimal policy and thepossibility of user disengagement during the exploration phase. We addressedthe first limitation by proposing that RL is used together with clustering. Tosolve the current lack of online clustering algorithms for e-Health data, wecreated and evaluated our own state of the art algorithm (i.e., CluStream-
259
Chapter 9. Conclusion
GT). To tackle the second limitation of RL, we investigated which machinelearning models are better suited in predicting user engagement. We thenexplored and categorised the current state of the art of software self-adaptationtechniques. After choosing to use the MAPE (Monitor-Analyze-Plan-Execute)loop technique we propose a reference architecture (RA) for personalised andself-adaptive e-Health apps. This RA utilises several self-adaptive components,in combination with the previously reported AI techniques, to provide state ofthe art dynamic adaptation. We lastly explore the social sustainability impactof our proposed RA, as well as empirically evaluating the effectiveness of anapp implemented following the guidance of our RA.
9.1 Discussion
In this section we are going to discuss and reflect on the work done throughoutthis thesis. We divide our discussion to reflect the contributions brought forth.
A rigorous map into the current state of the art use of RL forpersonalisation: We started by conducting a systematic literature review(SLR) of RL applications for personalisation used in different applicationsdomains. The goal of the SLR was to present an overview and categorisation ofthe state of the art in RL for personalisation, the settings, solution architecturesand evaluation strategies used. Overall, our results found an increase in the useof RL for personalisation over time. Furthermore, we found RL to be a suitableparadigm for personalisation of systems on an individual level, using collecteduser data. These findings are valid across domains, including e-Health. Ourfindings also shed a light on some of the existing short-comings in the use of RLfor personalisation. Relevant to this thesis, was the discovery that the majorityof RL models can be classified as one of two ways: 1) one RL model used on allof the users and their data (i.e., one-size-fits-all) or 2) using one model per user(i.e., on an individual level). The one-size-fits-all model is faster at finding asuitable policy, as it has more data to use, however it does it by trading the levelof personalisation that it can deliver to each user. This can be problematic ine-Health as a high level of individual personalisation is desired in order to better
260
9.1. Discussion
help the user achieve their health goals. The opposite method found (i.e., onemodel per user) could achieve a long term higher level of personalisation, whichis desired in e-Health. However, as the model is trained only on the informationof the individual user, it could then take too long to collect enough data toreach the desired policy: possibly disengaging the user before it can reach thedesired level of personalisation. To tackle this shortcoming, we propose to useclustering together with RL creating a cluster-based RL model.
Data-efficient and effective techniques for personalisation: We de-signed a study to compare various clustering algorithms and distance metricsfor the use of cluster-based RL for personalisation in e-Health. The goal ofthis study was to find which combination resulted in the most effective andefficient way of performing cluster-based RL. We then compared the best foundcombinations with the one-size-fits-all method and the per individual RL model.We compared these techniques on data created with the use of a simulationenvironment, generating data imitating the daily schedule of an individual.The goal of the RL personalisation was to send interventions at the correctmoment in the schedule of the individuals, so that they would accept and per-form them. The results of our study found that derived features as a distancemetric normally gave us the best results, with some times the use of dynamictime warping performing equally if not better. This result was consisted, nomatter the clustering algorithm that was used. Furthermore, in our study wedemonstrate how the best found cluster-based RL methods can outperform thelevel of personalisation offered by the current state of the art. This result isachieved by also tackling the user disengagement that could occur with the useof a RL model per individual as we are able to reach an optimal personalisationpolicy faster. More testing would be needed to understand if, over longer periodsof time, cluster-based RL would still perform better. It is possible, as timeprogresses, that using on RL model per individual could surpass the level ofpersonalisation offered by cluster-based RL. If that were to be the case, it wouldbe interesting to explore the use of cluster-based RL as a first step to a laterswitch to one RL model per individual.
To expand on our cluster-based RL findings, we decided to address the
261
Chapter 9. Conclusion
discovered lack of clustering algorithms tailored for e-Health. We did so bycreating an online clustering algorithm capable of clustering growing timeseriesand so suited for the e-Health domain. The algorithm was created by modifyingthe already existing data stream clustering algorithm CluStream and so namedours CluStream-GT (CluStream for Growing T imeseries). We empirically eval-uated CluStream-GT against other state of the art online clustering algorithms,by using them on both artificially generated and real-life datasets. Our resultsfound CluStream-GT capable of addressing the shortcomings of the currentstate of the art, but also able to cluster data more efficiently whilst remainingcomparatively effective. With the creation of CluStream-GT, we now have abetter suited clustering method for the domain of e-Health and one that couldhelp further improve cluster-based RL for personalisation in e-Health. In orderto further validate our findings it will be important to expand our testing onother datasets and analyse what any potential differences in performance mayarise. Furthermore, whilst we have evidence that CluStream-GT will be a goodfit in combination with RL for personalisation in e-Health, empirical experimentsare needed in order to validate this claim. These types of experiments wouldalso allow us to test how well CluStream-GT aided cluster-based RL performscompared to other state of the art methods (e.g., deep reinforcement learning)
Machine Learning models to predict user engagement in mobileapps: To combat the potential user disengagement that can occur when usingRL based personalisation, we studied how to predict user engagement. Weexplored if and which machine learning techniques are most effective at predictinguser engagement, as we can use user engagement as a method to understandif the given personalisation is liked by the user. The understanding is that,with better liked personalisation the user will remain engaged with the app. Ifthe personalisation is not performing as intended, the user will consequentlydisengage from the app. In our investigation we used collected data from a realworld app. We tested and evaluated four different machine learning approacheswhom were all aided by the use of clustering. Our results showed that therandom forest and boosted-tree algorithms were the best in predicting userengagement. We also observed that we achieve a desirable level of accuracy
262
9.1. Discussion
utilising usage dynamics and features that can be obtained by apps from variousdomains. A significant feature for the models, was location. We are thereforeconfident that our findings could apply also to apps from domains where locationplays an important role, such as e-Health (e.g., fitness). This however, willhave to be tested as feature importance may shift according to the domain.Furthermore, the best performing models in our tested setting might not remainsuch in other domains.
A rigorous map into the current state of the art use of self-adaptation for mobile apps: As the goal of this thesis is to investigatethe use of AI for personalisation and software self-adaptation, we conducted aSLR on self-adaptation in the context of mobile applications. The purpose ofthis SLR was to identify the state of the art techniques used for self-adaptationin apps. We did so by creating a classification framework that allowed us tocategorise the state of the art algorithms and methods found. From this SLR weidentified a few important shortcoming in the current state of the art. We foundfew approaches of self-adaptation that, as a goal, targeted non-technical goals(e.g., promoting user behavioural change and lifestyle improvements). This typeof adaptation would be crucial to develop for e-Health apps, as their main goalis the betterment of the users’ health and well being. We also identified a lackof adaptation techniques adapting because of changes occurring in third-partyapps and smart-objects surrounding the user. Being able to trigger adaptationfrom changes coming from these devices would be an important step in furtheradapting to the users’ context, as these devices are part of, and capture, thecurrent state of the users’ context. Lastly, we found a lack of empirical testingdone within the field of self-adaptation for apps.
An RA for personalised self-adaptive e-Health apps: In order toovercome the identified shortcomings in the the state of the art self-adaptation forapps and combine these solutions with the personalisation techniques developed,we propose a Reference Architecture (RA). The goal of this RA is to combine AIpersonalisation and self-adaptation under one architecture that can be used toguide the development of dynamically adapting e-Health apps. Within our RAwe achieve self-adaptation on three levels: adapting to connected smart object
263
Chapter 9. Conclusion
and third-party applications, adapting to the users and their environments,and adapting to the output of the AI achieved personalisation. With thiswork we show how the combination of self-adaptation and personalisation canbe beneficial to users in the e-Health domain and how it can address socialsustainability. By providing smarter and more well-rounded tailoring, e-Healthapps can help users achieve better mental and physical health. We are thereforeincreasing the support offered to the community of people whom suffer fromphysical and mental illness.
In order to empirically evaluate some of the benefits that our RA couldachieve, we implemented and then tested a prototype app using the RA as aguide for the implementation. For the evaluation we designed and performedtwo experiments: a user study and a measurement-based experiment. In bothexperiments, our prototype app (which we refer to as RELATE), was comparedto an almost identical app (called BaseApp) lacking of adaptation techniques.For the user study we recruited human participants which we randomly assignedinto one of two groups. Group R used RELATE, the app with adaptationtechniques, and group B used the BaseApp. We asked the participants tocompleted a number of questionnaires, over the course of a month of use. As aresult of our study we found no difference in the rated end users’ perceptionbetween the two groups and also recorded a better end users’ usability forRELATE. In our second experiment, the measurement-based one, we concludedthat the differences in performance impact (i.e., CPU and memory consumption)and energy consumption between the two apps were so small that the userwouldn’t be able to perceive a difference. Whilst further work is needed tovalidate our results on other aspects affected by the use of RELATE, our resultsencourage the use of AI-base personalisation with self-adaptation in e-Healthapps.
9.2 Thesis Research Questions Answered
The goal of this thesis is to understand how AI-based personalisation and self-adaptation can be used together for designing and developing e-Health mobile
264
9.2. Thesis Research Questions Answered
apps. To achieve this goal we defined a number of research questions. In thissection we answer each one of them.
T.RQ1 How can RL-based personalisation for e-Health be improved?We propose the use of cluster-based RL to improve the efficiency andefficacy of current state of the art RL. We compare a number of clusteringalgorithms and distance metrics to find which variation of cluster-basedRL performed best. Our results find the use of derived features froma user’s timeseries data lead to the best RL policy, regardless of theclustering algorithm used. This finding also applied when comparing thiscluster-based RL approach to the current state of the art. Our resultstherefore show that the use of cluster-based RL can lead to improvementsto RL based personalisation for e-Health.
T.RQ2 How can online-clustering be used to efficiently and effectivelycluster e-Health data? We propose a novel online clustering algorithm(i.e., CluStream-GT) tailor made for e-Health data. We test CluStream-GT against the state of the art, by using both artificial and real lifee-Health timeseries datasets. Our results show that CluStream-GT cancluster up to 95% faster, whilst being comparably effective in the clustersgenerated. Furthermore, CluStream-GT can cope with specific difficultiesof clustering e-Health data, that no other state of the art algorithm cando.
T.RQ3 How can we predict user engagement in apps? We compare mul-tiple machine learning models aided by clustering. We show how, on ourcollected dataset, two of the models (i.e., random forest and boosted tree)can predict user engagement with good accuracy using usage dynamicsand features relate to apps (e.g., user location).
T.RQ4 How can AI-based personalisation and self-adaptation be usedto create e-Health apps that dynamically adapt to the user andtheir context? We propose a unique RA for personalised and self-adaptive e-Health apps. With this RA we show how AI-based personalisa-
265
Chapter 9. Conclusion
tion and self-adaptation can be used together to create e-Health apps thatare capable of adapting to the user and their context whilst personalisingto their needs and end goals. To achieve this, the RA is comprised ofseveral components that address the shortcomings identified in both thefields of AI-based personalisation as well as software self-adaptation, inthe context of e-Health.
T.RQ5 How do dynamically adaptive e-Health apps affect users andtheir mobile devices? We conduct two experiments to empirically testhow the use of dynamic adaptation on an e-Health app effects users andtheir mobile devices. For the first experiment we conduct a user study andanalyse the effects that dynamic adaptation has on end users’ usability andperception. For our second experiment we conduct a measurement-basedexperiment to empirically evaluate how dynamic adaptation impacts en-ergy consumption and performance. In both experiments, the dynamicallyadaptive e-Health app was compared to an identical non dynamicallyadaptive e-Health app. Our results show how the use of dynamic adap-tation on an e-Health app does not negatively impact it in terms of endusers’ perception, energy consumption and performance. Furthermore, wefind that dynamic adaptation can improve end users’ usability.
9.3 Future Work
Whilst we found promising results in the combination of AI-based personalisationand self-adaptation in tackling the current shortcomings of e-Health apps, webelieve there is still room for improvement and future testing. We hereby listsome points for future work:
1. Test the identified machine learning models for user engage-ment on datasets from other app domains, including e-Healthapps. In this work we concluded that our findings will likely remain validacross domains were user location plays an important role. For futurework, it will be important to test our conclusions and better understand
266
9.3. Future Work
how our models perform to these types of domains, especially e-Health.
2. Expand our testing done on cluster-based RL by including realworld e-Health datasets. In our original experiments we tested cluster-based RL with the use of data generated from a simulation environment.For future work, it is important to expand our testing by using real worlde-Health datasets to better understand how cluster-based RL will performin a real world scenario when compared to other state of the art RLmodels.
3. Investigate how our proposed RA can be expanded to other e-Health sub-domains. Our proposed RA is currently designed for thee-Health sub-domains of fitness and mental health. We have, however,designed the most critical components of the RA (such as the Goal Model)to be easily expanded to other e-Health sub-domains. For future work, it isimportant to test our design and how our RA can guide the implementationof dynamically adaptive apps across the whole domain of e-Health.
4. Replicate our empirical experiments with a dynamically adap-tive app that uses all of our RA’s components. In the future, itwill be important to replicate our empirical experiments on an app thatuses all of the components present in our RA. This will allow researchersand developers working in the field of e-Health apps to get a better un-derstanding of the advantages and potential drawbacks of using an RAsuch as the one we propose.
267

Bibliography
[1] (2018). Android connectivity. Available at https://developer.android.com/training/basics/network-ops/connecting.
[2] (2019). The industrial internet of things volume G1: reference architecture.Industrial Internet Consortium.
[3] Abe, N., N. Verma, C. Apte, and R. Schroko (2004). Cross channel optimizedmarketing by reinforcement learning. Proceedings of the 2004 ACM SIGKDDinternational conference on Knowledge discovery and data mining - KDD’04 .
[4] Abowd, G., A. Dey, P. Brown, N. Davies, M. Smith, and P. Steggles(1999). Towards a better understanding of context and context-awareness. InHandheld and ubiquitous computing, pp. 319. Springer.
[5] Aggarwal, C. C., J. Han, J. Wang, and P. S. Yu (2003). A framework forclustering evolving data streams. In Proceedings of the 29th internationalconference on Very large data bases-Volume 29, pp. 81–92. VLDB Endowment.
[6] Ahrndt, S., M. Lützenberger, and S. M. Prochnow (2016). Using person-ality models as prior knowledge to accelerate learning about stress-copingpreferences: (demonstration). In AAMAS.
[7] Almardini, M., A. Hajja, Z. W. Raś, L. Clover, D. Olaleye, Y. Park, J. Paul-son, and Y. Xiao (2015). Reduction of readmissions to hospitals based onactionable knowledge discovery and personalization. In Beyond Databases,
269
Bibliography
Architectures and Structures. Advanced Technologies for Data Mining andKnowledge Discovery, pp. 39–55. Springer.
[8] Anderlucci, L. (2012). Comparing different approaches for clustering cate-gorical data. Ph. D. thesis, University of Bologna.
[9] Andersson, J., R. De Lemos, S. Malek, and D. Weyns (2009). Modelingdimensions of self-adaptive software systems. In Software engineering forself-adaptive systems, pp. 27–47. Springer.
[10] Andrade, G., G. Ramalho, H. Santana, and V. Corruble (2005). Automaticcomputer game balancing. Proceedings of the fourth international jointconference on Autonomous agents and multiagent systems - AAMAS ’05 .
[11] Andreu-Perez, J., C. C. Poon, R. D. Merrifield, S. T. Wong, and G.-Z.Yang (2015). Big data for health. IEEE journal of biomedical and healthinformatics 19 (4), 1193–1208.
[12] Android (2017). Android developer portal.
[13] Andrzejak, R. G., K. Lehnertz, F. Mormann, C. Rieke, P. David, and C. E.Elger (2001). Indications of nonlinear deterministic and finite-dimensionalstructures in time series of brain electrical activity: Dependence on recordingregion and brain state. Physical Review E 64 (6), 061907.
[14] Angelov, S., P. Grefen, and D. Greefhorst (2012). A framework for analysisand design of software reference architectures. Information and SoftwareTechnology 54 (4).
[15] Asimakopoulos, S., G. Asimakopoulos, and F. Spillers (2017). Motivationand user engagement in fitness tracking: Heuristics for mobile healthcare wear-ables. In Informatics, Volume 4, pp. 5. Multidisciplinary Digital PublishingInstitute.
[16] Aspinall, M. G. and R. G. Hamermesh (2007). Realizing the promise ofpersonalized medicine. Harvard business review 85 (10), 108.
270
Bibliography
[17] Atrash, A. and J. Pineau (2008). A bayesian reinforcement learningapproach for customizing human-robot interfaces. Proceedingsc of the 13thinternational conference on Intelligent user interfaces - IUI ’09 .
[18] Attfield, S., G. Kazai, M. Lalmas, and B. Piwowarski (2011). owards ascience of user engagement (position paper). In WSDM Workshop on UserModelling for Web Applications.
[19] Auer, P., N. Cesa-Bianchi, and P. Fischer (2002). Finite-time analysis ofthe multiarmed bandit problem. Machine learning 47 (2-3), 235–256.
[20] Ávila-Sansores, S., F. Orihuela-Espina, and L. Enrique-Sucar (2013). Pa-tient tailored virtual rehabilitation. In Converging Clinical and EngineeringResearch on Neurorehabilitation, pp. 879–883. Springer.
[21] Awad, N. F. and M. S. Krishnan (2006). The personalization privacy para-dox: an empirical evaluation of information transparency and the willingnessto be profiled online for personalization. MIS quarterly , 13–28.
[22] Bagdure, N. and B. Ambudkar (2015). Reducing delay during verticalhandover. 2015 International Conference on Computing CommunicationControl and Automation.
[23] Ballesteros, J., I. Ayala, J. R. Caro-Romero, M. Amor, and L. Fuentes(2020). Evolving dynamic self-adaptation policies of mhealth systems forlong-term monitoring. Journal of Biomedical Informatics 108, 103494.
[24] Baniya, A., S. Herrmann, Q. Qiao, and H. Lu (2017). Adaptive inter-ventions treatment modelling and regimen optimization using sequentialmultiple assignment randomized trials (smart) and q-learning. In IIE AnnualConference. Proceedings, pp. 1187–1192. Institute of Industrial and SystemsEngineers (IISE).
[25] Baresi, L., W. G. Griswold, G. A. Lewis, M. Autili, I. Malavolta, andC. Julien (2020). Trends and challenges for software engineering in the mobiledomain. IEEE Software 38 (1), 88–96.
271
Bibliography
[26] Barto, A., P. Thomas, and R. Sutton (2017). Some recent applications ofreinforcement learning.
[27] Basili, V. R., G. Caldiera, and H. D. Rombach (1994). The goal questionmetric approach. In Encyclopedia of Software Engineering. Wiley.
[28] Bassi, A., M. Bauer, M. Fiedler, T. Kramp, R. van Kranenburg, S. Lange,and S. Meissner (2016). Enabling Things to Talk: Designing IoT Solutionswith the IoT Architectural Reference Model (1st ed.). Springer PublishingCompany.
[29] Bates, D. W., S. Saria, L. Ohno-Machado, A. Shah, and G. Escobar (2014).Big data in health care: using analytics to identify and manage high-risk andhigh-cost patients. Health Affairs 33 (7), 1123–1131.
[30] Bauer, M. and et. al (2013). IoT Reference Architecture. In EnablingThings to Talk: Designing IoT solutions with the IoT Architectural ReferenceModel.
[31] Bazzan, A. L. C. (2017). Synergies between evolutionary computationand multiagent reinforcement learning. Proceedings of the Genetic andEvolutionary Computation Conference Companion on - GECCO ’17 .
[32] Bellemare, M. G., Y. Naddaf, J. Veness, and M. Bowling (2013). Thearcade learning environment: An evaluation platform for general agents.Journal of Artificial Intelligence Research 47, 253–279.
[33] Bellera, C. A., G. MacGrogan, M. Debled, C. T. de Lara, V. Brouste, andS. Mathoulin-Pélissier (2010). Variables with time-varying effects and theCox model: Some statistical concepts illustrated with a prognostic factorstudy in breast cancer. BMC Medical Research Methodology 10 (1), 1–12.
[34] Bellman, R. E. (2015). Adaptive control processes: a guided tour, Volume2045. Princeton university press.
272
Bibliography
[35] Berndt, D. J. and J. Clifford (1994). Using dynamic time warping to findpatterns in time series. In KDD workshop, Volume 10, pp. 359–370. Seattle,WA.
[36] Bi, H., O. J. Akinwande, and E. Gelenbe (2015). Emergency navigation inconfined spaces using dynamic grouping. 2015 9th International Conferenceon Next Generation Mobile Applications, Services and Technologies.
[37] Biegel, G. and V. Cahill (2004). A framework for developing mobile,context-aware applications. In Pervasive Computing and Communications,2004. PerCom 2004. Proceedings of the Second IEEE Annual Conference on,pp. 361–365. IEEE.
[38] Block, R. (2007). Live from Macworld 2007: Steve Jobskeynote. Available at https://www.engadget.com/2007/01/09/live-from-macworld-2007-steve-jobs-keynote/.
[39] Bodas, A., B. Upadhyay, C. Nadiger, and S. Abdelhak (2018). Reinforce-ment learning for game personalization on edge devices. 2018 InternationalConference on Information and Computer Technologies (ICICT).
[40] Bonino, D., M. T. D. Alizo, C. Pastrone, and M. Spirito (2016). Wasteapp:Smarter waste recycling for smart citizens. In 2016 International Multidis-ciplinary Conference on Computer and Energy Science (SpliTech), pp. 1–6.IEEE.
[41] Bouneffouf, D., A. Bouzeghoub, and A. L. Gançarski (2012). Hybrid-ε-greedy for mobile context-aware recommender system. Lecture Notes inComputer Science, 468–479.
[42] Bragg, J., Mausam, and D. S. Weld (2016). Optimal testing for crowdworkers. In AAMAS.
[43] Breiman, L. (2001). Random forests. Machine Learning 45 (1), 5–32.
273
Bibliography
[44] Brockman, G., V. Cheung, L. Pettersson, J. Schneider, J. Schul-man, J. Tang, and W. Zaremba (2016). Openai gym. arXiv preprintarXiv:1606.01540 .
[45] Brooke, J. (1996). Sus: a “quick and dirty’usability. Usability evaluationin industry 189.
[46] Brusilovski, P., A. Kobsa, and W. Nejdl (2007). The adaptive web: methodsand strategies of web personalization, Volume 4321. Springer Science &Business Media.
[47] Bucchiarone, A., A. Lluch-Lafuente, A. Marconi, and M. Pistore (2009). Aformalisation of adaptable pervasive flows. In WS-FM, pp. 61–75.
[48] Budgen, D. and P. Brereton (2006). Performing systematic literaturereviews in software engineering. In Proceedings of the 28th internationalconference on Software engineering, pp. 1051–1052. ACM.
[49] Buduru, A. B. and S. S. Yau (2015). An effective approach to continuoususer authentication for touch screen smart devices. 2015 IEEE InternationalConference on Software Quality, Reliability and Security .
[50] Buehlmann, P. (2006). Boosting for high-dimensional linear models. TheAnnals of Statistics 2 (34), 559–583.
[51] Buehlmann, P. and T. Hothorn (2007). Boosting algorithms: regularization,prediction and model fitting. Statistical Science 4 (22), 477–505.
[52] Buehlmann, P. and B. Yu (2003). Boosting with the l2 loss: regressionand classification. Journal of the American Statistical Association 1 (98),324–339.
[53] Cafazzo, J. A., M. Casselman, N. Hamming, D. K. Katzman, and M. R.Palmert (2012, may). Design of an mHealth app for the self-management ofadolescent type 1 diabetes: A pilot study. J Med Internet Res 14 (3), e70.
[54] Caldiera, G., V. R. Basili, and H. D. Rombach (1994). Goal questionmetric paradigm. Encyclopedia of software engineering 1, 528–532.
274
Bibliography
[55] Calinescu, R., D. Weyns, S. Gerasimou, M. U. Iftikhar, I. Habli, andT. Kelly (2018). Engineering trustworthy self-adaptive software with dynamicassurance cases. IEEE Trans. Software Eng. 44 (11), 1039–1069.
[56] Cañete, A., J.-M. Horcas, I. Ayala, and L. Fuentes (2020). Energy effi-cient adaptation engines for android applications. Information and SoftwareTechnology 118, 106220.
[57] Cao, F., M. Estert, W. Qian, and A. Zhou (2006). Density-based clusteringover an evolving data stream with noise. In Proceedings of the 2006 SIAMinternational conference on data mining, pp. 328–339. SIAM.
[58] Casanueva, I., T. Hain, H. Christensen, R. Marxer, and P. Green (2015).Knowledge transfer between speakers for personalised dialogue management.In Proceedings of the 16th Annual Meeting of the Special Interest Group onDiscourse and Dialogue, pp. 12–21.
[59] Casquina, J. C., J. D. S. Eleuterio, and C. M. Rubira (2016). Adaptivedeployment infrastructure for android applications. In Dependable ComputingConference (EDCC), 2016 12th European, pp. 218–228. IEEE.
[60] Castro-Gonzalez, A., F. Amirabdollahian, D. Polani, M. Malfaz, and M. A.Salichs (2011). Robot self-preservation and adaptation to user preferencesin game play, a preliminary study. 2011 IEEE International Conference onRobotics and Biomimetics.
[61] Cella, L. (2017). Modelling user behaviors with evolving users and catalogsof evolving items. Adjunct Publication of the 25th Conference on UserModeling, Adaptation and Personalization - UMAP ’17 .
[62] Chakraborty, B. and S. A. Murphy (2014). Dynamic treatment regimes.Annual Review of Statistics and Its Application 1 (1), 447–464.
[63] Chan, J. and G. Nejat (2011). A learning-based control architecture for anassistive robot providing social engagement during cognitively stimulatingactivities. 2011 IEEE International Conference on Robotics and Automation.
275

Bibliography
[64] Chatzis, S. P., V. Siakoulis, A. Petropoulos, E. Stavroulakis, and N. Vla-chogiannakis (2018). Forecasting stock market crisis events using deep andstatistical machine learning techniques. Expert Systems with Applications 112,353 – 371.
[65] Chellappa, R. K. and R. G. Sin (2005). Personalization versus privacy:An empirical examination of the online consumer’s dilemma. Informationtechnology and management 6 (2-3), 181–202.
[66] Chen, J. and Z. Yang (2003). A learning multi-agent system for personal-ized information fiftering. Fourth International Conference on Information,Communications and Signal Processing, 2003 and the Fourth Pacific RimConference on Multimedia. Proceedings of the 2003 Joint .
[67] Chen, T. and C. Guestrin (2016). Xgboost: A scalable tree boosting system.In Proceedings of the 22nd acm sigkdd international conference on knowledgediscovery and data mining, pp. 785–794. ACM.
[68] Chen, T. and T. He (2015). Higgs boson discovery with boosted trees.In NIPS 2014 Workshop on High-energy Physics and Machine Learning, pp.69–80.
[69] Chen, X., Y. Zhai, C. Lu, J. Gong, and G. Wang (2017). A learning modelfor personalized adaptive cruise control. 2017 IEEE Intelligent VehiclesSymposium (IV).
[70] Chen, Y. and L. Tu (2007). Density-based clustering for real-time streamdata. In Proceedings of the 13th ACM SIGKDD international conference onKnowledge discovery and data mining, pp. 133–142. ACM.
[71] Cheng, B. H. C., R. d. Lemos, H. Giese, P. Inverardi, and J. Magee (Eds.)(2009). Software Engineering for Self-Adaptive Systems. Lecture Notes inComputer Science.
[72] Cheng, Z., Q. Zhao, F. Wang, Y. Jiang, L. Xia, and J. Ding (2016).Satisfaction based q-learning for integrated lighting and blind control. Energyand Buildings 127, 43–55.
276
Bibliography
[73] Chi, C.-Y., R. T.-H. Tsai, J.-Y. Lai, and J. Y.-j. Hsu (2010). A rein-forcement learning approach to emotion-based automatic playlist generation.2010 International Conference on Technologies and Applications of ArtificialIntelligence.
[74] Chi, M., K. VanLehn, D. Litman, and P. Jordan (2010). Inducing effectivepedagogical strategies using learning context features. Lecture Notes inComputer Science, 147–158.
[75] Chiang, Y.-S., T.-S. Chu, C. D. Lim, T.-Y. Wu, S.-H. Tseng, and L.-C. Fu(2014). Personalizing robot behavior for interruption in social human-robotinteraction. 2014 IEEE International Workshop on Advanced Robotics andits Social Impacts.
[76] Cho, Y. H., J. K. Kim, and S. H. Kim (2002). A personalized recommendersystem based on web usage mining and decision tree induction. Expert systemswith Applications 23 (3), 329–342.
[77] Chu, W., L. Li, L. Reyzin, and R. Schapire (2011). Contextual banditswith linear payoff functions. In Proceedings of the Fourteenth InternationalConference on Artificial Intelligence and Statistics, pp. 208–214.
[78] Claeys, M., S. Latre, J. Famaey, and F. De Turck (2014). Design andevaluation of a self-learning http adaptive video streaming client. IEEECommunications Letters 18 (4), 716–719.
[79] Cliff, N. (1993). Dominance statistics: Ordinal analyses to answer ordinalquestions. Psychological bulletin 114 (3), 494.
[80] Cooray, D., E. Kouroshfar, S. Malek, and R. Roshandel (2013). Proactiveself-adaptation for improving the reliability of mission-critical, embedded,and mobile software. IEEE Transactions on Software Engineering 39 (12),1714–1735.
[81] Cortellese, F., M. Nalin, A. Morandi, A. Sanna, and F. Grasso (2009).Personality diagnosis for personalized ehealth services. In InternationalConference on Electronic Healthcare, pp. 157–164. Springer.
277
Bibliography
[82] Cox, D. R. (1972). Regression models and life-tables. Journal of the RoyalStatistical Society. Series B (Methodological) 34 (2), 187–220.
[83] Cox, D. R. and D. Oakes (1984). Analysis of survival data (1st ed.).Chapman and Hall.
[84] Cugola, G., C. Ghezzi, L. S. Pinto, and G. Tamburrelli (2012). Adaptiveservice-oriented mobile applications: A declarative approach. In InternationalConference on Service-Oriented Computing, pp. 607–614. Springer.
[85] Da Silveira, G., D. Borenstein, and F. S. Fogliatto (2001). Mass customiza-tion: Literature review and research directions. International journal ofproduction economics 72 (1), 1–13.
[86] Dal Lago, U., M. Pistore, and P. Traverso (2002). Planning with a languagefor extended goals. In Proceedings of the Eighteenth National Conference onArtificial Intelligence and Fourteenth Conference on Innovative Applicationsof Artificial Intelligence, pp. 447–454.
[87] Daltayanni, M., C. Wang, and R. Akella (2012). A fast interactive searchsystem for healthcare services. 2012 Annual SRII Global Conference.
[88] Daskalaki, E., P. Diem, and S. G. Mougiakakou (2013a). An actor–criticbased controller for glucose regulation in type 1 diabetes. Computer Methodsand Programs in Biomedicine 109 (2), 116–125.
[89] Daskalaki, E., P. Diem, and S. G. Mougiakakou (2013b). Personalizedtuning of a reinforcement learning control algorithm for glucose regulation.2013 35th Annual International Conference of the IEEE Engineering inMedicine and Biology Society (EMBC).
[90] Daskalaki, E., P. Diem, and S. G. Mougiakakou (2016). Model-free ma-chine learning in biomedicine: Feasibility study in type 1 diabetes. PLOSONE 11 (7), e0158722.
278
Bibliography
[91] Day, W. H. E. and H. Edelsbrunner (1984). Efficient algorithms foragglomerative hierarchical clustering methods. Journal of Classification 1 (1),7–24.
[92] de Morais Barroca Filho, I., G. S. A. Junior, and T. V. Batista (2019).Extending and instantiating a software reference architecture for iot-basedhealthcare applications. In Int. Conf. on Computational Science and ItsApplications, pp. 203–218.
[93] De Paula, M., G. G. Acosta, and E. C. Martínez (2015). On-line policylearning and adaptation for real-time personalization of an artificial pancreas.Expert Systems with Applications 42 (4), 2234–2255.
[94] De Paula, M., L. O. Ávila, and E. C. Martínez (2015). Controlling blood glu-cose variability under uncertainty using reinforcement learning and gaussianprocesses. Applied Soft Computing 35, 310–332.
[95] De Pessemier, T., S. Dooms, and L. Martens (2014). Context-aware recom-mendations through context and activity recognition in a mobile environment.Multimedia Tools and Applications 72 (3), 2925–2948.
[96] den Hengst, F., E. Grua, A. el Hassouni, and M. Hoogendoorn (2020,January). Release of the systematic literature review into ReinforcementLearning for personalization.
[97] den Hengst, F., M. Hoogendoorn, F. van Harmelen, and J. Bosman(2019). Reinforcement learning for personalized dialogue management. InIEEE/WIC/ACM International Conference on Web Intelligence, pp. 59–67.
[98] Deng, K., J. Pineau, and S. Murphy (2011). Active learning for personalizingtreatment. 2011 IEEE Symposium on Adaptive Dynamic Programming andReinforcement Learning (ADPRL).
[99] Deshmukh, A. A., Ürün Dogan, and C. Scott (2017). Multi-task learningfor contextual bandits. In NIPS.
279
Bibliography
[100] Dey, S., Y. Kumar, S. Saha, and S. Basak (2016, 10). Forecasting toclassification: Predicting the direction of stock market price using xtremegradient boosting.
[101] Di Nucci, D., F. Palomba, A. Prota, A. Panichella, A. Zaidman, andA. De Lucia (2017). Software-based energy profiling of android apps: Simple,efficient and reliable? In 2017 IEEE 24th international conference on softwareanalysis, evolution and reengineering (SANER), pp. 103–114. IEEE.
[102] Domingos, P. (2012, oct). A few useful things to know about machinelearning. Communications of the ACM 55 (10), 78.
[103] Duan, Y., X. Chen, R. Houthooft, J. Schulman, and P. Abbeel (2016).Benchmarking deep reinforcement learning for continuous control. In Inter-national Conference on Machine Learning, pp. 1329–1338.
[104] Durand, A. and J. Pineau (2015). Adaptive treatment allocation usingsub-sampled gaussian processes. In 2015 AAAI Fall Symposium Series.
[105] El Fouki, M., N. Aknin, and K. E. El. Kadiri (2017). Intelligent adaptede-learning system based on deep reinforcement learning. Proceedings of the2nd International Conference on Computing and Wireless CommunicationSystems - ICCWCS’17 .
[106] El Hassouni, A., M. Hoogendoorn, A. E. Eiben, M. van Otterlo, andV. Muhonen (2019). End-to-end personalization of digital health interventionsusing raw sensor data with deep reinforcement learning: A comparative studyin digital health interventions for behavior change. In 2019 IEEE/WIC/ACMInternational Conference on Web Intelligence (WI), pp. 258–264. IEEE.
[107] el Hassouni, A., M. Hoogendoorn, M. van Otterlo, and E. Barbaro (2018a).Personalization of health interventions using cluster-based reinforcementlearning. In International Conference on Principles and Practice of Multi-Agent Systems, pp. 467–475. Springer.
280
Bibliography
[108] el Hassouni, A., M. Hoogendoorn, M. van Otterlo, and E. Barbaro (2018b).Personalization of health interventions using cluster-based reinforcementlearning. arXiv preprint arXiv:1804.03592 .
[109] Fan, H. and M. S. Poole (2006). What is personalization? perspectiveson the design and implementation of personalization in information systems.Journal of Organizational Computing and Electronic Commerce 16 (3-4),179–202.
[110] Fawcett, T. (2006, jun). An introduction to ROC analysis. PatternRecognition Letters 27 (8), 861–874.
[111] Feljan, A. V., S. K. Mohalik, M. B. Jayaraman, and R. Badrinath (2015).SOA-PE: A service-oriented architecture for planning and execution in cyber-physical systems. In 2015 International Conference on Smart Sensors andSystems (IC-SSS), pp. 1–6.
[112] Feng, J., H. Li, M. Huang, S. Liu, W. Ou, Z. Wang, and X. Zhu (2018).Learning to collaborate. Proceedings of the 2018 World Wide Web Conferenceon World Wide Web - WWW ’18 .
[113] Fernandez-Gauna, B. and M. Grana (2014). Recipe tuning by reinforce-ment learning in the sands ecosystem. 2014 6th International Conference onComputational Aspects of Social Networks.
[114] Ferretti, S., S. Mirri, C. Prandi, and P. Salomoni (2014a). Exploitingreinforcement learning to profile users and personalize web pages. 2014IEEE 38th International Computer Software and Applications ConferenceWorkshops.
[115] Ferretti, S., S. Mirri, C. Prandi, and P. Salomoni (2014b). User centeredand context dependent personalization through experiential transcoding. 2014IEEE 11th Consumer Communications and Networking Conference (CCNC).
[116] Ferretti, S., S. Mirri, C. Prandi, and P. Salomoni (2016a). Automatic webcontent personalization through reinforcement learning. Journal of Systemsand Software 121, 157–169.
281
Bibliography
[117] Ferretti, S., S. Mirri, C. Prandi, and P. Salomoni (2016b). On personal-izing web content through reinforcement learning. Universal Access in theInformation Society 16 (2), 395–410.
[118] Ferretti, S., S. Mirri, C. Prandi, and P. Salomoni (2017). On personal-izing web content through reinforcement learning. Universal Access in theInformation Society 16 (2), 395–410.
[119] Fling, B. (2009). Mobile design and development: Practical concepts andtechniques for creating mobile sites and Web apps. O’Reilly Media, Inc.
[120] Flores, H. and S. Srirama (2013). Adaptive code offloading for mobilecloud applications: Exploiting fuzzy sets and evidence-based learning. InProceeding of the fourth ACM workshop on Mobile cloud computing andservices, pp. 9–16. ACM.
[121] Fournier, L. (1994). Learning capabilities for improving automatic trans-mission control. Proceedings of the Intelligent Vehicles ’94 Symposium.
[122] Fremantle, P. (2015). A Reference Architecture for the Internet of Things.WSO2 White paper.
[123] Gao, A. Y., W. Barendregt, and G. Castellano (2017). Personalised human-robot co-adaptation in instructional settings using reinforcement learning. InIVA Workshop on Persuasive Embodied Agents for Behavior Change: PEACH2017, August 27, Stockholm, Sweden.
[124] Garcıa, J. and F. Fernández (2015). A comprehensive survey on safereinforcement learning. Journal of Machine Learning Research 16 (1), 1437–1480.
[125] Garivier, A. and E. Moulines (2011). On upper-confidence bound policiesfor switching bandit problems. In International Conference on AlgorithmicLearning Theory, pp. 174–188. Springer.
[126] Gaweda, A., M. Muezzinoglu, G. Aronoff, A. Jacobs, J. Zurada, andM. Brier (2005a). Incorporating prior knowledge into q-learning for drug
282
Bibliography
delivery individualization. Fourth International Conference on MachineLearning and Applications (ICMLA’05).
[127] Gaweda, A. E. (2009). Improving management of anemia in end stage renaldisease using reinforcement learning. 2009 International Joint Conference onNeural Networks.
[128] Gaweda, A. E., M. K. Muezzinoglu, G. R. Aronoff, A. A. Jacobs, J. M.Zurada, and M. E. Brier (2005b). Individualization of pharmacological anemiamanagement using reinforcement learning. Neural Networks 18 (5), 826–834.
[129] Gentile, C., S. Li, and G. Zappella (2014). Online clustering of bandits.In International Conference on Machine Learning, pp. 757–765.
[130] Ghahfarokhi, B. S. and N. Movahhedinia (2013). A personalized qoe-aware handover decision based on distributed reinforcement learning. WirelessNetworks 19 (8), 1807–1828.
[131] Gil, M., V. Pelechano, J. Fons, and M. Albert (2016). Designing thehuman in the loop of self-adaptive systems. In International Conference onUbiquitous Computing and Ambient Intelligence, pp. 437–449. Springer.
[132] Ginsburg, G. S. and J. J. McCarthy (2001). Personalized medicine: revolu-tionizing drug discovery and patient care. TRENDS in Biotechnology 19 (12),491–496.
[133] Glavinic, V., S. Ljubic, and M. Kukec (2008). Transformable menucomponent for mobile device applications: Working with both adaptiveand adaptable user interfaces. International Journal of Interactive MobileTechnologies (iJIM) 2 (3), 22–27.
[134] Global Industry Analysts, I. (2019). mhealth (mobile health) services -market analysis, trends, and forecasts.
[135] Glowacka, D., T. Ruotsalo, K. Konuyshkova, k. Athukorala, S. Kaski, andG. Jacucci (2013). Directing exploratory search. Proceedings of the 2013international conference on Intelligent user interfaces - IUI ’13 .
283
Bibliography
[136] Goldberg, Y. and M. R. Kosorok (2012). Q-learning with censored data.The Annals of Statistics 40 (1), 529–560.
[137] Gordon, G., S. Spaulding, J. K. Westlund, J. J. Lee, L. Plummer, M. Mar-tinez, M. Das, and C. Breazeal (2016). Affective personalization of a socialrobot tutor for children’s second language skills. In Thirtieth AAAI Confer-ence on Artificial Intelligence.
[138] Goutte, C. and E. Gaussier (2005). A probabilistic interpretation ofprecision, recall and f-score, with implication for evaluation. In D. E. Losadaand J. M. Fernández-Luna (Eds.), Advances in Information Retrieval, Berlin,Heidelberg, pp. 345–359. Springer Berlin Heidelberg.
[139] Gower, J. C. (1971, dec). A general coefficient of similarity and some ofits properties. Biometrics 27 (4), 857.
[140] Grassi, V. and R. Mirandola (2021). The tao way to anti-fragile soft-ware architectures: the case of mobile applications. In IEEE InternationalConference on Software Architecture Companion (ICSA-C). IEEE.
[141] Greenhalgh, T. and R. Peacock (2005). Effectiveness and efficiency ofsearch methods in systematic reviews of complex evidence: audit of primarysources. Bmj 331 (7524), 1064–1065.
[142] Grua, E., I. Malavolta, and P. Lago (2019a). Replication package of thestudy. Available at http://s2group.cs.vu.nl/seams-2019-replication-package/.
[143] Grua, E. M., M. De Sanctis, and P. Lago (2020). A reference architecturefor personalized and self-adaptive e-health apps. In Software Architecture:14th European Conference, ECSA 2020 Tracks and Workshops, L’Aquila,Italy, September 14–18, 2020, Proceedings, pp. 195–209. Springer.
[144] Grua, E. M., M. De Sanctis, I. Malavolta, M. Hoogendoorn, and P. Lago(2021). Social sustainability in the e-health domain via personalized andself-adaptive mobile apps. In C. Calero, M. Moraga, and M. Piattini (Eds.),Software Sustainability. Springer. To appear.
284
Bibliography
[145] Grua, E. M. and M. Hoogendoorn (2018). Exploring clustering techniquesfor effective reinforcement learning based personalization for health andwellbeing. In 2018 IEEE Symposium Series on Computational Intelligence(SSCI), pp. 813–820. IEEE.
[146] Grua, E. M., M. Hoogendoorn, I. Malavolta, P. Lago, and A. Eiben (2019).Clustream-GT: Online clustering for personalization in the health domain. InIEEE/WIC/ACM International Conference on Web Intelligence, pp. 270–275.ACM.
[147] Grua, E. M., I. Malavolta, and P. Lago (2019b). Self-adaptation in mobileapps: A systematic literature study. In IEEE/ACM 14th InternationalSymposium on Software Engineering for Adaptive and Self-Managing Systems(SEAMS), pp. 51–62.
[148] Grua, E. M., I. Malavolta, and P. Lago (2019). Self-adaptation in mobileapps: a systematic literature study. In 2019 IEEE/ACM 14th InternationalSymposium on Software Engineering for Adaptive and Self-Managing Systems(SEAMS), pp. 51–62.
[149] Harper, F. M., X. Li, Y. Chen, and J. A. Konstan (2005). An economicmodel of user rating in an online recommender system. Lecture notes incomputer science 3538, 307.
[150] Heagerty, P. J., T. Lumley, and M. S. Pepe (2000). Time-dependent roccurves for censored survival data and a diagnostic marker. Biometrics 56 (2),337–344.
[151] Hemminghaus, J. and S. Kopp (2018). Adaptive behavior generation forchild-robot interaction. Companion of the 2018 ACM/IEEE InternationalConference on Human-Robot Interaction - HRI ’18 .
[152] Henning, C. and T. Liao (2013). How to find an appropriate clusteringfor mixed-type variables with application to socio-economic stratification.Journal of the Royal Statistical Society 62 (3), 309–369.
285
Bibliography
[153] Herland, M., T. M. Khoshgoftaar, and R. Wald (2014). A review of datamining using big data in health informatics. Journal of Big data 1 (1), 1–35.
[154] Hester, T. and P. Stone (2012). Learning and using models. In M. Wieringand M. Van Otterlo (Eds.), Reinforcement learning, Volume 12, pp. "120".Springer.
[155] Hill, D. N., H. Nassif, Y. Liu, A. Iyer, and S. Vishwanathan (2017). Anefficient bandit algorithm for realtime multivariate optimization. Proceedingsof the 23rd ACM SIGKDD International Conference on Knowledge Discoveryand Data Mining - KDD ’17 .
[156] Hiraoka, T., G. Neubig, S. Sakti, T. Toda, and S. Nakamura (2016).Learning cooperative persuasive dialogue policies using framing. SpeechCommunication 84, 83–96.
[157] Hochberg, I., G. Feraru, M. Kozdoba, S. Mannor, M. Tennenholtz, andE. Yom-Tov (2016a). Encouraging physical activity in patients with diabetesthrough automatic personalized feedback via reinforcement learning improvesglycemic control. Diabetes Care 39 (4), e59–e60.
[158] Hochberg, I., G. Feraru, M. Kozdoba, S. Mannor, M. Tennenholtz, andE. Yom-Tov (2016b). Encouraging physical activity in patients with diabetesthrough automatic personalized feedback via reinforcement learning improvesglycemic control. Diabetes Care 39 (4), e59–e60.
[159] Hogben, G. and M. Perera (2018). Project capillary: End-to-end encryp-tion for push messaging, simplified.
[160] Hoogendoorn, M. and B. Funk (2017). Machine Learning for the QuantifiedSelf: On the Art of Learning from Sensory Data, Volume 35. Springer.
[161] Huajun, Z., Z. Jin, W. Rui, and M. Tan (2008). Multi-objective rein-forcement learning algorithm and its application in drive system. 2008 34thAnnual Conference of IEEE Industrial Electronics.
286
Bibliography
[162] Huang, S.-l. and F.-r. Lin (2005). Designing intelligent sales-agent foronline selling. Proceedings of the 7th international conference on Electroniccommerce - ICEC ’05 .
[163] IBM (2006). An architectural blueprint for autonomic computing. Tech-nical report, IBM.
[164] Ie, E., C.-w. Hsu, M. Mladenov, V. Jain, S. Narvekar, J. Wang, R. Wu,and C. Boutilier (2019). Recsim: A configurable simulation platform forrecommender systems. arXiv preprint arXiv:1909.04847 .
[165] International Organization for Standardization (2011). ISO/IEC/IEEE42010:2011 - Systems and Software Engineering – Architecture Description.Technical report, International Organization for Standardization (ISO).
[166] internationale de normalisation, O. (2011). Systems and Software Engineer-ing: Systems and Software Quality Requirements and Evaluation (SQuaRE):System and Software Quality Models. ISO/IEC.
[167] Jaradat, S., N. Dokoohaki, M. Matskin, and E. Ferrari (2016). Trustand privacy correlations in social networks: A deep learning framework.2016 IEEE/ACM International Conference on Advances in Social NetworksAnalysis and Mining (ASONAM).
[168] Jawaheer, G., M. Szomszor, and P. Kostkova (2010). Comparison ofimplicit and explicit feedback from an online music recommendation service.In proceedings of the 1st international workshop on information heterogeneityand fusion in recommender systems, pp. 47–51. ACM.
[169] Jiang, N. and L. Li (2016). Doubly robust off-policy value evaluation forreinforcement learning. In International Conference on Machine Learning,pp. 652–661.
[170] Jin, X. and J. Han (2016). K-medoids clustering. In Encyclopedia ofMachine Learning and Data Mining, pp. 1–3. Springer.
287

Bibliography
[171] Jin, Z. and Z. Huajun (2011). Multi-objective reinforcement learningalgorithm and its improved convergency method. 2011 6th IEEE Conferenceon Industrial Electronics and Applications.
[172] Kardan, A. A. and O. R. Speily (2010). Smart lifelong learning systembased on q-learning. 2010 Seventh International Conference on InformationTechnology: New Generations.
[173] Kastanis, I. and M. Slater (2012). Reinforcement learning utilizes prox-emics. ACM Transactions on Applied Perception 9 (1), 1–15.
[174] Khalid, H., E. Shihab, M. Nagappan, and A. E. Hassan (2015). What domobile app users complain about? IEEE Software 32 (3), 70–77.
[175] Khribi, M. K., M. Jemni, and O. Nasraoui (2008). Automatic recommenda-tions for e-learning personalization based on web usage mining techniques andinformation retrieval. In Advanced Learning Technologies, 2008. ICALT’08.Eighth IEEE International Conference on, pp. 241–245. IEEE.
[176] Kim, H.-K. (2013). Architecture for adaptive mobile applications. Int. J.Bio-Sci. Bio-Technol 5 (5), 197–210.
[177] Kim, K.-j. and H. Ahn (2004). Using a clustering genetic algorithm tosupport customer segmentation for personalized recommender systems. InInternational Conference on AI, Simulation, and Planning in High AutonomySystems, pp. 409–415. Springer.
[178] Kim, Y. H., D. J. Kim, and K. Wachter (2013, dec). A study of mobile userengagement (MoEN): Engagement motivations, perceived value, satisfaction,and continued engagement intention. Decision Support Systems 56, 361–370.
[179] Kitchenham, B. and P. Brereton (2013). A systematic review of systematicreview process research in software engineering. Information and softwaretechnology 55 (12), 2049–2075.
288
Bibliography
[180] Kitchenham, B. A. and S. Charters (2007). Guidelines for performingsystematic literature reviews in software engineering. Technical Report EBSE-2007-01, Keele Uni- versity and University of Durham.
[181] Kober, J. and J. Peters (2012). Reinforcement learning in robotics: Asurvey. In M. Wiering and M. Van Otterlo (Eds.), Reinforcement learning,Volume 12, pp. "596–597". Springer.
[182] Konda, V. R. and J. N. Tsitsiklis (2000). Actor-critic algorithms. InAdvances in neural information processing systems, pp. 1008–1014.
[183] Koukoutsidis, I. (2003). A learning strategy for paging in mobile en-vironments. 5th European Personal Mobile Communications Conference2003 .
[184] Krakow, E. F., M. Hemmer, T. Wang, B. Logan, M. Arora, S. Spellman,D. Couriel, A. Alousi, J. Pidala, M. Last, and et al. (2017). Tools forthe precision medicine era: How to develop highly personalized treatmentrecommendations from cohort and registry data using q-learning. AmericanJournal of Epidemiology 186 (2), 160–172.
[185] Krupitzer, C., F. M. Roth, S. VanSyckel, G. Schiele, and C. Becker (2015).A survey on engineering approaches for self-adaptive systems. Pervasive andMobile Computing 17, 184–206.
[186] Kuhn, T., K. Pittel, and T. Schulz (2003). Recycling for sustainability-along run perspective? International journal of global environmental is-sues 3 (3), 339–355.
[187] Lago, P. (2019). Architecture design decision maps for software sus-tainability. In 2019 IEEE/ACM 41st International Conference on SoftwareEngineering: Software Engineering in Society (ICSE-SEIS), pp. 61–64. IEEE.
[188] Lago, P., R. Verdecchia, N. C. Fernandez, E. Rahmadian, J. Sturm, T. vanNijnanten, R. Bosma, C. Debuysscher, and P. Ricardo (2020). Designing forsustainability: Lessons learned from four industrial projects. In Environmental
289
Bibliography
Informatics – Sustainability aware digital twins for urban smart environments(EnviroInfo). Springer.
[189] Lagoudakis, M. G. and R. Parr (2003). Least-squares policy iteration.Journal of machine learning research 4 (Dec), 1107–1149.
[190] Lai, T. L. and H. Robbins (1985). Asymptotically efficient adaptiveallocation rules. Advances in applied mathematics 6 (1), 4–22.
[191] Lan, A. S. and R. G. Baraniuk (2016). A contextual bandits frameworkfor personalized learning action selection. In EDM.
[192] Laprie, J.-C. (2008). From dependability to resilience. In 38th IEEE/IFIPInt. Conf. On Dependable Systems and Networks, pp. G8–G9. Citeseer.
[193] Lee, G., S. Bauer, P. Faratin, and J. Wroclawski (2004). Learning userpreferences for wireless services provisioning. Proceedings of the Third Inter-national Joint Conference on Autonomous Agents and Multiagent Systems,2004. AAMAS 2004., 480–487.
[194] Lehmann, J., M. Lalmas, E. Yom-Tov, and G. Dupret (2012). Modelsof user engagement. In Proceedings of the Conference on User Modeling,Adaptation, and Personalization, UMAP, pp. 164–175. Springer.
[195] Lella, A. and A. Lipsman (2016). The 2016 U.S. Mobile App Report.comsCore white paper.
[196] Lewis, G. A. and P. Lago (2015). Architectural tactics for cyber-foraging:Results of a systematic literature review. J. Syst. Softw. 107, 158–186.
[197] Li, K. and M. Q.-H. Meng (2015). Personalizing a service robot by learninghuman habits from behavioral footprints. Engineering 1 (1), 079–084.
[198] Li, L., W. Chu, J. Langford, and R. E. Schapire (2010a). A contextual-bandit approach to personalized news article recommendation. In Proceedingsof the 19th international conference on World wide web, pp. 661–670. ACM.
290
Bibliography
[199] Li, L., W. Chu, J. Langford, and R. E. Schapire (2010b). A contextual-bandit approach to personalized news article recommendation. Proceedingsof the 19th international conference on World wide web - WWW ’10 .
[200] Li, Z., J. Kiseleva, M. de Rijke, and A. Grotov (2017). Towards learningreward functions from user interactions. Proceedings of the ACM SIGIRInternational Conference on Theory of Information Retrieval - ICTIR ’17 .
[201] Liaw, A. and M. Wiener (2002). Classification and regression by random-forest. R News 2 (3), 18–22.
[202] Liebman, E. and P. Stone (2015). Dj-mc: A reinforcement-learning agentfor music playlist recommendation. In AAMAS.
[203] Lim, J., H. Son, D. Lee, and D. Lee (2017). An marl-based distributedlearning scheme for capturing user preferences in a smart environment. 2017IEEE International Conference on Services Computing (SCC).
[204] Lin, L.-J. (1992). Self-improving reactive agents based on reinforcementlearning, planning and teaching. Machine learning 8 (3-4), 293–321.
[205] Linden, A. and S. Mantyniemi (2011). Using the negative binomialdistribution to model overdispersion in ecological count data. Ecology 92 (7),1414–1421.
[206] Liu, Q., B. Cui, Z. Wei, B. Peng, H. Huang, H. Deng, J. Hao, X. Huang,and K.-F. Wong (2019). Building personalized simulator for interactivesearch. In Proceedings of the Twenty-eighth International Joint Conferenceon Artificial Intelligence (IJCAI-19), pp. 5109–5115.
[207] Liu, Y., B. Logan, N. Liu, Z. Xu, J. Tang, and Y. Wang (2017). Deepreinforcement learning for dynamic treatment regimes on medical registrydata. 2017 IEEE International Conference on Healthcare Informatics (ICHI).
[208] Liu, Y. and Y. Zhuang (2015). Research model of churn prediction basedon customer segmentation and misclassification cost in the context of bigdata. JCC 03 (06), 87–93.
291
Bibliography
[209] Llorente and S. E. Guerrero (2012). Increasing retrieval quality in con-versational recommenders. IEEE Transactions on Knowledge and DataEngineering 24 (10), 1876–1888.
[210] Lopez, F. S. and N. Condori-Fernández (2016). Design of an adaptivepersuasive mobile application for stimulating the medication adherence. InInternational Conference on Intelligent Technologies for Interactive Entertain-ment, pp. 99–105. Springer.
[211] Lopez, F. S. and N. Condori-Fernández (2016). Design of an adaptivepersuasive mobile application for stimulating the medication adherence. InIntelligent Technologies for Interactive Entertainment - 8th InternationalConference, INTETAIN 2016, Revised Selected Papers, Volume 178, pp.99–105. Springer.
[212] Lotfy, H. M., S. M. Khamis, and M. M. Aboghazalah (2016). Multi-agents and learning: Implications for webusage mining. Journal of AdvancedResearch 7 (2), 285–295.
[213] Lowery, C. and A. A. Faisal (2013). Towards efficient, personalized anesthe-sia using continuous reinforcement learning for propofol infusion control. 20136th International IEEE/EMBS Conference on Neural Engineering (NER).
[214] Ma, Y., X. Liu, Y. Liu, Y. Liu, and G. Huang (2018). A tale of twofashions: An empirical study on the performance of native apps and webapps on android. IEEE Transactions on Mobile Computing 17 (5), 990–1003.
[215] Macías-Escrivá, F. D., R. Haber, R. Del Toro, and V. Hernandez (2013).Self-adaptive systems: A survey of current approaches, research challengesand applications. Expert Systems with Applications 40 (18), 7267–7279.
[216] MacQueen, J. et al. (1967). Some methods for classification and analysisof multivariate observations. In Proceedings of the fifth Berkeley symposiumon mathematical statistics and probability, Volume 1, pp. 281–297. Oakland,CA, USA.
292

Bibliography
[217] Madani, O. and D. DeCoste (2005). Contextual recommender problems[extended abstract]. Proceedings of the 1st international workshop on Utility-based data mining - UBDM ’05 .
[218] Maes, P. and R. Kozierok (1993). Learning interface agents. In AAAI,Volume 93, pp. 459–465.
[219] Mahdavi-Hezavehi, S., V. H. Durelli, D. Weyns, and P. Avgeriou (2017).A systematic literature review on methods that handle multiple qualityattributes in architecture-based self-adaptive systems. Information andSoftware Technology 90, 1–26.
[220] Mahmood, T., G. Mujtaba, and A. Venturini (2013). Dynamic personal-ization in conversational recommender systems. Information Systems ande-Business Management 12 (2), 213–238.
[221] Mahmood, T. and F. Ricci (2007). Learning and adaptivity in interactiverecommender systems. Proceedings of the ninth international conference onElectronic commerce - ICEC ’07 .
[222] Malavolta, I. (2016). Beyond native apps: web technologies to the res-cue!(keynote). In Proceedings of the 1st International Workshop on MobileDevelopment, pp. 1–2. ACM.
[223] Malavolta, I., E. M. Grua, C.-Y. Lam, R. de Vries, F. Tan, E. Zielinski,M. Peters, and L. Kaandorp (2020). A framework for the automatic execu-tion of measurement-based experiments on android devices. In Proceedingsof the 35th IEEE/ACM International Conference on Automated SoftwareEngineering Workshops, ASE ’20, pp. 61–66.
[224] Malavolta, I., S. Ruberto, V. Terragni, and T. Soru (2015, June). Endusers’ perception of hybrid mobile apps in the google play store. In MobileServices (MS), 2015 IEEE International Conference on, pp. 25–32. Instituteof Electrical and Electronics Engineers (IEEE).
[225] Malpani, A., B. Ravindran, and H. Murthy (2011). Personalized intelligenttutoring system using reinforcement learning. In FLAIRS Conference.
293
Bibliography
[226] Manickam, I., A. S. Lan, and R. G. Baraniuk (2017). Contextual multi-armed bandit algorithms for personalized learning action selection. 2017IEEE International Conference on Acoustics, Speech and Signal Processing(ICASSP).
[227] Martin, K. N. and I. Arroyo (2004). Agentx: Using reinforcement learningto improve the effectiveness of intelligent tutoring systems. In InternationalConference on Intelligent Tutoring Systems, pp. 564–572. Springer.
[228] Martín-Guerrero, J. D., F. Gomez, E. Soria-Olivas, J. Schmidhuber,M. Climente-Martí, and N. V. Jiménez-Torres (2009). A reinforcementlearning approach for individualizing erythropoietin dosages in hemodialysispatients. Expert Systems with Applications 36 (6), 9737–9742.
[229] Martín-Guerrero, J. D., F. Gomez, E. Soria-Olivas, J. Schmidhuber,M. Climente-Martí, and N. V. Jiménez-Torres (2009). A reinforcementlearning approach for individualizing erythropoietin dosages in hemodialysispatients. Expert Systems with Applications 36 (6), 9737–9742.
[230] Martín-Guerrero, J. D., E. Soria-Olivas, M. Martínez-Sober, A. J. Serrrano-López, R. Magdalena-Benedito, and J. Gómez-Sanchis (2008). Use of rein-forcement learning in two real applications. Recent Advances in ReinforcementLearning , 191–204.
[231] Massimo, D., M. Elahi, and F. Ricci (2017). Learning user preferences byobserving user-items interactions in an iot augmented space. Adjunct Publica-tion of the 25th Conference on User Modeling, Adaptation and Personalization- UMAP ’17 .
[232] Masumitsu, K. and T. Echigo (2000). Video summarization using rein-forcement learning in eigenspace. Proceedings 2000 International Conferenceon Image Processing (Cat. No.00CH37101).
[233] May, B. C., N. Korda, A. Lee, and D. S. Leslie (2012). Optimistic bayesiansampling in contextual-bandit problems. Journal of Machine Learning Re-search 13 (Jun), 2069–2106.
294
Bibliography
[234] McKnight, P. E. and J. Najab (2010). Mann-whitney u test. The Corsiniencyclopedia of psychology , 1–1.
[235] Mengelkamp, E., J. Gärttner, and C. Weinhardt (2018). Intelligent agentstrategies for residential customers in local electricity markets. Proceedingsof the Ninth International Conference on Future Energy Systems - e-Energy’18 .
[236] Mengelkamp, E. and C. Weinhardt (2018). Clustering household pref-erences in local electricity markets. Proceedings of the Ninth InternationalConference on Future Energy Systems - e-Energy ’18 .
[237] Menikpura, S., S. H. Gheewala, S. Bonnet, and C. Chiemchaisri (2013).Evaluation of the effect of recycling on sustainability of municipal solid wastemanagement in thailand. Waste and Biomass Valorization 4 (2), 237–257.
[238] Merkle, N. and S. Zander (2017). Agent-based assistance in ambientassisted living through reinforcement learning and semantic technologies.Lecture Notes in Computer Science, 180–188.
[239] Middelweerd, A., J. S. Mollee, C. N. van der Wal, J. Brug, and S. J.Te Velde (2014). Apps to promote physical activity among adults: a reviewand content analysis. International journal of behavioral nutrition and physicalactivity 11 (1), 97.
[240] Mizouni, R., M. A. Matar, Z. Al Mahmoud, S. Alzahmi, and A. Salah(2014). A framework for context-aware self-adaptive mobile applications spl.Expert Systems with applications 41 (16), 7549–7564.
[241] Mnih, V., K. Kavukcuoglu, D. Silver, A. Graves, I. Antonoglou, D. Wier-stra, and M. Riedmiller (2013). Playing atari with deep reinforcement learning.arXiv preprint arXiv:1312.5602 .
[242] Mo, K., Y. Zhang, S. Li, J. Li, and Q. Yang (2018). Personalizing adialogue system with transfer reinforcement learning. In AAAI.
295
Bibliography
[243] Moghaddam, F. A., M. Simaremare, P. Lago, and P. Grosso (2017). Aself-adaptive framework for enhancing energy efficiency in mobile applications.In 2017 Sustainable Internet and ICT for Sustainability (SustainIT), pp. 1–3.IEEE.
[244] Moghimi, M., J. Venkatesh, P. Zappi, and T. Rosing (2013). Context-aware mobile power management using fuzzy inference as a service. InD. Uhler, K. Mehta, and J. L. Wong (Eds.), Mobile Computing, Applications,and Services, Berlin, Heidelberg, pp. 314–327. Springer Berlin Heidelberg.
[245] Mohalik, S. K., N. C. Narendra, R. Badrinath, and D. Le (2017). Adaptiveservice-oriented architectures for cyber physical systems. In IEEE Symposiumon Service-Oriented System Engineering, SOSE, pp. 57–62.
[246] Moher, D., A. Liberati, J. Tetzlaff, and D. G. Altman (2009). Preferred re-porting items for systematic reviews and meta-analyses: the prisma statement.Annals of internal medicine 151 (4), 264–269.
[247] Moling, O., L. Baltrunas, and F. Ricci (2012). Optimal radio channelrecommendations with explicit and implicit feedback. Proceedings of the sixthACM conference on Recommender systems - RecSys ’12 .
[248] Moon, A., T. Kang, H. Kim, and H. Kim (2007). A service recommen-dation using reinforcement learning for network-based robots in ubiquitouscomputing environments. RO-MAN 2007 - The 16th IEEE InternationalSymposium on Robot and Human Interactive Communication.
[249] Morandini, M., L. Penserini, and A. Perini (2008). Towards goal-orienteddevelopment of self-adaptive systems. In 2008 ICSE Workshop on SoftwareEngineering for Adaptive and Self-Managing Systems, SEAMS, pp. 9–16.
[250] Muccini, H., M. Sharaf, and D. Weyns (2016). Self-adaptation for cyber-physical systems: a systematic literature review. In Proceedings of the11th international symposium on software engineering for adaptive and self-managing systems, pp. 75–81. ACM.
296
Bibliography
[251] Muccini, H., R. Spalazzese, M. T. Moghaddam, and M. Sharaf (2018).Self-adaptive iot architectures: an emergency handling case study. In Proceed-ings of the 12th European Conference on Software Architecture: CompanionProceedings, pp. 19. ACM.
[252] Müller, H., J. Gove, and J. Webb (2012). Understanding tablet use.In Proceedings of the 14th international conference on Human-computerinteraction with mobile devices and services - MobileHCI. ACM Press.
[253] Müller, H., A. Hanbury, N. Al Shorbaji, et al. (2012). Health informationsearch to deal with the exploding amount of health information produced.Methods of information in medicine 51 (6), 516.
[254] Mylopoulos, J., L. Chung, and B. A. Nixon (1992). Representing andusing nonfunctional requirements: A process-oriented approach. IEEE Trans.Software Eng. 18 (6), 483–497.
[255] Naqvi, N. Z., J. Devlieghere, D. Preuveneers, and Y. Berbers (2016).Mascot: self-adaptive opportunistic offloading for cloud-enabled smart mobileapplications with probabilistic graphical models at runtime. In SystemSciences (HICSS), 2016 49th Hawaii International Conference on, pp. 5701–5710. IEEE.
[256] Narvekar, S., J. Sinapov, and P. Stone (2017). Autonomous task se-quencing for customized curriculum design in reinforcement learning. InIJCAI.
[257] Nelissen, K., M. Snoeck, S. V. Broucke, and B. Baesens (2018, June).Swipe and tell: Using implicit feedback to predict user engagement on tablets.ACM Trans. Inf. Syst. 36 (4), 35:1–35:36.
[258] Nemati, S., M. M. Ghassemi, and G. D. Clifford (2016). Optimal med-ication dosing from suboptimal clinical examples: A deep reinforcementlearning approach. 2016 38th Annual International Conference of the IEEEEngineering in Medicine and Biology Society (EMBC).
297
Bibliography
[259] Neumann, D., T. Mansi, L. Itu, B. Georgescu, E. Kayvanpour, F. Sedaghat-Hamedani, A. Amr, J. Haas, H. Katus, B. Meder, and et al. (2016). A self-taught artificial agent for multi-physics computational model personalization.Medical Image Analysis 34, 52–64.
[260] Neumann, D., T. Mansi, L. Itu, B. Georgescu, E. Kayvanpour, F. Sedaghat-Hamedani, J. Haas, H. Katus, B. Meder, S. Steidl, and et al. (2015). Vito –a generic agent for multi-physics model personalization: Application to heartmodeling. Medical Image Computing and Computer-Assisted Intervention –MICCAI 2015 , 442–449.
[261] Nocedal, J. and S. J. Wright (1999). Numerical Optimization (2nd ed.).Springer.
[262] O’Brien, H. and R. Bassett (2009). Exploring engagement in the qualitativeresearch process. American Society for Information Science and TechnologyAnnual Meeting, Vancouver, BC, October, 2009.
[263] O’Brien, H. L. and E. G. Toms (2008). What is user engagement? aconceptual framework for defining user engagement with technology. J. Am.Soc. Inf. Sci. 59 (6), 938–955.
[264] Oh, D. and C. L. Tan (2004). Making better recommendations with onlineprofiling agents. AI Magazine 26, 29–40.
[265] Ondruska, P. and I. Posner (2014). The route not taken: Driver-centric es-timation of electric vehicle range. In Twenty-Fourth International Conferenceon Automated Planning and Scheduling.
[266] Palomba, F., M. L. Vásquez, G. Bavota, R. Oliveto, M. Di Penta, D. Poshy-vanyk, and A. De Lucia (2018). Crowdsourcing user reviews to support theevolution of mobile apps. Journal of Systems and Software 137, 143–162.
[267] Pan, S. J. and Q. Yang (2010). A survey on transfer learning. IEEETransactions on knowledge and data engineering 22 (10), 1345–1359.
298
Bibliography
[268] Pant, V., S. Bhasin, and S. Jain (2017). Self-learning system for per-sonalized e-learning. 2017 International Conference on Emerging Trends inComputing and Communication Technologies (ICETCCT).
[269] Paschou, M., E. Sakkopoulos, E. Sourla, and A. Tsakalidis (2013). Healthinternet of things: Metrics and methods for efficient data transfer. SimulationModelling Practice and Theory 34, 186 – 199.
[270] Patompak, P., S. Jeong, I. Nilkhamhang, and N. Y. Chong (2017). Learn-ing social relations for culture aware interaction. 2017 14th InternationalConference on Ubiquitous Robots and Ambient Intelligence (URAI).
[271] Pecka, M. and T. Svoboda (2014). Safe exploration techniques for rein-forcement learning–an overview. In International Workshop on Modellingand Simulation for Autonomous Systems, pp. 357–375. Springer.
[272] Peng, B., Q. Jiao, and T. Kurner (2016). Angle of arrival estimation indynamic indoor thz channels with bayesian filter and reinforcement learning.2016 24th European Signal Processing Conference (EUSIPCO).
[273] Peng, C. and P. Vuorimaa (2004). Automatic navigation among mobiledtv services. In ICEIS.
[274] Perera, C., A. Zaslavsky, P. Christen, and D. Georgakopoulos (2014).Context aware computing for the internet of things: A survey. IEEE Com-munications Surveys & Tutorials 16 (1), 414–454.
[275] Petersen, K., R. Feldt, S. Mujtaba, and M. Mattsson (2008). Systematicmapping studies in software engineering. In Proceedings of the 12th Interna-tional Conference on Evaluation and Assessment in Software Engineering,EASE’08, Swinton, UK, UK, pp. 68–77. British Computer Society.
[276] Petersen, K., S. Vakkalanka, and L. Kuzniarz (2015). Guidelines forconducting systematic mapping studies in software engineering: An update.Information and Software Technology 64, 1–18.
299
Bibliography
[277] Picco, G. P., C. Julien, A. L. Murphy, M. Musolesi, and G.-C. Roman(2014). Software engineering for mobility: reflecting on the past, peeringinto the future. In Proceedings of the on Future of Software Engineering, pp.13–28. ACM.
[278] Pine, B. J., B. Victor, and A. C. Boynton (1993). Making mass customiza-tion work. Harvard business review 71 (5), 108–11.
[279] Pineau, J., M. G. Bellemare, A. J. Rush, A. Ghizaru, and S. A. Murphy(2007). Constructing evidence-based treatment strategies using methods fromcomputer science. Drug and Alcohol Dependence 88, S52–S60.
[280] Pomprapa, A., S. Leonhardt, and B. J. Misgeld (2017). Optimal learningcontrol of oxygen saturation using a policy iteration algorithm and a proof-of-concept in an interconnecting three-tank system. Control EngineeringPractice 59, 194–203.
[281] Powell, A. C., J. Torous, S. Chan, G. S. Raynor, E. Shwarts, M. Shanahan,and A. B. Landman (2016). Interrater reliability of mhealth app ratingmeasures: analysis of top depression and smoking cessation apps. JMIRmHealth and uHealth 4 (1).
[282] Prasad, N., L.-F. Cheng, C. Chivers, M. Draugelis, and B. E. Engel-hardt (2017). A reinforcement learning approach to weaning of mechanicalventilation in intensive care units. CoRR abs/1704.06300.
[283] Preda, M. and D. Popescu (2005). Personalized web recommenda-tions: Supporting epistemic information about end-users. The 2005IEEE/WIC/ACM International Conference on Web Intelligence (WI’05).
[284] Preuveneers, D., N. Z. Naqvi, A. Ramakrishnan, Y. Berbers, andW. Joosen (2016). Adaptive dissemination for mobile electronic healthrecord applications with proactive situational awareness. In 2016 49th HawaiiInternational Conference on System Sciences (HICSS), pp. 3229–3238. IEEE.
300
Bibliography
[285] Priscoli, F. D., L. Fogliati, A. Palo, and A. Pietrabissa (2014). Dynamicclass of service mapping for quality of experience control in future networks.In WTC 2014; World Telecommunications Congress 2014, pp. 1–6. VDE.
[286] Qian, W., X. Peng, H. Wang, J. Mylopoulos, J. Zheng, and W. Zhao(2018). MobiGoal: Flexible achievement of personal goals for mobile users.IEEE Trans. Services Computing 11 (2), 384–398.
[287] Qin, Z., I. Rishabh, and J. Carnahan (2016). A scalable approach forperiodical personalized recommendations. Proceedings of the 10th ACMConference on Recommender Systems - RecSys ’16 .
[288] Racherla, P., C. Furner, and J. Babb (2012). Conceptualizing the impli-cations of mobile app usage and stickiness: A research agenda. Available atSSRN 2187056 .
[289] Raghuveer, V. R., B. K. Tripathy, T. Singh, and S. Khanna (2014).Reinforcement learning approach towards effective content recommendationin mooc environments. 2014 IEEE International Conference on MOOC,Innovation and Technology in Education (MITE).
[290] Raheel, S. (2016). Improving the user experience using an intelligentadaptive user interface in mobile applications. In Multidisciplinary Conferenceon Engineering Technology (IMCET), IEEE International, pp. 64–68. IEEE.
[291] Ramesh, A., D. Goldwasser, B. Huang, H. D. III, and L. Getoor (2014).Learning latent engagement patterns of students in online courses. In AAAIConference on Artificial Intelligence.
[292] Rennison, E. (1995). Personalized galaxies of infomation. In Companionof the ACM Conference on Human Factors in Computing Systems (CHI’95).
[293] Resnick, P. and H. R. Varian (1997). Recommender systems. Communi-cations of the ACM 40 (3), 56–58.
[294] Riaño, D., F. Real, J. A. López-Vallverdú, F. Campana, S. Ercolani,P. Mecocci, R. Annicchiarico, and C. Caltagirone (2012). An ontology-based
301
Bibliography
personalization of health-care knowledge to support clinical decisions forchronically ill patients. Journal of biomedical informatics 45 (3), 429–446.
[295] Ricci, F., L. Rokach, and B. Shapira (2011). Introduction to recommendersystems handbook. In Recommender systems handbook, pp. 14–17. Springer.
[296] Riecken, D. (2000). Personalized views of personalization. Communicationsof the ACM 43 (8), 26–26.
[297] Riedmiller, M. (2005). Neural fitted q iteration–first experiences with adata efficient neural reinforcement learning method. In European Conferenceon Machine Learning, pp. 317–328. Springer.
[298] Ritschel, H. and E. André (2017). Real-time robot personality adaptationbased on reinforcement learning and social signals. Proceedings of the Com-panion of the 2017 ACM/IEEE International Conference on Human-RobotInteraction - HRI ’17 .
[299] Rivas-Blanco, I., C. Lopez-Casado, C. J. Perez-del Pulgar, F. Garcia-Vacas, J. C. Fraile, and V. F. Munoz (2018). Smart cable-driven camerarobotic assistant. IEEE Transactions on Human-Machine Systems 48 (2),183–196.
[300] Rodrigues, P. P., J. Gama, and J. Pedroso. Hierarchical timeseriesclustering for data streams. [Online;].
[301] Rodrigues, P. P., J. Gama, and J. Pedroso (2008). Hierarchical clusteringof time-series data streams. IEEE transactions on knowledge and dataengineering 20 (5), 615–627.
[302] Rousseeuw, P. J. (1987). Silhouettes: a graphical aid to the interpretationand validation of cluster analysis. Journal of computational and appliedmathematics 20, 53–65.
[303] Rudary, M., S. Singh, and M. E. Pollack (2004). Adaptive cognitiveorthotics. Twenty-first international conference on Machine learning - ICML’04 .
302
Bibliography
[304] Russell, S. and P. Norvig (2002). Artificial intelligence: a modern ap-proach.
[305] Saha, S. and R. Quazi (2008). Emotion-driven learning agent for settingrich presence in mobile telephony. 2008 11th International Conference onComputer and Information Technology .
[306] Sama, M., D. S. Rosenblum, Z. Wang, and S. Elbaum (2010). Multi-layerfaults in the architectures of mobile, context-aware adaptive applications.Journal of Systems and Software 83 (6), 906–914.
[307] Santos, M., C. Gralha, M. Goulão, and J. Araújo (2018). Increasingthe semantic transparency of the KAOS goal model concrete syntax. InConceptual Modeling - 37th International Conference, ER, pp. 424–439.
[308] Saraçli, S., N. Doğan, and İ. Doğan (2013). Comparison of hierarchicalcluster analysis methods by cophenetic correlation. J Inequal Appl 2013 (1),203.
[309] Schafer, J. B., D. Frankowski, J. Herlocker, and S. Sen (2007). Collab-orative filtering recommender systems. In The adaptive web, pp. 291–324.Springer.
[310] Sekhavat, Y. A. (2017). Mprl: Multiple-periodic reinforcement learningfor difficulty adjustment in rehabilitation games. 2017 IEEE 5th InternationalConference on Serious Games and Applications for Health (SeGAH).
[311] Sener, I. N., R. B. Copperman, R. M. Pendyala, and C. R. Bhat (2008). Ananalysis of children’s leisure activity engagement: examining the day of week,location, physical activity level, and fixity dimensions. Transportation 35 (5),673–696.
[312] Seo, Y.-W. and B.-T. Zhang (2000a). Learning user’s preferences byanalyzing web-browsing behaviors. In Proceedings of the fourth internationalconference on Autonomous agents, pp. 381–387. ACM.
303
Bibliography
[313] Seo, Y.-W. and B.-T. Zhang (2000b). Learning user’s preferences byanalyzing web-browsing behaviors. In Proceedings of the fourth internationalconference on Autonomous agents, pp. 381–387. ACM.
[314] Seo, Y.-W. and B.-T. Zhang (2000c). A reinforcement learning agent forpersonalized information filtering. In Proceedings of the 5th internationalconference on Intelligent user interfaces, pp. 248–251. ACM.
[315] Shapiro, S. S. and M. B. Wilk (1965). An analysis of variance test fornormality (complete samples). Biometrika 52 (3/4), 591–611.
[316] Shawky, D. and A. Badawi (2018). A reinforcement learning-based adap-tive learning system. Advances in Intelligent Systems and Computing , 221–231.
[317] Shen, S. and M. Chi (2016). Reinforcement learning. Proceedings of the2016 Conference on User Modeling Adaptation and Personalization - UMAP’16 .
[318] Shiffman, S., A. A. Stone, and M. R. Hufford (2008). Ecological momentaryassessment. Annu. Rev. Clin. Psychol. 4, 1–32.
[319] Shirazi, A. S., N. Henze, T. Dingler, M. Pielot, D. Weber, and A. Schmidt(2014). Large-scale assessment of mobile notifications. In Proceedings of the32nd annual ACM conference on Human factors in computing systems. ACMPress.
[320] Silber, D. et al. (2003). The case for eHealth. European Institute of PublicAdministration Maastricht.
[321] Silva, B. M., J. J. Rodrigues, I. de la Torre Díez, M. López-Coronado, andK. Saleem (2015). Mobile-health: A review of current state in 2015. Journalof biomedical informatics 56, 265–272.
[322] Snyder, S. (2009). The New World of Wireless: How to Compete in the4G Revolution. FT Press.
304
Bibliography
[323] Snyder, S. (2016). Hyper-personalizing the user experience throughdata. Presentation at the Mobile World Congress - Contextual Commerce,Barcelona.
[324] Song, L., W. Hsu, J. Xu, and M. van der Schaar (2016). Using contextuallearning to improve diagnostic accuracy: Application in breast cancer screen-ing. IEEE Journal of Biomedical and Health Informatics 20 (3), 902–914.
[325] Sprague, N. and D. Ballard (2003). Multiple-goal reinforcement learningwith modular sarsa (0).
[326] Srinivasan, A. R. and S. Chakraborty (2016). Path planning with userroute preference - a reward surface approximation approach using orthogonallegendre polynomials. 2016 IEEE International Conference on AutomationScience and Engineering (CASE).
[327] Srivihok, A. and P. Sukonmanee (2005). Intelligent agent for e-tourism:Personalization travel support agent using reinforcement learning. In WWW2005.
[328] Statista (2018). Number of available applications in the google play storefrom december 2009 to june 2018.
[329] Su, P.-h., Y.-B. Wang, T.-h. Yu, and L.-s. Lee (2013). A dialoguegame framework with personalized training using reinforcement learningfor computer-assisted language learning. 2013 IEEE International Conferenceon Acoustics, Speech and Signal Processing .
[330] Su, P.-H., C.-H. Wu, and L.-S. Lee (2014). A recursive dialogue game forpersonalized computer-aided pronunciation training. IEEE/ACM Transac-tions on Audio, Speech, and Language Processing , 1–1.
[331] Sutton, R. S. (1990). Integrated architectures for learning, planning, andreacting based on approximating dynamic programming. In Machine learningproceedings 1990, pp. 216–224. Elsevier.
305
Bibliography
[332] Sutton, R. S. (1996). Generalization in reinforcement learning: Successfulexamples using sparse coarse coding. In Advances in neural informationprocessing systems, pp. 1038–1044.
[333] Sutton, R. S. and A. G. Barto (1998). Reinforcement learning: Anintroduction, Volume 1. MIT press Cambridge.
[334] Sutton, R. S. and A. G. Barto (2018). Reinforcement learning: Anintroduction. MIT press Cambridge.
[335] Sutton, R. S., D. A. McAllester, S. P. Singh, and Y. Mansour (2000). Policygradient methods for reinforcement learning with function approximation. InAdvances in neural information processing systems, pp. 1057–1063.
[336] Szepesvári, C. (2010). Algorithms for reinforcement learning. Synthesislectures on artificial intelligence and machine learning 4 (1), 1–103.
[337] Tabatabaei, S. A., M. Hoogendoorn, and A. van Halteren (2018). Narrow-ing reinforcement learning: Overcoming the cold start problem for person-alized health interventions. In International Conference on Principles andPractice of Multi-Agent Systems, pp. 312–327. Springer.
[338] Taghipour, N. and A. Kardan (2008). A hybrid web recommender systembased on q-learning. Proceedings of the 2008 ACM symposium on Appliedcomputing - SAC ’08 .
[339] Taghipour, N., A. Kardan, and S. S. Ghidary (2007). Usage-based webrecommendations. Proceedings of the 2007 ACM conference on Recommendersystems - RecSys ’07 .
[340] Tang, J., C. Abraham, E. Stamp, and C. Greaves (2015, aug). Howcan weight-loss app designers best engage and support users? a qualitativeinvestigation. British Journal of Health Psychology 20 (1), 151–171.
[341] Tang, L., Y. Jiang, L. Li, and T. Li (2014). Ensemble contextual banditsfor personalized recommendation. Proceedings of the 8th ACM Conferenceon Recommender systems - RecSys ’14 .
306
Bibliography
[342] Tang, L., Y. Jiang, L. Li, C. Zeng, and T. Li (2015). Personalizedrecommendation via parameter-free contextual bandits. Proceedings of the38th International ACM SIGIR Conference on Research and Development inInformation Retrieval - SIGIR ’15 .
[343] Tang, L., R. Rosales, A. Singh, and D. Agarwal (2013). Automatic adformat selection via contextual bandits. Proceedings of the 22nd ACM inter-national conference on Conference on information & knowledge management- CIKM ’13 .
[344] Tavakol, M. and U. Brefeld (2017). A unified contextual bandit frameworkfor long- and short-term recommendations. Lecture Notes in ComputerScience, 269–284.
[345] Taylor, M. E. and P. Stone (2009). Transfer learning for reinforcementlearning domains: A survey. Journal of Machine Learning Research 10 (Jul),1633–1685.
[346] Tegelund, B., H. Son, and D. Lee (2016). A task-oriented service person-alization scheme for smart environments using reinforcement learning. 2016IEEE International Conference on Pervasive Computing and CommunicationWorkshops (PerCom Workshops).
[347] Theocharous, G., P. S. Thomas, and M. Ghavamzadeh (2015a). Adrecommendation systems for life-time value optimization. Proceedings of the24th International Conference on World Wide Web - WWW ’15 Companion.
[348] Theocharous, G., P. S. Thomas, and M. Ghavamzadeh (2015b). Per-sonalized ad recommendation systems for life-time value optimization withguarantees. In Twenty-Fourth International Joint Conference on ArtificialIntelligence.
[349] Thomas, P. S., G. Theocharous, and M. Ghavamzadeh (2015). High-confidence off-policy evaluation. In Twenty-Ninth AAAI Conference onArtificial Intelligence.
307
Bibliography
[350] Torlay, L., M. Perrone-Bertolotti, E. Thomas, and M. Baciu (2017).Machine learning–xgboost analysis of language networks to classify patientswith epilepsy. Brain informatics 4 (3), 159.
[351] Triki, S. and C. Hanachi (2017). A self-adaptive system for improvingautonomy and public spaces accessibility for elderly. Smart Innovation,Systems and Technologies, 53–66.
[352] Tseng, H.-H., Y. Luo, S. Cui, J.-T. Chien, R. K. Ten Haken, and I. E.Naqa (2017). Deep reinforcement learning for automated radiation adaptationin lung cancer. Medical Physics 44 (12), 6690–6705.
[353] Tsiakas, K., C. Abellanoza, and F. Makedon (2016). Interactive learningand adaptation for robot assisted therapy for people with dementia. Pro-ceedings of the 9th ACM International Conference on PErvasive TechnologiesRelated to Assistive Environments - PETRA ’16 .
[354] Tsiakas, K., M. Huber, and F. Makedon (2015). A multimodal adaptivesession manager for physical rehabilitation exercising. Proceedings of the8th ACM International Conference on PErvasive Technologies Related toAssistive Environments - PETRA ’15 .
[355] Tsiakas, K., M. Papakostas, B. Chebaa, D. Ebert, V. Karkaletsis, andF. Makedon (2016). An interactive learning and adaptation framework foradaptive robot assisted therapy. Proceedings of the 9th ACM InternationalConference on PErvasive Technologies Related to Assistive Environments -PETRA ’16 .
[356] Tsiakas, K., M. Papakostas, M. Theofanidis, M. Bell, R. Mihalcea, S. Wang,M. Burzo, and F. Makedon (2017). An interactive multisensing frameworkfor personalized human robot collaboration and assistive training using re-inforcement learning. Proceedings of the 10th International Conference onPErvasive Technologies Related to Assistive Environments - PETRA ’17 .
[357] Urieli, D. and P. Stone (2014). Tactex’13: a champion adaptive powertrading agent. In AAMAS.
308
Bibliography
[358] van den Hoven, J. (2016). Clustering with optimised weights for Gower’smetric. Master’s thesis, Vrij University, Amsterdam, the Netherlands.
[359] Van Hasselt, H., A. Guez, and D. Silver (2016). Deep reinforcementlearning with double q-learning. In Thirtieth AAAI conference on artificialintelligence.
[360] Vasan, G. and P. M. Pilarski (2017). Learning from demonstration:Teaching a myoelectric prosthesis with an intact limb via reinforcementlearning. 2017 International Conference on Rehabilitation Robotics (ICORR).
[361] Vasilyeva, E., M. Pechenizkiy, and S. Puuronen (2005). Towards theframework of adaptive user interfaces for ehealth. In Computer-Based MedicalSystems, 2005. Proceedings. 18th IEEE Symposium on, pp. 139–144. IEEE.
[362] Volpato, T., B. R. N. Oliveira, L. Garcés, R. Capilla, and E. Y. Nakagawa(2017). Two perspectives on reference architecture sustainability. In Proceed-ings of the 11th European Conference on Software Architecture: Companion,pp. 188–194. ACM.
[363] Wachter, K., Y. H. Kim, and M. Kim (2012). Mobile users: Choosing toengage. International Journal of Sales, Retailing and Marketing 1 (1).
[364] Wang, L., Y. Gao, C. Cao, and L. Wang (2012). Towards a generalsupporting framework for self-adaptive software systems. 2012 IEEE 36thAnnual Computer Software and Applications Conference Workshops.
[365] Wang, P., J. Rowe, B. Mott, and J. Lester (2016). Decomposing dramamanagement in educational interactive narrative: A modular reinforcementlearning approach. Lecture Notes in Computer Science, 270–282.
[366] Wang, P., J. P. Rowe, W. Min, B. W. Mott, and J. C. Lester (2017).Interactive narrative personalization with deep reinforcement learning. InIJCAI.
309

Bibliography
[367] Wang, X., Y. Wang, D. Hsu, and Y. Wang (2014a). Exploration in interac-tive personalized music recommendation. ACM Transactions on MultimediaComputing, Communications, and Applications 11 (1), 1–22.
[368] Wang, X., Y. Wang, D. Hsu, and Y. Wang (2014b). Exploration ininteractive personalized music recommendation: a reinforcement learningapproach. ACM Transactions on Multimedia Computing, Communications,and Applications (TOMM) 11 (1), 7.
[369] Wang, X., M. Zhang, F. Ren, and T. Ito (2015). Gongbroker: A brokermodel for power trading in smart grid markets. 2015 IEEE/WIC/ACMInternational Conference on Web Intelligence and Intelligent Agent Technology(WI-IAT).
[370] Watkins, C. J. and P. Dayan (1992). Q-learning. Machine learning 8 (3-4),279–292.
[371] Webb, M. S., V. N. Simmons, and T. H. Brandon (2005). Tailored inter-ventions for motivating smoking cessation: using placebo tailoring to examinethe influence of expectancies and personalization. Health Psychology 24 (2),179.
[372] Wesson, J. L., A. Singh, and B. Van Tonder (2010). Can adaptiveinterfaces improve the usability of mobile applications? In Human-ComputerInteraction, pp. 187–198. Springer.
[373] Weyns, D. (2017). Software engineering of self-adaptive systems: anorganised tour and future challenges. Chapter in Handbook of SoftwareEngineering .
[374] Weyns, D., M. U. Iftikhar, D. Hughes, and N. Matthys (2018). Applyingarchitecture-based adaptation to automate the management of internet-of-things. In European Conference on Software Architecture, pp. 49–67. Springer.
[375] Weyns, D., M. U. Iftikhar, S. Malek, and J. Andersson (2012). Claimsand supporting evidence for self-adaptive systems: A literature study. In
310
Bibliography
Proceedings of the 7th International Symposium on Software Engineering forAdaptive and Self-Managing Systems, pp. 89–98. IEEE Press.
[376] Wiering, M. and M. Van Otterlo (2012a). Reinforcement learning. Adap-tation, learning, and optimization 12.
[377] Wiering, M. and M. Van Otterlo (2012b). Reinforcement learning. Adap-tation, learning, and optimization 12.
[378] Williams, P. A. H. and V. McCauley (2013). A rapidly moving target:Conformance with e-health standards for mobile computing. In 2nd AustralianeHealth Informatics and Security Conference.
[379] Wohlin, C. (2014a). Guidelines for snowballing in systematic literaturestudies and a replication in software engineering. In Proceedings of the 18thinternational conference on evaluation and assessment in software engineering,pp. 38. ACM.
[380] Wohlin, C. (2014b). Guidelines for snowballing in systematic literaturestudies and a replication in software engineering. In Proceedings of the18th International Conference on Evaluation and Assessment in SoftwareEngineering, EASE ’14, New York, NY, USA, pp. 38:1–38:10. ACM.
[381] Wohlin, C., P. Runeson, M. Höst, M. C. Ohlsson, B. Regnell, and A. Wess-lén (2012). Experimentation in software engineering. Springer Science &Business Media.
[382] Wu, G., Y. Ding, Y. Li, J. Luo, F. Zhang, and J. Fu (2017). Data-driveninverse learning of passenger preferences in urban public transits. 2017 IEEE56th Annual Conference on Decision and Control (CDC).
[383] Xu, J., T. Xing, and M. van der Schaar (2016). Personalized coursesequence recommendations. IEEE Transactions on Signal Processing 64 (20),5340–5352.
[384] Yang, M., Q. Qu, K. Lei, J. Zhu, Z. Zhao, X. Chen, and J. Z. Huang (2018).Investigating deep reinforcement learning techniques in personalized dialogue
311
Bibliography
generation. In Proceedings of the 2018 SIAM International Conference onData Mining, pp. 630–638. SIAM.
[385] Yang, M., W. Tu, Q. Qu, Z. Zhao, X. Chen, and J. Zhu (2018). Personal-ized response generation by dual-learning based domain adaptation. NeuralNetworks 103, 72–82.
[386] Yang, M., Z. Zhao, W. Zhao, X. Chen, J. Zhu, L. Zhou, and Z. Cao (2017).Personalized response generation via domain adaptation. Proceedings of the40th International ACM SIGIR Conference on Research and Development inInformation Retrieval - SIGIR ’17 .
[387] Yang, Z., Z. Li, Z. Jin, and Y. Chen (2014). A systematic literaturereview of requirements modeling and analysis for self-adaptive systems. InInternational Working Conference on Requirements Engineering: Foundationfor Software Quality, pp. 55–71. Springer.
[388] Yuan, S.-T. (2003). A personalized and integrative comparison-shoppingengine and its applications. Decision Support Systems 34 (2), 139–156.
[389] Yue, Y., S. A. Hong, and C. Guestrin (2012). Hierarchical explorationfor accelerating contextual bandits. In Proceedings of the 29th InternationalCoference on International Conference on Machine Learning, pp. 979–986.Omnipress.
[390] Zaidenberg, S. and P. Reignier (2011). Reinforcement learning of userpreferences for a ubiquitous personal assistant. In Advances in ReinforcementLearning. IntechOpen.
[391] Zaidenberg, S., P. Reignier, and J. L. Crowley (2008). Reinforcementlearning of context models for a ubiquitous personal assistant. 3rd Symposiumof Ubiquitous Computing and Ambient Intelligence 2008 , 254–264.
[392] Zeng, C., Q. Wang, S. Mokhtari, and T. Li (2016). Online context-awarerecommendation with time varying multi-armed bandit. Proceedings of the22nd ACM SIGKDD International Conference on Knowledge Discovery andData Mining - KDD ’16 .
312
Bibliography
[393] Zepeda-Mendoza, M. L. and O. Resendis-Antonio (2013). Hierarchicalagglomerative clustering. In Encyclopedia of Systems Biology, pp. 886–887.Springer.
[394] Zhang, B.-T. and Y.-W. Seo (2001a). Personalized web-document filteringusing reinforcement learning. Applied Artificial Intelligence 15 (7), 665–685.
[395] Zhang, B.-T. and Y.-W. Seo (2001b). Personalized web-document filteringusing reinforcement learning. Applied Artificial Intelligence 15 (7), 665–685.
[396] Zhang, Y., R. Chen, J. Tang, W. F. Stewart, and J. Sun (2017). Leap. Pro-ceedings of the 23rd ACM SIGKDD International Conference on KnowledgeDiscovery and Data Mining - KDD ’17 .
[397] Zhao, T. and I. King (2016). Locality-sensitive linear bandit model foronline social recommendation. Lecture Notes in Computer Science, 80–90.
[398] Zhao, Y., M. R. Kosorok, and D. Zeng (2009). Reinforcement learningdesign for cancer clinical trials. Statistics in medicine 28 (26), 3294–3315.
[399] Zhao, Y., S. Wang, Y. Zou, J. Ng, and T. Ng (2017). Automaticallylearning user preferences for personalized service composition. 2017 IEEEInternational Conference on Web Services (ICWS).
[400] Zhao, Y., D. Zeng, M. A. Socinski, and M. R. Kosorok (2011). Rein-forcement learning strategies for clinical trials in nonsmall cell lung cancer.Biometrics 67 (4), 1422–1433.
[401] Zhao, Y., Q. Zhao, L. Xia, Z. Cheng, F. Wang, and F. Song (2013). Aunified control framework of hvac system for thermal and acoustic comforts inoffice building. 2013 IEEE International Conference on Automation Scienceand Engineering (CASE).
[402] Zheng, G., F. Zhang, Z. Zheng, Y. Xiang, N. J. Yuan, X. Xie, and Z. Li(2018). Drn. Proceedings of the 2018 World Wide Web Conference on WorldWide Web - WWW ’18 .
313
[403] Zheng, H. and J. Jumadinova (2016). Owls: Observational wirelesslife-enhancing system (extended abstract). In AAMAS.
[404] Zhou, L. and E. Brunskill (2016). Latent contextual bandits and theirapplication to personalized recommendations for new users. In IJCAI.
[405] Zhou, M., Y. D. Mintz, Y. Fukuoka, K. Y. Goldberg, E. Flowers, P. Kamin-sky, A. Castillejo, and A. Aswani (2018). Personalizing mobile fitness appsusing reinforcement learning. In IUI Workshops.
[406] Zhu, F., J. Guo, Z. Xu, P. Liao, and J. Huang (2017). Group-drivenreinforcement learning for personalized mhealth intervention. arXiv preprintarXiv:1708.04001 .
[407] Zhu, R., Y.-Q. Zhao, G. Chen, S. Ma, and H. Zhao (2016). Greedyoutcome weighted tree learning of optimal personalized treatment rules.Biometrics 73 (2), 391–400.

Bibliography
315

SIKS Dissertatiereeks
20112011-01 Botond Cseke (RUN)
Variational Algorithms for BayesianInference in Latent Gaussian Models
2011-02 Nick Tinnemeier (UU)
Organizing Agent Organizations.Syntax and Operational Semantics ofan Organization-Oriented Program-ming Language
2011-03 Jan Martijn van der Werf(TUE)
Compositional Design and Verifica-tion of Component-Based Informa-tion Systems
2011-04 Hado van Hasselt (UU)
Insights in Reinforcement Learning;Formal analysis and empirical evalu-ation of temporal-difference learningalgorithms
2011-05 Base van der Raadt (VU)
Enterprise Architecture Coming ofAge - Increasing the Performance ofan Emerging Discipline.
2011-06 Yiwen Wang (TUE)
Semantically-Enhanced Recommen-dations in Cultural Heritage
2011-07 Yujia Cao (UT)
Multimodal Information Presenta-tion for High Load Human ComputerInteraction
2011-08 Nieske Vergunst (UU)
BDI-based Generation of RobustTask-Oriented Dialogues
2011-09 Tim de Jong (OU)
Contextualised Mobile Media forLearning
2011-10 Bart Bogaert (UvT)
Cloud Content Contention
2011-11 Dhaval Vyas (UT)
Designing for Awareness: AnExperience-focused HCI Perspective
2011-12 Carmen Bratosin (TUE)
Grid Architecture for DistributedProcess Mining
2011-13 Xiaoyu Mao (UvT)
Airport under Control. MultiagentScheduling for Airport Ground Han-dling
2011-14 Milan Lovric (EUR)
Behavioral Finance and Agent-BasedArtificial Markets
317

2011-15 Marijn Koolen (UvA)
The Meaning of Structure: the Valueof Link Evidence for InformationRetrieval
2011-16 Maarten Schadd (UM)
Selective Search in Games of Differ-ent Complexity
2011-17 Jiyin He (UVA)
Exploring Topic Structure: Coher-ence, Diversity and Relatedness
2011-18 Mark Ponsen (UM)
Strategic Decision-Making in com-plex games
2011-19 Ellen Rusman (OU)
The Mind ’ s Eye on Personal Pro-files
2011-20 Qing Gu (VU)
Guiding service-oriented softwareengineering - A view-based approach
2011-21 Linda Terlouw (TUD)
Modularization and Specification ofService-Oriented Systems
2011-22 Junte Zhang (UVA)
System Evaluation of Archival De-scription and Access
2011-23 Wouter Weerkamp (UVA)
Finding People and their Utterancesin Social Media
2011-24 Herwin van Welbergen (UT)
Behavior Generation for Interper-sonal Coordination with VirtualHumans On Specifying, Schedulingand Realizing Multimodal VirtualHuman Behavior
2011-25 Syed Waqar ul Qounain Jaffry(VU)
Analysis and Validation of Modelsfor Trust Dynamics
2011-26 Matthijs Aart Pontier (VU)
Virtual Agents for Human Comm-unication - Emotion Regulation andInvolvement-Distance Trade-Offs inEmbodied Conversational Agentsand Robots
2011-27 Aniel Bhulai (VU)
Dynamic website optimizationthrough autonomous managementof design patterns
2011-28 Rianne Kaptein (UVA)
Effective Focused Retrieval by Ex-ploiting Query Context and Docu-ment Structure
2011-29 Faisal Kamiran (TUE)
Discrimination-aware Classification
2011-30 Egon van den Broek (UT)
Affective Signal Processing (ASP):Unraveling the mystery of emotions
2011-31 Ludo Waltman (EUR)
Computational and Game-TheoreticApproaches for Modeling BoundedRationality
2011-32 Nees-Jan van Eck (EUR)
Methodological Advances in Biblio-metric Mapping of Science
2011-33 Tom van der Weide (UU)
Arguing to Motivate Decisions
2011-34 Paolo Turrini (UU)
Strategic Reasoning in Interdepen-dence: Logical and Game-theoreticalInvestigations
318

2011-35 Maaike Harbers (UU)
Explaining Agent Behavior in Vir-tual Training
2011-36 Erik van der Spek (UU)
Experiments in serious game design:a cognitive approach
2011-37 Adriana Burlutiu (RUN)
Machine Learning for Pairwise Data,Applications for Preference Learningand Supervised Network Inference
2011-38 Nyree Lemmens (UM)
Bee-inspired Distributed Optimiza-tion
2011-39 Joost Westra (UU)
Organizing Adaptation using Agentsin Serious Games
2011-40 Viktor Clerc (VU)
Architectural Knowledge Manage-ment in Global Software Develop-ment
2011-41 Luan Ibraimi (UT)
Cryptographically Enforced Dis-tributed Data Access Control
2011-42 Michal Sindlar (UU)
Explaining Behavior through MentalState Attribution
2011-43 Henk van der Schuur (UU)
Process Improvement through Soft-ware Operation Knowledge
2011-44 Boris Reuderink (UT)
Robust Brain-Computer Interfaces
2011-45 Herman Stehouwer (UvT)
Statistical Language Models for Al-ternative Sequence Selection
2011-46 Beibei Hu (TUD)
Towards Contextualized InformationDelivery: A Rule-based Architec-ture for the Domain of Mobile PoliceWork
2011-47 Azizi Bin Ab Aziz (VU)
Exploring Computational Models forIntelligent Support of Persons withDepression
2011-48 Mark Ter Maat (UT)
Response Selection and Turn-takingfor a Sensitive Artificial ListeningAgent
2011-49 Andreea Niculescu (UT)
Conversational interfaces for task-oriented spoken dialogues: designaspects influencing interaction qual-ity
20122012-01 Terry Kakeeto (UvT)
Relationship Marketing for SMEs inUganda
2012-02 Muhammad Umair (VU)
Adaptivity, emotion, and Rational-ity in Human and Ambient AgentModels
2012-03 Adam Vanya (VU)
Supporting Architecture Evolutionby Mining Software Repositories
2012-04 Jurriaan Souer (UU)
Development of Content Manage-ment System-based Web Applica-tions
2012-05 Marijn Plomp (UU)
Maturing Interorganisational Infor-mation Systems
319

2012-06 Wolfgang Reinhardt (OU)
Awareness Support for KnowledgeWorkers in Research Networks
2012-07 Rianne van Lambalgen (VU)
When the Going Gets Tough: Explor-ing Agent-based Models of HumanPerformance under Demanding Con-ditions
2012-08 Gerben de Vries (UVA)
Kernel Methods for Vessel Trajecto-ries
2012-09 Ricardo Neisse (UT)
Trust and Privacy Management Sup-port for Context-Aware Service Plat-forms
2012-10 David Smits (TUE)
Towards a Generic Distributed Adap-tive Hypermedia Environment
2012-11 J.C.B. Rantham Prabhakara(TUE)
Process Mining in the Large: Prepro-cessing, Discovery, and Diagnostics
2012-12 Kees van der Sluijs (TUE)
Model Driven Design and Data Inte-gration in Semantic Web InformationSystems
2012-13 Suleman Shahid (UvT)
Fun and Face: Exploring non-verbalexpressions of emotion during playfulinteractions
2012-14 Evgeny Knutov (TUE)
Generic Adaptation Framework forUnifying Adaptive Web-based Sys-tems
2012-15 Natalie van der Wal (VU)
Social Agents. Agent-Based Mod-elling of Integrated Internal andSocial Dynamics of Cognitive andAffective Processes
2012-16 Fiemke Both (VU)
Helping people by understandingthem - Ambient Agents supportingtask execution and depression treat-ment
2012-17 Amal Elgammal (UvT)
Towards a Comprehensive Frame-work for Business Process Compli-ance
2012-18 Eltjo Poort (VU)
Improving Solution ArchitectingPractices
2012-19 Helen Schonenberg (TUE)
What’s Next? Operational Supportfor Business Process Execution
2012-20 Ali Bahramisharif (RUN)
Covert Visual Spatial Attention,a Robust Paradigm for Brain-Computer Interfacing
2012-21 Roberto Cornacchia (TUD)
Querying Sparse Matrices for Infor-mation Retrieval
2012-22 Thijs Vis (UvT)
Intelligence, politie en veiligheidsdi-enst: verenigbare grootheden?
2012-23 Christian Muehl (UT)
Toward Affective Brain-ComputerInterfaces: Exploring the Neurophysi-ology of Affect during Human MediaInteraction
2012-24 Laurens van der Werff (UT)
Evaluation of Noisy Transcripts forSpoken Document Retrieval
2012-25 Silja Eckartz (UT)
Managing the Business Case Devel-opment in Inter-Organizational ITProjects: A Methodology and itsApplication
320

2012-26 Emile de Maat (UVA)
Making Sense of Legal Text
2012-27 Hayrettin Gurkok (UT)
Mind the Sheep! User ExperienceEvaluation & Brain-Computer Inter-face Games
2012-28 Nancy Pascall (UvT)
Engendering Technology EmpoweringWomen
2012-29 Almer Tigelaar (UT)
Peer-to-Peer Information Retrieval
2012-30 Alina Pommeranz (TUD)
Designing Human-Centered Systemsfor Reflective Decision Making
2012-31 Emily Bagarukayo (RUN)
A Learning by Construction Ap-proach for Higher Order CognitiveSkills Improvement, Building Capac-ity and Infrastructure
2012-32 Wietske Visser (TUD)
Qualitative multi-criteria preferencerepresentation and reasoning
2012-33 Rory Sie (OUN)
Coalitions in Cooperation Networks(COCOON)
2012-34 Pavol Jancura (RUN)
Evolutionary analysis in PPI net-works and applications
2012-35 Evert Haasdijk (VU)
Never Too Old To Learn – On-lineEvolution of Controllers in Swarm-and Modular Robotics
2012-36 Denis Ssebugwawo (RUN)
Analysis and Evaluation of Collabo-rative Modeling Processes
2012-37 Agnes Nakakawa (RUN)
A Collaboration Process for Enter-prise Architecture Creation
2012-38 Selmar Smit (VU)
Parameter Tuning and ScientificTesting in Evolutionary Algorithms
2012-39 Hassan Fatemi (UT)
Risk-aware design of value and coor-dination networks
2012-40 Agus Gunawan (UvT)
Information Access for SMEs in In-donesia
2012-41 Sebastian Kelle (OU)
Game Design Patterns for Learning
2012-42 Dominique Verpoorten (OU)
Reflection Amplifiers in self-regulated Learning
2012-43
Withdrawn
2012-44 Anna Tordai (VU)
On Combining Alignment Techniques
2012-45 Benedikt Kratz (UvT)
A Model and Language for Business-aware Transactions
2012-46 Simon Carter (UVA)
Exploration and Exploitation of Mul-tilingual Data for Statistical MachineTranslation
2012-47 Manos Tsagkias (UVA)
Mining Social Media: Tracking Con-tent and Predicting Behavior
2012-48 Jorn Bakker (TUE)
Handling Abrupt Changes in Evolv-ing Time-series Data
321
2012-49 Michael Kaisers (UM)
Learning against Learning - Evolu-tionary dynamics of reinforcementlearning algorithms in strategic inter-actions
2012-50 Steven van Kervel (TUD)
Ontologogy driven Enterprise Infor-mation Systems Engineering
2012-51 Jeroen de Jong (TUD)
Heuristics in Dynamic Sceduling;a practical framework with a casestudy in elevator dispatching
20132013-01 Viorel Milea (EUR)
News Analytics for Financial Deci-sion Support
2013-02 Erietta Liarou (CWI)
MonetDB/DataCell: Leveraging theColumn-store Database Technologyfor Efficient and Scalable StreamProcessing
2013-03 Szymon Klarman (VU)
Reasoning with Contexts in Descrip-tion Logics
2013-04 Chetan Yadati (TUD)
Coordinating autonomous planningand scheduling
2013-05 Dulce Pumareja (UT)
Groupware Requirements EvolutionsPatterns
2013-06 Romulo Goncalves (CWI)
The Data Cyclotron: Juggling Dataand Queries for a Data WarehouseAudience
2013-07 Giel van Lankveld (UvT)
Quantifying Individual Player Differ-ences
2013-08 Robbert-Jan Merk (VU)
Making enemies: cognitive modelingfor opponent agents in fighter pilotsimulators
2013-09 Fabio Gori (RUN)
Metagenomic Data Analysis: Compu-tational Methods and Applications
2013-10 Jeewanie JayasingheArachchige (UvT)
A Unified Modeling Framework forService Design.
2013-11 Evangelos Pournaras (TUD)
Multi-level Reconfigurable Self-organization in Overlay Services
2013-12 Marian Razavian (VU)
Knowledge-driven Migration to Ser-vices
2013-13 Mohammad Safiri (UT)
Service Tailoring: User-centric cre-ation of integrated IT-based home-care services to support independentliving of elderly
2013-14 Jafar Tanha (UVA)
Ensemble Approaches to Semi-Supervised Learning Learning
2013-15 Daniel Hennes (UM)
Multiagent Learning - DynamicGames and Applications
2013-16 Eric Kok (UU)
Exploring the practical benefits ofargumentation in multi-agent deliber-ation
2013-17 Koen Kok (VU)
The PowerMatcher: Smart Coordina-tion for the Smart Electricity Grid
322
2013-18 Jeroen Janssens (UvT)
Outlier Selection and One-Class Clas-sification
2013-19 Renze Steenhuizen (TUD)
Coordinated Multi-Agent Planningand Scheduling
2013-20 Katja Hofmann (UvA)
Fast and Reliable Online Learning toRank for Information Retrieval
2013-21 Sander Wubben (UvT)
Text-to-text generation by monolin-gual machine translation
2013-22 Tom Claassen (RUN)
Causal Discovery and Logic
2013-23 Patricio de Alencar Silva(UvT)
Value Activity Monitoring
2013-24 Haitham Bou Ammar (UM)
Automated Transfer in Reinforce-ment Learning
2013-25 Agnieszka AnnaLatoszek-Berendsen (UM)
Intention-based Decision Support.A new way of representing and im-plementing clinical guidelines in aDecision Support System
2013-26 Alireza Zarghami (UT)
Architectural Support for DynamicHomecare Service Provisioning
2013-27 Mohammad Huq (UT)
Inference-based Framework Manag-ing Data Provenance
2013-28 Frans van der Sluis (UT)
When Complexity becomes Interest-ing: An Inquiry into the InformationeXperience
2013-29 Iwan de Kok (UT)
Listening Heads
2013-30 Joyce Nakatumba (TUE)
Resource-Aware Business ProcessManagement: Analysis and Support
2013-31 Dinh Khoa Nguyen (UvT)
Blueprint Model and Language forEngineering Cloud Applications
2013-32 Kamakshi Rajagopal (OUN)
Networking For Learning; The roleof Networking in a Lifelong Learner’sProfessional Development
2013-33 Qi Gao (TUD)
User Modeling and Personalizationin the Microblogging Sphere
2013-34 Kien Tjin-Kam-Jet (UT)
Distributed Deep Web Search
2013-35 Abdallah El Ali (UvA)
Minimal Mobile Human ComputerInteraction
2013-36 Than Lam Hoang (TUe)
Pattern Mining in Data Streams
2013-37 Dirk Börner (OUN)
Ambient Learning Displays
2013-38 Eelco den Heijer (VU)
Autonomous Evolutionary Art
2013-39 Joop de Jong (TUD)
A Method for Enterprise Ontologybased Design of Enterprise Informa-tion Systems
2013-40 Pim Nijssen (UM)
Monte-Carlo Tree Search for Multi-Player Games
323
2013-41 Jochem Liem (UVA)
Supporting the Conceptual Mod-elling of Dynamic Systems: A Knowl-edge Engineering Perspective onQualitative Reasoning
2013-42 Léon Planken (TUD)
Algorithms for Simple Temporal Rea-soning
2013-43 Marc Bron (UVA)
Exploration and Contextualizationthrough Interaction and Concepts
20142014-01 Nicola Barile (UU)
Studies in Learning Monotone Mod-els from Data
2014-02 Fiona Tuliyano (RUN)
Combining System Dynamics with aDomain Modeling Method
2014-03 Sergio Raul Duarte Torres(UT)
Information Retrieval for Children:Search Behavior and Solutions
2014-04 Hanna Jochmann-Mannak(UT)
Websites for children: search strate-gies and interface design - Threestudies on children’s search perfor-mance and evaluation
2014-05 Jurriaan van Reijsen (UU)
Knowledge Perspectives on Advanc-ing Dynamic Capability
2014-06 Damian Tamburri (VU)
Supporting Networked Software De-velopment
2014-07 Arya Adriansyah (TUE)
Aligning Observed and Modeled Be-havior
2014-08 Samur Araujo (TUD)
Data Integration over Distributedand Heterogeneous Data Endpoints
2014-09 Philip Jackson (UvT)
Toward Human-Level Artificial In-telligence: Representation and Com-putation of Meaning in Natural Lan-guage
2014-10 Ivan Salvador Razo Zapata(VU)
Service Value Networks
2014-11 Janneke van der Zwaan(TUD)
An Empathic Virtual Buddy for So-cial Support
2014-12 Willem van Willigen (VU)
Look Ma, No Hands: Aspects of Au-tonomous Vehicle Control
2014-13 Arlette van Wissen (VU)
Agent-Based Support for BehaviorChange: Models and Applications inHealth and Safety Domains
2014-14 Yangyang Shi (TUD)
Language Models With Meta-information
2014-15 Natalya Mogles (VU)
Agent-Based Analysis and Supportof Human Functioning in ComplexSocio-Technical Systems: Applica-tions in Safety and Healthcare
2014-16 Krystyna Milian (VU)
Supporting trial recruitment and de-sign by automatically interpretingeligibility criteria
324

2014-17 Kathrin Dentler (VU)
Computing healthcare quality in-dicators automatically: SecondaryUse of Patient Data and SemanticInteroperability
2014-18 Mattijs Ghijsen (VU)
Methods and Models for the Designand Study of Dynamic Agent Organi-zations
2014-19 Vinicius Ramos (TUE)
Adaptive Hypermedia Courses: Qual-itative and Quantitative Evaluationand Tool Support
2014-20 Mena Habib (UT)
Named Entity Extraction and Dis-ambiguation for Informal Text: TheMissing Link
2014-21 Kassidy Clark (TUD)
Negotiation and Monitoring in OpenEnvironments
2014-22 Marieke Peeters (UU)
Personalized Educational Games -Developing agent-supported scenario-based training
2014-23 Eleftherios Sidirourgos(UvA/CWI)
Space Efficient Indexes for the BigData Era
2014-24 Davide Ceolin (VU)
Trusting Semi-structured Web Data
2014-25 Martijn Lappenschaar (RUN)
New network models for the analysisof disease interaction
2014-26 Tim Baarslag (TUD)
What to Bid and When to Stop
2014-27 Rui Jorge Almeida (EUR)
Conditional Density Models Integrat-ing Fuzzy and Probabilistic Repre-sentations of Uncertainty
2014-28 Anna Chmielowiec (VU)
Decentralized k-Clique Matching
2014-29 Jaap Kabbedijk (UU)
Variability in Multi-Tenant Enter-prise Software
2014-30 Peter de Cock (UvT)
Anticipating Criminal Behaviour
2014-31 Leo van Moergestel (UU)
Agent Technology in Agile Multi-parallel Manufacturing and ProductSupport
2014-32 Naser Ayat (UvA)
On Entity Resolution in ProbabilisticData
2014-33 Tesfa Tegegne (RUN)
Service Discovery in eHealth
2014-34 Christina Manteli (VU)
The Effect of Governance in GlobalSoftware Development: AnalyzingTransactive Memory Systems.
2014-35 Joost van Ooijen (UU)
Cognitive Agents in Virtual Worlds:A Middleware Design Approach
2014-36 Joos Buijs (TUE)
Flexible Evolutionary Algorithms forMining Structured Process Models
2014-37 Maral Dadvar (UT)
Experts and Machines UnitedAgainst Cyberbullying
2014-38 Danny Plass-Oude Bos (UT)
Making brain-computer interfacesbetter: improving usability throughpost-processing.
325

2014-39 Jasmina Maric (UvT)
Web Communities, Immigration, andSocial Capital
2014-40 Walter Omona (RUN)
A Framework for Knowledge Manage-ment Using ICT in Higher Education
2014-41 Frederic Hogenboom (EUR)
Automated Detection of FinancialEvents in News Text
2014-42 Carsten Eijckhof (CWI/TUD)
Contextual Multidimensional Rele-vance Models
2014-43 Kevin Vlaanderen (UU)
Supporting Process Improvementusing Method Increments
2014-44 Paulien Meesters (UvT)
Intelligent Blauw. Met als ondertitel:Intelligence-gestuurde politiezorg ingebiedsgebonden eenheden.
2014-45 Birgit Schmitz (OUN)
Mobile Games for Learning: APattern-Based Approach
2014-46 Ke Tao (TUD)
Social Web Data Analytics: Rele-vance, Redundancy, Diversity
2014-47 Shangsong Liang (UVA)
Fusion and Diversification in Infor-mation Retrieval
20152015-01 Niels Netten (UvA)
Machine Learning for Relevance ofInformation in Crisis Response
2015-02 Faiza Bukhsh (UvT)
Smart auditing: Innovative Compli-ance Checking in Customs Controls
2015-03 Twan van Laarhoven (RUN)
Machine learning for network data
2015-04 Howard Spoelstra (OUN)
Collaborations in Open LearningEnvironments
2015-05 Christoph Bösch (UT)
Cryptographically Enforced SearchPattern Hiding
2015-06 Farideh Heidari (TUD)
Business Process Quality Computa-tion - Computing Non-FunctionalRequirements to Improve BusinessProcesses
2015-07 Maria-Hendrike Peetz (UvA)
Time-Aware Online Reputation Anal-ysis
2015-08 Jie Jiang (TUD)
Organizational Compliance: Anagent-based model for designing andevaluating organizational interactions
2015-09 Randy Klaassen (UT)
HCI Perspectives on BehaviorChange Support Systems
2015-10 Henry Hermans (OUN)
OpenU: design of an integrated sys-tem to support lifelong learning
2015-11 Yongming Luo (TUE)
Designing algorithms for big graphdatasets: A study of computingbisimulation and joins
2015-12 Julie M. Birkholz (VU)
Modi Operandi of Social NetworkDynamics: The Effect of Context onScientific Collaboration Networks
2015-13 Giuseppe Procaccianti (VU)
Energy-Efficient Software
326

2015-14 Bart van Straalen (UT)
A cognitive approach to modelingbad news conversations
2015-15 Klaas Andries de Graaf (VU)
Ontology-based Software Architec-ture Documentation
2015-16 Changyun Wei (UT)
Cognitive Coordination for Coopera-tive Multi-Robot Teamwork
2015-17 André van Cleeff (UT)
Physical and Digital Security Mecha-nisms: Properties, Combinations andTrade-offs
2015-18 Holger Pirk (CWI)
Waste Not, Want Not! - ManagingRelational Data in Asymmetric Mem-ories
2015-19 Bernardo Tabuenca (OUN)
Ubiquitous Technology for LifelongLearners
2015-20 Loïs Vanhée (UU)
Using Culture and Values to SupportFlexible Coordination
2015-21 Sibren Fetter (OUN)
Using Peer-Support to Expand andStabilize Online Learning
2015-22 Zhemin Zhu (UT)
Co-occurrence Rate Networks
2015-23 Luit Gazendam (VU)
Cataloguer Support in Cultural Her-itage
2015-24 Richard Berendsen (UVA)
Finding People, Papers, and Posts:Vertical Search Algorithms and Eval-uation
2015-25 Steven Woudenberg (UU)
Bayesian Tools for Early DiseaseDetection
2015-26 Alexander Hogenboom (EUR)
Sentiment Analysis of Text Guidedby Semantics and Structure
2015-27 Sándor Héman (CWI)
Updating compressed column-stores
2015-28 Janet Bagorogoza (TiU)
Knowledge Management and HighPerformance; The Uganda FinancialInstitutions Model for HPO
2015-29 Hendrik Baier (UM)
Monte-Carlo Tree Search Enhance-ments for One-Player and Two-Player Domains
2015-30 Kiavash Bahreini (OUN)
Real-time Multimodal EmotionRecognition in E-Learning
2015-31 Yakup Koç (TUD)
On Robustness of Power Grids
2015-32 Jerome Gard (UL)
Corporate Venture Management inSMEs
2015-33 Frederik Schadd (UM)
Ontology Mapping with AuxiliaryResources
2015-34 Victor de Graaff (UT)
Geosocial Recommender Systems
2015-35 Junchao Xu (TUD)
Affective Body Language of Hu-manoid Robots: Perception andEffects in Human Robot Interaction
327

20162016-01 Syed Saiden Abbas (RUN)
Recognition of Shapes by Humansand Machines
2016-02 Michiel Christiaan Meulendijk(UU)
Optimizing medication reviewsthrough decision support: prescribinga better pill to swallow
2016-03 Maya Sappelli (RUN)
Knowledge Work in Context: UserCentered Knowledge Worker Support
2016-04 Laurens Rietveld (VU)
Publishing and Consuming LinkedData
2016-05 Evgeny Sherkhonov (UVA)
Expanded Acyclic Queries: Contain-ment and an Application in Explain-ing Missing Answers
2016-06 Michel Wilson (TUD)
Robust scheduling in an uncertainenvironment
2016-07 Jeroen de Man (VU)
Measuring and modeling negativeemotions for virtual training
2016-08 Matje van de Camp (TiU)
A Link to the Past: ConstructingHistorical Social Networks from Un-structured Data
2016-09 Archana Nottamkandath (VU)
Trusting Crowdsourced Informationon Cultural Artefacts
2016-10 George Karafotias (VUA)
Parameter Control for EvolutionaryAlgorithms
2016-11 Anne Schuth (UVA)
Search Engines that Learn fromTheir Users
2016-12 Max Knobbout (UU)
Logics for Modelling and VerifyingNormative Multi-Agent Systems
2016-13 Nana Baah Gyan (VU)
The Web, Speech Technologies andRural Development in West Africa -An ICT4D Approach
2016-14 Ravi Khadka (UU)
Revisiting Legacy Software SystemModernization
2016-15 Steffen Michels (RUN)
Hybrid Probabilistic Logics - The-oretical Aspects, Algorithms andExperiments
2016-16 Guangliang Li (UVA)
Socially Intelligent AutonomousAgents that Learn from Human Re-ward
2016-17 Berend Weel (VU)
Towards Embodied Evolution ofRobot Organisms
2016-18 Albert Meroño Peñuela (VU)
Refining Statistical Data on the Web
2016-19 Julia Efremova (Tu/e)
Mining Social Structures from Ge-nealogical Data
2016-20 Daan Odijk (UVA)
Context & Semantics in News &Web Search
2016-21 Alejandro Moreno Célleri(UT)
From Traditional to InteractivePlayspaces: Automatic Analysis ofPlayer Behavior in the InteractiveTag Playground
328

2016-22 Grace Lewis (VU)
Software Architecture Strategies forCyber-Foraging Systems
2016-23 Fei Cai (UVA)
Query Auto Completion in Informa-tion Retrieval
2016-24 Brend Wanders (UT)
Repurposing and Probabilistic In-tegration of Data; An Iterative anddata model independent approach
2016-25 Julia Kiseleva (TU/e)
Using Contextual Information toUnderstand Searching and BrowsingBehavior
2016-26 Dilhan Thilakarathne (VU)
In or Out of Control: ExploringComputational Models to Study theRole of Human Awareness and Con-trol in Behavioural Choices, withApplications in Aviation and EnergyManagement Domains
2016-27 Wen Li (TUD)
Understanding Geo-spatial Informa-tion on Social Media
2016-28 Mingxin Zhang (TUD)
Large-scale Agent-based Social Simu-lation - A study on epidemic predic-tion and control
2016-29 Nicolas Höning (TUD)
Peak reduction in decentralised elec-tricity systems - Markets and pricesfor flexible planning
2016-30 Ruud Mattheij (UvT)
The Eyes Have It
2016-31 Mohammad Khelghati (UT)
Deep web content monitoring
2016-32 Eelco Vriezekolk (UT)
Assessing Telecommunication ServiceAvailability Risks for Crisis Organisa-tions
2016-33 Peter Bloem (UVA)
Single Sample Statistics, exercises inlearning from just one example
2016-34 Dennis Schunselaar (TUE)
Configurable Process Trees: Elicita-tion, Analysis, and Enactment
2016-35 Zhaochun Ren (UVA)
Monitoring Social Media: Summa-rization, Classification and Recom-mendation
2016-36 Daphne Karreman (UT)
Beyond R2D2: The design of nonver-bal interaction behavior optimizedfor robot-specific morphologies
2016-37 Giovanni Sileno (UvA)
Aligning Law and Action - a concep-tual and computational inquiry
2016-38 Andrea Minuto (UT)
Materials that Matter - Smart Mate-rials meet Art & Interaction Design
2016-39 Merijn Bruijnes (UT)
Believable Suspect Agents; Responseand Interpersonal Style Selection foran Artificial Suspect
2016-40 Christian Detweiler (TUD)
Accounting for Values in Design
2016-41 Thomas King (TUD)
Governing Governance: A FormalFramework for Analysing Institu-tional Design and Enactment Gover-nance
2016-42 Spyros Martzoukos (UVA)
Combinatorial and CompositionalAspects of Bilingual Aligned Corpora
329

2016-43 Saskia Koldijk (RUN)
Context-Aware Support for StressSelf-Management: From Theory toPractice
2017-44 Thibault Sellam (UVA)
Automatic Assistants for DatabaseExploration
2016-45 Bram van de Laar (UT)
Experiencing Brain-Computer Inter-face Control
2016-46 Jorge Gallego Perez (UT)
Robots to Make you Happy
2016-47 Christina Weber (UL)
Real-time foresight - Preparednessfor dynamic innovation networks
2016-48 Tanja Buttler (TUD)
Collecting Lessons Learned
2016-49 Gleb Polevoy (TUD)
Participation and Interaction inProjects. A Game-Theoretic Anal-ysis
2016-50 Yan Wang (UVT)
The Bridge of Dreams: Towards aMethod for Operational PerformanceAlignment in IT-enabled ServiceSupply Chains
20172017-01 Jan-Jaap Oerlemans (UL)
Investigating Cybercrime
2017-02 Sjoerd Timmer (UU)
Designing and Understanding Foren-sic Bayesian Networks using Argu-mentation
2017-03 Daniël Harold Telgen (UU)
Grid Manufacturing; A Cyber-Physical Approach with AutonomousProducts and Reconfigurable Manu-facturing Machines
2017-04 Mrunal Gawade (CWI)
Multi-core Parallelism in a Column-store
2017-05 Mahdieh Shadi (UVA)
Collaboration Behavior
2017-06 Damir Vandic (EUR)
Intelligent Information Systems forWeb Product Search
2017-07 Roel Bertens (UU)
Insight in Information: from Ab-stract to Anomaly
2017-08 Rob Konijn (VU)
Detecting Interesting Differ-ences:Data Mining in Health Insur-ance Data using Outlier Detectionand Subgroup Discovery
2017-09 Dong Nguyen (UT)
Text as Social and Cultural Data: AComputational Perspective on Varia-tion in Text
2017-10 Robby van Delden (UT)
(Steering) Interactive Play Behavior
2017-11 Florian Kunneman (RUN)
Modelling patterns of time and emo-tion in Twitter #anticipointment
2017-12 Sander Leemans (TUE)
Robust Process Mining with Guaran-tees
2017-13 Gijs Huisman (UT)
Social Touch Technology - Extend-ing the reach of social touch throughhaptic technology
330

2017-14 Shoshannah Tekofsky (UvT)
You Are Who You Play You Are:Modelling Player Traits from VideoGame Behavior
2017-15 Peter Berck (RUN)
Memory-Based Text Correction
2017-16 Aleksandr Chuklin (UVA)
Understanding and Modeling Usersof Modern Search Engines
2017-17 Daniel Dimov (UL)
Crowdsourced Online Dispute Reso-lution
2017-18 Ridho Reinanda (UVA)
Entity Associations for Search
2017-19 Jeroen Vuurens (UT)
Proximity of Terms, Texts and Se-mantic Vectors in Information Re-trieval
2017-20 Mohammadbashir Sedighi(TUD)
Fostering Engagement in KnowledgeSharing: The Role of Perceived Bene-fits, Costs and Visibility
2017-21 Jeroen Linssen (UT)
Meta Matters in Interactive Story-telling and Serious Gaming (A Playon Worlds)
2017-22 Sara Magliacane (VU)
Logics for causal inference underuncertainty
2017-23 David Graus (UVA)
Entities of Interest — Discovery inDigital Traces
2017-24 Chang Wang (TUD)
Use of Affordances for EfficientRobot Learning
2017-25 Veruska Zamborlini (VU)
Knowledge Representation for Clini-cal Guidelines, with applications toMultimorbidity Analysis and Litera-ture Search
2017-26 Merel Jung (UT)
Socially intelligent robots that under-stand and respond to human touch
2017-27 Michiel Joosse (UT)
Investigating Positioning and GazeBehaviors of Social Robots: People’sPreferences, Perceptions and Behav-iors
2017-28 John Klein (VU)
Architecture Practices for ComplexContexts
2017-29 Adel Alhuraibi (UvT)
From IT-BusinessStrategic Align-ment to Performance: A ModeratedMediation Model of Social Innova-tion, and Enterprise Governance ofIT"
2017-30 Wilma Latuny (UvT)
The Power of Facial Expressions
2017-31 Ben Ruijl (UL)
Advances in computational methodsfor QFT calculations
2017-32 Thaer Samar (RUN)
Access to and Retrievability of Con-tent in Web Archives
2017-33 Brigit van Loggem (OU)
Towards a Design Rationale for Soft-ware Documentation: A Model ofComputer-Mediated Activity
2017-34 Maren Scheffel (OU)
The Evaluation Framework for Learn-ing Analytics
331

2017-35 Martine de Vos (VU)
Interpreting natural science spread-sheets
2017-36 Yuanhao Guo (UL)
Shape Analysis for Phenotype Char-acterisation from High-throughputImaging
2017-37 Alejandro Montes Garcia(TUE)
WiBAF: A Within Browser Adapta-tion Framework that Enables Controlover Privacy
2017-38 Alex Kayal (TUD)
Normative Social Applications
2017-39 Sara Ahmadi (RUN)
Exploiting properties of the humanauditory system and compressivesensing methods to increase noiserobustness in ASR
2017-40 Altaf Hussain Abro (VUA)
Steer your Mind: ComputationalExploration of Human Control inRelation to Emotions, Desires andSocial Support For applications inhuman-aware support systems
2017-41 Adnan Manzoor (VUA)
Minding a Healthy Lifestyle: An Ex-ploration of Mental Processes anda Smart Environment to ProvideSupport for a Healthy Lifestyle
2017-42 Elena Sokolova (RUN)
Causal discovery from mixed andmissing data with applications onADHD datasets
2017-43 Maaike de Boer (RUN)
Semantic Mapping in Video Retrieval
2017-44 Garm Lucassen (UU)
Understanding User Stories - Compu-tational Linguistics in Agile Require-ments Engineering
2017-45 Bas Testerink (UU)
Decentralized Runtime Norm En-forcement
2017-46 Jan Schneider (OU)
Sensor-based Learning Support
2017-47 Jie Yang (TUD)
Crowd Knowledge Creation Accelera-tion
2017-48 Angel Suarez (OU)
Collaborative inquiry-based learning
20182018-01 Han van der Aa (VUA)
Comparing and Aligning ProcessRepresentations
2018-02 Felix Mannhardt (TUE)
Multi-perspective Process Mining
2018-03 Steven Bosems (UT)
Causal Models For Well-Being:Knowledge Modeling, Model-DrivenDevelopment of Context-Aware Ap-plications, and Behavior Prediction
2018-04 Jordan Janeiro (TUD)
Flexible Coordination Support forDiagnosis Teams in Data-CentricEngineering Tasks
2018-05 Hugo Huurdeman (UVA)
Supporting the Complex Dynamicsof the Information Seeking Process
2018-06 Dan Ionita (UT)
Model-Driven Information SecurityRisk Assessment of Socio-TechnicalSystems
332

2018-07 Jieting Luo (UU)
A formal account of opportunism inmulti-agent systems
2018-08 Rick Smetsers (RUN)
Advances in Model Learning for Soft-ware Systems
2018-09 Xu Xie (TUD)
Data Assimilation in Discrete EventSimulations
2018-10 Julienka Mollee (VUA)
Moving forward: supporting physi-cal activity behavior change throughintelligent technology
2018-11 Mahdi Sargolzaei (UVA)
Enabling Framework for Service-oriented Collaborative Networks
2018-12 Xixi Lu (TUE)
Using behavioral context in processmining
2018-13 Seyed Amin Tabatabaei(VUA)
Computing a Sustainable Future
2018-14 Bart Joosten (UVT)
Detecting Social Signals with Spa-tiotemporal Gabor Filters
2018-15 Naser Davarzani (UM)
Biomarker discovery in heart failure
2018-16 Jaebok Kim (UT)
Automatic recognition of engagementand emotion in a group of children
2018-17 Jianpeng Zhang (TUE)
On Graph Sample Clustering
2018-18 Henriette Nakad (UL)
De Notaris en Private Rechtspraak
2018-19 Minh Duc Pham (VUA)
Emergent relational schemas forRDF
2018-20 Manxia Liu (RUN)
Time and Bayesian Networks
2018-21 Aad Slootmaker (OUN)
EMERGO: a generic platform forauthoring and playing scenario-basedserious games
2018-22 Eric Fernandes de MelloAraujo (VUA)
Contagious: Modeling the Spread ofBehaviours, Perceptions and Emo-tions in Social Networks
2018-23 Kim Schouten (EUR)
Semantics-driven Aspect-Based Senti-ment Analysis
2018-24 Jered Vroon (UT)
Responsive Social Positioning Be-haviour for Semi-Autonomous Telep-resence Robots
2018-25 Riste Gligorov (VUA)
Serious Games in Audio-Visual Col-lections
2018-26 Roelof Anne Jelle de Vries(UT)
Theory-Based and Tailor-Made: Mo-tivational Messages for BehaviorChange Technology
2018-27 Maikel Leemans (TUE)
Hierarchical Process Mining for Scal-able Software Analysis
2018-28 Christian Willemse (UT)
Social Touch Technologies: How theyfeel and how they make you feel
333
2018-29 Yu Gu (UVT)
Emotion Recognition from MandarinSpeech
2018-30 Wouter Beek (VU)
The "K" in "semantic web" standsfor "knowledge": scaling semanticsto the web
20192019-01 Rob van Eijk (UL)
Comparing and Aligning ProcessRepresentations
2019-02 Emmanuelle Beauxis Aussalet(CWI, UU)
Statistics and Visualizations for As-sessing Class Size Uncertainty
2019-03 Eduardo Gonzalez Lopez deMurillas (TUE)
Process Mining on Databases: Ex-tracting Event Data from Real LifeData Sources
2019-04 Ridho Rahmadi (RUN)
Finding stable causal structures fromclinical data
2019-05 Sebastiaan van Zelst (TUE)
Process Mining with Streaming Data
2019-06 Chris Dijkshoorn (VU)
Nichesourcing for Improving Accessto Linked Cultural Heritage Datasets
2019-07 Soude Fazeli (TUD)
2019-08 Frits de Nijs (TUD)
Resource-constrained Multi-agentMarkov Decision Processes
2019-09 Fahimeh Alizadeh Moghaddam(UVA)
Self-adaptation for energy efficiencyin software systems
2019-10 Qing Chuan Ye (EUR)
Multi-objective Optimization Meth-ods for Allocation and Prediction
2019-11 Yue Zhao (TUD)
Learning Analytics Technology toUnderstand Learner Behavioral En-gagement in MOOCs
2019-12 Jacqueline Heinerman (VU)
Better Together
2019-13 Guanliang Chen (TUD)
MOOC Analytics: Learner Modelingand Content Generation
2019-14 Daniel Davis (TUD)
Large-Scale Learning Analytics:Modeling Learner Behavior & Im-proving Learning Outcomes in Mas-sive Open Online Courses
2019-15 Erwin Walraven (TUD)
Planning under Uncertainty in Con-strained and Partially ObservableEnvironments
2019-16 Guangming Li (TUE)
Process Mining based on Object-Centric Behavioral Constraint(OCBC) Models
2019-17 Ali Hurriyetoglu (RUN)
Extracting actionable informationfrom microtexts
2019-18 Gerard Wagenaar (UU)
Artefacts in Agile Team Communi-cation
2019-19 Vincent Koeman (TUD)
Tools for Developing CognitiveAgents
334

2019-20 Chide Groenouwe (UU)
Fostering technically augmented hu-man collective intelligence
2019-21 Cong Liu (TUE)
Software Data Analytics: Architec-tural Model Discovery and DesignPattern Detection
2019-22 Martin van den Berg (VU)
Improving IT Decisions with Enter-prise Architecture
2019-23 Qin Liu (TUD)
Intelligent Control Systems: Learn-ing, Interpreting, Verification
2019-24 Anca Dumitrache (VU)
Truth in Disagreement - Crowdsourc-ing Labeled Data for Natural Lan-guage Processing
2019-25 Emiel van Miltenburg (VU)
Pragmatic factors in (automatic)image description
2019-26 Prince Singh (UT)
An Integration Platform for Synchro-modal Transport
2019-27 Alessandra Antonaci (OUN)
The Gamification Design Processapplied to (Massive) Open OnlineCourses
2019-28 Esther Kuinderman (UL)
Cleared for take-off: Game-basedlearning to prepare airline pilots forcritical situations
2019-29 Daniel Formolo (VU)
Using virtual agents for simulationand training of social skills in safety-critical circumstances
2019-30 Vahid Yazdanpanah (UT)
Multiagent Industrial Symbiosis Sys-tems
2019-31 Milan Jelisavcic (VU)
Alive and Kicking: Baby Steps inRobotics
2019-32 Chiara Sironi (UM)
Monte-Carlo Tree Search for Artifi-cial General Intelligence in Games
2019-33 Anil Yaman (TUE)
Evolution of Biologically InspiredLearning in Artificial Neural Net-works
2019-34 Negar Ahmadi (TUE)
EEG Microstate and FunctionalBrain Network Features for Classifi-cation of Epilepsy and PNES
2019-35 Lisa Facey-Shaw (OUN)
Gamification with digital badges inlearning programming
2019-36 Kevin Ackermans (OUN)
Designing Video-Enhanced Rubricsto Master Complex Skills
2019-37 Jian Fang (TUD)
Database Acceleration on FPGAs
2019-38 Akos Kadar (OUN)
Learning visually grounded and mul-tilingual representations
335

20202020-01 Armon Toubman (UL)
Calculated Moves: Generating AirCombat Behaviour
2020-02 Marcos de Paula Bueno (UL)
Unraveling Temporal Processes usingProbabilistic Graphical Models
2020-03 Mostafa Deghani (UvA)
Learning with Imperfect Supervisionfor Language Understanding
2020-04 Maarten van Gompel (RUN)
Context as Linguistic Bridges
2020-05 Yulong Pei (TUE)
On local and global structure mining
2020-06 Preethu Rose Anish (UT)
Stimulation Architectural Thinkingduring Requirements Elicitation - AnApproach and Tool Support
2020-07 Wim van der Vegt (OUN)
Towards a software architecture forreusable game components
2020-08 Ali Mirsoleimani (UL)
Structured Parallel Programming forMonte Carlo Tree Search
2020-09 Myriam Traub (UU)
Measuring Tool Bias and ImprovingData Quality for Digital HumanitiesResearch
2020-10 Alifah Syamsiyah (TUE)
In-database Preprocessing for Pro-cess Mining
2020-11 Sepideh Mesbah (TUD)
Semantic-Enhanced Training DataAugmentation Methods for Long-TailEntity Recognition Models
2020-12 Ward van Breda (VU)
Predictive Modeling in E-MentalHealth: Exploring Applicability inPersonalised Depression Treatment
2020-13 Marco Virgolin (CWI)
Design and Application of Gene-poolOptimal Mixing Evolutionary Algo-rithms for Genetic Programming
2020-14 Mark Raasveldt (CWI/UL)
Integrating Analytics with RelationalDatabases
2020-15 Konstantinos Georgiadis(OUN)
Smart CAT: Machine Learning forConfigurable Assessments in SeriousGames
2020-16 Ilona Wilmont (RUN)
Cognitive Aspects of ConceptualModelling
2020-17 Daniele Di Mitri (OUN)
The Multimodal Tutor: AdaptiveFeedback from Multimodal Experi-ences
2020-18 Georgios Methenitis (TUD)
Agent Interactions & Mechanismsin Markets with Uncertainties: Elec-tricity Markets in Renewable EnergySystems
2020-19 Guido van Capelleveen (UT)
Industrial Symbiosis RecommenderSystems
2020-20 Albert Hankel (VU)
Embedding Green ICT Maturity inOrganisations
2020-21 Karine da Silva Miras deAraujo (VU)
Where is the robot?: Life as it couldbe
336
2020-22 Maryam Masoud Khamis(RUN)
Understanding complex systems im-plementation through a modelingapproach: the case of e-governmentin Zanzibar
2020-23 Rianne Conijn (UT)
The Keys to Writing: A writing an-alytics approach to studying writingprocesses using keystroke logging
2020-24 Lenin da Nobrega Medeiros(VUA/RUN)
How are you feeling, human? To-wards emotionally supportive chat-bots
2020-25 Xin Du (TUE)
The Uncertainty in ExceptionalModel Mining
2020-26 Krzysztof Leszek Sadowski(UU)
GAMBIT: Genetic Algorithm forModel-Based mixed-Integer opTi-mization
2020-27 Ekaterina Muravyeva (TUD)
Personal data and informed consentin an educational context
2020-28 Bibeg Limbu (TUD)
Multimodal interaction for deliber-ate practice: Training complex skillswith augmented reality
2020-29 Ioan Gabriel Bucur (RUN)
Being Bayesian about Causal Infer-ence
2020-30 Bob Zadok Blok (UL)
Creatief, Creatieve, Creatiefst
2020-31 Gongjin Lan (VU)
Learning better – From Baby to Bet-ter
2020-32 Jason Rhuggenaath (TUE)
Revenue management in online mar-kets: pricing and online advertising
2020-33 Rick Gilsing (TUE)
Supporting service-dominant busi-ness model evaluation in the contextof business model innovation
2020-34 Anna Bon (MU)
Intervention or Collaboration? Re-designing Information and Communi-cation Technologies for Development
2020-35 Siamak Farshidi (UU)
Multi-Criteria Decision-Making inSoftware Production
20212021-01 Francisco Xavier Dos Santos
Fonseca (TUD)
Location-based Games for SocialInteraction in Public Space
2021-02 Rijk Mercuur (TUD)
Simulating Human Rou-tines:Integrating Social PracticeTheory in Agent-Based Models
2021-03 Seyyed Hadi Hashemi (UVA)
Modeling Users Interacting withSmart Devices
2021-04 Ioana Jivet (OU)
The Dashboard That Loved Me: De-signing adaptive learning analyticsfor self-regulated learning
2021-05 Davide Dell’Anna (UU)
Data-Driven Supervision of Au-tonomous Systems
2021-06 Daniel Davison (UT)
"Hey robot, what do you think?"How children learn with a socialrobot
337

2021-07 Armel Lefebvre (UU)
Research data management for openscience
2021-08 Nardie Fanchamps (OU)
The Influence of Sense-Reason-ActProgramming on ComputationalThinking
2021-09 Cristina Zaga (UT)
The Design of Robothings. Non-Anthropomorphic and Non-VerbalRobots to Promote Children’s Col-laboration Through Play
2021-10 Quinten Meertens (UvA)
Misclassification Bias in StatisticalLearning
2021-11 Anne van Rossum (UL)
Nonparametric Bayesian Methods inRobotic Vision
2021-12 Lei Pi (UL)
External Knowledge Absorption inChinese SMEs
2021-13 Bob R. Schadenberg (UT)
Robots for Autistic Children: Under-standing and Facilitating Predictabil-ity for Engagement in Learning
2021-14 Negin Samaeemofrad (UL)
Business Incubators: The Impact ofTheir Support
2021-15 Onat Ege Adali (TU/e)
Transformation of Value Propositionsinto Resource Re-Configurationsthrough the Business ServicesParadigm
2021-16 Esam A. H. Ghaleb (MU)
BIMODAL EMOTION RECOG-NITION FROM AUDIO-VISUALCUES
2021-17 Dario Dotti (UM)
Human Behavior Understandingfrom motion and bodily cues usingdeep neural networks
2021-18 Remi Wieten (UU)
Bridging the Gap Between InformalSense-Making Tools and Formal Sys-tems - Facilitating the Constructionof Bayesian Networks and Argumen-tation Frameworks
2021-19 Roberto Verdecchia (VU)
Architectural Technical Debt: Identi-fication and Management
2021-20 Masoud Mansoury (TU/e)
Understanding and Mitigating Multi-Sided Exposure Bias in Recom-mender Systems
2021-21 Pedro Thiago Timbó Holanda(CWI)
Progressive Indexes
2021-22 Sihang Qiu (TUD)
Conversational Crowdsourcing
2021-23 Hugo Manuel Proença (LI-ACS)
Robust rules for prediction and de-scription
2021-24 Kaijie Zhu (TUE)
On Efficient Temporal SubgraphQuery Processing
338
Related Documents


