Accepted Manuscript The function of targeted host genes determines the oncogenicity of HBV inte- gration in hepatocellular carcinoma Xiaojun Li, Jiangbo Zhang, Ziwei Yang, Jingting Kang, Suzhen Jiang, Ting Zhang, Tingting Chen, Meng Li, Xiangmei Chen, Malcolm A. McCrae, Hui Zhuang, Fengmin Lu PII: S0168-8278(13)00882-9 DOI: http://dx.doi.org/10.1016/j.jhep.2013.12.014 Reference: JHEPAT 4976 To appear in: Journal of Hepatology Received Date: 19 June 2013 Revised Date: 9 December 2013 Accepted Date: 10 December 2013 Please cite this article as: Li, X., Zhang, J., Yang, Z., Kang, J., Jiang, S., Zhang, T., Chen, T., Li, M., Chen, X., McCrae, M.A., Zhuang, H., Lu, F., The function of targeted host genes determines the oncogenicity of HBV integration in hepatocellular carcinoma, Journal of Hepatology (2013), doi: http://dx.doi.org/10.1016/j.jhep. 2013.12.014 This is a PDF file of an unedited manuscript that has been accepted for publication. As a service to our customers we are providing this early version of the manuscript. The manuscript will undergo copyediting, typesetting, and review of the resulting proof before it is published in its final form. Please note that during the production process errors may be discovered which could affect the content, and all legal disclaimers that apply to the journal pertain.

Welcome message from author
This document is posted to help you gain knowledge. Please leave a comment to let me know what you think about it! Share it to your friends and learn new things together.
Transcript
Accepted Manuscript
The function of targeted host genes determines the oncogenicity of HBV inte-gration in hepatocellular carcinoma
Xiaojun Li, Jiangbo Zhang, Ziwei Yang, Jingting Kang, Suzhen Jiang, TingZhang, Tingting Chen, Meng Li, Xiangmei Chen, Malcolm A. McCrae, HuiZhuang, Fengmin Lu
PII: S0168-8278(13)00882-9DOI: http://dx.doi.org/10.1016/j.jhep.2013.12.014Reference: JHEPAT 4976
To appear in: Journal of Hepatology
Received Date: 19 June 2013Revised Date: 9 December 2013Accepted Date: 10 December 2013
Please cite this article as: Li, X., Zhang, J., Yang, Z., Kang, J., Jiang, S., Zhang, T., Chen, T., Li, M., Chen, X.,McCrae, M.A., Zhuang, H., Lu, F., The function of targeted host genes determines the oncogenicity of HBVintegration in hepatocellular carcinoma, Journal of Hepatology (2013), doi: http://dx.doi.org/10.1016/j.jhep.2013.12.014
This is a PDF file of an unedited manuscript that has been accepted for publication. As a service to our customerswe are providing this early version of the manuscript. The manuscript will undergo copyediting, typesetting, andreview of the resulting proof before it is published in its final form. Please note that during the production processerrors may be discovered which could affect the content, and all legal disclaimers that apply to the journal pertain.

1
Title page 1
Title:::: 2
The function of targeted host genes determines the oncogenicity of HBV integration 3
in hepatocellular carcinoma 4
Running title: 5
The oncogenicity of HBV integration determined by targeted host genes function 6
Authors: 7
Xiaojun Li1,#, Jiangbo Zhang1,#, Ziwei Yang1, Jingting Kang1, Suzhen Jiang2, Ting 8
Zhang1, Tingting Chen
1, Meng Li
1, Xiangmei Chen
1,*, Malcolm A. McCrae
3, Hui 9
Zhuang1, FengminLu
1,* 10
Author Affiliations: 11
1 Department of Microbiology& Infectious Disease Center, School of Basic Medical 12
Sciences, Peking University Health Science Center, Beijing, P. R. China 13
2Department of Gastroenterology & Hepatology, Chinese PLA General Hospital, 14
Beijing, P. R. China 15
3The Pirbright Institute, Pirbright, UK 16
# These authors contributed equally to this work. 17
*Corresponding authors: 18
Professor Fengmin Lu, MD. and associated professor Xiangmei Chen, PhD., 19
Department of Microbiology& Infectious Disease Center, School of Basic Medical 20
Sciences, Peking University Health Science Center, 38 Xueyuan Road, Haidian 21
District, Beijing, 100191, P. R. China; 22
2
Tel: 86-10-82805136; Fax: 86-10-82805136; 23
Emails: [email protected] for Fengmin Lu and 24
[email protected] for Xiangmei Chen. 25
Electronic word count: 5,325 words (excluding abstract and references). 26
Abstract word count: 238words. 27
Number of figures and tables: 4 figures and 3 tables. 28
List of abbreviations: 29
HBV, hepatitis B virus; HCC, hepatocellular carcinoma; ITG, integration targeted 30
gene; RTG, recurrent integration targeted host genes; NGS, next generation 31
sequencing; EST, expressed sequence tag; TPM, transcripts per million; GO, gene 32
ontology; TSS, transcription state site; aCGH, array-based Comparative Genomic 33
Hybridization; T, HCC tumor derived tissues; NT, adjacent non-tumor derived tissues; 34
BCP, basic core promoter; CNV, copy number variation; IROF, integration related 35
oncogenic functions. 36
Conflict of interest: No potential conflict of interest was disclosed. 37
Financial support: This study was supported by 973 Program (Grant no. 38
2012CB518900), the National S & T Major Project for Infectious Diseases (Grant no. 39
2012ZX10004-904), the Leading Academic Discipline Project of Beijing and the 111 40
Project. 41
42

3
ABSTRACT 43
Background & Aims: Although hepatitis B virus (HBV) integration into the human 44
genome has been considered as one of the major causative factors to 45
hepatocarcinogenesis, the underlying mechanism(s) was still elusive. Here we 46
investigate the essential difference(s) of HBV integration between HCC tumor and 47
adjacent non-tumor tissues and explore the factor(s) determine the oncogenicity of 48
HBV integration. 49
Methods: 1115 HBV integration sites were collected from four recent studies. 50
Functional annotation analysis of integration targeted host genes (ITGs) were 51
performed using DAVID based on Gene Ontology and KEGG pathway databases. 52
Array-based expression profiles, real-time qPCR and western blot were used to detect 53
the expression of recurrent integration targeted genes (RTGs). The biological 54
consequences of the overexpression of UBXN8 in 8 HCC cell lines were studied in 55
vitro. 56
Results: HBV are prone to integrate in genic regions (exons, introns and promoters) 57
and gene-dense regions. Functional annotation analysis reveals that, compared to 58
those in adjacent non-tumor tissues, ITGs in HCC tumor tissues were significantly 59
enriched in functional terms related to negative regulation of cell death, transcription 60
regulation, development and differentiation, and cancer related pathways. 32% of the 61
75 RTGs identified in this analysis expressed abnormally in HCC tissues. UBXN8, 62
one of the RTGs, was identified as a new tumor suppressor candidate which functions 63
in a TP53 dependent manner. 64

4
Conclusions: The oncogenicity of HBV integration was determined, to some extend 65
by the function of HBV integration targeted host genes in HCC. 66
Keywords: 67
Hepatitis B virus; HBV integration; Hepatocellular carcinoma; functional annotation 68
analysis; UBXN8 69

5
INTRODUCTION 70
Hepatocellular carcinoma (HCC) is the third leading cause of global cancer 71
deaths [1]. Chronic infection with hepatitis B virus (HBV) is one of the major risk 72
factors for the development of HCC, particularly in China where more than 80% of 73
HCCs have been associated etiologically with HBV [2]. It has been widely recognized 74
that HBV DNA integration into the genome of hepatocytes as one of the major cause 75
of hepatocarcinogenesis [3-6]. There were two main promulgated mechanisms 76
explaining the oncogenicity of HBV integration in hepatocarcinogenesis: (1) the 77
inserted fragments of the HBV genome themselves have strong oncogenic potency 78
due to mutational changes, such as the truncation of the viral HBx protein; (2) viral 79
DNA integration promotes carcinogenic changes in the host genome, including 80
inducing chromosome instability, nearby cellular genes aberrant expression and 81
interruptions of the normal structure of host genes leading to their functional 82
aberration. Recent work from this lab has revealed that the characteristics of the 83
oncogenic elements contained in inserted HBV sequences were similar between tumor 84
and adjacent non-tumor tissues [7], suggesting the oncogenicity of HBV integration 85
resides primarily in its effects on the host genome. The potential for HBV integration 86
events to cause aberrant regulation of the expression of nearby host genes and to 87
induce vicinal chromosome instability have already been confirmed by a number of 88
studies [7-9]. 89
Recently, several research groups have reported a large number of HBV 90
integrations in HCC through the application of next generation sequencing (NGS) 91
6
[8-12], which provided us the relatively unbiased and unprecedented great amount of 92
information about HBV integration. A few frequently targeted genes such as hTERT, 93
MLL4 and CCNE1 have been noted [9-11]. Moreover, Murakami et al. [12] and Ding 94
et al. [11] have suggested that host genes potentially affected by HBV integration in 95
HCC tissues were enriched in distinct functions. However, those frequently targeted 96
genes accounted for only 7% of the total integration events characterized. The 97
oncogenic potential of the remained 90% of the HBV integration events defined 98
to-date remains largely unattached. Alongside this, the frequent occurrence of HBV 99
integration events in adjacent non-tumor tissues has also been reported [8-11]. 100
However, the functions of those potentially integration targeted genes derived from 101
adjacent non-tumor has never been characterized. Combining the NGS data with the 102
231 virus-human DNA junctions analyzed by this lab [7], a total of 1,115 HBV 103
integration sites have now been characterized. 104
In the present study, we take advantage of the availability of this large body of 105
information on HBV integration to investigate the differences in the patterns of HBV 106
integration events seen in HCC and adjacent non-tumor tissues, as well as to analyze 107
the distinct functions of integration targeted host genes (ITGs) from HCC tumor 108
tissues using gene function annotation analysis. The cancer relativities of the 109
recurrently targeted host genes (RTGs) of HBV integration were further analyzed. 110
And the tumor suppressor property of UBXN8, one of the RTGs, was identified for 111
the first time. 112

7
MATERIALS AND METHODS 113
Patient specimens and HCC cell line 114
49 pairs of matched primary human HCC tumorous and corresponding adjacent 115
non-tumorous tissue samples were obtained from patients who underwent surgical 116
resection in the Affiliated Oncology Hospital of Zhengzhou University between 117
March to April, 2013 and have been histologically confirmed. Clinical features of the 118
patients were in Supplementary table 1. HCC cell lines HepG2, Hep3B, Huh1, Huh7, 119
SMMC7721, SNU182, SNU387, SNU449, PLC/PRF/5 and one endothelial cell line 120
SK-Hep-1 (which was derived from hepatic ascites adenocarcinoma) used in the study 121
were stored by our lab and have been previously used. 122
This study was approved by the Ethics Committee of Peking University Health 123
Science Center. Informed consent was obtained from each participant. 124
Modified read number 125
To compare the supported read number of virus-host junctions detected by NGS 126
with different coverage. We modified the read number according to the coverage of 127
the corresponding NGS method as following: 128
In 30× NGS, modified read = original read × 8; 129
In 80× NGS, modified read = original read × 3; 130
In 240× NGS, modified read = original read × 1. 131
The modified read number of each integration sites can be access in supplementary 132
table 4. 133
EST profiles data source and metabolically related genes 134
8
EST (expressed sequence tag) profiles of liver tissues were downloaded from 135
UniGene (http://www.ncbi.nlm.nih.gov/unigene/). The EST profiles show 136
approximate gene expression patterns as inferred from EST counts and the cDNA 137
library sources. The expression level of each gene is presented as transcripts per 138
million (TPM), meaning the number of transcripts belonging to the gene in every one 139
million clones. 140
Genes belonging to the Gene Ontology (GO) terms of metabolic processes that 141
take place in liver were abstracted from the human genome and defined as 142
metabolically related genes, and downloaded from GO database 143
(http://www.geneontology.org/). These metabolic processes included protein 144
metabolism (GO:0019538), lipid metabolism (GO:0006629), carbohydrate 145
metabolism (GO:0005975), vitamin metabolism (GO:0006766), hormone metabolism 146
(GO:0042445), RNA and DNA metabolism (GO:0016070 and GO:0006259). 147
Integration targeted genes (ITGs) 148
The HBV integration sites were mapped to the human genome (hg 19) as their 149
source publication reported. Genes with their transcription start sites (TSS) closest to 150
the HBV integration sites (with distance≤1Mb from integration site) were defined as 151
integration targeted genes (ITGs) (Table1; supplementary table2). RefSeq genes were 152
used as the reference database. 153
Chromosome aberration detection and RNA expression profiles 154
Chromosome aberration analyzed via array-based Comparative Genomic 155
Hybridization (aCGH) assays of 25 HCC tumor tissues has been previously described 156
[7]. Six of the above 25 paired HCC tumor and non-tumor tissues were used in the 157
RNA expression profiles (Arraystar Human LncRNA Microarray v2.0). Subsequent 158
9
data analysis was carried out using Agilent Feature Extraction. Paired t test was used 159
to statistically identify the abnormally expressed genes in HCC. P<0.05 and greater 160
than 2-fold change were the criteria of differently expressed. 161
Gene functional annotation analysis 162
DAVID (http://david.abcc.ncifcrf.gov/) [13, 14] was used to perform the gene 163
functional annotation analysis, the categories of GO and KEGG Pathways were 164
chosen as background databases. All genes of homo sapiens were used as background 165
gene list. 166
RNA extraction and real-time qPCR 167
Real-time qPCR was performed as previously described [15]. Primers and 168
annealing temperatures for different genes are listed in Supplementary Table 3. 169
In vitro functional experiments 170
Lentivirus expression system was used to restore the expression of UBXN8 in 171
HCC cell lines. The methods of Western blot, MTT assay and flow cytometry 172
technique were described previously [15, 16]. 173
Statistical analysis 174
All the statistical analyses were performed using SAS 9.1 for windows. The χ2 175
test and Fisher’s exact tests were used to compare categorical variables between two 176
groups. The Mann-Whitney test was used to analysis the differences between different 177
groups of discrete variables. Student’s t test was used to compare two groups of 178
continuous variables. All estimates were accompanied by a 95% confidence interval, 179
10
where a p<0.05 was considered as being statistically significant. 180
RESULTS 181
Cataloguing the ensemble of HBV integration sites 182
All of the virus-host junctions from the three NGS studies [8-10], together with 183
those from the PCR based study of this lab [7] were aggregated as an ensemble. 184
Virus-host junctions detected in a number of earlier studies which could not be 185
precisely mapped to human genome were not included [17-20]. A total of 1115 186
integration sites from 155 HCC patients were taken into the analysis. Among them, 187
1004 sites were unique (Table 1, supplementary table 4). The clinical features of the 188
74 patients with detailed patient by patient information were summarized in 189
supplementary table 5. Meanwhile, the summary of integration status of the overall 190
155 patients was in supplementary table 6. The average integration site in tumor 191
tissues and non-tumor tissues are 4.04±12.97 and 2.63±11.58 (mean±SD), 192
respectively. To investigate and compare different characteristics of the HBV 193
integration seen in HCC and adjacent non-tumor tissues, different subgroups of this 194
ensemble were used (Table 1). 195
Viral transcriptional regulators are frequently present in integrated HBV 196
fragments from both tumor and adjacent non-tumor tissues 197
The HBV breakpoints distribution of 1004 non-redundant integration events 198
(Table 1, subgroup A) was analyzed. In agreement with previously reports [8, 9], 37% 199
of the HBV break points were mapped within the DR2-DR1 region (1590-1840nt) of 200
11
HBV genome. (Fig 1A, Supplementary Fig 1). Especially at the DR1 (1820-1840nt) 201
region, within it 11% of the break points were mapped. We noticed the relatively even 202
distribution of viral breakpoints in HCC tumor tissue than that in adjacent non-tumor 203
tissues (28% vs. 51% localized within the DR2-DR1 hotspot; p<0.0001; Fig 1B). 204
Interestingly, when the modified read number (see “Materials and methods”) derived 205
from NGS data was considered, there was a positive correlation between the 206
percentage of viral break points localized in the DR2-DR1 hotspot and the 207
lower-threshold of modified read numbers (R2=0.85,p<0.0001; Fig 1C). Same 208
tendency can be observed when analyzed using the original reads number in each 209
depth of NGS methods (NGS30×, NGS80× and NGS240×; Supplementary Fig 210
2). 211
The preference of HBV break points distributed in DR2-DR1 region may imply a 212
large proportion of inserted HBV sequence containing viral transcriptional regulators. 213
Indeed, detailed analysis of the inserted viral fragments detected by PCR methods [7] 214
revealed the similar frequencies of truncated HBx gene (>90%) and intact enhancer II 215
(>40%) both in HCC tumor and adjacent non-tumor tissues. Although a greater 216
percentage of the integration events in HCC tissues contained intact basic core 217
promoter (BCP), the difference was not statistically significant (p=0.12; Fig 1D). 218
HBV integration sites are preferentially located in genic regions and gene-dense 219
regions 220
To investigate the distribution pattern of integration sites in human genome, 1004 221
non-repetitive integration sites were analyzed. Almost 45% of them were located in 222
12
gene-coding regions (including exons and introns), which was significantly enriched 223
compared to the expected ratio based on the fraction of the human genome 224
compassion of such regions (39%; χ2 test, p=0.0114). More refined analysis revealed 225
that the 1004 sites were preferentially located in exons and promoters (defined as the 226
0-5Kb upstream region of genes’ TSSs) compared to expected frequencies (Fig 2A). 227
Further stratified analysis revealed that the integration events derived from HCC 228
tumor tissues prominently located in exons or promoter regions (p=0.025), whilst the 229
non-tumor derived events was found significantly enriched in introns (p=0.0003) (Fig 230
2B). 231
It has been suggested that the open chromatin configuration where gene enriched 232
and characterized of active regulation or transcription are more accessible to HBV 233
integration. To testify this prediction, 1000 sites across the human genome were 234
selected randomly as a control group. Then the number of genes in a region of 100Kb 235
up and downstream of both the 1004 integration sites and 1000 random sites was 236
catalogued. A total of 2730 genes were identified surrounding the 1004 integrated 237
sites, while only 1997 genes were found in the random group (Mann-Whitney test, 238
p<0.0001, Fig 2C). Unexpectedly, no significant difference between HCC tumor and 239
adjacent non-tumor tissues was observed (Fig 2D). 240
We next tested the status of active regulation or transcription of host genes 241
surrounding integration sites. To analyze this, TPM values from EST profiles in 242
normal liver tissues (see ‘Materials and methods’ for details) were used as a direct 243
indicator of normal transcriptional activity of host genes. Of 837 genes located within 244

13
15Kb upstream and downstream of the 1004 integration sites and 631 genes 245
surrounding the 1000 random selected sites were abstracted from human genome. The 246
expression levels of genes in the HBV integration group were higher than those in 247
random group, but the difference was not statistically significant (Fig 2E). However, 248
when we compared that in HCC tumor and adjacent non-tumor groups separately, it 249
showed that the genes from adjacent non-tumor group had significantly higher 250
expression levels compared to those both in the random group and HCC tumor group 251
(Mann-Whitney test, p<0.0001; Fig 2E). In addition and somewhat unexpectedly, the 252
expression levels of surrounding genes for the HCC tumor group were significantly 253
lower than those seen in the control random group (p=0.009; Fig 2E). Similar results 254
were obtained when the analysis window was expanded from 15Kb to 50 or 100Kb 255
(data not shown). Subsequent analysis showed that, in comparison to HCC tumor 256
tissues, a significant larger percentage of integration sites were located in the 15Kb up 257
and downstream regions of metabolically related genes (see ‘Materials and methods’ 258
for definition) in adjacent non-tumor tissues (T: 20% vs. NT: 30%; χ2 test, p<0.0001; 259
Fig 2F). 260
Functional annotation analysis shows a distinct clustering of gene functions for 261
HBV integration targeted genes (ITGs) identified in HCC derived tissues. 262
As the results above indicated that the characteristics of host genes surrounding 263
integration sites may have significant difference between HCC and adjacent 264
non-tumor tissues, identifying the functions of the host genes targeted by HBV 265
integration events could be important in understanding the process of carcinogenesis 266

14
associated with HBV integration. To address this concern, we conducted ITGs 267
functional analysis using the DAVID software. A total of 817 ITGs at 837integration 268
sites from subgroup B were identified (Table 1). Among them, 87.4% of the ITGs 269
located within 100Kb from the integrated sites, of which 38.7% had integration sites 270
within them or in their promoters (Supplementary table 2). Because it has been 271
reported that inserted HBV fragments were able to active promoters up to 100Kb 272
away [21, 22], this observation implies that the majority of ITGs could be affected by 273
HBV integration. 274
Gene ontology analysis of the 408 non-redundant ITGs from the HCC tissues 275
revealed that terms related to developmental process and cell differentiation, 276
transcriptional regulation, cell communication and negative regulation of cell death 277
were significantly enriched (p<0.05). In the pathway annotation analysis, 5 ITGs in 278
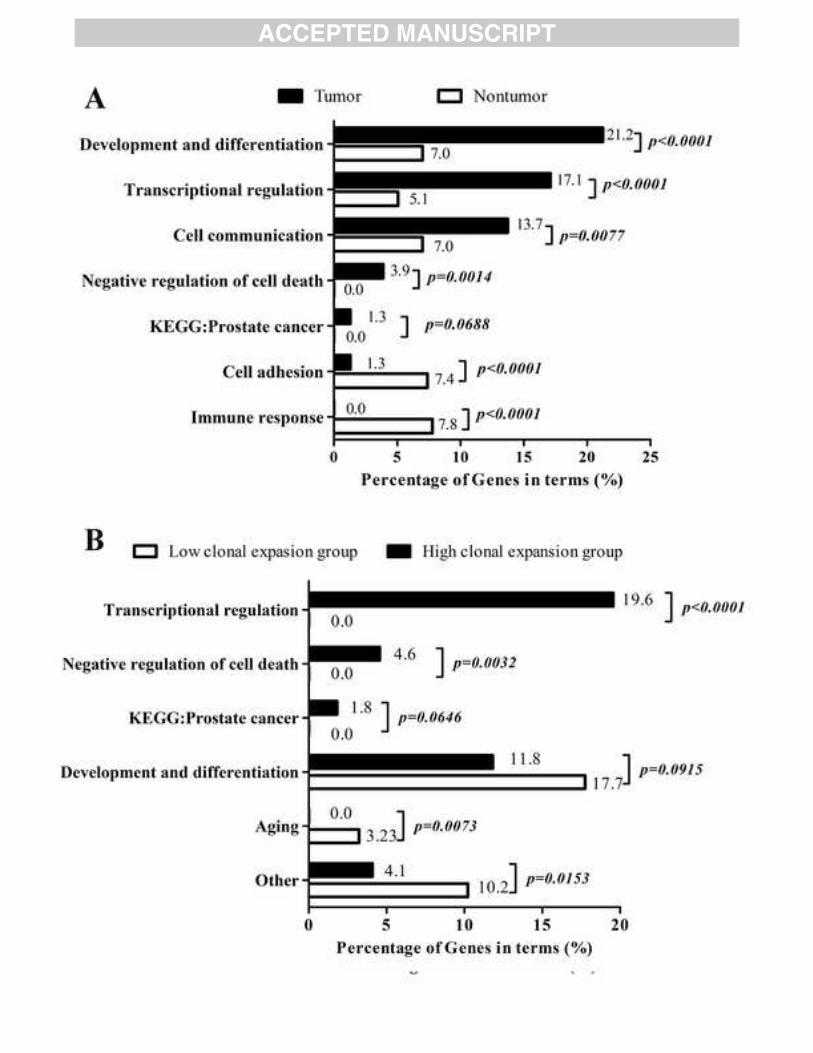
the HCC tumor group belonged to “Prostate cancer” (p= 0.049; Fig 3A, 279
supplementary table 6). The annotation of the 274 unique ITGs from the adjacent 280
non-tumor tissues showed they were enriched in terms related to developmental 281
process and cell differentiation, cell communication and transcriptional regulation too, 282
but with significantly smaller percentages (Fig 3A and Supplementary table 8). In 283
addition, the ITGs in the non-tumor group were not enriched in terms related to 284
negative regulation of cell death or cancer related pathways. Instead, they were 285
enriched in terms related to cell adhesion and immune response (Fig 3A). 286
The modified read number representing an integrated sequence derived from 287
NGS data was assumed to reflect the clonal expansion ability of cells harboring this 288
15
HBV integration site. In order to isolate functional terms closely related to hepatocyte 289
malignant transformation, we next investigated whether the ITGs’ enriched functional 290
terms would change along with the extent of clonal expansion after HBV integration. 291
Based on the above assumption, ITGs of the integration sites from HCC tissues were 292
divided into two subgroups: 193 ITGs derived from viral-host junction sites supported 293
by <32 modified reads in NGS were regarded as the low clonal expansion group; 235 294
ITGs of sites supported by ≥32 modified reads in NGS and those detected by PCR 295
were regarded as the high clonal expansion group (Sites from PCR method were 296
catalogued as high read events because the sensitivity of PCR method is much lower 297
than NGS. The read number 32 was chosen as the cut off value because it was the 298
median of modified reads after considering the sites from PCR and could balance the 299
number of sites in either group). Functional annotation showed that greater 300
percentages of genes were enriched in terms related to transcriptional regulation, 301
negative regulation of cell death and prostate cancer pathway in high clonal expansion 302
group (Fig 3B, supplementary table 9); In contrast, genes from low clonal expansion 303
group were no longer enriched in the above three catalogues of terms. But they were 304
enriched in “Aging” (p=0.014) and “Negative regulation of Wnt receptor signaling 305
pathway” (p=0.027; Supplementary table 10). ITGs from both groups were enriched 306
in terms related to developmental process and cell differentiation. Therefore, 307
functional terms of transcriptional regulation, negative regulation of cell death, cancer 308
pathways and developmental process and cell differentiation were defined as 309
integration related oncogenic functions (IROFs). We suggested that affecting the 310

16
expressions or functions of genes with IROFs is the determined oncogenic factor of 311
HBV integration. Consistent with this hypothesis, the percentages of tissues 312
containing ITGs annotated in the IROFs were significantly higher in HCC tumor 313
tissues (T: 73% vs.NT:20%; P<0.0001). 314
We also performed functional annotation analysis on 256 genes recurrently 315
mutated (mutated more than once) in HCCs [10, 23]. The results revealed that 316
functional terms belonging to three IROFs, with an exception of ‘transcriptional 317
regulation’, could be found in the top 30 enriched GO terms and the top 5 enriched 318
KEGG pathways (Supplementary table 11), indicating that genes related to IROFs 319
were indeed function abnormally in HCC. 320
Genes recurrently targeted by HBV integration are potentially cancer related. 321
A number of studies have suggested that HBV integration can induce 322
tumorigenesis through affecting few frequently targeted genes relevant to neoplasia, 323
including hTERT, MLL4 and CCNE1 [24-27]. Though these three frequently 324
identified ITGs were detected in up to 31% of the HCC samples analyzed in this study, 325
the cancer related functions of ITGs from the remaining ~70% of HCC tissues have 326
been overlooked, particularly those of genes been integration targeted more than once 327
(defined as recurrently targeted genes, RTGs). In this study, overall 75 RTGs were 328
identified amongst all the 817 ITGs. The functional annotation analysis of these 75 329
genes showed they were mainly enriched in terms belong to IROFs (Table 2). Besides, 330
result of our aCGH assays showed that 33 (44%) of the 75 RTGs exhibited copy 331
number variations (CNVs) in no less than 20% (5/25) of the HCC tissues (Table 3). 332

17
Even more, scrutiny of the documentation concerning the 75 RTGs showed that 26 333
(35%) of them have been reported to be cancer related genes. Additionally, the results 334
of micro-array based expression profiles (see “Materials and methods” for details) and 335
real-time qPCR methods (Supplementary Fig 3) showed 23 (31%) of the 75 RTGs 336
being abnormally expressed in HCC tissues compared to adjacent non-tumor tissues 337
or normal tissues (Table 3). Among them, 12 RTGs had never been reported to be 338
cancer related. Finally, what noteworthy is that RTG in tumor tissues was significantly 339
more frequent (50 genes repeated only in HCC tissues vs. 11 in non-tumorous tissues, 340
p=0.0002). 341
UBXN8 exerts its tumor suppressor role in a TP53 dependent manner. 342
Among the recurrently targeted genes, UBXN8 is one of the newly discovered 343
RTGs (Fig 4A) with no known cancer relativity but presented frequent copy number 344
deletion (28%, 7/25; Table 3). UBXN8 was found significantly down-regulated (43%, 345
21/49; Fig 4Bi) in HCC tumor tissues, particularly the HCC tissue with HBV 346
integration within the intron of UBXN8 (Fig 4Bii). The low expression of UBXN8 in 347
HCC tumor tissues was further confirmed by Western blot assay (Fig 4Biii). What is 348
more, dramatically low expression of UBXN8 was found in 7 of the ten HCC cell 349
lines tested (Fig 4Biv). 350
To evaluate the function of UBXN8 in the process of carcinogenesis, we restored 351
the expression of UBXN8 in 8 HCC cell lines. The in vitro experiments demonstrated 352
that ectopic expression of UBXN8 significantly slowed down the proliferation of 353
HepG2, SK-Hep-1, SMMC7721 and Huh1 cells with wild type TP53 gene [28] 354

18
(supplementary table 12), but not of PLC/PRF/5, Huh7, SNU449 and SNU387 whose 355
TP53 were mutated (Fig 4C, Supplementary Fig 4 and supplementary table 12). 356
Further flow cytometry experiments showed that ectopic expression of UBXN8 could 357
induce G1/S transition retardation in HepG2 and SK-Hep-1 cells but not in Huh7 cells 358
(Fig 4D). Concordantly, we also observed the up-regulation of p53 and p21CIP1/WAF1
359
proteins, and down-regulation of cyclin D1 in HepG2 and SK-Hep-1 cells after 360
UBXN8 overexpression (Fig 4E). These results indicated the tumor suppressive 361
activity of UBXN8 by promoting the expression of cell cycle negative regulators 362
TP53 and p21CIP1/WAF1
in HCC. 363
DISCUSSION 364
Following the initial discovery of HBV DNA integration, many studies have 365
investigated its role in HCC carcinogenesis [12, 29]. The ability of HBV integration to 366
affect the normal statuses of nearby host genes was explicit. In the present study, data 367
of 1115 HBV integration sites were collected and analyzed to investigation the 368
differences between integration in HCC tumor and adjacent non-tumor tissues that 369
might be related to oncogenicity. 370
First of all, we confirmed that the break points of the inserted viral fragment 371
were concentrated within DR2-DR1 region of HBV genome, as previously reported 372
[9]. The DR2 and DR1 sites represent the ends of the partially duplex HBV DNA and 373
can provide DNA termini for non-homologous end joining (NHEJ) [29, 30]. 374
Consequently, they are more likely to be the initiation break points for HBV 375
integration. Since vicinal chromosomal instabilities have been observed surrounding 376

19
integration sites [7], the relatively more even scattering of integrated HBV break 377
points in HCC tumor tissues may reflect the repetitive post-integration rearrangements 378
of the viral-host junction sequences, during the process of malignant transformation 379
and rapid proliferation of hepatocytes. Therefore, we suggested that this difference is 380
not necessarily related to the greater oncogenic potency of HBV integration in HCC 381
tumor tissues, but a result of an inherent feature of cancer cells. 382
In contrast to the reports by the Ding et al. and Toh et al. which concluded that 383
HBV integration into chromosomes 10 and 17 was favored [11, 31], no preferential 384
host chromosome was found in this study. However, we did reveal that HBV 385
integration events are more likely to occur in genic regions and gene-dense regions. 386
These regions are character by looser secondary structures, which enable them to be 387
transcriptionally more active, and this will also make such regions easier to break and 388
provide the human DNA termini for NHEJ with HBV viral DNA. On the other hand, 389
the preference of integration sites locating in these regions increases the potentiality 390
of HBV integration influence on host genes. 391
The active transcription status of host genes nearby integration sites in 392
non-tumor tissues, but not in tumor tissues, was consistent with the hypothesis that 393
HBV integrates into the open chromatin configuration more efficiently. A potential 394
explanation is that under normal condition in disease-free liver tissues, the host genes 395
surrounding the integration sites were supposed to be transcriptionally more active. 396
Indeed in this study, we found that in most of the cases, HBV integrated closed to host 397
genes transcriptionally activated in normal liver cells, like metabolically related genes. 398
20
However, in general the aberrant statuses of such kind of genes usually have little 399
contribution to tumorigenesis. Only when HBV integration affected the host genes 400
with cancer related functions, can the hepatocytes with such integrations obtain 401
growth advantage and eventually develop into malignant cancer cells. Because cancer 402
related host genes are not always activated in normal liver tissues, for example, most 403
of the oncogenes are silent in normal liver tissues. Therefore, the low expression level 404
of the surrounding host genes in HCC tumor tissues may be the result of selection 405
during the process of disease development. 406
The functional annotation analysis of host genes involved in HBV integration 407
events showed that functional terms belonging to four IROF groups were enriched in 408
HCC tissues. Terms related to negative regulation of cell death and cancer related 409
pathways are obviously related to HCC development. Aberrations of genes in terms 410
related to development and differentiation may lead to hepatocyte de-differentiation 411
so as to promote tumor progress. Finally aberrations of genes in terms related to 412
transcriptional regulation may enlarge the range of the genes affected to their 413
downstream regulated genes thereby increasing the scope of influence of HBV 414
integration events. 415
Unlike the HBV infecting animals, such as Woodchuck HBV, integrations were 416
mainly occurred in certain host genomic regions, such as Nmyc2 gene region [32], 417
HBV integration occur relatively more randomly in human genome. However, there 418
are still a few frequent targeted genes of HBV integration, such as hTERT and 419
CCNE1. These genes have themselves been shown to be related to cancer progress in 420

21
a range of tumors [25-27]. HBV integration targeting such RTGs has been considered 421
to be the major oncogenic effect in some studies. In this study, 75 RTGs was 422
identified and a significant percentage of them showed expression or function 423
abnormality in cancer cells. Therefore, being recurrently integrated into by HBV 424
DNA can be considered as an indicator of being a cancer related gene. Indeed, the in 425
vitro functional restoring experiments implicated that UBXN8, one of the novel RTGs 426
as a potential tumor suppressor in HCC. 427
UBXN8 is an Endoplasmic Reticulum (ER) transmembrane protein. Previous 428
study showed that UBXN8 could tethers p97 to the ER membrane for degradation of 429
misfolded proteins (ERAD) [33]. Insufficient of UBXN8 expression would disturb 430
this process leading to the accumulation of misfolded or unassembled proteins inside 431
the ER lumen and subsequently induce unfolded protein response (UPR) or ER stress. 432
It was reported that ER stress could induce the cytoplasmic localization and 433
degradation of p53 [34, 35]. Consistently, our study showed that UBXN8 exert its 434
tumor suppressor function only in HCC cell lines with normal functioned TP53. And 435
western blot results showed that exogenous expression of UBXN8 could promote p53 436
and p21 expression in HepG2 and SK-hep-1 with wild type TP53, indicating UBXN8 437
function as a tumor-suppressor in a TP53 dependent manner. Altogether, we proposed 438
that restoration of UBXN8 could remit the ER stress within abnormal cells (like 439
malignant cells) and thus suppress the degradation of p53, and finally lead to the 440
growth inhibition of abnormal cells. However, further investigation was needed to 441
fully understand the exact relationship of UBXN8 and ER stress. 442
22
In summary, the preference of integration occurring within genic regions and 443
gene-dense regions, and the characteristic of containing viral transcription regulating 444
elements within the inserted HBV fragments endow HBV integration a greater 445
opportunity to induce crucial oncogenic alterations to host genes. Only when a HBV 446
integration event targeted host genes with oncogenic functions such as IROFs, can it 447
contribute to the eventual malignant transformation of hepatocytes. Therefore, the 448
present study suggests the oncogenicity of HBV integration is determined by the 449
function of HBV integration targeted host genes in hepatocellular carcinoma. 450
ACKNOWLEDGEMENTS 451
We thank Doctor Ling Zhang and Professor Quanjun Lv for their enthusiastic 452
help to establish the HCC tissue specimen database. 453
454
References: 455
[1] Forner A, Llovet JM, Bruix J. Hepatocellular carcinoma. Lancet 2012;379:1245-1255. 456
[2] Lu FM, Zhuang H. Management of hepatitis B in China. Chin Med J (Engl) 2009;122:3-4. 457
[3] Shafritz DA, Shouval D, Sherman HI, Hadziyannis SJ, Kew MC. Integration of hepatitis B 458
virus DNA into the genome of liver cells in chronic liver disease and hepatocellular carcinoma. 459
Studies in percutaneous liver biopsies and post-mortem tissue specimens. N Engl J Med 460
1981;305:1067-1073. 461
[4] Koshy R, Koch S, von Loringhoven AF, Kahmann R, Murray K, Hofschneider PH. 462
Integration of hepatitis B virus DNA: evidence for integration in the single-stranded gap. Cell 463
1983;34:215-223. 464
23
[5] Chakraborty PR, Ruiz-Opazo N, Shouval D, Shafritz DA. Identification of integrated 465
hepatitis B virus DNA and expression of viral RNA in an HBsAg-producing human hepatocellular 466
carcinoma cell line. Nature 1980;286:531-533. 467
[6] Brechot C, Pourcel C, Louise A, Rain B, Tiollais P. Presence of integrated hepatitis B virus 468
DNA sequences in cellular DNA of human hepatocellular carcinoma. Nature 1980;286:533-535. 469
[7] Jiang S, Yang Z, Li W, Li X, Wang Y, Zhang J, et al. Re-evaluation of the carcinogenic 470
significance of hepatitis B virus integration in hepatocarcinogenesis. PLoS One 2012;7:e40363. 471
[8] Jiang Z, Jhunjhunwala S, Liu J, Haverty PM, Kennemer MI, Guan Y, et al. The effects of 472
hepatitis B virus integration into the genomes of hepatocellular carcinoma patients. Genome Res 473
2012;22:593-601. 474
[9] Sung WK, Zheng H, Li S, Chen R, Liu X, Li Y, et al. Genome-wide survey of recurrent HBV 475
integration in hepatocellular carcinoma. Nat Genet 2012;44:765-769. 476
[10] Fujimoto A, Totoki Y, Abe T, Boroevich KA, Hosoda F, Nguyen HH, et al. Whole-genome 477
sequencing of liver cancers identifies etiological influences on mutation patterns and recurrent 478
mutations in chromatin regulators. Nat Genet 2012;44:760-764. 479
[11] Ding D, Lou X, Hua D, Yu W, Li L, Wang J, et al. Recurrent targeted genes of hepatitis B 480
virus in the liver cancer genomes identified by a next-generation sequencing-based approach. 481
PLoS Genet 2012;8:e1003065. 482
[12] Murakami Y, Saigo K, Takashima H, Minami M, Okanoue T, Brechot C, et al. Large scaled 483
analysis of hepatitis B virus (HBV) DNA integration in HBV related hepatocellular carcinomas. 484
Gut 2005;54:1162-1168. 485
[13] Huang DW, Sherman BT, Lempicki RA. Systematic and integrative analysis of large gene 486

24
lists using DAVID bioinformatics resources. Nat Protoc 2009;4:44-57. 487
[14] Huang DW, Sherman BT, Lempicki RA. Bioinformatics enrichment tools: paths toward the 488
comprehensive functional analysis of large gene lists. Nucleic Acids Res 2009;37:1-13. 489
[15] Xie Q, Chen X, Lu F, Zhang T, Hao M, Wang Y, et al. Aberrant expression of microRNA 490
155 may accelerate cell proliferation by targeting sex-determining region Y box 6 in 491
hepatocellular carcinoma. Cancer 2012;118:2431-2442. 492
[16] Chen X, Zhang L, Zhang T, Hao M, Zhang X, Zhang J, et al. Methylation-mediated 493
repression of microRNA 129-2 enhances oncogenic SOX4 expression in HCC. Liver Int 494
2013;33:476-486. 495
[17] Tamori A, Yamanishi Y, Kawashima S, Kanehisa M, Enomoto M, Tanaka H, et al. 496
Alteration of gene expression in human hepatocellular carcinoma with integrated hepatitis B virus 497
DNA. Clin Cancer Res 2005;11:5821-5826. 498
[18] Wang Y, Lau SH, Sham JS, Wu MC, Wang T, Guan XY. Characterization of HBV integrants 499
in 14 hepatocellular carcinomas: association of truncated X gene and hepatocellular 500
carcinogenesis. Oncogene 2004;23:142-148. 501
[19] Chami M, Gozuacik D, Saigo K, Capiod T, Falson P, Lecoeur H, et al. Hepatitis B 502
virus-related insertional mutagenesis implicates SERCA1 gene in the control of apoptosis. 503
Oncogene 2000;19:2877-2886. 504
[20] Wang J, Chenivesse X, Henglein B, Brechot C. Hepatitis B virus integration in a cyclin A 505
gene in a hepatocellular carcinoma. Nature 1990;343:555-557. 506
[21] Horikawa I, Barrett JC. cis-Activation of the human telomerase gene (hTERT) by the 507
hepatitis B virus genome. J Natl Cancer Inst 2001;93:1171-1173. 508

25
[22] Shamay M, Agami R, Shaul Y. HBV integrants of hepatocellular carcinoma cell lines contain 509
an active enhancer. Oncogene 2001;20:6811-6819. 510
[23] Guichard C, Amaddeo G, Imbeaud S, Ladeiro Y, Pelletier L, Maad IB, et al. Integrated 511
analysis of somatic mutations and focal copy-number changes identifies key genes and pathways 512
in hepatocellular carcinoma. Nat Genet 2012;44:694-698. 513
[24] Paterlini-Brechot P, Saigo K, Murakami Y, Chami M, Gozuacik D, Mugnier C, et al. 514
Hepatitis B virus-related insertional mutagenesis occurs frequently in human liver cancers and 515
recurrently targets human telomerase gene. Oncogene 2003;22:3911-3916. 516
[25] Huang FW, Hodis E, Xu MJ, Kryukov GV, Chin L, Garraway LA. Highly recurrent TERT 517
promoter mutations in human melanoma. Science 2013;339:957-959. 518
[26] Saigo K, Yoshida K, Ikeda R, Sakamoto Y, Murakami Y, Urashima T, et al. Integration of 519
hepatitis B virus DNA into the myeloid/lymphoid or mixed-lineage leukemia (MLL4) gene and 520
rearrangements of MLL4 in human hepatocellular carcinoma. Hum Mutat 2008;29:703-708. 521
[27] Nakayama N, Nakayama K, Shamima Y, Ishikawa M, Katagiri A, Iida K, et al. Gene 522
amplification CCNE1 is related to poor survival and potential therapeutic target in ovarian cancer. 523
Cancer 2010;116:2621-2634. 524
[28] Gao Y, Lin LP, Zhu CH, Chen Y, Hou YT, Ding J. Growth arrest induced by C75, A fatty 525
acid synthase inhibitor, was partially modulated by p38 MAPK but not by p53 in human 526
hepatocellular carcinoma. Cancer Biol Ther 2006;5:978-985. 527
[29] Bonilla GR, Roberts LR. The role of hepatitis B virus integrations in the pathogenesis of 528
human hepatocellular carcinoma. J Hepatol 2005;42:760-777. 529
[30] Bill CA, Summers J. Genomic DNA double-strand breaks are targets for hepadnaviral DNA 530
26
integration. Proc Natl Acad Sci U S A 2004;101:11135-11140. 531
[31] Toh ST, Jin Y, Liu L, Wang J, Babrzadeh F, Gharizadeh B, et al. Deep sequencing of the 532
hepatitis B virus in hepatocellular carcinoma patients reveals enriched integration events, 533
structural alterations and sequence variations. Carcinogenesis 2013;34:787-798. 534
[32] Ueda K, Wei Y, Ganem D. Activation of N-myc2 gene expression by cis-acting elements of 535
oncogenic hepadnaviral genomes: key role of enhancer II. Virology 1996;217:413-417. 536
[33] Madsen L, Kriegenburg F, Vala A, Best D, Prag S, Hofmann K, et al. The tissue-specific 537
Rep8/UBXD6 tethers p97 to the endoplasmic reticulum membrane for degradation of misfolded 538
proteins. PLoS One 2011;6:e25061. 539
[34] Qu L, Huang S, Baltzis D, Rivas-Estilla AM, Pluquet O, Hatzoglou M, et al. Endoplasmic 540
reticulum stress induces p53 cytoplasmic localization and prevents p53-dependent apoptosis by a 541
pathway involving glycogen synthase kinase-3beta. Genes Dev 2004;18:261-277. 542
[35] Pluquet O, Qu LK, Baltzis D, Koromilas AE. Endoplasmic reticulum stress accelerates p53 543
degradation by the cooperative actions of Hdm2 and glycogen synthase kinase 3beta. Mol Cell 544
Biol 2005;25:9392-9405. 545
546
Figure Legend 547
Fig. 1. HBV break points distribution and the percentages of integrated viral 548
fragments containing transcriptional regulators. ‘T’: tumorous tissues; ‘NT’: 549
non-tumorous tissues. (A) Distribution of HBV break points across the HBV genome. 550
This figure only included sites from C genotype. For B and D genotypes please refer 551
to Supplementary Fig 1. (B) Percentage distribution of HBV break points in the three 552
27
regions of the viral genome. (C) Correlation between the lower limit of modified read 553
numbers of integration events and the percentages of them with break points located 554
in the DR2-DR1 region. e.g.: the point (X=5, Y=32%) means 32% of HBV break 555
points of the integration event supported by ≥5 modified reads located in DR2-DR1 556
region. (D) The percentages of inserted viral fragments containing transcriptional 557
regulators. ‘ns’: non-sense. 558
559
Fig. 2. The distribution of HBV integration events in the human genome. ‘T’: 560
tumorous tissues; ‘NT’: non-tumorous tissues. (A, B) the percentages of HBV 561
integration sites located within genes and promoters. (C, D) The number of host genes 562
located within 100Kb surrounding each HBV integration site. Data were presented in 563
boxes and whiskers’ style, representing the ranges and medians of the data. (E) The 564
transcriptional activities of host genes located within 15Kb surrounding HBV 565
integration sites. ‘TPM’ indicates the expression level of genes in normal liver tissues. 566
The whiskers represent the 2.5-97.5 percentile of the data. (F) The percentage of sites 567
located nearby 15Kb surrounding metabolism related genes. 568
569
Fig. 3. Functional annotation analysis of HBV integration targeted genes (ITGs). 570
(A) Functional annotation analysis of ITGs from both tumor (T) and non-tumor (NT) 571
groups. (B) Functional annotation analysis of ITGs from both high clonal expansion 572
group and low clonal expansion group. 573
Fig. 4. UBXN8 exerts its tumor suppressor role in a TP53 dependent manner. 574

28
(A) The positions of integrated sites into UBXN8 gene. (Bi) The expression status of 575
UBXN8 in 49 paired of HCC tumorous (T), non-tumorous tissues (NT) and 14 normal 576
liver tissues. (Bii) The mRNA level of UBXN8 in tissue No.85. (Biii) Western blot 577
results of UBXN8 in T and paired NT. (Biv) The expression of UBXN8 in HCC cell 578
lines. The red dashed line indicates the average expression level of 14 normal liver 579
tissues. (C) The results of MTT assay. (D) The results of flow cytometry cell cycle 580
detection assays. (E) Western blot results of several cell cycle related proteins. 581
‘UBXN8’: HCC cells stable expressing UBXN8; ‘control’: cells stable transfected 582
with control vectors. 583
584
Table 1. The ensemble of integrated sites and the contents of different subgroups:
Methods
Sample
count
Integration
count Subgroup A-
Non-repetitive
Subgroup B
T NT T NT Functional
annotation
ITG count
T NT
PCR[7] 60 60 80 151 Y Y 78 148
NGS 30× [9,10] 92 81 299 52 Y Y 292 50
NGS 80× [8] 3 3 148 107 Y # Y 144 106
NGS 243× [8] 1 1 142 136 Y - - -
Total 155 144 669 446 1004 837 514 304
Notes: ‘PCR’: the technique of Alu-/LM-PCR[7]; ‘NGS’: next generation sequencing;
‘×’: the coverage of NGS. ‘T’: HCC tissues; ‘NT’: adjacent non-tumor tissues; ‘ITG’:
integrated targeted host genes; ‘Y’: integration sites detected by the certain methods
were included in the subgroups; ‘Subgroup A -Non-repetitive’: all non-redundant
integrations; ‘#’ integration sites detected in sample 31656 by NGS 80× were
excluded, because sample 31656 was also used in NGS 243× . ‘Subgroup B
-Functional annotation’: integration sites used in functional annotation.

Table 2. The enriched GO terms and pathways of 75 recurrently targeted genes
(RTGs):
GO ID Term Count % P
GO:0032502 developmental process 17 23.29 1.21E-02
GO:0007275 multicellular organismal development 15 20.55 2.98E-02
GO:0030154 cell differentiation 10 13.70 4.73E-02
GO:0045941 positive regulation of transcription 7 9.59 5.87E-03
GO:0010628 positive regulation of gene expression 7 9.59 6.76E-03
GO:0045893 positive regulation of transcription,
DNA-dependent 6 8.22 1.27E-02
GO:0043193 positive regulation of gene-specific
transcription 3 4.11 2.72E-02
GO:0030182 neuron differentiation 5 6.85 3.96E-02
KEGG ID Term Count % P
hsa04070 Phosphatidylinositol signaling system 3 4.11 3.67E-02
hsa05222 Small cell lung cancer 3 4.11 4.62E-02
Notes: ‘Count’: the number of RTGs belongs to each term. ‘%’: the percentage of
genes belongs to each term. ‘P’: the enrichment p value.
Table 3. The 40 RTGs with frequent CNVs or aberrant expression in HCC:
Gene
Symbol
Integration sites counts Deletion/Amplification Expression
tendency Total Tumor Non-tumor Total cases=25
TERT 25 25 0 3/6 T>NT
MLL4 10 10 0 2/8 T>NT
CCNE1 7 7 0 0/3 T>NT
ANKRD26P1 4 4 0 5/0 T=NT
SENP5 3 3 0 2/4 T>NT
HRSP12 3 2 1 1/7 T<NT
SLITRK6 3 2 1 4/0 T<NT
FGF9 2 2 0 2/1 T<NT
RIMS1 2 2 0 4/3 T=NT
RPP40 2 2 0 1/6 T>NT
FAM46C 2 2 0 2/4 T<NT
RIPK2 2 2 0 1/4 T=NT
TUFT1 2 2 0 0/14 T>NT
EBF3 2 2 0 4/1 T=NT
OR51E1 2 2 0 4/3 T>NT
SPRYD4 2 2 0 1/4 T<NT
C1QTNF9 2 2 0 5/1 T=NT
C1orf229 2 2 0 1/8 T=NT
NBAS 2 2 0 1/2 T>NT
MIR764 2 2 0 6/3 T=NT
ARHGEF10L 2 2 0 8/2 T=NT
ADH1A 2 2 0 12/0 T<NT
UBXN8 2 2 0 7/0 T<NT
DDX54 2 2 0 0/2 T<NT
TC2N 2 2 0 7/1 T=NT
CSMD1 3 0 3 10/0 T=NT
EIF4B 2 0 2 3/6 T<NT
ESRRG 2 0 2 1/12 T=NT
DGKG 2 0 2 0/3 T<NT
LAMP1 2 0 2 7/5 T>NT
FN1 21 2 19 7/2 T >NT
C3orf58 2 1 1 0/2 T<NT
GTF2I 2 1 1 0/2 T>NT
PIK3R1 2 1 1 / T<NT
LPHN3 2 1 1 6/2 T=NT
CASP12 2 1 1 4/2 T=NT
SMARCA1 2 1 1 6/3 T=NT
C4orf51 2 1 1 7/0 T=NT
C1GALT1 2 1 1 2/4 T=NT
GALC 2 1 1 6/0 T=NT

Notes: Gene symbol underlined indicated the 12 genes have never been reported to be
cancer related. Column ‘Deletion/Amplification’ indicates the results of aCGH assays.
‘T’: HCC tumor tissues; ‘NT’: adjacent non-tumor tissues. Expression tendency
results underlined mean they were detected by qPCR.


Related Documents