Journal of Materials Science manuscript No. (will be inserted by the editor) The fracture toughness of polymer cellulose nanocomposites using the essential work of fracture method M. Shir Mohammadi · C. Hammerquist · J. Simonsen · J. A. Nairn the date of receipt and acceptance should be inserted later Abstract This work reinforced both a glassy polymer (high stiffness matrix) and a rubbery polymer (low stiff- ness matrix) with cellulose nanocrystals (CNC) derived from natural sources. CNC addition always increased stiffness while it increased toughness for a rubbery poly- mer and caused no loss in toughness for a glassy poly- mer. These results contradict many claims that when stiffness increases, the toughness decreases. We show that these claims depend on how toughness is mea- sured. Our results were based on toughness measured using the essential work of fracture method (EWFM). In contrast, toughness determined from area under the stress-strain curve shows a significant decrease, but that method may be a poor measure of toughness. Property enhancements usually require a good fiber/matrix in- terface. We used modeling of stiffness properties to con- firm CNC has a good interface with the studied polymer matrices. Keywords Toughness · nanocomposites · soft polymers · interface · essential work 1 Introduction Nanofillers are often used to increase polymer mechan- ical properties, such as modulus, yield strength, ulti- mate strength [5, 22], ductility [35] and toughness [32]. Measuring nanocomposite toughness, however, can be a challenge. Some studies use total work of fracture (W f defined as area under the stress-strain curve) to mea- sure “toughness” [9, 30, 35, 39]. Our view is that W f is not a material property and therefore not an ideal in- Oregon State University, Wood Science & Engineering 112 Richardson Hall, Corvallis, OR 97330, USA E-mail: [email protected] dicator of toughness. Instead, toughness should be as- sociated with the amount of energy required to extend an existing crack by a unit amount of area [1]. Crack extension toughness can be measured by crit- ical stress intensity factor, K c , or by energy required to propagate a crack, G c . These experiments are com- monly done in opening or mode I because mode I K c and G c are usually the lowest toughnesses and there- fore a critical test in nanocomposites for role of fillers on toughness properties. Measurement of mode I K c re- quires specialized specimens while G c can be measured on any specimen by directly measuring energy released as a function of crack growth [3, 14, 21, 36]. If either one can be measured, the other can be calculated by the relations: K c = r G c E 1 - ν 2 (if plane strain) (1) K c = p G c E (if plane stress) (2) where E is Young’s modulus in the applied stress direc- tion and ν is Poisson’s ratio. Under plane strain con- ditions K c and G c are usually called K Ic and G Ic and are material properties. In plane stress conditions, K c and G c are still useful, but may depend on specimen thickness. The fracture toughness of brittle polymer nanocom- posites (e.g., epoxy/carbon nanotube) has been mea- sured using both impact tests (a K c method) [6] and crack propagation (a G c method) [16]. These tests show that nanofiller addition increases fracture toughness provided the interface between fibers and the matrix is good [41] and the nanofillers are well dispersed [6]. The experiments here used thin nanocomposite films, which is a common form for making nanocomposites. Unfortu- nately, typical impact or crack propagation tests do not work for thin nanocomposite films, especially films de-

Welcome message from author
This document is posted to help you gain knowledge. Please leave a comment to let me know what you think about it! Share it to your friends and learn new things together.
Transcript
Journal of Materials Science manuscript No.(will be inserted by the editor)
The fracture toughness of polymer cellulosenanocomposites using the essential work of fracturemethod
M. Shir Mohammadi · C. Hammerquist · J. Simonsen · J. A. Nairn
the date of receipt and acceptance should be inserted later
Abstract This work reinforced both a glassy polymer
(high stiffness matrix) and a rubbery polymer (low stiff-
ness matrix) with cellulose nanocrystals (CNC) derived
from natural sources. CNC addition always increased
stiffness while it increased toughness for a rubbery poly-
mer and caused no loss in toughness for a glassy poly-
mer. These results contradict many claims that when
stiffness increases, the toughness decreases. We show
that these claims depend on how toughness is mea-
sured. Our results were based on toughness measured
using the essential work of fracture method (EWFM).
In contrast, toughness determined from area under the
stress-strain curve shows a significant decrease, but that
method may be a poor measure of toughness. Property
enhancements usually require a good fiber/matrix in-
terface. We used modeling of stiffness properties to con-
firm CNC has a good interface with the studied polymer
matrices.
Keywords Toughness · nanocomposites · soft
polymers · interface · essential work
1 Introduction
Nanofillers are often used to increase polymer mechan-
ical properties, such as modulus, yield strength, ulti-
mate strength [5, 22], ductility [35] and toughness [32].
Measuring nanocomposite toughness, however, can be a
challenge. Some studies use total work of fracture (Wf
defined as area under the stress-strain curve) to mea-
sure “toughness” [9, 30, 35, 39]. Our view is that Wf is
not a material property and therefore not an ideal in-
Oregon State University, Wood Science & Engineering112 Richardson Hall, Corvallis, OR 97330, USA E-mail:[email protected]
dicator of toughness. Instead, toughness should be as-
sociated with the amount of energy required to extend
an existing crack by a unit amount of area [1].
Crack extension toughness can be measured by crit-
ical stress intensity factor, Kc, or by energy required
to propagate a crack, Gc. These experiments are com-
monly done in opening or mode I because mode I Kc
and Gc are usually the lowest toughnesses and there-
fore a critical test in nanocomposites for role of fillers
on toughness properties. Measurement of mode I Kc re-
quires specialized specimens while Gc can be measured
on any specimen by directly measuring energy released
as a function of crack growth [3, 14, 21, 36]. If either
one can be measured, the other can be calculated by
the relations:
Kc =
√GcE
1− ν2(if plane strain) (1)
Kc =√GcE (if plane stress) (2)
where E is Young’s modulus in the applied stress direc-
tion and ν is Poisson’s ratio. Under plane strain con-
ditions Kc and Gc are usually called KIc and GIc and
are material properties. In plane stress conditions, Kc
and Gc are still useful, but may depend on specimen
thickness.
The fracture toughness of brittle polymer nanocom-
posites (e.g., epoxy/carbon nanotube) has been mea-
sured using both impact tests (a Kc method) [6] and
crack propagation (a Gc method) [16]. These tests show
that nanofiller addition increases fracture toughness
provided the interface between fibers and the matrix is
good [41] and the nanofillers are well dispersed [6]. The
experiments here used thin nanocomposite films, which
is a common form for making nanocomposites. Unfortu-
nately, typical impact or crack propagation tests do not
work for thin nanocomposite films, especially films de-
2 M. Shir Mohammadi et al.
rived using ductile polymers. Impact tests do not work
for films and it can be difficult to objectively record
crack propagation as well. Some alternate methods are
needed for thin films.
Because work of fracture (Wf ) experiments are easy
and avoid the need to monitor crack propagation, it is
tempting to resort to such tests. In brief, Wf is de-
fined as total work per unit specimen area to break an
unnotched specimen. It is found from area under the
stress-strain curve:
Wf =1
Wt
∫F dx = L
∫σ dε (3)
where W , t and L are specimen width, thickness, and
length, F is applied force, x is displacement, σ is applied
stress, and ε is strain. Because final failure must be
associated with crack initiation and propagation across
the specimen, one could speculate that Wf is an average
of the crack propagation fracture toughness for crack
growth from zero to W or
Wf =1
W
∫ W
0
Gc dx = Gc (4)
and equality of Wf with Gc assumes Gc is constant.
Unfortunately, many influences, such as crack initia-
tion, edge effects, and energies not associated with crack
propagation, cause Wf to only be crudely related to
Gc. When Wf was used to characterize nanocellulose
reinforced nanocomposites, the general trend was that
stiffness increases but Wf decreases as filler content
increases [7, 18, 30, 38]. As a result, a consensus has
emerged that nanofiller addition decreases the tough-
ness of polymers [10, 30]. This consensus derived from
Wf experiments may be misleading and might change
by switching to improved methods for measuring tough-
ness.
For ductile polymers and films, an alternate fracture
method, known as the essential work of fracture method
(EWFM), has been advocated [4, 19, 20, 33, 34]. In
brief, the EWFM measures specific work of fracture (to-
tal work of fracture per unit ligament area denoted here
using lower case wf ) for a series of deeply, double-edge
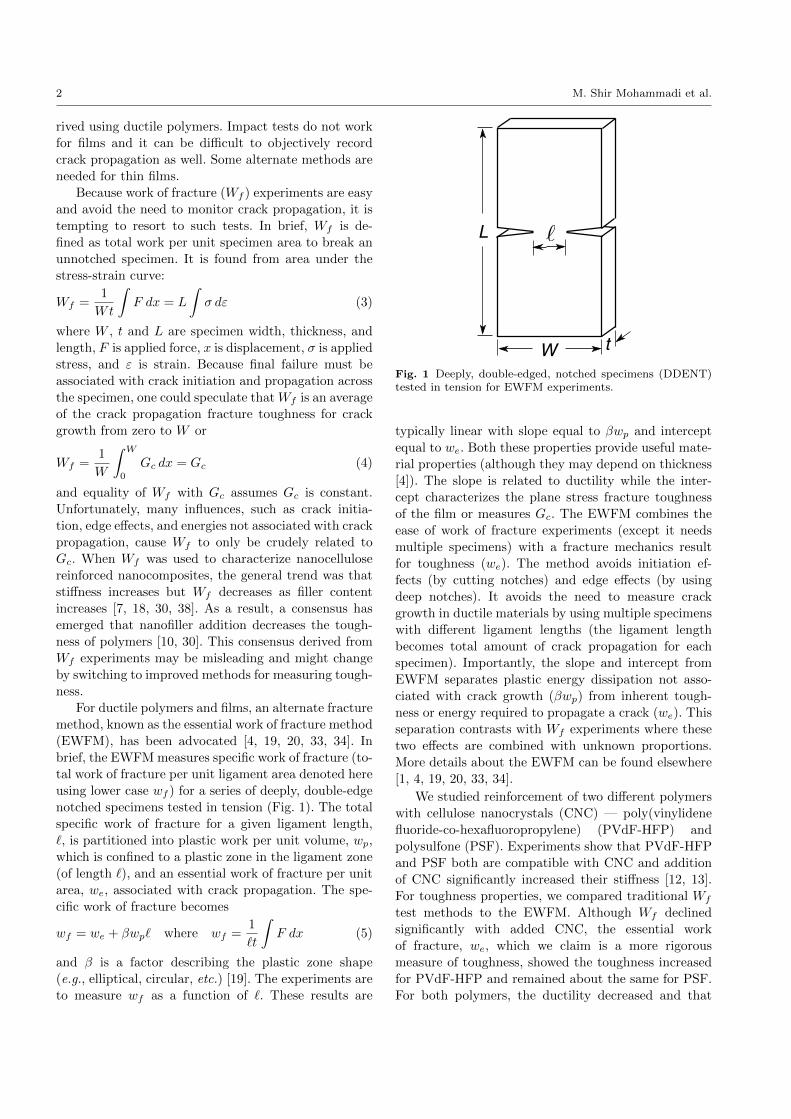
notched specimens tested in tension (Fig. 1). The total
specific work of fracture for a given ligament length,
`, is partitioned into plastic work per unit volume, wp,
which is confined to a plastic zone in the ligament zone
(of length `), and an essential work of fracture per unit
area, we, associated with crack propagation. The spe-
cific work of fracture becomes
wf = we + βwp` where wf =1
`t
∫F dx (5)
and β is a factor describing the plastic zone shape
(e.g., elliptical, circular, etc.) [19]. The experiments are
to measure wf as a function of `. These results are
L
W t
`
Fig. 1 Deeply, double-edged, notched specimens (DDENT)tested in tension for EWFM experiments.
typically linear with slope equal to βwp and intercept
equal to we. Both these properties provide useful mate-
rial properties (although they may depend on thickness
[4]). The slope is related to ductility while the inter-
cept characterizes the plane stress fracture toughness
of the film or measures Gc. The EWFM combines the
ease of work of fracture experiments (except it needs
multiple specimens) with a fracture mechanics result
for toughness (we). The method avoids initiation ef-
fects (by cutting notches) and edge effects (by using
deep notches). It avoids the need to measure crack
growth in ductile materials by using multiple specimens
with different ligament lengths (the ligament length
becomes total amount of crack propagation for each
specimen). Importantly, the slope and intercept from
EWFM separates plastic energy dissipation not asso-
ciated with crack growth (βwp) from inherent tough-
ness or energy required to propagate a crack (we). This
separation contrasts with Wf experiments where these
two effects are combined with unknown proportions.
More details about the EWFM can be found elsewhere
[1, 4, 19, 20, 33, 34].
We studied reinforcement of two different polymers
with cellulose nanocrystals (CNC) — poly(vinylidene
fluoride-co-hexafluoropropylene) (PVdF-HFP) and
polysulfone (PSF). Experiments show that PVdF-HFP
and PSF both are compatible with CNC and addition
of CNC significantly increased their stiffness [12, 13].
For toughness properties, we compared traditional Wf
test methods to the EWFM. Although Wf declined
significantly with added CNC, the essential work
of fracture, we, which we claim is a more rigorous
measure of toughness, showed the toughness increased
for PVdF-HFP and remained about the same for PSF.
For both polymers, the ductility decreased and that
Fracture toughness of polymer cellulose nanocomposites 3
decrease was reflected in decreased βwp. Additional
studies used modeling to quantify interfacial properties
and reanalyzed fracture data to evaluate the role of
thickness when interpreting EWFM experiments.
2 Materials and methods
2.1 Materials
Sulfonate CNC (S-CNC) dispersed in water (11%
solids) was purchased from the University of Maine.
Dimethylacetamide (DMAc) was used as the organic
solvent and it was purchased from Honeywell Burdick &
Jackson Co., MI, U.S.A. The rubbery polymer, PVdF-
HFP, with molecular weight of 400,000 D and density of
1.78 g/cm3 was purchased from Aldrich Chemical Co.
The glassy polymer, polysulfone (PSF) with a molecu-
lar weight of 35,000 D and density of 1.24 g/cm3, was
donated by Solvay Advanced Polymers (Alpharetta,
GA).
2.2 Nanocomposite Fabrication
DMAc was added to a CNC/water solution to reach
4% CNC in DMAc (note this % content and all others
in this paper are percent contents by weight). A Roto-
vapor (Buchi RE111, Switzerland) was used to com-
pletely evaporate water from the solution (PSF and
PVdF-HFP do not dissolve in water). PVdF-HFP was
dissolved in DMAc and was mixed with the dispersed
CNC in DMAc to reach the desired CNC weight con-
tent in the PVdF-HFP composite and stirred for 0.5 hr
at 85◦C to yield a uniform solution. The total solution
solids were ∼5%. The same procedure was used for the
PSF composites.
Centrifugal casting was used to cast films in or-
der to reduce the trapped solvent and to get uniform
thickness. In centrifugal casting, a solution is poured
into a metal beaker that is attached to a motor. Then
the beaker is partially sealed with a center-hole cap to
contain the liquid, but allow solvent evaporation. The
beaker is rotated at 1800 rpm and films are cast on the
beaker wall. A heat gun is applied to the exterior of the
metal beaker to control the temperature. All films were
cast at 70◦ to 80◦C.
2.3 Mechanical Testing
All samples were cut to 12.7 mm width and 40 mm
length. The thickness of the cast films varied within
and between films. We therefore measured each film’s
thickness using an optical microscope (Nikon Eclipse
E400) and it ranged from 20 to 80 µm. All samples
were tested at room temperature using an Instron 4301
with a 100 N load cell capacity and the gage length
was 20 mm. The crosshead speed was set to 1 mm/min
for PVdF-HFP films. But for PSF films, due to their
glassy nature, a 0.5 mm/min rate was chosen in order
to reach the plastic region prior to failure. Stress-strain
curves were calculated by dividing the force by the ini-
tial cross sectional area and displacement by the initial
gage length. Young’s modulus was calculated from ini-
tial slope of the stress-strain curves (up to about 0.1%
strain). Offset yield stress (σY ) was determined by find-
ing the intersection of a line having the initial slope of
the stress-strain curve but offset by 1% strain from that
curve.
2.4 Essential Work of Fracture Experiments
EWFM experiments used DDENT specimens (Fig. 1).
Mirrored notches were cut at the centerline of the
samples using a razor blade. The notch depths were
varied such that the remaining ligament lengths (`)
varied from 0.5 to 3.5 mm. Because our maximum
thickness was t = 80 µm and specimens widths were
W = 12.7 mm, all specimens were confined to the
recommended range of 3t < ` < W/3 for measuring
plane stress essential work of fracture [19]. Samples
were loaded in tension and stress-strain curves were
measured up to failure. Afterwards, the specific work
of fracture (wf ) was plotted as a function of ligament
length (`). Ductility was measure from the slope and es-
sential work of fracture was calculated by extrapolating
the curve to ` = 0.
3 Results and Discussion
3.1 Tensile Tests on Unnotched Specimens
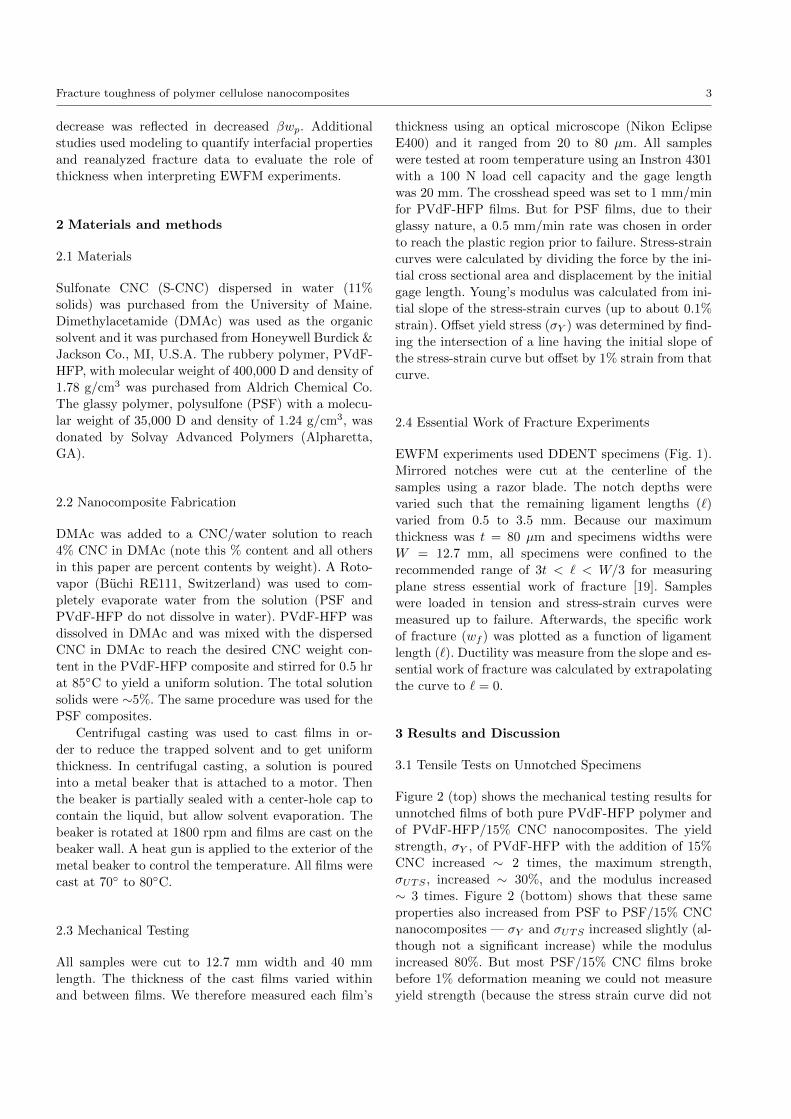
Figure 2 (top) shows the mechanical testing results for
unnotched films of both pure PVdF-HFP polymer and
of PVdF-HFP/15% CNC nanocomposites. The yield
strength, σY , of PVdF-HFP with the addition of 15%
CNC increased ∼ 2 times, the maximum strength,
σUTS , increased ∼ 30%, and the modulus increased
∼ 3 times. Figure 2 (bottom) shows that these same
properties also increased from PSF to PSF/15% CNC
nanocomposites — σY and σUTS increased slightly (al-
though not a significant increase) while the modulus
increased 80%. But most PSF/15% CNC films broke
before 1% deformation meaning we could not measure
yield strength (because the stress strain curve did not
4 M. Shir Mohammadi et al.
0% 15%
Stre
ss (M
Pa)
010
2030
40
Yiel
d St
ress
Ulti
mat
e Te
nsile
Stre
ss
0% 15%
Mod
ulus
(GPa
)
0.0
0.5
1.0
1.5
0% 15%
050
010
0015
0020
0025
00To
tal E
nerg
y (K
J/ m
2 )
0% 15%
Stre
ss (M
Pa)
020
4060
Yiel
d St
ress
Ulti
mat
e Te
nsile
Stre
ss
0% 15%
Mod
ulus
(GPa
)
0.0
0.5
1.0
1.5
2.0
2.5
0% 15%
020
4060
8010
012
014
0To
tal E
nerg
y (K
J/ m
2 )
Fig. 2 Mechanical testing results from stress-strain curves fornanocomposite files. Top: PVdF-HFP and PVdF-HFP/15%CNC films. Bottom: PSF and PSF/15% CNC films.
reach the 1% offset line). For these films yield strength
was assumed the same as σUTS .
These increases all suggested both PVdF-HFP and
PSF are compatible with added CNC and the fibers
were well dispersed. Visual inspection of the films sup-
ported this claim. The increases, especially in ultimate
strengths, also suggest that the CNCs did not introduce
any flaws into the polymer (point of weakness for fail-
ure). Nevertheless, the total fracture energy, Wf , for
PVdF-HFP films decreased 85% with the addition of
15% CNC, while for PSF films, Wf decreased by 70%.
But, does a decrease in Wf mean their toughness has
decreased?
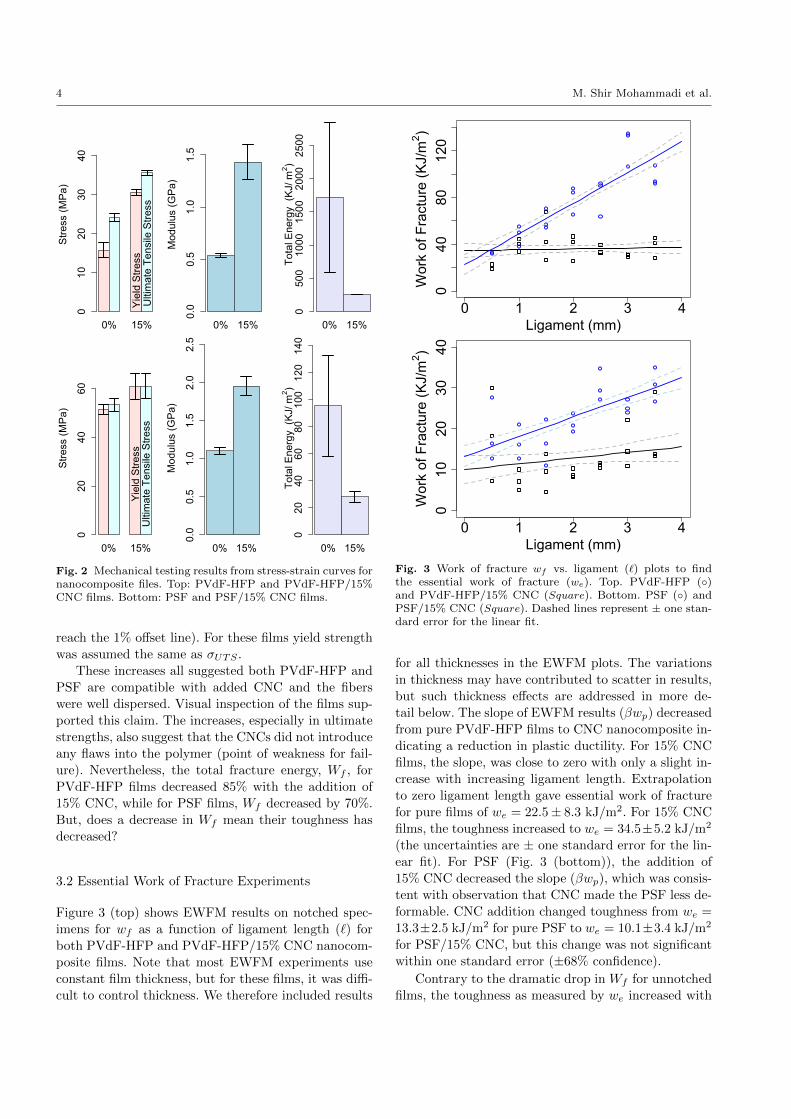
3.2 Essential Work of Fracture Experiments
Figure 3 (top) shows EWFM results on notched spec-
imens for wf as a function of ligament length (`) for
both PVdF-HFP and PVdF-HFP/15% CNC nanocom-
posite films. Note that most EWFM experiments use
constant film thickness, but for these films, it was diffi-
cult to control thickness. We therefore included results
0 1 2 3 4
040
8012
0
Ligament (mm)
Wor
k of
Fra
ctur
e (K
J/m
2 )
0 1 2 3 4
010
2030
40
Ligament (mm)
Wor
k of
Fra
ctur
e (K
J/m
2 )
Fig. 3 Work of fracture wf vs. ligament (`) plots to findthe essential work of fracture (we). Top. PVdF-HFP (◦)and PVdF-HFP/15% CNC (Square). Bottom. PSF (◦) andPSF/15% CNC (Square). Dashed lines represent ± one stan-dard error for the linear fit.
for all thicknesses in the EWFM plots. The variations
in thickness may have contributed to scatter in results,
but such thickness effects are addressed in more de-
tail below. The slope of EWFM results (βwp) decreased
from pure PVdF-HFP films to CNC nanocomposite in-
dicating a reduction in plastic ductility. For 15% CNC
films, the slope, was close to zero with only a slight in-
crease with increasing ligament length. Extrapolation
to zero ligament length gave essential work of fracture
for pure films of we = 22.5± 8.3 kJ/m2. For 15% CNC
films, the toughness increased to we = 34.5±5.2 kJ/m2
(the uncertainties are ± one standard error for the lin-
ear fit). For PSF (Fig. 3 (bottom)), the addition of
15% CNC decreased the slope (βwp), which was consis-
tent with observation that CNC made the PSF less de-
formable. CNC addition changed toughness from we =
13.3±2.5 kJ/m2 for pure PSF to we = 10.1±3.4 kJ/m2
for PSF/15% CNC, but this change was not significant
within one standard error (±68% confidence).
Contrary to the dramatic drop in Wf for unnotched
films, the toughness as measured by we increased with
Fracture toughness of polymer cellulose nanocomposites 5
CNC addition for PVdF-HFP and caused little or no
decrease for PSF. The proponents of EWFM [4, 19]
contend that we is a better measure of toughness than
Wf . In our films the drop in Wf was likely caused by
loss of ductility rather than inherent toughness. When
toughness is separated from ductility, CNC addition in-
creases the toughness of PVdF-HFP films. Even in PSF
where no increase was observed, the fact that tough-
ness did not decrease suggests that the CNC addition
has enhanced toughness enough to overcome the over-
all decrease in ductility. If we assume that the polymer
structure does not change with CNC addition, the in-
crease in the fracture toughness suggests good interfa-
cial properties and a sufficient filler density to retard
crack propagation.
3.3 Interface Modeling
One way to validate interface quality, as suggested by
enhanced properties above, is to compare the observed
increase in modulus to theoretical predictions for a
short fiber composite modulus using a model that ac-
counts for interfacial properties. Nairn and Shir Mo-
hammadi [24] recently developed an enhanced shear lag
model for short fiber composites that explicitly models
imperfect interfaces on both the fiber sides and the fiber
ends. It is called the end-capped shear lag model. The
interface is modeled using interfacial stiffness terms —
rfDn and rfDt — where rf is the fiber radius and Dn
and Dt are imperfect interface parameters for normal
and tangential loading that vary from 0 for a debonded
interface to ∞ for a perfect interface [8]. Although the
end-capped model was verified by comparison to nu-
merical models, it has two problems. As introduced,
the model only applies for aligned short fiber compos-
ites and like all other numerical and analytical mod-
els, it degenerates to a lower bound result when the
fiber to matrix modulus ratio gets high (> 100). The
appendix describes the model and extends it to han-
dle both randomly oriented composites and composites
with soft matrices. This section applies the extended
model to the current experiments.
If all material properties are known except the inter-
facial properties, modeling calculations can give infor-
mation about the interface. The CNC fibers used here
were estimated to have modulus Ef = 105 GPa [23],
Poisson’s ratio νf = 0.28, aspect ratio ρ = 18, and di-
ameter rf = 10 nm. For PSF, the matrix properties
were measured or estimated as modulus Em = 1.2 GPa
and Poisson’s ratio νm = 0.33. For this material, the
fiber to matrix modulus ratio is R = Ef/Em = 87.5.
Because R < 100, the properties can be calculated us-
ing the end-capped shear lag model (see Appendix). If
the interfaces are assumed perfect (rfDn = rfDt =∞)
the calculated composite modulus with 15% fibers is 2.9
GPa, which is above the measured result of 1.8 to 2.0
GPa (see Fig. 2). If we assume the difference is caused
by imperfect interfaces, the experimental result can be
fit by setting rfDn = rfDt = 250 MPa.
For PVdF-HFP, the matrix properties were mea-
sured or estimated as modulus Em = 0.55 GPa and
Poisson’s ratio νm = 0.33. For this material, the fiber
to matrix modulus ratio is R = Ef/Em = 190. Because
R > 100, the properties can be calculated using shear
lag model calibrated for soft matrices that add 93% of
the end-capped model with 7% of a fiber effectiveness
method (see Appendix). In this model the PVdF-HFP
composite with 15% CNC and perfect interfaces is pre-
dicted to have modulus of 2.3 GPa. The experimental
results can be fit by adjusting the interface parameters
to rfDn = rfDt = 350 MPa
These calculations show the interface properties for
PSF and PVdF-HFP are similar with PVdF-HFP per-
haps having a slightly better interface. Because these
interface parameters are difficult to measure, there
are few results to help decide what values consti-
tute a “good” interface. Some previous results for car-
bon/epoxy used Raman methods to directly observe
stress transfer into the fiber and the results could be
fit to determine interface parameters [29]. The result
for sized carbon fibers with a known good interface had
rfDt = 300 MPa. By analogy, the CNC composite here
can be characterized as having good interfaces. More
details about fitting nanocomposite experiments with
interface properties will be reported in a future publi-
cation [37]
3.4 Fractography
Although fillers can reduce ductility (as observed by
slope of EWFM experiments), when viewed as energy
per increment of crack growth, fillers can block crack
propagation and increase toughness (as shown schemat-
ically in Fig. 4). For this mechanism to be effective,
there needs to be a good interfacial bond between
matrix and fibers and enough fibers to inhibit crack
growth. A weak interface causes fiber pull-out and is
less effective at inhibiting crack propagation. Too few
fibers decreases the probability of blocking the crack.
To look for evidence of these mechanisms in our
composites, we used fractography of the fracture sur-
faces for pure polymer and for CNC composites. Figure
5 shows scanning electron microscopy (SEM) images
of the fracture surface for both pure PVdF-HFP and
PVdF-HFP/15% CNC. In pure PVdF-HFP the crack
6 M. Shir Mohammadi et al.
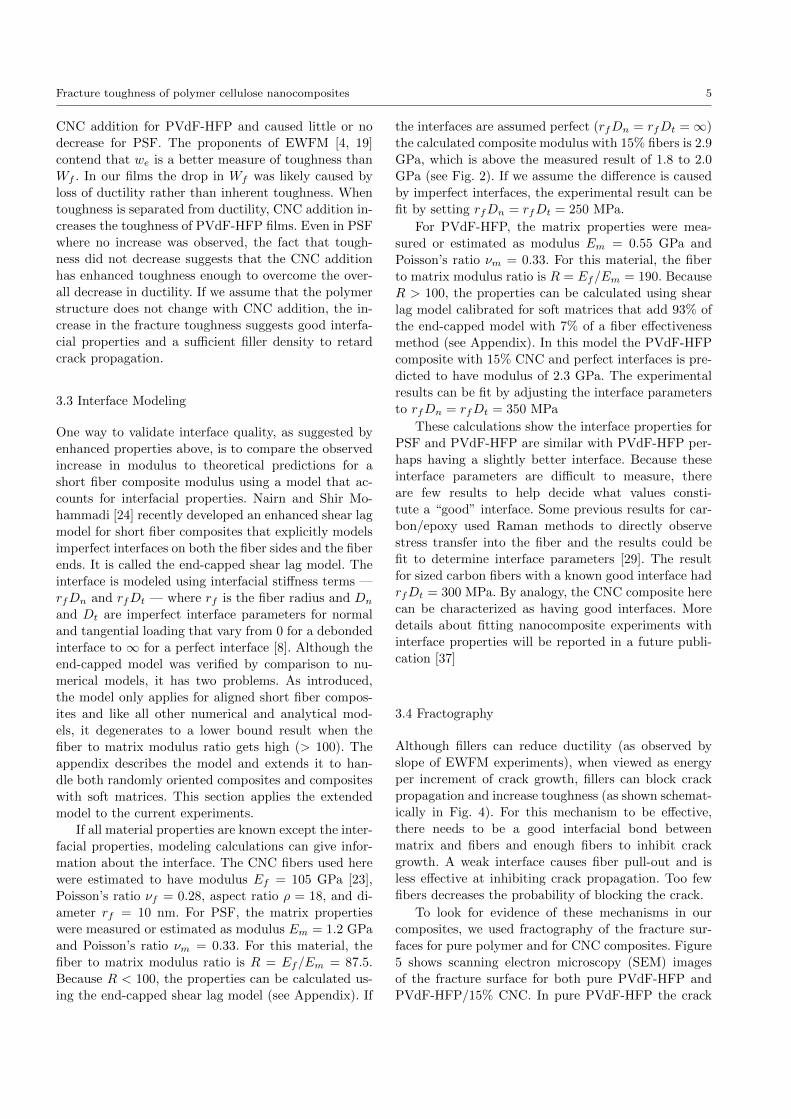
Fig. 4 Schematic picture of fracture surface of polymers (left)and polymer nanocomposite (right) .
Fig. 5 Fracture surface of PVdF-HFP (left) and PVdF-HFP/15% CNC (right). Arrows show the crack propagationdirection.
surface is smooth with straight propagation. In con-
trast, with 15% CNC the crack was not straight and
the surface was rough, presumably because propaga-
tion was deflected by the CNCs. In other words, CNC
addition to the polymer gave a local increase in the
fracture energy as the crack propagated more through
the weaker areas and thus deviated from straight crack
propagation. Such a crack path may explain the ob-
served increase in essential work of fracture. Lin et
al. [17] showed similar crack deviation behavior in
polypropylene filled with 20% CaCO3 nanoparticles
and saw an increase in fracture toughness (as measured
by impact tests).
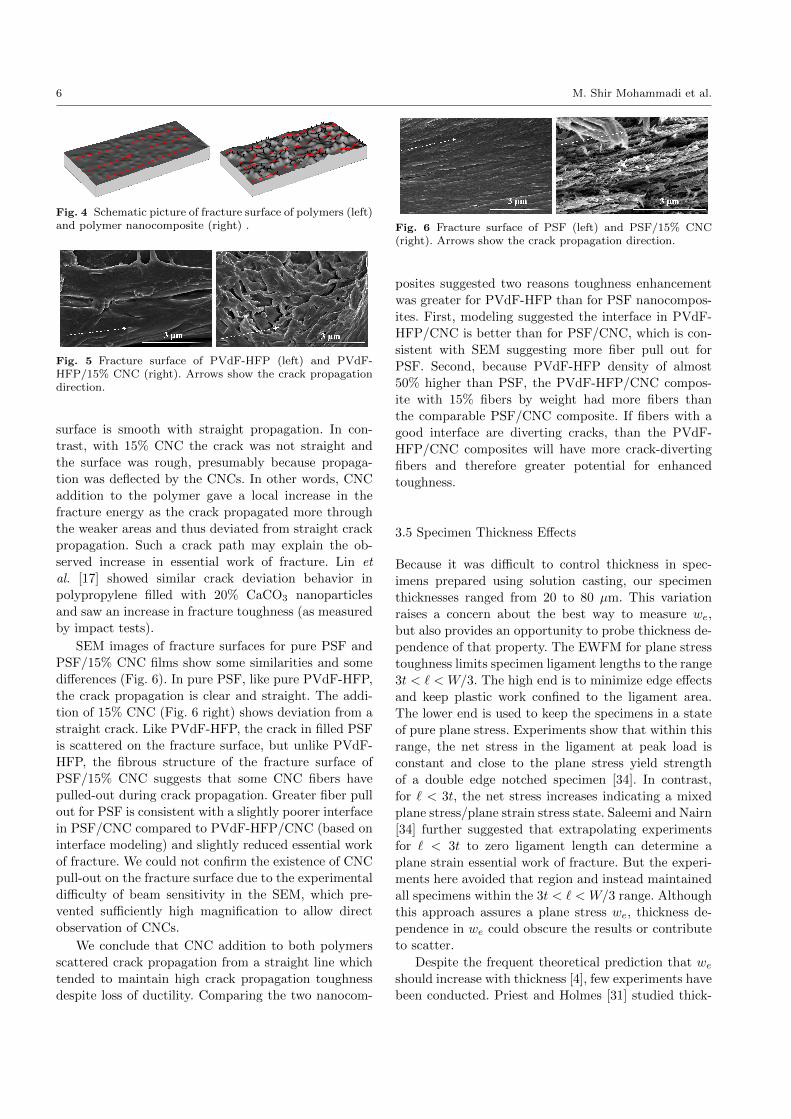
SEM images of fracture surfaces for pure PSF and
PSF/15% CNC films show some similarities and some
differences (Fig. 6). In pure PSF, like pure PVdF-HFP,
the crack propagation is clear and straight. The addi-
tion of 15% CNC (Fig. 6 right) shows deviation from a
straight crack. Like PVdF-HFP, the crack in filled PSF
is scattered on the fracture surface, but unlike PVdF-
HFP, the fibrous structure of the fracture surface of
PSF/15% CNC suggests that some CNC fibers have
pulled-out during crack propagation. Greater fiber pull
out for PSF is consistent with a slightly poorer interface
in PSF/CNC compared to PVdF-HFP/CNC (based on
interface modeling) and slightly reduced essential work
of fracture. We could not confirm the existence of CNC
pull-out on the fracture surface due to the experimental
difficulty of beam sensitivity in the SEM, which pre-
vented sufficiently high magnification to allow direct
observation of CNCs.
We conclude that CNC addition to both polymers
scattered crack propagation from a straight line which
tended to maintain high crack propagation toughness
despite loss of ductility. Comparing the two nanocom-
Fig. 6 Fracture surface of PSF (left) and PSF/15% CNC(right). Arrows show the crack propagation direction.
posites suggested two reasons toughness enhancement
was greater for PVdF-HFP than for PSF nanocompos-
ites. First, modeling suggested the interface in PVdF-
HFP/CNC is better than for PSF/CNC, which is con-
sistent with SEM suggesting more fiber pull out for
PSF. Second, because PVdF-HFP density of almost
50% higher than PSF, the PVdF-HFP/CNC compos-
ite with 15% fibers by weight had more fibers than
the comparable PSF/CNC composite. If fibers with a
good interface are diverting cracks, than the PVdF-
HFP/CNC composites will have more crack-diverting
fibers and therefore greater potential for enhanced
toughness.
3.5 Specimen Thickness Effects
Because it was difficult to control thickness in spec-
imens prepared using solution casting, our specimen
thicknesses ranged from 20 to 80 µm. This variation
raises a concern about the best way to measure we,
but also provides an opportunity to probe thickness de-
pendence of that property. The EWFM for plane stress
toughness limits specimen ligament lengths to the range
3t < ` < W/3. The high end is to minimize edge effects
and keep plastic work confined to the ligament area.
The lower end is used to keep the specimens in a state
of pure plane stress. Experiments show that within this
range, the net stress in the ligament at peak load is
constant and close to the plane stress yield strength
of a double edge notched specimen [34]. In contrast,
for ` < 3t, the net stress increases indicating a mixed
plane stress/plane strain stress state. Saleemi and Nairn
[34] further suggested that extrapolating experiments
for ` < 3t to zero ligament length can determine a
plane strain essential work of fracture. But the experi-
ments here avoided that region and instead maintained
all specimens within the 3t < ` < W/3 range. Although
this approach assures a plane stress we, thickness de-
pendence in we could obscure the results or contribute
to scatter.
Despite the frequent theoretical prediction that weshould increase with thickness [4], few experiments have
been conducted. Priest and Holmes [31] studied thick-
Fracture toughness of polymer cellulose nanocomposites 7
ness effects in steels and saw only small effects. Levita
et al. [15] examined rigid PVC and saw we increase
with thickness. To investigate the thickness effect in
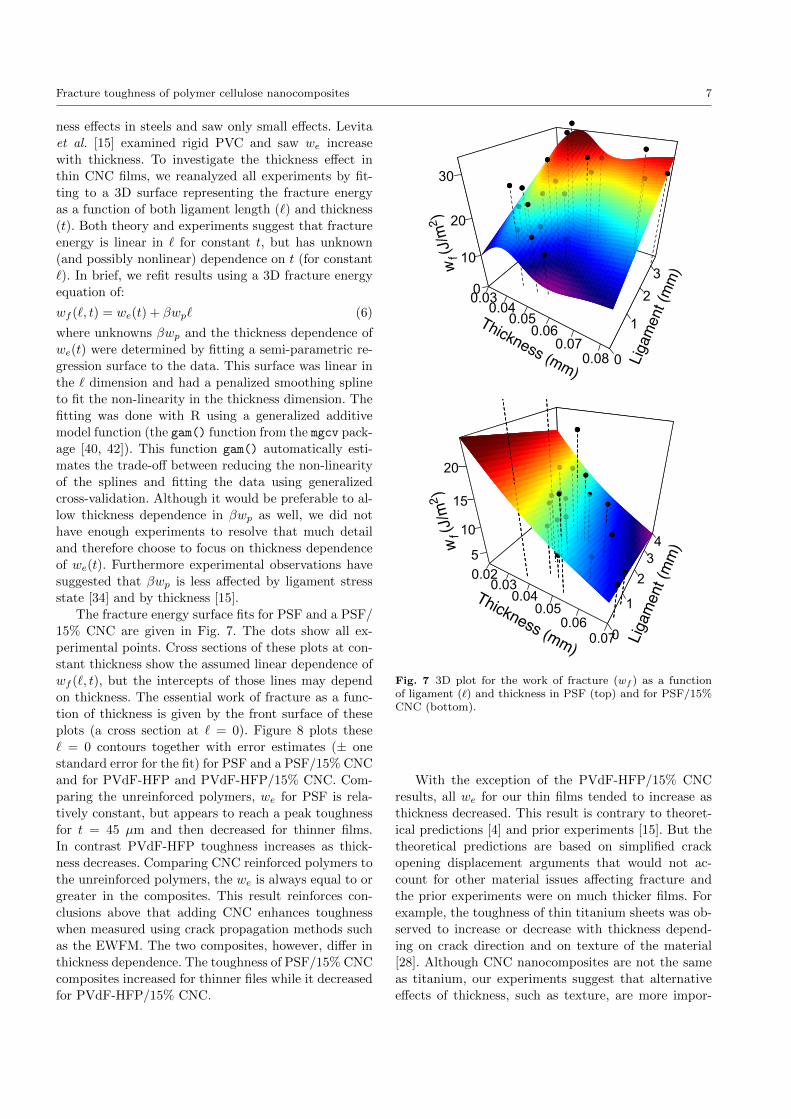
thin CNC films, we reanalyzed all experiments by fit-
ting to a 3D surface representing the fracture energy
as a function of both ligament length (`) and thickness
(t). Both theory and experiments suggest that fracture
energy is linear in ` for constant t, but has unknown
(and possibly nonlinear) dependence on t (for constant
`). In brief, we refit results using a 3D fracture energy
equation of:
wf (`, t) = we(t) + βwp` (6)
where unknowns βwp and the thickness dependence of
we(t) were determined by fitting a semi-parametric re-
gression surface to the data. This surface was linear in
the ` dimension and had a penalized smoothing spline
to fit the non-linearity in the thickness dimension. The
fitting was done with R using a generalized additive
model function (the gam() function from the mgcv pack-
age [40, 42]). This function gam() automatically esti-
mates the trade-off between reducing the non-linearity
of the splines and fitting the data using generalized
cross-validation. Although it would be preferable to al-
low thickness dependence in βwp as well, we did not
have enough experiments to resolve that much detail
and therefore choose to focus on thickness dependence
of we(t). Furthermore experimental observations have
suggested that βwp is less affected by ligament stress
state [34] and by thickness [15].
The fracture energy surface fits for PSF and a PSF/
15% CNC are given in Fig. 7. The dots show all ex-
perimental points. Cross sections of these plots at con-
stant thickness show the assumed linear dependence of
wf (`, t), but the intercepts of those lines may depend
on thickness. The essential work of fracture as a func-
tion of thickness is given by the front surface of these
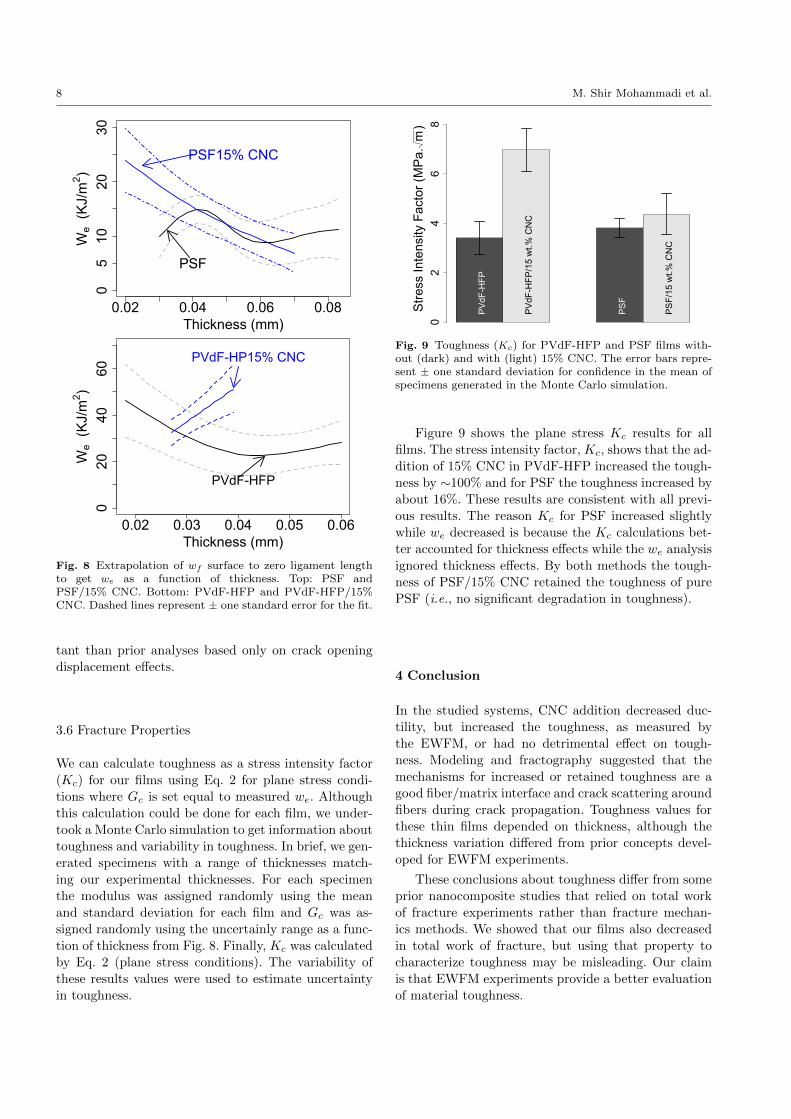
plots (a cross section at ` = 0). Figure 8 plots these
` = 0 contours together with error estimates (± one
standard error for the fit) for PSF and a PSF/15% CNC
and for PVdF-HFP and PVdF-HFP/15% CNC. Com-
paring the unreinforced polymers, we for PSF is rela-
tively constant, but appears to reach a peak toughness
for t = 45 µm and then decreased for thinner films.
In contrast PVdF-HFP toughness increases as thick-
ness decreases. Comparing CNC reinforced polymers to
the unreinforced polymers, the we is always equal to or
greater in the composites. This result reinforces con-
clusions above that adding CNC enhances toughness
when measured using crack propagation methods such
as the EWFM. The two composites, however, differ in
thickness dependence. The toughness of PSF/15% CNC
composites increased for thinner files while it decreased
for PVdF-HFP/15% CNC.
0.030.040.05
0.060.07
0.08 0
1
23
0
10
20
30
Ligam
ent (
mm
)
Thickness (mm)
wf (J
/m2 )
0.020.03
0.040.05
0.060.070
1
234
5
10
15
20
Ligam
ent (
mm
)
Thickness (mm)
wf (J
/m2 )
Fig. 7 3D plot for the work of fracture (wf ) as a functionof ligament (`) and thickness in PSF (top) and for PSF/15%CNC (bottom).
With the exception of the PVdF-HFP/15% CNC
results, all we for our thin films tended to increase as
thickness decreased. This result is contrary to theoret-
ical predictions [4] and prior experiments [15]. But the
theoretical predictions are based on simplified crack
opening displacement arguments that would not ac-
count for other material issues affecting fracture and
the prior experiments were on much thicker films. For
example, the toughness of thin titanium sheets was ob-
served to increase or decrease with thickness depend-
ing on crack direction and on texture of the material
[28]. Although CNC nanocomposites are not the same
as titanium, our experiments suggest that alternative
effects of thickness, such as texture, are more impor-
8 M. Shir Mohammadi et al.
0.02 0.04 0.06 0.08
05
1020
30
Thickness (mm)
We
(KJ/
m2 )
PSF
PSF15% CNC
0.02 0.03 0.04 0.05 0.06
020
4060
Thickness (mm)
We
(KJ/
m2 )
PVdF-HFP
PVdF-HP15% CNC
Fig. 8 Extrapolation of wf surface to zero ligament lengthto get we as a function of thickness. Top: PSF andPSF/15% CNC. Bottom: PVdF-HFP and PVdF-HFP/15%CNC. Dashed lines represent ± one standard error for the fit.
tant than prior analyses based only on crack opening
displacement effects.
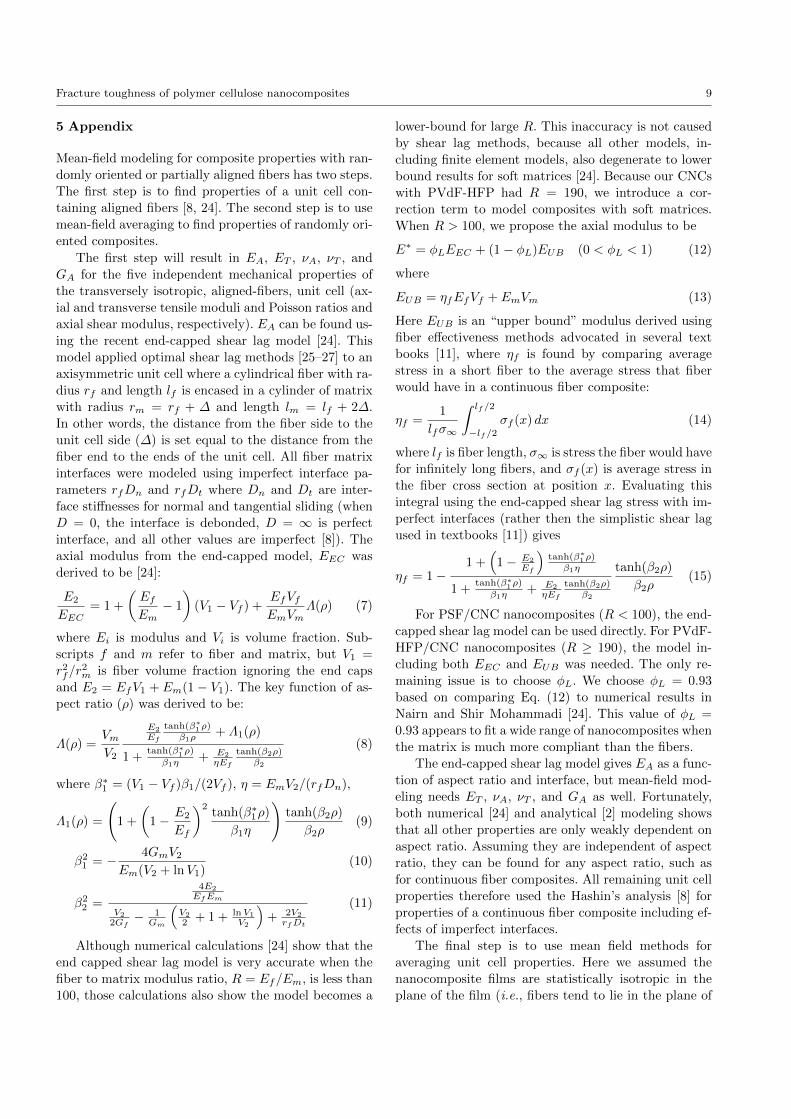
3.6 Fracture Properties
We can calculate toughness as a stress intensity factor
(Kc) for our films using Eq. 2 for plane stress condi-
tions where Gc is set equal to measured we. Although
this calculation could be done for each film, we under-
took a Monte Carlo simulation to get information about
toughness and variability in toughness. In brief, we gen-
erated specimens with a range of thicknesses match-
ing our experimental thicknesses. For each specimen
the modulus was assigned randomly using the mean
and standard deviation for each film and Gc was as-
signed randomly using the uncertainly range as a func-
tion of thickness from Fig. 8. Finally, Kc was calculated
by Eq. 2 (plane stress conditions). The variability of
these results values were used to estimate uncertainty
in toughness.
Stre
ss In
tens
ity F
acto
r (M
Pa.
m)
02
46
8
PVdF
-HFP
PVdF
-HFP
/15
wt.%
CN
C
PSF
PSF/
15 w
t.% C
NC
Fig. 9 Toughness (Kc) for PVdF-HFP and PSF films with-out (dark) and with (light) 15% CNC. The error bars repre-sent ± one standard deviation for confidence in the mean ofspecimens generated in the Monte Carlo simulation.
Figure 9 shows the plane stress Kc results for all
films. The stress intensity factor, Kc, shows that the ad-
dition of 15% CNC in PVdF-HFP increased the tough-
ness by ∼100% and for PSF the toughness increased by
about 16%. These results are consistent with all previ-
ous results. The reason Kc for PSF increased slightly
while we decreased is because the Kc calculations bet-
ter accounted for thickness effects while the we analysis
ignored thickness effects. By both methods the tough-
ness of PSF/15% CNC retained the toughness of pure
PSF (i.e., no significant degradation in toughness).
4 Conclusion
In the studied systems, CNC addition decreased duc-
tility, but increased the toughness, as measured by
the EWFM, or had no detrimental effect on tough-
ness. Modeling and fractography suggested that the
mechanisms for increased or retained toughness are a
good fiber/matrix interface and crack scattering around
fibers during crack propagation. Toughness values for
these thin films depended on thickness, although the
thickness variation differed from prior concepts devel-
oped for EWFM experiments.
These conclusions about toughness differ from some
prior nanocomposite studies that relied on total work
of fracture experiments rather than fracture mechan-
ics methods. We showed that our films also decreased
in total work of fracture, but using that property to
characterize toughness may be misleading. Our claim
is that EWFM experiments provide a better evaluation
of material toughness.
Fracture toughness of polymer cellulose nanocomposites 9
5 Appendix
Mean-field modeling for composite properties with ran-
domly oriented or partially aligned fibers has two steps.
The first step is to find properties of a unit cell con-
taining aligned fibers [8, 24]. The second step is to use
mean-field averaging to find properties of randomly ori-
ented composites.
The first step will result in EA, ET , νA, νT , and
GA for the five independent mechanical properties of
the transversely isotropic, aligned-fibers, unit cell (ax-
ial and transverse tensile moduli and Poisson ratios and
axial shear modulus, respectively). EA can be found us-
ing the recent end-capped shear lag model [24]. This
model applied optimal shear lag methods [25–27] to an
axisymmetric unit cell where a cylindrical fiber with ra-
dius rf and length lf is encased in a cylinder of matrix
with radius rm = rf + ∆ and length lm = lf + 2∆.
In other words, the distance from the fiber side to the
unit cell side (∆) is set equal to the distance from the
fiber end to the ends of the unit cell. All fiber matrix
interfaces were modeled using imperfect interface pa-
rameters rfDn and rfDt where Dn and Dt are inter-
face stiffnesses for normal and tangential sliding (when
D = 0, the interface is debonded, D = ∞ is perfect
interface, and all other values are imperfect [8]). The
axial modulus from the end-capped model, EEC was
derived to be [24]:
E2
EEC= 1 +
(EfEm− 1
)(V1 − Vf ) +
EfVfEmVm
Λ(ρ) (7)
where Ei is modulus and Vi is volume fraction. Sub-
scripts f and m refer to fiber and matrix, but V1 =
r2f/r2m is fiber volume fraction ignoring the end caps
and E2 = EfV1 + Em(1− V1). The key function of as-
pect ratio (ρ) was derived to be:
Λ(ρ) =VmV2
E2
Ef
tanh(β∗1ρ)
β1ρ+ Λ1(ρ)
1 +tanh(β∗
1ρ)
β1η+ E2
ηEf
tanh(β2ρ)β2
(8)
where β∗1 = (V1 − Vf )β1/(2Vf ), η = EmV2/(rfDn),
Λ1(ρ) =
(1 +
(1− E2
Ef
)2tanh(β∗1ρ)
β1η
)tanh(β2ρ)
β2ρ(9)
β21 = − 4GmV2
Em(V2 + lnV1)(10)
β22 =
4E2
EfEm
V2
2Gf− 1
Gm
(V2
2 + 1 + lnV1
V2
)+ 2V2
rfDt
(11)
Although numerical calculations [24] show that the
end capped shear lag model is very accurate when the
fiber to matrix modulus ratio, R = Ef/Em, is less than
100, those calculations also show the model becomes a
lower-bound for large R. This inaccuracy is not caused
by shear lag methods, because all other models, in-
cluding finite element models, also degenerate to lower
bound results for soft matrices [24]. Because our CNCs
with PVdF-HFP had R = 190, we introduce a cor-
rection term to model composites with soft matrices.
When R > 100, we propose the axial modulus to be
E∗ = φLEEC + (1− φL)EUB (0 < φL < 1) (12)
where
EUB = ηfEfVf + EmVm (13)
Here EUB is an “upper bound” modulus derived using
fiber effectiveness methods advocated in several text
books [11], where ηf is found by comparing average
stress in a short fiber to the average stress that fiber
would have in a continuous fiber composite:
ηf =1
lfσ∞
∫ lf/2
−lf/2σf (x) dx (14)
where lf is fiber length, σ∞ is stress the fiber would have
for infinitely long fibers, and σf (x) is average stress in
the fiber cross section at position x. Evaluating this
integral using the end-capped shear lag stress with im-
perfect interfaces (rather then the simplistic shear lag
used in textbooks [11]) gives
ηf = 1−1 +
(1− E2
Ef
)tanh(β∗
1ρ)β1η
1 +tanh(β∗
1ρ)
β1η+ E2
ηEf
tanh(β2ρ)β2
tanh(β2ρ)
β2ρ(15)
For PSF/CNC nanocomposites (R < 100), the end-
capped shear lag model can be used directly. For PVdF-
HFP/CNC nanocomposites (R ≥ 190), the model in-
cluding both EEC and EUB was needed. The only re-
maining issue is to choose φL. We choose φL = 0.93
based on comparing Eq. (12) to numerical results in
Nairn and Shir Mohammadi [24]. This value of φL =
0.93 appears to fit a wide range of nanocomposites when
the matrix is much more compliant than the fibers.
The end-capped shear lag model gives EA as a func-
tion of aspect ratio and interface, but mean-field mod-
eling needs ET , νA, νT , and GA as well. Fortunately,
both numerical [24] and analytical [2] modeling shows
that all other properties are only weakly dependent on
aspect ratio. Assuming they are independent of aspect
ratio, they can be found for any aspect ratio, such as
for continuous fiber composites. All remaining unit cell
properties therefore used the Hashin’s analysis [8] for
properties of a continuous fiber composite including ef-
fects of imperfect interfaces.
The final step is to use mean field methods for
averaging unit cell properties. Here we assumed the
nanocomposite films are statistically isotropic in the
plane of the film (i.e., fibers tend to lie in the plane of
10 M. Shir Mohammadi et al.
the film). For this special case, an upper bound modu-
lus can be found from unit cell properties using [22]:
Ec ≤ 4U2
(1− U2
U1
)(16)
U1 =EA(3 + 2ν′A) + 3ET + 4GA(1− νAν′A)
8(1− νAν′A)(17)
U2 =EA(1− 2ν′A) + ET + 4GA(1− νAν′A)
8(1− νAν′A)(18)
where ν′A = νAET /EA and νT is not needed.
Compliance with Ethical Standards
Funding: This project was support, in part, by the
National Science Foundation grant CMMI 1161305, the
USDA Forest Products Lab under 11-JV-11111129-137,
and National Institute of Food and Agriculture under
Mclntyre Stennis OREZ-WSE-839-U. Also, we thank
Jenna Schardt for the SEM images.
Conflict of Interest: The authors declare that they
have no conflict of interest.
References
1. Anderson, T., Anderson, T.: Fracture Mechanics:
Fundamentals and Applications, Third Edition.
CRC Press (2005)
2. Christenson, R.M.: Mechanics of Composite Mate-
rials. John Wiley & Sons, New York (1979)
3. Cotterell, B., Chia, J., Hbaieb, K.: Fracture mech-
anisms and fracture toughness in semicrystalline
polymer nanocomposites. Engineering Fracture
Mechanics 74(7), 1054 – 1078 (2007)
4. Cotterell, B., Reddell, J.K.: The essential work of
plane stress ductile fracture. Int. J. Fract. Mech.
13, 267–277 (1977)
5. Farshid, B., Lalwani, G., ShirMohammadi, M., Si-
monsen, J., Sitharaman, B.: Boron nitride nan-
otubes and nanoplatelets as reinforcing agents of
polymeric matrices for bone tissue engineering.
Journal of Biomedical Materials Research: Part B
- Applied Biomaterials (2015)
6. Gojny, F., Wichmann, M., Kopke, U., Fiedler, B.,
Schulte, K.: Carbon nanotube-reinforced epoxy-
composites: enhanced stiffness and fracture tough-
ness at low nanotube content. Composites Science
and Technology 64(15), 2363 – 2371 (2004)
7. Gopalan Nair, K., Dufresne, A., Gandini, A., Bel-
gacem, M.N.: Crab shell chitin whiskers reinforced
natural rubber nanocomposites. 3. effect of chem-
ical modification of chitin whiskers. Biomacro-
molecules 4(6), 1835–1842 (2003)
8. Hashin, Z.: Thermoelastic properties of fiber com-
posites with imperfect interface. Mechanics of Ma-
terials 8(4), 333 – 348 (1990)
9. Henriksson, M., Berglund, L.A., Isaksson, P., Lind-
strom, T., Nishino, T.: Cellulose nanopaper struc-
tures of high toughness. Biomacromolecules 9(6),
1579–1585 (2008)
10. Huang, J., Keskkula, H., Paul, D.: Rubber tough-
ening of an amorphous polyamide by functionalized
{SEBS} copolymers: morphology and izod impact
behavior. Polymer 45(12), 4203 – 4215 (2004)
11. Hull, D., Clyne, T.: An introduction to composite
materials. Cambridge University Press (1996)
12. Jovanovic, G., Atre, S., Paul, B., Simonsen, J.,
Remcho, V., Chang, C.: Microfluidic devices, par-
ticularly filtration devices comprising polymeric
membranes, and method for their manufacture and
use (2012). US Patent 8,137,554
13. Kelley, J., Simonsen, J., Ding, J.: Poly(vinylidene
fluoride-co-hexafluoropropylene) nanocomposites
incorporating cellulose nanocrystals with potential
applications in lithium ion batteries. Journal of
Applied Polymer Science 127(1), 487–493 (2013)
14. Labour, T., Vigier, G., Seguela, R., Gauthier,
C., Orange, G., Bomal, Y.: Influence of the ?-
crystalline phase on the mechanical properties of
unfilled and calcium carbonate-filled polypropy-
lene: Ductile cracking and impact behavior. Journal
of Polymer Science Part B: Polymer Physics 40(1),
31–42 (2002)
15. Levita, G., Parisi, L., Marchetti, A., Bartolommei,
L.: Effects of thickness on the specific essential work
of fracture of rigid PVC. Polymer Engineering &
Science 36(20), 2534–2541 (1996)
16. Lim, S.H., Dasari, A., Yu, Z.Z., Mai, Y.W., Liu, S.,
Yong, M.S.: Fracture toughness of nylon 6/organ-
oclay/elastomer nanocomposites. Composites Sci-
ence and Technology 67(14), 2914 – 2923 (2007)
17. Lin, Y., Chen, H., Chan, C.M., Wu, J.: High
impact toughness polypropylene/caco3 nanocom-
posites and the toughening mechanism. Macro-
molecules 41(23), 9204–9213 (2008)
18. Ljungberg, N., Bonini, C., Bortolussi, F., Boisson,
C., Heux, L., Cavaille: New nanocomposite ma-
terials reinforced with cellulose whiskers in atac-
tic polypropylene:? effect of surface and disper-
sion characteristics. Biomacromolecules 6(5), 2732–
2739 (2005)
19. Mai, Y.W., Cotterell, B.: On the essential work of
ductile fracture in polymers. Int. J. Fract. 32, 105–
125 (1986)
20. Mai, Y.W., Cotterell, B., Horlyck, R., Visna, G.:
The essential work of plane stress ductile fracture of
Fracture toughness of polymer cellulose nanocomposites 11
linear polyethylene. Polymer Engineering & Science
27, 804–809 (1987)
21. Matsumoto, N., Nairn, J.A.: The fracture tough-
ness of medium density fiberboard (mdf) including
the effects of fiber bridging and crack–plane inter-
ference. Engineering Fracture Mechanics 76(18),
2748 – 2757 (2009)
22. Moon, R.J., Martini, A., Nairn, J., Simonsen, J.,
Youngblood, J.: Cellulose nanomaterials review:
structure, properties and nanocomposites. Chem.
Soc. Rev. 40, 3941–3994 (2011)
23. Rusli, R., Eichhorn, S. J.: Determination of the
stiffness of cellulose nanowhiskers and the fiber-
matrix interface in a nanocomposite using Raman
spectroscopy. Applied Physics Letters. 93, 033111
(2008)
24. Nairn, J., Mohammadi, M.S.: Numerical and ana-
lytical modeling of aligned short fiber composites
including imperfect interfaces. Composites Part A:
Applied Science and Manufacturing 77(0), 26 – 36
(2015)
25. Nairn, J.A.: On the use of shear-lag methods for
analysis of stress transfer in unidirectional compos-
ites. Mechanics of Materials 26, 63–80 (1997)
26. Nairn, J.A.: Generalized shear-lag analysis includ-
ing imperfect interfaces. Advanced Composite Let-
ters 13, 263–274 (2004)
27. Nairn, J.A., Mendels, D.A.: On the use of pla-
nar shear-lag methods for stress-transfer analysis
of multilayered composites. Mechanics of Materials
33, 335–362 (2001)
28. Nasiri-Abarbekoh, H., Ekrami, A., Ziaei-Moayyed,
A.A.: Effects of thickness and texture on mechani-
cal properties anistropy of commerically pure tita-
nium thin sheets. Materials & Design 44(528-534)
(2013)
29. Paipetis, A., Galiotis, C., Liu, Y.C., Nairn, J.A.:
Stress transfer from the matrix to the fibre in a
fragmentation test: Raman experiments and ana-
lytical modeling. Journal of composite materials
33(4), 377–399 (1999)
30. Pei, A., Malho, J.M., Ruokolainen, J., Zhou, Q.,
Berglund, L.A.: Strong nanocomposite reinforce-
ment effects in polyurethane elastomer with low
volume fraction of cellulose nanocrystals. Macro-
molecules 44(11), 4422–4427 (2011)
31. Priest, A.H., Holmes, B.: A multi-test piece ap-
proach to the fracture characterization of linepipe
steels. Int. J. Fract. 17(3), 277–299 (1981)
32. Ragosta, G., Abbate, M., Musto, P., Scarinzi, G.,
Mascia, L.: Epoxy-silica particulate nanocompos-
ites: Chemical interactions, reinforcement and frac-
ture toughness. Polymer 46(23), 10,506 – 10,516
(2005)
33. Rink, M., Andena, L., Marano, C.: The essential
work of fracture in relation to j-integral. Engineer-
ing Fracture Mechanics 127(0), 46 – 55 (2014)
34. Saleemi, A.S., Nairn, J.A.: The plane-strain essen-
tial work of fracture as a measure of the fracture
toughness of ductile polymers. Polymer Engineer-
ing & Science 30(4), 211–218 (1990)
35. Shah, D., Maiti, P., Jiang, D., Batt, C., Giannelis,
E.: Effect of nanoparticle mobility on toughness
of polymer nanocomposites. Advanced Materials
17(5), 525–528 (2005)
36. Shir Mohammadi, M., Nairn, J.A.: Crack propaga-
tion and fracture toughness of solid balsa used for
cores of sandwich composites. Journal of Sandwich
Structures and Materials 16(1), 22–41 (2014)
37. Shir Mohammadi, M., Nairn, J.A.: Mean-field mod-
eling of soft-fiber composites with imperfect inter-
faces and soft matrices (2016). In preperation
38. Siqueira, G., Bras, J., Dufresne, A.: Cellulose
whiskers versus microfibrils: Influence of the na-
ture of the nanoparticle and its surface function-
alization on the thermal and mechanical properties
of nanocomposites. Biomacromolecules 10(2), 425–
432 (2009)
39. Svagan, A.J., Azizi Samir, M.A.S., Berglund, L.A.:
Biomimetic polysaccharide nanocomposites of high
cellulose content and high toughness. Biomacro-
molecules 8(8), 2556–2563 (2007)
40. Team, R.C.: R: A Language and Environment for
Statistical Computing. R Foundation for Statistical
Computing, Vienna, Austria (2014)
41. Wichmann, M.H., Schulte, K., Wagner, H.D.: On
nanocomposite toughness. Composites Science and
Technology 68(1), 329 – 331 (2008)
42. Wood, S.: mgcv: Mixed GAM Computation Vehicle
with GCV/AIC/REML Smoothness Estimation. R
package version 1.8-6 (2015)
Related Documents