This article appeared in a journal published by Elsevier. The attached copy is furnished to the author for internal non-commercial research and education use, including for instruction at the authors institution and sharing with colleagues. Other uses, including reproduction and distribution, or selling or licensing copies, or posting to personal, institutional or third party websites are prohibited. In most cases authors are permitted to post their version of the article (e.g. in Word or Tex form) to their personal website or institutional repository. Authors requiring further information regarding Elsevier’s archiving and manuscript policies are encouraged to visit: http://www.elsevier.com/authorsrights

Welcome message from author
This document is posted to help you gain knowledge. Please leave a comment to let me know what you think about it! Share it to your friends and learn new things together.
Transcript

This article appeared in a journal published by Elsevier. The attached
copy is furnished to the author for internal non-commercial research
and education use, including for instruction at the authors institution
and sharing with colleagues.
Other uses, including reproduction and distribution, or selling or
licensing copies, or posting to personal, institutional or third party
websites are prohibited.
In most cases authors are permitted to post their version of the
article (e.g. in Word or Tex form) to their personal website or
institutional repository. Authors requiring further information
regarding Elsevier’s archiving and manuscript policies are
encouraged to visit:
http://www.elsevier.com/authorsrights

Author's personal copy
The five pillar EPPS framework for quantifying, mapping and managingecosystem services
Olaf Bastian n, Ralf-Uwe Syrbe, Matthias Rosenberg, Doreen Rahe, Karsten Grunewald
Leibniz Institute of Ecological Urban and Regional Development, Weberplatz 1, 01217 Germany
a r t i c l e i n f o
Article history:
Received 4 October 2012Received in revised form22 March 2013Accepted 1 April 2013Available online 3 May 2013
Keywords:
Ecosystem properties, potentials, services,benefitsMonetary valuesLand-use change modelling toolSaxonySoil erosionYield losses
a b s t r a c t
This paper introduces an ecosystem services assessment framework with five pillars: ecosystemproperties, potentials, services, benefits/values, and beneficiaries. In a case study in the district of Görlitz(Eastern Saxony, Germany), we present an exemplary application for two ecosystem services: crop foodproduction and soil erosion regulation.
The farmland of the district can produce a total of about 518,000 t of crop food (rye) per year,depending on yield potential. Corrected for the mean price of the crop rye, this translates to a value ofabout 100 million € annually. At the same time, 606,000 t of soil loss must be calculated per year, whichcorresponds to 36 million € in damages. If 7% of the farmland were to be transformed into grassland orforest, the provisioning service would sink by 37,000 t of rye, for an income loss of approx. €7.4 millionper year. On the other hand, soil erosion regulationwould be enhanced and soil loss would be reduced byc. 20%, corresponding to on-site benefit of €7.1 million. Within a more intensively used partial study area(with dominating loess soils), the benefits of the erosion regulation service (€656,000) exceed the yieldlosses (€245,000) more than twice.
& 2013 Elsevier B.V. All rights reserved.
1. Introduction
The assessment of ecosystem services in a structured wayneeds suitable, flexible frameworks including robust proceduresor guidelines for each working step, e.g. indicator selection,valuation rules, the consideration of space, scale and time aspects,stakeholder involvement, as well as a consistent, logical termino-logical system (e.g. Bastian et al. 2012a, 2012b; van Oudenhovenet al., 2012; Seppelt et al., 2012).
Recently the EPPS framework (Ecosystem Properties, Potentialsand Services) for the assessment of ecosystem services wasdeveloped (Grunewald and Bastian, 2010; Bastian et al., 2012a),which is based on three interdependent and related pillars, andwhich highlights the differences between the biophysical prere-quisites of ecosystems and their potential and real supply ofecosystem services. Here, we propose an extended EPPS frame-work with five pillars to emphasize more on additional aspectssuch as benefits/values, beneficiaries and management.
The goal of this paper is to describe and explain this newframework. Its practical application will be exemplified by way oftwo ecosystem services, one provisioning service (crop foodproduction) and one regulation service (soil erosion regulation)in the district of Görlitz, eastern part of Saxony in Germany. Both
services will be assessed by monetary terms in order to comparetrade-offs. Management measures to enhance the supply ofecosystem services and to reduce risks are proposed. For thispurpose, a special selection tool is developed, which helps toconstruct a data pool of areas where land use changes (e.g.afforestation of arable land or conversion into grassland) shouldtake place.
2. Methods
2.1. The extended EPPS framework
The extended EPPS framework (Fig. 1) consists of five pillars,each requiring its own perspective and specific procedures todescribe and map ecosystem services. On the left side of theextended EPPS framework are the properties of ecosystems –
individual objects, parts of objects, and even entire ecosystemcomplexes – and the structures and processes (e.g. soil qualities,nutrient cycles, biological diversity) which form the basis for allecosystem services, and moreover, for the existence of humansand of human society in general. According to van Oudenhovenet al. (2012), ecosystem properties are the set of ecologicalconditions, structures and processes that determine whether anecosystem service can be supplied.
As a component of nature, this basis for services is materiallymanifest and can, in principle, be measured (Staub et al., 2011).
Contents lists available at SciVerse ScienceDirect
journal homepage: www.elsevier.com/locate/ecoser
Ecosystem Services
2212-0416/$ - see front matter & 2013 Elsevier B.V. All rights reserved.http://dx.doi.org/10.1016/j.ecoser.2013.04.003
n Corresponding author. Tel.: +49 351 4679 279.E-mail address: [email protected] (O. Bastian).
Ecosystem Services 4 (2013) 15–24

Author's personal copy
Hence, the analysis of ecosystem properties is predominantlydriven by natural scientific methods, using analytical indicators.The results represent facts and data that are initially without anyrelationship to potential societal benefits, values or demands forservices by society. Since this ecological endowment is first of allscientifically based, it has to be assigned mainly to the factuallevel. The analysis of ecosystems properties represents thestarting-point of the work – the scientific-analytical basis – andan understanding of the functional principles of nature. Such moreor less value-free ecological categories as complexity, diversity,rarity, ecological integrity, or ecosystem health, also belong topillar 1, i.e. that of ecosystem properties.
Depending on their properties, ecosystems are able to supplyservices; they have particular potentials or capacities for that.Potentials have consciously been included as pillar 2, so as todistinguish between the possibility of use and an actual use, whichis the expression of the real service (Bastian et al., 2012a).Potentials can be regarded and quantified as stocks of ecosystemservices, while the services themselves represent the actual flows(Haines-Young et al., 2012). In terms of the ecosystem potentials,various preconditions need to be considered, e.g. the ecologicalcarrying capacity and the resilience, which is defined as “thecapacity of a system to absorb and utilize or even benefit fromperturbations and changes that attain it, and so to persist withouta qualitative change in the system” (Holling in Ring et al., 2010).The assessment of ecosystem potentials also pursues the goal ofascertaining the potential use of particular services, and is morenormative than a mere accounting of ecosystem properties. Itconstitutes an important basis for planning, e.g. for the imple-mentation of sustainable land use systems: the suitability of anecosystem to carry different forms of land use can be established,the available but still unused potentials can be put to actual use,and risks can be estimated.
Only human needs or demands actually convert a potential intoa real service. Ecosystem services, the third pillar of the framework,reflect an even stronger human perspective (value level), since theservices (and goods) are in fact currently valued, demanded orused. In other words, the status of an ecosystem service isinfluenced not only by its provision of a certain service, but alsoby human needs and the desired level of provision for this service
by society, which connects inseparably supply and demand ofecosystem services (Burkhard et al., 2012; Syrbe and Walz, 2012).
The analysis of ecosystem services always involves a valuationstep, i.e., scientific findings (facts) are transformed into humandriven value categories. The decisive factor is the combination ofthe various causal areas in the relationship between society andnature, e.g. (but not only) in the form of economic valuation (e.g.Costanza et al., 1997; Spangenberg and Settele, 2010). Through thelink “ecosystem services”, human beings benefit from ecosystems.That means, ecosystems yield benefits and values (pillar 4), whichcontribute to human well-being. The benefit is the socio-culturalor economic welfare gain provided through the ecosystem service,such as health, employment and income. Moreover, the benefits ofecosystem services must have a direct relationship to human well-being (Fisher and Turner (2008)). Value is most commonly definedas the contribution of ecosystem services to goals, objectives orconditions that are specified by a user (van Oudenhoven et al.,2012). Actors in society can attach a value to these benefits.Monetary value can help to internalize so-called externalities(impacts, side-effects) in economic valuation procedures so thatthey can be better taken into account in decision-making pro-cesses at all levels. It should be noted that not all dimensions ofhuman well-being can be expressed in monetary terms, e.g.cultural and spiritual values.
An ecosystem service is only a service if there is a humanbenefit. Without human beneficiaries, there are no ecosystemservices (Fisher et al., 2009). Accordingly, there is a disserviceonly if humans suffer harm. The stakeholders, providers, users orbeneficiaries of ecosystems and their services (pillar 5) can besingle persons, groups, or society as a whole. Not only do theydepend or benefit from ecosystems, they in turn react uponecosystems.
The use and management of services (often regulated andcontrolled by decisions and legislation tools) can modify or changethe properties and potentials of ecosystems. Appropriate manage-
ment has to bridge the gap between the present state and futuretargets for ecosystem services. Ecosystem management meanstreats areas at various scales in such a way that ecological servicesand biological resources are restored and conserved, while appro-priate human uses are sustained (Schneiders et al., 2012).
Fig. 1. Conceptual framework for the analysis of ecosystem services—the extended EPPS framework.
O. Bastian et al. / Ecosystem Services 4 (2013) 15–2416

Author's personal copy
All pillars or categories of the framework can or should beanalyzed and differentiated in terms of space (e.g. scale, dimen-sion, patterns) and time (e.g. driving forces, changes, scenarios)aspects. Spatial aspects (e.g. minimum function areas, the arrange-ment of parts of the ecosystem or functional traits, ecosystempatterns and complexes, interactions between elements as well asfluxes of matter, energy and living-beings, service providing areas/service connecting areas and service benefiting areas), shouldalways be taken into consideration. Spatial characteristics ofecosystem services are important not only for the assessments,but for the maintenance of ecosystem services as such (Bastianet al., 2012b; Syrbe and Walz, 2012).
Finally, it should be taken into account that ecosystems, thepotentials and services they deliver are subject to constantchanges triggered by driving forces (e.g. climate change, demo-graphic change, technological development). The state of ecosys-tems and ecosystem services can be predicted or assessed fordifferent scenarios. Not only ecosystems and ecosystem servicescan change but also the value humans attribute to them.
2.2. The case study
2.2.1. Overview
The practical application of the five EPPS pillars is performedusing two ecosystem services as examples: crop food provisionand erosion regulation. First, the ecosystem properties (pillar 1)which are relevant for both services are described. Among others,these properties relate to soil, climate, vegetation, and land use,differentiated by landscape units. Second, potentials are deter-mined within the frame of pillar 2. Regarding pillar 3, theecosystem services are then calculated in terms of real matters(yield and soil loss in tons). Fourth, the benefits from the twoservices are given in monetary terms (pillar 4). The beneficiaries ofboth services (pillar 5) are identified. Because the two servicescannot work without interacting trade-offs and synergies existbetween them. Therefore, management measures were developedin order to improve the ecological service of erosion regulationwithout limiting the provisioning service of crop production morethan necessary in the study area. The newly elaborated tool LUMO(LandUse change MOdeller tool) is applied to elaborate suitablemeasures of ecological optimization. Assuming the proposedmeasures, the application of pillars 3 and 4 are repeated in orderto estimate the effectiveness of the management.
2.2.2. Characteristics of the study area: ecosystem properties
The characteristics of the study areas can be regarded as pillar 1(ecosystem properties). The area of the regional case study(Figs. 3 and 4) is coextensive with the approx. 2106 km2 districtof Görlitz (Saxony, Germany, 275,000 inhabitants), in the tri-national border area with Poland and the Czech Republic. Thisdistrict is characterized by a wide variety of natural areas,extending from the lowlands to the mountains.
Görlitz district includes, in its lowland northern part, a part ofthe soil regions of the old moraine landscapes, loess and sandy loessareas in its central part, and mountainous and hilly country in thesouth. The first two soil regions account for the major part, andhence are the focus of our observations. The old moraine landscapeincludes largely sandy soils with minimal soil quality and low waterstorage capacity. The difficult framework conditions mean reducedagricultural yield and the planting of relatively low-demand crops.In the lowlands, the danger of water erosion is slight, while winderosion is a major factor, due to the sandy soil which dries outquickly. However, the large forested portion, primarily pine,prevents major erosion loss. The potential natural vegetation in
the north is pine-oak forests on groundwater-remote sites, andbirch-English oak forests on groundwater-proximate sites.
In the loess hilly landscapes of the central and southern parts ofthe Görlitz district the fertile soils provide favorable farmingconditions and enable the production of a wide spectrum ofmarket crops. The shares of grassland and forests are low. Soilproperties and the intensive farming may cause serious degrees ofsoil erosion, especially at slopes, and soil compaction, which leadsto losses in soil fertility. Acidophilic deciduous forests with beechbut also with lime, hornbeam and oaks represent the dominatingpotential natural vegetation there. The Herrnhut hill country, asmall-scale focal area of our studies (sect. 3.2.), is part of theseloess hilly landscapes.
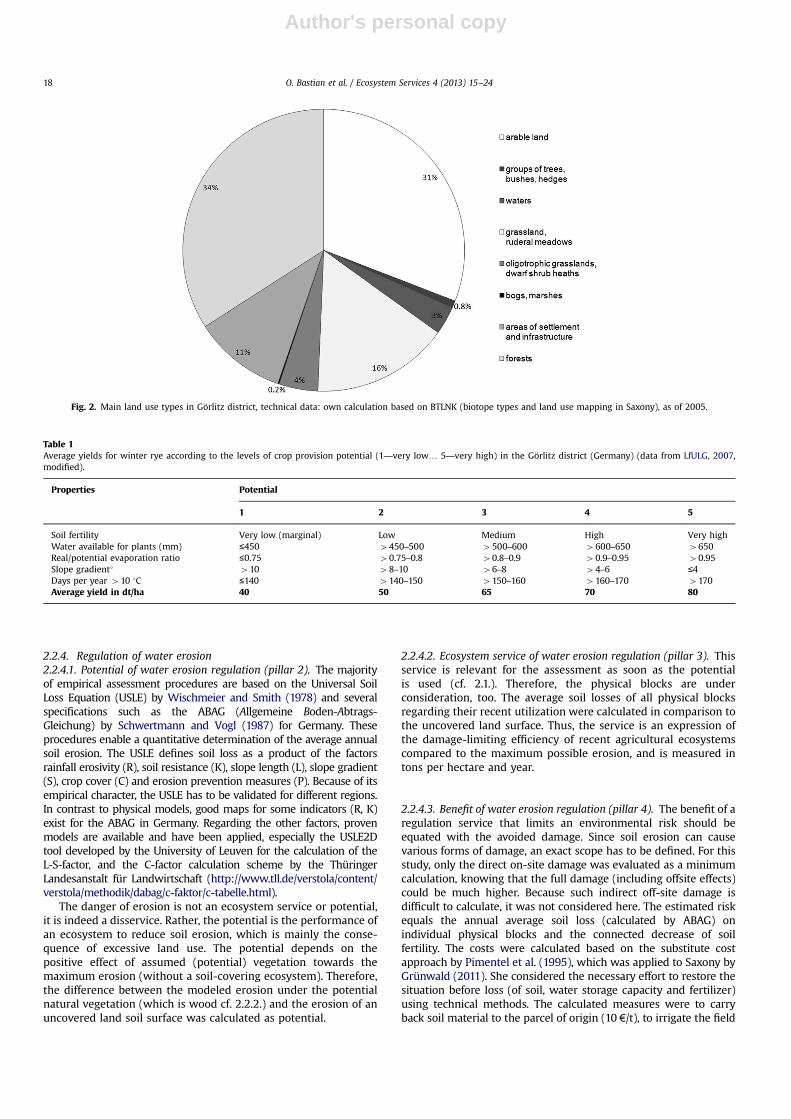
Fig. 2 shows the distribution of the main land use types inGörlitz district in 2005. The balanced proportion of arable fields(31%), grassland (16%) and forests (34%) is typical for Saxony andlarge parts of Germany.
2.2.3. Production of food crops
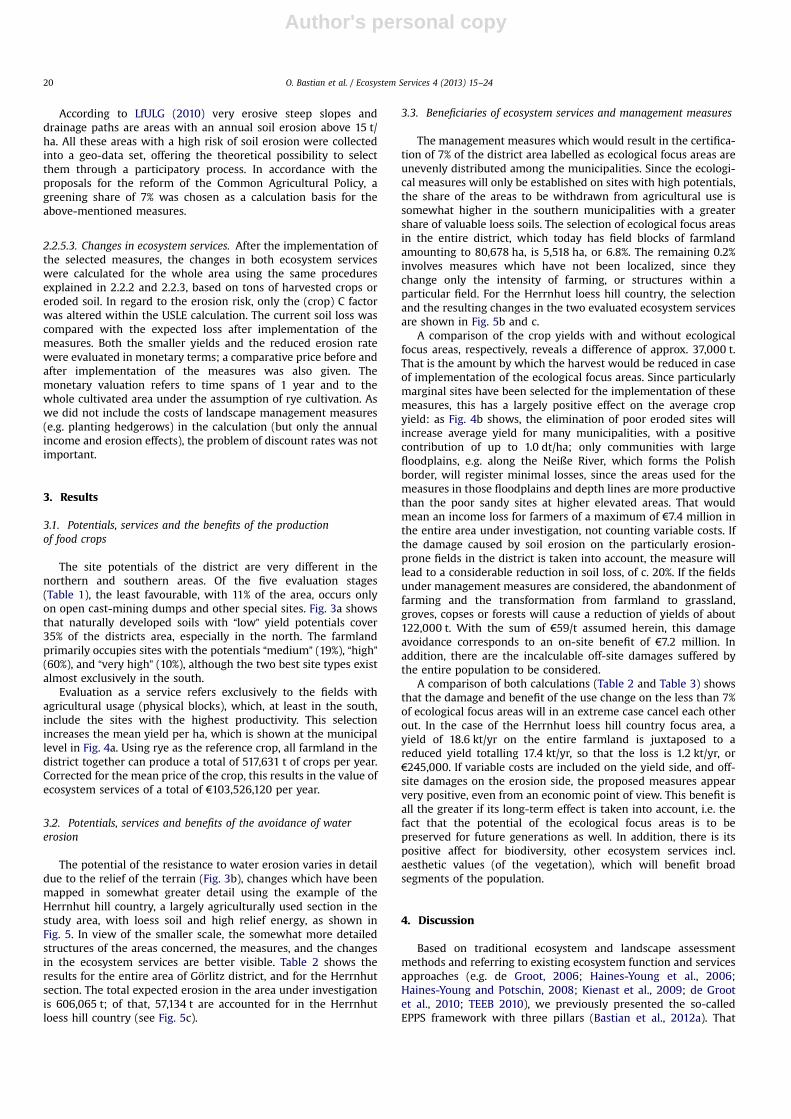
2.2.3.1. Potential of food crop provision (pillar 2). To assess thepotential of food crop provision, the map “natural yieldpotential” from the Soil Atlas of Saxony (LfULG, 2007) was used.For the creation of that map, a two-stage procedure was appliedthat first assessed the soil fertility in five degrees. The factors ofassessment were usable field capacity, capillary moisture, cation-exchange capacity, and base saturation (LfULG, 2007). Since thepotential concept comprises only natural properties, technicalmeasures such as fertilization, liming, plant protection, andirrigation were excluded. Second, besides the soil fertility, factorsof climate and surface were also taken into account, namely theratio of actual vs. potential evaporation, the length of vegetationperiod, and slope gradient (Table 1). The resulting map (Fig. 3a)shows the yield potential classified into five degrees for the wholestudy area without lakes and cities.
2.2.3.2. Ecosystem service of food crop provision (pillar 3). Incontrast to the potential, an ecosystem service exists only ifthere is a real use or demand. Hence, only the agricultural land(in terms of the parcels registered in the EU agricultural subsidysystem – so-called physical blocks) is relevant for the assessmentof the crop provision service. The capacity of agriculturalecosystems to produce a crop's biomass, provided by plantsgrowing using solar radiation, has to be determined within thisarea. The amount of that service is measured by tons of yield. Sincecrops generate different yields, additionally altered by theintensity of production, the service is linked to winter rye as aunique crop that is suitable to be cultivated in the whole studyarea. This crop is rarely cultivated on fertile soils admittedlybecause other crops such as maize and wheat earn more profit;nevertheless, reference yields were available for all soil classes.Table 1 shows the yields that were allocated to the five soil classes.The yields were determined in coordination with the local StateOffice for Agriculture.
2.2.3.3. Benefit of food crop provision (pillar 4). The benefits ofan ecosystem service cannot be calculated like a classicalbusiness assessment. For instance, subsidies, market violations,technological innovations and advertising had to remain out ofscope. (The connection between ecosystem services and the profitof an enterprise will always be ambiguous.) Therefore, a generalsolution was needed. The benefit in monetary terms was orientedat the average price for food rye, 200 €/t.
O. Bastian et al. / Ecosystem Services 4 (2013) 15–24 17
Author's personal copy
2.2.4. Regulation of water erosion
2.2.4.1. Potential of water erosion regulation (pillar 2). The majorityof empirical assessment procedures are based on the Universal SoilLoss Equation (USLE) by Wischmeier and Smith (1978) and severalspecifications such as the ABAG (Allgemeine Boden-Abtrags-Gleichung) by Schwertmann and Vogl (1987) for Germany. Theseprocedures enable a quantitative determination of the average annualsoil erosion. The USLE defines soil loss as a product of the factorsrainfall erosivity (R), soil resistance (K), slope length (L), slope gradient(S), crop cover (C) and erosion prevention measures (P). Because of itsempirical character, the USLE has to be validated for different regions.In contrast to physical models, good maps for some indicators (R, K)exist for the ABAG in Germany. Regarding the other factors, provenmodels are available and have been applied, especially the USLE2Dtool developed by the University of Leuven for the calculation of theL-S-factor, and the C-factor calculation scheme by the ThüringerLandesanstalt für Landwirtschaft (http://www.tll.de/verstola/content/verstola/methodik/dabag/c-faktor/c-tabelle.html).
The danger of erosion is not an ecosystem service or potential,it is indeed a disservice. Rather, the potential is the performance ofan ecosystem to reduce soil erosion, which is mainly the conse-quence of excessive land use. The potential depends on thepositive effect of assumed (potential) vegetation towards themaximum erosion (without a soil-covering ecosystem). Therefore,the difference between the modeled erosion under the potentialnatural vegetation (which is wood cf. 2.2.2.) and the erosion of anuncovered land soil surface was calculated as potential.
2.2.4.2. Ecosystem service of water erosion regulation (pillar 3). Thisservice is relevant for the assessment as soon as the potentialis used (cf. 2.1.). Therefore, the physical blocks are underconsideration, too. The average soil losses of all physical blocksregarding their recent utilization were calculated in comparison tothe uncovered land surface. Thus, the service is an expression ofthe damage-limiting efficiency of recent agricultural ecosystemscompared to the maximum possible erosion, and is measured intons per hectare and year.
2.2.4.3. Benefit of water erosion regulation (pillar 4). The benefit of aregulation service that limits an environmental risk should beequated with the avoided damage. Since soil erosion can causevarious forms of damage, an exact scope has to be defined. For thisstudy, only the direct on-site damage was evaluated as a minimumcalculation, knowing that the full damage (including offsite effects)could be much higher. Because such indirect off-site damage isdifficult to calculate, it was not considered here. The estimated riskequals the annual average soil loss (calculated by ABAG) onindividual physical blocks and the connected decrease of soilfertility. The costs were calculated based on the substitute costapproach by Pimentel et al. (1995), which was applied to Saxony byGrünwald (2011). She considered the necessary effort to restore thesituation before loss (of soil, water storage capacity and fertilizer)using technical methods. The calculated measures were to carryback soil material to the parcel of origin (10 €/t), to irrigate the field
Table 1
Average yields for winter rye according to the levels of crop provision potential (1—very low… 5—very high) in the Görlitz district (Germany) (data from LfULG, 2007,modified).
Properties Potential
1 2 3 4 5
Soil fertility Very low (marginal) Low Medium High Very highWater available for plants (mm) ≤450 4450–500 4500–600 4600–650 4650Real/potential evaporation ratio ≤0.75 40.75–0.8 40.8–0.9 40.9–0.95 40.95Slope gradient1 410 48–10 46–8 44–6 ≤4Days per year 410 1C ≤140 4140–150 4150–160 4160–170 4170Average yield in dt/ha 40 50 65 70 80
Fig. 2. Main land use types in Görlitz district, technical data: own calculation based on BTLNK (biotope types and land use mapping in Saxony), as of 2005.
O. Bastian et al. / Ecosystem Services 4 (2013) 15–2418

Author's personal copy
(35 €/t) and to re-fertilize it (14 €/t). Together, all benefits werecalculated at 59 € per ton avoided soil loss (Grünwald, 2011).
2.2.5. Beneficiaries and response of society
2.2.5.1. Beneficiaries of both ecosystem services (pillar 5). Thebeneficiaries first include the actors who are involved in serviceprovision, who own the corresponding landscape elements,or who use and manage them. They have a commercial interestin the related ecosystem assets. Regarding both services, thebeneficiaries are mainly the farmers and landowners; due to thefact that land is predominantly rented in eastern Germany, thesebeneficiaries tend to be different groups of people.
However, the whole population of a region (or even beyond)may be considered as an indirect beneficiary. For this reason, theservices cause effects that are not limited to a specific populationgroup or that may be socialized to all taxpayers such as streetcleaning costs. The beneficiary of the erosion regulation service ismainly the downstream living population. In general, all foodconsumers can be identified as beneficiaries of the food cropprovision service since they need healthy, sufficient, valuable andeven ethically produced food.
2.2.5.2. Management of services. The soil cover has essential effectson runoff. Apart from an alteration of crops and their cultivationstrategy, the conversion of fields into grassland or the establishmentof new landscape structure elements were considered as possiblemeasures. For this step, we have developed a special mapping tool,
named LUMO (Land-Use Change Modeller), which is a procedure forlocalizing landscape change at the local and regional level, taking intoaccount certain scenarios. On the basis of ecological attributes suchas natural potentials and risks, and of planning data, databases areformed in which all land plots are listed that are suitable for variousfollow-up uses. The possibility exists to consider multiple useoptions, taking into account the interests of various actors and/orscenario results, and then determining a follow-up use. These areapools can be established for various scale levels and criteria. Thatincludes: (a) regions in which changes are expected which cannot beprecisely localized, such as the start-ups of small and medium-sizebusinesses, tourist developments, or changes in intensity of land-use;(b) particular areas with use change from agricultural, forestry orsmall-scale structures; (c) area segments for transport and residentialdevelopment projects. For these methodologically different tasks, theLUMO is compiled of a number of different modules, which can alsobe used singly.
Using the tool LUMO, the authors have selected measures that notonly reduce erosion risks but also improve biodiversity and scenery.LUMO has identified a set of areas that are unfavorable to use:
1. steep erodible slopes for conversion into grassland, grovesor copses
2. runoff courses for conversion into grassland3. marginal sites in areas where the forest cover shall be increased
for afforestation4. core areas, corridors, and stepping stones of habitat connectiv-
ity systems that need extensification.
Fig. 3. Potentials of (a) food crop provision, and (b) water erosion regulation in Görlitz district.
O. Bastian et al. / Ecosystem Services 4 (2013) 15–24 19
Author's personal copy
According to LfULG (2010) very erosive steep slopes anddrainage paths are areas with an annual soil erosion above 15 t/ha. All these areas with a high risk of soil erosion were collectedinto a geo-data set, offering the theoretical possibility to selectthem through a participatory process. In accordance with theproposals for the reform of the Common Agricultural Policy, agreening share of 7% was chosen as a calculation basis for theabove-mentioned measures.
2.2.5.3. Changes in ecosystem services. After the implementation ofthe selected measures, the changes in both ecosystem serviceswere calculated for the whole area using the same proceduresexplained in 2.2.2 and 2.2.3, based on tons of harvested crops oreroded soil. In regard to the erosion risk, only the (crop) C factorwas altered within the USLE calculation. The current soil loss wascompared with the expected loss after implementation of themeasures. Both the smaller yields and the reduced erosion ratewere evaluated in monetary terms; a comparative price before andafter implementation of the measures was also given. Themonetary valuation refers to time spans of 1 year and to thewhole cultivated area under the assumption of rye cultivation. Aswe did not include the costs of landscape management measures(e.g. planting hedgerows) in the calculation (but only the annualincome and erosion effects), the problem of discount rates was notimportant.
3. Results
3.1. Potentials, services and the benefits of the production
of food crops
The site potentials of the district are very different in thenorthern and southern areas. Of the five evaluation stages(Table 1), the least favourable, with 11% of the area, occurs onlyon open cast-mining dumps and other special sites. Fig. 3a showsthat naturally developed soils with “low” yield potentials cover35% of the districts area, especially in the north. The farmlandprimarily occupies sites with the potentials “medium” (19%), “high”(60%), and “very high” (10%), although the two best site types existalmost exclusively in the south.
Evaluation as a service refers exclusively to the fields withagricultural usage (physical blocks), which, at least in the south,include the sites with the highest productivity. This selectionincreases the mean yield per ha, which is shown at the municipallevel in Fig. 4a. Using rye as the reference crop, all farmland in thedistrict together can produce a total of 517,631 t of crops per year.Corrected for the mean price of the crop, this results in the value ofecosystem services of a total of €103,526,120 per year.
3.2. Potentials, services and benefits of the avoidance of water
erosion
The potential of the resistance to water erosion varies in detaildue to the relief of the terrain (Fig. 3b), changes which have beenmapped in somewhat greater detail using the example of theHerrnhut hill country, a largely agriculturally used section in thestudy area, with loess soil and high relief energy, as shown inFig. 5. In view of the smaller scale, the somewhat more detailedstructures of the areas concerned, the measures, and the changesin the ecosystem services are better visible. Table 2 shows theresults for the entire area of Görlitz district, and for the Herrnhutsection. The total expected erosion in the area under investigationis 606,065 t; of that, 57,134 t are accounted for in the Herrnhutloess hill country (see Fig. 5c).
3.3. Beneficiaries of ecosystem services and management measures
The management measures which would result in the certifica-tion of 7% of the district area labelled as ecological focus areas areunevenly distributed among the municipalities. Since the ecologi-cal measures will only be established on sites with high potentials,the share of the areas to be withdrawn from agricultural use issomewhat higher in the southern municipalities with a greatershare of valuable loess soils. The selection of ecological focus areasin the entire district, which today has field blocks of farmlandamounting to 80,678 ha, is 5,518 ha, or 6.8%. The remaining 0.2%involves measures which have not been localized, since theychange only the intensity of farming, or structures within aparticular field. For the Herrnhut loess hill country, the selectionand the resulting changes in the two evaluated ecosystem servicesare shown in Fig. 5b and c.
A comparison of the crop yields with and without ecologicalfocus areas, respectively, reveals a difference of approx. 37,000 t.That is the amount by which the harvest would be reduced in caseof implementation of the ecological focus areas. Since particularlymarginal sites have been selected for the implementation of thesemeasures, this has a largely positive effect on the average cropyield: as Fig. 4b shows, the elimination of poor eroded sites willincrease average yield for many municipalities, with a positivecontribution of up to 1.0 dt/ha; only communities with largefloodplains, e.g. along the Neiße River, which forms the Polishborder, will register minimal losses, since the areas used for themeasures in those floodplains and depth lines are more productivethan the poor sandy sites at higher elevated areas. That wouldmean an income loss for farmers of a maximum of €7.4 million inthe entire area under investigation, not counting variable costs. Ifthe damage caused by soil erosion on the particularly erosion-prone fields in the district is taken into account, the measure willlead to a considerable reduction in soil loss, of c. 20%. If the fieldsunder management measures are considered, the abandonment offarming and the transformation from farmland to grassland,groves, copses or forests will cause a reduction of yields of about122,000 t. With the sum of €59/t assumed herein, this damageavoidance corresponds to an on-site benefit of €7.2 million. Inaddition, there are the incalculable off-site damages suffered bythe entire population to be considered.
A comparison of both calculations (Table 2 and Table 3) showsthat the damage and benefit of the use change on the less than 7%of ecological focus areas will in an extreme case cancel each otherout. In the case of the Herrnhut loess hill country focus area, ayield of 18.6 kt/yr on the entire farmland is juxtaposed to areduced yield totalling 17.4 kt/yr, so that the loss is 1.2 kt/yr, or€245,000. If variable costs are included on the yield side, and off-site damages on the erosion side, the proposed measures appearvery positive, even from an economic point of view. This benefit isall the greater if its long-term effect is taken into account, i.e. thefact that the potential of the ecological focus areas is to bepreserved for future generations as well. In addition, there is itspositive affect for biodiversity, other ecosystem services incl.aesthetic values (of the vegetation), which will benefit broadsegments of the population.
4. Discussion
Based on traditional ecosystem and landscape assessmentmethods and referring to existing ecosystem function and servicesapproaches (e.g. de Groot, 2006; Haines-Young et al., 2006;Haines-Young and Potschin, 2008; Kienast et al., 2009; de Grootet al., 2010; TEEB 2010), we previously presented the so-calledEPPS framework with three pillars (Bastian et al., 2012a). That
O. Bastian et al. / Ecosystem Services 4 (2013) 15–2420

Author's personal copy
framework particularly highlights the differentiation between thebio-physical prerequisites and conditions of ecosystems, thepotential and the demanded or real use of ecosystem services.
The potentials (pillar 2) are emphasized as an intermediate stepbetween biophysical processes and real services. The potentialsmark a field of options showing currently unused or barely usedservices, but also over-exploited services and disservices (in thesense of Swintona et al., 2007; Lyytimaki et al., 2008). Burkhardet al. (2012b) and van Oudenhoven et al. (2012) differentiatebetween the potential supply and capacities, which are relatedto currently used ecosystem services. The cascade model ofHaines-Young and Potschin (2010) inserts the ecosystem functionsas an intermediate step between the “biophysical structures andprocesses” and the “services”.
The EPPS framework, however, makes a distinction betweenthe functioning (part of pillar 1), and the functions used by society(societal functions in the sense of services, pillar 3).
The extended EPPS framework (Table 4) adds two additionalpillars: (4) benefits/values and (5) beneficiaries (incl. serviceproviders and losers – people who are negatively affected by thereduction of a service). The actors, both the service providers andthe beneficiaries, impact upon the ecosystems through theirmanagement activities. The implementation of ecosystem servicemanagement actions cannot be achieved without the knowledgeof the beneficiaries or stakeholders involved. Moreover, impor-tance is attached to space and time aspects (Bastian et al., 2012b).
It is not always necessary to consider all five pillars – not if wewant to analyze only the ecosystem properties or the servicepotential, and not for each planning process. The decision as to
whether the whole framework should be worked through or onlysingle pillars used, depends on the specific task and the focus ofthe stakeholders. If only information about the potentials isneeded, the pillar 3 of the EPPS framework – actually used ordemanded services – can be left out. But the pillar 2 too – thepotentials – can be skipped if only the actual use of services is ofinterest.
The differences between ecosystem properties and processes,potentials and services must be considered, too, with regard toregulation services such as the regulation of soil erosion. Thehuman perspective is decisive, i.e., the affiliation to the data levelor to the valuation level. Soil erosion or the resistance against soilerosion can be regarded as a predominantly physical processindependent of any human perception, evaluation, or interests ofusage. If this process is regarded in terms of possible usage ordamage, it becomes an ecosystem potential that is transferred intoa service (or a disservice) by an actual use or at least a demand or aneed, e.g. the actual necessity to avoid or to reduce soil losses (orto withstand soil erosion) on arable fields.
The comparison of the whole study area (district of Görlitz) andthe more intensively used partial study area (which is dominatedby fertile loess soils) shows impressively the significant role of thereference unit (delineation, size and scale; ecological character-istics) for the benefits and values of ecosystem services.
All valuation methods are vulnerable to criticize. For instance,for the determination of harvest quantities and yields, the actuallyplanted crops could be taken into account, which return verydifferent yields, so that better soils can be used for “moreexpensive” crops, which provide higher profits. On the other hand,
Fig. 4. Average yield of (a) winter rye production, and (b) assumed changes of yield due to the proposed measures impacting on municipalities in Görlitz district.
O. Bastian et al. / Ecosystem Services 4 (2013) 15–24 21

Author's personal copy
one might argue that variable costs of subsidies should not beincluded in the calculation. Without subsidies, however, the ratherhigh variable costs for farming would lead to the decline of anyfarming activity in large areas of the district, especially in the
north, on the poor, sandy soils. There too, plants assimilate andgrow, so that the negative economic result (if subsidies aresubtracted) can hardly be the fault of an ecosystem service. Otherfactors than the services of the ecosystem are necessary for
Fig. 5. The Herrnhut hill country focus area: (a) recent land use, (b) winter rye production, (c) erosion on arable fields, and (d) proposed land use changes.
O. Bastian et al. / Ecosystem Services 4 (2013) 15–2422

Author's personal copy
agricultural crop production, such as introduction of materialsfrom outside (fertilization), human labour power, and suitableoutside basic conditions, such as costs, prices, and possiblysubsidies, all of which enter into the price and profit calculation,but do not represent any ecosystem service.
The calculation of the erosion and its associated damage is noless difficult. Most important is the question of off-site costs,which do not accrue to the farmer, but rather to the RoadsAuthority, the water users, or other sections of the population,due to mud-covered roads, yards and cellars. For instance,Grünwald (2011) calculated €15.8/t just for clearing away depos-ited sediments, and thus arrived at total of on-site and off-sitedamages of €75/t. Not included in this calculation is waterpollution, devalued biotopes, damage to buildings, traffic risksand reduction of recreational value. Even in the mid-1990s,Pimentel et al. (1995) calculated total costs of at least $100/t forerosion in the USA. Assigning a value of $20 for 1 t of topsoil, avalue based primarily on its contents and the resulting fertility ofthe soil, the sedimentation of eroded topsoil in floodplains andsurface waters produced damage or repair costs of at least $80/t.Global loss of value and costs added up to $7.5 billion a year (Borkand Müller, 2002).
The idea of hiring a contractor to return such eroded soil backto the farm field seems hardly likely to be realized. However,without compensation, a continued conventional cultivation of thefields would have to accept the permanent loss of soil functions,which cannot be plausibly evaluated in monetary terms but equalsto a loss of most erodible sites as farmland in the long run (see3.2.). But sustainable economics means preventing losses orcompensating for them; indeed, the Federal Soil Protection Law,
§17 (good professional practice in agriculture), demands, amongother things, that “soil erosion should be prevented as much aspossible by means of a utilization adapted to the location,particularly taking into account the incline of the terrain, waterand wind conditions, and land cover.” Precisely this would beachievable by means of the proposed land use change for sitesmore vulnerable to erosion.
In spite of all criticisms, only this approach provides theopportunity to balance crop yields and soil losses against oneanother on a comparable basis at least approximately. It nowbecomes apparent what economic relevance these two ecosystemservices have: simply the yields and losses on the stated 7%ecological focus areas cancel each other out regarding the wholedistrict of Görlitz. However, the proposed measures against ero-sion would cause distinct positive economic effects regarding theHerrnhut area due to the high erosion risks on the loess soilsdominating there. Any additional positive effect, such as preserva-tion of biodiversity, improvement of the appearance of the land-scape and the recreational value, improvement of water quality,etc., would constitute a much higher net gain for society, which isalready paying for the maintenance of agriculture by means ofagricultural subsidies.
The methodology shown here for the selection of measures forecological focus areas is part of a procedure for localizing usechanges in the scenarios that is modularly inherent in the Land-Use Change Modeller (LUMO) tool. In the example shown, itobserves only the development of fields in the agricultural area.Additional model parts deal with developments in residential andtransport areas, the development of open land, and touristic andeconomic developments (Rosenberg et al., 2013).
Table 2
Soil erosion for the agricultural area (farm and grassland), with the actual situation (biotope types and land use mapping in Saxony – BTLNK – in 2005), and measures.
Reference unit Actual erosion (t/yr) Erosion aftermeasures (t/yr)
Difference(t/yr)
Reductionof erosion (%)
Benefit throughmeasures (1000 €/yr)
Görlitz district 606,065 484,174 121,891 20.1 7,192Herrnhut loess hill country 57,121 45,999 11,122 19.5 656
Table 3
Comparison of yields and income quantities without and with measures against soil erosion.
Reference unit Yield of winter ryeproduction (t/yr)
Yield of winter rye productionwith ecological focus areas (t/yr)
Difference (t/yr) Yield losses (%) Loss of income(1000 €/yr)
Görlitz district 517,631 480,634 36,997 7.1 7,399Herrnhut loess hill country 18,630 17,404 1,226 6.5 245
Table 4
The pillars of the EPPS framework illustrated on the example of food crop provision and soil erosion regulation in the present case study.
Pillar Examples
Food crop provision Soil erosion regulation
1 Ecosystem properties Usable field capacity, capillary moisture,cation-exchange capacity, base saturation
Soil resistance, slope, rainfall erosivity, crop cover
2 Ecosystem potentials Natural yield potential Potential to reduce erosion3 Ecosystem services Provision of yields (dt/ha) Damage-limiting efficiency of recent agricultural ecosystems
compared to the maximum possible erosion (t/ha per year)4 Values/benefits Average price for food rye Avoided on-site and off-site damages5 Beneficiaries Farmers, landowners, societya Farmers, landowners, downstream living people, society
a If farming is too intensive and not environmentally compatible, also losers are emerged who are harmed by declines and losses in biodiversity and regulation and socio-cultural services, e.g. nature lovers but also large parts of the society in general.
O. Bastian et al. / Ecosystem Services 4 (2013) 15–24 23

Author's personal copy
5. Conclusion
We have shown that the extended EPPS framework representsa suitable theoretical and methodological basis for the ascertain-ment of ecosystem services, starting with ecosystem propertiesthrough potentials for the services, the values and beneficiaries, allthe way to planning and management.
Based on two ecosystem services, it has been demonstrated howthe particular pillars can be handled, building logically upon oneanother and in a methodologically differentiated manner. In principle,the framework is applicable for all ecosystem services. However,knowledge gaps and lack of data may impair the assessments.Additional case studies will be required in order to provide a moredetailed elucidation of particular questions. For instance, with regardto the present investigation, wind erosion should be more stronglytaken into account. Moreover, there are considerable gaps in ourknowledge regarding off-site damage resulting from erosion. Quanti-fication algorithms and evaluation models can be easily incorporatedinto the framework. In the case of the Land-Use Change Modeller(LUMO) tool introduced, stronger computer-based operationalizationin future would be a matter for consideration.
Each of the five pillars of the framework can be important forspecific applications and statements. For this reason not all fivepillars need necessarily to be considered within each ecosystemservice assessment.
The present example of two ecosystem services in Görlitz districthas proven that each potential, and the associated ecosystem servicescan be calculated rather exactly on the basis of material services – intons of harvested crops, without monetization. Nonetheless, a com-parison via monetary value is also possible, and certainly informative,even if all the difficulties are recognized. In the given example, it couldbe shown that appropriate measures to protect against soil erosionneed not cause economic disadvantage to the land user. Taking intoaccount the long-term effects and the off-site effects for society as awhole, positive economic effects (benefit) are possible. Thus, aformulation of subsidy practice appropriate to the goals of protectingbiodiversity, of sustainability and particularly of generational justice,would be positive, even in economic terms. Regarding methodicalaspects, the study has verified impressively that ecosystem services(their benefits and values) significantly depend on the delineation(size and scale) as well as the characteristics (properties) of thestudy area.
Acknowledgements
We would like to thank the Saxon State Ministry for Scienceand Art for funding the project “Landschaft Sachsen 2050” andthus enabling the present publication. We would also like to thankthe other members of the project team which have supported thispublication with comments and ideas, particularly Elisa Micheland Christian Stein. We would also like to thank the reviewers fortheir helpful advice, and Phil Hill, and Mindy Erhart-Krull forpolishing the language of the paper.
References
Bastian, O., Haase, D., Grunewald, K., 2012a. Ecosystem properties, potentials andservices—the EPPS conceptual framework and an urban application example.Ecological Indicators 21, 7–16.
Bastian, O., Grunewald, K., Syrbe, R.-U., 2012b. Space and time aspects of ecosystemservices, using the example of the EU Water Framework Directive. InternationalJournal of Biodiversity Science, Ecosystem Services and Management, http://dx.doi.org/10.1080/21513732.2011.631941.
Bork, H.R., Müller, K., 2002. Landschaftswandel von 500 bis 2500 n. Chr.- In: Böcker,R. (Ed.). Offenhaltung der Landschaft. 33. Hohenheimer Umwelttagung26.1.2001, pp. 11–26.
Burkhard, B., Kroll, F., Nedkov, S., Müller, F., 2012. Mapping ecosystem servicesupply, demand and budgets. Ecological Indicators 21, 17–29.
Costanza, R., d'Arge, R., deGroot, R., Farber, S., Grasso, M., Hannon, B., Limburg, K.,Naeem, S., O'Neill, R., Paruelo, J., et al., 1997. The value of the world's ecosystemservices and natural capital. Nature 387, 253–260.
de Groot, R., 2006. Function-analysis and valuation as a tool to assess land useconflicts in planning for sustainable, multi-functional landscapes. Landscapeand Urban Planning 75, 175–186.
de Groot, R.S., Alkemade, R., Braat, L., Hein, L., Willemen, L., 2010. Challenges inintegrating the concept of ecosystem services and values in landscape planning,management and decision making. Ecological Complexity 6, 453–462.
Fisher, B., Turner, R.K., 2008. Ecosystem services: classification for valuation.Biological Conservation 141, 1167–1169.
Fisher, B., Turner, R.K., Morling, P., 2009. Defining and classifying ecosystemservices for decision making. Ecological Economics 68, 643–653.
Grünwald, A., 2011. Zukunft Landschaftsplan. Perspektiven einer methodischenWeiterentwicklung unter Anwendung des Konzepts der Ökosystemdienstleis-tungen. Master thesis, Technical University Dresden, 128 pp.
Grunewald, K., Bastian, O., 2010. Ökosystemdienstleistungen analysieren – begriff-licher und konzeptioneller Rahmen aus landschaftsökologischer Sicht. GEOÖKO31, 50–82.
Haines-Young, R., Watkins, C., Wale, C., Murdock, A., 2006. Modelling naturalcapital: the case of landscape restoration on the South Downs, England.Landscape and Urban Planning 75, 244–264.
Haines-Young, R., Potschin, M.B., 2008. England's terrestrial ecosystem services andthe rationale for an ecosystem approach. Overview Report, DEFRA, 33.
Haines-Young, R., Potschin, M., 2010. Proposal for a Common InternationalClassification of Ecosystem Goods and Services (CICES) for Integrated Environ-mental and Economic Accounting, Report to the European EnvironmentalAgency, Nottingham.
Haines-Young, R., Potschin, M., Kienast, F., 2012. Indicators of ecosystem servicepotential at European scales: mapping marginal changes and trade-offs.Ecological Indicators 21, 39–53.
Kienast, F., Bolliger, J., Potschin, M., de Groot, R., Verburg, P., Heller, I., Wascher, D.,Haines-Young, R., 2009. Assessing landscape functions with broad-scale envir-onmental data: insights gained from a prototype development for Europe.Environmental Management 44, 1099–1120.
LfULG, (Sächsisches Landesamt für Umwelt, Landwirtschaft und Geologie¼Saxon StateOffice for Environment, Agriculture and Geology, Ed.), 2007. Bodenatlas desFreistaates Sachsen (Soil atlas of the Free State Saxony)—part 4: Auswertungskartenzum Bodenschutz (Assessment maps for soil protection). ⟨http://www.forsten.sachsen.de/umwelt/download/boden/16_Braeunig.pdf⟩ [accessed 20.07.12].
LfULG, 2010. Erosionsschutz in reliefbedingten Abflussbahnen. LfULG-Schriftenreihe 13/2010, ⟨http://www.smul.sachsen.de/lfl/publikationen/download/4764_1.pdf⟩ [accessed 20.07.12].
Lyytimaki, J., Petersen, L.-K., Normander, B., Bezak, P., 2008. Nature as a nuisance?Ecosystem services and disservices to urban lifestyle. Journal of IntegrativeEnvironmental Sciences 5, 161–172.
Pimentel, D., Harvey, C., Resosudarmo, P., Sinclair, K., Kurz, D., McNai, M., Christ, S.,Shpritz, L., Fitton, R., Saffoni, R., Blair, R., 1995. Environmental and economiccosts of soil erosion and conservation benefits. Science 267, 1117–1123.
Ring, I., Hansjürgens, B., Elmqvist, T., Wittmer, H., Sukhdev, P., 2010. Challenges inframing the economics of ecosystems and biodiversity: the TEEB initiative.Science Direct Current Opinion in Environmental Sustainability 2, 15–26.
Rosenberg, M., Syrbe, R.-U., Vowinckel, J., Walz, U., 2013. Scenario technique for theassessment of future landscape developments with the aid of ecosystemservices. Landscape Online (submitted).
Schneiders, A., van Daele, T., van Landuyt, W., van Reeth, W., 2012. Biodiversity andecosystem services: complementary approaches for ecosystem management?Ecological Indicators 21, 123–133.
Schwertmann, U., Vogl, W., 1987. Bodenerosion durch Wasser – Vorhersage desAbtrags und Bewertung von Gegenmaßnahmen. Stuttgart, Ulmer.
Seppelt, R., Fath, B., Burkhard, B., Fisher, J.L., Grêt-Regamey, A., Lautenbach, S., Pert,P., Hotes, S., Spangenberg, J., Verburg, P.H., van Oudenhoven, A.P.E., 2012. Formfollows function? Proposing a blueprint for ecosystem service assessmentsbased on reviews and case studies. Ecological Indicators 21, 145–154.
Spangenberg, J.H., Settele, J., 2010. Precisely incorrect? Monetising the value ofecosystem services. Ecological Complexity 7, 327–337.
Staub, C., Ott, W., Heusi, F., Klingler, G., Jenny, A., Häcki, M., Hauser, A., 2011.Indikatoren für Ökosystemdienstleistungen: Systematik, Methodik und Umset-zungsempfehlung für eine wohlfahrtsbezogene Umweltberichterstattung. Bun-desamt für Umwelt, Bern. Umwelt-Wissen Nr, 1102.
Swintona, S.M., Lupia, F., Robertson, G.P., Hamilton, S.K., 2007. Ecosystem servicesand agriculture: cultivating agricultural ecosystems for diverse benefits. Eco-logical Economics 64, 245–252.
Syrbe, R.-U., Walz, U., 2012. Spatial indicators for the assessment of ecosystemservices: providing, benefiting and connecting areas and landscape metrics.Ecological Indicators 21, 80–88.
TEEB, 2010. In: Kumar, P. (Ed.), The Economics of Ecosystems and Biodiversity:Ecological and Economic Foundations. Earthscan, London and Washington.
van Oudenhoven, A.P.E., Petz, K., Alkemade, R., Hein, L., de Groot, R.S., 2012.Framework for systematic indicator selection to assess effects of land manage-ment on ecosystem services. Ecological Indicators 21, 110–122.
Wischmeier, W.H., Smith, D.D., 1978. Predicting rainfall losses—a guide to con-servation planning. Agricultural Handbook, 537; U.S. Dep. Agric., p. 58.
O. Bastian et al. / Ecosystem Services 4 (2013) 15–2424
Related Documents