PRIMARY RESEARCH PAPER The fish zonation of the Itanhae ´m river basin in the Atlantic Forest of southeast Brazil Fabio Cop Ferreira Miguel Petrere Jr. Received: 25 February 2008 / Revised: 12 August 2009 / Accepted: 24 August 2009 Ó Springer Science+Business Media B.V. 2009 Abstract The distribution range of fishes along an upstream–downstream gradient within a river basin is determined by the ecological requirements of each fish species. This differential pattern of distribution may suggest the occurrence of fish zones, where different functional guilds would prevail. The earliest concept of fish zonation highlighted the preferential position of several species in European rivers. Nowadays, there is a consensus that for a broad application of this concept, it is necessary to consider the division in functional groups along the down- stream profile as related to reproductive, feed and population dynamics traits. However, for a number of tropical systems, such information does not exist. In this case, it is possible to use the fish family as a surrogate metric, by assuming that it fully covers common aspects of morphology, feeding, and behav- ior. Using this surrogate metric, we analyzed the distribution range of fish species along an elevation gradient in a typical Atlantic Forest basin in southeast Brazil. Our objective was to delimit fish zones based on the representativeness of some dominant fish families. Between 2006 and 2008, we sampled 42 sites from the estuary to the headwater creeks in elevations that varied from 3 to 783 m. The data were explored using the species (or family) occurrence, relative numerical abundance (N 0 ), relative biomass (B 0 ), and the importance index (IP). We applied the non-metric multidimensional scaling (NMDS) to ordinate the sampling sites using the Jaccard distance calculated on the species occurrence matrix. Data on family importance were superimposed to the NMDS to check how the distribution and the abundance of the families were correlated to the ordination. We caught 64 species distributed among 25 fish families. Based on the dominance of some families, we propose that the fish assemblage in the Itanhae ´m river basin can be organized in four fish zones (FZ) and three transitory zones (TZ), which replace each other along the longitudinal gradient. The marine/ estuarine fishes dominated in FZ1 and TZ1. The freshwater fishes were dominated by Characidae (FZ2), Heptapteridae (FZ3), and Gymnotidae (FZ4). TZ2 was equally dominated by Characidae, Loricar- iidae, and Heptapteridae. The distinct assemblage composition along the FZ’s may relate to complex interactions involving seasonal patterns of variation in salinity levels (next to estuary), slope, presence of downstream barriers, and availability of food resources. We expect that the patterns observed in Handling editor: J. Trexler F. C. Ferreira M. Petrere Jr. (&) Departamento de Ecologia, Instituto de Biocie ˆncias, Universidade Estadual Paulista ‘‘Ju ´lio de Mesquita Filho’’, Av. 24-A, 1515, CEP 13506-900, Rio Claro, Sa ˜o Paulo, Brazil e-mail: [email protected] F. C. Ferreira e-mail: [email protected] 123 Hydrobiologia DOI 10.1007/s10750-009-9932-4

Welcome message from author
This document is posted to help you gain knowledge. Please leave a comment to let me know what you think about it! Share it to your friends and learn new things together.
Transcript

PRIMARY RESEARCH PAPER
The fish zonation of the Itanhaem river basin in the AtlanticForest of southeast Brazil
Fabio Cop Ferreira Æ Miguel Petrere Jr.
Received: 25 February 2008 / Revised: 12 August 2009 / Accepted: 24 August 2009
� Springer Science+Business Media B.V. 2009
Abstract The distribution range of fishes along an
upstream–downstream gradient within a river basin is
determined by the ecological requirements of each
fish species. This differential pattern of distribution
may suggest the occurrence of fish zones, where
different functional guilds would prevail. The earliest
concept of fish zonation highlighted the preferential
position of several species in European rivers.
Nowadays, there is a consensus that for a broad
application of this concept, it is necessary to consider
the division in functional groups along the down-
stream profile as related to reproductive, feed and
population dynamics traits. However, for a number of
tropical systems, such information does not exist. In
this case, it is possible to use the fish family as a
surrogate metric, by assuming that it fully covers
common aspects of morphology, feeding, and behav-
ior. Using this surrogate metric, we analyzed the
distribution range of fish species along an elevation
gradient in a typical Atlantic Forest basin in southeast
Brazil. Our objective was to delimit fish zones based
on the representativeness of some dominant fish
families. Between 2006 and 2008, we sampled 42
sites from the estuary to the headwater creeks in
elevations that varied from 3 to 783 m. The data were
explored using the species (or family) occurrence,
relative numerical abundance (N0), relative biomass
(B0), and the importance index (IP). We applied the
non-metric multidimensional scaling (NMDS) to
ordinate the sampling sites using the Jaccard distance
calculated on the species occurrence matrix. Data on
family importance were superimposed to the NMDS
to check how the distribution and the abundance of
the families were correlated to the ordination. We
caught 64 species distributed among 25 fish families.
Based on the dominance of some families, we
propose that the fish assemblage in the Itanhaem
river basin can be organized in four fish zones (FZ)
and three transitory zones (TZ), which replace each
other along the longitudinal gradient. The marine/
estuarine fishes dominated in FZ1 and TZ1. The
freshwater fishes were dominated by Characidae
(FZ2), Heptapteridae (FZ3), and Gymnotidae (FZ4).
TZ2 was equally dominated by Characidae, Loricar-
iidae, and Heptapteridae. The distinct assemblage
composition along the FZ’s may relate to complex
interactions involving seasonal patterns of variation
in salinity levels (next to estuary), slope, presence of
downstream barriers, and availability of food
resources. We expect that the patterns observed in
Handling editor: J. Trexler
F. C. Ferreira � M. Petrere Jr. (&)
Departamento de Ecologia, Instituto de Biociencias,
Universidade Estadual Paulista ‘‘Julio de Mesquita
Filho’’, Av. 24-A, 1515, CEP 13506-900, Rio Claro,
Sao Paulo, Brazil
e-mail: [email protected]
F. C. Ferreira
e-mail: [email protected]
123
Hydrobiologia
DOI 10.1007/s10750-009-9932-4

our study will also be presented in other coastal
Atlantic Forest basins in Southeast Brazil.
Keywords East basin � Elevation profile �Species turnover � Freshwater fish families �Functional guilds
Introduction
In order to understand how the river ecosystems are
affected by human activities, we need to know how
they function in the absence of these activities, i.e., we
have to develop reference models for the functioning
of these systems (Poff et al., 1997; USEPA, 2002,
2006; Whol & Merritts, 2007). Vannote et al. (1980)
were the first to organize the riverine functioning into a
comprehensive framework (The River Continuum
Concept—RCC), which describes expected patterns
and processes along the longitudinal gradient. In the
RCC model, the faunal composition and function in a
given position are expected to conform to the mean
state of the geomorphic and fluvial characteristics of
the system. Although several contributions empha-
sized other external influences, such as the effects of
the geomorpholgy, climate, presence of tributaries,
riparian vegetation, and channel discontinuities (Min-
shall et al., 1983, 1985; Ward & Stanford, 1983,
Osborne and Wiley, 1992), the RCC model still
remains valuable in predicting the main patterns and
processes along the longitudinal gradient in a river
(Winemiller & Leslie, 1992; Petry & Schulz, 2006).
Concerning the biological aspects, the RCC model
predicts that changes in the prevalence of different
functional groups along the river position will follow
the distribution of the hydrogeomorphic patches
(Thorp et al., 2006). For fish communities, a ubiqui-
tous consequence of the RCC concept is that changes
in the structural condition promote a shift in the fish
groups along the downstream profile. This observation
leads to the development of the fish zonation concept, a
schematic arrangement of discrete zones, where fish
species share similar habitat preferences (Huet, 1959).
This concept was first developed for temperate Euro-
pean waters, where the entire river course was divided
into five basic zones (sensu Aarts & Nienhuis, 2003)
following the downstream direction. The need to
develop effective tools for assessing river conditions
and measure the effects of anthropogenic impacts over
large areas or ecoregions highlights an obvious
problem for the application of Huet’s fish zonation.
For example, Huet’s fish zonation does not account for
natural differences in species composition among
basins, nor it explains which resources are essential for
the conservation of each fish zone. Nowadays, it is a
consensus that the concept of fish zonation should
group species not by their taxonomic status, but by
their functional roles in the environment, that is, it
must consider their habitat requirements for spawning,
nursery, and feeding, their tolerance to non-natural
modifications in the river flow and structure, in the
water chemistry, and the main aspects of population
dynamics relating to longevity, mobility, and growth
rates (Aarts & Nienhuis, 2003; Welcomme et al., 2006;
Beier et al., 2007; Lasne et al., 2007; Noble et al.,
2007; Pont et al., 2007).
The concept of functional groups is related to the
concept of ecological guild (Simberloff & Dayan,
1991), as it refers to species that use similar resources
and affect the system in similar ways (Higgins &
Strauss, 2008). The practical issue with this classifi-
cation is that it creates effective tools for assessing
the ecological integrity of lotic systems. For the fish
community, the traditional classification of functional
groups follows measurable features related to thro-
phic category (e.g., herbivore, piscivore, and inver-
tivore), population dynamics (e.g., opportunistic,
periodic, and equilibrium species), and feeding
behaviors (e.g., benthic detritivores, surface feeders,
benthic pickers) (Matthews, 1998; Winemiller, 1992,
1996; Winemiller & Rose, 1993; Hoeinghaus et al.,
2007; Higgins & Strauss, 2008). Migratory move-
ments, reproductive strategies, longevity, habitats
requirements, and tolerance to non-natural degrada-
tion can be added to form these functional groups
(Karr, 1981; Welcomme et al., 2006; Noble et al.,
2007). For instance, Balon (1975) proposed a tradi-
tional classification of reproductive fish guilds con-
sidering spawning habits and habitats. This
classification is used worldwide with minor modifi-
cations (Vriese et al., 1994; Aarts & Nienhuis, 2003).
Most attempts to create functional fish groups were
made in temperate regions of North America and
Europe, where biological information is available for
several species. However, there is a necessity for
developing similar classifications for tropical and
sub-tropical systems, as these systems are suffering
drastic changes in their flow regime around the
Hydrobiologia
123

catchments basins caused by water abstraction,
damming, agriculture, and urbanization (Welcomme
et al., 2006).
Unfortunately, there is a lack of information about
the ecology of most species in tropical streams and
rivers. In order to help developing similar classifica-
tion in tropical regions, a ‘‘fish environmental guild’’
arrangement was recently proposed to assist in
constructing reference conditions for assessing the
response of the fish biota to changes in the system’s
flow and geomorphology (Welcomme et al., 2006).
The foundation for identifying these environmental
guilds is based on the species-specific preference for a
given river location, which highlights the importance
of the longitudinal distribution of fish species in
riverine ecosystems worldwide (Kadye et al., 2008;
Araujo et al., 2009; Orrego et al., 2009). In this
protocol, the species were organized in zones accord-
ing to its upstream–downstream occurrence (Rhi-
thron, Potamon, and Estuary). In the rhithron zones,
there is a prevalence of resident and small-bodied
fishes that can be divided in sub-groups according to
their preferences for fast flowing and steep stretches
(riffle guild) or for slower flowing and lower gradient
areas (pool guild) (Schlosser, 1982; Angermeier &
Karr, 1983; Buhrnheim & Fernandes, 2003; Langeani
et al., 2005). Downstream, the potamonic zones are
inhabited by lentic species distributed in habitats such
as the main channels, connected or eventually
disconnected lagoons, inundated floodplain, backwa-
ters, and the floodable forests or the riparian vegeta-
tion. The potamonic guilds presents more complex
and diversified ecological traits related to various
levels of resistance to anoxia or to specific reproduc-
tive behaviors. The Estuarine guilds are distinguished
by their response to daily or seasonal changes in
salinity levels. Feeding categories present complex
relationships with body size, river location, morpho-
logical restrictions, and ontogenetic changes and,
thus, were not included in the environmental fish
guilds (Welcomme et al., 2006). As a general pattern,
it appears that strict top-carnivores (piscivorous) are
rare and restricted to fishes with a large body size. As
a consequence, top-carnivores are restricted to the
lower basin portions such as the estuary and the
potamon zones, decreasing upstream when the dimen-
sion of the aquatic habitats became too reduced to
support larger fishes (Gilliam et al., 1993; Petry &
Schulz, 2006). However, the carnivorous habit can be
found from the estuary to the rhithron zones, and
includes species that feed on a wide range of
organisms, depending on their longitudinal distribu-
tion pattern in the river basin.
Despite obvious taxonomic differences among the
species used for the propositions of the European fish
zonation (Huet, 1959) and the species considered in
the ‘‘fish environmental guilds’’ (Welcomme et al.,
2006), both arrangements highlighted the preference
of some species for lotic and fast flowing waters
upstream or for lentic habitats downstream, and the
salinity influence’s next to the estuaries, i.e., they
describe aspects of the overall influence of the
longitudinal gradient in riverine ecosystems. Lamou-
roux et al. (2002) evaluated intercontinental conver-
gence in fish traits along a longitudinal profile in
temperate streams of Europe and North America.
They found significant and similar response of body
size, fecundity, maximum age, shape factor, and the
preference for vertical position in the channel. While
the first three responses were probably due to
intercorrelated allometric effects (Woodward et al.,
2005), the last two responses expressed the prefer-
ence for pool habitats and the use of water column in
downstream reaches, and the preference for fast
flowing, shallow reaches, and for benthic habits in
upstream portions.
In this article, we evaluated the fish assemblage
structure and composition along an altitudinal range
in the Itanhaem river basin, the second largest coastal
basin of the Sao Paulo State. This basin is part of the
East Basin system (Menezes, 1972), which extends
for more than 2,000 km along the Brazilian coast
line, amidst the remainder of the Atlantic Forest, one
of the most threatened biomes in the country and a
world hotspot of species biodiversity (Myers et al.,
2000). The East basin is composed by a number of
short and isolated drainages, which flows directly to
the Atlantic Ocean, promoting high levels of ende-
mism (Menezes, 1972). In Southeast Brazil, between
the States of Sao Paulo and Santa Catarina, the
geomorphology of the coastal drainages is strongly
influenced by the Serra do Mar mountain range. This
mountain formation is the border of an interior low-
relief plateau of Pre-Cambrian origin that isolates the
high stretches (above 700 m) from the lower coastal
plain region (bellow 50 m), a geologic formation
covered by soil deposits of Quaternary age (Almeida
& Carneiro, 1998). Owing to this geomorphology, the
Hydrobiologia
123
coastal fish fauna of Sao Paulo State is primarily
divided into three distinct groups, concerning evolu-
tionary and biogeographical histories: (i) a marine/
estuarine group, (ii) a freshwater group occurring at
low/moderate elevations in freshwater coastal plain
and in the mountain range, and (iii) a fish group
occurring above 600/700 m, at the headwaters of the
low-relief areas in the plateau next to the drainages
limits (Leung & Camargo, 2005; Takako et al., 2005;
Oyakawa et al., 2006; Ribeiro, 2006; Ribeiro et al.,
2006; Louro, 2007; Menezes et al., 2007; Serra,
2007). Despite the proximity of great metropolitan
areas, little is known about the patterns of longitu-
dinal fish zonation that could account for more than
biogeographical elements. Thus, by sampling from
the estuary to the plateau, we expect to identify
changes between these fish groups related to the
elevation profile. We analyzed the prevalence of
dominant fish species and families throughout the
sampling sites and propose a schematic model of fish
zonation that can help to understand the ecological
processes prevailing along the upstream/downstream
gradient.
Materials and methods
Study area
The Brazilian coastal drainages of eastern continental
margin were originated at Triassic from the break-up
of Gondwana (Ribeiro, 2006). The Itanhaem river
basin (238350; 248150 S and 468350; 478000 W) has
930 km2 and can be divided into four regions
according to its altitude, declivity, and geomorphol-
ogy (Camargo et al., 1997). Although the superior
region (the plateau) is located around the most
populated city in Brazil (Sao Paulo), it is inside of
two environmental protection areas, the ‘‘Parque
Estadual da Serra do Mar (PESM)’’ and the ‘‘Area
de Protecao Ambiental (APA) Capivari-Monos.’’
These protection areas sustain well preserved rem-
nants of the original Atlantic Rain Forest. Between
700 and 50 m there is a steep region of mountain
range (the Serra do Mar) that is still inserted in the
PESM. The coastal plain, a low-relief region formed
by Quaternary deposits, is mostly covered by the
restinga vegetation, an herbaceous–arbustive lowland
forest that is partly affected by anthropogenic
pressures as agriculture (mostly banana plantation)
and urbanization. The lower region of the basin is
covered by mangrove vegetation surrounding the
river channels, and is largely affected by uncontrolled
urbanization and sewage discharge (Camargo et al.,
1997; Nogueira, 2001; Pereira, 2002).
Hydrography
Four main rivers (Branco, Mambu, Preto, and Agu-
apeu) form the Itanhaem river channel. The Branco
and Mambu microbasins originate in the plateau and
rapidly reach the coastal plain after passing through-
out short and steep valleys in the Serra do Mar. The
Mambu River crosses a low-relief stretch in the
coastal plain and joins the Branco River. The
Aguapeu headwaters originate at 400 m in the Serra
do Bariri, a mountain formation between Branco and
Aguapeu microbasins. Its main channel presents dark
waters and low levels of dissolved oxygen and pH.
Almost all the original restinga vegetation in its
surroundings was replaced by agriculture or urban
areas. The Preto microbasin originates at three
different areas. The majority of its headwaters are
above 700 m in a well-preserved region inside the
PESM. Other headwater streams originate at 400 m
in an area partially occupied by agriculture, known as
Serra dos Itatins. The last stream system originates at
low elevations inside the last preserved remnants of
the restinga forest in the region. It differed from the
other headwaters by its dark waters, high acidity, and
low levels of oxygen (similar to the Aguapeu River).
The Preto and Branco main channels form the
Itanhaem River, a sixth-order estuarine channel
7 km long, 100–200 m wide, and 1–4 m deep
(Fig. 1).
Fish sampling
The fishes were sampled between 2006 and 2008 in
42 sites, from estuary to plateau headwaters, with the
use of different sampling techniques. The estuary and
the main river channels (larger than 10 m width) were
fished with ten series of gillnets (20 m 9 1.0 m and
mesh sizes ranging from 3 to 12 cm between opposed
knots), a sieve (1.5 m 9 1.0 m, with 2-mm mesh
size), and two pairs of funnel traps. Streams and
creeks were sampled by electric fishing using an
electric generator (Yamaha, model EF2600, 2.3 kVA,
Hydrobiologia
123

60 Hz) linked to a current rectifier in wider channels
or a backpack (Smith-root, model LR-24) in less
accessible reaches. Both equipments were used with
direct current at 600 V. Fish effort was standardized
to 12 h for gillnets and funnel traps (late afternoon to
next morning), and ten sweeps of the sieve in the
river margins. Electric fishing was carried out by two
persons passing once against the current. The length
of the segments varied between 50 and 100 m due to
the difficulty of access in some stretches. Twenty
sites ranging from 0 to 130 m high were repeatedly
sampled in February, May, August, and November of
2006. In November of 2007, eight streams above
700 m were sampled once. Additional 14 streams,
from altitudes ranging from 8 to 263 m, were
sampled in March 2008 (Fig. 1; Table 1).
On collection, all fishes were immediately fixed in
10% formalin for later identification, and weighed
(g). Some specimens were taken to the Museu de
Zoologia da Universidade de Sao Paulo (MZUSP) for
taxonomic identification and for deposition of
voucher specimens.
Data analysis
Owing to the inherent bias resulting from the use of
different sampling techniques, the data were explored
using species occurrence, relative numerical abun-
dance N 0ij ¼ Nij
.Nj
� �, relative biomass B0ij ¼
�
Bij
.BjÞ and the importance index calculated at
species and family levels. The IP index was quan-
tified as: IPij ¼ Nij � Bij
�PNij � Bij
� �, which is a
modification of the Ponderal index originally
described by Beaumord and Petrere Jr. (1994). The
original Ponderal index was expressed in percentage,
while here the IP index ranged from 0 to 1, as for the
values of N 0ij and B0ij. Nij and Bij are, respectively, the
number of individuals and biomass of species (or
family) i in sample j, and Nj and Bj are, respectively,
the totals for sample j. N 0ij, B0ij and IPij measures the
representativeness of each species (or family) in local
samples as relative contributions. These procedures
allow a minimization of the effects of consistent bias
resulting from the sampling effect. Some sites were
sampled more frequently than others (Table 1), and
so we combined temporal collections within a site
using the mean values of N 0ij, B0ij and IPij (Winemiller
& Leslie, 1992; Lasne et al., 2007). The spatial
turnover was explored with the non-metric multidi-
mensional scaling (NMDS) using the Jaccard dis-
tance on the species occurrence matrix (Ludwig &
Reynolds, 1988). The IP index matrix at the family
level was superimposed to this ordination using the
‘‘envfit’’ function from Vegan package to check how
Atlantic Ocean
Itanhaém river
Preto river
Aguapeu river
Mambu river
16
17
12
11
3031
2928
3433
32
13
1415
21
18
19
27
26
2524
2223
36
37
39
38
40
4142
35
20 N
1 km
Branco river
1
2
3
4
56
7
89
10
Fig. 1 Location and
hydrography of the
Itanhaem river basin with
the 42 sampling sites
Hydrobiologia
123

Ta
ble
1L
oca
tio
nan
dm
ain
char
acte
rist
ics
of
the
sam
pli
ng
site
s
Sit
eG
eogra
phic
coord
inat
esL
oca
tion
Riv
erty
pe
Mic
robas
inP
ropose
dfi
shor
tran
siti
on
zones
Dis
tance
from
the
Itan
hae
mri
ver
mouth
(km
)
Ele
vat
ion
(m)
Riv
erord
erW
idth
(m)
Dep
th(m
)N
um
ber
of
sam
ple
s
Sam
pli
ng
tech
niq
ue
Spec
ies
rich
nes
sN
tW
t(g
)
146W 470 5
600
24S 100 4
100
Coas
tal
pla
inE
stuar
ine
chan
nel
Itan
hae
mF
Z1
2.3
33
6200
2.5
04
gn,
si,
ft13
40
2527.8
5
246W 480 1
500
24S 90 2
100
Coas
tal
pla
inE
stuar
ine
chan
nel
Itan
hae
mT
Z1
5.2
44
6100
3.1
04
gn,
si,
ft10
67
4040.4
7
346W 490 0
100
24S 080 3
200
Coas
tal
pla
inB
lack
wat
erP
reto
TZ
18.2
24
540
3.0
04
gn,
si,
ft12
14
342.8
0
446W 470 4
000
24S 070 2
700
Coas
tal
pla
inW
hit
ew
ater
Bra
nco
TZ
111.9
35
5200
2.0
04
gn,
si,
ft8
41
1265.3
546W 480 2
800
24S 050 400
Coas
tal
pla
inW
hit
ew
ater
Bra
nco
FZ
219.2
610
430
2.2
03
gn,
si,
ft8
27
2438.6
2
646W 490 2
600
24S 040 0
500
Coas
tal
pla
inC
lear
wat
erM
ambu
FZ
221.8
310
430
1.8
04
gn,
si,
ft13
52
565.6
9
746W 430 2
000
24S 010 4
600
Coas
tal
pla
inW
hit
ew
ater
Bra
nco
FZ
239.8
318
420
2.2
04
gn,
si,
ft12
76
1588.9
8
846W 560 3
200
24S 070 5
900
Coas
tal
pla
inB
lack
wat
erP
reto
FZ
232.8
95
15
2.2
04
gn,
si,
ft16
99
3117.6
1
946W 570 2
400
24S 70 1
300
Coas
tal
pla
inC
lear
wat
erP
reto
FZ
235.9
16
425
0.8
04
gn,
si,
ft18
150
65820.8
9
10
46W 560 4
800
24S 100 4
300
Coas
tal
pla
inB
lack
wat
erP
reto
FZ
238.7
210
315
2.1
04
gn,
si,
ft12
37
4999.9
1
11
46W 440 1
800
24S 020 3
800
Coas
tal
pla
inC
lear
wat
erB
ranco
TZ
233.9
969
11.6
00.1
04
ef8
50
235.9
9
12
46W 420 2
000
24S 010 3
700
Coas
tal
pla
inC
lear
wat
erB
ranco
TZ
243.3
558
24.8
00.2
04
ef14
66
830.8
0
13
46W 490 5
600
24S 040 1
700
Coas
tal
pla
inC
lear
wat
erM
ambu
FZ
223.6
919
14.7
00.3
04
ef20
97
426.5
3
14
46W 490 2
500
24S 020 5
600
Coas
tal
pla
inC
lear
wat
erM
ambu
FZ
224.4
614
29.7
00.2
04
ef22
163
707.8
1
15
46W 500 4
600
24S 020 4
100
Mouta
inra
nge
Cle
arw
ater
Mam
bu
FZ
327.1
1197
1N
ot
mea
sure
dN
ot
mea
sure
d1
ef3
38
291.6
2
16
46W 540 4
300
24S 110 0
900
Coas
tal
pla
inB
lack
wat
erP
reto
FZ
227.9
911
14.3
00.2
03
ef15
379
376.3
6
17
46W 550 2
700
24S 130 3
000
Coas
tal
pla
inB
lack
wat
erP
reto
FZ
245.0
417
11.3
00.2
03
ef17
126
433.9
8
Hydrobiologia
123

Ta
ble
1co
nti
nu
ed
Sit
eG
eogra
phic
coord
inat
esL
oca
tion
Riv
erty
pe
Mic
robas
inP
ropose
dfi
shor
tran
siti
on
zones
Dis
tance
from
the
Itan
hae
mri
ver
mouth
(km
)
Ele
vat
ion
(m)
Riv
erord
erW
idth
(m)
Dep
th(m
)N
um
ber
of
sam
ple
s
Sam
pli
ng
tech
niq
ue
Spec
ies
rich
nes
sN
tW
t(g
)
18
46W 590 1
900
24S 120 1
100
Coas
tal
pla
inC
lear
wat
erP
reto
FZ
244.7
538
23.3
00.1
04
ef16
165
572.2
3
19
47W 000 0
100
24S 120 4
200
Mouta
inra
nge
Cle
arw
ater
Pre
toF
Z3
46.2
8134
24.3
00.1
03
ef6
43
260.9
1
20
46W 590 5
600
24S 090 4
900
Coas
tal
pla
inC
lear
wat
erP
reto
FZ
240.4
236
37.9
00.2
04
ef19
103
890.6
5
21
47W 000 2
200
24S 080 2
300
Coas
tal
pla
inC
lear
wat
erP
reto
TZ
241.7
860
36.8
00.1
04
ef13
106
536.1
2
22
47W 010 2
900
24S 110 2
900
Mouta
inra
nge
Cle
arw
ater
Pre
toT
Z2
45.4
980
3N
ot
mea
sure
dN
ot
mea
sure
d1
ef10
91
244.2
1
23
47W 010 5
600
24S 100 5
600
Mouta
inra
nge
Cle
arw
ater
Pre
toF
Z3
46.3
7190
2N
ot
mea
sure
dN
ot
mea
sure
d1
ef5
46
216.7
4
24
47W 010 2
800
24S 100 3
900
Mouta
inra
nge
Cle
arw
ater
Pre
toF
Z3
45.3
9131
3N
ot
mea
sure
dN
ot
mea
sure
d1
ef8
33
118.6
2
25
47W 000 5
500
24S 100 5
800
Mouta
inra
nge
Cle
arw
ater
Pre
toT
Z2
44.0
854
3N
ot
mea
sure
dN
ot
mea
sure
d1
ef7
42
235.2
7
26
47W 010 3
500
24S 110 4
100
Mouta
inra
nge
Cle
arw
ater
Pre
toT
Z2
45.9
283
2N
ot
mea
sure
dN
ot
mea
sure
d1
ef8
92
197.7
2
27
47W 020 3
800
24S 110 1
700
Mouta
inra
nge
Cle
arw
ater
Pre
toF
Z3
47.7
1263
2N
ot
mea
sure
dN
ot
mea
sure
d1
ef5
32
192.0
3
28
46W 420 0
700
24S 040 0
300
Coas
tal
pla
inC
lear
wat
erA
guap
euF
Z2
35.1
112
2N
ot
mea
sure
dN
ot
mea
sure
d1
ef8
139
174.7
8
29
46W 420 0
800
24S 040 0
100
Coas
tal
pla
inC
lear
wat
erA
guap
euF
Z2
35.1
811
2N
ot
mea
sure
dN
ot
mea
sure
d1
ef8
143
168.8
5
30
46W 420 2
000
24S 030 2
300
Mouta
inra
nge
Cle
arw
ater
Aguap
euT
Z2
36.5
750
1N
ot
mea
sure
dN
ot
mea
sure
d1
ef6
101
397.9
5
31
46W 420 1
300
24S 030 700
Mouta
inra
nge
Cle
arw
ater
Aguap
euT
Z2
36.7
75
1N
ot
mea
sure
dN
ot
mea
sure
d1
ef4
22
68.4
9
32
46W 440 3
500
24S 040 4
800
Mouta
inra
nge
Cle
arw
ater
Aguap
euT
Z2
28.7
967
1N
ot
mea
sure
dN
ot
mea
sure
d1
ef5
40
454.5
9
33
46W 440 1
200
24S 050 0
600
Mouta
inra
nge
Cle
arw
ater
Aguap
euF
Z2
27.9
527
22.2
00.3
01
ef10
108
675.1
7
34
46W 430 5
500
24S 050 2
000
Coas
tal
pla
inC
lear
wat
erA
guap
euF
Z2
27.2
48
27.1
00.3
51
ef9
87
134.5
4
Hydrobiologia
123

Ta
ble
1co
nti
nu
ed
Sit
eG
eogra
phic
coord
inat
esL
oca
tion
Riv
erty
pe
Mic
robas
inP
ropose
dfi
shor
tran
siti
on
zones
Dis
tance
from
the
Itan
hae
mri
ver
mouth
(km
)
Ele
vat
ion
(m)
Riv
erord
erW
idth
(m)
Dep
th(m
)N
um
ber
of
sam
ple
s
Sam
pli
ng
tech
niq
ue
Spec
ies
rich
nes
sN
tW
t(g
)
35
46W 430 4
600
23S 590 0
100
Pat
eaul
Cle
arw
ater
Bra
nco
FZ
481.4
1787
35.0
00.2
01
ef3
94
593.8
9
36
46W 380 0
700
23S 560 1
500
Pat
eaul
Cle
arw
ater
Bra
nco
FZ
462.1
9732
4N
ot
mea
sure
dN
ot
mea
sure
d1
ef5
55
297.9
5
37
46W 410 1
200
23S 540 1
800
Pat
eaul
Cle
arw
ater
Bra
nco
FZ
467.7
0746
35.7
00.4
01
ef6
149
457.5
5
38
46W 410 2
900
23S 560 3
300
Pat
eaul
Cle
arw
ater
Bra
nco
FZ
464.9
4747
46.0
00.5
01
ef3
29
134.9
1
39
46W 410 4
300
23S 550 1
500
Pat
eaul
Cle
arw
ater
Bra
nco
FZ
467.0
2743
32.8
00.3
01
ef7
70
381.7
6
40
46W 430 5
800
23S 560 3
700
Pat
eaul
Cle
arw
ater
Bra
nco
FZ
476.5
3760
32.2
50.3
01
ef6
42
236.6
8
41
46W 430 5
400
23S 570 1
300
Pat
eaul
Cle
arw
ater
Bra
nco
FZ
477.9
770
3N
ot
mea
sure
dN
ot
mea
sure
d1
ef4
40
171.9
0
42
46W 430 5
900
23S 570 2
400
Pat
eaul
Cle
arw
ater
Bra
nco
FZ
478.2
4770
2N
ot
mea
sure
dN
ot
mea
sure
d1
ef4
44
114.9
0
Nt
tota
lnum
ber
of
fish
coll
ecte
d,
Wt
tota
lw
eigh
coll
ect
For
the
site
ssa
mple
dm
ore
than
once
,N
tan
dW
tar
eth
eav
erag
eval
ues
per
sam
pli
ng
Hydrobiologia
123

the family importance was related to the sites’
ordination (R Development Core Team, 2008). The
‘‘envfit’’ function finds directions in ordination space
toward which the vectors change most rapidly having
maximal correlations with the configuration (Oksa-
nen et al., 2009). A randomization test (9999
permutations) was used to verify the significance of
the importance of each family using the squared
correlation coefficient (r2). The significance level was
considered 5% or less. We plotted the IP values
versus elevation taking into account only the families
that comprise 80% of the total importance. In order to
detect dependence patterns, the relationships were
explored with robust locally weighted regression
(LOWESS), a polynomial smoothing algorithm (R
Development Core Team, 2008). The same procedure
was carried out for relative numeric abundance and
relative biomass.
Results
Owing to the easiness of access, 70% of the samples
were collected below an altitude of 100 m. The main
river channels ranged from elevations of 3–18 m
while the streams and creeks ranged from 8 to 787 m.
We had no access to streams between 300 and 700 m
located in the steep portion of the Serra do Mar
mountain range. The lowest streams are in the Preto
(site 16) and Aguapeu (sites 28, 29, and 34)
microbasins. The highest main channels were at 16
(site 9) and 18 m (site 7) next to the Serra do Mar
foothills. The distances to the basin mouth ranged
from 2.33 km (in site 1) to 78.24 km in site 42. Five
black-water sites were sampled in the Preto micro-
basin, two with electrofisher, and three with gillnets,
funnel traps, and sieve (Table 1).
The species richness totaled 64, distributed in 25
fish families, 3,438 individual and approximately
98 kg. Nineteen species and 12 families were marine/
estuarine, with Ariidae and Sciaenidae being the most
abundant. Overall, the marine/estuarine families had
low representativeness (3.61% of the numeric abun-
dance and 7.16% of the total weight) due to the low
number of estuarine environments sampled. The
freshwater families Characidae, Heptapteridae, Gym-
notidae, and Loricariidae account for 66% of the
numeric abundance and 80% of the total weight. If
measured by the IP index, these families accounted
for 78.36% of the total importance. Erythynidae,
represented by the piscivorous Hoplias malabaricus
(Block, 1794), was the fifth most important family.
Six freshwater species occurred exclusively at the
plateau sites, while 39 were exclusively caught
between 4 and 263 m in the coastal plain or in the
mountain range sites. The freshwater species Geoph-
agus cf. brasiliensis (Quoy & Gaimard, 1824),
H. malabaricus, Phalloceros spp., and Gymnotus
pantherinus (Steindachner, 1908) occurred from the
coastal plain to the plateau. The conservation status
of four species was officially ranked as endangered or
vulnerable according to Machado et al. (2005). They
were captured exclusively in the black-water streams
or in the highest plateau sites. One introduced species
the ‘‘Pacu’’ Piaractus mesopotamicus (Holmberg,
1887) was captured in site 4 (Table 2).
The number of individuals tended to be higher in
the electrofished sites whereas the sites sampled with
gillnets, funnel traps, and sieve yielded higher fish
weigh, which can be partly assigned to the sampling
effect (Table 1). As expected, the sampling technique
was responsible for the main source of variability,
which was expressed by the first ordination axis
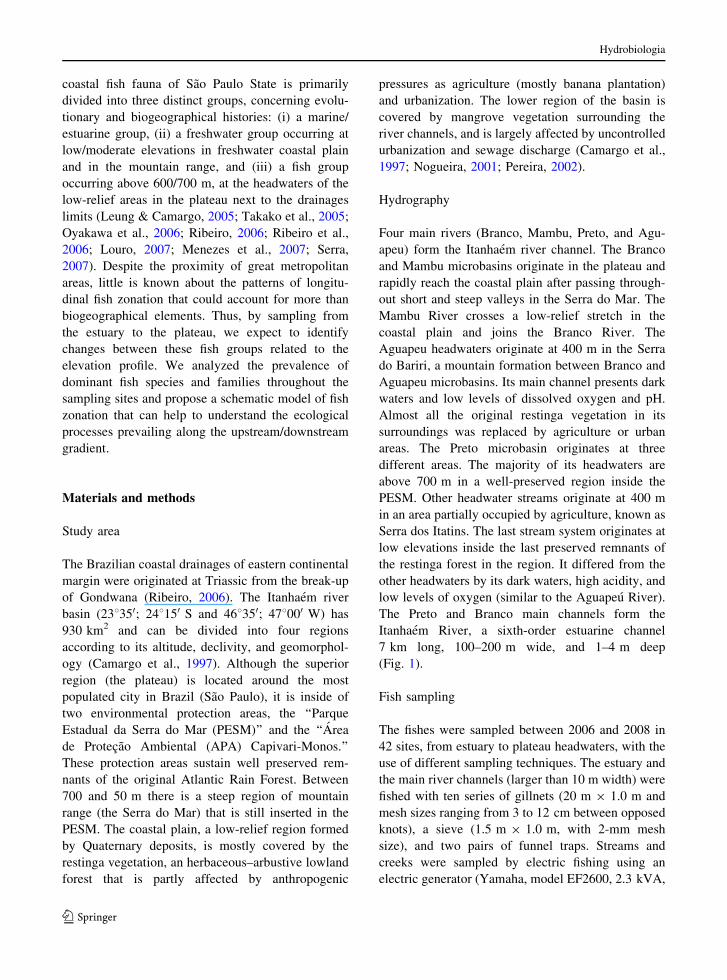
(Fig. 2). The electrofished sites (streams and creeks)
were in the right side of Fig. 2a, and the main river
channels in the left. The two estuarine sites (open
triangles) were in the left side of the dimension 1
while the plateau is in the lower right side (Fig. 2a).
Considering only the freshwater sites below 300 m,
the spatial species turnover expressed by dimension 1
was linearly correlated with the log of elevation
(r = 0.89; P \ 0.01; n = 32) (Fig. 2b). The IP index
of six marine/estuarine families (Paralichthyidae,
Ephippidae, Carangidae, Ariidae Tetraodontidae,
and Sciaenidae) was significantly associated to the
ordination (P B 0.05, Fig. 2a). Except for Sciaenid-
ade and Ariidae, all the families were represented by
one or two individuals caught exclusively in site 1.
For the freshwater families, we detected significant
association between Gymnotide, and the plateau sites,
where 84% of the individuals were caught. The
importance of Characidae, Heptapteridae, and Lori-
cariidae were associated to the coastal plain and to
the mountain range sites below 300 m (Fig. 2a).
However, we found that Characidae and Heptapter-
idae presented opposite patterns of importance. The
Characidae was better represented below 40 m, while
Heptapteridae became the dominant family above
Hydrobiologia
123

Ta
ble
2N
um
ber
of
ind
ivid
ual
s(N
),b
iom
ass
(W,
ing
ram
s),
and
IPin
dex
(91
00
)fo
rsp
ecie
sca
ptu
red
inth
ep
rop
ose
dfi
shzo
nes
Spec
ies
Fam
ily
FZ
1(1
)T
Z1
(3)
FZ
2(1
6)
TZ
2(9
)F
Z3
(5)
FZ
4(8
)
NW
IP9
100
NW
IP9
100
NW
IP9
100
NW
IP9
100
NW
IP9
100
NW
IP9
100
Cath
oro
ps
spix
ii(A
gas
siz,
1829)*
Ari
idae
20
1286.5
184.6
05
584.5
53.1
4
Gen
iden
sgen
iden
s(V
alen
cien
nes
,1840)*
Ari
idae
5744.3
212.2
46
904.7
85.8
3
Bair
die
lla
ronch
us
(Cuvie
r,1830)*
Sci
aenid
ae3
191.4
71.8
938
1949.7
379.6
3
Mic
ropogonia
sfu
rnie
ri(D
esm
ares
t,1823)*
Sci
aenid
ae2
63.1
20.4
26
175.2
01.1
3
Euci
nost
om
us
mel
anopte
rus
(Ble
eker
,1863)*
Ger
reid
ae2
18.7
10.1
22
64.8
30.1
4
Cen
tropom
us
para
llel
us
Poey
,1860*
Cen
tropom
idae
1121.1
90.4
01
10.4
20.0
12
34.9
8\
0.0
1
Cara
nx
cf.
latu
sA
gas
siz,
1831*
Car
angid
ae1
12.6
60.0
4
Chaet
odip
teru
sfa
ber
(Bro
uss
onet
,1782)*
Ephip
pid
ae1
9.8
60.0
3
Dia
pte
rus
rhom
beu
s(V
alen
cien
nes
,1830)*
Ger
reid
ae1
7.5
30.0
2
Etr
opus
sp.*
Par
alic
hth
yid
ae1
5.3
10.0
2
Lagoce
phalu
sla
evig
atu
s(L
innae
us,
1758)*
Tet
raodonti
dae
130.5
50.1
0
Men
tici
rrhus
am
eric
anus
(Lin
nae
us,
1758)*
Sci
aenid
ae1
13.5
30.0
4
Sphoer
oid
essp
engle
ri(B
loch
,1785)*
Tet
raodonti
dae
123.1
10.0
8
Deu
tero
don
iguape
Eig
enm
ann,
1907
Char
acid
ae28
43.1
51.3
0451
3232.3
943.9
2114
798.4
231.8
0
Geo
phagus
cf.
bra
sili
ensi
s(Q
uoy
&G
aim
ard,
1824)
Cic
hli
dae
8330.7
62.8
448
1934.2
72.8
03
35.8
40.0
41
4.4
30.0
16
147.6
20.2
0
Lyc
engra
uli
sgro
ssid
ens
(Agas
siz,
1829)*
Engru
lidae
590.0
50.4
8
Hopli
as
mala
bari
cus
(Blo
ch,
1974)
Ery
thri
nid
ae4
720.2
83.1
029
6403.0
65.5
91
7.2
0\
0.0
1
Hydrobiologia
123

Ta
ble
2co
nti
nu
ed
Spec
ies
Fam
ily
FZ
1(1
)T
Z1
(3)
FZ
2(1
6)
TZ
2(9
)F
Z3
(5)
FZ
4(8
)
NW
IP9
100
NW
IP9
100
NW
IP9
100
NW
IP9
100
NW
IP9
100
NW
IP9
100
Oli
gosa
rcus
hep
setu
s(C
uvie
r,1829)
Char
acid
ae4
88.8
90.3
821
64505.4
840.8
11
0.6
2\
0.0
1
Ste
llif
erra
stri
fer
(Jord
an,
1889)*
Sci
aenid
ae4
223.9
40.9
6
Hoplo
ster
num
litt
ora
le(H
anco
ck,
1828)
Cal
lich
thyid
ae3
192.4
70.6
23
540.2
80.0
5
Rham
dia
quel
en(Q
uoy
&G
aim
ard,
1824)
Hep
tapte
ridae
2128.8
30.2
825
2664.6
92.0
14
249.1
40.3
5
Phall
oce
ros
spp.
Poec
ilii
dae
10.1
8\
0.0
1146
283.1
01.2
580
75.5
02.1
125
13.0
60.4
3220
71.1
83.5
4
Chara
cidiu
msp
p.
Cre
nuch
idae
10.1
0\
0.0
1113
75.5
40.2
629
23.6
20.2
4
Rin
elori
cari
akr
onei
(Mir
anda
Rib
eiro
,1911)
Lori
cari
idae
123.6
10.0
348
307.2
10.4
410
51.5
70.1
81
0.8
1\
0.0
1
Cre
nic
ichla
lacu
stri
s(C
aste
lnau
,1856)
Cic
hli
dae
138.6
70.0
412
222.5
50.0
82
30.5
70.0
2
Gla
nid
ium
mel
anopte
rum
Mir
anda
Rib
eiro
,1918
Auch
enip
teri
dae
118.9
20.0
23
170.9
70.0
2
Pia
ract
us
mes
opota
mic
us
(Holm
ber
g,
1887)m
Char
acid
ae1
59.2
50.0
6
Mim
agonia
tes
mic
role
pis
(Ste
indac
hner
,1877)
Char
acid
ae247
83.8
50.6
212
13.9
60.0
6
Mim
agonia
tes
late
rali
s(N
ichols
,1913)#
d
Char
acid
ae180
53.5
30.2
9
Kro
nic
hth
yshey
landi
(Boule
nger
,1900)
Lori
cari
idae
106
252.6
90.8
1138
421.0
920.3
020
54.1
11.4
2
Scl
erom
ysta
xm
acr
opte
rus
Reg
an,
1913
#d
Cal
lich
thyid
ae67
51.8
10.1
0
Hyp
hes
sobry
con
reti
cula
tus
Ell
is,
1911
Char
acid
ae64
104.0
70.2
0
Scl
erom
ysta
xbarb
atu
s(Q
uoy
&G
aim
ard,
1824)
Cal
lich
thyid
ae50
106.2
20.1
638
68.6
30.9
1
Hydrobiologia
123

Ta
ble
2co
nti
nu
ed
Spec
ies
Fam
ily
FZ
1(1
)T
Z1
(3)
FZ
2(1
6)
TZ
2(9
)F
Z3
(5)
FZ
4(8
)
NW
IP9
100
NW
IP9
100
NW
IP9
100
NW
IP9
100
NW
IP9
100
NW
IP9
100
Ace
ntr
onic
hth
ysle
pto
sE
igen
man
n&
Eig
enm
ann,
1889
Hep
tapte
ridae
40
27.6
60.0
34
10.6
00.0
1
Pse
udoto
thyr
isobtu
sa(M
iran
da
Rib
eiro
,1911)
Lori
cari
idae
35
12.7
20.0
1
Pim
elodel
lacf
.tr
ansi
tori
aM
iran
da
Rib
eiro
,1905
Hep
tapte
ridae
26
155.2
80.1
24
33.6
30.0
5
Gym
notu
spanth
erin
us
(Ste
indac
hner
,1908)
Gym
noti
dae
21
210.7
80.1
36
102.8
80.2
22
15.0
70.0
4216
1956.4
695.5
5
Rham
dio
gla
nis
cf.
transf
asc
iatu
sM
iran
da
Rib
eiro
,1908
Hep
tapte
ridae
19
186.5
70.1
191
1305.2
741.4
981
894.3
795.0
1
Holl
andic
hth
ysm
ult
ifasc
iatu
s(E
igen
man
n&
Norr
is,
1900)
Char
acid
ae16
81.4
30.0
416
105.9
50.5
9
Sch
izole
cis
gunth
eri
(Mir
anda
Rib
eiro
,1918)
Lori
cari
idae
13
3.6
6\
0.0
177
26.1
90.7
021
9.5
80.2
6
Call
ichth
ysca
llic
hth
ys(L
innae
us,
1758)
Cal
lich
thyid
ae10
92.2
00.0
3
Riv
ulu
ssa
nte
nsi
sK
ohle
r,1906
Riv
uli
dae
83.8
5\
0.0
1
Bry
conam
eric
us
cf.
mic
roce
phalu
sM
iran
da
Rib
eiro
,1908
Char
acid
ae7
14.3
5\
0.0
19
11.0
20.0
3
Gym
notu
scf
.ca
rapo
Lin
nae
us,
1758
Gym
noti
dae
10
320.1
60.1
0
Anci
stru
ssp
.L
ori
cari
idae
619.7
5\
0.0
111
50.7
50.2
01
5.2
90.0
1
Tri
chom
ycte
rus
cf.
zonatu
s(E
igen
man
n,
1918)
Tri
chom
yct
erid
ae5
5.9
3\
0.0
118
31.0
10.2
010
16.8
90.2
2
Nannost
om
us
cf.
bec
kford
iG
unth
er,
1872
D
Leb
iasi
nid
ae5
0.9
0\
0.0
1
Hydrobiologia
123

Ta
ble
2co
nti
nu
ed
Spec
ies
Fam
ily
FZ
1(1
)T
Z1
(3)
FZ
2(1
6)
TZ
2(9
)F
Z3
(5)
FZ
4(8
)
NW
IP9
100
NW
IP9
100
NW
IP9
100
NW
IP9
100
NW
IP9
100
NW
IP9
100
Syn
bra
nch
us
marm
ora
tus
Blo
ch,
1975
Synbra
nch
idae
427.2
4\
0.0
11
87.0
20.0
3
Tri
chom
ycte
rus
sp2
Tri
chom
yct
erid
ae3
1.9
2\
0.0
14
5.1
10.0
1
Chara
cidiu
msp
1C
renuch
idae
24.5
2\
0.0
128
42.5
00.4
230
66.3
12.6
1
Aw
aous
taja
sica
(Lic
hte
nst
ein,
1822)*
Gobii
dae
211.1
3\
0.0
15
26.6
90.0
5
Rin
elori
cari
asp
1L
ori
cari
idae
212.9
6\
0.0
1
Tri
chom
ycte
rus
sp1
Tri
chom
yct
erid
ae1
0.4
6\
0.0
11
1.9
7\
0.0
1
Ast
yanax
janei
roen
sis
Eig
enm
ann,
1908
Char
acid
ae1
36.7
2\
0.0
1
Cen
tropom
us
undec
imali
s(B
loch
,1796)*
Cen
tropom
idae
1158.3
2\
0.0
1
Euger
res
bra
sili
anus
(Val
enci
ennes
,1830)*
Ger
reid
ae1
147.5
1\
0.0
1
Mugil
cure
ma
Val
enci
ennes
,1836*
Mugil
idae
1103.4
1\
0.0
1
Rin
elori
cari
aaf
f.la
tiro
stri
s(B
oule
nger
,1900)j
Lori
cari
idae
118.1
80.0
1
Pse
udoto
cincl
us
cf.
tiet
ensi
s(R
.Ih
erin
g,
1907)#
Lori
cari
idae
28
41.1
30.2
6
Chara
cidiu
msp
2C
renuch
idae
14
20.5
10.0
6
Tri
chom
ycte
rus
sp3
Tri
chom
yct
erid
ae13
45.1
10.1
3
Hyp
ost
om
us
sp.
Lori
cari
idae
12
61.0
20.1
7
Ast
yanax
sp.
Char
acid
ae10
34.5
60.0
8
Gla
ndulo
cauda
mel
anogen
ysE
igen
man
n,
1911
#
Char
acid
ae3
4.7
5\
0.0
1
Tota
lsp
ecie
sri
chnes
s13
20
42
26
10
10
Tota
lnum
ber
of
indiv
idual
s40
122
1854
707
192
523
Hydrobiologia
123

100 m. Loricariidae showed a modal distribution
with a peak between 40 and 100 m. It reached the
highest IP value at site 31 (75 m high, IP = 0.72)
coinciding with the absence of Characidae and with
the low importance of Heptapteridae (IP = 0.25).
Gymnotidae became dominant above 700 m, where
the contribution of the other three families was
negligible. The patterns described by the IP index
followed similar trends when we considered the
relative numerical abundance or relative biomass
(Fig. 3).
Species zonation
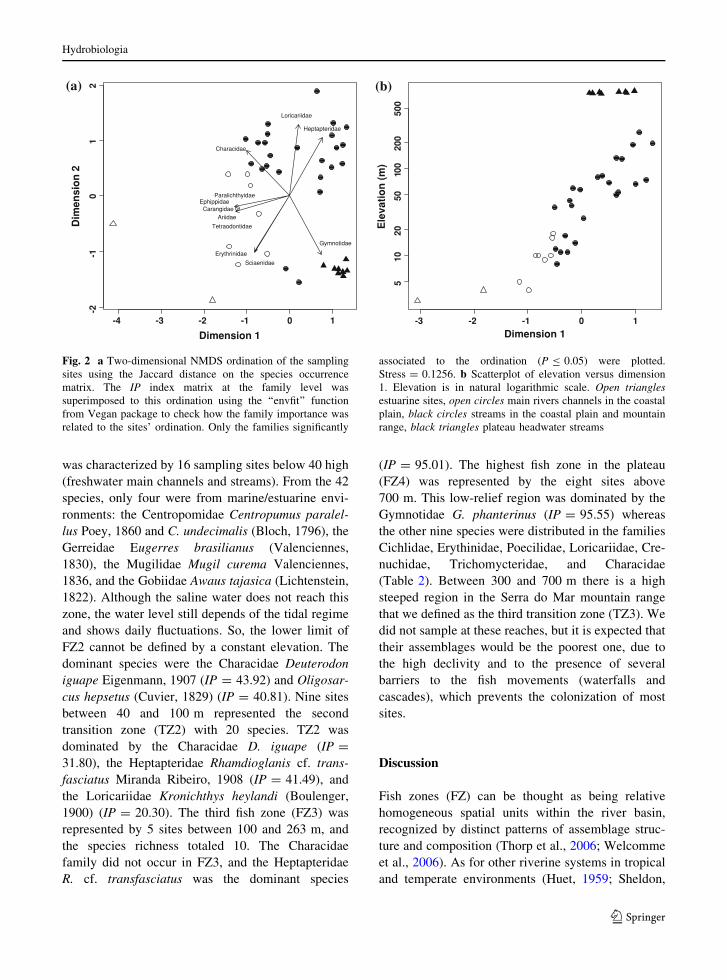
With the proposed fish zonation we attempted to
organize the main fish groups along the longitudinal
gradient in the Itanhaem river basin. The main
characteristics of the fish zones (FZ’s) and the related
sites were summarized in Tables 1 and 2, and Fig. 4.
The lowest site sampled with the eletrofisher (site 34
at 8 m) and the highest site sampled with gillnets,
sieves, and funnel traps (site 7 at 18 m) were inside
the limits of FZ2 (Table 1). So, it appears that the
sampling effects did not influence the delimitation of
the FZ’s and the TZ’s. The estuarine portion formed
the first zone (FZ1), which was inhabited only by
marine/estuarine species. Most species of this zone
have their spatial distribution limited by the ranges of
the saline level, which is, in turn, influenced by the
tidal regime and by the amount of freshwater flowing
from the upper basin portions. In our sample, FZ1
was characterized by site 1 in the Itanhaem river
channel. Louro (2007) caught 54 marine/estuarine
species in the same area but we caught only 18 which
probably indicates a low sampling efficiency for the
estuarine habitats. The most representative species
were the Ariidae catfishes Catorops spixii (Agassiz,
1829) (IP = 84.60) and Genidens genidens (Valen-
ciennes, 1840) (IP = 12.24). Above FZ1 there was a
reduction in the richness of marine species, and the
appearance of some freshwater species. We defined
this region as the transition zone (TZ1) between the
estuarine and the freshwater environments. In TZ1
we caught 20 species, being only eight of marine/
estuarine origin. The dominant species was the
Sciaenidae Bairdiella ronchus (Cuvier, 1830)
(IP = 79.63). The 14 freshwater species summed
only 10% of the total importance. TZ1 was charac-
terized by sites 2 to 4. The second fish zone (FZ2)Ta
ble
2co
nti
nu
ed
Spec
ies
Fam
ily
FZ
1(1
)T
Z1
(3)
FZ
2(1
6)
TZ
2(9
)F
Z3
(5)
FZ
4(8
)
NW
IP9
100
NW
IP9
100
NW
IP9
100
NW
IP9
100
NW
IP9
100
NW
IP9
100
Tota
lw
eight
(g)
13
20
42
26
10
10
*M
arin
e/E
stuar
ine
spec
ies.
mIn
troduce
dsp
ecie
s.#
Conse
rvat
ion
stat
us
offi
cial
lyra
nked
asvuln
erab
leor
endan
ger
ed(M
achad
oet
al.
2005
).d
Spec
ies
found
only
inac
idic
bla
ck-w
ater
stre
ams
bet
wee
nth
eS
tate
sof
Sao
Pau
loan
dS
anta
Cat
arin
a(M
enez
eset
al.
2007
).j
Nee
ds
taxonom
icco
nfi
rmat
ion
bec
ause
R.
lati
rost
ris
does
not
occ
ur
inth
eE
ast
bas
in.
DT
he
spec
ies
isknow
nfo
rth
eE
squib
ori
ver
(Guyan
a),
and
the
mid
dle
and
low
erA
maz
on.
Its
pre
sence
inso
me
dra
inag
esof
the
Eas
tB
asin
ispro
bab
lydue
toin
troduct
ion
by
aquar
ists
,but
unti
lnow
ther
eis
no
conse
nsu
sab
out
this
fact
.F
urt
her
more
,th
esp
ecie
snee
ds
abro
adly
taxonom
icre
vis
ion
thro
ughout
its
dis
trib
uti
on
range
(Men
ezes
etal
.2007
;B
rits
ki,
per
sonal
com
munic
atio
n).
The
IPin
dex
was
mult
ipli
edby
100
tofa
cili
tate
the
com
par
isons
among
the
less
import
ant
spec
ies.
Aft
erF
Zan
dT
Z,
the
num
ber
bet
wee
npar
enth
eses
refe
rsto
the
num
ber
of
site
ssa
mple
din
each
zone
Hydrobiologia
123
was characterized by 16 sampling sites below 40 high
(freshwater main channels and streams). From the 42
species, only four were from marine/estuarine envi-
ronments: the Centropomidae Centropumus paralel-
lus Poey, 1860 and C. undecimalis (Bloch, 1796), the
Gerreidae Eugerres brasilianus (Valenciennes,
1830), the Mugilidae Mugil curema Valenciennes,
1836, and the Gobiidae Awaus tajasica (Lichtenstein,
1822). Although the saline water does not reach this
zone, the water level still depends of the tidal regime
and shows daily fluctuations. So, the lower limit of
FZ2 cannot be defined by a constant elevation. The
dominant species were the Characidae Deuterodon
iguape Eigenmann, 1907 (IP = 43.92) and Oligosar-
cus hepsetus (Cuvier, 1829) (IP = 40.81). Nine sites
between 40 and 100 m represented the second
transition zone (TZ2) with 20 species. TZ2 was
dominated by the Characidae D. iguape (IP =
31.80), the Heptapteridae Rhamdioglanis cf. trans-
fasciatus Miranda Ribeiro, 1908 (IP = 41.49), and
the Loricariidae Kronichthys heylandi (Boulenger,
1900) (IP = 20.30). The third fish zone (FZ3) was
represented by 5 sites between 100 and 263 m, and
the species richness totaled 10. The Characidae
family did not occur in FZ3, and the Heptapteridae
R. cf. transfasciatus was the dominant species
(IP = 95.01). The highest fish zone in the plateau
(FZ4) was represented by the eight sites above
700 m. This low-relief region was dominated by the
Gymnotidae G. phanterinus (IP = 95.55) whereas
the other nine species were distributed in the families
Cichlidae, Erythinidae, Poecilidae, Loricariidae, Cre-
nuchidae, Trichomycteridae, and Characidae
(Table 2). Between 300 and 700 m there is a high
steeped region in the Serra do Mar mountain range
that we defined as the third transition zone (TZ3). We
did not sample at these reaches, but it is expected that
their assemblages would be the poorest one, due to
the high declivity and to the presence of several
barriers to the fish movements (waterfalls and
cascades), which prevents the colonization of most
sites.
Discussion
Fish zones (FZ) can be thought as being relative
homogeneous spatial units within the river basin,
recognized by distinct patterns of assemblage struc-
ture and composition (Thorp et al., 2006; Welcomme
et al., 2006). As for other riverine systems in tropical
and temperate environments (Huet, 1959; Sheldon,
-4 -3 -2 -1 0 1
-2-1
01
2
Dimension 1
Dim
ensi
on
2
AriidaeCarangidae
Characidae
Ephippidae
Erythrinidae
Gymnotidae
Heptapteridae
Loricariidae
Paralichthyidae
Sciaenidae
Tetraodontidae
-3 -2 -1 0 1
510
2050
100
200
500
Dimension 1
Ele
vati
on
(m
)
(a) (b)
Fig. 2 a Two-dimensional NMDS ordination of the sampling
sites using the Jaccard distance on the species occurrence
matrix. The IP index matrix at the family level was
superimposed to this ordination using the ‘‘envfit’’ function
from Vegan package to check how the family importance was
related to the sites’ ordination. Only the families significantly
associated to the ordination (P B 0.05) were plotted.
Stress = 0.1256. b Scatterplot of elevation versus dimension
1. Elevation is in natural logarithmic scale. Open trianglesestuarine sites, open circles main rivers channels in the coastal
plain, black circles streams in the coastal plain and mountain
range, black triangles plateau headwater streams
Hydrobiologia
123

1968; Winemiller & Leslie, 1992; Peres-Neto, 1995;
Aarts & Nienhuis, 2003; Petry & Schulz, 2006; Lasne
et al., 2007; Araujo et al., 2009; Orrego et al., 2009),
we found evidences for longitudinal fish zonation in
the Itanhaem river basin. The characterization of the
proposed zones followed the pattern of dominance of
different fish families. The fish zones represented the
estuarine environment (FZ1, Ariidae dominant
assemblages), the low-gradient rivers and streams
in the coastal plain (FZ2, Characidae dominant
assemblages), the high steeped streams in the moun-
tain range (FZ3, Heptapteridae dominant assem-
blages), and the low-gradient headwater streams in
the plateau (FZ4, Gymnotidae dominant assem-
blages). Between two adjacent zones we found
transition zones (TZ) where the assemblages had
elements of the two adjacent FZ’s (Tables 1, 2;
Fig. 4). Our findings highlight a criticism to the
earlier concept of fish zonation, i.e., that the zones are
not discrete entities, but replace each other gradually
5 10 20 50 100 200 500
0.0
0.2
0.4
0.6
0.8
1.0
0.0
0.2
0.4
0.6
0.8
1.0
0.0
0.2
0.4
0.6
0.8
1.0
0.0
0.2
0.4
0.6
0.8
1.0
Elevation (m)
5 10 20 50 100 200 500
Elevation (m)5 10 20 50 100 200 500
Elevation (m)
5 10 20 50 100 200 500
Elevation (m)
IP In
dex
IP In
dex
Assemblage
trasition zone
Assemblage
trasition zone
Characidae
Heptapteridae
Loricariidae
Gymnotidae
Assemblage
trasition zone
Assemblage
trasition zone
Rel
ativ
e n
um
eric
ab
un
dan
ce
Assemblage
trasition zone
Assemblage
trasition zone
Rel
ativ
e b
iom
ass
Assemblage
trasition zone
Assemblage
trasition zone
(a) (b)
(c) (d)
Fig. 3 a Scatterplot of the elevation versus IP index for
Characidae (open circles), Heptapteridae (open triangles),
Loricariidae (black circles), and Gymnotidae (black squares).
b Smoothed lines from the LOWESS regression for the same
data. The same patterns are showed for relative numeric
abundance (c) and relative biomass (d). The two estuarine sites
in the Itanhaem river were excluded from the figures due to the
absence or the low representativeness of these families.
Elevation is in natural logarithmic scale. The proposal of the
transition zones (sketched in gray) was based on the
distribution and prevalence of these four dominant families
along the elevation profile
Hydrobiologia
123
along the downstream profile forming diffuse bound-
aries (Lasne et al., 2007). The FZ’s and TZ’s were
organized according to the elevations sampled. In our
case, elevation has a close relationship with different
biogeographical region isolating the plateau from the
mountain range and coastal plain fish faunas. Below
300 m, the elevation stressed the changes from
rhithron to potamon areas in the freshwater sites.
The elevation criterion could not be used for the lower
zones (FZ1 and TZ1) because their elevation varied
with the tidal regime. Thus, the limits between these
zones were defined according to the contribution of
the marine/estuarine fishes in the samples, which in
turn depends on the proximity of the basin mouth.
The patterns of species addition and replacement
are commonly described for lotic gradients (Peres-
Neto, 1995). Species addition seems to prevail in less
abrupt transitions whereas species substitution
resulted from abrupt transitions along the fresh/salt
water interface or between distinct geomorphic
formations, and are expressed by higher rates of
species turnover (Balon & Stewart, 1983; Winemiller
& Leslie, 1992; Edds, 1993; Wilkison & Edds, 2001).
In the Itanhaem river basin, we detect higher species
turnover between FZ4 and FZ3 representing the
geomorphic transition from the high steeped streams
in the mountain range to the low-gradient streams in
the plateau. Some fishes caught in FZ4, such as
Glandulocauda melanogenys Eigenmann, 1911 and
Pseudotocinclus cf. tietensis (R. Ihering, 1907), are
typical representatives of the adjacent upper Tiete
basin. On the other hand, G. pantherinus evolved first
in coastal drainages and irradiated to adjacent interior
basins only recently (Ribeiro, 2006). G. pantherinus
Fig. 4 Diagram of fish assemblage zonation in the Itanhaem
river basin related to elevation. The distribution of the river and
its streams along the elevation gradient (sketched in grayrectangle at right) was concerned to the 42 sampling sites, and
not to the actual distribution of all these aquatic habitats in the
basin. The highest river sampled was at 18 m (site 7), and the
lowest stream at 8 m (site 34). The exact elevation limits for
TZ1 varies with tidal regime. FZ1 estuary (Ariidae dominant
assemblages), TZ1 transition zone 1 (estuarine-freshwater
assemblages dominated by the Sciaenidae Bairdiella ronchus),
FZ2 fish zone 2 (Characidae dominant assemblages), TZ2transition zone 2, FZ3 fish zone 3 (Heptapteridae dominant
assemblages), TZ3 transition zone 3, FZ4 fish zone 4
(Gymnotidae dominant assemblages). The distances to the
moth are only approximated
Hydrobiologia
123

was highly associated to sandy streams, and similar to
other Gymnotidae species, it has elongated body
shape with the caudal fin absent. During the day, it
lives along the marginal vegetation, but at night, it
explores the environment to feed on insects and
eventually on small fishes (Oyakawa et al., 2006).
The complex and recent history of faunal interchange
between the upper Tiete basin and adjacent coastal
areas are examples of recent vicariant events that
took place during the Tertiary and can be explained
by the occurrence of tectonic movements and erosive
retreats of the Serra do Mar (Ribeiro, 2006; Ribeiro
et al., 2006). Therefore, some headwaters that
otherwise run to interior watersheds, now run to
costal drainages, causing truly hybrid zones affecting
the distribution and the evolutionary patters of
several groups. For instance, Takako et al. (2005)
described morphological differences among species
of the genus Parotocinclus caught in the upper Tiete
and in the coastal drainages of Sao Paulo State. The
other abrupt transition zone was TZ1, representing
the change between fresh and salt water environ-
ments. Although the freshwater fishes in TZ1 prevail
in species number, they accounted for less than 10%
of the total importance (Table 2). The dominant
species, B. ronchus, is essentially carnivorous, feed-
ing on several benthic organisms, and uses the more
internal estuarine areas, where it remains for most of
its life cycle (Louro, 2007). In general, this species is
not caught in deeper marine waters in the littoral of
Sao Paulo State (Souza et al., 2008). The abundance
of B. ronchus in the internal area of the Itanhaem
estuary was already detected by Silva Jr. & Petrere Jr.
(1994). The freshwater fishes in TZ1 were caught
mainly in sites 3 and 4 (mouth of the rivers Preto and
Branco, respectively). Leung & Camargo (2005)
sampled the fishes associated to aquatic macrophyte
stands in the Branco river (12 km to the Itanhaem
river mouth and next to our site 3) and, although they
used different sampling procedures, the results were
quite similar to ours, with the dominance of fresh-
water fishes (150 individuals and 14 species), and a
lower contribution of marine/estuarine species (8
individuals and 5 species). In site 2 (upper Itanhaem
channel), the freshwater species were caught only in
the summer season (wet season). This suggests
temporal patterns in species turnover in the estuary,
which might be mediated by seasonal variations in
the salinity levels (Silva Jr. & Petrere Jr., 1994;
Barletta et al., 2005; Louro, 2007). In the estuaries of
the Estacao Ecologica da Jureia (South littoral of the
State of Sao Paulo) the genus Centropomus is more
frequently caught between March and April, indicat-
ing seasonal shifts in this species requirements which
may be related to reproductive or feeding behavior
(Sabino & Silva, 2004). The two species of Centrop-
omus (C. parallelus and C. undecinalis) caught in
Itanhaem river basin occurred from FZ1 to FZ2.
These fishes are active, visually oriented carnivores,
and may exert influence upon freshwater and estua-
rine fish assemblages through predation (Leung &
Camargo, 2005). Owing to their migratory habits,
from estuary to freshwaters zones, they are probably
susceptible to river damming in coastal basins. The
less abrupt transitions detected in TZ2 were marked
by species addition downstream and by a gradual
change in the dominant families. This gradual change
can be verified in the Fig. 2, which shows the higher
contributions of Heptapteridae between 100 and
300 m, and of Characidae below 40 m. Loricariidae
shows a modal distribution in TZ2 between 40 and
100 m. Petry and Schulz (2006) detected the domi-
nance of Characidae and Loricariidae species for a
subtropical Brazilian river but a lower contribution of
Heptapteridae. This trend probably reflects the fact
that these authors sampled at elevations below
160 m, downstream to river barriers such as cascades
or waterfalls. Deus (1999) found marked differences
in the composition of the stream fish assemblages
above and bellow waterfalls in the Estacao Ecologica
da Jureia.
The Characidae comprise the most numerous and
diverse freshwater family in Central and South
America. A large number of Characidae species were
recently rearranged under Incertae Sedis genera due
to uncertainties about their phylogenetic relation-
ships. This is the case for D. iguape and O. hepsetus,
the dominant species in FZ2. Only the few groups for
which there is evidence of monophyly were main-
tained in their traditional subfamilies (Malabarba
et al., 1998; Reis et al., 2003). The high heteroge-
neous nature of Characidae is exemplified by the
diversity of reproductive behaviors and feeding
habits. In the coastal basins, some species have
internal insemination (genera Hollandichthys, Mima-
goniates, and Glandulocauda), an uncommon behav-
ior that protects the sperm cells from the acid waters
(Menezes et al., 2007). Other species of forested
Hydrobiologia
123
streams present short longitudinal movements related
to reproductive strategies, with the adults migrating
upstream to spawn during prolonged periods (Mazz-
oni et al., 2004). Long reproductive periods are
common for some species of Characidae in the
headwaters of the Atlantic rain forest (Mazzoni et al.,
2005; Souza, 2009). Concerning the diversity of
feeding habits, several species knows as ‘‘lambaris’’
are omnivorous, insectivorous, or herbivorous. The
species of the genus Deuterodon, for example, were
classified as omnivorous (Mazzoni & Resende, 2003)
or herbivorous (Esteves and Lobon-Cervia, 2001)
depending on the author. One of the first dietary
studies classified D. iguape as omnivorous but
highlighted the high presence of algae in the stom-
achs and ontogenetic changes, with juveniles feeding
highly on insects (Sabino & Castro, 1990). The
capacity of change the feeding behavior according to
different ontogenetic stages or due to differences in
resource availability is common to several tropical
freshwater fishes (Agostinho et al., 2007). In the
Itanhaem river basin, as in other coastal drainages of
southeast Brazil, the only piscivorous Characidae was
O. hepsetus. However, the diet of Oligosarcus is not
restricted to fishes, but also includes other animals
such as insects (Casatti, 2002). The piscivory in this
case may be related to the pattern of individual
growth, where larger individuals can feed on larger
items. Considering the diversity of habits hitherto
cited, perhaps, the only common feature for the
Characidae family as a whole would be the laterally
compressed body which favors nektonic habits and
the maneuverability in low current conditions (Petry
& Schulz, 2006).
The Heptapteridae are commonly represented by
carnivorous catfishes that feed on a variety of items
such as insects (adults or larvae), crustaceans, or
small fishes, while the Loridariidae feed basically on
periphyton, and eventually on small benthonic insects
(Gerhard, 1999; Casatti, 2002; Oyakawa et al., 2006;
Menezes et al., 2007; Braga et al., 2008). These two
families have dorsally compressed bodies and have
nektobenthic or benthic habitats (Langeani et al.,
2005) which favor the colonization of fast flowing
and steep environments, such as the streams of TZ2
and FZ3. We hypothesized that the gradual change
from Characidae to Heptapteridae, and the distribu-
tion range of Loricariidae probably resulted from
complex interactions between flow suitability and the
amount of food resources available for the fish
assemblages. In small headwater creeks such as those
in FZ3, the riparian vegetation may prevent the
extensive growth of the periphyton, and the trophic
food web may be sustained by the input of allochth-
onous insects (Barrella et al., 2000).
Implications of fish zonation
The delimitation of fish zones has theoretical appli-
cability for community ecology, and their recognition
could help to understand the regulatory mechanisms
underlying assemblage dynamics. Models of the
strength and frequency of species interactions, for
example, stated that abundant species have strong
effects on rare species (Vazquez et al., 2007). The
most abundant species are supposed to play a pivotal
role in the determination of patterns of biotic
interactions in ecological networks. Flecker (1992)
detected indirect influences of fish on the abundance
of invertebrates in Andean streams, an effect that
increases with fish density, and which were mediated
by the modification in the resource distribution used
by these invertebrates. For tropical streams, Gilliam
et al. (1993) described complementary distribution of
predator (Hoplias) and prey (Rivulus) species and
significant effects of interspecific competition in
which the presence of Poecilia depressed the growth
rate of Rivulus. On the other hand, such biotic
interactions can be difficult to verify without non-
manipulated experiments. Indeed, in systems sub-
jected to stochastic environmental fluctuations, their
potential to maintain the assemblage dynamics can be
minimum (Jackson et al., 2001). Even in that case, we
could expect that the dominant groups in specific
locations are those that better explore the amount of
available resources. Concerning the complexity
behind these patterns, we propose that the FZ’s
(and TZ’s) might be used as baseline for testing
ecological theories of community assembly along the
longitudinal gradient of these environments.
Applied issues related to delimitation of fish zones
are usually directed to the development of ecological
indicators that could be used for the rehabilitation of
degraded areas (Karr, 1999; Aarts & Nienhuis, 2003;
Welcomme et al., 2006; Lasne et al., 2007; Orrego
et al., 2009; Araujo et al., 2009). Other attempts to
develop arrangements of fish zonation used more
complex method to define the indicator species (Petry
Hydrobiologia
123
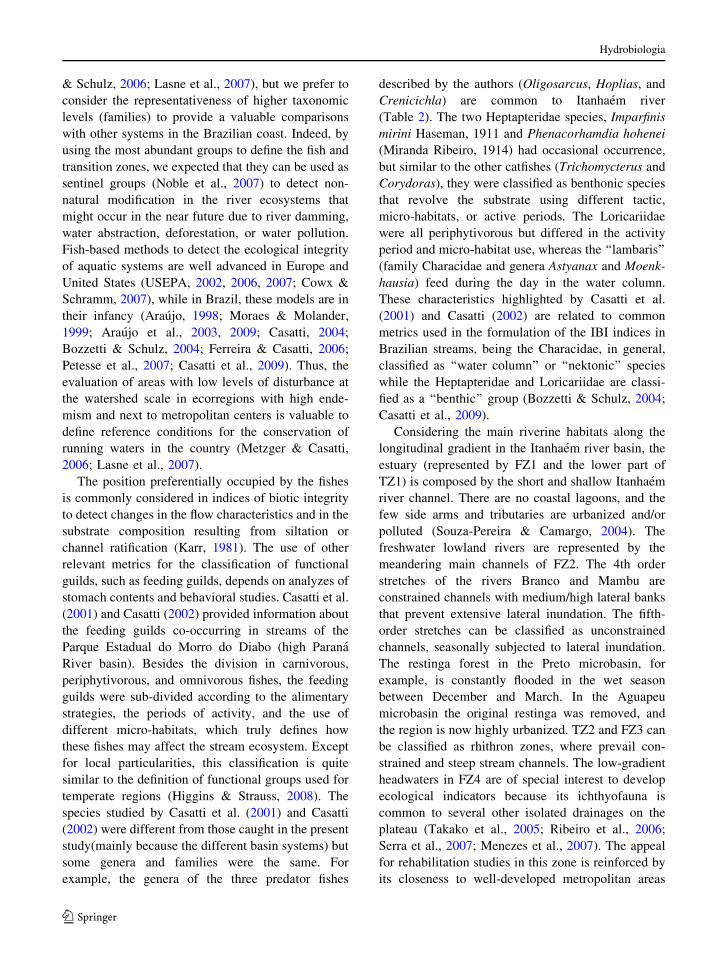
& Schulz, 2006; Lasne et al., 2007), but we prefer to
consider the representativeness of higher taxonomic
levels (families) to provide a valuable comparisons
with other systems in the Brazilian coast. Indeed, by
using the most abundant groups to define the fish and
transition zones, we expected that they can be used as
sentinel groups (Noble et al., 2007) to detect non-
natural modification in the river ecosystems that
might occur in the near future due to river damming,
water abstraction, deforestation, or water pollution.
Fish-based methods to detect the ecological integrity
of aquatic systems are well advanced in Europe and
United States (USEPA, 2002, 2006, 2007; Cowx &
Schramm, 2007), while in Brazil, these models are in
their infancy (Araujo, 1998; Moraes & Molander,
1999; Araujo et al., 2003, 2009; Casatti, 2004;
Bozzetti & Schulz, 2004; Ferreira & Casatti, 2006;
Petesse et al., 2007; Casatti et al., 2009). Thus, the
evaluation of areas with low levels of disturbance at
the watershed scale in ecorregions with high ende-
mism and next to metropolitan centers is valuable to
define reference conditions for the conservation of
running waters in the country (Metzger & Casatti,
2006; Lasne et al., 2007).
The position preferentially occupied by the fishes
is commonly considered in indices of biotic integrity
to detect changes in the flow characteristics and in the
substrate composition resulting from siltation or
channel ratification (Karr, 1981). The use of other
relevant metrics for the classification of functional
guilds, such as feeding guilds, depends on analyzes of
stomach contents and behavioral studies. Casatti et al.
(2001) and Casatti (2002) provided information about
the feeding guilds co-occurring in streams of the
Parque Estadual do Morro do Diabo (high Parana
River basin). Besides the division in carnivorous,
periphytivorous, and omnivorous fishes, the feeding
guilds were sub-divided according to the alimentary
strategies, the periods of activity, and the use of
different micro-habitats, which truly defines how
these fishes may affect the stream ecosystem. Except
for local particularities, this classification is quite
similar to the definition of functional groups used for
temperate regions (Higgins & Strauss, 2008). The
species studied by Casatti et al. (2001) and Casatti
(2002) were different from those caught in the present
study(mainly because the different basin systems) but
some genera and families were the same. For
example, the genera of the three predator fishes
described by the authors (Oligosarcus, Hoplias, and
Crenicichla) are common to Itanhaem river
(Table 2). The two Heptapteridae species, Imparfinis
mirini Haseman, 1911 and Phenacorhamdia hohenei
(Miranda Ribeiro, 1914) had occasional occurrence,
but similar to the other catfishes (Trichomycterus and
Corydoras), they were classified as benthonic species
that revolve the substrate using different tactic,
micro-habitats, or active periods. The Loricariidae
were all periphytivorous but differed in the activity
period and micro-habitat use, whereas the ‘‘lambaris’’
(family Characidae and genera Astyanax and Moenk-
hausia) feed during the day in the water column.
These characteristics highlighted by Casatti et al.
(2001) and Casatti (2002) are related to common
metrics used in the formulation of the IBI indices in
Brazilian streams, being the Characidae, in general,
classified as ‘‘water column’’ or ‘‘nektonic’’ species
while the Heptapteridae and Loricariidae are classi-
fied as a ‘‘benthic’’ group (Bozzetti & Schulz, 2004;
Casatti et al., 2009).
Considering the main riverine habitats along the
longitudinal gradient in the Itanhaem river basin, the
estuary (represented by FZ1 and the lower part of
TZ1) is composed by the short and shallow Itanhaem
river channel. There are no coastal lagoons, and the
few side arms and tributaries are urbanized and/or
polluted (Souza-Pereira & Camargo, 2004). The
freshwater lowland rivers are represented by the
meandering main channels of FZ2. The 4th order
stretches of the rivers Branco and Mambu are
constrained channels with medium/high lateral banks
that prevent extensive lateral inundation. The fifth-
order stretches can be classified as unconstrained
channels, seasonally subjected to lateral inundation.
The restinga forest in the Preto microbasin, for
example, is constantly flooded in the wet season
between December and March. In the Aguapeu
microbasin the original restinga was removed, and
the region is now highly urbanized. TZ2 and FZ3 can
be classified as rhithron zones, where prevail con-
strained and steep stream channels. The low-gradient
headwaters in FZ4 are of special interest to develop
ecological indicators because its ichthyofauna is
common to several other isolated drainages on the
plateau (Takako et al., 2005; Ribeiro et al., 2006;
Serra et al., 2007; Menezes et al., 2007). The appeal
for rehabilitation studies in this zone is reinforced by
its closeness to well-developed metropolitan areas
Hydrobiologia
123
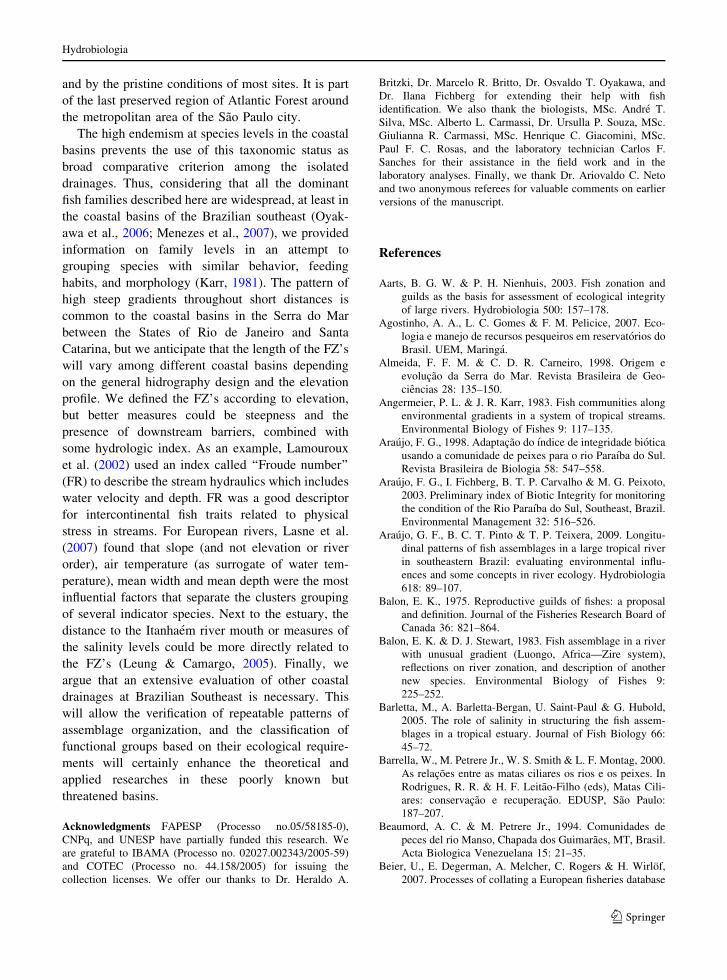
and by the pristine conditions of most sites. It is part
of the last preserved region of Atlantic Forest around
the metropolitan area of the Sao Paulo city.
The high endemism at species levels in the coastal
basins prevents the use of this taxonomic status as
broad comparative criterion among the isolated
drainages. Thus, considering that all the dominant
fish families described here are widespread, at least in
the coastal basins of the Brazilian southeast (Oyak-
awa et al., 2006; Menezes et al., 2007), we provided
information on family levels in an attempt to
grouping species with similar behavior, feeding
habits, and morphology (Karr, 1981). The pattern of
high steep gradients throughout short distances is
common to the coastal basins in the Serra do Mar
between the States of Rio de Janeiro and Santa
Catarina, but we anticipate that the length of the FZ’s
will vary among different coastal basins depending
on the general hidrography design and the elevation
profile. We defined the FZ’s according to elevation,
but better measures could be steepness and the
presence of downstream barriers, combined with
some hydrologic index. As an example, Lamouroux
et al. (2002) used an index called ‘‘Froude number’’
(FR) to describe the stream hydraulics which includes
water velocity and depth. FR was a good descriptor
for intercontinental fish traits related to physical
stress in streams. For European rivers, Lasne et al.
(2007) found that slope (and not elevation or river
order), air temperature (as surrogate of water tem-
perature), mean width and mean depth were the most
influential factors that separate the clusters grouping
of several indicator species. Next to the estuary, the
distance to the Itanhaem river mouth or measures of
the salinity levels could be more directly related to
the FZ’s (Leung & Camargo, 2005). Finally, we
argue that an extensive evaluation of other coastal
drainages at Brazilian Southeast is necessary. This
will allow the verification of repeatable patterns of
assemblage organization, and the classification of
functional groups based on their ecological require-
ments will certainly enhance the theoretical and
applied researches in these poorly known but
threatened basins.
Acknowledgments FAPESP (Processo no.05/58185-0),
CNPq, and UNESP have partially funded this research. We
are grateful to IBAMA (Processo no. 02027.002343/2005-59)
and COTEC (Processo no. 44.158/2005) for issuing the
collection licenses. We offer our thanks to Dr. Heraldo A.
Britzki, Dr. Marcelo R. Britto, Dr. Osvaldo T. Oyakawa, and
Dr. Ilana Fichberg for extending their help with fish
identification. We also thank the biologists, MSc. Andre T.
Silva, MSc. Alberto L. Carmassi, Dr. Ursulla P. Souza, MSc.
Giulianna R. Carmassi, MSc. Henrique C. Giacomini, MSc.
Paul F. C. Rosas, and the laboratory technician Carlos F.
Sanches for their assistance in the field work and in the
laboratory analyses. Finally, we thank Dr. Ariovaldo C. Neto
and two anonymous referees for valuable comments on earlier
versions of the manuscript.
References
Aarts, B. G. W. & P. H. Nienhuis, 2003. Fish zonation and
guilds as the basis for assessment of ecological integrity
of large rivers. Hydrobiologia 500: 157–178.
Agostinho, A. A., L. C. Gomes & F. M. Pelicice, 2007. Eco-
logia e manejo de recursos pesqueiros em reservatorios do
Brasil. UEM, Maringa.
Almeida, F. F. M. & C. D. R. Carneiro, 1998. Origem e
evolucao da Serra do Mar. Revista Brasileira de Geo-
ciencias 28: 135–150.
Angermeier, P. L. & J. R. Karr, 1983. Fish communities along
environmental gradients in a system of tropical streams.
Environmental Biology of Fishes 9: 117–135.
Araujo, F. G., 1998. Adaptacao do ındice de integridade biotica
usando a comunidade de peixes para o rio Paraıba do Sul.
Revista Brasileira de Biologia 58: 547–558.
Araujo, F. G., I. Fichberg, B. T. P. Carvalho & M. G. Peixoto,
2003. Preliminary index of Biotic Integrity for monitoring
the condition of the Rio Paraıba do Sul, Southeast, Brazil.
Environmental Management 32: 516–526.
Araujo, G. F., B. C. T. Pinto & T. P. Teixera, 2009. Longitu-
dinal patterns of fish assemblages in a large tropical river
in southeastern Brazil: evaluating environmental influ-
ences and some concepts in river ecology. Hydrobiologia
618: 89–107.
Balon, E. K., 1975. Reproductive guilds of fishes: a proposal
and definition. Journal of the Fisheries Research Board of
Canada 36: 821–864.
Balon, E. K. & D. J. Stewart, 1983. Fish assemblage in a river
with unusual gradient (Luongo, Africa—Zire system),
reflections on river zonation, and description of another
new species. Environmental Biology of Fishes 9:
225–252.
Barletta, M., A. Barletta-Bergan, U. Saint-Paul & G. Hubold,
2005. The role of salinity in structuring the fish assem-
blages in a tropical estuary. Journal of Fish Biology 66:
45–72.
Barrella, W., M. Petrere Jr., W. S. Smith & L. F. Montag, 2000.
As relacoes entre as matas ciliares os rios e os peixes. In
Rodrigues, R. R. & H. F. Leitao-Filho (eds), Matas Cili-
ares: conservacao e recuperacao. EDUSP, Sao Paulo:
187–207.
Beaumord, A. C. & M. Petrere Jr., 1994. Comunidades de
peces del rio Manso, Chapada dos Guimaraes, MT, Brasil.
Acta Biologica Venezuelana 15: 21–35.
Beier, U., E. Degerman, A. Melcher, C. Rogers & H. Wirlof,
2007. Processes of collating a European fisheries database
Hydrobiologia
123

to meet the objectives of the European Union Water
Framework Directive. Fisheries Management and Ecology
14: 407–416.
Bozzetti, M. & U. H. Schulz, 2004. An index of biotic integrity
based on fish assemblage for subtropical streams in
southern Brazil. Hydrobiologia 529: 133–144.
Braga, F. M. S., L. M. Gomiero & U. P. Souza, 2008. Aspectos
da reproducao e alimentacao de Neoplecostomus microps(Loricariidae, Neoplecostominae) na microbacia do
Ribeirao Grande, serra da Mantiqueira oriental (Estado de
Sao Paulo). Acta Sciaentiarum Biological Science 30:
455–463.
Buhrnheim, C. M. & C. C. Fernandes, 2003. Structure of fish
assemblages in Amazonian rain-forest streams: effects of
habitats and locality. Copeia 2003: 255–262.
Camargo, A. F. M., P. R. Nucci, L. M. Bini & U. L. Silva Jr.,
1997. The influence of the geology on the limnological
characteristics of some lotic ecosystems of the Itanhaem
River Basin, SP-Brazil. Verhandlungen des Internationa-
len Verein Limnologie 26: 860–864.
Casatti, L. 2002. Alimentacao dos peixes em um riacho do
Parque Estadual do Morro do Diabo, bacia do alto rio
Parana, sudeste do Brasil. Biota Neotropica 2 [available
on internet at http://www.biotaneotropica.org.br/v2n2/pt/
fullpaper?bn02502022002?pt].
Casatti, L., 2004. Ichthyofauna of two streams (silted and
reference) in the upper Parana river basin, southeastern
Brazil. Brazilian Journal of Biology 64: 757–765.
Casatti, L., F. Langeani & R. M. C. Castro, 2001. Peixes de
riacho do Parque Estadual do Morro do Diabo, bacia do
alto rio Parana, SP. Biota Neotropica [available on inter-
net at http://www.biotaneotropica.org.br/v1n12/pt/full
paper?bn00201122001?pt].
Casatti, L., C. P. Ferreira & F. Langeani, 2009. A fish-based
biotic integrity index for assessment of lowland streams in
southeastern Brazil. Hydrobiologia 623: 173–189.
Cowx, I. G. & H. L. Schramm, 2007. Developing, evaluating
and implementation of stantardised fish-based assessment
method for the ecological status of European rivers
(FAME). Fisheries Management and Ecology 14(6):
91–101.
Deus, C. P., 1999. Estrutura, dieta e padrao longitudinal da
comunidade de peixes de dois rios da estacao ecologica da
Jureia-Itatins e sua regulacao por fatores bioticos e abi-
oticos. Universidade Estadual de Campinas, Campinas.
Edds, D. R., 1993. Fish assemblage structure and environ-
mental correlates in Nepal’s Gandaki river. Copeia 1993:
48–60.
Esteves, K. E. & J. Lobon-Cervia, 2001. Composition and
tropic structure of a fish community of clear water
Atlantic rainforest stream in southeastern Brazil. Envi-
ronmental Biology of Fishes 62: 429–440.
Ferreira, C. P. & L. Casatti, 2006. Integridade biotica de um
corrego na bacia do Alto Rio Parana avaliada por meio da
comunidade de peixes. Biota Neotropica 6: 1–25.
Flecker, A. S., 1992. Fish trophic guilds and structure of a
tropical stream: weak direct vs. strong indirect effects.
Ecology 73: 927–940.
Gerhard, P., 1999. Ecologia de populacoes e comportamento de
quatro especies de bagres Hepapterinae (Teleostei: Silur-
iformes) em riachos do Alto Vale do rio Ribeira
(Iporanga, Sao Paulo). Universidade de Sao Paulo, Sao
Paulo.
Gilliam, J. F., D. F. Fraser & M. Alkins-Koo, 1993. Structure
of a tropical stream fish community: a role for biotic
interactions. Ecology 74: 1856–1870.
Higgins, C. L. & R. E. Strauss, 2008. Modeling stream fish
assemblages with niche apportionment models: patterns,
processes, and scale dependence. Transactions of the
American Fisheries Society 137: 696–706.
Hoeinghaus, D. J., K. O. Winemiller & J. S. Birnbaum, 2007.
Local and regional determinants of stream fish assemblage
structure: inferences based on taxonomic vs. functional
groups. Journal of Biogeography 34: 324–338.
Huet, M., 1959. Profiles and biology of western European
streams as related to fisheries management. Transactions
of the American Fisheries Society 88: 155–163.
Jackson, D. A., P. R. Peres-Neto & J. D. Olden, 2001. What
controls who is where in the freshwater fish communities—
the roles of biotic, abiotic and spatial factors. Canadian
Journal of Fisheries and Aquatic Sciences 58: 157–170.
Kadye, W. T., C. H. D. Magadza, N. A. G. Moyo & S. Kativu,
2008. Stream fish assemblages in relation to environ-
mental factor son a montane plateau (Nyika Plateau
Malawi). Environmental Biology of Fishes 83: 417–428.
Karr, J. R., 1981. Assessment of biotic integrity using fish
communities. American Fisheries Society 6: 21–27.
Karr, J. R., 1999. Defining and measuring river health. Fresh-
water Biology 41: 221–234.
Lamouroux, N., N. L. Poff & P. L. Angermeier, 2002. Inter-
continental convergence of stream fish community traits
along geomorphic and hydraulic gradients. Ecology 83:
1792–1807.
Langeani, F., L. Casatti, H. S. Gameiro, A. B. Carmo & D. C.
Rossa-Feres, 2005. Riffle and pool fish communities in a
large stream of southeastern Brasil. Neotropical Ichthyol-
ogy 3: 305–311.
Lasne, E., B. Bergerot, S. Lek & P. Laffaille, 2007. Fish
zonation and indicator species for the evaluation of the
ecological status of rivers: example of the Loire basin
(France). River Research and Applications 23: 877–890.
Leung, R. & A. F. M. Camargo, 2005. Marine influence on fish
assemblage in coastal streams of Itanhaem river basin,
Southeastern Brazil. Acta Limnologica Brasiliensia 17:
219–232.
Louro, M. P., 2007. A ictiofauna do estuario do rio Itanhaem,
SP, Brasil: dinamica espaco-temporal e aspectos biologi-
cos das especies principais. Instituto Oceanografico,
Univerisdade de Sao Paulo, Sao Paulo.
Ludwig, J. A. & J. F. Reynolds, 1988. Statistical Ecology: A
Primer on Methods and Computing. John Wiley & Sons,
New York.
Machado, A. B. M., C. S. Martins & G. M. Drumond (eds),
2005. Lista da fauna brasileira ameacada de extincao.
Fundacao Biodiversitas, Belo Horizonte.
Malabarba, L. R., R. E. Reis, R. P. Vari, Z. M. S. Lucena & C.
A. S. Lucena, 1998. Phylogeny and Classificatin of Neo-
tropical Fishes. EDIPUCRS, Port Alegre.
Matthews, W. J., 1998. Pattenrs in freshwater fish ecology.
Chapman & Hall, New York.
Mazzoni, R. & C. F. Resende, 2003. Seasonal diet shift in aTetragonopterinae (Osteichthyes, Characidae) from the
Hydrobiologia
123
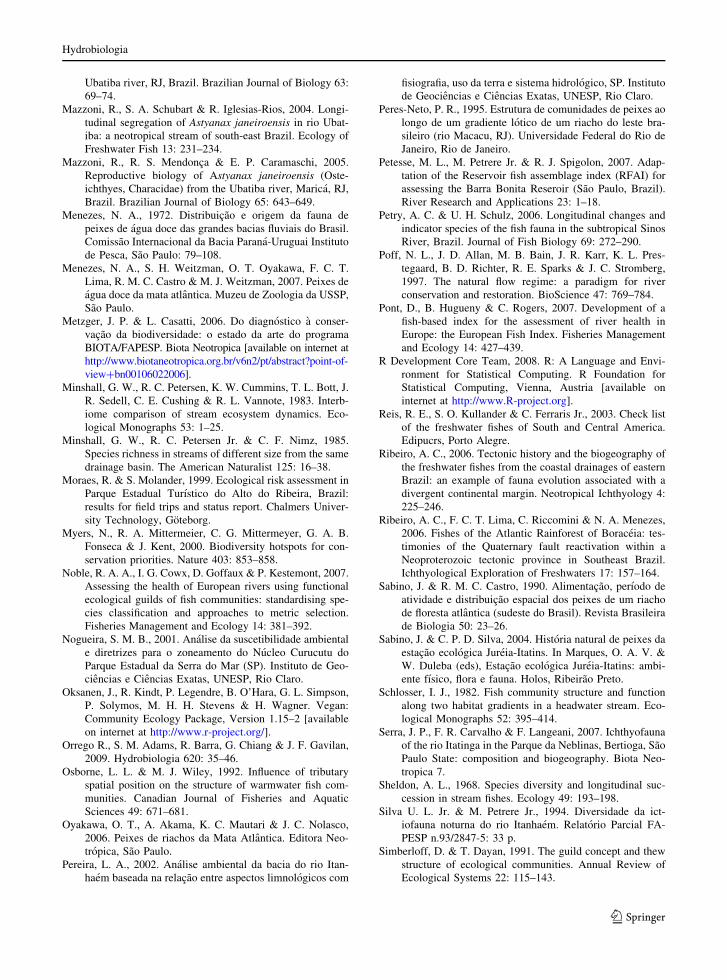
Ubatiba river, RJ, Brazil. Brazilian Journal of Biology 63:
69–74.
Mazzoni, R., S. A. Schubart & R. Iglesias-Rios, 2004. Longi-
tudinal segregation of Astyanax janeiroensis in rio Ubat-
iba: a neotropical stream of south-east Brazil. Ecology of
Freshwater Fish 13: 231–234.
Mazzoni, R., R. S. Mendonca & E. P. Caramaschi, 2005.
Reproductive biology of Astyanax janeiroensis (Oste-
ichthyes, Characidae) from the Ubatiba river, Marica, RJ,
Brazil. Brazilian Journal of Biology 65: 643–649.
Menezes, N. A., 1972. Distribuicao e origem da fauna de
peixes de agua doce das grandes bacias fluviais do Brasil.
Comissao Internacional da Bacia Parana-Uruguai Instituto
de Pesca, Sao Paulo: 79–108.
Menezes, N. A., S. H. Weitzman, O. T. Oyakawa, F. C. T.
Lima, R. M. C. Castro & M. J. Weitzman, 2007. Peixes de
agua doce da mata atlantica. Muzeu de Zoologia da USSP,
Sao Paulo.
Metzger, J. P. & L. Casatti, 2006. Do diagnostico a conser-
vacao da biodiversidade: o estado da arte do programa
BIOTA/FAPESP. Biota Neotropica [available on internet at
http://www.biotaneotropica.org.br/v6n2/pt/abstract?point-of-
view?bn00106022006].
Minshall, G. W., R. C. Petersen, K. W. Cummins, T. L. Bott, J.
R. Sedell, C. E. Cushing & R. L. Vannote, 1983. Interb-
iome comparison of stream ecosystem dynamics. Eco-
logical Monographs 53: 1–25.
Minshall, G. W., R. C. Petersen Jr. & C. F. Nimz, 1985.
Species richness in streams of different size from the same
drainage basin. The American Naturalist 125: 16–38.
Moraes, R. & S. Molander, 1999. Ecological risk assessment in
Parque Estadual Turıstico do Alto do Ribeira, Brazil:
results for field trips and status report. Chalmers Univer-
sity Technology, Goteborg.
Myers, N., R. A. Mittermeier, C. G. Mittermeyer, G. A. B.
Fonseca & J. Kent, 2000. Biodiversity hotspots for con-
servation priorities. Nature 403: 853–858.
Noble, R. A. A., I. G. Cowx, D. Goffaux & P. Kestemont, 2007.
Assessing the health of European rivers using functional
ecological guilds of fish communities: standardising spe-
cies classification and approaches to metric selection.
Fisheries Management and Ecology 14: 381–392.
Nogueira, S. M. B., 2001. Analise da suscetibilidade ambiental
e diretrizes para o zoneamento do Nucleo Curucutu do
Parque Estadual da Serra do Mar (SP). Instituto de Geo-
ciencias e Ciencias Exatas, UNESP, Rio Claro.
Oksanen, J., R. Kindt, P. Legendre, B. O’Hara, G. L. Simpson,
P. Solymos, M. H. H. Stevens & H. Wagner. Vegan:
Community Ecology Package, Version 1.15–2 [available
on internet at http://www.r-project.org/].
Orrego R., S. M. Adams, R. Barra, G. Chiang & J. F. Gavilan,
2009. Hydrobiologia 620: 35–46.
Osborne, L. L. & M. J. Wiley, 1992. Influence of tributary
spatial position on the structure of warmwater fish com-
munities. Canadian Journal of Fisheries and Aquatic
Sciences 49: 671–681.
Oyakawa, O. T., A. Akama, K. C. Mautari & J. C. Nolasco,
2006. Peixes de riachos da Mata Atlantica. Editora Neo-
tropica, Sao Paulo.
Pereira, L. A., 2002. Analise ambiental da bacia do rio Itan-
haem baseada na relacao entre aspectos limnologicos com
fisiografia, uso da terra e sistema hidrologico, SP. Instituto
de Geociencias e Ciencias Exatas, UNESP, Rio Claro.
Peres-Neto, P. R., 1995. Estrutura de comunidades de peixes ao
longo de um gradiente lotico de um riacho do leste bra-
sileiro (rio Macacu, RJ). Universidade Federal do Rio de
Janeiro, Rio de Janeiro.
Petesse, M. L., M. Petrere Jr. & R. J. Spigolon, 2007. Adap-
tation of the Reservoir fish assemblage index (RFAI) for
assessing the Barra Bonita Reseroir (Sao Paulo, Brazil).
River Research and Applications 23: 1–18.
Petry, A. C. & U. H. Schulz, 2006. Longitudinal changes and
indicator species of the fish fauna in the subtropical Sinos
River, Brazil. Journal of Fish Biology 69: 272–290.
Poff, N. L., J. D. Allan, M. B. Bain, J. R. Karr, K. L. Pres-
tegaard, B. D. Richter, R. E. Sparks & J. C. Stromberg,
1997. The natural flow regime: a paradigm for river
conservation and restoration. BioScience 47: 769–784.
Pont, D., B. Hugueny & C. Rogers, 2007. Development of a
fish-based index for the assessment of river health in
Europe: the European Fish Index. Fisheries Management
and Ecology 14: 427–439.
R Development Core Team, 2008. R: A Language and Envi-
ronment for Statistical Computing. R Foundation for
Statistical Computing, Vienna, Austria [available on
internet at http://www.R-project.org].
Reis, R. E., S. O. Kullander & C. Ferraris Jr., 2003. Check list
of the freshwater fishes of South and Central America.
Edipucrs, Porto Alegre.
Ribeiro, A. C., 2006. Tectonic history and the biogeography of
the freshwater fishes from the coastal drainages of eastern
Brazil: an example of fauna evolution associated with a
divergent continental margin. Neotropical Ichthyology 4:
225–246.
Ribeiro, A. C., F. C. T. Lima, C. Riccomini & N. A. Menezes,
2006. Fishes of the Atlantic Rainforest of Boraceia: tes-
timonies of the Quaternary fault reactivation within a
Neoproterozoic tectonic province in Southeast Brazil.
Ichthyological Exploration of Freshwaters 17: 157–164.
Sabino, J. & R. M. C. Castro, 1990. Alimentacao, perıodo de
atividade e distribuicao espacial dos peixes de um riacho
de floresta atlantica (sudeste do Brasil). Revista Brasileira
de Biologia 50: 23–26.
Sabino, J. & C. P. D. Silva, 2004. Historia natural de peixes da
estacao ecologica Jureia-Itatins. In Marques, O. A. V. &
W. Duleba (eds), Estacao ecologica Jureia-Itatins: ambi-
ente fısico, flora e fauna. Holos, Ribeirao Preto.
Schlosser, I. J., 1982. Fish community structure and function
along two habitat gradients in a headwater stream. Eco-
logical Monographs 52: 395–414.
Serra, J. P., F. R. Carvalho & F. Langeani, 2007. Ichthyofauna
of the rio Itatinga in the Parque da Neblinas, Bertioga, Sao
Paulo State: composition and biogeography. Biota Neo-
tropica 7.
Sheldon, A. L., 1968. Species diversity and longitudinal suc-
cession in stream fishes. Ecology 49: 193–198.
Silva U. L. Jr. & M. Petrere Jr., 1994. Diversidade da ict-
iofauna noturna do rio Itanhaem. Relatorio Parcial FA-
PESP n.93/2847-5: 33 p.
Simberloff, D. & T. Dayan, 1991. The guild concept and thew
structure of ecological communities. Annual Review of
Ecological Systems 22: 115–143.
Hydrobiologia
123

Souza, U. P., R. C. Costa, I. A. Martins & A. Fransozo, 2008.
Associacoes entre as biomassas de peixes Sciaenidae
(Teleostei: Perciformes) e de camaroes Penaeoidea
(Decapoda: Dendrobranchiata) no litoral norte do Estado
de Sao Paulo. Biota Neotropica 8 [available on internet at
http://www.scielo.br/pdf/bn/v8n1/a11v8n1.pdf].
Souza, U. P., 2009. Biologia e ciclo de vida de Astynax cf.
scabripinis paranae Eigenmann, 1914 (Characidae, Te-
tragonopterinae), no Ribeirao Grande, Parque Estadual da
Serra do Mar, Nucleo Santa Virgınia, SP. Instituto de
Biociencias, Universidade Estadual Paulista ‘‘Julio de
Mesquita Filho’’, Sao Paulo.
Souza-Pereira, P. E. & A. F. M. Camargo, 2004. Efeito da
salinidade e do esgoto organico sobre a comunidade
zooplanctonica, com enfase nos copepodes, do estuario do
rio Itanhaem, Estado de Sao Paulo. Acta Scientiarum
Biological Sciences 26: 9–17.
Takako, A. K., C. Oliveira & O. T. Oyakawa, 2005. Revision
of the genus Pseudotocinclus (Siluriformes: Loricariidae:
Hypoptopomatinae), with description of two new species.
Neotropical Ichthyology 3: 499–508.
Thorp, J. H., M. C. Thoms & M. D. Delong, 2006. The riverine
ecosystem synthesis? Biopcomplexity in river networks
across space and time. River Research and Applications
22: 123–147.
USEPA, 2002. Methods for Evaluating Wetland Condition:
Developing Metrics and Indexes of Biological Integrity.
Office of Water, U.S. Environmental Protection Agency,
Washington, DC [available on internet at http://www.
epa.gov/].
USEPA, 2006. Best Practices for Identifying Reference Con-
dition in Mid-Atlantics Streams, U. S. E. P. A. (Envi-
ronmental Protection Agency) [available on internet at
http://www.epa.gov/].
USEPA, 2007. United States Environmental Protection Agency
[available on internet at http://www.epa.gov/].
Vannote, R. L., G. W. Minshall, K. W. Cummins, J. R. Sedell
& C. E. Cushing, 1980. The river continuum concept.
Canadian Journal of Fisheries and Aquatic Sciences 37:
130–137.
Vasquez, D. P., C. J. Melian, N. M. Williams, N. Bluthgen, B.
R. Krasnov & R. Poulin, 2007. Species abundance and
asymmetric interaction strength in ecological networks.
Oikos 116: 1120–1127.
Vriese, F. T., S. Semmekrot & A. J. P. Raat, 1994. Assessment
of spawning and nursery areas in the River Meuse. Water
Science and Technology 29: 297–299.
Ward, J. V. & J. A. Stanford, 1983. The serial discontinuity
concept of lotic ecosystems. In Fontaine, T. D. III & S. M.
Bartell (eds), Dynamics of Lotic Ecosystems. Ann Arbor
Science, Ann Arbor, MI, USA.
Welcomme, R. L., K. O. Winemiller & I. G. Cowx, 2006. Fish
environmental guilds as a tool for assessment of ecolog-
ical conditions of rivers. River Research and Applications
22: 377–396.
Whol, E. & D. J. Merrits, 2007. What is a natural river?
Geography Compass 1: 871–900.
Wilkison, C. D. & D. R. Edds, 2001. Spatial pattern and
environmental correlates of a midwestern stream fish
community: including spatial autocorrelation as a factor in
community analyses. American Midland Naturalist 146:
271–289.
Winemiller, K. O., 1992. Ecomorphology of freshwater fishes.
Research Explorations 8(3): 308–327.
Winemiller, K. O., 1996. Factors driving spatial and temporal
variation in aquatic floodplain food webs. In Polis, G. A.
& K. O. Winemiller (eds), Food Webs: Integration of
Patterns and Dynamics. Chapman & Hall, New York:
298–312.
Winemiller, K. O. & M. A. Leslie, 1992. Fish assemblages
across a complex, tropical freshwater/marine ecotone.
Environmental Biology of Fishes 34: 29–50.
Winemiller, K. O. & K. A. Rose, 1993. Why do most fish
produce so many tiny offspring? Evidence from a size-
based model. American Naturalist 142: 585–603.
Woodward, G., B. Edenman, M. Emmerson, J. M. Montoya, J.
M. Olesen, A. Valido & P. H. Warren, 2005. Body size in
ecological networks. Trends in Ecology and Evolution 20:
402–409.
Hydrobiologia
123
Related Documents


