4 4?L4v UNDP-WORLD BANK TRADE EXPANSION PROGRAM OCCASIONAL PAPER 9 /seemh/ /s THE FISCAL IMPLICATIONS OF TRADE POLICY REFORM: THEORY AND EVIDENCE David Greenaway Chris Milner This country rport Is a product of the joint UNDP/World Bank Trade Expansion mgmm which provides technical and policy advice to countries intending to reform their trade regimes The views contained herein are those of the authors and do not necessarily refect those of the United Naions Development Program or the World Bank. Public Disclosure Authorized Public Disclosure Authorized Public Disclosure Authorized Public Disclosure Authorized

Welcome message from author
This document is posted to help you gain knowledge. Please leave a comment to let me know what you think about it! Share it to your friends and learn new things together.
Transcript
4 4?L4v
UNDP-WORLD BANKTRADE EXPANSION PROGRAM
OCCASIONAL PAPER 9
/seemh/ /s
THE FISCAL IMPLICATIONS
OF TRADE POLICY REFORM:
THEORY AND EVIDENCE
David GreenawayChris Milner
This country rport Is a product of the joint UNDP/World Bank Trade Expansion mgmm which provides technicaland policy advice to countries intending to reform their trade regimes The views contained herein are those of theauthors and do not necessarily refect those of the United Naions Development Program or the World Bank.
Pub
lic D
iscl
osur
e A
utho
rized
Pub
lic D
iscl
osur
e A
utho
rized
Pub
lic D
iscl
osur
e A
utho
rized
Pub
lic D
iscl
osur
e A
utho
rized
THE FISCAL IMPLICATIONS
OF TRADE POLICY REFORM:
THEORY AND EVIDENCE
David GreenawayChris Milner
November 1993
Trade Policy DivisionPolicy Research Department
World BankWashington, D.C.
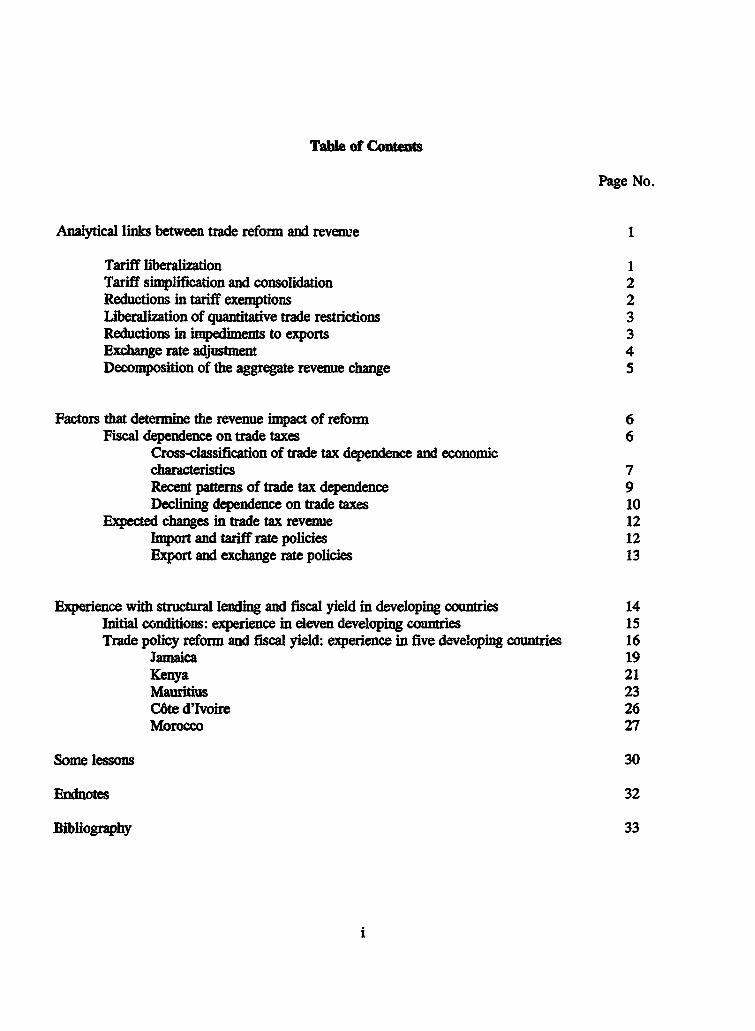
Table of Contents
Page No.
Analytical links between trade reform and revenLe 1
Tariff liberalization 1Tariff simplification and consolidation 2Reductions in tariff exemptions 2Liberalization of quantitative trade restrictions 3Reductions in impediments to exports 3Exchange rate adjustment 4Decomposition of the aggregate revenue change 5
Factors that determine the revenue impact of reform 6Fiscal dependence on trade taxes 6
Cross-classification of trade tax dependence and economiccharacteristics 7Recent patterns of trade tax dependence 9Declining dependence on trade taxes 10
Expected changes in trade tax revenue 12Import and tariff rate policies 12Export and exchange rate policies 13
Experience with structural lending and fiscal yield in developing countries 14Initial conditions: experience in eleven developing countries 15Trade policy reform and fiscal yield: experience in five developing countries 16
Jamaica 19Kenya 21Mauritius 23C6te d'Ivoire 26Morocco 27
Some lessons 30
Endnotes 32
Bibliography 33
i
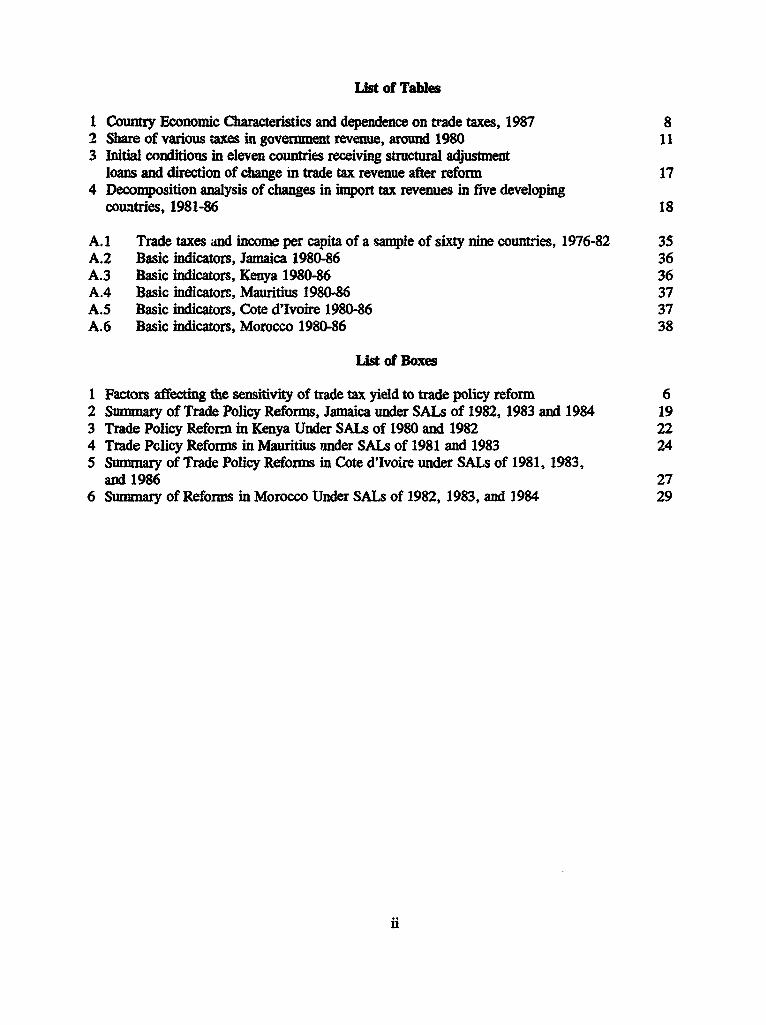
List of Tables
1 Country Economic Characteristics and dependence on trade taxes, 1987 82 Share of various taxes in government revenue, around 1980 113 Initial conditions in eleven countries receiving structural adjustment
loans and direction of change in trade tax revenue after reform 174 Decomposition analysis of changes in import tax revenues in five developing
countries, 1981-86 18
A.1 Trade taxes and income per capita of a sample of sixty nine countries, 1976-82 35A.2 Basic indicators, Jamaica 1980-86 36A.3 Basic indicators, Kenya 1980-86 36A.4 Basic indicators, Mauritius 1980-86 37A.5 Basic indicators, Cote d'Ivoire 1980-86 37A.6 Basic indicators, Morocco 1980-86 38
List of Boxes
1 Factors affecting the sensitivity of trade tax yield to trade policy reform 62 Summary of Trade Policy Reforms, Jamaica under SALs of 1982, 1983 and 1984 193 Trade Policy Reform in Kenya Under SALs of 1980 and 1982 224 Trade Policy Reforms in Mauritius under SALs of 1981 and 1983 245 Summary of Trade Policy Reforms in Cote d'Ivoire under SALs of 1981, 1983,
and 1986 276 Summary of Reforms in Morocco Under SALs of 1982, 1983, and 1984 29
ii
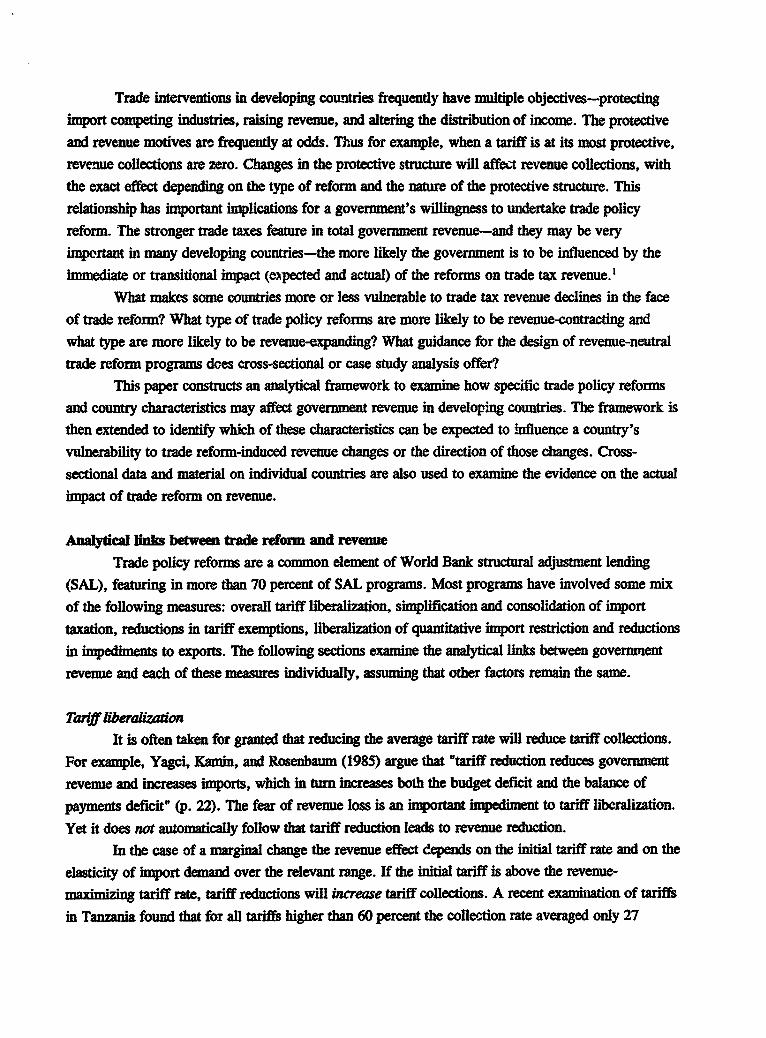
Trade interventions in developing countries frequently have multiple objectives-protectingimport competing industries, raising revenue, and altering the distribution of income. The protectiveand revenue motives are frequently at odds. Thus for example, when a tariff is at its most protective,
revenue collections are zero. Changes in the protective structure will affect revenue collections, withthe exact effect depending on the type of reform and the nature of the protective structure. Thisrelationship has important implications for a government's willingness to undertake trade policy
reform. The stronger trade taxes feature in total government revenue-and they may be veryimportant in many developing countries-the more likely the government is to be influenced by the
immediate or transitional impact (expected and actual) of the reforms on trade tax revenue.IWhat makes some countries more or less vulnerable to trade tax revenue declines in the face
of trade reform? What type of trade policy reforms are more likely to be revenue-contracting and
what type are more likely to be revenue-expanding? What guidance for the design of revenue-neutral
trade reform programs does cross-sectional or case study analysis offer?This paper constructs an analytical framework to examine how specific trade policy reforms
and country characteristics may affect government revenue in developing countries. The framework is
then extended to identify which of these characteristics can be expected to influence a country's
vulnerability to trade reform-induced revenue changes or the direction of those changes. Cross-
sectional data and material on individual countries are also used to examine the evidence on the actual
impact of trade reform on revenue.
Analytical links between trade reform and revenueTrade policy reforms are a common element of World Bank structural adjustment lending
(SAL), featuring in more than 70 percent of SAL programs. Most programs have involved some mixof the following measures: overall tariff liberalization, simplification and consolidation of import
taxation, reductions in tariff exemptions, liberalization of quantitative import restriction and reductions
in impediments to exports. The following sections examine the analytical links between government
revenue and each of these measures individually, assuming that other factors remain the same.
Tanff liberalizationIt is often taken for granted that reducing the average tariff rate will reduce tariff collections.
For example, Yagci, Kamin, and Rosenbaum (1985) argue that "tariff reduction reduces government
revenue and increases imports, which in turn increases both the budget deficit and the balance ofpayments deficit" (p. 22). The fear of revenue loss is an important impediment to tariff liberalization.
Yet it does not automatically follow that tariff reduction leads to revenue reduction.
In the case of a marginal change the revenue effect depends on the initial tariff rate and on the
elasticity of import demand over the relevant range. If the initial tariff is above the revenue-maximizing tariff rate, tariff reductions will increase tariff collections. A recent examination of tariffs
in Tanzania found that for all tariffs higher than 60 percent the collection rate averaged only 27
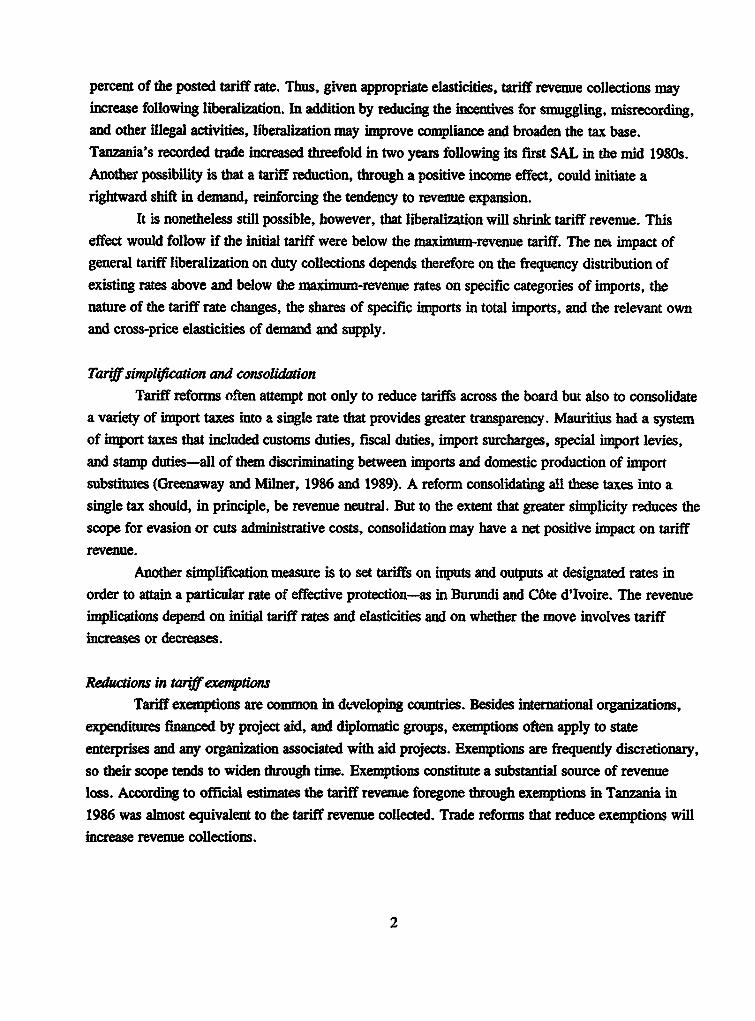
percent of the posted tariff rate. Thus, given appropriate elasticities, tariff revenue collections mayincrease following liberalization. In addition by reducing the incentives for smuggling, misrecording,and other ilegal activities, liberalization may improve compliance and broaden the tax base.Tanzania's recorded trade increased threefold in two years following its first SAL in the mid 1980s.Another possibility is that a tariff reduction, through a positive income effect, could initiate arightward shift in demand, reinforcing the tendency to revenue expansion.
It is nonetheless still possible, however, that liberalization will shrink tariff revenue. Thiseffect would follow if the initial tariff were below the maximum-revenue tariff. The net impact ofgeneral tariff liberalization on duty collections depends therefore on the frequency distribution ofexisting rates above and below the maximum-revenue rates on specific categories of imports, thenature of the tariff rate changes, the shares of specific imports in total imports, and the relevant ownand cross-price elasticities of demand and supply.
Tariff simplification and consolidaionTariff reforms often attempt not only to reduce tariffs across the board but also to consolidate
a variety of import taxes into a single rate that provides greater transparency. Mauritius had a systemof import taxes that included customs duties, fiscal duties, import surcharges, special import levies,and stamp duties-all of them discriminating between imports and domestic production of importsubstitutes (Greenaway and Milner, 1986 and 1989). A reform consolidating all these taxes into asingle tax should, in principle, be revenue neutral. But to the extent that greater simplicity reduces thescope for evasion or cuts administrative costs, consolidation may have a net positive impact on tariffrevenue.
Another simplification measure is to set tariffs on inputs and outputs at designated rates inorder to attain a particular rate of effective protection-as in Burundi and C6te d'Ivoire. The revenueimplications depend on initial tariff rates and elasticities and on whether the move involves tariffincreases or decreases.
Reductions in tarff exemptionsTariff exemptions are common in developing countries. Besides international organizations,
expenditures financed by project aid, and diplomatic groups, exemptions often apply to stateenterprises and any organization associated with aid projects. Exemptions are frequently discretionary,so their scope tends to widen through time. Exemptions constitute a substantial source of revenueloss. According to official estimates the tariff revenue foregone through exemptions in Tanzania in1986 was almost equivalent to the tariff revenue collected. Trade reforms that reduce exemptions willincrease revenue collections.
2
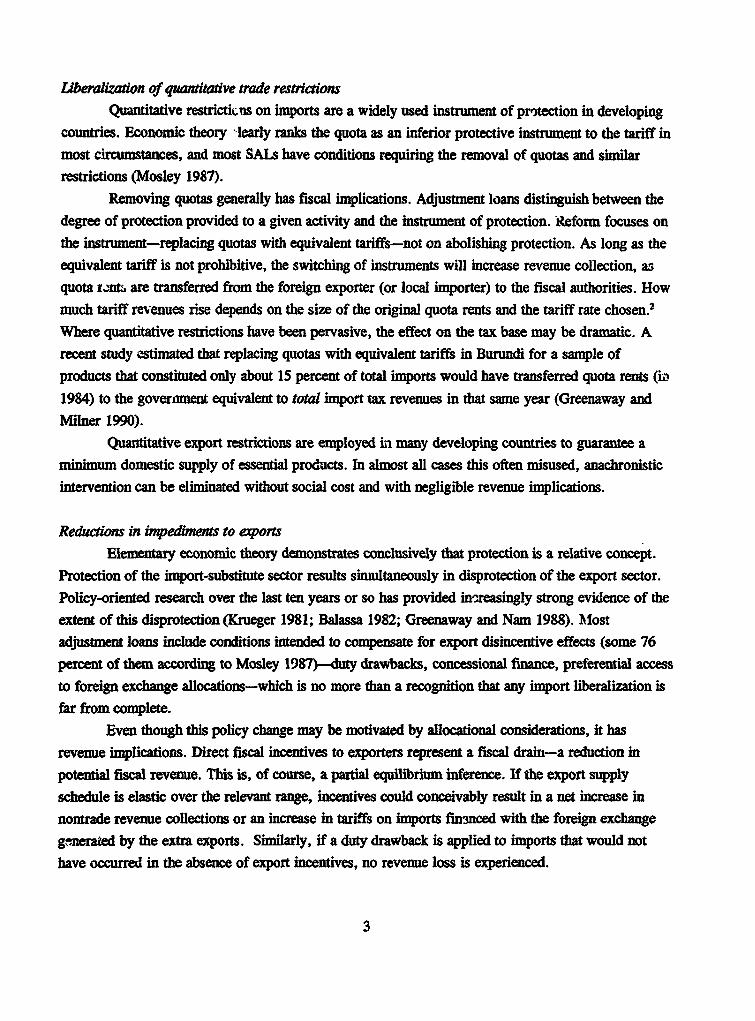
Liberalization of quantitative trade restrictions
Quantitative restrictit.us on imports are a widely used instrument of protection in developingcountries. Economic theory learly ranks the quota as an inferior protective instrument to the tariff inmost circumstances, and most SALs have conditions requiring the removal of quotas and similarrestrictions (Mosley 1987).
Removing quotas generally has fiscal implications. Adjustment loans distinguish between thedegree of protection provided to a given activity and the instrument of protection. Reform focuses on
the instrument-replacing quotas with equivalent tariffs-not on abolishing protection. As long as theequivalent tariff is not prohibitive, the switching of instruments will increase revenue collection, asquota rzntz are transferred from the foreign exporter (or local importer) to the fiscal authorities. Howmuch tariff revenues rise depends on the size of the original quota rents and the tariff rate chosen.2
Where quantitative restrictions have been pervasive, the effect on the tax base may be dramatic. Arecent study estimated that replacing quotas with equivalent tariffs in Burundi for a sample ofproducts that constituted only about 15 percent of total imports would have transferred quota rents (i
1984) to the government equivalent to total import tax revenues in that same year (Greenaway and
Milner 1990).Quantitative export restrictions are employed in many developing countries to guarantee a
minimum domestic supply of essential products. In almost all cases this often misused, anachronisticintervention can be eliminated without social cost and with negligible revenue implications.
Reductions in impediments to exportsElementary economic theory demonstrates conclusively that protection is a relative concept.
Protection of the import-substitute sector results simultaneously in disprotection of the export sector.Policy-oriented research over the last ten years or so has provided increasingly strong evidence of the
extent of this disprotection (Krueger 1981; Balassa 1982; Greenaway and Nam 1988). Mostadjustment loans include conditions intended to compensate for export disincentive effects (some 76percent of them according to Mosley 1987)-duty drawbacks, concessional finance, preferential accessto foreign exchange allocations-which is no more than a recognition that any import liberalization isfar from complete.
Even though this policy change may be motivated by allocational considerations, it has
revenue implications. Direct fiscal incentives to exporters represent a fiscal drain-a reduction in
potential fiscal revenue. This is, of course, a partial equilibrium inference. If the export supplyschedule is elastic over the relevant range, incentives could conceivably result in a net increase innontrade revenue collections or an increase in tariffs on imports finnced with the foreign exchangegenerated by the extra exports. Similarly, if a duty drawback is applied to imports that would not
have occurred in the absence of export incentives, no revenue loss is experienced.
3
Another concern is that export taxes, direct or in the form of differentials between foreignprices and prices paid to producers by public sector marketing boards with export monopolies, are a
major source of trade taxes in some developing countries. For traditional exports these taxes may notsignificantly impede the volume of exports, at least in the short run. In that case reductions in exporttaxes are likely to reduce short-term tax revenue. But it is important to note that in small open
economies the revenue impact of partial reductions depends strictly on the elasticity of export supply:
tax yield from traditional exports will be much more sensitive to variations in world prices.
Domestic policy decisions are likely to have substantially more impact in the case of
nontraditional exports. To enable these goods to compete in export markets and to reduce the
incentive to produce for the home market, exemption from export taxes is likely to be necessary.
Thus the importance of export taxes in total tax yield diminishes as the share of nontraditional
exportables in total exports increases.
Exchange rate adjustmentThe exchange rate is a critical relative price. About 16 percent of World Bank structural
adjustment loans have involved exchange rate conditions. Cross-conditionaw'y with IMF stabilization
loans give further prominence to exchange rate alignment. The need, almost invariably, is for
exchange rate depreciation in real terms. On small open economy assumptions, depreciation raises the
domestic price of imports and may reduce or augment tariff revenues (denominated in domestic
currency) depending on elasticity of demand for importables and elasticity of supply for importsubstitutes.
The overall elasticity of demand for imports depends on the share of competitive imports in
total imports. Elasticity for imports that compete with domestic production, such as foodstuffs and
consumer goods, may be quite high, while elasticity for capital goods, raw material, and intermediate
inputs for which there are no domestic substitutes wi" tend to be low.
For the least industrialized of developing countries imports are therefore likely to be price
inelastic, and devaluation is likely to boost import duties. These low-income, less industrialized
countries are also more likely to be dependent on traditional exports and export taxes. Export tax
yields in domestic currency are unambiguously increased by reducing currency overvaluation since
even if exports are perfectly inelastic in supply the domestic currency value of given foreign currency
earnings is increased by devaluation.3
Exchange rate adjustment is therefore most likely to be revenue enhancing in the case of low-
income industrializing countries. However, depreciation does not necessarily mean a loss of revenue
for more industrialized developing countries with a greater proportion of competitive imports and of
nontraditional exports because there are likely to be sufficient noncompetitive imports and quality
differences between imports and import substitutes to prevent the tax base (in domestic value terms)
4
from contracting. Revenue yield from specific duties will fall as the volume of imports falls, but if advalorem tariffs predominate revenue will be at least maintained in these cases.
Decomposition of the aggregate revenue changeAs the discussion so far makes clear, how trade tax yield is affected by trade policy reform
depends on a complex array of factors at the time of reform (reform details, price elasticities) and oncontemporaneous macroeconomic adjustments and constraints. In the absence of a highlydisaggregated, computable general equilibrium model for a large number of countries, this studyrelies on actual or revealed effects of trade policy reform programs for examining the relative revenueeffects of alternative elements of trade policy reform.
The methodology can be employed in a number of ways. First, the content and effects of
trade policy reform can be compared across a number of countries; consistent or distinctivecharacteristics may be instructive. Second, the dynamics of reform and adjustment in a restrictednumber of country case studies can be examined in detail. Last, formal decomposition analysis can beused to summarize the relative fiscal impact of the broad characteristics of import policy reform. (Thedecomposition analysis is defined in Table 4.)
The aggregate decomposition analysis considers three typee of effects on the total import taxyield: the real import effect which measures the revenue effect associated with a change in the real(dollar) value of imports: the exchange rate effect, which measures the indirect effect of a change inthe exchange rate on import tax yields through its effect on the tax base (the local currency value of a
given dollar import bill); and the tariff rate effect which measures the tariff revenue effect of a realchange in average tariff rate for a given tax base.
This type of aggregate decomposition analysis is a potentially valuable complementary tool forinvestigating the revenue effects of trade policy reform, but it has several shortcomings. Much of therichness of the earlier piecemeal analysis of tariff reform is lost in the aggregate decompositionanalysis. As established earlier, the effect on tariff revenue of lowering an individual tariff is
ambguous: it can be revenue expanding or revenue intracting, depending on whether the initial
tariff was below or above the maximum-revenue rae. Thus in measuring the tariff rte effect usingthe decomposition analysis, it is important to interpret the results carefully, in the cortext of a specific
package of trade policv reforms. A recorded change in the average rate of duty collection can be due
to a change in scheduled or operational tariff rates or to a change in the taxable base (the local
currency value of imports), so it is important to understand how trade reforms affect the average dutycollection rate. Similarly, the absence of a significant tariff rate effect in a decomposition analysis of
this type may simply mean that there are indirect tariff rate effects that are being captured by the real
import effect.
5

Factors that determine the revenue impact of reform
The interdependence of trade policy and other fiscal policy reforms is so strong that it is
impossible to consider trade policy reforms in a narrow, isolated sense. In the absence of other fiscal
reforms, trade policy reforms that reduce revenue are likely to result in fiscal problems that
undermine the sustainability of trade policy reform. The extent of this threat to sustainability in a
particular country depends on two factors:
a The country's current fiscal dependence on trade taxes and how this departure might be
expected to change.a The probability that trade policy reforms will be revenue-contracting, rather than revenue
neutral or revenue-expanding.Box 1 summarizes the factors or country characteristics that affect the sensitivity of trade tax
yields to trade policy reform and provides some testable hypotheses for the discussion presented in
this section. These hypotheses can be examined in light of the experiences of countries that have
undergone significant trade policy reform, as discussed later in this volume.
Box I Factors affecting the sensitivity of trade tax yield to trade policy reform
Thposiblityof a revenue reduction The possibilityofa revenue increase
- of import duties, inversely related - of idiport duties, dhrectly related toto the average level of nominal tariffs the eustentof tauitt see differentialsbefore reform. before reform.
- of impot4dedes,direcdly related to -of import duties, directly salated tothe smallness and newnesso ithe the share of competing imports in totalindustriaimport-substitutesector imports before reform.before reform.
- of imporidoties, directly related to - of import duties, directly related tothe share of nontraditional exports in the incidence of duty exemptions beforetotal exports before reform, reform.
- of import doties. inversely related to - of laport duties, directly related tothe extent of the foreign exchange the incidence and extent of quantitativeconstraintisasilvated by the reform. Import restrictions.
-of exoedtis,4irecdy talated to the - of exporedudles, directly related toeensorfday rearsson tradirional he anoutrcurency depreciation
expdathe impettance oftradiionlal follown th eform.
Fiscal dependence on trade taxes
Many generalizations or "stylized facts" about developing countries cannot withstand closescrutiny. One that can, however, is that developing countries depend more heavily on trade taxes thando other countries. For developing countries in a sample of sixty-nine countries the trade tax shareover the period 1976-1982 averaged from 5 percent in Chile to 63 percent in Gambia (annex table
6
A. 1). For all developing countries that are not oil exporters the share averaged 17 percent. Dispersionaround the mean is quite high, however, and for many countries the trade tax share was substantially
higher: more than 40 percent In eleven countries and more than 20 percent in thirty-one countries.
These figures even understate the importance of trade taxes since they include only explicit import
and export taxes; foreign exchange licensing and other schemes that constitute defacto trade taxes are
excluded.
Cross-classifications of trade tax dependence and economic characteristics. For most countries
import taxes account for the largest volume (84 percent) of total trade taxes. Only in sixteen countries
does the share of import taxes in total trade taxes fall below 75 percent and only in four does it fall
below 50 percent. In general export taxes tend to be more important to economies that are heavily
dependent on exports of primary agricultural products such as El Salvador, Ghana, and Zaire. This
same consideration also influences the regional pattern of dependence on trade tax. Countries in
Africa are most heavily dependent on trade taxes, followed by those in Asia, Latin America, and the
Southern European middle-income countries (table 1). This is due in part to the more extensive use of
export taxes and in part *o the higher concentration of low-income countries in Sub-Saharan Africa.
How did this pattern of heavy dependence on trade taxes come about in developing countries?
In considering questions of tax structure, economists take into account efficiency, equity andadministration. With the exception of lump-sum levies, taxes generate by-product distortions. The
design of optimal taxes seeks to minimize the by-product distortion costs in order to minimize the
resource misallocation induced by taxation. Equity considerations include both horizontal equity
(treating like individuals or entities in a like manner) and vertical equity (allocating tax burdens in
accordance with ability to pay).Trade taxes score badly on efficiency grounds and are second-best (or worse) as revenue
raisers. Because they discriminate between domestically produced and foreign produced products,
their excess burden is greater than a revenue-equivalent sales or excise tax. Many developing
countries attempt to attain equity objectives by levying high trade taxes on luxuries. But trade taxes
do not score well from an equity standpoint because demand elasticities tend to be lower on
necessities and because domestically produced luxury substitutes frequently go untaxed. Thus on both
efficiency and equity grounds trade taxes levied for revenue purposes are unlikely to feature in a first-
best tax structure.This proposition is based on two crucial assumptions: that the country's trade is too small to
affect world prices (small country assumption) and that there are no collection costs. If the small
country assumption is relaxed, then conventional wisdom on excess burdens must be qualified.
Indeed, it can be shown that if a country has market power, an import tax may be superior on
efficiency grounds to an equal-yield Lacome tax or an equal-yield domestic production tax
(Friedlaender and Vandendorpe 1968; Georgakopoulos 1974). The tariff continues to generate
deadweight losses, but these are counteracted by the favorable shift in terms of trade. This is not,
7

Table 1. Country economic characteristics and dependence on trade taxes, 1987 (percent)7Ade tax Agriculture Government Primary Urban GDP peras share of as share consumption as products as population capita
Category tax revenue of GDP share of GDP share of GDP Share ($)
Income'Low (39) 33.8 40.7 14.0 75.0 21.0Lower-middle (34) 22.6 20.2 16.0 74.0 44.0Upper-middle (24) 9.9 13.9 16.0 58.0 60.0High-income oil (4) 3.6 2.5 22.0 90.0 76.0
Dependence on trade taxes"Low (25) 7.2 14.5 17.8 65.5 61.0 3,560Medium (29) 22.4 27.6 14.8 75.1 36.2 918High (17) 42.7 34.6 15.5 74.1 29.8 616
RegionAfrica (4) 35.8 32.3 15.6 82.4 29.9 637Asia (32) 17.7 21.8 15.8 59.8 41.3 2,636Americas (21) 22.3 15.4 14.2 71.4 54.6 1,648Europe (5) 12.3 14.2 14.2 30.2 51.2 2,786
Special categoryHighly indebted (17) 22.0 17.3 12.7 66.7 58.5 1,511Sub-Saharan Africa (35) 37.5 34.7 15.4 83.4 27.0 550
Degree of trade exposureLow (22) 28.4 34.0 13.0 72.8 33.6 782Medium (42) 19.4 26.8 15.0 72.9 42.0 1.226High (22) 21.6 18.9 16.9 61.0 46.6 2.087
World Development Report classification.For dependence categories, trade taxes constitute the following shares of total taxes: low, less than 15 percent: medium, 16-30 percent: high, more than 30 percent.
. Trade exposure categories are as follows, where exposure is defined as 1/2(X+M)/ODP: low, less than 15 percent; medium, 16-30 percent; high, more than 30 percent.
8
however, a widely applicable explanation of the greater dependence of developing countries on tradetaxes.
Relaxation of the assumption of zero collection costs turns out to be crucial for the choice oftax base in a developing country. When income per capita is low (in absolute terms), questions ofequity and efficiency are secondary to questions of administrative feasibility. Administering income-based or production-based taxes requires considerable sophistication. And even when a country hasthe required administrative superstructure, the existence of large subsistence sectors makes thedefinition and valuation of income an intractable problem. Similarly, the distribution of much ofproduction through informal markets creates insurmountable difficulties for the administration of asales tax. By contrast collection costs for taxes on international transactions are likely to be somewhatlower because the number of transactors is restricted and their identity is more obvious since all legaltransactions are channeled through a finite number of ports of entry. As Corden (1974) notes, these
characteristics apply with particular relevance to export taxes.For these reasons the cost-yield ratio could be much lower for trade taxes than for domestic
income taxes or production taxes. The World Development Report 1980 estimated the administrativecosts of trade taxes at 1 percent to 3 percent of revenue collect, compared u ith 5 percent for valueadded taxes and as high as 10 percent for income taxes. Despite these differences in the costs ofadministration, however, the social ccsts per unit of revenue raised are likely to be strongly in favorof alternatives such as consumption-based taxes (see Clarete and Whalley 1987 for an illustration).
Recent paterns of trade tax dependence. More recent information (most is for 1987) for 101developing countries was used to classify countries in ways that highlight the principal economiccharacteristics associated with heavy dependence on trade taxes (table 1).
Cross-classifying income per person and dependence on trade taxes confirms the inverserelationship between them. In low-income countries the share of trade taxes in total taxes is almost 34percent, compared with just under 10 percent in upper middle income countries and less than 4percent for high income oil exporting countries. Other factors commonly associated with low incomeper person and dependence on trade taxes also show the expected relationship: the share of agriculturein GDP varies inversely with income per person while the proportion of the total population in urbanareas varies directly. The pattern for dependence on primary products is less clear. With the exception
of the high-income oil-exporters the share of central government consumption in GDP is remarkablystable. Looking at countries classified by dependence on trade taxes (share of trade taxes in totaltaxes) shows the same relationships (second panel of table 1).
Regional cross-classification shows that trade tax dependence is heaviest in Africa, followed byCentral and South America, Asia, and Europe (third panel). In Africa, income per person and urbanpopulation share are lowest, while the share of agriculture in GDP and dependence on primaryproducts are highest. In the Southern European countries the opposite relationships hold. Countries inAsia and the Americas fall in between. Income per person is lower in the Americas than in other
9
regions except Africa, and dependence on primary products is greater. However, the share ofagriculture in GDP is lower and the share of the urban population greater than in Asia. Finally, thestability in the share of central government expenditure by continent is again notable.
Two special categories-the highly indebted countries and the Sub-Saharan African countries-show relationships for country groups that have particular problems and that have received particularscrutiny in structural adjustment loan programs. As a group the highly indebted countries-most aremiddle-income countries-fall into the medium dependence category for trade taxes, have a relativelysmall share if agriculture in GDP, and are relatively highly urbanized. By contrast, the Sub-SaharanAfrican countries are heavily dependent on trade taxes, very heavily dependent on exports of primaryproducts, and agriculturally based.
Trade exposure or openness (defined as 1/2[X + M]/GDP) appears to be directly related toincome per person and inversely related to the share of agriculture in GDP. The share of primaryproducts in GDP is lowest for the most open economies, but identical in the low and mediumexposure categories. No clear pattern emerges for dependence on trade taxes, although the mostclosed economies exhibit the greatest dependence. While one might expect the contrary to be true, itseems that the low income per person relationship with trade tax dependence (low trade exposurecountries are also low-income countries) holds sway here as elsewhere.
These cross-classifications identify very clearly the country characteristics associated withheavy dependence on trade taxes: low level of income per person, a strongly agriculturally basedeconomy, relatively heavy dependence on primary products, and not highly urbanized. The countrygroup that most closely matches these characteristics is Sub-Saharan Africa. These findings accordwell with expected relationships and suggest that sensitivity to trade policy reform is likely to bestrongest in Sub-Saharan African economies. The findings also suggest that any analysis that seeks to
define the relationship between trade liberalization and trade taxes must include the Sub-Saharan
African economies.Declining dependence on trade taxes. As per capita income grows and industrialization
proceeds, a widening of the tax phase and a shift toward a more efficient tax structure becomepossible (table 2) The collection costs of other taxes begin to fall relative to trade taxes asurbanization and the cash-based economy spread and administrative expertise grows. Severalempirical studies have investigated the relationship between fiscal dependence on trade taxes andeconomic development. The country samples in the studies examined here vary from forty-one toeighty-six and encompass various subperiods from 1954 through 1978. The studies regress the shareof trade taxes in total tax revenue on income per person and an index of openness, using the relativesize of the foreign trade sector as a proxy for taxable capacity.
The studies, although they encompass a number of time periods and a variety of countrysamples, obtained consistent results. One is the finding of a statistically significant negativerelationship for the aggregate sample between income per person and dependence on trade taxes, a
10

relationship found to be robust across time periods and for various proxies for development.Greenaway (1984), for example, used real income per person, the share of agriculture in GDP, andthe share of manufactures in GDP as :i1ernative proxies for development. Another common findingconcerns samples disaggregated by income (low income, middle income, and industrial economies).The inverse relationship holds for the middle-income countries, but it is weaker for the industrialeconomies and collapses completely for the low-income countries.' Several factors may explain thecollapse of the relationship for low-income countries. Income per capita as a proxy for development isat its most unsatisfactory in the case of low-income countries, and the pattern of trade policies amountthe least developed countries is much more varied than for other groups. Greenaway (1984) estimated
Table 2. Share of various taxes in government revenue, around 1980 (percent):raxes
Country grop (nwmber) Income and Domestic goods International Social securityprofit and services trade contributions
Industrial countries (20) 33.3 26.0 3.7 25.0Semi-industrial countries (15) 25.3 30.6 14.5 13.0Middle-income countries (55) 23.7 23.1 28.9 4.1Least developed countries (14) 17.0 21.7 41.6 1.6
Note: For a list of countries included in each group see Goode (1984, pp. 6, 91), who generally followed IMF groupings.
Source: Goode (1984, p. 91)
separate models for import and export taxes. Proxies were introduced in the export model to capturemarket power in export markets and the composition of trade effects, but neither performedsatisfactorily. For both import and export models, income per person and openness continued to bethe most important explanatory variables.
This cross-sectional work has been compleented by a little time-series work. Greenaway(1984) experimented with a sample of forty-four countries covering a period of sixteen years.Although the results are tentative, they are consistent with the cross-sectional findings. Detailed casestudy evidence is provided by Lewis (1968) and Khan (1988) for Pakistan, Idachaba (1975) forGhana, and Mulet (1979) for Ethiopia.
In summary, then, there is a clear inverse relationship between fiscal dependence on tradetaxes and economic development. a relationship that is especially strong in the case of middle-incomecountries. The least developed remain most heavily dependent on trade taxes and, therefore, the mostvulnerable to any sudden, large alteration in tariffs.
11
Expected changes in trade tax revenue
As noted earlier, trade reform may induce revenue changes in all categories of taxes, not justin trade taxes directly. The analysis here focuses on trade tax revenue only, however, both becausethe indirect tax revenue effects are difficult to identify and because they are likely to be smaller wherefiscal dependence on trade taxes is greater. The discussion, based on the relationship between tradereform and trade tax revenue developed above, considers which initial conditions (before thereform)-other conditions held constant-can be expected to result in higher or lower trade taxrevenue.
Import and tarif rate policies
The revenue effect ot reducing the overall average rate of import taxation is ambiguous,unless the effect of liberalization on individual categories of imports is known. The assumption thatall other conditions remain unchanged also gives rise to complications, since trade policy reforms arelikely to alter the composition of imports. If, for simplicity, however, it is assumed that demand andsupply elasticities are similar across broad categories of imports between developing countries, then itis possible to formulate an expected revenue effect. Since the maximum protective tariff is greaterthan the maximum-revenue tariff, countries with the highest average tariff levels can be expected tobe the most likely, through tariff reform, to move individual tariff rates toward the maximum-revenuetariff and thereby to expand tariff revenue. By contrast, if the average rate before reform lies below
the maximum-revenue tariff, tariff liberalization will tend to reduce revenue.An increase in tariff revenue can be expected, in particular, where imports . impeting with
domestically produced goods are a larger share of total imports and where the protective motive istherefore likely to have dominated the revenue motive.s Thus revenue expansion as a result ofgeneral tariff reduction would be most likely in the case of the larger, more industrialized developingcountries that have followed an inward-oriented import-substitution strategy for some time and have ahigh share of competing imports. Smaller countries or countries in the early stages of industrialization
are by contrast likely to have high shares of noncompeting (including capital and intermediate) goodsin total imports, which means that a high proportion of their import tax base is unlikely to be taxedfor protective reasons. Tariff rates are more likely to be below the revenue-maximizing level andtariff reduction is more likely to reduce tariff revenue than in the case of more industrialized
developing countries.The average maximum-revenue tariff rate for a typical developing country is of course
difficult to estimate. The rate varies by commodity according to the elasticity of import demand andthe scope for duty evasion through smuggling or false invoicing. Nonetheless, it is possible toguesstimate the order of magnitude involved as a guide for policy analysis. In the small-country casewith constant elasticity of import demand, the maximum-revenue tariff depends only on the elasticityof import demand (Johnson 1950-51). For a conservative assumption of -2 as the overall import
12
demand elasticity for developing countries, the maximum-revenue tariff rate is 100 percent.Admittedly this estimate may be upwardly biased by the constant elasticity assumption, but it is alsolikely to be downwardly biased by the specific elasticity value chosen, given developing countries'general dependence on imported fuels, intermediate goods, and capital goods.
Even if this estimated rate is adjusted for the tariff evasion likely to be induced by tariff ratesthis high, import duty collection is still likely to be significantly larger than average collection rates inmost developing countries.' The average rate of import collection (import duties as a percentage ofthe value of imports) before trade reform for the five countries considered in detail later in this study(C6te d'Ivoire, Jamaica, Kenya, Mauritius, and Morocco) was less than 20 percent and for some itwas even less than 10 percent. It is difficult to imagine that nominal scheduled rates in these countries
were higher than the maximum-revenue tariff. No doubt enforcement problems accounted for some ofthe shortfall between scheduled rates and collection rates. But it is more likely that these low averagerates of import taxation were the result of numerous tariff exemptions and the relative unimportance
of tariffs as a protective instrument, given the importance of noncompeting raw materials and
intermediate and capital goods in total imports and the pervasive use of quantitative restrictions
against competing imports.As in the case of tariff reform, so too with the reduction or removal of quantitative import
restrictions, the orientation of a country's trade strategy and the composition of its imports are likely
to be significant predictors of revenue impact. Quantitative restrictions are more likely to be pervasive
in inward-oriented economies and where import quotas and bans are a major instrument of protection
because of a high ratio of competing to total imports. Thus eliminating nontariff restrictions is likelyto be a more important way of boosting tariff revenue for the larger and more industrializeddeveloping countries than for less developed ones. Exceptions might be some of the poorest countrieswith the tightest foreign exchange constraints (in Sub-Saharan Africa, for instance), where the
rationing of scarce foreign exchange constitutes a de facto quantitative import restriction. Most of
these countries do not use auctions to ration foreign exchange, and potential revenue loss fromquantitative restrictions is likely to be greatest in relative terms the scarcer is foreign exchange. Butde facto restrictions on imports are likely to remain if the foreign exchange constraint is not
substantially alleviated by the reforms.Export and exchange rate pokcies. Many measures intended to reduce antiexport bias may
affect the government budget through other channels than trade tax revenues. Tax holidays (reducedtaxes) for firms located in export processing zones may reduce yields from profit taxes in the short to
medium term. Improving credit facilities or infrastructure for export activities will have implicationsfor the expenditure side of the budget. Direct influences on trade tax yields are likely to come through
duty drawback schemes (usually for nontraditional exports) and changes in export taxes (usually fortraditional exports). Exemption from import taxes on inputs will be revenue reducing if there were
nontraditional exports that previously received no duty drawback. The greater the share of
13
nontraditional exports in total exports and the greater the dependence of nontraditional exports onimported inputs before the reform, the greater the revenue reduction from the introdui ion of dutydrawbacks. Of course, if duty exemptions on inputs for export activities replace exemptions on inputsfor import-substitution activities and if the nontraditional export sector is smaller than the import-substitution sector, there may be no immediate revenue reduction.
Significant reduction in taxation of traditional exports is likely to reduce trade tax revenue.For nontraditional exports, export taxes are likely to be a more significant impediment to exportingthan for traditional exports, making total removal of export taxes revenue-contracting. Partial removalcould be revenue-expanding, however-albeit on a small scale-if nontraditional exports constitute asmall share of total exports, which is likely to be the case when nontraditional exports are taxed toany significant extent.
Predicting the revenue effects of exchange rate adjustment is particularly problematic. Exporttax yield is directly related to the degree of currency depreciation-and the degree of depreciationrequired to restore equilibrium is directly related to the extent of import protection. But it is also inthe most heavily protected economies that tariff reduction is most likely to increase tariff revenue.This revenue-expanding effect may therefore be offset if currency depreciation accompanies tariff ratereductions. The corollary is that currency depreciation tends to eliminate sources of revenuecontraction associated with tariff reductions.
Experience with structural adjustment lending and fiscal yield in developing countriesThe preceding section focused on an a priori appraisal of the conditions that might influence
fiscal yield following trade policy reform in the context of structural adjustment loans (SALs). Theseconditions were related to prereform tariff levels, tariff dispersion, quotas, and exemptions. Thepossible combinations of initial conditions are numerous. Moreover, the importance of reformmeasures and their impact on fis-al yield will be strongly affected by institutional constraints andfeedback effects, which may differ by country. For these reasons, this section focuses morespecifically on the detail of individual country experiences.
Three important points need to be noted in an analysis of this type. First, the sheer number of
countries that have had SALs with some trade policy components (more than forty countries)precludes a detailed analysis of the experience of all of them in a study such as this one. Second, theSAL program is only about a decade old, and many of the policy reforms they have introduced are
intended to have effects in the medium to long term. Although some fiscal effects occur quickly, itmay still be too early in many cases to evaluate the economic effects of SALs. Third, some countrieshave had more than one SAL with trade policy components.
The next section examines the initial conditions in a subsample of eleven SALcountries-Chile, C6te d'Ivoire, Ghana, Jamaica, Kenya, Mauritius, Mexico, Morocco, Panama, thePhilippines, and Tunisia-to identify any obvious patterns with respect to revenue effects following a
14
SAL program. This sample provides wide coverage of country characteristics (size, geographicallocation, and population) and economic characteristics (debt position, income per capita, and tradeorientation). The following section then focuses in greater detail on the experience of five countries,three that experienced revenue expansion-Jamaica, Kenya, and Mauritius-and two that experiencedrevenue contraction-C6te d'Ivoire and Morocco. Together, the analysis of initial conditions and thedetailed examination of experience in these countries will provide a foundation for identifying some of
the factors that influence revenue expansion or contraction with trade policy reform.
Initial conditions: experience in eleven developing countriesTable 3 summarizes initial conditions-most of them identified in the preceding section as
likely to have an important impact on fiscal yield after reform-for the eleven sample SAL countries.
Fiscal yield does not appear to vary systematically either with overall dependence on trade taxes (row3) or with the importance of import duties in trade taxes (row 4). High, low, and nedium dependencecases are found both among countries that have evidently experienced a rise in trade taxes as a shareof GDP and among those that have experienced a fall. In all but one case (Ghana) import duties are,overwhelmingly, the main source of trade taxes. Judging from this sample, the importance of import
duties in trade taxes does not appear to have a significant bearing on post-reform fiscal yield.
It was argued above that the probability that trade liberalization would result in an increase inrevenue was greater when tariffs started at a level above the maximum-revenue tariff. The difficulty
lies in estimating maximum-revenue tariffs, which are likely to vary from country to country. Onealternative is a qualitative analysis, based on a classification such as Halevi's (1989), who categorizes
tariff structures as high, medium, or low. Other things being equal, the probability that initial tariffsexceed maximum-revenue tariffs is greater the higher the initial tariffs. All six countries that
experienced revenue gains from reform (Chile, Jamaica, Kenya, Mauritius, the Philippines, and
Tunisia) had high initial tariff levels (row 5). All the other countries experienced revenue contraction
and all but one had initial tariffs in the medium range. Some caution is required in interpreting this
finding, however. Scheduled tariffs on competing imports may be high for protective purposes, but
overall or average collection rates may be relatively low if noncompeting imports predominate.Another hypothesis presented in the preceding section is that high dispersion of tariff rates is
likely to be associated with a higher probability of revenue gain. The three countries with highdispersion all achieved revenue expansion from reform; results were mixed for the other countries,which all had medium dispersion (row 6): thus the comparison of country experiences offers some
support for the validity of this relationship.The association between broad coverage of quantitative restrictions and a high potential for
revenue gains from reform that was posited above also receives some support from the case study
comparison. In all countries where revenue expansion occurred (except Chile), quantitative
restrictions were (initially) either high or medium. But they wcre also high or medium in cases where
15
revenue contraction resulted. This apparent lack of a decisive pattern arises because pervasivequantitative restrictions are a necessary but not sufficient condition fo revenue expansion. Thesufficiency condition is that any dismantled quantitative restrictions be replaced with equivalent tariffs.
Half the sum of exports plus imports as a share of GDP (trade exposure) was used as a proxyfor the trade tax base. All the case study countries with revenue gains had high or medium tradeexposure, as did three of the five revenue-contracting countries-the other two were in the lowcategory for trade exposure. Overall, the average index of trade exposure was 43 percent for therevenue gainers and 27 percent for the revenue losers. Thus the comparison suggests some tentative
association between revenue yield and trade exposure.Two other variables identified above as having an impact on revenue-the share of competing
imports in total imports and the size of the industrial sector-are difficult concepts to capture in
simple summary statistics. Industrial imports as a share of industrial production and industrialproduction as a share of total production are two possible indicators of these concepts (rows 9 and
10). There is no obvious association between revenue performance and either of these indicators,probably because these ratios can be interpreted in different ways for different countries.
Last, the analysis in the preceding section posited an association between revenue and the
share of traditional exportables in total exports for the case of export tax reductions. For the casestudy countries no obvious pattern emerges for dependence on traditional exportables (row 11).
All these patterns of country characteristics and revenue change suggest that revenue
expansion has tended to occur in economies with relatively wide dispersion of tariff rates, extensive
use of quantitative restrictions, and relatively high levels of exposure to trade. Superficially, revenueexpansion also appears to have occurred where initial tariff rates were relatively high. But, after
allowing for low or no duties on noncompeting imports and for duty-exemptions, high scheduledtariffs on competing imports may not translate into high average rates of duty. Indeed, as is discussed
in the next section, only some of the countries experiencing revenue-expansion reduced tariffs while
others actually increased tariffs overall as part of an adjustment program.
Trade policy reform and fiscal yield experience in five developing countries
So far, this section has defined the broad parameters of possible influences on revenue. Moredetailed, country-speciic analysis of initial conditions and, more important, of reform packages andactual outcomes is required to identify more precisely the outcome of what is, after all, a highlycomplicated general equilibrium process. This section focuses on the experience of five countries with
SALs that included trade reform components. In three of them-Jamaica, Kenya, and
Mauritius-revenue expansion followed SAL reforms; in the other two-C6te d'Ivoire and
Morocco-revenue contraction resulted.
16
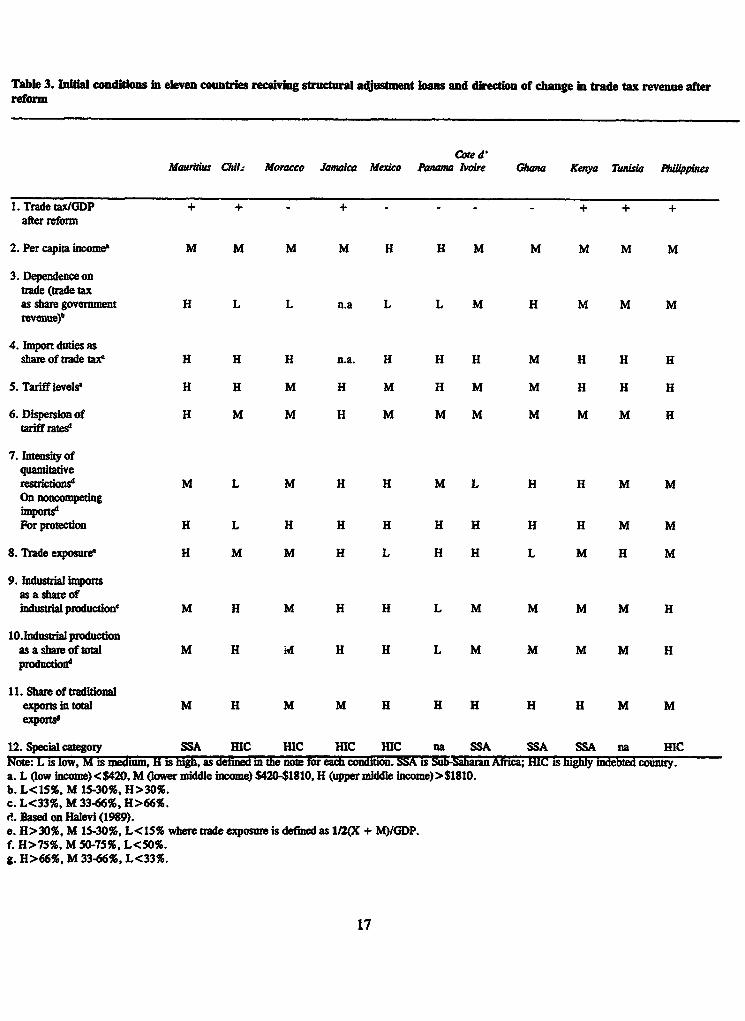
Table 3. Initial conditions in eleven countries receiving structural adjustment loans and direction of change In trade tax revenue afterreform
Coe d'MauritiWs h. Moracco Jamaica Mexico Panama Ivoire Ghana Kenya Tunisia P*ilipines
1. Trade tax/GDP + + - + - - - - + + +after reform
2. Per capita income M M M M H H M M M M M
3. Dependence ontrade (trade taxas share government H L L n.a L L M H M M Mrevenue)
4. Import duties asshare of rade tax H H H n.a. H H H M H H H
5. Tariff levels, H H M H M H M M H H H
6. Dispersion of H M M H M M M M M M Htariff ratee
7. Intensity ofquantitativerestrictions M L M H H M L H H M MOn noncompetingimportsFor protection H L H H H H H H H M M
8. Trade exposure H M M H L H H L M H M
9. Industrial importsas a share ofindustrialproduction' M H M H H L M M M M H
10.Industrial productionas a share of total M H M H H L M M M M Hproduction
11. Share of traditionalexports in total M H M M H H H H H M Mexports'
12. Special category SSA HIC HIC HIC HIC na SSA SSA SSA na HICNote: L is low, M is medium, H is high, as defined in the note for each condition. SSA is Sub-Saharan Africa; HIC is highly indebted country.a. L (low income)<$420, M (lower middle income) $420-$1810, H (upper middle income)>$1810.b. L<15%, M 15-30%, H>30%.c. L<33%, M 33-66%, R>66%.0. Based on Halevi (1989).e. H>30%, M 15-30%, L<15% where trade exposure is defined as 1/2(X + M)/GDP.f. H>75%. M 50-75%, L<SO%.g. H>66%, M 33-66%, L<33%.
17
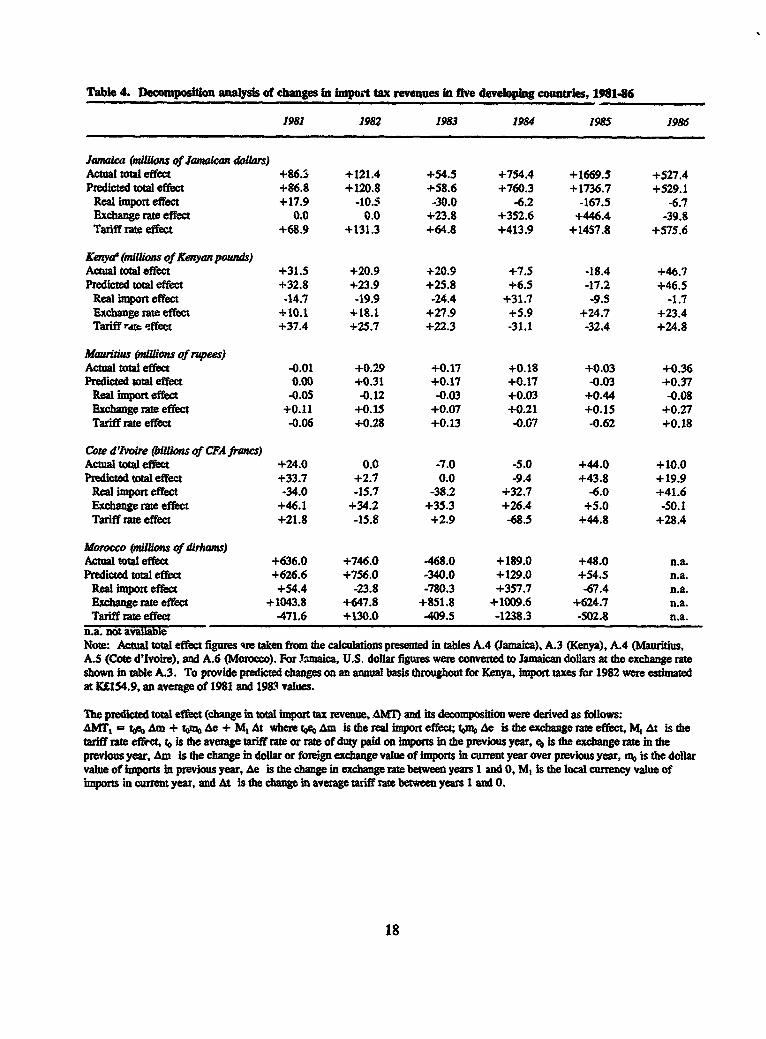
Table 4. Decomposition analysis of changes in Import tax revenues in five developing countries, 198146
1981 1982 1983 1984 1985 1986
Jamaica (millions of Jamaican dollars)Actual total effect +86.5 +121.4 +54.5 +754.4 +1669.5 +527.4Predicted total effect +86.8 +120.8 +58.6 +760.3 +1736.7 +529.1
Real import effect +17.9 -10.5 -30.0 -6.2 -167.5 -6.7Exchange rate effect 0.0 0.0 +23.8 +352.6 +446.4 -39.8Tariff rate effect +68.9 +131.3 +64.8 +413.9 +1457.8 +575.6
Kenya (milUons of Kenyan pounds)Actual total effect +31.5 +20.9 +20.9 +7.5 -18.4 +46.7Predicted total effect +32.8 +23.9 +25.8 +6.5 -17.2 +46.5
Real import effect -14.7 -19.9 -24.4 +31.7 -9.5 -1.7Exchange rate effect +10.1 +18.1 +27.9 +5.9 +24.7 +23.4Tariff rtv effect +37.4 +25.7 +22.3 -31.1 -32.4 +24.8
Mauiaus (millons of rupees)Actual total effect -0.01 +0.29 +0.17 +0.18 +0.03 +0.36Predicted total effect 0.00 +0.31 +0.17 +0.17 -0.03 +0.37
Real import effect -0.05 -0.12 -0.03 +0.03 +0.44 -0.08Exchange rate effect +0.11 +0.15 +0.07 +0.21 +0.15 +0.27Tariff rate effect -0.06 +0.28 +0.13 -0.07 -0.62 +0.18
Core d'Ivoire (illions of CPA francs)Actual total effect +24.0 0.0 -7.0 -5.0 +44.0 +10.0Predicted total effect +33.7 +2.7 0.0 -9.4 +43.8 +19.9
Real import effect -34.0 -15.7 -38.2 +32.7 -6.0 +41.6Exchange rate effect +46.1 +34.2 +35.3 +26.4 +5.0 -50.1Tariff rate effect +21.8 -15.8 +2.9 -68.5 +44.8 +28.4
Morocco (millions of dirhams)Actual total effect +636.0 +746.0 -468.0 +189.0 +48.0 n.a.Predicted total effect +626.6 +756.0 -340.0 +129.0 +54.5 n.a.
Real import effect +54.4 -23.8 -780.3 +357.7 -67.4 n.a.Exchange rate effect +1043.8 +647.8 +851.8 +1009.6 +624.7 n.a.Tariff rate effect -471.6 +130.0 -409.5 -1238.3 -502.8 n.a.
n.a. not availableNote: Actual total effect figures re taken from the calculations presented in tables A.4 (Jamaica), A.3 (Kenya), A.4 (Mauritius,A.5 (Cote d'Ivoire), and A.6 (Morocco). For Jamaica, U.S. dollar figures were converted to Jamaican dollars at the exchange rateshown in table A.3. To provide predicted changes on an annual basis throughout for Kenya, import taxes for 1982 were estimatedat K£154.9, an average of 1981 and 1983 values.
The predicted total effect (change in total import tax revenue, AMT) and its decomposition were derived as follows:AMT, to Am + to% Ae + M, At where toev Am is the real import effect; tom Ae is the exchange rate effect, M, At is thetariff rate effect, to is the average tariff rate or rate of duty paid on imports in the previous year, e is the exchange rate in theprevious year, Am is the change in dollar or foreign exchange value of imports in current year over previous year, n), is the dollarvalue of imports in previous year, Ae is the change in exchange rate between years 1 and 0, M, is the local currency value ofimports in current year, and At is the change in average tariff rate between years 1 and 0.
18
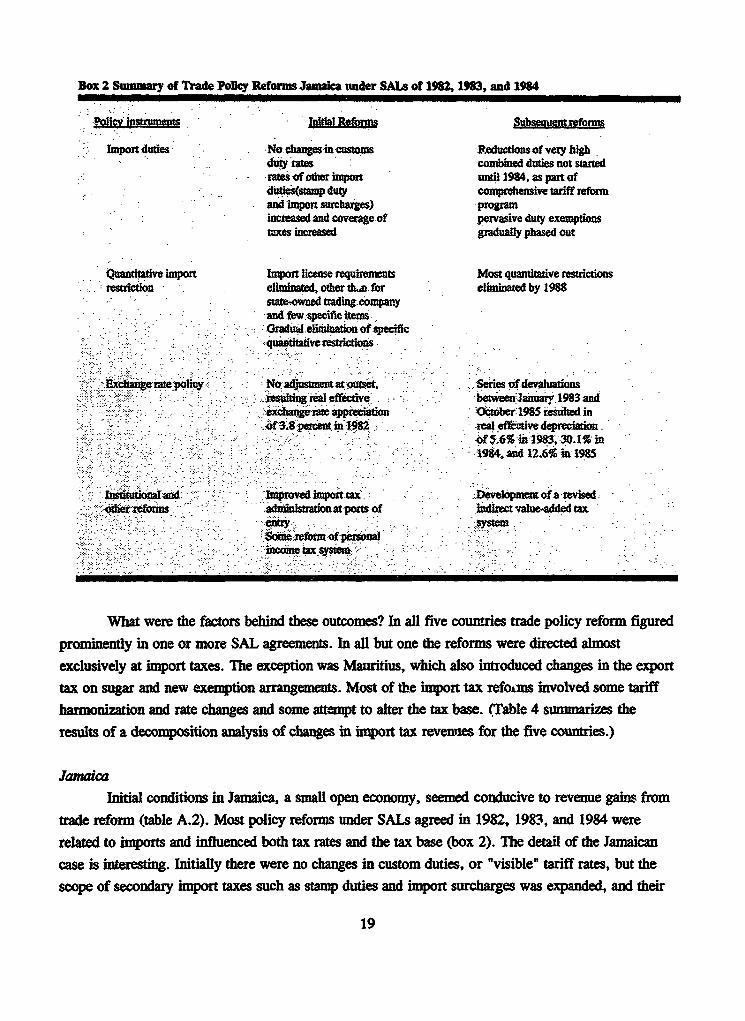
Box 2 Summary of Trade Policy Reforms Jamaica under SALs of 1982, 1983, and 1984
.olicy instrments Initial RfrsSubseounatsofouns
Import duties No changesin customs Reductionsof vey highduty rates combined duties not startedTates of other import until 1984. as part ofduties(stamp duty comprehensive tariff reformand impon surcharges) programincreased and coverageof pervasive duty exemptionstaxes increased gradually phased out
Quantitative import Import license requirements Most quantitative restrictionsrestriction eliminated, other the for eliminated by 1988
state-owned trading companyand few specific itemsGradual e -minationofspecificquatitativerestritions
Exchange rate policy Iadjustmentat tet Series of-devaluationsresulting neal ef fecive betweea January 1983 andchange rat appreciation October 1985 resulted in
fitpercent in 1982 real eMctive depreciationof 5.6% in 1983,30.1% in18. and 12.6% in 1985
Istonland Improved impoit ta Developmentof a revisedother reforms adeAinistrationat ports of indirect value-added tax
-.entry. sysemSonereftm or personaincame tax system
What were the factors behind these outcomes? In all five countries trade policy reform figured
prominently in one or more SAL agreements. In all but one the reforms were directed almost
exclusively at import taxes. The exception was Mauritius, which also introduced changes in the export
tax on sugar and new exemption arrangements. Most of the import tax refoims involved some tariff
harmonization and rate changes and some attempt to alter the tax base. (Table 4 summarizes the
results of a decomposition analysis of changes in import tax revenues for the five countries.)
Jamaica
Initial conditions in Jamaica, a small open economy, seemed conducive to revenue gains from
trade reform (table A.2). Most policy reforms under SALs agreed in 1982, 1983, and 1984 were
related to imports and influenced both tax rates and the tax base (box 2). The detail of the Jamaican
case is interesting. Initially there were no changes in custom duties, or "visible" tariff rates, but the
scope of secondary import taxes such as stamp duties and import surcharges was expanded, and their
19
rates were increased. Exemptions to import duties-which had been pervasive prior to reform-werereduced. As a result of these measures, the overall import duty rate increased, and this increase wasassociated with increased revenue collections.
There were substantial revisions in quantitative restrictions. Before SAL I in 1982, licensingprovisions applied to all imports, and there were 364 specific quantitative restrictions. The SALsrequired that licensing be lifted for all but a few state-owned companies. In addition many quantitativerestrictions were eliminated, and by 1988 nontariff barriers affected only about 8.5 percent ofimports. No formal provisions were made for replacing the quantitative restrictions with equivalent
tariffs, although some de facto replacement occurred through an expansion of the scope of stampduties and import surcharges. Average rates of collection on imports were very low prior to the first
SAL in 1982: 3.5 percent in 1980 and 6.1 percent in 1981 (table A.2). From such low average levels,
the rise in tariff rates implicit in increases in stamp duties and surcharges would be expected to be
revenue-expanding. The view that overall rates of duty were on average below their maximum-
revenue levels prior to the reforms is supported by the results of the decomposition analysis for
Jamaica: the tariff rate effect is positive for all years covered, but increases dramatically after 1983(table 4).
Pressures for exchange rate adjustment were initially resisted. The decomposition analysisshows no exchange rate effect on revenues in 1981 and 1982. In 1983, however, parallel market
transactions were legalized. Subsequently, the parallel and official rates were anified. The Jamaican
dollar fell from J$1.78 = US$1, to J$6.4 = US$1 between 1983 and 1985 and then stabilized. With
the reduction in the over-valuation of the exchange rate and the removal of quantitative restrictions,
the structure of imports changed. For instance, the share of consumer goods in total imports doubled
(from 11 percent to 21 percent). The 300 percent currency depreciation had a major impact on thesize of the tax base as well as on its composition. While the volume and foreign currency value of
imports fell sharply after 1982, the depreciation sustained the value of imports in local currency
terms. The decomposition analysis shows substantial positive revenue effects associated with
depreciation in 1984 and 1985 (table 4).Changes in the exchange rate also affected non-trade tax-related revenues associated with
specific exports. Bauxite levy receipts, for example, rose sharply in 1984 as devaluation induced a
rise in export earnings. But the decline in bauxite production meant that the bauxite levy as a share of
GDP did not increase over the period as a whole. Other trade-related policy changes may also haveaffected revenue, in particular the cutbacks in the activities of state marketing boards in bananas,coffee, cocoa, citrus, and pimento and the introduction of a duty drawback scheme (which did notprove very effective). These changes were unlikely to have caused significant revenue-contraction.
Indeed over the period as a whole tax effort increased, rising form 26.9 percent of GDP in 1982 to
30.4 percent in 1986.
20

While Jamaica's overall progress with policy reform during this period was incomplete, the
impact on trade revenue was dramatic. The tariff collection rate (import duties as a share of total
imports) rose from 12 percent in 1982 to nearly 60 percent in 198C, despite a massive contraction in
imports as a share of GDP (from 24 percent to 8 percent). This source of shrinkage in the tax base
was (approximately) offset in absolute terms by the substantial devaluation that occurred after 1983.
The decomposition analysis shows that the negative real import effect for 1981-86 was more than
offset by a significant, positive tariff rate effect, especially in 1984-85, and by exchange rate
depreciation between 1983 and 1985. So although the import tax base contracted sharply, the rate of
import tax collection rose enough to boost trade taxes as a share of GDP from 2.7 percent in 1983 to
4.8 percent in 1986. Revenue expansion would thus appear to have resulted from an increase in
collection rates due to improved tax administration at ports of entry and the introduction of additional
import-specific taxes in 1982 as Jamaica phased out quantitative restrictions. Thus, although no
formal provisions were made to replace quantitative restrictions with equivalent tariffs, the tariff
surcharges had that effect.
KenyaKenya also experienced revenue expansion following its SAL progrms. Prior to Kenya's first
SAL in 1980 the average tariff collection rate was only 12 percent, although scheduled nominal tariff
rates ranged from zero to over 100 percent. With the relaxation of import bans in 1980-81 (see box
3), tariffs were raised on some 150 items, many of them intermediate goods (about 11 percent of
imports), and a 10 percent surcharge was imposed on all dutiable items, including many of the items
removed from the banned list.
21

Box 3 Trade Policy Reforms in Kenya Under SALs of 1980 and 1982
oneitial Reforms Subseqent Ref*rMs
Import duties *Tadf-fson ome *Intention to produce moreincluding capital and moderate and unifouM tariffintersmediategods, increased sat, including sMe use of(maximum rate of 100%) tariff equivalents to replace
QRs.
*Temporary 10% tariff
surcharge imposed onall duraWble items
Quantitative import *Removalof import bans *Progressive reduction of QRsresuictions on most imports planned
Export taxes or subsidies *Raesof export compensationraisedirom 10% to 20% andlist of dlg il ex ions
Exchange rate policy i %in unher depreciationFebrnary 1981 ad1% inS pteberl981
Intoal and other..:foT f
Under SAL I of 1982, a progressive reduction of quantitative restrictions on all but 12 percent ofimports was proposed, with the intention of introducing equivalent tariffs in 1984 and 1985.Harmonization of tariffs toward a more moderate and uniform tariff was also planned
Since all the initial tariff changes in Kenya were directed at raising the implicit tariff rate, and
since many previously untaxed imports were included, it is not surprising that the collection rate rose
from 12 percent to 22 percent between 1980 and 1983. Over the same period the ratio of trade taxesto GDP increased from 4.9 percent to 5.3 percent (table A.3). There was a significant decline in the
trade tax base over the same period, as merchandise imports fell by 10 percent. The tightening of theforeign exchange constraint appears to have been A significant factor in this drop in imports-foreign
reserves fell by 50 percent over the period. What is important to note is that the fall in imports as ashare of GDP alongside an increase in revenue (trade taxes as a share of GDP) indicates that theincreases in average tariff rates were a major source of the revenue expansion. The decomposition
analysis shows that, with approximately offsetting real import effects and exchange rate effects, thetariff rate effect accounted for the positive net revenue effect identified up to 1983 (table 4).
The increase in trade tax revenue between 1980 and 1983 occurred despite a sharp fall inexport duties in 1981, a fall from which they did not recover until 1984 (table 4). There is no
22
evidence of changes in export tax rates, so the fall in export tax is probably reflected in the exportbase. Indeed, the value of coffee exports fell from $292 million in 1980 to $241 million in 1983,while that of tea exports fell from $172 million to $153 million.
Between 1983 and 1985 trade taxes as a share of GDP fell from 5.5 percent to 4.5 percent,with the collection rate for import taxes falling from 22 percent to 16 percent and the rate for exportduties increasing from 1.1 percent to 4.2 percent.Why did the trade tax share fall? There was somerationalization of the tariff regime during this period, but only a modest reduction of rates, and littleprogress was made in liberalizing quantitative restrictions and replacing them with equivalent tariffs.The value of merchandise imports increased by some 30 percent, and some exchange rate depreciationtook place. The principal driving force, however, appears to have been a relaxation of the foreignexchange constraint. Foreign exchange reserves rose from $281 million in 1982 to $448 million in1984, and there was a significant increase in external loans of almost $500 million in 1984. Thus,despite an expanding (import and export) tax base, the trade tax to GDP ratio fell. This fall can beattributed to the fall in collection rates on imports. The decomposition analysis shows large negativetariff-rate effects for 1984 and 1985, which were offset in 1984 (only) by the growth in imports (table
4).The increase in the trade tax to GDP ratio after 1984 can be largely explained by an
exchange-rate induced increase in the tax base. The decomposition analysis shows large positiveexchange rate effects in 1984 and 1985 for import tax revenues. In addition there was a substantialincrease in export earnings, particularly from coffee exports (up from $281 million to $479 million).Provisional estimates suggest that the rising trend for the collection rate, the trade tax ratio, and the
import base continued into 1987.Changes in the composition of the trade tax base between 1983 and 1987 may also have had
some slight effect. Among imports, the importance of fuels and lubricants fell as that of transportequipment rose, although it is not clear whether these changes were directly due to the trade policymeasures. While the impact on revenue is unclear, the direction of change should have been upward,assuming that fuels and lubricants am subject to excise duties while transportation equipment issubject to import duties. Among exports, the relative importance of coffee increased, a change thatshould also have boosted revenue. As with the change in the composition of imports, however, thischange appears to have had little to do with the trade policy measures-indeed, the share ofnontraditional exports actually fell marginally between 1980 and 1986.
MauritiusLike Jamaica and Kenya, Mauritius also experienced revenue expansion following its SAL
programs. The SAL reforms affected both export and import duties. On the export side reformsincluded changes in exemption and assessment arrangements (see box 4). Lifting the export taxexemption ceiling for sugar and offering duty drawbacks to nontraditional exports were
23
unambiguously revenue contracting, at least in the short run. After 1994-85, however, export tax
revenue increased as the higher guaranteed price offered by the EC led to a rise in the value of sugar
exports.
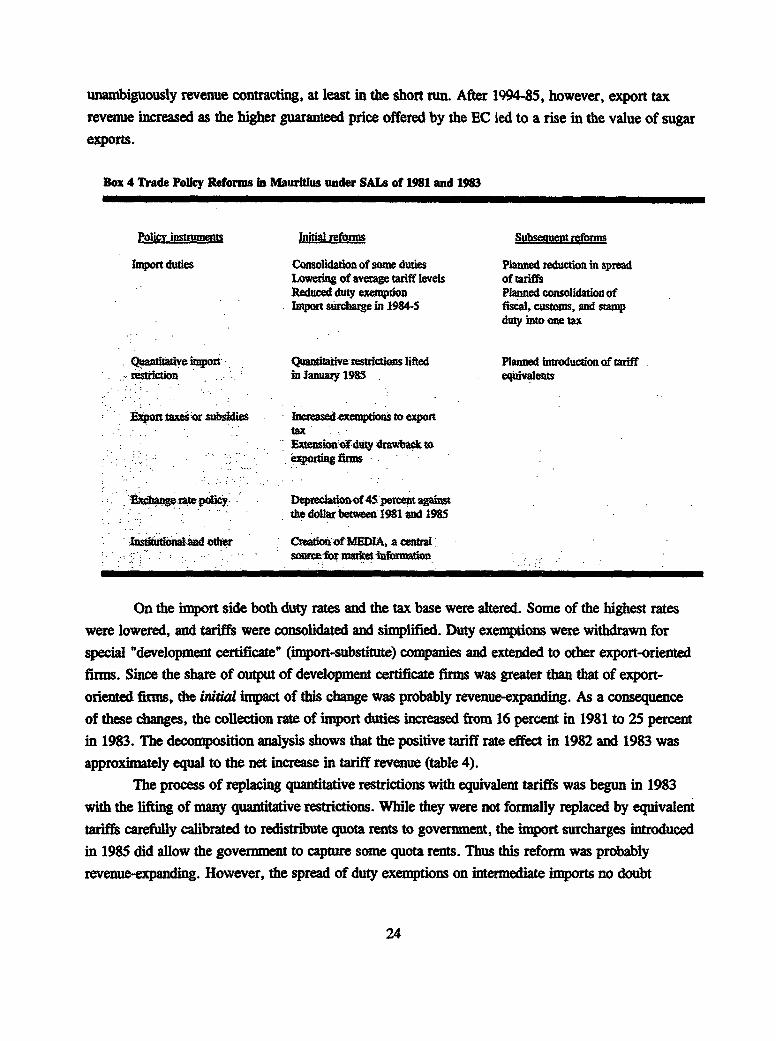
Box 4 Trade Policy Reforms In Mauritlus under SAL of 1981 and 1983
Policy instruments Initial refouns Subsequent reforms
Import dudes Consolidation of some duties Planed reduction in spreadLowering of average tariff levels of tariffsReduced duty exemption Planned consolidation ofImport surchar e in 1984-5 fiscal, customs, and stamp
duty into one tax
Quantitative import Quantitative restrictions lifted Planned introduction of tariffrestriction january 1985 equivalents
aport taxes or subsidies Increased exemptions to exporttaxExtension of duty drawback toeporting anrms
dxcange rateopolicy Depreciationof45 percent againstthe doUar between 1981 and 1985
nsdtutionatand edier Creati of MEDIA, a centralsourcefor market infornation
On the import side both duty rates and the tax base were altered. Some of the highest rates
were lowered, and tariffs were consolidated and simplified. Duty exemptions were withdrawn for
special "development certificate" (import-substitute) companies and extended to other export-oriented
firms. Since the share of output of development certificate firms was greater than that of export-
oriented firms, the initial impact of this change was probably revenue-expanding. As a consequence
of these changes, the collection rate of import duties increased from 16 percent in 1981 to 25 percent
in 1983. The decomposition analysis shows that the positive tariff rate effect in 1982 and 1983 was
approximately equal to the net increase in tariff revenue (table 4).
The process of replacing quantitative restrictions with equivalent tariffs was begun in 1983with the lifting of many quantitative restrictions. While they were not formally replaced by equivalent
tariffs carefully calibrated to redistribute quota rents to government, the import surcharges introduced
in 1985 did allow the government to capture some quota rents. Thus this reform was probably
revenue-expanding. However, the spread of duty exemptions on intermediate imports no doubt
24
contributed to the overall negative tariff rate effects in 1984 and 1985 shown in the decompositionanalysis, although the import surcharge effect is discernible in 1986 (table 4).
Mauritius introduced the strongest package of export incentives for nontraditional exportsamong the five sample countries: improvements in the duty drawback scheme, tax exemptions forexporters, and such institutional improvements as an export credit guarantee and insurance scheme, acentral source of information and market intelligence (MEDIA), and an industrial coordination unit toassist potential foreign investors. These measures, together with the increasing attractiveness ofMauritius as a location for offshore investment, contributed to the export-led growth of th; economyand to strong growth in the tax base (imports and exports) after 1982 (table A.4). The decompositionanalysis shows a positive real import effect in 1984 and 1985 and overall for the period 1981-86.
Two other important factors in the Mauritian case are changes in the exchange rate and innontrade taxes. The exchange rate was permitted to depreciate in real terms over the adjustmentperiod, resulting in a positive exchange rate effect on import duties throughout 1981-86 (table 4).
Changes in the tax system-a land development tax, a tax on seasonal residences, a land transfer tax,and a withholding tax on dividends-helped alleviate the fear of revenue-contraction from the tradereforms, thus strengthening the government's resolve to see the reforms through.
Most of the revenue effects of these changes were positive (table A.4). Between 1981 and1984 total trade taxes increased by 67 percent in nominal terms or by 23 percent relative to GDP.Revenue from both export and import taxes increased in absolute terms, but the collection rate on
exports fell by more than 40 percent, despite strong export growth, largely because of changes inexemption arrangements and export rates for sugar. By contrast the collection rate for imports
increased by 50 percent, due to changes in tariff rates and the import tax base. The rate changes wererelatively modest and in an upward direction initially, and together with the surcharges accompanyingremoval of quantitative restrictions, were probably revenue-expanding. The tax base changes-growthin the local currency value of imports and the significant reduction in exemptions-would also havebeen revenue-expanding.
The picture changes in 1985 and 1986, several years after the second SAL. Both import andexport growth remained strong, and import duty collections continued to rise in nominal terms. Butwhile duty collections rose 29 percent between 1984 and 1986, imports grew by an even faster 68percent. The drop in the collection rate from 24 percent to just under 19 percent is consistent withincreased imports of exempt and duty-free items and falling nominal rates as liberalization becameeffective. The strong growth of imports (more than 20 percent a year in real terms between 1984 and
1988), however, ensured that actual collections from imports more than doubled over the perioddespite the fall in the collection rate.
25

Cte d'IvoireOf the five countries considered in this section, C6te d'Ivoire proposed the most far-reaching
and ambitious reforms (box 5). The 1981 stabilization program provided for raising producer pricesin agriculture, restructuring state enterprises, and increasing nontrade taxes. Trade policy reforms
were initiated under the terms of the 1983 SAL, to be phased in over 1985-90. Nominal tariff rateswere to be lowered and their dispersion narrowed, the objective being to create a uniform effectiveprotection of 40 percent. Since effective protection rates in 1980 ranged from 14 percent to 355percent, this rep'esented a significant degree of liberalization for many industries. Export subsidies
would be granted so that exporters (of some products) would also benefit from an effective protectionrate of 40 percent. Quantitative restrictions- which had affected about 45 percent of allimports-began to be dismantled in 1985, and all quotas were to be removed by the end of 1986. Toease adjustment, temporary import surtaxes of 10 to 50 percent were proposed, to be phased out
between 1986 and 1990. Tariff exemptions were eliminated, except for domestic producers of
intermediate goods.This reform package altered both tax rates and the tax base. Nominal tariffs, which were
substantially lower than effective tariffs before reform, were reduced less than were effective tariffs.
The nominal exchange rate remained stable in the early reform period, but the effective rate againstthe dollar depreciated steadily up to 1985, in large measure because of appreciation of the dollar(table A.5). The import and export tax base contracted in real or dollar terms until 1983, then
expanded in 1984 and 1985 (as cocoa prices rose). However, import duty collection rates, which had
risen somewhat between 1980 and 1983, fell back sharply in 1984 before recovering to the prereform
rate of 30 percent in 1986. Export duty collection rates remained fairly stable in the postreform
period. Between 1981 and 1984 trade taxes as a share of GDP fell by two percentage points. The
decomposition analysis shows that the actual total change in import tax revenues in CMte d'Ivoire
from 1982 through 1984 was zero or negative (table 4), the result largely of the reduction in tariff
rates associated with the adjustment programs, and the declining real import growth associated withchanges in terms of trade. These negative effects were softened to some extent by a positive exchangerate effect, an effect unrelated to the adjustment program.
Why were the Ivorian reforms initially accompanied by revenue contraction? Several factors
appear to have been at work. First, average nominal tariffs were relatively low before the reform,ranging from 15 percent to 49 percent for most industrial sectors. Even at the higher end, these rates
were probably below maximum-revenue tariffs. Thus tariff liberalization, though it was limited,appears to have been revenue-contracting, at least in the initial phase. The average collection rate fellsharply between 1983 and 1984, more than offsetting revenue-expanding effects (table 4). Second,
26
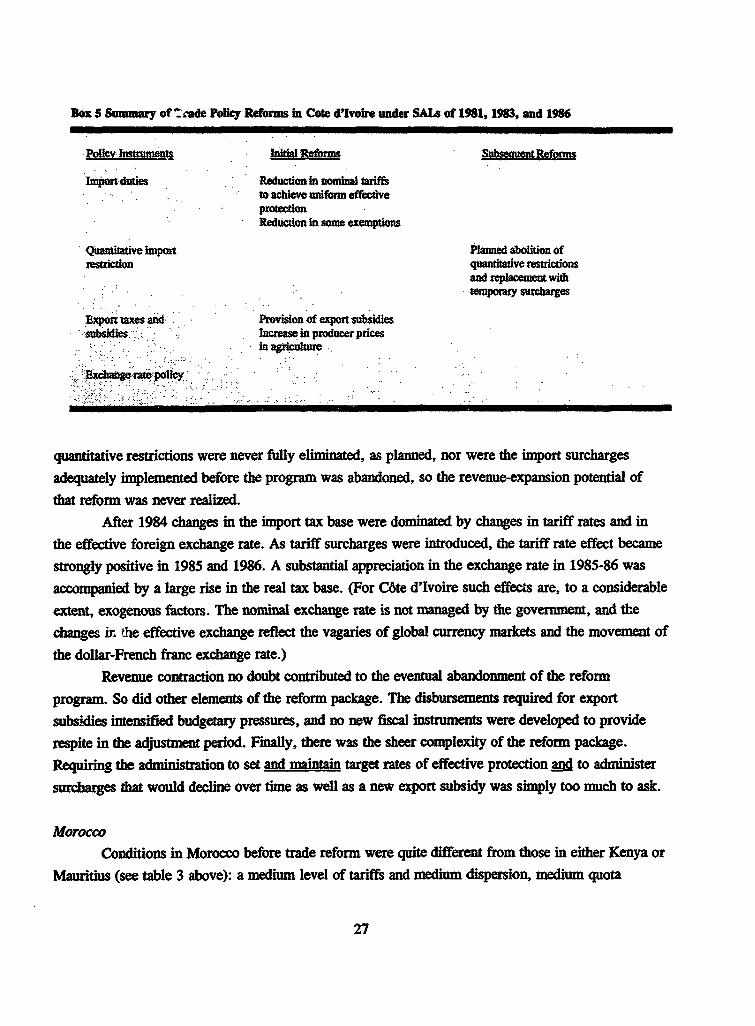
Box 5 Summary of ':ade Policy Reforms in Cote d'Ivoire under SALs of 1981, 1983, and 1986
Policyf SubsequtRefonus
Import duties Reduction in nominal tariffsto achieve uniform effectiveprotectionReduction in some exemptions
Quantitative impoxt Planned abolition ofrestriction quantitative restrictions
and replacement withtemporary surcharges
xpon taxes and Provision of export subsidiessbubsidies Increase in producer prices
in agriculture
Exchange rate policy
quantitative restrictions were never fully eliminated, as planned, nor were the import surcharges
adequately implemented before the program was abandoned, so the revenue-expansion potential of
that reform was never realized.After 1984 changes in the import tax base were dominated by changes in tariff rates and in
the effective foreign exchange rate. As tariff surcharges were introduced, the tariff rate effect became
strongly positive in 1985 and 1986. A substantial appreciation in the exchange rate in 1985-86 was
accompanied by a large rise in the real tax base. (For C6te d'Ivoire such effects are, to a considerable
extent, exogenous factors. The nominal exchange rate is not managed by the government, and the
changes ir the effective exchange reflect the vagaries of global currency markets and the movement of
the dollar-French franc exchange rate.)Revenue contraction no doubt contributed to the eventual abandonment of the reform
program. So did other elements of the reform package. The disbursements required for exportsubsidies intensified budgetary pressures, and no new fiscal instruments were developed to providerespite in the adjustment period. Finally, there was the sheer complexity of the reform package.
Requiring the administration to set and maintain target rates of effective protection and to administer
surcharges that would decline over time as well as a new export subsidy was simply too much to ask.
MoroccoConditions in Morocco before trade reform were quite different from those in either Kenya or
Mauritius (see table 3 above): a medium level of tariffs and medium dispersion, medium quota
27
protection, and a low dependence on trade taxes. SALs with substantial trade policy elements wereintroduced in 1984 and 1985 (box 6). Most of the reforms pertained to import duties. The maximumtariff rate was lowered to 45 percent, and the special import tax was lowered from 15 percent to 5percent. A wide range of exemptions was also eliminated.
As the reforms were implemented, the collection rates for customs duties, total import duties,and export duties declined (table A.6). The decomposition analysis shows that these tariff rate effectsaccounted for more than a 2,000 million dirham loss in import tax revenues over the period 1983-85.The tax base expanded over the same period, however, with import value increasing by 50 percent
(predominantly through currency depreciation) and export value by 75 percent. Because collection
rates fell by less than the increase in Lie tax base, revenue collections increased in absolute terms for
both import and export taxes in 1984 and 1985. But the share of trade taxes in GDP fell from 5.5percent in 1982 to 4.0 percent in 1985.
What can we learn from Morocco's experience about the potential impact of trade reformmeasures? Other things remaining constant, the increase in tax base and the reduction in exemptionsshould have been revenue-expanding, while the direction of the revenue effect of changes in nominalimport and export tax rates would depend on whether the average tariff before reform was above or
below the maximum-revenue tariff. Since actual collection rates fell, and the share of trade taxes in
GDP fell, there is strong presumptive evidence that average initial tariffs were below the maximum-
revenue tariff rate. (As table 4 shows, the tariff rate effect is negative for all but one year.)
This presumption is further supported by a consideration of other elements of the reformpackage. Import bans were removed from the outset, and import licensing requirements were relaxed.
Most protective quotas were retained, and those that were eliminated were not replaced with tariffs.
The growth in imports after 1983 despite depreciation of the exchange rate suggests that the tradepolicy measures played a role. The growth in exports was even stronger, and the current account
balance improved steadily after 1982. Since no specific export promotion measures were introduced
with the trade policy reforms, any benefits from the reform measures will have come about throughthe reduced "disprotection" of exports as import restraints were eased and a lower real exchange rate.
28
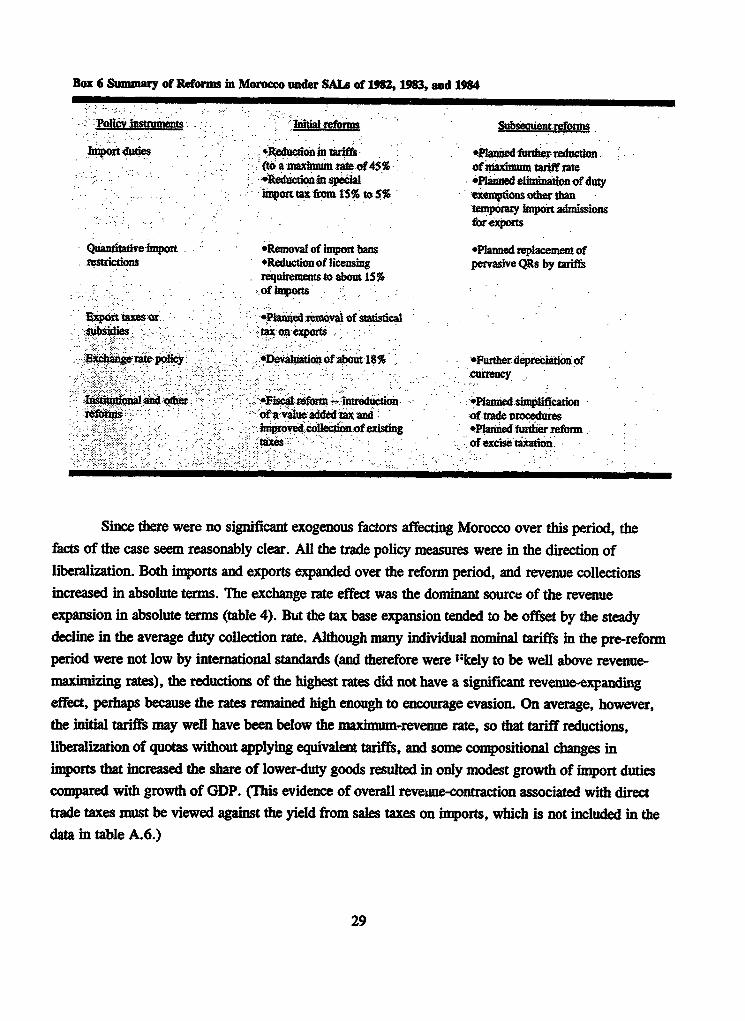
Box 6 Summary of Reforms in Morocco under SALs of 1982, 1983, and 1964
Ponidal reforms SubsequentrefoMns
mpot duties eduction in tariffs *Planned ther reduction(toa maxinann rate of 45% of muaximum tariff rate
Special Planned elimination of dutyimport taxftom 1S% to 5% exmptions other than
temporary import admissionsfoexponts
Quantitative import *Removal of import bans *Planned replacement ofrestrictions *Reduction of licensing pervasive QRs by tariffs
requirements to about 15%of imports
Esport taxes or *Planned removal of statisticalsubsidies tax on exports
change.ratepolicy *Devaluatioh of about18% 'Furtherdepreciationofacurrency
lastutionalandther 'Fiscalreform arrduction Planned simplificationrefous ofavaleadded tx and of trade Procedures
improved ctionof existin 'Planed further reformtaxes of excise taxation
Since there were no significant exogenous factors affecting Morocco over this period, thefacts of the case seem reasonably clear. All the trade policy measures were in the direction ofliberalization. Both imports and exports expanded over the reform period, and revenue collectionsincreased in absolute terms. The exchange rate effect was the dominant source of the revenue
expansion in absolute terms (table 4). But the tax base expansion tended to be offset by the steadydecline in the average duty collection rate. Although many individual nominal tariffs in the pre-reform
period were not low by international standards (and therefore were '-kely to be well above revenue-maximizing rates), the reductions of the highest rates did not have a significant revenue-expanding
effect, perhaps because the rates remained high enough to encourage evasion. On average, however,the initial tariffs may well have been below the maximum-revenue rate, so that tariff reductions,liberalization of quotas without applying equivalent tariffs, and some compositional changes inimports that increased the share of lower-duty goods resulted in only modest growth of import dutiescompared with growth of GDP. (This evidence of overall reveune-contraction associated with directtrade taxes must be viewed against the yield from sales taxes on imports, which is not included in thedata in table A.6.)
29
Some lessonsWhether a structural adjustment program succeeds depends in large measure on a
government's commitment to see it through. And that commitment depends, among other things, onbudgetary constraints. If structural adjustment programs turn out to be revenue-contracting-or areassumed to be-the probability that a reform program will be carried out to its completion drops.Although definitive conclusions require more detailed and extensive case study and appraisal andconstruction of computable general equilibrium models, this analysis of the fiscal implications of tradereforms under structural adjustment lending provides a number of important clues to the factors that
influence fiscal yield:* Both theory and country experience demonstrate that a range of revenue outcomes is possible
from trade liberalization, depending on initial conditions, the components of the reform
package, the effects of changes in tariff rates, changes in the import base, and changes in the
exchange rate.* Most trade reform programs involved reduction or elimination of quantitative import
restrictions, and were associated with revenue increases. Several countries experiencingsubstantial revenue expansion introduced some kind of temporary tariff surcharge while
reducing quantitative restrictions.* Theory suggests that tariff rate changes can have an important fiscal impact, with the
direction of change depending on whether average tariff rates are initially very high or not(i.e. possibly above or below revenue-maximizing tariff rates). Detailed country studiesuncovered a range of outcomes. Revenue expansion was associated with tariff reductions in
Mauritius and with tariff increases in Jamaica and Kenya, while revenue contraction wasassociated with tariff reductions in C6te d'Ivoire and Morocco. Though relatively low initial
tariff levels in C6te d'Ivoire and Morocco suggest that the revenue contraction was
attributable to a reduction in tariffs that were probably already below maximum-revenue
levels, it was difficult to disentangle this effect from that of tariffication of quantitativerestrictions. It was also difficult to tell how much of the observed changes in imports was
due to factors other than trade policy, e.g., demand-contracting effects of recession or
stabilization.* Reform-induced changes in the tax base also appear to be important. In all cases of revenue
expansion significant changes in exemption arrangements were part of the reform package.Even in countries experiencing an overall contraction in revenue, reducing exemptions has a
revenue-expanding effect. Changes in exemption arrangements were especially important in
Mauritius.* The importance of changes in the trade tax base varied. In all the cases examined, the real
import base shrank at some point in the period, with the contraction especially marked in
Jamaica and Kenya.
30
* Exchange rate changes associated with trade reform programs appear to have had animportant revenue-expanding effect in all five of the countries studied. Exchange tate changesin general served to expand the tax base, confirming the expectation that import demand isrelatively price inelastic over the relevant range. Exchange rate changes served to reinforceother revenue-expanding effects or to counteract revenue-contracting effects. This findingconfirms the importance of exchange rate changes in the adjustment process for easing fiscalconstraints, and it suggests that fears about the revenue consequences of exchange ratechanges may be exaggerated.
* External shocks have in some cases dominated the revenue changes. In Jamaica the collapseof bauxite prices was instrumental in contracting the tax base, and in C6te d'Ivoire thecollapse of cocoa prices had the same effect.These conclusions also have implications for the timing and sequencing of trade policy
reforms. Initial tariff rates, especially collection rates, need to be considered carefully in terms of thepotential for revenue expansion or contraction. It is also clear that in the early stages of a reformprogram, reducing tariff exemptions should reap important fiscal gains. When elimination ofquantitative restrictions is contemplated, careful consideration should be given to replacing them withsome form of tariff surcharge. If tariffs are regarded as inappropriate for allocative reasons, thenfiscal respite should be provided through other tax measures or reforms. The exchange rate should beallowed to adjust: for developing countries, this adjustment is likely to be revenue-expanding. Finally,sustaining the tax base requires appropriate measures for promoting the growth of real exports so thatreductions in collections resulting from import liberalization are offset by changes in the tax base.
31
Eudnotes
1. Long-term fiscal impact is likely to be less problematic, since with full supply responses to reformfiscal depletion is less likely. Endogenous change and policy reforms are also likely to reduce dependenceon trade taxes.
2. Many imports subject to quantitative restrictions are also subject to tariffs. But removing quantitativerestrictions will still be revenue enhancing if, as is likely, the quantitative restriction is more binding thanthe tariff.
3. Some counties employ multiple exchange rates as a means of taxing traditional exports that arerelatively inelastic in supply. Foreign exchange earnings from these traditional exports have to beconva,rted into domestic currency at a highly overvalued rate, while the authorities are able to sell foreignexchangc to other sectors or agents at rates at or nearer the true or equilibrium rate. As the gap widensbetween the equilibrium rate and the official rate for taxed exports, the yield from that tax rises. This typeof multiple exchange rate system may be explicit or it may operate implicitly through the pricing policiesof state marketing boards.
4. It should be noted that this relationship across country groups has been challenged by Hitiris andWeekes (1987). They accept that a negative relationship exists between dependence on trade taxes anddevelopment but argue that the relationship is characterized by only a single break. As Greenaway andSapsford (1987) demonstrate, however, both in theory and using approriate estimation techiniques, thereare likely to be three distinct subgroups-the least developed, middle income, and industrialized countries.
5. Greenaway and Nam (1988) provide a classification of countries according to trade orientation. Forthe period 1973-84, for instance, they classify Ghana as strongly inward oriented, Philippines and Cfted1Ivoire as moderately inward oriented, and Chile and Tunisia as moderately outward oriented.
6. Although evidence on the relationship between tariff rates and smuggling is not easy to come by,empirical work on Indonesia (Shaw 1981) suggests that smuggling activity becomes a problem at taiffrates over 40 percent. This finding is consistent with the author's experience iivestigating tariff schedulesin Burundi and Tanzania, and with Larry SJastaad's experience investigating tariff schedules in variousLatin American countries (personal communication).
32
Bibliography
Balassa, B. 1982. Development Strategies in Semi-industrial Economics. Baltimore: Johns HopkinsUniversity Press.
Clarete, R., and J. Whalley. 1987. "Comparing the Marginal Welfare Costs of Commodity and TradeTaxes." Journal of Public Economics 33:357-62.
Corden, W.M. 1947. Trade Policy and Economic Welfare. Oxford: Oxford University Press.
Friedlaender, A., and A. Vandendorpe. 1968. "Excise Taxes and the Gains from Trade." Journal ofPolitical Economy 76(5):1058-68.
Georgakopoulous, T. 1974. "The 'Excess Burden' Controversy in a Trading World: A Case forSpecial Indirect Taxes." Public Finance 29(2):152-67.
Goode, R. 1984. "Government Finance in Developing Countries." Washington, D.C.: BrookingsInstitution.
Greenaway, D. 1980. "Trade Taxes as a Source of Government Revenue: An InternationalComparison." Scottish Journal of Political Economy 27:175-82.
Greenaway, D. 1982. "Maximum Revenue Tariffs and Optimal Revenue Tariffs: Concepts and PolicyIssues." Public Finance 27:67-79.
Greenaway, D. 1984. "A Statistical Analysis of Fiscal Dependence on Trade Taxes and EconomicDevelopment." Public Finance 29: 79-89.
Greenaway, D., and C.R. Milner. 1986. "Estimating the Shifting of Protection across Sectors: AnApplication to Mauritius." Industry and Development 16:1-22 UNIDO.
Greenaway, D., and C.R. Miler 1989. "Nominal and Effective Tariffs in a Small IndustrializingEconomy: The Case of Mauritius." Applied Economics 21:995-1010.
Greenaway, D., and C.R. Milner. 1990. "Measuring and Evaluating the Structure of Protection in aLow-Income LDC: A Case Study of Burundi." Journal of Development Studies.
Greenaway, D., and C.H. Nam. 1988. "Industrialization and Macroeconomic Performance inDeveloping Countries under Alternative Trade Strategies." Kykos 41:419-35.
Greenaway, D., and D.R. Sapsford. 1987. "Further Econometric Analysis of the Relationshipbetween Fiscal Dependence on Trade Taxes and Economic Development." Public Finance42:390-19.
Halevi, N. 1989, "Trade Restrictions and Reforms by Developing Countries in the 1980's." UNDP-World Bank Trade Expansion Program Occasional Paper 4. World Bank, Washington, D.C.
33
Hitiris, T., and A.J. Weekes. 1987, "Fiscal Dependence on Trade Taxes and Economic Development:An Econometric Investigation." Public Finance 42:297-308.
Idachaba, F.S. 1975. "Revenue Instability in Developing Countries: The Ghanaian Experience."Public Finance. 39:96-107.
Johnson, H.G. 1950-51. "Optimum Welfare and Maximum Revenue Tariffs." Review of EconomicStudies 19:28-35.
Khan, A. 1988. "Fiscal Dependence on Trade Taxes and Economic Development: The Case ofPakistan." Public Finance. 43, No. 1: 96-112.
Kreger, A.O. 1981. Trade and Employment in Developing Countries. Chicago: University of ChicagoPress.
Lewis, S.R. 1968. "Government Revenue from Foreign Trade: An International Comparison." TheManchester School of Economic and Social Studies 31:39-46.
Lewis, S.R. 1967. "Revenue Implications of Changing Industrial Structure." National Tax Journal(December).
Milner, C.R. 1989. "Tariff Reform in Burundi." In J. Bates and V.N. Balusubramanyam, eds., CaseStudies in Economic Development. London: Macmillan.
Mosley, P. 1987. "Conditionality as a Bargaining Process: Structural Adjustment Lending 1980-86."Princeton Essay 168. Princeton University, Princeton, New Jersey.
Mulct, T. 1979. "The Revenue Effectiveness of the Ethiopia Coffee Export Taxation." Public Finance34:375-83.
Shaw, G.K. 1981. "Leading Issues of Tax Policy in Developing Countries." In A.T. Peacock and F.Forte, eds., The Political Economy of Taration. Oxford: Basil Blackwell.
34
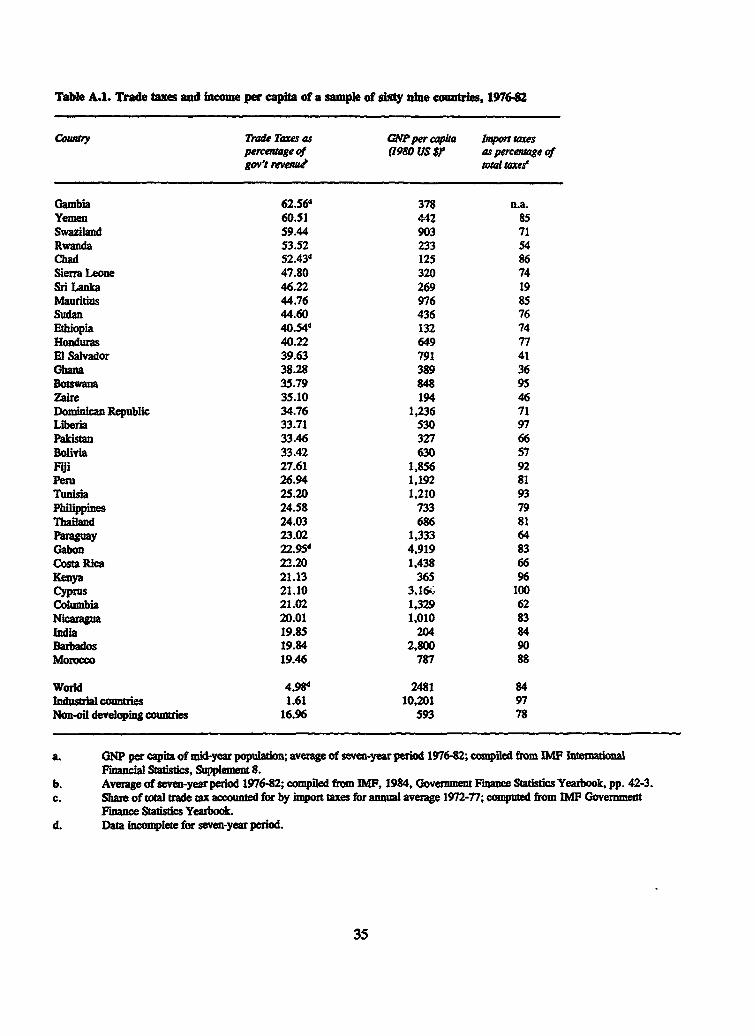
Table A.1. Trade taxes and income per capita of a sample of sixty nine countries, 197642
Contry Tade Tame as GNP per capita Impon taxespercentage of (1980 US $ as percentage ofgov't revenal otal rae'
Gambia 62.56d 378Yemen 60.51 442 85Swaziland 59.44 903 71Rwanda 53.52 233 54Chad 52.434 125 86Sierra Leone 47.80 320 74Sri Lanka 46.22 269 19Mauritius 44.76 976 85Sudan 44.60 436 76Ethiopia 40.54d 132 74Honduras 40.22 649 77El Salvador 39.63 791 41Ghana 38.28 389 36Botswana 35.79 848 95Zaire 35.10 194 46Dominican Republic 34.76 1,236 71Liberia 33.71 530 97Pakistan 33.46 327 66Bolivia 33.42 630 57Fiji 27.61 1,856 92Peru 26.94 1,192 81Tunisia 25.20 1,210 93Philippines 24.58 733 79Thailand 24.03 686 81Paraguay 23.02 1,333 64Gabon 22.95d 4.919 83Costa Rica 22.20 1,438 66Kenya 21.13 365 96Cyprus 21.10 3.16. 100Columbia 21.02 1,329 62Nicaragua 20.01 1,010 83India 19.85 204 84Barbados 19.84 2,800 90Morocco 19.46 787 88
World 4.98d 2481 84Industrial countries 1.61 10,201 97Nonoil developing countries 16.96 593 78
a. ONP per capita of mid-year population; average of seven-year period 1976-82; compiled from IMF InternationalFinancial Statistics, Supplement 8.
b. Average of seven-year period 1976-82; compiled from IMF, 1984, Government Finance Statistics Yearbook, pp. 42-3.c. Share of total trade tax accounted for by import taxes for annual average 1972-77; computed from IMF Government
Finance Statistics Yearbook.d. Data incomplete for seven-year period.
35
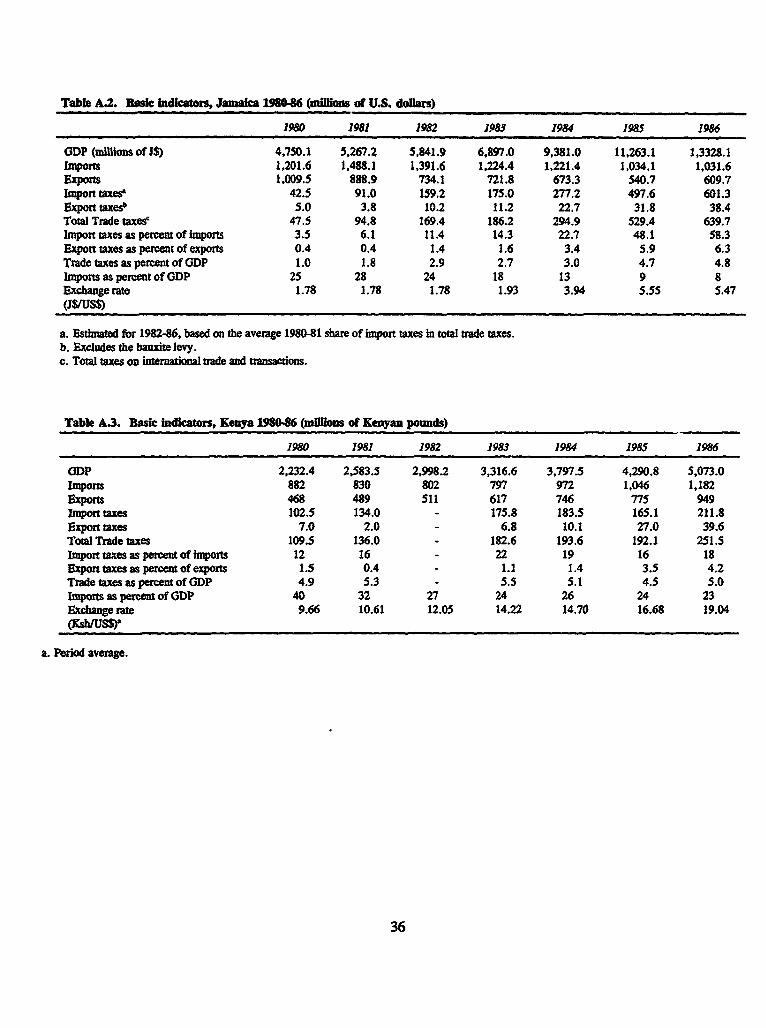
Table A.2. Basic Indicators, Jamaiea 189646 (mMions of U.S. dollars)
1980 1981 1982 1983 1984 1985 1986
GDP (millions of J$) 4,750.1 5,267.2 5,841.9 6,897.0 9,381.0 11,263.1 1,3328.1Imports 1,201.6 1,488.1 1,391.6 1,224.4 1,221.4 1,034.1 1,031.6Exports 1,009.5 888.9 734.1 721.8 673.3 540.7 609.7Import taxes 42.5 91.0 159.2 175.0 277.2 497.6 601.3Export taxesb 5.0 3.8 10.2 11.2 22.7 31.8 38.4Total Trade taxes' 47.5 94.8 169.4 186.2 294.9 529.4 639.7Import taxes as percent of imports 3.5 6.1 11.4 14.3 22.7 48.1 58.3Export taxes as percent of exports 0.4 0.4 1.4 1.6 3.4 5.9 6.3Trade taxes as percent of GDP 1.0 1.8 2.9 2.7 3.0 4.7 4.8Imports as percent of GDP 25 28 24 18 13 9 8Exchange rate 1.78 1.78 1.78 1.93 3.94 5.55 5.47
(JS/US$)
a. Estimated for 1982-86, based on the average 1980-81 share of import taxes in total trade taxes.b. Excludes the bauxite levy.c. Total taxes on international trade and transactions.
Table A.3. Basic Indicators, Kenya 1980.86 (millions of Kenyan pounds)
1980 1981 1982 1983 1984 1985 1986
GDP 2,232.4 2,583.5 2,998.2 3,316.6 3,797.5 4,290.8 5,073.0Imports 882 830 802 797 972 1,046 1,182
Exports 468 489 511 617 746 775 949Import taxes 102.5 134.0 - 175.8 183.5 165.1 211.8Export taxes 7.0 2.0 - 6.8 10.1 27.0 39.6Total Trade taxes 109.5 136.0 - 182.6 193.6 192.1 251.5Import taxes as percent of imports 12 16 - 22 19 16 18Export taxes as percent of exports 1.5 0.4 - 1.1 1.4 3.5 4.2Trade taxes as percent of GDP 4.9 5.3 - 5.5 5.1 4.5 5.0Imports as percent of GDP 40 32 27 24 26 24 23Exchange rate 9.66 10.61 12.05 14.22 14.70 16.68 19.04
(Ksh/US$Y
a. Period average.
36
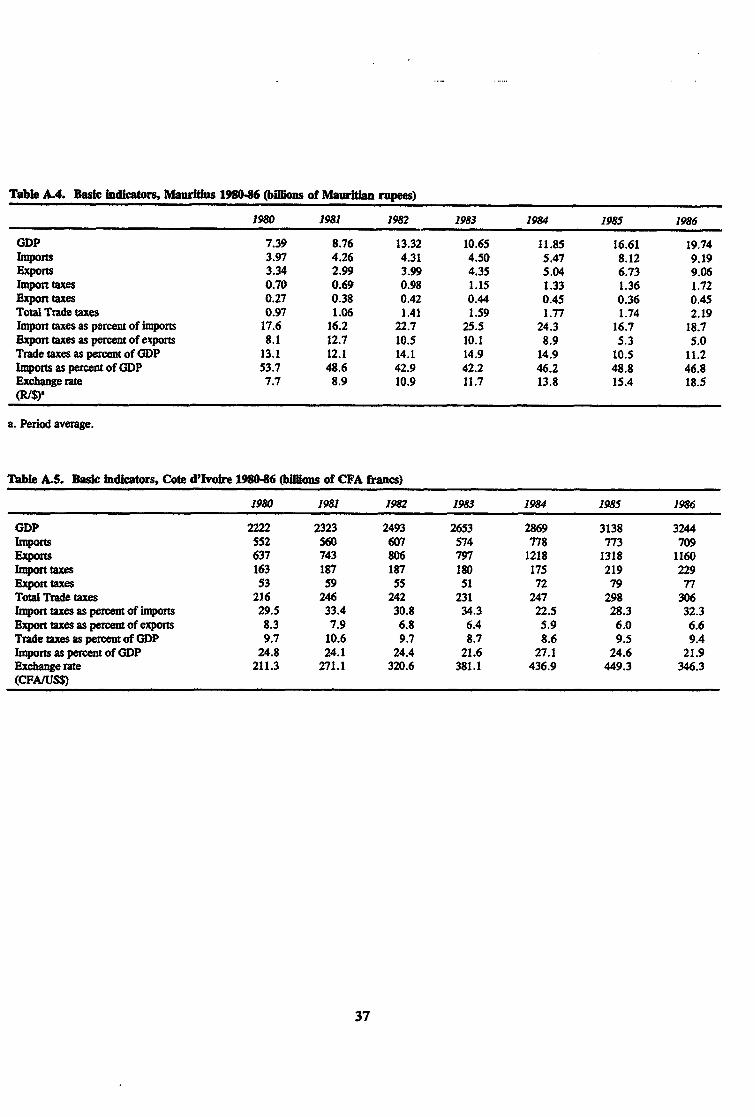
Table A.4. Basic Indicators, Maurities 1980-86 (bilions of Mauritan rupees)
1980 1981 1982 1983 1984 1985 1986
GDP 7.39 8.76 13.32 10.65 11.85 16.61 19.74Imports 3.97 4.26 4.31 4.50 5.47 8.12 9.19Exports 3.34 2.99 3.99 4.35 5.04 6.73 9.06Import taxes 0.70 0.69 0.98 1.15 1.33 1.36 1.72Export taxes 0.27 0.38 0.42 0.44 0.45 0.36 0.45Total Trade taxes 0.97 1.06 1.41 1.59 1.77 1.74 2.19Import taxes as percent of imports 17.6 16.2 22.7 25.5 24.3 16.7 18.7Export taxes as percent of exports 8.1 12.7 10.5 10.1 8.9 5.3 5.0Trade taxes as percent of ODP 13.1 12.1 14.1 14.9 14.9 10.5 11.2Imports as percent of GDP 53.7 48.6 42.9 42.2 46.2 48.8 46.8Exchange rate 7.7 8.9 10.9 11.7 13.8 15.4 18.5(RI$)
a. Period average.
Table A.S. Basic indicators, Cote d'Ivoire 1980-46 (billions of CFA francs)
1980 1981 1982 1983 1984 1985 1986
GDP 2222 2323 2493 2653 2869 3138 3244Imports 552 560 607 574 778 773 709Exports 637 743 806 797 1218 1318 1160Import taxes 163 187 187 180 175 219 229Export taxes 53 59 55 51 72 79 77Total Trade taxes 216 246 242 231 247 298 306Import taxes as percent of imports 29.5 33.4 30.8 34.3 22.5 28.3 32.3Export taxes as percent of exports 8.3 7.9 6.8 6.4 5.9 6.0 6.6Trade taxes as percent of GDP 9.7 10.6 9.7 8.7 8.6 9.5 9.4Imports as percent of GDP 24.8 24.1 24.4 21.6 27.1 24.6 21.9Exchange rate 211.3 271.1 320.6 381.1 436.9 449.3 346.3(CPA/US$)
37
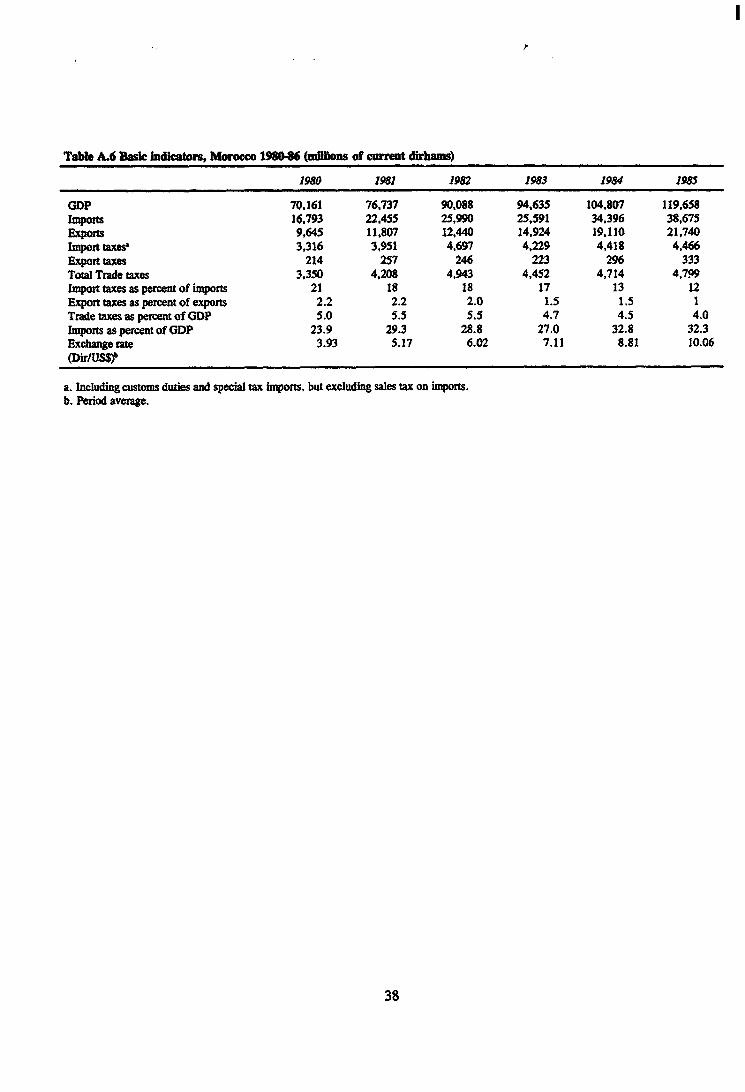
I
Table A.6 Basic indicators, Morocco 196046 (miloas of current dirhams)
1980 1981 1982 1983 1984 1985
GDP 70,161 76,737 90,088 94,635 104,807 119,658Imports 16,793 22,455 25,990 25,591 34,396 38,675Exports 9,645 11,807 12,440 14,924 19,110 21,740Import taxes' 3,316 3,951 4,697 4,229 4,418 4,466Export taxes 214 257 246 223 296 333Total Trade taxes 3,350 4,208 4,943 4,452 4,714 4,709Import taxes as percent of imports 21 18 18 17 13 12Export taxes as percent of exports 2.2 2.2 2.0 1.5 1.5 1Trade taxes as percent of GDP 5.0 5.5 5.5 4.7 4.5 4.0Imports as percent of GDP 23.9 29.3 28.8 27.0 32.8 32.3Exchange rate 3.93 5.17 6.02 7.11 8.81 10.06(Dir/US$p
a. Including customs duties and special tax imports, but excluding sales tax on imports.b. Period average.
38
Related Documents