The Financial Returns from Oil and Natural Gas Company Stocks Held by American College and University Endowments Robert J. Shapiro and Nam D. Pham December 2012

Welcome message from author
This document is posted to help you gain knowledge. Please leave a comment to let me know what you think about it! Share it to your friends and learn new things together.
Transcript
The Financial Returns from Oil and Natural Gas Company Stocks
Held by American College and University Endowments
Robert J. Shapiro and Nam D. Pham
December 2012
1
Table of Contents
I. Executive Summary ………………………………………………………….. 2.
II. College and University Endowments: An Overview ………………………… 5.
III. The Distribution of College and University Endowments by Asset Class …… 8.
IV. The Returns on Investments by College and University Endowments
by Asset Class……………………………………………………………….. 12.
V. Conclusion ………………………………………………………………..…. 17.
References …………………………………………………………………… 19.
About the Authors ……………………………………………………………. 20.

2
The Financial Returns from Oil and Natural Gas Company Stocks
Held by American College and University Endowments
Robert J. Shapiro and Nam D. Pham1
I. Executive Summary
This study examines the performance of American college and university endowments.
While these endowments vary in size and the public or private status of the institutions, the most
important factor affecting their financial performance is their asset allocation. We tracked the
returns of the major asset classes held by college and university endowments over the most
recent year (FY 2010-2011), the most recent five-year period (FYs 2006-2011), and the most
recent ten-year period (FYs 2001-2011).2 Depending on the period, different classes of assets
produced relatively higher returns for college and university endowments. Over the most recent
five-year period, for example, fixed income securities and distressed debt far outperformed all
U.S. equities, foreign equities, and real estate securities. Yet, over the most recent ten-year
period, real estate securities, distressed debt, commodities and foreign equities far outperformed
all U.S. equities, fixed income instruments, and Treasury bills. And over the most recent year,
real estate securities, all U.S. equities and foreign equities outperformed bonds, distressed debt,
and cash and Treasury bills.
This analysis also revealed one consistent element: Over all three periods, U.S. shares of
oil and natural gas companies outperformed both the overall performance of these endowments
and every other asset class examined here. 3
We find that for at least the last decade, investments
by college and university endowments in U.S. shares of oil and natural gas companies produced
the highest returns for those endowments.
In the most recent year with available data, FY 2010-2011, 823 endowed U.S. public and
private not-for-profit colleges and universities held endowment assets totaling $408
billion, an average of $496 million per-institution.4 The endowments of 295 public
1 Support for the research for this report was provided by the American Petroleum Institute. The analysis and
conclusions are solely those of the authors. 2 We used the following indexes to measure the returns of the various asset classes: U.S. stocks, the S&P 500;
foreign equities, the MSCI World Index, excluding the U.S.; bonds or fixed income instruments, the Barclay Bond
Index; real estate securities, the Wilshire Real Estate Securities index; commodities, the Dow Jones Commodities
Index; and distressed debt, the HFRI Distressed Debt Index. Note, the National Association of College and
University Business Officers (NACUBO) has reported the one-year return on certain asset classes. In particular,
they reported a 30.1 percent return on U.S. equities held by their endowments for FY 2010-2011. They do not
report five-year or ten-year returns by asset class. For this study, we generally apply the benchmarks, and for FY
2010-2011, the S&P 500 returned 30.7 percent. As NACUBO reported a 30.1 percent return on U.S. equities, it
indicates that college and university endowment investments in U.S. equities track the S&P 500 very closely. 3 The returns on oil and natural gas stocks are derived from the S&P Energy Index. Over 98 percent of the index is
comprised of oil and natural gas companies: 60.3 percent integrated oil & gas companies; 17.75 percent oil & gas
exploration and production firms; 14.11 percent oil and gas equipment and services companies; 2.66 percent oil and
gas storage and transportation firms; 1.96 percent oil and gas drilling companies; and 1.29 percent oil & gas refining
and marketing firms. Coal and consumable fuels account for the remaining 1.92 percent of the Index. 4 The number of institutions of higher education is larger than the number analyzed here. We focus on 823
institutions with significant endowments included in the NACUBO-Commonfund Study of Endowments.

3
institutions totaled $122.4 billion, averaging $415 million each; and the endowments of
528 private institutions totaled $285.7 billion, averaging $541 million each. All told,
private institutions account for 70 percent of all college and university endowment assets.
In FY 2010-2011, these 823 college and university endowments held 2.1 percent of their
assets in oil and natural gas company stocks, valued at $8.45 billion and accounting for
$3 billion of the endowment assets of public institutions and $5.4 billion of the
endowments at private institutions.
Summary Table 1. College and University Endowment Assets and Investment Gains,
All Assets, U.S. Equities, and Oil and Natural Gas Stocks,
Public and Private Institutions, FY 2010-2011 ($ million)
Public Institutions Private Institutions All Institutions
Total Endowment Assets $122,439.0 $285,691.0 $408,130.0
Domestic Equities $23,263.4 $42,853.7 $66,117.1
Share of Endowment Assets 19.0% 15.0% 16.2%
Oil & Natural Gas Stocks $2,973.1 $5,476.7 $8,449.8
Share of Endowment Assets 2.4% 1.9% 2.1%
Total Investment Gains $23,508.3 $55,138.4 $78,361.0
One-Year Returns 19.2% 19.3% 19.2%
All U.S. Equities $7,072.1 $12,856.1 $19,901.2
One-Year Returns 30.4% 30.0% 30.1%
Oil & Natural Gas Stocks $1,570.7 $2,893.3 $4,464.0
One-Year Returns 52.8% 52.8% 52.8%
Over the most recent five-year period, June 2006 to June 2011, the oil and gas company
stocks held by colleges and universities produced average annual returns of 7.9 percent.
These returns far exceeded those of the other asset classes held by these endowments,
with average annual five-year returns of 2.9 percent for all U.S. stocks, 2.0 percent for
global equities, 6.5 percent for bonds, 1.6 percent for real estate, 0.0 percent for
commodities, 4.7 percent for distressed debt, and 2.0 percent for 3-month Treasury bills.
The 7.9 percent average annual five-year returns from oil and natural gas company stocks
were 172 percent higher than the average annual five-year 2.9 percent returns on all U.S.
stocks and 68 percent greater than the average annual five-year 4.7 percent returns on all
college and university endowment assets.
Over the most recent ten-year period, June 2001 to June 2011, oil and gas company
stocks held by colleges and universities produced average annual ten-year returns of 11.5
percent, compared to 2.7 percent for all U.S. stocks, 6.1 percent for global equities, 5.7
percent for bonds, 10.4 percent for real estate. 6.6 percent for commodities, 9.4 percent
for distressed debt, and 2.1 percent for 3-month Treasury bills.
The 11.5 percent average annual ten-year returns on oil and natural gas company stocks
were 326 percent higher than the average annual ten-year 2.7 percent returns on all U.S.
4
stocks and 105 percent greater than the overall average annual ten-year 5.6 percent
returns on all college and university endowment assets.
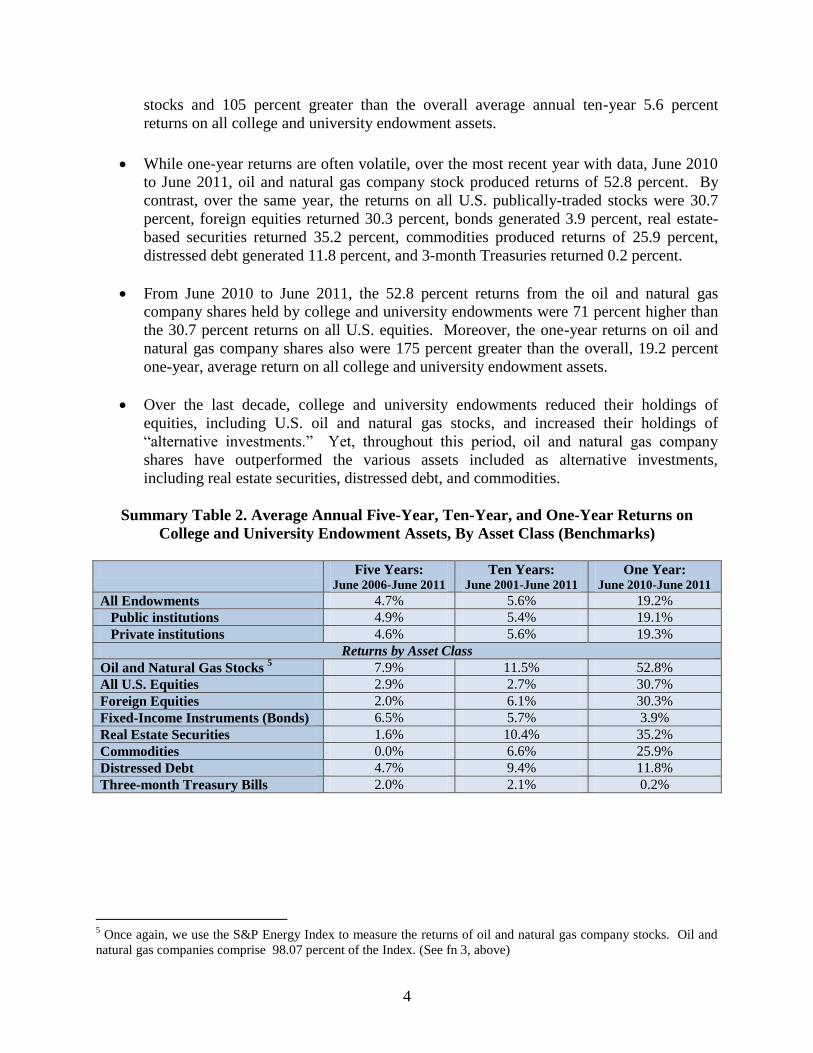
While one-year returns are often volatile, over the most recent year with data, June 2010
to June 2011, oil and natural gas company stock produced returns of 52.8 percent. By
contrast, over the same year, the returns on all U.S. publically-traded stocks were 30.7
percent, foreign equities returned 30.3 percent, bonds generated 3.9 percent, real estate-
based securities returned 35.2 percent, commodities produced returns of 25.9 percent,
distressed debt generated 11.8 percent, and 3-month Treasuries returned 0.2 percent.
From June 2010 to June 2011, the 52.8 percent returns from the oil and natural gas
company shares held by college and university endowments were 71 percent higher than
the 30.7 percent returns on all U.S. equities. Moreover, the one-year returns on oil and
natural gas company shares also were 175 percent greater than the overall, 19.2 percent
one-year, average return on all college and university endowment assets.
Over the last decade, college and university endowments reduced their holdings of
equities, including U.S. oil and natural gas stocks, and increased their holdings of
“alternative investments.” Yet, throughout this period, oil and natural gas company
shares have outperformed the various assets included as alternative investments,
including real estate securities, distressed debt, and commodities.
Summary Table 2. Average Annual Five-Year, Ten-Year, and One-Year Returns on
College and University Endowment Assets, By Asset Class (Benchmarks)
Five Years:
June 2006-June 2011
Ten Years: June 2001-June 2011
One Year: June 2010-June 2011
All Endowments 4.7% 5.6% 19.2%
Public institutions 4.9% 5.4% 19.1%
Private institutions 4.6% 5.6% 19.3%
Returns by Asset Class
Oil and Natural Gas Stocks 5 7.9% 11.5% 52.8%
All U.S. Equities 2.9% 2.7% 30.7%
Foreign Equities 2.0% 6.1% 30.3%
Fixed-Income Instruments (Bonds) 6.5% 5.7% 3.9%
Real Estate Securities 1.6% 10.4% 35.2%
Commodities 0.0% 6.6% 25.9%
Distressed Debt 4.7% 9.4% 11.8%
Three-month Treasury Bills 2.0% 2.1% 0.2%
5 Once again, we use the S&P Energy Index to measure the returns of oil and natural gas company stocks. Oil and
natural gas companies comprise 98.07 percent of the Index. (See fn 3, above)
5
II. College and University Endowments: An Overview
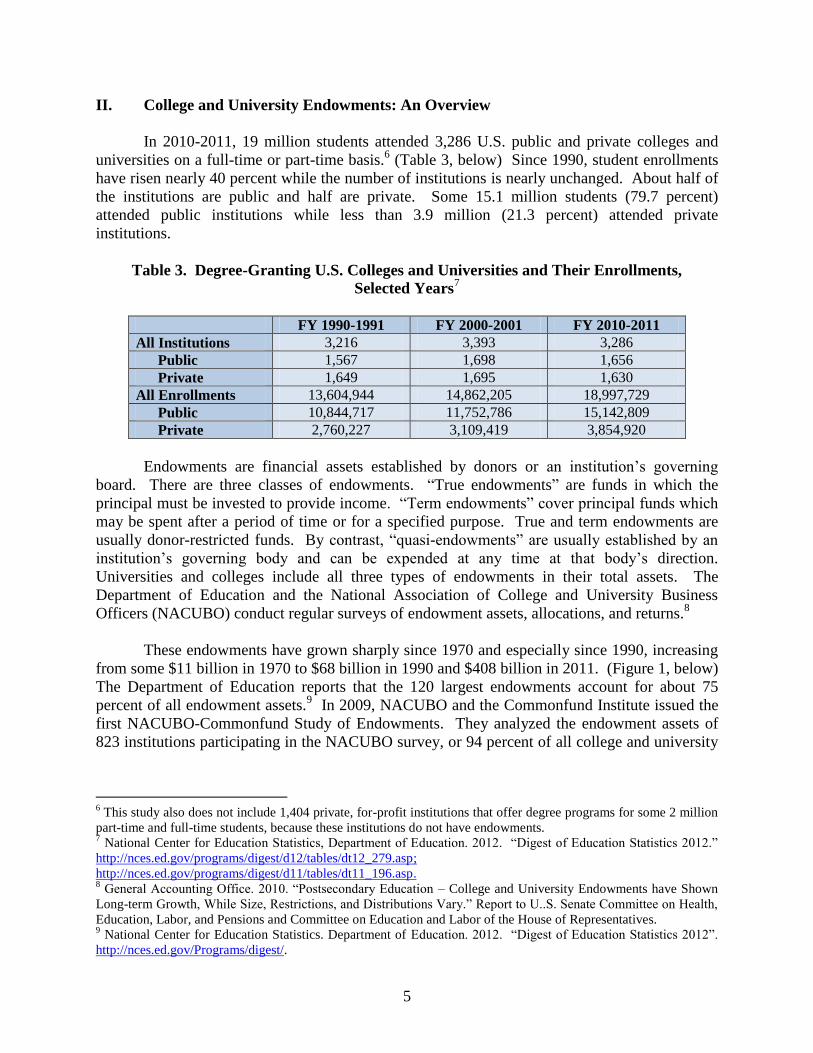
In 2010-2011, 19 million students attended 3,286 U.S. public and private colleges and
universities on a full-time or part-time basis.6 (Table 3, below) Since 1990, student enrollments
have risen nearly 40 percent while the number of institutions is nearly unchanged. About half of
the institutions are public and half are private. Some 15.1 million students (79.7 percent)
attended public institutions while less than 3.9 million (21.3 percent) attended private
institutions.
Table 3. Degree-Granting U.S. Colleges and Universities and Their Enrollments,
Selected Years7
FY 1990-1991 FY 2000-2001 FY 2010-2011
All Institutions 3,216 3,393 3,286
Public 1,567 1,698 1,656
Private 1,649 1,695 1,630
All Enrollments 13,604,944 14,862,205 18,997,729
Public 10,844,717 11,752,786 15,142,809
Private 2,760,227 3,109,419 3,854,920
Endowments are financial assets established by donors or an institution’s governing
board. There are three classes of endowments. “True endowments” are funds in which the
principal must be invested to provide income. “Term endowments” cover principal funds which
may be spent after a period of time or for a specified purpose. True and term endowments are
usually donor-restricted funds. By contrast, “quasi-endowments” are usually established by an
institution’s governing body and can be expended at any time at that body’s direction.
Universities and colleges include all three types of endowments in their total assets. The
Department of Education and the National Association of College and University Business
Officers (NACUBO) conduct regular surveys of endowment assets, allocations, and returns.8
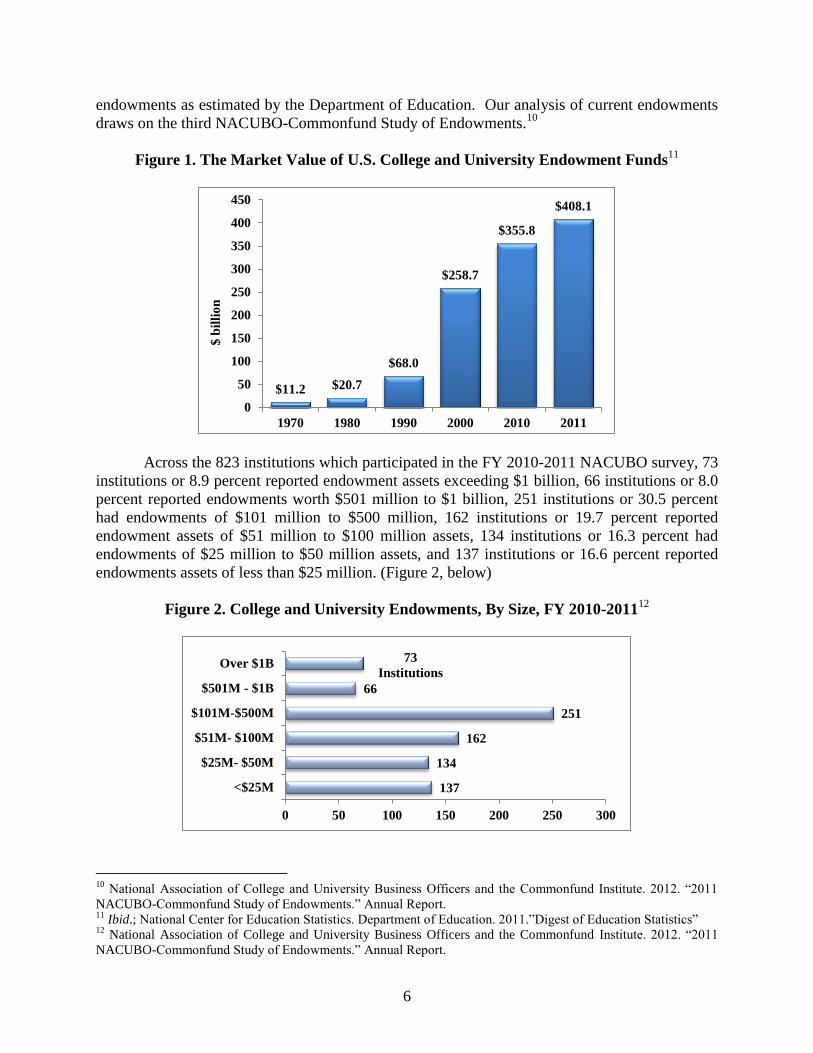
These endowments have grown sharply since 1970 and especially since 1990, increasing
from some $11 billion in 1970 to $68 billion in 1990 and $408 billion in 2011. (Figure 1, below)
The Department of Education reports that the 120 largest endowments account for about 75
percent of all endowment assets.9 In 2009, NACUBO and the Commonfund Institute issued the
first NACUBO-Commonfund Study of Endowments. They analyzed the endowment assets of
823 institutions participating in the NACUBO survey, or 94 percent of all college and university
6 This study also does not include 1,404 private, for-profit institutions that offer degree programs for some 2 million
part-time and full-time students, because these institutions do not have endowments. 7 National Center for Education Statistics, Department of Education. 2012. “Digest of Education Statistics 2012.”
http://nces.ed.gov/programs/digest/d12/tables/dt12_279.asp;
http://nces.ed.gov/programs/digest/d11/tables/dt11_196.asp. 8 General Accounting Office. 2010. “Postsecondary Education – College and University Endowments have Shown
Long-term Growth, While Size, Restrictions, and Distributions Vary.” Report to U..S. Senate Committee on Health,
Education, Labor, and Pensions and Committee on Education and Labor of the House of Representatives. 9 National Center for Education Statistics. Department of Education. 2012. “Digest of Education Statistics 2012”.
http://nces.ed.gov/Programs/digest/.
6
endowments as estimated by the Department of Education. Our analysis of current endowments
draws on the third NACUBO-Commonfund Study of Endowments.10
Figure 1. The Market Value of U.S. College and University Endowment Funds11
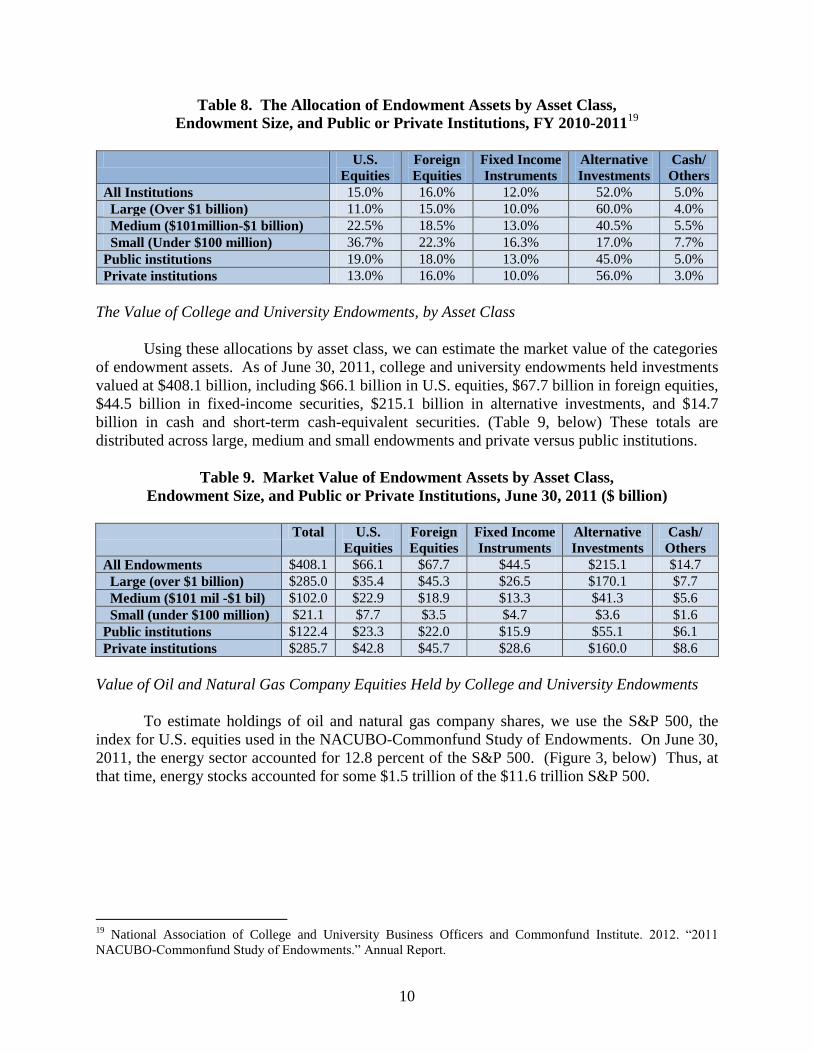
Across the 823 institutions which participated in the FY 2010-2011 NACUBO survey, 73
institutions or 8.9 percent reported endowment assets exceeding $1 billion, 66 institutions or 8.0
percent reported endowments worth $501 million to $1 billion, 251 institutions or 30.5 percent
had endowments of $101 million to $500 million, 162 institutions or 19.7 percent reported
endowment assets of $51 million to $100 million assets, 134 institutions or 16.3 percent had
endowments of $25 million to $50 million assets, and 137 institutions or 16.6 percent reported
endowments assets of less than $25 million. (Figure 2, below)
Figure 2. College and University Endowments, By Size, FY 2010-201112
10
National Association of College and University Business Officers and the Commonfund Institute. 2012. “2011
NACUBO-Commonfund Study of Endowments.” Annual Report. 11
Ibid.; National Center for Education Statistics. Department of Education. 2011.”Digest of Education Statistics” 12
National Association of College and University Business Officers and the Commonfund Institute. 2012. “2011
NACUBO-Commonfund Study of Endowments.” Annual Report.
$11.2 $20.7
$68.0
$258.7
$355.8
$408.1
0
50
100
150
200
250
300
350
400
450
1970 1980 1990 2000 2010 2011
$ b
illi
on
137
134
162
251
66
73
Institutions
0 50 100 150 200 250 300
<$25M
$25M- $50M
$51M- $100M
$101M-$500M
$501M - $1B
Over $1B

7
Over 64 percent of these endowed institutions, or 528 colleges and universities, are
private institutions, and the remaining 295 institutions or nearly 36 percent of the total are public
colleges and universities.13
This large sample includes 66 community colleges granting associate
degrees, or 8 percent of the total. In addition, 231 institutions or 28.1 percent confer only
bachelor degrees, 241 institutions or 29.3 percent of the total grant bachelor and master degrees,
and 285 institutions or 34.6 percent confer bachelor, master and doctorate degrees.14
The average market value of the endowment assets of all these institutions in FY 2010-
2011 was $495.9 million per-institution, ranging from $574,000 at Southern Virginia University
and $823,000 at Georgia Perimeter College, to $31.7 billion at Harvard University and $19.3
billion at Yale University. Seventy-three institutions reported endowment assets of more than $1
billion each. (Table 4, below) These 73 colleges and universities held a total of $285 billion in
endowment assets, an average of $3.9 billion per-institution, and accounted for 70 percent of the
combined endowment assets of all 823 institutions. Some 317 institutions had endowment assets
of $100 million to $1 billion each, averaging $321.8 million per-institution, and together held a
total of $102 billion in those assets or 25 percent of all college and university endowments. The
remaining 433 institutions with endowments of less than $100 million each, and averaging $48.8
million per-institution, held combined assets of $21.1 billion or 5 percent of all college and
university endowments.
Table 4. Distribution of College and University Endowment Assets
By Size, FY 2010-11 ($ million)15
Number of
Institutions
Share of All
Endowment
Assets
Total Value of
Endowments
Average Value
of Endowment
Per-Institution
Total Endowments 823 100.0% $408,130 $495.9
Large (Over $1 billion) 73 69.8% $285,000 $3,904.1
Medium ($100 million-$1 billion) 317 25.0% $102,000 $321.8
Small (Under $100 million) 433 5.2% $21,130 $48.8
Private colleges and universities hold most endowment assets. In FY 2010-11, the 528
private colleges and universities held a combined total of $285.7 billion in endowment assets, or
70 percent of all such endowment assets in the United States. (Table 5, below) By contrast, the
combined endowments of the 295 public colleges and universities totaled $122.4 billion, or 30
percent of all such assets. On an average per-institution basis, private and public institutions
held endowments of roughly comparable size, at an average of $541 million per-private
institution and $415 million per-public institution.
13
Ibid. 14
Ibid. 15
Ibid.

8
Table 5. Distribution of College and University Endowment Assets,
Private and Private Institutions, FY 2010-2011 ($ million)16
All Institutions Public Institutions Private Institutions
Total Endowments $408,130.0 $122,439.0 $285,691.0
Share of Total Endowment Assets 100.0% 30.0% 70.0%
Number of institutions 823 295 528
Endowment Assets Per Institution $495.9 $415.0 $541.1
As of June 30, 2011, the 10 largest college and university endowments included seven
private institutions with combined assets of $109.4 billion and three public institutions with
combined endowments of $32 billion. (Table 6, below) Harvard University had the largest
endowment with more than $31.7 billion in assets, following by Yale University with an
endowment worth nearly $19.4 billion and the University of Texas system with an endowment of
$17.1 billion. On a per-student basis, Princeton University had the largest endowment with
assets of $2,261,069 per-student, followed by Yale University at $1,671,781 per-student and
Harvard University at $1,494,845 per-student.
Table 6. Ten Largest College and University Endowments,
Total Assets and Assets Per-Student, June 30, 201117
Private or
Public
Total Endowment
($ million)
Endowment
Per-Student
Harvard University Private $31,728.1 $1,494,845
Yale University Private $19,374.0 $1,671,781
University of Texas System Public $17,148.6 $85,160
Princeton University Private $17,109.5 $2,261,069
Stanford University Private $16,502.6 $1,077,264
Massachusetts Institute of Technology Private $9,712.6 $891,558
University of Michigan Public $7,834.8 $183,415
Columbia University Private $7,789.6 $282,170
Northwestern University Private $7,182.7 $374,413
Texas A&M University System Public $6,999.5 $131,232
III. The Distribution of College and University Endowments by Asset Class
The endowments of U.S. colleges and universities are distributed across many classes of
assets. The main asset categories include U.S. equities, foreign equities, fixed income
instruments such as bonds, cash and near-cash equivalents such as Treasury bills, and alternative
investments. These alternative investments include holdings in funds operated by hedge funds,
venture capital and private equity funds, distressed debt, commodity instruments including
timber, agricultural goods and oil and natural gas, and real estate-based securities.
Over the last decade, college and university endowments have sharply reduced their
relative holdings of U.S. equities, foreign equities and fixed-income instruments, and sharply
16
Ibid. 17
Ibid. University websites.

9
increased their holdings in alternative investments. In FY 2000-2001, 50.2 percent of the assets
of college and university endowments were held in U.S. and foreign stocks, 23.4 percent in
fixed-income instruments, alternative investments accounted for 24.3 percent of endowments,
and the remaining 2.1 percent was held in cash and near-cash equivalents. (Table 7, below) By
FY 2010-2011, the share of endowments held in U.S. and foreign stocks had declined to 31
percent and the share held in fixed-income instruments had fallen to 12 percent. (Table 8, below)
In contrast, the share of those endowments held in alternative investments increased from 24.3
percent in FY 2000-2011 to 52.0 percent in FY 2010-2011.
This shift in the composition of college and university endowments has been led by
institutions with large endowments (over $1 billion), although it has occurred across institutions
with large, medium and small endowments. By FY 2010-2011, institutions with large
endowments held just 26 percent of their endowments in equities and 60 percent in alternative
investments. (Table 8, below) By contrast, colleges and universities with medium-sized
endowments ($100 million to $1 billion) still held 41 percent of their assets in equities and 40.5
percent in alternative investments; and institutions with small endowments held 59.0 percent of
their assets in equities and just 17.0 percent in alternative investments. Finally, this shift is
evident across private and public institutions, with private institutions relying on alternative
investment to a greater extent. In FY 2000-2001, private colleges and universities held 57.3
percent of their endowments in equities and 11.5 percent in alternative investments, and public
institutions held 57.2 percent of their endowments in equities and 8.0 percent in alternative
investments. (Table 7, below) By FY 2010-2011, private college and university endowments
held 29.0 percent of their assets in equities and 56.0 percent in alternative investments, and
public institutions held 37.0 percent in equities and 45.0 percent in alternative investments.
Table 7. The Allocation of Endowment Assets by Asset Class,
Endowment Size, and Public or Private Institutions, FY 2000-200118
U.S. and Foreign
Equities
Fixed Income
Instruments
Alternative
Investments
Cash/
Others
All institutions 50.2% 23.4% 24.3% 2.1%
Large ($1 billion +) 45.1% 20.5% 32.0% 2.4%
Medium ($101 million-$1 billion) 56.7% 22.4% 18.2% 2.8%
Small (Under $100 million) 58.7% 29.1% 6.4% 5.8%
Public institutions 57.2% 29.1% 8.0% 5.7%
Private institutions 57.3% 25.7% 11.5% 5.5%
18
National Association of College and University Business Officers and the Commonfund Institute. 2002. “Asset
Allocation by Asset Class” 2002 NACUBO Endowment Study Information.
10
Table 8. The Allocation of Endowment Assets by Asset Class,
Endowment Size, and Public or Private Institutions, FY 2010-201119
U.S.
Equities
Foreign
Equities
Fixed Income
Instruments
Alternative
Investments
Cash/
Others
All Institutions 15.0% 16.0% 12.0% 52.0% 5.0%
Large (Over $1 billion) 11.0% 15.0% 10.0% 60.0% 4.0%
Medium ($101million-$1 billion) 22.5% 18.5% 13.0% 40.5% 5.5%
Small (Under $100 million) 36.7% 22.3% 16.3% 17.0% 7.7%
Public institutions 19.0% 18.0% 13.0% 45.0% 5.0%
Private institutions 13.0% 16.0% 10.0% 56.0% 3.0%
The Value of College and University Endowments, by Asset Class
Using these allocations by asset class, we can estimate the market value of the categories
of endowment assets. As of June 30, 2011, college and university endowments held investments
valued at $408.1 billion, including $66.1 billion in U.S. equities, $67.7 billion in foreign equities,
$44.5 billion in fixed-income securities, $215.1 billion in alternative investments, and $14.7
billion in cash and short-term cash-equivalent securities. (Table 9, below) These totals are
distributed across large, medium and small endowments and private versus public institutions.
Table 9. Market Value of Endowment Assets by Asset Class,
Endowment Size, and Public or Private Institutions, June 30, 2011 ($ billion)
Total U.S.
Equities
Foreign
Equities
Fixed Income
Instruments
Alternative
Investments
Cash/
Others
All Endowments $408.1 $66.1 $67.7 $44.5 $215.1 $14.7
Large (over $1 billion) $285.0 $35.4 $45.3 $26.5 $170.1 $7.7
Medium ($101 mil -$1 bil) $102.0 $22.9 $18.9 $13.3 $41.3 $5.6
Small (under $100 million) $21.1 $7.7 $3.5 $4.7 $3.6 $1.6
Public institutions $122.4 $23.3 $22.0 $15.9 $55.1 $6.1
Private institutions $285.7 $42.8 $45.7 $28.6 $160.0 $8.6
Value of Oil and Natural Gas Company Equities Held by College and University Endowments
To estimate holdings of oil and natural gas company shares, we use the S&P 500, the
index for U.S. equities used in the NACUBO-Commonfund Study of Endowments. On June 30,
2011, the energy sector accounted for 12.8 percent of the S&P 500. (Figure 3, below) Thus, at
that time, energy stocks accounted for some $1.5 trillion of the $11.6 trillion S&P 500.
19
National Association of College and University Business Officers and Commonfund Institute. 2012. “2011
NACUBO-Commonfund Study of Endowments.” Annual Report.

11
Figure 3. S&P’s 500 Sector Breakdown, as of June 201120
Using this distribution, college and university endowments held $8.45 billion in oil and
natural gas company stocks on June 30, 2011, or 12.8 percent of an estimated $66.1 billion in
U.S. equity investments and 2.1 percent of $408.1 billion in total endowment assets. (Table 10,
below) Large endowments held more than $4.5 billion in oil and natural gas company stocks,
medium-size endowments held $2.9 billion in those stocks, and small endowments held less than
$1 billion in those shares. As a share of endowment assets, large and medium-sized endowments
held 1.6 percent of their total holdings in oil and natural gas company stocks, while those shares
accounted for 2.9 percent of small endowments. Public colleges and universities held nearly
$3.0 billion in oil and natural gas company shares, or 2.4 percent of their endowments; and
private institutions held nearly $5.5 billion in those shares or 1.9 percent of their total holdings.
Table 10. Oil and Natural Gas Company Holdings
By College and University Endowments, June 30, 2011 ($ billions)
Oil and Natural
Gas Company
Holdings
Total
Endowment
Assets
Oil and Natural Gas
Company Holdings as a
Share of Endowments
All Endowments $8.45 $408.1 2.1%
Large (over $1 billion) $4.52 $285.0 1.6%
Medium ($101 million -$1 billion) $2.93 $102.0 2.9%
Small (under $100 million) $0.99 $21.1 4.7%
Public institutions $2.97 $122.4 2.4%
Private institutions $5.48 $285.7 1.9%
20
Standard & Poor’s, S&P Dow Jones Indices Benchmark, Research, Data and Analytics,
http://www.standardandpoors.com/indices/sp-500/en/us/?indexId=spusa-500-usduf--p-us-l--
Oil and Natural Gas
12.8%
Materials 3.6%
Industrials 11.0%
Consumer Discretionary
10.5% Consumer Staples 10.9%
Healthcare 11.9%
Financials 15.1%
Information Technology
17.7%
Telecom Services
3.1%
Utilities 3.4%
12
IV. The Returns on Investments by College and University Endowments by Asset Class
Analysis of the returns by the various assets held by college and university endowments
shows that over the most recent periods of one year (FY 2010-2011), five years (FY 2006-2011)
and ten years (FY 2001-2011), oil and natural gas company stock achieved substantially higher
returns than all U.S. equities, the foreign equities, fixed-income instruments, alternative
investments or cash and near-cash equivalents held by those endowments.
Returns on College and University Endowments, the S&P 500, and Oil and Natural Gas Shares
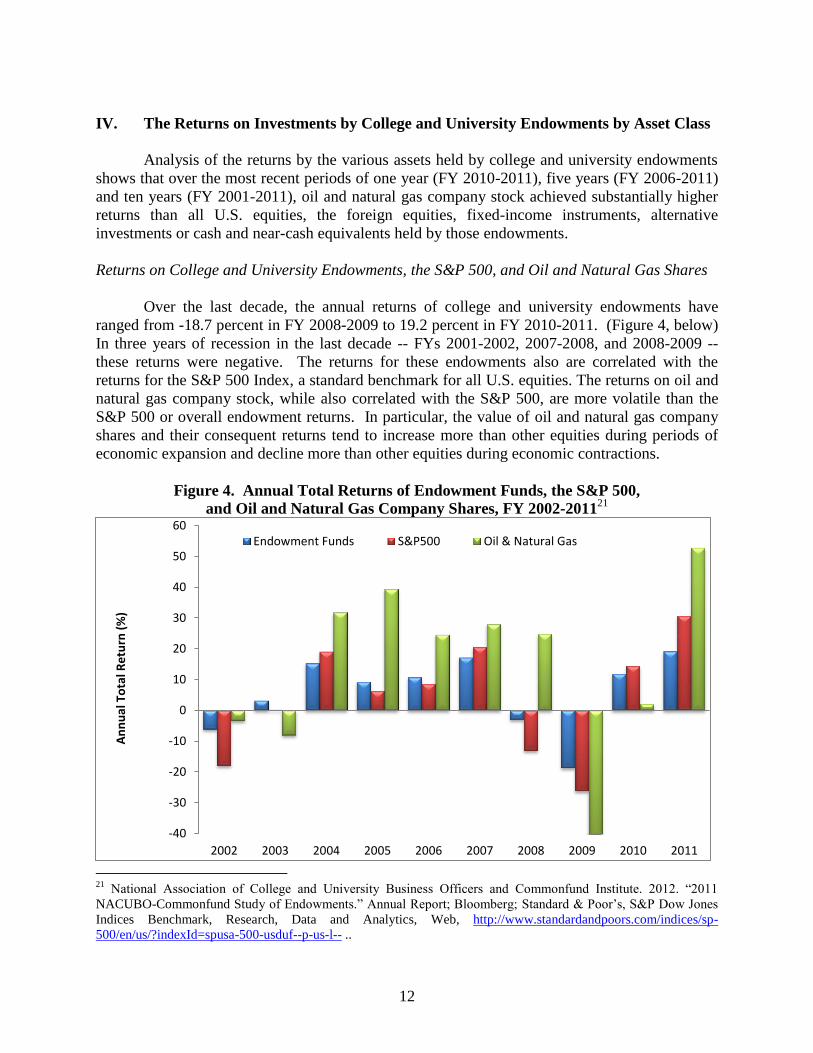
Over the last decade, the annual returns of college and university endowments have
ranged from -18.7 percent in FY 2008-2009 to 19.2 percent in FY 2010-2011. (Figure 4, below)
In three years of recession in the last decade -- FYs 2001-2002, 2007-2008, and 2008-2009 --
these returns were negative. The returns for these endowments also are correlated with the
returns for the S&P 500 Index, a standard benchmark for all U.S. equities. The returns on oil and
natural gas company stock, while also correlated with the S&P 500, are more volatile than the
S&P 500 or overall endowment returns. In particular, the value of oil and natural gas company
shares and their consequent returns tend to increase more than other equities during periods of
economic expansion and decline more than other equities during economic contractions.
Figure 4. Annual Total Returns of Endowment Funds, the S&P 500,
and Oil and Natural Gas Company Shares, FY 2002-201121
21
National Association of College and University Business Officers and Commonfund Institute. 2012. “2011
NACUBO-Commonfund Study of Endowments.” Annual Report; Bloomberg; Standard & Poor’s, S&P Dow Jones
Indices Benchmark, Research, Data and Analytics, Web, http://www.standardandpoors.com/indices/sp-
500/en/us/?indexId=spusa-500-usduf--p-us-l-- ..
-40
-30
-20
-10
0
10
20
30
40
50
60
2002 2003 2004 2005 2006 2007 2008 2009 2010 2011
An
nu
al T
ota
l Re
turn
(%
)
Endowment Funds S&P500 Oil & Natural Gas
13
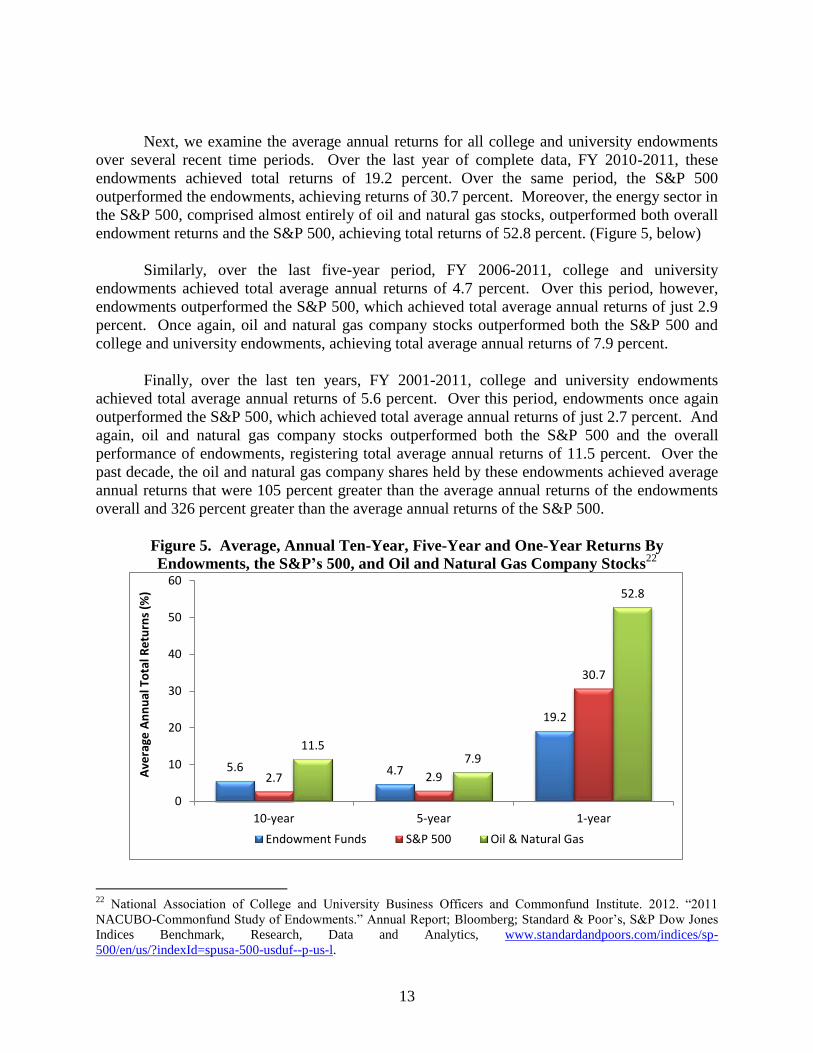
Next, we examine the average annual returns for all college and university endowments
over several recent time periods. Over the last year of complete data, FY 2010-2011, these
endowments achieved total returns of 19.2 percent. Over the same period, the S&P 500
outperformed the endowments, achieving returns of 30.7 percent. Moreover, the energy sector in
the S&P 500, comprised almost entirely of oil and natural gas stocks, outperformed both overall
endowment returns and the S&P 500, achieving total returns of 52.8 percent. (Figure 5, below)
Similarly, over the last five-year period, FY 2006-2011, college and university
endowments achieved total average annual returns of 4.7 percent. Over this period, however,
endowments outperformed the S&P 500, which achieved total average annual returns of just 2.9
percent. Once again, oil and natural gas company stocks outperformed both the S&P 500 and
college and university endowments, achieving total average annual returns of 7.9 percent.
Finally, over the last ten years, FY 2001-2011, college and university endowments
achieved total average annual returns of 5.6 percent. Over this period, endowments once again
outperformed the S&P 500, which achieved total average annual returns of just 2.7 percent. And
again, oil and natural gas company stocks outperformed both the S&P 500 and the overall
performance of endowments, registering total average annual returns of 11.5 percent. Over the
past decade, the oil and natural gas company shares held by these endowments achieved average
annual returns that were 105 percent greater than the average annual returns of the endowments
overall and 326 percent greater than the average annual returns of the S&P 500.
Figure 5. Average, Annual Ten-Year, Five-Year and One-Year Returns By
Endowments, the S&P’s 500, and Oil and Natural Gas Company Stocks22
22
National Association of College and University Business Officers and Commonfund Institute. 2012. “2011
NACUBO-Commonfund Study of Endowments.” Annual Report; Bloomberg; Standard & Poor’s, S&P Dow Jones
Indices Benchmark, Research, Data and Analytics, www.standardandpoors.com/indices/sp-
500/en/us/?indexId=spusa-500-usduf--p-us-l.
5.6 4.7
19.2
2.7 2.9
30.7
11.5 7.9
52.8
0
10
20
30
40
50
60
10-year 5-year 1-year
Ave
rage
An
nu
al T
ota
l Re
turn
s (%
)
Endowment Funds S&P 500 Oil & Natural Gas
14
Investment Returns of College and University Endowments, By Asset Class
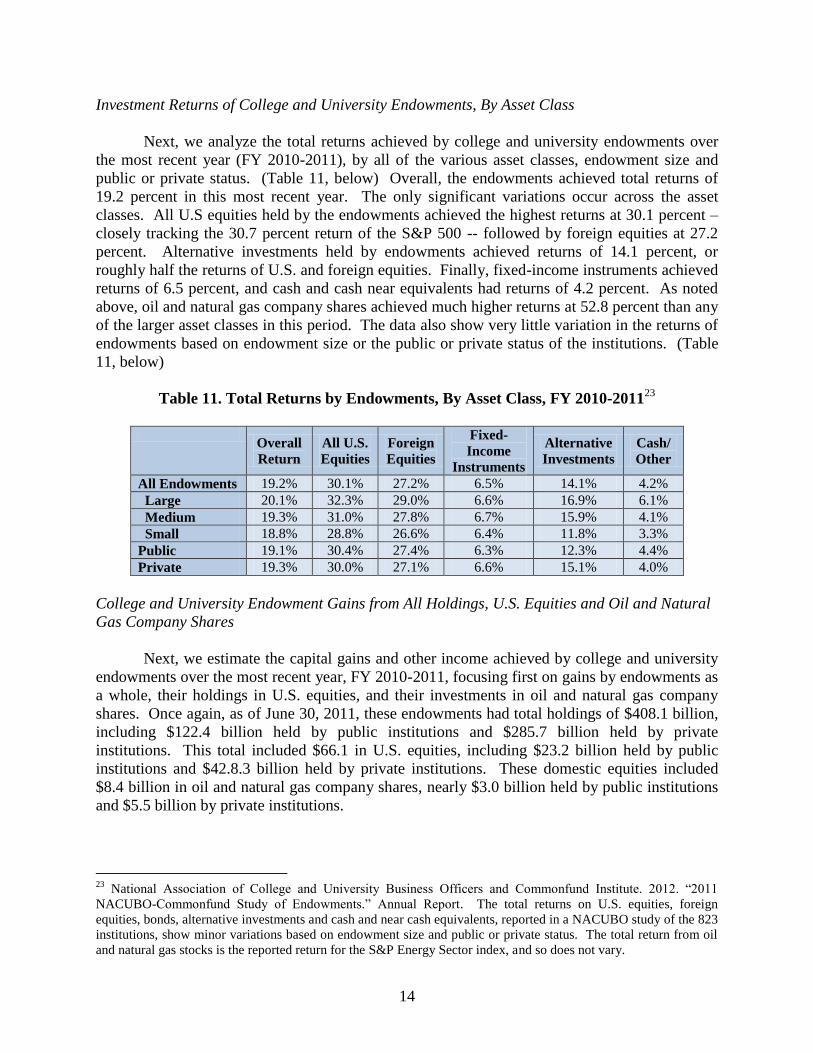
Next, we analyze the total returns achieved by college and university endowments over
the most recent year (FY 2010-2011), by all of the various asset classes, endowment size and
public or private status. (Table 11, below) Overall, the endowments achieved total returns of
19.2 percent in this most recent year. The only significant variations occur across the asset
classes. All U.S equities held by the endowments achieved the highest returns at 30.1 percent –
closely tracking the 30.7 percent return of the S&P 500 -- followed by foreign equities at 27.2
percent. Alternative investments held by endowments achieved returns of 14.1 percent, or
roughly half the returns of U.S. and foreign equities. Finally, fixed-income instruments achieved
returns of 6.5 percent, and cash and cash near equivalents had returns of 4.2 percent. As noted
above, oil and natural gas company shares achieved much higher returns at 52.8 percent than any
of the larger asset classes in this period. The data also show very little variation in the returns of
endowments based on endowment size or the public or private status of the institutions. (Table
11, below)
Table 11. Total Returns by Endowments, By Asset Class, FY 2010-201123
Overall
Return
All U.S.
Equities
Foreign
Equities
Fixed-
Income
Instruments
Alternative
Investments
Cash/
Other
All Endowments 19.2% 30.1% 27.2% 6.5% 14.1% 4.2%
Large 20.1% 32.3% 29.0% 6.6% 16.9% 6.1%
Medium 19.3% 31.0% 27.8% 6.7% 15.9% 4.1%
Small 18.8% 28.8% 26.6% 6.4% 11.8% 3.3%
Public 19.1% 30.4% 27.4% 6.3% 12.3% 4.4%
Private 19.3% 30.0% 27.1% 6.6% 15.1% 4.0%
College and University Endowment Gains from All Holdings, U.S. Equities and Oil and Natural
Gas Company Shares
Next, we estimate the capital gains and other income achieved by college and university
endowments over the most recent year, FY 2010-2011, focusing first on gains by endowments as
a whole, their holdings in U.S. equities, and their investments in oil and natural gas company
shares. Once again, as of June 30, 2011, these endowments had total holdings of $408.1 billion,
including $122.4 billion held by public institutions and $285.7 billion held by private
institutions. This total included $66.1 in U.S. equities, including $23.2 billion held by public
institutions and $42.8.3 billion held by private institutions. These domestic equities included
$8.4 billion in oil and natural gas company shares, nearly $3.0 billion held by public institutions
and $5.5 billion by private institutions.
23
National Association of College and University Business Officers and Commonfund Institute. 2012. “2011
NACUBO-Commonfund Study of Endowments.” Annual Report. The total returns on U.S. equities, foreign
equities, bonds, alternative investments and cash and near cash equivalents, reported in a NACUBO study of the 823
institutions, show minor variations based on endowment size and public or private status. The total return from oil
and natural gas stocks is the reported return for the S&P Energy Sector index, and so does not vary.
15
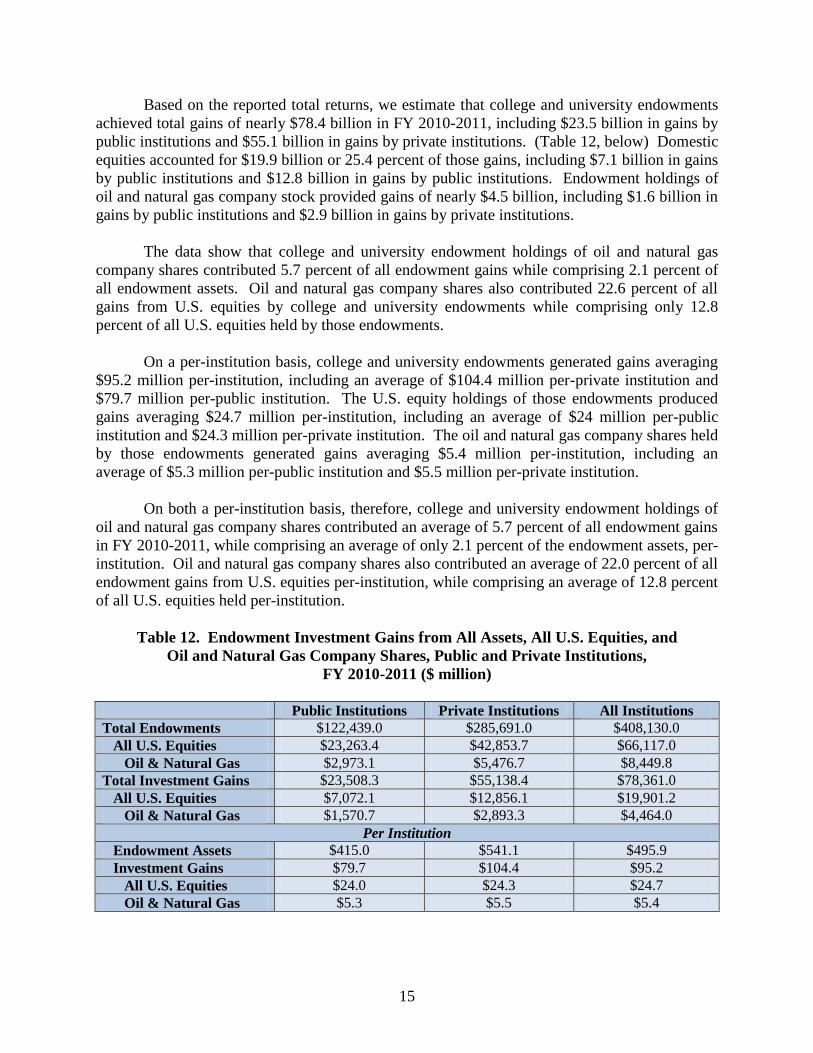
Based on the reported total returns, we estimate that college and university endowments
achieved total gains of nearly $78.4 billion in FY 2010-2011, including $23.5 billion in gains by
public institutions and $55.1 billion in gains by private institutions. (Table 12, below) Domestic
equities accounted for $19.9 billion or 25.4 percent of those gains, including $7.1 billion in gains
by public institutions and $12.8 billion in gains by public institutions. Endowment holdings of
oil and natural gas company stock provided gains of nearly $4.5 billion, including $1.6 billion in
gains by public institutions and $2.9 billion in gains by private institutions.
The data show that college and university endowment holdings of oil and natural gas
company shares contributed 5.7 percent of all endowment gains while comprising 2.1 percent of
all endowment assets. Oil and natural gas company shares also contributed 22.6 percent of all
gains from U.S. equities by college and university endowments while comprising only 12.8
percent of all U.S. equities held by those endowments.
On a per-institution basis, college and university endowments generated gains averaging
$95.2 million per-institution, including an average of $104.4 million per-private institution and
$79.7 million per-public institution. The U.S. equity holdings of those endowments produced
gains averaging $24.7 million per-institution, including an average of $24 million per-public
institution and $24.3 million per-private institution. The oil and natural gas company shares held
by those endowments generated gains averaging $5.4 million per-institution, including an
average of $5.3 million per-public institution and $5.5 million per-private institution.
On both a per-institution basis, therefore, college and university endowment holdings of
oil and natural gas company shares contributed an average of 5.7 percent of all endowment gains
in FY 2010-2011, while comprising an average of only 2.1 percent of the endowment assets, per-
institution. Oil and natural gas company shares also contributed an average of 22.0 percent of all
endowment gains from U.S. equities per-institution, while comprising an average of 12.8 percent
of all U.S. equities held per-institution.
Table 12. Endowment Investment Gains from All Assets, All U.S. Equities, and
Oil and Natural Gas Company Shares, Public and Private Institutions,
FY 2010-2011 ($ million)
Public Institutions Private Institutions All Institutions
Total Endowments $122,439.0 $285,691.0 $408,130.0
All U.S. Equities $23,263.4 $42,853.7 $66,117.0
Oil & Natural Gas $2,973.1 $5,476.7 $8,449.8
Total Investment Gains $23,508.3 $55,138.4 $78,361.0
All U.S. Equities $7,072.1 $12,856.1 $19,901.2
Oil & Natural Gas $1,570.7 $2,893.3 $4,464.0
Per Institution
Endowment Assets $415.0 $541.1 $495.9
Investment Gains $79.7 $104.4 $95.2
All U.S. Equities $24.0 $24.3 $24.7
Oil & Natural Gas $5.3 $5.5 $5.4
16
The Returns on College and University Holdings of Oil and Natural Gas Company Shares,
Compared to Other Endowment Assets, Over the Most Recent One-Year, Five-Year and Ten-
Year Periods
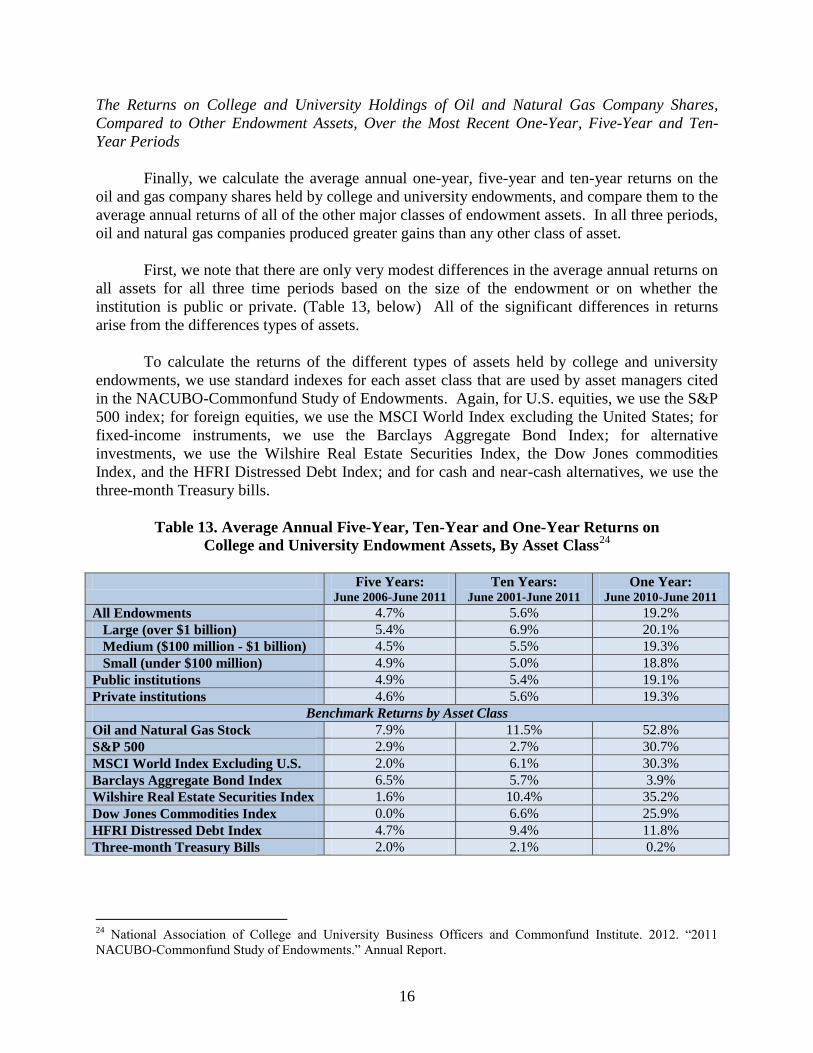
Finally, we calculate the average annual one-year, five-year and ten-year returns on the
oil and gas company shares held by college and university endowments, and compare them to the
average annual returns of all of the other major classes of endowment assets. In all three periods,
oil and natural gas companies produced greater gains than any other class of asset.
First, we note that there are only very modest differences in the average annual returns on
all assets for all three time periods based on the size of the endowment or on whether the
institution is public or private. (Table 13, below) All of the significant differences in returns
arise from the differences types of assets.
To calculate the returns of the different types of assets held by college and university
endowments, we use standard indexes for each asset class that are used by asset managers cited
in the NACUBO-Commonfund Study of Endowments. Again, for U.S. equities, we use the S&P
500 index; for foreign equities, we use the MSCI World Index excluding the United States; for
fixed-income instruments, we use the Barclays Aggregate Bond Index; for alternative
investments, we use the Wilshire Real Estate Securities Index, the Dow Jones commodities
Index, and the HFRI Distressed Debt Index; and for cash and near-cash alternatives, we use the
three-month Treasury bills.
Table 13. Average Annual Five-Year, Ten-Year and One-Year Returns on
College and University Endowment Assets, By Asset Class24
Five Years:
June 2006-June 2011
Ten Years: June 2001-June 2011
One Year: June 2010-June 2011
All Endowments 4.7% 5.6% 19.2%
Large (over $1 billion) 5.4% 6.9% 20.1%
Medium ($100 million - $1 billion) 4.5% 5.5% 19.3%
Small (under $100 million) 4.9% 5.0% 18.8%
Public institutions 4.9% 5.4% 19.1%
Private institutions 4.6% 5.6% 19.3%
Benchmark Returns by Asset Class
Oil and Natural Gas Stock 7.9% 11.5% 52.8%
S&P 500 2.9% 2.7% 30.7%
MSCI World Index Excluding U.S. 2.0% 6.1% 30.3%
Barclays Aggregate Bond Index 6.5% 5.7% 3.9%
Wilshire Real Estate Securities Index 1.6% 10.4% 35.2%
Dow Jones Commodities Index 0.0% 6.6% 25.9%
HFRI Distressed Debt Index 4.7% 9.4% 11.8%
Three-month Treasury Bills 2.0% 2.1% 0.2%
24
National Association of College and University Business Officers and Commonfund Institute. 2012. “2011
NACUBO-Commonfund Study of Endowments.” Annual Report.
17
The data show that over the most recent year (June 30, 2010-June 30, 2011), the oil and
natural gas company stocks held in college and university endowments achieved estimated
returns of 52.8 percent. (Table 13, above) These returns far exceeded those of the endowments’
other assets classes, including a 30.7 percent return on all U.S. equities, the 30.3 percent return
on foreign equities, and “alternative investment” returns of 35.2 percent return for real estate
securities and 25.9 percent return for commodities. Overall, the one-year returns on the oil and
natural gas company assets held by endowments were 2.75 times the 19.2 percent one-year
average return on all endowment assets.
One-year returns can be volatile. However, our analysis finds the same pattern on
relative returns by asset class for the most recent five-year and ten-year periods. Over the most
recent five years (June 30, 2006-June 30, 2011), the oil and natural gas company shares in
college and university endowments recorded estimated, average annual returns of 7.9 percent.
Over this period, these returns also exceeded those of other well-performing asset classes,
including the 6.5 percent average annual five-year return on fixed-income instruments and the
4.7 percent average annual five-year return on distressed debt. (Table 13, above) Over this
period, oil and natural gas company shares also far outperformed the 2.9 percent average annual
five-year return for all U.S. stocks overall and a 2.0 percent average annual five-year return for
foreign equities. Overall, the 7.9 percent average annual five-year returns on the oil and natural
gas company assets held by college and university endowments were 68 percent greater than the
4.7 percent average annual five-year returns on all endowment assets.
Finally, over the most recent ten-year period (June 20, 2001-June 30. 2011), the oil and
natural gas company stocks held by college and university endowments achieved estimated
returns of average annual ten-year returns of 11.5 percent. (Table 13, above) Once again, these
returns exceeded those of every other asset class held by those endowments, including in this
instance the 10.4 percent average annual ten-year return on real estate securities and a 9.4
percent average annual ten-year return on distressed debt. Over this period, oil and natural gas
company shares also far outperformed the 2.7 percent average annual ten-year return for all U.S.
stocks, a 6.1 percent average annual ten-year return on foreign equities, and the 5.7 percent
average annual ten-year return on bonds (fixed-income instruments). Overall, the 11.5 percent
average annual ten-year returns on the oil and natural gas company assets held by college and
university endowments were 105 percent higher than the 5.6 percent average annual ten-year
returns on all endowment assets.
V. Conclusion
This study has analyzed the composition and performance of the endowment assets of
American colleges and universities. These educational endowments vary substantially in size
and in the public and private status of the institutions. In addition, the composition of these
endowments, in terms of their asset holdings, varies somewhat by size. Consequently, the
returns generated by these endowments also vary somewhat by size. Overall, the most
significant factor affecting the performance of these endowments is their asset allocation and the
financial performances of these asset classes.
18
We tracked the returns of the major asset classes held by college and university
endowments over the most recent available year (FY 2010-2011), the most recent five-year
period (FY 2006-2011) and the most recent ten-year period (FY 2001-2011). To estimate these
returns, we used standard indexes for the major classes of assets, including U.S. equities, foreign
equities, fixed-income instruments, cash and near-cash equivalents (three-month Treasury bills),
and several categories of alternative investments including real estate securities, distressed debt,
and commodity instruments.
We found that depending on the period, different classes of assets produced relatively
higher returns for college and university endowments. Over the most recent year, real estate
securities, U.S. equities and foreign equities substantially outperformed fixed-income
instruments (bonds), distressed debt and cash and Treasury bills. By contrast, over the most
recent five-year period, fixed-income securities and distressed debt far outperformed U.S.
equities, foreign equities and real estate securities. And over the most recent ten-year period,
real estate securities, distressed debt, commodities and foreign equities far outperformed U.S.
equities, fixed income instruments, and Treasury bills.
Our analysis of the returns on college and university endowment assets also revealed one
constant element: Over all three periods, shares of oil and natural gas companies far
outperformed both the overall performance of these endowments and every other asset class
examined here.
Over the most recent year (FY 2010-2011), oil and natural gas company shares generated
returns of 52.8 percent, compared to 19.2 percent for endowments overall and 30.7 percent for
all U.S. equities, the highest-performing broad class of assets in that year. Over the most recent
five-year period (FY 2006-2011), oil and natural gas company shares produced average annual
returns of 7.9 percent, compared to a 4.7 percent average annual return for college and university
endowments overall and 6.5 percent annual returns for fixed-income instruments, the highest-
performing broad class of assets over the same five years. Finally, over the most recent ten-year
period (FY 2001-2011), oil and natural gas company stock generated average annual gains of
11.5 percent for college and university endowments, compared to a 5.6 percent average annual
return for the endowments overall and 10.4 percent annual returns for real estate securities, the
highest-performing broad class of assets over the same ten years.
We conclude that for at least the last decade, investments by college and university
endowments in oil and natural gas company shares have produced the highest consistent returns
for those endowments.
19
References
Bloomberg Service, historical data from the MSCI World Index excluding U.S.; Barclay Bond
Index; Wilshire Real Estate Securities Index, Dow Jones Commodities Index, and HFRI
Distressed Debt Index.
Department of Education. 2012. National Center for Education Statistics. “Digest of Education
Statistics 2012.”
__________. 2011. National Center for Education Statistics. “Digest of Education Statistics
2011.”
General Accounting Office. 2010. “Postsecondary Education – College and University
Endowments have Shown Long-term Growth, While Size, Restrictions, and Distributions Vary.”
Report to U.S. Senate Committee on Health, Education, Labor, and Pensions and the Committee
on Education and Labor of the House of Representatives.
Gravelle, Jane G. 2007. “Tax Issues and University Endowments.” Memorandum, Congressional
Research Service.
National Association of College and University Business Officers and Commonfund Institute.
2012. “2011 NACUBO-Commonfund Study of Endowments.” Annual Report.
__________. 2002. “2002 NACUBO Endowment Study Information.”
www.nacubo.org/Research/NACUBO-
Commonfund_Study_of_Endowments/Public_NCSE_Tables.html.
Standard & Poor’s, S&P Dow Jones Indices Benchmark, Research, Data and Analytics, Web.
http://www.standardandpoors.com/indices/sp-500/en/us/?indexId=spusa-500-usduf--p-us-l--
20
About the Authors
Robert J. Shapiro is the chairman of Sonecon, LLC, a private firm that provides advice, analysis
and support to senior officials of the U.S. and foreign governments, senior executives of U.S. and
foreign firms, and directors and managers of non-profit organizations. He is an internationally-
known economist who has advised, among others, President Bill Clinton, Vice President Al
Gore, Jr., British Prime Ministers Tony Blair and Gordon Brown, and U.S. Senators Barack
Obama and Hillary Clinton, as well as senior management at numerous Fortune 100 companies.
Currently, he is also a Senior Policy Fellow of the Georgetown University McDonough School
of Business, an advisor to the International Monetary Fund, chairman of the U.S. Climate Task
Force, director of the Globalization Initiative at NDN, and a member of the advisory board of
Gilead Sciences. Prior to establishing Sonecon, Dr. Shapiro was Under Secretary of Commerce
for Economic Affairs from 1998 to 2001. Prior to that post, he was co-founder and Vice
President of the Progressive Policy Institute and before that, Legislative Director and Economic
Counsel for Senator Daniel Patrick Moynihan. He also was the principal economic advisor to
Bill Clinton in his 1991-1992 campaign and a senior economic advisor to Vice President Gore
and Senator John Kerry in their presidential campaigns. In 2008, he advised the campaign and
presidential transition of Barack Obama. Dr. Shapiro has been a Fellow of Harvard University,
the Brookings Institution, and the National Bureau of Economic Research. He holds a Ph.D. and
M.A. from Harvard University, a M.Sc. from the London School of Economics and Political
Science, and an A.B. from the University of Chicago.
Nam D. Pham is the founder and president of NDP Group, LLC, an economics consulting firm
that specializes in assessing complex issues in finance, trade, and industry development, and a
senior affiliate of Sonecon, LLC. Clients of NDP Group include U.S. and foreign corporations,
financial institutions, federal and local governments, trade associations and multinational
organizations. Prior to founding NDP Group in 2000, Dr. Pham was Vice President at Scudder
Kemper Investments in Boston, where he was responsible for research, asset allocations and
currency hedges for Scudder's global and international bond funds. Before that he was Chief
Economist of the Asia Region for Standard & Poor's DRI in Boston. Dr. Pham also has advised
numerous multilateral institutions and government agencies in Washington D.C. These activities
include time as an economist at the World Bank as well as consultant to the Department of
Commerce and the Federal Trade Commission. In addition, Dr. Pham has been an adjunct
professor at the George Washington University, where he has taught courses in monetary
economics, international finance and trade, monetary economics, macroeconomics and
microeconomics. Dr. Pham earned his Ph.D. in economics from George Washington University
with concentrations in international finance and trade, economic development and applied
microeconomics, a M.A. from Georgetown University, and a B.A. from the University of
Maryland.
Related Documents


