Tana Sub-basin Land Use Planning and Environmental Study Project BoEPLAU Watershed Management Draft Final Report ADSWE i The Federal Democratic Republic of Ethiopia Amhara National Regional State Bureau of Environmental Protection, Land Administration and Use (BoEPLAU) Tana Sub-basin Land Use Planning and Environmental Study Project Technical Report: Watershed Management Study Draft Final (ADSWE, LUPESP /TaSB: Section II/Volume 07/2015) February 2015 Bahir Dar Client: Bureau of Environmental Protection, Land Administration and Use (BoEPLAU) Address: P.O.Box: 145 Telephone: +251-582-265458 Fax: (058) 2265479 E-mail:Amhara [email protected] Consultant: Amhara Design & Supervision Works Enterprise (ADSWE) Address: P.O.Box: 1921 Telephone: +251-582-181023/ 180638/181201/181254 Fax: (058) 2180550/0560 E-mail:amhara [email protected]

Welcome message from author
This document is posted to help you gain knowledge. Please leave a comment to let me know what you think about it! Share it to your friends and learn new things together.
Transcript

Tana Sub-basin Land Use Planning and Environmental Study Project
BoEPLAU Watershed Management Draft Final Report ADSWE i
The Federal Democratic Republic of Ethiopia
Amhara National Regional State
Bureau of Environmental Protection, Land Administration and Use
(BoEPLAU)
Tana Sub-basin Land Use Planning and Environmental Study Project
Technical Report: Watershed Management Study Draft Final
(ADSWE, LUPESP /TaSB: Section II/Volume 07/2015)
February 2015
Bahir Dar
Client:Bureau of Environmental Protection, Land Administration and Use (BoEPLAU)
Address:
P.O.Box: 145
Telephone: +251-582-265458
Fax: (058) 2265479
E-mail:Amhara [email protected]
Consultant: Amhara Design & Supervision Works Enterprise (ADSWE)
Address:
P.O.Box: 1921
Telephone: +251-582-181023/ 180638/181201/181254
Fax: (058) 2180550/0560
E-mail:amhara [email protected]

Tana Sub-basin Land Use Planning and Environmental Study Project
BoEPLAU Watershed Management Study DraftFinal Report ADSWE ii
LIST OF REPORTS
Section I: MAIN REPORT
Section II: SECTOR STUDIES
Volume I: Soil Survey
Volume II: Forest and Wildlife Assessment
Volume III: Hydrology and Water Resource Assessment
Volume IV: Land Use and Land Cover
Volume V: Agro Climatic Assessment
Volume VI: Crop Resource Assessment
Volume VII: Watershed Management
Volume VIII: Livestock Production and Feed Resource
Assessment
Volume IX: Human Health Assessment
Volume X Animal Health Assessment
Volume XI: Fish and Wetland Assessment
Volume XII: Sociologic Assessment
Volume XIII: Economic Study
Volume XIV: Tourism Assessment
Section III PLANNING
Volume I Approaches, Procedures and Methods
Volume II Land Utilization Types Description and their
Environmental Requirements Setting
Volume III Planning Units Description
Volume IV Land Suitability Evaluation
Volume V Land Use Plan
Volume VI Management plan
Volume VII Implementation Guideline
SECTION IV ANNEXES
Maps albums and data base

Tana Sub-basin Land Use Planning and Environmental Study Project
BoEPLAU Watershed Management Study DraftFinal Report ADSWE iii
EXECUTIVE SUMMARY
Watershed is any surface area from which runoff resulting from rainfall collected and drained through a
common confluence point. Now a day‟s watershed degradation is a serious problem in the developing
country like Ethiopia. Land degradation is the decline in land quality and the results of complex
interactions between physical, chemical, biological, socioeconomics and political issues of local, national,
or global nature. Some of the causes of degradation are natural hazards, population growth, expansion of
agricultural lands forests and marginal lands, poverty, land ownership problems, political instability,
administration problems and inappropriate agricultural practice.
Tanasub basin is part of Amhara Regional State affected by the different types of land degradation such as;
water erosion and flooding are the main problem in the study area. The objective of watershed
management study is to identify and understand ecological and socio economic problems in the basin and
prepare watershed intervention plan that enable sustainable management and use of resources.
The sub basin includes about 29 rural woredas and three-townworeda of the region. The sub basin has a
total area of 1,579,096.94 hectares. It is one of the most important potential areas for all development in
Amhara region.Tana sub basin categorized under four major watersheds, namely Megech, Rib, Gumara
and Gilgel Abay.The major type of land use/cover are cultivated land, forest, shrubs and Bush land,
grassland, wetland, water bodies, afro alpine and built up areas. The method followed for this study is
collection of primary and secondary data at field level. The study approaches and procedures followed
different stages of the study include pre-field work, fieldwork, and post fieldwork activities.
Land degradation assessment is one of land resources assessment conducted on qualitative& quantitative
indicators. The soil lossmap developed on Arc GIS environment by using RUSLE parameters as an input
to assess average annual soil loss rate of the area.Based on the analysis,2833.06 ton/ha/year total amount
of soil loss in the sub basinat mountains and hilly areas and 0 ton/ha/yr where deposition takes place at flat
and level areas and the mean annual soil loss of 29 t /ha/yr.From the assessment 73.69 % of the area has
soil loss fall non to slight,14.03% moderate ,9.24 % high and 3.03% very high soil loss class respectively..
Soil and water conservation is preventing soil and water from degradation. The soil and water
conservation trend in the sub basin isbetter.
The overall impact of land degradation in the sub basin is not limited to the level of reduction of land
productivity in the upper stream areas, but rather has brought colossal impacts on the downstream areas. In
order to alleviate the problems, the study identified and presented different mitigation measures in the
main body of the report.

Tana Sub-basin Land Use Planning and Environmental Study Project
BoEPLAU Watershed Management Study DraftFinal Report ADSWE iv
TABLE OF CONTENT
LIST OF REPORTS ....................................................................................................................................... ii
EXECUTIVE SUMMARY ................................................................................................................................ iii
TABLE OF CONTENT ................................................................................................................................ iv
LIST OF TABLES ....................................................................................................................................... vii
LIST OF FIGURES ..................................................................................................................................... viii
ABBREVIATIONS AND ACRONYMS ...................................................................................................... ix
1. INTRODUCTION .................................................................................................................................. 1
1.1 Background ........................................................................................................................ 1
1.2 Scope of the Study.............................................................................................................. 2
1.3 Objectives of the Project .................................................................................................... 2
1.3.1 General Objective ................................................................................................................... 2
1.3.2 Specific objectives .................................................................................................................. 3
1.4 Limitation of the study ....................................................................................................... 3
2. LITERATURE REVIEW ....................................................................................................................... 4
2.1 History and Experience of Watershed Based Development .............................................. 4
2.2 Experiencein Watershed Management in Amhara Region ..................................................... 4
2.3 Baseline Survey of Community-Based Integrated Natural Resources Management Project
in Lake Tana Sub-Basin, TCS (2013) ........................................................................................... 5
2.4 Baseline Information of Community-Based Integrated Natural Resources Management
Project in Lake Tana Sub-Basin, IFAD/EPLAUA (2007) ............................................................ 6
2.5 Megech-Seraba Pump Irrigation Project ............................................................................ 7
2.6 Rib irrigation Project .......................................................................................................... 8
2.7 Koga irrigation Project ............................................................................................................ 8
2.8 Watershed Degradation ........................................................................................................... 9
2.9 Land Degradation ............................................................................................................. 10
2.10 Land Degradation Indicators ............................................................................................... 11
2.11Driving Forces, Pressure, State, Impact and Response Indicators ....................................... 11
2.11.1 BiophysicalLand Degradation Indicators .................................................................................. 12
2.11.2Socio-Economic Land Degradation Indicators ........................................................................... 12
2.12Land Degradation Assessment ............................................................................................. 13

Tana Sub-basin Land Use Planning and Environmental Study Project
BoEPLAU Watershed Management Study DraftFinal Report ADSWE v
2.12.1Qualitative Land degradation Assessment ................................................................................. 13
2.12.2 Quantitative Land degradation assessment ................................................................................ 16
3. MATERIALS AND METHODS ......................................................................................................... 25
3.1 Description of the Study Area .......................................................................................... 25
3.1.1 Slope ............................................................................................................................................ 28
3.1.2 Soil condition in the sub basin ..................................................................................................... 29
3.1.3 Land Use/ Cover .......................................................................................................................... 30
3.2 Materials and Equipment ................................................................................................. 31
3.3 Methodology ......................................................................................................................... 32
3.3.1 Pre Field ...................................................................................................................................... 32
3.3.2 At Field ........................................................................................................................................ 32
3.3.3 Post Field ..................................................................................................................................... 33
4. RESULT AND DISCUSSION ............................................................................................................. 37
4.1 Watershed Delineation, Morphology and characteristics ..................................................... 37
4.1.1 Watershed Delineation ................................................................................................................ 37
4.1.2 Morphology ................................................................................................................................. 38
4.1.3 Drainage Pattern .......................................................................................................................... 38
4.2 Fragility Assessment ............................................................................................................. 39
4.2.1 Climatic Fragility Assessment ..................................................................................................... 39
4.2.2 Slope Fragility of Watershed ....................................................................................................... 40
4.2.3 Forest cover Fragility .................................................................................................................. 42
4.2.4. Fragility using Population density .............................................................................................. 43
4.2.5 Proportion of Arable Land Affected by Erosion ......................................................................... 44
4.2.6 Average farm size fragility analysis ............................................................................................ 45
4.2.7 Total stability the sub basin ......................................................................................................... 46
4.3 Land Degradation and Soil Erosion ...................................................................................... 47
4.3.1 Water Erosion .............................................................................................................................. 50
4.3.2 Forms of Water Erosion .............................................................................................................. 50
4.4Soil Erosion Hazard Assessment Results ............................................................................... 56
4.4.1 RUSLE Parameters Results ......................................................................................................... 56
4.5Causes of Watershed degradation and Soil erosion ............................................................... 65
4.5.1 Population and Land Degradation Processes ............................................................................... 66
4.5.2 Deforestation and Overexploitation of Vegetation ...................................................................... 66
Tana Sub-basin Land Use Planning and Environmental Study Project
BoEPLAU Watershed Management Study DraftFinal Report ADSWE vi
4.5.3 Improper Agricultural Practice .................................................................................................... 67
4.6Effects of land degradation and soil erosion .......................................................................... 69
4.7Soil and water conservation Experiencesin the Sub Basin .................................................... 71
4.7.1 Indigenous Soil and Water conservation Structures .................................................................... 72
4.7.2 Physical Soil and Water Conservation Structures ....................................................................... 73
4.7.3 Biological Soil and Water Conservation ..................................................................................... 74
5. PROBLEM IDENTIFICATION .......................................................................................................... 77
5.1 Soil Erosion and Land Degradation ................................................................................. 77
5.2 Deforestation .................................................................................................................... 77
5.3 Decline of Soil Fertility .................................................................................................... 78
5.4 Weak Soil and Water Conservation Work and Management Practice .................................. 78
6. LAND MANAGEMENT PRACTICES/OPTIONS ............................................................................. 80
6.1 Capability Land Classification .............................................................................................. 80
6.1.1 Capability Inputs ......................................................................................................................... 80
6.1.2 Land Capability Classes .............................................................................................................. 82
6.2 Proposed Soil Water Conservation Measures .................................................................. 85
6.2.1 Physical Soil and Water Conservation Measures ........................................................................ 88
6.2.2 Biological Soil and Water Conservation Measures ..................................................................... 94
7. CONCLUSION AND RECOMMENDATION ................................................................................... 99
7.1 Conclusion ........................................................................................................................ 99
7.2 Recommendation ................................................................................................................... 99
8. REFERENCES ................................................................................................................................... 101
9. APPENDICES .................................................................................................................................... 103
Appendix I. RUSLE Estimation Parameter............................................................................... 103
Appendix II Secondary Data of Watershed Management ......................................................... 106
Tana Sub-basin Land Use Planning and Environmental Study Project
BoEPLAU Watershed Management Study DraftFinal Report ADSWE vii
LIST OF TABLES
Table 1: Climate (Rain fall) index based area classification (Nurhusen, 2006) ........................................... 14
Table 2: Slope Index Watershed Stability .................................................................................................... 14
Table 3: Erosion hazarded based fragility class assessment ......................................................................... 15
Table 4: Population fragility ......................................................................................................................... 16
Table 5: Soil color Erodibility Factor (Hellden, 1987) ................................................................................ 20
Table 6: P- value (Wischemeier and Smith, 1978) ....................................................................................... 22
Table 7: Tana Sub basin slope classification ................................................................................................ 28
Table 8: Major watersheds of Tana sub basin .............................................................................................. 38
Table 9: Tana Sub Basin Aridity index ........................................................................................................ 40
Table 10: Slope Index Watershed Stability .................................................................................................. 41
Table 11: Forest Cover as Criteria for Determining Catchment Stability Class .......................................... 42
Table 12: Arable land as a criteria factor for determining catchment stability class.................................... 44
Table 13: Average Farm as a Criteria Factor for Determining Catchment Stability Class .......................... 45
Table 14: Tana sub basin weighted overlay fragility analysis ...................................................................... 46
Table 15: Dry matter production from different land covers in the sub basin ............................................. 47
Table 16: Soil depth of the sub basin ........................................................................................................... 50
Table 17: Tana sub basin organic matter rating analysis .............................................................................. 51
Table 18: Tana Sub basin zonal Livestock population ................................................................................. 52
Table 19: Tana sub basin of sheet erosion observed data severity class ...................................................... 52
Table 20: Gully erosion amount by land cover at different depth ................................................................ 54
Table 21: Gully erosion by volume at different land cover .......................................................................... 54
Table 22: Tana sub basin stream bank erosion severity class ...................................................................... 54
Table 23: Mean Annual rain fall and R-values of Metrological Station of the Sub basin........................... 57
Table 24: Major watersheds soil loss rate in the sub basin .......................................................................... 63
Table 25: Tana Sub Basin Annual Soil Loss ................................................................................................ 64
Table 26: Demand and supply of the existing forest resource projection in the sub basin .......................... 66
Table 27: Total Achievement of SWC from2001-2005 EC with in the sub basin ....................................... 76
Table 28: Table Slope factor rating and proportional area coverage ............................................................ 81
Table 29: Soil depth rating and proportional area coverage ......................................................................... 81
Table 30: Soil erosion rating table ................................................................................................................ 81
Table 31: Soil drainage class of Tana sub basin ........................................................................................... 82
Table 32: Soil texture class distribution of study area .................................................................................. 82
Table 33: Land capability class and proportional area coverage in Tana sub basin ..................................... 83
Table 34: Proposed Soil and water conservation measures .......................................................................... 87
Table 35: The gradient, soil depth and width of a cultivated area (in meters) on a bench terrace. .............. 91
Table 36: Different sizes of gabions (Length x Width x Height) and wire requirement for each ................ 94
Table 37: Spacing for grass strip down a slope (RELMA and MOA, 2005) ............................................... 95
Table 38: FAO soil unit & their corresponding K values ........................................................................... 103
Table 39: Major soil unit, soil color and K- Values ................................................................................... 103
Table 40: K value based on the soil texture and organic matter content .................................................... 104
Table 41: Soil Erodibility Factor (K) (Schwab et al., 1981) ...................................................................... 104
Table 42: Crop Factor and land use land cover .......................................................................................... 104
Table 43: Land capability classes andSWC Options at different land cover ............................................. 104
Tana Sub-basin Land Use Planning and Environmental Study Project
BoEPLAU Watershed Management Study DraftFinal Report ADSWE viii
LIST OF FIGURES Figure 1: Biophysical Indicators for land degradation(Michael & Niamh, 2000) ....................................... 12
Figure 2: Values of the Gravelius's index for watersheds ............................................................................ 15
Figure 3: Map of Tana sub basin .................................................................................................................. 25
Figure 4: slope map of the sub basin ............................................................................................................ 28
Figure 5: Soil map of Tana sub basin ........................................................................................................... 30
Figure 6: Major land use land cover of the sub basin ................................................................................... 31
Figure 7: Flow diagram for soil loss estimation ........................................................................................... 34
Figure 8: Tana Sub basin major watersheds. ................................................................................................ 37
Figure 9:TanaSub Basin Rainfall Fragility ................................................................................................... 40
Figure 10:Tana Sub Basin Slope Fragility ................................................................................................... 41
Figure 11: Tana sub basin Forest fragility Map ........................................................................................... 42
Figure 12: Tana Sub Basin Population Fragility Map .................................................................................. 43
Figure 13: Arable land evaluation for classifying watershed stability ......................................................... 44
Figure 14: Average Farm Size Evaluation for Classifying Watershed Stability .......................................... 45
Figure 15: Tana Sub Basin Weighted overlay Fragility analysis ................................................................. 46
Figure 16: Sediment deposition near Lake Tana at Takusa and Gonder Zuria Woreda, ADSWE, 2014. .... 48
Figure 17: Soil depth of the sub basin .......................................................................................................... 49
Figure 18: Shallow Soil depth and Root over top of chemical degradation at Farata (right) and Dera
(left)ADSWE, 2014. ..................................................................................................................................... 49
Figure 19: Tana sub basin organic matter ratinganalysis ............................................................................. 51
Figure 20:Rill erosion South Achefer (left) and Dera (right) woredas ADSWE, 2014................................ 53
Figure 21: Gully erosion at Ebinat (left) and Farta (right) woredas, ADSWE, 2014. .................................. 53
Figure 22: Stream bank erosion Alefa woreda (left) and North Achefer woreda (right); ADSWE, 2014. .. 55
Figure 23: Roadside erosion Dembia (left), Farta (middle) and South Achefer (right) ADSWE, 2014. ..... 55
Figure 24:Tana Sub Basin Metrological Stations ......................................................................................... 56
Figure 25:TanaRainfall and Erosivity Map .................................................................................................. 58
Figure 26:Tana Sub Basin Soil and Erodiblity Map..................................................................................... 59
Figure 27: Tana Sub Basin DEM, Slope length, Slope gradient and LS Maps ............................................ 60
Figure 28:TanaSub Basin Crop factor Map .................................................................................................. 61
Figure 29:TanaSub basin Management Practice (P-value) map................................................................... 62
Figure 30: Soil loss map of the sub basin ..................................................................................................... 63
Figure 31: Tana sub basin average annual soil loss map .............................................................................. 64
Figure 32: Slope more than 30% are cultivated in the sub basin.................................................................. 68
Figure 33: Improper agricultural practice at Ebinat, West Belesa, Farta and Quarit ADSWE, 2014. ......... 69
Figure 34: Hydrological degradation Megech at Robit Dembia and Trikura river Takusa woreda, ADSWE,
2014. ............................................................................................................................................................. 70
Figure 35: Irrigation schemes Selamiko Dam (Debretabor), Drima weir at Dembia and Lake Tana (Gonder
Zuria and Fogera) woreda filled by Sediment load, 2014. ........................................................................... 71
Figure 36: Physical Soil and Water conservation at Farta, Mecha, Takusa and Fagita woreda, ADSWE,
2014 .............................................................................................................................................................. 74
Figure 37:Effective Biological Soil and water conservation Sekela and Fara ,ADSWE 2014. ................... 75
Figure 38: Poor SWC practice and management Gonder Zuria, Dera and Libokemkem ADSWE, 2014. .. 79
Figure 39: Land capability class map ........................................................................................................... 83
Figure 40: Proposed soil and water conservation measures ......................................................................... 87
Figure 41: Cross section of a bund ............................................................................................................... 89
Figure 42: Patterns of micro basins .............................................................................................................. 90
Tana Sub-basin Land Use Planning and Environmental Study Project
BoEPLAU Watershed Management Study DraftFinal Report ADSWE ix
ABBREVIATIONS AND ACRONYMS
ADSWE Amhara Design and Supervision Works Enterprise
CBPWD Community Based Participatory Watershed Development
DEM Digital Elevation Model
EMA Ethiopian Mapping Agency
ERDAS Earth Resource Data Analysis System
FAO Food Agriculture Organization
GIS Geographical Information System
GPS Global Positioning System
LADA Land degradation Assessment in Dry land Areas
Land Sat TM Land Satellite Thematic Mapper
LUPRD Land Use Planning and Regulatory Department
MoA Ministry of Agriculture
NGO None Governmental Organization
RUSLE Revised Universal Soil Loss Equation
SCRP Soil Conservation Research Project
SWAT Soil Water Assessment Tool
SWC Soil and Water Conservation
T/ha/yr Tons per hectare per year
UTM Universal Transverse Mercator
Tana Sub-basin Land Use Planning and Environmental Study Project
EPLAUB Watershed management Study Draft Final Report ADSWE 1
1. INTRODUCTION
1.1 Background
A watershed is any surface area from which runoff resulting from rainfall collected and drained
through a common confluence point. The term is synonymous with a drainage basin or catchment
area. Hydro logically, watershed defined as an area from which the runoff drains through a
particular point in the drainage system. A watershed made up of the natural resources in a basin,
especially water, soil, and vegetative factors. At the socioeconomic level a watershed includes
people, their farming system (including livestock) and interactions with land resources, coping
strategies, social and economic activities and cultural aspects.(CBPWD,2005). Now a day‟s
watershed degradation is a serious problem in the developing country like Ethiopia. Amhara
Region it is one of the region which affected by land degradation. Especially Tana Sub Basin is
one of the sub basin, which seriously affected by different land degradation.
Land degradation is the decline in land quality caused by human activities. The immediate causes
of land degradation are inappropriate land use that leads to degradation of soil, water and
vegetative cover.
Land degradation is the results of complex interactions between physical, chemical, biological,
socioeconomics and political issues of local, national, or global nature. Some of the causes of
degradation are natural hazards, population growth, expansion of agricultural lands on to forests
and marginal lands, poverty, land ownership problems, political instability and administration
problems, and inappropriate agricultural practice.
Land degradation manifests itself in many ways. Vegetation, which may provide fuel and fodder,
becomes increasingly scarce, watercourses dry up, thorny weeds predominate in once rich
pastures, footpaths disappear into gullies, and soils become thin and stony. All of these
manifestations have potentially severe impacts for land users and for people who rely for their
living on the products from a healthy landscape.
Types of land degradations are soil erosion by water, soil erosion by wind, soil fertility decline,
water logging, increase in salinity, flooding, lowering of water table, and loss of vegetation cover.
However, the sub basin affected with different types of land degradation such as physical,
chemical and biological degradation are the main problems in the study area.
The sub basin divided in to four major watersheds namely Megech, Rib, Gumara and Gilgel
Abay.
Tana Sub-basin Land Use Planning and Environmental Study Project
EPLAUB Watershed management Study Draft Final Report ADSWE 2
The sub basin has a total area of 1,579,096.94 hectares. The sub basin includes about 29 rural and
town woredas of the region. The sub-basin is one of the most important potential areas for all
developmental activities, especially for irrigation, livestock production, crop production, forest
production, tourism and mining. In addition, although it needs thorough study economically
important mineral resource found in this sub basin.
It has plenty surface and most importantly ground water resources, suitability to promote
commercial agriculture and agro-industry, access to market are to be mentioned as the good
opportunities of this sub basin. However, due to mismanagement or underutilization of land
resources the living standard of the farming community could not improve beyond subsistence.
Meanwhile the productivity of the land is seriously declining. This due to different watershed
management problems especially land degradation is the main mechanism for declining
productivity.
This watershed management study particularly deals with the existing natural resources inside the
watershed and future intervention for sustainabledevelop.
1.2 Scope of the Study
The watershed management study carried out at Tana sub basin in Amhara Regional State is
intended watershed management to degradation, utilization and conservation of natural resource.
The natural features of the watershed, topography, soil type, climate and socio economic
conditions, demography and farming system are study criteria to analyze the causes and effects of
soil erosion of the watershed. Conservation experience and benefits of soil and water
conservation studied .Major problems identified in the field of SWC and development measures
recommended with management and planning techniques. The study assessed land qualities and
characteristics related to land degradation for land evaluation process in land use planning
project. The land qualities quantified by fragility and soil erosion risk classes. Soil loss and
sediment yield estimations carried out. Soil loss equation is best indicator of land degradation.
The study based on overlay of soil geomorphology, climatic, present land cover possessed in Arc
GIS 10.1 environments.
1.3 Objectives of the Project
1.3.1 General Objective
The general objective of the watershed management study in the sub basin is in order to identify
and understand ecological and socio economic problems in the sub basin to identify and prepare

Tana Sub-basin Land Use Planning and Environmental Study Project
EPLAUB Watershed management Study Draft Final Report ADSWE 3
watershed intervention plan that enable sustainable management and use of resources: thereby
establishing sustainable production system to improve the livelihood of the communities in the
sub basin
1.3.2 Specific objectives
To study the existing soil erosion condition to indicate socio-economic and
ecological problems.
To study the soil and water conservation trend to understand the strength and
weakness of concerned bodies while transforming towards sustainable
development.
To estimate soil loss and potential sediment yield transporteddownstreamto Lake
Tanaby using RUSLE parameters.
To identify soil and water conservation measures overcoming the problem of soil
erosion
To study the condition of watersheds as a proper unit for wise utilization and
development of all land resources.
Recommend sound natural resource management strategy for sustainable
development to improve livelihoods and protecting ecosystem stability through
strengthening capacity for integrated land use planning and implementation.
1.4 Limitation of the study
Secondary data collection was not satisfactory process, because it was difficult to get documented
data of different seasons of soil and water conservation practices at woreda levels. Only data of
current year were available, data series in the recent past years not obtained.

Tana Sub-basin Land Use Planning and Environmental Study Project
EPLAUB Watershed management Study Draft Final Report ADSWE 4
2. LITERATURE REVIEW
2.1 History and Experience of Watershed Based Development
In Ethiopia, Different extension systems exercised for 54 years. However, the focus of extension
system has been on crop production and to some extent on livestock, no attention was given to
natural resource conservation and development. Watershed based natural resource management in
general and soil and water conservation in particular commenced in the 1980‟s though the
management was at large scale and top down. This has attributed largely to the unmanageable
size of the target areas and the lack of community participation and limited sense of
responsibility.
The watershed conservation was strictly soil erosion control and afforestation .It did not include
the socioeconomic transformation noticed in watershed development (Berhe, 1996).
The lessons learned from this experience encouraged MoA and support agencies like FAO to
initiate pilot watershed planning approaches on a bottom-up basis, using smaller units and
following community-based approaches. A number of participatory planning tools and
methodologies have been developed and tried out in Ethiopia. Recently, from several of these
approaches community-based participatory watershed development guideline extracted to provide
guidance to DAs and woreda experts on how to engage and consult with communities to prepare
a workable, socially acceptable, and technically sound community-based watershed plan.
Minimum planning at the initial stage involved shifting from larger watersheds to smaller sub-
watersheds. Community based sub-watershed approaches originated from watershed planning and
the minimum planning. The woreda level planning, which started in 1994, consisted of socio
economic survey and planning, biophysical indicators (land use land cover) and development plan
prepared for 3 years.
2.2 Experiencein Watershed Management in Amhara Region
Watershed management efforts in Amhara region have so far focused on the food insecure and
degraded areas. The food secure areas, which are eroding at increasing rate, had given little
attention. Existing efforts also focus on soil water conservation and water harvesting with heavy
emphasis on physical measures, rather than on broader program of watershed development.
Watershed development has been problematic when we applied without community participation
and using only hydrological planning units. This resulted in various failures or serious
shortcomings. For instance, large Borkena dam in South Wello, all irrigation dams constructed by

Tana Sub-basin Land Use Planning and Environmental Study Project
EPLAUB Watershed management Study Draft Final Report ADSWE 5
CoSAERAR and Angereb dam in North Gondar where constructed before not sufficient
conservation measures were in place. Similarly, about five large dams are going constructed in
Lake Tana watershed however; none of these will offer sustainable benefit in the current situation
of upstream degradation. Watershed management therefore, is important to the long–term
effectiveness of the sustainable utilization of the dams and Lake Tana reservoirs.
Thus, the national government has designed and launched a Community Based Participatory
Watershed Development approach to lead the process of rural transformation, the generation of
multiple and mutually reinforcing assets. Accordingly, Bureau of Agriculture and Rural
Development is being heavily involved in watershed management and declared that all resources
development projects should be watershed based.
In the past decades, participatory watershed development approach has taken on board by
different organizations including NGOs and bilateral organizations. GTZ has adopted
Participatory Land Use-Planning (PLUP) approach in implementation of soil and water
conservation and farming practices. South Gondar is one of zones were the organization has
succeeded in mainstreaming the participatory element into the land use-planning and natural
resources management approach.
The Amhara micro enterprise development, agricultural research, extension and watershed
management(AMAREW) project, since its beginning in July 2002,has been conducting multi-
faced and integrated rural development activities in targeted woredas of selected pilot watersheds
of the region in agricultural research, extension ,watershed management and micro enterprise
development. The organization has commenced operation in Sekota and Gubalafto since 2003.
Besides, the pilot in Sekela Woreda, which is part of Lake Tana watershed, has initiated since
august 2005. It gained experience in participatory watershed management on these pilot
watersheds.
These include participatory planning and implementation, demonstrating at small scale and
scaling up of activities. These all reach experiences of organizations working in the watershed
will be very helpful during implementation of the intended project.
2.3 Baseline Survey of Community-Based Integrated Natural Resources
Management Project in Lake Tana Sub-Basin, TCS (2013)
There are many community based integrated natural resources management study in Lake Tana
sub basin. Most of them focused on base line survey and on resource assessment only. For
example, baseline survey of community-based integrated natural resources management study
Tana Sub-basin Land Use Planning and Environmental Study Project
EPLAUB Watershed management Study Draft Final Report ADSWE 6
carried out by Temesgen Consultancy Service (TCS, 2013) focused mainly identifying the
existing types of soil and water conservation structures, analysing soil loss in Lake Tana sub
basin and estimating yield and associated economic loss only.
The amount of physical and biological conservation measures not well quantified in terms of
human and financial resources requirement. The study had no detail implementation plan and
time schedules. Besides, it did not specify the specific location for each conservation measures.
2.4 Baseline Information of Community-Based Integrated Natural Resources
Management Project in Lake Tana Sub-Basin, IFAD/EPLAUA (2007)
The study IFAD/EPLAUA (2007) indicated that land degradation in the Lake Tana watershed
limits the potential to develop a sustainable livelihood for its inhabitants. Deforestation,
sedimentation, and loss of fertility contribute to global warming, biodiversity loss, and restrict the
availability of fresh water while altering the structure and integrity of local ecosystems. Those
phenomena exacerbated by inappropriate land use and damaging agriculture and grazing
practices. The effectiveness of the regional and local efforts to improve the environment and
livelihoods of the residents in the Lake Tana watershed through natural resource conservation
programs are limited due to capacity, and financial barriers.
The study finally identified land use and water resource related barriers that include weak policy
implementation, low capacity (technical and financial), poor information management system,
low or no incentives, and frequent restructuring of core and principal institutions at
national/regional levels. Alleviation of these constraints will be important for better delivery of
technical support and enabling local users to implement good land use related practices, to
influence policies reduce dependency on aids and implement environmentally friendly activities.
The following alternatives are proposed by the study (IFAD/EPLAUA, 2007);
Strengthening capacity for integrated land use planning and implementation, at the
regional and local levels and across sectors
Development and Strengthening implementation of policies, regulations, and incentive
structures,
Strengthening and designing information management systems to support decision-
making at all levels on integrated land use planning and management.
Formulation of bylaws to govern wetland resource use as well as avert degradation of
wetlands as a result of mismanagement of streams and rivers feeding the wetland.

Tana Sub-basin Land Use Planning and Environmental Study Project
EPLAUB Watershed management Study Draft Final Report ADSWE 7
Creating awareness amongst communities on the useful functions of wetlands and the
sustainable utilization of land and water resources
Promoting integrated land-use planning with environmental conservation activities at
watershed, micro watershed level
Supporting and developing both extension staff and community capacity to
develop/introduce sustainable land use systems.
Improving the availability (quality and quantity) of potable water and irrigation water
through rainwater harvesting, diversion and spring development
Communication of Water Users along river resources at various spots is limited. Hence,
the water users‟ complaint from different users can be resolved by involving
representatives from different sites and setting equitable water use rights.
Besides, strategies adopted for removing the barriers to achieving Sustainable Land Management
(SLM) in Lake Tana Watershed are also stated.
However, thebaseline survey study lacked to draw detail implementable activities, where to
implement and the like; rather it gave a clue to commence a detail study. Hence, it is important to
undertake detail watershed management study to translate this study in to implementable project.
2.5 Megech-Seraba Pump Irrigation Project
This study (TAHAL, 2009) has no watershed management plan rather it conducted to undertake
soil suitability evaluations of the project area for irrigation of major crops. FAO guidelines for
land evaluation for irrigated agriculture, and USDA land classification system to assess the
capability of the project area. Land evaluation for surface irrigation based on matching the land
characteristics (slope range, drainage class, soil depth, soil texture, pH, EC, ESP, CEC, OM,
available P, infiltration rate, hydraulic conductivity and stoniness) of the command area and the
land use requirements for surface irrigation.
The results of the evaluation 4,323 ha from total command area were not suitable for surface
irrigation at that level of management due to drainage, flooding, shallow groundwater table and
heavy clay. The study recommend that , in order to run the irrigation project in a sustainable
manner, improvement of the slow drainage or water application that conforms to slow drainage,
flood control and groundwater rise is very imperative.
The study has relevance on land suitability classification aspects and discussed in detail for the
area, but it does not cover all the envisaged area and it is specific only the issue of irrigated area.
The study has to be considering for this study, however consideration of other LUTs is important.

Tana Sub-basin Land Use Planning and Environmental Study Project
EPLAUB Watershed management Study Draft Final Report ADSWE 8
2.6 Rib irrigation Project
The study undertaken by WWDSE/TAHAL (2008) on Rib irrigation project has recommended
Watershed Management Interventions such as: Physical soil and water conservation measures like
graded bunds and/or graded fanya-juu, level bunds, check dams, embankment or road cut slope,
cut-off drains, waterway construction and improvement and soil management; biological soil
conservation measures like grass strip and alley cropping, crop rotation and inter-cropping,
multiple cropping, intercropping, hedgerows, relay cropping, agro- forestry and nursery
establishment and seedling production. in addition, area closure, river bank protection,
agricultural production enhancement, livestock management interventions, spring
development,alternative energy development, income diversification, infrastructure development,
agricultural production support systems, loan and credit, marketing, extension system
improvement, and participation of community and stake holders are other interventions
recommended for Rib watershed management. These recommended interventions complemented
with detail implementation schedule, quantity of work and budgeting. However, the study lacked
where and which recommended measures implemented. No spatial distribution of the measures
indicated except mentioning the requirement of recommended measures as slope, terrain
condition and the like.
2.7 Koga irrigation Project
The watershed management plan of Koga irrigation project feasibility (Acres and Shawel, 1995)
tries to describe about topography, slope, soil and land suitability, traditional agro-climatic zones,
land use and land cover types in the watershed area, review of the on-going watershed
management project, understanding of the watershed resources, and population of the watershed.
It, then, puts major problems of the Koga watershed; such as shortage of drinking water, soil
erosion, lack of irrigation facility, low crop yields as the major/dominant problems. The other
associated problems like unemployment, shortage of fuel wood, fodder etc. also needed to tackle.
Soil loss for the watershed also estimated on sub-watershed basis.
Watershed treatment planincluded soil and water conservation measures. Firstly, basic activities
like farmers training and preparation of seedlings in the nurseries. Secondly, arable land treatment
like conservation measures which consist of contour cultivation for all farmlands, diversion drain
about 20,000 meters, soil bunds 800km on 2000ha farm land, stone bund 100km for 1000ha and
fanya juu 100km for 500ha.In addition to these, production measures, which consist of crop
demonstration, agro-forestry, horticulture development, organic farming / compost pits,
Tana Sub-basin Land Use Planning and Environmental Study Project
EPLAUB Watershed management Study Draft Final Report ADSWE 9
homestead garden and household production system, planned implemented as watershed
management component of the project. About 400,000 USD also earmarked for the
implementation.
Hence, this study, unless some changes are expected, sufficient enough for implementation of the
watershed management plan every activities well mentioned. What it lacked is nothing but what
to do where.
2.8 Watershed Degradation
Depletion of water resources: Ethiopia suffers from what referred as a “recurrent wastage of most
of its rainwater”. With loss of water through surface runoff, soil eroded, thus triggering the whole
chain of negative consequences leading to chronic food insecurity. In most developing countries,
only 20–50% of total surface runoff is controlled and effectively used. Ethiopia is among them as
topography, inadequate farming practices, and lack of conservation hamper water and moisture
retention and its efficient use. Depletion of water resources directly linked to the disappearance of
vegetative cover and surface protection systems. High runoff also implies high erosion rates and
soil degradation, lower infiltration and a vicious cycle of depletion. Scarcity of water for domestic
and livestock use is a major consequence of degradation in Ethiopia, with serious repercussions
on health, incomes and the quality of life of people. Soil erosion and land degradation; Soil
erosion is one of the most important component of land degradation. Soil erosion and degradation
is a reduction in soil depth and fertility. It is caused by erosion (soil removal, loss of nutrients),
reduced soil water holding capacity and excessive exploitative use of the land (cultivation of
steep slopes, shallow soils, tillage, overgrazing, encroachment of forests/closed areas, and others).
If land and water resources not protected and conserved against the forces of erosion, soil
resources degradation occurs in various forms. In degraded watersheds, forms of degradations can
be physical, biological and chemical. Impoverishment of the vegetative cover is reduction of the
vegetative cover and biomass caused by climatic factors, over utilization of vegetation (such as
cutting of trees, overuse of crop residues for animal feed and fuel wood, overgrazing, and
burning), erosion and reduced soil fertility. If watersheds not managed properly then the natural
resources (soil, water, fauna - vegetation and flora) degraded rapidly and in due course not be
used for settlement of humans. The linkages among these three factors are obvious: land
degradation is mostly responsible for reduction of the vegetative cover and ultimately depletion of
the water resources that in turn makes the soil, water and vegetation more vulnerable to further
aggravation.
Tana Sub-basin Land Use Planning and Environmental Study Project
EPLAUB Watershed management Study Draft Final Report ADSWE 10
2.9 Land Degradation
Land degradation is a composite term; it has no single readily identifiable feature, but instead
describes how one or more of the land resources (soil, water, vegetation, rocks, air, climate,
relief) has changed for the worse. Land degradation generally signifies the temporary or
permanent decline in the productive capacity of the land (UN/FAO definition). Another definition
describes it as, “the aggregate diminution of the productive potential of the land, including its
major uses (rain-fed, arable, irrigated, rangeland, forest), its farming systems (e.g. smallholder
subsistence) and its value as an economic resource." This link between degradation (which often
caused by land use practices) and its effect on land use is central to nearly all published
definitions of land degradation. The emphasis on land, rather than soil, broadens the focus to
include natural resources, such as climate, water, landforms and vegetation. Other definitions
differentiate between reversible and irreversible land degradation. Whilst soil degradation
recognized as a major aspect of land degradation, other processes, which affect the productive
capacity of cropland, rangeland and forests, such as lowering of the water table and deforestation,
captured by the concept of land degradation.
Land degradation is, however, difficult to grasp in its totality. Therefore, we have to use
indicators of land degradation. Indicators are variables, which may show that land degradation
has taken place – they are not necessarily the actual degradation itself. The piling up of sediment
against a down slope barrier may be an 'indicator' that land degradation is occurring upslope.
Similarly, decline in yields of a crop may be an indicator that soil quality has changed, which in
turn may indicate that soil and land degradation are also occurring. The condition of the soil is
one of the best indicators of land degradation. The soil integrates a variety of important processes
involving vegetation growth, overland flow of water, infiltration, land use and management. Soil
degradation is, in itself, an indicator of land degradation. Farmers' concerns is a distinction is
made between productivity, which is defined as the inherent potential of a land system to produce
crop yields, and production, which is defined as the actual yield levels achieved by farmers. Land
degradation may reduce the inherent productivity of a system, but production levels may be
unaffected, or may increase as a result of compensating action being taken by the land user (for
example, the application of fertilizer). Land management practices may not exploit the full
potential productivity of the land. Land degradation, if defined as a loss in productivity, closely
aligned with the interests of farmers, whose major concern is the yield that they can achieve from
their lands. Although current harvest potential is critical to most farming decisions, farmers will
often take a long-term approach to land productivity. Farming activities can trigger or exacerbate
Tana Sub-basin Land Use Planning and Environmental Study Project
EPLAUB Watershed management Study Draft Final Report ADSWE 11
land degradation, storing up future problems for land users. Consequently, early identification of
risk-prone areas and management techniques is of interest to land users.
2.10 Land Degradation Indicators
Land degradation indicators are statistics or measures that relate to a condition, change of quality,
or change in state of land valued. They provide information and describe the state of the
phenomena, are useful to monitor changes and provide means to compare trends and progress
over time. The main challenge in identifying indicators is to select those that are sufficiently
representative and at the same time easy to understand and measure on a routine basis (LADA,
2002).Generally, land degradation indicators classified as quantitative and qualitative that
provides a simple and reliable basis for assessing change.
2.11Driving Forces, Pressure, State, Impact and Response Indicators
The driving forces, pressure, state, impact and response provide a convenient representation of
many of the factors related to land degradation. Indicators of drive forces include activities that
directly or indirectly cause land degradation (macro-economic policies, land use development,
population growth, poverty, land use and tenure condition, extreme climate events/ changes,
natural disasters, and water stress). Pressure Indicators are activities that may result in an
increased pressure on the natural resources (demand from agriculture and urban land use, nutrient
mining, demand for waste disposal, population growth, over-cultivation, over-grazing, and
demand for water uses). State Indicators reflect the conditions and status of degradation, as well
as the resilience to degradation (Land productivity decline, soil degradation and contamination,
soil erosion and salinization, loss of vegetation cover, loss of biodiversity). The effect and impact
of land degradation on natural resources, human well-being and society are the indicators grouped
under the impact indicators (land productivity decline, poverty and migration, land goods and
services, water cycle and quality, carbon storage decline, loss of biodiversity, changes in human
population size and distribution). Response indicators represent policies and actions taken
towards proper control of degradation (Macro-economic policies, land policies and policy
instrument, conservation and rehabilitation, monitoring and early warning systems, commitment
to international conventions, investments in land and water resources). Indicators of land
degradation can also group as biophysical and socio-economic FAO /LADA (2002).
Tana Sub-basin Land Use Planning and Environmental Study Project
EPLAUB Watershed management Study Draft Final Report ADSWE 12
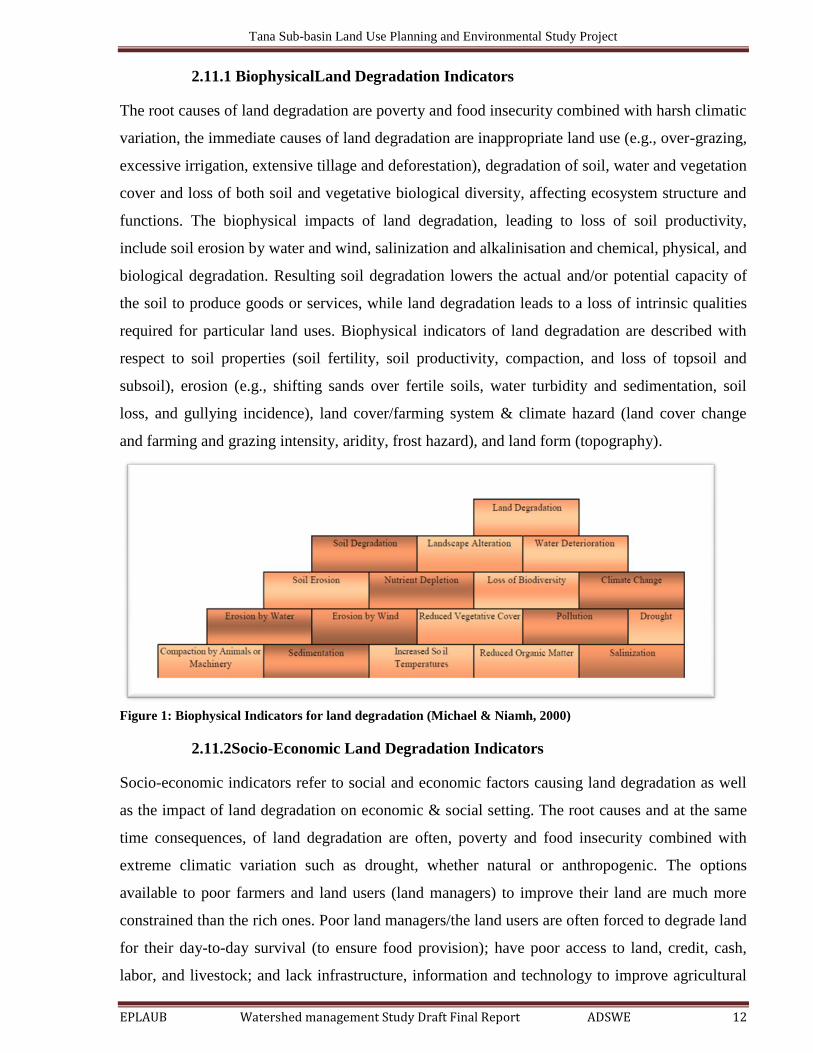
2.11.1 BiophysicalLand Degradation Indicators
The root causes of land degradation are poverty and food insecurity combined with harsh climatic
variation, the immediate causes of land degradation are inappropriate land use (e.g., over-grazing,
excessive irrigation, extensive tillage and deforestation), degradation of soil, water and vegetation
cover and loss of both soil and vegetative biological diversity, affecting ecosystem structure and
functions. The biophysical impacts of land degradation, leading to loss of soil productivity,
include soil erosion by water and wind, salinization and alkalinisation and chemical, physical, and
biological degradation. Resulting soil degradation lowers the actual and/or potential capacity of
the soil to produce goods or services, while land degradation leads to a loss of intrinsic qualities
required for particular land uses. Biophysical indicators of land degradation are described with
respect to soil properties (soil fertility, soil productivity, compaction, and loss of topsoil and
subsoil), erosion (e.g., shifting sands over fertile soils, water turbidity and sedimentation, soil
loss, and gullying incidence), land cover/farming system & climate hazard (land cover change
and farming and grazing intensity, aridity, frost hazard), and land form (topography).
Figure 1: Biophysical Indicators for land degradation (Michael & Niamh, 2000)
2.11.2Socio-Economic Land Degradation Indicators
Socio-economic indicators refer to social and economic factors causing land degradation as well
as the impact of land degradation on economic & social setting. The root causes and at the same
time consequences, of land degradation are often, poverty and food insecurity combined with
extreme climatic variation such as drought, whether natural or anthropogenic. The options
available to poor farmers and land users (land managers) to improve their land are much more
constrained than the rich ones. Poor land managers/the land users are often forced to degrade land
for their day-to-day survival (to ensure food provision); have poor access to land, credit, cash,
labor, and livestock; and lack infrastructure, information and technology to improve agricultural
Tana Sub-basin Land Use Planning and Environmental Study Project
EPLAUB Watershed management Study Draft Final Report ADSWE 13
yields and face political marginalization to improve their lives. Due to poverty, the cause and
consequence of land degradation more pronounced among the poorest segments of the world‟s
population.Socio-economic indicators framed about key characteristics of poverty:Lack of
opportunity (lack of income, credit, land and other assets to attain necessities such as food,
clothing and shelter; insecurity (vulnerability to adverse shocks and limited means to cope); and
disempowerment (voicelessness and powerlessness to influence decisions).
Institutional factors: the main driving forces of land degradation are institutional and policy
distortions, failures in the public or government, private or market, civil or community sectors,
and civil strife. Lack of institutional support; apprehension to decentralize; inadequate
development of land and natural resources management policies; negative externalities of
privatization schemes; development of macro-economic policies that encourage land
mismanagement; and incomplete markets for environmental goods and services (e.g., that do not
internalize environmental costs) have decreased incentive and ability for collective action to
manage land and natural resources.
2.12Land Degradation Assessment
2.12.1Qualitative Land degradation Assessment
The main goal of classifying land based on stability indicator is to identify critical areas and
concentrate limited financial and work force resources onto the most seriously affected lands first.
Based on their stability watersheds classified into: (Fragile, Instable, Moderately stable and
Stable).This classification based on evaluation of biophysical and socio-economic indicators that
are easy to obtain and suitable to evaluate the stability of the catchment. All the indicators
evaluated by means of empirical "Stability coefficient" to describe the overall stability of a
particular watershed with regard to ecological stability and erosion hazard need for technical and
social improvements & food production.
2.12.1.1 Biophysical Indicators
Climate (R)
This parameter (climate) especially rain & temperature determines soil erodibility as well as
moisture availability to plant growth (biomass production). Generally, an area has classified arid
(fragile), semi-arid (instable), sub humid (moderately stable) and humid (stable) based on average
annual rainfall of the area.

Tana Sub-basin Land Use Planning and Environmental Study Project
EPLAUB Watershed management Study Draft Final Report ADSWE 14
Table 1: Climate (Rain fall) index based area classification (Nurhusen, 2006)
Rainfall
(mm/year)
Climate
Watershed stability
Class Coefficient
Below 400 Arid Fragile 0.1
400-800 Semi-arid Instable 0.4
800-1200 Sub humid Moderately stable 0.8
Over 1200 Humid Stable 1.25
Arid environments are extremely diverse in terms of their landforms, soils, fauna, flora, water
balances and human activities. Because of this diversity, no practical definition of arid
environments derived. However, the one binding element to all arid regions is aridity.
Aridity usually expressed as a function of rainfall and temperature. The hyper-arid zone (arid
index 0.03) comprises dry land areas without vegetation, with the exception of a few scattered
shrubs. True nomadic pastoralism frequently practiced. Annual rainfall is low, rarely exceeding
100 millimeters. The rains are infrequent and irregular, sometimes with no rain during long
periods of several years.
The arid zone (arid index 0.03-0.20) is characterized by pastoralism and no farming except with
irrigation. For the most part, the native vegetation is sparse, being comprised of annual and
perennial grasses and other herbaceous vegetation, and shrubs and small trees. There is high
rainfall variability, with annual amounts ranging between 100 and 400millimeters.
The semi-arid zone (arid index 0.20-0.50) can support rain-fed agriculture with more or less
sustained levels of production. Sedentary livestock production also occurs. Native vegetation
represented by a variety of species, such as grasses and grass-like plants, fortes and half-shrubs,
and shrubs and trees. Annual precipitation varies from 400-600 to 700-800 millimeters, with
summer rains, and from 200-250 to 450-500 millimeters with winter rains.
Arid conditions also found in the sub-humid zone (arid index 0.50-0.75). The term "arid zone"
used here to represent the hyper-arid, arid, semi-arid, and sub-humid zones.
Slope gradient (S)
This factor influences soil erodibility in that it controls surface run-off stability of catchment or
watershed classified as follows; catchment considered critical if more than 30% of its land area
has slopes steeper than 50% gradient.
Table 2: Slope Index Watershed Stability
Proportion of slopes (%)
Watershed stability
Class Coefficient
Over 30 Fragile 0.1
15-30 Instable 0.4
5-15 Moderately stable 0.8
0-5 Stable 1.25

Tana Sub-basin Land Use Planning and Environmental Study Project
EPLAUB Watershed management Study Draft Final Report ADSWE 15
2.12.1.2 Morphology and erosion rate of watershed (C)
Watershed classified as critical if the sediments from the steep headwater ranges not deposited on
adjacent flat land, but completely exported from the eco-system. Thus, the most stable watersheds
are the plain like watershed and the accumulation type watersheds. Highly instable types are
therefore those having narrow, steep valleys and short lengths with high relief energy. In terms of
stability, the U-profile type takes an intermediate.
The shape of a catchment affects the stream flow hydrograph and peak flow rates. Shape of
watersheds varies considerably usually influenced by the geological processes. Commonly, the
slope resembles a leaf shape, the drains resembling the midrib and veins. Watershed shapes
described according to their physical configurations such as square, rectangular or oval shape.
However, indexes, approximates best the shape of a watershed.
The most frequently used index is the Gravelius's index KG, which defined as the relation
between the perimeter of the watershed and that of a circle having a surface equal to that of a
watershed.
Where: KG= Gravelius's shape index: A= watershed area [km2], P= watershed perimeter [km]
rank. Shape of watershed/catchment identified either in the field or in the office by means of
assessing shape factor in Arc hydro tools in GIS environment for each micro watershed.
Figure 2: Values of the Gravelius's index for watersheds
Table 3: Erosion hazarded based fragility class assessment
Erosion hazard
Watershed stability
class Coefficient
High Fragile 0.1
Medium Instable 0.4
Moderate Moderately stable 0.8
Low stable 1.25

Tana Sub-basin Land Use Planning and Environmental Study Project
EPLAUB Watershed management Study Draft Final Report ADSWE 16
2.12.1.3Socio-Economic Indicators
With regard to human involvement in the land degradation process, it is not necessary for a
society advanced agriculturally to do long-term damage to the land resources. Though human
causes, in the form of either mismanagement or deliberate damage, have contributed toward land
degradation, sometimes nature itself is the driving force.
Long-term changes in rainfall or general climate as well as soil erosion can turn an area into
permanently unproductive. An ecosystem may survive short-term drought, but if soil forced to go
too long without proper moisture, it sets in motion a chain reaction in which plant life dwindles
and, with it, animal life as well. Thus, the soil denied the fresh organic material necessary to its
continued sustenance, and a slow, steady process of decline begins.
Through social and economic occurrence an area of land may be defined as critical if: More than
about one third of all agricultural (arable) fields are affected by severe rill and/or gully erosion or
show signs of sheet erosion (exposed stones and / or roots). The average farm household produces
less than about 2.0 quintals of cereals per head per year, the average farm size is below one ha
and population density exceeds 50-75 persons per km2.
Table 4: Population fragility
2.12.2 Quantitative Land degradation assessment
2.12.2.1 Soil erosion hazard assessment
The assessment of erosion hazard considered as a special form of land resource evaluation to
identify those areas of land where the maximum sustained productivity from a given land
threatened by excessive soil loss. The land evaluation domain broadened from land suitability to
land vulnerability. Land vulnerability (referred to soil erosion, soil salinity, soil contamination,
subsoil compaction etc.) focuses on environmental degradation assessment (Deore, 2005).
Soil is a renewable resource so long as its use balanced with the soil formation rate. However, in
the watershed extensive land degradation has occurred because of deforestation, overgrazing and
inappropriate agricultural practices. This has resulted in both soil erosion and loss of fertility of
highland areas of the watershed where half of the arable land eroded. Sheet and Rill erosions are
the most prominent features to almost all cultivated lands of this watershed. Degradation of soil
Population Density (Persons/ Km2) Watershed stability
class Coefficient
>75 Fragile 0.1
50-75 Instable 0.4
25-50 Moderately stable 0.8
<25 stable 1.25
Tana Sub-basin Land Use Planning and Environmental Study Project
EPLAUB Watershed management Study Draft Final Report ADSWE 17
and vegetation resources leads to increased vulnerability to environmental shocks, decreased
agricultural production, reduction in access to basic services (water and electricity), demographic
instability, loss of carbon reserves, and loss of ecosystem resilience.
The population pressure, which is alarmingly increased, contributes a great share in expanding
cultivation of marginal lands. Increasing human and livestock population on one hand, and
diminishing of the existing arable lands on the other hand could help to increase the proportion of
degraded lands. This problem is more aggravated on the highlands of the watershed where 88%
human and 70% of animal population live (Kruger et al, 1996).
The annual soil loss in Ethiopia is between 1.5 and 3 billion tones (EHRS, 1986). From this about
50 percent occurs in croplands where soil loss has been reported to be very high (296
ton/ha/year). The Ethiopian Highlands Reclamation Study (EHRS) study estimated that about 50
percent of the highlands already significantly eroded.
Constable (1985) indicated that about 50% of the highlands already eroded, and cautioned that if
present soil degradation trends continue, per capita income in the highlands reduced on average
by 30% in the year 2010. though there is no a single research conducted in the watershed, Plot
experiment of Soil Conservation Research project (SCRP) at Anjeni (West Gojam) adjacent to the
watershed on different slopes and conservation practices showed soil loss between 53 and 161 t/
ha/year. Similarly, 152 t/ha was estimated in Angereb Watershed (Admasu, 2006).
Out of the total soil loss in the country (1.9 billion tone) about 1.1 (58%) is estimated to be from
the Amhara Regional State though the region covers only 16.7% of the total area of the country
(Gizachew, 1991). This shows significant portion of the region affected by soil erosion.
According to Berhanu (2003), about 29% of the region categorized under high erosion hazard. As
a result, 51 to 200 tons of soil eroded from each hectare of land every year. Nearly 37% of the
region identified as not suitable for crop production due to limiting soil depth (Teshome, 1995).
Consequent to the soil erosion the productivity of the soil reported to decline at a range of 2 to 3%
per year in the Amhara region
The estimated soil erosion rates of Lake Tana watershed is about 230 t/ha. This must have
increased at least by considerable percent from the present trends of soil erosion, accompanied
with complete absence of integrated watershed management.
2.12.2.2 Soil Loss Estimation Models
The researchers reported that much of the reduced yield observed on eroded soils was due to a
decrease for water available to the plant on eroded soils. On some soils, these crop yield
Tana Sub-basin Land Use Planning and Environmental Study Project
EPLAUB Watershed management Study Draft Final Report ADSWE 18
decreases largely overcome by higher fertilization levels. On other soils, particularly more
shallow soils on sloping terrain, erosion may destroy productivity if appropriate conservation
practices not initiated.
Soil losses, or relative erosion rates for different management systems, estimated to assist farmers
and government agencies in evaluation of existing farming systems or in planning to decrease soil
losses. In now, a day‟s method of estimating losses based on statistical analyses of field plot data
from small plots was developed, which resulted in the Universal Soil Loss Equation (USLE).
The soil loss affected by slope steepness and slope length, climatic characteristic, soil
characteristics, crop management and conservation practices, these factors considered for soil loss
estimation. In this regard, the effect of climatic factor in terms of rainfall erosivity index and crop
management factor taking into account effectiveness of different growth stages of the crop on soil
loss introduced. Similarly, the effects of conservation practices and soil erodibility on soil loss
also evaluated later on. Ultimately, by considering all these factors, a predictive equation
developed for estimating the soil-loss called as universal soil-loss equation.
The USLE continues to be a widely accepted method of estimation soil loss despite its
simplification of the many variables involved. It is useful for determining the adequacy of
conservation measures in farm planning, and for predicting nonpoint sediment losses in pollution
control programs. The average annual soil loss, as determined by Wischmeier and Smith (1978),
estimated from the equation.
Universal Soil Loss Equation: the equation given by:
PCSLKRA .....
Where, A = average annual soil loss in ton/ha,
R = rainfall factor (erosivity index) from rainfall map of the area; K = Soil erodibility factor; L =
slope length factor; S = Slope steepness factor; C = cover management factor; P = conservation
practice factor (terracing, Strip-cropping and contouring).
By application of this equation, the average annual soil loss computed for any region; but before
using it, its validity verified. The different factors associated with this equation described below.
Rainfall Factor (R): refers to the rainfall and runoff erosivity index, which expresses the ability of
rainfall to erode the soil particles from an unprotected field. The soil loss closely related to
rainfall partly through the detachment power of raindrop striking the soil surface and partly
through the contribution of rain to runoff (Morgan, 1994). This applies particularly to erosion by
overland flow and rills for which intensity generally considered the most important rainfall
characteristics. There are different ways of analyzing the R factor.

Tana Sub-basin Land Use Planning and Environmental Study Project
EPLAUB Watershed management Study Draft Final Report ADSWE 19
R = 9.28 * P – 8838. Mean annual erosivity (KE > 25) where P is mean annual Precipitation
[Morgan (1974) cited in Morgan (1994)],
R = 0.276 * P * I30. Mean annual EI30, where P is mean annual precipitation [Foster et.al (1981)
cited in Morgan (1994)],
R = 0.5 * P (in US unit) and R = 0.5 * P *1.73 (in Metric unit). [Roose (1975) cited in Morgan
(1994)].
The above formulas applied in different parts of the world. The first equation appears to work
well for Peninsular Malaysia, whereas the application for other countries is less satisfactory.
Especially with the annual rainfall below 900mm, the equation yields estimates of erosivity,
which are obviously meaningless (Morgan, 1994). In line with this, the second equation needs the
value of I30 for calculating of erosivity factor, which is difficult to get in context of the study area.
However, rainfall kinetic energy and intensity data are not available most cases. Therefore, the
erosivity factor calculated according to the equation given by Hurni (1985), derived from a spatial
regression analysis (Hellden, 1987) for Ethiopian conditions based on the easily available mean
annual rainfall (P).
R = -8.12+0.562*P; Where, P is the mean annual rainfall, mm
Soil Erodibility Factor (K). Physical characteristics of the soil greatly influence the rate at which
different soils eroded. Some more important soil properties such as the soil permeability,
infiltration rate, soil texture, size & stability of soil structure, organic content and soil depth, also
affect the soil loss in large extent. The soil erodibility factor (K), expressed as tones of soil loss
per hectare per unit rainfall (erosivity) index from a field of 9 percent slope and 22 meters as field
length. The erodibility factor (K) is determined by considering the soil loss from continuous
cultivated fallow land without the influence of crop cover or management. A nomograph to
estimate K for a given soil on which it not known presented or calculated from the regression
equation:
)3(103.3)2(103.4)12(108.2 3314.17 cbaMK.
Where M = Particle size parameter (%silt + %very fine sand) x (100-% clay), a = Percent organic
matter, b = soil structure code (very fine granular, 1; fine granular, 2; medium or coarse granular,
3; blocky, platy, or massive, 4), c = Profile permeability class (rapid, 1; moderate to rapid,2;
moderate,3;slow to moderate, 4;slow, 5; very slow, 6).
The value of K ranges from 0 to 1. Hellden (1987) developed a USLE for Ethiopian condition by
adapting different sources and proposed the K values of the soil based on their color. Factor data
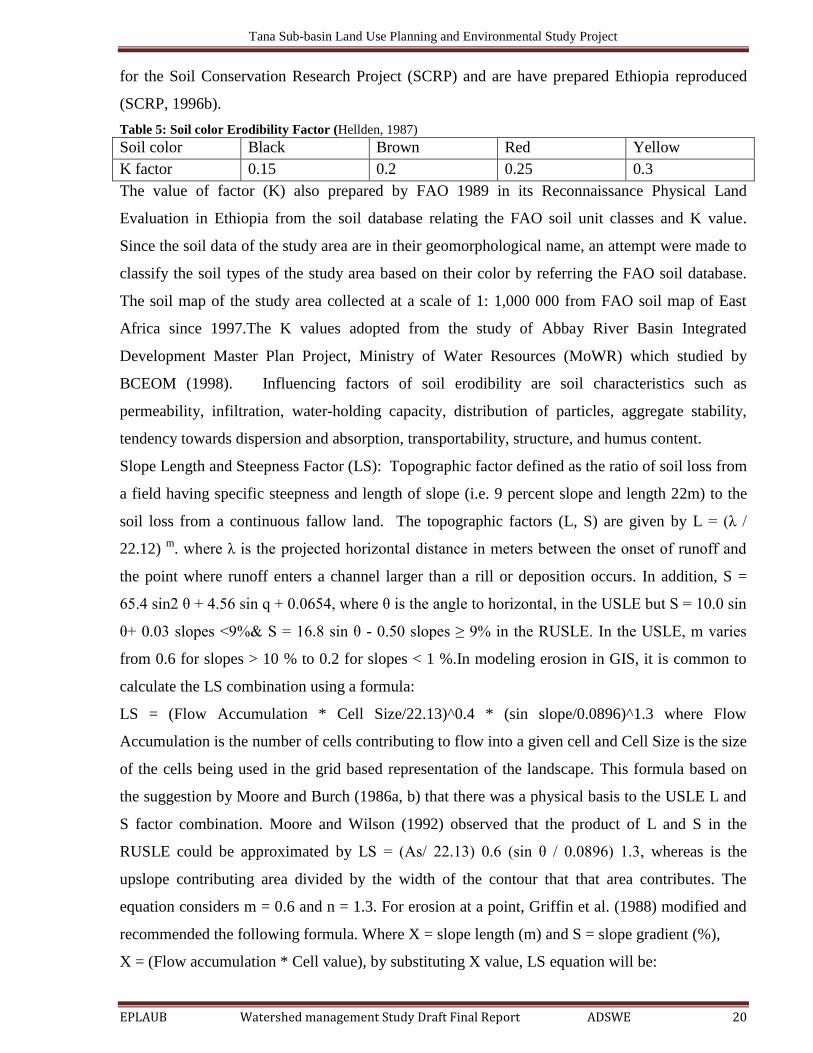
Tana Sub-basin Land Use Planning and Environmental Study Project
EPLAUB Watershed management Study Draft Final Report ADSWE 20
for the Soil Conservation Research Project (SCRP) and are have prepared Ethiopia reproduced
(SCRP, 1996b).
Table 5: Soil color Erodibility Factor (Hellden, 1987)
Soil color Black Brown Red Yellow
K factor 0.15 0.2 0.25 0.3
The value of factor (K) also prepared by FAO 1989 in its Reconnaissance Physical Land
Evaluation in Ethiopia from the soil database relating the FAO soil unit classes and K value.
Since the soil data of the study area are in their geomorphological name, an attempt were made to
classify the soil types of the study area based on their color by referring the FAO soil database.
The soil map of the study area collected at a scale of 1: 1,000 000 from FAO soil map of East
Africa since 1997.The K values adopted from the study of Abbay River Basin Integrated
Development Master Plan Project, Ministry of Water Resources (MoWR) which studied by
BCEOM (1998). Influencing factors of soil erodibility are soil characteristics such as
permeability, infiltration, water-holding capacity, distribution of particles, aggregate stability,
tendency towards dispersion and absorption, transportability, structure, and humus content.
Slope Length and Steepness Factor (LS): Topographic factor defined as the ratio of soil loss from
a field having specific steepness and length of slope (i.e. 9 percent slope and length 22m) to the
soil loss from a continuous fallow land. The topographic factors (L, S) are given by L = (λ /
22.12) m
. where λ is the projected horizontal distance in meters between the onset of runoff and
the point where runoff enters a channel larger than a rill or deposition occurs. In addition, S =
65.4 sin2 θ + 4.56 sin q + 0.0654, where θ is the angle to horizontal, in the USLE but S = 10.0 sin
θ+ 0.03 slopes <9%& S = 16.8 sin θ - 0.50 slopes ≥ 9% in the RUSLE. In the USLE, m varies
from 0.6 for slopes > 10 % to 0.2 for slopes < 1 %.In modeling erosion in GIS, it is common to
calculate the LS combination using a formula:
LS = (Flow Accumulation * Cell Size/22.13)^0.4 * (sin slope/0.0896)^1.3 where Flow
Accumulation is the number of cells contributing to flow into a given cell and Cell Size is the size
of the cells being used in the grid based representation of the landscape. This formula based on
the suggestion by Moore and Burch (1986a, b) that there was a physical basis to the USLE L and
S factor combination. Moore and Wilson (1992) observed that the product of L and S in the
RUSLE could be approximated by LS = (As/ 22.13) 0.6 (sin θ / 0.0896) 1.3, whereas is the
upslope contributing area divided by the width of the contour that that area contributes. The
equation considers m = 0.6 and n = 1.3. For erosion at a point, Griffin et al. (1988) modified and
recommended the following formula. Where X = slope length (m) and S = slope gradient (%),
X = (Flow accumulation * Cell value), by substituting X value, LS equation will be:

Tana Sub-basin Land Use Planning and Environmental Study Project
EPLAUB Watershed management Study Draft Final Report ADSWE 21
LS = (Flow accumulation * Cell value /22.1) 0.6
(sin (S)*0.01745 / 0.09)1.3
LS = (X/22.1)0.6
(sin(S) *0.01745/0.09)1.3
The values of X and S will be derived from DEM. Contours at 20 m intervals were digitized from
a1: 50 000 scale topographic map and from this contour TIN is created and converted to DEM
(Raster) with 100m output cell size. To calculate the X value, Flow Accumulation derived from
the DEM after conducting FILL and Flow Direction processes in Arc GIS 9.By building an
expression in the Raster Calculator:
The slope length and gradient factors estimated from Digital Elevation Model data in the GIS
environment. The technique described here for computing LS requires a flow accumulation grid
layer and slope grid layer. The flow accumulation computed from hydro logically corrected DEM
(Digital Elevation Model). Flow accumulation grid represents number of grid cells that are
contributing for the downward flow. The cell size of the DEM represents the length of the cell.
LS = (Flow Accumulation*Cell size/22.13)0.4
*(Sin slope/0.896)1.3
Where: - Cell size- represents the field slope length;22.13 is the length of the research field
plot where the equation derived.
Land cover factor (C): the Land Cover factor represents the ratio of soil loss under a given land
cover to that of the base soil (Morgan, 1994). As Nyssen, (1997) commented, the land cover
factor „C‟, is of paramount importance in the determination of erosion hazard assessment because
of the large difference between its minimum and maximum values therefore slight mistakes in
land cover mapping can result in large over or under estimations of soil loss. For this reason, up-
to-date and accurate land cover map used for analyzing the c-value. After changing the classified
vector data to grid, a corresponding C-value assigned to each land use classes using reclassify
method in Arc GIS 9.3.
Conservation Practices Factor (P): It may be defined as the ratio of soil loss for a given
conservation practice to the soil loss, obtained from up and down the slope. The conservation
practice consists of mainly contouring, terracing and strip cropping, in which contouring appears
to be most effective practice on medium slope ranging from 2 to 7 percent. The soil loss from
contouring ranges about one-half of the total soil loss that occurs from up and down hill farming
system. In general, as land slope decreases from medium to zero, the effectiveness of contour
tillage to reduce soil loss decreases, compared to the non-contoured tillage field. Similarly, when
land slope increases from medium to steep slope, the contour row diminishes its capacity to
reduce the soil erosion or loss, because of having a very little capacity to detain the water on soil.

Tana Sub-basin Land Use Planning and Environmental Study Project
EPLAUB Watershed management Study Draft Final Report ADSWE 22
In strip cropping, the meadow strips alternate with grain strips tend to slow down the surface flow
and thereby catching of eroded soil from cultivated strips achieved. Similarly, the terraces in hilly
areas intercept the surface flow down the slope before attaining to an erosive velocity to damage
to land. From filed observations, found that when strip cropping adopted with the terracing
practice, then it becomes more effective to control erosion and soil loss.
The conservation practice P found from the equation
tsc PPPP
Where Pc = contouring factor based on slope;
Ps = strip cropping factor for crop strip widths recommended (1.0 for contouring only or for
alternating strips of corn and small grain, 0.75 for 4-year rotation with 2 years of row crop, and
0.50 with 1 year of row crop);
Pt = terrace sedimentation factor (1.0 for no terraces, 0.2 for terraces with graded channel sod
outlets, and 0.1 for terraces with underground outlets).The Pt factor will predict the amount of
sediment actually delivered from a given terrace. It is possible to predict either sediment detached
from the cropping area, and not include the terrace factor, or sediment leaving the field, and
include the terrace factor.
The erosion management practice, P value, is also one factor that governs the soil erosion rate.
The P-value ranges from 0-1 depending on the soil management activities employed in the
specific plot of land. These management activities are highly depends on the slope of the area.
Wischmeier and Smith (1978) calculated the P-value by delineating the land in to two major land
uses, agricultural land and other land. The agricultural land sub-divided in to six classes based on
the slope percent to assign different P-value.
Table 6: P- value (Wischemeier and Smith, 1978)
Land use type Slope % P-factor
Agricultural land
0-5 0.1
5-10 0.12
10-20 0.14
20-30 0.19
30-50 0.25
50-100 0.33
Other All 1.00
2.12.2.3Soil Loss Tolerance (T)
Since erosion is a natural process not prevented, but it reduced to an acceptable rate (Morgan,
1986). The maximum acceptable rate of soil erosion is the soil loss tolerance (Morgan, 1995).
The only tolerable rate of soil loss equals the rate of soil formation. However, although the rates
of soil loss measured, the rates of soil formation are so slow that they cannot be easily

Tana Sub-basin Land Use Planning and Environmental Study Project
EPLAUB Watershed management Study Draft Final Report ADSWE 23
determined. The rate of soil formation throughout the world estimated to range from 0.001 to 7.7
mm/y (Buol et al., 1973) and the average is about 0.1mm/y (Zachar, 1982). In Ethiopia, Hurni
(1983 quoted by Nyssen,2003),categorized average soil formation rates based on the agro-
climatic zones which are delimited based on altitude(m) and annual rainfall(mm).Accordingly the
soil formation rates ranged from 1tone/ha/year for Bereha „desert‟(altitude,500m)to 16
tone/ha/year for Wet Woina Dega (altitude:1500-2300m;annual rainfall.1400mm) agro-climatic
zones.
Due to a wide variability of conditions affecting the rate of soil formation in a given locality,
current values for soil loss tolerance are uncertain. Morgan (1995) also indicated that a better
guideline to estimate tolerable soil loss an assessment of the rate of natural soil loss in the
area.Soils with shallow root zone or other restricting characteristics generally assigned lower
tolerances (Kirkby and Morgan, 1980 quoted by Smith et al., 1997).Deep, medium textured,
moderately permeable soils with subsoil characteristics favorable for plant growth assigned
tolerances of up to 11 tone/ha/yr (Smith et al., 1997) soil loss tolerances of 3 to 10 tone/ha/yr
therefore considered for practical purposes.
The objective of conservation planning is to control average annual soil loss to a particular level,
which is usually soil loss tolerance (T). Shallow and fragile soils that not be easily reclaimed after
serious erosion are assigned low tolerance values. Limiting soil loss to tolerance controls erosion
so that soil protected as a natural resource and its productive capacity maintained for an extended
period. Soil loss tolerance considers the damages caused by erosion and the benefits of soil
conservation.
Soil loss values principally developed for cropland soils, Tolerance values also used for
conservation planning for reclaimed surface mines, landfills and military training sites.
Controlling erosion greatly facilitates establishing vegetation. For example, applied mulch cover
controls erosion and promotes seed germination and early growth of vegetation. In addition,
erosion control regulations for reclaimed land require that excessive rilling prevented. A rule of
thumb is that rilling begins when soil loss exceeds about 7 tons per acre (15 tons per hectare) per
year, which is met by tolerance values less than 5 tons per acre (11 t/ha) per year.
Soil tolerance values are primarily for protecting the soil as a natural resource and not for
protecting offsite resources from excessive sedimentation or water quality degradation. The
criteria for controlling sediment yield from a site based on how both amount and sediment
characteristics affect the resource. The usual approach for using soil loss tolerance in

Tana Sub-basin Land Use Planning and Environmental Study Project
EPLAUB Watershed management Study Draft Final Report ADSWE 24
conservation planning is to assume a uniform slope having a slope from the origin of overland
flow to either where deposition occurs.

Tana Sub-basin Land Use Planning and Environmental Study Project
EPLAUB Watershed management Study Draft Final Report ADSWE 25
3. MATERIALS AND METHODS
3.1 Description of the Study Area
Tana sub basin found in the Amhara region. Geographically, the basin is located between North
latitude 1210669m – 1411084m and East longitude 254549 - 416363m. Its elevation is ranging
1327 - 4109 meter above sea level. The basin has a total area of 1,579,096.94 hectares. It is one of
the most important potential areas for all development in Amhara region. The largest lake in
Ethiopia, Lake Tana found in the sub basin.
Parts or the whole of 29 Woredas and 4 administrative zones are encompasses in the sub-basin.
These include Banja, Fageta Lekuma and Dangila Woredas in Awi zone. Sekela, South Achefer,
North Achefer, Mecha and Bahir Dar Zuria Woredas in West Gojjam zone. BahirDar Town in
BahirDar Liyu zone; Dera, Estie, Farta, Libo Kemkem, Ebinat and Fogera Woredas in South
Gondar zone; Debre Tabor Town in Debre Tabor Town Administration; Gondar Zuria, Wogera,
Lay Armachiho, Dembia, Chilga, Alefa and Takusa in North Gondar zone and Gondar Town in
Gondar Town Administration
Figure 3: Map of Tana sub basin

Tana Sub-basin Land Use Planning and Environmental Study Project
EPLAUB Watershed management Study Draft Final Report ADSWE 26
Human population in Tana Sub Basin is generally homogeneous linguistically and consists of the
main ethnic families of Amhara. According to CSAs 2007 census and Woredas, the study area
has a total population of 3,158,247 with male 1,587,394and female 1,570,853 this is about 16
percent of the total regional population. The very big proportion or 76.9 percent of the population
of the area is living in rural areas where as the remaining 23.1 percent are concentrated in urban
and semi urban centers. The settlement pattern of the study area is dominantly scattered and the
average population density of the area is 200 persons per km square.
The sub basin is endowed with eight different agro-climatic zones namely, moist tepid, sub-
humid tepid, moist cool, moist warm, moist cold, moist very cold, sub-humid cool and sub-humid
cold. Most of the project area (79.4%) is found in moist tepid agro climatic zone followed by sub-
humid tepid, moist cool and sub-humid cool which account for 12%, 5% and 3% respectively.
The area dominated by one main rainy season, from June to September and one dry season
between October and May. The rainfall distribution of area is controlled by the northward and
southward movement of the inter-tropical convergence zone (ITCZ) resulting in a single rainy
season.
Physiographically, Tana sub basin is categorized under four major watersheds, namely Megech,
Rib, Gumara and Gilgel Abay. The sub basin is diverse topographic feature ranges from lowland
plain, mountainous and raged topography cover. The large plain areas around Lake Tana are often
flooded during the rainy season, such as the Shesher and Welela plain in the east, the Dembia
plain in the north, the Kunzila plain in the west, and marshlands at the peripheries of the whole
lake. The mountainous terrain and raged topography (Guna Mountain, Parts of Sekela, Wegera,
Lay Armhachoiew, Libokemkem, Gonder zuria West Belesa ,Ebinat, Farta and Quriet).
River Megech, Rib, Gumara and Gilgel Abbay are the main permanent water resources in the
Basin, However, the Megech and Rib rivers sometimes dries-up at downstream during the dry
seasons. Both Rivers used to supply water for human and livestock consumption and for crop
irrigation. The others seasonal rivers originate from the upper in the mountainous range in the
north and in hilly zones in the inter-riverine area of river Megech and Rib are also other sources
of water. RiverInfranz, River Jema, River Awra Arda, River Derba, River Arno-Garno, River
Shine, River Selamko, River Dengura are some of prominent seasonal rivers found in the study
area.
The sub basin is one among the other agrarian areas of the nation, where by Agricultural field
crop production is predominantly prevailing. With this respect, Agriculture production is the
mainstay for the livelihood of people in the sub basin. Beyond the presence of huge arable land
Tana Sub-basin Land Use Planning and Environmental Study Project
EPLAUB Watershed management Study Draft Final Report ADSWE 27
resource, the sub basin adequately endowed with a wide variety of indigenous plants with a
unique heritage of diverse germplasm of vegetables, fruits, oil crops, forages, tubers, cereals and
pulses. Teff, Noug, safflower, rapeseed, caster bean, Gesho, are among indigenous plants grown
in the basin. Maize, sorghum, beans, barley finger millet, wheat, chickpea and others are
commonly grown crops.
Livestock constitutes a major part of the farming system next to crop production, providing draft
power, producing milk and conferring a certain degree of security against crop failures. However,
performance in the production of the major food commodities of livestock origin has been poor
compared with other African countries, including neighboring Kenya (IFAD/EPLAUA, 2007).
Inadequate feed and nutrition, widespread diseases and poor health, poor breeding stock, and
infrastructure as major constraints affecting livestock performance.
Forest resource offer the main energy supply is one of the most dynamic economic activity in sub
basin; it also contribute to sustainable agricultural systems; and are a source for agro-biodiversity
and a major storehouse for carbon and water. However, Forest resource in the sub basin depleted,
biodiversity is declining, timber and non-timber forest products and services weakened, and most
of the important biological endemic species, that have a potential to sustain the livelihood in the
basin, are now vulnerable.
The sub basin is rich in fish and wetland resources. However, the fishery of Lake Tana is at an
early stage of development due to low level of technology employed by fishery man and a lack of
marketing facilities. On other hand the wetlands resources also declining due to ever-increasing
populationin the study area coupled with inappropriate land use and wetland management system.
The position of the basin in its cultural heritage is remarkable. For example, Some 37 islands &
21 monasteries surviving remnants of a very old meditative tradition have been used as safe
keeping places for the religious relics and art treasures during the times of trouble. In addition,
these monasteries from all corners of the country have architectural significances, beautiful mural
paintings and icons, as well as numerous strikingly illustrated parchments and intricately
decorated processional and hand crosses. It is also house myriads of treasures, beautiful mural
paintings, icons, parchment manuscripts, scrolls and emperors assets. However, efforts and
progress made on archaeological searches for historical values in the area are still at infancy. As a
result, most of the attractions including those that have been declared world heritage by UNESCO
have long suffered from severe deterioration by both natural calamities and human interferences

Tana Sub-basin Land Use Planning and Environmental Study Project
EPLAUB Watershed management Study Draft Final Report ADSWE 28
3.1.1 Slope
The slope class generated from DEM indicates that the sub basin has slope classes ranging from
0 to 60% and above.
Figure 4: slope map of the sub basin
Table 7: Tana Sub basin slope classification
The sub basin is classified into seven slope classes and the dominant slope classes are flat and
gently sloping land form covers about 556340.3 ha (35.23%) and 302457.34 ha (19.15%)
respectively from total coverage the rest are indicated in table7.
Slope Range Land form Area_ha Coverage (%)
0-2% Flat 556340.3 35.23
2-5% Gently sloping 302457.34 19.15
5-8% Sloping 153841.57 9.74
8-15% Rolling 239789.31 15.19
15-30% Moderately steep 223945.8 14.18
30-60% Steep 97608.65 6.18
>60% Very steep 5113.96 0.32
Total 1579096.94 100.00
Tana Sub-basin Land Use Planning and Environmental Study Project
EPLAUB Watershed management Study Draft Final Report ADSWE 29
3.1.2Soil condition in the sub basin
As there is strong relation between landform and soil characteristics, samples to characterize soil
type taken as per the major landform types within the watershed. Because of similarity in
landforms, the soil characteristics are almost similar for most of the mapping units.
a) Soil color: soil color is useful indicator of drainage.
b) Soil texture: soil texture is mainly concerned with size and shape of mineral particles.
Soil erosion depends much on the infiltration rate of the soil. The infiltration rate again
depends on soil texture. Hence, the decision for selecting graded or level physical soil
conservation structures on cultivated lands mainly dependent on soil texture. For example,
for clayey soil graded structures recommended because of less infiltration rate. The
textures identified with in the sub basin are clayey, silt and sand with their textural classes.
c) Soil depth: It refers the depth of the soil above a layer of hard rocks, stones or other
materials, which hinder root penetration. In this basin soil depth classes from shallow to
very deep with small proportion of shallow soil at the periphery of the basin.
According to the soil survey study of the sub basin, the total area covered with 12 major soils.
These are Acrisols, Alisols, Ferralsols, Gleysols lixisols Cambisols, Fluvisols, Leptosols,
Luvisols, Nistosols Vertisols and Regosols. From the twelve major soils identified Vertisols,
Luvisols and Nistosols are the dominant soils in the study area.
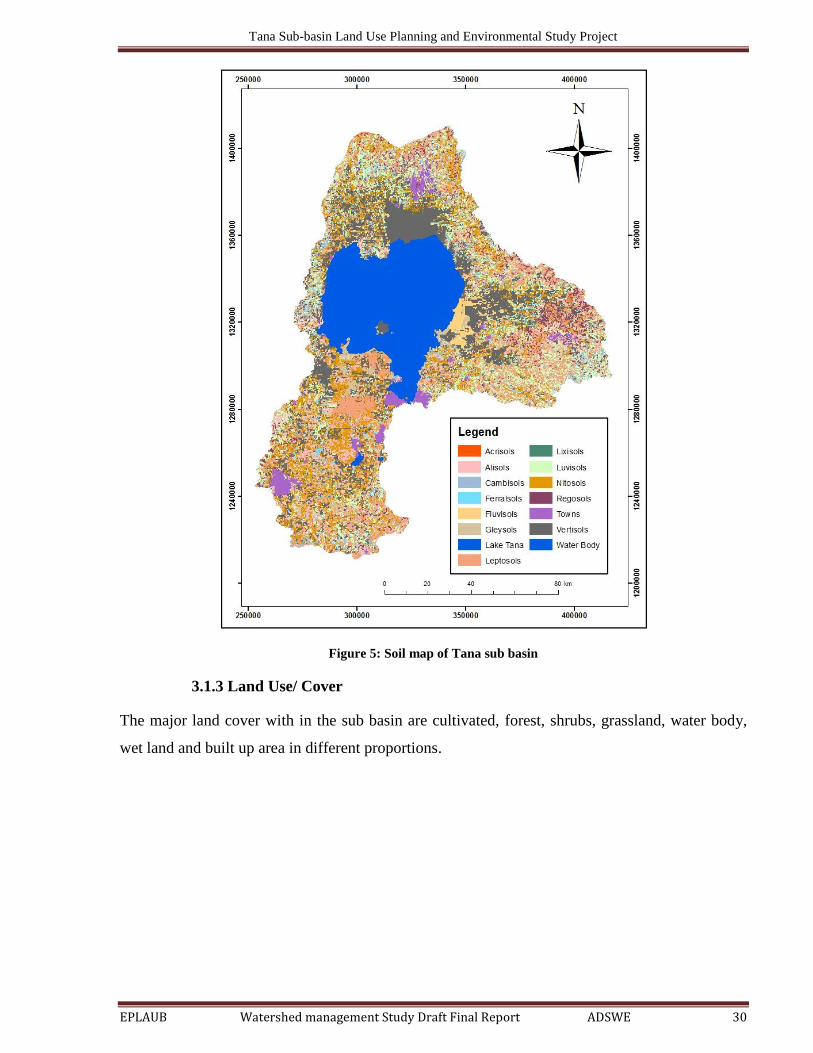
Tana Sub-basin Land Use Planning and Environmental Study Project
EPLAUB Watershed management Study Draft Final Report ADSWE 30
Figure 5: Soil map of Tana sub basin
3.1.3 Land Use/ Cover
The major land cover with in the sub basin are cultivated, forest, shrubs, grassland, water body,
wet land and built up area in different proportions.

Tana Sub-basin Land Use Planning and Environmental Study Project
EPLAUB Watershed management Study Draft Final Report ADSWE 31
Figure 6: Major land use land cover of the sub basin
3.2 Materials and Equipment
The watershed management study of the Tana Sub-Basin conducted under the Amhara Design &
Supervision Works Enterprise, Land Use Planning and Environmental Studies Work Process,
Tana Sub-Basin Land Use Planning Project, utilized different materials. These materials collected
from different offices Ethiopian mapping agency (EMA), Amhara Design & Supervision Works
Enterprise and Amhara Region.
The following materials used for the study:
Computer facility with GIS and Remote sensing programs;
Field data collection format prepared for the study;
GPS with Alkaline battery;

Tana Sub-basin Land Use Planning and Environmental Study Project
EPLAUB Watershed management Study Draft Final Report ADSWE 32
Tape meter
Digital data like administrative maps, satellite imagery, FAO digital soil map,
ASTER_DEM data.
3.3 Methodology
The methodology employed includes collection of primary and secondary data at field
level. The primary data collected in the field by using checklists of biophysical land resources
survey based on the prepared land cover, slope class and by asking key informants. The
secondary data collected from development agents and woreda expert by using readily made
questionnaires and by making discussion with the concerned experts. Soil erosion by water
estimated using RUSLE model. The study approaches and procedures exercised during different
stages of the study include pre-field work, fieldwork, and post fieldwork activities.
3.3.1 Pre Field
Base Map Preparation
During pre-field work, the main activities were concentrated on base map preparation. To make
the land resources survey activity simple and economical the Digital elevation Model (DEM) and
satellite imagery (Land Sat and Spot_2.5) of the project area were collected and land use / land
cover, shape file were developed. In addition to the Land use / cover base map, the watershed
boundaries, drainage lines and their networks and slope of each watershed extracted from 90m
DEM data by using Arc-Hydro tool extension in the ArcGIS environment.
Guideline development/Preparation
The general guideline for detailed land use planning project was prepared.
Preparation of check lists and questionnaires for:
Field data collection format prepared for biophysical survey.
Secondary data format was prepared.
The observation point selected based on the prepared base map at different slope class.
3.3.2 At Field
The following activities were undertaking; the sub basin fully covered during the study. Hence,
the primary and secondary data of the study collected.
Primary Data Collection
The study conducted mainly by primary data collection. Field observation of selected sites and
transects along selected routes with the aid of GPS and maps to investigate different biophysical

Tana Sub-basin Land Use Planning and Environmental Study Project
EPLAUB Watershed management Study Draft Final Report ADSWE 33
data, land form, land cover and forms of soil erosion, soil depth and stoniness, flood marks and
conservation practices. Inaddition, qualitativedescription made.
Secondary Data Collection
The secondary data collected from woreda and regional experts by using readily made
questionnaires and by making discussion with the concerned experts.
3.3.3 Post Field
3.3.3.1 Data Analysis and Interpretation
Watershed Delineation
By using Arc GIS and Arc Hydro, Arc SWAT software extensions further watershed delineation
done for large watersheds based on community based participatory watershed principles and the
final name and number of watersheds identified
Land degradation actually is a land quality considered in land use planning as it influences the
utilization of the land; it is the result of the complex interaction between biophysical& socio-
economic issues.
Land degradation assessment; an expression for the quality of the land is one form of land
resources assessment & conducted on qualitative& quantitative indicators. Qualitatively the sub
basin classified as; fragile, instable; moderately stable and stable taking climate aridity
&population density as fragility indicators of land degradation. Quantitatively the area was
assessed taking soil erosion hazard as an indicator for quantitative land degradation. To assess
soil erosion hazard for the project area Revised Universal Soil Loss Equation (RUSLE) approach
followed.
The land degradation map developed on ArcGIS environment by using RUSLE parameters
(rainfall erosivity; soil erodibility; slope length and gradient; land cover; and land management
practices) as an input to assess average annual soil loss rate of the area. The mathematical
equation represented on physical based models in the ArcGIS environment. Each variable
overlaid to make the overall spatial analysis. The schematic flow diagram below represents the
interaction and step-by-step activities of the analysis.
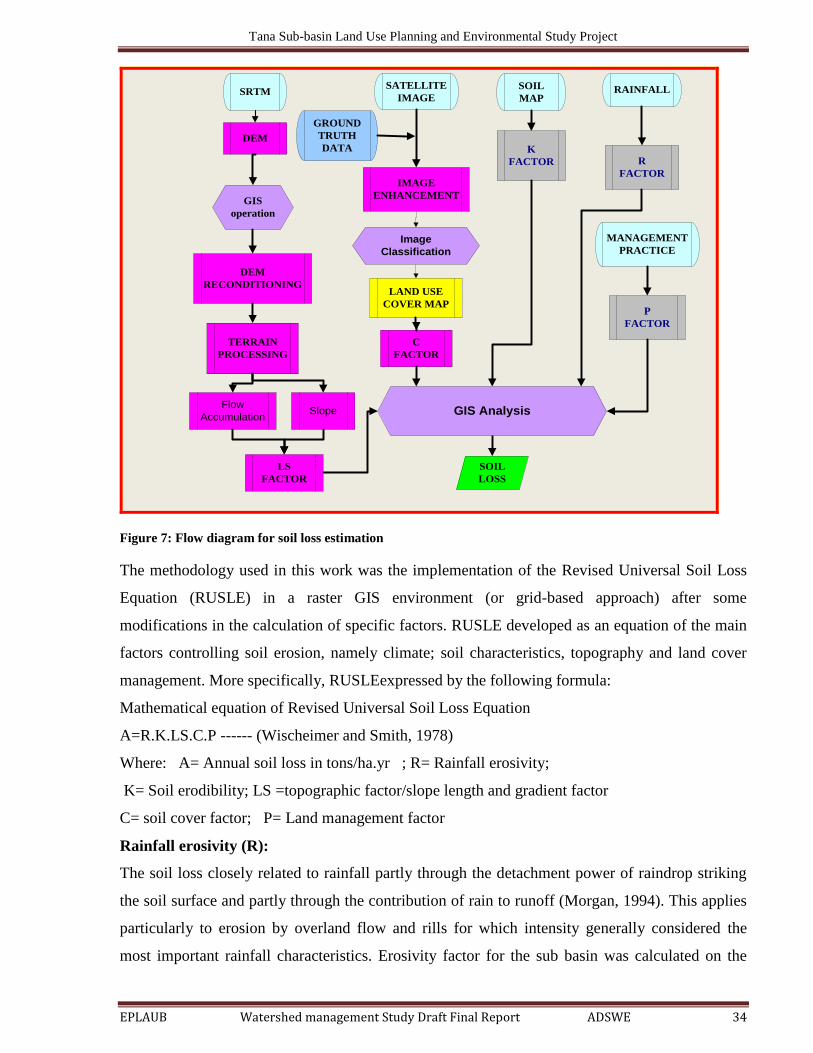
Tana Sub-basin Land Use Planning and Environmental Study Project
EPLAUB Watershed management Study Draft Final Report ADSWE 34
SRTMSATELLITE
IMAGE
SOIL
MAP
DEM
IMAGE
ENHANCEMENT
LAND USE
COVER MAP
TERRAIN
PROCESSING
DEM
RECONDITIONING
GROUND
TRUTH
DATA
RAINFALL
R
FACTOR
K
FACTOR
P
FACTOR
MANAGEMENT
PRACTICE
C
FACTOR
SOIL
LOSS
LS
FACTOR
GIS
operation
GIS Analysis
Image
Classification
Flow
AccumulationSlope
Figure 7: Flow diagram for soil loss estimation
The methodology used in this work was the implementation of the Revised Universal Soil Loss
Equation (RUSLE) in a raster GIS environment (or grid-based approach) after some
modifications in the calculation of specific factors. RUSLE developed as an equation of the main
factors controlling soil erosion, namely climate; soil characteristics, topography and land cover
management. More specifically, RUSLEexpressed by the following formula:
Mathematical equation of Revised Universal Soil Loss Equation
A=R.K.LS.C.P ------ (Wischeimer and Smith, 1978)
Where: A= Annual soil loss in tons/ha.yr ; R= Rainfall erosivity;
K= Soil erodibility; LS =topographic factor/slope length and gradient factor
C= soil cover factor; P= Land management factor
Rainfall erosivity (R):
The soil loss closely related to rainfall partly through the detachment power of raindrop striking
the soil surface and partly through the contribution of rain to runoff (Morgan, 1994). This applies
particularly to erosion by overland flow and rills for which intensity generally considered the
most important rainfall characteristics. Erosivity factor for the sub basin was calculated on the

Tana Sub-basin Land Use Planning and Environmental Study Project
EPLAUB Watershed management Study Draft Final Report ADSWE 35
bases of mean annual rainfall data of each station according to the equation given by Hurni
(1985), derived from a spatial regression analysis (Hellden,1987) for Ethiopian conditions based
on the easily available mean annual rainfall (P) and given by a regression equation:
R = -8.12+0.562*P
Where: R= Rainfall erosivity factor, and P= Mean annual rainfall in mm
The mean point rainfall data changed area based by using Thissen polygon method to calculate
erosivity value of the sub basin.
Soil Erodibility (K):
The soil erodibility factor characterizes more or less the soil sensitivity towards erosional force
(Wischmeier and Mannering, 1969, Blume, 1992). Influencing factors of soil erodibility are soil
characteristics such as permeability, infiltration, water-holding capacity, distribution of particles,
aggregate stability, tendency towards dispersion and absorption, transportability, structure, and
humus content. The soilerodibility calculated from the generated soils map of the project area and
raster form used. The erodibility value estimated based major soil type on FAO classification
used.
Slope length and gradient factor (LS):
The slope length and gradient factors estimated from digital elevation model data in the GIS
environment. The technique described here for computing LS requires a flow accumulation grid
layer and slope grid layer. The flow accumulation computed from hydrologically corrected DEM
(Digital Elevation Model). Flow accumulation grid represents number of grid cells that are
contributing for the downward flow. The cell size of the DEM represents the length of the cell.
LS= Power (Flow Length, 0.3)/22.13*Power ("Slope"/9, 1.3)developed by (Griffin et al. 1988)
LS= (Flow Accumulation*Cell size/22.13)0.4
*(Sin slope/0.896)1.3
Where: - Cellsize- represents the field slope length
- 22.13 is the length of the research field plot where the equation was derived
Land use/cover (C)
The land cover factor calculated by using the land use/cover map as an input. Each cover value of
the project area synchronized with the adopted C-value in Ethiopian condition. The land
cover/use map was developing from the LandSat Imagery by using Arc-GIS.
Land management practice (P)
The management practice estimated from land use maps and data from biophysical & soil survey.
The P-value estimatedbased on the land cover and slope map of the sub basin supper imposed.

Tana Sub-basin Land Use Planning and Environmental Study Project
EPLAUB Watershed management Study Draft Final Report ADSWE 36
The intersection of the two maps/polygons helps us to determine the P-value spatially though GIS
environment.
Finally, all the five the layers were superimposed and the parameters multiplied according to the
general RUSLE formula. These values gave annual soil loss per hectare per year at pixel level.
Sediment Yield
Considering that only, some of the eroded soils routed to the basin outlet, knowing the ratio
between the basin sediment yield at the basin outlet and soil erosion over the sub basin, sediment
delivery ratio (SDR), is important for the decision makers. The RUSLE calculates soil loss forced
by rainfall but does not consider the SDR. To generate the sediment yield at the outlet, empirical
equations carried out.
SDR = A-0.2
Where SDR:Sediment delivery ratio and
A: area of the Sub basin.
The SDR physically means the ratio of the sediment routed to the outlet over the sub basin, both
overland and channel.
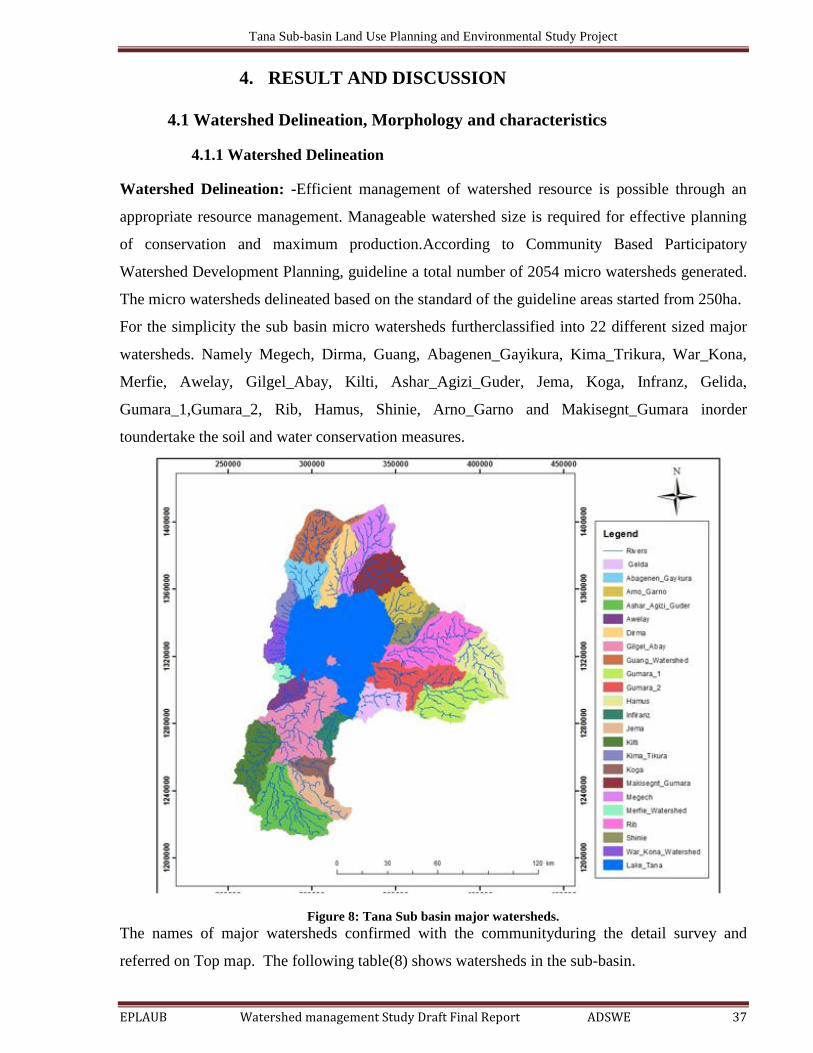
Tana Sub-basin Land Use Planning and Environmental Study Project
EPLAUB Watershed management Study Draft Final Report ADSWE 37
4. RESULT AND DISCUSSION
4.1 Watershed Delineation, Morphology and characteristics
4.1.1 Watershed Delineation
Watershed Delineation: -Efficient management of watershed resource is possible through an
appropriate resource management. Manageable watershed size is required for effective planning
of conservation and maximum production.According to Community Based Participatory
Watershed Development Planning, guideline a total number of 2054 micro watersheds generated.
The micro watersheds delineated based on the standard of the guideline areas started from 250ha.
For the simplicity the sub basin micro watersheds furtherclassified into 22 different sized major
watersheds. Namely Megech, Dirma, Guang, Abagenen_Gayikura, Kima_Trikura, War_Kona,
Merfie, Awelay, Gilgel_Abay, Kilti, Ashar_Agizi_Guder, Jema, Koga, Infranz, Gelida,
Gumara_1,Gumara_2, Rib, Hamus, Shinie, Arno_Garno and Makisegnt_Gumara inorder
toundertake the soil and water conservation measures.
Figure 8: Tana Sub basin major watersheds.
The names of major watersheds confirmed with the communityduring the detail survey and
referred on Top map. The following table(8) shows watersheds in the sub-basin.

Tana Sub-basin Land Use Planning and Environmental Study Project
EPLAUB Watershed management Study Draft Final Report ADSWE 38
Table 8: Major watersheds of Tana sub basin
No Name of watershed Area_Ha % No Name of watershed Area_Ha %
1 Guang 71693.36 5.62 12 Hamus 67961.78 5.33
2 Ashar_Agizi_Guder 116753.24 9.15 13 Infiranz 25159.29 1.97
3 Merfie 10753.12 0.84 14 Jema 48544.91 3.80
4 War_Kona 27789.04 2.18 15 Kilti 73858.57 5.79
5 Arno_Garno 43575.88 3.42 16 Kima_Tikura 20290.7 1.59
6 Awelay 27527.23 2.16 17 Koga 30099.62 2.36
7 Dirma 53127.36 4.16 18 Makisegnt_Gumara 58041.37 4.55
8 Gelda 41853.22 3.28 19 Rib 108811.4 8.53
9 Gilgel_Abay 134600.81 10.55 20 Shinie 30576.2 2.40
10 Gumara_1 82606.19 6.47 21 Abagenen_Gaykura 43148.95 3.38
11 Gumara_2 81330.99 6.37 22 Megech 77828.98 6.10
4.1.2 Morphology
Most of the major watershedrivers are direct tributary of the Lake Tana. The physiographical
characteristics of a watershed influence in great measure its hydrological response and especially
the flow regime during floods and periods of drought. The concentration time, which
characterizes the speed and intensity of the watershed's reaction to a stress (rainfall), influenced
by the different morphologic characteristics. Most of the rivers in the sub basin are increase its
width and depth .This is due to poor management of the upper parts of catchment, the shape of
the watersheds is somewhat irregular and the severity become more dangerous from year to year
4.1.3 Drainage Pattern
The drainage pattern has something to do with erosion hazard and sediment yield. Most of the
major riversstart from the highland of Wogera, Ebinat, Farta, Estie, Dera, SekelaQuarit and
terminates in Lake Tana. Most of the major rivers cross a number of kebeles with in the sub basin
and the Tributaries Rivers join with the major one by traveling so many kilometers. This indicates
that all the parts upper of the watershed contribute high amount run- off to the main channel of
the river simultaneously and significantly, urban areas affect the flood flow characteristics of the
sub basin river. There for, major watersheds are dendritic drainage pattern. Most of the Fogera
and Dembiaflood plain areas affected by Megech, Gumara and Rib rivers stay as flood with a
minimum of 3-5 months during field survey observation and local people explained. This is due
to over top of the riversides and the surrounding areas.
Tana Sub-basin Land Use Planning and Environmental Study Project
EPLAUB Watershed management Study Draft Final Report ADSWE 39
4.2 Fragility Assessment
4.2.1 Climatic Fragility Assessment
Rainfall is the most important climatic factor in determining areas at risk of land degradation and
potential desertification. Rainfall plays a vital role in the development and distribution of plant
life, but the variability and extremes of rainfall can lead to soil erosion and land degradation. If
unchecked for a period, this land degradation can lead to desertification. The interaction of human
activity on the distribution of vegetation through land management practices and seemingly
benign rainfall events can make land more vulnerable to degradation. These vulnerabilities
become more acute when the prospect of climate change introduced.
Rainfall and temperature are the prime factors in determining the climate and therefore the
distribution of vegetation types. There is a strong correlation between rainfall and biomass since
water is one of primary inputs to photosynthesis. Climatologists use an “aridity index” (the ratio
of annual precipitation to potential evaporation) to help classify desert (arid) or semi-arid areas.
Dry lands exist because the annual water loss (evaporation) exceeds the annual rainfall; therefore,
these regions have a continual water deficit. Desserts are the ultimate example of a climate where
annual evaporation far exceeds the annual rainfall. In cases where the annual water deficits are
not so large, some plant life can take hold usually in the form of grasslands or steppes .With
normal climatic variability, in some years the water deficits can be greater than others but
sometimes there can be a several consecutive years of water deficit or long term drought.
The extremes of either too much or too little rainfall can produce soil erosion that can lead to land
degradation .However, soil scientists consider rainfall the most important erosion factor among
the many factors that cause soil erosion. Rainfall can erode soil by the force of raindrops, surface
and subsurface runoff, and river flooding. The velocity of rain hitting the soil surface produces a
large amount of kinetic energy, which can dislodge soil particles. Erosion at this micro scale also
caused by easily dissoluble soil material made water-soluble.

Tana Sub-basin Land Use Planning and Environmental Study Project
EPLAUB Watershed management Study Draft Final Report ADSWE 40
Figure 9:TanaSub Basin Rainfall Fragility
Table 9: Tana Sub Basin Aridity index
N
o
Rainfall
class(mm/yr) Aridity class Coefficient Description Area(Ha)
Coverage
(%)
1 800-1200 Sub humid 0.8 Moderately Stable 469445.15 29.73
2 >1200 Humid 1.25 Stable 1109651.79 70.27
Total 1579096.94 100.00
The sub basin is fall down in to two aridity indices 70.27% of the area is stable and 29.73% is
moderately stable.
4.2.2 Slope Fragility of Watershed
This factor influences soil erodibility in that it controls surface run-off stability of catchment or
watershed classified as follows; catchment considered critical if more than 30% of its land area
has slopes steeper than 50% gradient.
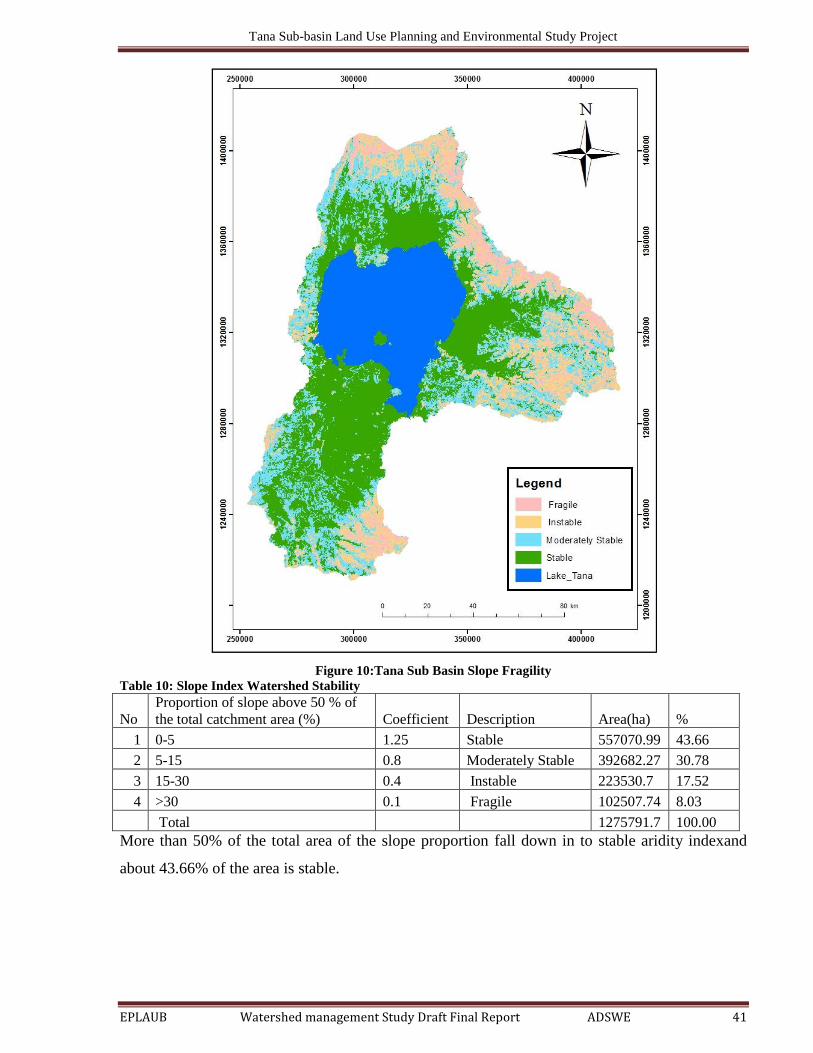
Tana Sub-basin Land Use Planning and Environmental Study Project
EPLAUB Watershed management Study Draft Final Report ADSWE 41
Figure 10:Tana Sub Basin Slope Fragility
Table 10: Slope Index Watershed Stability
No
Proportion of slope above 50 % of
the total catchment area (%) Coefficient Description Area(ha) %
1 0-5 1.25 Stable 557070.99 43.66
2 5-15 0.8 Moderately Stable 392682.27 30.78
3 15-30 0.4 Instable 223530.7 17.52
4 >30 0.1 Fragile 102507.74 8.03
Total 1275791.7 100.00
More than 50% of the total area of the slope proportion fall down in to stable aridity indexand
about 43.66% of the area is stable.
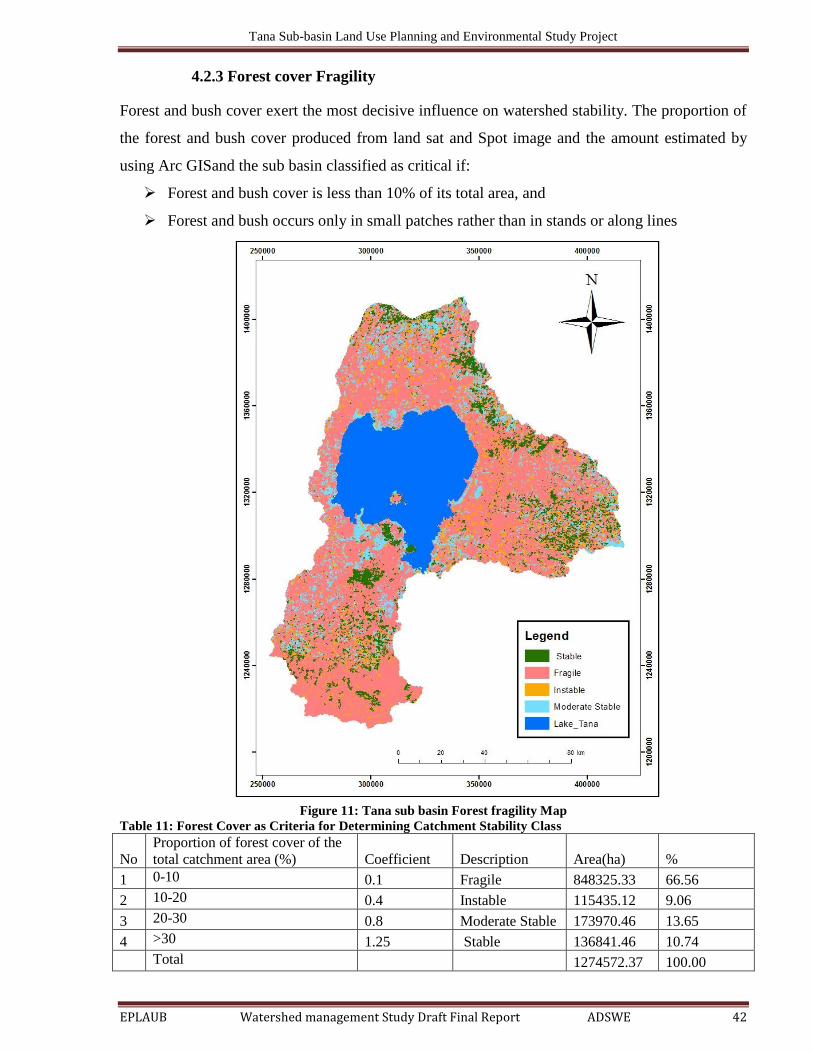
Tana Sub-basin Land Use Planning and Environmental Study Project
EPLAUB Watershed management Study Draft Final Report ADSWE 42
4.2.3 Forest cover Fragility
Forest and bush cover exert the most decisive influence on watershed stability. The proportion of
the forest and bush cover produced from land sat and Spot image and the amount estimated by
using Arc GISand the sub basin classified as critical if:
Forest and bush cover is less than 10% of its total area, and
Forest and bush occurs only in small patches rather than in stands or along lines
Figure 11: Tana sub basin Forest fragility Map
Table 11: Forest Cover as Criteria for Determining Catchment Stability Class
No
Proportion of forest cover of the
total catchment area (%) Coefficient Description Area(ha) %
1 0-10 0.1 Fragile 848325.33 66.56
2 10-20 0.4 Instable 115435.12 9.06
3 20-30 0.8 Moderate Stable 173970.46 13.65
4 >30 1.25 Stable 136841.46 10.74
Total
1274572.37 100.00

Tana Sub-basin Land Use Planning and Environmental Study Project
EPLAUB Watershed management Study Draft Final Report ADSWE 43
The stability of the sub basin by forest factor tends to fragile, 66.56%. The sub basin highly
degraded and fragile from the analysis.
4.2.4. Fragility using Population density
Rising population, soil erosion, undulating topography, and deforestation have contributed to the
rapidly declining soil fertility. The increase in human population to some extent, has also caused
increase in the population of livestock where of the human population is concentrated. The rising
human and livestock populations together have exerted pressure on the natural resources
degradation. In need of fuel and construction, the rural population depended on fully cutting trees.
Population makes the land fragile and make decline in the productive capacity of the land, or its
potential for environmental management, has been a significant factor of the low yield of
livestock in the sub-basin.In the sub-basin, the mean of population density found as 219 people/
km2 area, which is fragile and covers 100.00 % area the sub basin.
Figure 12: Tana Sub Basin Population Fragility Map

Tana Sub-basin Land Use Planning and Environmental Study Project
EPLAUB Watershed management Study Draft Final Report ADSWE 44
4.2.5 Proportion of Arable Land Affected by Erosion
The sub basin of agricultural (arable) fields affected by severe rill and/or gully erosion or show
signs of sheet erosion (exposed stones and / or roots). The border of the sub basin affected with
high amount of soil erosion and fragile. The intensively cultivated areas potential for the fragility
of the sub basin.
Figure 13: Arable land evaluation for classifying watershed stability
Table 12: Arable land as a criteria factor for determining catchment stability class
Arable Land affected by Soil Loss Description Coefficient Area(ha) %
0-5 Stable 1.25 669198.84 52.65
5-15 Moderate Stable 0.8 267406.6 21.04
15-30 Instable 0.4 114364.57 9.00
>30 Fragile 0.1 219955.5 17.31
Total 1270925.51 100.00
According to the analysis, 52.65% of the area is stable, 21.04% is moderately stable, 17.31% is
fragile and 9.00% is instable.

Tana Sub-basin Land Use Planning and Environmental Study Project
EPLAUB Watershed management Study Draft Final Report ADSWE 45
4.2.6 Average farm size fragility analysis
The average farm size of the sub basin is about 1.36ha.This is done based on the sample kebeles
of the socio economic data. However, the analysis of fragility for average farm by taking the
household data of the sample kebeles and the rest kebeles given the average farm size of the sub
basin .Based on this most of the sub basin area is moderately stable.
Figure 14: Average Farm Size Evaluation for Classifying Watershed Stability
Table 13: Average Farm as a Criteria Factor for Determining Catchment Stability Class
No
Average farm
size (Ha) Coefficient Description Area(ha) %
1 <0.5 0.1 Fragile 16211.53 1.27
2 0.5-1 0.4 Instable 52768.82 4.14
3 1-2 0.8 Moderate 1058397.51 82.98
4 >2 1.25 Stable 148121.87 11.61
Total 1275499.73 100.00
From the analysis, the 82.98% of the area is moderately stable and 11.61 % is stable which
shows that the average farmland holding in the sub basin is not as such influence for the fragility.

Tana Sub-basin Land Use Planning and Environmental Study Project
EPLAUB Watershed management Study Draft Final Report ADSWE 46
4.2.7 Total stability the sub basin
After having gathered the information for all indicators above, the respective stability coefficients
entered on general evaluation key to calculate and classify sub basin on stability basis. The six
parameters weighted overlay in Arc GIS environment to get the overall fragility analysis of the
sub basin. From the overall analysis, the sub basin is moderately stable.
Figure 15: Tana Sub Basin Weighted overlay Fragility analysis
Table 14: Tana sub basin weighted overlay fragility analysis
No Description Coefficient Area(ha) %
1 Fragile 0.1 1207.81 0.10
2 Instable 0.4 384429.66 30.30
3 Moderately stable 0.8 881989.34 69.51
4 Stable 1.25 1254.85 0.10
1268881.66 100.00
The overall fragility analysis of the sub basin result shows 69.51% is moderately stable and
30.30% is about instable. This evaluation suggests moderately stable, instable and fragile
condition need detailed management plan.
In order to control the results of the catchment rehabilitation activities, stability evaluation
repeated periodically, every 3-5 years. The result of current/future evaluation compared with the
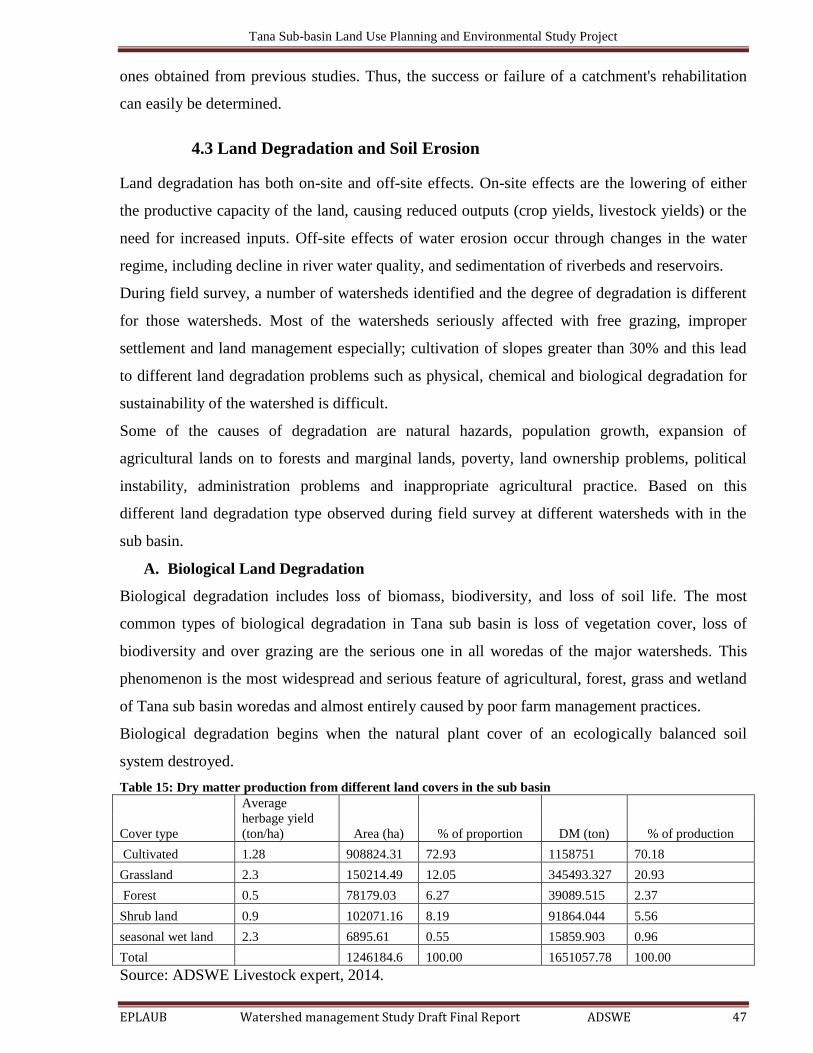
Tana Sub-basin Land Use Planning and Environmental Study Project
EPLAUB Watershed management Study Draft Final Report ADSWE 47
ones obtained from previous studies. Thus, the success or failure of a catchment's rehabilitation
can easily be determined.
4.3 Land Degradation and Soil Erosion
Land degradation has both on-site and off-site effects. On-site effects are the lowering of either
the productive capacity of the land, causing reduced outputs (crop yields, livestock yields) or the
need for increased inputs. Off-site effects of water erosion occur through changes in the water
regime, including decline in river water quality, and sedimentation of riverbeds and reservoirs.
During field survey, a number of watersheds identified and the degree of degradation is different
for those watersheds. Most of the watersheds seriously affected with free grazing, improper
settlement and land management especially; cultivation of slopes greater than 30% and this lead
to different land degradation problems such as physical, chemical and biological degradation for
sustainability of the watershed is difficult.
Some of the causes of degradation are natural hazards, population growth, expansion of
agricultural lands on to forests and marginal lands, poverty, land ownership problems, political
instability, administration problems and inappropriate agricultural practice. Based on this
different land degradation type observed during field survey at different watersheds with in the
sub basin.
A. Biological Land Degradation
Biological degradation includes loss of biomass, biodiversity, and loss of soil life. The most
common types of biological degradation in Tana sub basin is loss of vegetation cover, loss of
biodiversity and over grazing are the serious one in all woredas of the major watersheds. This
phenomenon is the most widespread and serious feature of agricultural, forest, grass and wetland
of Tana sub basin woredas and almost entirely caused by poor farm management practices.
Biological degradation begins when the natural plant cover of an ecologically balanced soil
system destroyed.
Table 15: Dry matter production from different land covers in the sub basin
Cover type
Average
herbage yield
(ton/ha) Area (ha) % of proportion DM (ton) % of production
Cultivated 1.28 908824.31 72.93 1158751 70.18
Grassland 2.3 150214.49 12.05 345493.327 20.93
Forest 0.5 78179.03 6.27 39089.515 2.37
Shrub land 0.9 102071.16 8.19 91864.044 5.56
seasonal wet land 2.3 6895.61 0.55 15859.903 0.96
Total 1246184.6 100.00 1651057.78 100.00
Source: ADSWE Livestock expert, 2014.

Tana Sub-basin Land Use Planning and Environmental Study Project
EPLAUB Watershed management Study Draft Final Report ADSWE 48
According to the table, 13 shows that high amount of dry matter produced from cultivated land
almost 70.18%,20.93 % from grassland and 5.56 % from shrub and bush land covers this
aggravate biological degradation and high amount of biomass loss from each cover and the
diversity of different land cover decreased.
B. Physical Land Degradation
Many forms of' physical degradation are secondary effects of biological degradation. Tana sub
basin affected by water erosion, stoniness, sedimentation, flooding and crusting of physical land
degradation. Sedimentation, flooding and crusting were observed in the Dembia, parts of Gonder
Zuria and Libokemkem and Fogera plains; Water erosion was observed in the high land of Lay
Armachihoew ,Wegera, Farta, Ebinat, West Belesa, Libokemkem, Alefa ,North Achefer ,Takusa
,Sekela ,Quarit, Fagita Lekoma ,Banja Shikudad, Mecha, Bahirdar Zuria and Chilga woredas.
Figure 16: Sediment deposition near Lake Tana at Takusa and Gonder Zuria Woreda, ADSWE, 2014.
C. Chemical Land Degradation
Chemical degradation due to progressive loss of soil depth of sub watersheds and was observed
plants are bared and over tapped one in their roots. The chemical land degradation is decline in
soil fertility and water pollution of different water bodies. This type of degradation extremely
affect the high land area of Mirab Belesa,Ebinat,Lay Armhachieow,Quarit, Farta,Dera and Estie
with decrease in soil fertility. Around Lake Tana and major rivers chemically affected with water
pollution by different fertilizer and sediment load. The major rivers carried the different types of
chemicals and sediment load from the upper parts of the sub basin.

Tana Sub-basin Land Use Planning and Environmental Study Project
EPLAUB Watershed management Study Draft Final Report ADSWE 49
Figure 17: Soil depth of the sub basin
Figure 18: Shallow Soil depth and Root over top of chemical degradation at Farata (right) and Dera (left)
ADSWE, 2014.
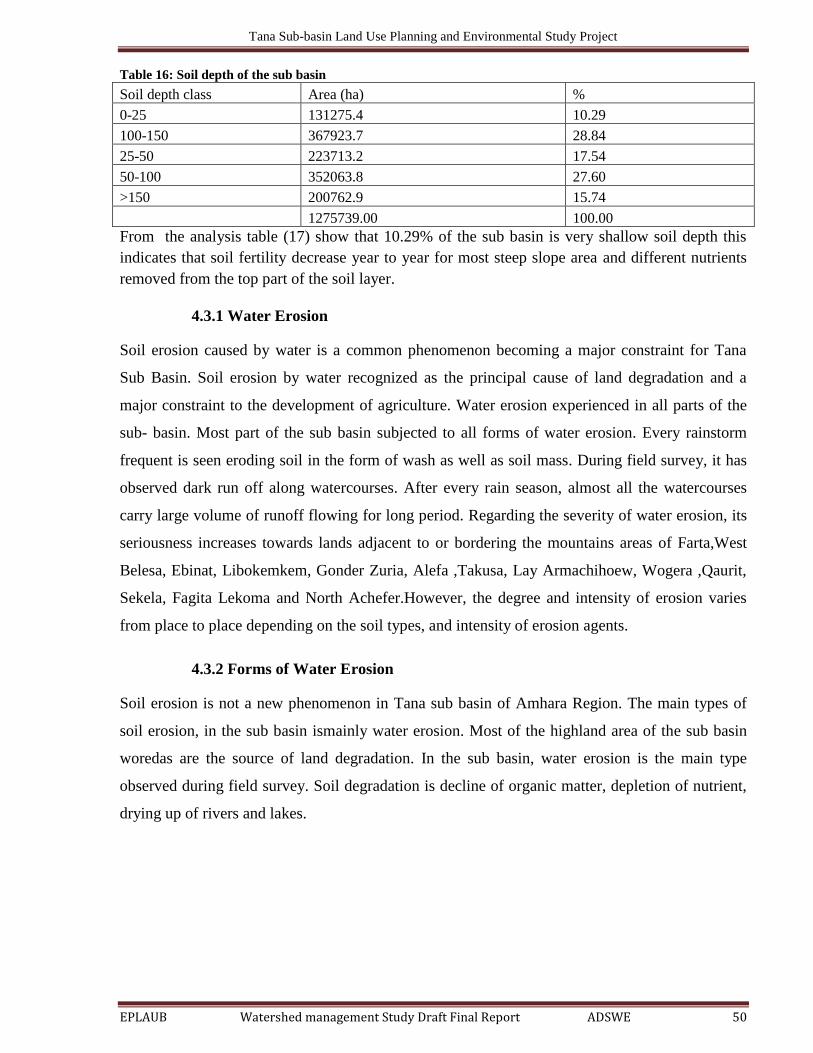
Tana Sub-basin Land Use Planning and Environmental Study Project
EPLAUB Watershed management Study Draft Final Report ADSWE 50
Table 16: Soil depth of the sub basin
Soil depth class Area (ha) %
0-25 131275.4 10.29
100-150 367923.7 28.84
25-50 223713.2 17.54
50-100 352063.8 27.60
>150 200762.9 15.74
1275739.00 100.00
From the analysis table (17) show that 10.29% of the sub basin is very shallow soil depth this
indicates that soil fertility decrease year to year for most steep slope area and different nutrients
removed from the top part of the soil layer.
4.3.1 Water Erosion
Soil erosion caused by water is a common phenomenon becoming a major constraint for Tana
Sub Basin. Soil erosion by water recognized as the principal cause of land degradation and a
major constraint to the development of agriculture. Water erosion experienced in all parts of the
sub- basin. Most part of the sub basin subjected to all forms of water erosion. Every rainstorm
frequent is seen eroding soil in the form of wash as well as soil mass. During field survey, it has
observed dark run off along watercourses. After every rain season, almost all the watercourses
carry large volume of runoff flowing for long period. Regarding the severity of water erosion, its
seriousness increases towards lands adjacent to or bordering the mountains areas of Farta,West
Belesa, Ebinat, Libokemkem, Gonder Zuria, Alefa ,Takusa, Lay Armachihoew, Wogera ,Qaurit,
Sekela, Fagita Lekoma and North Achefer.However, the degree and intensity of erosion varies
from place to place depending on the soil types, and intensity of erosion agents.
4.3.2 Forms of Water Erosion
Soil erosion is not a new phenomenon in Tana sub basin of Amhara Region. The main types of
soil erosion, in the sub basin ismainly water erosion. Most of the highland area of the sub basin
woredas are the source of land degradation. In the sub basin, water erosion is the main type
observed during field survey. Soil degradation is decline of organic matter, depletion of nutrient,
drying up of rivers and lakes.

Tana Sub-basin Land Use Planning and Environmental Study Project
EPLAUB Watershed management Study Draft Final Report ADSWE 51
Figure 19: Tana sub basin organic matter ratinganalysis
Table 17: Tana sub basin organic matter rating analysis
No Rating of OM % Rating description Area Ha %
1 <1 Very low 71611.15 5.61
2 1 - 2 Low 423310.27 33.18
3 2-4.2 Medium 618170.09 48.45
4 4.2-6 High 142073.49 11.14
5 >6 Very high 20659.01 1.62
Total 1275824.01 100.00
The amount of organic matter of the sub basin cover is about 48.45% is medium, 33.18% is low
and 11.14% is high after a few years the amount of organic matter decreased. Because the soil
degradation rate from different land use increased and area, which is not good for agriculture
practice affected by the farmers.
The other case for soil erosion problems in the sub basin is increase in human and animal
population number causes high deforestation, over grazing of hilly areas contributes, and
aggravate soil erosion towards Lake Tana. The sub basin is about a total of 4,225,464 livestock

Tana Sub-basin Land Use Planning and Environmental Study Project
EPLAUB Watershed management Study Draft Final Report ADSWE 52
population. This number indicate that over grazing for the hilly areas and aggravate soil
degradation for the sub basin.
Table 18: Tana Sub basin zonal Livestock population
Zone Cattle Sheep Goats Horses Mules Donkeys
Total
Livestock
population %
Awi 115067 82061 24114 13338 2874 9276 246730 5.84
North
Gonder 900406 282922 191003 3325 3602 87634 1468892 34.76
South Gonder 775760 288885 217005 9569 11115 89861 1392195 32.95
West Gojjam 613880 298114 117656 4864 11497 71636 1117647 26.45
2405113 951982 549778 31096 29088 258407 4225464 100.00
High livestock population 34.76 %, 32.95%, 26.45% and 5.84%at North Gonder, South Gonder,
West Gojjam and Awi zone respectively this lead to high pressure on the hilly areas and facilitate
soil erosion.
The most sever processes of soil erosion observed in the sub watersheds are: Sheet erosion rill
erosion, gully erosion, road and stream bank erosions.
Sheet Erosion: - Sheet eerosion is the removal of thin layer of soil. It is unnoticed because of the
total amount of soil removed in any storm usually is small. It removes lighter soil particles and
soluble nutrients. However, it has serious effect on soil fertility and productivity. Sheet erosion is
the dominant form of erosion observed in all woredas of the sub basin during field survey.
Table 19: Tana sub basin of sheet erosion observed data severity class
Severity class Sheet erosion observation %
Slight 40 54.79
Moderately 8 10.96
Sever 23 31.51
extremely sever 2 2.74
Total 73 100
The result show that 54.79% is slight, 37.51 sever and 10.96% moderately affected with sheet
erosion. As a whole sheet erosion is the dominant form of erosion observed in all woredas of the
sub basin during field survey
Rill Erosion: - is the next noticeable form of erosion, which exists where after sheet erosion
occurs. The symptom of rill erosion is the occurrence of rills or small channels. Rill erosion
occurs in all parts of the sub-basin, considered as the second destructive form of erosion, and
located on relatively hilly slopes and frequent rain.
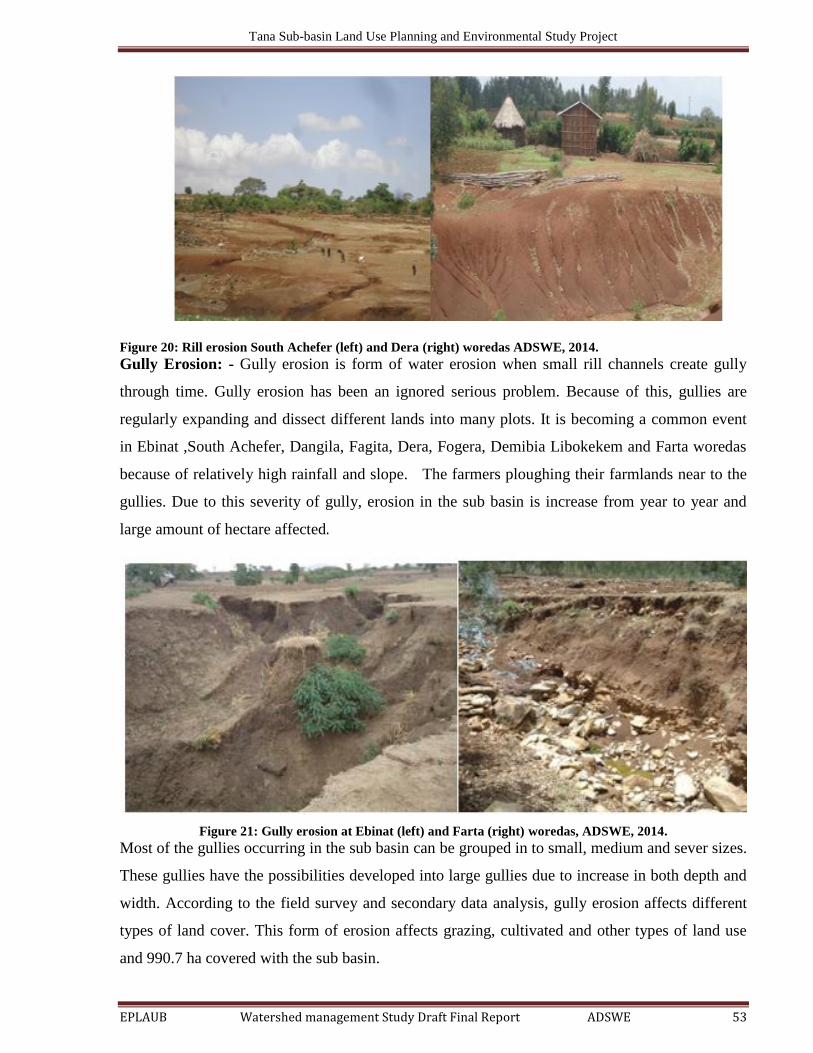
Tana Sub-basin Land Use Planning and Environmental Study Project
EPLAUB Watershed management Study Draft Final Report ADSWE 53
Figure 20: Rill erosion South Achefer (left) and Dera (right) woredas ADSWE, 2014.
Gully Erosion: - Gully erosion is form of water erosion when small rill channels create gully
through time. Gully erosion has been an ignored serious problem. Because of this, gullies are
regularly expanding and dissect different lands into many plots. It is becoming a common event
in Ebinat ,South Achefer, Dangila, Fagita, Dera, Fogera, Demibia Libokekem and Farta woredas
because of relatively high rainfall and slope. The farmers ploughing their farmlands near to the
gullies. Due to this severity of gully, erosion in the sub basin is increase from year to year and
large amount of hectare affected.
Figure 21: Gully erosion at Ebinat (left) and Farta (right) woredas, ADSWE, 2014.
Most of the gullies occurring in the sub basin can be grouped in to small, medium and sever sizes.
These gullies have the possibilities developed into large gullies due to increase in both depth and
width. According to the field survey and secondary data analysis, gully erosion affects different
types of land cover. This form of erosion affects grazing, cultivated and other types of land use
and 990.7 ha covered with the sub basin.
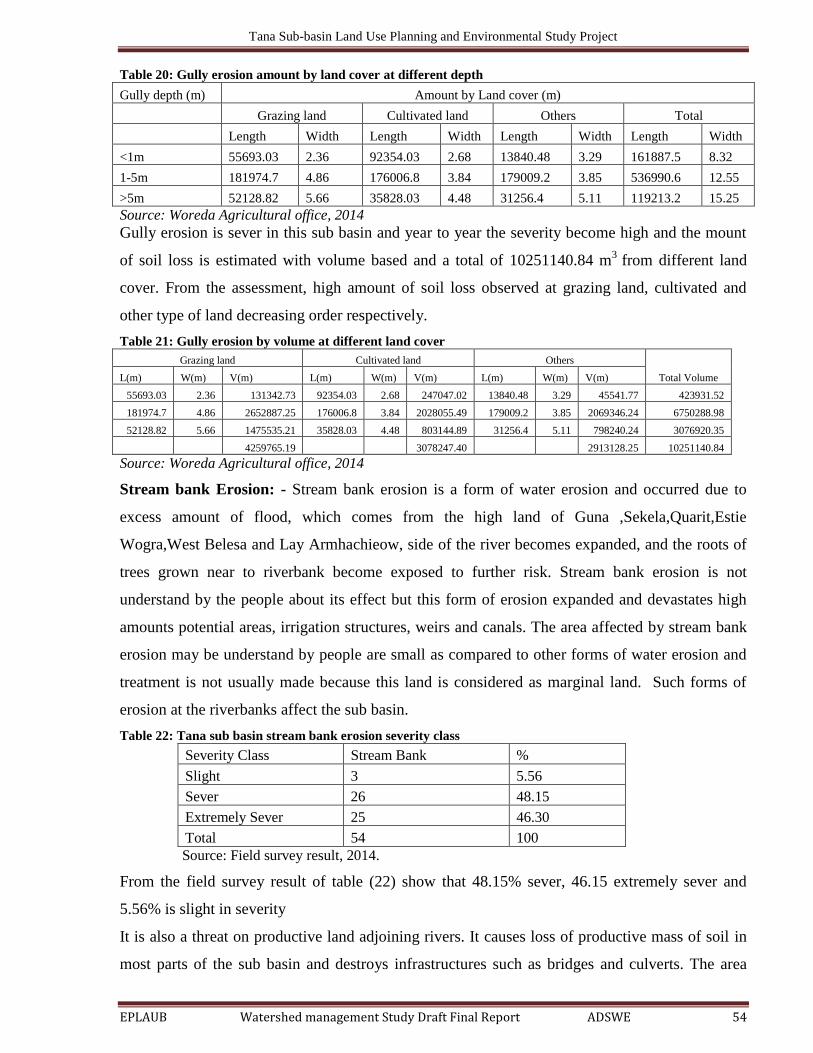
Tana Sub-basin Land Use Planning and Environmental Study Project
EPLAUB Watershed management Study Draft Final Report ADSWE 54
Table 20: Gully erosion amount by land cover at different depth
Gully depth (m) Amount by Land cover (m)
Grazing land Cultivated land Others Total
Length Width Length Width Length Width Length Width
<1m 55693.03 2.36 92354.03 2.68 13840.48 3.29 161887.5 8.32
1-5m 181974.7 4.86 176006.8 3.84 179009.2 3.85 536990.6 12.55
>5m 52128.82 5.66 35828.03 4.48 31256.4 5.11 119213.2 15.25
Source: Woreda Agricultural office, 2014
Gully erosion is sever in this sub basin and year to year the severity become high and the mount
of soil loss is estimated with volume based and a total of 10251140.84 m3
from different land
cover. From the assessment, high amount of soil loss observed at grazing land, cultivated and
other type of land decreasing order respectively.
Table 21: Gully erosion by volume at different land cover
Grazing land Cultivated land Others
Total Volume L(m) W(m) V(m) L(m) W(m) V(m) L(m) W(m) V(m)
55693.03 2.36 131342.73 92354.03 2.68 247047.02 13840.48 3.29 45541.77 423931.52
181974.7 4.86 2652887.25 176006.8 3.84 2028055.49 179009.2 3.85 2069346.24 6750288.98
52128.82 5.66 1475535.21 35828.03 4.48 803144.89 31256.4 5.11 798240.24 3076920.35
4259765.19 3078247.40 2913128.25 10251140.84
Source: Woreda Agricultural office, 2014
Stream bank Erosion: - Stream bank erosion is a form of water erosion and occurred due to
excess amount of flood, which comes from the high land of Guna ,Sekela,Quarit,Estie
Wogra,West Belesa and Lay Armhachieow, side of the river becomes expanded, and the roots of
trees grown near to riverbank become exposed to further risk. Stream bank erosion is not
understand by the people about its effect but this form of erosion expanded and devastates high
amounts potential areas, irrigation structures, weirs and canals. The area affected by stream bank
erosion may be understand by people are small as compared to other forms of water erosion and
treatment is not usually made because this land is considered as marginal land. Such forms of
erosion at the riverbanks affect the sub basin.
Table 22: Tana sub basin stream bank erosion severity class
Severity Class Stream Bank %
Slight 3 5.56
Sever 26 48.15
Extremely Sever 25 46.30
Total 54 100
Source: Field survey result, 2014.
From the field survey result of table (22) show that 48.15% sever, 46.15 extremely sever and
5.56% is slight in severity
It is also a threat on productive land adjoining rivers. It causes loss of productive mass of soil in
most parts of the sub basin and destroys infrastructures such as bridges and culverts. The area

Tana Sub-basin Land Use Planning and Environmental Study Project
EPLAUB Watershed management Study Draft Final Report ADSWE 55
affected by stream bank erosion may be small as compared to other forms of water erosion and
treatment not usually made because this land considered as marginal land. The farmers expand
their farmland towards the riverbank. Almost all rivers which is found in the sub basin extremely
affected with this forms of erosion and colluvial deposition along the sides of the river banks
Figure 22: Stream bank erosion Alefa woreda (left) and North Achefer woreda (right); ADSWE, 2014.
Roadside Erosion: - Roadside erosion is anotherform of soil erosion. This is due absence of
conservation structures and improper drainage system of the road and the artificial water ways
constructed by different organization are not properly drained towards the natural water ways
.The run off collected and flowing along the road is forming small to medium sized gullies, and
damage both the road and productive land. The areas are affected by such types of erosion are
South Achefer, Fagita, Dangila ,Demibia and Farta due to poor waterway and culvert construction
which cannot hold the amount of runoff. Roads from Koladiba to Gorgora, Kimir Digay to
Simada and Merawi to Dangila suffer high erosion because of absence of conservation structures
and improper drainage system of the road. These roads constructed without regular ditches and
culverts toward the natural waterway.
Figure 23: Roadside erosion Dembia (left), Farta (middle) and South Achefer (right) ADSWE, 2014.

Tana Sub-basin Land Use Planning and Environmental Study Project
EPLAUB Watershed management Study Draft Final Report ADSWE 56
4.4Soil Erosion Hazard Assessment Results
4.4.1 RUSLE Parameters Results
Six parameters are required for the soil erosion estimation, as described previously. All the layers
of R, K, LS, C and P with 90 X 90m output cell size were generated in GIS and were crossed to
obtain the product, which gives annual soil loss (A) for the sub basin. Each parameter of RUSLE
assessed in the following sections.
4.4.1.1 Rainfall Erosivity Factor (R)
The soil loss closely related to rainfall partly through the detaching power of raindrop striking the
soil surface and partly through the contribution of rain to runoff. In this study, the erosivity factor
calculated for each grid cells on the bases of mean annual rainfall43 meteorological stations
distribution of the stations as shown in the figure using spatial analyst tool in GIS environment.
Figure 24: Tana Sub Basin Metrological Stations

Tana Sub-basin Land Use Planning and Environmental Study Project
EPLAUB Watershed management Study Draft Final Report ADSWE 57
Table 23: Mean Annual rain fall and R-values of Metrological Station of the Sub basin
No Station Name
Annual
Rainfall R_Value No Station Name
Annual
Rainfall R_Value
1 Shahura 1214.98 674.70 23 Mekaneeysus 1302.11 723.66
2 Bahir Dar 1436.64 799.27 24 AmedBer 1311.34 728.85
3 Aykel 1164.98 646.60 25 Gassay 1321.88 734.78
4 Dangila 1607.61 895.36 26 Woreta 1274.06 707.90
5 DebereTabor 1547.64 861.65 27 Enfranz 1022.72 566.65
6 Gondar synoptic 1157.29 642.28 28 Makisegnit 1031.50 571.58
7 Chuahit 995.93 551.59 29 AddisZemen 1351.17 751.24
8 TikilDingay 2378.24 1328.45 30 WotetAbay 1599.10 890.57
9 Delgi 814.72 449.75 31 AmbaGiorgis 1030.61 571.08
10 Shembekit 1141.23 633.25 32 Leway 1535.09 854.60
11 KimirDingay 1329.54 739.08 33 Gundil 2412.86 1347.91
12 Yifag 1019.54 564.86 34 Kessa 2529.42 1413.42
13 Aymba 1124.29 623.73 35 Adet 1272.25 706.88
14 Ebinat 899.53 497.41 36 Agere Genet 1601.89 892.14
15 DeraHamusit 1514.18 842.85 37 Askuna 2484.62 1388.24
16 Korata 1593.53 887.44 38 Chanchok 1477.16 822.04
17 Meshenti 1363.95 758.42 39 Deke Estifanos 1712.52 954.32
18 Sekela 1867.94 1041.66 40 Meshenti 1379.88 767.37
19 Zegie 1543.62 859.40 41 Tillili 2030.71 1133.14
20 Chandiba 1272.69 707.13 42 Tiss Abay 1201.99 667.40
21 Gorgora 1036.47 574.37 43 Urana 1960.44 1093.65
22 Wanzay 1502.61 836.34
The mean annual rainfall (P) ofeach station used to calculatethe erosivity factor (R) of the study
area presented below. Each grid cells of mean annual rainfall calculated based on equation
adapted for Ethiopia to get the R-value (rainfall erosivity) using spatial analysis tool in raster
calculator, Arc GIS-10.1 software by IDW method used to generate the rainfall erosivity map. To
make ease of calculation each variables would be changed in to raster form, should have
continuous value. For this data IDW interpolation techniques to change point rainfall to areal
rainfall. Hence, the value we get varies significantly. Therefore, it is used merit to select the best
method by considering the topography of the area, rain gauge density and so on. As shown in the
figure here the map of erosivity values range from 458.15 MJ.mm/ (ha.h) to 1318.35 MJ.mm/
(ha.h).
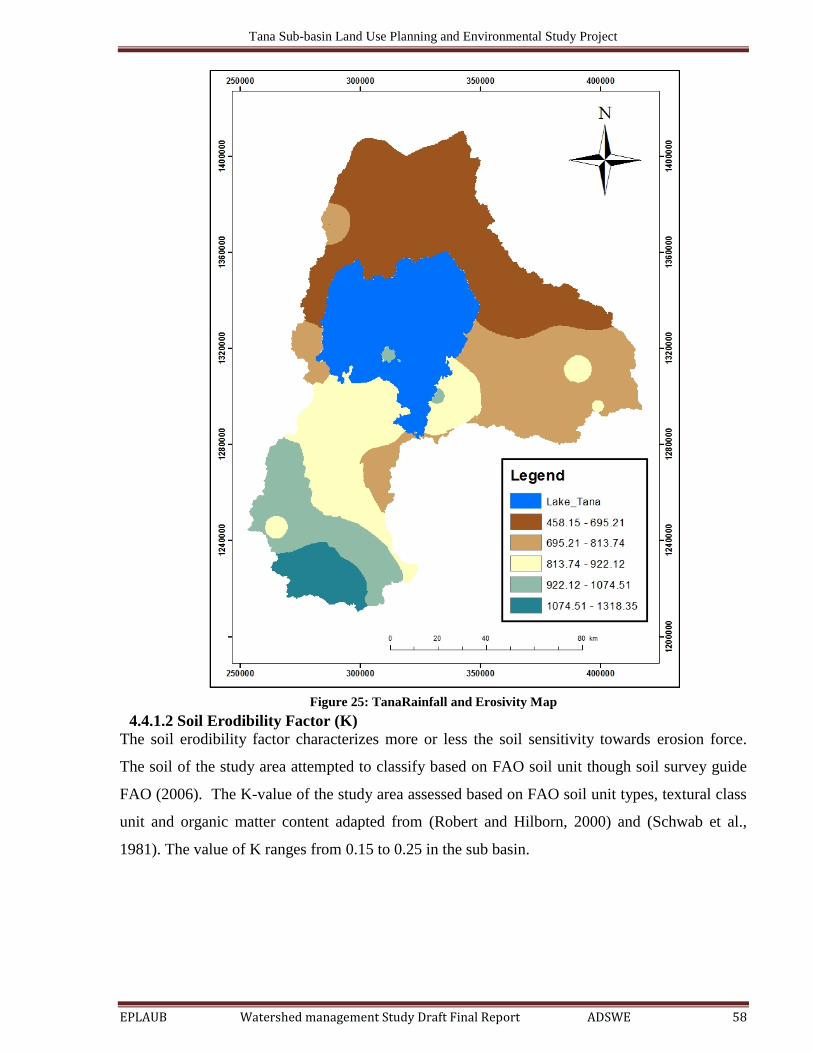
Tana Sub-basin Land Use Planning and Environmental Study Project
EPLAUB Watershed management Study Draft Final Report ADSWE 58
Figure 25: TanaRainfall and Erosivity Map
4.4.1.2 Soil Erodibility Factor (K)
The soil erodibility factor characterizes more or less the soil sensitivity towards erosion force.
The soil of the study area attempted to classify based on FAO soil unit though soil survey guide
FAO (2006). The K-value of the study area assessed based on FAO soil unit types, textural class
unit and organic matter content adapted from (Robert and Hilborn, 2000) and (Schwab et al.,
1981). The value of K ranges from 0.15 to 0.25 in the sub basin.
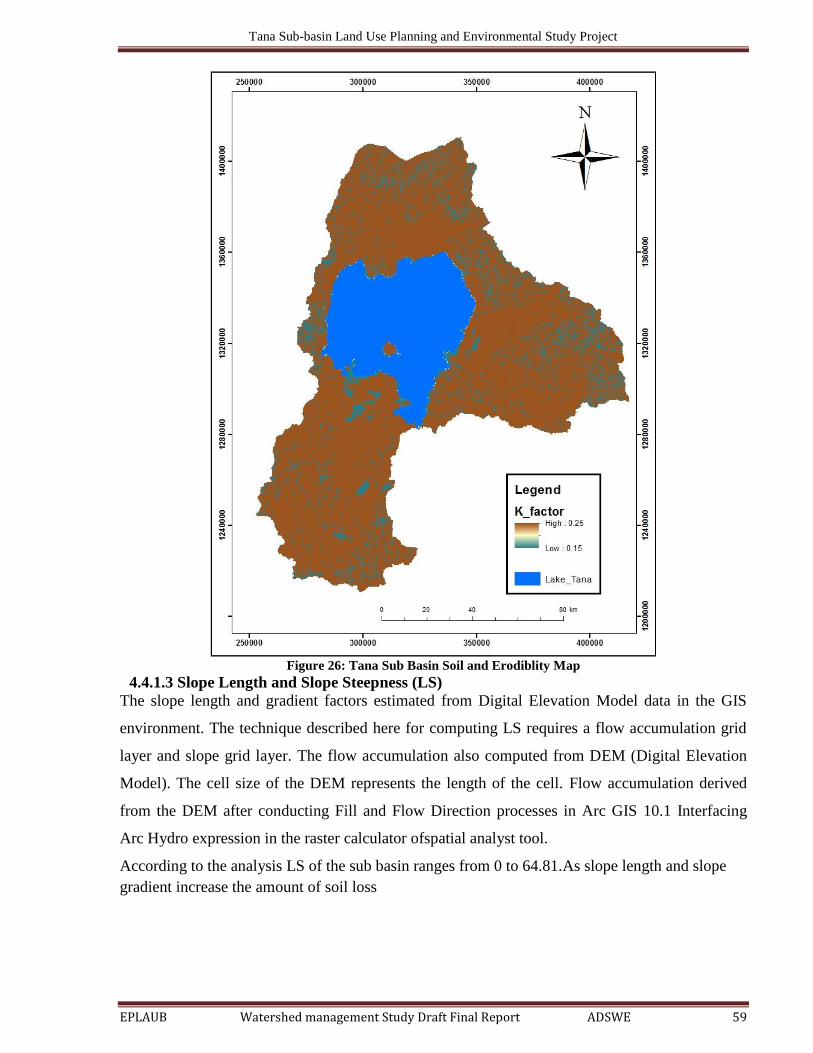
Tana Sub-basin Land Use Planning and Environmental Study Project
EPLAUB Watershed management Study Draft Final Report ADSWE 59
Figure 26: Tana Sub Basin Soil and Erodiblity Map
4.4.1.3 Slope Length and Slope Steepness (LS)
The slope length and gradient factors estimated from Digital Elevation Model data in the GIS
environment. The technique described here for computing LS requires a flow accumulation grid
layer and slope grid layer. The flow accumulation also computed from DEM (Digital Elevation
Model). The cell size of the DEM represents the length of the cell. Flow accumulation derived
from the DEM after conducting Fill and Flow Direction processes in Arc GIS 10.1 Interfacing
Arc Hydro expression in the raster calculator ofspatial analyst tool.
According to the analysis LS of the sub basin ranges from 0 to 64.81.As slope length and slope
gradient increase the amount of soil loss
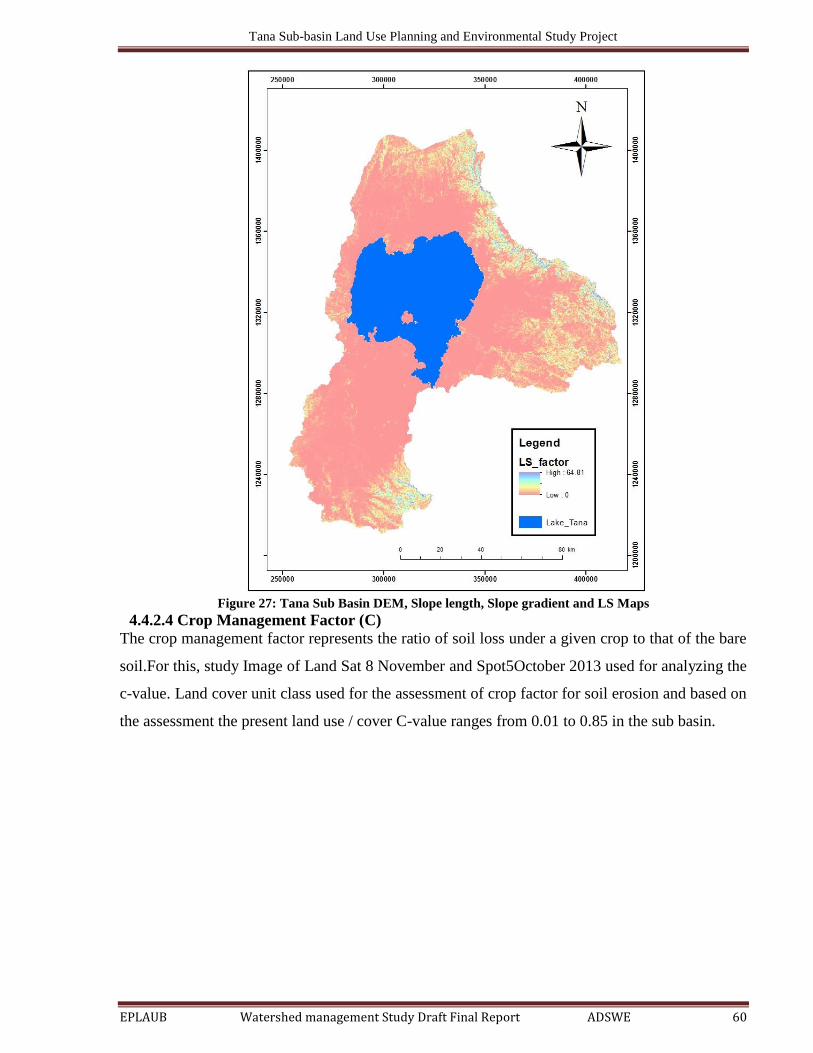
Tana Sub-basin Land Use Planning and Environmental Study Project
EPLAUB Watershed management Study Draft Final Report ADSWE 60
Figure 27: Tana Sub Basin DEM, Slope length, Slope gradient and LS Maps
4.4.2.4 Crop Management Factor (C)
The crop management factor represents the ratio of soil loss under a given crop to that of the bare
soil.For this, study Image of Land Sat 8 November and Spot5October 2013 used for analyzing the
c-value. Land cover unit class used for the assessment of crop factor for soil erosion and based on
the assessment the present land use / cover C-value ranges from 0.01 to 0.85 in the sub basin.

Tana Sub-basin Land Use Planning and Environmental Study Project
EPLAUB Watershed management Study Draft Final Report ADSWE 61
Figure 28: TanaSub Basin Crop factor Map
4.4.1.5 Management Practice Factor (P)
The erosion management practice, P value, is also one factor that governs the soil erosion
rate.This is factor governs the amount of soil erosion in the sub basin with in the present land
cover and slope class.Based on the assessment the P-value ranges from 0.1-1.
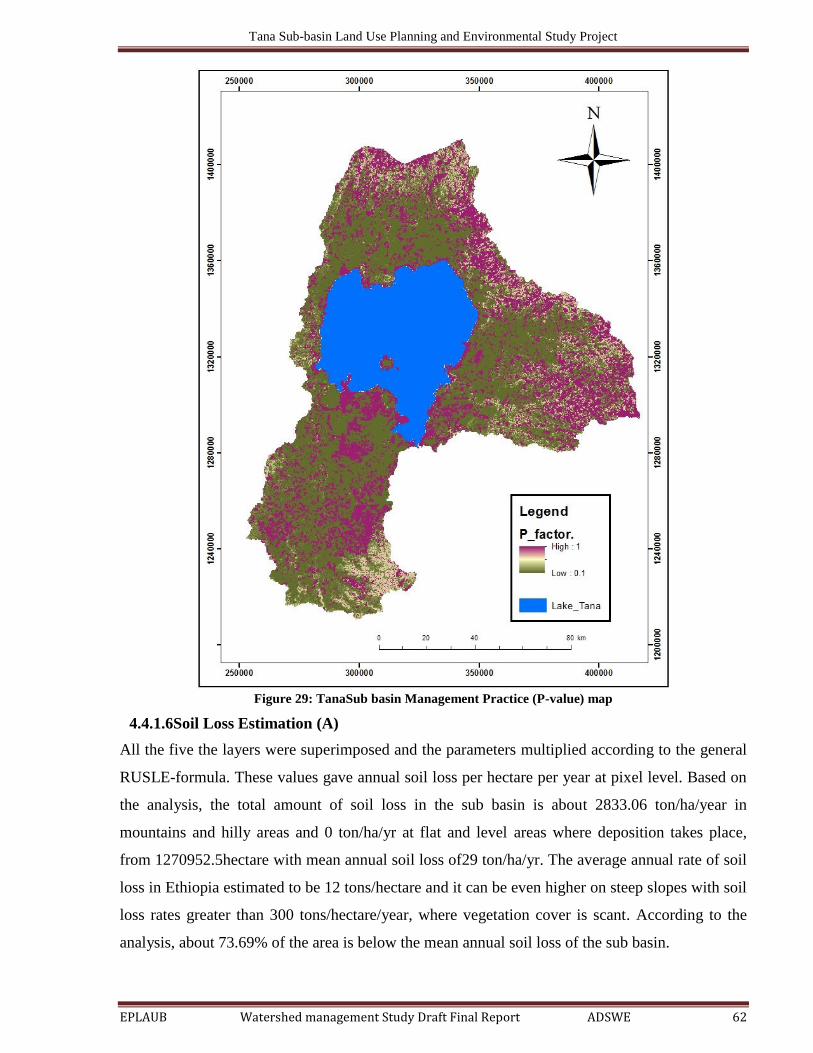
Tana Sub-basin Land Use Planning and Environmental Study Project
EPLAUB Watershed management Study Draft Final Report ADSWE 62
Figure 29: TanaSub basin Management Practice (P-value) map
4.4.1.6Soil Loss Estimation (A)
All the five the layers were superimposed and the parameters multiplied according to the general
RUSLE-formula. These values gave annual soil loss per hectare per year at pixel level. Based on
the analysis, the total amount of soil loss in the sub basin is about 2833.06 ton/ha/year in
mountains and hilly areas and 0 ton/ha/yr at flat and level areas where deposition takes place,
from 1270952.5hectare with mean annual soil loss of29 ton/ha/yr. The average annual rate of soil
loss in Ethiopia estimated to be 12 tons/hectare and it can be even higher on steep slopes with soil
loss rates greater than 300 tons/hectare/year, where vegetation cover is scant. According to the
analysis, about 73.69% of the area is below the mean annual soil loss of the sub basin.
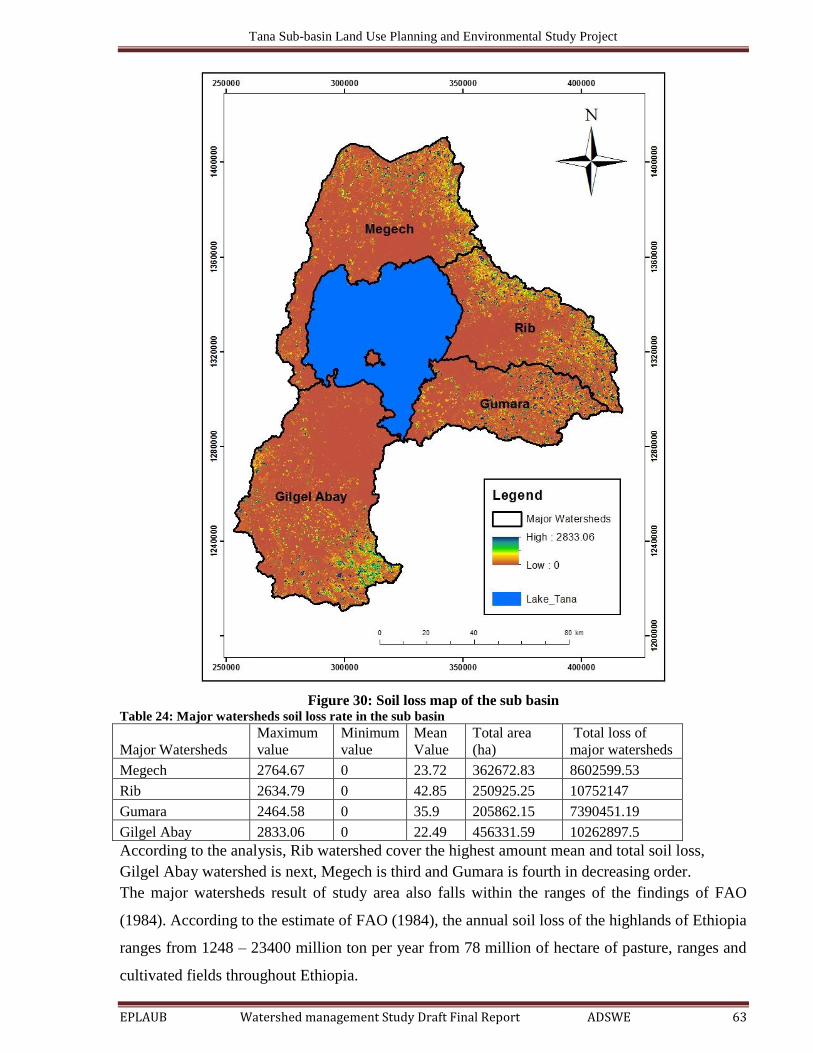
Tana Sub-basin Land Use Planning and Environmental Study Project
EPLAUB Watershed management Study Draft Final Report ADSWE 63
Figure 30: Soil loss map of the sub basin Table 24: Major watersheds soil loss rate in the sub basin
Major Watersheds
Maximum
value
Minimum
value
Mean
Value
Total area
(ha)
Total loss of
major watersheds
Megech 2764.67 0 23.72 362672.83 8602599.53
Rib 2634.79 0 42.85 250925.25 10752147
Gumara 2464.58 0 35.9 205862.15 7390451.19
Gilgel Abay 2833.06 0 22.49 456331.59 10262897.5
According to the analysis, Rib watershed cover the highest amount mean and total soil loss,
Gilgel Abay watershed is next, Megech is third and Gumara is fourth in decreasing order.
The major watersheds result of study area also falls within the ranges of the findings of FAO
(1984). According to the estimate of FAO (1984), the annual soil loss of the highlands of Ethiopia
ranges from 1248 – 23400 million ton per year from 78 million of hectare of pasture, ranges and
cultivated fields throughout Ethiopia.
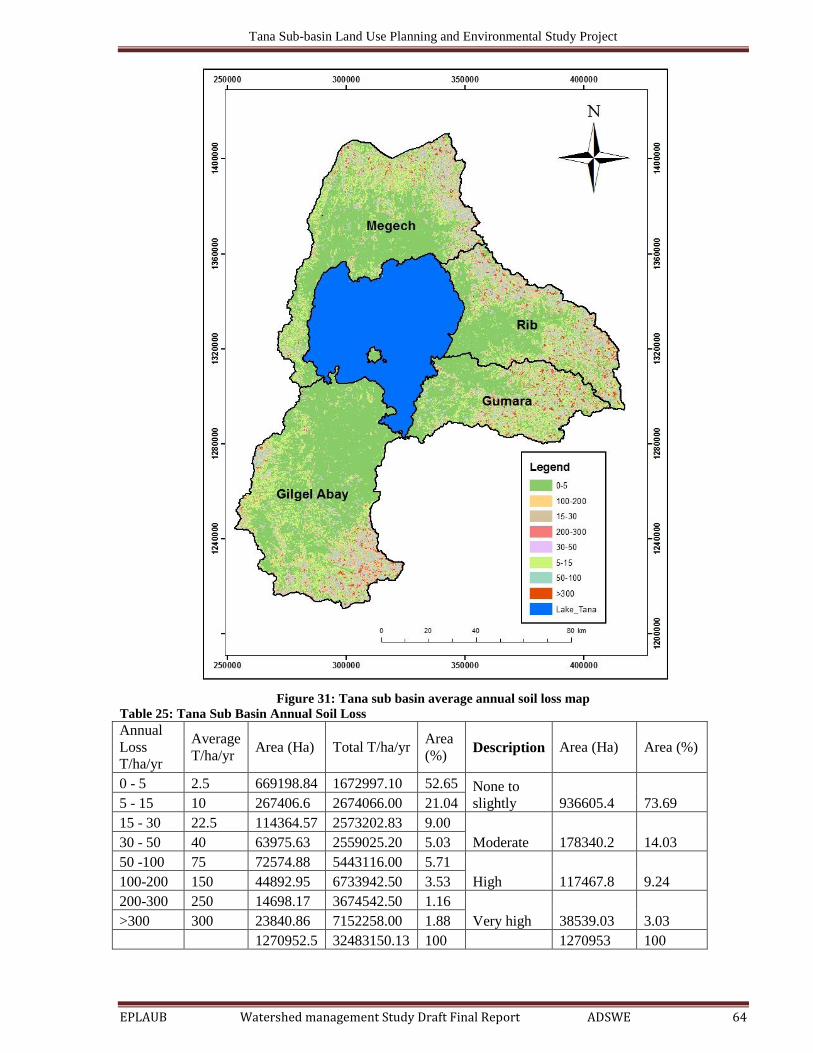
Tana Sub-basin Land Use Planning and Environmental Study Project
EPLAUB Watershed management Study Draft Final Report ADSWE 64
Figure 31: Tana sub basin average annual soil loss map
Table 25: Tana Sub Basin Annual Soil Loss
Annual
Loss
T/ha/yr
Average
T/ha/yr Area (Ha) Total T/ha/yr
Area
(%) Description Area (Ha) Area (%)
0 - 5 2.5 669198.84 1672997.10 52.65 None to
slightly 936605.4 73.69 5 - 15 10 267406.6 2674066.00 21.04
15 - 30 22.5 114364.57 2573202.83 9.00
Moderate 178340.2 14.03 30 - 50 40 63975.63 2559025.20 5.03
50 -100 75 72574.88 5443116.00 5.71
High 117467.8 9.24 100-200 150 44892.95 6733942.50 3.53
200-300 250 14698.17 3674542.50 1.16
Very high 38539.03 3.03 >300 300 23840.86 7152258.00 1.88
1270952.5 32483150.13 100 1270953 100
Tana Sub-basin Land Use Planning and Environmental Study Project
EPLAUB Watershed management Study Draft Final Report ADSWE 65
From the assessment the sub basin is about 73.69 % of the area has soil loss fall non to
slight,14.03% moderate ,9.24 % high and 3.03% very high soil loss class respectively
Taking density of mineral soil as 1.65 ton/m3
Total soil loss in tons/ yr = yrtons /13.150,483,32
Density=mass/volume---------------v=m/d
Estimated rate of erosion = yrmmtons
yrtons/365.757,686,19
3/65.1
/13.150,483,32
Soil loss in depth = yearmmyrmm
yrm/55.1/00155.0
201270952500
/365.757,686,19
This implies that 1.55 mm of soil depth washed away per hectare every year withoutconsider the
soil formation rate.
4.4.1.7 Sediment yield
Sediment yield is such important for dams and different schemes projects but it is necessary know
the amount of sediment enter to the Lake Tana also, it tells us how much amount of our top soils
are being eroded by running water.
Area factor =
06.05.1270952
112.02.0
A
Where: A is area of watershed in hectare
SY= (0.06* 19,686,757.65 m3/yr) = 1183990.81 m
3/yr
The main erosion sources in the area are miscellaneous lands around mountains and hilly areas,
cultivated lands; gullies and stream bank formed due to untreated the side of the riverbank and
hilly areas. The amount of sediment yield towards Lake Tana is about 1183990.81 m3/yr. This
lead to decrease the depth of the lake and biodiversity year to year. Finally, the Lake may
disappear with the sediment load and protection may not return the lake.
4.5Causes of Watershed degradation and Soil erosion
The major cause for watershed degradation is land structural deterioration of the project area is
long-term excessive tillage without any remedial measures. Cultivation for a long period, which is
common feature in study area, results in depletion of soil nutrients and organic matter that in turn
enhances crusting, aggressive runoff, accelerated erosion and ultimately low productivity. The
removal of forest cover played a great role in the process of enhancing accelerated erosion. This
was not a terminating single event, rather, a century process. As a result of this process, the

Tana Sub-basin Land Use Planning and Environmental Study Project
EPLAUB Watershed management Study Draft Final Report ADSWE 66
topsoil depth is reduced to a minimum uncultivable value are the most important factors in high
runoff yield that results in more accelerated erosion. The main causes of soil erosion in the
watersheds are the farming system and rapidly increasing human population, the limited area of
fertile soils on flat lands, deforestation, and excessive livestock population.
4.5.1 Population and Land Degradation Processes
Tana sub basin is one of the most densely populated areas.The total population of the sub basin is
about3,158,247 due to the high population of the sub basin; land degradation involves two
interlocking, complex systems: the natural ecosystem and the human social system. Natural
forces, through periodic stresses of extreme and persistent climatic events, and human use and
abuse of sensitive and vulnerable dry land ecosystems, often act in unison, creating feedback
processes, which not fully understood. Interactions between the two systems determine the
success or failure of resource management programs. The problems arise mainly from population
growth and poverty, which caused arable land expansion, intensive land use, deforestation and
over exploitation of the land for short-term benefit.
4.5.2 Deforestation and Overexploitation of Vegetation
Since harvested trees not replaced adequately by tree planting, soils are exposed to high intensity
of rainfall the major sources of energy for the rural households in the watersheds include mainly
firewood. Most households get firewood from scrublands and private eucalyptus plantations
around homesteads and along roads and footpaths. In using the vital energy needs market access
of the nearby urban communities, most charcoal producers in the sub basin resorted to free
gathered biomass fuels, including wood and forest lands along rivers. The removal of vegetation
cover expansion of farmland from bush and forestlands was the other cause of destruction of the
vegetation cover. The total projected demand of forest for 20 years in the sub basin show that an
increase every 5 years interval this will lead high deforestation for the forest area and land
degradation rate increase with deforestation due to demand increase for fuel wood and
construction materials
Table 26: Demand and supply of the existing forest resource projection in the sub basin
Forest resource 2015 2020 2025 2030 2035
Total demand m3 1915301.3 2495625.9 3150082.7 3878673.3 4694718.2
Total supply m3 1499269.8 1499269.8 1499269.8 1499269.8 1499269.8
Difference 3414571 3994896 4649353 5377943 6193988
The demand and supply projection table that thereis a variation between demand and supply
potential of the existing forest resources of the sub basin. The above table show that the demands

Tana Sub-basin Land Use Planning and Environmental Study Project
EPLAUB Watershed management Study Draft Final Report ADSWE 67
exceeds supply by 127% to 316% that means shortage will boost up from 27.8% to 213% within
20 years period. this implies that, unless the existing plantation forests resources will be manage
with improved technologies and supported with additional plantations; also supported by
different energy sources like improved stoves, electric stove, bio fuel, kerosene stoves, solar
energies etc..; the annual incremental potential of the existing forest resource will not be
satisfactory and the degree of unbalance between demand and supply will be extremely go far and
this will create pleasures on the existing natural vegetation. So that this will lead to high
deforestation and aggravate soil erosion in the sub basin.
4.5.3 Improper Agricultural Practice
Causes of land degradation were not only biophysical, but also socioeconomic, example land
tenure, marketing, institutional support, income and human health; most of the soil degradation
problems of the highlands have also been associated with farming systems and farming practices.
Agriculture is the prime means of livelihood for the rural people and remain to be subsistence and
traditional.
A set of improper practices had to do with land expansion, the main problem in Tana sub basin
being the gradual expansion of cultivated lands even to sloping areas.
The local farmers plough areas more than 30% slope for agriculture it is about 36,574.98 ha and
this aggravate soil erosion. Wogera, Lay Armhachieow Libokemkem, Ebinat Farta and Sekela are
the most affected and hilly areas practiced for agriculture.
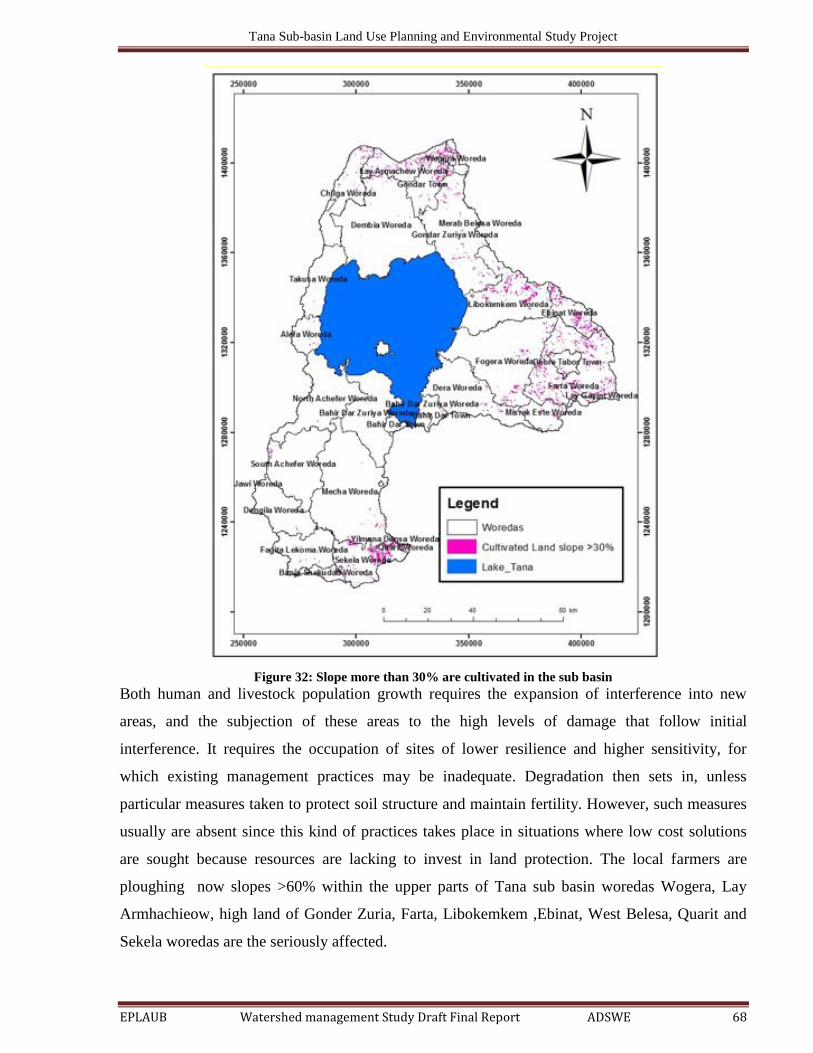
Tana Sub-basin Land Use Planning and Environmental Study Project
EPLAUB Watershed management Study Draft Final Report ADSWE 68
Figure 32: Slope more than 30% are cultivated in the sub basin
Both human and livestock population growth requires the expansion of interference into new
areas, and the subjection of these areas to the high levels of damage that follow initial
interference. It requires the occupation of sites of lower resilience and higher sensitivity, for
which existing management practices may be inadequate. Degradation then sets in, unless
particular measures taken to protect soil structure and maintain fertility. However, such measures
usually are absent since this kind of practices takes place in situations where low cost solutions
are sought because resources are lacking to invest in land protection. The local farmers are
ploughing now slopes >60% within the upper parts of Tana sub basin woredas Wogera, Lay
Armhachieow, high land of Gonder Zuria, Farta, Libokemkem ,Ebinat, West Belesa, Quarit and
Sekela woredas are the seriously affected.

Tana Sub-basin Land Use Planning and Environmental Study Project
EPLAUB Watershed management Study Draft Final Report ADSWE 69
Figure 33: Improper agricultural practice at Ebinat, West Belesa, Farta and Quarit ADSWE, 2014.
4.6Effects of land degradation and soil erosion
4.6.1 Loss of Soil Mass
Soil erosion is by far the largest process causing land degradation, in the sub basin. The mass of
soil wasting from sheet, rill, gully, streams and roadside assessed as the amount of soil material
that removed from a landscape by water, since these physical changes are obvious and
quantifiable. The total amount of physical soil loss in the sub basin about 19,686,757.65 ton/yr
that causes of land and soil degradation.Due to the poor soils, the process of restoring badly
degraded areas will inevitably be difficult, slow and expensive.
4.6.2 Nutrient Loss
Degradation of the soil resource, on the other hand, has been reported alarming; soil productivity
is declining at the rate of 2-3% per year (Hurni, 1993, cited in Dr Birru 2007) with soil erosion
rate in most croplands usually being far beyond the rate of formation due to cultivation of steeply
sloping lands without adequate SWC measures.
The capacity of the soil in the upper parts of the sub basin to produce crop greatly reduced. Soil
from the top layer is the most concern because it contains more organic matter; rich in available

Tana Sub-basin Land Use Planning and Environmental Study Project
EPLAUB Watershed management Study Draft Final Report ADSWE 70
plant nutrients. This soil is lost in sheet and rill erosion nutrients, which are of great value in
containing nitrogen, phosphorus and potassium. The productivity of cropland is decreasing year
after year at alarming rate. Land productivity is decreasing. The higher yield in production is
associated with fertilizer application, improved seeds and farm expansions from other uses.
Loss of soil fertility severely affected by soil erosion, use of dung and crop residues for household
fuels and animal feeds and decline in fallow periods. Even though the farming system in the sub
basin mixed, crop–livestock, the culture based on the nutrient take way from the soil that the
nutrient return to the soil is minimal.
4.6.3 Hydrological Degradation
Hydrological degradation that include surface and subsurface water declines, seasonality of
discharges of the rivers, variability of rainfall, etc. are important causes and consequences of the
processes of land degradation and challenges for the sustainable land management systems in the
region.
Tana sub basin has many rivers like Megech, Rib, Gilgel Abay and Gumara are the main sources
of water for Lake Tana. However, apart from the main rivers and tributaries, there was hardly of
perennial flow in the sub basin this is due to severe occurrences of soil degradation in the upper
parts of the catchment. This lead to decrease in river flow of water throughout the year and the
local farmers face drinking water for their cattle and themselves in some areas and travellong
distance to get water.
Figure 34: Hydrological degradation Megech at Robit Dembia and Trikura river Takusa woreda, ADSWE,
2014.
4.6.4 Sedimentation
Lake Tana, which is the biggest natural water reservoirs in Ethiopia and affected with sediments a
total of 1,183,990.81m3/yr from all parts of its watersheds; Megech, Rib,Gilgel Abay and

Tana Sub-basin Land Use Planning and Environmental Study Project
EPLAUB Watershed management Study Draft Final Report ADSWE 71
Gumara are the major ones, with high rates. This tragedy of the Lake has international
significance, as the lake is the source of Blue Nile and the home of some endemic animals exist
nowhere except in and around the Lake. There are more pressures and interest conflicts on the
lake aggravating sediment loads to it. Koga, Angerb and Selamko dams and small intake and
weirs are now filled with sediment load year-to-year .This problem is due to improper watershed
management practice with in the sub basin.
Figure 35: Irrigation schemes Selamiko Dam (Debretabor), Drima weir at Dembia and Lake Tana (Gonder
Zuria and Fogera) woreda filled by Sediment load, 2014.
4.7Soil and water conservation Experiencesin the Sub Basin
Conservation is a balance of policies programs plan project and practices that run the gamut from
exploitation to preservation in order to manage the rate of using natural resource in the interest of
bum an kind(Black ,2001) .
By now, most watershed programs have evolved towards participatory watershed development,
decentralizing the planning, implementation and management of soil and water conservation
(SWC) to local communities at the village and Keble level.
The major aged traditional SWC activities include shifting cultivation, soil mulching, slope lands
terracing like Konso culture, soil manuring, and extra water disposal furrows and intercropping.

Tana Sub-basin Land Use Planning and Environmental Study Project
EPLAUB Watershed management Study Draft Final Report ADSWE 72
To improving these traditional conservation measures successfully controlling soil erosion and
the problem of land degradation, the government budget and actions added soil and water
conservation actions started in the country since late 1970s. The government actions have
introduced number of additional technologies and measures, which practiced in the countrywide.
The sub basinpractice different types of soil and water conservation structures traditional as well
as scientific soil and water conservation activities. These structures practiced with the local
farmers (indigenous) and scientific measures assisted by some development programs (NGO‟s)
and regular program (government). During field survey, there are different types of indigenous
and scientific soil and water conservation structures observed(physical and biological).
4.7.1 Indigenous Soil and Water conservation Structures
The indigenous SWC that have been practiced in the sub basin mainly includes soil manuring,
traditional farm-ditches and furrows, traditional Cut-off drains, ,traditional waterway, contour
plough, crop rotation, management of scattered trees on croplands, hedge rows and live fences
along farm boundaries and grass strips along farm boundaries. The farmers belief on the
importance and advantages of the traditional SWC practices are categorized under three groups;
1) soil fertility improvement, 2) safe removal of excess water from farmlands, protecting
farmland from run-off coming from up slope lands. Farmers in sub basin practiced diversion-
drains and waterways to divert run off coming from up-slopes and to collect run-off coming from
farm ditches. The farm boundaries of most farmers have also bordered by traditional bund and
traditional waterways. Traditional cut-off drains are mostly located at the upper age of the farm
boundary, while waterways are located along the farm boundaries if the boundary bordered along
the slope of the land. In most cases, the traditional ditches are temporary structures constructed
every rainy season. However, with in the sub basin some permanent structures observed during
field survey and still existed.
These indigenous/traditional SWC measures have been contributing a lot in reducing soil erosion
and controlling run off and floods. However, some physical structures such as cut-off drains,
waterways and farm ditches are aggravating soil erosion problems in adjacent farmlands because
they collect run –off from up-slopes and pass high run –off to the down slopes that create gullies
in the downstream areas. Waterways, which are supposed to carry a large amount of runoff from
traditional cut-off drains and farm ditches, are bare, gullies without check dams, grasses or stone
paving problem observed. As per the farmers view, these were happened due to land

Tana Sub-basin Land Use Planning and Environmental Study Project
EPLAUB Watershed management Study Draft Final Report ADSWE 73
fragmentation, lack of disposal areas and unwillingness of some farmers to accept and pass run-
off coming from upslope and adjacent lands towards the natural waterway.
The problems are associated with technical, social and management factors. Even, some problems
require policy considerations. Thus, it is highly important to reduce those drawbacks of
indigenous SWC measures.
4.7.2 Physical Soil and Water Conservation Structures
Many new physical and biological SWC technologies introduced since late 1970s in Ethiopia.
Most of the newly introduced common technologies adapted and implemented in Tana sub basin
mainly physical soil and water conservation measures. These include farmland soil, stone-faced
soil and stone bunds, which are mainly graded and level types and hillside terraces.Moisture
conservation measures like micro basin, eyebrowbasin and trench.Flood control like cut off drains
and waterways. Gully control mechanisms likesack, stone,brushwood and gabion check damsare
the most common practice technologies. The physical soil and water conservation structures
constructed with in the sub basin most structures are not follow watershed based approach and
poor quality. Some of the areas are good in quality and watershed based approach like Gonder
Zuria Minzro, Takusa, North Achefer Amishan Jihan, Mecha, Farta woreda Huletu Simina and
Mynet kebele, Sekela Lijambera kebele are model works. The implementation of these SWC
measures done through the assistance of lay out farmers, developmentagents and in some cases
the woreda level experts in design and layout of structures. These agents and experts also train
farmers in the SWC technologies application and the trained farmers, team leaders and support
the development agents in lay out of structures and kebele and woreda carbine
membersmobilizing the communities to participate in the implementation of SWC measures.
However, the technical support of the experts are so scant that most of the constructed physical
SWC structures lack the capacity to control soil erosion effectively. Their capacity further
impacted by geophysical and socio-economic situations of the area. Woreda agricultural offices
report that some of the physical SWC structures particularly in farm fields disappear every year
because of partly design and layout failures, improper farming operation, free grazing system,
lack of maintenance and upgrading works and partly because of steep slopes that produce heavy
floods.
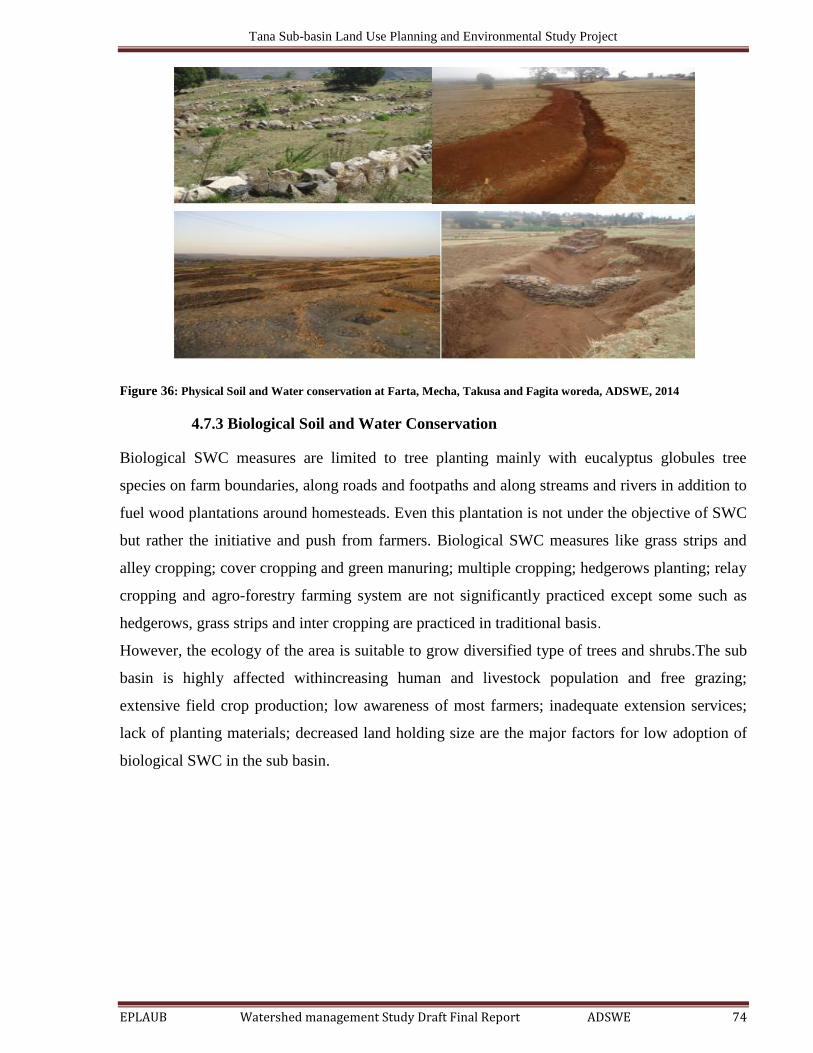
Tana Sub-basin Land Use Planning and Environmental Study Project
EPLAUB Watershed management Study Draft Final Report ADSWE 74
Figure 36: Physical Soil and Water conservation at Farta, Mecha, Takusa and Fagita woreda, ADSWE, 2014
4.7.3 Biological Soil and Water Conservation
Biological SWC measures are limited to tree planting mainly with eucalyptus globules tree
species on farm boundaries, along roads and footpaths and along streams and rivers in addition to
fuel wood plantations around homesteads. Even this plantation is not under the objective of SWC
but rather the initiative and push from farmers. Biological SWC measures like grass strips and
alley cropping; cover cropping and green manuring; multiple cropping; hedgerows planting; relay
cropping and agro-forestry farming system are not significantly practiced except some such as
hedgerows, grass strips and inter cropping are practiced in traditional basis.
However, the ecology of the area is suitable to grow diversified type of trees and shrubs.The sub
basin is highly affected withincreasing human and livestock population and free grazing;
extensive field crop production; low awareness of most farmers; inadequate extension services;
lack of planting materials; decreased land holding size are the major factors for low adoption of
biological SWC in the sub basin.

Tana Sub-basin Land Use Planning and Environmental Study Project
EPLAUB Watershed management Study Draft Final Report ADSWE 75
Figure 37: EffectiveBiological Soil and water conservation Sekela and Fara ,ADSWE 2014.
As the experience shows that soil and water conservation structures started in the sub basin during
Dergue Regime but the sustainability is not profitable and now it starts in 2001 E.C.in a new
strategy at Regional level to do the physical and biological conservation structures. The soil and
water conservation structures results show that most structures not done in standards, the quality
is less and sustainability become well. The structures done by cooperating the development group
and work group at kebele level. In addition to this, the structures done by the local peoples given
(assigned) by the kebele land administration for the owner of management. The amount of work
not fit with the standard of work norm of the structures. Some woredas small amount of work
when compare with the number of population participated and on the other hand the large amount
of work with less participated population. During field survey most of the structures failed with
free grazing and poor management what observed. (Table 20) shown that below physical soil and
water conservation structures a little bit better area coverage but biological soil and water
conservation is less in coverage area with in the sub basin. Area closure and gully treatment with
in the sub basin is now better from year to year this is due to watershed based approach practice
done. Moisture conservation structure like micro basin, eyebrow basin and trench started and the
coverage is better year to year for the sub basin, which helps, from prevention of land degradation
and moisture harvest.

Tana Sub-basin Land Use Planning and Environmental Study Project
EPLAUB Watershed management Study Draft Final Report ADSWE 76
Table 27: Total Achievement of SWC from2001-2005 EC with in the sub basin
No Woreda
Identified and
studied Micro-
watershed
Physical measures Biological measures Water conservation Gully
control,
check dams,
m3
Terracing,
km COD, m3
Plantation
on bunds,
km
Plantation
on gullies,
ha
Area
closure, ha
Micro-basin
,No
Trench,
No
Eye-brow,
No
1 Alefa 14 4229.76 203.00 227.52 0.00 439.00 3530 7754 0 688.00
2 Takusa 18 12689.28 4.99 449.28 4.75 4587.00 294500 65600 28300 36000.00
3 Chilga 60 11674.35 143.76 76.53 10.25 834.89 3336 2533 910 31122.25
4 Wegera 9 1699.46 0.00 0.00 0.13 80.00 0 2316 100 0.00
5 Lay Armachew 32 7208.26 70.84 4427.76 0.00 620.62 72977 174205 3800 88.02
6 Gonder Town 0 5375.94 79.55 0.40 2.21 702.99 6873 20064 831 27.19
7 Gonder zuria 103 6892.80 4007.00 301.44 15.00 4149.00 41075 65460 365 0.00
8 Demibia 30 14935.23 0.00 0.00 0.00 653.00 441 1770 1106 5949.00
9 Libokemkem 123 14081.29 49843.20 186.43 42.18 1780.38 228534 441359 31015 581879.00
10 Fogera 152 19068.68 43.08 2898.96 10.13 1738.25 90995 178704 15083 142643.01
11 Ebinat 13 2273.67 0.16 0.00 0.00 2113.00 886 20406 11915 8468.80
12 Farta 228 22756.00 358.10 303.00 63.30 3580.00 353848 303917 124227 436.67
13 Banja 7 23497 250.66 0 154.6 4514.65 6447 75564 1270 257.6
14 Fagita Lekoma 95 46259 1025 34113 3258.5 10000 308 79624 0 633.49
15 Dangila 157 32945 472 1374.465 271 1696 499 69460 0 160.095
16 N/Achefer 208 41439.66 435.14 34262.6 212.7 4415.45 0 31575 126916 640
17 S/Achefer 71 39000.4 170.65 21428.6 105.3 619.24 9287 54016 1705 116.3
18 Mecha 352 57538.7 583.198 77538.7 377 107 0 260364 78698 0
19 Bahirdar Zuria 145 25343.4 131652 330.81 370.02 0 932 8131 0 55374
20 Bahir Dar Town 0 389.82 3977.5 0 0 46 0 350 0 3375
21 Sekela 0 143610 52495 0 0 0 1408 362749 0 20143
22 Dera 198 44651 316.7 9086.1 0 4864.6 0 1520434 904656 1215822
23 Estie 9 4366.76 1280 0 48 285.57 5719 25488 1087 102296
Total 2024 581925.45 247411.52 187005.59 4945.07 47826.64 1121595 3771843 1331984 2206119.43

Tana Sub-basin Land Use Planning and Environmental Study Project
EPLAUB Watershed management Study Draft Final Report ADSWE 77
5. PROBLEM IDENTIFICATION
Watershed management in Ethiopia is a serious problem in general, in the Amhara Region
particularly Tana sub basin characterizedbyland degradation, deforestationand over grazing.
Fieldobservations at numerous points in the watershed indicated that physical and biological
degradations are the common phenomena of sub basin. For most of the part of sub basin, land
degradation and fertility losses mainly attributed tothe following major factors.
5.1 Soil Erosion and Land Degradation
Soil erosion by water is high in the sub basin.Even though erosion process is subtle one,
itevaluated by its effect on cultivated lands and check dams. Uncontrolled erosionfinally leads to
land deterioration.
The major causes of soil erosion and land degradation are:
Natural features such as rugged topography, temporal high intensity of rainfall.
High population growth is pressure on land for cultivation and encroachment of
cultivation to marginal lands (i.e. steep slopes, forestlands, grazing lands, etc.)
without conservation measures.
Over grazing and over stocking and continued lack of proper management of
communalgrazing lands and lack of attention to animal feed production by any
concerned agencies.
Lack ofland useresponsibility.
5.2 Deforestation
Excess removal of forests is contributing to land degradation. Since harvested trees notreplaced
adequately by tree planting in the region, soils are exposed to high intensity of rainfallthe major
sources of energy for the rural households in the watershed include mainly firewood. The only
sources of fuel wood therefore are some homestead plantations, crop residues andanimal dung.
The major sources of energy for the rural households in the watershed includemainly firewood
residues. Most households get firewood from scrublands and private eucalyptusplantations around
homesteads and along roads and footpaths.

Tana Sub-basin Land Use Planning and Environmental Study Project
EPLAUB Watershed management Study Draft Final Report ADSWE 78
5.3 Decline of Soil Fertility
Loss of soil fertility severely affected by soil erosion and land degradation, use of dung andcrop
residues for household fuels and animal feeds and decline in fallow periods. Even thoughthe
farming system in the project area mixed crop–livestock, the culture based on thenutrient take
way from the soil that the nutrient return to the soil is minimal. The chemicalfertilizer use is also
limited because of its unaffordable price to the watershed area poor farmers.
The soil fertility problem in the watershed is therefore one of the serious problems, which
shouldbe addressed in this watershed management plan.
5.4 Weak Soil and Water Conservation Work and Management Practice
There is no defined land use system followed in the region. For the last many years, this has led
over exploitation of the natural resources. It is an area where the government and the public
should agree and adopt a policy for further degradation avoid.
The soil conservation programs were target-driven requiring procedures completed in scheduled
time with the result the officials concerned could not integrate themselves with the community.
There was no training component for the beneficiaries. The beneficiary participation confined to
preparation of action plans and no stakeholder contribution envisaged resulting in lack of
involvement.
Soil and water conservation works were focus only area coverage during construction time, even
the activity mainly targets on physical soil conservation measures, the quality was not well
controlled, no proper design, farmers little awareness, mass mobilization problem, female
participation for work is less, free grazing and unwillingness and proper maintenance is not
undertaken by the farmers on time which is devastated during land preparation.
At this time, different soil water conservation practiced but poor management observed with in
the sub basin like Mecha, Dera, Gonder Zuria and Libokemkem severely affected free grazing
and poor management design of structures and farmer plough during agricultural practice.
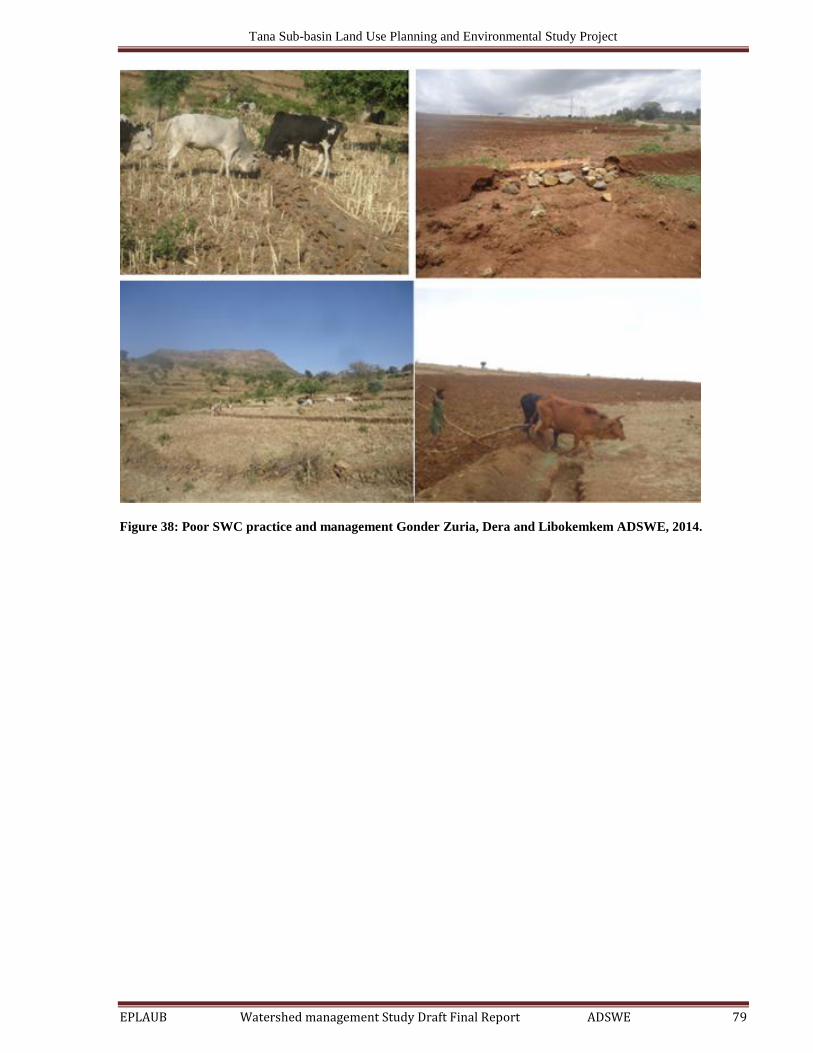
Tana Sub-basin Land Use Planning and Environmental Study Project
EPLAUB Watershed management Study Draft Final Report ADSWE 79
Figure 38: Poor SWC practice and management Gonder Zuria, Dera and Libokemkem ADSWE, 2014.

Tana Sub-basin Land Use Planning and Environmental Study Project
EPLAUB Watershed management Study Draft Final Report ADSWE 80
6. LAND MANAGEMENT PRACTICES/OPTIONS
6.1 Capability Land Classification
The variability of land resources and farming system would mean variable problems and
constraints spatially distributed with in the watershed. Variations in soil type, depth, slope and the
like factors have a strong influence on agricultural land husbandry practices. It is therefore,
necessary to classify similar areas within the watershed based up on physical land resources and
socio-economic characteristics. One of the most widely used systems of land classification is that
of the Soil Conservation Service (SCS) of the U.S. Department of Agriculture (USDA). It
commonly referred as land capability classification. There is no one land capability classification
(LCC) but many (Taffa, 2002). Different countries have different classification system, for in
every country or geographical region there are different factors, which allowed for (Taffa, 2002).
Although the numbering of classes is similar in each of the systems, this does not necessarily
mean that the lands are the same. Land in class II in Ethiopia, for instance, may not be the same
with that of class II in U.S.A or Israel (Berehanu, 2001). The land capability classification
adopted here is the one developed to the Ethiopian condition by J.V Scobedo (1988).
Accordingly, the land evaluation targeted to assess the capacity of land for soil and water
conservation purposes. The input data for capability classification obtained from soil and
topographic survey assessment report. Data of slope, soil depth, erosion, water logging, drainage,
and texture obtained from soil survey and land degradation assessment organized in soil mapping
unit over the study area. Each thematic map were reclassified based on the land capability rating
table and mapped which further combined in Arc GIS environment for capability classification.
This takes account of the least favorable assessment as limiting or determined by lowest supply of
land to evaluate the capacity of land for major land uses under consideration.
6.1.1 Capability Inputs
The present land capability evaluation used slope percent, soil depth, erosion, drainage, surface
texture, obtained from different surveys of this report sources and the present study and
reclassified based on the factor-rating table given in below.
6.1.1.1Slope (%)
Slope of the study area generated from 90mx90m DEM reclassified in Arc GIS environment and
calculated for proportional area coverage.
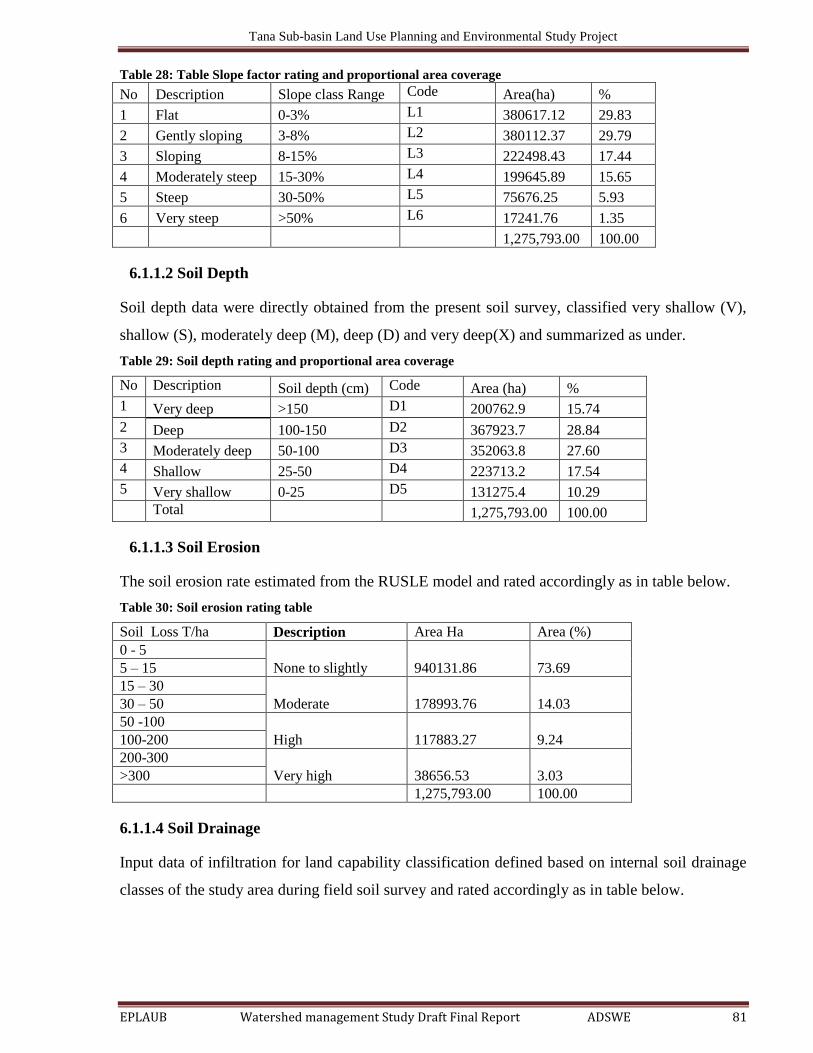
Tana Sub-basin Land Use Planning and Environmental Study Project
EPLAUB Watershed management Study Draft Final Report ADSWE 81
Table 28: Table Slope factor rating and proportional area coverage
No Description Slope class Range Code Area(ha) %
1 Flat 0-3% L1 380617.12 29.83
2 Gently sloping 3-8% L2 380112.37 29.79
3 Sloping 8-15% L3 222498.43 17.44
4 Moderately steep 15-30% L4 199645.89 15.65
5 Steep 30-50% L5 75676.25 5.93
6 Very steep >50% L6 17241.76 1.35
1,275,793.00 100.00
6.1.1.2 Soil Depth
Soil depth data were directly obtained from the present soil survey, classified very shallow (V),
shallow (S), moderately deep (M), deep (D) and very deep(X) and summarized as under.
Table 29: Soil depth rating and proportional area coverage
No Description Soil depth (cm) Code Area (ha) %
1 Very deep >150 D1 200762.9 15.74
2 Deep 100-150 D2 367923.7 28.84
3 Moderately deep 50-100 D3 352063.8 27.60
4 Shallow 25-50 D4 223713.2 17.54
5 Very shallow 0-25 D5 131275.4 10.29
Total 1,275,793.00 100.00
6.1.1.3 Soil Erosion
The soil erosion rate estimated from the RUSLE model and rated accordingly as in table below.
Table 30: Soil erosion rating table
Soil Loss T/ha Description Area Ha Area (%)
0 - 5
None to slightly 940131.86 73.69 5 – 15
15 – 30
Moderate 178993.76 14.03 30 – 50
50 -100
High 117883.27 9.24 100-200
200-300
Very high 38656.53 3.03 >300
1,275,793.00 100.00
6.1.1.4 Soil Drainage
Input data of infiltration for land capability classification defined based on internal soil drainage
classes of the study area during field soil survey and rated accordingly as in table below.

Tana Sub-basin Land Use Planning and Environmental Study Project
EPLAUB Watershed management Study Draft Final Report ADSWE 82
Table 31: Soil drainage class of Tana sub basin
No Drainage class Area (ha) Cover (%)
1 Excessively drained 84781.55 6.65
2 Imperfectly drained 337632.10 26.47
3 Moderately well drained 294377.33 23.08
4 Poorly drained 11051.8 0.87
5 Rock and Water body 26600.70 2.09
6 Somewhat Excessively drained 187393.91 14.69
7 Well drained 333901.61 26.17
1,275,793.00 100.00
6.1.1.5 Soil Texture
Soil texture classes of the study area rated and classified into 13 textural types obtained from soil
laboratory analysis. From the analysis, the three textural types are dominant in the sub basin
49.77% clay, 17.01% clay loam and 14.49% clay-to-clay loam respectively.
Table 32: Soil texture class distribution of study area
No Texture Area (ha) %
1 Clay 634972.18 49.77
2 Clay loam 217017.02 17.01
3 Clay loam to sandy clay 65585.32 5.14
4 Clay to clay loam 184886.52 14.49
5 Clay to silt clay loam 2507.39 0.20
6 Clay to silt loam 11038.16 0.87
7 Loam 33084.38 2.59
8 Sandy clay 42369.02 3.32
9 Sandy clay to clay 1214.63 0.10
10 Sandy loam 56212.40 4.41
11 Silt clay 3.81 0.00
12 Silt loam 247.46 0.02
13 Water body and rock 26600.71 2.09
1,275,793.00 100.00
6.1.2 Land Capability Classes
Land capability assessment utilized soil information obtained from field survey to classify the
land based on capability concepts of maximum limitations. In this regard, land capability maps
were prepared based on the capability assessment criteria and used to determine the conservation
needs; understand the basic characteristics of the soils and climate used as a background
document for the preparation of soil and water conservation plan in the study area. In general, the
capability class maps produced for the study area presented below in figure 40.

Tana Sub-basin Land Use Planning and Environmental Study Project
EPLAUB Watershed management Study Draft Final Report ADSWE 83
Figure 39: Land capability class map
Table 33: Land capability class and proportional area coverage in Tana sub basin
No Capability class Area(ha) Coverage (%)
1 I 84184.2 6.60
2 II 171823.4 13.47
3 III 197974.4 15.52
4 IV 520721.7 40.82
5 V 31791.85 2.49
6 VI 165832.6 13.00
7 VII 49311.26 3.87
8 VIII 54153.58 4.24
1275793.00 100.00
Tana Sub-basin Land Use Planning and Environmental Study Project
EPLAUB Watershed management Study Draft Final Report ADSWE 84
6.1.2.1 Land Capability Class I
This class covers 84184.20ha of land and accounts 6.60% of the study area. The soils do not have
limitations or hazards that restrict their use and suitable for a wide range of crops. They cropped
very intensively, used for pasture, range, woodlands and wildlife reserves. The soils are deep,
well drained, and the land is flat to gently sloping and generally fertile.
The soils need only commonly used crop management practices such as contour plough, grass
strip, trash line, land preparation, manure and fertilizer application and weeding to maintain their
productivity.
6.1.2.2 Land Capability Class II
Land capability class II occupied 171823.4hectares of land accounted 13.47% of the basin. Soils
in class II have limitations that reduce the choice of plants or require moderate conservation
practices. Soils in this class require careful soil bund, stone bund and stone faced soil bund and
biological soil conservation ,soil management and conservation practices to prevent deterioration
or to improve air and water relations when the soils are cultivated.
6.1.2.3 Land Capability Class III
This class consists of 15.52% of the study area occupied 197974.4hectares of land. The major
limitations of this class include slope, erosionand soil depth. It is, therefore, obvious that the soils
in Class III have combinations of limitations that reduce the choice of plants or require special
conservation practices.
6.1.2.4 Land Capability Class IV
The soils and climatic conditions in this class used for cultivation, but there are very severe
limitations on the choice of crops. In addition, very careful management is required. This class
covers 520721.7hectares, which is 40.82% of the land area of the basin.
6.1.2.5 Land Capability Class V
The most limiting factor of these soils is poor drainage. Soils in classes V to VIII are generally
not suited for cultivation. In some waterlogged areas of this class, drainage is not feasible. Often
water loving crops such as rice, dry season grazing or pasture development is feasible on this
class of land. Assessing the class in the basin have 31791.85hectares and covers about 2.49%
area.
Tana Sub-basin Land Use Planning and Environmental Study Project
EPLAUB Watershed management Study Draft Final Report ADSWE 85
6.1.2.6 Land Capability Class VI
Soils in this class have extreme limitations that restrict their use other than grazing, forestry and
wildlife. This class covers about 165832.6 hectares, which is 13.00 % of the study area.
6.1.2.7 Land Capability Class VII
The major limitations of the class are soil depth, slope, and erosion. Soils in this class have very
severe limitations, which restrict their use to grazing. It used for limited forestry and wildlife.
This land capability class occupies 49311.26 hectares and accounts about 3.87% of the sub basin.
6.1.2.8 Land Capability Class VIII
The major limitations of the class are soil depth, erosion and slope. The soils in this land
capability class not used for commercial tree planting. Their use should be restricted to recreation,
wildlife or aesthetic purposes. This land capability class occupies in the study area, which is
54153.58 hectares that accounts for 4.24 % of sub basin.
6.2 Proposed Soil Water Conservation Measures
In the sub basin high amount of soil loss estimated so that to solve the problem land use
management options proposed as an intervention those are mixture of physical and biological
conservation measures should be done. The interventions should be watershed based, vary with
slopes, current situation and suitability to the farming systems of the specific areas. During
implementation of the land management components in the micro-watersheds, however
interventions and land uses preferred by slope classes and land types by the land users take care
of to satisfy the participation of the farmers and their demands in integrated watershed
development.
In Tana sub basin, land degradation and status of soil erosion assessed based on review of
previous studies and actual field survey. During these periods it was possible to realize the core
causes of the problems and as well as the efforts made to alleviate the problems. In the sub basin,
physical structures constructed especially on the flat slope of grazing land areas and different
physical structures under taken by financial assistance from NGOs and government. These efforts
were lacking integrated approaches and consistencies in type and structure and thus most of the
efforts were not successful.
In order to solve the problem of soil and water conservation structures in the sub basin different
physical and biological conservation, structures proposed based on slope and land use land cover.
Tana Sub-basin Land Use Planning and Environmental Study Project
EPLAUB Watershed management Study Draft Final Report ADSWE 86
As you know, the sub basin rugged and undulating topography so that different soil and water
conservation structures are proposed. Such as soil and stone bunds, micro basin, eyebrow basin,
trench, percolation pit, hillside terrace, bench terrace, area closure and bund plantation. These
structures are conserve moisture, increase biomass of the sub basin and the most important ones.
In view of those facts, we realized that those structures already at the place maintained through
biological interventions: through plantation of different multipurpose tree and shrub species (e.g.
grass species, agro forestry). Therefore, nursery establishment is the first priority as a project
component. It expected that this intervention will mitigate the current offsite and onsite impacts
of soil erosion and at the same time tackle the root cause of erosion such as tree clearing for
firewood and construction.
The improper road ditch channel construction, overgrazing and deforestation aggravating the
gully formation and reduce grazing lands. Some of the gullies that treated by simple intervention.
The check dams supported by gabions, as the soil is easily erodible and not stable. Promotion of
agro-forestry also identified as project for its multipurpose for the community: e.g. soil fertility
management and fodders for animal feeds. Additional physical soil conservation measures such
as cut off drain at the top of gully recommended protecting growth of the gully with close
supervision of the development agents in sub basin and the physical structures done with
consultation of group of farmers so that they can do the work in common consensus.
Different physical and biological measures selected in the sub basin to address the problems of
soil erosion and land degradation. Their application follows the slope and suitability of the
techniques to area and farming system
For sound watershed management different interventions proposed that will solve the
statedproblems when it implemented properly. The development plan designed considering
social,economic, technical and ecological aspects of the area. Based on this, the
watershedmanagement plan covers physical, biophysical and biological conservation measures.

Tana Sub-basin Land Use Planning and Environmental Study Project
EPLAUB Watershed management Study Draft Final Report ADSWE 87
Figure 40: Proposed soil and water conservation measures
Table 34: Proposed Soil and water conservation measures
No Proposed SWC Area(ha) Coverage (%)
1 Area Closure 354201.9 27.76
2 Bench Terrace 41151.68 3.23
3 Buffering 31791.85 2.49
4 Contour Trench 29201.89 2.29
5 Grass Strip 245978.61 19.28
6 Micro Basin 44278.65 3.47
7 Soil Bund 75641.74 5.93
8 Stone Bund 97610.49 7.65
9 Stone faced Soil Bund 298102.4 23.37
10 Trench 57833.83 4.53
Total 1275793.00 100.00

Tana Sub-basin Land Use Planning and Environmental Study Project
EPLAUB Watershed management Study Draft Final Report ADSWE 88
6.2.1 Physical Soil and Water Conservation Measures
Physical SWC measures recommended in thesub basin for erosion control include soil, soil
facedand stonebunds, cut off drains, waterway, check dams, hillside terraces, micro basin,
eyebrow basin, bench terraceand trenches.These physical measures are applicable in a broadrange
of agro-ecological zones and land uses.
1. Soil Bunds
Suitable mostly in semi-arid and arid parts of the country but also in medium rainfall areas with
well drained soils. The sub basin suitable for soil bund is about 75641.74 ha and covers 5.93%.
The bund reduces and stops the velocity of runoff and consequently reduces soil erosion. Several
areas also show-introduced bunds adapted or adopted from past conservation activities. Local
experience is very relevant to assess performance of past activities and suggest modifications as
required. Improved designs integrated with local ones to add strength to bunds (grass, stones, etc).
It applied on cultivated lands with slopes above 3% and below 15% gradient and grazing lands
with gentle slopes at wider intervals (up to 5%) and applied within sloping homestead areas
combined with cash crops.
2. Stone Bunds
It is suitable in semi-arid and arid parts of the country but also in medium rainfall areas with deep
and well-drained soils. The area suitable for stone bund is about 97610.49 ha, covers 7.65% and
stone-faced soil bund 298102.4ha, and covers 23.37%. The stone bund reduces and stops the
velocity of runoff and consequently reduces soil erosion and the steady decline in fertility and
crop yields. Several areas also show-introduced bunds adapted or adopted from past conservation
activities. Local experience is very relevant to assess performance of past activities and suggest
modifications as required. Improved designs integrated with local ones to add strength to bunds
(plants, etc). It is applicable in a broad range of land uses in all agro-climatic areas, particularly in
cultivated lands with some level of stoniness and common in treatment of degraded hillsides.
Stone bunds also possible in large gully networks combined with vegetative stabilization and tree
planting.

Tana Sub-basin Land Use Planning and Environmental Study Project
EPLAUB Watershed management Study Draft Final Report ADSWE 89
Figure 41: Cross section of a bund
3. Cut off drain
A cut-off drain is a graded channel constructed to intercept and divert the surface runoff from
higher ground/slopes and protect downstream cultivated land or village. This safely divert the
run-off to a waterway, river, gully, etc. After assessing existence of enough out let facility, cut-off
drain is effective to avoid the excess runoff from cultivated lands.
t is suitable at a foot of a steep hillside under which cultivated fields are exposed.
Constructed above gully head to divert off run off from active gullies to treated/stable
ones.
4. Water way
A waterway is a natural or artificial drainage channel constructed along the steepest slope or in a
valley to receive/accommodate runoff from cut-off drains and graded terraces/bunds. The
waterway carries the run-off to rivers, reservoirs or gullies safely without creating erosion.
- A vegetative waterway constructed in areas without stones. The main advantage is that
waterways constructed for both very small and large size catchments, thus accommodating
individual or communal needs for drainage and evacuation/use of excess run-off.
-Paved waterways are suitable in steeper terrains and areas with large amount of stones
5. Micro-basins
Micro basins are small circular &stone-faced structures for tree planting. Are suitable for medium
and slightly low rainfall areas, stony areas and shallow soils .Based upon experience they are not
very effective in low rainfall areas (where trenches, eyebrows, etc. are preferred). It is applicable
in steep and degraded hillsides (max slope 50%) and for community closures. Micro basins often
combined with other measures such as hillside terraces, stone bunds, trenches, etc. Micro-basins
proposed to accommodate eroded soils and runoff water to create conducive microenvironment
for any type of plantation activities. The sub basin area suitable for micro basin is about 44278.65

Tana Sub-basin Land Use Planning and Environmental Study Project
EPLAUB Watershed management Study Draft Final Report ADSWE 90
and covers 3.47%.The shape of micro basins can be full or half moon type. For flat areas, full
moon type recommended while half-moon is for steep slopes. It is applicable in steep and
degraded hillsides and for community closures. Combined with hillside terraces, trenches and
other measures. Constructed using sods, in areas without stones, stabilized with
plants.Constructed using sods, in areas without stones, and stabilized with plants.
B
S
Figure 42: Patterns of micro basins
6. Trenches
Trenches are large and deep pits constructed along the contours with the main purpose of
collecting & storing rainfall water to support the growth of trees, shrubs, cash crops and grass or
various combination of those species in moisture stressed areas (350-900 mm rainfall).Trenches
can have flexible design, to accommodate the requirements of different species. Trenches collect
and store considerable amount of runoff water, thus vegetation grows faster and vigorous.
Trenches protect cultivated fields located downstream from flood and erosion. The area suitable
for trench in the sub basin about57833.83 ha and covers 4.53 %. Part of the water captured by the
trenches reaches the underground aquifer. Therefore, water tables recharged and supply springs
and wells with good quality water and for a long period. It is highly suitable in many areas in the
highlands to improve closures and plantations. Also relevant in pastoral areas to improve grazing
reserves, aerial pasture, etc. Easily understood /adopted after demonstration. Trench is applicable
in steep and degraded hillsides and for community closures. It combined with other measures
such as hillside terraces, stone bunds, and trenches based upon soil, slope and stoniness and
applied inside large gully areas for tree planting.
7. Bench terraces
A bench terrace is a conservation structure where a slope converted into a series of steps, with a
horizontal cultivated area on step riser between two steps. In Ethiopia, either constructed directly

Tana Sub-basin Land Use Planning and Environmental Study Project
EPLAUB Watershed management Study Draft Final Report ADSWE 91
on a slope or gradually developed from bunds and fanya juu. They are level along the contour in
dry to moist agro climatic zones. In moist to wet areas, they graded to drain excess runoff to
waterways or river. The area suitable for bench terrace in the sub basin is about 41151.68 and
covers 3.23%.
Specifications: Slope up to 50%, soil very deep, vertical interval is two and half times the depth
of re-workable soil depth.
Table 35: The gradient, soil depth and width of a cultivated area (in meters) on a bench terrace.
Slope gradient %
Soil depth in (cm)
25 50 75 100 125 150
20 2.81 5.63 8.44 11.25 14.06 16.88
30 1.77 3.54 5.31 7.07 8.85 10.63
40 1.25 2.50 3.25 5.00 6.25 7.50
50 0.94 1.88 2.81 3.75 4.69 6.63
Note: Bench terraces employed when too steep slope land is to be cultivated. Therefore, bench
terraces are not preferable in shallow soils. During digging infertile subsoil brought up to the
surface unless special measures taken.
- An enormous amount of labor is required for the construction, so that valuable crop should
be grown.
-They constructed on the contour or with slight gradient; the difficulty is to discharge any surface
runoff down the steep slope without causing erosion
8. Gully Control and Rehabilitation
Stabilization of gullies involves the use of appropriate structural and vegetative measures in the
head, floor and sides of the gully. The combination of the two measures (biophysical approach) is
the best solution for effective gully control and productive use of the gully area. In the sub basin
990.7ha gully assessed from cultivated, grazing and other types land use.For this physical and
biological treatment must done. The establishment of biological measures will follow the
construction of gully physical structures. Stabilized watershed slopes are the best assurance for
the continued functioning of gully control structure.Some of the most common physical and
biological gully control measures.
In gully control, temporary physical structural measures such as gully reshaping, brushwood, sand
bag, loose stone, and gabion check-dams used to dissipate the energy of runoff and to keep the
stability of the gully. Check-dams constructed across the gully bed to stop channel/bed erosion.
By reducing the original gradient of the gully channel, check-dams diminish the velocity of water
flow of runoff and the erosive power of runoff. Run-off during peak flow conveyed safely by
check-dams.

Tana Sub-basin Land Use Planning and Environmental Study Project
EPLAUB Watershed management Study Draft Final Report ADSWE 92
a. Gully reshaping and filling
Gully wall reshaping is cutting off steep slopes of active gully flanks in to gentle slope (Minimum
at 45% slope), up to two-third of the total depth of the gully and constructing small trenches along
contours for re-vegetating slanted part of the gully walls and beds. If the gully is wide and has
meandering nature with huge accumulation of runoff flowing down, cut off soils and soil
materials can be washed away by runoff water and requires constructing of retaining walls, to
protect displaced (not yet stabilized) soils and soil materials and newly created sidewalls of the
reshaped gully. Gullies with very little water flow stabilized by filling and shaping, that is, if the
surface water diverted, and livestock kept out. Steep gully heads and gully banks shaped to a
gentler slope (about a one-to-one slope). Filling of gullies is applicable only for small
discontinuous gullies, in their early stages of development. The filled gully area can be planted
even be used for cultivation. Rills and incipient branch gullies filled in by spade shovel or plow
(on cultivated lands)
b. Brushwood check-dams
Brushwood check-dams made of posts and brushes placed across the gully (Figure 5). The main
objective of brushwood check-dams is to hold fine material carried by flowing water in the gully.
Brushwood check dams can also stabilize small gully heads, no deeper than one meter.
Brushwood check-dams are temporary structures and not used to treat ongoing problems such as
concentrated run-off from roads or cultivated fields. They employed in connection with land use
changes such as reforestation or improved range management until vegetative and slope treatment
measures become effective.
There are two types of brushwood check-dams: these are single row and double row brush wood
check-dams. The type chosen for a particular site depends on the amount and kind of brush
available and on the rate and volume of runoff.
i. Single row brushwood checkdams
These check-dams used where the flow of runoff is less than 0.5m3/sec. The structure is
temporary and its durability will depend on the quality of posts used. If possible, live posts of
willow, popular and other should be used (8 – 10 cm in diameter). Thicker branches used as
vertical posts driven into the soil to about 50 cm– 100 cm (1/3 to half of the post length) depth
and spaced about 30 to 50 cm apart. The posts will have a length of 1 – 2 m. The space between
the posts will depend upon the height of the check-dam. The higher the dam, the closer will be the
distance between the posts.

Tana Sub-basin Land Use Planning and Environmental Study Project
EPLAUB Watershed management Study Draft Final Report ADSWE 93
ii. Double row brushwood check-dam
This type of brushwood check-dam is suited where the flow of runoff is less than 1 m3/sec. The
construction of the dam starts with an excavation inthe floor and into the sides of the gully to a
depth of 0.3 – 0.5 m. Two rows of posts, 5 -10 cm in diameter and 1 - 2 m in length placed into
the holes, across the floor of the gully to a depth of 0.5 – 0.6 m. The spacing between the posts is
0.5 m. The height of the posts in the center should not exceed the height of the spillway otherwise
the flow will be blocked and water may be forced to move to the gully sides
c. Loose stone check-dam
Loose stone check-dam is a structure made of relatively small rocks and placed across the gully
or small stream, which reduces the velocity of runoff and prevents the deepening and widening of
the gully. The Sediment accumulated behind a check-dam used for plantation of crops or
trees/shrubs, grasses and thus provide additional income tothe farmer. This commonly used to
check gullies on highly eroded grazing and cultivated lands and hillsides.A loose stone check-
dam should full fill the following minimum standards.
The Bottom key and foundation is 0.5 m deep, side key 0.5 – 1 m per side ,height: 1 – 1.5 m
excluding the foundation, mostly 1 m is suffice to avoid failures ,base width: 1 m – 3. 5 m. The
spillway (trapezoidal/parabolic): 0.25 – 0.5 m permissible depth and 0.25 m free board; and width
0.5 – 1.2 m, apron length should be at least 1.5 times of the effective height of the check-dam and
as wide as the gully bed and the apron placed in an excavation of about 0.3 – 0.5 m to ensure
stability and prevent wash away. A sill of about 15 cm constructed on the lower end of the apron.
d. Gabion check-dam
Gabions are rectangular boxes of varying sizes and are mostly made of galvanized steel wire
woven into mesh. The boxes tied together with wire and then field with either stone or soil
material and placed as building blocks. Large and smallstones filled with in the gabion to protect
from heavy runoff washed away and correctly installed.
The main advantages of gabions are tough and long lasting that the wire has been well
galvanized. Furthermore, they are somewhat flexible and installed where the surface is uneven.
They used to stabilize gully sides, gully heads, roadside embankments, riverbanks and even
landslips. This should integrate with biological measures to restore and play a great role for
rehabilitation of the gully.
Gabion check-dams undermined or bypassed round the side due to incorrect installation or
unstable soils. Common problems are failure to embed the gabions to a sufficient depth in the

Tana Sub-basin Land Use Planning and Environmental Study Project
EPLAUB Watershed management Study Draft Final Report ADSWE 94
floor of the gully and failure to insert to a sufficient distance in to the gully banks. Once in placed
and properly anchored, gabion check-dam can resist even strong flood sand last for a long time.
Gabion check-dams built usually not high than1.5 m spillway height in the first year. After
sediments deposited behind the structure, it is possible to raise the spillway height by adding
additional gabion boxes. Nowadays, different sized gabions are available commercially in the
country.
Table 36: Different sizes of gabions (Length x Width x Height) and wire requirement for each
No Gabion Size
(m)
2.5 mm wire
(kg)
3.5mm wire
(kg)
Tying wire
(kg)
Share of each size during
construction (%)
1 2x1x1 12.0 2.3 0.6 60
2 2x1x0.5 8.5 1.7 0.5 20
3 1x1x1 7.0 1.5 0.4 15
4 1x1x0.5 3.4 0.9 0.3 5
(Source: Lakew & Belayneh, 2012)
Design and construction specification of a gabion check-dam. The foundation depth (key trench)
should not be less than 50 cm. The foundation width is 1m and the structure plugged one meter to
each side of the gully wall /abutment/ right up to the height of the dam. Construct apron from
downstream side of the structure with a foundation of 30cm from a dry stone, with a width of 1.5
times the reservoir level. For the spillway, the general design criteria given for loose stone check-
dam is applicable here. It should be adequate to allow the peak flows, without overtopping the
dam. An apron of stone/similar gabion box about 1.5 m times the height of the spillway is
necessary. General considerations for the apron are the same as for the loose stone check dam.
6.2.2 Biological Soil and Water Conservation Measures
Biological soil conservation has economic and ecological linkages in the way of providing
adequate groundcover and narrowing the gap between population pressure and carrying capacity
of the land. The ground cover or vegetation cover maximized by improved soil conditions and
effective management of rainfall and run-off. If the physical, chemical and biological properties
of the soil are improved pastureland and forest productivity and the environment also changed.
The effective control of soil erosion and improvement of agricultural productivity through
biological soil conservation techniques determines the linkage of strong economic and ecology in
biological soil conservation. Currently there are little efforts of plantation of different plant
species as biological soil conservation measures within the sub basin by community participation.
Therefore, multipurpose trees integrated, as biological conservation measures mustpropose. The
biological conservation measures should be thedrought resistance species, forageand fruit
trees.Even though the importance of these species is not widely understood by the community
great extension should be transferred and done in the sub basin about their importance and
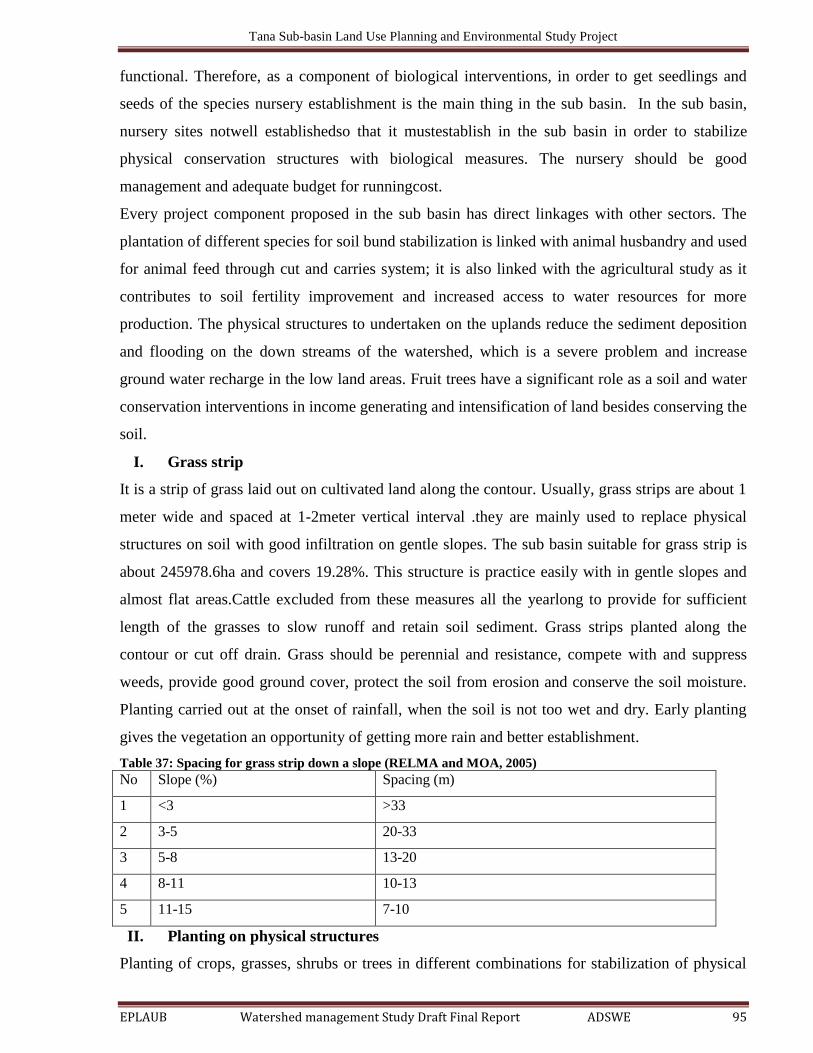
Tana Sub-basin Land Use Planning and Environmental Study Project
EPLAUB Watershed management Study Draft Final Report ADSWE 95
functional. Therefore, as a component of biological interventions, in order to get seedlings and
seeds of the species nursery establishment is the main thing in the sub basin. In the sub basin,
nursery sites notwell establishedso that it mustestablish in the sub basin in order to stabilize
physical conservation structures with biological measures. The nursery should be good
management and adequate budget for runningcost.
Every project component proposed in the sub basin has direct linkages with other sectors. The
plantation of different species for soil bund stabilization is linked with animal husbandry and used
for animal feed through cut and carries system; it is also linked with the agricultural study as it
contributes to soil fertility improvement and increased access to water resources for more
production. The physical structures to undertaken on the uplands reduce the sediment deposition
and flooding on the down streams of the watershed, which is a severe problem and increase
ground water recharge in the low land areas. Fruit trees have a significant role as a soil and water
conservation interventions in income generating and intensification of land besides conserving the
soil.
I. Grass strip
It is a strip of grass laid out on cultivated land along the contour. Usually, grass strips are about 1
meter wide and spaced at 1-2meter vertical interval .they are mainly used to replace physical
structures on soil with good infiltration on gentle slopes. The sub basin suitable for grass strip is
about 245978.6ha and covers 19.28%. This structure is practice easily with in gentle slopes and
almost flat areas.Cattle excluded from these measures all the yearlong to provide for sufficient
length of the grasses to slow runoff and retain soil sediment. Grass strips planted along the
contour or cut off drain. Grass should be perennial and resistance, compete with and suppress
weeds, provide good ground cover, protect the soil from erosion and conserve the soil moisture.
Planting carried out at the onset of rainfall, when the soil is not too wet and dry. Early planting
gives the vegetation an opportunity of getting more rain and better establishment.
Table 37: Spacing for grass strip down a slope (RELMA and MOA, 2005)
No Slope (%) Spacing (m)
1 <3 >33
2 3-5 20-33
3 5-8 13-20
4 8-11 10-13
5 11-15 7-10
II. Planting on physical structures
Planting of crops, grasses, shrubs or trees in different combinations for stabilization of physical

Tana Sub-basin Land Use Planning and Environmental Study Project
EPLAUB Watershed management Study Draft Final Report ADSWE 96
structure. It should combine with other purposes for the maximization of the use of the woody
plants grown. This is suitable in all land uses
Technology description: close spacing, use seedlings instead of direct seeding, nitrogen fixing
trees for forage purposes, single row planting preferred, side pruning of trees after 1-2 years and
root pruning may be necessary to avoid competition with crops
III. Crop Rotation and Inter-Cropping
Crop rotation with intervals of cereals and legumes applied to improve soil fertility, which
enhance biomass production and maximize land cover. These are very important for halting
splash erosion and controlling soil moving with surface runoff. Crop types for both crop rotation
and inter-cropping carefully selected to maximize soil and water conservation as well as
economic value. This applied in crop cultivation of both altitudes and in all slope ranges.
Cover crops and green manure:Cover crops grown as soil conservation measures during the off-
seasons. The plants, in most cases, grown on the surplus moisture after the previous crop
harvested. Such crops grown, ploughed, and mixed with the soil in their young age as green
manure. Crops used for this purpose must be legumes like chickpeas, lintels and Sesbania tree
species. This also used mainly in medium altitude farmlands.
IV. Hedgerows
This activity already partially practiced in the sub basin along some field boundaries and
homesteads. However, it should expanded with the plant species and planting designs
improvement in order to meet soil conservation functions; livestock feed and fodder production
and fuel and construction wood production. In relation to these, hedgerows designed, as much as
possible, on contour lines along and between field crops and homestead. Plant, shrub and grass
species planted should be with multipurpose quality and fast growing. The species must have high
palatable biomass for livestock feed and forage; enriching ability of soil nutrients; high yield of
food, fuel and construction wood; quality for soil and water conservation but not aggressively
compete or suppress the field crops; and social acceptance in the area. Under growing of grass
and bushy shrub, species with these hedgerows would be very important to control the movement
of soil particles. In addition, a meter wide grass along the hedgerows would supplement grazing
to animals given special attention like lactating cows, calves and draught animals and more
control of soil movement.
V. Agroforestry Practice
Agroforestry defined as all practices that involves a close association of trees and shrubs with
crops,animals and /or pastures. Agroforestry may involve a combination of practices in the same
place at the same time (intercropping or related practices) or practices in the same place but at

Tana Sub-basin Land Use Planning and Environmental Study Project
EPLAUB Watershed management Study Draft Final Report ADSWE 97
different time (rotational practice)
VI. Dispersed trees in the farm
Trees may be grown on farmers‟ fields while crop grown in the under storey. The trees may be
dispersed widely, either spaced systematically in grid or scattered at random. The practice of
raising trees dispersed on crop land may be used based on the protection and management of
selected trees on the site. Spacing is determined by the size and requirement of the trees and in
order to fit trees in to the crop land in a way of that minimizes interference with crop cultivation
and that makes the best use of any positive effects of the trees on crops.
VII. Boundary and border planting
Demarcation of areas between different land owners or land uses, different from live fences in
objective and border plants are usually allowed to grow taller while living fences are trimmed
regularly
VIII. Protection and Stabilization of water way and gullies
Permanent vegetation particularly trees and shrubs can play major role in stabilizing artificial
waterways and gullies as well as natural stream banks. Woody vegetation helps decrease water
velocity along the channel edges and protects exposed soil, gravel or rocks from the erosive
forces of flowing water. In smaller channels and even in extremely steep ones such as gullies,
trees shrubs and grasses can reduce flow velocity across the entire channel.
IX. Soil and water conservation measures for grasslands
Grass land is a land use type where the dominant species are grasses and included cultivated land
that was or will have to be the abandoned from cultivation and change into grass land. The system
should practice controlled grazing, rational grazing and cut carry to protect from land
degradation.
Controlled grazing: controlling the number and types of livestock that graze a pasture
prevent over grazing and avoids waste feeding.
Rational grazing is a form of controlled grazing and involves dividing pasture land into
several paddocks and allowing livestock to graze each in turn.
Cut and carry involves keeping animals in a shed or paddock and bringing fodder to them
rather than allowing them to graze outside. It is also called zero grazing or stall-feeding.
X. Area Closure
Area closure is suitable for degraded areas in most agro-climatic parts of the sub basin. It
commonly practiced inEthiopia with different levels of performance. Best-closed areas found
when directly managed by the communityand groups of interested farmers. Based on the analysis

Tana Sub-basin Land Use Planning and Environmental Study Project
EPLAUB Watershed management Study Draft Final Report ADSWE 98
the sub basin suitable for area closure is about 354201.9ha and covers 27.76%. Area closure
increases the productivity of degraded and moisture stressed areas and combined with different
soil and moisture conservation measures.Area closure restores sufficient productivity for the
growth of multipurpose trees,grass and specific cash crops. Area closure protects downstream
fertile fields from flood and erosion and contributes torecharge aquifers. When properly managed
area closure can provide significant income to poorest households.
Therefore, the first duty of the natural resource managers and the political leaders especially and all
the citizens as a whole should be responsible in all conservation interventions and could create
awareness one to the other. Natural resources conservation and management is not left for only for
the conservationist, it the duty of all citizens. Hence, all sectorial offices should cooperate and
givesupport for the facilitation of natural resources management. The area closure will benefit the
surrounding community in providing adequate fuel wood and construction materials. It directly
linked with job creation for the rural youth and as well as solving the problem of landlessness in the
rural areas.

Tana Sub-basin Land Use Planning and Environmental Study Project
EPLAUB Watershed management Study Draft Final Report ADSWE 99
:
7. CONCLUSION AND RECOMMENDATION
7.1 Conclusion
Land degradation (water erosion) is serious problem in the sub basin due to strong
linked with livelihoods of the community like over grazing and deforestation due
to population pressure; resulted high amount of soil is erosion and expansion of
desertification.
Water erosion and flood are the other serious problem in the sub basin.
Watershed based land use planning work is not well established (developed) in the
sub basin.
Lake Tana seriously affected with sediment load and the amount of water content
and depth of the Lake decrease year to year.
Areas >30% slopes are ploughed by the local people and this increase amount of
soil degradation towards Lake Tana.
Physical soil and water conservation structures with in the sub basin constructed in
large amount but the quality is still under problem.
7.2 Recommendation
To solve the problems of soil degradation in the sub basin great extension and new
technology application should practice.
To solve the problem of watershed based land use planning in the sub basin at all
levels (from kebele to regional) watershed principles, ways of management and its
importance should be cleared and trained.
As the other problems,water erosion is a serious problem in the sub basin so that
physical and biological soil and water conservation structures fully practice in the
sub basin and further farmer extension should done for the severity and effects of
water erosion.
The flood comes from upper catchment of the sub basin if it is possible treated by
different types soil and water conservation structures and the excess amount of
flood should be protected by constructing gabion check dam near the riverside in
order to protect from increasing of riversides width and over topping.
Physical and biological soil and water conservation structures in the sub basin

Tana Sub-basin Land Use Planning and Environmental Study Project
EPLAUB Watershed management Study Draft Final Report ADSWE 100
should be well established with standards, actual norms and maintained
properly.Finally, as an introduction of zero grazing scaling up must practice.
It is from this viewpoint that the government is taking different actions to reverse
the problems. During this study the severity of the problems are identified which
indicates site-specific interventions. For this purpose the involvement and
consultation of the community for the implementation and sustainability of the
interventions is very decisive. The other important point considered is building the
capacity of the government staffs who are supposed to implement the projects at
all level. The Woredaagricultural office is the immediate responsible for
implementation of the project and thus strengthening of the office in all aspect is
very crucial. The Woreda staffs also should get adequate training on the subject
matter before the commencement of the project in their respective working area.
Tana Sub-basin Land Use Planning and Environmental Study Project
EPLAUB Watershed management Study Draft Final Report ADSWE 101
8. REFERENCES
1. Acres and Shawel, 1995.Watershed management plan of Koga irrigation project feasibility
Study Report.
2. Black, 2001. Conservation of Water and Related land Resource 3rdedition pp .403.
3. Foster, G.R., 1982. Modelling the erosion processes. In: C.T. Haan (Editor), Hydrologic
Modelling of Small Watersheds. ASAE Monograph, pp. 297-380.
4. IFAD/EPLAUA, 2007.Baseline Information of Community-Based Integrated Natural
Resources Management Project in Lake Tana Sub-Basin.
5. Lu, X. and Higgitt, D.L. 2001. Sediment delivery to the Three Gorges. 2: local response.
Geomorphology, 41: 157-169.
6. McDonald and Partners in collaboration with Institute of Hydrology. 1991. Hydrometry
Project Somalia. Final Report, Phase 3.
7. McDonald and Partners. McDonald and Partners in collaboration with Institute of Hydrology.
1991. Hydrometry Project – Somalia. Final Report, Phase 3
8. MoARD, 2005. Community Based Participatory Watershed Development. Volume 1 and 2
.Addis Ababa, Ethiopia.
9. MORGAN, R.P.C. 1995.Soil Erosion and Conservation.Edinburgh: Addison-Wesley
Longman.pp. 198
10. MORGAN, R.P.C. 1994. Soil Erosion and Conservation. Silsoe College, Cranfield
University. MORGAN, R.P.C. 1974.Estimating regional variation in soil erosion
hazard in Peninsular, Malaysia. Malayan Nature Journal 28: 94-106.
11. Norman W. Hudson, 1987.Soil and water conservation in semi-arid areas. Food and
Agriculture Organization of the United Nations Rome.
12. NYSSEN, J.1997. Soil erosion in Tigray Highlands (Ethiopia).IIsOIL loss estimation.Geo-Eco-
Trop.,21(1) pp 27-49
13. Poesen, J., Nachtergaele, J., Verstraeten, G. and Valentin, C., 2003. Gully erosion and
environmental change: Importance and research needs. Catena, 50: 91-113
14. Saavedra, C. 2005. Estimating spatial patterns of soil erosion and deposition in the Andean
region using geo-information techniques. A case study in Cochabamba, Bolivia. PhD Thesis,
ITC, Enschede
15. TCS, 2013. Baseline Survey of Community-Based Integrated Natural Resources Management
Project in Lake Tana Sub-Basin

Tana Sub-basin Land Use Planning and Environmental Study Project
EPLAUB Watershed management Study Draft Final Report ADSWE 102
16. Thornes, J.B. 1990. Vegetation and Erosion: Processes and Environments. Wiley, ChicHester,
London, UKWischmeier, W.H., Smith, D. D., 1978. Predicting Rainfall Erosion Losses.
Agricultural Handbook 537. USDA, Washington, DC, USA.
17. WWDSE/TAHAL, 2008.Watershed Management final feasibility Study Report Design of Rib
Dam in Lake Tana Sub-Basin Project.

Tana Sub-basin Land Use Planning and Environmental Study Project
EPLAUB Watershed management Study Draft Final Report ADSWE 103
9. APPENDICES
Appendix I. RUSLE Estimation Parameter
Table 38: FAO soil unit & their corresponding K values
FAO soil unit K- value FAO soil unit K- value FAO soil unit K- value FAO soil unit K- value
Eutric Fluvisol 0.15 Luvic Phaeozem 0.1 Ranker 0.1 Eutric planosol 0.2
Calcaric Fluvisol 0.1 Gleyic Phyaeozem 0.1 Haplic Phaeozem 0.1 Dystric Planosol 0.2
Dystric Fluvisol 0.1 Eutric Cambisols 0.15 Calcaric Phaeozem 0.1 Mollic Planosol 0.15
Eutric Gleysol 0.15 Dystric Cambisols 0.15 Humic Planosol 0.15 Cacic Xerosol 0.2
Calcaric Gleysol 0.1 Humic Cambisols 0.1 Solodic Planosol 0.2 Gypsic Xerosol 0.2
Dystric Gleysol 0.15 Gleyic Cambisols 0.15 Ochric Andosol 0.15 Luvic Xerosol 0.2
Mollic Gleysol 0.1 Calcaric Cambisols 0.15 Molic Andosol 0.1 Orthic Acrisol 0.15
Humic Gleysol 0.1 Chromic Cambisols 0.15 Humic Andosol 0.1 FerricAcrisol 0.15
Plinthic Gleysol 0.15 Vertic Cambisols 0.2 Vertic Andosol 0.15 HumicAcrisol 0.1
Eutric Regosol 0.15 Ferallic Cambisols 0.15 Pellic Vertisol 0.2 Plinthic Acrisol 0.2
Calcaric Regosol 0.1 Orthic Luvisol 0.15 Chromic Vertisol 0.2 Gleyic Acrisol 0.15
Dystric Regosol 0.15 Chromic Luvisol 0.15 Orthic solonchak 0.15 Eutric Nitosol 0.15
Lithosol 0.1 Calcic Luvisol 0.15 Molic solonchak 0.1 Dystric Nitosol 0.15
Cambic Arinosol 0.1 Vertic Luvisol 0.2 Takyric solonchak 0.2 Humic Nitosol 0.1
Luvic Arinosol 0.1 Ferralic Luvisol 0.15 Gleyic solonchak 0.15 Orthic Ferralosol 0.15
Feralic Arinosol 0.1 Albic Luvisol 0.2 Orthic solonetz 0.2 Xanthic Ferralosol 0.15
Albic Arinosol 0.1 Plinthic Luvisol 0.2 Mollic solonetz 0.15 Rhodic Ferralosol 0.15
Rendzina 0.1 Gleyic Luvisol 0.15 Gleyic solonetz 0.2 Humic Ferralosol 0.1
Source:Reconnaissance Physical Land Evaluation in Ethiopia. (FAO, 1989)
Table 39: Major soil unit, soil color and K- Values
No Major soil Soil color SCRP estimates of K-value
1 Eutric Fluvisols Mostly brown but variable 0.2
2 Eutric Vertisols Dark grey or Black 0.15
3 Eutric Cambisol Brown or Dark brown 0.2
4 Eutric Leptosols Brown to yellowish brown 0.2
5 Haplic Alisols Reddish brown 0.25
6 Haplic Luvisols Brown /Reddish brown 0.2
7 Haplic Nitosols Reddish brown 0.25
8 Chromic Luvisol Brown /Reddish brown 0.2
9 Lithic Leptosols Brown to yellowish brown 0.2
10 Eutric Regosols Brown 0.2
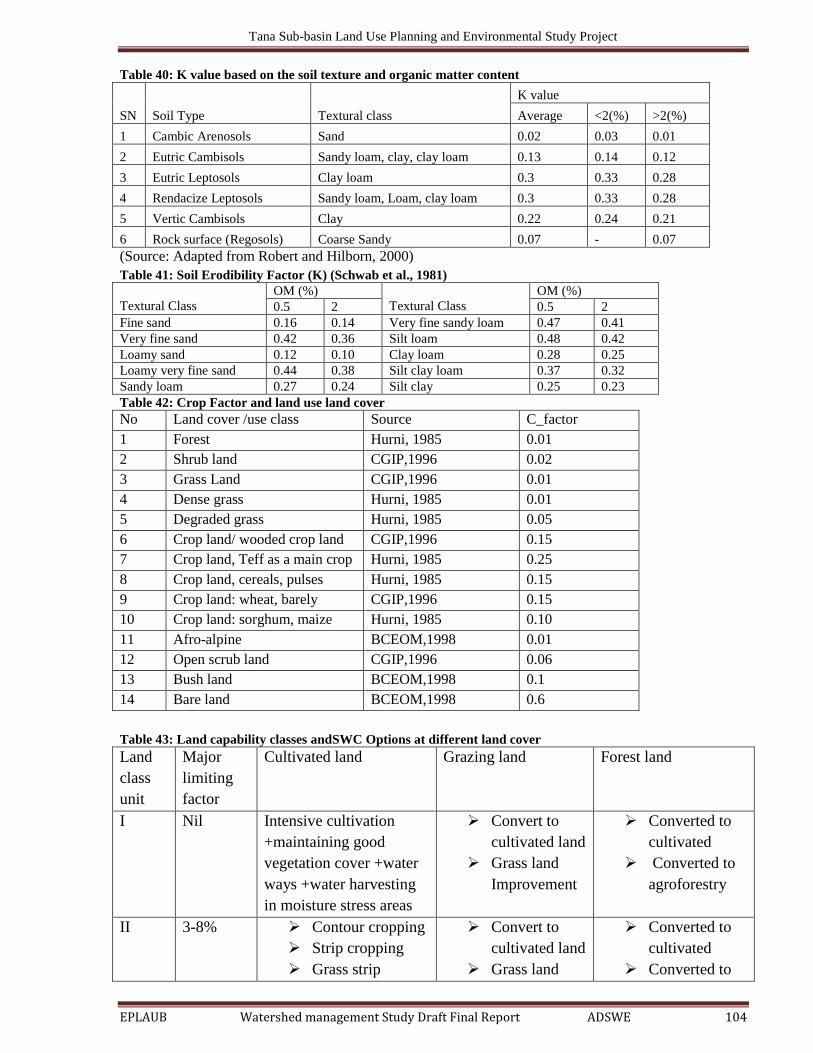
Tana Sub-basin Land Use Planning and Environmental Study Project
EPLAUB Watershed management Study Draft Final Report ADSWE 104
Table 40: K value based on the soil texture and organic matter content
SN Soil Type Textural class
K value
Average <2(%) >2(%)
1 Cambic Arenosols Sand 0.02 0.03 0.01
2 Eutric Cambisols Sandy loam, clay, clay loam 0.13 0.14 0.12
3 Eutric Leptosols Clay loam 0.3 0.33 0.28
4 Rendacize Leptosols Sandy loam, Loam, clay loam 0.3 0.33 0.28
5 Vertic Cambisols Clay 0.22 0.24 0.21
6 Rock surface (Regosols) Coarse Sandy 0.07 - 0.07
(Source: Adapted from Robert and Hilborn, 2000)
Table 41: Soil Erodibility Factor (K) (Schwab et al., 1981)
Textural Class
OM (%)
Textural Class
OM (%)
0.5 2 0.5 2
Fine sand 0.16 0.14 Very fine sandy loam 0.47 0.41
Very fine sand 0.42 0.36 Silt loam 0.48 0.42
Loamy sand 0.12 0.10 Clay loam 0.28 0.25
Loamy very fine sand 0.44 0.38 Silt clay loam 0.37 0.32
Sandy loam 0.27 0.24 Silt clay 0.25 0.23
Table 42: Crop Factor and land use land cover
No Land cover /use class Source C_factor
1 Forest Hurni, 1985 0.01
2 Shrub land CGIP,1996 0.02
3 Grass Land CGIP,1996 0.01
4 Dense grass Hurni, 1985 0.01
5 Degraded grass Hurni, 1985 0.05
6 Crop land/ wooded crop land CGIP,1996 0.15
7 Crop land, Teff as a main crop Hurni, 1985 0.25
8 Crop land, cereals, pulses Hurni, 1985 0.15
9 Crop land: wheat, barely CGIP,1996 0.15
10 Crop land: sorghum, maize Hurni, 1985 0.10
11 Afro-alpine BCEOM,1998 0.01
12 Open scrub land CGIP,1996 0.06
13 Bush land BCEOM,1998 0.1
14 Bare land BCEOM,1998 0.6
Table 43: Land capability classes andSWC Options at different land cover
Land
class
unit
Major
limiting
factor
Cultivated land Grazing land Forest land
I Nil Intensive cultivation
+maintaining good
vegetation cover +water
ways +water harvesting
in moisture stress areas
Convert to
cultivated land
Grass land
Improvement
Converted to
cultivated
Converted to
agroforestry
II 3-8% Contour cropping
Strip cropping
Grass strip
Convert to
cultivated land
Grass land
Converted to
cultivated
Converted to
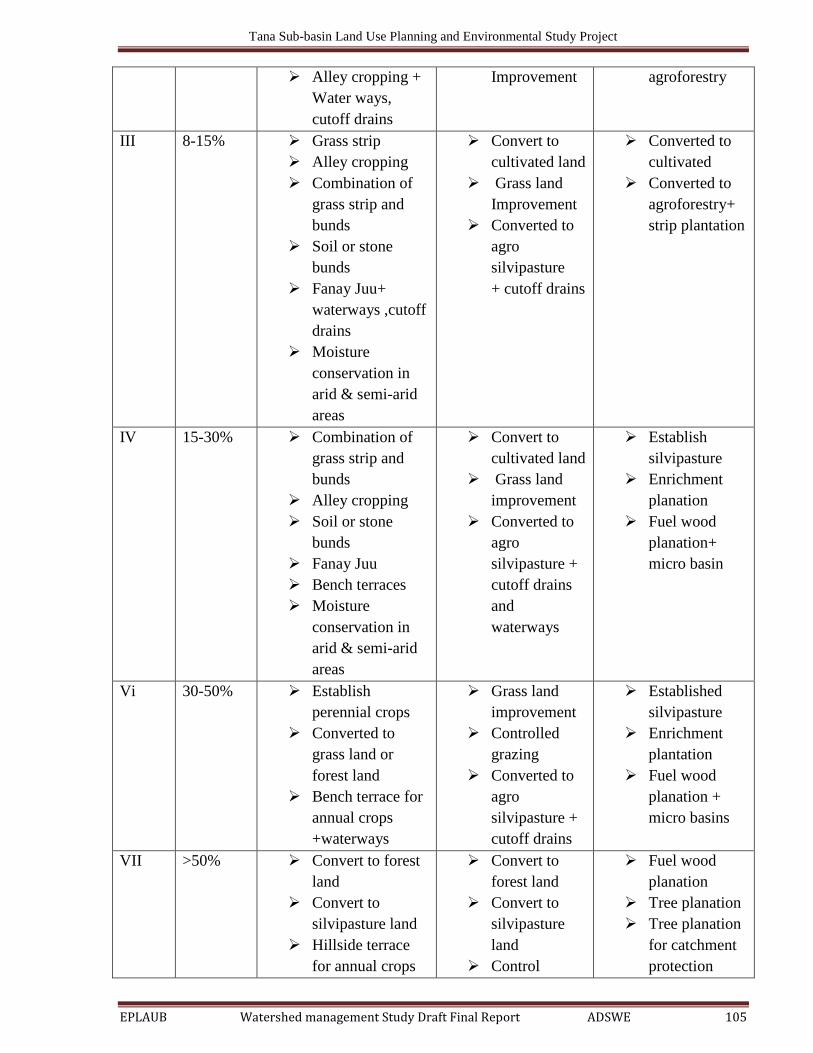
Tana Sub-basin Land Use Planning and Environmental Study Project
EPLAUB Watershed management Study Draft Final Report ADSWE 105
Alley cropping +
Water ways,
cutoff drains
Improvement agroforestry
III 8-15% Grass strip
Alley cropping
Combination of
grass strip and
bunds
Soil or stone
bunds
Fanay Juu+
waterways ,cutoff
drains
Moisture
conservation in
arid & semi-arid
areas
Convert to
cultivated land
Grass land
Improvement
Converted to
agro
silvipasture
+ cutoff drains
Converted to
cultivated
Converted to
agroforestry+
strip plantation
IV 15-30% Combination of
grass strip and
bunds
Alley cropping
Soil or stone
bunds
Fanay Juu
Bench terraces
Moisture
conservation in
arid & semi-arid
areas
Convert to
cultivated land
Grass land
improvement
Converted to
agro
silvipasture +
cutoff drains
and
waterways
Establish
silvipasture
Enrichment
planation
Fuel wood
planation+
micro basin
Vi 30-50% Establish
perennial crops
Converted to
grass land or
forest land
Bench terrace for
annual crops
+waterways
Grass land
improvement
Controlled
grazing
Converted to
agro
silvipasture +
cutoff drains
Established
silvipasture
Enrichment
plantation
Fuel wood
planation +
micro basins
VII >50% Convert to forest
land
Convert to
silvipasture land
Hillside terrace
for annual crops
Convert to
forest land
Convert to
silvipasture
land
Control
Fuel wood
planation
Tree planation
Tree planation
for catchment
protection
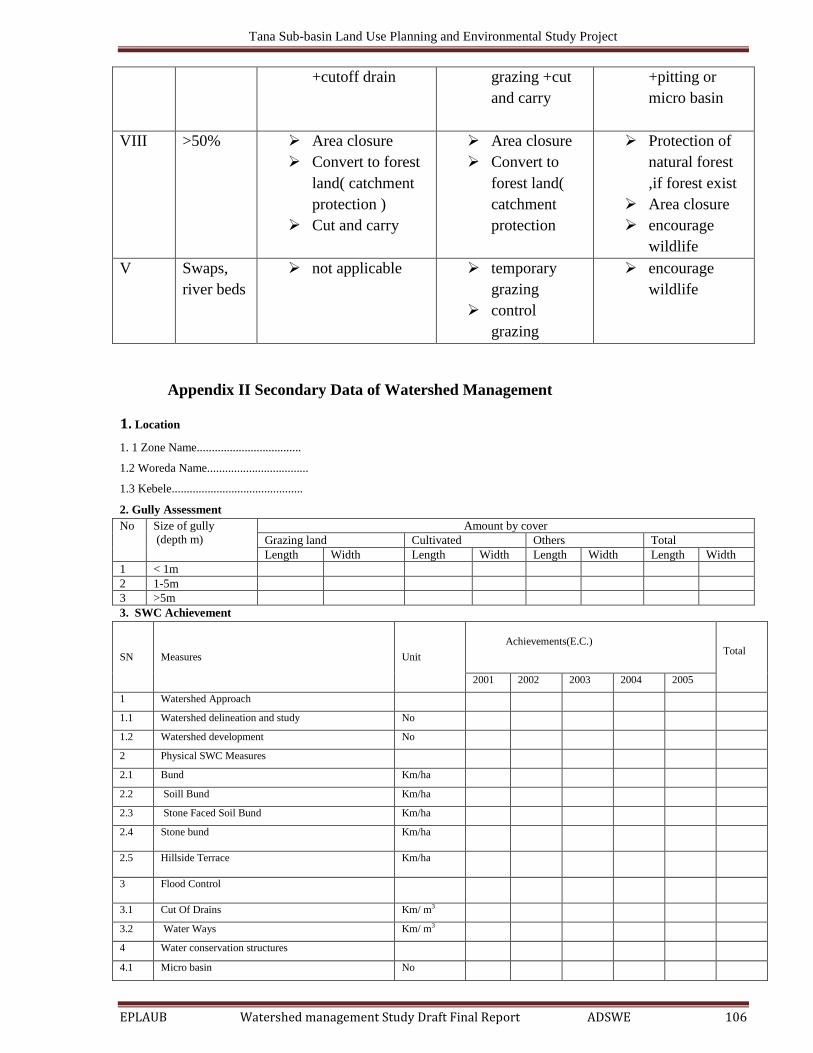
Tana Sub-basin Land Use Planning and Environmental Study Project
EPLAUB Watershed management Study Draft Final Report ADSWE 106
+cutoff drain grazing +cut
and carry
+pitting or
micro basin
VIII >50% Area closure
Convert to forest
land( catchment
protection )
Cut and carry
Area closure
Convert to
forest land(
catchment
protection
Protection of
natural forest
,if forest exist
Area closure
encourage
wildlife
V Swaps,
river beds
not applicable temporary
grazing
control
grazing
encourage
wildlife
Appendix II Secondary Data of Watershed Management
1. Location
1. 1 Zone Name...................................
1.2 Woreda Name..................................
1.3 Kebele............................................
2. Gully Assessment
No Size of gully
(depth m)
Amount by cover
Grazing land Cultivated Others Total
Length Width Length Width Length Width Length Width
1 < 1m
2 1-5m
3 >5m
3. SWC Achievement
SN Measures Unit
Achievements(E.C.)
Total
2001 2002 2003 2004 2005
1 Watershed Approach
1.1 Watershed delineation and study No
1.2 Watershed development No
2 Physical SWC Measures
2.1 Bund Km/ha
2.2 Soill Bund Km/ha
2.3 Stone Faced Soil Bund Km/ha
2.4 Stone bund Km/ha
2.5 Hillside Terrace Km/ha
3 Flood Control
3.1 Cut Of Drains Km/ m3
3.2 Water Ways Km/ m3
4 Water conservation structures
4.1 Micro basin No
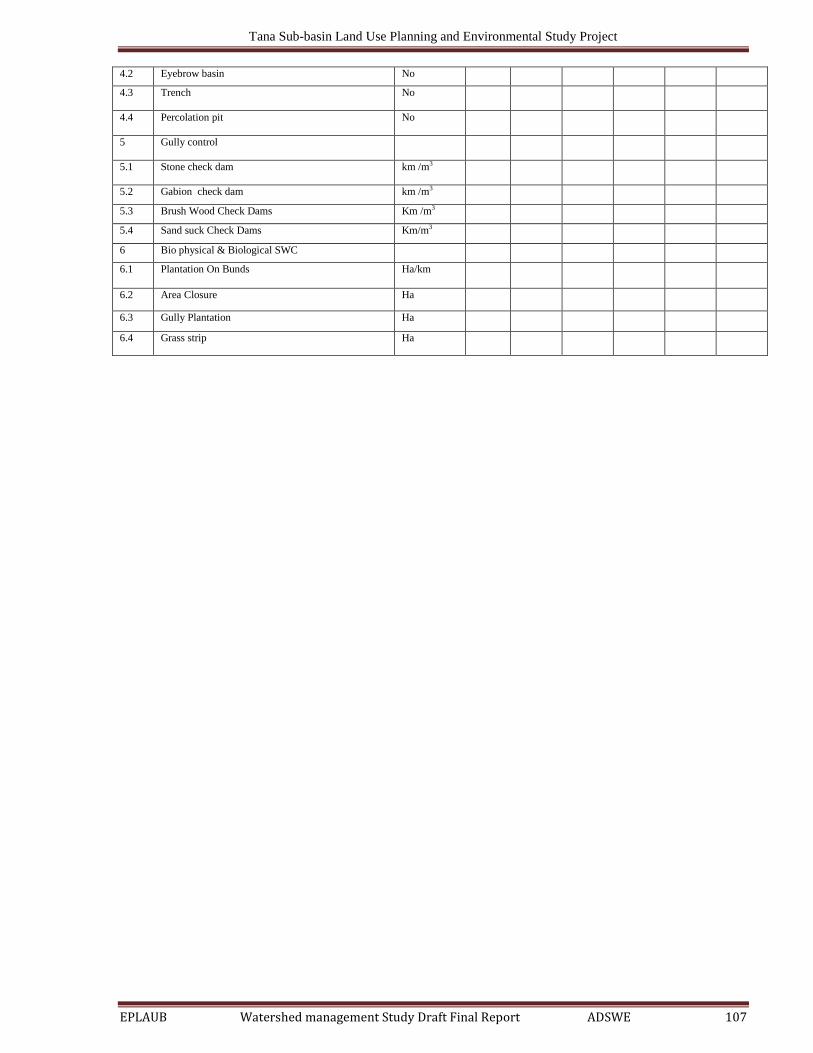
Tana Sub-basin Land Use Planning and Environmental Study Project
EPLAUB Watershed management Study Draft Final Report ADSWE 107
4.2 Eyebrow basin No
4.3 Trench No
4.4 Percolation pit No
5 Gully control
5.1 Stone check dam km /m3
5.2 Gabion check dam km /m3
5.3 Brush Wood Check Dams Km /m3
5.4 Sand suck Check Dams Km/m3
6 Bio physical & Biological SWC
6.1 Plantation On Bunds Ha/km
6.2 Area Closure Ha
6.3 Gully Plantation Ha
6.4 Grass strip Ha
Related Documents