THE fDi REPORT 2014 Global greenfield investment trends

The FDi Report 2014
Dec 26, 2015
FDI Report for 2014
Welcome message from author
This document is posted to help you gain knowledge. Please leave a comment to let me know what you think about it! Share it to your friends and learn new things together.
Transcript
THE fDiREPORT 2014Global greenfield investment trends
The fDi RepoRT 20141
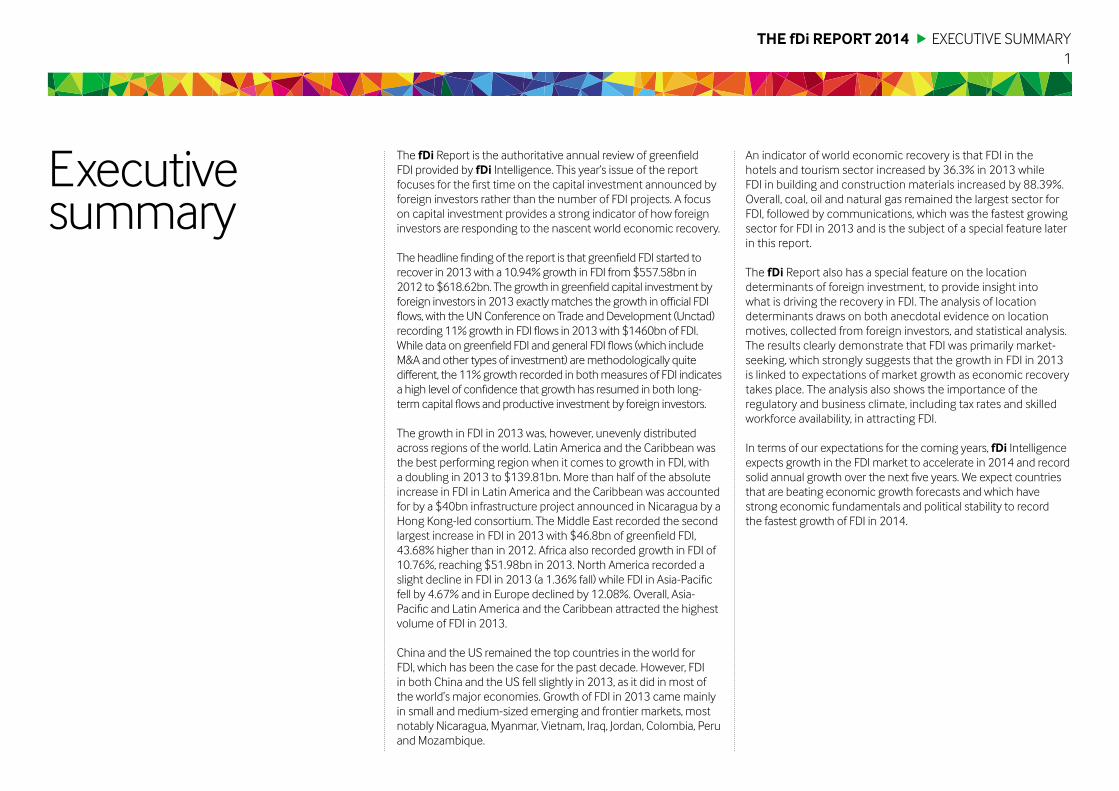
The fDi Report is the authoritative annual review of greenfieldFDI provided by fDi Intelligence. This year’s issue of the reportfocuses for the first time on the capital investment announced byforeign investors rather than the number of FDI projects. A focuson capital investment provides a strong indicator of how foreigninvestors are responding to the nascent world economic recovery.
The headline finding of the report is that greenfield FDI started torecover in 2013with a 10.94% growth in FDI from $557.58bn in2012 to $618.62bn. The growth in greenfield capital investment byforeign investors in 2013 exactlymatches the growth in official FDIflows, with the UNConference on Trade and Development (Unctad)recording 11% growth in FDI flows in 2013with $1460bn of FDI.While data on greenfield FDI and general FDI flows (which includeM&A and other types of investment) aremethodologically quitedifferent, the 11% growth recorded in bothmeasures of FDI indicatesa high level of confidence that growth has resumed in both long-term capital flows and productive investment by foreign investors.
The growth in FDI in 2013 was, however, unevenly distributedacross regions of the world. Latin America and the Caribbean wasthe best performing region when it comes to growth in FDI, witha doubling in 2013 to $139.81bn. More than half of the absoluteincrease in FDI in Latin America and the Caribbean was accountedfor by a $40bn infrastructure project announced in Nicaragua by aHong Kong-led consortium. The Middle East recorded the secondlargest increase in FDI in 2013 with $46.8bn of greenfield FDI,43.68% higher than in 2012. Africa also recorded growth in FDI of10.76%, reaching $51.98bn in 2013. North America recorded aslight decline in FDI in 2013 (a 1.36% fall) while FDI in Asia-Pacificfell by 4.67% and in Europe declined by 12.08%. Overall, Asia-Pacific and Latin America and the Caribbean attracted the highestvolume of FDI in 2013.
China and the US remained the top countries in the world forFDI, which has been the case for the past decade. However, FDIin both China and the US fell slightly in 2013, as it did in most ofthe world’s major economies. Growth of FDI in 2013 camemainlyin small and medium-sized emerging and frontier markets, mostnotably Nicaragua, Myanmar, Vietnam, Iraq, Jordan, Colombia, Peruand Mozambique.
An indicator of world economic recovery is that FDI in thehotels and tourism sector increased by 36.3% in 2013 whileFDI in building and construction materials increased by 88.39%.Overall, coal, oil and natural gas remained the largest sector forFDI, followed by communications, which was the fastest growingsector for FDI in 2013 and is the subject of a special feature laterin this report.
The fDi Report also has a special feature on the locationdeterminants of foreign investment, to provide insight intowhat is driving the recovery in FDI. The analysis of locationdeterminants draws on both anecdotal evidence on locationmotives, collected from foreign investors, and statistical analysis.The results clearly demonstrate that FDI was primarily market-seeking, which strongly suggests that the growth in FDI in 2013is linked to expectations of market growth as economic recoverytakes place. The analysis also shows the importance of theregulatory and business climate, including tax rates and skilledworkforce availability, in attracting FDI.
In terms of our expectations for the coming years, fDi Intelligenceexpects growth in the FDI market to accelerate in 2014 and recordsolid annual growth over the next five years. We expect countriesthat are beating economic growth forecasts and which havestrong economic fundamentals and political stability to recordthe fastest growth of FDI in 2014.
Executivesummary
ExECUTIVE SUMMARy

The fDi RepoRT 20142
In 2013, greenfield FDI showed signs of recovery, increasing byan estimated 10.94% from $557.58bn in 2012 to $618.62bn. Thenumber of FDI projects declined slightly in 2013, decreasing by6.36% to 11,691. Job creation also fell, by 3.84% to 1,532,602.China was the highest ranked country globally, with $64.14bn-worth of FDI announced in 2013.
Top destination regions for FDI
Asia-Pacific remained the leading destination for FDI in 2013,with projects recorded bringing capital investment to $184.67bn.
FDI into Europe declined in 2013, falling 12.08% to $137.26bnon the back of a 6% decline in project numbers to 4166. The UKremains the leading destination for FDI in Europe, with 796 projectsrecorded at a total value of $26.51bn, accounting for almost 20%of FDI in the region. Turkey continues to increase its market share,accounting for 6.69% of total FDI in Europe with $9.19bn-worth ofprojects announced in 2013. This increase has pushed Turkey upthe European rankings table to fourth from seventh in 2012.
Both the Middle East and Latin America and the Caribbeanrecorded strong growth in greenfield FDI in 2013. FDI into theMiddle East increased in 2013 by 43.68%, with major growth inIraq and Jordan. Nicaragua attracted the biggest project in theworld in 2013, a $40bn waterway, significantly contributing to
Global overview
gLOBAL OVERVIEW
Source: fDiMarkets*estimates**by capital investment
Global overview2013 FDI snapshot
$619bn*
Total capitalinvestment
11,691
Total projects
1,532,602*
Total jobscreated
Coal, oilandnatural
gas**
Top sector
Top destinationcountry
China**Topsource country
US**
Increase in capitalinvestment in globalgreenfield FDI in 201310.94%

3
FDI coming out of Africa more than doubled in 2013. The numberof outward projects from the region also increased, by 20.47% in2013 from 171 in 2012 to 206 in 2013. The number of outwardprojects from Africa is the highest recorded since fDiMarketsbegan recording in 2003.
Sector analysis
Coal, oil and natural gas; communications; business services;renewable energy; and real estate were the top five sectors bycapital investment in 2013, accounting for 47.26% of FDI globally.Of the top five sectors, real estate was the only one to record adecline, by 27.03% to $46.74bn.
FDI activity in construction picked up, with hotels and tourismincreasing by 36.3% to $18.98bn in 2013 and building andconstruction materials increasing by 88.39% to $9.69bn.
In 2013, fDiMarkets recorded 762 investments in thecommunications sector totalling $61.59bn. This representsan increase of 82.2% on 2012 and the highest ever capitalinvestment figure for the communications sector since fDiMarkets began measuring such statistics in 2003.
the doubling of FDI in the region to $139.81bn. Mexico also sawstrong growth in greenfield FDI, though Brazil’s figures were flat.
Project numbers and resulting capital investment in NorthAmerica declined 0.77% and 1.36%, respectively. Ontario wasthe top state in the region with $7.23bn invested in 2013.Quebec and North Carolina were the two fastest growingstates, with respective investments of $3.93bn and $1.88bn.
Africa performed well in 2013, attracting $51.98bn in inwardcapital investment, compared with $46.92bn in 2012. Thisincrease of 10.76% is a positive story for Africa, which appearsto be rebounding from a drop in inward FDI in 2012 from its$70.92bn level in 2011.
Top source regions for FDI
Western Europe was the top source region for FDI in 2013. Itaccounted for 34.94% of all announced outward FDI in the year andalso experienced a 10.38% increase on 2012. However, the numberof FDI projects from the region decreased in 2013, by 3.48% to5269. Total estimated FDI fromwestern Europe, excluding intra-western Europe FDI, increased 13% on 2012 to $176.4bn.
Asia-Pacific remains a strong source for outward FDI despite a1.9% decline in outward capital investment. In 2012, the regionaccounted for 32.5% of the global total of $557.58bn. However,in 2013 it accounted for 28.77% of the global total of $618.54bn,down 3.73% on the previous year.
Estimated capital investment from North America increased by9.57% in 2013 and the region maintained a global market shareof about 20%. However, the region experienced a 10.22% declineas a source region for FDI projects, with outward project numberscoming in at 2951 in 2013 compared with 3287 in 2012.
The fDi RepoRT 2014 gLOBAL OVERVIEW
Increase in capitalinvestment in Africangreenfield FDI in 201310.76%
about thedata
The report is based on the fDiMarkets database of The FinancialTimes Ltd, which tracks greenfield investment projects. It does notincludemergers and acquisitions or other equity-based or non-equity investments. Only new investment projects and significantexpansions of existing projects are included. fDiMarkets is themostauthoritative source of intelligence on real investment in the globaleconomy, and the only source of greenfield investment data thatcovers all countries and industries worldwide. Retail projects havebeen excluded from this analysis but are tracked by fDiMarkets.
The data presented includes FDI projects that have either beenannounced or opened by a company. The data on capitalinvestment and job creation is based on the investment thecompany is making at the time of the project announcementor opening. As companies can raise capital locally, phase theirinvestment over a period of time, and can channel their investmentthrough different countries for tax efficiency, the data used in thisreport is different to the official data on FDI flows. The data fromfDiMarkets is more accurate and a real-time indicator of the realinvestment companies aremaking in their overseas subsidiaries.
The data shown includes estimates for capital investment andjob creation derived from algorithms (patent pending) when acompany does not release the information.
Note that the investment projects tracked by fDiMarkets are beingconstantly updated and revised based on new intelligence beingreceived and the underlying algorithms are constantly improvingtheir accuracy over time. The data presented in this report maytherefore differ slightly from the real-time data available atwww.fdimarkets.com.
TheWorld Bank, Unctad, the Economist Intelligence Unit andmore than 100 governments around the world as well as majorcorporations use the data as the primary source of intelligenceon greenfield investment trends.

The fDi RepoRT 20144
ASIA-PACIFIC
FDI projects into Asia-Pacific
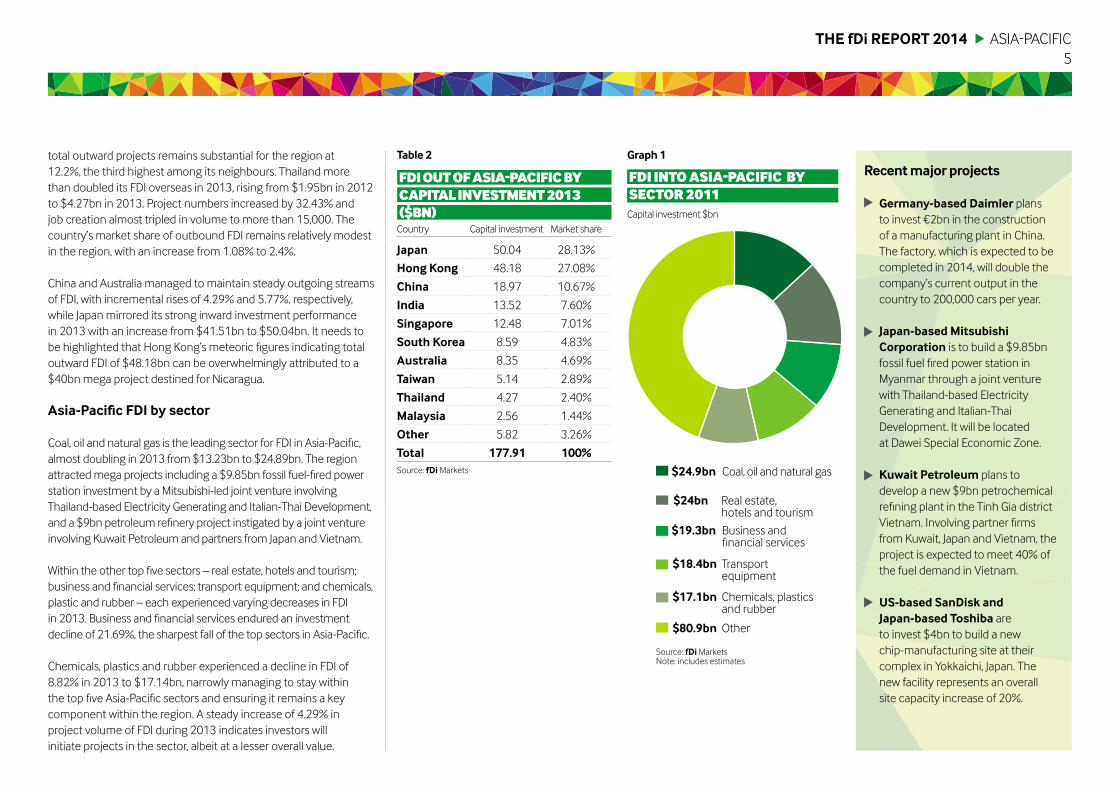
FDI into Asia-Pacific declined by 4.67% in 2013, with $184.67bnof announced investments recorded in the region. While Chinastill leads Asia-Pacific in 2013 with an estimated FDI total value of$64.14bn and a dominant 34.73%market share, announced FDIinto the country declined slightly, while several other countries inthe region recorded very strong growth. Vietnam almost tripledits FDI in 2013, from $5.34bn in 2012 to $15.31bn. As the countrycontinues its integration into the global economy, its open-market policies have become increasingly effective in attractinginternational investors. FDI in Myanmar grew from $1.54bn in2012 to $13.22bn in 2013, resulting in a 7.16%market share of allcapital investment into Asia-Pacific. Myanmar continues to benefitfrom political and economic reform in the wake of its democraticelections in 2010.
Capital investment into India almost halved throughout 2013. Incontrast, in 2013, Japan experienced an impressive rise in FDI from$3.84bn to $8.91bn, displaying a 4.83%market share of all FDI inthe region. Among the significant boosts to the Japanese capitalinvestment figures, US-based SanDisk and Japan’s Toshiba plan toinvest $4bn to build a new chip manufacturing site at their existingcomplex in the city of yokkaichi.
FDI projects out of Asia-Pacific
Many countries in Asia-Pacific experienced a decline in outwardFDI in 2013, with the region itself recording a 1.94% drop in FDI to$177.91bn. India, South Korea and Malaysia, which were amongthe strong performers previously, all recorded lower figures thanin 2012. While India suffered a drop in its market share of all FDIleaving Asia-Pacific from 12.93% to 7.6%, the country’s share of
Asia-Pacific FDI IntoAsIA-PAcIFIcbyMArketshAre2013
FDI IntoAsIA-PAcIFIcbycAPItAl InvestMent 2013($bn)
This map shows the percentagechange on 2012
Source: fDiMarkets
ChIna64.1bn
InDIa15.8bn
SInGapoRe7.5bn
MyanMaR13.2bn
VIeTnaM15.3bn
aUSTRalIa9.3bn
ThaIlanD5.1bn
honGkonG7.5bn
MalaySIa5.2bn
InDoneSIa9.6bn
japan8.9bn
Table 1
Country Market share
China 34.73%
India 8.57%
Vietnam 8.29%
Myanmar 7.16%
Indonesia 5.21%
australia 5.01%
japan 4.83%
Singapore 4.07%
Malaysia 2.80%
Thailand 2.78%
other 16.55%
Total 100%Source: fDiMarkets
$50bn-$60bn
$60bn-$70bn
$20bn-$30bn
$40bn-$50bn
$10bn-$20bn
$30bn-$40bn
$0bn-$10bn
The fDi RepoRT 20145
ASIA-PACIFIC
total outward projects remains substantial for the region at12.2%, the third highest among its neighbours. Thailand morethan doubled its FDI overseas in 2013, rising from $1.95bn in 2012to $4.27bn in 2013. Project numbers increased by 32.43% andjob creation almost tripled in volume to more than 15,000. Thecountry’s market share of outbound FDI remains relatively modestin the region, with an increase from 1.08% to 2.4%.
China and Australia managed to maintain steady outgoing streamsof FDI, with incremental rises of 4.29% and 5.77%, respectively,while Japan mirrored its strong inward investment performancein 2013 with an increase from $41.51bn to $50.04bn. It needs tobe highlighted that Hong Kong’s meteoric figures indicating totaloutward FDI of $48.18bn can be overwhelmingly attributed to a$40bn mega project destined for Nicaragua.
Asia-Pacific FDI by sector
Coal, oil and natural gas is the leading sector for FDI in Asia-Pacific,almost doubling in 2013 from $13.23bn to $24.89bn. The regionattractedmega projects including a $9.85bn fossil fuel-fired powerstation investment by a Mitsubishi-led joint venture involvingThailand-based Electricity generating and Italian-Thai Development,and a $9bn petroleum refinery project instigated by a joint ventureinvolving Kuwait Petroleum and partners from Japan and Vietnam.
Within the other top five sectors – real estate, hotels and tourism;business and financial services; transport equipment; and chemicals,plastic and rubber – each experienced varying decreases in FDIin 2013. Business and financial services endured an investmentdecline of 21.69%, the sharpest fall of the top sectors in Asia-Pacific.
Chemicals, plastics and rubber experienced a decline in FDI of8.82% in 2013 to $17.14bn, narrowly managing to stay withinthe top five Asia-Pacific sectors and ensuring it remains a keycomponent within the region. A steady increase of 4.29% inproject volume of FDI during 2013 indicates investors willinitiate projects in the sector, albeit at a lesser overall value.
Germany-based Daimler plansto invest €2bn in the constructionof a manufacturing plant in China.The factory, which is expected to becompleted in 2014, will double thecompany’s current output in thecountry to 200,000 cars per year.
japan-basedMitsubishiCorporation is to build a $9.85bnfossil fuel fired power station inMyanmar through a joint venturewith Thailand-based Electricitygenerating and Italian-ThaiDevelopment. It will be locatedat Dawei Special Economic Zone.
kuwait petroleum plans todevelop a new $9bn petrochemicalrefining plant in the Tinh gia districtVietnam. Involving partner firmsfrom Kuwait, Japan and Vietnam, theproject is expected to meet 40% ofthe fuel demand in Vietnam.
US-based SanDisk andjapan-based Toshiba areto invest $4bn to build a newchip-manufacturing site at theircomplex in yokkaichi, Japan. Thenew facility represents an overallsite capacity increase of 20%.
Recentmajor projects
Capital investment $bn
FDI IntoAsIA-PAcIFIc bysector2011
Source: fDiMarketsNote: includes estimates
Table 2 Graph1
$24.9bn Coal, oil and natural gas
$18.4bn Transportequipment
$24bn Real estate,hotels and tourism
$17.1bn Chemicals, plasticsand rubber
$19.3bn Business andfinancial services
$80.9bn Other
FDIoutoFAsIA-PAcIFIcbycAPItAlInvestMent2013($bn)Country Capital investment Market share
japan 50.04 28.13%
hong kong 48.18 27.08%
China 18.97 10.67%
India 13.52 7.60%
Singapore 12.48 7.01%
South korea 8.59 4.83%
australia 8.35 4.69%
Taiwan 5.14 2.89%
Thailand 4.27 2.40%
Malaysia 2.56 1.44%
other 5.82 3.26%
Total 177.91 100%Source: fDiMarkets
The fDi RepoRT 20146
FDI projects into europe
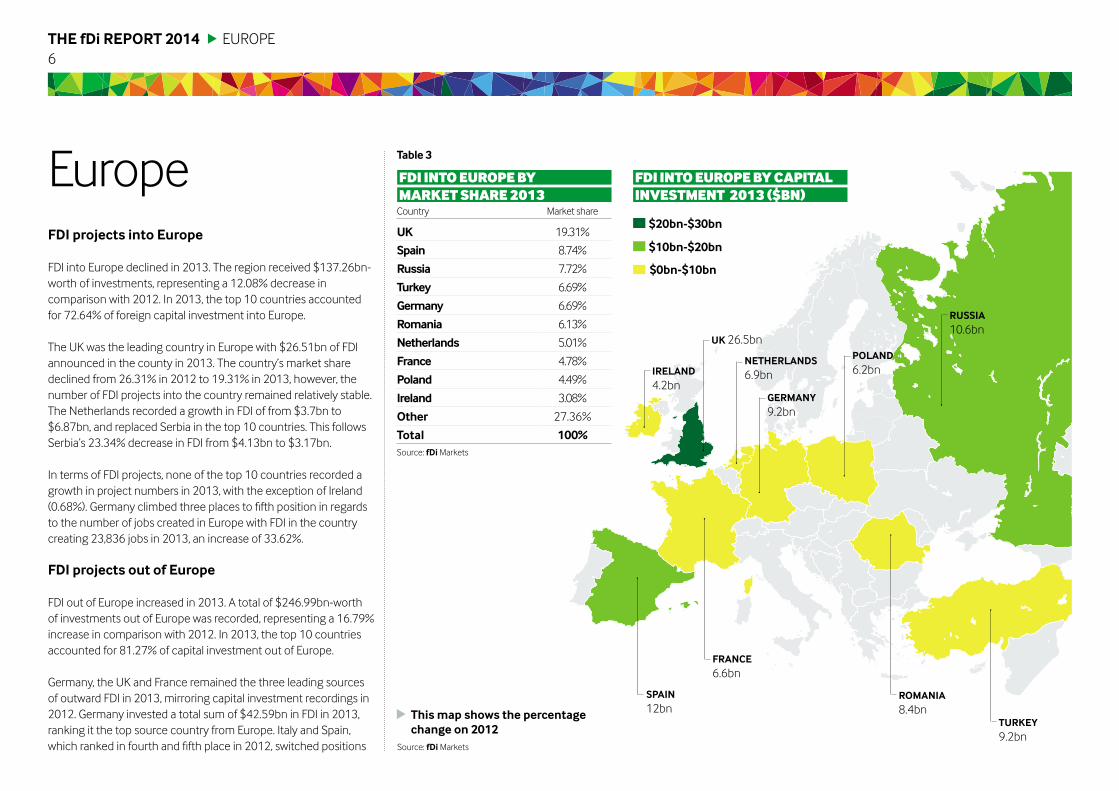
FDI into Europe declined in 2013. The region received $137.26bn-worth of investments, representing a 12.08% decrease incomparison with 2012. In 2013, the top 10 countries accountedfor 72.64% of foreign capital investment into Europe.
The UK was the leading country in Europe with $26.51bn of FDIannounced in the county in 2013. The country’s market sharedeclined from 26.31% in 2012 to 19.31% in 2013, however, thenumber of FDI projects into the country remained relatively stable.The Netherlands recorded a growth in FDI of from $3.7bn to$6.87bn, and replaced Serbia in the top 10 countries. This followsSerbia’s 23.34% decrease in FDI from $4.13bn to $3.17bn.
In terms of FDI projects, none of the top 10 countries recorded agrowth in project numbers in 2013, with the exception of Ireland(0.68%). germany climbed three places to fifth position in regardsto the number of jobs created in Europe with FDI in the countrycreating 23,836 jobs in 2013, an increase of 33.62%.
FDI projects out of europe
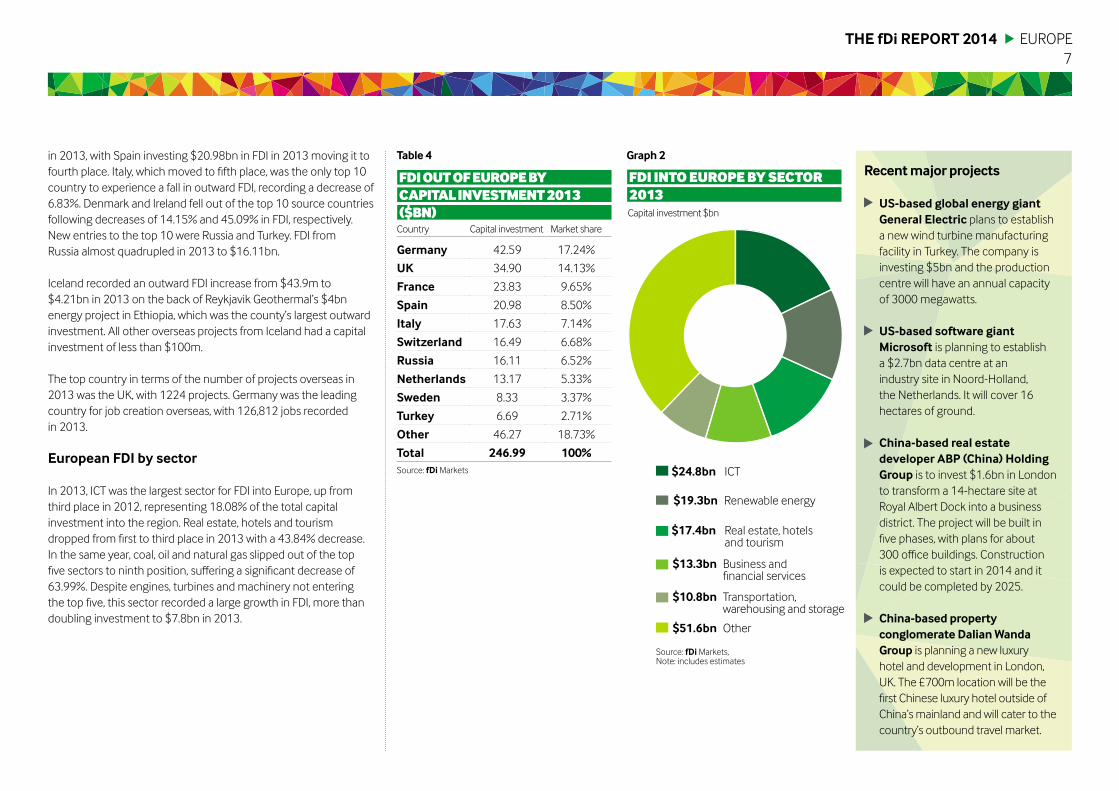
FDI out of Europe increased in 2013. A total of $246.99bn-worthof investments out of Europe was recorded, representing a 16.79%increase in comparison with 2012. In 2013, the top 10 countriesaccounted for 81.27% of capital investment out of Europe.
germany, the UK and France remained the three leading sourcesof outward FDI in 2013, mirroring capital investment recordings in2012. germany invested a total sum of $42.59bn in FDI in 2013,ranking it the top source country from Europe. Italy and Spain,which ranked in fourth and fifth place in 2012, switched positions
IRelanD4.2bn
SpaIn12bn
FRanCe6.6bn
RoManIa8.4bn
TURkey9.2bn
Uk 26.5bn
neTheRlanDS6.9bn
GeRMany9.2bn
polanD6.2bn
RUSSIa10.6bn
Europe
EUROPE
This map shows the percentagechange on 2012
Source: fDiMarkets
Table 3
FDI IntoeuroPebyMArketshAre2013Country Market share
Uk 19.31%
Spain 8.74%
Russia 7.72%
Turkey 6.69%
Germany 6.69%
Romania 6.13%
netherlands 5.01%
France 4.78%
poland 4.49%
Ireland 3.08%
other 27.36%
Total 100%Source: fDiMarkets
$10bn-$20bn
$20bn-$30bn
$0bn-$10bn
FDI IntoeuroPebycAPItAlInvestMent 2013 ($bn)
The fDi RepoRT 20147
in 2013, with Spain investing $20.98bn in FDI in 2013 moving it tofourth place. Italy, which moved to fifth place, was the only top 10country to experience a fall in outward FDI, recording a decrease of6.83%. Denmark and Ireland fell out of the top 10 source countriesfollowing decreases of 14.15% and 45.09% in FDI, respectively.New entries to the top 10 were Russia and Turkey. FDI fromRussia almost quadrupled in 2013 to $16.11bn.
Iceland recorded an outward FDI increase from $43.9m to$4.21bn in 2013 on the back of Reykjavik geothermal’s $4bnenergy project in Ethiopia, which was the county’s largest outwardinvestment. All other overseas projects from Iceland had a capitalinvestment of less than $100m.
The top country in terms of the number of projects overseas in2013 was the UK, with 1224 projects. germany was the leadingcountry for job creation overseas, with 126,812 jobs recordedin 2013.
european FDI by sector
In 2013, ICT was the largest sector for FDI into Europe, up fromthird place in 2012, representing 18.08% of the total capitalinvestment into the region. Real estate, hotels and tourismdropped from first to third place in 2013 with a 43.84% decrease.In the same year, coal, oil and natural gas slipped out of the topfive sectors to ninth position, suffering a significant decrease of63.99%. Despite engines, turbines and machinery not enteringthe top five, this sector recorded a large growth in FDI, more thandoubling investment to $7.8bn in 2013.
EUROPE
US-based global energy giantGeneral electric plans to establisha new wind turbine manufacturingfacility in Turkey. The company isinvesting $5bn and the productioncentre will have an annual capacityof 3000 megawatts.
US-based software giantMicrosoft is planning to establisha $2.7bn data centre at anindustry site in Noord-Holland,the Netherlands. It will cover 16hectares of ground.
China-based real estatedeveloper abp (China) holdingGroup is to invest $1.6bn in Londonto transform a 14-hectare site atRoyal Albert Dock into a businessdistrict. The project will be built infive phases, with plans for about300 office buildings. Constructionis expected to start in 2014 and itcould be completed by 2025.
China-based propertyconglomerate DalianwandaGroup is planning a new luxuryhotel and development in London,UK. The £700m location will be thefirst Chinese luxury hotel outside ofChina’s mainland and will cater to thecountry’s outbound travel market.
Recentmajor projects
Capital investment $bn
FDI IntoeuroPebysector2013
Graph2Table 4
Source: fDiMarkets,Note: includes estimates
$24.8bn ICT
$13.3bn Business andfinancial services
$19.3bn Renewable energy
$10.8bn Transportation,warehousing and storage
$17.4bn Real estate, hotelsand tourism
$51.6bn Other
FDIoutoFeuroPebycAPItAlInvestMent2013($bn)Country Capital investment Market share
Germany 42.59 17.24%
Uk 34.90 14.13%
France 23.83 9.65%
Spain 20.98 8.50%
Italy 17.63 7.14%
Switzerland 16.49 6.68%
Russia 16.11 6.52%
netherlands 13.17 5.33%
Sweden 8.33 3.37%
Turkey 6.69 2.71%
other 46.27 18.73%
Total 246.99 100%Source: fDiMarkets
The fDi RepoRT 20148
north america
FDI projects into North America
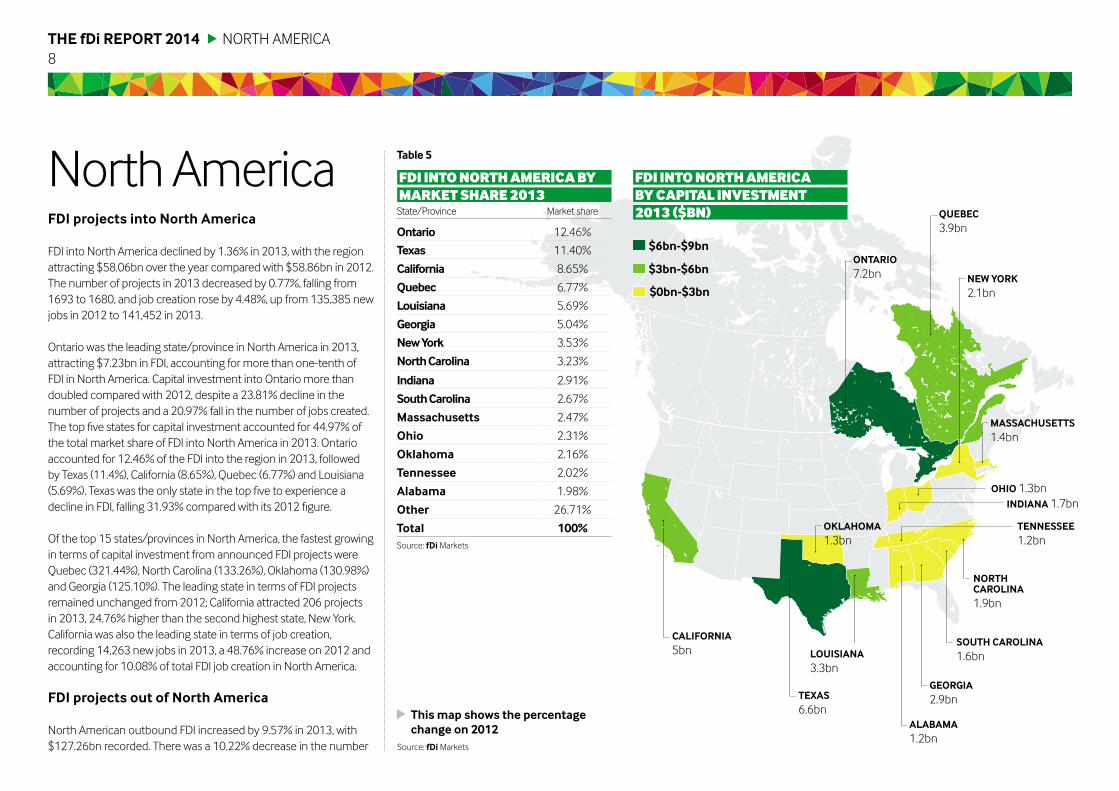
FDi into north america declined by 1.36% in 2013, with the regionattracting $58.06bn over the year compared with $58.86bn in 2012.the number of projects in 2013 decreased by 0.77%, falling from1693 to 1680, and job creation rose by 4.48%, up from 135,385 newjobs in 2012 to 141,452 in 2013.
ontario was the leading state/province in north america in 2013,attracting $7.23bn in FDi, accounting for more than one-tenth ofFDi in north america. capital investment into ontario more thandoubled compared with 2012, despite a 23.81% decline in thenumber of projects and a 20.97% fall in the number of jobs created.The top five states for capital investment accounted for 44.97% ofthe total market share of FDi into north america in 2013. ontarioaccounted for 12.46% of the FDi into the region in 2013, followedby texas (11.4%), california (8.65%), Quebec (6.77%) and Louisiana(5.69%). Texas was the only state in the top five to experience adecline in FDI, falling 31.93% compared with its 2012 figure.
of the top 15 states/provinces in north america, the fastest growingin terms of capital investment from announced FDi projects wereQuebec (321.44%), north carolina (133.26%), oklahoma (130.98%)and Georgia (125.10%). the leading state in terms of FDi projectsremained unchanged from 2012; california attracted 206 projectsin 2013, 24.76% higher than the second highest state, new York.california was also the leading state in terms of job creation,recording 14,263 new jobs in 2013, a 48.76% increase on 2012 andaccounting for 10.08% of total FDi job creation in north america.
FDI projects out of North America
north american outbound FDi increased by 9.57% in 2013, with$127.26bn recorded. there was a 10.22% decrease in the number
north america
This map shows the percentagechange on 2012
Source: fDimarkets
CAlIFoRNIA5bn
New YoRk2.1bn
oNTARIo7.2bn
TexAs6.6bn
louIsIANA3.3bn
NoRThCARolINA1.9bn
TeNNessee1.2bn
GeoRGIA2.9bn
AlAbAmA1.2bn
oklAhomA1.3bn
ohIo 1.3bnINDIANA 1.7bn
souTh CARolINA1.6bn
+53%
QuebeC3.9bn
mAssAChuseTTs1.4bn
Table 5
FDI IntonorthamerIcabymarketshare2013State/Province market share
ontario 12.46%
Texas 11.40%
California 8.65%
Quebec 6.77%
louisiana 5.69%
Georgia 5.04%
NewYork 3.53%
NorthCarolina 3.23%
Indiana 2.91%
southCarolina 2.67%
massachusetts 2.47%
ohio 2.31%
oklahoma 2.16%
Tennessee 2.02%
Alabama 1.98%
other 26.71%
Total 100%Source: fDimarkets
FDI IntonorthamerIcabycapItal Investment2013 ($bn)
$3bn-$6bn
$6bn-$9bn
$0bn-$3bn
THE fDi REPORT 20149
NORTH AMERICA
of projects, and an increase of 8.38% in the number of jobs created.
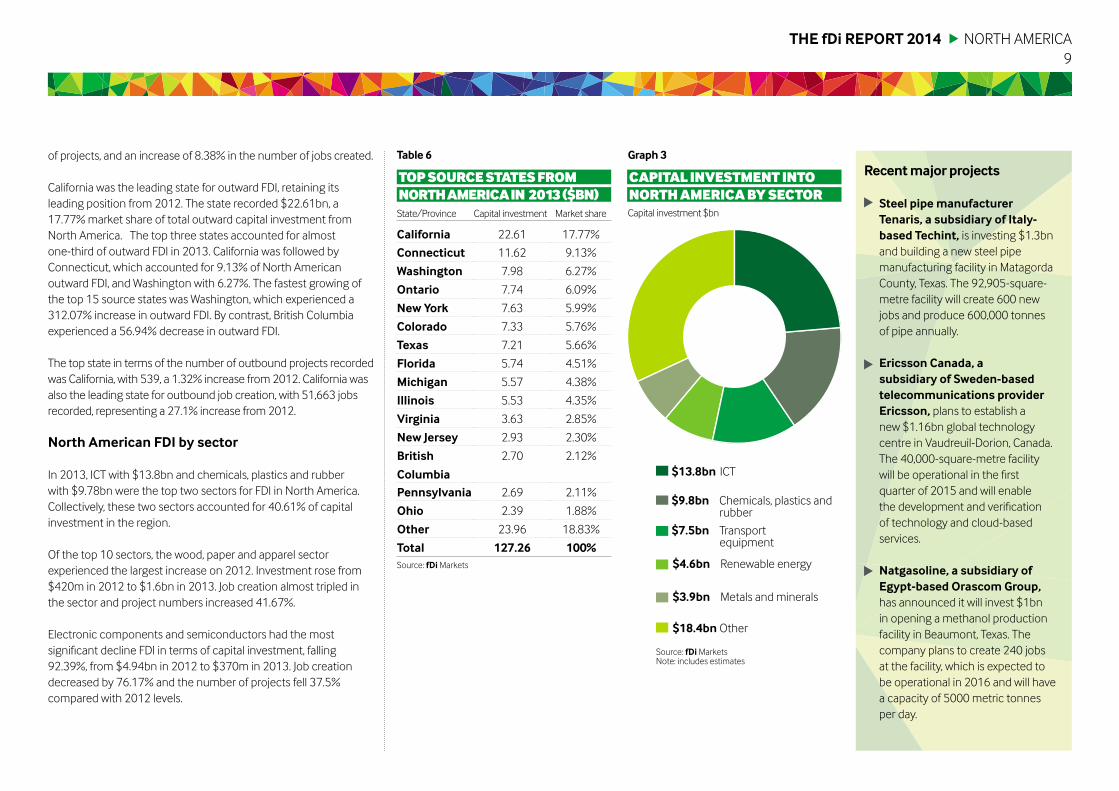
California was the leading state for outward FDI, retaining itsleading position from 2012. The state recorded $22.61bn, a17.77%market share of total outward capital investment fromNorth America. The top three states accounted for almostone-third of outward FDI in 2013. California was followed byConnecticut, which accounted for 9.13% of North Americanoutward FDI, and Washington with 6.27%. The fastest growing ofthe top 15 source states was Washington, which experienced a312.07% increase in outward FDI. By contrast, British Columbiaexperienced a 56.94% decrease in outward FDI.
The top state in terms of the number of outbound projects recordedwas California, with 539, a 1.32% increase from 2012. California wasalso the leading state for outbound job creation, with 51,663 jobsrecorded, representing a 27.1% increase from 2012.
North American FDI by sector
In 2013, ICT with $13.8bn and chemicals, plastics and rubberwith $9.78bn were the top two sectors for FDI in North America.Collectively, these two sectors accounted for 40.61% of capitalinvestment in the region.
Of the top 10 sectors, the wood, paper and apparel sectorexperienced the largest increase on 2012. Investment rose from$420m in 2012 to $1.6bn in 2013. Job creation almost tripled inthe sector and project numbers increased 41.67%.
Electronic components and semiconductors had the mostsignificant decline FDI in terms of capital investment, falling92.39%, from $4.94bn in 2012 to $370m in 2013. Job creationdecreased by 76.17% and the number of projects fell 37.5%compared with 2012 levels.
Capital investment $bn
CAPITAL INVESTMENT INTONORTHAMERICABYSECTOR
TOPSOURCESTATESFROMNORTHAMERICAIN 2013($BN)
Table 6 Graph3
Source: fDiMarketsNote: includes estimates
$13.8bn ICT
$4.6bn Renewable energy
$9.8bn Chemicals, plastics andrubber
$3.9bn Metals and minerals
$7.5bn Transportequipment
$18.4bn Other
Steel pipemanufacturerTenaris, a subsidiary of Italy-based Techint, is investing $1.3bnand building a new steel pipemanufacturing facility in MatagordaCounty, Texas. The 92,905-square-metre facility will create 600 newjobs and produce 600,000 tonnesof pipe annually.
Ericsson Canada, asubsidiary of Sweden-basedtelecommunications providerEricsson, plans to establish anew $1.16bn global technologycentre in Vaudreuil-Dorion, Canada.The 40,000-square-metre facilitywill be operational in the firstquarter of 2015 and will enablethe development and verificationof technology and cloud-basedservices.
Natgasoline, a subsidiary ofEgypt-based Orascom Group,has announced it will invest $1bnin opening a methanol productionfacility in Beaumont, Texas. Thecompany plans to create 240 jobsat the facility, which is expected tobe operational in 2016 and will havea capacity of 5000 metric tonnesper day.
Recentmajor projects
State/Province Capital investment Market share
California 22.61 17.77%
Connecticut 11.62 9.13%
Washington 7.98 6.27%
Ontario 7.74 6.09%
New York 7.63 5.99%
Colorado 7.33 5.76%
Texas 7.21 5.66%
Florida 5.74 4.51%
Michigan 5.57 4.38%
Illinois 5.53 4.35%
Virginia 3.63 2.85%
New Jersey 2.93 2.30%
British
Columbia
2.70 2.12%
Pennsylvania 2.69 2.11%
Ohio 2.39 1.88%
Other 23.96 18.83%
Total 127.26 100%Source: fDiMarkets

The fDi RepoRT 201410
LATIN AMERICA AND THE CARIBBEAN
FDI projects into latin america and the Caribbean
In 2013, FDI into Latin America and Caribbean more than doubledfrom $69.37bn in 2012 to $139.81bn. Project numbers increased10.18% from 1198 to 1320, and the region also experienced a20.54% increase in jobs created.
With an estimated $40.51bn of FDI announced in the country,Nicaragua was the leading location in 2013 in Latin Americaand the Caribbean, replacing Brazil, due to the $40bn waterwaybeing constructed by Hong Kong Nicaragua Canal DevelopmentInvestment as an alternative to the Panama Canal. FDI into Brazildeclined by 3.31% in 2013 to $27.32bn, following a decline in thenumber of FDI projects. Brazil was the only country in the top 10to witness a decline in project numbers, dropping to 327 recordedprojects in 2013. FDI into Mexico increased 48.5% to $22.47bnin 2013. The top three countries for capital investment in LatinAmerica – Nicaragua, Brazil and Mexico – collectively account foralmost 65% of FDI into the region in 2013.
Colombia increased its FDI five-fold to $10.58bn in 2013 with thenumber of FDI projects increasing 12.38% to 118. In comparison,FDI into Chile and Argentina fell by 1.84% and 29.64%, respectively,to $9.7bn and $4.16bn. Of the top 10 countries, in terms of capitalinvestment, six increased their markets share of FDI in the regionin 2013, with Nicaragua accounting for 28.97% of FDI into LatinAmerica and the Caribbean, followed by Colombia (7.57%), Peru(4.34%), Dominican Republic (1.85%), Puerto Rico (1.74%) andVenezuela (1.35%).
LatinAmericaandtheCaribbean
This map shows the percentagechange on 2012
Source: fDiMarkets
bRaZIl27.3bnMexICo
22.5bn
aRGenTIna4.2bn
ColoMbIa10.6bn
ChIle9.7bn
peRU6.1bn
nICaRaGUa40.5bn
pUeRTo RICo2.4bn
DoMInICan RepUblIC2.6bn
VeneZUela1.9bn
Table 7
FDI IntolAtInAMerIcAAnDthecArIbbeAnbyMArketshAre2013Country Market share
nicaragua 28.97%
brazil 19.54%
Mexico 16.07%
Colombia 7.57%
Chile 6.94%
peru 4.34%
argentina 2.98%
DominicanRepublic 1.85%
puertoRico 1.74%
Venezuela 1.35%
other 8.65%
Total 100%Source: fDiMarkets $30bn-$40bn
$40bn-$50bn
$20bn-$30bn
FDI IntolAtInAMerIcAAnDthecArIbbeAnbycAPItAlInvestMent 2013($bn)
$10bn-$20bn
$0bn-$10bn

11The fDi RepoRT 2014 LATIN AMERICA AND THE CARIBBEAN
Capital investment $bn
FDIIntolAtInAMerIcAAnDcArIbbeAn bysector2013
FDI projects out of latin america and the Caribbean
Outbound FDI from Latin American companies in 2013 almostdoubled from $9.05bn in 2012 to $17.53bn. In comparisonwith 2012, the number of projects recorded also increased, by16.92% to 228, with job creation continuing the trend increasing35.88% to 40,842. Brazil remained the top country for outwardFDI, investing a total of $6.38bn outside its borders in 2013,accounting for more than one-third of capital investmentfrom the region.
The top three source countries, Brazil, Mexico and Bermuda, allmore than doubled their outbound capital investment in 2013,accounting for more than 70% of FDI from the region. Within thetop 10, Argentina and guatemala were the only two countries towitness a decline in FDI overseas, investing $1.37bn and $190m,a decline of 1.53% and 2.03%, respectively.
FDI from Chile and Colombia almost doubled in 2013 to $1.09bneach.
latin america and the Caribbean FDI by sector
The top three sectors in Latin America and the Caribbean in 2013were business and financial services with FDI worth $48.19bn, ICTwith $17.04bn and renewable energy with $13.28bn. Together,these three sectors accounted for 56% of FDI in Latin Americaand the Caribbean.
Of the top five sectors, transport equipment was the only sectorto witness a decline in 2013, with FDI figures falling 4.19% from$12.23bn to $11.72bn. This was despite an increase in projectnumbers by 7.03%. Business and financial services and coal, oiland natural gas were the fastest growing sectors.
Graph4Table 8
Source: fDiMarketsNote: includes estimates
$48.2bn Business and financialservices
$11.7bn Transportequipment
$17bn ICT
$11.5bn Coal, oil andnatural gas
$13.3bn Renewable energy
$38.1bn Other
hong kong-based hong kongnicaragua Canal DevelopmentInvestment will invest $40bnto build the Inter-OceanicNicaragua Canal, a waterwaythrough Nicaragua to connectthe Caribbean Sea and AtlanticOcean with the Pacific Ocean. Thewaterway will be a higher capacityalternative to the Panama Canal.The project is expected to befinished by 2024.
acerias paz del Rio, a miningcompany and subsidiary of Brazil-based conglomerate HejoassuAdministracao, plans to operatea newmetallurgical coal mine inthe central area of Colombia. Theproject is estimated to cost $4bnand aims to produce 3 milliontonnes of coal per year.
Minera escondida, a subsidiaryof australia-basedminingmajor bhp billiton, is to invest$1.97bn to establish a seconddesalination plant at its Escondidacopper mine in the Atacama Desertin the Antofagasta region of Chile.This move is to meet growingdemand of water from the site. Thenew facility will be commissionedin 2017.
Recentmajor projectsFDIoutoFlAtInAMerIcAAnDthecArIbbeAnbycAPItAlInvestMent2013($bn)Country Capital investment Market share
brazil 6.38 36.41%
Mexico 4.29 24.47%
bermuda 1.94 11.08%
argentina 1.37 7.84%
Chile 1.09 6.21%
Colombia 1.09 6.19%
jamaica 0.44 2.54%
honduras 0.37 2.10%
Guatemala 0.19 1.10%
bahamas 0.10 0.55%
other 0.26 1.51%
Total 17.53 100%Source: fDiMarkets

The fDi RepoRT 201412
MIDDLE EAST AND AFRICA
FDI projects intoMiddle east and africa
FDI into theMiddle East and Africa (MEA) increased in 2013 by24.27%. Despite this increase, the number of projects in the regiondecreased by 8.59% and job creation declined by 12.98%.
Iraq has attracted the greatest increase in FDI, rising from $960m in2012 to $14.96bn in 2013. In 2012 the country’s market share ofinward FDI was 1.21%; this increased to 15.14% in 2013, making itthe leading location for FDI into theMEA region. UAE-based EmaarProperties’ plans to establish a $3bn tourist project in the countrycontributed to this rise. Jordan also experienced a significant rise inFDI in 2013, primarily due to a $10bn nuclear power plant project. FDIentering Jordan increased from $1.26bn to $10.9bn in 2013. Jordan’smarket share of capital investment into the region also increased in2013, reaching 11.03% from its 2012 total of 1.58%, despite seeing a35.29% decrease in project numbers.
Due to widespread political and economic instability in Egypt, thecountry saw a substantial decline of inward FDI during 2013, fallingfrom $9.66bn in 2012 to $2.93bn in 2013, a decrease of 69.65%.This decline had a resulting impact on the number of new jobscreated, which decreased 65.45%.
FDI projects out ofMiddle east and africa
An increase in outward FDI from the MEA region was observedduring 2013. Recorded FDI grew 21.81% compared with 2012 toa total of $48.02bn. However, project numbers and job creationdeclined by 11.54% and 26.41%, respectively.
Middle EastandAfrica
This map shows the percentagechange on 2012
Source: fDiMarkets
Uae6.2bn
SoUThaFRICa5.4bn
SaUDI aRabIa6.2bn
alGeRIa4.3bn
kenya3.6bn
eThIopIa4.5bn
MoZaMbIQUe6bn
nIGeRIa5.8bn
IRaQ15bn
joRDan10.9bn
Table 9
FDI IntoMIDDleeAstAnDAFrIcAbyMArketshAre2013Country Market share
Iraq 15.14%
jordan 11.03%
Saudi arabia 6.31%
Uae 6.31%
Mozambique 6.09%
nigeria 5.83%
South africa 5.52%
ethiopia 4.56%
algeria 4.32%
kenya 3.61%
other 31.28%
Total 100%Source: fDiMarkets
FDI IntoMIDDleeAstAnDAFrIcAbycAPItAlInvestMent 2013 ($bn)
$5bn-$10bn
$10bn-$20bn
$0bn-$5bn

13
Capital investment $bn
FDI IntoMIDDleeAstAnDAFrIcA bysector2013
The UAE remained the leading country in theMEA region foroutward FDI, despite experiencing a slight decline of 1.05%whencompared with 2012. During 2013, the UAEwas responsible for$14.68bn of outward capital investment, accounting for 30.56% of alloutward investment from the region. Kuwait recorded a substantialincrease in its outward investment, recording $10.73bn of outwardFDI in 2013 compared with the $1.1bn recorded during 2012.
Four of the top five leading source countries for FDI during 2013experienced a shift when compared to 2012. While the UAE’sposition was unchanged, South Africa rose to third place from fifthand Israel fell two places. Qatar and Egypt both fell from the top five.
Middle east and african FDI by sector
In 2013, coal, oil and natural gas was the leading sector for FDIin the MEA region, attracting $29.14bn, a 52.01% increase whencompared with 2012. The sector also recorded a 60.61% increasein the number of projects recorded and 9165 new jobs createdcompared with the 3885 jobs created in 2012.
Thewood, paper and apparel sector witnessed the largestpercentage increase, rising from a low of $200m in 2012 to $3.8bnin 2013. This sector experienced a successful 2013, also creatingmore than 12,000 new jobs when compared with the 2235 recordedin 2012. The real estate, hotels and tourism; ICT; renewable energy;business and financial services; buildingmaterials, ceramics and glass;and transportation, warehousing and storage sectors all finished2013with an increase in FDI compared with that recorded in 2012.
The leisure and entertainment sector recorded the largest decreasein capital investment, with the $1.68bn recorded in 2012 falling to$330m in 2013. Jobs created in this sector also fell, by 81.05%. Themetals andminerals sector saw the greatest percentage decreasein recorded projects, from 59 in 2012 to 31 in 2013.
Graph5Table 10
Source: fDiMarketsNote: includes estimates
$29.1bn Coal, oil and natural gas
$7.9bn Renewable energy
$14.9bn Real estate, hotelsand tourism
$6.3bn Business andfinancial services
$13.5bn ICT
$27.1bn Other
Rusatomoverseas, a subsidiaryof Russia-based nuclear powercorporation Rosatom, has beencommissioned to construct the firstnuclear power plant in Jordan. Thenew $10bn facility, to be located inthe Amra region, will supply 12% ofthe country’s energy supply needsby 2020. The plant will consist oftwo 1000-megawatt reactors.
Renault-nissan, the automotivealliance between France-basedRenault and japan-basednissan,is to invest $542m to build a secondproduction line at its facility inTangier, Morocco. Scheduled tobe operational in 2014, 1400 newjobs will be created. The expansionis the result of a public-privatepartnership betweenMoroccoand the Renault group.
Iceland-basedReykjavikGeothermal, a geothermaldevelopment firm, plans to establisha new power plant in Ethiopia. To belocated in Corbetti Caldera, the $4bnplant is expected to have a capacityof 1000megawatts. ReykjavikGeothermal will build and operatethe plant, supplying power to theEthiopian Electric Power Corporationunder a 25-year contract.
Recentmajor projects
The fDi RepoRT 2014 MIDDLE EAST AND AFRICA
FDIoutoFMIDDleeAstAnDAFrIcAbycAPItAlInvestMent2013($bn)Country Capital investment Market share
Uae 14.68 30.56%
kuwait 10.73 22.35%
South africa 5.45 11.36%
Mauritius 3.25 6.77%
Israel 3.12 6.49%
nigeria 3.06 6.37%
Saudi arabia 1.50 3.13%
Qatar 1.46 3.04%
egypt 1.12 2.33%
bahrain 0.56 1.17%
other 3.09 6.43%
Total 48.02 100%Source: fDiMarkets
The fDi RepoRT 201414
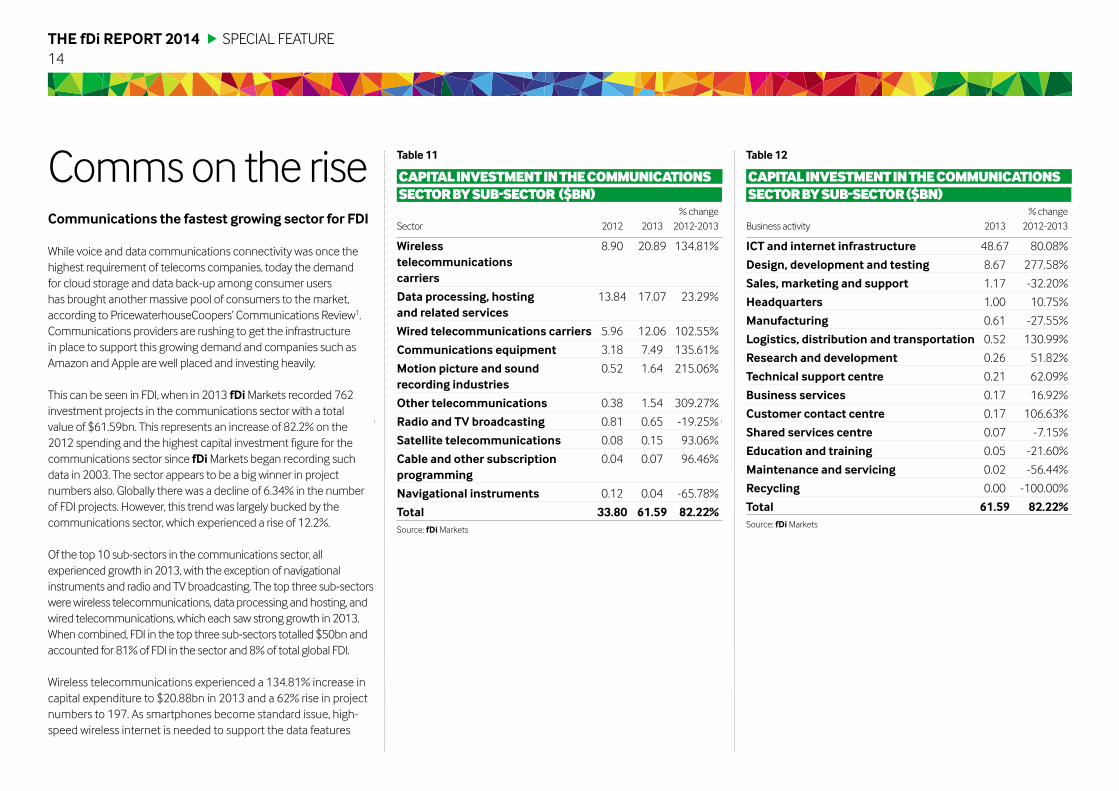
Communications the fastest growing sector for FDI
While voice and data communications connectivity was once thehighest requirement of telecoms companies, today the demandfor cloud storage and data back-up among consumer usershas brought another massive pool of consumers to themarket,according to PricewaterhouseCoopers’ Communications Review1.Communications providers are rushing to get the infrastructurein place to support this growing demand and companies such asAmazon and Apple are well placed and investing heavily.
This can be seen in FDI, when in 2013 fDiMarkets recorded 762investment projects in the communications sector with a totalvalue of $61.59bn. This represents an increase of 82.2% on the2012 spending and the highest capital investment figure for thecommunications sector since fDiMarkets began recording suchdata in 2003. The sector appears to be a big winner in projectnumbers also. Globally there was a decline of 6.34% in the numberof FDI projects. However, this trend was largely bucked by thecommunications sector, which experienced a rise of 12.2%.
Of the top 10 sub-sectors in the communications sector, allexperienced growth in 2013, with the exception of navigationalinstruments and radio and TV broadcasting. The top three sub-sectorswerewireless telecommunications, data processing and hosting, andwired telecommunications, which each saw strong growth in 2013.When combined, FDI in the top three sub-sectors totalled $50bn andaccounted for 81%of FDI in the sector and 8%of total global FDI.
Wireless telecommunications experienced a 134.81% increase incapital expenditure to $20.88bn in 2013 and a 62% rise in projectnumbers to 197. As smartphones become standard issue, high-speed wireless internet is needed to support the data features
Commson the rise
SPECIAL FEATURE
%changeBusiness activity 2013 2012-2013
%changeSector 2012 2013 2012-2013
ICT and internet infrastructure 48.67 80.08%
Design, development and testing 8.67 277.58%
Sales, marketing and support 1.17 -32.20%
headquarters 1.00 10.75%
Manufacturing 0.61 -27.55%
logistics, distribution and transportation 0.52 130.99%
Research and development 0.26 51.82%
Technical support centre 0.21 62.09%
business services 0.17 16.92%
Customer contact centre 0.17 106.63%
Shared services centre 0.07 -7.15%
education and training 0.05 -21.60%
Maintenance and servicing 0.02 -56.44%
Recycling 0.00 -100.00%
Total 61.59 82.22%
wireless 8.90 20.89 134.81%telecommunicationscarriers
Data processing, hosting 13.84 17.07 23.29%and related services
wired telecommunications carriers 5.96 12.06 102.55%
Communications equipment 3.18 7.49 135.61%
Motion picture and sound 0.52 1.64 215.06%recording industries
other telecommunications 0.38 1.54 309.27%
Radio and TV broadcasting 0.81 0.65 -19.25%
Satellite telecommunications 0.08 0.15 93.06%
Cable and other subscription 0.04 0.07 96.46%programming
navigational instruments 0.12 0.04 -65.78%
Total 33.80 61.59 82.22%
cAPItAlInvestMentInthecoMMunIcAtIonssectorbysub-sector($bn)
cAPItAlInvestMentInthecoMMunIcAtIonssectorbysub-sector ($bn)
Source: fDiMarketsSource: fDiMarkets
Table 12Table 11

15
of these and other portable devices currently in the market andtelecommunications firms such as Telefonica are investing heavilyin both 3G and 4G connectivity globally2.
The functions of these projects are heavily grouped around theICT and internet infrastructure business activity, as well as design,development and testing. This essentially shows that the currentfocus for communications companies is development anddeployment. The ICT and internet infrastructure activity attracted$48.67bn of the $61.59bn invested in the sector, which appears torespond to the growth of sub-sectors that all require high levels ofinfrastructure deployment. The capital spent on ICT and internetinfrastructure in 2013was the highest recorded since fDiMarketsbegan tracking andwas supported by a 66.5% rise in projectnumbers to 328.
Interestingly, the capital investment into innovation-focusedactivities (design, development and testing and also research anddevelopment) increased to its highest level on record to $8.93bn,which is a 261.97% rise on its 2012 level and a 44.22% rise onits 2003 level. This trend looks likely to continue, with a PwC CEOsurvey finding that 41% of CEOs in the communications sectorcited product development and innovations as their main driverof business growth by 20173.
Major projects in the sector have occurred in a number ofsub-sectors, primarily communications equipment and dataprocessing, hosting and related services. Canada attracted thelargest two projects, with more than $5bn in telecoms R&D-related investment announced in 2013.
1. PricewaterhouseCoopers, October 2013, Communication Review; Finding Opportunitiesin the Cloud. Available from: http://www.pwc.com/gx/en/communications/publications/communications-review/assets/pwc-communications-review-18-2.pdf2. PricewaterhouseCoopers, March 2014, Communication Review; New Metrics for a ChangingIndustry. Available from: http://www.pwc.com/gx/en/communications/publications/communications-review/assets/communications-review-march-2014.pdf3. PricewaterhouseCoopers, February 2014, Fit for the Future; 17th Annual global CEO Survey:Key Findings in the Communications Industry. Available from: http://www.pwc.com/gx/en/ceo-survey/2014/assets/pwc-17th-annual-global-ceo-survey-telecom-and-communications-key-findings.pdf
The fDi RepoRT 2014 SPECIAL FEATURE
Project date Investing company Parent company Source Destination Sub-sector Industry activity Capexcountry country ($bn)
Dec 2013 Cisco Systems Cisco Systems US Canada Communications Design, 4.00equipment development
and testingJun 2013 ericsson Ericsson Sweden Canada Communications Design, 1.16
Canada equipment developmentand testing
Mar 2013 pinewood- Pinewood- UK US Motion picture and Design, 1.00Shepperton Shepperton sound recording developmentStudios Studios industries and testing
Sep 2013 Microsoft Microsoft US Ireland Data processing, ICT and internet 0.51hosting and related infrastructureservices
Apr 2013 etisalat nigeria Emirates UAE Nigeria Wireless ICT and internet 0.50Telecommunications telecommunication infrastructure(Etisalat) carriers
Sep 2013 Microsoft Microsoft US Finland Data processing, ICT and internet 0.25hosting and related infrastructureservices
Oct 2013 huawei Huawei China UK Communications Design, 0.20Technologies Technologies equipment development
and testingOct 2013 DirecTV Liberty Media US Colombia Radio and TV Design, 0.10
broadcasting developmentand testing
Nov 2013 equinix Equinix US UK Data processing, ICT and internet 0.08hosting and related infrastructureservices
Feb 2013 MTnUganda MTN group South Uganda Wireless ICT and internet 0.07Africa telecommunication Infrastructure
carriers
MAjorProjectsInthecoMMunIcAtIonssectorIn2013bycAPItAl InvestMent($bn)
Source: fDiMarkets
Table 13
The fDi RepoRT 201416
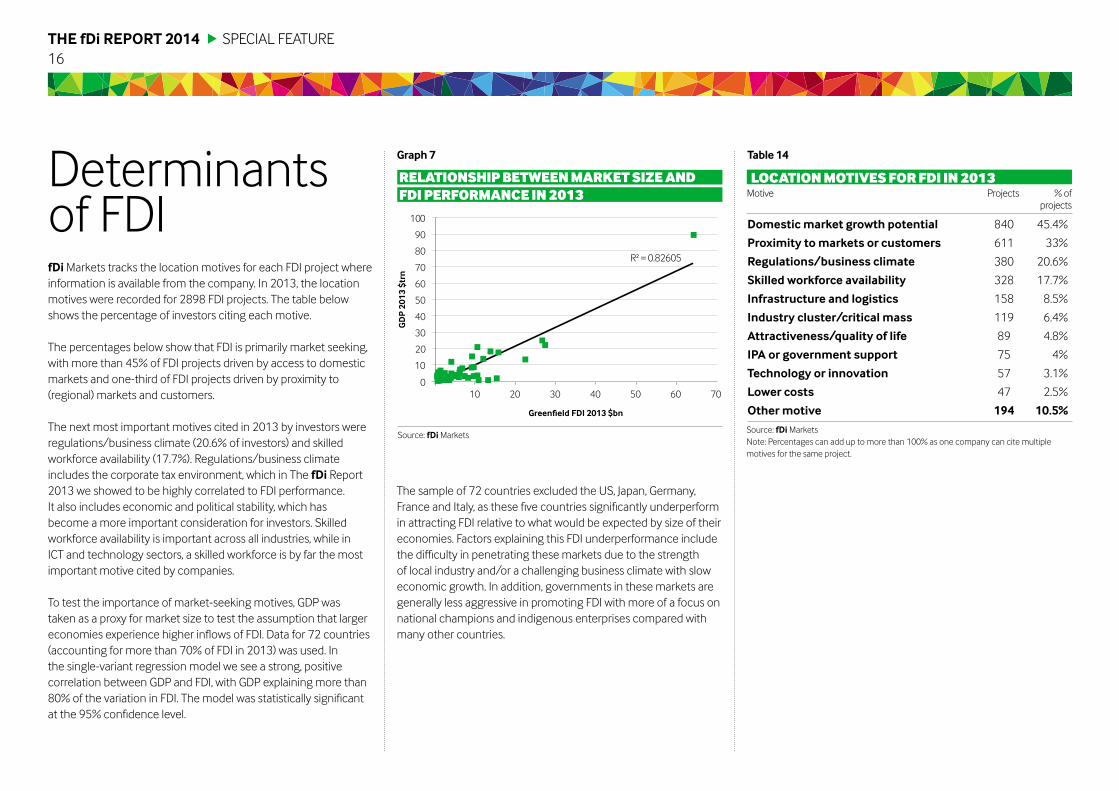
Domestic market growth potential 840 45.4%
proximity tomarkets or customers 611 33%
Regulations/business climate 380 20.6%
Skilled workforce availability 328 17.7%
Infrastructure and logistics 158 8.5%
Industry cluster/critical mass 119 6.4%
attractiveness/quality of life 89 4.8%
Ipa or government support 75 4%
Technology or innovation 57 3.1%
lower costs 47 2.5%
othermotive 194 10.5%
fDiMarkets tracks the location motives for each FDI project whereinformation is available from the company. In 2013, the locationmotives were recorded for 2898 FDI projects. The table belowshows the percentage of investors citing each motive.
The percentages below show that FDI is primarily market seeking,with more than 45% of FDI projects driven by access to domesticmarkets and one-third of FDI projects driven by proximity to(regional) markets and customers.
The next most important motives cited in 2013 by investors wereregulations/business climate (20.6% of investors) and skilledworkforce availability (17.7%). Regulations/business climateincludes the corporate tax environment, which in The fDi Report2013 we showed to be highly correlated to FDI performance.It also includes economic and political stability, which hasbecome a more important consideration for investors. Skilledworkforce availability is important across all industries, while inICT and technology sectors, a skilled workforce is by far the mostimportant motive cited by companies.
To test the importance of market-seeking motives, gDP wastaken as a proxy for market size to test the assumption that largereconomies experience higher inflows of FDI. Data for 72 countries(accounting for more than 70% of FDI in 2013) was used. Inthe single-variant regression model we see a strong, positivecorrelation between gDP and FDI, with gDP explaining more than80% of the variation in FDI. The model was statistically significantat the 95% confidence level.
Determinantsof FDI
SPECIAL FEATURE
relAtIonshIPbetweenMArketsIzeAnDFDIPerForMAnce In2013
Source: fDiMarkets
Motive Projects %ofprojects
Source: fDiMarketsNote: Percentages can add up to more than 100% as one company can cite multiplemotives for the same project.
locAtIonMotIvesForFDI In2013
Table 14Graph7
The sample of 72 countries excluded the US, Japan, germany,France and Italy, as these five countries significantly underperformin attracting FDI relative to what would be expected by size of theireconomies. Factors explaining this FDI underperformance includethe difficulty in penetrating these markets due to the strengthof local industry and/or a challenging business climate with sloweconomic growth. In addition, governments in these markets aregenerally less aggressive in promoting FDI with more of a focus onnational champions and indigenous enterprises compared withmany other countries.
R² = 0.82605
0
10
20
30
40
50
60
70
80
90
100
GDp20
13$trn
10 20 30 40 50 60 70

17The fDi RepoRT 2014 FORECASTS AND CONCLUSION
fDi Intelligence expects growth in greenfield FDI to acceleratein 2014 as the world’s economic recovery strengthens. Weexpect particularly strong growth of FDI into the UK, withresurgent economic growth taking place. We also expectstrong growth in major emerging markets that are revisingupwards their growth projections and have strong economicfundamentals. Ones to watch in 2014 include Mexico, Polandand Malaysia, and we also expect FDI into India to rebound in2014, notably in the same year that India replaces Japan as theworld’s third largest economy.
We expect solid growth in FDI to continue over the period 2015to 2018, with North America one of the strongest performingregions, with substantial growth in chemicals and heavy industryFDI expected, driven by access to cheap shale gas. FDI in theMiddle East and Africa should also grow strongly, driven by fasteconomic growth in Africa and recovery of the Middle East fromthe collapse in construction investment during the global financialcrisis. Asia is expected to increasingly become a major greenfieldinvestor overseas and the hype surrounding opportunities toattract Chinese FDI will become fact rather than fiction over thenext five years.
ConclusionsThe focus on capital investment trends in this issue of The fDiReport has revealed some important trends, with significantimplications for policy-makers and corporate decision-makers.
First, the FDI market grew strongly in 2013 not only in terms
of official FDI flows (which include M&A and other types ofinvestment) but also in terms of greenfield capital investment. fDiIntelligence expects the growth in greenfield FDI to accelerate in2014 and to continue to grow in subsequent years. governmentsshould expect the market to get bigger and increase their effortsto attract FDI and their performance targets.
Second, the growth in FDI in 2013 was particularly strong insmall and medium-sized emerging and frontier markets. Thissuggests foreign investors are taking risks again with their FDIstrategies and are focused on investing in growth markets withuntapped potential. This trend is very positive for the role FDIcan make in the coming years in the economic development ofdeveloping countries.
Third, several industries are showing a rebound in FDI, includingthe high-tech communications sector and large job-creatingtourism and construction sectors. The growth in these industriesprovides opportunities for governments to attract both high-
Forecasts GreenFIelDFDI,2009-2018
Source: fDiMarkets
Graph8
4002009 2010 2011 2012 2013 2014 2015 2016 2017 2018
600
800
1000
1200
Capitalinvestmen
t$bn
tech FDI that upgrades their digital infrastructure, which will helpattract knowledge-based investment, and to attract tourism andconstruction industries, which many countries depend upon forjob creation and export revenues.
Fourth, we have seen that FDI is primarily market-seeking andthat the countries that foster a high-growth economy will attractFDI, which will further increase economic growth. Our pick of themajor markets we expect to achieve the fastest growth in FDI in2014 is driven primarily by their economic growth performance.
Fifth, we expect the countries of Asia, and China in particular,to emerge as major outward investors, which will provideopportunities not only for traditional host locations such asAfrica but also developed economies. In particular, we expectthe strength of Asia and China in capital-intensive industriesto increasingly align with the FDI potential of North America.governments in North America will increasingly look across thePacific rather than across the Atlantic for the major FDI deals.
Published by The Financial Times LtdNumber One Southwark BridgeLondon SE1 9HL
©The Financial Times Ltd 2014
For further information, please contact;
[email protected]+44 (0) 20 7775 6365
[email protected]+ 44 (0)207 775 6667
editorCourtney Fingar
Contributing editorDr Henry Loewendahl
ContributorsChristine McMillanGeraldine EwingJulie ReynoldsJonathan PorterMathew AndersonHannah Clarke
fDi Intelligence is a specialist division of The Financial Times Ltdestablished to provide industry leading insight into globalisationwith a portfolio of world-class products, services and business toolsthat allow organisations such as investment promotion agencies,companies, service providers and academic institutions tomakeinformed decisions regarding foreign direct investment andassociated activities.
products and services include:fDi Markets – the only online database tracking crossbordergreenfield investment covering all sectors and countries worldwide.It provides real-timemonitoring of investment projects, capitalinvestment and job creation with powerful tools to track and profilecompanies investing overseas.
fDi benchmark – the only online tool to benchmark thecompetitiveness of countries and cities in more than 50 sectors.Its comprehensive location data series covers themain cost andquality competitiveness indicators for more than 300 locationsaround the world.
fDi Reports – provides sector, country, company and bespoke FDIreports which deliver vital business intelligence to corporations,investment promotion agencies, economic developmentorganisations, consulting firms and research institutions.
fDi atlas – an online locationmapping tool whichmakes it easier tonarrow down a location shortlist and identify the incentives offeredby investment promotion agencies in specific locations worldwide.
fDi Magazine – firmly established as the world’s premierpublication for the business of globalisation. Published on a bi-monthly basis with an ABC-certified, highly targeted circulation ofmore than 15,000, fDi provides corporate decision-makers with anup-to-date image of the ever-changing global investmentmap.
Contributors about fDi Intelligence
www.fDiIntelligence.com
The fDi RepoRT 201418
INFORMATION
Related Documents