J O I N T C E N T E R AEI-BROOKINGS JOINT CENTER FOR REGULATORY STUDIES The Failure of Structural Remedies in Sherman Act Monopolization Cases Robert W. Crandall Working Paper 01-05 March 2001 Robert W. Crandall is a Senior Fellow in Economic Studies at the Brookings Institution and a Scholar at the AEI-Brookings Joint Center for Regulatory Studies. The author is indebted to Hal Singer, Bruce M. Owen, J. Gregory Sidak, and Clifford Winston for comments and suggestions. Research assistance was provided by Jeffrey West, Ana Kreacic, and Kristin Jaeger. The author has been a consultant to Microsoft in its current Sherman Act litigation.

Welcome message from author
This document is posted to help you gain knowledge. Please leave a comment to let me know what you think about it! Share it to your friends and learn new things together.
Transcript
J O I N T C E N T E R AEI-BROOKINGS JOINT CENTER FOR REGULATORY STUDIES
The Failure of Structural Remedies in Sherman Act Monopolization Cases
Robert W. Crandall
Working Paper 01-05
March 2001
Robert W. Crandall is a Senior Fellow in Economic Studies at the Brookings Institution and a Scholar at the AEI-Brookings Joint Center for Regulatory Studies. The author is indebted to Hal Singer, Bruce M. Owen, J. Gregory Sidak, and Clifford Winston for comments and suggestions. Research assistance was provided by Jeffrey West, Ana Kreacic, and Kristin Jaeger. The author has been a consultant to Microsoft in its current Sherman Act litigation.
J O I N T C E N T E R
In response to growing concerns about understanding the impact of regulation on consumers, business, and government, the American Enterprise Institute and the Brookings Institution have established the AEI-Brookings Joint Center for Regulatory Studies. The primary purpose of the center is to hold lawmakers and regulators more accountable by providing thoughtful, objective analysis of existing regulatory programs and new regulatory proposals. The Joint Center builds on AEI’s and Brookings’s impressive body of work over the past three decades that has evaluated the economic impact of regulation and offered constructive suggestions for implementing reforms to enhance productivity and consumer welfare. The views in Joint Center publications are those of the authors and do not necessarily reflect the views of the staff, council of academic advisers, or fellows.
ROBERT W. HAHN ROBERT E. LITAN Director Codirector
COUNCIL OF ACADEMIC ADVISERS
MAUREEN L. CROPPER University of Maryland and World Bank
JOHN D. GRAHAM Harvard University
PHILIP K. HOWARD Covington & Burling
PAUL L. JOSKOW Massachusetts Institute of Technology
RODNEY W. NICHOLS New York Academy of Sciences
ROGER G. NOLL Stanford University
GILBERT S. OMENN University of Michigan
PETER PASSELL Milken Institute
RICHARD SCHMALENSEE Massachusetts Institute of Technology
ROBERT N. STAVINS Harvard University
CASS R. SUNSTEIN University of Chicago
W. KIP VISCUSI Harvard University
© 2001 AEI-Brookings Joint Center for Regulatory Studies. All rights reserved.
All Joint Center publications can be found at www.aei.brookings.org

Executive Summary
Considerable controversy has arisen around the recent U.S. District Court decision that
ordered vertical divestiture of Microsoft as a remedy for its violation of Section 2 of the Sherman Act. In this paper, I look back over more than a century of Sherman Act case law to see how frequently structural relief has been imposed in monopolization cases that involve a single firm that has not attained its market position through merger or from conspiring with other firms. I conclude that there are only four or five such cases in the history of Sherman Act enforcement. I then examine intensively the effectiveness of structural relief—vertical or horizontal divestiture—in seven of the most important Section 2 cases and two others. I conclude that with one exception, the break up of AT&T in 1984, there is very little evidence that such relief is successful in increasing competition, raising industry output, and reducing prices to consumers. The exception turns out to be a case of overkill because the same results could have been obtained through a simple regulatory rule, obviating the need for vertical divestiture of AT&T.

1
The Failure of Structural Remedies in Sherman Act Monopolization Cases
Robert W. Crandall
Introduction
On June 7, 2000, Judge Thomas Penfield Jackson ordered that Microsoft be broken into
two separate companies as the remedy for its monopolization of the market for Intel-based PC
software.1 This ruling marked the first major antitrust divestiture since the 1982 consent decree
that broke AT&T into seven operating companies and a long-distance/manufacturing company.2
It is also one of only a handful of examples of such a break-up of a firm whose growth has not
been the result of a series of mergers. Given the size of Microsoft, its position in the U.S.
economy, and the drastic nature of the relief ordered by the judge, this case could have a major
impact on American consumers. Is there any evidence on the likelihood that such relief can
work? In this paper I look at the historical record for such evidence.
Among the most well-known U.S. antitrust cases are those that have been brought by the
government under Section 2 of the Sherman Act, alleging that a firm or groups of firms has
“monopolized” a particular industry. Actions in which the government prevailed include
Standard Oil,3 American Tobacco,4 Alcoa,5 Paramount,6 United Shoe Machinery,7 and AT&T.8
The prevailing conventional wisdom is that in most of these cases the remedies were at least
partially successful in restoring competition to an industry that had been illegally monopolized
by the defendant(s). However, there is a surprising lack of evidence to support such a view, in
part because scholars have not attempted to undertake counterfactual analyses of the relevant
industries.
1.TOM FOREMSKI, CHRISTOPHER GRIMES & RICHARD WOLFE, JUDGE JACKSON ORDERS BREAK-UP ORDER TO
MICROSOFT, Fin. Times, JUNE 8, 2000, AT P1. 2.UNITED STATES V. AT&T, 552 F. SUPP. 131 (D.D.C. 1982) AFF’D SUB. NOM., MARYLAND V. UNITED STATES, 460 U.S. 1001 (1983). 3.STANDARD OIL COMPANY OF NEW JERSEY V. UNITED STATES, 221 U.S. 1 (1911). 4.UNITED STATES V. AMERICAN TOBACCO, 221 U.S. 106 (1911). 5.UNITED STATES V. ALUMINUM COMPANY OF AMERICA, 148 F.2D 416 (2D CIR. 1945). 6.UNITED STATES V. PARAMOUNT PICTURES, 334 U.S. 131 (1948). 7.UNITED STATES V. UNITED SHOE MACHINERY, 110 F. SUPP. 295 (D.MASS. 1953), AFF’D. 347 U.S. 521 (1954). 8.UNITED STATES V. AT&T, 552 F. SUPP.131 (D.D.C. 1982), AFF’D SUB. NOM.; MARYLAND V. UNITED STATES, 160 U.S., 1001 (1983).

2
Given the passage of time and the dearth of data for cases that were litigated 50 to 90
years ago, this review cannot always provide dispositive conclusions. However, I believe that
there is sufficient evidence to question whether the government’s victory and the structural relief
it obtained had a beneficial effect on competition and economic welfare in most cases. Because
the resources expended by the government and defendants on lengthy litigation and the ensuing
structural relief are substantial, requiring the expenditure of real resources and the opportunity
cost of lost output in the short run, the long run gains from restructuring must be substantial. But
in most cases the available evidence does not allow one to conclude that the court-imposed relief
had its intended effect.
Identifying “Monopolization”
An essential part of any Section 2 Sherman Act case is identifying monopoly power and
its sources. Under the case law, monopoly power is the power to exclude competitors and to raise
prices in a particular market. Determining whether a firm or set of firms has such monopoly
power requires inferences to be drawn from data on market concentration, ease of entry, price-
cost margins, and rates of return on capital. Even if a firm appears to possess monopoly power
by any or all of these measures, however, it may not be guilty of “monopolizing.” Monopoly
power may have evolved naturally because of economies of scale or scope or because of patents
or other intellectual capital. In such cases, the government will find it difficult to prove
monopolization.
To prove monopolization, the government must demonstrate that a firm has not only
power over price and output in an antitrust market, but it must also prove that this power was
obtained by business decisions whose intent was to exclude competition.9 It is not sufficient to
demonstrate in Judge Learned Hand’s words that the defendant obtained a monopoly position if
it did so through “...superior skill, foresight, and industry.”10 The government must then prove
that the defendant did not achieve this status simply by being progressive and efficient, but that it
undertook specific actions designed to exclude competition. The mens rea of intent must be
9. Philip Areeda, Antitrust Analysis (LITTLE, BROWN 1988). 10.UNITED STATES V. ALUMINUM COMPANY OF AMERICA, 148 F.2D 416 (2D CIR. 1945).

3
merged with the actus reus of monopoly power in order for a company to be found guilty of
monopolizing.
To prove monopolization thus requires an analysis of how the defendant achieved its
position of monopoly. This begins with the definition of the market because monopoly power
does not exist if the firm controls only one of many substitute products and therefore cannot
exercise power over price. Having defined the market and established the defendant’s monopoly
power, the government must then demonstrate how the defendant’s alleged monopoly position
was obtained. Anecdotal evidence on the causes of rivals’ failures will often suggest that
predation was involved, but such evidence may not withstand scrutiny. The defendant may have
been innovative in developing product attributes, distribution channels, marketing strategies, or
backward integration into the supply of requisite inputs. If such strategies allowed it to price its
products or services below those of its rivals or to otherwise offer a more attractive package to its
customers, such a strategy could hardly be considered predatory. Nevertheless, the government
may argue and the court may accept the argument that the practices are exclusionary. If so, the
government may seek relief that limits the “bundling” of attractive features or that requires
vertical divestiture.11
Remedies in Antitrust Cases
If the government has advanced an incorrect theory of the determinants of the
defendant’s success in achieving a monopoly position, its recommendations for a decree that
purports to increase competition are likely to prove either ineffective or counterproductive. For
instance, I shall show that the dissolution of the Standard Oil Trust in 1911 had no discernible
effects on output and prices in the petroleum industry after 1911 because Standard’s position in
the rapidly-growing petroleum industry of the early 1900s was already eroding due to the success
of entrants in the booming oil patches outside Standard’s stronghold in Pennsylvania and Ohio.
Establishing 38 separate, independent companies by dissolving the Trust had little impact on the
ability of new, independent companies to expand their operations in Oklahoma, Texas, or
California. The alleged sins visited on Standard’s early competitors in Pennsylvania or Ohio had
11.UNITED STATES V. UNITED SHOE MACHINERY, 110 F. SUPP. 295 (D.MASS. 1953), AFF’D. 347 U.S. 521 (1954).

4
nothing do with the state of competition in Missouri, Kansas, Oklahoma, Texas, or California a
decade or so later.
An antitrust decree may be even counterproductive by establishing an inefficient market
structure. For example, it has been argued that the decree ordering vertical dissolution in the
Paramount case broke the essential bond between production, distribution, and exhibition that
was required for efficient production and distribution of motion pictures.12 If this is true, the
decree reduced consumer welfare until vertical integration was re-established by distributor
downstream integration into cable television thirty years later or into Internet delivery more than
forty years later. Whether it was counterproductive or not, I show below that the decree had no
discernible effect on output and may even have increased consumer prices.
A decree may also be ineffective because the government and the court fail to anticipate
changes in technology or customer demand. In 1969, the government filed a Section 2 case
against IBM for allegedly monopolizing the computer industry.13 The case was eventually
dropped in 1982 when the Assistant Attorney General for Antitrust discovered that the industry
had changed drastically in the 1969-82 period and that IBM was not selling any products in 1982
that it had offered in 1969. Any theory that purportedly explained IBM’s dominance of the
market for 360 or 370 mainframe computers was not likely to provide a useful guide to
establishing competition in an era in which IBM was struggling to compete with Apple in the
newest generation of personal computers.14 Surely, this should be a warning to those who
advocate a structural decree in the current Microsoft case, given that Microsoft’s products have
been evolving even more rapidly than were IBM’s products in the 1970s.
These problems are particularly acute in markets that have been regulated as monopolies
by the government for decades. For example, the Federal Communications Commission (FCC)
began to admit entrants into interstate telecommunications in 1969. By the mid 1970s, the FCC
had lost control of this liberalization process and actually attempted to block the entry of MCI
into ordinary long-distance services. When rebuffed by the courts, the FCC was forced to
regulate inter-carrier connections to facilitate competition. Not surprisingly, it failed in this
12.SEE SECTION III.D BELOW. 13.UNITED STATES V. IBM, 69 CIV. 200. 14.FOR A DISCUSSION OF THE FUTILITY OF THE GOVERNMENT’S CASE, SEE Franklin M. Fisher, Joen E. Greenwood, & John J. McGowan, Folded, Spindled, and Mutilated: Economic Analysis and U.S. v. IBM (MIT PRESS 1983).
5
attempt, and the new major entrant, MCI, struggled to take market share from the erstwhile
regulated monopolist, AT&T. MCI and others eventually persuaded the government to bring a
Section 2 Sherman Act suit against AT&T,15 but a co-defendant in this suit should have been the
FCC. As I demonstrate below, the FCC could have achieved at least as good a result as the
eventual court-ordered dissolution of AT&T achieved and without its costly disruption.
Structural versus Behavioral Relief
Remedies in Section 2 cases generally take one or both of two forms: structural remedies
or behavioral relief. Structural remedies are those in which the court orders some change in the
firm’s or industry’s structure. These changes may involve a horizontal divestiture or “break up”
through which two or more separate companies are created from the assets of the defendant. For
example, the court-ordered dissolution of the Standard Oil trust created several quasi-
independent refining companies by simply requiring that the various companies in the Trust be
spun off to Standard’s stockholders. Or the relief may require vertical divestiture, the creation of
separate companies at different stages of production. The Paramount case resulted in five
decrees that divested the major film distributors’ theater chains from their production-
distribution operations.
Behavioral relief generally proscribes some aspect of the firm’s behavior that the
government identified as anti-competitive during the litigation, such as tying arrangements,
“block booking” of feature films, price “squeezes” on downstream competitors, collusive
agreements to exclude competitors, leasing equipment without an option for purchase, or
predatory pricing. Such prohibitions obviously require monitoring by an enforcement authority
and are likely to result in numerous issues that have to be resolved by the courts.
Finally, relief may involve the compulsory licensing of intellectual property that is the
source of the alleged monopoly power. There have been a large number of such decrees,
involving such diverse products as copying machines, motion picture film, glass, and oil well
equipment.16
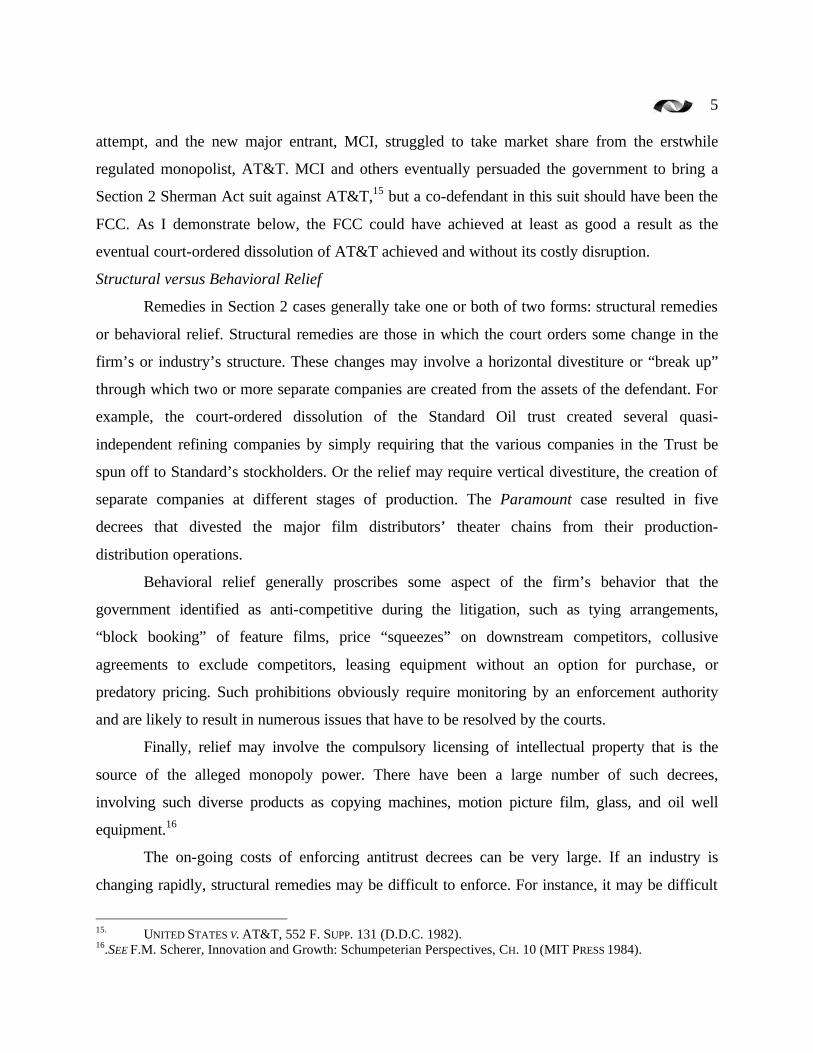
The on-going costs of enforcing antitrust decrees can be very large. If an industry is
changing rapidly, structural remedies may be difficult to enforce. For instance, it may be difficult
15. UNITED STATES V. AT&T, 552 F. SUPP. 131 (D.D.C. 1982). 16.SEE F.M. Scherer, Innovation and Growth: Schumpeterian Perspectives, CH. 10 (MIT PRESS 1984).
6
to determine the demarcation point between various stages of production that have been
separated through vertical divestiture. When television exhibition replaced theatrical exhibition
of feature films, for example, would the Paramount defendants be allowed to own television
stations, but not theaters? Could the divested Bell operating companies provide Internet service
through local Internet Service Providers (ISPs) if the latter sent data packets across LATA
boundaries? What if the Bell-owned ISP connected with another entity within its own LATA,
who, in turn, sent the data packets to the Internet backbone?
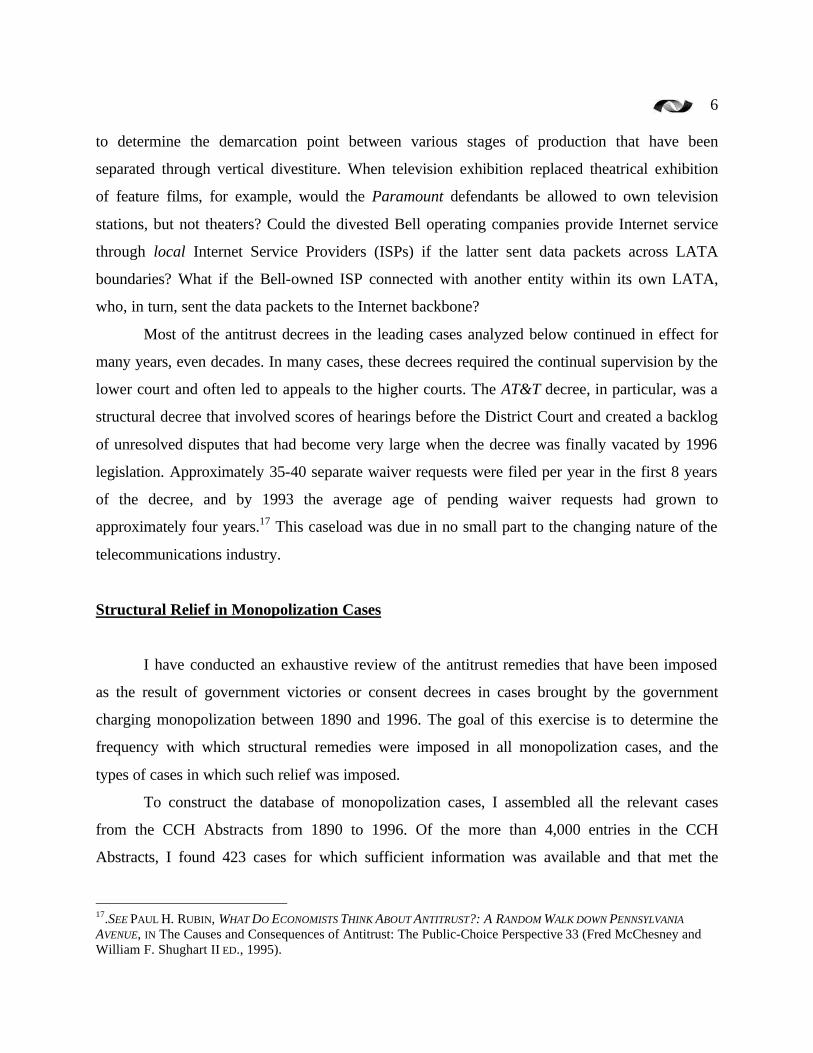
Most of the antitrust decrees in the leading cases analyzed below continued in effect for
many years, even decades. In many cases, these decrees required the continual supervision by the
lower court and often led to appeals to the higher courts. The AT&T decree, in particular, was a
structural decree that involved scores of hearings before the District Court and created a backlog
of unresolved disputes that had become very large when the decree was finally vacated by 1996
legislation. Approximately 35-40 separate waiver requests were filed per year in the first 8 years
of the decree, and by 1993 the average age of pending waiver requests had grown to
approximately four years.17 This caseload was due in no small part to the changing nature of the
telecommunications industry.
Structural Relief in Monopolization Cases
I have conducted an exhaustive review of the antitrust remedies that have been imposed
as the result of government victories or consent decrees in cases brought by the government
charging monopolization between 1890 and 1996. The goal of this exercise is to determine the
frequency with which structural remedies were imposed in all monopolization cases, and the
types of cases in which such relief was imposed.
To construct the database of monopolization cases, I assembled all the relevant cases
from the CCH Abstracts from 1890 to 1996. Of the more than 4,000 entries in the CCH
Abstracts, I found 423 cases for which sufficient information was available and that met the
17.SEE PAUL H. RUBIN, WHAT DO ECONOMISTS THINK ABOUT ANTITRUST?: A RANDOM WALK DOWN PENNSYLVANIA
AVENUE, IN The Causes and Consequences of Antitrust: The Public-Choice Perspective 33 (Fred McChesney and William F. Shughart II ED., 1995).
7
initial criteria—a finding against the defendants or a consent decree in a monopolization case
brought by the government.18
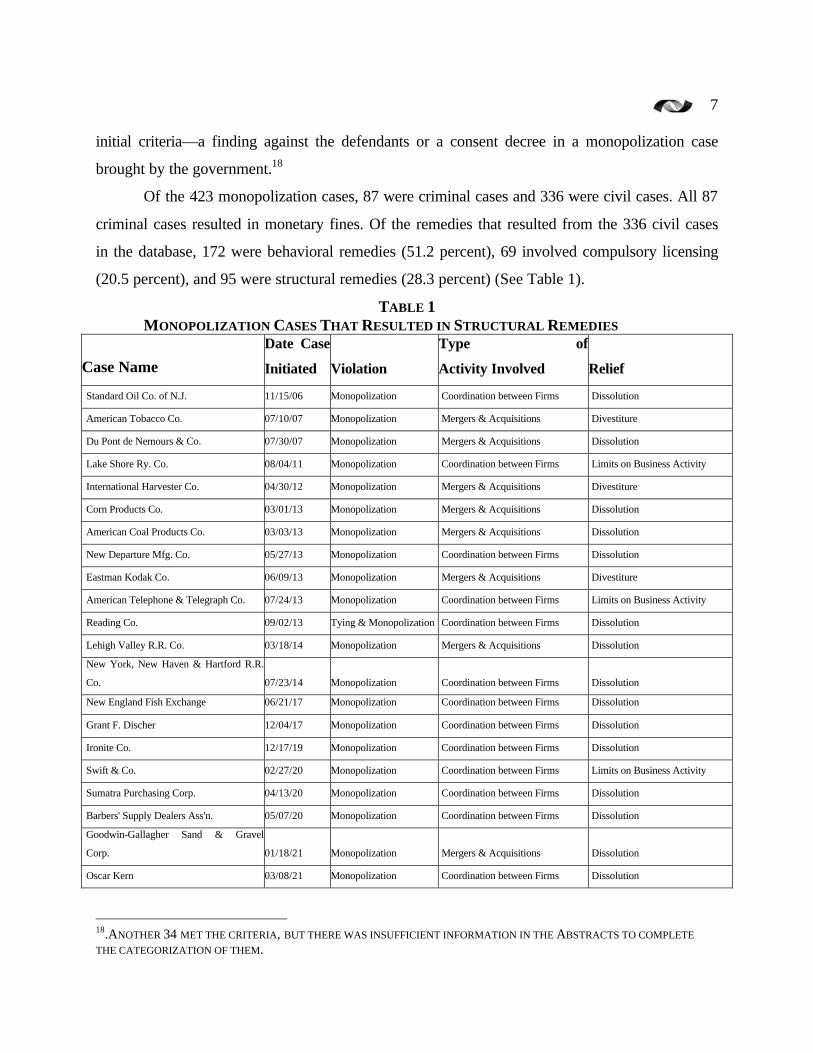
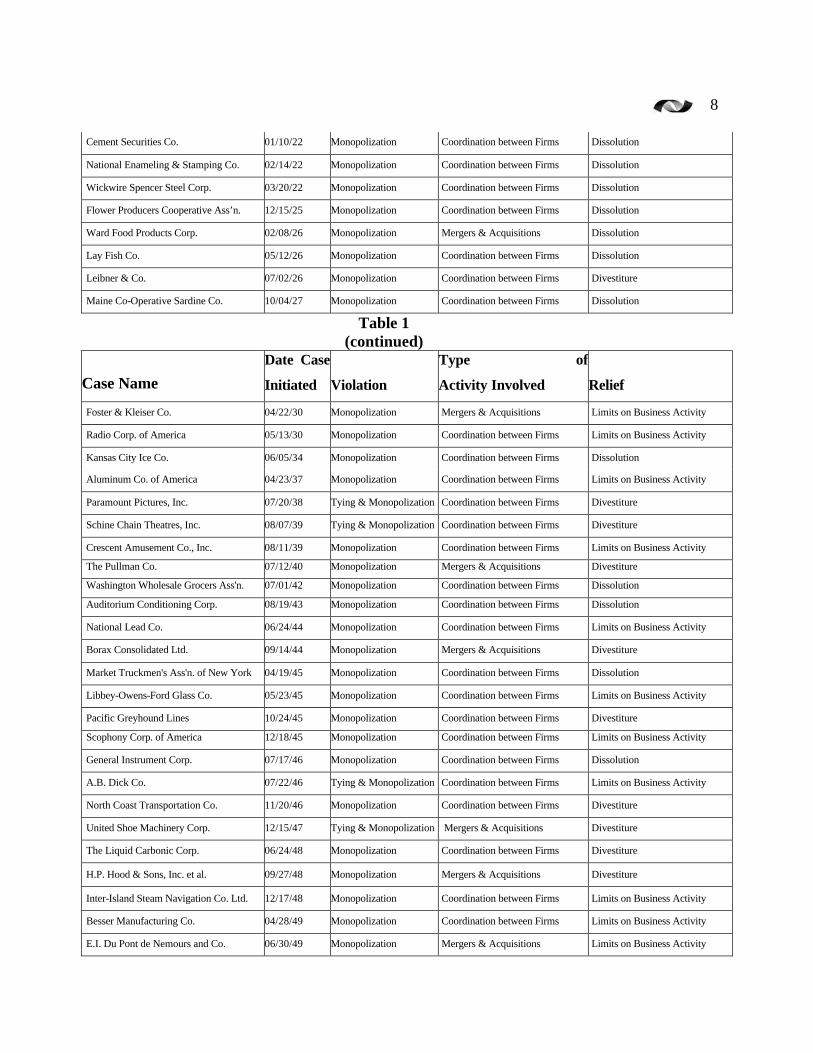
Of the 423 monopolization cases, 87 were criminal cases and 336 were civil cases. All 87
criminal cases resulted in monetary fines. Of the remedies that resulted from the 336 civil cases
in the database, 172 were behavioral remedies (51.2 percent), 69 involved compulsory licensing
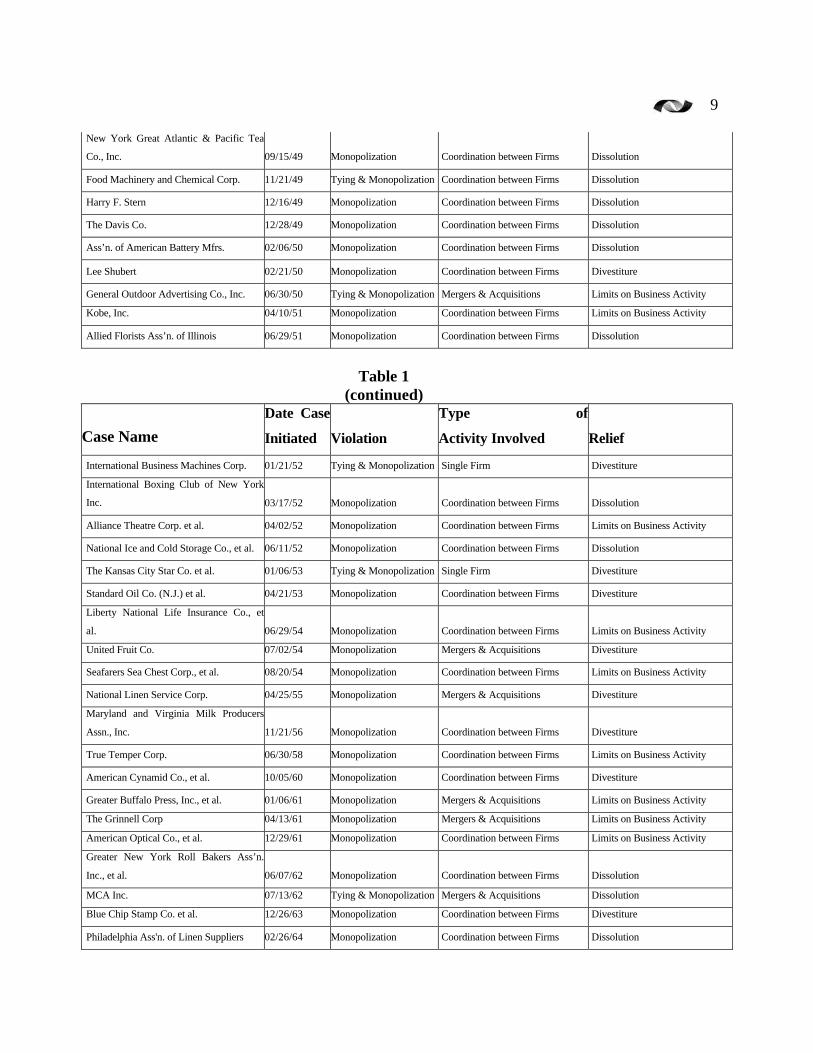
(20.5 percent), and 95 were structural remedies (28.3 percent) (See Table 1).
TABLE 1 MONOPOLIZATION CASES THAT RESULTED IN STRUCTURAL REMEDIES
Case Name
Date Case
Initiated Violation
Type of
Activity Involved Relief
Standard Oil Co. of N.J. 11/15/06 Monopolization Coordination between Firms Dissolution
American Tobacco Co. 07/10/07 Monopolization Mergers & Acquisitions Divestiture
Du Pont de Nemours & Co. 07/30/07 Monopolization Mergers & Acquisitions Dissolution
Lake Shore Ry. Co. 08/04/11 Monopolization Coordination between Firms Limits on Business Activity
International Harvester Co. 04/30/12 Monopolization Mergers & Acquisitions Divestiture
Corn Products Co. 03/01/13 Monopolization Mergers & Acquisitions Dissolution
American Coal Products Co. 03/03/13 Monopolization Mergers & Acquisitions Dissolution
New Departure Mfg. Co. 05/27/13 Monopolization Coordination between Firms Dissolution
Eastman Kodak Co. 06/09/13 Monopolization Mergers & Acquisitions Divestiture
American Telephone & Telegraph Co. 07/24/13 Monopolization Coordination between Firms Limits on Business Activity
Reading Co. 09/02/13 Tying & Monopolization Coordination between Firms Dissolution
Lehigh Valley R.R. Co. 03/18/14 Monopolization Mergers & Acquisitions Dissolution
New York, New Haven & Hartford R.R.
Co. 07/23/14 Monopolization Coordination between Firms Dissolution
New England Fish Exchange 06/21/17 Monopolization Coordination between Firms Dissolution
Grant F. Discher 12/04/17 Monopolization Coordination between Firms Dissolution
Ironite Co. 12/17/19 Monopolization Coordination between Firms Dissolution
Swift & Co. 02/27/20 Monopolization Coordination between Firms Limits on Business Activity
Sumatra Purchasing Corp. 04/13/20 Monopolization Coordination between Firms Dissolution
Barbers' Supply Dealers Ass'n. 05/07/20 Monopolization Coordination between Firms Dissolution
Goodwin-Gallagher Sand & Gravel
Corp. 01/18/21 Monopolization Mergers & Acquisitions Dissolution
Oscar Kern 03/08/21 Monopolization Coordination between Firms Dissolution
18.ANOTHER 34 MET THE CRITERIA, BUT THERE WAS INSUFFICIENT INFORMATION IN THE ABSTRACTS TO COMPLETE
THE CATEGORIZATION OF THEM.
8
Cement Securities Co. 01/10/22 Monopolization Coordination between Firms Dissolution
National Enameling & Stamping Co. 02/14/22 Monopolization Coordination between Firms Dissolution
Wickwire Spencer Steel Corp. 03/20/22 Monopolization Coordination between Firms Dissolution
Flower Producers Cooperative Ass’n. 12/15/25 Monopolization Coordination between Firms Dissolution
Ward Food Products Corp. 02/08/26 Monopolization Mergers & Acquisitions Dissolution
Lay Fish Co. 05/12/26 Monopolization Coordination between Firms Dissolution
Leibner & Co. 07/02/26 Monopolization Coordination between Firms Divestiture
Maine Co-Operative Sardine Co. 10/04/27 Monopolization Coordination between Firms Dissolution
Table 1
(continued)
Case Name
Date Case
Initiated Violation
Type of
Activity Involved Relief
Foster & Kleiser Co. 04/22/30 Monopolization Mergers & Acquisitions Limits on Business Activity
Radio Corp. of America 05/13/30 Monopolization Coordination between Firms Limits on Business Activity
Kansas City Ice Co. 06/05/34 Monopolization Coordination between Firms Dissolution
Aluminum Co. of America 04/23/37 Monopolization Coordination between Firms Limits on Business Activity
Paramount Pictures, Inc. 07/20/38 Tying & Monopolization Coordination between Firms Divestiture
Schine Chain Theatres, Inc. 08/07/39 Tying & Monopolization Coordination between Firms Divestiture
Crescent Amusement Co., Inc. 08/11/39 Monopolization Coordination between Firms Limits on Business Activity
The Pullman Co. 07/12/40 Monopolization Mergers & Acquisitions Divestiture
Washington Wholesale Grocers Ass'n. 07/01/42 Monopolization Coordination between Firms Dissolution
Auditorium Conditioning Corp. 08/19/43 Monopolization Coordination between Firms Dissolution
National Lead Co. 06/24/44 Monopolization Coordination between Firms Limits on Business Activity
Borax Consolidated Ltd. 09/14/44 Monopolization Mergers & Acquisitions Divestiture
Market Truckmen's Ass'n. of New York 04/19/45 Monopolization Coordination between Firms Dissolution
Libbey-Owens-Ford Glass Co. 05/23/45 Monopolization Coordination between Firms Limits on Business Activity
Pacific Greyhound Lines 10/24/45 Monopolization Coordination between Firms Divestiture
Scophony Corp. of America 12/18/45 Monopolization Coordination between Firms Limits on Business Activity
General Instrument Corp. 07/17/46 Monopolization Coordination between Firms Dissolution
A.B. Dick Co. 07/22/46 Tying & Monopolization Coordination between Firms Limits on Business Activity
North Coast Transportation Co. 11/20/46 Monopolization Coordination between Firms Divestiture
United Shoe Machinery Corp. 12/15/47 Tying & Monopolization Mergers & Acquisitions Divestiture
The Liquid Carbonic Corp. 06/24/48 Monopolization Coordination between Firms Divestiture
H.P. Hood & Sons, Inc. et al. 09/27/48 Monopolization Mergers & Acquisitions Divestiture
Inter-Island Steam Navigation Co. Ltd. 12/17/48 Monopolization Coordination between Firms Limits on Business Activity
Besser Manufacturing Co. 04/28/49 Monopolization Coordination between Firms Limits on Business Activity
E.I. Du Pont de Nemours and Co. 06/30/49 Monopolization Mergers & Acquisitions Limits on Business Activity
9
New York Great Atlantic & Pacific Tea
Co., Inc. 09/15/49 Monopolization Coordination between Firms Dissolution
Food Machinery and Chemical Corp. 11/21/49 Tying & Monopolization Coordination between Firms Dissolution
Harry F. Stern 12/16/49 Monopolization Coordination between Firms Dissolution
The Davis Co. 12/28/49 Monopolization Coordination between Firms Dissolution
Ass’n. of American Battery Mfrs. 02/06/50 Monopolization Coordination between Firms Dissolution
Lee Shubert 02/21/50 Monopolization Coordination between Firms Divestiture
General Outdoor Advertising Co., Inc. 06/30/50 Tying & Monopolization Mergers & Acquisitions Limits on Business Activity
Kobe, Inc. 04/10/51 Monopolization Coordination between Firms Limits on Business Activity
Allied Florists Ass’n. of Illinois 06/29/51 Monopolization Coordination between Firms Dissolution
Table 1
(continued)
Case Name
Date Case
Initiated Violation
Type of
Activity Involved Relief
International Business Machines Corp. 01/21/52 Tying & Monopolization Single Firm Divestiture
International Boxing Club of New York
Inc. 03/17/52 Monopolization Coordination between Firms Dissolution
Alliance Theatre Corp. et al. 04/02/52 Monopolization Coordination between Firms Limits on Business Activity
National Ice and Cold Storage Co., et al. 06/11/52 Monopolization Coordination between Firms Dissolution
The Kansas City Star Co. et al. 01/06/53 Tying & Monopolization Single Firm Divestiture
Standard Oil Co. (N.J.) et al. 04/21/53 Monopolization Coordination between Firms Divestiture
Liberty National Life Insurance Co., et
al. 06/29/54 Monopolization Coordination between Firms Limits on Business Activity
United Fruit Co. 07/02/54 Monopolization Mergers & Acquisitions Divestiture
Seafarers Sea Chest Corp., et al. 08/20/54 Monopolization Coordination between Firms Limits on Business Activity
National Linen Service Corp. 04/25/55 Monopolization Mergers & Acquisitions Divestiture
Maryland and Virginia Milk Producers
Assn., Inc. 11/21/56 Monopolization Coordination between Firms Divestiture
True Temper Corp. 06/30/58 Monopolization Coordination between Firms Limits on Business Activity
American Cynamid Co., et al. 10/05/60 Monopolization Coordination between Firms Divestiture
Greater Buffalo Press, Inc., et al. 01/06/61 Monopolization Mergers & Acquisitions Limits on Business Activity
The Grinnell Corp 04/13/61 Monopolization Mergers & Acquisitions Limits on Business Activity
American Optical Co., et al. 12/29/61 Monopolization Coordination between Firms Limits on Business Activity
Greater New York Roll Bakers Ass’n.
Inc., et al. 06/07/62 Monopolization Coordination between Firms Dissolution
MCA Inc. 07/13/62 Tying & Monopolization Mergers & Acquisitions Dissolution
Blue Chip Stamp Co. et al. 12/26/63 Monopolization Coordination between Firms Divestiture
Philadelphia Ass'n. of Linen Suppliers 02/26/64 Monopolization Coordination between Firms Dissolution

10
E. W. Scripps Co. 05/27/64 Monopolization Mergers & Acquisitions Limits on Business Activity
Chrysler Corp. and Mack Trucks, Inc. 07/30/64 Monopolization Mergers & Acquisitions Limits on Business Activity
Broadcast Music, Inc. 12/10/64 Monopolization Coordination between Firms Limits on Business Activity
The Citizen Publishing Co. et al. 01/04/65 Monopolization Mergers & Acquisitions Limits on Business Activity
Pittsburgh Brewing Co., et al. 12/28/65 Monopolization Mergers & Acquisitions Limits on Business Activity
Mid-America Dairymen, Inc. 12/27/73 Monopolization Coordination between Firms Divestiture
American Telephone and Telegraph Co. 11/20/74 Monopolization Single Firm Divestiture
CBS, Inc. 12/10/74 Monopolization Coordination between Firms Limits on Business Activity
American Broadcasting Companies, Inc. 12/10/74 Monopolization Coordination between Firms Limits on Business Activity
National Broadcasting Co., Inc. 12/10/74 Monopolization Coordination between Firms Limits on Business Activity
Hospital Affiliates International 09/25/80 Monopolization Mergers & Acquisitions Divestiture
GTE, Corp. 05/04/83 Monopolization Mergers & Acquisitions Limits on Business Activity
Of the 95 cases shown in Table 1, 63 resulted in a divestiture or dissolution and 32 in
restrictions on business activities. In the latter cases, for example, a firm or firms might be barred
from offering certain goods or services or be required to sell as well as lease their products. I
distinguish these prohibitions from outright divestiture or dissolution, which requires the
separation of a firm’s assets, the sale of certain divisions, or the dissolution of an entire
organization, such as an association through which a price-fixing conspiracy had been effected.
For example, the line-of-business restrictions imposed on the Bell Operating Companies in the
1982 AT&T decree would be classified as a structural remedy in my classification, not as a
behavioral remedy. If these restrictions required the sale or spin-off of assets, as the AT&T
decree surely did, it would be defined as a “divestiture.”
For each of the cases listed in Table 1, I created three separate subcategories, reflecting
the activities that led to the firm(s) being charged with monopolization, namely (1) cases in
which mergers and acquisitions were central to the government’s case, (2) cases involving
coordinated price behavior among defendants, and (3) cases in which neither mergers and
acquisitions nor coordinated price behavior were central elements in the case (single-firm cases).
Note that a very large share of the cases that resulted in divestiture involved either price
coordination (i.e., price-fixing or market-sharing conspiracies) or mergers and acquisitions that
led to monopoly power.
Dividing the cases that resulted in structural relief into these categories is important
because the problems in effecting such relief are likely to be very different across the three

11
categories. First, divestiture or dissolution in cases involving pricing coordination is generally
quite simple because dissolution of a trade association or other organization that exists
principally to carry out a price-fixing or market-sharing conspiracy is straightforward and does
not necessarily imperil the viability or efficiency of the independent firms that were found to
have been involved in the market coordination. Similarly, divestiture of recently-merged entities
is much more easily accomplished than is the breakup of a unitary firm that is not a combination
of recently independent companies. However, divestiture of a single organic firm can be much
more difficult and risky in terms of lost output or producer efficiency. Courts are understandably
reluctant to order relief that may not be sustainable in the marketplace.
For example, Judge Wyzanski resisted a divestiture decree in United Shoe Machinery
because of the difficulty in dividing up a company with only one plant.19 Similarly, in the 1911
Standard Oil case, the court left the various Standard companies that comprised the Trust intact,
fearing the effects of a more drastic divestiture.20
Of the 63 cases where divestiture or dissolution was imposed, 17 were cases involving
mergers and acquisition(s), 43 were cases resulting from coordinated price behavior, and only 3
were single-firm divestitures in which neither conspiracy nor acquisitions were involved.
Another three cases in the coordination category, the three network television cases brought in
the 1970s, resulted in less drastic structural relief, namely, limitations on business activities.
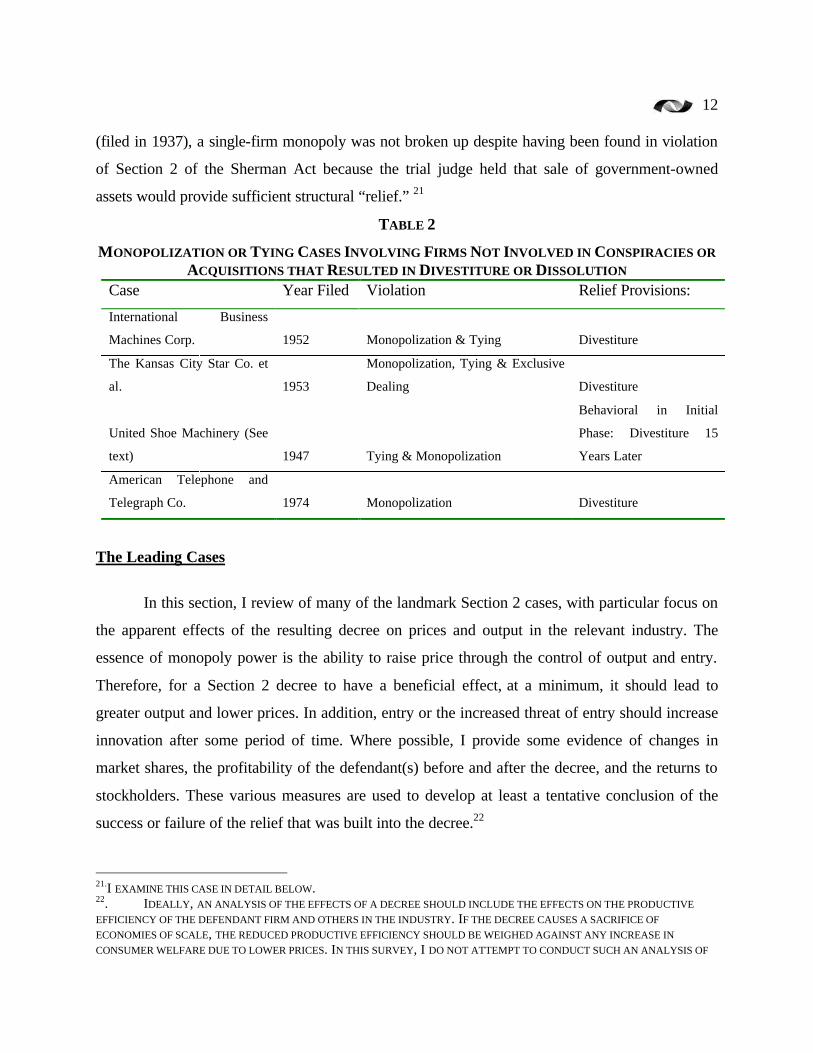
Table 2 lists the monopolization or tying cases that did not allege coordinated price behavior or
mergers and acquisitions, but resulted in divestiture or dissolution.
To summarize, of the 95 monopolization cases that resulted in structural relief, only 3
(3.2 percent) led to divestiture or dissolution when a single firm was charged with
monopolization without resort to mergers and acquisitions or coordinated pricing behavior with
other firms. In addition, I include United Shoe Machinery in this list in Table 2 because it was
eventually required to spin off some assets fifteen years after the trial judge refused to order such
relief and because mergers and acquisitions were not a major source of United’s market position.
In another of the “landmark” monopolization cases in which the government prevailed , Alcoa
19.SEE Carl Kaysen, United States v. United Shoe Machinery Corporation: An Economic Analysis of an Antitrust Case 272-75 (HARVARD UNIVERSITY PRESS 1956). 20.MALCOLM R. BURNS, THE COMPARATIVE EFFECTS OF TRUST BUSTING, 85 J. Pol. Econ. 717 (1977).
12
(filed in 1937), a single-firm monopoly was not broken up despite having been found in violation
of Section 2 of the Sherman Act because the trial judge held that sale of government-owned
assets would provide sufficient structural “relief.” 21
TABLE 2
MONOPOLIZATION OR TYING CASES INVOLVING FIRMS NOT INVOLVED IN CONSPIRACIES OR ACQUISITIONS THAT RESULTED IN DIVESTITURE OR DISSOLUTION
Case Year Filed Violation Relief Provisions:
International Business
Machines Corp. 1952 Monopolization & Tying Divestiture
The Kansas City Star Co. et
al. 1953
Monopolization, Tying & Exclusive
Dealing Divestiture
United Shoe Machinery (See
text) 1947 Tying & Monopolization
Behavioral in Initial
Phase: Divestiture 15
Years Later
American Telephone and
Telegraph Co. 1974 Monopolization Divestiture
The Leading Cases
In this section, I review of many of the landmark Section 2 cases, with particular focus on
the apparent effects of the resulting decree on prices and output in the relevant industry. The
essence of monopoly power is the ability to raise price through the control of output and entry.
Therefore, for a Section 2 decree to have a beneficial effect, at a minimum, it should lead to
greater output and lower prices. In addition, entry or the increased threat of entry should increase
innovation after some period of time. Where possible, I provide some evidence of changes in
market shares, the profitability of the defendant(s) before and after the decree, and the returns to
stockholders. These various measures are used to develop at least a tentative conclusion of the
success or failure of the relief that was built into the decree.22
21.I EXAMINE THIS CASE IN DETAIL BELOW. 22. IDEALLY, AN ANALYSIS OF THE EFFECTS OF A DECREE SHOULD INCLUDE THE EFFECTS ON THE PRODUCTIVE
EFFICIENCY OF THE DEFENDANT FIRM AND OTHERS IN THE INDUSTRY. IF THE DECREE CAUSES A SACRIFICE OF
ECONOMIES OF SCALE, THE REDUCED PRODUCTIVE EFFICIENCY SHOULD BE WEIGHED AGAINST ANY INCREASE IN
CONSUMER WELFARE DUE TO LOWER PRICES. IN THIS SURVEY, I DO NOT ATTEMPT TO CONDUCT SUCH AN ANALYSIS OF

13
Standard Oil
The Standard Oil Company was formed in Ohio in 1870 by John D. Rockefeller and
associates.23 In its earliest years, the company refined and marketed crude oil produced in
Pennsylvania, Ohio, and Indiana. Over time, however, it expanded to a large number of
surrounding states and developed transportation and production facilities for the processing of
crude oil from a number of states. From its beginning, Standard Oil was involved in controversy
because of its aggressive competitive conduct, particularly in negotiating contracts for
transporting its oil on eastern railroads and its alleged use of predatory pricing. As a result, it was
the subject of numerous state and federal actions against these practices, culminating in a
Sherman Act suit in 1906.24 Standard Oil was eventually broken up in 1911 as the results of a
government victory in this case.
Oil Production
Crude oil was discovered in Pennsylvania in 1859. Production rose steadily in
Pennsylvania and then on the Ohio-Indiana border in the 1870s, but it was not until oil was
discovered in Kansas, Oklahoma, California, and Texas that oil production began to expand
rapidly. In 1899, production in the Mid-Continent (Kansas-Oklahoma), Gulf (Texas-Louisiana),
and California fields accounted for just 7 percent of total U.S. output.25 The oil boom in Texas,
Kansas, California, and Oklahoma began in earnest in 1901-2, and by 1909 these areas
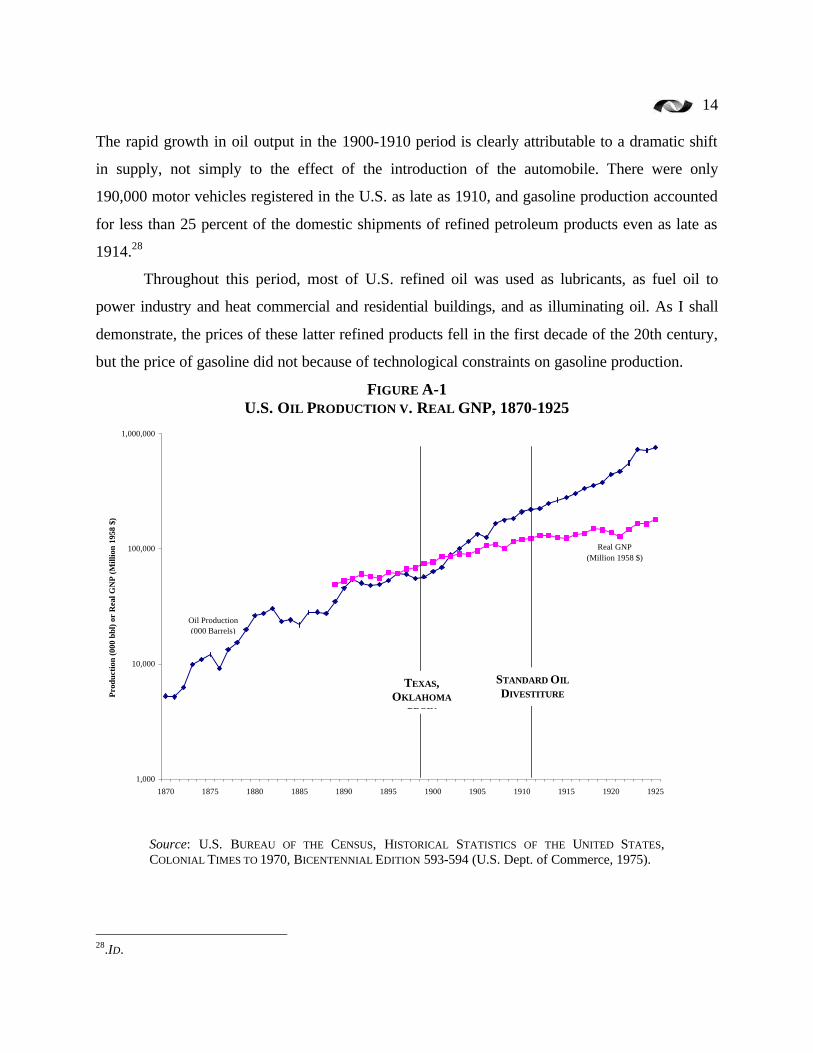
accounted for nearly two-thirds of U.S. crude production.26 As Figure A-1 shows, crude oil
production grew slowly for seventeen years after 1883, but began to accelerate in 1901-10 due to
the exploitation of these western fields. Surprisingly, production growth slowed somewhat from
1910 until 1919 despite the acceleration in GNP due to World War I.27
EVERY CASE, FOCUSING INSTEAD ON WHETHER THE DECREES HAD ANY MEASURABLE BENEFICIAL IMPACT ON PRICES
AND OUTPUT. 23.Harold F. Williamson & Arnold R. Daum, The American Petroleum Industry: The Age of Illumination 1859-1899 302 (NORTHWESTERN UNIVERSITY PRESS 1959). 24.Harold F. Williamson, Ralph L. Andreano, Arnold R. Daum, & Gilbert C. Klose, The American Petroleum Industry: The Age of Energy 1899-1959 9 (NORTHWESTERN UNIVERSITY PRESS 1963). (A “PARTIAL LIST” OF STATE
SUITS AGAINST STANDARD INCLUDES 20 ACTIONS FILED IN 1904-06.) 25.ID. AT 17. 26.ID. 27.U.S. Bureau of the Census, Historical United States, Colonial Times to 1970, Bicentennial Edition 593-94 (U.S. DEPARTMENT OF COMMERCE 1975); Williamson, et al., SUPRA NOTE AT 168.
14
The rapid growth in oil output in the 1900-1910 period is clearly attributable to a dramatic shift
in supply, not simply to the effect of the introduction of the automobile. There were only
190,000 motor vehicles registered in the U.S. as late as 1910, and gasoline production accounted
for less than 25 percent of the domestic shipments of refined petroleum products even as late as
1914.28
Throughout this period, most of U.S. refined oil was used as lubricants, as fuel oil to
power industry and heat commercial and residential buildings, and as illuminating oil. As I shall
demonstrate, the prices of these latter refined products fell in the first decade of the 20th century,
but the price of gasoline did not because of technological constraints on gasoline production.
FIGURE A-1 U.S. OIL PRODUCTION V. REAL GNP, 1870-1925
Source: U.S. BUREAU OF THE CENSUS, HISTORICAL STATISTICS OF THE UNITED STATES, COLONIAL TIMES TO 1970, BICENTENNIAL EDITION 593-594 (U.S. Dept. of Commerce, 1975).
28.ID.
1,000
10,000
100,000
1,000,000
1870 1875 1880 1885 1890 1895 1900 1905 1910 1915 1920 1925
Pro
duct
ion
(000
bbl
) or
Rea
l GN
P (
Mill
ion
1958
$)
Oil Production(000 Barrels)
Real GNP(Million 1958 $)
TEXAS, OKLAHOMA
BEGIN
STANDARD OIL
DIVESTITURE

15
Industry Structure
In its formative years, Standard Oil purchased crude oil from Pennsylvania and Indiana-
Ohio producers and arranged for transportation to its refineries. Over time, a larger and larger
share of this transportation was effected through Standard’s own pipelines, which it used to
control output in the early years of the industry.29 When the Mid-Continent and Gulf fields
opened, however, Standard was unable to achieve a similar dominant position through
controlling crude-oil pipelines because the large scale of these fields, and the proximity of the
Gulf fields to water-borne transportation, provided the opportunity for competitors to construct
their own pipelines. As a result, Standard companies were unable to obtain and retain a large
share of production in these areas. Gulf Oil, the Texas Company, Sun Oil, and a host of
independents prospered, obtaining a large share of the production from these fields throughout
the 1901-10 period.30
The refining of crude oil into final products evolved over time due to changing product
demand and improvements in technology. The share of gasoline in total output rose steadily in
the early 20th century as the stock of motor vehicles increased. The development of new
technologies, such as cracking, was required to increase the yield of gasoline and other volatile
compounds.
Refined products were distributed through the integrated refiners’ bulk stations and by
independent jobbers. The Standard companies and their large competitors, Union Oil, the Texas
Company, Pure Oil, Cudahy, and Gulf Oil built terminals to provide the wholesale distribution of
fuel oil, kerosene, gasoline, and lubricating oils. But the shift away from kerosene towards fuel
oil and gasoline required major new investments in distribution facilities that opened the door for
Standard’s competitors in the twelve years leading up to the 1911 dissolution. In 1899,
Standard’s competitors accounted for only about 15 percent of the domestic market for all
refined products. By 1911, they supplied nearly 70 percent of the country’s fuel oil, 34 percent of
the gasoline, and one-quarter of the nation’s kerosene.31 For the most part, these products were
29.AMONG THE CHARGES IN THE 1906 STANDARD OIL CASE WAS THAT STANDARD DENIED COMMON CARRIAGE ON ITS
PIPELINES TO SMALL INDEPENDENT REFINERS. 30.Williamson, et al., SUPRA NOTE AT 64-109. 31. ID. AT 7.
16
sold by the integrated (i.e., refiner-owned) and independent wholesalers to an independent retail
sector and directly to large industrial users.
Oil Prices
Crude oil prices fell sharply in real terms during the formative years of Standard Oil and
continued their decline until 1892.32 For the rest of the 1890s, the real price of crude rose as
production growth slowed. However, from 1900 until 1911, real prices fell once again in
response to the sharp increase in production from the newly developed Mid-Continent, Gulf, and
California fields (See Figure A-2). During this period Standard oil was scrambling to build new
refineries in order to compete with companies such as Sun Oil, Gulf Oil, and the Texas
Company. As it expanded its refinery output and distribution, it would reduce prices selectively
to compete with the non-Standard Oil companies. In response, Standard’s competitors—
including the smaller local refineries—pressed a number of states to pass “anti-discrimination”
laws preventing any company from reducing its prices in one part of the state without reducing
them everywhere.
Perhaps as a result of these anti-discrimination laws, the price of refined products—as
measured by the Wholesale Price Index (WPI) for “Fuel & Lighting”—did not decline with the
sharp decline in crude-oil prices between 1900 and 1910 (See Figure A-2). The widening gap
between crude prices and refined products prices was an issue in a series of legal actions against
the Standard Oil trust that were to culminate in the Sherman Act case that was brought in 1906.
One of the reasons for this gap, however, was the shift towards gasoline at a time when refinery
output of gasoline was constrained by technology.
32.U.S. Bureau of the Census, Historical United States, Colonial Times to 1970, Bicentennial Edition 593-94 (U.S. DEPARTMENT OF COMMERCE 1975).

17
FIGURE A-2
REAL U.S. Oil Prices, 1870-1925
Note: The Wholesale Price Index for Fuel & Lighting and the Real Price of Crude Oil are deflated by the
Consumer Price Index for all urban consumers. Sources: U.S. BUREAU OF THE CENSUS, HISTORICAL STATISTICS OF THE UNITED STATES, COLONIAL
TIMES TO 1970, BICENTENNIAL EDITION 200, 593-594 (U.S. Department of Commerce, 1975); and the
Bureau of Labor Statistics internet site (http://www.bls.gov/).
The price spread between gasoline and kerosene prices widened from 3.9 cents in 1909 to
a peak of 17 cents in 1917. During this period, the price of kerosene was relatively stable,
declining from 9.5 cents per gallon to 6 cents per gallon between 1909 and 1911 then returning
to 9 cents per gallon for virtually all of the 1913-17 period. By contrast, gasoline prices nearly
doubled between 1909 and 1917, rising from 13.4 cents per gallon to 26 cents per gallon.33
During this period the domestic demand for gasoline was increasing rapidly due to the increase
0
2
4
6
8
10
12
14
1870
1872
1874
1876
1878
1880
1882
1884
1886
1888
1890
1892
1894
1896
1898
1900
1902
1904
1906
1908
1910
1912
1914
1916
1918
1920
1922
1924
Rea
l 196
7 $/
bbl
50
100
150
200
250
300
WP
I (1
926=
100)
TEXAS, OKLAHOMA
BEGIN
STANDARD OIL
DIVESTITURE
REAL PRICE
OF CRUDE
WPI-FUEL
& LIGHTING

18
in the number of motor vehicles in use, but the demand for kerosene—used largely for
illumination—was rising much more modestly. With constraints on the proportion of refined
output that could be produced as gasoline, this increase in the demand for gasoline relative to the
demand for other products placed upward pressure on gasoline prices relative to the prices of
other refined products, such as kerosene. In addition, the onset of World War I led to a sharp
increase in gasoline exports while kerosene exports declined. As a result, the spread between real
gasoline prices rose dramatically in the 1914-17 period (See Figure A-3).
FIGURE A-3 REAL PETROLEUM PRICES, 1899-1925
Note: Gasoline and kerosene prices are deflated by the Consumer Price Index for all urban consumers.
Crude oil prices are deflated by the GNP deflator.
Sources: WILLIAMSON, ET AL., supra note 172, 457; U.S. BUREAU OF THE CENSUS, HISTORICAL
STATISTICS OF THE UNITED STATES, COLONIAL TIMES TO 1970, BICENTENNIAL EDITION 224, 593-594
(U.S. Department of Commerce, 1975); Bureau of Labor Statistics internet site (http://www.bls.gov/).
33.Williamson, et al., SUPRA NOTE AT 172.
0
5
10
15
20
25
30
35
1899
1901
1903
1905
1907
1909
1911
1913
1915
1917
1919
1921
1923
1925
Rea
l Pri
ce (
1967
$/b
bl)
GASOLINE
KEROSENE
CRUDE OIL
19
The Antitrust Case and Its Antecedents
Complaints about Standard Oil’s business practices took a number of forms. First, it was
alleged that Standard Oil used ruthless practices in negotiating transportation contracts with
railroads through its South Improvement Company and later in denying independents access to
its own pipelines. Second, Standard Oil was alleged to have used selective predatory price cuts to
drive rivals from the market.34 Third, public authorities and the public in general feared that
Standard Oil’s secretive organization—the Standard Oil “Trust”—gave it unspecified market
power. Finally, it was alleged that Standard Oil used its trust form of organization to effect a
price-fixing conspiracy, complete with profit “pools.”35
The lower court ruled that Standard had violated Sections 1 and 2 of the Sherman Act by
engaging in a massive restraint of trade through the Standard Oil Trust and monopolizing
interstate commerce in petroleum products.36 The lower court decision was handed down in St.
Louis on November 20, 1909 and was upheld in a landmark decision by the Supreme Court on
May 15, 1911 with Justice White writing the opinion.37 At the time of the trial, the Standard
companies controlled 72 percent of Appalachian crude oil supplies, 95 percent of the Ohio-
Indiana supply, and 100 percent of the Illinois supply. However, they only controlled between 10
and 45 percent of the Mid-Continent, 10 percent of Gulf Coast, and 29 percent of California
supplies, that collectively accounted for two-thirds of U.S. supply by the time Chief Justice
White penned his opinion. In the first twelve years of the 20th century, Standard’s share of
refinery capacity fell from 82 percent to 64 percent of the U.S. capacity.38
Standard’s shares of the refined products market, while substantial, were also in decline
before the antitrust case was finally decided. Its share of the kerosene market had fallen from 85
percent to 75 percent from 1899 to 1906-11, but kerosene demand was growing very slowly. In
the more rapidly growing fuel-oil and gasoline markets, Standard’s average shares were lower
34.JOHN S. MCGEE, PREDATORY PRICE CUTTING: THE STANDARD OIL (N.J.) CASE, 1 J.L & Econ. 137 (1958). (PROVIDES A COGENT ARGUMENT THAT STANDARD DID NOT ATTAIN ITS MARKET POSITION THROUGH PREDATORY
PRICES, BUT RATHER IT SIMPLY ACQUIRED RIVALS IN LARGE NUMBERS. MCGEE DOES NOT DISPUTE, HOWEVER, THAT
STANDARD MAY HAVE USED EXCLUSIONARY PRACTICES WITH RESPECT TO ITS TRANSPORTATION FACILITIES.) 35.IT IS NOT CLEAR WHY SUCH “PROFIT POOLS” WERE VIEWED WITH SUCH HOSTILITY IF THEY WERE INDEED SIMPLY
THE POOLING OF PROFITS WITHIN A SINGLE ENTITY—THE STANDARD OIL TRUST. 36.UNITED STATES V. STANDARD OIL, 173 F. 177 (1909). 37.STANDARD OIL CO. OF NEW JERSEY V. UNITED STATES 221 U.S. 1 (1911). 38.ALL OF THESE DATA ARE FROM Williamson, et al., SUPRA NOTE AT 7.

20
and also falling. By 1906-11, its share of fuel oil sales had declined to just 31 percent from a
level of 85 percent in 1899. In gasoline, Standard accounted for 66 percent of sales in 1906-11,
down from 85 percent in 1899.39
The lower court and the Supreme Court found that Standard’s aggressive behavior in
transporting oil and pricing refined products constituted sufficient evidence of a willful strategy
to monopolize the country’s petroleum industry. But they also found that the manner in which
Standard reconstituted its Trust in New Jersey, after an Ohio court had invalidated the earlier
Ohio trust, to be particularly offensive. Clearly, the federal Circuit court and the Supreme Court
saw the New Jersey Trust as a set of potentially competing companies that had been brought
together for the purpose of a combination in restraint of trade.
The decree that was issued to provide relief from Standard’s violation of the Sherman Act
was rather simple in design. It simply required that the New Jersey Trust be dissolved and that
the stock in each of the constituent companies be spun off to Standard’s stockholders. As a
result, 38 separate companies were established as independent entities, albeit with common
ownership because each had stockholders in common with the others. However, the Court was
explicit that no single entity was to control these companies henceforth. The company
complained that the dissolution created a set of uneconomic companies, many of which had
insufficient upstream or downstream integration to compete successfully, and that the pipeline
companies would be deprived of the essential network economies for which they were mutually
designed. Its complaints were rejected by the court.
The Effect of the Dissolution
As we have seen, the Standard companies were already losing market share before the
dissolution of the Trust in 1911. Indeed, two prominent students of the industry remarked that:
“Even more important than the dissolution of the Standard Oil Trust in altering the structure of the industry after 1911 was the violent transformation and expansion in demand, with skyrocketing sales of automobiles, and the
39.ID.
21
corresponding vast increase in supply, marked by alternating periods of threatening shortage and dramatic new discoveries.”40
Had the market grown more slowly and oil production been limited to Appalachia and the
Middle West, Standard might have held on to its dominant position. But the enormous
discoveries of oil in Oklahoma, Texas, and California and the rapid shift to gasoline from other
refined products after 1910 would have made it difficult for the Standard Trust to maintain its
position even without the dissolution mandated by the court.
To estimate the effect of the dissolution on the output and price of crude-oil in the U.S., I
estimated two reduced-form regression equations in which the exogenous variables are real GNP,
total U.S. automobile registrations, total U.S. electricity production, two time trends for the period
prior to 1901 and the period thereafter, and a dummy variable equal to zero prior to 1912 and one
thereafter to capture any effects of the decree.41 These variables capture the effects of aggregate
demand and other influences on the demand for petroleum as well as the supply shift that occurred
just after the turn of the century due to the opening up of the new western fields. The period of
estimation is 1889-1917, a period that includes the era before the antitrust case and six years after
the decree. The results are exhibited in Table A-1 for both the entire period and for 1900-1917, a
shorter period for which data on all variables are available. 42
40.Melvyn G. DeChazeau & Alfred E. Kahn, Integration and Competition in the Petroleum Industry 87 (YALE
UNIVERSITY PRESS 1959). 41.All prices are deflated by the GNP deflator (1958=100). Data for crude oil production and prices are available in U.S. Bureau of the Census, Historical Statistics of the United States, Colonial Times to 1970, Bicentennial Edition 593 (U.S. Department of Commerce 1975). Crude oil production is in thousand barrel units. Crude oil prices per barrel are in units of 1958 dollars. Real GNP and the GNP deflator are available from the Historical Statistics of the United States at 224. Real GNP is in billion 1958 dollars. Automobile registrations are in thousand units and are available from the Historical Statistics of the United States at 716. Electricity production is in units of million kilowatt-hours and is available from the Historical Statistics of the United States at 821. Missing values for electricity production were interpolated by fitting a power function to the existing data points from 1902 to 1934.

22
TABLE A-1
THE DETERMINANTS OF U.S. CRUDE-OIL PRODUCTION AND PRICE, 1889-1917 (T-STATISTICS IN PARENTHESES)
Dependent
Variable
Time
Period Constant
Time
Trend
(89-00)
Time
Trend
(01-17)
Real
GNP
Automobile
Registrat-
ions
Electricity
Production
Dissolution
Dummy
(1912-
1917=1)
R2
U.S.
Production
1889-
1917
67270
(4.34)
656.6
(0.71)
9590
(4.25)
-407.6
(-1.27)
3.4779
(4.36)
-11485
(-1.79) 0.995
U.S.
Production
1900-
1917
75418
(2.72)
12350
(2.68)
-464.8
(-1.30)
1.4711
(0.21)
2.3464
(0.90)
-12668
(-1.85) 0.994
Real U.S.
Crude Oil
Price
1889-
1917
1.9874
(1.45)
0.1248
(1.54)
-0.5636
(-2.83)
0.007368
(0.26)
0.000197
(2.80)
0.4975
(0.88) 0.560
Real U.S.
Crude Oil
Price
1900-
1917
2.465
(1.52)
-0.7986
(-2.97)
0.0208
(1.00)
-0.000206
(-0.50)
0.000300
(1.97)
0.4492
(1.13) 0.756
Note: For each of the four regressions, standard tests for the presence of heteroscedasticity or
autocorrelation were conducted. In each case, there was no evidence of these problems at standard confidence levels.
These results generally confirm the effect of new discoveries after 1900, but do not
suggest any influence of automobile registrations in the period through 1917. The coefficients for
the dummy variable for the period following the dissolution of Standard Oil are not statistically
significant, particularly in the price equations. The oil production estimates suggest a perverse
effect of the decree—the coefficient for the 1912+ dummy variable is marginally significant and
negative in the total production equation, suggesting that output fell after the dissolution.43 Thus,
the most conservative interpretation of these results is that the dissolution had at best no effect.
Indeed, it appears that the stock market had discounted these possibilities in advance.
Despite the apparently drastic remedy of total dissolution of the company, the price of the
equities of Standard Oil of New Jersey and its successor companies rebounded in 1911 after the
42.A similar analysis of the determinants of gasoline and kerosene prices would have been informative, but annual data on these prices are not available for the requisite time period. 43.These coefficients are statistically significant when electricity capacity is substituted for electricity production in these two equations.
23
Supreme Court decision and soared in 1912. Burns has found that this rebound was greater than
the decline in the value of Standard’s stock in 1906 when the government’s complaint was
announced.44 Burns suggests that this was the result of the recognition by the market of the
“benign” nature of decree.45 An alternative explanation is that the decree could not reduce
Standard’s market power in the growing geographical markets where it had none.
I have confirmed Burns' basic results using monthly data on the returns to holding
Standard Oil (NJ) common stock and on the Dow Jones Average rather than the Cowles Index
for stock prices in the standard Capital Asset Pricing Model.46 I find that the announcement of
the antitrust suit initially depressed Standard's equity price—i.e., created a negative excess
return—by 10.9 percent in the month it was announced, but the stock recovered somewhat in the
ensuing months. Five months after the announcement of the suit, the cumulative negative excess
return had been reduced to 5.8 percent (See Table A-2). In the month that the trial court's
decision was announced, November 1909, Standard shareholders once again suffered a negative
excess return of 3.8 percent, but this entire loss was recovered within the next five months.
Finally, the Supreme Court decision of May 1911 reduced shareholder excess returns by
about 4 percent through August 1911, the last month in which the old Standard company
remained intact. If one uses a six-month “window” after each of these three events (except for
the Supreme Court decision) to assess the stock market's reaction to antitrust developments, the
overall effect on shareholders is only an 8 percent negative excess return. Over the entire period
from November 1906 to the end of the old Standard Oil in August 1911, however, the
cumulative excess returns from the capital-asset pricing model are very large and positive.
Overall, these results confirm that investors did not expect the adverse antitrust ruling to have
negative repercussions for Standard Oil shareholders.
44.Malcolm R. Burns, The Comparative Effects from Trust Busting: A Portfolio Analysis, 85 J. Pol. Econ. 717-39 (1977). 45.Id. 46.In this analysis and those reported below for the other cases, I estimate a standard capital-asset pricing model of the form rit = α + �R t + uit where rit is the return to stockholders of the ith company’s equity (capital gains plus dividends divided by the value of the common equity at the beginning of the period) in period t, Rt is the return to the entire market (Dow Jones Average) in period t, and uit is a random error term. The CAP model is estimated for the period prior to the filing of the case, and the estimate of � from this regression is used to generate predicted values of r for the event windows in the case. The residuals are simply the actual return less the predicted return.

24
TABLE A-2
THE EXCESS RETURNS TO STOCKHOLDERS OF STANDARD OIL (NJ) DURING MAJOR ANTITRUST EVENTS, 1906-11
Event
Excess Return in Same
Month
Cumulative Excess Returns
Over Six Months
Antitrust Case Filed
(November 1906) -10.9% -5.8%
Lower Court Decision and
Decree (November 1909) -3.8% +1.6%
Supreme Court Decision
(May 1911) -2.0% -4.1%*
* Cumulative return for only four months of available data for old equity shares of Standard Oil (NJ).
The decree established ten separate refining companies, but these companies were
separated by substantial distances and were unlikely to begin competing against each other very
soon after the decree. All were simply set free with the assets that they had at the time. For
instance, some, such as Standard of California and Standard of New Jersey, had extensive
pipeline and marketing facilities. Others, such as Standard of Kansas, had none. Ohio Oil and
Prairie Oil and Gas were crude oil producers with pipelines, but South Penn Oil was left as a
crude oil producer without pipelines.47 In short, the post-dissolution structure of the industry was
largely an accident of Standard’s pre-1911 corporate organization.
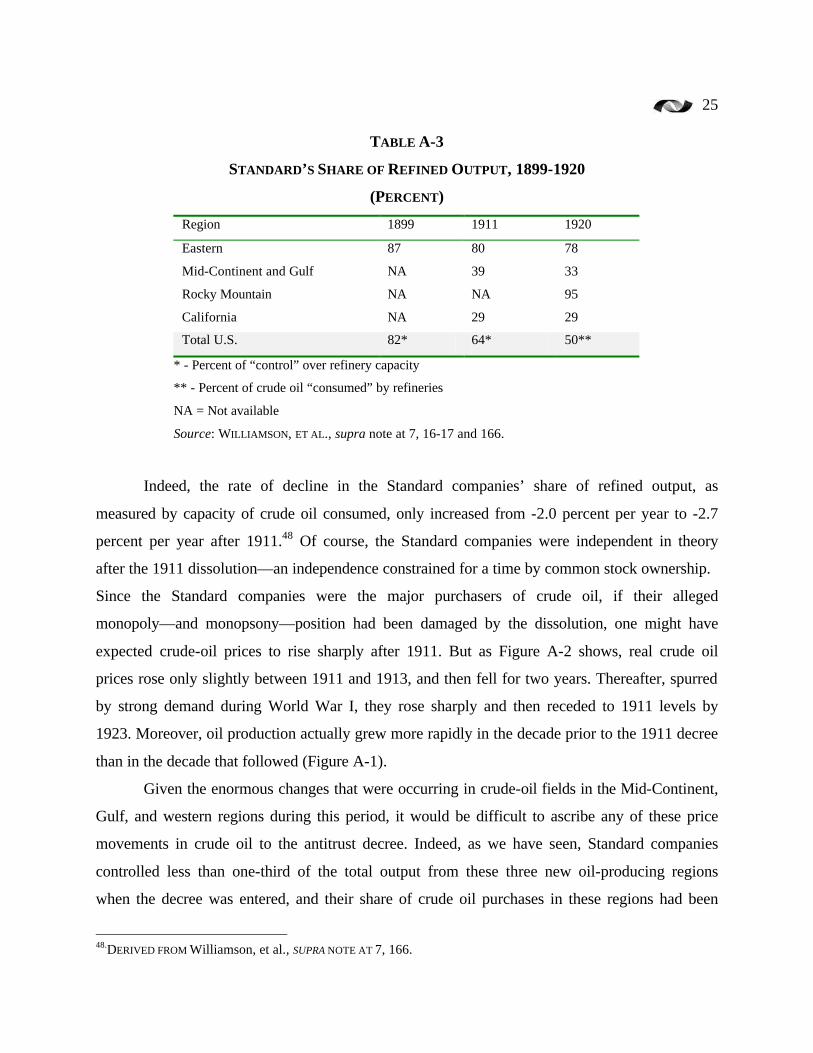
The erstwhile Standard companies’ share of output of refined products continued to fall
after the decree, but the decline was simply an extension of the 1899-1911 trend (See Table A-3).
47.Williamson, et al., SUPRA NOTE AT 12-13.
25
TABLE A-3
STANDARD’S SHARE OF REFINED OUTPUT, 1899-1920
(PERCENT)
Region 1899 1911 1920
Eastern 87 80 78
Mid-Continent and Gulf NA 39 33
Rocky Mountain NA NA 95
California NA 29 29
Total U.S. 82* 64* 50**
* - Percent of “control” over refinery capacity
** - Percent of crude oil “consumed” by refineries
NA = Not available
Source: WILLIAMSON, ET AL., supra note at 7, 16-17 and 166.
Indeed, the rate of decline in the Standard companies’ share of refined output, as
measured by capacity of crude oil consumed, only increased from -2.0 percent per year to -2.7
percent per year after 1911.48 Of course, the Standard companies were independent in theory
after the 1911 dissolution—an independence constrained for a time by common stock ownership.
Since the Standard companies were the major purchasers of crude oil, if their alleged
monopoly—and monopsony—position had been damaged by the dissolution, one might have
expected crude-oil prices to rise sharply after 1911. But as Figure A-2 shows, real crude oil
prices rose only slightly between 1911 and 1913, and then fell for two years. Thereafter, spurred
by strong demand during World War I, they rose sharply and then receded to 1911 levels by
1923. Moreover, oil production actually grew more rapidly in the decade prior to the 1911 decree
than in the decade that followed (Figure A-1).
Given the enormous changes that were occurring in crude-oil fields in the Mid-Continent,
Gulf, and western regions during this period, it would be difficult to ascribe any of these price
movements in crude oil to the antitrust decree. Indeed, as we have seen, Standard companies
controlled less than one-third of the total output from these three new oil-producing regions
when the decree was entered, and their share of crude oil purchases in these regions had been
48.DERIVED FROM Williamson, et al., SUPRA NOTE AT 7, 166.

26
falling. The regions in which the Standard companies continued to be dominant accounted for
just 12.7 percent of oil production by 1919. It is difficult to see how separating the various
Standard pipeline or refining-pipeline companies from each other would have increased
competition for crude materially in the newer oil-producing regions if there was already
aggressive competition from large, well-capitalized independents such as Gulf Oil, Union Oil,
the Texas Company, Sun Oil, Phillips, and Cities Service.49 It is also not likely that new entrants
after 1911, such Shell and the Santa Fe Railroad, would have been dissuaded from such entry if
the antitrust suit had not been decided against Standard Oil.
Nor is there evidence that the dissolution of the Standard Oil Trust had any effect on
refined product prices. Figure A-3 shows that real kerosene prices rose slightly after the decree—
particularly during the first few years of World War I—but then receded to their 1911-12 levels.
Gasoline prices, on the other hand, had been declining slightly prior to 1911, but then soared
with rising domestic and export demand during World War I. Technological change in refining
processes eventually narrowed the gap between kerosene and gasoline prices, but the gap
remained above its 1911 level until the 1920s.
Concluding Assessment
The oil industry was becoming much more competitive throughout the first few years of
the 20th century—as the Standard Oil case was being litigated—in large part because new
entrants in the Midwest, Gulf Coast, and California were successful in obtaining a large share of
refinery output and sales. Standard may have engaged successfully in exclusionary tactics in the
East in the early years of the industry, but it was not successful in extending these practices
westward. There is simply no evidence that the Standard Oil decree, which created 38 quasi-
independent companies by dissolving the Standard Oil Trust—had much effect on output or
prices in the U.S. oil industry.
Whatever the merits of the government’s case for the pre-1900 industry, it appears that
the case had already been mooted by competitive developments in the early 1900s. As with the
49.One historian, Joseph A. Pratt, advances the theory that it was Texas antitrust law that prevented Standard from expanding its market power into the Gulf area. (The Petroleum Industry in Transition: Antitrust and the Decline of Monopoly Control of Oil, 40 J. Econ. History 815-837 (1980). I do not address his theory in this paper because it is not germane to my inquiry into the effects of federal

27
IBM case, brought more than 60 years later, the Standard Oil litigation involved allegations of
monopoly abuses whose effects were surely being overtaken by rapidly-changing market
conditions. The decree might have worked to restore competition prior to 1900, but by 1911 the
oil industry was very different and the decree was not needed.
American Tobacco
Like Standard Oil, the American Tobacco Company was organized as a Trust. It was first
incorporated in 1890, and by 1909 the Trust had grown to include 86 different companies
conducting business in the United States, Cuba, and Puerto Rico and 33 others operating in other
parts of the world.50
Market Position
The company assumed a dominant position in the production of all U.S. tobacco products
other than cigars, accounting for between 76 percent and 96 percent of the output of such
products as plug tobacco, smoking tobacco, snuff, and cigarettes in 1910 (See Table B-1).
TABLE B-1
AMERICAN TOBACCO’S SHARE OF U.S. OUTPUT, 1910 (PERCENT)
Product American Tobacco Trust Share
Cigarettes 86.1
Plug 84.9
Smoking 76.2
Fine Cut 79.7
Snuff 96.5
Little cigars 91.4
Cigars 14.4
Source: RICHARD B. TENNANT, THE AMERICAN CIGARETTE INDUSTRY:
A STUDY IN ECONOMIC ANALYSIS AND PUBLIC POLICY 27 (Yale
University Press 1950).
antitrust actions. However, Pratt does not explain how Texas antitrust law could have affected Standard’s behavior in other Gulf, Mid-Continent, and western states.
28
This market position was obtained through acquisitions of firms such as the Union Tobacco
Company and the Continental Tobacco Company and an extremely aggressive pricing behavior,
allegedly including sales at prices below manufacturing costs.51
Between 1890 and 1910, U.S. production of cigarettes increased fourfold, from
approximately 2.5 billion to 10 billion cigarettes. Although it lost market share to new “Turkish”
brands of cigarettes in the early 1900s, the American Tobacco Trust’s share of domestic output
recovered to approximately 85 percent by 1910. Throughout this period, its overall rate of return
on tangible assets varied substantially, declining from about 54 percent in 1890 to only 16
percent in 1899, but rising thereafter to more than 35 percent in 1903.52
The Antitrust Suit
The American Tobacco Trust was challenged in numerous state antitrust actions in the
1890s, but the Trust generally prevailed in these actions. The 1904 Northern Securities53
decision forced a reorganization of the Tobacco Trust, but it was not until 1908 that the
government filed its major Sherman Act case against the tobacco producers, seeking to dissolve
the trust entirely. This case was decided in favor of the government, and an injunction was
entered against American Tobacco that barred it from continuing to operate in interstate
commerce until the conditions that existed prior to the formation of the Trust were restored.54
The Supreme Court found this remedy too drastic, ordering instead that the lower court hold
hearings to determine a “plan or method for dissolving the combination.”55
The lower court subsequently approved a dissolution of the Trust that divided cigarette
production into three separate parts. American kept assets that accounted for approximately 37
percent of cigarette production, P. Lorillard had 15 percent, and a new company, Liggett and
Myers , was provided with the assets to produce brands that accounted for 28 percent of cigarette
output.56 There were similar divisions of assets devoted to plug, smoking tobacco, and cigars.
50.Richard B. Tennant, The American Cigarette Industry: A Study in Economic Analysis and Public Policy 27 (YALE
UNIVERSITY PRESS 1950). 51.Tennant, SUPRA NOTE AT 28-29. 52.Tennant, SUPRA NOTE AT 28-29. 53.Northern Securities v. United States, 193 U.S. 197 (1904). 54.United States v. American Tobacco, 164 F. 700 (1908). 55.United States v. American Tobacco, 221 U.S. 106 (1911). 56.Tennant, SUPRA NOTE AT 61.

29
Various restrictive covenants provided by firms and individuals that had sold out to the Trust
were declared invalid.
While individual stockholders’ control of the voting rights in the new companies were
reduced somewhat, the large stockholders continued to hold important positions in all three of
the major companies that emerged from the decree. This continued ownership by the former
owners of the Trust was very controversial at the time of dissolution, as was the three-firm
oligopoly structure that was established by the decree. The lower court rejected any objections
based on these concerns, asserting that it was a court of law, not a commerce commission.57
The Effect of the Decree
The dissolution of the American Tobacco Trust occurred very quickly. The court’s decree
was entered in November 1911, and the changes were to be effected by February 1912.
According to Tennant, the immediate practical effect of this restructuring of the tobacco industry
was to unleash a battle for market share, carried out largely through advertising.58 The three-firm
oligopoly did not engage in vigorous price competition. With the incredibly successful
introduction of the Camel brand, Reynolds became the industry’s price leader.
Cigarette prices were essentially stable in the 1909-13 period (See Table B-2). The
average real price of the “domestic and blended brands” that accounted for the overwhelming
share of sales fell between 1909 and 1910 but then rose after the imposition of the decree.59 The
real price of the “Turkish” brands feel between 1909 and 1910 and continued to fall, albeit at a
somewhat reduced rate, after the decree. Thus, one can hardly conclude that the immediate
effects of divestiture were to reduce cigarette prices to consumers. Thereafter, cigarette prices
became somewhat more volatile as Reynolds introduced and began promoting Camel (See
Figure B-1). Wholesale prices rose much more rapidly in the 1917-20 period in response to
increases in tobacco excise taxes.60 Throughout this period, the industry avoided price
competition and the price wars that had accompanied the ascendancy of the American Tobacco
Trust.
57.United States v. American Tobacco, 191 F. 371 (1911), as quoted in Tennant, supra note at 65. 58.Tennant, supra note at 70. 59.Tennant, SUPRA NOTE AT 71, TABLE 12. 60.Tennant, SUPRA NOTE AT 85.

30
TABLE B-2
CIGARETTE PRICES, 1909-13 ($/1000)
Year Domestic & Blended
(Nominal Price)
Domestic & Blended
(Real Price)
Turkish
(Nominal Price)
Turkish
(Real Price)
1909 2.36 26.22 6.93 76.84
1910 2.41 25.74 6.93 74.12
1912 2.67 27.56 7.17 74.04
1913 2.81 28.30 6.92 69.71
Note: Prices deflated by Consumer Price Index
Source: Derived from TENNANT, supra note at 71, Table 12.
Had prices fallen after the decree, one would have expected the value of the industry’s
output to fall relative to GNP because cigarette demand is price inelastic. But the share of cigar,
cigarettes, and tobacco fell only slightly—from 1.29 percent in1911 of GNP to 1.20 percent in
1912 and then fluctuated between 1.04 and 1.30 for the next eight years.61 The higher advertising
expenses eroded cigarette producer profits per cigarette sold in the early post-decree period.
However, the return on assets remained high throughout the next 15 years. Absent price
competition, the three-firm oligopoly was able to maintain its profitability despite the dissolution
of the Trust. Indeed, Tennant calculated that operating profits averaged 17.5 percent on tangible
net worth between 1912 and 1949 for the four major companies, about the same profit rate as
that earned by the Trust in 1898-1908.62
Nor is there evidence that the dissolution of American Tobacco affected the price paid to
farmers for tobacco. The price of tobacco averaged 9.8 cents per pound in 1906-10 and 10.3
cents in 1911-15.63 This increase of 5 percent was less than the average rate of inflation in
consumer prices during the period.64
61.U.S. Bureau of the Census, Historical Statistics of the United States, Colonial Times to 1970, Bicentennial Edition 224, 699 (U.S. DEPARTMENT OF COMMERCE 1975). 62.Tennant, supra note at 96, 346. 63.U.S. Bureau of the Census, Historical Statistics of the United States, Colonial Times to 1970, Bicentennial Edition
517 (U.S. DEPARTMENT OF COMMERCE 1975). 64.ID. AT 211.

31
FIGURE B-1
NET REAL PRICE TO MANUFACTURER (DOLLARS PER 1000)
CHESTERFIELD AND CAMEL CIGARETTES
Notes: Prices are deflated by the Consumer Price Index (1982-1984=100). Monthly CPI was used
except for 1912, where annual CPI was used.
Source: William Nicholls, PRICE POLICIES IN THE CIGARETTE INDUSTRY, at 46-47; Bureau of Labor
Statistics website; HISTORICAL STATISTICS OF THE UNITED STATES BICENTENNIAL EDITION, at 210-
211.
Given these results, it is hardly surprising that the returns to stockholders were largely
unimpaired by the dissolution of the Trust. The capital markets anticipated the rather sanguine
impacts of the decree as the prices of American Tobacco stocks and bonds recovered in late 1911
and 1912 from their earlier declines that had resulted from the filing of the suit in 1907 and the
Supreme Court’s June 1911 decision. Using the capital-asset pricing model, Burns finds that the
excess returns that were generated by the announcement of the dissolution plan and the
subsequent declaration of dividends and interest by the successor companies essentially wiped
0
5
10
15
20
25
30
Apr1912
Oct1912
Apr1913
Oct1913
Apr1914
Oct1914
Apr1915
Oct1915
Apr1916
Oct1916
Apr1917
Oct1917
Apr1918
Oct1918
Apr1919
Oct1919
Rea
l $ p
er 1
,000
Cig
aret
tes
CHESTERFIELD
CAMEL

32
out the negative excess returns caused by the adverse news from the suit’s filing and the
Supreme Court decision.65
Conclusion
One might argue that the creation of a three-firm oligopoly to replace the old American
Tobacco trust had some beneficial effects on cigarette prices, but the limited data available
suggest that real cigarette prices were little affected by the decree in the first two years. In fact,
immediately after the 1911 decree real prices actually rose. The principal effect of the decree
appears to have been the development of oligopolistic rivalry that diverted substantial resources
to advertising while having little effect on cigarette prices. Thus, it is difficult to conclude that
the decree improved consumer welfare. The stability of the industry’s profit rate and the absence
of any decided break in prices after 1911 inevitably leads one to the conclusion that this major
Section 2 case contributed very little to developing meaningful competition in this industry.
Alcoa
The manufacture of aluminum consists of four distinct phases: (1) the mining of
aluminum ore, usually bauxite, (2) the refining of the aluminum ore to extract alumina
(aluminum oxide), (3) the reduction of alumina into aluminum ingot, and (4) the fabrication of
the ingot into mill products like sheet, tube, and wire. Vertically integrated producers of primary
aluminum generally produce their own alumina and refine it into aluminum. The fabrication
process, however, has always consisted of a mix of independents and integrated producers.
Early History
The aluminum industry was born in the 1880’s when America’s Charles M. Hall and
France’s Paul L.T. Héroult separately developed patents for a cheap electrolytic process of
reducing aluminum from alumina. Hall’s patent application won over Héroult’s in the United
States due to Héroult’s failure to file a “Preliminary Statement” with the U.S. Patent Office. 66
65.MALCOLM R. BURNS, AN EMPIRICAL ANALYSIS OF STOCKHOLDER INJURY UNDER #2 OF THE SHERMAN ACT, 31 J. Indus. Econ. 333 (1983). 66.THIS DESCRIPTION OF THE EARLY ALUMINUM INDUSTRY IS DERIVED MAINLY FROM Merton J. Peck, Competition in the Aluminum Industry 1945-1958 (HARVARD UNIVERSITY PRESS 1961); Simon Whitney, Antitrust Policies: American Experience in Twenty Industries, VOLUME II (THE TWENTIETH CENTURY FUND 1958); AND Margaret B.W. Graham & Bettye H. Pruitt, R&D for Industry: A Century of Technical Innovation at Alcoa (CAMBRIDGE UNIVERSITY PRESS 1990).

33
The Pittsburgh Reduction Company (PRC) was formed in 1888 to apply Hall’s patent, and soon
faced legal challenges from Alfred and Eugene Cowles, who also used Hall’s process to make
pure aluminum. The Cowles brothers had secured rights to a patent by Charles Bradley for
internal heating of the electrolytic bath, which the PRC used in its aluminum production process.
The PRC and the Cowles brothers sued and counter-sued each other for patent infringement, and
separate decisions upheld the claims of both sides. With neither party able to produce aluminum
without the patent of the other, the PRC and Cowles brothers came to an agreement. PRC paid
for a license to use the Bradley patent, and the Cowleses agreed not to reenter the aluminum
production business.
This settlement allowed PRC to extend its exclusive rights to aluminum production to
1909 (the Bradley patent had been granted three years after the Hall patent). When the patent
expired in 1909, the economy had entered a recession, and entry into aluminum production
proved difficult for would-be competitors. PRC changed its name to Aluminum Company of
America (“Alcoa”) in 1907, and by 1909 it had already integrated backwards into ore and
electricity production and had begun “to roll sheet and fabricate sundry articles.”67
The aluminum market was very small until World War II. United States primary
aluminum output peaked at 65,000 tons per year during World War I and did not exceed 200,000
tons until 1940.68 By contrast U.S. steel production peaked at 50 million tons in World War I and
was only marginally higher in 1940, rising to 67 million tons69 (See Figure C-1). The small size
of the aluminum market prior to World War II made entry very difficult because of economies of
scale in alumina production. Through the 1930s, Alcoa produced its entire output of alumina
from a single plant in East St. Louis. Germany had but one alumina plant; the French had three
or four; and the British one.70
67.Donald H. Wallace, Market Control in the Aluminum Industry 24 (HARVARD UNIVERSITY PRESS 1937). 68.U.S. Bureau of the Census, Historical Statistics of the United States, Colonial Times to 1970, Bicentennial Edition
605 (U.S. DEPARTMENT OF COMMERCE 1975). 69.ID. AT 695. 70.Wallace, SUPRA NOTE AT 194.
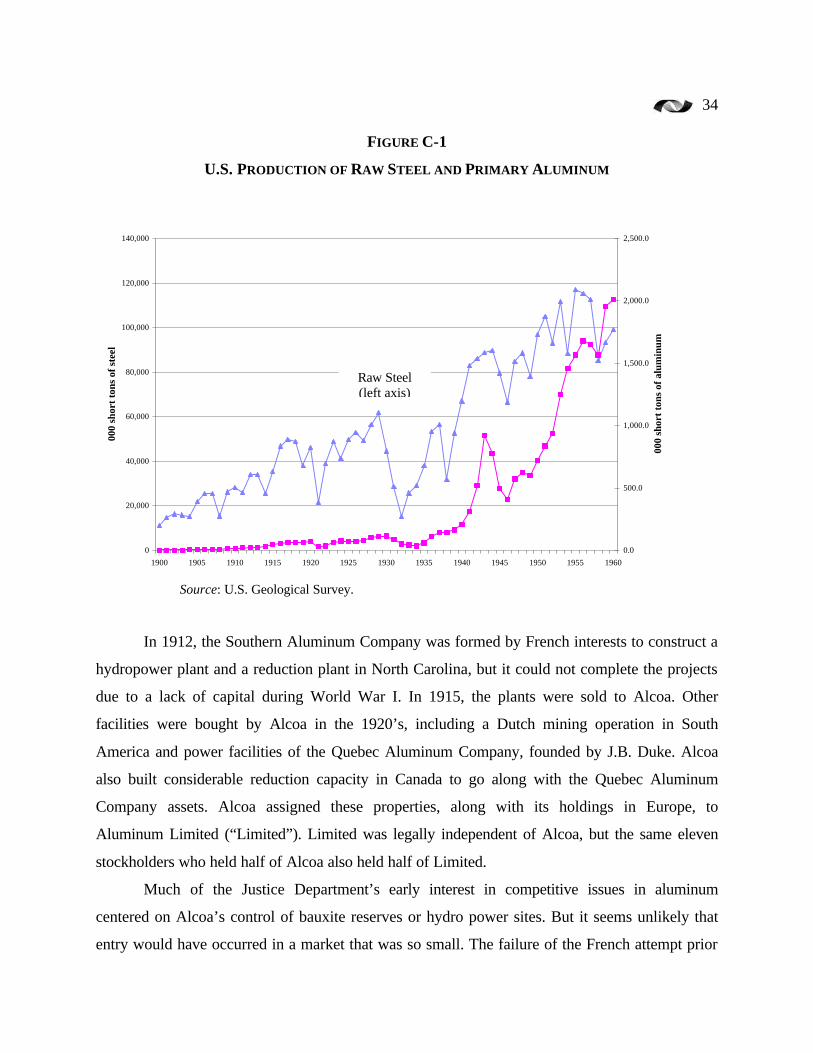
34
FIGURE C-1
U.S. PRODUCTION OF RAW STEEL AND PRIMARY ALUMINUM
Source: U.S. Geological Survey.
In 1912, the Southern Aluminum Company was formed by French interests to construct a
hydropower plant and a reduction plant in North Carolina, but it could not complete the projects
due to a lack of capital during World War I. In 1915, the plants were sold to Alcoa. Other
facilities were bought by Alcoa in the 1920’s, including a Dutch mining operation in South
America and power facilities of the Quebec Aluminum Company, founded by J.B. Duke. Alcoa
also built considerable reduction capacity in Canada to go along with the Quebec Aluminum
Company assets. Alcoa assigned these properties, along with its holdings in Europe, to
Aluminum Limited (“Limited”). Limited was legally independent of Alcoa, but the same eleven
stockholders who held half of Alcoa also held half of Limited.
Much of the Justice Department’s early interest in competitive issues in aluminum
centered on Alcoa’s control of bauxite reserves or hydro power sites. But it seems unlikely that
entry would have occurred in a market that was so small. The failure of the French attempt prior
0
20,000
40,000
60,000
80,000
100,000
120,000
140,000
1900 1905 1910 1915 1920 1925 1930 1935 1940 1945 1950 1955 1960
000
shor
t to
ns o
f st
eel
0.0
500.0
1,000.0
1,500.0
2,000.0
2,500.0
000
shor
t to
ns o
f al
umin
um
Raw Steel (left axis)

35
to World War I is often ascribed to poor timing, but it may not have succeeded anyway given the
economies of scale in alumina production and the small size of the market. In the Depression of
the 1930s, aluminum output fell to less than 40,000 tons per year. If the East St. Louis alumina
plant could supply Alcoa’s smelters when output was at 115,000 tons per year, its excess
capacity in the 1930’s would loom menacingly over any entrant’s nascent operation. Moreover,
Alcoa’s rate of return on invested capital between World War I and 1935 hardly suggested that a
bonanza awaited a successful entrant. According to Wallace, Alcoa’s average return over this
period was just over 6 percent after taxes.71
By the late 1930’s, Alcoa’s primary production and imports constituted 90 percent of the
total American supply, with the rest imported by others. This did not include “secondary”
aluminum, which was processed by independent smelters and competed with primary aluminum.
The 90 percent share included aluminum fabricated by Alcoa as well as ingot sold in the
market.72
The Antitrust Cases
In 1912, the Department of Justice charged Alcoa with restraining trade and
monopolizing the aluminum industry.73 Alcoa signed a consent decree through which it gave up
its interest in its Canadian subsidiary, dropped a contract with two chemical firms whose bauxite
it had purchased, agreed not to enter any collusive agreements or mergers, and agreed not to
discriminate against any competing fabricator in the sale of ingot. Neither of the two chemical
firms subsequently entered the business despite the advantages the consent decree gave them.
The Federal Trade Commission subsequently brought two suits against Alcoa. The
Cleveland Products Company had built a small rolling mill in 1915, but found it difficult to make
money due to the wartime price ceiling for sheet. Alcoa agreed to infuse money into the plant in
exchange for a controlling stock interest. The Commission challenged the stock purchase under
71.Wallace, SUPRA NOTE AT 226. 72.Whitney, SUPRA NOTE AT 90. 73.UNITED STATES V. ALUMINUM COMPANY OF AMERICA, EQ. 159 (W.D. PA. 1912), DECREE IN Decrees and Judgments in Federal Antitrust Cases 341-350 (U.S. DEPARTMENT OF JUSTICE 1918), AND IN WALLACE, MARKET
CONTROL IN THE ALUMINUM INDUSTRY, 547-555, AS CITED IN Simon N. Whitney, Antitrust Policies 86 (THE
TWENTIETH CENTURY FUND, INC. 1958).

36
Section 7 of the Clayton Act and was sustained by the Third Circuit Court of Appeals.74 Alcoa
sold its interest to the other stockholder, but Cleveland Products encountered severe financial
difficulties. When Alcoa bought the property at a sheriff’s sale, the Commission again objected,
but the Circuit Court overruled.75 In any case, obsolescence soon closed the mill.
In 1924, the Federal Trade Commission reported that its investigations had disclosed
violations of the 1912 consent decree.76 The Department of Justice produced a rebuttal in 1926
that cleared Alcoa.77 The Commission also charged Alcoa with delaying shipments of materials
to competitors and with price discrimination, but dismissed the charges in 1930.78
In 1937, three years after beginning an investigation of Alcoa, the Department of Justice
filed a Sherman Act civil suit, charging Alcoa with monopolizing the aluminum market and
restraining trade. District Judge Francis Caffey found Alcoa innocent of all charges, finding no
evidence of a current attempt to monopolize.79 He also rejected the government’s argument that
the power to fix prices and to exclude others from the market was monopolization.80 The
government appealed Judge Caffey’s decision to the Supreme Court, but so many justices had to
disqualify themselves because of their prior work in the Department of Justice against Alcoa that
a quorum of six could not be achieved. As a result, legislation was enacted to allow the three
senior judges of the Circuit Court of Appeals with territorial jurisdiction to serve as the ultimate
appellate court in such cases. Judge Learned Hand issued the decision of the Second Circuit
Court of Appeals in Alcoa in March 1945. He sustained Judge Caffey’s decisions on almost all
of the charges, but ruled that the power to exclude and the power to fix prices constituted
monopolization in violation of Section 2 of the Sherman Act.81 Alcoa was thus found guilty of
monopolizing the market for primary aluminum.
The Court’s ruling on the relevant product market generated substantial controversy.
Secondary aluminum, produced from aluminum scrap, was excluded from the relevant product
74.ALUMINUM COMPANY OF AMERICA, DOCKET 248, 3 FTC 302 (1921); ALUMINUM COMPANY OF AMERICA V. FTC, 284 FED. 401 (3D CIR. 1922), CERTIORARI DENIED 261 U.S. 616 (1923). 75.ALUMINUM COMPANY OF AMERICA V. FTC, 299 FED. 361 (3D CIR. 1924). 76.FEDERAL TRADE COMMISSION, KITCHEN FURNISHINGS AND DOMESTIC APPLIANCES, IN Report on House Furnishings Industry, VOL. 3, AT XXXII (1924). 77.ALUMINUM COMPANY OF AMERICA, S. DOC. 67, 69TH CONG., 1ST SESS. (1926). 78.ALUMINUM COMPANY OF AMERICA, DKT. 1335, 13 FTC 333 (1930). 79.UNITED STATES V. ALUMINUM COMPANY OF AMERICA, 44 F. SUPP. 97 (S.D. N.Y. 1942). 80.UNITED STATES V. ALUMINUM COMPANY OF AMERICA, 44 F. SUPP. 97, 152 (S.D. N.Y. 1942).

37
market because secondary aluminum could not be made without primary aluminum, whose
production was controlled by Alcoa. Even though secondary aluminum would not enter the
market for five to twenty-five years after its primary source was fabricated, Judge Hand
concluded that a company would account for the effect of secondary products when pricing the
primary product.82
While Alcoa had argued that its profits on primary aluminum sales were not extravagant,
Judge Hand ruled that the level of profits was irrelevant to the determination of monopolization
or price fixing. The Court also found that Alcoa had created a price squeeze on downstream
customers from 1925 to 1932 by selling some aluminum sheet at prices that were too close to the
price of primary aluminum ingot to allow independent fabricators to achieve adequate margins
on their sales of aluminum sheet. Judge Hand did not rest his opinion on this violation, but
prohibited this practice in the future. Neither Judge Caffey nor Wallace could provide a motive
for the price squeeze, but it was likely motivated by a desire to engage in price discrimination
without the fear of arbitrage.83
Postponement of Relief
Judge Hand ruled that major remedies be postponed until after the war because of
changes in the industry’s structure created by the war emergency. Due to the need for aluminum
in the national defense effort when the United States entered World War II, the government had
constructed plants for alumina reduction, aluminum smelting, and fabrication.84 By 1944, the
government plants accounted for approximately 50 percent of the domestic aluminum reduction
capacity. The Defense Plant Corporation, a subsidiary of the Reconstruction Finance Corporation
(RFC), owned these government plants. Alcoa, Reynolds Metals Company, and Olin
Corporation operated the government plants under management contracts. The Surplus Property
81.UNITED STATES V. ALUMINUM COMPANY OF AMERICA, 148 F.2D 416 (2D CIR. 1945). 82.A LIVELY LITERATURE DEVELOPED OVER THIS ISSUE. SEE DARIUS W. GASKINS, JR., ALCOA REVISITED: THE
WELFARE IMPLICATIONS OF A SECOND-HAND MARKET, 7 J. Econ. Theory 254-71 (1974); FRANKLIN M. FISHER, ALCOA
REVISITED: COMMENT, 9 J. Econ. Theory 357-59 (1974). 83.Whitney, SUPRA NOTE AT 93. 84.GERMANY HAD BECOME THE WORLD’S LARGEST PRODUCER OF ALUMINUM WHEN WORLD WAR II BEGAN IN 1939. BY ITSELF, ALCOA COULD NOT AFFORD TO SUFFICIENTLY EXPAND ITS OPERATIONS TO MEET THE EMERGENCY
DEMANDS OF THE ALLIED POWERS. SEE George David Smith, From Monopoly to Competition: The Transformation of Alcoa 1888-1986 191-92 (CAMBRIDGE UNIVERSITY PRESS 1988).

38
Act, passed a year before Judge Hand’s decision, directed the sale of these plants be effected in a
manner that was consistent with the development of competition. Therefore, although Alcoa had
leases on several wartime plants that were effective through 1947 and 1948, the RFC canceled
them on August 30, 1945.85
Since there were only two government alumina plants, there could only be two new
competitors to Alcoa in the primary aluminum market if the new firms were to be vertically
integrated. Given that Alcoa remained vertically integrated, the Surplus Property Board (SPB)
decided the new competitors should be as vertically integrated as Alcoa in order to compete on
an equal footing. The Board approached over 200 metals companies as possible purchasers of the
wartime plants, but only Reynolds Metals and Kaiser (then Permanente Metals Corporation)
were willing to assume the large financial outlays required to become vertically integrated
producers. With the exception of an extrusion plant and a smelter, which attracted no bidders and
were thus granted to Alcoa, all of the government’s wartime aluminum properties were assigned
to Reynolds and Kaiser in 1946, 1947, and 1948.86
From these government-owned assets, Reynolds received one of the two large alumina
plants, two smelters, two sheet mills, two extrusion plants, and one forge shop. Kaiser received
one of the two large alumina plants, two smelters, and one sheet mill. The government also
induced Alcoa to allow the new competitors to use its alumina patents, free of royalties,
conditional on a “grant-back” to Alcoa of any improvement patents obtained by the competitors.
Interestingly, had Judge Hand ordered the vertical dissolution of Alcoa in his ruling rather than
leaving the SPB to act without knowing the government’s final decision, the SPB might have
been able to sell its aluminum production facilities to more than a maximum of two companies.
Whether a vertically-fragmented industry structure would have survived or resulted in improved
market performance cannot be known although some economists criticized the court for
preventing such a result.87
85.Whitney, SUPRA NOTE AT 95. 86.Whitney, SUPRA NOTE AT 97-8. 87.Whitney, SUPRA NOTE AT 98 N.48.
39
The Final Decree
In 1947, Alcoa petitioned the court, asking for a ruling that it no longer monopolized the
market for primary aluminum. After the government moved to dismiss the petition, the District
Court was directed to find if further remedies were needed. Judge John Knox, who had taken
over for Judge Caffey, presided over the trial and handed down his opinion in 1950.88 He ruled
against divestiture, but required that the Court retain jurisdiction of the case for five years in the
event that the new competitors were not able to provide sufficient competition. In addition, the
Court ordered each of the eleven major Alcoa stockholders to sell their interest in either Alcoa or
Limited within ten years. The grant-back provision of the license agreements between Alcoa and
the two new competitors was also eliminated, but Judge Hand’s invocation against price
squeezes remained.
In 1956, the Department of Justice argued that Reynolds and Kaiser had not proven an
ability to compete and thus petitioned for another five-year test. District Judge Cashin ruled that
the three companies’ relative performance during the initial five-year period was sufficient
evidence of competition and dismissed the government’s petition.89
The Effects of the Decree
The disposition of the government’s aluminum properties by the SPB created two viable
competitors in Reynolds and Kaiser. Three additional companies entered the primary aluminum
market between 1950 and 1955, once again with government assistance. In 1950, another
government program was launched to expand aluminum capacity because of the onset of the
Korean War. The government issued each participating company an accelerated five-year
amortization certificate for 85 percent of the cost of the new production and provided for
government purchase at list prices of all the new plants’ output that the producers could not sell
commercially. The government also had the option to buy any aluminum from the new facilities
at the list price.90
Three new entrants into primary aluminum production were funded from this Korean
War program: Harvey Aluminum Company, Anaconda Aluminum Company, and Ormet. In
88.UNITED STATES V. ALUMINUM COMPANY OF AMERICA, 91 F. SUPP. 333 (S.D. N.Y. 1950). 89.UNITED STATES V. ALUMINUM COMPANY OF AMERICA, 153 F. SUPP. 132 (S.D.N.Y. 1957).
40
addition, the program funded capacity expansions by the three existing producers, Alcoa, Kaiser,
and Reynolds. Harvey’s reduction capacity from the third round of expansion had not begun
construction when the expansion program ended in 1955 due to some problems in securing
power supplies. These issues were resolved, and Harvey’s 54,000-ton reduction capacity was in
place in 1958.91 The Anaconda plant began production in 1955. Anaconda received the
accelerated amortization from the government, but declined the government purchase contracts.
This lifted the requirement that Anaconda sell to independent fabricators or to the government.
The final successful entrant of the 1950’s was Ormet, a joint venture between Olin
Mathieson and Revere Copper and Brass. Olin had managed one of the government’s plants
during World War II, and Revere was an established aluminum fabricator. Both Olin and Revere
had initially planned to individually produce primary aluminum. However, Olin experienced
financing problems with respect to its second round reduction capacity distribution, and Revere
had been denied an accelerated amortization certificate from the government to build its own
reduction plant. Thus, Olin and Revere formed Ormet, which constructed an aluminum reduction
plant in 1958. Olin and Revere signed a 25-year agreement to purchase the ingot produced by
Ormet at full manufacturing cost. Olin would purchase 64 percent of the production while
Revere would purchase the remainder. Each would sell the output in either ingot or fabricated
form. Thus, the joint venture resulted in one additional primary aluminum producer, but two
primary aluminum sellers.92
By 1955, the new entrants had reduced Alcoa’s share of the primary aluminum market to
40 percent, but the market had grown substantially since the onset of World War II. In 1937,
when the government first filed the Sherman Act suit, U.S. production of aluminum was only
146,000 tons. Although production slumped after World War II, the demands during the Korean
War drove aluminum production to more than 1.25 million tons, or nearly nine times its level
when the antitrust case was filed (See Figure C-1). As a result, even though Alcoa’s share had
fallen to 40 percent by 1955, its output was more than four times its “monopoly” level in 1937.
90.Peck, SUPRA NOTE AT 148-50. 91.Aluminum Association, Aluminum Industry Annual Statistical Review 12-13 (ALUMINUM ASSOCIATION 1965). 92.Peck, SUPRA NOTE AT 176-78.

41
The increase in the size of the market clearly facilitated entry, even without two
government programs to build or finance new facilities. By 1955, Reynolds and Kaiser each had
enough capacity to produce four times the U.S. output in 1937. By 1958, even Ormet had the
capacity to produce the entire U.S. pre-World War II output (See Table C-1). With demand
fluctuating between 34,000 and 102,000 metric tons in the 1930’s, entry was not likely, with or
without government assistance. Once output rose to more than 900,000 tons, the environment
was quite different.
TABLE C-1
INSTALLED PRIMARY ALUMINUM CAPACITY IN THE UNITED STATES
1949 1955 1958
Tons Percent Tons Percent Tons Percent
Alcoa 294,000 45 706,500 43 798,250 36
Reynolds 227,000 35 440,000 27 601,000 27
Kaiser 133,000 20 428,200 26 537,000 24
Anaconda 0 0 60,000 4 60,000 3
Harvey 0 0 0 0 54,000 2
Ormet 0 0 0 0 144,000 7
Total 654,000 100 1,634,700 100 2,194,250 100
Source: ALUMINUM ASSOCIATION, ALUMINUM INDUSTRY ANNUAL STATISTICAL REVIEW 12-13 (Aluminum
Association, 1965).
The price of aluminum ingot had fallen steeply in the Depression, and it continued to
decline through the World War II period. After 1947, the price of primary aluminum stabilized,
rising more rapidly than general inflation. It appears that the antitrust case and government-
funded entry did not lead to lower aluminum prices (See Figure C-2). A regression analysis of
real aluminum prices over the period 1926-1950 confirms this conclusion. This analysis includes
a time trend for technical change in aluminum production, real GNP, the price of hot-rolled steel
bars (a substitute), the real price of electricity, the real price of imported bauxite, a dummy
variable for the World War II years (1942-45), and a dummy variable for the postwar years to
reflect the effect of the government’s structural “relief”—the increase in the number of sellers of

42
primary aluminum from one to three.93 The results are shown in Table C-2 for 1926-50 and for
an extended period, 1926-65. In general, the results show that the real price of aluminum is
positively related to the cost of an important input, electricity, and to the price of a substitute,
steel. The trend rate of prices is negative in all four of the equations, but the time trend and Real
GNP are statistically significant only in the linear equations. There is no discernible impact of
World War II on the real price of aluminum.
TABLE C-2
REGRESSION RESULTS FOR THE REAL PRICE OF PRIMARY ALUMINUM (T-STATISTICS IN PARENTHESES)
Period Constant Real
GNP
Time
Trend
World
War II
Dummy
Real
Price of
Steel
Real Price of
Electricity
Real Price
of Imported
Bauxite
Post-1945
Dummy R2
1926-50
(linear)
-0.175
(-1.04)
0.0006
(1.51)
-0.0081
(-2.88)
-0.00917
(-0.38)
0.00157
(2.51)
0.0845
(6.00)
0.00179
(0.42)
0.0360
(0.85) 0.986
1926-50
(log-linear)
-2.98
(-1.77)
-0.0430
(-0.19)
-0.00782
(-1.36)
-0.0155
(-0.24)
0.340
(2.74)
0.778
(3.10)
-0.112
(-1.35)
-0.0764
(-0.64) 0.989
1926-65
(linear)
-0.209
(-2.76)
0.000417
(4.19)
-0.00547
(-2.28)
0.00879
(0.34)
0.00282
(4.89)
0.0894
(8.11)
-0.0055
(-1.81)
0.02539
(0.70) 0.984
1926-65
(log-linear)
-4.682
(-2.68)
0.169
(0.72)
-0.00383
(-0.49)
-0.0575
(-0.97)
0.442
(2.64)
0.719
(2.86)
-0.0212
(-0.17)
-0.0966
(-0.98) 0.611
Note: All continuous independent variables in logarithmic form in log-linear regressions. The linear regressions for
1926-1950 and 1926-1965 were corrected for heteroscedasticity by computing robust standard errors consistent in
the presence of heteroscedasticity. The log-linear regression for 1926-1965 was corrected for autocorrelation. The
original model’s Durbin-Watson test rejected the null hypothesis of no positive autocorrelation. The model was
corrected for autocorrelation with the maximum likelihood iterative procedure. The new model’s Durbin-Watson
test is inconclusive for positive autocorrelation and does not reject the null hypothesis of no negative autocorrelation
at the 5% level of significance.
93.ALL PRICES ARE DEFLATED BY THE GNP DEFLATOR (1958=100). DATA FOR THE PRICES OF PRIMARY ALUMINUM
AND IMPORTED BAUXITE WERE OBTAINED FROM THE MINERALS INFORMATION TEAM OF THE U.S. GEOLOGICAL
SURVEY. PRICES OF PRIMARY ALUMINUM ARE IN UNITS OF 1958 DOLLARS PER POUND. PRICES OF IMPORTED BAUXITE
ARE IN UNITS OF 1958 DOLLARS PER SHORT TON. REAL GNP AND THE GNP DEFLATOR ARE FROM U.S. Bureau of the Census, Historical Statistics of the United States, Colonial Times to 1970, Bicentennial Edition 224 (U.S. DEPARTMENT OF COMMERCE 1975). REAL GNP IS IN BILLION 1958 DOLLARS. STEEL PRICES ARE FROM U.S. Geological Survey, Metal Prices in the United States through 1998, AT 63 (AVAILABLE AT
HTTP://MINERALS.USGS.GOV/MINERALS/PUBS/METAL_PRICES/). STEEL PRICES ARE IN UNITS OF 1958 DOLLARS PER
SHORT TON. ELECTRICITY PRICES ARE FROM U.S. Bureau of the Census, Historical Statistics of the United States, Colonial Times to 1970, Bicentennial Edition 827 (U.S. DEPARTMENT OF COMMERCE 1975) AND ARE IN UNITS OF
1958 CENTS PER KILOWATT-HOUR.
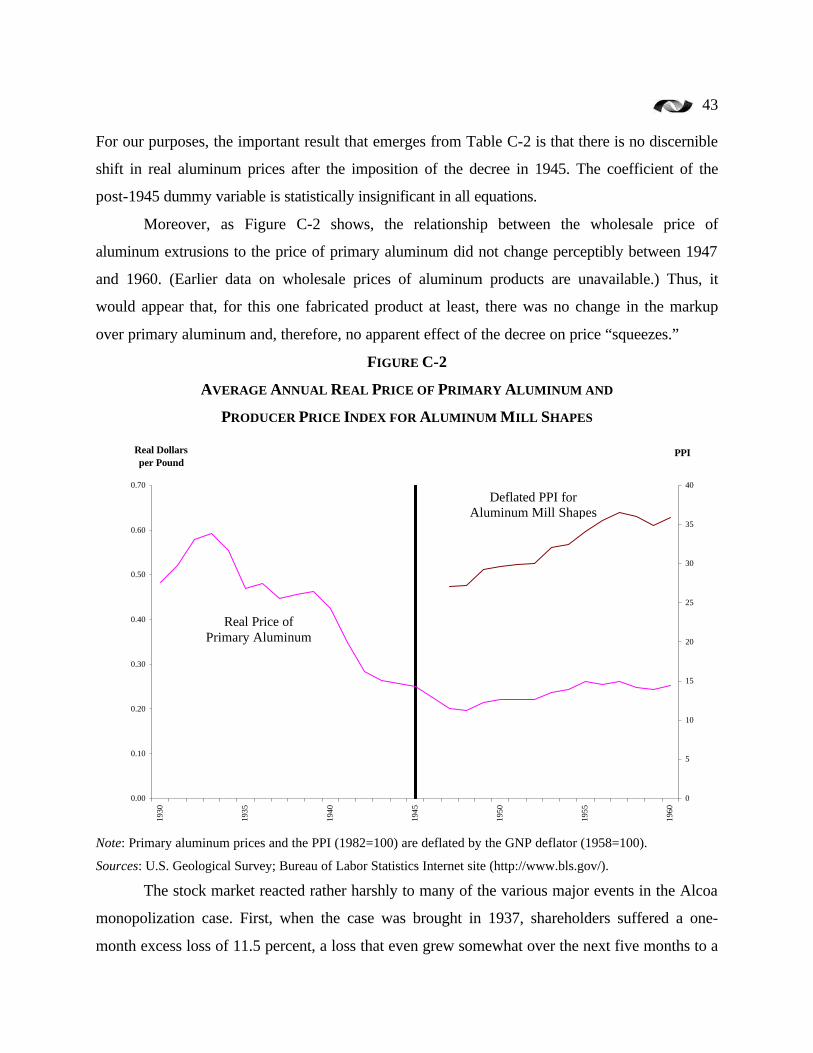
43
For our purposes, the important result that emerges from Table C-2 is that there is no discernible
shift in real aluminum prices after the imposition of the decree in 1945. The coefficient of the
post-1945 dummy variable is statistically insignificant in all equations.
Moreover, as Figure C-2 shows, the relationship between the wholesale price of
aluminum extrusions to the price of primary aluminum did not change perceptibly between 1947
and 1960. (Earlier data on wholesale prices of aluminum products are unavailable.) Thus, it
would appear that, for this one fabricated product at least, there was no change in the markup
over primary aluminum and, therefore, no apparent effect of the decree on price “squeezes.”
FIGURE C-2
AVERAGE ANNUAL REAL PRICE OF PRIMARY ALUMINUM AND
PRODUCER PRICE INDEX FOR ALUMINUM MILL SHAPES
0.00
0.10
0.20
0.30
0.40
0.50
0.60
0.70
1930
1935
1940
1945
1950
1955
1960
Real Dollarsper Pound
0
5
10
15
20
25
30
35
40
PPI
Note: Primary aluminum prices and the PPI (1982=100) are deflated by the GNP deflator (1958=100).
Sources: U.S. Geological Survey; Bureau of Labor Statistics Internet site (http://www.bls.gov/).
The stock market reacted rather harshly to many of the various major events in the Alcoa
monopolization case. First, when the case was brought in 1937, shareholders suffered a one-
month excess loss of 11.5 percent, a loss that even grew somewhat over the next five months to a
Real Price of Primary Aluminum
Deflated PPI for Aluminum Mill Shapes

44
cumulative 13.3 percent negative excess return (See Table C-3). When the lower court found
issued its findings of fact and conclusions of law in September-October 1941 stockholder excess
returns were -1.2 percent in September but rebounded to a cumulative + 4.6 percent at the end of
the fifth month thereafter. The lower court's decision, dismissing the complaint in July 1942 was
greeted by the stock market favorably at first, generating an excess return of 7.8 percent in July
but declining to a cumulative -8.0 percent five months thereafter, suggesting the effect of another
intervening event. Judge Hand's Appellate Court opinion in March 1945, reversing the lower
court and finding that Alcoa had monopolized, generated negative returns of -0.3 percent in the
first month, growing to a cumulative negative excess return of -3.4 percent five months later.
Finally, Judge Knox's decision in June 1950 not to grant the government structural relief resulted
in a positive excess return of 6.8 percent in the first month, increasing to a cumulative 7.9
percent five months later. Overall, using a six-month window to gauge the effect of these five
decisions, Alcoa stockholders appear to have lost about 12 percent relative to the overall market.
However, using only the contemporaneous month, the excess returns were very slightly positive.
The last event shown in Table C-3, the final decision regarding Alcoa’s forced disposition of its
stock in Alcan resulted in very large negative returns for stockholders. This event, occurring at
about the same time as the government’s Korean War subsidy program that resulted in the entry
of Anaconda, Harvey, and Ormet, appears to have had a substantial effect on Alcoa shareholders,
but it is difficult to attribute this effect to any belief that competition might break out along the
Canadian border.
TABLE C-3 EXCESS RETURNS TO ALCOA STOCKHOLDERS DURING MAJOR ANTITRUST EVENTS, 1937-51
Event
Excess Return
in Same
Month
Cumulative Excess
Returns Over Six
Months
Complaint Filed (April 1937) -11.5% -13.3%
Lower Court Findings of Fact and Law (September 1941) -1.2% +4.6%
Lower Court Decision (July 1942) +7.8% -8.0%
Judge Hand’s Decision (March 1945) -0.3% -3.4%
Lower Court Rejects New Plea for Divestiture (June 1950) +6.8% +7.9%
Final Court Judgment on Stock Disposal (January 1951) -13.1% -15.1%
45
Conclusion
The 1937 monopolization case brought against Alcoa reflected the failure of the earlier
1912 structural decree. The second Alcoa decree, finalized in 1950, was not very extensive
because of the government’s program to disperse war production facilities to new entrants. But
from the position of hindsight, it now seems likely that the failure of the 1912 decree to erode
Alcoa’s monopoly position derived from the small and even declining market for aluminum in
the early and mid 1930s. When demand grew in the 1940s and 1950s, entry would probably have
occurred even without government assistance. The government’s decision to bring a Section 2
case in the middle of the Depression when demand likely would not have supported more than
one supplier must surely be questioned. Demand soared as the case was being litigated, and the
federal government funded an expansion of capacity for the war effort. As in the case of
Standard Oil, changes in the market rendered the monopolization case largely irrelevant. In the
end, the antitrust suit served very little purpose other than to ignite controversy over the proper
method for defining the relevant market and for determining the market-share threshold for
establishing the existence of monopoly power.
Paramount
The motion-picture industry’s early history is dominated by a series of patent disputes
and antitrust actions.94 The industry’s origins derive from a series of patents obtained by Thomas
Edison and others in the late 19th century. One company controlled a large share of production
and distribution of feature films through its ownership of patents until 1912-18 when it lost a
series of antitrust cases and a major case involving the validity of a key patent. New entry soon
followed with the antecedents of many of today’s major film distributors—Universal, Fox, and
Paramount—emerging as major producer-distributors.
The exhibition of feature films was consolidated into a number of “circuits,” many of
whom, in turn, formed First National Exhibitors’ Circuit. First National soon began to finance
and distribute the films exhibited in its theaters. After World War I, vertical integration between
film distributors and theater chains began to proliferate. Theater owners integrated into
94.THE INFORMATION IN THIS SECTION IS DERIVED FROM Michael Conant, Antitrust in the Motion Picture Industry (UNIVERSITY OF CALIFORNIA PRESS 1960).
46
distribution to avoid the market power of distributors, and distributors countered by entering the
exhibition business. By 1931, six of the firms that would subsequently be defendants in the
Paramount case had control of nearly 2,500 theaters across the country. By this time, many of
the distributor practices that were alleged to constitute a pattern of behavior in violation of the
Sherman Act—such as block booking—emerged. As a result, the distributors were repeatedly
involved in antitrust suits long before the Paramount litigation was launched in 1938.
Industry Structure
The Paramount case was brought in 1938, and the complaint was amended in 1940. The
defendants were the five “major” distributors—those who owned theater chains—and three
“minor” distributors. These eight firms apparently controlled 95 percent of total film rentals in
the early 1940s and accounted for roughly two-thirds of all feature film releases.95 National
distribution of feature films was effected by each distributor through a large number of
“exchanges” in major urban centers who essentially monitored and enforced rental agreements
with theaters. No major distributor was so integrated into distribution as to be able to exhibit its
films solely in its own theaters. As a result, each major realized substantial rentals from the
theaters of its four integrated rivals.
There were a large number of independent theaters through which the eight Paramount
defendants also exhibited their films. Indeed, these independent theaters and theater circuits
accounted for about half of all theatrical rentals in the early 1940s. While several different major
distributors often owned theaters in the same town, these holdings were often operated jointly as
a “pool”, and these pooling arrangements extended to independent theaters as well.
At the time the Paramount case was brought, seven of the distributor defendants owned
production facilities and had extensive long-term agreements with talent—actors, directors, etc.
By the time that the trial had begun, however, the “studio” system of long-term, exclusive
contracts was in decline. Independent producers existed, but these producers were forced to
distribute their films through one of the 11 national distributors. Because production was
fragmented, the government was unable to argue successfully that the defendants had
monopolized this stage of production.
95.ID.
47
Antitrust
Antitrust actions against distributors and theater chains were very common throughout
the industry’s pre-World War II history. Many of these cases involved allegations of conspiracies
to fix theatrical admission prices or rental terms or to restrict output to competing theaters.96
Some of the alleged abuses—fixing minimum admission prices and licensing terms for
each picture—were virtually identical to the charges in the earlier cases against theater circuits.
However, the complaint in the Paramount case, as amended in November 1940, went much
farther. The eight defendants were charged with fixing license terms for feature films, excluding
independently produced films, controlling first runs of films in their own theaters, and even
pooling profits in territories where two or more of the five majors operated theaters. These
charges were quickly followed by a consent decree that limited the defendants’ ability to engage
in various tying or “block booking” practices and provided for arbitration of disputes with
unaffiliated theater owners who felt they had been unfairly denied access to the defendants’
films. Most of these disputes involved clearances—the timing of licensing films to different
theaters in the distribution chain. These clearances were employed to enforce a system of price
discrimination.
In 1944, the government moved to modify the 1940 decree, arguing that this decree had
not eliminated the anticompetitive abuses. A full-blown trial ensued in 1945-46 resulting in a
government victory in the District Court in December 1946.97 The court found that a large
number of practices violated Sections 1 and 2 of the Sherman Act, including:
1. The fixing of uniform admission prices—both among the defendants and between the
distributors and their theater licensees;
2. The system of uniform length or runs and clearances among theaters;
3. “Formula deals” between distributors and entire theater chains or circuits;
4. Block booking—i.e., tying arrangements; and
5. Pooling agreements.
96.UNITED STATES V. INTERSTATE CIRCUIT, 20 F. SUPP. 868, 874 (N.D. TEXAS, 1937); UNITED STATES V. CRESCENT
AMUSEMENT, 323 U.S. 173 (1944); UNITED STATES V. GRIFFITH, 334 U.S. 100 (1948); SCHINE CHAIN THEATRES V. UNITED STATES, 334 U.S. 110 (1948). 97.UNITED STATES V. PARAMOUNT PICTURES, 70 F. SUPP. 53, 72-76 (S.D.N.Y. 1946).

48
The District Court refused to order divestiture of theaters from the five major distributors, but
issued a decree that prohibited a large number of the offenses alleged to be anticompetitive by
the government. Agreements to maintain uniform admission prices and clearances among
theaters were banned. Clearances had to be reasonable and could not be granted against theaters
not in substantial competition with each other. The Court required that a system of competitive
bidding among theaters for each run of a feature film be installed to replace these collusive
practices. Various restrictions on block booking and circuit-wide formula deals were also in the
decree.
In 1948, the Supreme Court upheld the lower court in most respects, but it found the
system of competitive bidding unworkable.98 Instead, it ordered the lower court to reconsider
divestiture. Interestingly, the Court’s reversal of the competitive bidding relief was based on its
fear that such a mechanism would require the federal courts to be involved too much in the day-
to-day operations of the industry. As it developed, however, the structural remedy required
substantial continuing enforcement efforts as distributors attempted to devise new approaches to
exhibiting their films.
As a result of the Supreme Court decision, two of the major distributors entered into
consent agreements divorcing their theaters and even divesting some of their theaters before the
divorcement. The other three majors were ordered to divest their theater chains by the lower
court in decrees entered in 1950-52.99 Stock ownership of the divorced theater circuits and the
major distributors were to be kept totally separate. All eight defendants were still subject to the
injunctive relief in the original decree except for the competitive bidding requirement.
The Effect of the Decrees
The primary objective of the Paramount decrees was to prevent collusive, joint-profit-
maximizing activities of the eight defendants. Absent collusion in the licensing of films to each
other’s theater circuits and in licensing and exhibiting films, distributors would have to compete
for theater space by offering attractive rental terms. These terms, in turn, would be available to
98.UNITED STATES V. PARAMOUNT PICTURES, 334 U.S. 131 (1948). 99.UNITED STATES V. LOEW’S: WARNER CONSENT DECREE, 1950-51 C.C.H TRADE CASES ¶62,765 (S.D.N.Y, 1951); TWENTIETH CENTURY-FOX CONSENT DECREE, 1950-1951 C.C.H. TRADE CASES ¶62,861 (S.D.N.Y, 1951); LOEW’S

49
large numbers of theater owners who would decide which films to bid for and how long to run
them. Independent distributors would now have better access to theaters, and the independents
should be able to take market share aware from the eight defendants. Entry of new distributors
might also occur, further reducing the defendants’ market shares. If this scenario had played out,
we might have expected the share of theatrical revenues obtained by the distributors to fall,
admission prices to decline, and the number of distributors and annual film releases to increase.
In fact, none of these events occurred.
A major complication in analyzing the development of the motion-picture industry after
the Paramount decision was the sudden change in the entertainment habits of U.S. households
that occurred after 1948. The introduction of television as a mass medium at precisely this time
led to a dramatic decline in theatrical admissions. Total theatrical admissions fell by more than
two-thirds between 1948 and 1958, and by another 50 percent between 1958 and 1967.100 As a
result, large numbers of theaters closed, but substantial excess theater capacity remained in
1967.101 As in Standard Oil and Alcoa, unanticipated changes in market conditions had
enormous impacts that the designers of the decrees could not foresee.
Despite these negative trends, the average real price of a movie ticket actually rose over
the two decades following Paramount. The Consumer Price Index (CPI) for Indoor Theaters rose
by 36.4 percent between 1948 and 1958, a period in which the overall CPI rose just 20.1 percent.
This trend continued over the 1958-67 period, with the CPI for indoor theaters rising by 68.9
percent while the overall CPI rose by just 15.5 percent102 (See Figure D-1). In a sharply
contracting industry, one might have expected substantial downward pressure on prices,
particularly if the Justice Department had just succeeded in breaking a cartel of distributor-
exhibitors, which had previously succeeded in fixing admission prices. Instead, real theatrical
admission prices rose substantially after Paramount.103
CONSENT DECREE; 1952-1953 C.C.H. TRADE CASES ¶67,228 (S.D.N.Y. 1952), AS CITED IN CONANT, SUPRA NOTE AT
103. 100. Census of Service Industries (U.S. BUREAU OF THE CENSUS 1958 AND 1967). 101.MUCH OF THE DISCUSSION OF THE MOTION-PICTURE INDUSTRY AFTER PARAMOUNT IS DERIVED FROM ROBERT W. CRANDALL, THE POSTWAR PERFORMANCE OF THE MOTION PICTURE INDUSTRY, 20 Antitrust Bull. 49-88 (1975). 102.ID.; U.S. Bureau of the Census, Historical Statistics of the United States, Colonial Times to 1970, Bicentennial Edition 210 (U.S. DEPARTMENT OF COMMERCE 1975).
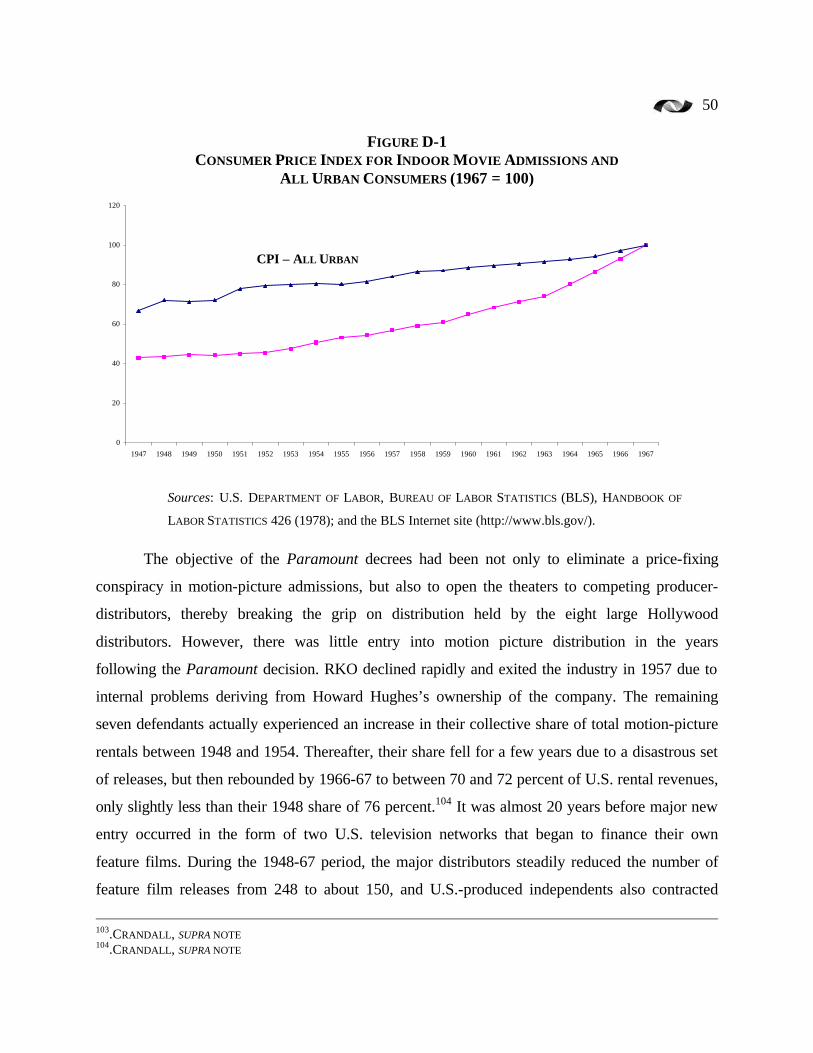
50
FIGURE D-1 CONSUMER PRICE INDEX FOR INDOOR MOVIE ADMISSIONS AND
ALL URBAN CONSUMERS (1967 = 100)
Sources: U.S. DEPARTMENT OF LABOR, BUREAU OF LABOR STATISTICS (BLS), HANDBOOK OF
LABOR STATISTICS 426 (1978); and the BLS Internet site (http://www.bls.gov/).
The objective of the Paramount decrees had been not only to eliminate a price-fixing
conspiracy in motion-picture admissions, but also to open the theaters to competing producer-
distributors, thereby breaking the grip on distribution held by the eight large Hollywood
distributors. However, there was little entry into motion picture distribution in the years
following the Paramount decision. RKO declined rapidly and exited the industry in 1957 due to
internal problems deriving from Howard Hughes’s ownership of the company. The remaining
seven defendants actually experienced an increase in their collective share of total motion-picture
rentals between 1948 and 1954. Thereafter, their share fell for a few years due to a disastrous set
of releases, but then rebounded by 1966-67 to between 70 and 72 percent of U.S. rental revenues,
only slightly less than their 1948 share of 76 percent.104 It was almost 20 years before major new
entry occurred in the form of two U.S. television networks that began to finance their own
feature films. During the 1948-67 period, the major distributors steadily reduced the number of
feature film releases from 248 to about 150, and U.S.-produced independents also contracted
103.CRANDALL, SUPRA NOTE 104.CRANDALL, SUPRA NOTE
0
20
40
60
80
100
120
1947 1948 1949 1950 1951 1952 1953 1954 1955 1956 1957 1958 1959 1960 1961 1962 1963 1964 1965 1966 1967
CPI – ALL URBAN C
51
supply substantially. Thus, the Paramount decrees did not succeed in introducing new
competition or new competitors in theatrical motion picture distribution. After twenty years, the
seven survivors of the Paramount litigation continued to account for nearly three-fourths of all
U.S. theatrical rentals.105
Given the sharp decline in demand for theatrical admissions, one might have expected
Hollywood distributors to be more aggressive in attempting to market their films to a sharply
declining set of U.S. theaters, particularly if they were just being liberated from membership in a
cartel. In fact, they reduced supply steadily and held the line remarkably on price competition for
the 1948-67 period. As real admission prices rose, the distributors were successful in capturing
most of the additional revenues for themselves. The share of theatrical admission receipts that
they captured rose from 30.4 percent in 1948 to 45.8 percent in 1967. Thus, the distributors
captured approximately two-thirds of the real increase in theater ticket prices in this period.
Surely, this is not the result one would have expected from a decree that ended collusive
practices among distributors.
Attempting to estimate the effect of the Paramount case on the defendant companies'
stockholders is complicated by the large number of court decisions and the number of defendant
companies. In general, the announcement of the filing of the case in July 1938 had a large
negative impact on the common equities of the larger, integrated defendants, but the opposite
effect on the minor unintegrated distributors, Universal and Columbia (See Table D-1).
However, the amended complaint and the subsequent consent decree in November 1940 were
followed by enormous positive excess returns for both the majors and the minor distributors.
When the government reopened the case in August 1944 by petitioning the court to modify the
1940 decree, the stockholder excess returns were understandably negative for all but one of the
major distributors, but positive for one of the two minor distributors who had no theaters to
divest. Finally, the Supreme Court decision in 1948 generated very large negative returns for the
majors as well as both of the minor distributors. In short, the market does not appear to have
foreseen the devastating effect of television, reacting very badly to the forced divestiture of
theaters!
105.ALL OF THESE DATA ARE FROM CRANDALL, SUPRA NOTE

52
TABLE D-1 CUMULATIVE SIX MONTH EXCESS RETURNS TO PARAMOUNT DEFENDANTS’ STOCKHOLDERS
DURING MAJOR ANTITRUST EVENTS, 1937-51
Event Paramount RKO
20th
Century
Fox
Warner
Bros. Loews Columbia Universal
Case Filed (July 1938) -12.3% -25.1% -14.8% -31.4% -10.0% +8.4% +58.7%
Complaint Amended and
Decree Issued
(November 1940)
+64.0% +27.9% +0.7% +42.4% +32.4% +11.6% +104.7%
Gov’t Files to Modify Decree
(August 1944) -13.2% -14.3% -3.0% -13.6% +5.6% +19.5% -8.9%
Lower Court Ruling
(December 1946) -26.0% -33.1% -35.0% -20.9% -22.1% -14.1% -25.4%
Supreme Court Opinion
(May 1948) -23.6% -13.6% -27.0% -32.0% -24.3% -16.0% -39.5%
What Went Wrong?
Clearly, the Paramount decrees did not succeed in creating a more competitive motion-
picture industry. Why did the decrees not achieve their goal? There are at least two possibilities.
First, the government may have erred in charging the defendants with a violation of the Sherman
Act. If the conduct of these companies was not collusive prior to 1948, or if their actions did not
result in a reduction of output or higher theater admission prices, the suit should never have been
filed. DeVany and Eckert argue that the practices assailed by the government—the agreement on
clearances and length of runs—were required to provide a stable environment for the
exploitation of feature films and to provide information on the demand for each film.106 As a
result, barring such practices or breaking the ownership ties between distributors and theaters
reduces the efficiency of the distribution system. The result would be higher costs, higher rental
rates, and fewer feature film releases, or precisely the results obtained after 1948.
A second possibility is that the collusive arrangements that existed among distributors
and exhibitors were successful in reducing output and raising prices, but that the decrees were
53
not successful in ending such collusion. After decades of agreeing on clearances and lengths of
runs, the seven remaining Paramount defendants would still be able to collude tacitly by
reporting their revenues from each theater to the trade press, thereby being able to detect any
deviations from the implicit cartel agreement. If a theater dropped a film earlier in its run than
expected, given its box-office revenues, distributors would surely be able to infer that the
distributor of the film that replaced it had cut its rental rate to obtain the clearance. Thus, by
simply reporting each week to trade publications their results on a theater-by-theater basis, the
implicit cartel could have continued.
It is even possible that elements of both theories are correct. The decrees might have
made it more expensive to distribute feature films without succeeding in allowing new entry and
without stimulating enhanced competition among the defendants. The result could have been
higher prices and lower output than would have existed without the decrees. Whatever the
explanation, it seems clear that the motion picture industry did not become more competitive as a
result of vertical divestiture of theaters from distributors.
The Paramount case once again illustrates the difficulty in designing a decree that is
effective when market conditions are changing dramatically. Like American Tobacco, it also
demonstrates that structural relief may not create the conditions for aggressive competition.
Modifications in the decree may be frequently required to adjust for changes in market
conditions and the realization that the decree is simply not working.
United Shoe Machinery
United Shoe Machinery Corp. (“USM”) began operations in 1899 with the acquisition of
five shoe machinery manufacturers, three of which were dominant companies in their segment of
the industry.107 These acquisitions provided USM with a prominent position in the major
segments of shoe machinery manufacturing. The company grew rapidly thereafter, acquiring a
number of other companies, and it eventually centralized its manufacturing operations in one
plant in Massachusetts.108
106.ARTHUR DEVANY & ROSS D. ECKERT, MOTION PICTURE ANTITRUST: THE PARAMOUNT CASES REVISITED, IN
Research in Law and Economics (RICHARD O. ZERBE, JR., & VICTOR P. GOLBERG EDS. 1991). 107.Carl Kaysen, United States v. United Shoe Machinery Corporation 6 (HARVARD UNIVERSITY PRESS 1956). 108.Kaysen, SUPRA NOTE AT 9.
54
As early as 1911, USM faced a civil suit charging it with combination in restraint of trade
and monopolizing in violations of Sections 1 and 2 of the Sherman Act.109 USM won the suit,
but was faced with another in 1915, charging that USM’s equipment leasing practices violated
Section 3 of the Clayton Act because of tying and exclusive-use provisions in their contracts.110
This suit was won by the government, resulting in a court decree that required USM to modify
the terms of its leases.111 The third major antitrust case against USM was brought in 1947,
charging USM with violations of Section 1 and Section 2 of the Sherman Act. The District court
issued its ruling against USM in this suit in 1953 and was upheld by the Supreme Court in
1954.112 Although the 1953 decree did not result in divestiture, a review of the case in 1964 led
to a Supreme Court decision that instructed the lower court to consider divestiture, and in 1969, a
substantial share of USM’s assets was divested.113 The company was purchased by Emhart
Industries five years later.
USM’s Products and Services
USM manufactured a full line of machines used specifically for the purpose of producing
shoes. By the 1940s, United offered more than 300 types of machines, of which a shoe
manufacturer might need as many as 100 to perform the operations required to produce a shoe.114
These included clicking machines, lasting machines, eyeleting machines, outsole stitching
machines, and heel attaching machines, to name only a few. Factories engaged in the
manufacture of shoes required a large number of different machines.
USM’s customer base consisted of shoemakers across the United States. These were
typically small enterprises (although several were very large, and one or two were nearly the size
of USM). In 1947, there were approximately 1,650 shoe factories in the United States, operated
109.Kaysen, SUPRA NOTE AT 3. 110.Kaysen, SUPRA NOTE AT 3 111.Kaysen, SUPRA NOTE AT 3. 112.UNITED STATES V. UNITED SHOE MACHINERY, 110 F.SUPP. 295 (D.MASS. 1953), AFFD. 391 U.S. 244. 113.UNITED SHOE MACHINERY, 1969 U.S. DIST. LEXIS 13280, AT *1. 114.SCOTT E. MASTEN & EDWARD A. SNYDER, UNITED STATES VERSUS UNITED SHOE MACHINERY CORPORATION: ON
THE MERITS, 36 J.L & Econ. 38 (1993).
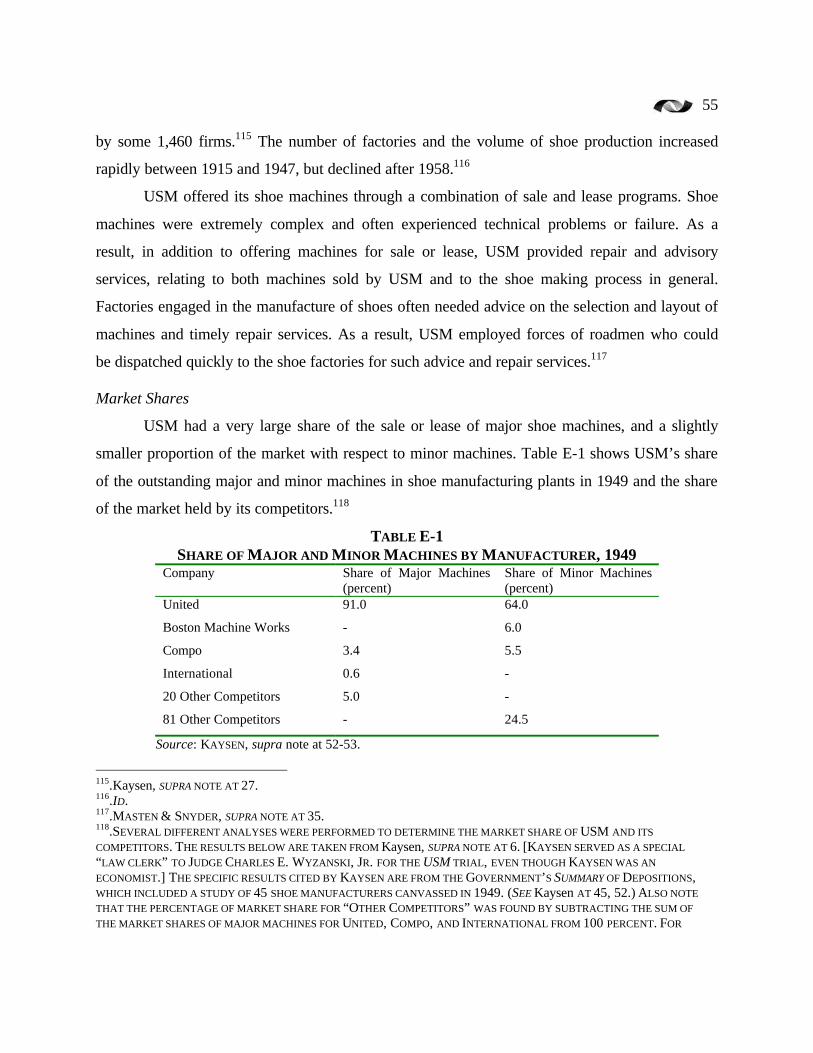
55
by some 1,460 firms.115 The number of factories and the volume of shoe production increased
rapidly between 1915 and 1947, but declined after 1958.116
USM offered its shoe machines through a combination of sale and lease programs. Shoe
machines were extremely complex and often experienced technical problems or failure. As a
result, in addition to offering machines for sale or lease, USM provided repair and advisory
services, relating to both machines sold by USM and to the shoe making process in general.
Factories engaged in the manufacture of shoes often needed advice on the selection and layout of
machines and timely repair services. As a result, USM employed forces of roadmen who could
be dispatched quickly to the shoe factories for such advice and repair services.117
Market Shares
USM had a very large share of the sale or lease of major shoe machines, and a slightly
smaller proportion of the market with respect to minor machines. Table E-1 shows USM’s share
of the outstanding major and minor machines in shoe manufacturing plants in 1949 and the share
of the market held by its competitors.118
TABLE E-1 SHARE OF MAJOR AND MINOR MACHINES BY MANUFACTURER, 1949
Company Share of Major Machines (percent)
Share of Minor Machines (percent)
United 91.0 64.0
Boston Machine Works - 6.0
Compo 3.4 5.5
International 0.6 -
20 Other Competitors 5.0 -
81 Other Competitors - 24.5
Source: KAYSEN, supra note at 52-53.
115.Kaysen, SUPRA NOTE AT 27. 116.ID. 117.MASTEN & SNYDER, SUPRA NOTE AT 35. 118.SEVERAL DIFFERENT ANALYSES WERE PERFORMED TO DETERMINE THE MARKET SHARE OF USM AND ITS
COMPETITORS. THE RESULTS BELOW ARE TAKEN FROM Kaysen, SUPRA NOTE AT 6. [KAYSEN SERVED AS A SPECIAL
“LAW CLERK” TO JUDGE CHARLES E. WYZANSKI, JR. FOR THE USM TRIAL, EVEN THOUGH KAYSEN WAS AN
ECONOMIST.] THE SPECIFIC RESULTS CITED BY KAYSEN ARE FROM THE GOVERNMENT’S SUMMARY OF DEPOSITIONS, WHICH INCLUDED A STUDY OF 45 SHOE MANUFACTURERS CANVASSED IN 1949. (SEE Kaysen AT 45, 52.) ALSO NOTE
THAT THE PERCENTAGE OF MARKET SHARE FOR “OTHER COMPETITORS” WAS FOUND BY SUBTRACTING THE SUM OF
THE MARKET SHARES OF MAJOR MACHINES FOR UNITED, COMPO, AND INTERNATIONAL FROM 100 PERCENT. FOR
56
USM was dominant in large machines while USM’s principal rivals competed by
offering a more limited line of machines. None of the rivals was a large manufacturing
enterprise. As a result, Kaysen concluded that: “[t]hey are essentially shoe machinery or
machinery-and-supplies businesses, and their small scale in the machine field indicates their
overall smallness and weakness relative to USM.”119
The Government’s Case Against USM
The government claimed that USM had monopolized the shoe machinery market through
the use of leases that impeded the purchase or lease of their competitors’ machines. Specifically,
the government charged that several provisions of USM’s leases were exclusionary. Among the
most important of these provisions were: (i) the ten-year terms of the leases; (ii) the return
charges or deferred payments due upon early termination of a lease; (iii) the minimum monthly
usage charges on machines subject to per-unit payments; and (iv) the “full-capacity” clause that
required lessees to use the machine to the fullest extent possible in producing all shoes for which
the machine is capable of being used.120
In addition to these provisions, USM would waive the monthly rental and minimum-
usage balances due on unexpired leases when machinery returns were made for reasons other
than the substitution of a competitor’s machine. USM would charge the shoe manufacturers with
violating the full-capacity clause only in cases in which a competitor’s machine was used.
Penalties were waived when the full capacity clause was not met as a result of changes in
demand, conversion to manual operations, or replacement with another United machine.121
USM’s market power was allegedly enhanced by a number of other factors. First, USM offered a
full line of machinery, which gave it the ability to use tying practices and to employ price
discrimination against its rivals, charging low markups for machines that faced competition and
high markups for those facing no competition.122 Second, USM held a large number of patents,
MINOR MACHINES, THE MARKET SHARES OF UNTIED, BOSTON MACHINE WORKS, AND COMPO WERE SUMMED AND
SUBTRACTED FROM 100 PERCENT TO DETERMINE THE MARKET SHARE OF OTHER COMPETITORS. 119.Kaysen, SUPRA NOTE AT 53. 120.Masten and Snyder, SUPRA NOTE AT 57. 121.ID. 122.Kaysen, SUPRA NOTE AT 74.
57
which made it difficult for any potential rival to develop machines or techniques that did not
somehow infringe on a USM patent.123 Kaysen conceded that he could not fully dismiss the
theory that USM was a natural monopoly due to the small size of the shoe machinery market.
However, his observations on the small lot size for parts and machine manufacturing in USM’s
Massachusetts plant led him to conclude that USM was probably not a natural monopolist.124
The Government’s Victory and Proposed Relief
In February 1953, the District Court found that USM had violated Section 2 of the
Sherman Act by illegally monopolizing the shoe machinery market and the market for some shoe
machinery supplies.125 USM appealed the District Court’s decision, but the Supreme Court
upheld the court’s decision.126 The government requested the division of USM into three full-line
manufacturers and the separation of all supply activities from the machinery business. The major
obstacle was the fact that USM produced its entire output in a single manufacturing plant. In
addition, the government sought an end to USM’s reliance upon leasing and the dissolution of
USM’s outstanding leases. This remedy, in conjunction with modifications in USM’s patent
policies and a ban on expansion of USM through acquisitions, would be expected to reduce
barriers to entry.127
The court declined to order dissolution of USM, but instead structured a decree that
focused heavily on USM’s leasing policy. Under the decree USM was forced to offer its
machines for sale as well as lease, but it could not structure the lease and sales terms in a fashion
that would make it substantially more advantageous to lease the machines. In addition, the
duration of all new leases had to be reduced to five years or less with an option to return
machines after one year. Return charges or deferred payments were banned. USM was barred
from acquiring any shoe machinery factory or shoe supply business, or stock in such business,
for more than $10,000. USM was also severely restricted with respect to the acquisition of
patents.128
123.ID. AT 89. 124.ID. AT 92. 125.UNITED STATES V. UNITED SHOE MACHINERY, 110 F. SUPP. 295 (1953). 126.UNITED STATES V. UNITED SHOE MACHINERY, 347 U.S. 521 (1954). 127.Kaysen, SUPRA NOTE AT 272-73. 128.UNITED SHOE MACHINERY V. UNITED STATES, 347 U.S. 521 (1954).
58
The decree was intended to stimulate competition in at least three ways. First, by
stimulating the purchase of machines, the decree might create a vibrant second-hand market.
These second-hand machines would serve to limit USM’s market power in the sale or lease of
new machines and provide potential entrants with valuable information about USM’s
technology. Second, by limiting the term of the leases and limiting discriminatory termination
fees, the decree might induce shoe manufacturers to choose more competitors’ products. Third,
by creating a second-hand market and stimulating incremental sales of competitive machines
through a relaxation of USM’s leasing terms, the decree might create an active independent
repair sector, freeing shoe manufacturers from reliance on USM’s technical staff.
The Effect of the Decree
After ten years, the lower court held hearings on the effectiveness of the decree and
concluded that the decree was generally working as expected. Specifically, Judge Wyzanski
found that:129
• USM’s market share of lease and sale revenue fell from approximately 85 percent in
1953 to approximately 62 percent in 1963.
• USM’s lease and sales revenue fell from approximately $32 million in 1953 to
approximately $24 million in 1963.
• The number of new entrants had increased, and machinery shipments of USM’s
principal competitors had increased substantially.
• USM shipped only 51.7 percent of all shoe machines shipped in 1963.
• A secondhand market had been established.
• Approximately 54 percent of machines in shoe factories in 1963 were made by USM,
but only 47 percent had been obtained from USM.
• In 1963, only 17 percent of leased machines in shoe factories were leased from USM.
• Between 1953 and 1963, shoe factories purchased approximately 53,000 previously
leased machines from USM.
129.Gordon Parrish, The Experience With Antitrust Relief In Shoe Machinery 142 (PH.D. DISSERTATION, WASHINGTON STATE UNIVERSITY 1973).
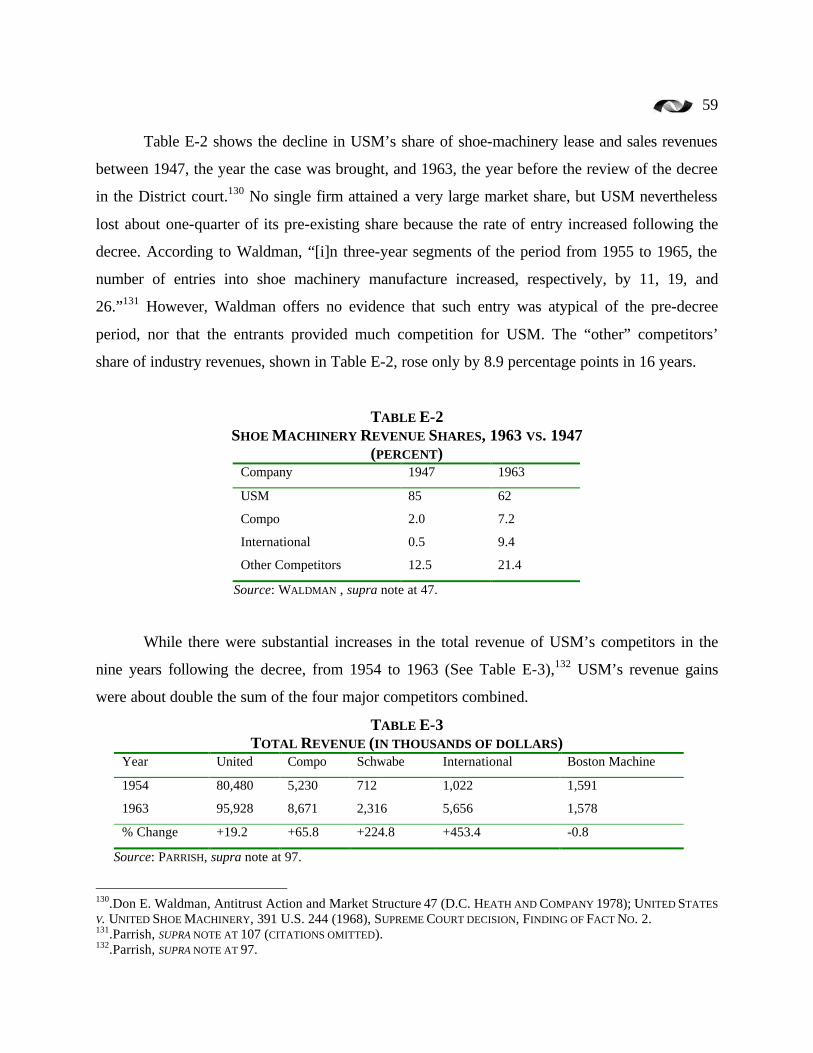
59
Table E-2 shows the decline in USM’s share of shoe-machinery lease and sales revenues
between 1947, the year the case was brought, and 1963, the year before the review of the decree
in the District court.130 No single firm attained a very large market share, but USM nevertheless
lost about one-quarter of its pre-existing share because the rate of entry increased following the
decree. According to Waldman, “[i]n three-year segments of the period from 1955 to 1965, the
number of entries into shoe machinery manufacture increased, respectively, by 11, 19, and
26.”131 However, Waldman offers no evidence that such entry was atypical of the pre-decree
period, nor that the entrants provided much competition for USM. The “other” competitors’
share of industry revenues, shown in Table E-2, rose only by 8.9 percentage points in 16 years.
TABLE E-2 SHOE MACHINERY REVENUE SHARES, 1963 VS. 1947
(PERCENT) Company 1947 1963
USM 85 62
Compo 2.0 7.2
International 0.5 9.4
Other Competitors 12.5 21.4
Source: WALDMAN , supra note at 47.
While there were substantial increases in the total revenue of USM’s competitors in the
nine years following the decree, from 1954 to 1963 (See Table E-3),132 USM’s revenue gains
were about double the sum of the four major competitors combined.
TABLE E-3 TOTAL REVENUE (IN THOUSANDS OF DOLLARS)
Year United Compo Schwabe International Boston Machine
1954 80,480 5,230 712 1,022 1,591
1963 95,928 8,671 2,316 5,656 1,578
% Change +19.2 +65.8 +224.8 +453.4 -0.8
Source: PARRISH, supra note at 97.
130.Don E. Waldman, Antitrust Action and Market Structure 47 (D.C. HEATH AND COMPANY 1978); UNITED STATES
V. UNITED SHOE MACHINERY, 391 U.S. 244 (1968), SUPREME COURT DECISION, FINDING OF FACT NO. 2. 131.Parrish, SUPRA NOTE AT 107 (CITATIONS OMITTED). 132.Parrish, SUPRA NOTE AT 97.
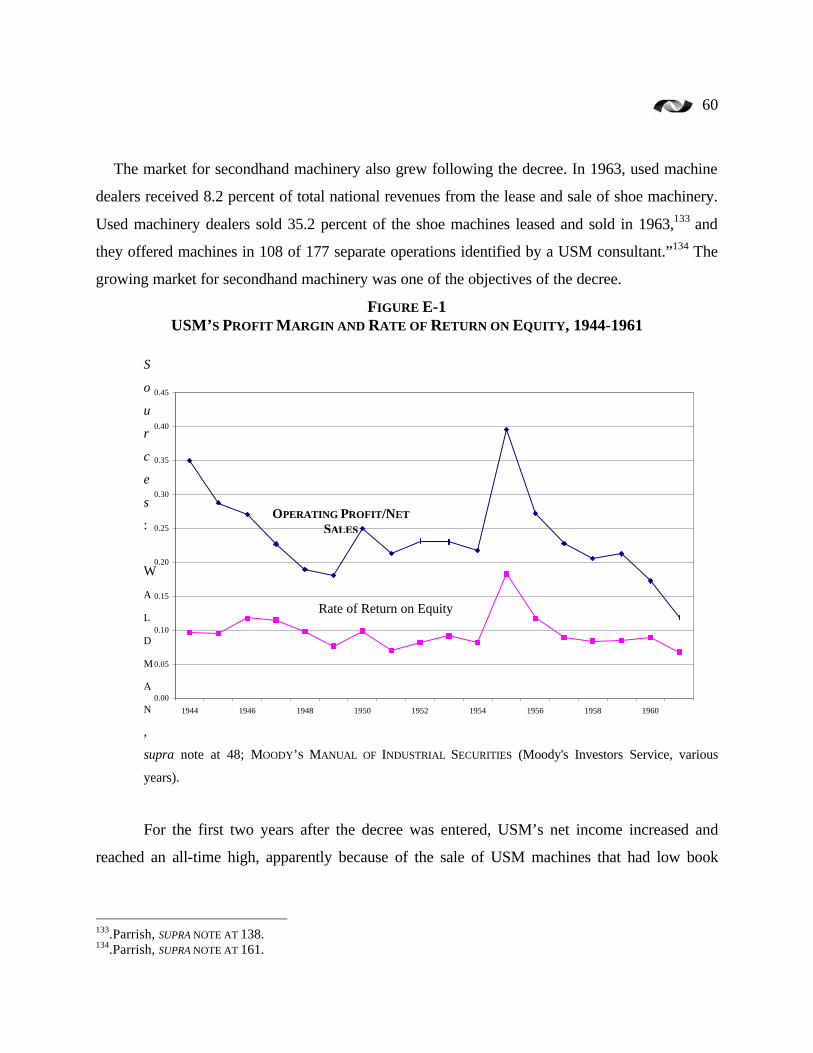
60
The market for secondhand machinery also grew following the decree. In 1963, used machine
dealers received 8.2 percent of total national revenues from the lease and sale of shoe machinery.
Used machinery dealers sold 35.2 percent of the shoe machines leased and sold in 1963,133 and
they offered machines in 108 of 177 separate operations identified by a USM consultant.”134 The
growing market for secondhand machinery was one of the objectives of the decree.
FIGURE E-1 USM’S PROFIT MARGIN AND RATE OF RETURN ON EQUITY, 1944-1961
S
o
u
r
c
e
s
:
W
A
L
D
M
A
N
,
supra note at 48; MOODY’S MANUAL OF INDUSTRIAL SECURITIES (Moody's Investors Service, various
years).
For the first two years after the decree was entered, USM’s net income increased and
reached an all-time high, apparently because of the sale of USM machines that had low book
133.Parrish, SUPRA NOTE AT 138. 134.Parrish, SUPRA NOTE AT 161.
0.00
0.05
0.10
0.15
0.20
0.25
0.30
0.35
0.40
0.45
1944 1946 1948 1950 1952 1954 1956 1958 1960
OPERATING PROFIT/NET
SALES
Rate of Return on Equity

61
value and because of an increase in lease prices.135 Waldman argues that the high prices
following the decree may have been a result of USM attempting to placate the court, but such
behavior is hardly consistent with Waldman’s view that USM suffered a reduction in market
power.136 Moreover, USM’s rate of return on equity was little affected by the decree (See Figure
E-1). In the first two years, as explained above, USM’s return on equity rose, but thereafter it
returned to the levels of 1945-53.
Given the heterogeneity of shoe machinery, there is no available index of shoe machinery
prices before and after the decree. Therefore, an indirect test of the effect of the decree on prices
is required. If the decree had succeeded in reducing machinery prices, shoe manufacturers should
have incurred lower machinery expense relative to the value of shoes produced. In the short run,
a lower price of shoe machines probably would not result in much substitution of machines for
labor. Yet, the ratio of shoe machinery shipments to shoe shipments declined from 0.014 in 1947
to 0.012 in 1954, but then remained constant at 0.012 in 1958, 1963, and 1967137 (See Figure E-
2). In 1972, this ratio rose sharply—perhaps in response to machine sales following the revision
of the decree in 1968, but then declined equally as sharply in 1977.138 The average ratio was
0.015 for the 1972-77 years combined, or approximately its value in the year the case was filed.
That the value of shoe-machinery shipments did not decline relative to the value of shoes is
surely suggestive of, but not proof of the absence of an effect of the decree on shoe machinery
prices.
135.Waldman, SUPRA NOTE AT 47. 136.ID. 137
DATA FROM THE QUINQUENNIAL CENSUS OF MANUFACTURES. 139. SEE THE NEXT SECTION.
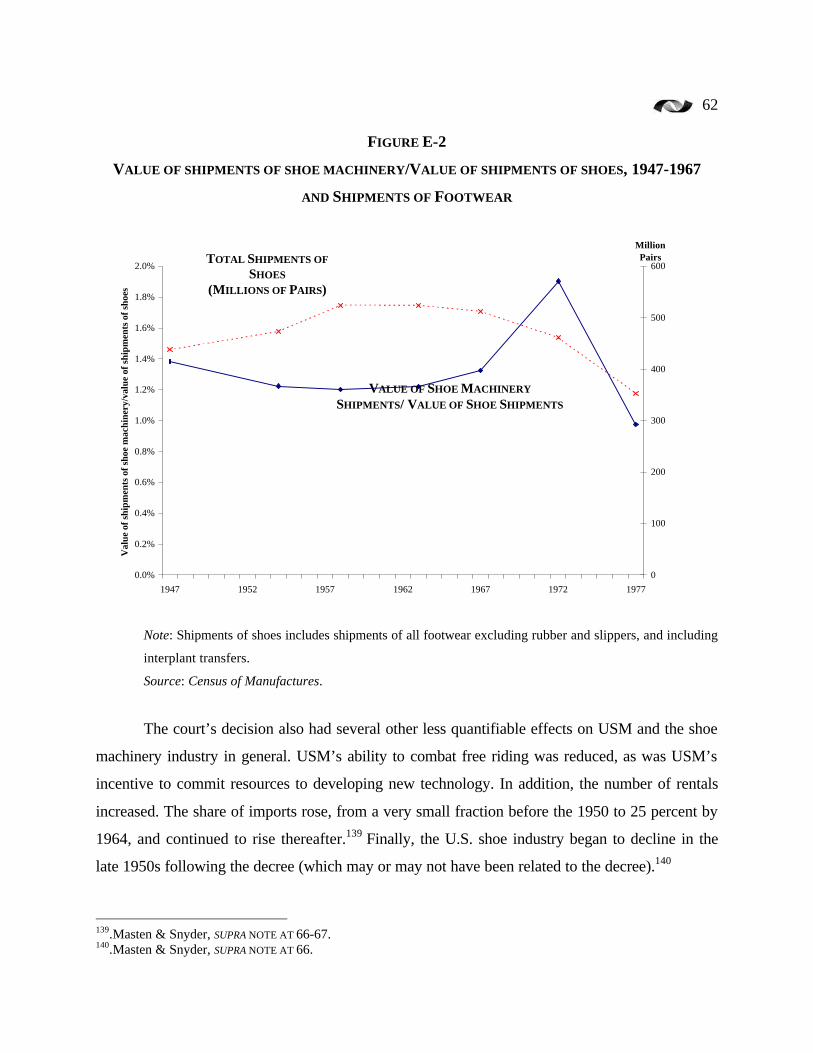
62
FIGURE E-2
VALUE OF SHIPMENTS OF SHOE MACHINERY/VALUE OF SHIPMENTS OF SHOES, 1947-1967
AND SHIPMENTS OF FOOTWEAR
Note: Shipments of shoes includes shipments of all footwear excluding rubber and slippers, and including
interplant transfers.
Source: Census of Manufactures.
The court’s decision also had several other less quantifiable effects on USM and the shoe
machinery industry in general. USM’s ability to combat free riding was reduced, as was USM’s
incentive to commit resources to developing new technology. In addition, the number of rentals
increased. The share of imports rose, from a very small fraction before the 1950 to 25 percent by
1964, and continued to rise thereafter.139 Finally, the U.S. shoe industry began to decline in the
late 1950s following the decree (which may or may not have been related to the decree).140
139.Masten & Snyder, SUPRA NOTE AT 66-67. 140.Masten & Snyder, SUPRA NOTE AT 66.
0.0%
0.2%
0.4%
0.6%
0.8%
1.0%
1.2%
1.4%
1.6%
1.8%
2.0%
1947 1952 1957 1962 1967 1972 1977
Val
ue o
f sh
ipm
ents
of
shoe
mac
hine
ry/v
alue
of
ship
men
ts o
f sh
oes
0
100
200
300
400
500
600
MillionPairsTOTAL SHIPMENTS OF
SHOES (MILLIONS OF PAIRS)
VALUE OF SHOE MACHINERY
SHIPMENTS/ VALUE OF SHOE SHIPMENTS

63
It is clear that stockholders anticipated the mild effect of the decrees on USM’s fortunes.
When the initial complaint was filed in 1947, the stock market reacted very mildly to the news
(See Table E-4). Even the adverse ruling by Judge Wyzanski in 1953 is associated with only a –
0.3 percent decline in the price of the stock in the same month, and the excess returns are
actually positive over the six-month window. In total, the complaint and the lower court decision
are associated with less than a 2% negative excess return to stockholders. However, when the
government lost its appeal on the lack of structural relief in the Supreme Court in 1954, these
negative excess returns were wiped out. Over the three event windows, the excess returns to
stockholders were positive.
TABLE E-4
EXCESS RETURNS TO USM STOCKHOLDERS DURING MAJOR ANTITRUST EVENTS, 1947-54
Event Excess Return in Same
Month
Cumulative Excess Returns Over
Six Months
Complaint Filed (December 1947) -1.6% -0.2%
Lower Court Decision (February 1953) -0.3% +5.9%
Supreme Court Decision (May 1954) +11.3% +27.5%
The 1964 Review of the Decree
After the 1964 review of the evidence, the lower court ruled that sufficient competition
had been introduced into the shoe-machinery market as the result of the decree and that the
decree should stand “unmodified.”141 On review, however, the Supreme Court disagreed and
recommended that the lower court consider “more definitive means” to achieve competition.142
As a result, the company was forced to divest itself of approximately one-third of its remaining
shoe-machinery manufacturing operations in 1969. Thus, structural relief was finally obtained by
the government 22 years after first filing its case at a time when—much as in the case of
Paramount—the U.S. shoe industry began a steep decline.
141.266 F. SUPP. 328 (D.MASS. 1967). 142.391 U.S. 244 (1969).

64
Conclusion
There is at least a modicum of evidence that the antitrust action against USM succeeded
in creating a more competitive shoe-machinery market after 1953. Entry occurred; USM lost
market share; and the second-hand market blossomed. On the other hand, there is no evidence
that the prices of machines fell or that innovation flourished. The ratio of shoe machinery
shipments to shoe shipments did not decline. USM’s return on equity remained relatively
constant, and the stock market reacted benignly to the passage of the case through the courts.
The Television Network Cases
For several decades, the Federal Communications Commission’s (FCC’s) spectrum-
allocation policy limited the number of television broadcast stations in major metropolitan areas.
As a result, there were only three commercial broadcast networks in the United States because a
fourth network could not assemble a large enough roster of affiliates to compete.143 The
inevitable result of this market concentration was public concern over the networks’ power in
several arenas. In the 1960s, the FCC conducted an inquiry into network program procurement
practices that was to result in the promulgation of rules limiting network “ownership” of
programming, including participation in the marketing of reruns of their network series, referred
to as “syndication”.144 At about the same time, the Justice Department launched an inquiry into
network programming practices that would eventually result in antitrust cases filed in 1972
against each of the three networks145 and in three antitrust consent decrees.
Network Television
The commercial television networks developed as organizations to distribute mass
entertainment programming across the country through hundreds of independent and network-
owned local broadcast stations. The exploitation of mass entertainment programming requires
national distribution. But because the FCC limits the number of local stations that any single
143.See Robert W. Crandall, The Economic Case for a Fourth Commercial Television Network, 22 PUB. POL’Y 513-36 (1974). 144.Federal Communications Commission Office of Network Inquiry, Television Network Program Procurement., H.R. REP. NO. 88-281 (1ST SESS. 1963); Federal Communications Commission Office of Network Inquiry, Television Network Program Procurement, PART II, WASHINGTON, 1965.
65
entity may own, a national broadcasting company cannot reach its audience solely through its
own stations. It is forced to negotiate affiliation agreements with broadcast stations throughout
the country.
Network programming is produced by the networks themselves and by hundreds of
different entities generally involved in the theatrical motion picture business.146 Programs are
generally developed as continuing “series” that appear at a regular time period each week.
Because these programs are expensive to produce, few are developed without a distribution
agreement, i.e., a network contract. Networks often provide development funding for “pilot”
productions before committing to a year’s output of a given series.
Popular network television series have value in foreign markets and in further exhibition
as “reruns” in domestic markets. As a result, the seller of a program series will not generally
recover its full production costs from the network run alone. The talent involved in its
production—the actors, producers, directors, etc.—is able to command salaries that reflect its
market value in all of these markets. Thus, when a network purchases a new network series, its
payments for these programs will not fully defray the supplier’s costs.
Early in the development of the television industry, networks shared the risk in
developing program series with their program suppliers by purchasing the rights to distribute the
program as reruns in the domestic market or to the foreign market or by sharing in the
profitability of such “syndication”, or both. In the 1960s, the major program suppliers,
principally the large motion picture companies, argued that this network participation in reruns
was being demanded from them at non-compensatory prices and therefore should be forbidden
by the FCC.147
The Antitrust Suits
When the networks began to enter the motion picture business in the late 1960s, the
Justice Department also began to investigate network program “ownership” and the market
145.THE CASES WERE UNITED STATES V. AMERICAN BROADCASTING, UNITED STATES V. COLUMBIA BROADCASTING , AND UNITED STATES V. NATIONAL BROADCASTING, CIVIL COMPLAINTS (C.D. CAL. 1972). 146.A THOROUGH DISCUSSION OF NETWORK PROGRAM PRODUCTION, ACQUISITION AND DISTRIBUTION MAY BE FOUND
IN Federal Communications Commission, Network Inquiry Special Staff, New Television Networks: Entry, Jurisdiction, Ownership, and Regulation (OCTOBER 1980). (HEREINAFTER, FCC, Special Staff Report.) 147.FCC, Special Staff Report, SUPRA NOTE VOL. II.

66
power of the networks in programming. In 1970, the FCC enacted its financial interest and
syndication rules,148 and the Justice Department’s inquiry languished. The FCC rules banished
the networks from the syndication market and forbade them from acquiring any interests in the
financial returns from the subsequent exhibitions of their programs. The rules did not bar the
networks from producing their own programs or syndicating them in foreign markets. They
could not, however, engage in the domestic syndication—i.e. the sale of reruns to U.S. television
stations—of even those programs that they produced themselves.
The Justice Department inexplicably renewed its interest in the network programming
issues in 1972 and brought suits charging each network with attempting to monopolize the
prime-time programming on its own network. These curious charges implied that each network’s
prime time programming was a separate antitrust market. The case was never fully litigated, and
therefore the absurdity of this theory was never fully exposed to the adversary process. Instead,
the networks each negotiated consent decrees with the Justice Department, which included the
provisions of the FCC’s financial interest and syndication rules and further provisions to limit the
amount of programming that network could produce for itself.149 These decrees thus drove a
greater wedge between distribution and production, requiring the network to purchase a
minimum amount of their programming from outside companies—mostly the motion-picture
companies. They also provided greater assurance to the motion picture companies that the FCC
could not, by itself, repeal the rules that barred the networks from the syndication market and
from the purchase of financial interests in these programs. The networks would now be barred
from these activities by federal antitrust decrees as well.
The Decrees and Related FCC regulations
From the outset, the case against network program “ownership” was one of network
monopsony power.150 The networks allegedly used this power to depress the total price of their
programming—the price for the initial network run less the expected returns from their right to
148.FOR DETAILS OF THESE RULES, SEE FCC, Special Staff Report, SUPRA NOTE VOL. II. 149.NBC ENTERED INTO A DECREE IN 1976, AND CBS AND ABC BOTH FOLLOWED IN 1980. 150.CRITICAL ANALYSES OF THE ASSUMPTION THAT NETWORKS HAD MONOPSONY POWER MAY BE FOUND IN ROBERT W. CRANDALL, FCC REGULATION, MONOPSONY, AND NETWORK TELEVISION PROGRAM COSTS, 3 Bell J. Econ. & Mgmt. Sci. 483-508 (1972), AND
FRANKLIN M. FISHER, THE FINANCIAL INTEREST AND SYNDICATION RULES IN NETWORK TELEVISION: REGULATORY FANTASY AND REALITY, IN Antitrust and Regulation: Essays in Memory of John J. McGowan 263-298 (FRANKLIN M. FISHER ED. 1985).

67
syndicate it (if they obtained it) and any interest they obtained in the profits from subsequent
distribution of the programming. The popular version of this theory, advanced by the motion
picture studios, was that the networks used their power to force their suppliers to accept non-
compensatory prices, but such a theory is obviously incorrect. The networks could not force the
Hollywood studios to provide them programming at a loss. To the extent that the monopsony
theory had any merit, such power must have been exercised through a reduction in the number of
programs purchased each year. If the networks had monopsony power, an unlikely possibility, it
was because FCC spectrum-allocation policies limited the number of broadcast networks to
three.
The irony of the network cases is that the originator of the theory of network dominance
over programming—the FCC—subsequently ruled that the networks must reduce their prime-
time programming by one-half hour per day on weekdays. This “Prime Time Access Rule” was
promulgated in 1972 to introduce more distributors into national television by the same agency
that had limited the number of such distributors through its limitation on the number of broadcast
stations it allowed in each market.151 The FCC now asserted that it wished to increase program
diversity by simply changing the identity of the three distributors for this one-half hour per day.
Unfortunately, the Prime Time Access Rule did not create new “networks”, but rather spawned a
large number of inexpensive game shows that typically carried more advertising minutes than the
network series they displaced.
Curiously, the three national television networks were even supportive of the Prime Time
Access Rule a few years after it was promulgated. They saw the Rule as beneficial as long as it
reduced the supply of quality programming and increased advertisers’ demand for commercials
in their reduced output—particularly in periods of economic recession. Subsequently, the
networks agreed to limit their own program production in the antitrust consent decrees.152 They
were being forced to reduce programming hours anyway and did not view the threat of self-
supply as an important source of bargaining power in procuring programs from the Hollywood
studios.
151.SEE FCC, Special Staff Report, SUPRA NOTE VOL. II, AT 736-41. 152.UNITED STATES V. NATIONAL BROADCASTING, 449 F.SUPP. 1127 (C.D. CAL. 1978), AFF'D, 603 F.2D 227 (9TH
CIR. 1979), CERT. DENIED, 444 U.S. 991 (1979); UNITED STATES V. AMERICAN BROADCASTING, 45 FED. REG. 58,442 (1980); UNITED STATES V. CBS, 45 FED. REG. 34,464 (1980).

68
The Result of the Decrees
The decrees and the FCC syndication rules could not have cured network monopsony
power, even if such power had existed. The number of buyers of programming was unaffected
by these interventions because they did not increase the number of networks. These three
networks had to continue to bid for programming against motion picture producers, the live
theater, and other media who employed actors, directors, cameramen, film-tape editors, etc.
However, the decrees and the FCC rules did reduce the number of firms in the
syndication market and the number of large companies who could finance risky programming
series by obtaining a share of their downstream returns.
Prior to the FCC rules, each network had about 6 percent of national program syndication
revenues. In 1971, before the FCC rules began to have an effect on syndication markets, the
seven major motion picture studios’ domestic syndication accounted for just 22.5 percent of the
total viewer hours of nationally syndicated programs. In 1981, the year after the consent decree
was negotiated, this share had risen to 36.9 percent. By 1989, the seven motion picture
companies accounted for 41.1 percent of viewer hours from national syndication and 58.5
percent of the viewer hours from syndicating network reruns.153 This increase in concentration
was the direct result of banning three of their major competitors from the syndication market.
Equally important was the effect the FCC rules (and the network decrees that incorporated them)
had on risk sharing of new programming development. In the 1969-70 television season, the four
largest suppliers of new network programming accounted for 33.5 percent of revenues from
network program purchases. By 1988-89, this four-firm share had risen to 47.1 percent because
the networks could no longer share in the risk of programming by purchasing syndication
interests in these programs.154 Smaller producers were forced to seek other sources of risk
capital, and the large motion picture companies were the obvious alternative.
153.THESE DATA ARE DERIVED FROM ROBERT W. CRANDALL, “THE ECONOMIC CASE AGAINST THE FCC’S
TELEVISION NETWORK FINANCIAL INTEREST AND SYNDICATION RULES”, SUBMITTED IN THE FEDERAL
COMMUNICATIONS COMMISSION’S IN THE MATTER OF THE SYNDICATION AN FINANCIAL INTEREST RULES, MM DOCKET NO. 90-162, 1990, TABLE V.2. 154.ID. AT TABLE V.1.
69
Because the networks were uniquely positioned to bear program risk, denying them the
right to acquire financial interests in the programs they purchased and limiting their ability to
produce their own programs changed the composition of their new program series. The risk of
innovative new programming had to be borne by others who were less well positioned to bear it.
As a result, the variance in network program ratings declined after 1972, reflecting a program
acquisition process that resulted in less daring, and therefore less risky, new program series.155
Further evidence of this decline in risk taking may be found in the variance in the average
number of years that prime-time network shows were kept on the air. Between 1963 and 1972,
this variance in the length of run of new series increased, but after 1972 it decreased steadily,
reflecting the fact that network programming was less innovative and thus less subject to early
cancellation after the FCC’s rules that were incorporated into the antitrust consent decrees were
promulgated.156
The FCC rules would have had adverse effects on innovation in network television
programming by themselves, but the consent decrees’ limitation on the networks’ ability to
supply their own programs surely exacerbated this unfortunate result. The networks could not
underwrite the risks themselves through self-supply, but were instead increasingly dependent on
the large Hollywood studios for programming. The result was less innovative, risky
programming.
A Concluding Assessment
The network antitrust cases, like the 1970 FCC Financial Interest and Syndication Rules,
were based on a faulty analysis of the television network program acquisition process. The
networks purchased programs from a large number of suppliers and had to compete with other
media to attract such programming and the talent required for its production. Barring the
networks from owning rights or profit shares in later exhibitions of this programming
(syndication) and limiting their ability to supply their own programming led to an increase in
concentration in program supply. It also reduced the efficiency of bearing the risk of innovative
new programming. By the time the FCC rules were repealed and the network antitrust decrees
155.ID. AT 31. 156.Bruce M. Owen & Steven S. Wildman, Video Economics CH. 5 (HARVARD UNIVERSITY PRESS 1992).
70
were vacated, these results were widely acknowledged.157 Nevertheless, it was not until cable
television had decimated the networks’ share of total television viewing that the regulators and
the Justice Department could agree to end these unfortunate restrictions on efficient program
supply.
AT&T
The 1974 AT&T case is often cited as an overwhelming government antitrust policy
success because long-distance competition grew substantially soon after the breakup of AT&T in
1984. In fact, as we shall see, it was not the vertical divestiture in the decree but a seemingly
small change in one regulatory requirement that provided the environment that propelled
competition. Federal regulators could have enacted this provision ten years earlier and avoided
the necessity of breaking up AT&T.
Origins of Telephony
The telephone industry in the United States has been tightly regulated by state and federal
authorities for much of the past century. Although it was often assumed to have many of the
characteristics of “natural monopoly,” the telephone industry did not evolve naturally through
market forces. Instead, its structure was heavily influenced and even dictated by regulatory and
antitrust authorities.
The telephone sector began to develop in the late 19th century as the result of several
patents, the most important of which were registered by Alexander Graham Bell. Telephone
exchanges were developed to route calls among these patented devices. In the U.S., these
exchanges were developed by the Bell and related companies almost exclusively until the
expiration of the original patents in 1893. Thereafter, “independent” local telephone companies
began to proliferate in major cities.158
At first, telephony was local because a satisfactory technology for transmitting calls over
long distances did not exist. However, improvements in technology and the development of the
vacuum tube allowed calls to be transmitted over increasing distance. The Bell companies—
157.SEE, FOR EXAMPLE, THE ANALYSIS OF THE FCC’S ON NETWORK INQUIRY SPECIAL STAFF IN FCC, Special Staff Report, SUPRA NOTE Fisher, SUPRA NOTE AND Owen & Wildman, SUPRA NOTE.

71
under the parentage of the American Telephone and Telegraph Company (AT&T)—began to
patent and deploy this technology, but they often refused to allow the independent telephone
companies to interconnect with their “long-distance” service. As a result of this handicap and the
intense price competition with the Bell companies, many of the independents eventually chose
simply to sell their companies to AT&T. These practices (and others) placed AT&T in the cross-
hairs of the antitrust authorities for the first time in the early part of the 20th century. To avoid a
Sherman Act suit, AT&T agreed to cease its acquisition of independent telephone companies, to
provide interconnection, to sell certain assets, and to submit to federal regulation.
Industry Structure before 1974
After World War I, AT&T was permitted to resume its acquisition of independent
telephone companies.159 By the 1930s, it controlled approximately 80 percent of local exchange
lines in the country. It was also the country’s only national long-distance company. Through its
Western Electric operations, it produced most of its own transmission, switching, and terminal
equipment, much of which was developed from ideas that originated in its Bell Laboratories.
Throughout the interwar period, AT&T and the smaller “independent” telephone companies
were regulated by state regulatory commissions and by federal authorities. The 1934 Federal
Communications Act established the Federal Communications Commission (FCC) as the
regulator of interstate services, but the FCC was not very active in regulating telephony until
after World War II. During the interwar period, most of the regulatory and antitrust concern
about AT&T centered on its ownership of Western Electric and the effect of such ownership on
the prices charged to AT&T’s operating divisions.
After World War II, the states and the FCC responded to a court decision that required
that the joint (nontraffic-sensitive) costs of local networks be recovered in part from the interstate
jurisdiction—i.e., from interstate long-distance services. This resulted in an increasing share of
these local-network costs being recovered from interstate calls through an obscure process,
which, in turn, led to long-distance calls being priced far above long-run incremental cost.
158.THIS DISCUSSION OF THE EARLY HISTORY OF THE U.S. TELEPHONE INDUSTRY IS BASED PRINCIPALLY ON Gerald W. Brock, The Telecommunications Industry (HARVARD UNIVERSITY PRESS 1981). 159.THE WILLIS-GRAHAM ACT OF 1921 EXEMPTED TELEPHONE MERGERS FROM THE ANTITRUST LAWS.

72
Through this artifice, the states were able to keep the price of residential connections low,
particularly in high-cost, low-density areas.160
In the 1960s, the FCC began to consider more liberal policies towards entry of
competitive carriers in interstate services. In 1969-71, it opened dedicated “private-line” business
services to entry, but it did not extend this entry to ordinary (switched) interstate long-distance
services, whose rates had been kept far above long-run incremental cost. The new entrants into
private-line services could easily extend their operations into the interstate long-distance market
if they obtained the FCC’s permission to do so and could arrange for the local AT&T and
independent companies to deliver their calls to the called parties. Alternatively, they could do so
surreptitiously by leasing connections that would deliver such services while pretending to offer
only dedicated private-line service.
MCI availed itself of the latter opportunity in 1974, offering ordinary switched long-
distance service without FCC authority. The FCC responded by attempting to banish MCI from
offering this service, but it was rebuffed by the federal courts.161 In this rather unusual manner,
long-distance competition was born, and the FCC was altogether unprepared to deal with it. The
entire long-distance network had evolved as a monopoly of AT&T, whose network was
connected to those of the monopoly local carriers, including those of its own Bell companies.
MCI could not obtain equivalent connections because AT&T’s switches were not designed to
offer equal access to competitive long-distance carriers.
At approximately the same time, AT&T and the other independent (monopoly) local
carriers controlled the use of customer terminal equipment on their networks. Telephone service
was offered under state tariffs that did not allow customers to connect their own equipment to
send or receive calls. A series of legal challenges to these restrictive provisions of the tariffs
narrowed the ability of the companies to limit non-interfering customer attachments, but it was
not until the mid 1970s that the FCC tried to open all terminal equipment to competition. By
1976, the courts had rebuffed state regulators’ challenges to the FCC’s terminal equipment
160.Robert W. Crandall & Leonard Waverman, Who Pays for Universal Service? When Telephone Subsidies Become Transparent (BROOKINGS 2000). 161.MCI TELECOMMUNICATIONS V. FCC, 561 F.2D 365 (D.C. CIR. 1977), CERT. DENIED, 434 U.S. 1040 (1978); MCI COMMUNICATIONS V. FCC, 580 F.2D 590 (D.C.CIR. 1978), CERT. DENIED, 439 U.S. 980 (1978).

73
policy, allowing competitors to sell customers telephone handsets, answering machines, and
other devices as long as they were certified as posing no threat to the operation of the network.162
The 1974 Antitrust Case and the 1982 Decree
Antitrust investigations had dogged AT&T for much of its existence. In 1913, AT&T
avoided antitrust prosecution through the Kingsbury Commitment, in which AT&T agreed to
dispose of certain assets, to cease its aggressive acquisition policy, and to interconnect its long-
distance network with independent telephone companies. A 1938 FCC report that was never
released on the relationship between Western Electric and AT&T’s operating divisions
eventually led to a 1949 Sherman Act case whose objective was divestiture of Western Electric.
This case was settled in 1956 without divestiture, but with a requirement that AT&T confine its
activities to “common carrier communications services.”163
Two decades later, as the FCC moved slowly to open interstate services and terminal
equipment to competition, the incumbent carriers—particularly AT&T and its Bell operating
companies—were far from cooperative with the new competitors. AT&T availed itself of every
opportunity to argue in regulatory and legislative proceedings against the development of
competition. At the same time, it often denied the nascent competitors interconnection with its
network facilities or at least delayed such interconnection through aggressive exploitation of the
regulatory processes available to it. These actions invited private antitrust suits164 and renewed
scrutiny from the U.S. Department of Justice.
The private antitrust suits brought by AT&T’s new long-distance competitors were
winding their way through the federal courts when the government filed a Section 2 Sherman
Act suit against AT&T on November 20, 1974.165 The complaint alleged monopolization of
long-distance services and telecommunications equipment by AT&T and its various subsidiaries.
The case languished for four years until reassigned in 1978 to Judge Harold H. Greene, who
began to guide it towards trial in 1981. After the government presented its case, Judge Greene
162.NORTH CAROLINA UTILITY COMMISSION V. FCC, 537 F.2D 787 (4TH
CIR, 1976). 163.UNITED STATES V. WESTERN ELECTRIC, CIVIL ACTION NO. 17-49, C.A. 82-0192 (D.N.J. JAN. 24, 1956). 164.THESE CASES INCLUDED MCI COMMUNICATIONS V. AT&T, 708 F.2D 1081 (7TH
CIR. 1983); SOUTHERN
COMMUNICATIONS V. AT&T, 556 F. SUPP. 825 (D.D.C. 1983); AND MID-TEXAS COMMUNICATIONS SYSTEMS V. AT&T, 615 F.2D 1372 (5TH
CIR. 1980). 165.UNITED STATES V. AT&T, CIVIL ACTION NO. 74-1698 (D.D.C. NOV. 20, 1974).
74
decisively rejected AT&T’s motion for summary judgment, and the parties quickly moved to
negotiate a decree that would settle the case.166
The government’s case relied heavily on the theory that AT&T’s ownership of local
operating companies had provided it with the incentive and the ability to exclude competitors in
long-distance services and telecommunications equipment manufacture by denying competitors’
services or equipment interconnection with the local Bell operating companies. As a result, the
central provision of the decree was a total divestiture of the local operating companies from the
rest of AT&T. This separation of local monopolies—which were not likely to be threatened by
competitive entry anytime soon—from the rest of AT&T’s businesses would allow competitors
to invade these latter businesses and compete with AT&T on an even footing since the divested
Bell companies would no longer have any incentive to exclude competitors.
Technically a “Modification of Final Judgment” (MFJ) from the 1949 antitrust case
against AT&T, the 1982 decree required that the divested Bell companies be barred from
offering long-distance services outside “Local Access and Transport Areas” (LATAs), which
were drawn around each Bell Company’s major service areas. In some cases, the LATAs were
only as large as a metropolitan area; in less populous regions, one LATA might include a large
state, such as South Dakota. In addition, the divested Bell companies were barred from
manufacturing telecommunications equipment and from offering “information” services without
the prior approval of the court. As we shall see, the most important provision of the decree was a
requirement that the Bell companies modify their switching facilities to provide equal access to
all long-distance competitors, a requirement that was subsequently extended to the independent
local companies by the FCC.
Administering the Decree—Regulation from the Bench
The decree became a major enterprise for Judge Greene’s court and the staff of the
Antitrust Division of the Justice Department. Many initial decisions had to be made over the
design of the LATAs, the number of Regional Bell Operating Companies (RBOCs) to be
established, and the method of separating AT&T’s local assets from all other assets. Part of Bell
Laboratories was spun off as Bellcore, a research organization to be owned jointly by the
166.UNITED STATES V. AT&T, 552 F. SUPP. 131 (D.D.C. 1982).

75
divested RBOCs. Disputes arose over who should own the inside wiring in a customer’s
premises, how the costs of conversion to equal access should be funded, and who should offer
Yellow Pages directories.
In the twelve years in which the decree was in force, Judge Greene’s court was
essentially a third regulator of the telecommunications sector (the other two were the state
regulators and the FCC), and many of his decisions were appealed to the federal appellate courts.
Judge Greene was very reluctant to cede control over RBOC entry into advanced information
services even though the antitrust suit did not involve allegations of anticompetitive Bell
practices in information services. He was eventually reversed by the Court of Appeals, which
ruled that the decree could not restrain RBOC information-services offerings.167
Equally important, the trial court wrestled with the definition of “manufacturing.” At
issue was whether basic research and engineering of new equipment or software were to be
included in the proscribed Bell activities. The court eventually settled on allowing the Bell
companies to develop or modify software that is integral to the operation of hardware designed
to deliver local services. But it was always difficult to delineate research and development
activities in such a manner.168
Clearly, the most contentious issue in the twelve years after divestiture involved the
restriction on interLATA services—i.e., the long-distance restriction. The divested Bell
companies could offer such services over their wireless networks, but not from their in-region
wireline networks. Many enhanced services might require the downloading of traffic across
LATA boundaries even though the service itself was local. As the Internet developed, the
distinctions between local, intraLATA, and interLATA clearly became very blurred. Was an
Internet connection that communicated with a server across the same city different from one that
communicated with a server across the country? Could the Bell companies offer basic Internet
service to their customers, but not provide the “backbone” services that connected its ISP to the
Internet “cloud”?
167.UNITED STATES V. WESTERN ELECTRIC, 951 F.2D 1324 (D.C. CIR. 1991). 168.SEE Michael K. Kellogg, John Thorne, & Peter W. Huber, Federal Telecommunications Law (LITTLE BROWN & CO. 1992), SECTION 6.5 FOR A THOROUGH DISCUSSION OF THESE PROBLEMS.

76
The premise of the decree was that long-distance service and manufacturing were to be
separated from the delivery of local/exchange service as long as the latter remained a monopoly.
But how much competition would be required to permit the court to allow Bell company entry
into interLATA services? Given the rapid growth of competition in central business districts
from new fiber-optic Competitive Access Providers (CAPs), would the Bell companies be
permitted to offer long-distance service to large business customers? Would wireless competition
alleviate the local-monopoly problem sufficiently to assuage the fears of the court about the
ability of the Bell companies to frustrate long-distance competition?
Many of the questions lingered for a long time before the court. Eventually, frustrated
Bell companies filed a petition to vacate the entire line-of-business provisions of the decree, a
petition that was still pending before the court when Congress interceded. In 1996, Congress
passed and the President signed the Telecommunications Act of 1996169 which vacated the 1982
AT&T decree and substituted new regulatory provisions that the Bell companies must satisfy on a
state-by-state basis in order to be permitted to offer in-region interLATA long-distance service.
Nearly five years later, only two companies—Verizon and SBC—have succeeded in satisfying
regulators that they have met these requirements, and then for only two states—New York and
Texas.
Evaluating the Decree
It is now commonplace that the AT&T decree worked in that it was associated with a
substantial increase in competition in long-distance services. Customer premises equipment had
already become very competitive before 1984; hence, there is little attempt to link increased
competition in the manufacture of terminal equipment to the decree. But was the decree
responsible for increasing long-distance competition, and—more particularly—was vertical
divestiture essential to promote competition?
At the dawn of divestiture, 1984, AT&T had more than 90 percent of all long-distance
carrier revenues.170 Indeed, in the first year of divestiture, there were only two national
169.47 U.S.C. § 271. 170.LONG-DISTANCE CARRIER REVENUES DO NOT INCLUDE THE LONG-DISTANCE REVENUES OF LOCAL EXCHANGE
COMPANIES, BUT THE LOCAL BELL COMPANIES DID NOT COMPETE OUTSIDE OF THEIR LATAS BECAUSE OF THE
DECREE, AND OTHER LOCAL COMPANIES DID NOT OFFER INTERLATA SERVICE TO ANY MAJOR EXTENT. THUS, THE

77
competitors for AT&T’s services—MCI and GTE-Sprint (Table G-1). This was fully a decade
after MCI began offering switched interstate service, and the FCC began wrestling with what to
about it. Over the next five years, 1985-89, AT&T would lose another 22.6 percentage points of
market share to new rivals, including several new entrants, many of which would eventually
become part of Worldcom. Thus, the decree appears to have worked much better than FCC
regulation in promoting competitive entry. But what accounts for this acceleration?
It is possible that the vertical divestiture in the decree is, by itself, responsible for the
acceleration of long-distance competition, but if this were true the U.S. should be enjoying the
most rapid advance in long-distance competition of any country in the world. No other country
has chosen to divorce its long distance companies from their local operations. Canada, Australia,
New Zealand, and the EU countries have opened long-distance services to competition without
requiring such divestiture. The EU required all countries to open their markets on January 1,
1998, but the United Kingdom began much earlier—in 1985—by allowing Mercury (Cable &
Wireless) to enter the long-distance market. Canada followed much later, opening long distance
to competition in 1992. Neither required vertical divestiture, but Canada mandated equal access
for all carriers while the United Kingdom did not. The differences in the rate of growth of
entrants in Canada, the United Kingdom, and the U.S. are quite remarkable.
Table G-1 REVENUE SHARES OF U.S. LONG-DISTANCE CARRIERS
(PERCENT OF TOTAL REVENUES) Year AT&T MCI Sprint WorldCom Others
1984 90.1 4.5 2.7 -- 2.6
1985 86.3 5.5 2.6 -- 5.6
1986 81.9 7.6 4.3 -- 6.3
1987 78.6 8.8 5.8 -- 6.8
1988 74.6 10.3 7.2 -- 8.0
1989 67.5 12.1 8.4 0.2 11.8
1990 65.0 14.2 9.7 0.3 10.8
1991 63.2 15.2 9.9 0.5 11.3
CONCENTRATION OF LONG DISTANCE CARRIER REVENUES PROVIDE A GOOD MEASURE OF MARKET CONCENTRATION IN
THE INTERLATA MARKET, WHICH ACCOUNTS FOR ABOUT THREE-FOURTHS OF ALL LONG DISTANCE SERVICE.

78
1992 60.8 16.7 9.7 1.4 11.5
1993 58.1 17.8 10 1.9 12.3
1994 55.2 17.4 10.1 3.3 14.0
1995 51.8 19.7 9.8 4.9 13.8
1996 47.9 20.0 9.7 5.5 17.0
1997 44.5 19.4 9.7 6.7 19.8
Note: Excludes local-exchange carriers’ long-distance revenues, but includes both intrastate and
interstate revenues of long-distance carriers.
Source: James Zolnierek, Katie Rangos & James Eisner, Long Distance Market Shares: Fourth Quarter
1998, Industry Analysis Division, Common Carrier Bureau, Federal Communications Commission
(Mar. 1999).
The United Kingdom privatized British Telecom (BT) in 1984 and opened the long-
distance market to competition shortly thereafter. It subsequently licensed new cable television
companies to offer telephone service, both local and long distance. However, the UK has never
required British Telecom to modify its switches so as to offer equal access to its rivals in long
distance. As a result, competition in long distance has increased steadily but not dramatically. By
1998, fourteen years after Mercury’s entry, BT still had about 73 percent of the long distance
market.171
By contrast, Canada did not begin to allow entry into switched long-distance services until
late 1992. Though not requiring the incumbent long-distance carrier, Bell Canada, to divest its
local operations in the most populous two provinces, Ontario and Quebec, the Canadian Radio-
Television and Telecommunications Commission (CRTC) did require all local companies to
convert their switches to equal access in a very short period of time. The result has been quite
notable (See Table G-2). In less than seven years, entrants have amassed a larger share of the
long-distance market than new entrants have obtained in the UK in twice the amount of time.
Indeed, Canadian entrants have the same market share as entrants had in the U.S. in 1990, fully
16 years after MCI’s entry into switched long distance.
171.FIFTH REPORT ON THE IMPLEMENTATION OF THE TELECOMMUNICATIONS REGULATORY PACKAGE: COMMUNICATION FROM THE COMMISSION TO THE EUROPEAN PARLIAMENT, THE COUNCIL, THE ECONOMIC AND
SOCIAL COMMITTEE AND THE COMMITTEE OF THE REGIONS, COM (99) 537 FINAL AT 151, ANNEX 4.2.

79
TABLE G-2 CANADIAN LONG-DISTANCE MARKET SHARES, 1995-98
(PERCENTAGE OF MINUTES)
Company 1995 1996 1997 1998
1999
(Q2)
Former Stentor (Incumbent) Companies 78 71 66 64 65
AT&T Canada 8 11 12 10 -
Sprint Canada 8 11 14 12 -
Others 6 6 7 14 -
Total Non-Incumbents 22 28 33 36 35
Source: 1995: Stentor Hearings Evidence in CRTC Forbearance Proceeding; 1996-98
Call-Net Interrogatory Responses in CRTC 99-5.
The EU liberalization regime has much more extensive interconnection requirements than
the simple provision of equal access. Entrants are able to lease network elements from the
incumbent carriers and obtain interconnection in a variety of ways, much as in the post-1996
U.S. environment. As a result, entry into long-distance services has led to a substantial erosion of
the incumbent national company’s long-distance market shares in some countries in just one year
even though the incumbents have not been required to divest any of their operations. In Germany
and Sweden, for example, the incumbents lost 15 to 20 percent of their long-distance market in
just one year.172
These data suggest that the vertical-divestiture provisions in the AT&T decree were not
responsible for the degree to which the U.S. long-distance market has become less concentrated.
Indeed, the banishing of the divested Bell companies from interLATA services probably added
to market concentration over the 1984-99 period. All that is required to develop a more
competitive long-distance market is the provision of interconnection with local carriers. If this
interconnection is provided to all carriers on an equal basis, as in Canada, vertical divestiture is
not required. The vertically integrated local carrier apparently cannot engage in any “subtle”
discrimination that impedes the development of long-distance competition as long as its switches
172.European Commission, SUPRA NOTE.
80
originate and terminate its rivals’ calls in the same fashion.173 Given the experiences outside the
U.S., it appears that equal access is sufficient for the development of long-distance competition.
Data on average transactions prices in the long-distance market are difficult to obtain in countries
in which liberalization has occurred. Comparisons of undiscounted posted peak or off-peak
prices can be misleading when numerous discount plans are offered by rival carriers. To
demonstrate this, I reproduce in Figure G-1 two examples of tariffed rates offered by AT&T and
Sprint: a daytime rate for AT&T and a lower, off-peak rate for Sprint. Note how these declined
from the early 1980s to 1990-91, but stabilized thereafter.174 However, the average interstate
long distance revenues per minute as estimated by the FCC continued to decline slowly after
1990.
173.B. DOUGLAS BERNHEIM AND ROBERT D. WILLIG MAKE THIS ARGUMENT IN The Scope of Competition in Telecommunications, DRAFT (AMERICAN ENTERPRISE INSTITUTE 1996). 174.ALL RATES ARE TAKEN FROM THE FCC’S Statistics of Communications Common Carriers, ANNUAL EDITIONS. THEY ARE RESIDENTIAL RATES DEFLATED BY THE OVERALL CONSUMER PRICE INDEX.
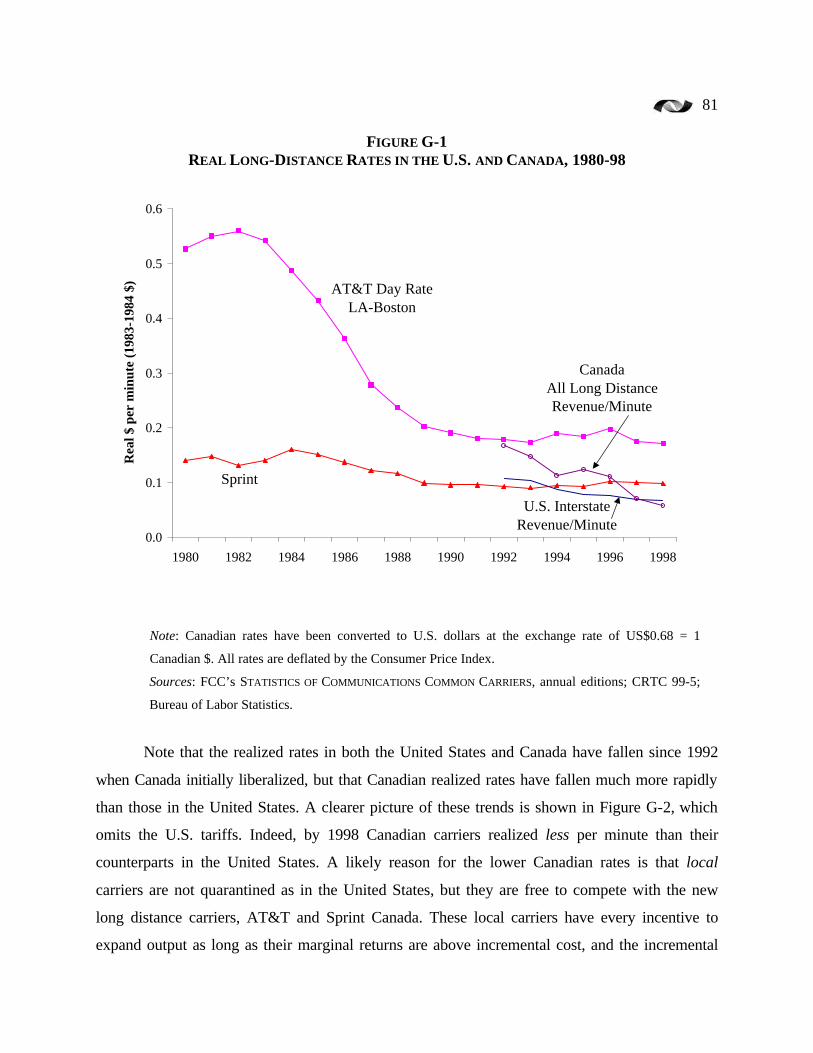
81
FIGURE G-1 REAL LONG-DISTANCE RATES IN THE U.S. AND CANADA, 1980-98
Note: Canadian rates have been converted to U.S. dollars at the exchange rate of US$0.68 = 1
Canadian $. All rates are deflated by the Consumer Price Index.
Sources: FCC’s STATISTICS OF COMMUNICATIONS COMMON CARRIERS, annual editions; CRTC 99-5;
Bureau of Labor Statistics.
Note that the realized rates in both the United States and Canada have fallen since 1992
when Canada initially liberalized, but that Canadian realized rates have fallen much more rapidly
than those in the United States. A clearer picture of these trends is shown in Figure G-2, which
omits the U.S. tariffs. Indeed, by 1998 Canadian carriers realized less per minute than their
counterparts in the United States. A likely reason for the lower Canadian rates is that local
carriers are not quarantined as in the United States, but they are free to compete with the new
long distance carriers, AT&T and Sprint Canada. These local carriers have every incentive to
expand output as long as their marginal returns are above incremental cost, and the incremental
0.0
0.1
0.2
0.3
0.4
0.5
0.6
1980 1982 1984 1986 1988 1990 1992 1994 1996 1998
Rea
l $ p
er m
inut
e (1
983-
1984
$) AT&T Day Rate
LA-Boston
Sprint Night/We
CanadaAll Long Distance Revenue/Minute
U.S. Interstate Revenue/Minute
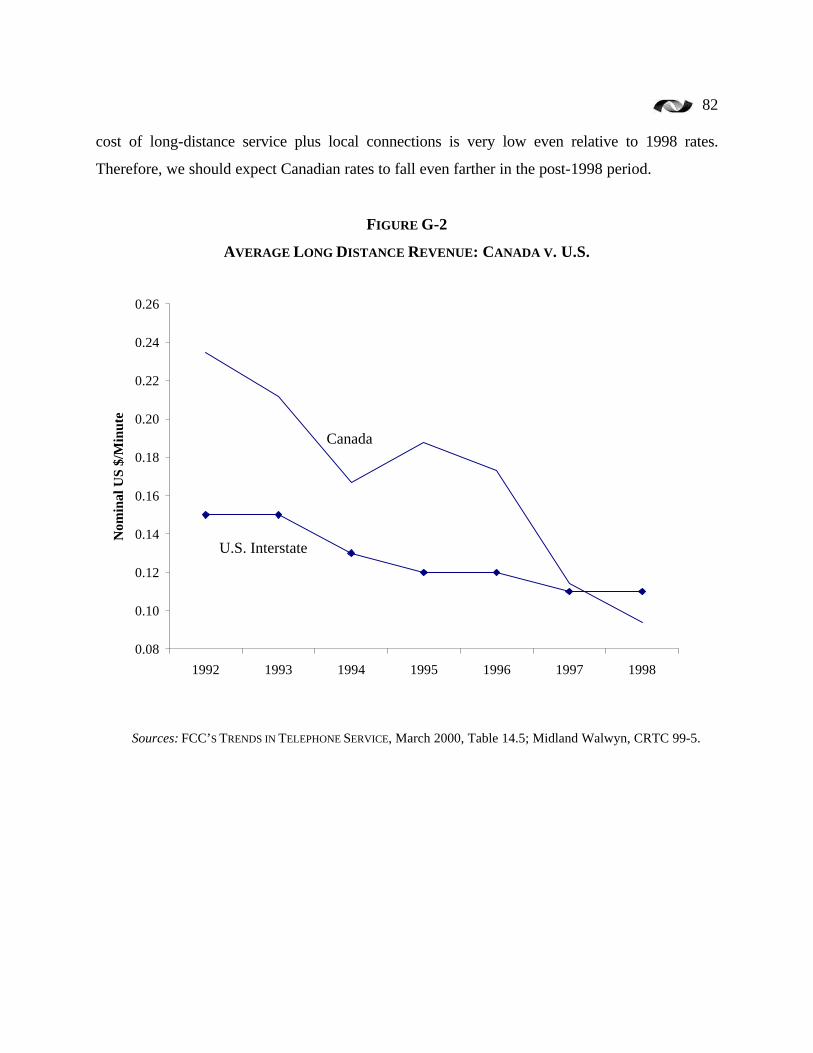
82
cost of long-distance service plus local connections is very low even relative to 1998 rates.
Therefore, we should expect Canadian rates to fall even farther in the post-1998 period.
FIGURE G-2
AVERAGE LONG DISTANCE REVENUE: CANADA V. U.S.
Sources: FCC’S TRENDS IN TELEPHONE SERVICE, March 2000, Table 14.5; Midland Walwyn, CRTC 99-5.
0.08
0.10
0.12
0.14
0.16
0.18
0.20
0.22
0.24
0.26
1992 1993 1994 1995 1996 1997 1998
Nom
inal
US
$/M
inut
e
U.S. Interstate
Canada
83
Lessons for the Future
In an earlier publication, I found that the results of the 1984 decree were on balance
favorable for two reasons: (1) the increase in long-distance competition that it created and (2) the
acceleration in productivity in the industry after 1984.175 As I have shown in this paper, however,
vertical divestiture was not required in order to unleash competition. The imposition of equal-
access arrangements by the regulator—and deregulation of output prices—was all that was
necessary. Nor was it necessary to require vertical divestiture to stimulate productivity growth.
Competition for AT&T from MCI, Sprint, Qwest, Worldcom, and numerous others would surely
have sufficed. AT&T subsequently realized that vertical integration between local and long-
distance operations is necessary in the modern telecommunications era. As a result, it has spent
$110 billion to acquire two of the country’s largest cable-television companies, which it will
convert to the local delivery of Internet and telephony—as well as video.
Perhaps just as revealing is the voluntary divestiture of manufacturing from AT&T’s
operations. In 1998, AT&T spun off Lucent’s manufacturing division because it felt that Lucent
would be more valuable if freed from AT&T’s patronage. The antitrust authorities had left
manufacturing with AT&T, but divested it of its local operating companies. The market is now
reversing those decisions in a much more competitive era. Similarly, in Canada, Bell Canada is
keeping its operating companies but voluntarily divesting itself of Nortel, its manufacturing
company. Competition in manufacturing and long distance is thriving on both sides of the border
even if the U.S. now appears to be lagging in the growth of competition in long distance. Had
antitrust authorities focused their attention on the actions of state or provincial authorities years
ago, competition in local services might also be a reality today.
Two Other Single-Firm Cases
I began this article with a review of Section 2 cases in which the government achieved a
consent decree or a court finding against the defendants. Of 423 such cases, only three or four
involved single-firm monopolization not achieved through a series of mergers. Of these, I have
175. Robert W. Crandall, After the Breakup: U.S. Telecommunications in a More Competitive Era, CH. 6 (BROOKINGS INSTITUTION 1991).
84
reviewed only United Shoe Machinery and AT&T. One of the interesting lessons of Section 2
case law is that the most important cases usually involved monopolization through merger.
There remain two single-firm cases that I have not analyzed in depth: IBM (1952) and Kansas
City Star (1953). Neither of these cases would qualify for “landmark” status, and there is very
little in the economics literature on them.
IBM
The 1952 Section 2 case against IBM has many similarities to the United Shoe Machinery
case. IBM dominated the “tabulating machine” business and the related business of tabulating
cards, or “punch cards,” long before the commercial development of the computer. The Justice
Department filed the suit against IBM in 1952, alleging that it had achieved monopoly power in
tabulating machines through its lease-only policy and a restrictive patent policy. In addition,
IBM allegedly enjoyed monopoly power in tabulating cards, which it maintained in part through
discriminatory pricing.
IBM settled the case in 1956 by agreeing to sell some rotary presses and to end its
discriminatory pricing. In addition, it would have to divest some of its card manufacturing
capacity if it had not reduced its share of this market to 50 percent by 1962. Since it only reduced
its share to 53 percent by the required date, some divestiture was required. In addition, IBM was
required by the decree to set up a separate “service bureau” through which it offered service to
customers who did not lease or own tabulating machines. This service bureau was subsequently
sold to Control Data Corporation to settle a private suit.
Obviously, by 1962 the computer was rapidly replacing tabulating machines. Although
the decree led to greater competition in tabulating cards, at least one student of the decree claims
that it was a failure because the new firms failed to achieve sustainable profits.176 There is little
evidence, however, that this antitrust action had any favorable effects on competition in the
computer industry, which was already beginning to replace tabulating machines in 1956, when
the decree was signed.177 Indeed, IBM quickly vaulted to a dominant position in mainframe
176.Waldman, SUPRA NOTE AT 141. 177.SEE RONALD P. WILDER THE ELECTRONIC DATA PROCESSING INDUSTRY: MARKET STRUCTURE AND POLICY ISSUES, Antitrust Bull. 25-47 (1975). WILDER VIEWS THE SERVICE-BUREAU PROVISION OF THE DECREE AS A MILD SUCCESS.

85
computers during this period, leading the Justice Department to file another Section 2 case
against it in 1969. This latter case was eventually dropped in 1982, in no small part because the
market had changed once again.178
If there is a lesson in these antitrust actions against IBM it is that federal antitrust actions
were far behind market developments. The replacement of tabulating machines by computers
was underway when IBM settled the first case, and IBM was losing its market power in
computers in the 1969-82 period to upstart firms offering mini-computers and personal
computers. Competitive forces eroded IBM's position, leaving antitrust at the gate.
Kansas City Star
The Kansas City Star case involved both criminal and civil complaints under the
Sherman Act brought in 1953 that alleged monopolization and attempts to monopolize the news
and advertising markets in the Kansas City metropolitan area.179 Most of the charges involved
exclusive dealing, tying arrangements and discriminatory pricing across the Star's newspapers in
the 1930s. However, the government also alleged tying arrangements between the Star's
newspapers and its broadcasting stations in Kansas City, WDAF and WDAF-TV. Cross-
ownership of media has been a major issue at the Federal Trade Commission for decades, but the
Kansas City Star case antedates even the Commission's lengthy record on the issue.
The Antitrust Case
The Kansas City Star newspapers had obtained a dominant position in the dissemination
of news and advertising in the Kansas City area through a variety of pricing policies and
acquisitions throughout the first half of the 20th century. By 1953, the Star's three newspapers—
one daily morning edition, one daily evening edition, and a single Sunday newspaper—averaged
about 360,000 in circulation. The nearest competitor, across the river in Kansas, had less than
28,000 in daily circulation. The lower court refused to admit evidence on the degree to which
national publications or newspapers in adjacent markets competed for readership and advertising
178.FOR A SCATHING CRITIQUE OF THE GOVERNMENT’S 1969 CASE, SEE Franklin M. Fisher, John J. McGowan & Joen E. Greenwood, Folded, Spindled, and Mutilated: Economic Analysis and U.S. v. IBM (MIT PRESS 1983). 179.UNITED STATES V. KANSAS CITY STAR, CRIMINAL NO.18444 AND CIVIL NO. 7989 (W.D. MO. JAN. 6, 1953).

86
with the Star's papers; therefore, the data on Kansas City dailies' circulation provided essentially
un-rebutted evidence of the Star's market power.180
The government alleged that earlier competitors had been vanquished through a variety
of anti-competitive practices. In particular, advertisers were required to purchase “combination”
advertising in the Star's morning and evening papers. Television advertisers were required to
advertise in the Star's newspapers to gain access to WDAF-TV. Predatory pricing—“depression
discounts”—drove its principal newspaper rival from the market, and once this rival exited,
prices were raised.
The case was developed and filed during the last days of the Truman administration, but
litigated during the Eisenhower administration. Allegations of political influence surrounded the
case, especially when the criminal charges against the Star's president were dropped on the eve
of trial. The government won the criminal case against the Star and one of its executives, but the
judge levied fines of only $7,500 against the two defendants.
The civil case was never litigated because the Star and the government entered
negotiations to settle the case shortly after the Star lost its appeals of the criminal case in the
Court of Appeals and the Supreme Court denied certiorari.181 Five months later, a consent
decree was entered that forbade discrimination in advertising, tying arrangements in advertising
or subscription sales, and discrimination in credit policies with advertisers. While the
government had asked that the Star's broadcast licenses be revoked, the consent decree simply
required the Star to sell them and transfer the licenses. Thereafter, the Star was forbidden to
acquire any other newspaper or broadcaster in the Kansas City area.
The Effects of the Decree
There is very little evidence available on the effect of the decree on the newspaper
business in Kansas City. The 1950s began a lengthy period of consolidation of the newspaper
industry throughout the country as consumers turned increasingly to television for their news and
other information. The consent decree had little apparent effect on the concentration in local
180.THESE DATA ARE FROM Lorry E. Rytting, United States of America v. Kansas City Star: An Antitrust Case Study
(PH.D. DISSERTATION, DEPARTMENT OF MASS COMMUNICATIONS UNIVERSITY OF WISCONSIN 1969). 181.KANSAS CITY STAR V. UNITED STATES, 240 F.2D 643 (1957); CERT. DEN., 354 U.S. 923 (1957).
87
newspapers in Kansas City, but it is probably naïv e to have expected such an effect in the
ensuing period of rapid growth of the television industry. Four years after the decree was
entered, the three Star newspapers still averaged about 348,00 in circulation, and the other dailies
totaled just 43,000. Between 1957 and 1961, the Star newspapers had declined from 348,000 to
339,000 in circulation, while the competitors had fallen from 47,000 to 43,000.182 However, the
price of a subscription to the Star papers remained constant in real terms between 1953 and 1960,
but increased thereafter. The Star's combined daily advertising rate rose by 51.6 percent and its
Sunday rate rose by 53.8 percent between 1953 and 1969, compared to a 37 percent increase in
the consumer price index.183 Obviously, these increases do not constitute convincing evidence
that the Star's market power was unaffected by the decree given the likely changes in costs and
the availability of competitive media. However, by themselves, the available data certainly do
not suggest that the decree improved competition among news and advertising media in Kansas
City.
Is Monopoly A Serious Problem in the United States?
This review of Section 2 monopolization cases surely casts doubt on the ability of
antitrust officials and the courts to design remedies for markets found to have been illegally
monopolized. Moreover, such cases involving single-firm monopoly are exceedingly rare; most
successful monopolization suits are brought against firms who have attained their market
position through merger or various price-fixing or market-sharing agreements. One possible
explanation for both the paucity of cases and the absence of obvious consumer-welfare
enhancing results is that monopoly power is simply not a very large problem in the United
States.
Beginning with Arnold Harberger’s seminal work,184 a number of empirical studies
suggest that the total cost of monopoly is very small indeed. Harberger found that the social cost
of monopoly is only 0.1 percent of gross national product. More recent studies place the loss
182.Rytting, SUPRA NOTE AT 194. 183.ID. AT 296-300; Bureau of Labor Statistics, Consumer Price Index, 1953-1969. 184.
ARNOLD HARBERGER, MONOPOLY AND RESOURCE ALLOCATION, am. econ.rev., papers and proceedings, 77-87. (1954).
88
between 0.02 percent and 13.1 percent, but the higher-end estimates include estimates of the
costs of advertising that allegedly result from monopoly power. Without including advertising as
a source of the loss of economic welfare due to monopoly, the estimates of the social cost of
monopoly are 4 percent of GDP or less.185
If monopoly is not much of a problem in the first place, it is understandable that Section 2
cases are rare and Section 2 remedies are not very effective. On the other hand, Section 2 may
provide a strong disincentive for firms to obtain monopoly power, given the cost of defending an
antitrust suit.
Conclusion
This review of the major Section 2 Sherman Act cases won by the government or ending
in consent decrees provides remarkably little evidence that these cases and the relief that
emanated from them had a positive effect on competition and consumer welfare. In some cases,
such as Standard Oil (1911) or IBM (1956), this ineffectiveness was due to the fact that market
forces were changing rapidly, thereby reducing the defendant firms’ market power anyway. In at
least three others, American Tobacco (1911), Alcoa (1945), and Paramount (1948), the relief
simply did not generate an increase in price competition. In American Tobacco and Alcoa, the
substitution of a three-firm oligopoly for a single firm did not have a measurable effect on prices.
In Paramount, prices actually rose after the forced vertical divestitures, but this result is clouded
by the enormous changes wrought by the substitution of television for motion picture theater
admissions that occurred in the 1950s. Similarly, the protracted relief obtained by the
government in United Shoe Machinery (1953) over more than 15 years was surely overwhelmed
by the development of foreign competition in shoe manufacturing, but there is no evidence that
shoe machinery prices were reduced very much by the first decree. Nor can one find evidence
that the vertical divestiture in Kansas City Star (1958) or the limitations on television network
program “ownership” and production in the 1980s had any beneficial effects on competition.
185. For a review of these estimates, see Paul R. Ferguson and Glenys J. Ferguson, Industrial Economics: Issues and Perspectives, 2d ed. (NYU Press 1988) 94.
89
Indeed, the network decrees appear to have reduced competition by eliminating three
competitors from the syndication market.
The exception in this analysis is the AT&T (1982) decree that broke up AT&T, a
monopoly created by government regulation. However, the vertical divestiture could have been
avoided through a simple regulatory policy of requiring equal access, a policy that the Federal
Communications Commission (FCC) failed to adopt. The continuing problems of rationalizing
and reintegrating the U.S. telecommunications sector could have been avoided had the FCC
adopted such policy as Canada and the EU have done more recently. Therefore, this antitrust
success in correcting a market failure was, in reality, the correction of an earlier government
failure.
The important lessons to be learned from this review of the history of Section 2 cases is
that the government often lags the market in finding ways to increase competition, rendering
antitrust cases redundant. In other cases, the government failed to formulate relief that resulted in
any meaningful change in competition because it failed to grasp the essentials of the market that
led to concentration in the first place. This is particularly true for markets gripped by rapid
technological change, such as computers or the distribution of video programming. Given the
rapid pace of technical progress that we are encountering as we enter the 21st century, there is
surely little prospect that Section 2 will be employed more productively in the future than it has
been in the past.
Related Documents