1 Running Head: THE FACTS DON’T ADD UP The Facts Don’t Add Up Missy Bragg Jim McKelvey Heather Smith Michelle Valent The University of Akron

Welcome message from author
This document is posted to help you gain knowledge. Please leave a comment to let me know what you think about it! Share it to your friends and learn new things together.
Transcript

1
Running Head: THE FACTS DON’T ADD UP
The Facts Don’t Add Up
Missy Bragg
Jim McKelvey
Heather Smith
Michelle Valent
The University of Akron

2
THE FACTS DON’T ADD UP
Analysis Phase
The Learning Situation
The setting for the current project is Canton Country Day School, a private educational
institution serving pre-kindergarten through eighth grade students in Canton, Ohio. The students
in grades kindergarten through grade four are taught mathematics with the use of the primary
curriculum, Chicago EveryDay Math (EM), a program emerging from the University of Chicago
School Mathematics Project, in addition to various supplements. The EM curriculum is taught in
small groups or pairs of students that actively work to apply the learning to everyday situations.
The constructivist paradigm, underlying the EM program, focuses the content design on
conceptual rather than rote learning, with a heavy emphasis on strategy application arriving at
problem solutions. The curriculum is taught in a spiral-fashion, in which skills are continuously
touched upon throughout the course, rather than taught to mastery one at a time.
The Learning Problem
Several issues surfaced in the past two school years that were symptomatic of program
deficiency. The initial symptom calling attention to the math curriculum involved the instructors
themselves. The instructors noted a deficient in the ability of students to successfully learn and
recall basic multiplication facts. They were concerned they were not meeting the curriculum
specifications for teaching time. The designers of EveryDay Math recommend spending one and
a half to two hours per school day on the program in order to complete all components within
each school year. The actual time constraints permitted an average of 40 to 60 minutes per day.
Due to limited time, the complete curriculum was not presented as designed. The test designers
state the curriculum may be adapted, and not fully presented, to be effective. However, taken

3
THE FACTS DON’T ADD UP
together, these events created a felt need to analyze the math curriculum as a potential
instructional problem.
The second symptom was
contained in the normative
performance of the third grade
students at Canton Country Day
School on the ERB testing for the
2009-2010 and the 2008-2009
academic years. Figures 1 and 2
illustrate the distribution of third
grade students’ performance,
measured in RIT scores, on the ERB
Comprehensive Testing Program 4
in Mathematics. Results suggested
their performance level was notably
below the normative distribution for
Independent school norms. The
repeated under-performance caused
concern among school
administrators and instructors using
the Everyday Math curriculum.
Two additional constraints to
note for the learning problem is
0
1
2
3
4
5
6
7
8
1 2 3 4 5 6 7 8 9
Nu
mb
er
f s
tud
en
ts
Distribution of stanine scores
2010 Student Stanine Distribution
Population Distribution
Figure 1. Grade 3 ERB 2010. This figure shows
distribution of third grade math scores compared to
independent school norms in May, 2010
0
1
2
3
4
5
6
1 2 3 4 5 6 7 8 9
Nu
mb
er
f stu
den
ts
Distribution of stanine scores
2009 Student StanineDistribution
Population Distribution
Figure 2. Grade 3 ERB 2009. This figure shows
distribution of third grade math scores compared to
independent school norms in May, 2009.

4
THE FACTS DON’T ADD UP
limited facilities in the computer lab and change in the instructor line-up for Math. A transition
to one-to-one laptops in grades fourth through eighth grade led to the closing of two computer
labs. The remaining two computer labs do not have enough computers to host both third grade
groups, a total of twenty-eight students, at one time. Limited access to the computers will require
special scheduling.
Detailed Needs Analysis of the Learning Problem
Further investigation was conducted to identify the root cause of the normative deficit
and determine whether the problem could be effectively addressed with an instructional solution.
Three approaches were taken to investigate this issue: Quantitative sub-test trend analysis,
qualitative survey data, and a review of the empirical research on the EM curriculum as regards
math fact proficiency.
Sub-Test Analysis: The first task was to take the aggregate normative data and study the
students’ sub-test scores to determine if a trend could be identified.
Figure 3 summarizes the sub-score data for the 2010 ERB test year. Results suggest that
Figure 3. CCDS ERB Math 2010. This figure shows Canton Country Day student math
subtest performance compared to independent school norms, May 2010.
52
61 59
67
42
56 5659
55
66
44
58
0
10
20
30
40
50
60
70
80
Wh
ole
Nu
m
Wh
ole
Nu
m
Fra
c &
De
c
Fra
c &
De
c
Ge
om
etr
y
Ge
om
etr
y
Me
asu
rme
nt
Me
asu
rem
en
t
Da
ta A
naly
sis
Da
ta A
na
lys
is
Pre
-Alg
Pre
-Alg
Student IndNorm
Student IndNorm
Student IndNorm
Student IndNorm
Student IndNorm
Student IndNorm
Pe
rcen
tag
e C
orr
ect
Sub Tests

5
THE FACTS DON’T ADD UP
every sub-score area was deficient compared to the normative data. Additional data was
reviewed for the previous year to identify trending of this problem.
Figure 4 illustrates the same data, but for the 2009 academic year. Interestingly, the trend
seen in the 2010 year was only observed in the first two sub-tests in 2009, Whole Number
Operations and Fractions / Decimals, and the final sub-test in pre-algebra. The remaining three
sub-tests did not show deficiency. Since pre-algebra is a higher-level math skill requiring the
lower-level number sense skills of whole number manipulation and decimals / fractions, this
project focused attention on the first two sub-tests. Therefore, math skills of the whole number
and decimal / fraction sections represented a root-cause skill deficiency.
Survey Data: Qualitative data, the second task, were collected through two methods. A
survey document (Appendix A) was developed to assess the needs of the four teachers in the
Figure 4. CCDS ERB Math 2009. This figure shows Canton Country Day student math
subtest performance compared to independent school norms, May 2009.
5961 60
68
57 57
6460
67 66
50
59
0
10
20
30
40
50
60
70
80
Wh
ole
Nu
m
Wh
ole
Nu
m
Fra
c &
Dec
Fra
c &
Dec
Geo
me
try
Geo
me
try
Me
asu
rmen
t
Me
asu
rem
en
t
Da
ta A
naly
sis
Da
ta A
naly
sis
Pre
-Alg
Pre
-Alg
Student IndNorm
Student IndNorm
Student IndNorm
Student IndNorm
Student IndNorm
Student IndNorm
Perc
en
tag
e C
orr
ect
Sub Tests
Target Area

6
THE FACTS DON’T ADD UP
areas of Student Achievement Monitoring, Curriculum, Teacher Support, Classroom Instruction
Practices, and Teacher Collaboration. The survey results suggested the areas of concern included
math assessment not being aligned with instruction, teachers not having a good understanding of
the Mathematics content standards, and teacher collaboration for modifying content.
The survey was followed up with a face-to-face discussion requesting clarification and
detail of these areas. In particular, the qualitative face-to-face data revealed a specific weakness
in the ability of the third grade students’ math fact proficiency. A subject matter expert (SME)
reported that math facts were a significant problem in student classroom performance. Further, it
was reported that, even for the students who know their math facts, automaticity was poor. In the
opinion of the SME for the EM program, one of the root causes to sub-norm student performance
was the lack of emphasis of automaticity of math facts in the EM program.
Empirical Support: The third task was to review empirical research for issues of the EM
curriculum for established problems in math fact proficiency to provide consensual validation to
the SME report.
In a double study of Everyday Math with 2nd
and 3rd
grade students, Fuson, Carroll, &
Drubeck (2000) reported EM students scored significantly better than sample-matched students
using traditional learning methods in several areas of mathematics. The EM program offered
superior outcome measures in all areas except for one. The one area that the EM program did not
provide higher performance was in student computation. The authors could not explain this
unexpected short-coming in the program.
An explanation offered by Cummins & Elkins (1999) is that memorization of math facts,
does not result from instruction exposure alone and, therefore, it does not establish automaticity.
The implication is math facts must be learned as a supplementary intervention in the EM

7
THE FACTS DON’T ADD UP
curriculum. Without structured memorization of math facts, it is unlikely they will be learned by
the students.
Reviewing this deficit further, Russell & Ginsburg (1984) reported that fourth grade
students exhibiting general math difficulty were unable to recall common math facts, despite
having no deficiency in other mathematical concepts and skills compared to their peers. These
authors concluded students who cannot retrieve basic math facts easily get lost during the steps
of calculations, and often cannot follow the logic of higher level teaching on math operations.
The failure to learn math facts prevented the students from progressing to high-order math
problems. Interestingly, the sub-test scores at Canton Country Day school showed deficiency in
the sub-test areas requiring computational proficiency and their higher-level operations (pre-
algebra), even though the other sub-test scores were at or above normative levels. Math fact
proficiency, or automaticity, can be considered essential knowledge for successful progression in
mathematics. The conclusion from the empirical research is that the EM curriculum may not
fully develop the Numerical Sense skill set, composed of computational proficiency of addition,
subtraction, multiplication and division, by itself.
In summary, the three data sources support the conclusion that a core deficiency in the
EM curriculum is a likely root cause of students at Canton Country Day School to under-perform
in automaticity of math facts. The research suggests a supplemental program of instruction is
needed to address this knowledge and skill problem, making it a candidate for an instructional
intervention.
The Learning Objectives
At the conclusion of the study of each fact table (0-10s):
1. The students will be able to recall basic multiplication facts with 100% accuracy.

8
THE FACTS DON’T ADD UP
2. The students will be able to demonstrate fluency of basic multiplication facts with an
average of 2.0 seconds or less per problem (Spear-Swerling, 2006).
3. The students will be able to display accurate and fluent recall of multiplication facts
during the expected time frame (end of grade 3 - end of grade 4).
4. The students will be able to display fact knowledge using timed tests of varying difficulty
with tests getting more challenging as students gain mastery of previous facts with 100%
accuracy.
Backwards Design evaluation learning outcomes will be based on the following:
● The students will demonstrate fluency and 100% accuracy for each post-test during the
project period of eight months.
● The students will perform at or above Independent School normative levels for the
aggregate and sub-tests on the ERB Comprehensive Testing Program 4 in Mathematics
(given in May following the curriculum roll out) in the areas of computation and in which
computation is a prerequisite for successful application of the skill.
Learner Analysis
The current learners consist of twenty-eight third grade students at Canton Country Day.
Past data represents an average single class size of approximately 20-25 students. Out of the
twenty-eight third grade students we chose two students to participate in our trial
implementation. Instead of choosing from the third grade class, we had to use lower level fourth
grade students because they were available for the trial.
The students chosen as test subjects for our implementation have struggled with
displaying instant recall of basic facts throughout the year and served as the best choice of
subjects available. It is important to note that one subject was diagnosed last year with

9
THE FACTS DON’T ADD UP
dysgraphia. Letter reversal is common, yet this subject is working with a specialist three to four
times a week. Reversal of numbers is rare. If this occurs, we will not consider the answer
incorrect.
Current learner characteristics.
● Gender Data: 1 girl, 1 boy
● Age Range: 8-10
● Prerequisites:
○ Demonstrate fluency in addition facts with addends through 9 and corresponding
subtractions; e.g., 9 + 9 = 18, 18 – 9 = 9.
○ Add and subtract multiples of 10.
○ Add and subtract whole numbers with and without regrouping.
A variety of learning styles occur in the everyday classroom. A part of Canton Country
Day School’s mission is to offer differentiation in the classroom based on learning styles and
needs on a daily basis. Learners are used to learning experiences of a range of styles including
visual to auditory to tactile and kinesthetic.
Investigations into the academics of the learners identified that the students receive
grades for the first time in grade three. The first experience with written standardized testing also
occurs at the end of grade three.
The age and maturity of the current students fall into the expected social and emotional
growth range for third grade.
Motivation in learning facts to recall appears low. There are several possible causes for
the lack of motivation. First, there is a difference in the learning theory associated with
memorizing facts, cognitive information processing, in comparison to the constructivist and
10
THE FACTS DON’T ADD UP
discovery learning styles commonly used in the classroom at Canton Country Day School.
Students may lack a clear understanding in the importance of learning facts to recall. Many of
the students are involved in multiple after-school activities. The parents have expressed that
finding the time to support student practice at home is a challenge due to their own busy
schedules.
All the learners are United Citizens with English as their first language. All learners,
regardless of learning abilities are taught within an inclusive classroom. Two full-time teachers
work with the core group of 28 students.
Based on data from the SMEs, this class has a classic range of learners, with the majority
of the students on pace with grade-level learning objectives, a few students experiencing
challenges with math concepts and a few students who quickly pick up concepts and require
enrichment. A common observation is despite ability, there is a common challenge amongst the
students in learning multiplication facts for instant recall.
The third grade room can be divided into two separate rooms if needed. It was originally
designed as two smaller rooms with a sliding door in the center of the two. Currently the door
remains open and both sides are used throughout the day. One side serves as a room for centers
and small grouping. The other side contains the student desks and is used for individual and full
class presentations. The side of the room without the desk contains a SmartBoard. There are two
overhead projectors. A white board is used as a screen, although there is a screen available if
desired. There is access to a line of 15 PC computers in the hallway outside the classroom, as
well as to a full lab of Mac computers adjacent to the library. Scheduling is generally not an
issue, due to one-to-one laptop usage by all students in proceeding grades.
11
THE FACTS DON’T ADD UP
There are many opportunities to apply the learning objectives into future applications in
the EveryDay math curriculum. The spiraling curriculum includes endless review applications
such as Math Boxes, math games, and a variety of formative assessment pieces. A recent
environment which encourages the transferring of knowledge acquired is the membership to the
online computer program IXL. This program will be investigated and possibly serve as tool of
instruction to address the identified learning problem.
Design Phase
The Task Analysis
A well executed task analysis sets the foundation for the instructional design phase,
especially setting the content sequence and the resulting instructional objectives for the content.
Taken together, this forms a hierarchical structure to the instructional strategy. The task analysis
also enables the backwards design step of creating behavior-based evaluation measures to gauge
success of the total program. This project will present a task analysis recommendation since time
constraints and real-world restrictions prevent a fully-designed task analysis from being
performed. Evaluation also will be discussed in this design phase.
There are many choices when it comes to task analysis. Each offers its own method and
may provide usable results, but the method decision should be consistent with the nature of the
task itself. For example, procedural analysis, or an information processing analysis, may seem
like logical methods for the current instructional problem. However, procedure analysis is best
used for overt behaviors and information processing is best used for multi-step, complex
psychomotor behaviors. With the simple two-step procedure of performing multiplication facts
between 0 -10, a topic analysis will be used to capture and categorize the content material.

12
THE FACTS DON’T ADD UP
An actual topic analysis was not performed as part of this project, but details describing
the steps that would be taken are presented in Appendix B. In general, the topic analysis will:
1. Establish the detailed content for the instructional problem.
2. Set the sequencing of content, and thus, the writing and ordering of the learning
objectives.
3. Establish a hierarchy to the learning objectives which will clarify the prerequisite
learning.
4. Enable the creation of behavior-based outcome evaluation items to gauge the
effectiveness of the instructional strategy.
In conducting a topic analysis, the SME will classify content into each of six areas
including facts, concepts, procedures, principles, and interpersonal skills and attitudes required.
This will be performed for the multiplication fact content. The content will be reviewed once it is
collected, and reordered as it makes sense to the SME for the learner.
Since the tasks associated with multiplication facts have been well established, with the
prerequisite content needed in numerical sense identified, and measures of proficiency with the
prerequisite material available for the SME to review as part of the learner analysis, existing
math fact content was reviewed and will be presented.
The team worked with the SME at Canton Country Day School to:
● Confirm the learning objectives resulting from the needs assessment.
● Verify the content domain for each objective to ensure it had been covered for our
project for all prerequisites for number sense operations. This is the base
knowledge required for learning multiplication facts and then achieving
automaticity.

13
THE FACTS DON’T ADD UP
● Confirm the sequence of number pairs for the multiplication math facts.
● Establish the hierarchy of the learning objectives and content.
● Write the evaluation questions that will measure outcome success of learning.
The Learning Theory
While several learning theories have effectively improved learner performance in
Mathematics, Cognitive Information Processing Theory will be used for the proposed study.
Mathematics is a subject that continuously advances to higher levels of complexity with learner
proficiency dependent on achieving success of previous levels (Wong & Evans, 2007). The
Everyday Math model, a constructivist-based curriculum, uses an upward spiraling sequencing
of each level through repeated exposure to the content, but does not use rote memorization of the
basic math facts content. Possessing immediate recall of math facts, automaticity, is one of the
most important and basic knowledge areas (Wong & Evans, 2007).
Math fact content naturally lends itself to the Cognitive Theory component of declarative
knowledge to achieve rote learning of math facts before higher-level procedural (conceptual)
knowledge can be successfully applied. The strength of the cognitive association for declarative
knowledge reduces the capacity demand of the information processing system of the person
because Cognitive Psychologists suggest students have a fixed capacity for processing math
problems. Efficiency is gained by converting operations based on procedural knowledge
(counting on one’s fingers) to declarative knowledge (rote memory) to free up the processing
space for higher level mathematics operations. Students who have not established strong
declarative knowledge in math facts are at a significant disadvantage for successful progression
to higher levels of conceptual understanding, or procedural knowledge (Russell & Ginsburg,
1984).
14
THE FACTS DON’T ADD UP
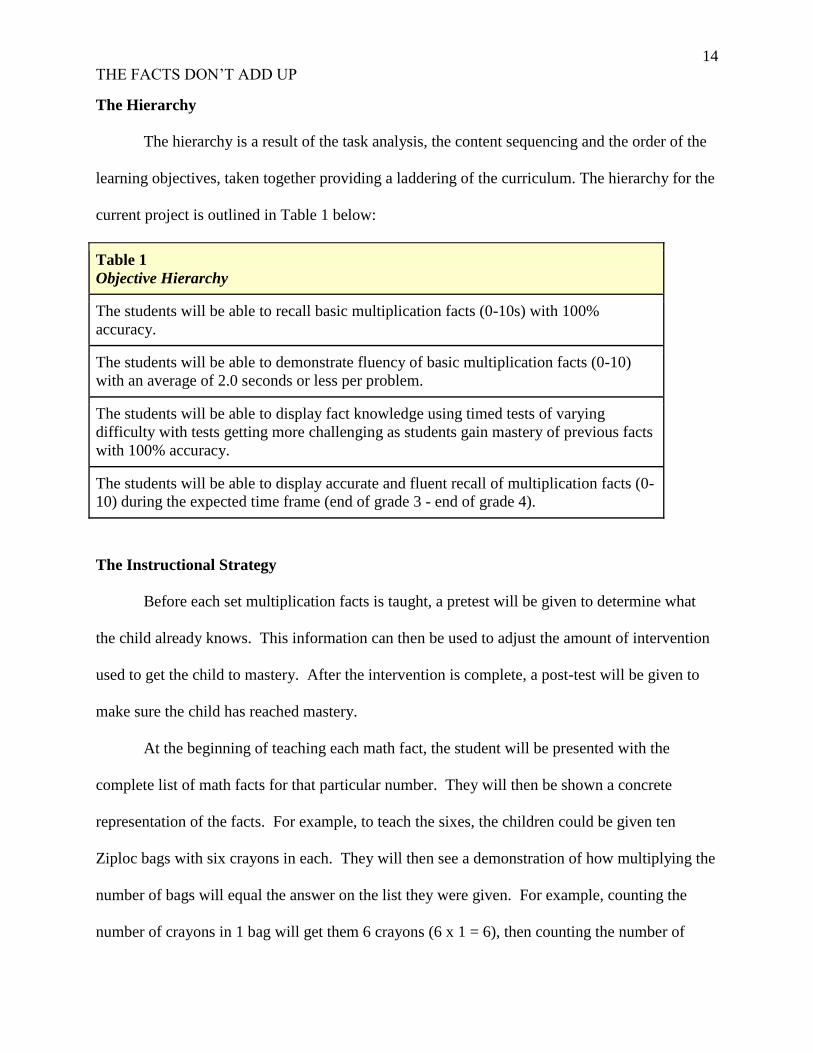
The Hierarchy
The hierarchy is a result of the task analysis, the content sequencing and the order of the
learning objectives, taken together providing a laddering of the curriculum. The hierarchy for the
current project is outlined in Table 1 below:
Table 1
Objective Hierarchy
The students will be able to recall basic multiplication facts (0-10s) with 100%
accuracy.
The students will be able to demonstrate fluency of basic multiplication facts (0-10)
with an average of 2.0 seconds or less per problem.
The students will be able to display fact knowledge using timed tests of varying
difficulty with tests getting more challenging as students gain mastery of previous facts
with 100% accuracy.
The students will be able to display accurate and fluent recall of multiplication facts (0-
10) during the expected time frame (end of grade 3 - end of grade 4).
The Instructional Strategy
Before each set multiplication facts is taught, a pretest will be given to determine what
the child already knows. This information can then be used to adjust the amount of intervention
used to get the child to mastery. After the intervention is complete, a post-test will be given to
make sure the child has reached mastery.
At the beginning of teaching each math fact, the student will be presented with the
complete list of math facts for that particular number. They will then be shown a concrete
representation of the facts. For example, to teach the sixes, the children could be given ten
Ziploc bags with six crayons in each. They will then see a demonstration of how multiplying the
number of bags will equal the answer on the list they were given. For example, counting the
number of crayons in 1 bag will get them 6 crayons (6 x 1 = 6), then counting the number of

15
THE FACTS DON’T ADD UP
crayons in 2 bags will get them 12 crayons (6 x 2 = 12), then counting the number of crayons in
3 bags will get them 18 crayons (6 x 3 = 18), etc. The same will be done by counting the crayons
in up to 12 bags.
After teaching the facts through concrete representation, the students will complete
applicable generative strategies to learn the facts to mastery. A variety of instructional strategies
will be implemented throughout the introduction, study and mastery of basic multiplication facts.
● Computer Assisted Instruction- Students will have access to a computer
program called IXL.
● Timed Drills- Students will be analyzed on timed tests of multiplication tests. A
test will be administered with 100 multiplication questions. Students will
complete as many problems as they can within a 60 second time limit.
● Pre-Test- Students will be given a test before instruction to determine their skill
level prior to intervention.
● Post-Test- Students will be given a test after instruction to determine if and how
much intervention with the student was successful.
● Independent Practice- Students will do some practice work on multiplication
facts without the help of the teacher
● Learning Lab- A learning lab is when a student is put into an environment that
has the resources and support to help the student learn at their own pace. Each
time an interventionist meets with the student, they will be given the tools (e.g.
computer) and support (e.g. teacher) to learn multiplication facts
● Rap Facts- Verbal practice to form word chain recall and fact families
● Written practice – Students will write out the chain
● FlashMaster (a handheld device for practicing all time tables)
Figure 5. Instructional Strategies. This figure outlines several examples
of instructional strategies to be used in implementation.
The Instructional Sequence

16
THE FACTS DON’T ADD UP
The instructional sequence of our design would initially start in the beginning of the
school year and run throughout the year. Each month would be dedicated to mastering certain
multiplication facts. The organization was determined based on the suggested order research
shows facts to be taught displayed in Table 2:
Table 2
Monthly Focus Fact Tables
Month Facts taught
September 0’s and 1’s
October 2’s and 10’s
November 5’s and 9’
December 4’s
January 7’s
February 3’s
March 8’s
April 6’s
May-June 11’s and 12’s with
intense review of all
facts
The month would be broken apart into 4 week sections:
Week 1- Learning, visualization, creating the fact table.
Week 2 through 4- Tricks or games reviewing the table(s).
Weeks 1 through 4- Nightly review will progressively increase over the four
weeks.

17
THE FACTS DON’T ADD UP
Based on the time we have for this project, we are going to focus on the multiplication
facts with 6’s only. We will first start with giving the students a pretest, one on the computer,
and one with paper pencil. This will allow us to see where the child is performing, as well as
give us a baseline with which to work. We will be able to later use this data to see the growth of
each student. Using both paper and pencil and the computer mediums to test, we will also be able
to determine on which medium the students best perform. Each version of the test for the 6’s is
illustrated in Appendices C and D.
During each month, the students will be introduced to new facts to learn. They will be
investigating strategies as well as learning tricks for memory as viewable in Figure 6.
The 9 Times Quickie 1. Hold your hands in front of you with your fingers spread out.
2. For 9 X 3 bend your third finger down. (9 X 4 would be the fourth
finger etc.)
3. You have 2 fingers in front of the bent finger and 7 after the bent
finger.
4. Thus the answer must be 27.
5. This technique works for the 9 times tables up to 10.
***If you add the answer's digits together, you get 9. Example: 9×5=45
and 4+5=9. (But not with 9×11=99)
The 4 Times Quickie
1. If you know how to double a number, this one is easy.
2. Simply, double a number and then double it again!
The 11 Times Rule #1
1. Take any number to 10 and multiply it by 11.
2. Multiply 11 by 3 to get 33, multiply 11 by 4 to get 44. Each number
to 10 is just duplicated.
The 11 Times Rule #2
1. Use this strategy for two digit numbers only.
2. Multiply 11 by 18. Jot down 1 and 8 with a space between it. 1 --8.
3. Add the 8 and the 1 and put that number in the middle: 198
Rule of 6
If you multiply 6 by an even number, they both end in the same digit.
Example: 6×2=12, 6×4=24, 6×6=36, etc.

18
THE FACTS DON’T ADD UP
Figure 6. Multiplication fact tricks. This figure contains an abbreviated list of tricks
taught during the study of multiplication tables.
Now that the students have new factors to learn, and a trick to help them remember, it’s
practice time. Practice can be done in a variety of ways, such as flash cards, multiplication war
using a deck of cards, and computerized programs. For this project, and with time restraints, we
are focusing on using IXL, a computer software program that the students can access from
school as well as home to practice math facts.
Students will be memorizing facts as they learn and practice through various means.
Through the use of practiced timed tests, we will gain an understanding of how the students are
doing. We will be able to clearly see what problems the students are having trouble with and
what the students seem to easily recall. This will help guide instruction of what facts need more
review and practice.
We will use a series of timed tests with the students to show mastery. Timed tests will
grow in difficulty as the students master facts. However, students not mastering the tests will
keep taking timed tests to check their ability until they are ready to move to the next level.
Develop Phase
Media Selection Rationale
Media selection for presenting multiplication facts for practice and testing have included;
flashcards and worksheets, verbal practice, paper and pencil and computer-based interactions.
While computer-based modes of practice and testing have shown superior outcomes compared to
verbal and paper and pencil methods in some studies, the results are not consistent across the
literature (Wong & Evan, 2007). The computer offers immediate feedback and scoring which
appears to result in better retention (Godfrey, 2001a). Moreover, the interactive process with the

19
THE FACTS DON’T ADD UP
computer results in longer retention periods in less practice time (Godfrey, 2001b). However,
Wong & Evans (2007) did not demonstrate superior retention with computer-based practice.
Their research suggests that their inconsistent results may have been due to the learners
practicing on computer, but testing with a paper and pencil method. It is possible that the mode
of practice and testing must remain consistent for the value offered by the use of a computer to
be observed. In light of this research question, the current intervention will utilize multiple
computer-based practice methods through the academic year, but will measure outcome
performance in both paper and pencil and computer testing modes.
IXL is a comprehensive math practice site with an unlimited number of math practice
questions in hundreds of skills, all of which are aligned to state standards and common core
standards. One of the best things about IXL is that students can access it from home and view his
or her progress. There are multiple assessment report options available for tracking progress and
goal setting. A class subscription allows students to access the interactive website on any
Internet device. Students can practice skills in any grade level which supports individualized goal
setting.
FlashMasters are an interactive handheld device for practicing basic math facts. A class
set is available in third grade for both school and home use. The FlashMaster provides various
levels which support introductory skills with practice in order to reach fact mastery. The student
can choose between the arithmetic of subtraction, addition, multiplication and division. This
device includes six major categories of learning activities: fact tables in order, fact tables no
order, practice, assessment, flashcards, and special problems. Multiple timed options allow the
student to hide the timed feature and set various time limits.

20
THE FACTS DON’T ADD UP
Various interactive gaming and practice sites will be utilized throughout the full year to
support each time table. A consistent online resource will be www.multiplication.com. This free
website contains endless resources to support the learning and practice of basic multiplication
facts including interactive, classroom, and electronic learning strategies to support the use of
multiple intelligences, and a variety of teaching and practice resources. Each week, the self-
correcting interactive quiz and written quiz will be used to assess ongoing progress.
Another rationale for offering various types of technological strategies is to accommodate
the student who has dysgraphia. Research shows that students with this disability are often more
successful when given other options for learning including the use of computer-based practices.
Organization and Presentation of Message Content
The message content will be supported through the use of mini-lessons that will minimize
the threat of overloading the cognitive processing limits of the learners. Our goal is to implement
three to five mini-lessons per week, averaging 10 to 15 minutes each. This method will also
enable effective use of repetition with the current design. Cognitive learning theory suggests that
transitioning from procedural to declarative knowledge is enhanced with repetition and
manageable segments of instruction. The mini-lessons will also present information in verbal,
auditory, kinesthetic and visual modes.
Description of Instructional Resources to achieve instructional Outcomes
Three teacher resource books provided strategies used to create a series of mini-lessons
and instruction on the 6s table. The book, One-Minute Math: Developmental Drill Level B
Factors 6 to 9, includes timed math tests, flashcards, bulletin boards, progress charts, and games.
This book will provide the 60-second written test on each times table to be used for both pre- and
post-test situations. The remaining two resource books, Making Multiplication Easy: Strategies
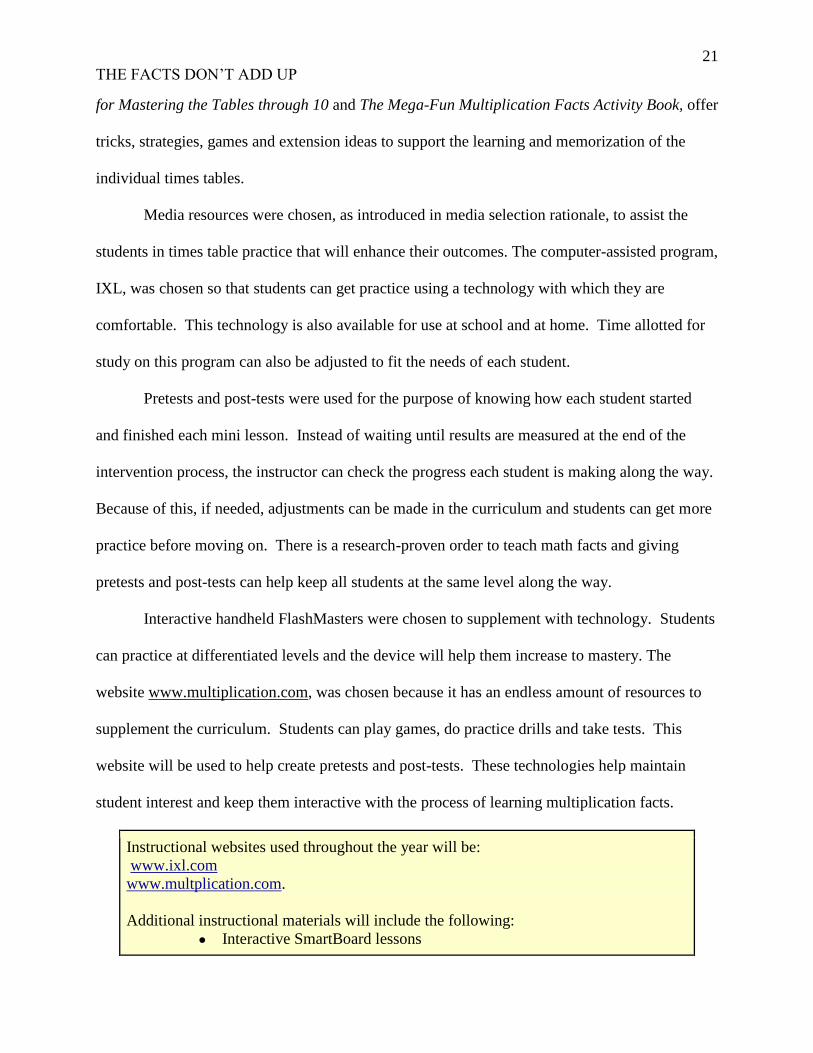
21
THE FACTS DON’T ADD UP
for Mastering the Tables through 10 and The Mega-Fun Multiplication Facts Activity Book, offer
tricks, strategies, games and extension ideas to support the learning and memorization of the
individual times tables.
Media resources were chosen, as introduced in media selection rationale, to assist the
students in times table practice that will enhance their outcomes. The computer-assisted program,
IXL, was chosen so that students can get practice using a technology with which they are
comfortable. This technology is also available for use at school and at home. Time allotted for
study on this program can also be adjusted to fit the needs of each student.
Pretests and post-tests were used for the purpose of knowing how each student started
and finished each mini lesson. Instead of waiting until results are measured at the end of the
intervention process, the instructor can check the progress each student is making along the way.
Because of this, if needed, adjustments can be made in the curriculum and students can get more
practice before moving on. There is a research-proven order to teach math facts and giving
pretests and post-tests can help keep all students at the same level along the way.
Interactive handheld FlashMasters were chosen to supplement with technology. Students
can practice at differentiated levels and the device will help them increase to mastery. The
website www.multiplication.com, was chosen because it has an endless amount of resources to
supplement the curriculum. Students can play games, do practice drills and take tests. This
website will be used to help create pretests and post-tests. These technologies help maintain
student interest and keep them interactive with the process of learning multiplication facts.
Instructional websites used throughout the year will be:
www.ixl.com
www.multplication.com.
Additional instructional materials will include the following:
● Interactive SmartBoard lessons

22
THE FACTS DON’T ADD UP
● BG Multiplication CD featuring artist “DC”
● FlashMaster
● Printable flashcards
● Hexagon pattern blocks
● Twelve 6-pack plastic rings
● Dominoes
● Pair of dice
● Homework assignment grid
● Deck of EveryDay math or playing cards
Figure 7. Instructional materials. This figure displays a list of necessary materials to
conduct the instructional process.
Lesson Plans: Sample Month Implementation: Six as a Factor
● Approximately 15 minutes, three to four days during weeks one and two will be
integrated in the classroom schedule for mini-lessons on the factor(s) of the
month. Ongoing practice will increasingly occur as part of nightly homework.
● To support different learning processes the students will be offered the choice
of handwritten tests/practice and/or computer based tests or typed practice.
Figure 8. Implementation notes. This figure notes expectations for the outlined sample
plan.
Week One.
Each new table will begin with a pretest to identify students with previous knowledge of
the table of focus. The purpose of the pretest is to determine the varied levels of fact knowledge
within the current group of students. This information can then be used to help determine if
adjustments need to be made in the lesson plan to fit the need of each individual student.
Students who display a solid understanding of the fact table will be provided enrichment
opportunities that relate to and extend the use of the current table. A primary resource for
enrichment will be individualized skill assignments using IXL, an online program utilized in
grades K-5.
Mini-Lesson One.

23
THE FACTS DON’T ADD UP
To introduce the multiplication table for the sixes, each student will be provided 12
hexagon pattern blocks and a placement pad such as a piece of colored construction paper. A
discussion will begin to determine why a hexagon is a good model for representing the sixes
table. A hexagon has six sides, six angles, and six lines can be drawn through it to make
symmetrical sides.
Using a prepared SmartBoard lesson, the teacher can unveil each number sentence of the
sixes table beginning with 6 * 0 = 0. The students will be instructed to place zero hexagons onto
the placement pad to model zero groups of six equals zero. As this pattern continues, the students
will be instructed to verbally state the fact sentence. Research has suggested student recall
increases with the practice and development of a verbal fact chain. Students will be instructed to
count all sides on hexagons placed on the pad. A set of six sides on each hexagon multiplied by
the number of hexagons represents the given multiplication number sentence. The tactile portion
of this lesson could be touching each side of the hexagon to show that there are a total of twelve
sides on two hexagons each with six sides:
Figure 9. Visualizing the sixes lesson. This figure depicts the process each student
will explore during mini-lesson one.

24
THE FACTS DON’T ADD UP
An extension to geometry could be pointing out that a regular hexagon, which is a
hexagon with equal sides and equal angles, is a perfect model because equal grouping is an
important concept of multiplication.
Mini-lesson one will conclude with a short homework assignment: Answer as many
questions as you can in x amount of minutes using IXL, Grade 3, Skill F.7: Multiply by 6. This
skill will be assigned at increasing intervals each night this week - Tuesday - 5 minutes,
Wednesday - 10 minutes, and Thursday - 15 minutes.
IXL provides ongoing formative assessment. Both accuracy and the number of questions
answered in the given time are recorded. Use the nightly IXL reports to make individualized
student adjustments.
Mini-Lesson Two.
**Prior to this lesson, collect twelve six-pack plastic rings to use as a visual aid. **
Begin a class discussion explaining that many items come in groups of six. Follow up the
discussion by creating a sixes bulletin board (or any area available in the room) to display
groupings of six. Post one six-pack of rings onto the bulletin board and have the students state
the current math fact. Each six-pack acts as an array of six. Call students up to count the
additions as six-packs are added and state the different facts of six as each set of rings is posted.
This will remain posted throughout the month study of the sixes. Wrap up the lesson by
brainstorming items that come in groups of six: six-packs of pop, insect legs, half a dozen eggs,
and so on. List the ideas on the board.
Mini-lesson two will conclude with a short homework assignment: Assign students at
least one fact sentence, such as 6 * 3 = 18. Have them prepare and bring in a model to place in

25
THE FACTS DON’T ADD UP
the class for observation. Encourage creativity. Display an example model a student could have
made using 2 by 6 sized Legos. Allow multiple nights for students to prepare this assignment.
Mini-Lesson Three.
Share models created by students. Have the students state the corresponding six fact
aloud as each model is presented and put on display. Each student will explain their rationale in
choosing their model to represent their fact sentence.
To end the week, give a 60-second written or computer-based timed assessment on the
sixes. This same assessment will be given each Friday. Students will graph how many facts they
answer correctly in 60 seconds to chart personal growth and set individualized goals for each
week. A class goal for each set of facts will be to develop and maintain instant recall of thirty
facts in one minute or less. Both versions of the test can be viewed in appendixes C and D.
Week Two.
Mini-Lesson Four.
Begin the week with a short review of the sixes table. As the students list the facts aloud,
write them on the board. Have the students listen and look for patterns in the facts. They may
notice many of the facts with an even factor seem to rhyme (6 * 4 = 24, 6 * 6 = 36, 6 * 8 = 48).
Point out that there is a quick trick that works for facts of six with an even factor.
Rule of Six:
If you multiply six by an even number, they both end in the same digit. Example:
6*2=12, 6*4=24, 6*6=36, 6*8=48, 6*10=60, 6*12=72, 6*14=84, etc.
Mini-lesson four will conclude with a short homework assignment: Cut out and practice
the 6s table using the provided flash cards from the following site:
http://www.multiplication.com/pdf/Flashcards%20-%206.pdf

26
THE FACTS DON’T ADD UP
Mini-Lesson Five.
Using a rap CD, the students will orally practice rapping the facts aloud. There is a track
on the CD for each fact table, the facts are repeated in order three times. The second set string of
facts does not contain the answer. Students practice filling in the missing answer. If they appear
comfortable, point to individual students as the song progresses to shout out the missing answer.
To build a verbal chain of recall, encourage all the students to say the whole fact sentence
including the factors and product.
Mini-lesson five will conclude with an introduction of a choice homework assignment to
be completed throughout the remainder of the week: Pick 3: Beginner Level - Using a 3 by 3 grid
of 9 homework practice options, the students will choose 3 assignments that make a row
horizontally, vertically or diagonally. The skills will be laid out in a fashion that the students will
have to pick at least one night of 6s review and at least one night of overall review. Parent
initials will be required each night when a grid square is completed.
Options:
● 100 problems - IXL Skill F.8
● 15 minutes - IXL Any of the following skills for review: F.1-F.7
● Flashcards - 6s Table - 10 minutes with an adult
● Flashcards - Mixed review of facts 0-5 - 10 minutes with an adult
● Write or type out the 6 fact sentences, three times each
● FlashMaster - Use this device to practice the 6s - 10 minutes
● FlashMaster - Practice 0s-5s - 10 minutes
● Role of the Dice -

27
THE FACTS DON’T ADD UP
○ Option A - Use a blank 6 by 6 grid to represent the products up through 6
as a factor. Solve the fact. Fill in each fact as you roll the dice.
○ Option B - Play with a partner and make Option A a game. The first
person to fill their grid wins.
● Multiplication War - Use a deck of EveryDay math cards (0-6s). Play another
student or adult in the classic game of war. The variation to this game is that the
person with the highest card has to correctly multiply the numbers on both cards
to win the cards.
At the end of the week, the students will take a written or online assessment to track level
of instant recall within a 60-second time frame.
Week Three.
Mini-Lesson Six.
The students will play a game using dominoes. In partners, the students will lay a set of
10-20 dominoes face down. Player A will turn over a domino, multiply the two numbers and
name the product. If correct, the player will collect the domino. If the player answers incorrectly,
the domino is returned face down. Player B will repeat the process. The player with most
dominoes at the end of the game wins.
Mini-lesson six will conclude with an introduction of a choice homework assignment to
be completed throughout week three: Pick 3 - Intermediate Level: Using the same 3 by 3 grid of
9 homework practice options, the students will choose 6 assignments to create two rows
horizontally, vertically or diagonally. Parent initials will be required each night as multiple grid
squares are completed.

28
THE FACTS DON’T ADD UP
At the end of the week, the students will take a written or online assessment to track level
of instant recall within a 60 second time frame.
Week Four.
The final week of each implementation will focus primarily on review and practice
outside of school. The choice homework assignment from the past two weeks will be revised and
presented to each student. Over the course of the week, it will be each student’s responsibility to
complete all nine practice options to prepare for the post assessment on the given table(s): Pick 3
- Advanced Level: Using the same 3 by 3 grid of 9 homework practice options, the students will
choose 9 assignments to create three rows horizontally, vertically or diagonally. Parent initials
will be required each night as multiple grid squares are completed. Students may repeat the same
row two or three times if they prefer.
At the end of the final week, the students will take a written or online assessment to track
level of instant recall within a 60-second time frame. If needed, an individual plan for continued
review will be prepared for students working to meet the class goal.
Description of the formative evaluation strategy
Assessment will be present from the very start. Using a pretest, we will be able to
determine each student’s skill level including weaknesses and strengths. Each student will have
the option of taking the tests via paper pencil and by computer. Eventually, the student will be
able to choose which method they prefer and best fits their success or continue testing with both
methods. If the student has met the goal of accuracy, we will work on fluency and vice versa.
As previously mentioned, students who demonstrate fluency and accuracy in the initial test will
receive enriched instruction.
29
THE FACTS DON’T ADD UP
We will observe each mini-lesson to evaluate the students as well as the plan. A series of
questions will be considered. Is the lesson going as planned? Was the outcome of the plan
beneficial to the students? What plans seemed to work better for each student? Are revisions
needed, or can instruction be improved upon? Did the students grasp the concept being taught?
These are important questions to think about and reflect upon continuously in order to effectively
achieve the set goals of this instructional design.
At the end of each week, a 60-second timed multiplication test will be used to determine
the progress of each student. The test will be compared to the pretest to determine student
growth, or lack thereof. With a case of lack of growth, we will have to look further into the
situation to identify the problem that needs addressed. In the case of student growth, we can
determine whether the student is ready to move onto the next goal.
The timed test in week four will be our final indicator showing overall student growth
based on the plan. As the students all started on various skill levels, the amount of growth will
vary as well. The amount of overall growth will help determine how well the instructional plan
has worked and what adjustments can be made to improve instruction.
Implementation Phase
We worked with two students in fourth grade at Canton Country Day School. Parental
permission was given for each student’s participation. Initially the target population for
implementation was third grade. Ideally, we would have conducted the implementation plan with
third graders, but due to time, availability and parental permissions this was not an option.

30
THE FACTS DON’T ADD UP
Figure 10. On-line assessment setting. This figure displays the two subjects accessing the
on-line assessment site, www.muliplication.com.
The instructor met with the students each morning during arrival time when another
teacher was available to cover additional students. A room adjacent to the fourth grade room was
used for the series of lessons. This room contained several computers and a table for lessons and
assessments. There were no resources in the room, such as a multiplication chart, which could
have altered performance outcome.
We used the pretest to determine what few facts the students understood, and which
problems were a definite weakness. From the initial assessment the students looked to have the
same basic understanding of similar facts. With this data, we determined that these students are
not where they need to be at this point in fourth grade. The scores validate that the EveryDay
Mathematics curriculum has a weakness in the area of mastering basic math facts.
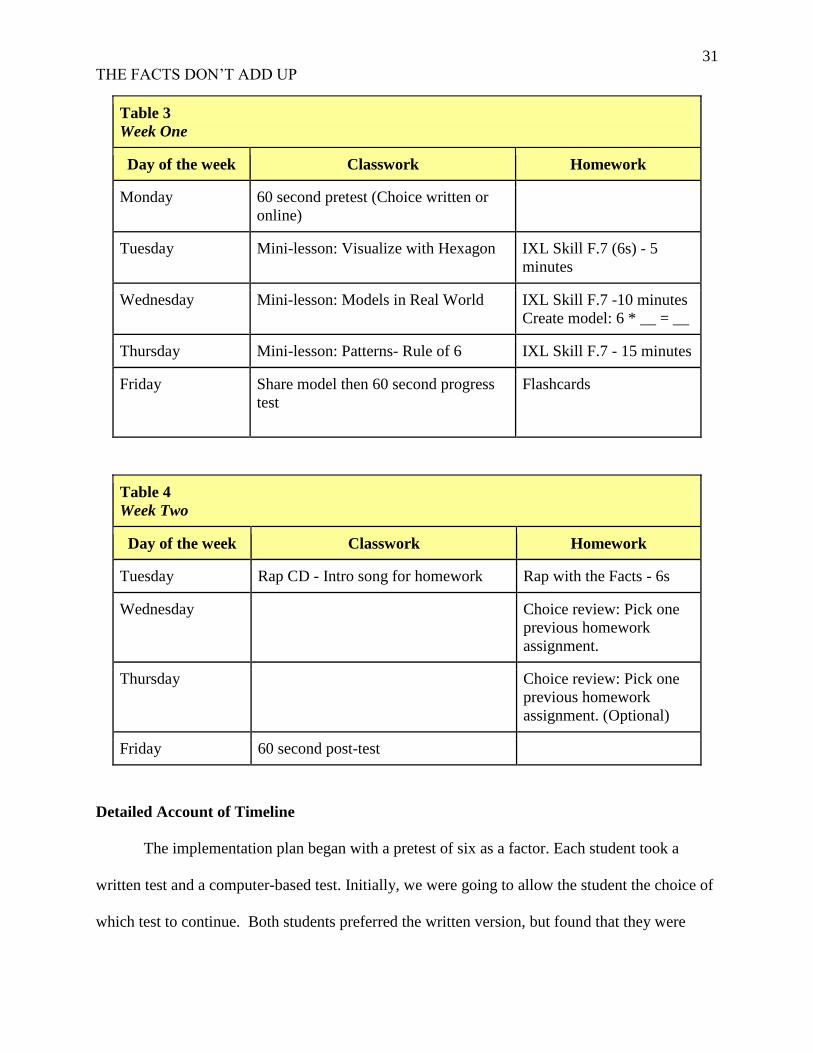
Piloted Implementation Plan
Table 3 and Table 4 are designed to display the modified implementation plan conducted
to meet time limitations.
31
THE FACTS DON’T ADD UP
Table 3
Week One
Day of the week Classwork Homework
Monday 60 second pretest (Choice written or
online)
Tuesday Mini-lesson: Visualize with Hexagon IXL Skill F.7 (6s) - 5
minutes
Wednesday Mini-lesson: Models in Real World IXL Skill F.7 -10 minutes
Create model: 6 * __ = __
Thursday Mini-lesson: Patterns- Rule of 6 IXL Skill F.7 - 15 minutes
Friday Share model then 60 second progress
test
Flashcards
Table 4
Week Two
Day of the week Classwork Homework
Tuesday Rap CD - Intro song for homework Rap with the Facts - 6s
Wednesday Choice review: Pick one
previous homework
assignment.
Thursday Choice review: Pick one
previous homework
assignment. (Optional)
Friday 60 second post-test
Detailed Account of Timeline
The implementation plan began with a pretest of six as a factor. Each student took a
written test and a computer-based test. Initially, we were going to allow the student the choice of
which test to continue. Both students preferred the written version, but found that they were
32
THE FACTS DON’T ADD UP
quicker on the computer. At this point, the students along with the instructor concluded it would
be best to conduct both a written and computer-based assessment throughout the plan to provide
various forms of feedback that may be altered by writing and typing skills.
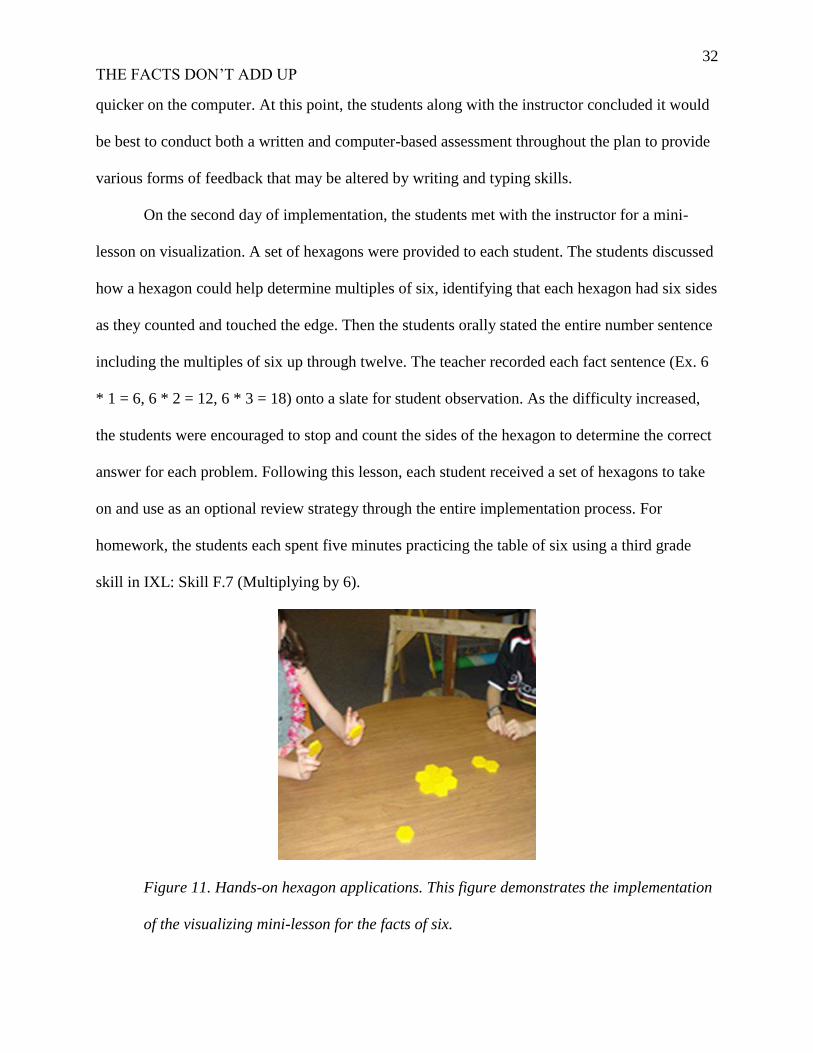
On the second day of implementation, the students met with the instructor for a mini-
lesson on visualization. A set of hexagons were provided to each student. The students discussed
how a hexagon could help determine multiples of six, identifying that each hexagon had six sides
as they counted and touched the edge. Then the students orally stated the entire number sentence
including the multiples of six up through twelve. The teacher recorded each fact sentence (Ex. 6
* 1 = 6, 6 * 2 = 12, 6 * 3 = 18) onto a slate for student observation. As the difficulty increased,
the students were encouraged to stop and count the sides of the hexagon to determine the correct
answer for each problem. Following this lesson, each student received a set of hexagons to take
on and use as an optional review strategy through the entire implementation process. For
homework, the students each spent five minutes practicing the table of six using a third grade
skill in IXL: Skill F.7 (Multiplying by 6).
Figure 11. Hands-on hexagon applications. This figure demonstrates the implementation
of the visualizing mini-lesson for the facts of six.
33
THE FACTS DON’T ADD UP
The third day of implementation continued the exploration of visualization. The
instructor discussed identifying models of six in the real world and explained that many items
come in groups of six. The students viewed a picture of six-pack rings and talked about how they
could be used to model facts. For example, three six-pack rings could stand for three times six.
Each six-pack acted as an array of six. Then we quickly brainstormed items that come in groups
of six: six-packs of pop, insect legs, half a dozen eggs, and so on. One student mentioned that
dice have six sides and dominoes can have a six on them. The other student shared that a Lego
can demonstrate six if it is a two by three Lego with six dots.
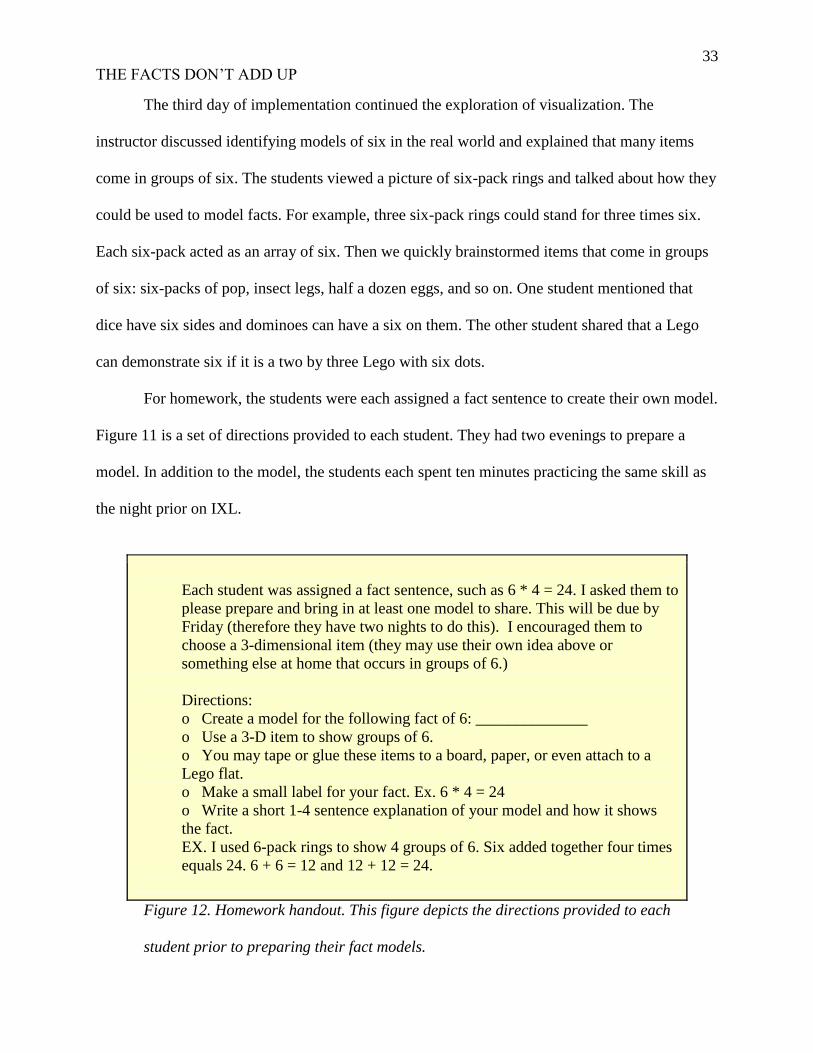
For homework, the students were each assigned a fact sentence to create their own model.
Figure 11 is a set of directions provided to each student. They had two evenings to prepare a
model. In addition to the model, the students each spent ten minutes practicing the same skill as
the night prior on IXL.
Each student was assigned a fact sentence, such as 6 * 4 = 24. I asked them to
please prepare and bring in at least one model to share. This will be due by
Friday (therefore they have two nights to do this). I encouraged them to
choose a 3-dimensional item (they may use their own idea above or
something else at home that occurs in groups of 6.)
Directions:
o Create a model for the following fact of 6: ______________
o Use a 3-D item to show groups of 6.
o You may tape or glue these items to a board, paper, or even attach to a
Lego flat.
o Make a small label for your fact. Ex. 6 * 4 = 24
o Write a short 1-4 sentence explanation of your model and how it shows
the fact.
EX. I used 6-pack rings to show 4 groups of 6. Six added together four times
equals 24. 6 + 6 = 12 and 12 + 12 = 24.
Figure 12. Homework handout. This figure depicts the directions provided to each
student prior to preparing their fact models.

34
THE FACTS DON’T ADD UP
Figure 13. Modeling sixes in the real world. This figure displays a set of images of
models the subjects prepared to represent a fact of six.
The fourth meeting on day four was the final mini-lesson. Due to limited time, the
instructor met with each student individually. She had them name all the fact sentences from zero
to twelve as a quick review. Answers were written on a slate as each was named. Each student
looked for patterns. The instructor helped each of them identify the pattern for facts with an even
factor then pointed out that this is a quick trick they can use to help recall every other fact
sentence. For homework, the students continued to practice the same skill in IXL, this time for
fifteen minutes.
On Friday, both students were administered a 60-second written then computer-based
assessment. Both students displayed improvement of the areas of accuracy and fluency outlined
below in the ongoing assessment table. The results for subject one identified a gap in recall of the
following facts: 6 * 7, 6 * 8 and 6 * 9. The instructor wrote these facts out and gave them to
subject one as a reminder of which facts to focus on during ongoing review and accuracy.
Subject Two’s results determined the student accurately knew each of the facts in the table of
six, but needed to practice fluency to meet the final goal recall of a fact every 2 seconds. Each

35
THE FACTS DON’T ADD UP
student was given a set of flashcards which had been printed on to card stock and cut out for easy
use. The students were told to keep the flashcards as another optional method for review.
The following week began with the introduction of a musical rap CD, specifically the use
of song reviewing the table of six. The students listened to the song and were each given a copy
of the full CD to keep. For homework, each student listened to and practiced the six’s song.
To review the day before the post assessment, the students listed the various strategies
and methods of practice they had learned throughout the implementation plan including the use
of hexagons, IXL Skill F.7, flashcards, practice tests online, creating a model for each fact
sentence, verbally practicing sentences aloud to develop a chain of recall, writing out the facts
and rapping out the facts using the provided CD. For homework, each student was asked to use
one of the mentioned methods as review. On the first night of review, Subject One chose to
review facts verbally, first by reciting each fact out loud to a parent. Then the parent tested the
student, verbally mixing up the facts of six. Subject Two reviewed using flashcards. On the
second night, Subject One reviewed using IXL while Subject Two chose not to review.
The modified implementation plan culminated with a final assessment, again, both
written and computer-based. The results, found in Table 5, showed that Subject One improved
scores over the implementation process in both the written and computerized methods, but was
unable to reach the fluency goal in the shortened time period of two weeks rather than the
anticipated four week, month long plan.
Subject Two displayed initial growth from the pretest to the mid-test. The scores went up
for the mid-test, but declined in the post-test, with the computerized testing showing a lower
score than the initial test. During the post-test Subject Two became stuck on a fact, 6 times 7.
Instead of moving ahead, the student chose to try and solve the fact, resulting in a decreased

36
THE FACTS DON’T ADD UP
score. Subject Two did not skip ahead until prompted by the instructor. The written assessment
immediately followed the computer assessment.
Subject Two displayed frustration as the computer test was completed, which could have
had a possible affect on the written test. It is important to note that this subject has a history of
anxiety. This supports, that despite our plan, it will always be important to keep the learning
styles and challenges of each child in consideration.
Due to the unexpected results with Subject Two, a second series of post-test was given
the following Monday to analyze whether or not the frustration experienced on the computer test
had a direct affect on the written test performance as well. The second series of post-tests with
Subject Two displayed a score of 22 per minute on the written test, and 12 per minute on the
computer test.
Table 5
Ongoing Assessment Results
Name Initial Score
Pre-Test
Mid Score Post-Score
Subject 1 (written)
(computer)
8/minute
13/minute
21/minute
13/minute
23/minute
18/minute
Subject 2 (written)
(computer)
9/minute
13/minute
21/minute
15/minute
16/minute
4/minute
Retest
22/minute (written)
12/minute (computer)
Challenges & Successes
The majority of the implementation plan went smoothly. One subject did not complete
the assignments on time and was asked to finish the work during morning work and snack time.

37
THE FACTS DON’T ADD UP
This is a common occurrence for that particular student. Completing the homework at a different
time did not appear to affect the outcome. It is important to note that this child has many
distractions at home and has mentioned in past homework discussions to prefer completing work
in school where it is easier to focus. We did not hold this against the child, as they were assisting
us in the completion of our project which included additional homework. The project was not
meant to measure whether or not assignments were completed on time, but to evaluate how well
they learned the information.
Subject Two seemed to be improving until the post test when he scored lower than the
mid test. His score dropped on the original post computer test, beginning with a score of 13 and
ending with a score of 4. Due to this drop, we chose to retest him. His retest scores are listed in
the table above.
Suggestions for Future Implementations
Students were given the choice of whether they wanted to test with paper and pencil or on
the computer. Surprisingly, their scores did not match their interest. They both did better on the
paper and pencil test than they did on the computer test initially; however, they both chose
computer tests as their testing preference. In the future, it may be best to consider using only the
method they excel in instead of giving them a choice. These results would be more accurate in
showing individual fluency and automaticity.
It may be beneficial to train parents at the beginning of the year on how to best help their
child at home with homework assignments. They should be aware of how the IXL program
works so that if the child needs help, they can assist. This may prevent students from not
completing their homework assignments. Parents could also be given weekly reports on the
student’s pretest and post-test results so they can also keep track of their child’s progress.
38
THE FACTS DON’T ADD UP
Another option to consider would be implementing post-tests that do not require a time
limit. This would allow the instructor to know if the student either does know the facts or just
does not perform well when timed. This would not measure their fluency level according to our
objectives, but would help identify how much they learned.
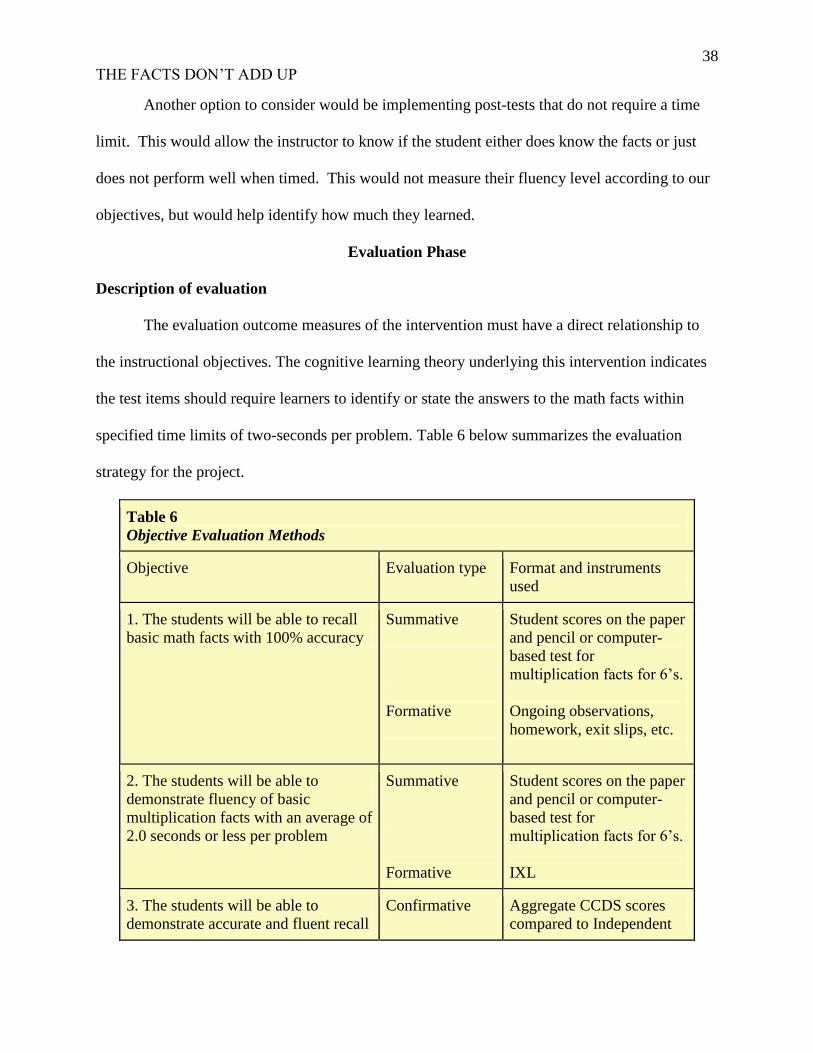
Evaluation Phase
Description of evaluation
The evaluation outcome measures of the intervention must have a direct relationship to
the instructional objectives. The cognitive learning theory underlying this intervention indicates
the test items should require learners to identify or state the answers to the math facts within
specified time limits of two-seconds per problem. Table 6 below summarizes the evaluation
strategy for the project.
Table 6
Objective Evaluation Methods
Objective Evaluation type Format and instruments
used
1. The students will be able to recall
basic math facts with 100% accuracy
Summative
Formative
Student scores on the paper
and pencil or computer-
based test for
multiplication facts for 6’s.
Ongoing observations,
homework, exit slips, etc.
2. The students will be able to
demonstrate fluency of basic
multiplication facts with an average of
2.0 seconds or less per problem
Summative
Formative
Student scores on the paper
and pencil or computer-
based test for
multiplication facts for 6’s.
IXL
3. The students will be able to
demonstrate accurate and fluent recall
Confirmative
Aggregate CCDS scores
compared to Independent

39
THE FACTS DON’T ADD UP
of multiplication facts during the
expected time frame (end of grade 3
to end of grade 4)
Summative
Formative
School normative
performance on the ERB
Comprehensive Testing
Program 4 in Mathematics
Student scores on the paper
and pencil or computer-
based test for
multiplication facts for 6’s
Ongoing observations,
homework, exit slips, etc.
4. The students will be able to display
fact knowledge using timed tests of
varying difficulty with tests getting
more challenging as students gain
mastery of previous facts with 100%
accuracy.
Confirmative
Summative
Sub-test CCDS scores
compared to Independent
School normative
performance on the ERB
Comprehensive Testing
Program 4 in Mathematics
Student scores on each
monthly module (paper and
pencil or computer-based
test) for multiplication facts
0 - 10.
Quantity and Quality of Data Collected
In addition to the formative evaluation procedures already discussed, there is good
quantitative data from which to conduct summative and confirmative evaluation of the program.
Each student completed a pre-test, a mid-test and a post-test where the number of problems
completed and the fluency (seconds per problem) rate can be calculated. This is collected for
both the paper and pencil and the computer-based test. This data is sufficient to establish the
effectiveness of the intervention plan.
Summary of Strengths and Flaws
We were able to see growth over the course of the implementation process, which was a
shorter model than what would essentially be implemented. Overall, the findings support the

40
THE FACTS DON’T ADD UP
curriculum design. Both students demonstrated 100% accuracy in the math facts they completed
on each test (objective #1). They also showed significant increases in automaticity (reduction in
time per problem) with only two weeks of practice and assessment (objective #2). The greatest
improvement occurred in the paper and pencil test group from the pre-test to the mid-term test.
Improvements continued at a small degree between the mid-test and the post-test. For the
computer-based group, the largest improvements in automaticity (reduction in time per problem)
occurred between the mid-test and the post-test. It is possible that the students needed some
practice with the computer test protocol to become more comfortable in navigation. This should
be the subject of future study. The results for each test for each student are presented in
Appendices E and F.
The two learning objectives that were met, or partially met, (1 and 4) were positively
affected with the use of both practice and testing method. However, it must be pointed out that
this was an abbreviated intervention lasting only two weeks. The full curriculum would have
committed a full month of practice time on the sixes that were the subject of the current
intervention, thus doubling the practice time between each of the three measures. Despite this
aggressive time schedule, both students showed significant improvement. The second objective
was not met as written, most likely due to the abbreviated roll out of the curriculum, although
both students made significant progress to meeting Objective 2 in only half the time they
normally would receive. Objectives 3 and 4 could not be fully assessed since it involves the full
program rollout and the school-wide ERB testing that is completed each year in late spring. It
will offer confirmative evaluation of the curriculum before the end of the school year.
41
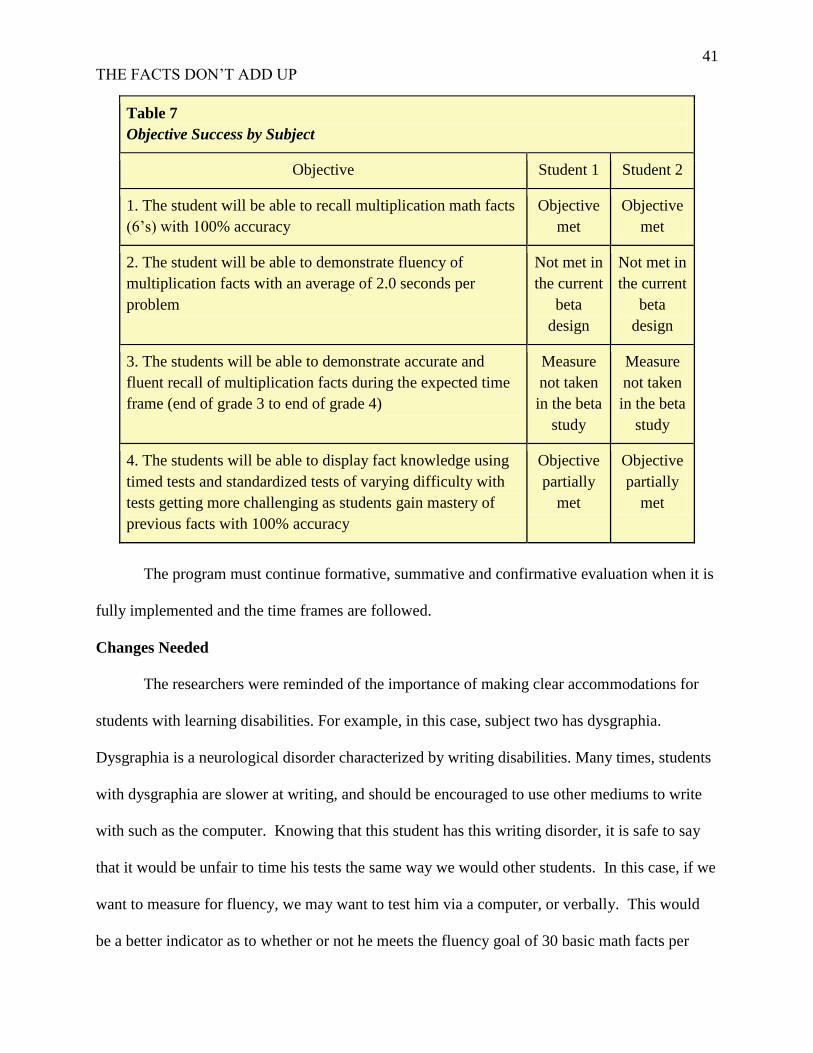
THE FACTS DON’T ADD UP
Table 7
Objective Success by Subject
Objective Student 1 Student 2
1. The student will be able to recall multiplication math facts
(6’s) with 100% accuracy
Objective
met
Objective
met
2. The student will be able to demonstrate fluency of
multiplication facts with an average of 2.0 seconds per
problem
Not met in
the current
beta
design
Not met in
the current
beta
design
3. The students will be able to demonstrate accurate and
fluent recall of multiplication facts during the expected time
frame (end of grade 3 to end of grade 4)
Measure
not taken
in the beta
study
Measure
not taken
in the beta
study
4. The students will be able to display fact knowledge using
timed tests and standardized tests of varying difficulty with
tests getting more challenging as students gain mastery of
previous facts with 100% accuracy
Objective
partially
met
Objective
partially
met
The program must continue formative, summative and confirmative evaluation when it is
fully implemented and the time frames are followed.
Changes Needed
The researchers were reminded of the importance of making clear accommodations for
students with learning disabilities. For example, in this case, subject two has dysgraphia.
Dysgraphia is a neurological disorder characterized by writing disabilities. Many times, students
with dysgraphia are slower at writing, and should be encouraged to use other mediums to write
with such as the computer. Knowing that this student has this writing disorder, it is safe to say
that it would be unfair to time his tests the same way we would other students. In this case, if we
want to measure for fluency, we may want to test him via a computer, or verbally. This would
be a better indicator as to whether or not he meets the fluency goal of 30 basic math facts per
42
THE FACTS DON’T ADD UP
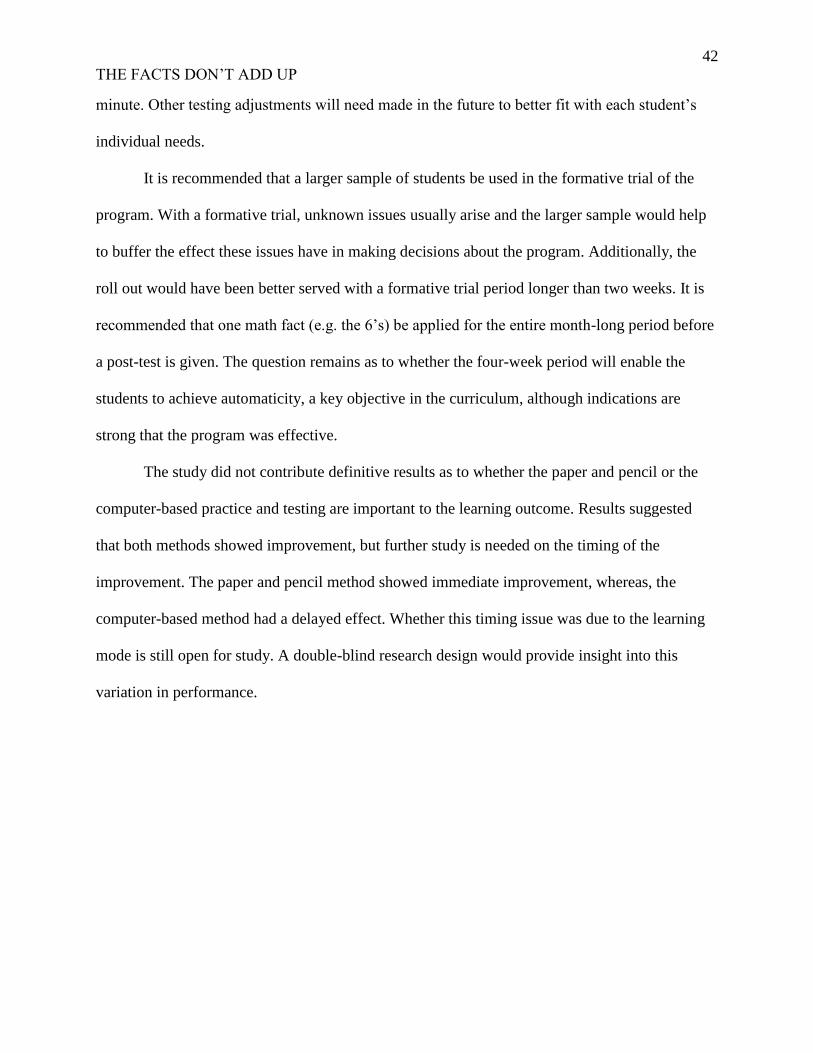
minute. Other testing adjustments will need made in the future to better fit with each student’s
individual needs.
It is recommended that a larger sample of students be used in the formative trial of the
program. With a formative trial, unknown issues usually arise and the larger sample would help
to buffer the effect these issues have in making decisions about the program. Additionally, the
roll out would have been better served with a formative trial period longer than two weeks. It is
recommended that one math fact (e.g. the 6’s) be applied for the entire month-long period before
a post-test is given. The question remains as to whether the four-week period will enable the
students to achieve automaticity, a key objective in the curriculum, although indications are
strong that the program was effective.
The study did not contribute definitive results as to whether the paper and pencil or the
computer-based practice and testing are important to the learning outcome. Results suggested
that both methods showed improvement, but further study is needed on the timing of the
improvement. The paper and pencil method showed immediate improvement, whereas, the
computer-based method had a delayed effect. Whether this timing issue was due to the learning
mode is still open for study. A double-blind research design would provide insight into this
variation in performance.

43
THE FACTS DON’T ADD UP
Citations
Cumming, J. & Elkins, J. (1999). Lack of automaticity in the basic addition facts as a
characteristic of arithmetic learning problems and instructional needs. Mathematical
Cognition, 5(2), 149-180.
Fuson, K. C., Carroll, W. M. & Drueck, J. V. (2000). Achievement results for second and
third graders using the standards-based curriculum Everyday Mathematics. Journal
for Research in Mathematics Education. 31(3) 277-295.
Godfrey, C. (2001a). Computer Technologies: Scaffolding tools for teaching and learning.
Australian Educational Computing, 16(2), 27-29.
Godfrey, C. (2001b). Computers in schools: Changing pedagogies. Australian Educational
Computing, 16(2), 14-17.
Goldish, M. (1991). Making Multiplication Easy: Strategies for Mastering the Tables
through 10. New York, NY: Scholastic Inc.
Hasselbring, T., Goin, L. I., & Bransford, J. D. (1988). Developing Math automaticity in
learning handicapped children: The role of computerized drill and practice. Focus
on Exceptional Children, 20(6), 1-7.
Miller, M., & Lee M. (1997). The Mega-Fun Multiplication Facts Activity Book. New
York, NY: Scholastic Inc.
Morrison, G., Ross, R., & Kemp, J (2006). Designing effective instruction. (6th ed.). New
York: Wiley.
Russell, R. L., & Ginsburg, H. P. (1984). Cognitive Analysis of children’s mathematics
difficulties. Cognition and Instruction. 1(2) 217-244.
Spear-Swerling, L. (2006). Developing automatic recall of addition and subtraction facts,

44
THE FACTS DON’T ADD UP
http://www.ldonline.org/spearswerling/9655
Warnick, T. (1997). One-Minute Math: Developmental Drill Level B Factors 6 to9.
Torrance, CA: Frank Schaffer Publications.
Wong, M., & Evans, D. (2007). Improving Basic Multiplication Fact Recall for Primary
School Students. Mathematics Education Research Journal 19(1), 89-106.

45
THE FACTS DON’T ADD UP
Appendix A
Mathematics Plan Needs Assessment
Rating Scale:
1= Not at all
2= Less than needed
3= As much as needed
4= More than needed
Student Achievement Monitoring
1. Math assessment is aligned with instruction.
1 2 3 4
2. Students are assessed frequently enough to determine
whether they are progressing steadily toward achieving the
Standards.
1 2 3 4
3. Teachers are using the math assessment results to analyze
what students have learned and to revisit/re-teach difficult
concepts.
1 2 3 4
4. Math assessment data is used to identify sub-groups of
students who are at risk or in need of specialized instruction
and monitoring.
1 2 3 4
5. Teachers maintain or change grouping strategies in
accordance with student performance on regular
assessments.
1 2 3 4
Instructional Assistance and Teacher Support
Curriculum
6. Teachers have a good understanding of the Mathematics
Content Standards. 1 2 3 4
7. The school mathematics curriculum is factually and
technically accurate and aligned with the mathematics
Standards.
1 2 3 4
Classroom Instruction and Management Practices
8. Teachers select research-based instructional strategies that
are appropriate to the instructional goals and to students’
needs.
1 2 3 4
9. Teachers effectively organize instruction around goals that 1 2 3 4

46
THE FACTS DON’T ADD UP
are tied to the Standards and direct students’ mathematical
learning.
10. Teachers effectively plan and manage: a. whole-class, small-group, and independent instruction
1 2 3 4
11. b math assessment
1 2 3 4
12 c. instructional support materials
1 2 3 4
13. During the allocated time for mathematics, students are
active participants in the instruction, engaged in thinking
about mathematics or doing mathematics.
1 2 3 4
14. Teachers are positive and optimistic about the prospects that
all students will demonstrate satisfactory achievement. 1 2 3 4
15. Teachers ensure that academic and behavioral expectations
are well established and explicitly taught at the school and
classroom levels.
1 2 3 4
Teacher Collaboration
16. Teachers are given regularly scheduled time, during the
school day, to work collaboratively to plan mathematics
instruction and review student math assessment data.
1 2 3 4
17. Teachers use collaboration to analyze data and modify
instruction.
1 2 3 4

47
THE FACTS DON’T ADD UP
Appendix B
A proposed Topic task analysis on Math Facts
Our task analysis utilizes the learning objectives identified in the needs assessment phase. Each of the
learning objectives becomes the subject of a detailed task analysis procedure. Our first step is to identify a
Subject Matter Expert (SME) so the domain of knowledge can be defined for each learning objective.
The basic steps would unfold as follows:
1. The SME would determine the domain of knowledge that encompasses the learning objectives
a. The domain would include multiplication math facts between 0 - 10
2. The SME would utilize the six types of tasks - facts, concepts, procedures, principles,
interpersonal, and attitudes - to initially categorize the content. Each category represents a
different task type.
3. Based on the learning objectives, the SME would reorganize the content areas for the objective. A
likely outline may appear as follows:
a. Multiplication facts - Learning objective
i.products are factual (Fact)
ii.numerals multiplied together result in a product (Procedure)
iii.commutative principle of multiplying numerals together (Principle)
4. The SME also will review the content for sequencing and hierarchy decisions.
a. Prerequisite knowledge and competency benchmarks will be applied
b. Multiplication facts will be presented in a specific order (based on empirical research
here, but would be decided by the SME in application) (e.g. 0, 1, 10, 2, 5, 9) and then (4,
7, 3, 8, and 6)
5. Finally, the SME would consider information from a learner analysis to determine the readiness
of each student to master the math fact material. Decisions may be made to organize the learning
groups based on their competency.
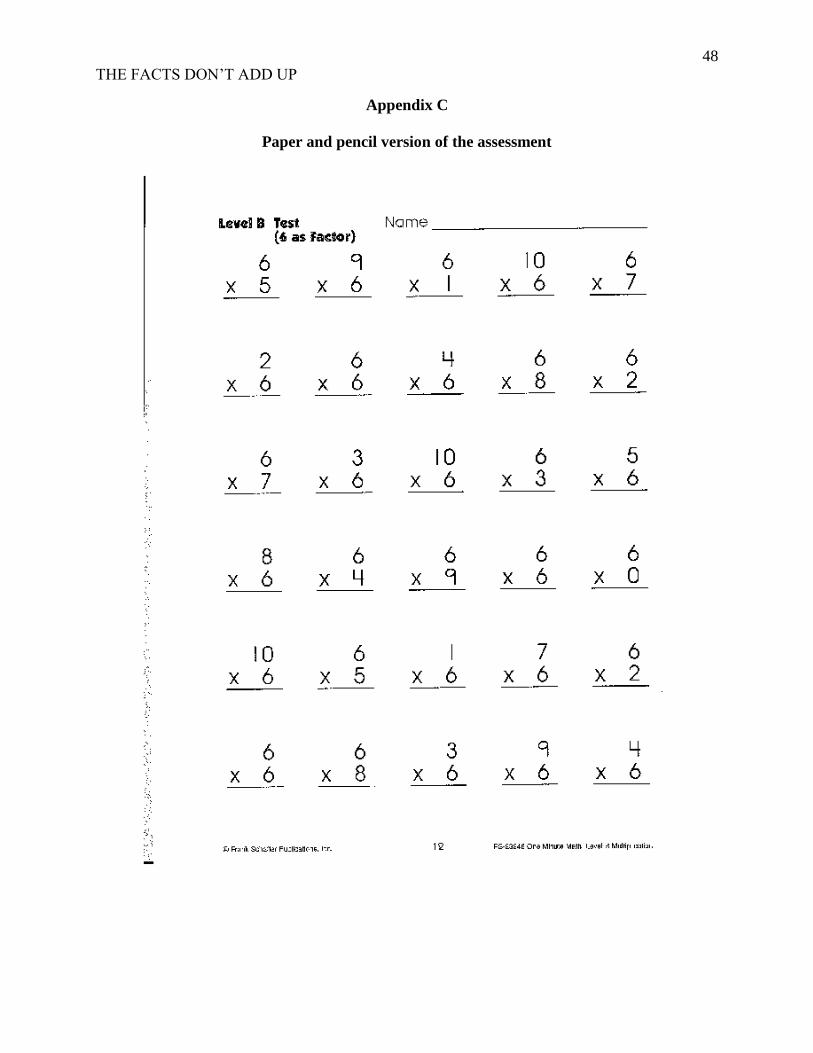
48
THE FACTS DON’T ADD UP
Appendix C
Paper and pencil version of the assessment

49
THE FACTS DON’T ADD UP
Appendix D
Computer version of the assessment

50
THE FACTS DON’T ADD UP
Appendix E
Table 8
Evaluation outcome: Paper and Pencil test results for Student 1 and 2
Student 1 Student 2
Pre-Test 8 problems/ 60 seconds
7.5 seconds per problem
9 problems/ 60 seconds
6.67 seconds per problem
Mid-Test 21 problems/ 60 seconds
2.86 seconds per problem
21 problems/ 60 seconds
2.86 seconds per problem
Post-Test 23 problems/ 60 seconds
2.61 seconds per problem
22 problems/ 60 seconds
2.73 seconds per problem
Table 9
Evaluation outcome: Computer test results for Student 1 and 2
Student 1 Student 2
Pre-Test 13 problems/ 60 seconds
4.62 seconds per problem
13 problems/ 60 seconds
4.62 seconds per problem
Mid-Test 13 problems/ 60 seconds
4.62 seconds per problem
15 problems/ 60 seconds
4.0 seconds per problem
Post-Test 18 problems/ 60 seconds
3.33 seconds per problem
12 problems/ 60 seconds
5.0 seconds per problem

51
THE FACTS DON’T ADD UP
Appendix F
Figure 14. Evaluation paper and pencil outcome. This figure shows seconds per problem
on paper and pencil test results for student 1 and 2.
Figure 15. Evaluation computer outcome. This figure shows seconds per problem on
computer testing for student 1 and 2.
012345678
Pre Mid Post
Seconds per problem - Paper & Pencil
Student 1
Student 2
Automaticity
0
1
2
3
4
5
6
Pre Mid Post
Seconds per problem - Computer
Student 1
student 2
Automaticity
Related Documents


