1 The Facts about Food: Teacher Companion Guide Introduction Welcome to Econ Essentials. This program is designed to help students learn fundamental economic principles in an engaging, digital environment. With this digital interactive, students will be challenged to advise a farm owner using the information they learn throughout this program. Along the way, students will learn about basic supply and demand, supply and demand within the food chain, and risk, and how all of these factors affect the price of food. While seat time for students will vary, the interactive is designed to take 30–35 minutes for students to complete. This educator guide includes background information about the topics covered and guidance on how to use the tools and assessments in a one-to-one or one-to-many environment. Overview This module in the Econ Essentials program focuses on the price of food. It is designed to be used as a self-paced module with interactive features that enhance the experience for visual, auditory, and kinesthetic learners. The content is divided into three topics: Supply, Demand, and the Food at Your Table: An introduction to supply, demand, and the relation both have to food prices Supply and Demand along the Food Supply Chain: An introduction to how supply and demand factor into the production of food at every point in the food supply chain Risks on the Ranch: An explanation of risk and how it affects food prices Students can view the module using a web browser on a workstation, laptop, or tablet. Content is presented as “screens” that students will navigate. Interactive elements and graphics are included throughout. The text, videos, and graphics are accompanied by audio narration that reinforces the content and supports learners at different reading levels. The last section is a simulation game in which students apply what they have learned about food prices to make recommendations about production on a farm. At the end of this interactive, students will complete a summative assessment that includes a series of multiple-choice questions on the topics covered in the module.

Welcome message from author
This document is posted to help you gain knowledge. Please leave a comment to let me know what you think about it! Share it to your friends and learn new things together.
Transcript
1
The Facts about Food: Teacher Companion Guide
Introduction
Welcome to Econ Essentials. This program is designed to help students learn fundamental economic principles in an engaging, digital environment. With this digital interactive, students will be challenged to advise a farm owner using the information they learn throughout this program. Along the way, students will learn about basic supply and demand, supply and demand within the food chain, and risk, and how all of these factors affect the price of food.
While seat time for students will vary, the interactive is designed to take 30–35 minutes for students to complete.
This educator guide includes background information about the topics covered and guidance on how to use the tools and assessments in a one-to-one or one-to-many environment.
Overview
This module in the Econ Essentials program focuses on the price of food. It is designed to be used as a self-paced module with interactive features that enhance the experience for visual, auditory, and kinesthetic learners. The content is divided into three topics:
Supply, Demand, and the Food at Your Table: An introduction to supply,demand, and the relation both have to food prices
Supply and Demand along the Food Supply Chain: An introduction to howsupply and demand factor into the production of food at every point in thefood supply chain
Risks on the Ranch: An explanation of risk and how it affects food prices
Students can view the module using a web browser on a workstation, laptop, or tablet. Content is presented as “screens” that students will navigate. Interactive elements and graphics are included throughout. The text, videos, and graphics are accompanied by audio narration that reinforces the content and supports learners at different reading levels.
The last section is a simulation game in which students apply what they have learned about food prices to make recommendations about production on a farm.
At the end of this interactive, students will complete a summative assessment that includes a series of multiple-choice questions on the topics covered in the module.
2
Instant Expert
The price of food and the factors that affect prices stand as great examples of the global economy at work. The basic economic principles of supply and demand operate as the prices of food commodities fluctuate over time. Students may be aware that these fluctuations occur, but they may not know why or how these fluctuations affect them and the economy in which they live.
This digital interactive will show students how the prices of different farm-produced food items are determined and how each point in the food supply chain factors into price.
Section 1: Introduction and Scenario In the setup, students will read a scenario that explains the following: Last summer, they worked on a farm and learned a lot about the day-to-day operation of the farm, but now they want to know how farms make money. Students will be introduced to the concepts of risk, prices, and supply and demand.
Section 2: Supply, Demand, and the Food on Your Table The first topic covers supply and demand. The price of a product is controlled mainly by levels of supply and demand.
Supply is the quantity of a product available for sale. This can change according to such factors as:
The cost of goods needed to make the product (inputs) Technological improvements in the production of the product The expectations of the producer The number of suppliers
Demand is the level of need for a product by consumers. Demand can increase or decrease according to such factors as:
Changes in competition from substitute products Prices of complementary products Changes in consumer preferences Changes in consumer incomes
Graphs of supply and demand curves illustrate these relationships. Supply and demand curves intersect to form a balance point called the equilibrium point. This represents the optimal price, which is the highest price the producer can charge without consumers losing interest in the product. Viewed another way, the optimal price is the lowest price consumers will pay at a point where it is still profitable and worthwhile for the producer to supply the product. When supply or demand
3
changes, this shifts supply or demand curve left or right, causing a change in the equilibrium point.
Section 3: Supply and Demand along the Food Chain The second topic introduces the student to the food supply chain. Supply and demand affect prices at every step in the supply chain. All the steps in the supply chain combine to determine the final prices consumers pay.
Each step in the supply chain is a single part of the business of getting food from farm to table. For example, farmers grow corn crops and harvest them for sale to a grain elevator. Processors buy the corn from the grain elevator and transform it into a product and package it for sale to consumers or feedlot operators. The processor sells the product to a wholesaler, and grocery stores (retailers) buy the product from the wholesaler. Each step in this supply chain incrementally increases prices until the product is sold to consumers at the final market price.
Speculators are briefly introduced as part of the supply chain. Speculators invest on organized futures exchanges, where they purchase futures contracts on commodities and financial instruments. Speculators accept risk in order to make a profit based on future price changes. Because risk can be transferred across buyers and sellers, these organized exchanges have a stabilizing influence on prices.
This section concludes with an interactive that allows students to manipulate costs at different stages of the beef supply chain to see how the final price consumers pay for hamburger meat is affected by each change the students make.
Section 4: Risks on the Ranch For any producer, there are many types of risks associated with making a product and getting it to market. These risks ultimately contribute to the final price of the product. For example, increased feed costs for cattle will increase a farmer's costs to produce beef. This increase is passed along the supply chain, raising the price of beef products for consumers at the grocery store.
Students will explore many examples of risks faced by farmers, including unexpected expenditures, increased energy costs, increased competition, and higher taxes. They see whether these risks and other factors cause prices to trend up or down.
Section 5: Making Production Decisions In the final section, students will apply what they have learned throughout the lesson about supply and demand, the supply chain, and risk. Building on the original scenario, they will be asked to advise a farm owner on how to expand production of beef or corn based on external factors and risks. They can increase their scores (profitability) by making smart decisions about production over five turns (years).
4
At the end of this simulation, students will receive an overall score that shows how effective their advice was. They can then repeat the game to try to get a higher score.
The Facts about Food
Getting Started
Objectives Students will learn:
The basics of supply and demand, including supply and demand curves andequilibrium points
How supply and demand apply to various stages in the production of food,particularly on a farm or ranch
How prices are affected by various factors at every point in the food supplychain
The role risk plays in food production and profit How to apply information about supply and demand, prices, the food chain,
and risk in order to manipulate profit margins for a farm owner in asimulation
Materials To help students navigate the interactive, you will need:
A computer or other device with Internet access and a web browser A projection device to display the web pages
Procedure This module is designed to be used by individual students in a self-paced setting or, if technology is limited, in a one-to-many environment. If using the module as a presentation in a one-to-many environment, the instructor can use the navigation features of the module to present the content to students and to set the pace of the lesson. By eliciting group responses, the instructor can facilitate interaction between students about their experiences and ideas and initiate small group discussions.
5
Topics
Section 1, Setup: From Farm to Table
Estimated time to complete: 3–5 minutes
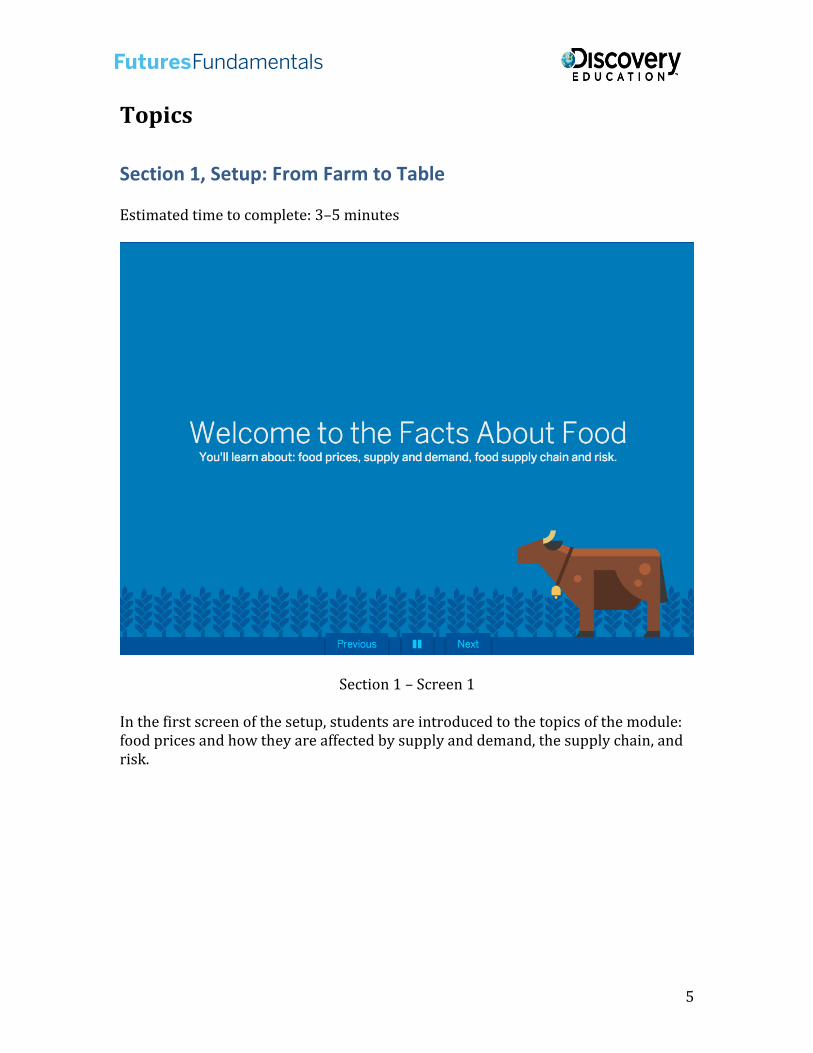
Section 1 – Screen 1
In the first screen of the setup, students are introduced to the topics of the module: food prices and how they are affected by supply and demand, the supply chain, and risk.
6
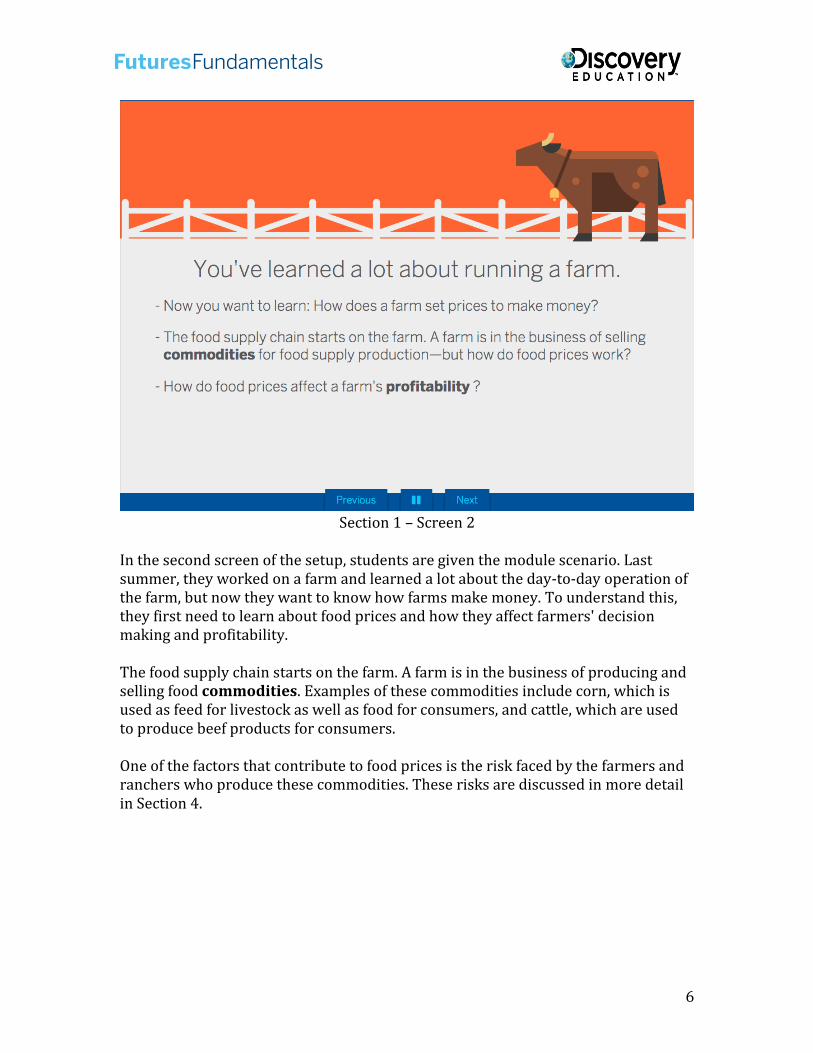
Section 1 – Screen 2
In the second screen of the setup, students are given the module scenario. Last summer, they worked on a farm and learned a lot about the day-to-day operation of the farm, but now they want to know how farms make money. To understand this, they first need to learn about food prices and how they affect farmers' decision making and profitability.
The food supply chain starts on the farm. A farm is in the business of producing and selling food commodities. Examples of these commodities include corn, which is used as feed for livestock as well as food for consumers, and cattle, which are used to produce beef products for consumers.
One of the factors that contribute to food prices is the risk faced by the farmers and ranchers who produce these commodities. These risks are discussed in more detail in Section 4.
7
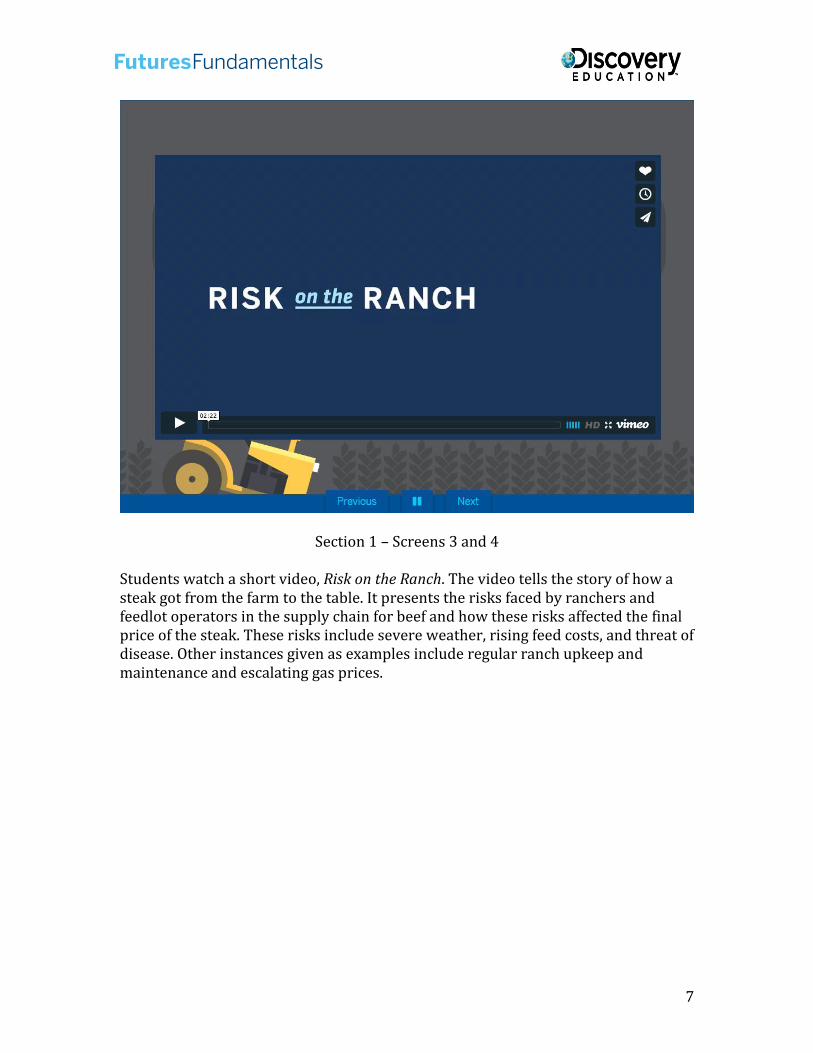
Section 1 – Screens 3 and 4
Students watch a short video, Risk on the Ranch. The video tells the story of how a steak got from the farm to the table. It presents the risks faced by ranchers and feedlot operators in the supply chain for beef and how these risks affected the final price of the steak. These risks include severe weather, rising feed costs, and threat of disease. Other instances given as examples include regular ranch upkeep and maintenance and escalating gas prices.
8
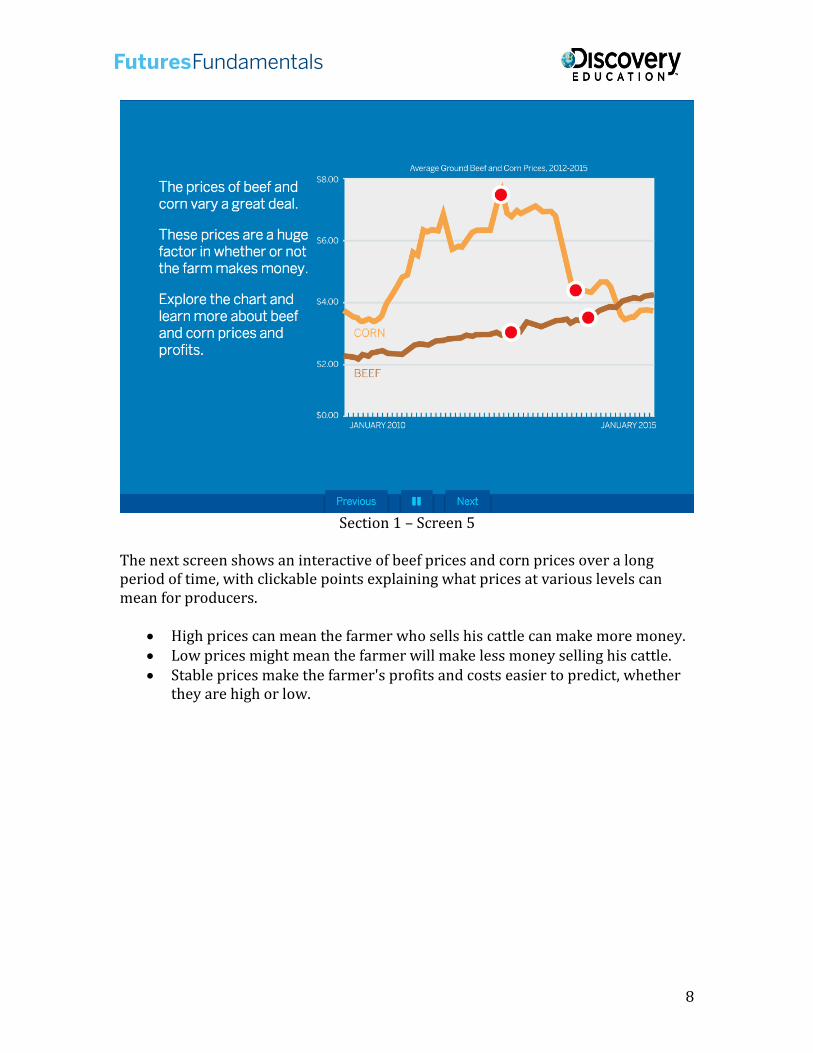
Section 1 – Screen 5
The next screen shows an interactive of beef prices and corn prices over a long period of time, with clickable points explaining what prices at various levels can mean for producers.
High prices can mean the farmer who sells his cattle can make more money. Low prices might mean the farmer will make less money selling his cattle. Stable prices make the farmer's profits and costs easier to predict, whether
they are high or low.
9
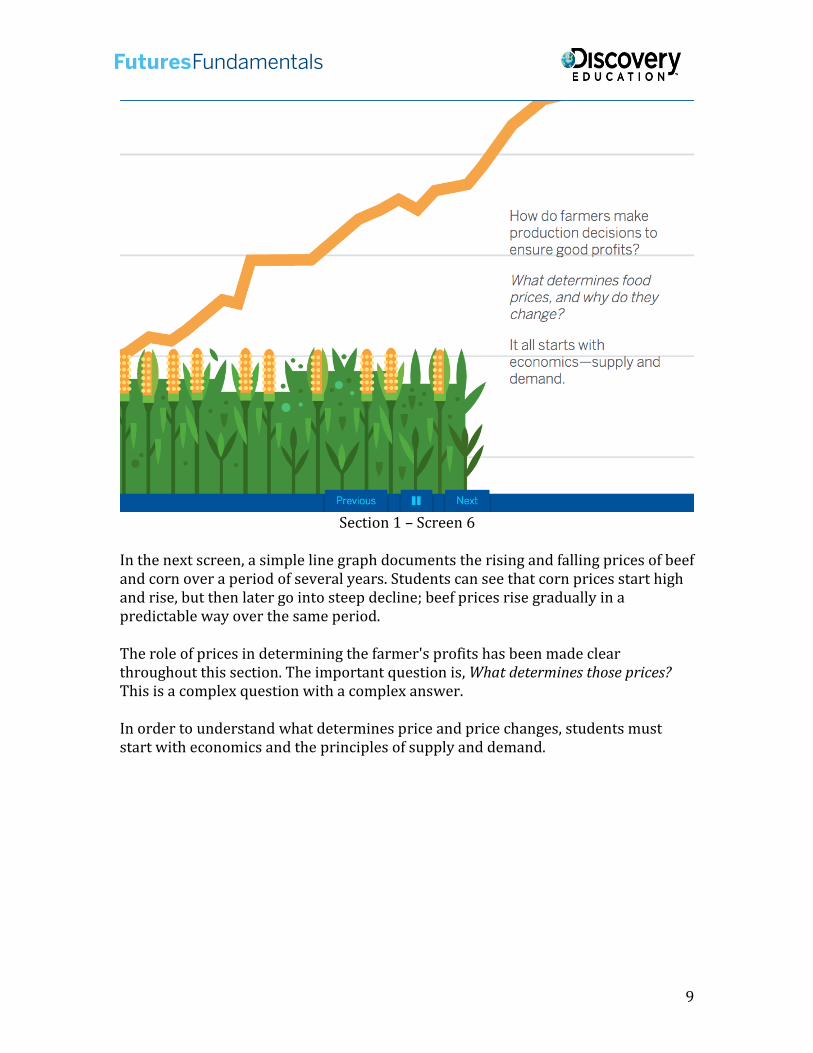
Section 1 – Screen 6
In the next screen, a simple line graph documents the rising and falling prices of beef and corn over a period of several years. Students can see that corn prices start high and rise, but then later go into steep decline; beef prices rise gradually in a predictable way over the same period.
The role of prices in determining the farmer's profits has been made clear throughout this section. The important question is, What determines those prices? This is a complex question with a complex answer.
In order to understand what determines price and price changes, students must start with economics and the principles of supply and demand.
10
Section 2: Supply, Demand, and the Food on Your Table Estimated time to complete: 4–6 minutes
Section 2 – Screen 1
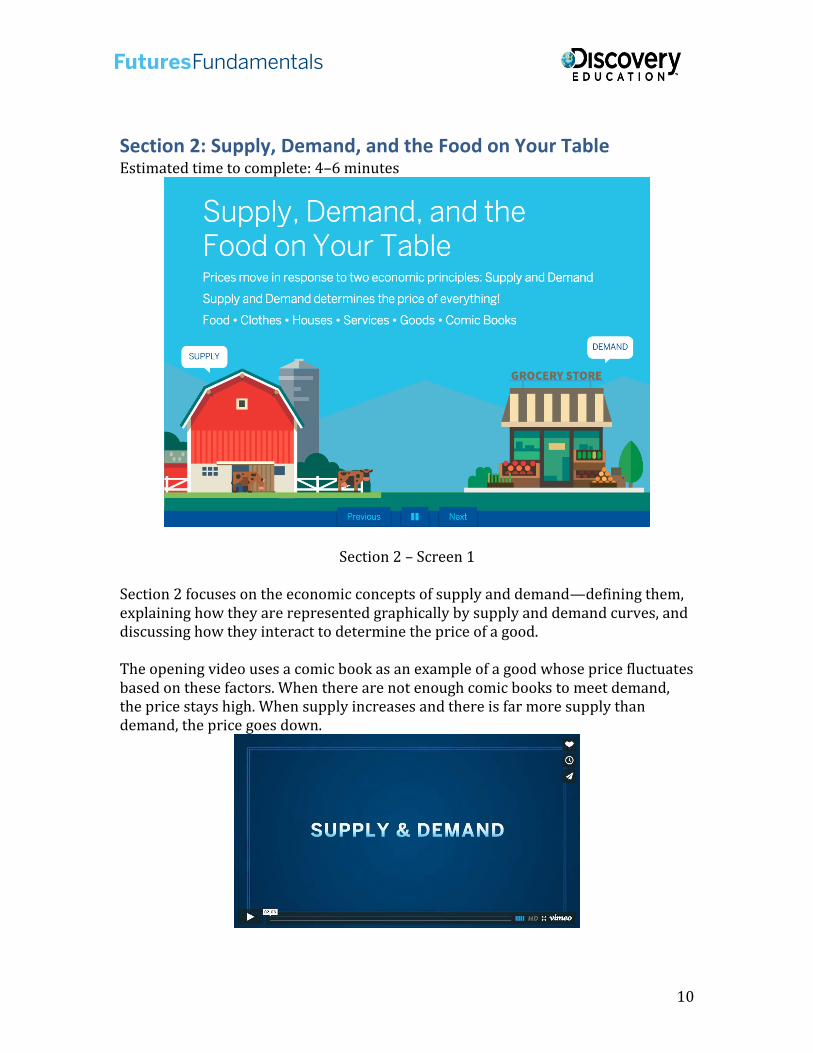
Section 2 focuses on the economic concepts of supply and demand—defining them, explaining how they are represented graphically by supply and demand curves, and discussing how they interact to determine the price of a good.
The opening video uses a comic book as an example of a good whose price fluctuates based on these factors. When there are not enough comic books to meet demand, the price stays high. When supply increases and there is far more supply than demand, the price goes down.
11
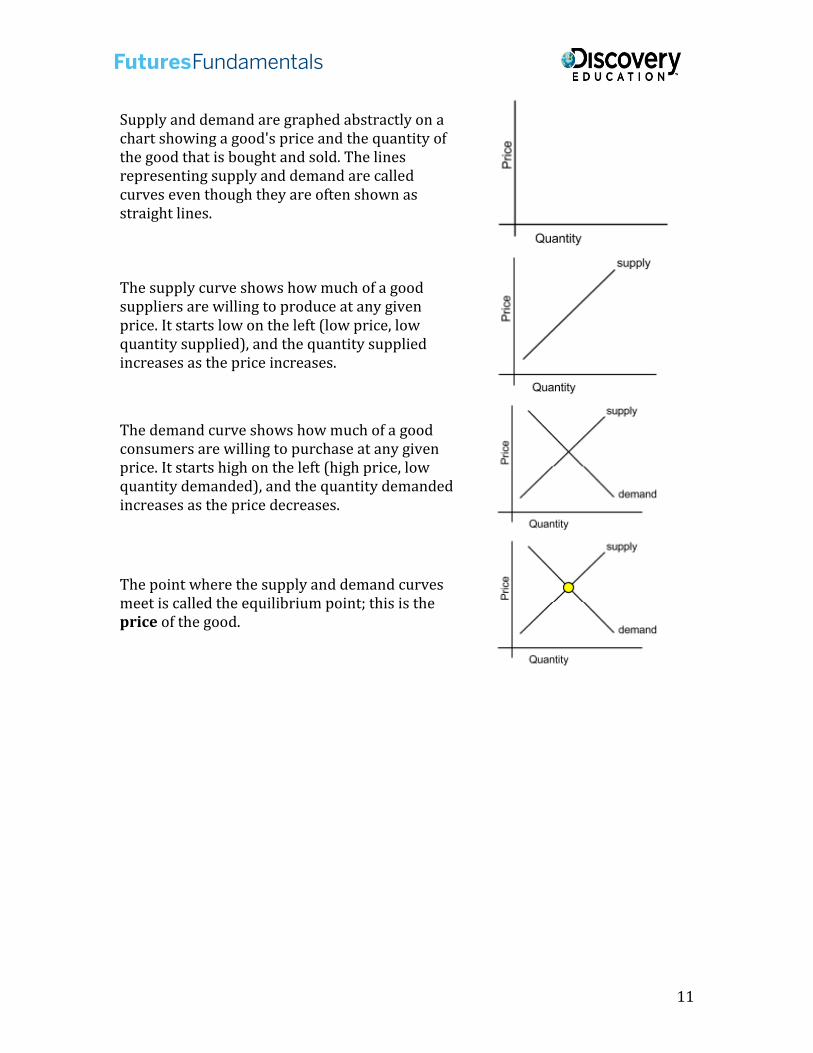
Supply and demand are graphed abstractly on a chart showing a good's price and the quantity of the good that is bought and sold. The lines representing supply and demand are called curves even though they are often shown as straight lines.
The supply curve shows how much of a good suppliers are willing to produce at any given price. It starts low on the left (low price, low quantity supplied), and the quantity supplied increases as the price increases.
The demand curve shows how much of a good consumers are willing to purchase at any given price. It starts high on the left (high price, low quantity demanded), and the quantity demanded increases as the price decreases.
The point where the supply and demand curves meet is called the equilibrium point; this is the price of the good.
12
Section 2 – Screen 2
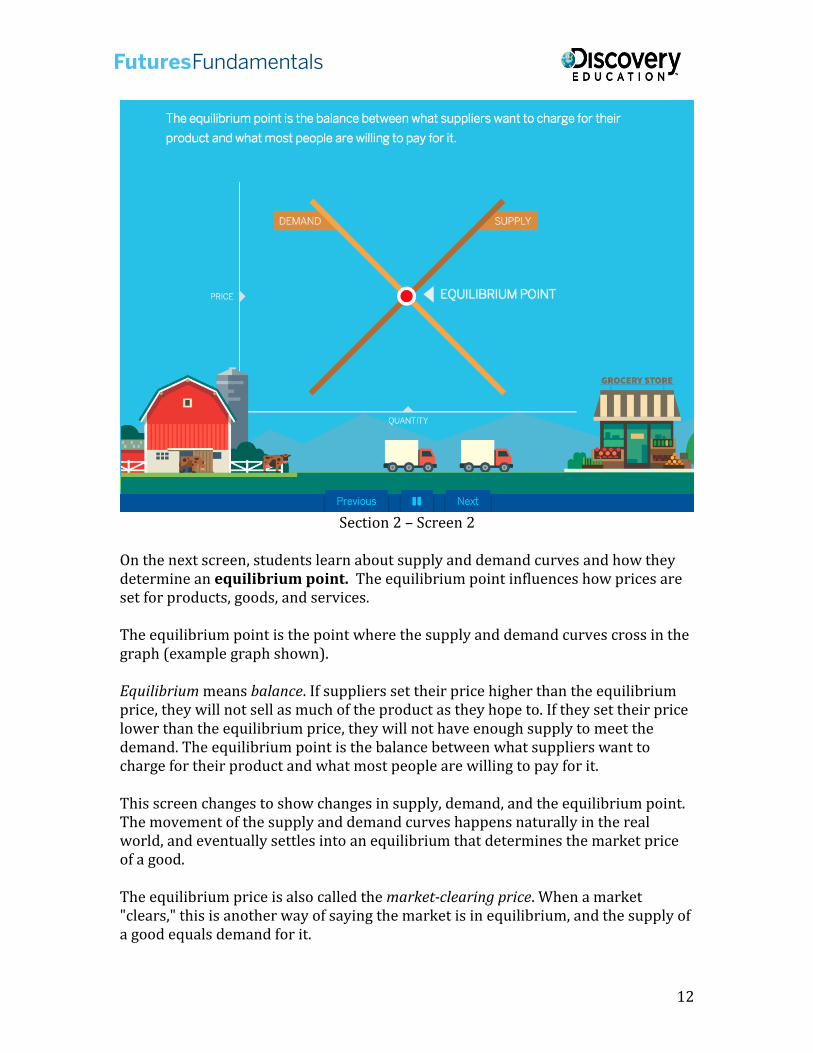
On the next screen, students learn about supply and demand curves and how they determine an equilibrium point. The equilibrium point influences how prices are set for products, goods, and services.
The equilibrium point is the point where the supply and demand curves cross in the graph (example graph shown).
Equilibrium means balance. If suppliers set their price higher than the equilibrium price, they will not sell as much of the product as they hope to. If they set their price lower than the equilibrium price, they will not have enough supply to meet the demand. The equilibrium point is the balance between what suppliers want to charge for their product and what most people are willing to pay for it.
This screen changes to show changes in supply, demand, and the equilibrium point. The movement of the supply and demand curves happens naturally in the real world, and eventually settles into an equilibrium that determines the market price of a good.
The equilibrium price is also called the market-clearing price. When a market "clears," this is another way of saying the market is in equilibrium, and the supply of a good equals demand for it.
13
Section 2 – Screen 3
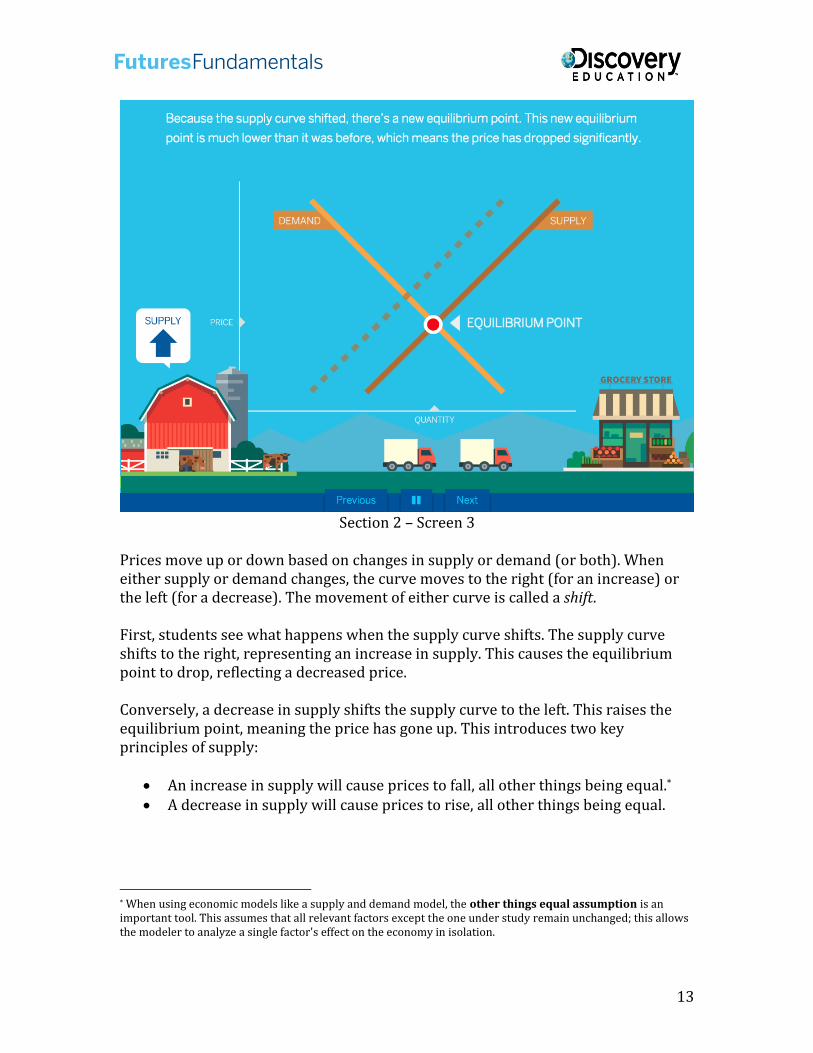
Prices move up or down based on changes in supply or demand (or both). When either supply or demand changes, the curve moves to the right (for an increase) or the left (for a decrease). The movement of either curve is called a shift.
First, students see what happens when the supply curve shifts. The supply curve shifts to the right, representing an increase in supply. This causes the equilibrium point to drop, reflecting a decreased price.
Conversely, a decrease in supply shifts the supply curve to the left. This raises the equilibrium point, meaning the price has gone up. This introduces two key principles of supply:
An increase in supply will cause prices to fall, all other things being equal.*
A decrease in supply will cause prices to rise, all other things being equal.
* When using economic models like a supply and demand model, the other things equal assumption is an important tool. This assumes that all relevant factors except the one under study remain unchanged; this allows the modeler to analyze a single factor's effect on the economy in isolation.
14
Section 2 – Screen 4
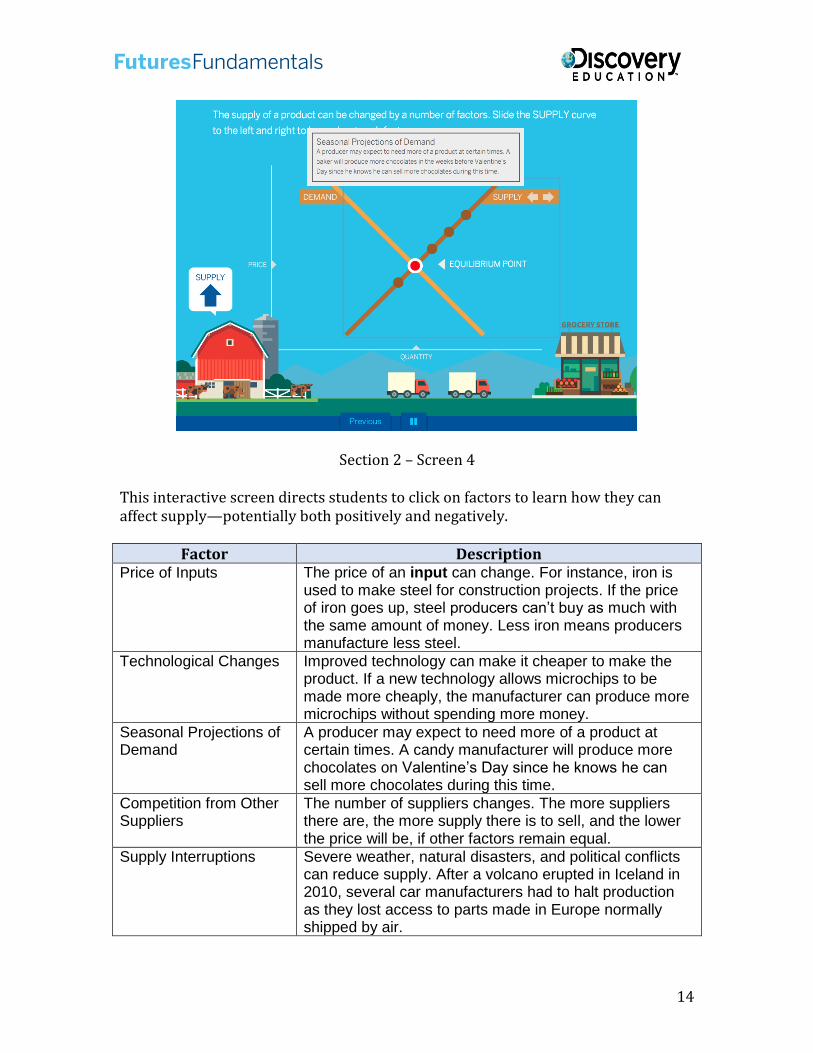
This interactive screen directs students to click on factors to learn how they can affect supply—potentially both positively and negatively.
Factor Description Price of Inputs The price of an input can change. For instance, iron is
used to make steel for construction projects. If the price of iron goes up, steel producers can’t buy as much with the same amount of money. Less iron means producers manufacture less steel.
Technological Changes Improved technology can make it cheaper to make the product. If a new technology allows microchips to be made more cheaply, the manufacturer can produce more microchips without spending more money.
Seasonal Projections of Demand
A producer may expect to need more of a product at certain times. A candy manufacturer will produce more chocolates on Valentine’s Day since he knows he can sell more chocolates during this time.
Competition from Other Suppliers
The number of suppliers changes. The more suppliers there are, the more supply there is to sell, and the lower the price will be, if other factors remain equal.
Supply Interruptions Severe weather, natural disasters, and political conflicts can reduce supply. After a volcano erupted in Iceland in 2010, several car manufacturers had to halt production as they lost access to parts made in Europe normally shipped by air.
15
Section 2 – Screen 5
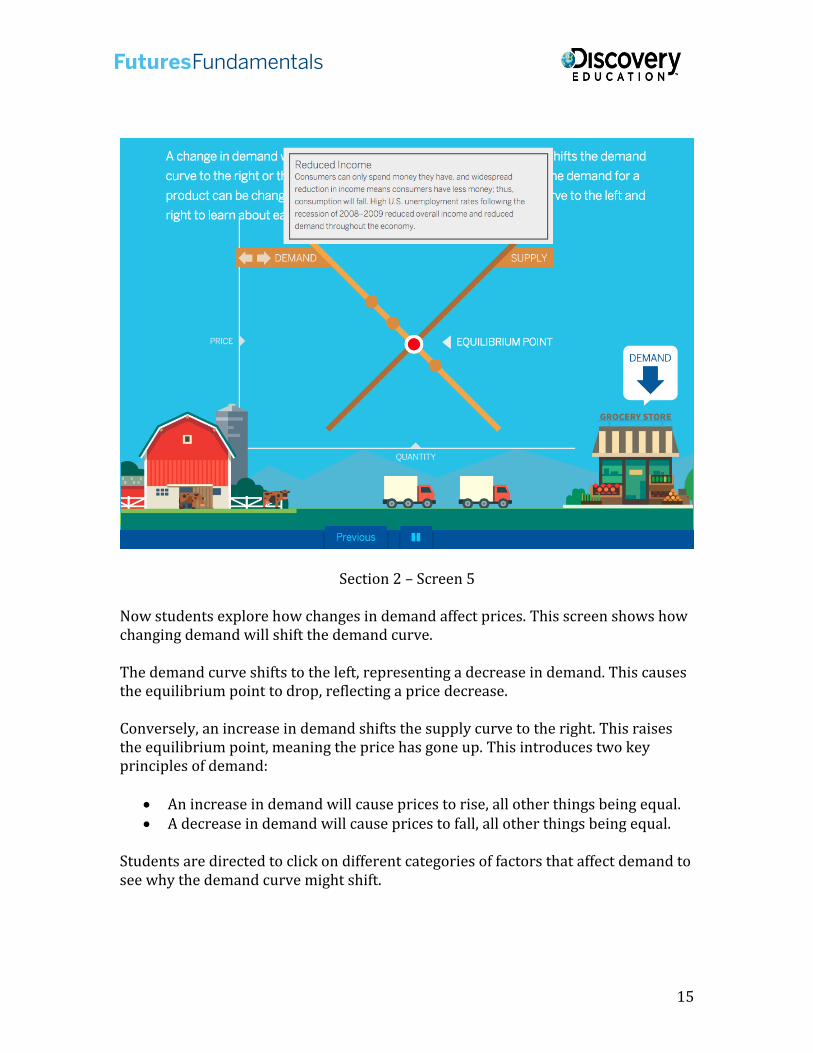
Now students explore how changes in demand affect prices. This screen shows how changing demand will shift the demand curve.
The demand curve shifts to the left, representing a decrease in demand. This causes the equilibrium point to drop, reflecting a price decrease.
Conversely, an increase in demand shifts the supply curve to the right. This raises the equilibrium point, meaning the price has gone up. This introduces two key principles of demand:
An increase in demand will cause prices to rise, all other things being equal. A decrease in demand will cause prices to fall, all other things being equal.
Students are directed to click on different categories of factors that affect demand to see why the demand curve might shift.
16
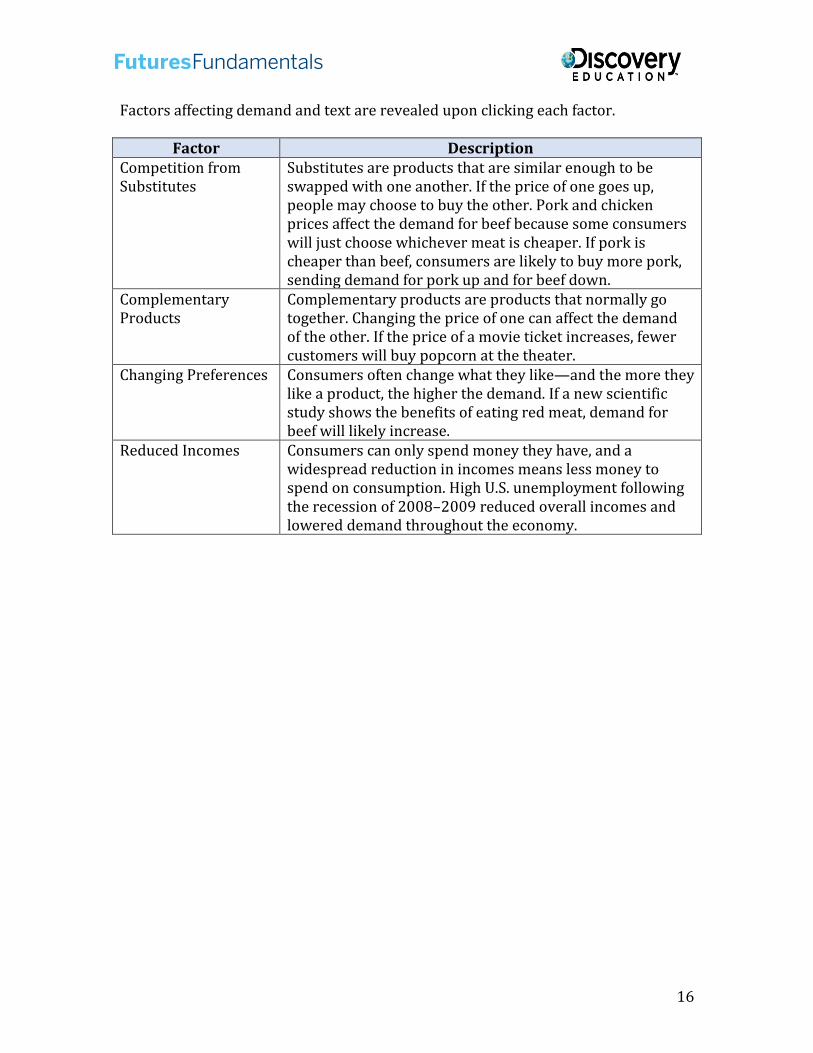
Factors affecting demand and text are revealed upon clicking each factor.
Factor Description Competition from Substitutes
Substitutes are products that are similar enough to be swapped with one another. If the price of one goes up, people may choose to buy the other. Pork and chicken prices affect the demand for beef because some consumers will just choose whichever meat is cheaper. If pork is cheaper than beef, consumers are likely to buy more pork, sending demand for pork up and for beef down.
Complementary Products
Complementary products are products that normally go together. Changing the price of one can affect the demand of the other. If the price of a movie ticket increases, fewer customers will buy popcorn at the theater.
Changing Preferences Consumers often change what they like—and the more they like a product, the higher the demand. If a new scientific study shows the benefits of eating red meat, demand for beef will likely increase.
Reduced Incomes Consumers can only spend money they have, and a widespread reduction in incomes means less money to spend on consumption. High U.S. unemployment following the recession of 2008–2009 reduced overall incomes and lowered demand throughout the economy.
17
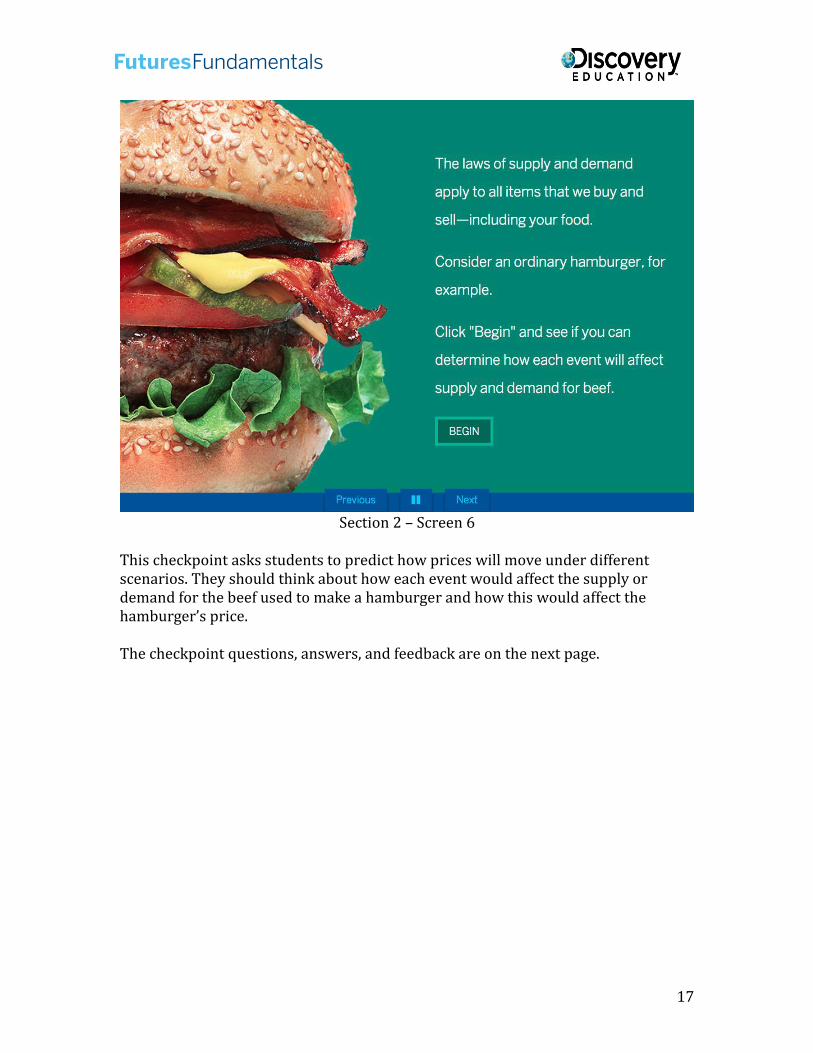
Section 2 – Screen 6
This checkpoint asks students to predict how prices will move under different scenarios. They should think about how each event would affect the supply or demand for the beef used to make a hamburger and how this would affect the hamburger’s price.
The checkpoint questions, answers, and feedback are on the next page.
18
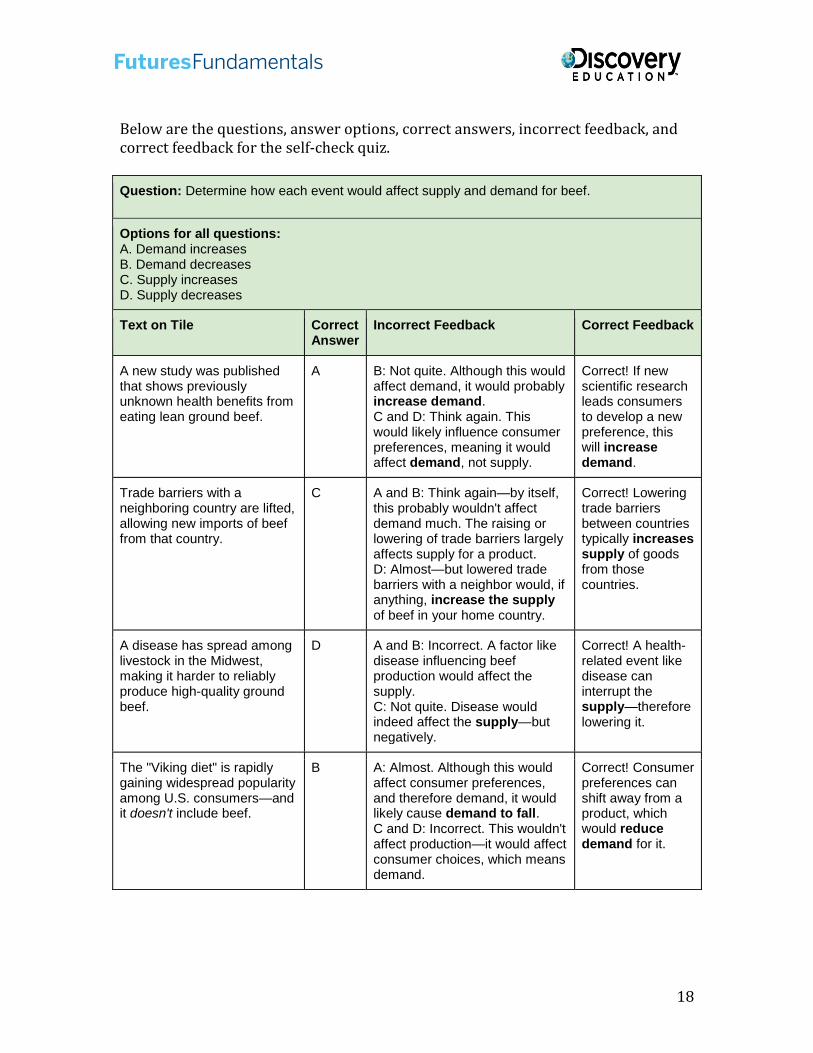
Below are the questions, answer options, correct answers, incorrect feedback, and correct feedback for the self-check quiz.
Question: Determine how each event would affect supply and demand for beef.
Options for all questions: A. Demand increasesB. Demand decreasesC. Supply increasesD. Supply decreases
Text on Tile Correct Answer
Incorrect Feedback Correct Feedback
A new study was published that shows previously unknown health benefits from eating lean ground beef.
A B: Not quite. Although this would affect demand, it would probably increase demand. C and D: Think again. This would likely influence consumer preferences, meaning it would affect demand, not supply.
Correct! If new scientific research leads consumers to develop a new preference, this will increase demand.
Trade barriers with a neighboring country are lifted, allowing new imports of beef from that country.
C A and B: Think again—by itself, this probably wouldn't affect demand much. The raising or lowering of trade barriers largely affects supply for a product. D: Almost—but lowered trade barriers with a neighbor would, if anything, increase the supply of beef in your home country.
Correct! Lowering trade barriers between countries typically increases supply of goods from those countries.
A disease has spread among livestock in the Midwest, making it harder to reliably produce high-quality ground beef.
D A and B: Incorrect. A factor like disease influencing beef production would affect the supply. C: Not quite. Disease would indeed affect the supply—but negatively.
Correct! A health-related event like disease can interrupt the supply—therefore lowering it.
The "Viking diet" is rapidly gaining widespread popularity among U.S. consumers—and it doesn't include beef.
B A: Almost. Although this would affect consumer preferences, and therefore demand, it would likely cause demand to fall. C and D: Incorrect. This wouldn't affect production—it would affect consumer choices, which means demand.
Correct! Consumer preferences can shift away from a product, which would reduce demand for it.
19
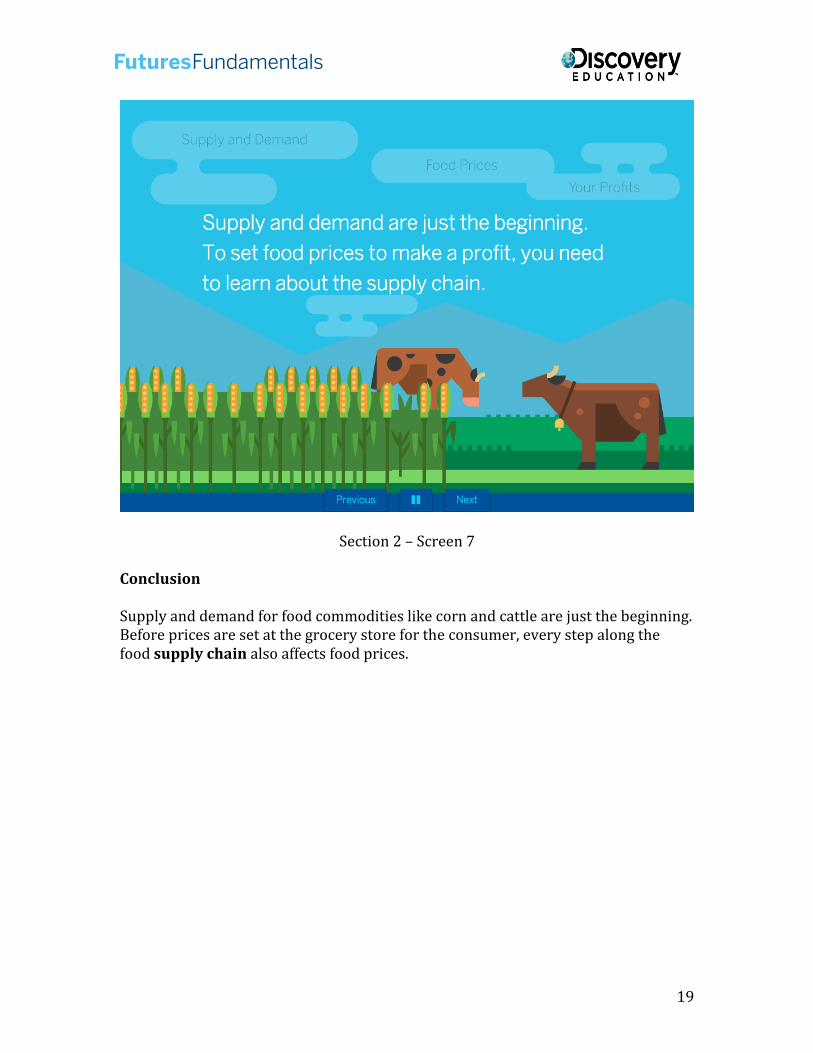
Section 2 – Screen 7
Conclusion
Supply and demand for food commodities like corn and cattle are just the beginning. Before prices are set at the grocery store for the consumer, every step along the food supply chain also affects food prices.
20
Section 3: Supply and Demand along the Food Chain Estimated time to complete: 5–7 minutes
Section 3 – Screen 1
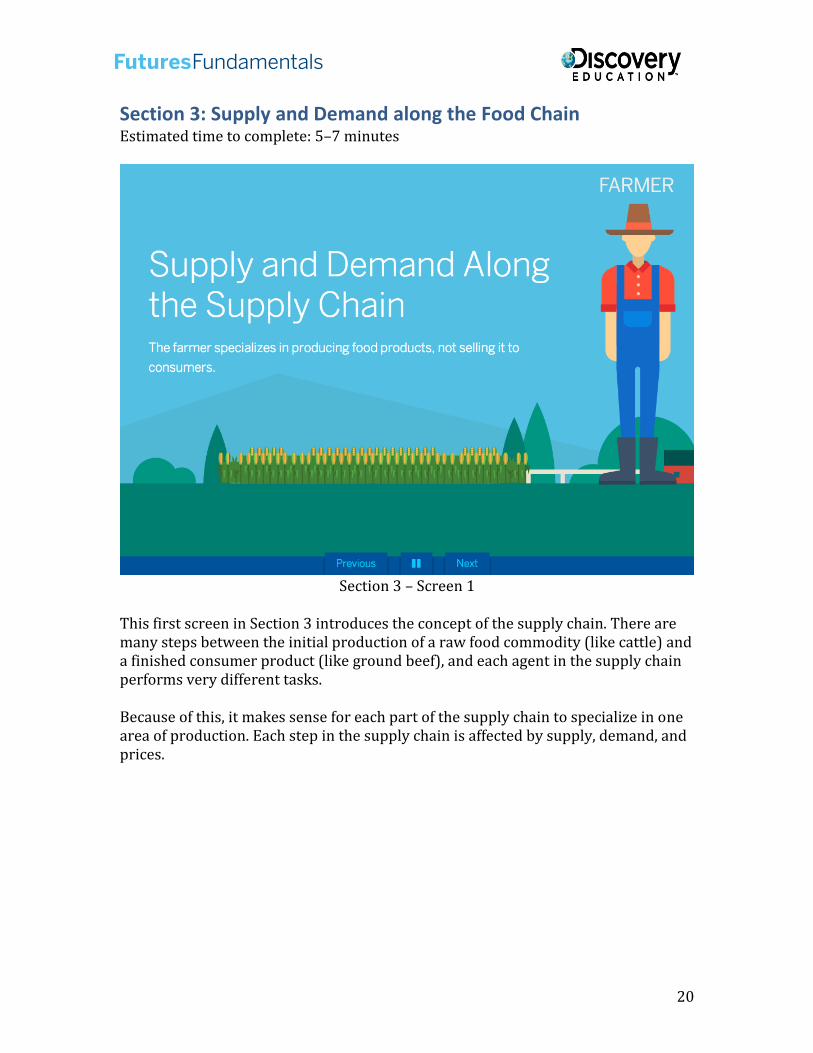
This first screen in Section 3 introduces the concept of the supply chain. There are many steps between the initial production of a raw food commodity (like cattle) and a finished consumer product (like ground beef), and each agent in the supply chain performs very different tasks.
Because of this, it makes sense for each part of the supply chain to specialize in one area of production. Each step in the supply chain is affected by supply, demand, and prices.
21
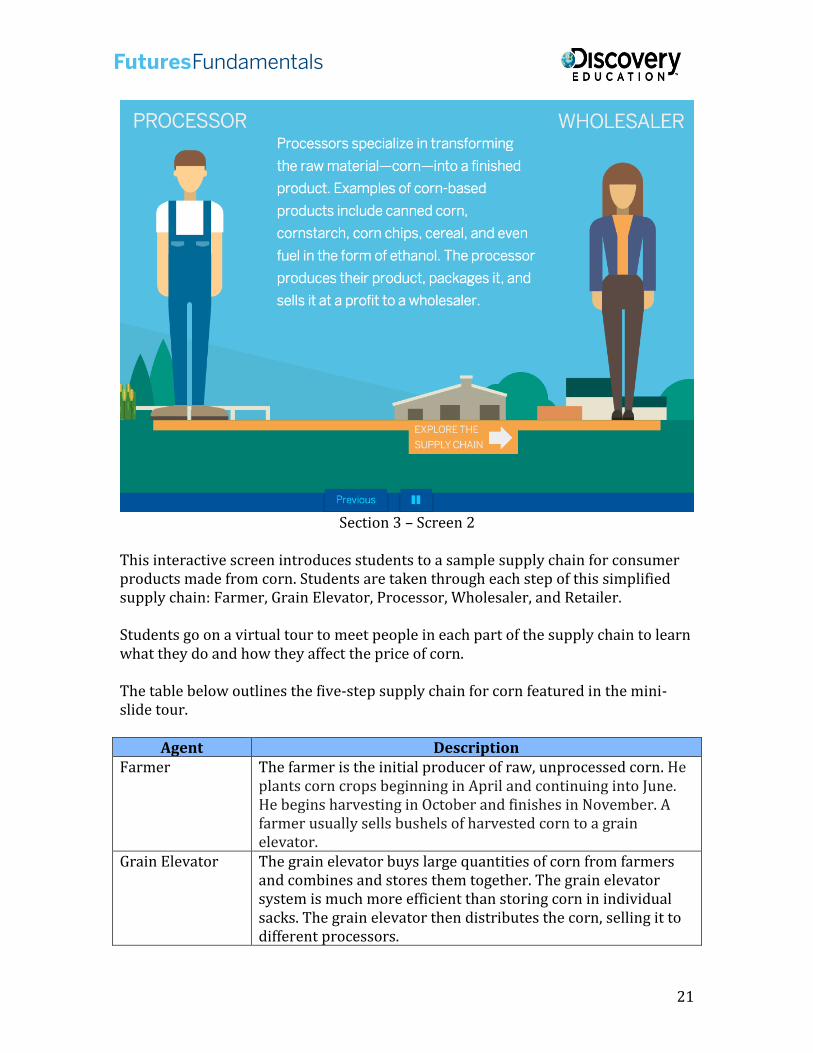
Section 3 – Screen 2
This interactive screen introduces students to a sample supply chain for consumer products made from corn. Students are taken through each step of this simplified supply chain: Farmer, Grain Elevator, Processor, Wholesaler, and Retailer.
Students go on a virtual tour to meet people in each part of the supply chain to learn what they do and how they affect the price of corn.
The table below outlines the five-step supply chain for corn featured in the mini-slide tour.
Agent Description Farmer The farmer is the initial producer of raw, unprocessed corn. He
plants corn crops beginning in April and continuing into June. He begins harvesting in October and finishes in November. A farmer usually sells bushels of harvested corn to a grain elevator.
Grain Elevator The grain elevator buys large quantities of corn from farmers and combines and stores them together. The grain elevator system is much more efficient than storing corn in individual sacks. The grain elevator then distributes the corn, selling it to different processors.
22
Agent Description Processor Processors specialize in transforming the raw material—
bushels of corn—into a finished product. Examples of corn-based products include canned corn, cornstarch, corn chips, cereal, and even fuel in the form of ethanol. The processor produces her product, packages it, and sells it at a profit to a wholesaler.
Wholesaler The wholesaler is a distributor who specializes in the business of getting the finished product to the markets where consumers demand them. Sometimes there are multiple levels to this part of the supply chain, especially when goods are sold across state and international borders.
Retailer The retailer, such as a neighborhood grocery store, is the final step in the supply chain. The retailer makes the finished product available to the consumer to purchase.
23
Section 3 – Screen 3
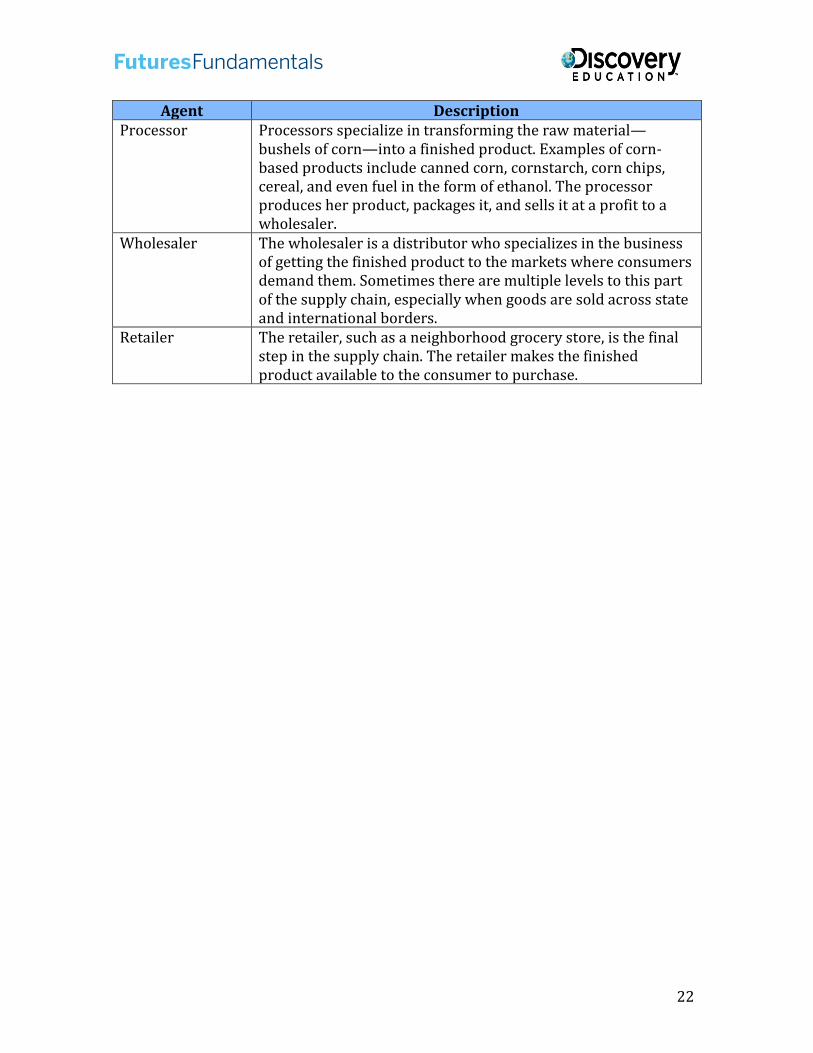
On this screen, the role of speculators in the supply chain is explained at a high level.
The speculation process helps keep prices relatively stable. Matching each buyer with a seller helps commodities markets function more efficiently.
Sidebar: More on Speculators
Speculators typically participate in organized futures markets. In these markets, standardized contracts are traded, and measures are put in place to ensure speculators do not have to worry about counterparty risk. In other words, the risk of not finding a reliable buyer for a commodity or financial instrument is reduced or eliminated. Speculators use complex economic calculations and market forecasts to make trading decisions. They do not usually participate in the supply chain for the physical commodity. They usually participate in the price discovery and risk management processes on organized futures exchanges.
The trading activity of speculators anticipates and warns others about shortages or surpluses in the market. This helps others prepare for these events and sets expectations for future market conditions, which results in a less volatile market and more stable prices.
24
Brokers and Liquidity
Brokers work with the speculators who want to accept market risk in an attempt to profit by buying and selling commodities like corn. This trading typically takes place on a futures exchange. Brokers can help various participants in the marketplace or the supply chain buy or sell commodities like corn in an effort to profit from future changes in prices.
Brokers and speculators play an essential role in maintaining effective markets. Their participation in the markets means it is easier for others to buy and sell when they want to, a concept called liquidity.
25
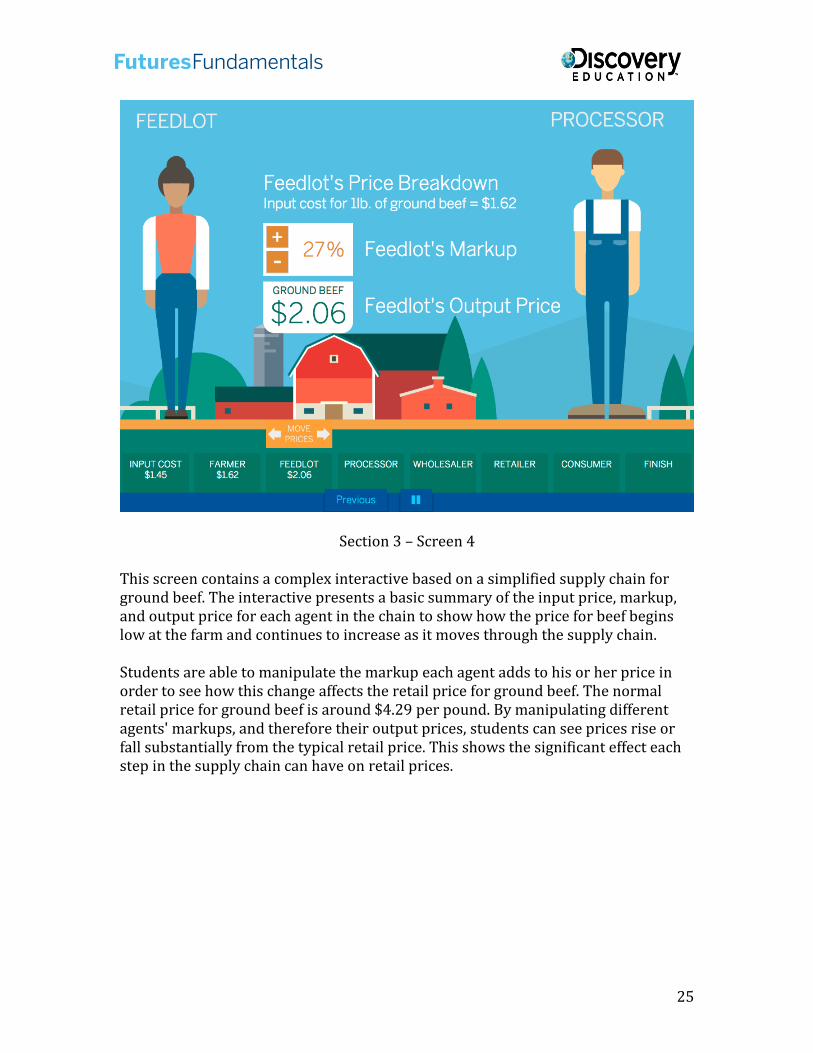
Section 3 – Screen 4
This screen contains a complex interactive based on a simplified supply chain for ground beef. The interactive presents a basic summary of the input price, markup, and output price for each agent in the chain to show how the price for beef begins low at the farm and continues to increase as it moves through the supply chain.
Students are able to manipulate the markup each agent adds to his or her price in order to see how this change affects the retail price for ground beef. The normal retail price for ground beef is around $4.29 per pound. By manipulating different agents' markups, and therefore their output prices, students can see prices rise or fall substantially from the typical retail price. This shows the significant effect each step in the supply chain can have on retail prices.
26
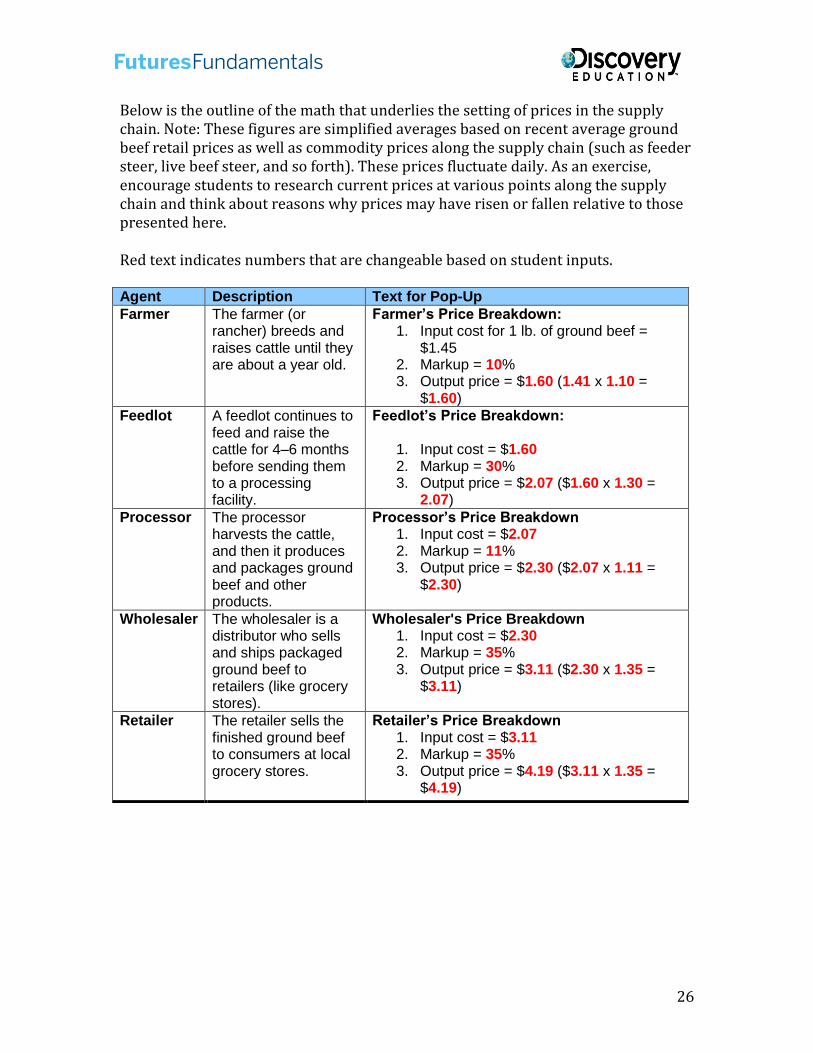
Below is the outline of the math that underlies the setting of prices in the supply chain. Note: These figures are simplified averages based on recent average ground beef retail prices as well as commodity prices along the supply chain (such as feeder steer, live beef steer, and so forth). These prices fluctuate daily. As an exercise, encourage students to research current prices at various points along the supply chain and think about reasons why prices may have risen or fallen relative to those presented here.
Red text indicates numbers that are changeable based on student inputs.
Agent Description Text for Pop-Up
Farmer The farmer (or rancher) breeds and raises cattle until they are about a year old.
Farmer’s Price Breakdown: 1. Input cost for 1 lb. of ground beef =
$1.452. Markup = 10%3. Output price = $1.60 (1.41 x 1.10 =
$1.60)
Feedlot A feedlot continues to feed and raise the cattle for 4–6 months before sending them to a processing facility.
Feedlot’s Price Breakdown:
1. Input cost = $1.602. Markup = 30%3. Output price = $2.07 ($1.60 x 1.30 =
2.07)
Processor The processor harvests the cattle, and then it produces and packages ground beef and other products.
Processor’s Price Breakdown 1. Input cost = $2.072. Markup = 11%3. Output price = $2.30 ($2.07 x 1.11 =
$2.30)
Wholesaler The wholesaler is a distributor who sells and ships packaged ground beef to retailers (like grocery stores).
Wholesaler's Price Breakdown 1. Input cost = $2.302. Markup = 35%3. Output price = $3.11 ($2.30 x 1.35 =
$3.11)
Retailer The retailer sells the finished ground beef to consumers at local grocery stores.
Retailer’s Price Breakdown 1. Input cost = $3.112. Markup = 35%3. Output price = $4.19 ($3.11 x 1.35 =
$4.19)
27
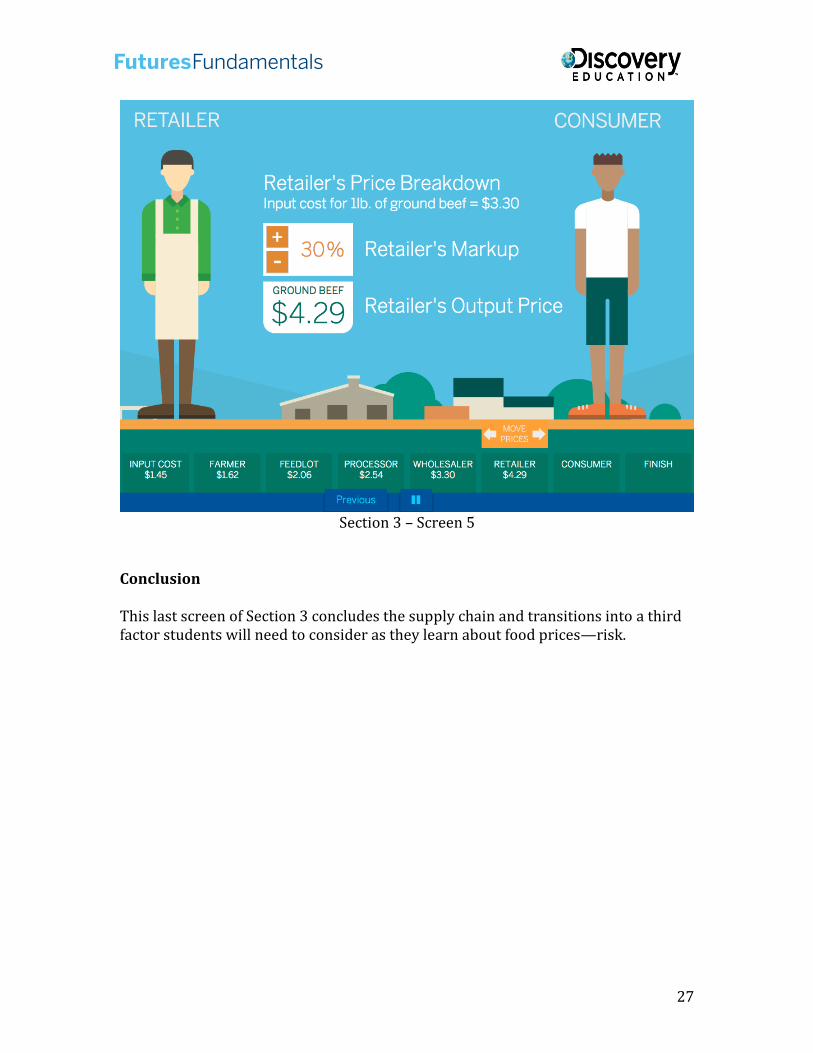
Section 3 – Screen 5
Conclusion
This last screen of Section 3 concludes the supply chain and transitions into a third factor students will need to consider as they learn about food prices—risk.
28
Section 4: Risks on the Ranch Estimated time to complete: 4–6 minutes
In this first screen of Section 4, students read a scenario about potential risks involved in operating a farm. In the scenario, a new state law has introduced stricter physical requirements for farm buildings used to house cattle. This means that the owner of the farm the student has worked for in the past must make expensive upgrades to comply with the law.
Upgrading is good in the long run, but this unexpected event will increase the owner’s production costs for this year. As a result, he must choose between raising his prices and reducing his profit margins.
This is an opportunity to ask students some questions about the economics of food prices:
What are some potential effects of increasing cattle prices?o Beef prices might increase in the marketplace.o The farmer's customers may go elsewhere to seek cheaper cattle.o The farmer might decide it is not worthwhile to produce cattle and
may cut production. What are some potential effects of reducing profit margins on cattle?
29
o The farmer may not be able to keep the business running if profitsdecline too much.
o The farmer may have to delay further investment in or expansion ofhis business.
30
Section 4 – Screens 2 and 3
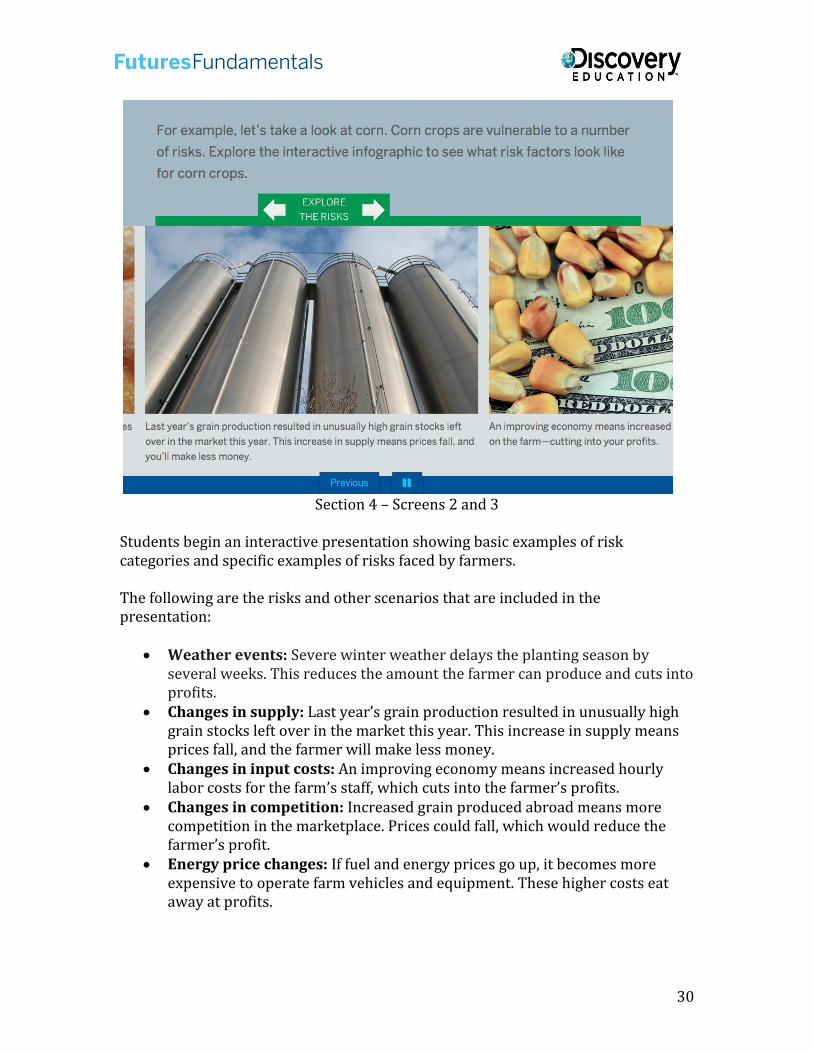
Students begin an interactive presentation showing basic examples of risk categories and specific examples of risks faced by farmers.
The following are the risks and other scenarios that are included in the presentation:
Weather events: Severe winter weather delays the planting season byseveral weeks. This reduces the amount the farmer can produce and cuts intoprofits.
Changes in supply: Last year’s grain production resulted in unusually highgrain stocks left over in the market this year. This increase in supply meansprices fall, and the farmer will make less money.
Changes in input costs: An improving economy means increased hourlylabor costs for the farm’s staff, which cuts into the farmer’s profits.
Changes in competition: Increased grain produced abroad means morecompetition in the marketplace. Prices could fall, which would reduce thefarmer’s profit.
Energy price changes: If fuel and energy prices go up, it becomes moreexpensive to operate farm vehicles and equipment. These higher costs eataway at profits.
31
Section 4 – Screen 3
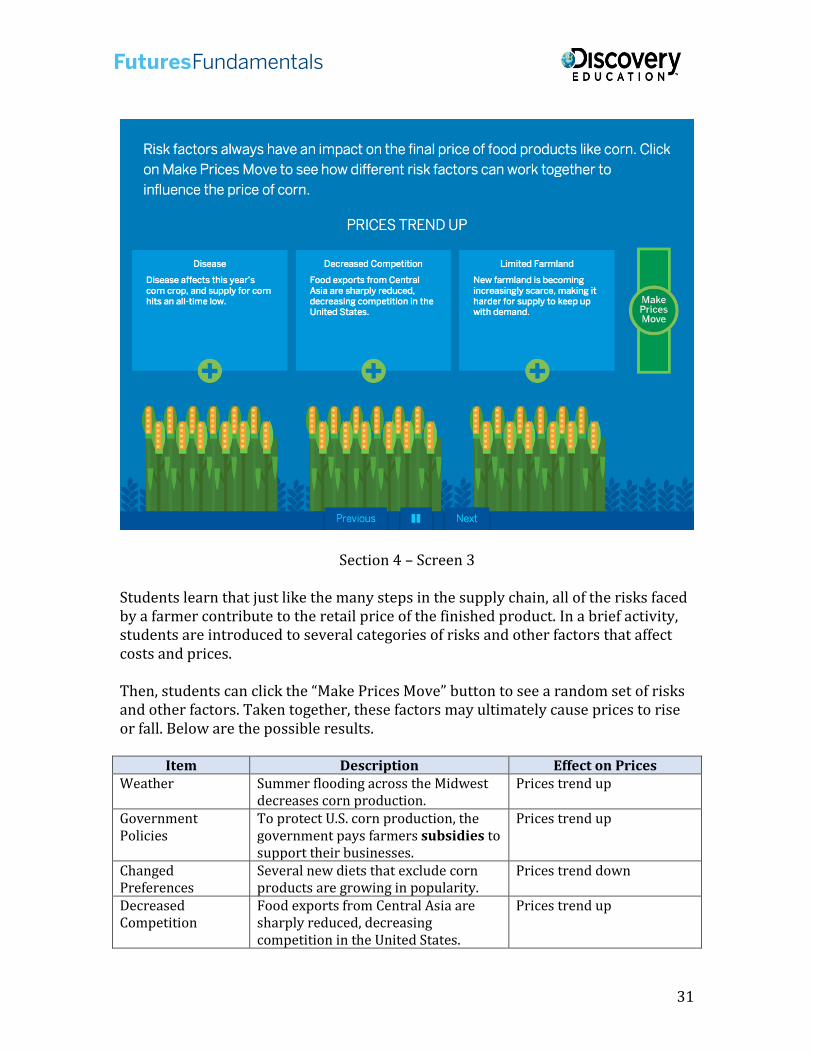
Students learn that just like the many steps in the supply chain, all of the risks faced by a farmer contribute to the retail price of the finished product. In a brief activity, students are introduced to several categories of risks and other factors that affect costs and prices.
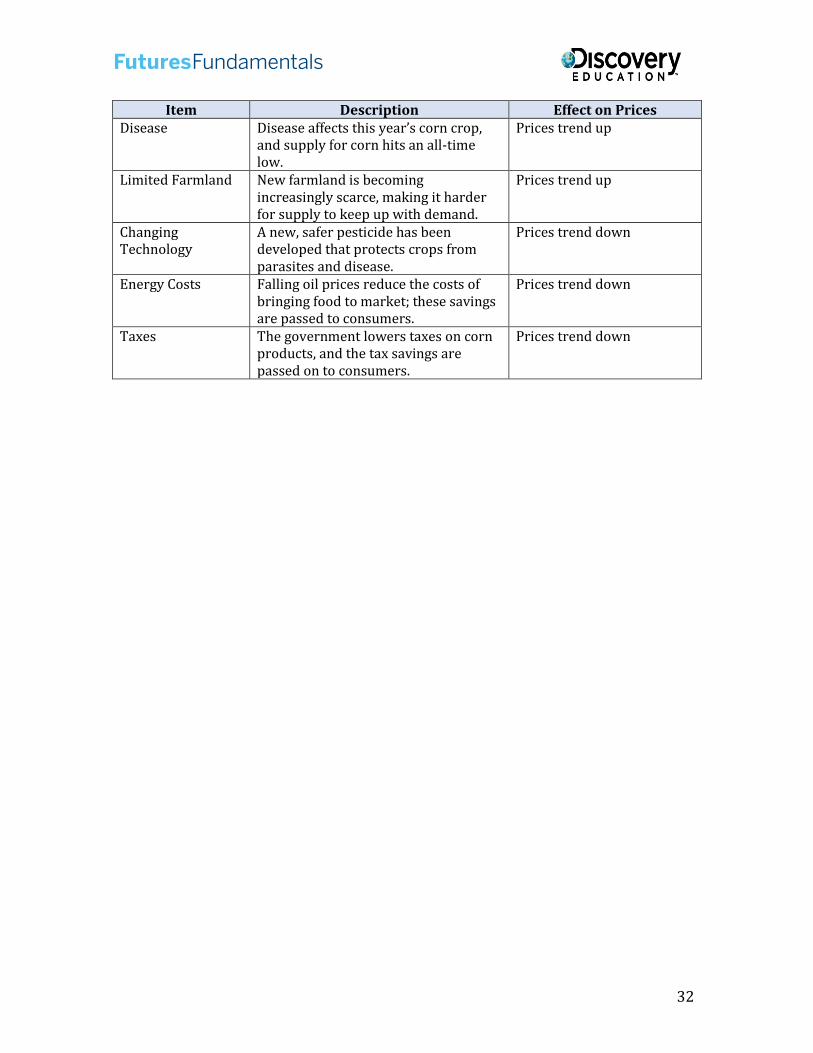
Then, students can click the “Make Prices Move” button to see a random set of risks and other factors. Taken together, these factors may ultimately cause prices to rise or fall. Below are the possible results.
Item Description Effect on Prices Weather Summer flooding across the Midwest
decreases corn production. Prices trend up
Government Policies
To protect U.S. corn production, the government pays farmers subsidies to support their businesses.
Prices trend up
Changed Preferences
Several new diets that exclude corn products are growing in popularity.
Prices trend down
Decreased Competition
Food exports from Central Asia are sharply reduced, decreasing competition in the United States.
Prices trend up
32
Item Description Effect on Prices Disease Disease affects this year’s corn crop,
and supply for corn hits an all-time low.
Prices trend up
Limited Farmland New farmland is becoming increasingly scarce, making it harder for supply to keep up with demand.
Prices trend up
Changing Technology
A new, safer pesticide has been developed that protects crops from parasites and disease.
Prices trend down
Energy Costs Falling oil prices reduce the costs of bringing food to market; these savings are passed to consumers.
Prices trend down
Taxes The government lowers taxes on corn products, and the tax savings are passed on to consumers.
Prices trend down
33
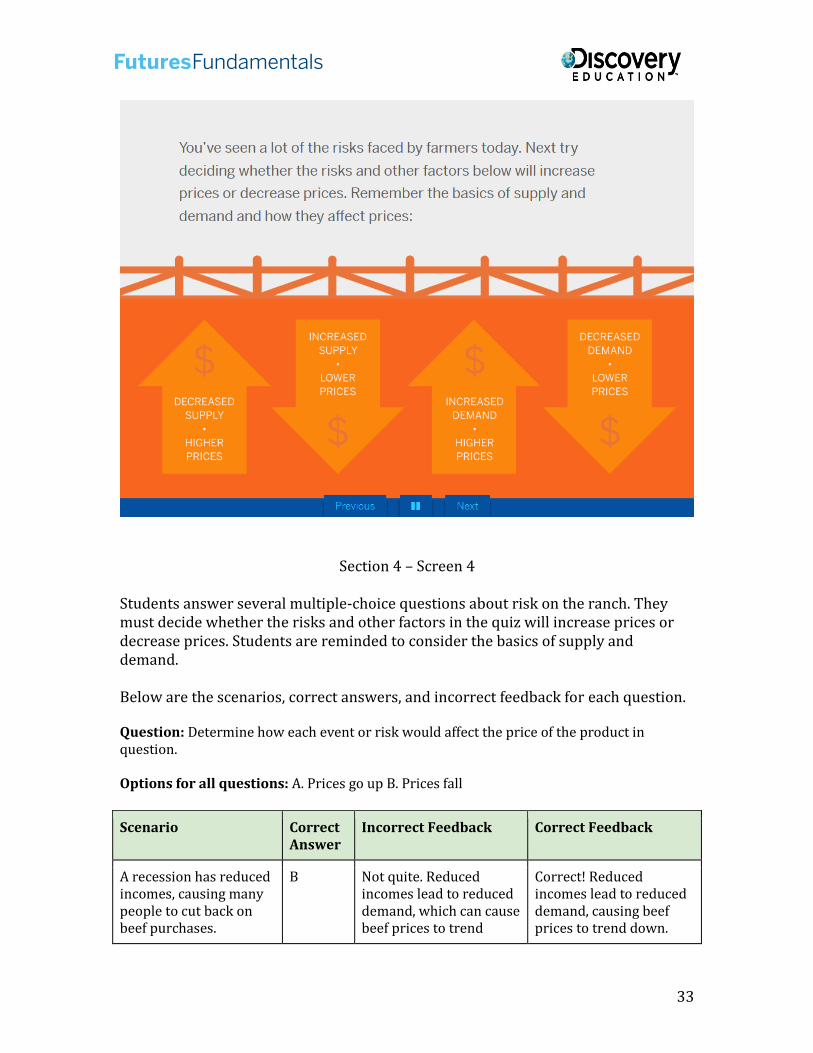
Section 4 – Screen 4
Students answer several multiple-choice questions about risk on the ranch. They must decide whether the risks and other factors in the quiz will increase prices or decrease prices. Students are reminded to consider the basics of supply and demand.
Below are the scenarios, correct answers, and incorrect feedback for each question.
Question: Determine how each event or risk would affect the price of the product in question.
Options for all questions: A. Prices go up B. Prices fall
Scenario Correct Answer
Incorrect Feedback Correct Feedback
A recession has reduced incomes, causing many people to cut back on beef purchases.
B Not quite. Reduced incomes lead to reduced demand, which can cause beef prices to trend
Correct! Reduced incomes lead to reduced demand, causing beef prices to trend down.
34
Scenario Correct Answer
Incorrect Feedback Correct Feedback
down.
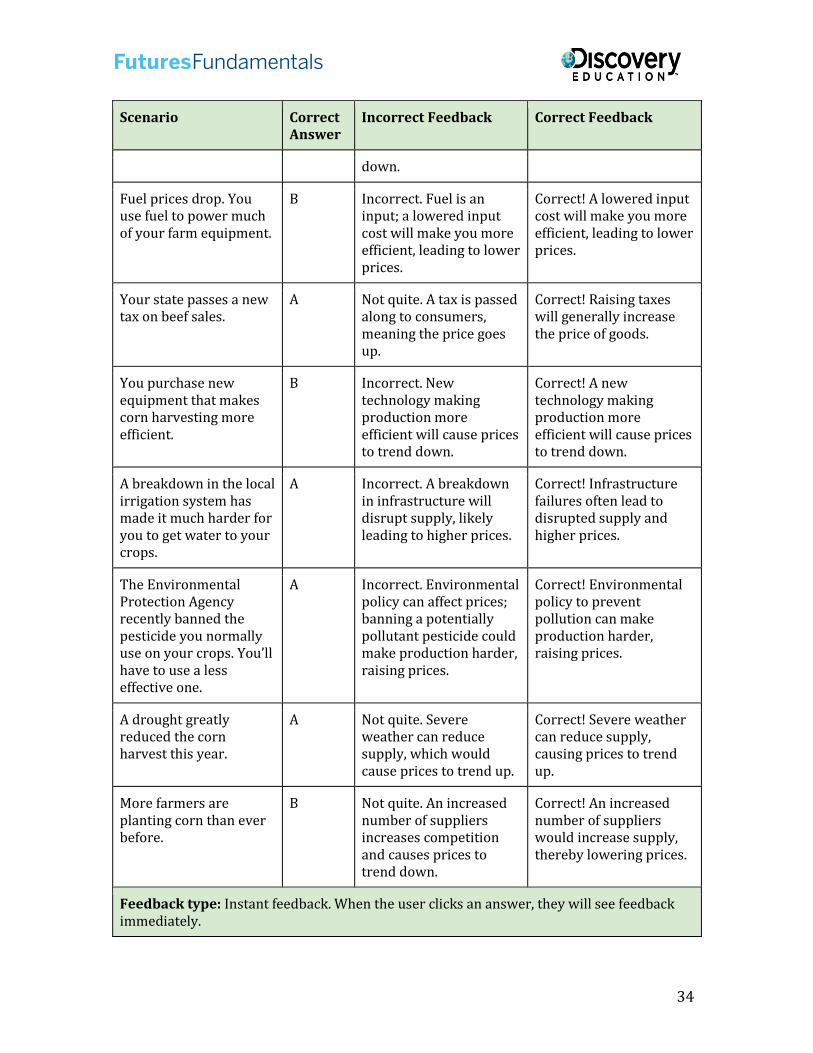
Fuel prices drop. You use fuel to power much of your farm equipment.
B Incorrect. Fuel is an input; a lowered input cost will make you more efficient, leading to lower prices.
Correct! A lowered input cost will make you more efficient, leading to lower prices.
Your state passes a new tax on beef sales.
A Not quite. A tax is passed along to consumers, meaning the price goes up.
Correct! Raising taxes will generally increase the price of goods.
You purchase new equipment that makes corn harvesting more efficient.
B Incorrect. New technology making production more efficient will cause prices to trend down.
Correct! A new technology making production more efficient will cause prices to trend down.
A breakdown in the local irrigation system has made it much harder for you to get water to your crops.
A Incorrect. A breakdown in infrastructure will disrupt supply, likely leading to higher prices.
Correct! Infrastructure failures often lead to disrupted supply and higher prices.
The Environmental Protection Agency recently banned the pesticide you normally use on your crops. You’ll have to use a less effective one.
A Incorrect. Environmental policy can affect prices; banning a potentially pollutant pesticide could make production harder, raising prices.
Correct! Environmental policy to prevent pollution can make production harder, raising prices.
A drought greatly reduced the corn harvest this year.
A Not quite. Severe weather can reduce supply, which would cause prices to trend up.
Correct! Severe weather can reduce supply, causing prices to trend up.
More farmers are planting corn than ever before.
B Not quite. An increased number of suppliers increases competition and causes prices to trend down.
Correct! An increased number of suppliers would increase supply, thereby lowering prices.
Feedback type: Instant feedback. When the user clicks an answer, they will see feedback immediately.
35
Scenario Correct Answer
Incorrect Feedback Correct Feedback
Results screen: You got X correct out of Y. Would you like to try again or continue?
36
Section 4 – Screen 5
Conclusion
Students are told that the farmer they used to work for has asked them to come back and use their new knowledge of several concepts to help him make plans for the future of the farm in the following areas:
Food prices Supply and demand Supply chain Risk
37
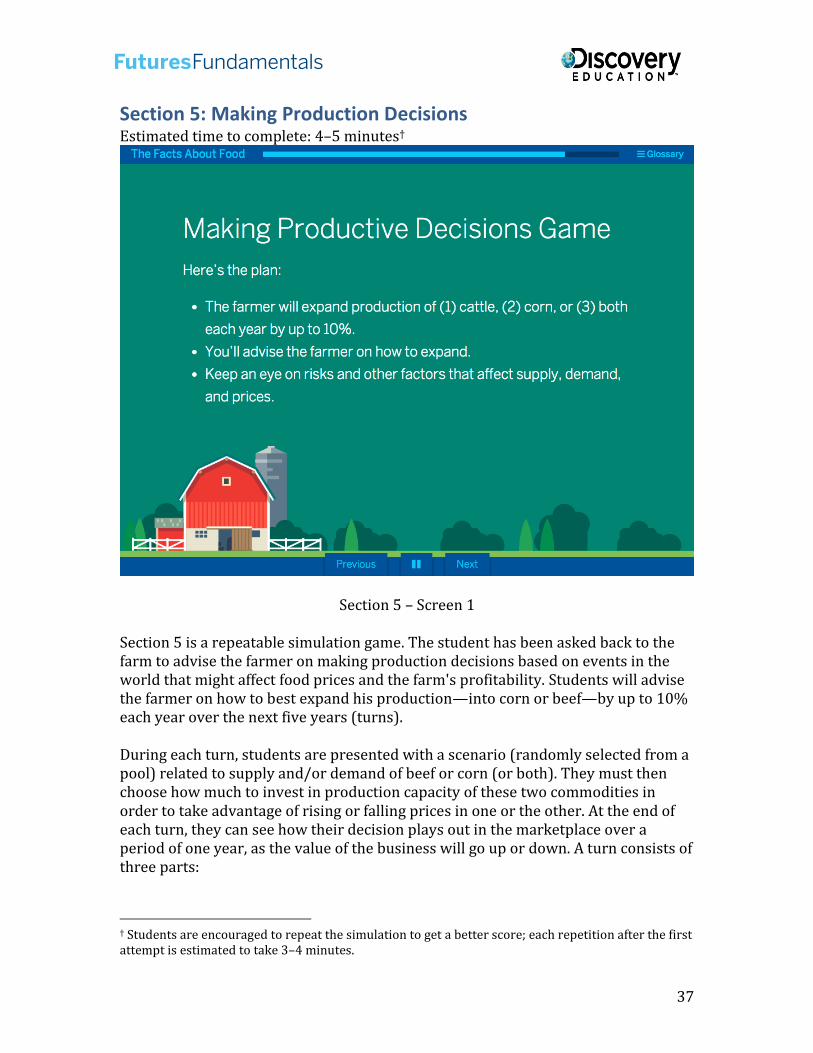
Section 5: Making Production Decisions Estimated time to complete: 4–5 minutes†
Section 5 – Screen 1
Section 5 is a repeatable simulation game. The student has been asked back to the farm to advise the farmer on making production decisions based on events in the world that might affect food prices and the farm's profitability. Students will advise the farmer on how to best expand his production—into corn or beef—by up to 10% each year over the next five years (turns).
During each turn, students are presented with a scenario (randomly selected from a pool) related to supply and/or demand of beef or corn (or both). They must then choose how much to invest in production capacity of these two commodities in order to take advantage of rising or falling prices in one or the other. At the end of each turn, they can see how their decision plays out in the marketplace over a period of one year, as the value of the business will go up or down. A turn consists of three parts:
† Students are encouraged to repeat the simulation to get a better score; each repetition after the first attempt is estimated to take 3–4 minutes.
38
Part 1: Scenario screen: Students read a scenario and consider how the scenario affects the supply, demand, and price of corn and/or beef.
Part 2: Decision screen: The students choose how much to invest in production of each commodity, up to a total of 10% across both products. Investing in a commodity with rising prices will generally yield the most profit to their business; investing in a commodity with a falling price will yield less profit.
Part 3: Results screen: The students see their profits after that year, with a new total dollar value for their corn and beef that changed based on (a) changing prices and (b) the production decisions they made in Part 2.
Students repeat these steps a total of five times (five turns). Because the scenarios are randomly selected from a larger pool, every repeat of the simulation will present different scenarios, and students can get very different scores each time.
39
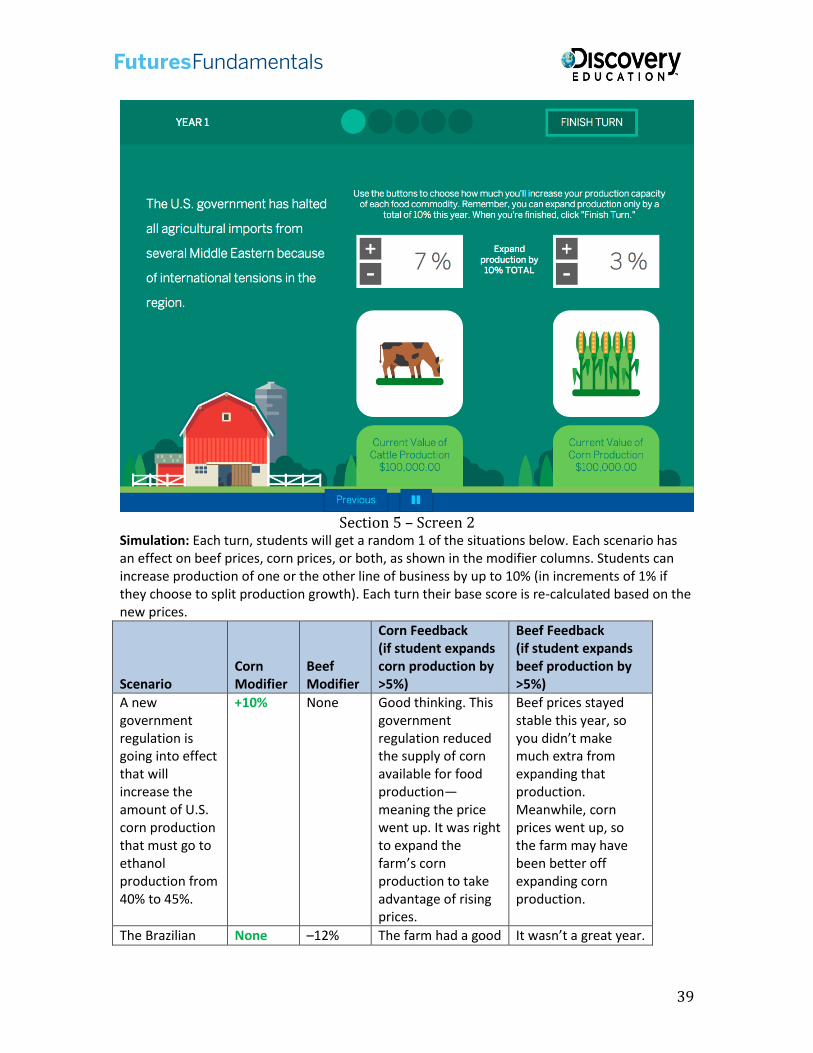
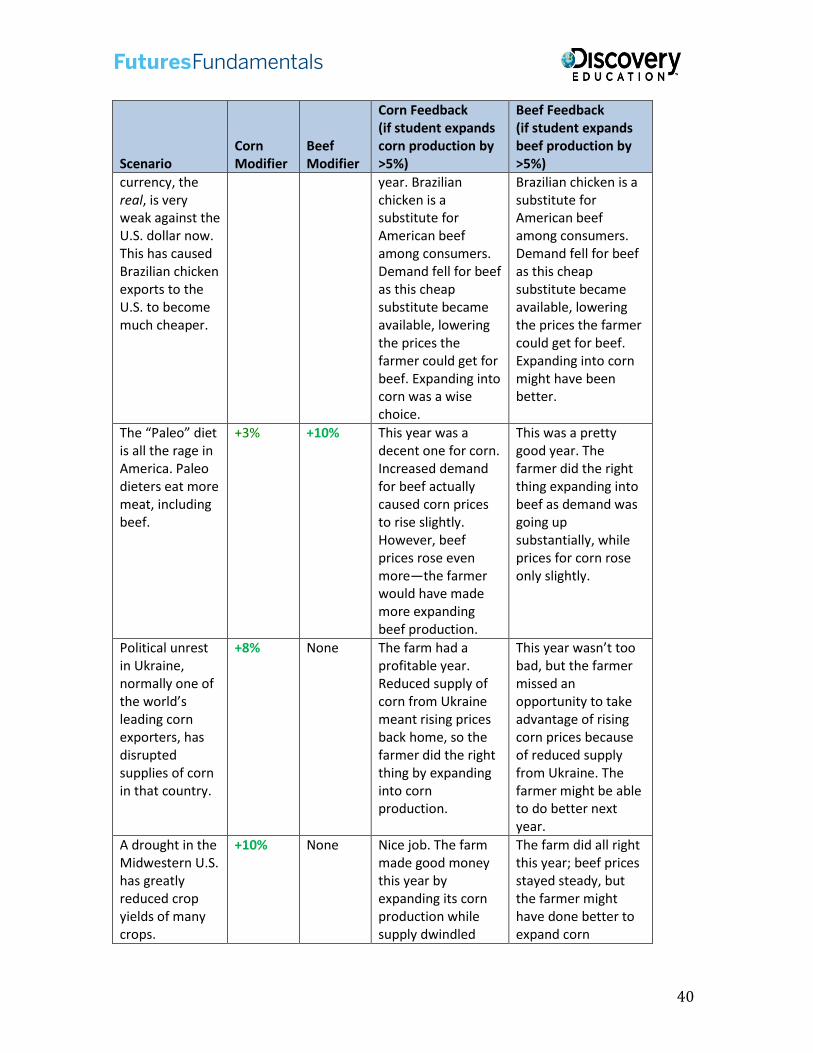
Section 5 – Screen 2 Simulation: Each turn, students will get a random 1 of the situations below. Each scenario has an effect on beef prices, corn prices, or both, as shown in the modifier columns. Students can increase production of one or the other line of business by up to 10% (in increments of 1% if they choose to split production growth). Each turn their base score is re-calculated based on the new prices.
Scenario Corn Modifier
Beef Modifier
Corn Feedback (if student expands corn production by >5%)
Beef Feedback (if student expands beef production by >5%)
A new government regulation is going into effect that will increase the amount of U.S. corn production that must go to ethanol production from 40% to 45%.
+10% None Good thinking. This government regulation reduced the supply of corn available for food production—meaning the price went up. It was right to expand the farm’s corn production to take advantage of rising prices.
Beef prices stayed stable this year, so you didn’t make much extra from expanding that production. Meanwhile, corn prices went up, so the farm may have been better off expanding corn production.
The Brazilian None –12% The farm had a good It wasn’t a great year.
40
Scenario Corn Modifier
Beef Modifier
Corn Feedback (if student expands corn production by >5%)
Beef Feedback (if student expands beef production by >5%)
currency, the real, is very weak against the U.S. dollar now. This has caused Brazilian chicken exports to the U.S. to become much cheaper.
year. Brazilian chicken is a substitute for American beef among consumers. Demand fell for beef as this cheap substitute became available, lowering the prices the farmer could get for beef. Expanding into corn was a wise choice.
Brazilian chicken is a substitute for American beef among consumers. Demand fell for beef as this cheap substitute became available, lowering the prices the farmer could get for beef. Expanding into corn might have been better.
The “Paleo” diet is all the rage in America. Paleo dieters eat more meat, including beef.
+3% +10% This year was a decent one for corn. Increased demand for beef actually caused corn prices to rise slightly. However, beef prices rose even more—the farmer would have made more expanding beef production.
This was a pretty good year. The farmer did the right thing expanding into beef as demand was going up substantially, while prices for corn rose only slightly.
Political unrest in Ukraine, normally one of the world’s leading corn exporters, has disrupted supplies of corn in that country.
+8% None The farm had a profitable year. Reduced supply of corn from Ukraine meant rising prices back home, so the farmer did the right thing by expanding into corn production.
This year wasn’t too bad, but the farmer missed an opportunity to take advantage of rising corn prices because of reduced supply from Ukraine. The farmer might be able to do better next year.
A drought in the Midwestern U.S. has greatly reduced crop yields of many crops.
+10% None Nice job. The farm made good money this year by expanding its corn production while supply dwindled
The farm did all right this year; beef prices stayed steady, but the farmer might have done better to expand corn
41
Scenario Corn Modifier
Beef Modifier
Corn Feedback (if student expands corn production by >5%)
Beef Feedback (if student expands beef production by >5%)
elsewhere. production and take advantage of rising corn prices.
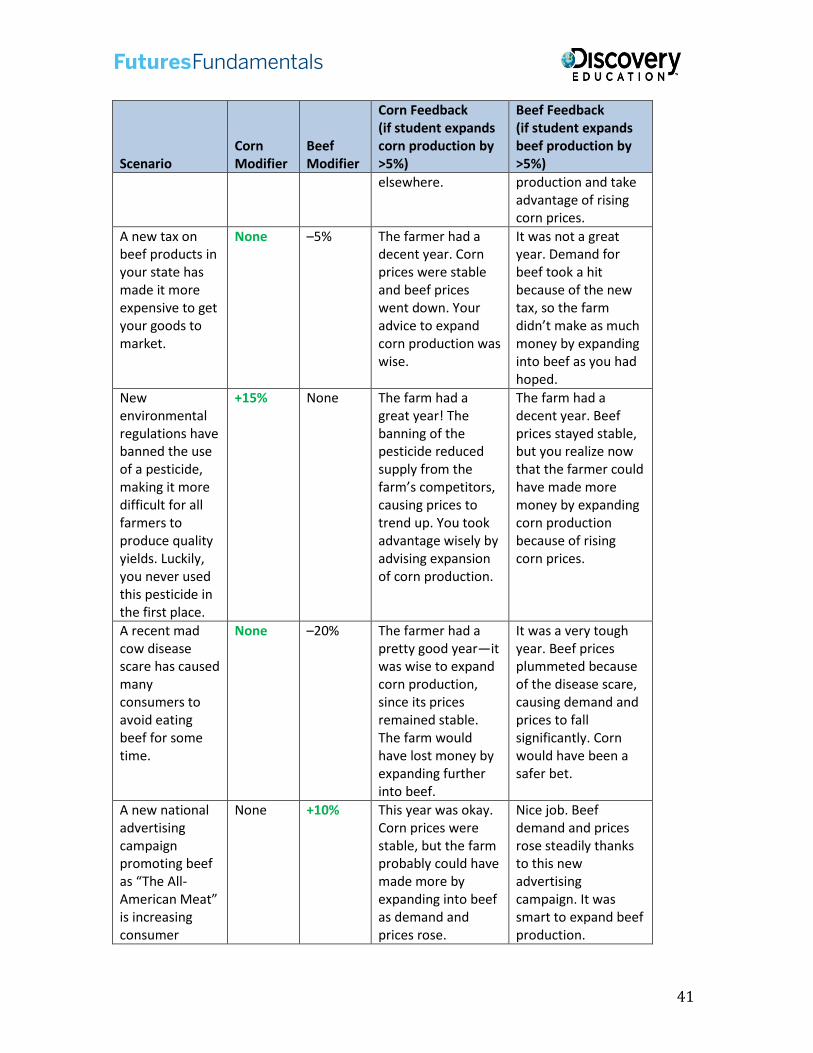
A new tax on beef products in your state has made it more expensive to get your goods to market.
None –5% The farmer had a decent year. Corn prices were stable and beef prices went down. Your advice to expand corn production was wise.
It was not a great year. Demand for beef took a hit because of the new tax, so the farm didn’t make as much money by expanding into beef as you had hoped.
New environmental regulations have banned the use of a pesticide, making it more difficult for all farmers to produce quality yields. Luckily, you never used this pesticide in the first place.
+15% None The farm had a great year! The banning of the pesticide reduced supply from the farm’s competitors, causing prices to trend up. You took advantage wisely by advising expansion of corn production.
The farm had a decent year. Beef prices stayed stable, but you realize now that the farmer could have made more money by expanding corn production because of rising corn prices.
A recent mad cow disease scare has caused many consumers to avoid eating beef for some time.
None –20% The farmer had a pretty good year—it was wise to expand corn production, since its prices remained stable. The farm would have lost money by expanding further into beef.
It was a very tough year. Beef prices plummeted because of the disease scare, causing demand and prices to fall significantly. Corn would have been a safer bet.
A new national advertising campaign promoting beef as “The All-American Meat” is increasing consumer
None +10% This year was okay. Corn prices were stable, but the farm probably could have made more by expanding into beef as demand and prices rose.
Nice job. Beef demand and prices rose steadily thanks to this new advertising campaign. It was smart to expand beef production.
42
Scenario Corn Modifier
Beef Modifier
Corn Feedback (if student expands corn production by >5%)
Beef Feedback (if student expands beef production by >5%)
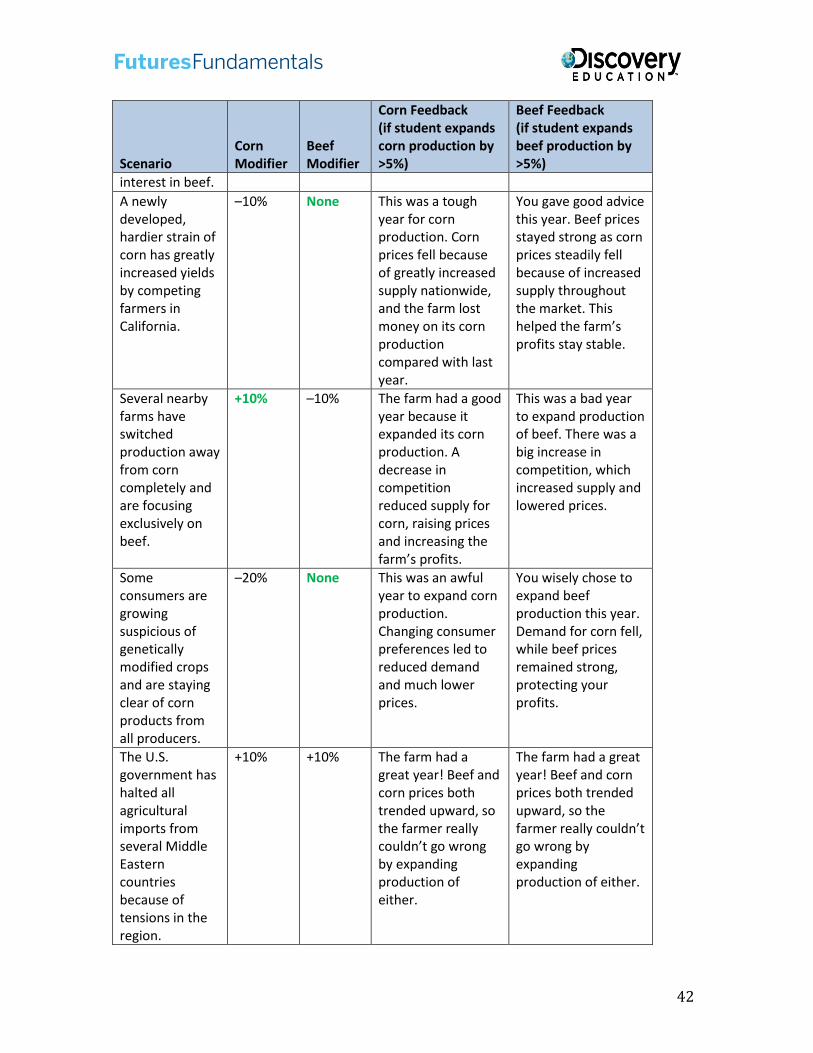
interest in beef.
A newly developed, hardier strain of corn has greatly increased yields by competing farmers in California.
–10% None This was a tough year for corn production. Corn prices fell because of greatly increased supply nationwide, and the farm lost money on its corn production compared with last year.
You gave good advice this year. Beef prices stayed strong as corn prices steadily fell because of increased supply throughout the market. This helped the farm’s profits stay stable.
Several nearby farms have switched production away from corn completely and are focusing exclusively on beef.
+10% –10% The farm had a good year because it expanded its corn production. A decrease in competition reduced supply for corn, raising prices and increasing the farm’s profits.
This was a bad year to expand production of beef. There was a big increase in competition, which increased supply and lowered prices.
Some consumers are growing suspicious of genetically modified crops and are staying clear of corn products from all producers.
–20% None This was an awful year to expand corn production. Changing consumer preferences led to reduced demand and much lower prices.
You wisely chose to expand beef production this year. Demand for corn fell, while beef prices remained strong, protecting your profits.
The U.S. government has halted all agricultural imports from several Middle Eastern countries because of tensions in the region.
+10% +10% The farm had a great year! Beef and corn prices both trended upward, so the farmer really couldn’t go wrong by expanding production of either.
The farm had a great year! Beef and corn prices both trended upward, so the farmer really couldn’t go wrong by expanding production of either.
43
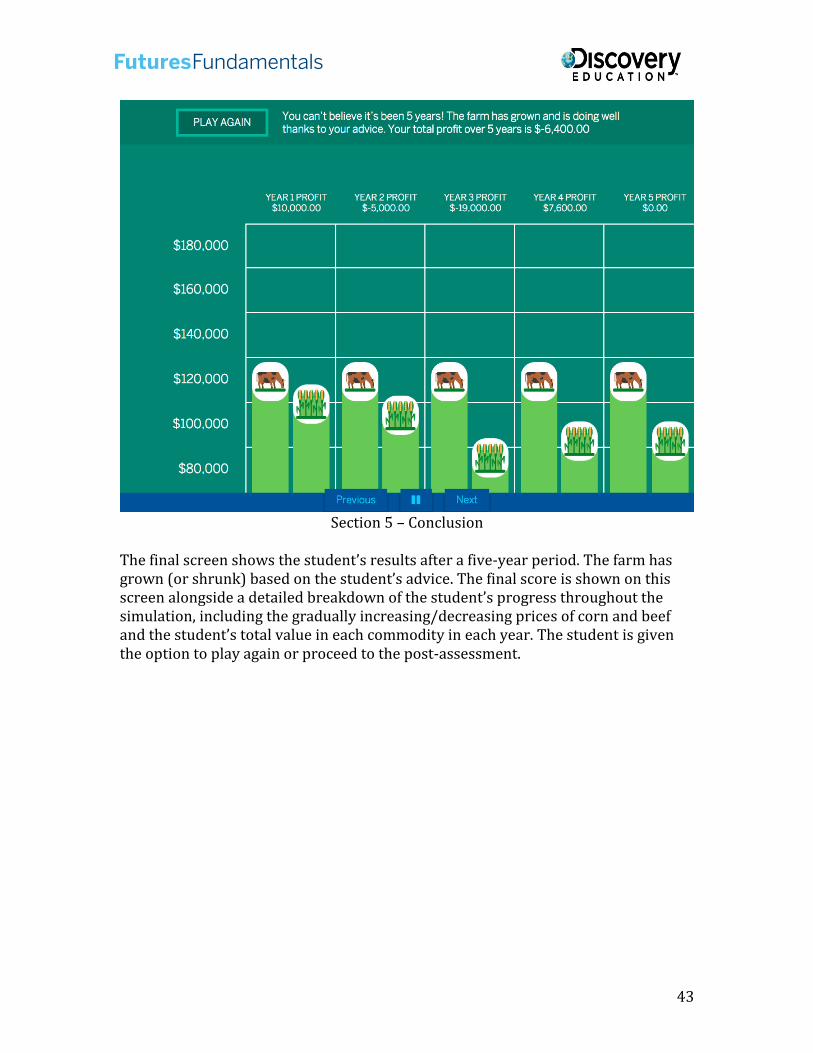
Section 5 – Conclusion
The final screen shows the student’s results after a five-year period. The farm has grown (or shrunk) based on the student’s advice. The final score is shown on this screen alongside a detailed breakdown of the student’s progress throughout the simulation, including the gradually increasing/decreasing prices of corn and beef and the student’s total value in each commodity in each year. The student is given the option to play again or proceed to the post-assessment.
44
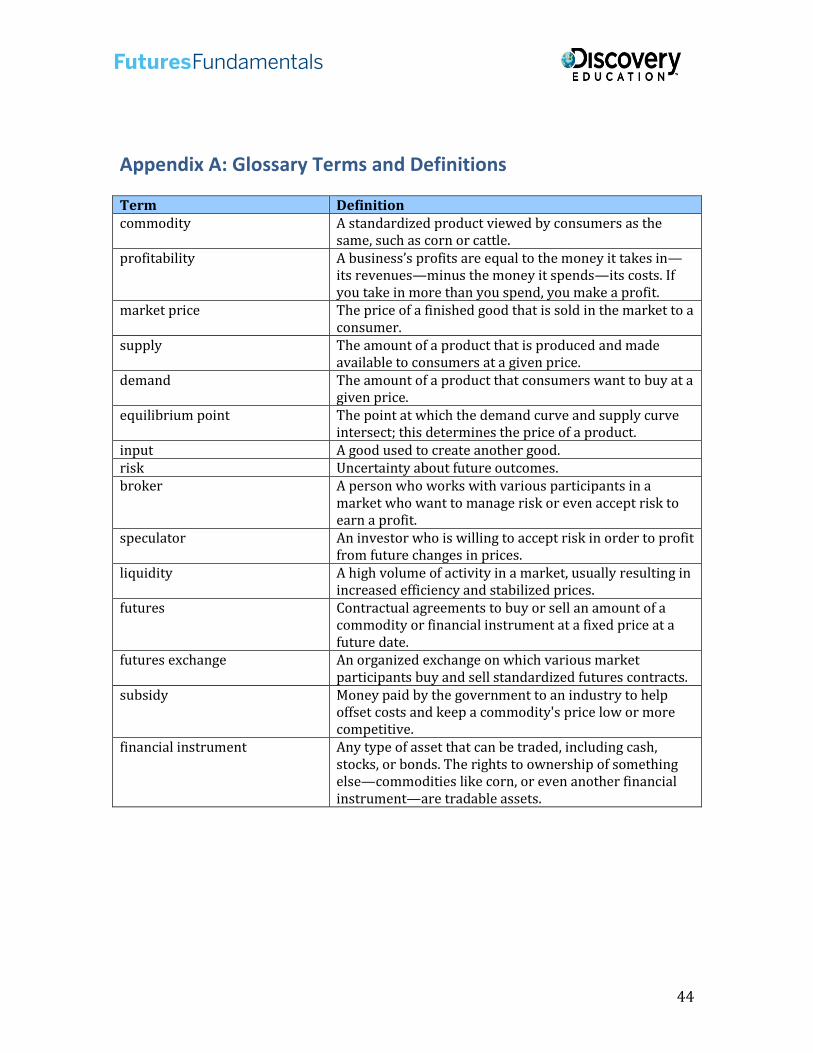
Appendix A: Glossary Terms and Definitions
Term Definition commodity A standardized product viewed by consumers as the
same, such as corn or cattle. profitability A business’s profits are equal to the money it takes in—
its revenues—minus the money it spends—its costs. If you take in more than you spend, you make a profit.
market price The price of a finished good that is sold in the market to a consumer.
supply The amount of a product that is produced and made available to consumers at a given price.
demand The amount of a product that consumers want to buy at a given price.
equilibrium point The point at which the demand curve and supply curve intersect; this determines the price of a product.
input A good used to create another good. risk Uncertainty about future outcomes. broker A person who works with various participants in a
market who want to manage risk or even accept risk to earn a profit.
speculator An investor who is willing to accept risk in order to profit from future changes in prices.
liquidity A high volume of activity in a market, usually resulting in increased efficiency and stabilized prices.
futures Contractual agreements to buy or sell an amount of a commodity or financial instrument at a fixed price at a future date.
futures exchange An organized exchange on which various market participants buy and sell standardized futures contracts.
subsidy Money paid by the government to an industry to help offset costs and keep a commodity's price low or more competitive.
financial instrument Any type of asset that can be traded, including cash, stocks, or bonds. The rights to ownership of something else—commodities like corn, or even another financial instrument—are tradable assets.
45
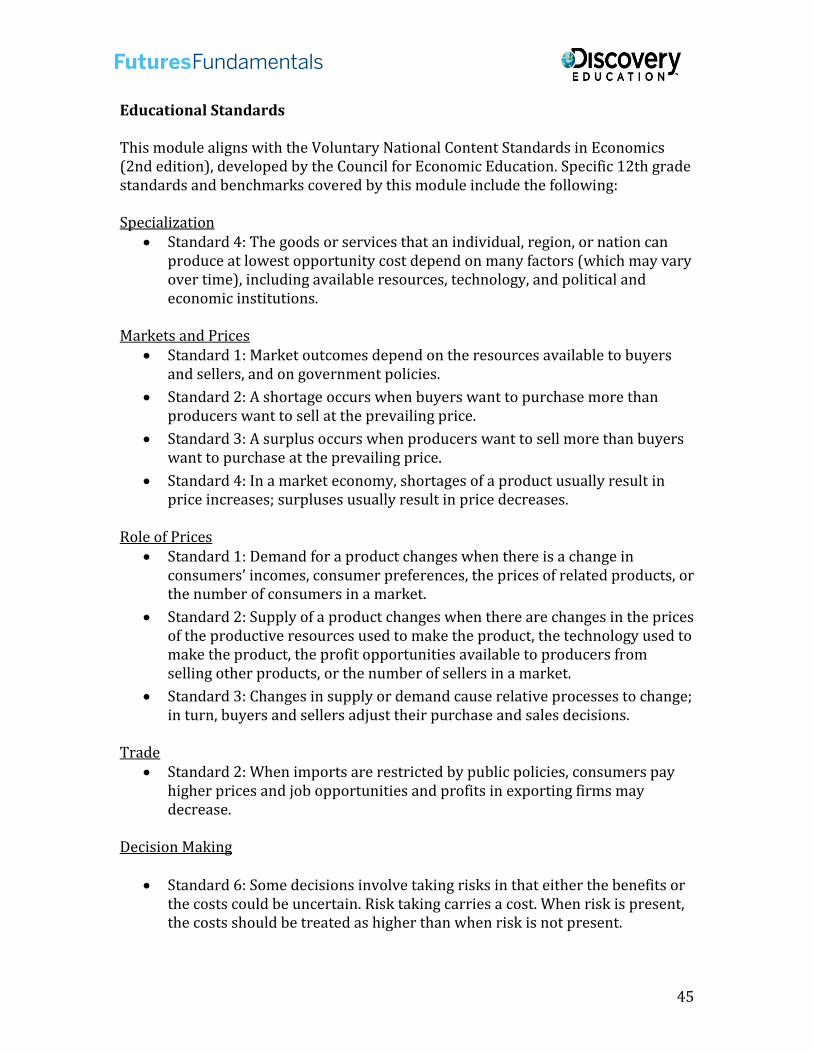
Educational Standards
This module aligns with the Voluntary National Content Standards in Economics (2nd edition), developed by the Council for Economic Education. Specific 12th grade standards and benchmarks covered by this module include the following:
Specialization Standard 4: The goods or services that an individual, region, or nation can
produce at lowest opportunity cost depend on many factors (which may varyover time), including available resources, technology, and political andeconomic institutions.
Markets and Prices Standard 1: Market outcomes depend on the resources available to buyers
and sellers, and on government policies.
Standard 2: A shortage occurs when buyers want to purchase more thanproducers want to sell at the prevailing price.
Standard 3: A surplus occurs when producers want to sell more than buyerswant to purchase at the prevailing price.
Standard 4: In a market economy, shortages of a product usually result inprice increases; surpluses usually result in price decreases.
Role of Prices Standard 1: Demand for a product changes when there is a change in
consumers’ incomes, consumer preferences, the prices of related products, orthe number of consumers in a market.
Standard 2: Supply of a product changes when there are changes in the pricesof the productive resources used to make the product, the technology used tomake the product, the profit opportunities available to producers fromselling other products, or the number of sellers in a market.
Standard 3: Changes in supply or demand cause relative processes to change;in turn, buyers and sellers adjust their purchase and sales decisions.
Trade Standard 2: When imports are restricted by public policies, consumers pay
higher prices and job opportunities and profits in exporting firms maydecrease.
Decision Making
Standard 6: Some decisions involve taking risks in that either the benefits orthe costs could be uncertain. Risk taking carries a cost. When risk is present,the costs should be treated as higher than when risk is not present.
46
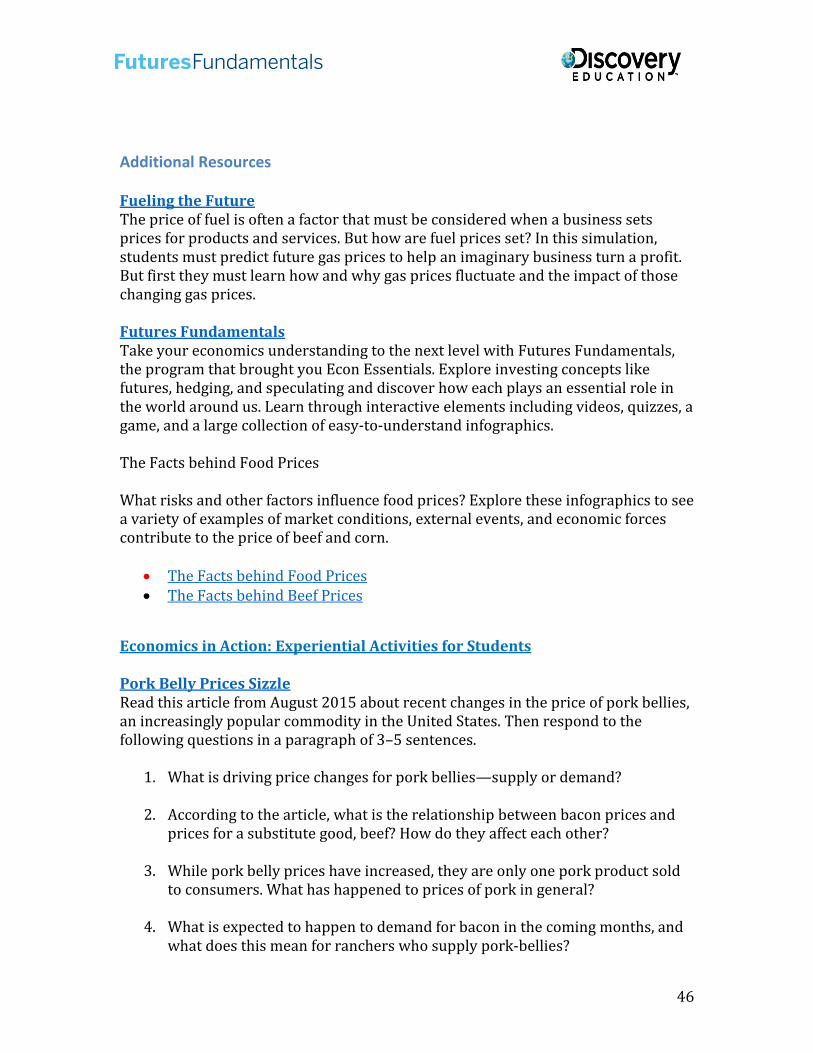
Additional Resources
Fueling the Future The price of fuel is often a factor that must be considered when a business sets prices for products and services. But how are fuel prices set? In this simulation, students must predict future gas prices to help an imaginary business turn a profit. But first they must learn how and why gas prices fluctuate and the impact of those changing gas prices.
Futures Fundamentals Take your economics understanding to the next level with Futures Fundamentals, the program that brought you Econ Essentials. Explore investing concepts like futures, hedging, and speculating and discover how each plays an essential role in the world around us. Learn through interactive elements including videos, quizzes, a game, and a large collection of easy-to-understand infographics.
The Facts behind Food Prices
What risks and other factors influence food prices? Explore these infographics to see a variety of examples of market conditions, external events, and economic forces contribute to the price of beef and corn.
The Facts behind Food Prices The Facts behind Beef Prices
Economics in Action: Experiential Activities for Students
Pork Belly Prices Sizzle Read this article from August 2015 about recent changes in the price of pork bellies, an increasingly popular commodity in the United States. Then respond to the following questions in a paragraph of 3–5 sentences.
1. What is driving price changes for pork bellies—supply or demand?
2. According to the article, what is the relationship between bacon prices andprices for a substitute good, beef? How do they affect each other?
3. While pork belly prices have increased, they are only one pork product soldto consumers. What has happened to prices of pork in general?
4. What is expected to happen to demand for bacon in the coming months, andwhat does this mean for ranchers who supply pork-bellies?
47
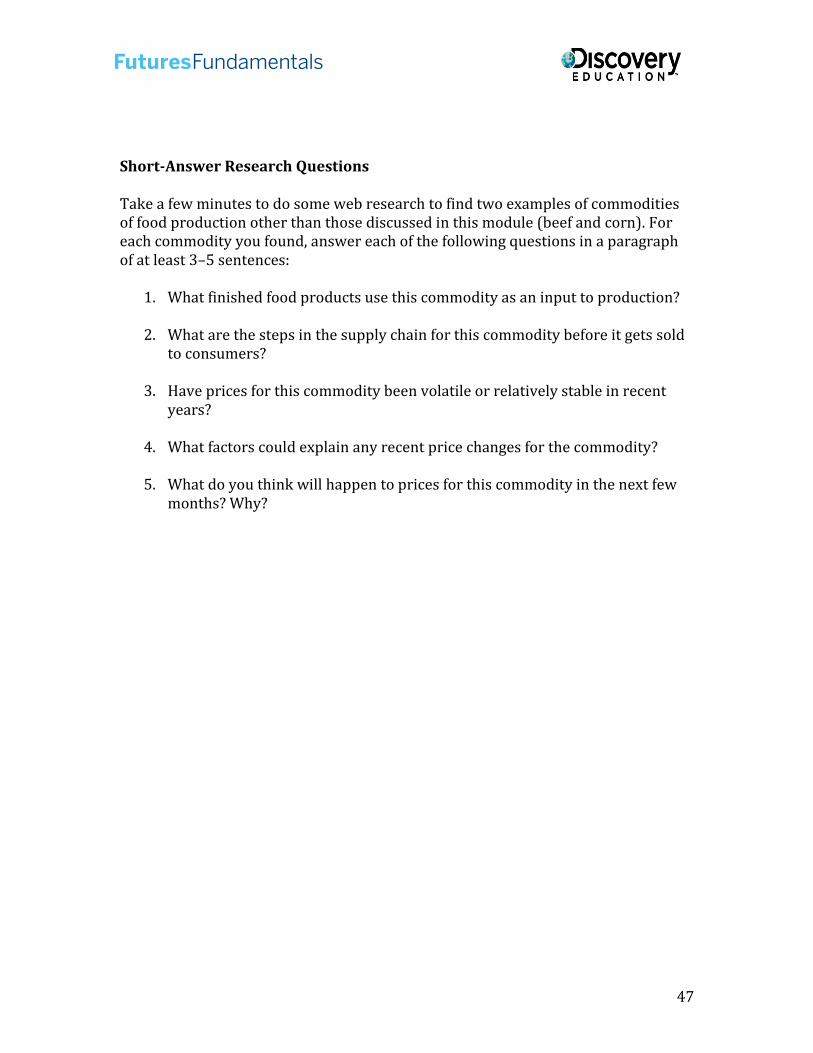
Short-Answer Research Questions
Take a few minutes to do some web research to find two examples of commodities of food production other than those discussed in this module (beef and corn). For each commodity you found, answer each of the following questions in a paragraph of at least 3–5 sentences:
1. What finished food products use this commodity as an input to production?
2. What are the steps in the supply chain for this commodity before it gets soldto consumers?
3. Have prices for this commodity been volatile or relatively stable in recentyears?
4. What factors could explain any recent price changes for the commodity?
5. What do you think will happen to prices for this commodity in the next fewmonths? Why?
Related Documents