The copyright © of this thesis belongs to its rightful author and/or other copyright owner. Copies can be accessed and downloaded for non-commercial or learning purposes without any charge and permission. The thesis cannot be reproduced or quoted as a whole without the permission from its rightful owner. No alteration or changes in format is allowed without permission from its rightful owner.

Welcome message from author
This document is posted to help you gain knowledge. Please leave a comment to let me know what you think about it! Share it to your friends and learn new things together.
Transcript

The copyright © of this thesis belongs to its rightful author and/or other copyright
owner. Copies can be accessed and downloaded for non-commercial or learning
purposes without any charge and permission. The thesis cannot be reproduced or
quoted as a whole without the permission from its rightful owner. No alteration or
changes in format is allowed without permission from its rightful owner.

THE IMPACT OF MARKETING MIX ELEMENTS ON CONSUMER
PREFERENCE TOWARDS SUPPLEMENT PRODUCT AMONG UUM
STUDENTS
By
MAISARAH BINTI MASRI
Thesis Submitted to
School of Business Management
Universiti Utara Malaysia
In Partial Fulfillment of the Requirement for the
Degree of Master Science (Management)

ii
PERMISSION TO USE
In presenting this project paper in partial fulfilment of the requirement for a postgraduate
degree from Universiti Utara Malaysia, I agree that the University Library may make it
freely available for inspection. I further agree that permission for copying of this project
paper in any manner, in whole or in part, for scholarly purposes may be granted by my
supervisor or in their absence, by the Dean of School of Business Management. It is
understood that any copying or publication or use of this project paper or parts thereof
for financial gain not be allowed without my written permission. It is also understood
that due recognition shall be given to me and Universiti Utara Malaysia for any scholarly
use which may be made of any material from my project paper.
Request for permission to copy or make other use of material in this thesis, in whole or
in part, should be addressed to:
Dean of School of Business Management
University Utara Malaysia
06010 UUM Sintok,
Kedah Darul Aman

iii
ABSTRACT
Nowadays, we can see the entrepreneurs of supplements and cosmetics are also
expanding rapidly. Various traditional plant commercialized and adapted to market needs.
Supplement product marketing activities in Malaysia showed significant growth over the
past few decades. This strong growth has led to questions about the true potential of
marketing to further improve the reliability of the product on the consumer preferences
of supplements among university students. Therefore, this study aimed to study the
relationship between the consumer preferences with the marketing mix (product, price,
promotion and distribution) towards supplement products. Research conducted at
Universiti Utara Malaysia (UUM) and sample size in this study is 397 samples. The
study used SPSS 22.0 to analyze the data. The methodology used in this research is
method descriptive and inferential statistical analysis that involves the use of frequencies
and percentages for analyzing the demographics of respondents, independent t-test
samples, test the connection one-way ANOVA, Pearson correlation analysis and multiple
regression analysis. Overall findings based on the analysis of the Pearson correlation test
found the analysis shows the three hypotheses were supported and all independent
variables named product, promotion and place distribution, is significant, while the
hypothetical price is not significantly associated with elections with consumer to
purchase the supplement products. The next discussion is provided in this study.
Keywords: consumer preferences, marketing mix (4Ps), supplement products, student
university.

iv
ABSTRAK
Pada masa kini, kita dapat melihat usahawan makanan tambahan dan kosmetik juga
berkembang dengan cepat. Pelbagai tumbuhan tradisional dikomersialkan dan
disesuaikan dengan keperluan pasaran. Aktiviti pemasaran produk makanan tambahan di
Malaysia menunjukkan pertumbuhan ketara sejak beberapa dekad yang lalu.
Pertumbuhan yang kuat telah mencetuskan beberapa soalan mengenai potensi sebenar
pemasaran untuk terus meningkatkan kebolehpercayaan terhadap pilihan pengguna
keatas produk makanan tambahan dalam kalangan pelajar Universiti. Oleh itu, kajian ini
bertujuan untuk mengkaji hubungan di antara pilihan pengguna dengan campuran
pemasaran (produk, harga, promosi dan pengedaran) terhadap produk makanan
tambahan. Penyelidikan yang dijalankan di Universiti Utara Malaysia (UUM) dan saiz
sampel dalam kajian ini adalah 397 sampel. Kajian ini menggunakan SPSS 22.0 untuk
menganalisis data. Kaedah yang digunakan dalam kajian ini adalah kaedah deskriptif
dan analisis statistik inferensi yang melibatkan penggunaan frekuensi dan peratusan
untuk menganalisis demografi responden, bebas sampel ujian-t, menguji sambungan
sehala analisis korelasi ANOVA, Pearson dan analisis regresi berganda. penemuan
berdasarkan analisis ujian korelasi Pearson mendapati analisis menunjukkan tiga
hipotesis dibina disokong dan semua pembolehubah bebas dinamakan produk, promosi
dan pengedaran tempat, adalah penting, manakala harga hipotesis tidak dikaitkan dengan
ketara dengan pilihan oleh pengguna untuk pembelian produk makanan tambahan.
Perbincangan berikut disediakan dalam kajian ini.
Kata kunci: pilihan pengguna, campuran pemasaran (4P), produk makanan tambahan,
pelajar universiti.

v
ACKNOWLEDGEMENT
“ In the name of Allah The Most Gracious and the Most Merciful”
First and foremost, Thank God, uttered deepest gratitude to Allah, Most Gracious, Most
Merciful as with the consent and favor of God, finally I can prepare my thesis perfectly.
And with His permission, this thesis also can benefit and knowledge to all readers or
researchers.
On this occasion also, humbly dam sincerely, I want to say a big thank you to my
supervisor because Dr Yaty binti Sulaiman has provided very good guidance, motivation
constructive and creative ideas to be translated through this thesis. In addition, thanks to
thousands of academic and administrative staff to have worked very well, especially in
the preparation of this thesis. A big thank you also goes to Sultanah Bahiyah Library,
UUM and Business School of Management (SBM) for providing the best service in
terms of information and guidelines for the completion of this thesis.
In addition, thanks to my beloved father and mother, Masri bin. Wandi and Maimunah
binti Abdullah, my sibling and also my friends Siti Hanis Jamail, NorFadhilah Jauhari,
and others that has a lot of moral support, ideas, and pray to me from the beginning of
this thesis so perfect. With the help of your prayers and blessings have enabled me to
continue writing with diligence, passion and quality.
My deepest gratitude to all the truth, only God is able to return the favor and sacrifice
you. Thanks.
Maisarah Masri
Master of Science (Management)

vi
TABLE OF CONTENTS
CERTIFICATION OF RESEARCH PAPER i
PERMISSION TO USE ii
ABSTRACT iii
ABSTRAK iv
ACKNOWLEDGEMENT v
TABLE OF CONTENT vi
LIST OF TABLES x
LIST OF FIGURES xii
LIST OF ABBREVIATIONS xiii
CHAPTER 1 INTRODUCTION 1
1.1 Introduction 1
1.2 Background of Study 4
1.3 Statement of the Problem 8
1.4 Research Objectives 11
1.5 Research Questions 12
1.6 Scope of Study 13
1.7 Significant of Study 13
1.8 Limitation o Study 14
1.9 Organization of Study 15
CHAPTER 2 LITERATURE REVIEW 16
2.1 Introduction 16
2.2 Consumer Preferences 16
2.3 Definition of Supplement 17
2.4 The Concept of Marketing Mix 19
2.5 Related Research 21
2.5.1 Product 21
a. Packaging 22
b. Quality Product 24

vii
c. Label 25
2.5.2 The Relationship between Product and Consumer
Preferences towards Supplement Product 28
2.5.3 Price 32
2.5.4 The Relationship between Price and Consumer
Preferences towards Supplement Product 34
2.5.5 Place 35
2.5.6 The Relationship between Place and Consumer
Preferences towards Supplement Product 37
2.5.7 Promotion 39
2.5.8 The Relationship between Promotion and
Consumer Preferences towards Supplement Product 40
2.6 Conclusion 43
CHAPTER 3 METHODOLOGY 44
3.1 Introduction 44
3.2 The Theoretical Framework 44
3.3 Hypothesis 46
3.4 Research Design 46
3.5 Sampling Technique 48
3.5.1 Sampling Procedure 49
3.5.2 Sampling Size 49
3.5.3 Sampling Method 50
3.6 Target Population 51
3.7 Questionnaire Design 51
3.7.1 Demographic Segmentation 54
3.7.2 Consumer Preferences 54
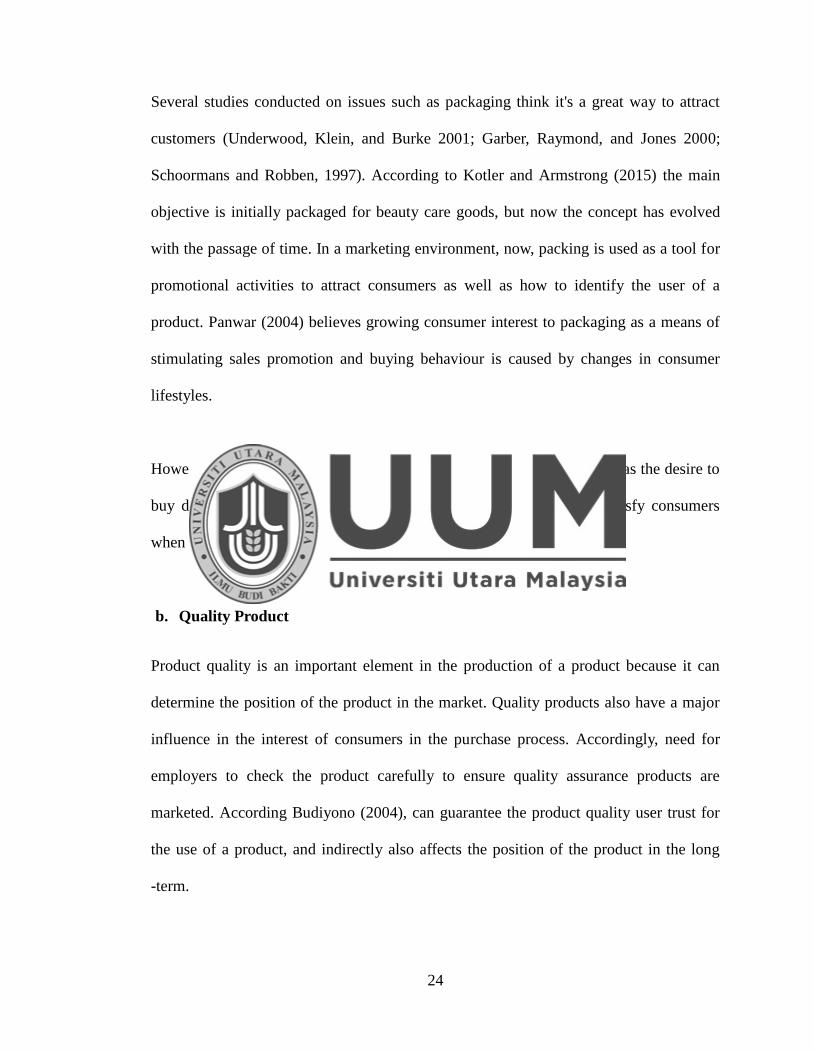
3.7.3 Product 55
3.7.4 Price 56
3.7.5 Place 57
3.7.6 Promotion 58

viii
3.8 Data Collection Procedures 60
3.8.1 Primary Data 60
3.8.2 Secondary Data 60
3.9 Data Analysis Technique 61
3.10 Pilot Test 61
3.11 Reliability Test 63
3.12 Validity Test 64
3.13 Factor Analysis 64
3.14 Data Screening 66
3.14.1 Missing Value 66
3.14.2 Multivariate Outliers Test 67
3.14.3 Normality Test 67
3.15 Inferential Analysis 67
3.15.1 Pearson’s Correlation Analysis 68
3.15.2 Multiple Regression Analysis 69
3.16 Conclusion 69
CHAPTER 4 FINDINGS AND DISCUSSION 70
4.1 Introduction 70
4.2 Rate of Reaction of Respondents 70
4.3 Reliability Test 71
4.4 Screening Data 72
4.4.1 Outlier Data 73
4.4.2 Normality Test 74
4.5 Factor Analysis 77
4.5.1 Analysis Consumer Preferences 77
4.5.2 Analysis Product 80
4.5.3 Analysis Price 82
4.5.4 Analysis Place 84
4.5.5 Analysis Promotion 86

ix
4.6 Analysis Descriptive Statistics 89
4.6.1 Profile of the Respondents 89
4.7 Mean and Standard Deviation 95
4.8 Statistical Analysis Inference 96
4.8.1 Pearson Correlation Analysis 96
4.8.2 Multiple Regression Analysis 98
4.9 Summary of Hypothesis Testing 100
4.10 Conclusion 101
CHAPTER 5 DISCUSSION AND CONCLUSION 102
5.1 Introduction 102
5.2 Discussion of the Finding 102
5.3 Summary of Finding 103
5.3.1 There is a Relationship between Product with the
Consumer Preferences to use Supplements Product 103
5.3.2 There is a Relationship between Price with the Consumer
Preferences to use Supplements Product 104
5.3.3 There is a Relationship between Place with the
Consumer Preferences to use Supplements Product 105
5.3.4 There is a Relationship between Promotion with
the Consumer Preferences to use Supplements Product 106
5.4 Implication of Research 107
5.4.1 Implications of Research on Entrepreneur
Products Supplements 108
5.4.2 Implications of Research on Consumer 110
5.4.3 Implications of Research on Government Planning 110
5.5 Limitation of Research 111
5.6 Future research 111
5.7 Conclusion 112
REFERENCES 113
APPENDIXES 125

x
LIST OF TABLES
Table 3.1 Sample Size 50
Table 3.2 Rating Scale 52
Table 3.3 Distribution of Variables and Measurement 53
Table 3.4 Measurement for Consumer Preferences 55
Table 3.5 Marketing Mix (Product) 56
Table 3.6 Marketing Mix (Price) 57
Table 3.6 Marketing Mix (Place) 58
Table 3.7 Marketing Mix (Promotion) 59
Table 3.8 The Cronbach Alpha for Pilot Test. 62
Table 3.9 Explanation of Cronbach Alpha (α) 63
Table 3.10 KMO value and Variance Level 65
Table 3.11 Strength Relationship for Correlation 68
Table 4.1 Total Rate of Reaction of Respondents 71
Table 4.2 Reliability Test Result in Pilot Test and Real Test 72
Table 4.3 KMO and Bartlett's Test of Consumer Preferences 78
Table 4.4 Eigenvalues and Cumulative Percentage Variance
For Consumer Preferences 78
Table 4.5 Matrix Components of Consumer Preferences 79
Table 4.6 KMO and Bartlett's test of Marketing Mix (Product) 80
Table 4.7 Eigenvalues and Cumulative Percentage Variance
For Marketing Mix (Product) 80
Table 4.8 Matrix Components of Marketing Mix (Product) 81
Table 4.9 KMO and Bartlett's test of Marketing Mix (Price) 83
Table 4.10 Eigenvalues and Cumulative Percentage Variance
For Marketing Mix (Price) 83
Table 4.11 Matrix Components of Marketing Mix (Price). 84
Table 4.12 KMO and Bartlett's Test of Marketing Mix (Place) 85
Table 4.13 Eigenvalues and Cumulative Percentage Variance
For Marketing Mix (Place) 86

xi
Table 4.14 Matrix Components of Marketing Mix (Place) 86
Table 4.15 KMO and Bartlett's test of Marketing Mix (Promotion) 87
Table 4.16 Eigenvalues and Cumulative Percentage Variance
For Marketing Mix (Promotion) 87
Table 4.17 Matrix Components of Marketing Mix (Promotion) 88
Table 4.18 Gender of the Respondents 89
Table 4.19 Age of the Respondents 90
Table 4.20 Race of the Respondents 91
Table 4.21 Marital Status of the Respondents 92
Table 4.22 Education of the Respondents 93
Table 4.23 Monthly Income of the Respondents 94
Table 4.24 Statistical Analysis Descriptive Variables 95
Table 4.25 Result of Pearson Correlation Analysis 97
Table 4.26 Model Summary 98
Table 4.27 Regression Analysis 99
Table 4.28 Summary of Hypothesis Testing 100

xii
LIST OF FIGURES
Figure 2 Examples of Labeling Rules Supplement Products Manufactured
by U.S. Food and Drug Administrative 26
Figure 3.1 Research Framework 45
Graph 4.1 Histogram Normality Test for Consumer Preferences 74
Graph 4.2 Histogram Normality Test for Marketing Mix (Product) 75
Graph 4.3 Histogram Normality Test for Marketing Mix (Price) 75
Graph 4.4 Histogram Normality Test for Marketing Mix (Promotion ) 76
Graph 4.5 Histogram Normality Test for Marketing Mix (Place) 76

xiii
LIST OF ABBREVIATIONS
RNI Recommended Nutrient Intake
MOH Ministry of Health
OTC Over-the-counter
GDP Gross Domestic Product
WHO The World Health Organization
DCA The Drug Control Authority
SOFA State of Food and Agriculture
NPANM National Nutrition Action Plan
FDA Food and Drug Administrator
GMP Good Manufacturing Practice
DSHEA Dietary Supplement Health and Education
FDA Food and Drug Administration
TCC Tribunal for Consumer Claims Malaysia
KMO Kaiser-Meyer-Olkin
IV Independent Variable
DV Dependent Variable
UUM Universiti Utara Malaysia

1
CHAPTER 1
INTRODUCTION
1.1 Introduction
There are a lot of successes have been achieved by Malaysia and received recognition
from the international community, particularly in the economic sector. With the
advancement of technology today, Malaysia's economic progress can be further extended
to various sectors such as the services sector in Malaysia. Malaysia market’s ability to
compete with the overseas market in view of the serious need for various initiatives has
been undertaken by the government in Malaysia as a country not only able to compete at
the international level but even produce a healthy and productive citizens towards
ensuring accelerated development of the country. A healthy lifestyle is very important in
life to face the days ahead.
The World Health Organization (WHO, 1948) defines health as a state of physical,
mental and social well-being and freedom from disease. This definitely confirms that the
three aspects are important in living a healthy and prosperous. Improved health product
industry, we can see today it become popular among the public in line with the
requirements of the supplement itself in accommodating the requirements necessary in
our body.

2
The emergence of various types of products gives users the option to choose a product
that meets their tastes and needs. Therefore, taking a supplement that has become a trend
to the extent that people affected indirectly because it is said to appear in all kinds of
products that supposedly able to cure chronic diseases. Users need to be wise in making
the choice to understand the holistic supplement products, namely, whether through its
own studies or reading about something related products.
Based on the Euromonitor, (2015) consumer health in Malaysia experienced slower
Gross Domestic Product (GDP) growth of 5% in 2015 compared with a 6% increase in
2014. The slower economic growth resulted in cautioning spending, especially in OTC
(Over-the-counter) product. Moreover, when the rising cost occur, this also caused
consumers to be more price sensitive when purchasing consumer health products.
In Malaysia the top ranking direct selling consumer health companies such as Amway
and Herbalife Product benefited from the consumer high confidence in the quality of
their product due to long brand history in the market. Nevertheless, the segmentation by
product and analysis of the health supplement market share of around 49% during 2014
and is expected to lead the market by the end of 2019. However, consumers will be still
selective when purchasing consumer health products as they are unlikely to spend on
OTC drugs when they are not needed. Although, the demand for vitamin and dietary
supplement will remain strong as consumer perceive to be important for maintaining
good health and lowering the risk of developing chronic illnesses.

3
The rise in the aging population and the awareness of the benefit itself is the key driver
for the growth in Malaysia economic. Consumers may express their needs and desires
and still may act in a totally opposite way, at times, it’s possible that they aren't even
aware of the true motivations behind their buying behaviour, or they could react to
factors determining last minute changes to their buying decision. Although the consumer
decisions are relatively easy to notice and quantify, the psycho physiological processes
behind them are very difficult to take into account. Therefore, the features of the
consumer’s preferences mark the conducted studies with certain specific features in this
sense, which we must take into considerations when elaborating and conducting these
studies. In view of observation the essence of this dimension of the consumer behaviour
itself.

4
1.2 Background of Study
Malaysia is the one of the key markets for health supplement business in Southeast Asia.
To develop an effective business marketing strategy in Malaysia, it is important to
understand the country’s regulatory framework for health supplement product. The
supplements we see more popular among people nowadays. This matter has also become
their lifestyle. This is because nowadays people live a hectic lifestyle when too busy
work and personal commitments. This condition causes they have no time to cook or eat
healthy food. Thus, most Malaysians think that taking vitamin or mineral supplements
can compensate for lack of nutrients in their daily diet. In Malaysia, health supplement
product was regulated as pharmaceutical products by The Drug Control Authority
(DCA).
Moreover, it can be classified as a dietary supplement or traditional medicine, is
depending on the type and dosages of the ingredients in the formulation. According to
the Thai Ministry of Public Health (2005), defines supplement as a product to be taken
or consumed as an addition to conventional foods that contain nutrients or other
substances either in the form of tablets, capsules, liquids, powders and others. If before
this product only supplements available in pharmacies, but has is now widely sold
supplement products. Marketing has evolved and allows users to get the same supplies in
health food stores, supermarkets or online. The significant increase in sales to
supplement its product users began to care about the health and take supplements as a
means to prevent disease and maintain health (Natila, 2002) for example vitamin A helps
to maintain growth, vision and tissue development. So, dietary supplements have to

5
comply with the general safety and quality requirement of pharmaceutical product under
the pharmaceutical category in Malaysia regulation. But, this becomes an issue from a
health perspective due to lack of scientific evidence and documentation about security,
interaction and effectiveness against certain diseases.
Intake of food quality and regularly is essential to provide the human body with nutrients
and maintain a healthy body. For a student, the awareness of health food and health food
intake to give a good impression of life as it affects the development or physical and
mental reactions of a student who is the backbone of the country's human capital for the
future. Intake of a balanced diet and regular feeding schedule will assure long-lasting
health. For a student who needs physical and mental activity, of course, very important
nutrients in an effective learning activities. However, the level of awareness of student
health food is still less because they are more likely to eat simple food like snacks and
fast food containing substances harmful to health in the long term. As a result of
improper diet, students may not be in optimal physical condition to give full attention to
learning.
In fact, the students are very prone to making unhealthy food as the easy lure of
advertising on television and print media on the food fun. While many people still do not
practice self health care, but there are still health conscious food intake for their survival.
While average people now have less rest time of 5 hours a day. Therefore, they are
aware of taking supplements can help them keep fit. But, it must be remembered, taking
supplements not only provide benefits but also give a bad impression to the user.

6
Health food intake can increase the level of intelligence. Health foods will positively
impact current enlargement process both physically and mentally. It is thus, as a health
food supplement containing nutrients could fuel all day. Additional nutrients such as
calcium, iron and fiber can help grow physically. As a result, the bones will become
stronger. In addition, health food such as gingko leaf and starch cod can strengthen a
person's memory. Therefore, the planned recruitment of health food can provide benefits
to its users.
Consumption of health also negatively affect the cause of illness. Excessive
consumption of health will lead the cause of diseases such as diabetes, cancer and heart
disease. This is so, because food intake for unplanned health will impact negatively on
the body. Decentralization, health food containing excess sugar causes diabetes.
Excessive nutrients in the body such as proteins, carbohydrates and iron will cause
cancer cells to become active. A hormone also becomes unstable as a result of the
election is not exactly health food. Therefore, choosing the right health food can prevent
someone affected by the disease.
Excessive intake of healthy food will cause damage to internal organs. Effects of
excessive chemicals in certain products or health food can damage vital organs like the
brain, kidneys and liver. This is so, because these chemicals will dissolve in the blood.
Blood flow to the brain along with the chemical solution. This situation will affect brain
function. Additionally, users who are not very suitable for products or food supplements
such as vitamin pills, collagen and slimming pills can have side effects to the user.
Therefore, health food abuse can cause severe complications in the internal organs.

7
Health food intake can also cause people to become passive exercises. People feel that
making healthy food can ensure good health. Therefore, people will not be doing
exercises for the muscles to move their bodies. Originally, the food is actually health
food intake side to increase energy after a hard work. The public will be more dependent
on vitamin pills, spriluna and collagen that may cause harm to consumers if taken in
excess. The public will get obesity when not exercising will lead the cause of many
diseases.
In conclusion, the intake of food can provide health benefits to users. Thus, health food
intake uncontrolled or excessive would give a bad impression to the user. This is because
the health food such as vitamin pills and spriluna contain chemicals that control. Health
effects of food intake in excess can cause damage to the kidneys, intestines and unstable
hormone. While eating healthy is a new alternative community now to take care of their
health, but health can also be compromised if nutrition is not practiced.

8
1.3 Statement of the Problem
University life is an overflow challenging, especially for students who are far from
where they live with their parents and families where different environment for them.
Unfamiliar environment affects personality, attitude and behaviour, particularly on their
food choices that influence by their nutritional status. According to Isa & Masuri, (2011)
the dietary pattern of young adults has been extensively studied and reported in the
literature as associated with obesity, frequent snacks, and skipping meals.
Furthermore, about their nutritional status, students themselves can make a bad choice
on preliminary studies at the university and this may continue throughout the life of the
university. This has been studied by previous researchers from their observation of the
daily routine of students such as busy class schedules, peer pressure, some female
students tends to buy fast foods from different food joints around the university while
others eat from the university cafeteria as others can afford to cook in their hostels. In
these foods outlets same kind of foods is prepared daily, therefore students tend to
consume same diet repeatedly and thus denies them a variety of choices (Cruz, 2000; Isa
& Masuri, 2011).
Some female students have reported to skip meals in order to achieve and maintain their
desired body size. In these circumstances, these routines can give an impact on
nutritional status since they feel safe or not for their healty lifestyle (Manwa,2013).
Therefore, it was necessary to investigate their dietary patterns, assess their nutritional
status and how dietary patterns influence nutritional status. There was prevalence of

9
physical signs of malnutrition, which indicates that the students were unhealthy and
could impact negatively on their academic performance (Manwa, 2013). So, for this
impact of their living in university, consume product health bring responsibility for food
preparation to avoid affect their dietary habits.
Based on the fact Hughes (2010), the desire to consume products that are practical and
can meet the needs of supplement products that demand for food is increasing. However,
the use of supplements should be used carefully so as not to harm things like poisoning.
So, by researching information about a product before making a decision to buy it seem
that for knowledge and can be focused on the major health determinant. Busy with
everyday tasks to prevent the students to pick up food for a balanced result in consumers
taking vitamin or mineral supplements to replace the lack of nutrients in their daily lives.
This is because, most of the students who study in the city to take supplements on
factors such as air pollution, work pressure as well as pesticide contamination around.
Nowadays, the quality of the food is also not what it used where the chemicals used in
food is high in comparison with the past. For example, fast food all the rage, especially
youth and children as a cheap and affordable price. According to the State of Food and
Agriculture (SOFA, 2013) showed that 12.5 percent or 868 million people in the world
face the problem of malnutrition. Even more so when the majority of whom are children
and 70 per cent are children in Africa.

10
From SOFA (2013), report proves the child also has the potential for a lack of nutrients
and substances as experienced by adults. Strategies to improve household food security
in Malaysia's National Nutrition Action Plan (NPANM) as stated by the Minister of
Agriculture and Agro-Based Industry, Dato 'Sri Ismail Sabri bin Yaakob shows that the
issue of food security and nutrition in the country cannot take lightly. According Yetley
(2007), supplement the security issues such as bio-availability (bioavailability),
bio-equivalence (bioequivalence) and confirmation in vitro and animal studies it is
appropriate to reflect the limited human condition. When used in supplements may
involve exposure to excessive nutrients or chemicals to normal individual need.
This is because, potentially beneficial supplement product or harm to the user interaction
(ADA, 2015). People now believe that lifestyle and poor diet pattern require them to
seek the help of nutritional supplement products to meet the needs of the body. It is also
a way to maintain health. However, many argue that taking supplements is said to restore
and enhance the prevention of illness while getting advice from a qualified doctor.
However, according to Ghazali (2016), supplements are not always healthy for the body
and always have side effects that need to be taken into account. Therefore, nutritional
supplements are taken in every important for us to know and is very important for us to
ensure that they comply with the standards of supplements Recommended Nutrient
Intake (RNI) Malaysia 2005 and received approval from the Ministry of Health
(MOH).

11
1.4 Research Objectives
This research will be conducted to identify the impacts of marketing mix elements on
consumer preference towards supplement product among Universiti Utara Malaysia
students. Therefore, there are four research objectives which are:
1. To investigate the relationship between product and consumer preferences
towards supplement product among Universiti Utara Malaysia students.
2. To investigate the relationship between price and consumer preferences towards
supplement product among Universiti Utara Malaysia students.
3. To identify the relationship between place and consumer preferences towards
supplement product among Universiti Utara Malaysia students.
4. To examine the relationship between promotion and consumer preferences
towards supplement product among Universiti Utara Malaysia students.

12
1.5 Research Questions
This research has been conducted, followed by the statement of the problems, the study
was conducted to answer some questions as stated below:
1. Is there any relationship between product and consumer preferences towards
supplement product among Universiti Utara Malaysia students?
2. Is there any relationship between price and consumer preferences towards
supplement product among Universiti Utara Malaysia students?
3. Is there any relationship between place and consumer preferences towards
supplement product among Universiti Utara Malaysia students?
4. Is there any relationship between promotion and consumer preferences towards
supplement product among Universiti Utara Malaysia students?

13
1.6 Scope of Study
This study is generally conducted to investigate the effect of a supplement product as
customer preferences among students. The main scope of the study, which is the
respondent in the survey, in which respondents were selected as study sample consisted
of students of Universiti Utara Malaysia. The study was conducted at Universiti Utara
Malaysia due to the level of consumerism supplement products among students of
Universiti Utara Malaysia. In addition, this study is to identify factors that influence
purchasing decisions towards supplement products through four marketing factors which
are product, price, promotion and location. This study used a questionnaire instrument
for obtaining information and data from respondents.
1.7 Significance of Study
The results of this study could help researchers learn more about what level of influence
and factors influencing purchasing supplement products among students. In addition,
researchers can also determine the average number of buyers supplement products
among students of Universiti Utara Malaysia. By using supplement products have tended
to increase with the level of a healthy lifestyle, age, education, and physical activity.
(Prynne & Wadsworth, 2005). The study of supplements we can see still less a place in
Malaysia. Not many studies conducted in the health care industry. Thus, the presence of
this study could help support the industry in producing data on factors that influence
purchasing supplement products. In fact, it is also important for operators supplement
products to use this information to evaluate the user's perspective in decision-supplement

14
products so entrepreneurs can produce a better product. Accordingly, the results of this
study can be beneficial to consumers and sellers in several aspects such as marketing.
The findings of this study can improve understanding and knowledge of the product
suppliers in producing products that guarantee customer satisfaction. In addition,
suppliers can produce a competitive marketing strategy and providing accurate
information to consumers about the product supplement (Ghazali et al, 2016). In fact, the
findings of this study can provide information and recommendations to buyers of
supplements so that they can make a wise and rational purchase.
1.8 Limitation of Study
In preparing this study, there are limitation and constraint faced during the process of
preparation of the study include the costs that involved on several fronts which are time,
money and energy, particularly in setting up data analysis and data collection. This is
because there is limited time in which the researchers have other commitments that must
be given priority as well as a student and children. Meanwhile, from a financial
perspective, the researchers do not have sufficient financial resources to be spent as the
cost of printing and distribution costs survey questions where researchers should move
from one area to another to get respondents to answer questions in this survey. In fact,
energy constraints should also be taken in the process of getting a response because data
collection is not all data obtained in accordance with the specifications desired by
researchers such questions not been answered by the respondents.

15
1.9 Organization of Study
This research consists of the five chapters of the full research paper. The chapters are the
introduction, literature review, research methodology, results and finding and lastly,
discussion, recommendation and conclusion.
Chapter one, the introduction is the first chapter of writing this paper. It highlights the
overview of the research titles and elaborates the title in more details. Meanwhile, the
literature review is the second chapter of this paper. Studies of previous researchers,
which relate to the present studies are gathered and explained the possibility and
appropriateness to carry this research. This secondary source also builds the foundation
for the future present studies. The next chapter is the research methodology for this study.
Research framework, research design, sampling design, instruments design and data
analysis are presented in this chapter. It is the heart of the research where all procedures
getting the research correctly are highlighted and explained based on valid citations in
order to obtain true and reliable findings.
The next chapter is chapter 4 will highlight the discussion of the result. This chapter will
analyze the result of the study. Lastly, chapter 5 is about conclusion and recommendation.
The purpose of this research to wrap up the all about this study and recommendation will
give the suggestion for improving the study and for the future researcher.

16
CHAPTER 2
LITERATURE REVIEW
2.1 Introduction
Review the work is an important part of research for helping researchers to make a
review of previous studies to obtain information related to the study. The literature
review contains statements, facts, theories, opinions, assessments and research reports
with respect to the title selected by the investigator based on the writings or natural
resources. The literature review also called the attention of the learned and collected
from various sources, including journals, articles and research ever carried out in
connection with the decision of buying additional food products among consumers.
These resources are very useful as an additional reference to researchers so that any
research and study have strong evidence to support that argument. The preferences of the
consumer are a positive motivation, expressed by the affective compatibility towards a
product, services or trading firm.
2.2 Consumer Preferences
Preference is a person’s feeling of pleasure, of disappointment resulting from comparing
products perceived performance (or outcome) in relation to his or her expectation. Many
companies are aiming for high satisfaction because consumers who are just satisfied still
find it easy to switch when a better offer comes along. Those who are highly satisfied are

17
much less to switch. High satisfaction or delight creates an emotional bond with the
brand, not just a rational preference. The result is high consumer’s loyalty.
The key to generating high consumer’s loyalty is delivering high consumer value.
Moreover, in delivering profitable value, a company must develop a competitively
superior value preferences won’t change easily towards the product. The brand must
represent a promise about the total resulting experiences that consumers can expect.
Whether the promise is kept depend upon the company ability to manage its value
delivery systems includes all the communications and channel experiences the
consumer’s will have on the way to obtaining the offering. Moreover, preferences can be
triggered by the features related to the material substances of the goods (shape, size,
print, taste, colour, consistency, package, and etc).
2.3 Definitions of Supplements
There are many supplements on the markets; a good product will regulate the product
from the beginning until the end. So as the best producer of food supplements will be
issued and distributed in the market if companies comply with FDA (Food and Drug
Administrator) and GMP (Good Manufacturing Practice) procedures.
The procedures FDA (Food and Drug Administrator) and GMP (Good Manufacturing
Practice) is a compulsory subject in the selection of supplements. According Wuri, (2007)
supplements are additional products that are used to supplement food containing one or
more ingredients such as vitamins, minerals, or substances derived from plants, amino

18
acids or material to improve Dietary Allowances (RDA), or concentration, extract or a
combination of the above materials. Thus, many users take supplements is to fill a need
within the lack of nutrients or vitamins.
This definition was agreed by Geoffrey P. Webb (2006) which states that food
supplements constitute a pattern for a normal diet and help health by taking important
nutrients such as vitamins, macro minerals, trace minerals and others. It is as busy and
do not have time to keep the body healthy. While according to the Dietary Supplement
Health and Education (DSHEA) of 1994 defines supplements as products other than
tobacco are expected to complete food containing one or more of the food ingredients
such as vitamins, minerals, herbs, amino acids, the feed to increase nutritional
concentrate , substance metabolite, extract, or combinations of these ingredients.
However, according to Devla, R. Acharya, S. Acharya and Kumar, (2011) each country
has a different call to the term of supplement. For example, Health Food (China),
Health Food Supplement (Korea), Dietary Supplement (United States), Nutraceutical
(Canada). Even though, the average Australian used the term complementary product
while the Food Supplements (Hardinsyah and Aries. M, 2012) practiced in Indonesia.
The term does not distinguish the various internal functions supplement itself generally
help users improve the health of the body.
In addition, according to the Food and Drug Administration (FDA) stating that the
supplements consist of a variety of forms, including tablets, capsules, powders, energy
bars and liquid. Ghazali, Mutum and Lee (2006) argues pleased to supplement available

19
from pharmacies, health shops, clinics, Chinese medicine shops, supermarkets or from
agents selling directly to customers. It is not directly encouraging the purchase and use
of supplement products because of its simplicity to be found by users. Moreover, now,
up to date technology at their fingertips, where the widespread use of technology allows
various products or items purchased on-line.
2.4 The Concept of Marketing Mix
The concept of marketing mix is an activity that can be done by companies to influence
the demand for and supply of a product either products or services. Thus, McCarthy has
inspired the concept of the marketing mix, known as the "4Ps" of the product, price,
promotion and place. The concept is popular among marketers to identify shortcomings
and strengths of the factors existing in the marketed product.
The objective of the marketing mix is continuing to perform actions that affect consumer
purchasing decisions (Megan J. and Han F. 2012) and the role of the market itself is to
align supply and demand in the market. Similarly, Kotler and Keller (2012) defines
marketing as a social process that helps the flow of products and services in an economy
from the producer to the consumer and at the same time to be able to meet consumer
demand and enhance the organization's goals.
Peter and Donnelly (2007) in Mohammad, Wang and Sumayya (2012) states, each
element in the marketing mix affect users in different ways. It is thus important to ensure
the right product is placed in the right place, at the right price and at the right time.

20
Similarly, multinational companies, they need to know how to adjust your marketing
strategy and how they are to adjust elements of the marketing mix in the market for
universal (Vrontis and Thrassou (2009). They need to know the need to adapt the
product, price, promotion and location to take into account all the variables of marketing
mix (Kotler and Keller, 2009). However, the marketed product will fail if one element in
the marketing mix cannot be reached indirectly will affect the profitability and
performance of the company that produces the product.

21
2.5 Related Research
This related research in this study shows the previous research about the relationship
between independent variable and dependent variable whether it has a positive effect
towards supplement product.
2.5.1 Product
The first element in the marketing mix is the product. There any combination of the
goods and services offered to satisfy the needs and wants of consumers. For instance a
product is anything tangible or intangible that can be offered for purchase or buy used
consumer. Thus, a tangible product is the one that consumer can actually touch, such as a
computer, but for an intangible product is a service that cannot be touched, such as
computer repair, income tax preparation or an office call. The product is an important
factor in the buying process because when users see during the purchasing process is the
product. Products can be classified into two main categories that can be touched and
cannot be touched. Products that can be touched are the items that can be held like a
book, chair, television and so on while the product is not visible to the naked eye
categorized as a product that cannot be touched, which can only be measured through
delivery, credit and collateral (McColl-Kennedy and Kiel , 2000).
According to Kotler and Keller (2011), the product is something that can be offered to a
market for attention, owned and worn or taken in order to meet the wishes or needs of
the user. Users will inevitably find a product to suit their own tastes to get
self-satisfaction. Various aspects and elements of the product must be taken before they

22
decided to purchase to ensure satisfaction after buying any product. And, as noted by
Alvaro. G. M, Oscar. G. B, and Mercedes. M. P (2016), the physical form of the product,
product packaging and labeling information can influence consumers to come into the
store, check the product and buy it. Whereas according to Kotler and Armstrong (2008),
the factors to be taken into account by the manufacturer before producing a product
which includes diversification of products, product design, product features, product
brands, product size, packaging, service and warranty after purchase products.
a. Packaging
Prendergast and Pitt (1996) states that the packaging is the most important factor in
purchasing decisions at the point of sale, where he became an important part of the sales
process (Rettie and Brewer, 2000). According Deliya and Parmar (2012), most marketers
believe that packaging is actually more influential than advertising in influencing
consumers because it has a direct impact on the perception and experience of a product.
Product packaging serves as the protector of an item to avoid damage and defects to the
goods. Packaging also serves as a shield to the product of any circumstances that could
alter or damage the product either physical or biological product so that quality and
freshness can be maintained. In addition to working to protect products in storage,
during the transfer of product and also during use, packaging serves to provide ease and
convenience to the user access (Shah, Ahmad and Ahmad, 2013).

23
Packaging process uses science technology that is designed to protect and ensure the
products can attract users to buy it. Pinya and Speece (2007), said packaging consisting
of several elements of shape, color, symbol, chart patterns, image and size. Similarly, the
study of Pinya and Speece (2007) which states that the user's initial perception of a
product is dependent on the style and design of the product packaging. Yonca Limon,
Lynn R. Kahle, and Ulrich R. Orth (2009) also states that the packaging design can also
be used to identify, build brand identity and image of a product. In addition, the product
allows users to choose from various types of the same product depending on the features
that are highlighted through product packaging (Wells, Farley and Armstrong, 2007;
PiresGon, Calves and Ricardo, 2008).
Based on studies conducted by Henry Morgan and Broadbridge Adelina (2007),
indicates if the user considers attractive packaging of a product, then the product is
reliable and has a good performance. With the advent of increasingly sophisticated
technology nowadays, different sizes and shapes of product packaging supplement
issued by the company to compete in the market. Beautiful product packaging can attract
users to view and examine the product before deciding to buy it. Accordingly, the design
of the product packaging refers to advertising tool last to inform, persuade and convince
consumers to help them to distinguish a brand, product and make a final decision based
on the design of the packaging during the purchase process, (Well, Moriarty and Bruntt,
2006; Klimchunk and Krasovec (2007).
24
Several studies conducted on issues such as packaging think it's a great way to attract
customers (Underwood, Klein, and Burke 2001; Garber, Raymond, and Jones 2000;
Schoormans and Robben, 1997). According to Kotler and Armstrong (2015) the main
objective is initially packaged for beauty care goods, but now the concept has evolved
with the passage of time. In a marketing environment, now, packing is used as a tool for
promotional activities to attract consumers as well as how to identify the user of a
product. Panwar (2004) believes growing consumer interest to packaging as a means of
stimulating sales promotion and buying behaviour is caused by changes in consumer
lifestyles.
However, packaging is not simply a factor that is seen by the user, whereas the desire to
buy depends on the extent to which consumers expect products to satisfy consumers
when they take it (Kupiec and Revell, 2001).
b. Quality Product
Product quality is an important element in the production of a product because it can
determine the position of the product in the market. Quality products also have a major
influence in the interest of consumers in the purchase process. Accordingly, need for
employers to check the product carefully to ensure quality assurance products are
marketed. According Budiyono (2004), can guarantee the product quality user trust for
the use of a product, and indirectly also affects the position of the product in the long
-term.

25
c. Label
Increased awareness of the importance of checking the label of an item or product before
buying it increases user understanding of the importance of these things than the time
before. Consumers are likely to collect information from various sources before making
any purchase to ensure the quality and effectiveness of a product. It is as described by
Hawkes (2004), information on the nutritional content and health benefits can be found
on the nutrition label of a product. In addition, the nutritional label is not only serves as a
channel that shows the nutritional properties of a product, but also enable to consumers
to make food choices and also works to create demand for healthy food products and
encourage competition on the nutritional quality (Baltas, 2001).
Labeling give a more detailed description of the product, the manufacturer, methods of
use, the materials used to produce the product and the use of supplementation. Ministry
of Health (MOH) also explains that food labeling is to provide correct and clear
information about a product. The label shall comply with the Malaysian Food
Regulations 1985 (PPM 1985) and not to mislead or deceive consumers. Various types
of labels used to make the products more attractive in the eyes of consumers. This is
consistent with the form of packaging, which also performs the transformation in line
with current technological advances. The label is used for patching material or adhesive
stickers, labels hung on product, print directly on the container or packaging and so on.
Here is an example of a label issued by the U.S. Food and Drug Administration in which
each supplement product label must follow the rules that have been set. Supplement

26
product label should be a descriptive name of the product states that it is a supplement,
the name and place of the manufacturer, packer or distributor, a list of materials used and
the net contents of the product.
Figure 2: Examples of labeling rules supplement products manufactured by U.S. Food
and Drug Administrative (Source of the Association of Consumer Health Care Products)
In recent years the issue of product safety is a serious concern consumer health. By
seeing this, reports in this press to some extent preventing their interest to buy the
product supplement. This occurs because the act of a brave marketer to sell counterfeit
products to consumers. The immoral acts that can cause consumers face higher risks
such as disability or death.

27
As a consumer, it is important for individuals to ensure their own security by complying
the criteria need to buy a product such as reading the label before make a decision
making. For Davies, Titterington and Cochrane (1995) stated that health and
environmental factors are the main factors in determining the purchase of a food product.
Therefore, users should be aware that the product is safe to be taken should have features
like high quality sanitary products, good processing and working environment clean.
Consumers also play a role in ensuring supplement products obtained approval from the
Ministry of Health (MOH). If the product has been registered, the registration number
beginning with 'MAL' followed by 8 digits and end with a letter describing the product
registration category. The registration number is usually located on the label or
packaging of a product. This code is important because the product has received
approval from the Ministry of Health and the ingredients are allowed in food.
For a company perspective, they are responsible for guaranteeing security through
advertising, labeling, and promotion so that consumers believe the product will be used.
As noted by Chebat (1995), they have an effect on a person's memory and can affect the
public's confidence in the product being advertised. Users must be aggressive in
knowing their rights and role as consumers to protect themselves from being
manipulated by the global market. Based on the Ministry's website in the national Trade,
Co-operatives and Consumerism Ministry (Ministry), consumer means a person who
buys goods and services for personal use or for domestic or household. Smart consumers
know their rights as consumers to demand any compensation if there are items that are
defective, dangerous or misleading trade description. Fraud or does not conform to the
service agreement. Complaints and claims can be made on matters relating to the

28
Tribunal for Consumer Claims Malaysia (TCC), an independent body set up by the
ministry.
2.5.2 The Relationship between Product and Consumer Preferences towards
Supplement Products
The increasing demand for products that are healthy and good nutrition from an
educated consumer is more demanding and lead to the need for it to be more flexible and
to be distinguished (Linnerman et at, 1999). In fact not only that, as their users want
quality products that provide special benefits in terms of health and safety, and assure
the quality of the environment (Van der Heuvel et al., 2007). Several studies have been
conducted to examine how consumers evaluate the properties of different products in
many food products. Health, nutrition, taste, price, facilities are some of the criteria that
consumers use to determine which products are more attractive (Bech-Larsem et al.,
1999). Consumers face a lot of balance in their food choices, for example between
nutrition and price, nutrition and facilities (Blaylock et al., 1999).
Development of healthy food has been rated as the most important area in the research,
followed by developing natural food (Katz, 2000). According Baltas (2001), users pay
much attention to their diet, and especially to the information printed on the package
label, such as nutrition and health claims. In response to consumer demands healthy and
nutritious products, manufacturers should highlight these claims on the front label their
packages. Other features such as the production of organic and locally may provide
additional benefits to users who are concerned about environmental care.

29
Think globally, act locally,” long the maxim for successful politics stressing a preference
for all things local, is emerging as a global trend. According to Alexander, (2014) users
sometimes find local product and interested through regional and traditional food. But
for some people label "local" to be strong buying options from "organic". In a world that
has become globally linked, and often somewhat confusing, a search for a regional and
local identity is emerging. The desire for traceable products is a by-product of a
never-ending series of food scandals, and it comes alongside a growing ethical outlook
that embraces organic food production, ethical consumption and a concern for animal
welfare.
For domestic manufacturers, there is an increase in consumers prefer products
manufactured in the country than outside the city where he showed consumer buying
habits that can improve the national economy (Strasek, 2010). These advantages have
given users the ability to make a purchase decision and also supplement their products
more attentive to nutrition, health and food quality than ever before (Strasek, 2010). For
example, a product marketed in the famous brand will have a shelf life longer than the
similar market products but with lesser known brands. The product planning and
research and development activities must be focused on resource and product brands to
further strengthen product positioning in the market and become the consumer
preferences.
Attraction senses something visual appearance of food products and packaging is a
powerful influence on consumer acceptance (Tuorila and Pangborn, 1988; Cardello,
1994). In fact, the properties of the packaging also can persuade consumers to buy a

30
product, and sensory properties will confirm if they like. This may give the desires and
determination to users and will repeat purchases (Munrray and Delahunty, 2000).
Package and label only have a few seconds to make an impression on the minds of
consumers (Dantas et al., 2004) at that time, it must draw the user's attention, and
convince buyers that it is the optimal choice on the shelf (Rowan, 2000).
Next, through color and graphics package fruit juice represents a key element of art in
the design of the package. According to Hutchings (2003), intensifying the color of the
fruit may reinforce expectations for taste juice. Deliza (2003) suggest that package
designers need to take into account consumer expectations about the sensory properties
of this product when designing labels.
In order to achieve the needs of users and successful in the market, manufacturers need
to try to understand the sensory characteristics and packaging of food products (Munrray
and Delahunty, 2000). Users usually do not choose one of the features that at one time,
instead they chose a group of attributes that make them the best utility in the process of
selecting a product.
Some literature has been devoted to consumer perceptions labeling and packaging, and
the role of information about consumer intent to purchase. For example, in Roe, Levy
and Derby (1999) study, nutrition and health claims set out in next label is more
important than back-label nutrition facts. Bond, Thilmany, Keeling (2007), recognizing
that the health benefits of a diet rich in fruits and vegetables, and the power of these
products reduce the risk of coronary disease and cancer, a claim proved to be most

31
effective when attracting users. Teisl, Bockstael and Levy (2001) studied the effects of
nutritional claims on the label next to several retail products, and determine that the tent
needs to change consumer behavior.
However, they noted that alternative health does not always increase in market share.
The choice of product can give a lot of influence by the packaging material. Beverage
package is of particular interest, because they can not be distributed without the former
(Van Dam and Van Trijp, 1993). Since their creation in 1960, aluminum can be listed as
the most desirable package, convenient, and environmentally friendly these days. The
literature review shows that the packaging and labeling of the properties of the most
visible to users is important before launching the product. In the case of 100% fruit juice,
packaging and labeling can influence consumers to buy the product. Features such as
packages and nutritional claims plays a key role in the purchase decision.
Information about the content and benefits for consumers should be highlighted on the
package. In order to get an edge in this competitive market, manufacturers should try to
engage users in the creation of the product before actually introduced into the market.
Several studies have been conducted about the package and label fruit juice. However,
few have examined the effect of lifestyle segmentation that includes behavior and
consumer preferences and opinions about 100% fruit juice packages, to identify
homogeneous user segments share the same pattern of social behavior.

32
2.5.3 Price
The second element in marketing mix is price. Price is simply the amount of money that
consumers are willing to pay for a product or service. In price setting, companies should
estimate customer reactions to possible prices. Companies should also estimate the
preferable profit margin and possible discounts in the future. Companies must be aware
of legal restrictions on pricing. The price is the amount charged for a product. Factors to
keep buying, suspend or cancel the purchase directly influenced by the price of a
product.
Generally, all grades given by customers to benefit from owning or using a product.
According Tjiptono (2008), the price is a marketing aspect which is flexible in where it
can be changed quickly. According to the researchers (Johnson and Gustafsson, 2000;
Morgan, 1996; Zeithaml and Bitner, 1996; Hill, 1996; Dutka, 1995, and Giel Naumann,
1995), said the price is a factor influencing customer satisfaction. However, users also
use price as a gauge to see the quality of a product. For those who want more expensive
product quality and reliability. Similarly (Hawkins, Best, and Coney, 2001: Schiffman
and Kanuk, 2010) stated price is a service to the quality of the signal. Depending on the
product, consumers prefer to buy products at a cheaper price with the quality and the
criteria that they need. In this case, employers should be more sensitive products because
of the competition, competitors will lower prices cheaper than what is sold by the
producers. Lupiyoadi (2001) say that the pricing is very significant in providing value to
the consumer in making and influencing decisions.

33
In addition, users tend to evaluate a product based on the price if they are not used for
such products to assess the quality of the product. For consumers, if the product is
expensive, this indicates the product is high quality and secure. According Wathieu and
Bertini (2007), there is evidence to suggest that the higher price of the product, believed
the higher the quality of a product. There are also a handful of marketers who produce
misleading information related to the user. For example, the label on the supplement
products, halal label, expiry date, or the price tag on the shelf.
Product purchase decisions are not solely dependent on the product but the price factor
also plays a role in influencing consumer decisions. Product price must be appropriate to
the materials used in the manufacturing process of the product. Therefore, users need to
check information or label before purchasing to ensure that products sold on the basis of
a reasonable price for the materials used. The other alternative for marketers such as
discounts or special prices only to increase the desire of buyers to buy a product and
products that get discount can change the minds of consumers where previously about to
buy because the price is expensive. This proves the price of a product has the potential to
change consumer purchasing decisions on a product.

34
2.5.4 The Relationship between Price and Consumer Preferences
Willingness to pay is the one medium that is important in the purchase of a product. Pay
the maximum price, one that makes it as one who is willing to acquire goods and
services to the needs of a more secure. Consumer are more likely to use price as a
benchmark to measure the quality (Mowen, 1993). According to Atanasoaie (2012)
mention that price is a marketing variable that can be easily modified unlike the three
marketing variables, when the marketing conditions require it. Consumers are
willingness to pay the price difference only if they are convinced that these products are
better. Also that how the price of supplement products can be compare to the traditional
product health and supplement product. This price differences can be seen as an
investment in human health. Other than that, given that price is a factor hindering market
development it is very important when buying for the first time these products,
consumers to be fully satisfied so that their satisfaction to lead to new acquisitions
(Aertsens, et al,, 2009).
Moreover, when we talk about the students budget regarding about buying the
supplement between their food, textbooks and tuition and money can a bit tight when it
come to college. Some of them, which struggle to spend extra cash on pre-workout.
Then, for those of students who love working out and using supplements they can figure
out the needed plus to decrease the expenses itself. According to Goldstein, 2015 he
mention a few tips to buy supplement such as buying what need, buying in bulk, and get
a membership plus they can give the special offer and also the coupons for the best deal.

35
The reason the researchers tested whether the proce is due to the price factor is the price
level actually relevant to a product of high quality supplements. This problem occurs
when there are cases where users are fooled by an expensive price but getting a product
that is quality and also dangerous to them. Price is one of the items that affect the
election results and the user of a product. But if consumers tend to choose quality as a
priority, and higher prices would have compared low price. This is because a product is
expensive because of high quality through a variety of manufacturing processes and
more perfect. However, the problems that occurred in Malaysia is a product that has
been blacklisted had sued the trust of consumers in respect of pricing power. The extent
of management efficiency aspects of the marketing mix in the price of food supplements
in Malaysia? Is it true that Malaysian consumers do not trust the power price as the level
of quality? This study will seek to answer such questions to delve into the issue price of
food supplements.
2.5.5 Place
Place refers to having the right product, in the right location, at the right time to be
purchased by consumers. This proper placement of products is done through middle
people called the channel of distribution. The channel of distribution is comprised of
interdependent manufacturers, wholesalers, and retailers. These groups are involved with
making a product or service available for use or consumption. Jones (2007) defines it as
any way in which consumers can get the products or services. Location factors also play
a role in influencing consumer purchasing decisions in buying a product. It is important
to ensure the functioning of product distribution channels to deliver products to target

36
consumers. Among the criteria for the location of choice among consumers and is close
to them go. Accordingly, the selection of appropriate locations need to employers
because a wrong decision can lead to failure in business. A good location can guarantee
the arrival and attract many users to change the shopping patterns and purchase
(Tjiptono, 2000).
Therefore, it is important for marketers to ensure the products made and distributed it
easy for users to get it. Put the product in the right place and at the right time is
necessary because when people come to the store to buy the product, the product can be
obtained without problems such as out of stock. If not, they certainly will be elsewhere
that supply the same product at the same time causing marketers to lose customers. The
marketing of products is important because generally people tend to business location to
location and facilities available and give satisfaction to the users. According to a study
made by Chung and Lee (2003), the position of the image or place is an important factor
in the marketing mix affects purchasing supplement products. The choice of location
was good to have a positive effect in raising supplement product. According Anntha Raj
(2012), an efficient distribution channel can help producers, manufacturers and users in
carrying out the tasks of distribution.

37
2.5.6 The Relationship between Place and Consumer Preferences
According to previous results (Patterson, 1999; Loureiro and Hine, 2001; Brown, 2003),
marketing locally grown products should stress quality, freshness and price
competitiveness. Although, Kotler and Armstrong (2006), define place or distribution as
a set of interdependent organizations involved in the process of making a product
available for use or consumption by consumers. Place strategy calls for effective
distribution of products among the marketing channels such as the wholesalers or
retailers (Berman, 1996). Results in the marketing of products is important because in
general the user will tend to business locations convenient and easily available and give
satisfaction to the users. According to a survey conducted by Chung and Lee (2003), the
position of the image or place is an important factor in the marketing mix which affects
the purchasing of products.
Place strategy in retail stores includes more than the question of how consumers access
the stores, it also includes the availability of products in such stores (Kotler, 2013). A
store can position or reposition a product by locating that product within a store. The
dimensions of place are channels, coverage, assortment, location, inventory, and
transport (Borden, 1984). Thus, the above studies imply that place or distribution
considerations play a major role in influencing consumer motives.
A marketer’s strategy for distributing products can influence consumers in several ways.
First, products that are convenient to buy in a variety of stores increase the chances of
consumers finding and buying them. When consumers are seeking low-involvement

38
products, they are unlikely to engage in an extensive search, so ready availability is
important. Second, products sold in exclusive outlets may be perceived by consumers as
having a higher quality. In fact, one of the ways marketers create brand equity - that is
favourable consumer perceptions of brands is by selling them in prestigious outlets.
Third, offering products by non store methods, such as on the internet or in catalogues,
can create the consumer perception that the products are innovative, exclusive, or
tailored for specific target markets.
Role in marketing management in place is very important aspect. Convenient location
and attractive grant will encourage consumer loyalty to a product or service. In line with
this, the industry is seen as the best platform for promoting local herbal products.
Synonymous with nature that exists in Malaysia and became a focal point for foreign
tourists enjoy the natural beauty and comfortable air. Furthermore, most of the plants
that live have properties that can be used to treat a variety of diseases such as cancer.
Malaysia has an interesting ecosystem and places like national parks, bird parks, etc.
Interesting locations is very convenient for foreign tourists enjoy the benefits of herbal
medicine approved MOH as well as conducting tourism activities. Previous studies have
found that the distribution factor is the basic thing that needs to be studied and given
attention to the operators of products to achieve customer loyalty. This is because, the
distribution is the last thing to get the product and the determination to make a repeat
user of the product purchase.

39
2.5.7 Promotion
Promotion is a communication process that takes place between a business and its
various publics. Publics are those individuals and organizations that have an interest in
what the business produces and offers for sale. In order to be effective, businesses need
to plan promotional activities with the communication process in mind. The elements of
the communication process are: sender, encoding, message, media, decoding, receiver,
feedback, and noise.
Promotion is the element in the marketing mix of organizations that serve to inform,
persuade and remind the market of the product in the hope of influencing the feelings,
beliefs and behaviour of consumers (Stanton, Etzel and Walker, 2007). The promotional
activities include advertising, sales promotion, public relations, direct marketing and
word of mouth (word-of-mouth). Through the campaign, marketers can attract the
attention of consumers and give them information about products to enhance consumer
buying interest. Promotion is important in sales as a way to reach consumers with
information about products. It is also an alternative to bring awareness to the users of the
existence of a product. When the product is known, is increasing consumer demand for
products and increase product sales. Moreover, promotion normally leads to significant
changes in sales of the brand being promoted.

40
2.5.8 The Relationship between Promotion and Consumer Preferences
Advertising, sales promotions, personal selling and publicity can influence what
consumers think about products, what emotions they experience in purchasing and using
them, and what behaviours they perform, including shopping in particular stores and
purchasing specific brands. Promotions such as price discounts and buy one get one free
are effective promotional tools for encouraging consumers to buy more (Shi, Ka-Man
and Gerald, 2005). In fact, with extensive advertising to change perception and
encourage them to try the product. In response to consumer advertising can be
influenced by several factors such as charging ads, ads influence something with taste,
culture, and people's emotions (Simamora, 2001).
Hung, L. H (2005) recommends that plans for promotions should be top-down strategy
built plans with tactical bottom-up purchase analysis and that they should be monitored
frequently. Moreover, consumer get so much information from marketers and
communication is essential to formulate a seller offers a consistent message about their
products. Marketing communications play an important role in informing consumers
about products and services that are running, including where they can buy and establish
a good image and perception. Related promotional laughing stock prices have affected
consumer behaviour in retail. According to Grunert , Wills and Celemin (2010) a number
of studies have been conducted showing that the pricing information is essential for
consumers to make a purchase decision. The effectiveness of product advertising in
television or social media plays an important role to popularize the products sold.

41
In terms of advertising spend, the selection of creative and effective replenishment is
important. The ads should be removed according to the pattern that is being experienced
by the country concerned. Malaysia among the countries that have a strong influence on
celebrities. It turns out that this is true when the most famous products using celebrities
as ambassadors business. The use of celebrities (public figure) in a variety of advertising,
especially for new products, is one of the effective marketing strategies to gain or
maintain market (Mc Crackern 1989).
By definition, a celebrity is a character (actor, entertainer or athlete) were known to the
public because of his achievements in different fields of various products (Shimp, 2003).
One creative way to advertise is to use endorser. Celebrity endorsers are figures of
modern marketing. Celebrity endorsement is one of the most popular methods of
promotion in the world, using celebrities are beautiful, interesting, and demand by the
public so that products promoted in the popular and famous (Noyer C. and Dimajo.S.
(2015) Nevertheless, the rules should have been interesting and what is most important
is the management of the campaign in terms of consumer loyalty to a product. Since
herbal products are not something to be sought after by the public wisdom in managing
the campaign is very important.
Advertising emphasis should be continually in a long period with according to the
situation at the time. In this context, the notion that herbal products are not able for rival
other types of businesses in the promotional aspect is not fair. Herbalife is a company
known around the world conducting business based health products. What is interesting
in Herbalife is a way to run a campaign using "spokeperson". Sponsorships to athletes

42
who star has raised the Herbalife brand on par with other goods brands such as Nike and
Disney. Way these companies do not emphasize the product but stressed the logo or
name of the product (Herbalife Annual Report, 2015). In line with this, the important
thing in product promotion is effective promotion management.
So far, companies from Malaysia herb has not recognized internationally. Therefore,
management techniques and promotion of creative and innovative so that consumer
loyalty to local herbal product can be produced. Things important in producing effective
promotion is a consistent increase in trade and germination good idea of the company
itself to promote the company's brand brought. For example, Herbalife company also
emphasizes training for its distributors in promoting the products of Herbalife products
through media advertising techniques (Herbalife Annual Report, 2015).
The researchers concluded that the promotion of local herbal products have a
relationship with a customer loyalty Malaysia. So in this study, the researchers will
unravel all the items under promotion factors such as personal selling, sales promotion,
public relations and advertising aspects other than the product itself.

43
2.6 Conclusion
In this chapter, the relevant literature review has shown even it helps in the formation
and development of the concept of an authentic framework through a survey instrument.
Moreover, this study help in the framing work of this to implement he strength and a
better understanding of research conducted. The framework of this study and research
hypothesis will be discussed in the next chapter.

44
CHAPTER 3
METHODOLOGY
3.1 Introduction
Methodology is the one of the techniques used to conduct a research. There are two
types of research methodology that are the quantitative and qualitative method. This
research will use the quantitative method. This research method will gather information
by using the numerical analysis. This chapter highlights how the research problem was
explored, how the participants were selected and the procedure followed to gather the
data. The chapter concludes with time frame the completeness of the study.
3.2 The Theoretical Framework
The theoretical framework used to compile systematically related variables and theories
used by researchers in drawing a theoretical framework adapted from previous studies
that Kotler (1997) to draw up theories that are used to measure the relationship between
the effects of the marketing mix element towards consumer preference in buying
supplements.
According to Kotler (1997) marketing management is described as the framework of the
implementation of ongoing and covers the marketing mix 4P which is a process of
planning and implementation of the concept, pricing, promotion and distribution of

45
ideas, goods and services by an organization to consumers in order to produce the
measure can satisfy consumers and meet the goals of the organization. Thus, the
researchers discovered that the management of the marketing mix 4P efficiently can
impact achievement in the generic industry of health for the better in future.
In Chapter 2 mentioned the literature review on dependent variable and independent
variable.
Figure 3.1 :
Research Framework
Independent Variable (Marketing Mix Elements) Dependent Variable
Product
Price
Place
Promotion
Consumer
Preference

46
3.3 Hypothesis
In this study, the researcher would like to study the relationship between independent
variable and dependent variable.
H1: There is significant relationship between product and consumer preferences
towards supplement product among Universiti Utara Malaysia students.
H2: There is significant relationship between price and consumer preferences towards
supplement product among Universiti Utara Malaysia students.
H3: There is significant relationship between place and consumer preferences
towards supplement product among Universiti Utara Malaysia students.
H4: There is significant relationship between promotion and consumer preferences
towards supplement product among Universiti Utara Malaysia students
3.4 Research Design
A research design can be referring to the overall approach that researcher chooses to
combine the different components of the study in a logical and coherent methods and
procedures for collecting and examining the information. The design is to confirm that
all information gathered is applicable for solving the research problem. According to
Sekaran (2007), research design will examine six basic aspects of research design.
This section comprises successor explanation of methodology chosen for study based on
the Gillham (2000) states that one of the strategies the researchers is a case study design
that can be positivist or interpretive in nature but also depends on the method of data

47
collection and analysis methods. As a case study, the researchers did not pay attention
and focus to explore certain issues. There are two designs data collected are used
depending on the case study, namely through experiments and the design is not
experimental. For example, the design of experimental studies conducted by Wagner &
Fard (2009) is to study the factors that affect the education of students chose to perform
with higher experimental research.
In addition, problems exist in the controller to create the replication when it comes to
experimentation. A study in other words the design is not an experiment in which he
helped the researchers to get information and details about the practice, condition or
opinions at a point in time distributing questionnaires or personal interviews. In order to
carry out this approach, the selection of some very important things such as the area to
be inspected, the variables and their size before the data collection is performed. The
issue of data instability can occur when using approach and leads to reduce the validity
of the findings (Burns & Grove, 2007).
The question can be answered in this study using information based on the study design.
In order to gain a deep understanding of the influences of variable such as in research
objective and quantitative research. The researchers chose to use quantitative descriptive
through it only describes what is happening in the data. It also helps researchers to
describe the importance of the characteristics of variables according to the situation. Due
to a limited number, by previous research on this field in Malaysia, researchers using
exploratory approach to study the effect of the marketing mix on supplement product
among the students of the university.

48
In addition, it is a suitable method to understand and predict this topic and relationships
between variables. Thus, some theoretical research and exploration framework or model
is very important to understand and predict relationships between variables (Fletcher
2004; Zepke & Leach, 2005). Moreover, Sekaran & Bougie (2013) states that the
research design is an action plan for collecting, measuring and analyzing data on the
question of a study released in this investigation.
The design of this study was made after researchers have identified variables within the
framework of the theory. In this study, the researchers decided to use a descriptive study
in which the aim of this descriptive study is to collect data that describes the
characteristics of the individual, event or situation. The study was carried out to get a
clear understanding of the impact of the marketing mix of supplements to students.
3.5 Sampling Technique
Sample refers to the subset of population which is part of members from a population.
Sampling method can be referred as a technique or by process that analyse the
characteristics of the identified population which by selecting a sufficient number of the
right elements from the population. Sekaran & Bougie (2010) mention that there are two
categories of sampling which are probability and non probability sampling. Probability
sampling was adopted when elements in the population have a known chance of being
chosen as subjects in the sample. Then, the researcher can use sample that is obtained
randomly to achieve this probability, and this sampling has least bias and offer more
general. Probability sampling designs can be divided into four different types of

49
sampling which are (1) Simple random sampling, (2) Cluster random sampling, (3)
Stratified random sampling and (4) Systematic sampling, (5) Proportionate stratified
random sampling, (6) Disproportionate stratified random sampling, (7) Double sampling
(Sekaran, 2003). According to this research, the researcher has been decided students in
Universiti Utara Malaysia were chosen to participate in this study.
3.5.1 Sampling Procedure
To answer the research questions through data collection and subsequence analysis,
survey method is powerful and useful in finding the answers. If the population is not
correctly targeted, they can do more harm than good in the study. Besides that, the
survey would be in vain if data are not collected from the right people that can provide
the correct answer to solve the problem.
3.5.2 Sampling Size
Based on Krejcie & Morgan (1970) table to determine the sample size, if the size of
population 27,945 students then the sample size will be 379 students. The sample sizes
for this study will focus on to the students in UUM Sintok. In this study, the population
has been determined in which students at UUM and the sample size is 400 respondents.
Of the 400 respondents, a total of three hundred and ninety-seven randomly selected to
answer a questionnaire about this study. The respondents were selected through the class
schedule issued obtained from Student Affairs and Academic Affairs UUM and they are
selected based on the time of learning for some time has been set. All selected

50
respondents were given a period of thirty (30) minutes to complete this questionnaire.
Meanwhile, of the 400 questionnaires distributed, only 397 were returned and 3 were
incomplete and did not respond according to the required specifications.
Table 3.1
Sample Size
Population size (N)
Sample Size (S)
10,000
370
15,000 375
20,000 377
30,000 379
40,000 380
Source: Krejcie & Morgan (1970)
3.5.3 Sampling Method
The sampling technique used in this study is probability sampling technique. This is
because the elements in the population have any probabilities to be chosen as sample
subject. Under the probability sampling technique, the sampling design chosen is Simple
Random Sampling since every element in the population has equal chances to be
selected as a subject.

51
3.6 Target Population.
This research has been conducted in a form of research case due to the research focused
only on one population in institution of higher learning. Population basically refer to the
total of collection on elements or cases which can be comparable and population include
group of people, or goods. Identifying the target population that researcher wishes to
investigate was one of the process of sampling (Sekaran,2005). Moreover, identifying
the correct population very important to prevent invalid data and limit generalization of
the finding of the study. The researcher has been chosen Universiti Utara Malaysia,
Sintok, Kedah as a research venue. This venue has been chosen for this study because it
is easy for researcher to cooperate with the students in order to get the data.
3.7 Questionnaire Design
This study will use the questionnaire as a medium to obtain the data needed. Data for
this study is collected through a survey questionnaire that was distributed to the students
in UUM Sintok. A survey questionnaire is a set of written and given to the respondent in
which it allows respondents to record their answers. In fact, this survey is an efficient
data collection tool when used in descriptive studies or research description (Sekaran &
Bougie, 2013). In addition, questionnaires typically used to save time and lower costs.
The main reason for the design of the questionnaire used for collect a large amount of
quantitative data.

52
In this study, a questionnaire was designed to investigate the impact of marketing mix on
the consumer preferences of supplement product among students. Respondents were
asking to rate as their level of agreement on a five–point Likert scale, where 1 represents
"strongly disagree" followed by "disagree", "neither agree nor disagree", "agree", and 5
for "strongly agree" as indicate in Table 3.2 below. This scale is used because it is
suitable for measuring the magnitude of individual preferences (Sekaran, 2003). The
questionnaire used in this study is attached in Appendix A.
Source: Zikmund et al (2010)
The measurement of the variable used in this study was adapted from relevant previous
literature with essential changes. The questions have been provided to the respondents in
bilingual which is English and Malay. Table 3.2 shows the distribution of variables and
measurement of the past research have been used in this study.
There are three sections in this questionnaire. In the first part, the respondents were
asked about their common background such as gender, age, race, marital status,
educational background, and monthly income. Meanwhile, part two and part three, the
respondents were asked about questions related to the dependent and independent
variables which have been adapted from some previous researchers. Table 3.3 below
shows a summary of which were asked in the questionnaire that was used in this study.
Table 3.2
Rating Scale
Strongly
Disagree
Disagree
Neutral
Agree
Strongly
Agree
1
2
3
4
5

53
Table 3.3
Distribution of Variables and Measurement.
Variable No. Items Section I
Gender 1 Item 1
Age 1 Item 2
Race 1 Item 3
Marital Status 1 Item 4
Education Level 1 Item 5
Monthly Income 1 Item 6
There are three sections in the questionnaire, consisting of Section I: Demographic
Segmentation, Section II: Consumer Preferences, Section III: Marketing Mix (Product,
Price, Place and Promotion)
Variable
Total no of items
Scales
Section II & III
Sources
Dependent
Consumer preference
7
Likert Scales
1-5
Anantha,2012,
Doroodgar, Nazari &
Emami,2012;
Akgam, 2013
Independent
(Marketing Mix)
Product 9 Likert Scales
1-5
Sudarin. A ,2008
Price 7 Likert Scales
1-5
Sudarin. A ,2008;
Place 9 Likert Scales
1-5
Sudarin. A ,2008
Promotion 8 Likert Scales
1-5
Sudarin. A ,2008
Total 40

54
3.7.1 Demographic Segmentation
In this section consists of five question and will asking about the respondents‟
demographic data such as their gender, age, race, marital status, education level and
monthly income.
3.7.2 Consumer Preferences
In this research, the item used for dependent variable were adopted from Anantha
(2012), Doroodgar, Nazari & Emami,2012; Akgam, 2013. The questionnaire consists of
7 items to access the understanding of the respondents about the criteria preferences
against supplement products. The researcher used the Likert scales for respondents to
rate the measurement item with 1 = strongly disagree and 5 = strongly agree.
55
Table 3.4
Measurement for Consumer Preferences
Items
1) Quality is one of the factors that influence my purchasing decisions on
supplement products.
2) Brand products into my concerns when I buy supplement products.
3) I should always buy supplement products made from Malaysia compared to
imported products
4) Supplement products sold in Malaysia is the best.
5) I will take the time to look at the label to find out about supplement products
6) I would recommend to others to buy supplement products.
7) My lifestyle choices will affect my purchase of supplement products
Source: Anantha, 2012, Doroodgar, Nazari & Emami, 2012; Akgam, 2013
3.7.3 Marketing Mix (Product).
The measurement for variable product was derived from Sudarin.A (2008); The
questionnaire consists of 9 items to identify what kind of product that students consume
to purchase against supplement products. The researcher used the Likert scales for
respondents to rate the measurement item with 1 = strongly disagree and 5 = strongly
agree.

56
Table 3.5
Marketing Mix (Product)
Items
1) I feel supplements are effective in solving health problems that I face.
2) I feel there are side effect when using local supplement products.
3) All products are supplement s that I've seen have the approval of the Ministry of
Health (MOH).
4) I know that the local supplement products have a wide range of output.
5) A supplement that I use has a well known brand.
6) I often observe supplements are recommended on packaging product.
7) Supplement packaging of products is satisfactory
8) My priorities in selecting quality health supplement products that I use.
9) I believe supplements are guaranteed effectiveness.
Source: Sudarin. A ,2008
3.7.4 Marketing Mix (Price).
The measurement for variable product was derived from Sudarin.A (2008) ;The
questionnaire consists of 7 items to identify the price that students consume to purchase
against supplement products. The researcher used the Likert scales for respondents to
rate the measurement item with 1 = strongly disagree and 5 = strongly agree.

57
Table 3.6
Marketing Mix (Price)
Items
1) I found the supplement product price are expensive
2) I feel the price is reasonable.
3) I found the price supplements are consistent last year to this year.
4) Supplement product prices are compatible with satisfaction that I got.
5) Dealer supplements offer discounts at certain seasons.
6) I do not feel the price as a burden to me to continue to use supplements.
7) To me, the price supplement product is cheaper compared with the cost of others
supplement products from abroad.
Source: Sudarin. A ,2008
3.7.5 Marketing Mix (Place)
The measurement for variable product was derived from Sudarin.A (2008); The
questionnaire consists of 7 items to investigate the place or location that students
consume to purchase against supplement products. The researcher used the Likert scales
for respondents to rate the measurement item with 1 = strongly disagree and 5 = strongly
agree.

58
Table 3.6
Marketing Mix (Place)
Items
1) I'm easy to buy supplement products in any premises sales.
2) I easily get in touch with distributors to supply supplement products
3) Distribution of supplement products that I use provides after-sales service
quickly.
4) I'm easy to retrieve local supplement products that have been used up.
5) The image store supplement products that often I visit are interesting.
6) I thought the location of the purchase of supplement products are suitable
7) I get that supplement products are sold to foreigner
8) Purchase location factors influenced me to buy supplement products.
Source: Sudarin. A ,2008
3.7.6 Marketing Mix (Promotion)
The measurement for variable product was derived from Sudarin.A (2008). The
questionnaire consists of 8 items to identify the promotion give to students and they
consume to purchase against supplement products. The researcher used the Likert scales
for respondents to rate the measurement item with 1 = strongly disagree and 5 = strongly
agree.

59
Table 3.7
Marketing Mix (Promotion)
Items
1) Medium advertising through print media influence me to use supplements.
2) Medium advertising through electronic media influenced me to use supplements.
3) I feel the lack of advertising methods lead to supplement products lukewarm.
4) I am interested in advertising supplements televised.
5) I am interested in direct sales promotion technique by the salesman supplements.
6) I found that most product advertising supplement is intended to affect the user
than the benefit of consumers.
7) I feel the direct selling technique gave me a clear understanding of the
supplement products.
8) I once saw a supplement product sales promotion through social sites.
9) I have recommended any supplements to others to try.
Source: Sudarin. A ,2008

60
3.8 Data Collection Procedures
In this study, the data is collected through two sources which are primary and secondary
data.
3.8.1 Primary Data
The primary data will be collected through structured questionnaireand it would be
collected through personally administered questionnaire because this is the best way to
get the full response from respondents in a short period of time. It also helps the
respondents if they have any doubtful question might be clarified on the spot. The
primary data of this study will be gathered through 400 sets of questionnaires. The
questionnaire will be distributed according to the number of students in UUM. This
questionnaire contains structured or closed-ended question that is a rating scale or Likert
Scale to provide answers for organization.
3.8.2 Secondary Data
This study will use two types of research data, which are internal and external sources.
The data available outside the organization which comes from one main resource which
is from the library is the external secondary data. For this study the research will use the
data from UUM’s library, internet journals, articles, online publications and internal
data’s that are saved by the organization such as the background of the university.
3.9 Data Analysis Technique

61
The collected data will be analysed by using IBM Statistical (SPSS) version 22. In this
study, the reliability of the test will be used to determine the value Crobach Alpha for
each variable used. In addition, data were analyzed using several statistical techniques
such as descriptive statistics which describe the frequency, mean, median, mode,
standard deviation and variance. While the other is a technique whereby the frequency
statistics about the reliability of data, correlation and regression. Additionally, SPSS can
also help researchers to analyze more accurately and can interpret the data from the
questionnaires were made.
3.10 Pilot Study
A pilot study can be referring to a small scale scientific research that gathers data from
respondent similar to the respondent that will be used in the actual study. The aim of
carrying out the pilot study is to make sure whether the respondents understand with the
items in the instrument. By performing a pilot study, the reliability of the measuring
tools and its acceptability of the study were examined. So that, the potential problems
could be recognized and classify before begin the actual study. The procedure of the
pilot study is necessary before the process of collecting the actual data. The detail
gathered was used to improve the instruments or method used where appropriate.
The pilot study was conducted based on 30 respondents who is the students in UUM 11th
September until 21th
September 2016. The researcher chooses the student at UUM
because to know their preferences towards supplement product based on marketing mix

62
elements. The results of the pilot study in Table 3.8 will help the researcher in the
modified and elimination the questions that are considered to be unclear to the
participants. Essentially, to ensure that the questionnaire is fully understood by the
respondents the alterations and improvement will be done on the questionnaire.
Table 3.8
The Cronbach Alpha for Pilot Test.
Variables Pilot Test (n=30)
Section II:
Consumer Preferences
0. 578
Section III: Marketing Mix
Product
0.759
Price 0. 640
Place
Promotion
0. 904
0. 700

63
3.11 Reliability Test
The reliability is a test of how reliably a measuring instrument measures whatever
concept it is measuring. The reliability of the questionnaire has been verified by using
Cronbach's Alpha or called Alpha Coefficient to display the internal dependability of the
questionnaire. Sekaran (2009) state that the reliability of the questionnaire is better if the
value of reliability coefficient closer to 1.00. Commonly, the acceptable alpha
coefficient should be more than 0.7 and it is still acceptable if the value of Cronbach
Alpha of 0.6 but is poor.
Table 3.9
Explanation of Cronbach Alpha (α)
Cronbach Alpha (α ) Explanation
<0.6 Weak
0.6 to <0.7 Medium
0.7 to <0.8 Good
0.8 to <0.9 Very Good
>0.9 Excellent
Source: Hair et al., (2007)

64
3.12 Validity Test
Validity test is a proof that the technique, process or instrument used to measure a
concept does really measure the intended concept (Sekaran, 2009). Validity test help to
recognize whether the variables studied in this research are measurable and valid. In this
study, the researcher performed face validity and congruent (construct) validity. The
result obtained from congruent validity test will show how well the use of the measure
fit the theories around which the test is designed. For congruent validity, the researcher
will depend on the results of factor analysis because congruent validity is performed to
identify the discriminate validity and the convergence validity. The relationship between
two variables which are the direction of the relationship and its magnitude. The
relationship is statistically significant if the value of r closer to 1.00 (Muchinsky, 1993).
3.13 Factor Analysis
By Zikmund & Partners (2013), factor analysis is a statistical technique that can identify
a number of factors that reduced the number of major factors of the variables measured.
The purpose of the analysis is to summarize the information in a large number of
variables to a smaller number of variables. Normally, the information obtained from the
variables is very large and spacious. In addition, factor analysis can also help in easing
the great information on factors which could translate into a smaller and more
meaningful data to achieve the objectives. However, in the factor analysis, factors
determined by the mathematical model while the only variant with only analyzed
(Tabachnich & Fidell, 2013). In addition, according Tabachinich & Fidell (2013), Value

65
Index Kaiser-Meyer-Olkin (KMO) is between 0 and 1, where 0.6 is the minimum value
of the factor analysis is good. While for the Bartless's Test of Sphericity must be
significant or significant (sig.) (P <0.05) for analysis and the factors considered
appropriate.
Table 3.10
KMO value and Variance Level
KMO Value Degree of Common Variance
0.90 to 1.00 Amazing
0.80 to 0.89 Excellent
0.70 to 0.79 Moderate
0.60 to 0.69 Medium
0.50 to 0.59 Not so good
0.00 to 0.49 No factor
Source: Tabachinich dan Fidell (2013)

66
3.14 Data Screening
Data screening is the process of ensuring the data is reliable, usable, and valid for
testing. Data screening process will focus on Missing value, Outlier Test and Normality
test.
3.14.1 Missing Value
Missing value is a generally step in before analyze the collected data. Where researcher
consider as a extreme part before data collect by researcher be analyze to identify, since
the data is often riddled with mistakes during the data entry errors which completely
affect the outcome of the analysis results (Hair, Anderson, Babin, & Black, 2010;
Pallant, 2013). Before tasting each hypothesis, each variables were tested to identify
missing data values and data entry.
Missing data are knows either casese valid values of one variables or more are
incorrectly entered or are not available for data analysis (Hair et al., 2007). Generally,
lack to understanding questionnaire questions, uninterested to answer or maybe
oversight of some items are issues that must be pointed into consideration because it will
impact on the result in outcome.

67
3.14.2 Multivariate Outliers Test
Multivariate Outliers Test can be done to test the extreme or unusual values on a single
variable or a combination variable (Meyers, et. al, 2006). To test the multivariate
outliers, the researcher evaluates by using Mahalanobis distance values.
3.14.3 Normality Test
Normality test is referring to the distribution of the data for the variables. Function of the
normality test is used to identify whether a data is well-modelled by a normal
distribution or not, or to analyse how probable an original random variable is to be
normally distributed. The researcher will use histogram test to check the normality. If
the histogram looks like bell shape, the data is normal.
3.15 Inferential Analysis
This section will discuss the results of data analysis using inferences analysis. The
inferential analysis is to test hypotheses is accepted or rejected in this study. In the
inferences analysis will conducted the T-test, ANOVA-one-way, Correlation Pearson
analysis and Multiple Regression analysis.

68
3.15.1 Pearson’s Correlation Analysis
To examine the relationship between independent and dependent variables understudied
the Pearson's correlation analysis will be done. Pearson correlation coefficient is used to
illustrate the degree of linear relationship between independent and dependent variables.
The symbol of a correlation coefficient is "r" and its range is from -1.00 to +1.00.
Table 3.11
Strength Relationship for Correlation
R Value
Strength Relationship
(-1.0 to 0.5) or (0.5 to 1.0)
Strong
(-0.5 To -0.3) or (0.3 to 0.5)
Medium
(-0.3 To -0.1) or (0.1 to 0.3)
Weak
(-0.1 To 0.1)
Very Weak/ No Relationship
Source: Choudhary (2009) & Pallant (2013)

69
3.15.2 Multiple Regression Analysis
In this study, standard multiple regression will be used to determine the effect on the
dependent variable and independent variables. In addition, this technique can also prove
that a strong element will affect consumer attitudes towards mobile banking. Multiple
linear regression equation was developed based on the following formula:
Multiple Regression: Y= a + b1X1 + b2X2 + b3X3 + b4X4
Where:
Y = Consumer Preferences towards supplement products
X = Independent variables used to predict Y
a = Shortcuts
b = slope
3.16 Conclusion
This chapter has designated the progress of the research model for this study. The
research framework and research hypotheses have been explained following the research
methodology and the research design. Different statistical analysis will be used such as
data screening, descriptive analysis and inferential analysis to examine the relationship
between Dependent variables and Independent variables.

70
CHAPTER 4
FINDINGS AND DISCUSSION
4.1 Introduction
This section will explain more about the study that was conducted. In this study, some of
the statistical methods were used to analyze the data. The statistical methods used were
descriptive statistics and statistical inference.
Descriptive statistics including frequency, mean, mod, median, standard deviation and
variance. Meanwhile, inferential statistics also include reliability, ANOVA, correlation
and regression. A total of 397 questionnaires were received from 400 questionnaires that
were distributed to the respondents. The statistical analysis using SPSS version 22 and
the discussion of this study is based on the objectives and hypotheses that have been
identified in this study that examines the impact of consumer preferences towards
supplement products through marketing factors.
4.2 Rate of Reaction of Respondents
A total of 400 questionnaires were distributed to students at Universiti Utara Malaysia
(UUM) and 397 questionnaires were returned in the response rate for this study was
99.2%. According to Sekaran & Bougie (2010), if the reaction is 30%, then it is
acceptable. Rate of reaction of respondents described in Table 4.1. An example of the
questionnaire in Appendix A.

71
Table 4.1
Total Rate of Reaction of Respondents
Items Respondent
The number of questionnaires distributed 400
The number of questionnaires received 397
Complete the questionnaire 397
Questionnaire incomplete 3
Rate of reaction received 99.2%
4.3 Reliability Test
According Sekaran (2003) if the value of Cronbach's Alpha is 1.0 it is regarded as highly
desirable, while a value greater than 0.89 is considered good. Next, the value of 0.70, it
is acceptable and value less than 0.60 was considered weak. Reliability test results
between test pilot and the real test is shown in Table 4.2 below.

72
Table 4.2
Reliability Test result in Pilot Test and Real Test
Variable No. Item Cronbach’s Alpha
Pilot Test
N= 30
Real Test
N=397
Consumer Preferences
7
0.58
0.66
Marketing mix
Product
9
0.76
0.77
Price 7 0.64 0.63
Place 8 0.90 0.82
Promotion 9 0.70 0.80
These results reveal that the coefficient of reliability of the independent variables and the
dependent variable is 0.58 to 0.90 for pilot test while the real test is 0.66 to 0.82.
Therefore, measurement of the independent variables and the dependent variable in this
study is considered to be acceptable because it has reached the alpha value of 0.6 and
above (Bougie & Sekaran, 2013).
4.4 Screening Data
Data were reviewed to determine the accuracy of data entry, remote data and
characteristics of the distribution before running the main analysis. In this study, data
screening was conducted by examining the basic descriptive statistics and frequency
distribution to determine if there is missing data, outliers, normality and linearity.

73
Descriptive data results indicate that no data was found missing from the 397
questionnaires that were returned by respondents. However, all the cases that have
maintained the same average values and values not very different from the existing
distribution. In addition, the normality test is also carried out by using histograms,
skewness and kurtosis. For this study, the histogram is used to see normality in which he
showed the score is normal and data about the arches with all of the variables.
4.4.1 Missing Data
Based on regression analysis there being found no missing data. Therefore, all of the 397
respondents used in the subsequent data analysis.
4.4.2 Outliers Data
Multivariate Outliers test has to, the Mahalanobis Distance can be referred. The
Mahalanobis Distance was examined by Chi-Square distribution Table (X2) with degrees
of freedom equal to the number of independent variables. The study consisted of 4
variables and it is on the schedule for the Chi-Square critical value on the alpha value of
p <0.001 (Meyers et, 2006). Thus, according to the distribution schedule X2, where cases
with Mahalanobis Distance value equal to or greater than 19.104 can be considered as
Multivariate Outliers Data. For this study the value of the Mahalanobis Distance does
not exceed 19.104.

74
4.4.3 Normality Test
In this study, the histogram was used in which the normality test to show whether are
normally distributed or not distributed normally. Distribution of empirical data
(histogram) should be bell-shaped and resembles a normal distribution. Graph 4.1,
Graph 4.2, Graph 4.3, Graph 4.4 and Graph 4.5 below shows the histograms for all
variables used in this study. All histogram graph showing a form of a bell and a normal
distribution.
Graph 4.1 : Normality Test for Consumer Preferences

75
Graph 4.2: Histogram Normality Test for Marketing Mix (Product)
Graph 4.3: Histogram Normality Test for Marketing Mix (Price)

76
Graph 4.4: Histogram Normality Test for Marketing Mix (Promotion )
Graph 4.5: Histogram Normality Test for Marketing Mix (Place)
4.5 Factor Analysis
77
Factor analysis is to determine the factors of discrimination and concentration for items
clustered in certain dimensions. Before carrying out the analysis, test prerequisites must
be done to allow the process of factor analysis. These tests include the Kaiser- Meyer-
Olkin (KMO) and Barlett's Test of Sphericity. KMO test was conducted to measure the
ability of sampling whose value must be greater than 0.5 for a satisfactory analysis of
factors to continue further measurements. (Meyer et al, 2006).
In addition, to identify a number of fundamental factors, the researchers refer to
Eigenvalue and Eigenvalue cummulative. Discriminant factor involved in this study
must have Eigenvalue greater than or equal to 1 and cummulative Eigenvalue must be
more than or equal to 60%. To show the items that accumulate in certain factors, this
study uses 0.5 as the factor loading (Meyer et al, 2006) items score greater than or equal
to 0.5 will be collected in the same factor.
4.5.1 Analysis Consumer Preferences
Based on the analysis performed on the consumer preferences, KMO value was 0.612
and Bartlett's sig is a value of p = 0.000. KMO value is significant and can be forwarded
to factor analysis.

78
Table 4.3
KMO and Bartlett's test of Consumer Preferences
KMO and Bartlett's Test
Kaiser-Meyer-Olkin Measure of Sampling
Adequacy. .612
Bartlett's Test of
Sphericity
Approx. Chi-Square 467.103
Df 21
Sig. .000
Table 4.4
Eigenvalues and Cumulative Percentage Variance For Consumer Preferences
Component
Initial Eigenvalues Exraction Sums of Squared
Loadings
Total % of
Variance
Cumulative
%
Total % of
Variance
Cumulative
%
1 2.197 31.389 31.389 1.527 21.808 21.808
2 1.559 22.273 53.662 1.100 15.717 37.525
3 .989 14.127 67.790
4 .735 10.499 78.288
5 .627 8.960 87.248
6 .511 7.301 94.549
7 .382 5.451 100.00
Extraction Method: Principle Component Analysis

79
Table 4.5
Matrix Components of Consumer Preferences
Question ( Consumer Preferences ) Loading Factor
Q1) Quality is one of the factors that
influence my purchasing decisions
on supplement products
0.653
Q2) Brand products into my concerns
when I buy supplement products.
0.582
Q3) I should always buy supplement
products made from Malaysia
compared to imported products.
0.772
Q4) Supplement products sold in Malaysia
is the best.
0.656
Q5) I will take the time to look at the label
to find out about supplement products.
0.494
Q6) I would recommend to others to buy
supplement products.
0.465
Q7) My lifestyle choices will affect my
purchase of supplement products
0.494
The above table shows that all the 7 items can be used in the analysis. The results of the
analysis of the factors comprising the item Q1, Q2, Q3, Q4, Q5, Q6 and Q7 have Eigen
value is 2.197 with a cumulative value of 31. 389%.

80
4.5.2 Analysis Marketing Mix (Product)
Based on the analysis performed on the product, KMO value was 0.828 and Bartlett's sig
is a value of p = 0.000. KMO value is significant and can be forwarded to factor
analysis.
Table 4.6
KMO and Bartlett's test of Marketing Mix (Product)
KMO and Bartlett's Test
Kaiser-Meyer-Olkin Measure of Sampling
Adequacy. .828
Bartlett's Test of
Sphericity
Approx. Chi-Square 884.665
df 36
Sig. .000
Table 4.7
Eigenvalues and Cumulative Percentage Variance For Marketing Mix (Product)
Component
Initial Eigenvalues Exraction Sums of Squared
Loadings
Total % of
Variance
Cumulative
%
Total % of
Variance
Cumulative
%
1 3.459 38.428 38.428 2.899 32.211 32.211
2 1.251 13.898 52.326 .606 6.737 38.948
3 .847 9.407 61.733
4 .824 9.516 70.888
5 .654 7.269 78.157
6 .629 6.986 85.143
7 .531 5.897 91.039
8 .463 5.139 96.178
9 .344 3.822 100.000
Extraction Method: Principle Component Analysis
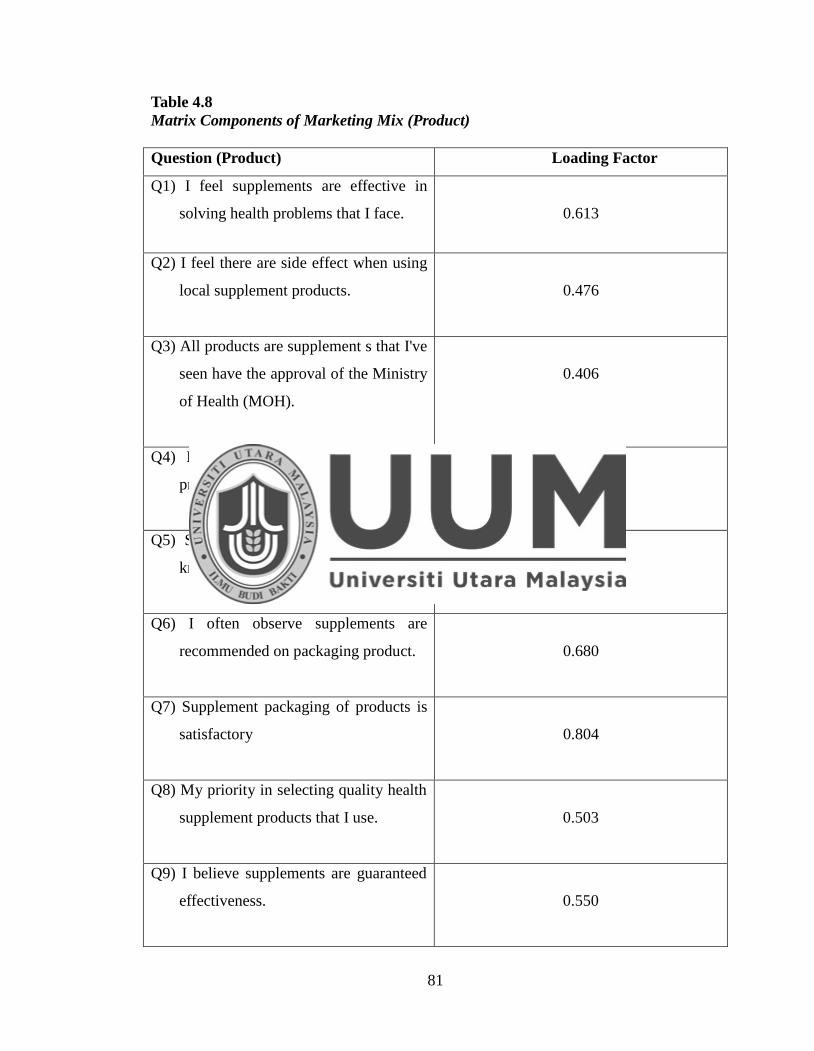
81
Table 4.8
Matrix Components of Marketing Mix (Product)
Question (Product) Loading Factor
Q1) I feel supplements are effective in
solving health problems that I face.
0.613
Q2) I feel there are side effect when using
local supplement products.
0.476
Q3) All products are supplement s that I've
seen have the approval of the Ministry
of Health (MOH).
0.406
Q4) I know that the local supplement
products have a wide range of output
0.563
Q5) Supplements that I use has a well
known brand.
0.577
Q6) I often observe supplements are
recommended on packaging product.
0.680
Q7) Supplement packaging of products is
satisfactory
0.804
Q8) My priority in selecting quality health
supplement products that I use.
0.503
Q9) I believe supplements are guaranteed
effectiveness.
0.550

82
The above table shows that all the 9 items can be used in the analysis. The results of the
analysis of the factors comprising the item Q1, Q2, Q3, Q4, Q5, Q6, Q7, Q8 and Q9
have Eigen value is 3.459 with a cumulative value of 38.428 %.
4.5.3 Analysis Marketing Mix ( Price)
Based on the analysis performed on the price , KMO value was 0.712 and Bartlett's sig
is a value of p = 0.000. KMO value is significant and can be forwarded to factor
analysis.
Table 4.9
KMO and Bartlett's test of Marketing Mix (Price)
KMO and Bartlett's Test
Kaiser-Meyer-Olkin Measure of Sampling
Adequacy. .712
Bartlett's Test of
Sphericity
Approx. Chi-Square 453.901
Df 21
Sig. .000

83
Table 4.10
Eigenvalues and Cumulative Percentage Variance For Marketing Mix (Price)
Component
Initial Eigenvalues Exraction Sums of Squared
Loadings
Total % of
Variance
Cumulative
%
Total % of
Variance
Cumulative
%
1 2.460 35.141 35.141 1.859 26.563 26.563
2 1.322 18.892 54.033 .686 9.799 36.362
3 .830 11.863 65.897
4 .794 11.350 77.246
5 .601 8.591 85.837
6 .537 7.674 93.512
7 .454 6.488 100.00
Extraction Method: Principle Component Analysis
Table 4.11
Matrix Components of Marketing Mix (Price)
Question (Price) Loading Factor
Q1) I found the price supplements are
expensive.
0.475
Q2) I feel the price is reasonable .
0.584
Q3) I found the price supplements is
consistent last year to this year.
0.545
Q4) Supplement product prices are
compatible with satisfaction that I
got.
0.641
Q5) Dealers supplements offer discounts
at certain seasons.
0.518

84
Q6) I do not feel the price as a burden to
me to continue to use supplements.
0.652
Q7) To me, the price supplement product
is cheaper compared with the cost of
others supplement products from
abroad.
0.412
The above table shows that all the 7 items can be used in the analysis. The results of the
analysis of the factors comprising the item Q1, Q2, Q3, Q4, Q5, Q6, and Q7, have Eigen
value is 2.460 with a cumulative value of 35.141 %.
4.5.4 Analysis Marketing Mix (Place)
Based on the analysis performed on the place distribution, KMO value was 0.829 and
Bartlett's sig is a value of p = 0.000. KMO value is significant and can be forwarded to
factor analysis.
Table 4.12
KMO and Bartlett's test of Marketing Mix (Place)
KMO and Bartlett's Test
Kaiser-Meyer-Olkin Measure of Sampling
Adequacy. .829
Bartlett's Test of
Sphericity
Approx. Chi-Square 1074.103
Df 28
Sig. .000

85
Table 4.13
Eigenvalues and Cumulative Percentage Variance For Marketing Mix (Place)
Component
Initial Eigenvalues Exraction Sums of Squared
Loadings
Total % of
Variance
Cumulative
%
Total % of
Variance
Cumulative
%
1 3.668 45.854 45.854 3.179 39.732 39.732
2 1.208 15.094 60.948 .653 47.893 47.893
3 .846 10.571 71.519
4 .585 7.308 78.827
5 .565 7.061 85.888
6 .432 5.394 91.281
7 .364 4.553 95.835
8 .333 4.165 100.000
Extraction Method: Principle Component Analysis
Table 4.14
Matrix Components of Marketing Mix (Place)
Question (Place) Loading Factor
Q1) I'm easy to buy supplement products
in any premises sales.
0.648
Q2) I easily get in touch with distributors
to supply supplement products.
0.725
Q3) Distribution of supplement products
that I use provides after-sales service
quickly.
0.539

86
Q4) I'm easy to retrieve local supplement
products that have been used up.
0.713
Q5) Image store supplement products that
often I visit is interesting.
0.601
Q6) I thought the location of the purchase
of supplement products are suitable.
0.762
Q7) I get that supplement products are sold
to foreigner
0.537
Q8) Purchase location factors influenced
me to buy supplement products.
0.451
The above table shows that all the 8 items can be used in the analysis. The results of the
analysis of the factors comprising the item Q1, Q2, Q3, Q4, Q5, Q6, Q7 and Q8 have
Eigen value is 3.668 with a cumulative value of 45.854 %.
4.5.5 Analysis Marketing Mix (Promotion)
Based on the analysis performed on the promotion, KMO value was 0.783 and Bartlett's
sig is a value of p = 0.000. KMO value is significant and can be forwarded to factor
analysis.

87
Table 4.15
KMO and Bartlett's test of Marketing Mix (Promotion)
KMO and Bartlett's Test
Kaiser-Meyer-Olkin Measure of Sampling
Adequacy. .783
Bartlett's Test of
Sphericity
Approx. Chi-Square 988.790
Df 36
Sig. .000
Table 4.16
Eigenvalues and Cumulative Percentage Variance For Marketing Mix (Promotion)
Component
Initial Eigenvalues Exraction Sums of Squared
Loadings
Total % of
Varian
ce
Cumulative
%
Total % of
Variance
Cumulative
%
1 3.531 39.234 39.234 2.990 33.222 3.222
2 1.213 13.481 52.715 .771 8.571 41.793
3 .930 10.334 63.049
4 .844 9.374 72.423
5 .727 8.075 80.498
6 .593 6.587 87.085
7 .460 5.107 92.191
8 .404 4.488 96.679
9 .299 3.321 100.000
Extraction Method: Principle Component Analysis

88
Table 4.17
Matrix Components of Marketing Mix (Promotion)
Question (Product) Loading Factor
Q1)Medium advertising through print
media influence me to use
supplements.
0.628
Q2) Medium advertising through
electronic media influenced me to use
supplements.
0.656
Q3) I feel the lack of advertising methods
lead to supplement products
lukewarm.
0.541
Q4) I am interested in advertising
supplements televised.
0.748
Q5) I am interested in direct sales
promotion technique by the salesman
supplements.
0.507
Q6) I found that most product advertising
supplement is intended to affect the
user than the benefit of consumers.
0.462
Q7) I feel the direct selling technique gave
me a clear understanding of the
supplement products.
0.487
Q8) I once saw a supplement product sales
promotion through social sites.
0.615
Q9) I have recommended any supplements
to others to try.
0.477

89
The above table shows that all the 9 items can be used in the analysis. The results of the
analysis of the factors comprising the item Q1, Q2, Q3, Q4, Q5, Q6, Q7, Q8 and Q9
have Eigen value is 3.531 with a cumulative value of 39.234 %.
4.6 Analysis Descriptive Statistics
Descriptive analysis is used to give an overview of the frequency and percentage of
respondents for demographic characteristics such as gender, race, age, marital status,
education level, monthly income.
4.6.1 Profile of the Respondents
Below tables shows the analysis of the respondents demographics finding which
conducted by researcher in order to understanding the profile of the respondents who
participated in this research.
Table 4.18
Gender of the Respondents
Variable Categories Frequencies Percent
Gender Male 115 29.0
Female 282 71.0
Total 397 100
In table 4.18 showed details on the gender of respondents who participated in this survey.
Based on first detail of demographic information part is male and female. Respondents
need to tick chosen answer about the most describing them self, (1) is for male

90
respondent and (2) is for female respondent. The results showed that female was the
majority of participant in this study which were 282 participants with 71.0 %. The
number of participant from male students was 115 participants and the percentage was
29.0%. The total number of student participated in this study as respondent was 397 in
frequency and 100% in percentage.
Table 4.19
Age of the Respondents
Variable Categories Frequencies Percent
Age <18-23 75 18.9
24-34 311 78.3
35-45 3 0.8
46> 8 2.0
Total 397 100.0
There are detail about age of respondents who participate in this survey. Table 4.19
showed that majority of the respondents age was 24-34 with frequency of 311 (78.3%).
Second highest of frequency were age of <18-23 respondents amount 75 with (18.9%),
followed by age 46> respondents with 8 (2.0%) and the least amount of frequency was 3
respondents which from 35-45 with (0.8%).

91
Table 4.20
Race of the Respondents
Variable Categories Frequencies Percent
Race Malay 287 72.3
Chinese 54 13.6
Indian 16 4.0
Others 40 10.1
Total 397 100.0
There are many races who participate in this survey. Table 4.20 showed that majority of
the respondents was Malay with frequency of 287 (72.3%). Second highest of frequency
were Chinese respondents amount 54 with (13.6%), followed by 40 respondents from
others race student with (10.1%) and the least amount of frequency was 16 respondents
which from Indian student with (4.0%). The total numbers of students participated in this
study as respondent was 397 in frequency and 100% in percentage.

92
Table 4.21
Marital Status of the Respondents
Variable Categories Frequencies Percent
Marital Status Single 306 77.1
Married 83 20.8
Divorced 8 2.0
Total 397 100.0
There are 3 types of categories in marital status in this survey. Table 4.21 showed that
majority of the respondents was single with frequency of 306 with (77.1%). Second
highest of frequency were from married respondents amount 83 with (20.8%), followed
by 8 respondents from divorced student with (2.0 %).

93
Table 4.22
Education of the Respondents
Variable Categories Frequencies Percent
Education Diploma 20 5.0
Degree 142 35.8
Master 224 56.4
Phd 11 2.8
Total 397 100.0
There are 4 types of categories in education in this survey. Table 4.22 showed that
majority of the respondents was Master with frequency of 224 with (56.4%). Second
highest of frequency were from Degree respondents amount 142 with (35.8%), followed
by 20 respondents from Diploma student with (5.0 %) and the least amount of frequency
was 11 respondents which from Phd students with (2.8 %). The total numbers of students
participated in this study as respondent was 397 in frequency and 100% in percentage.

94
Table 4.23
Monthly Income of the Respondents
Variable Categories Frequencies Percent
Monthly Income <RM 2000 235 59.2
RM 2000- RM 4000 39 9.8
>RM 4000 35 8.8
Others 88 22.2
Total 397 100.0
There are 4 types of categories in monthly income in this survey. Table 4.23 showed that
majority of the respondents who has income <RM 2000 with frequency of 235 with
(59.2%). Second highest of frequency were income it from Others respondents
frequency 88 with (22.2 %), followed by 39 respondents who has income RM 2000 to
RM 4000 with (9.8 %) and the least amount of frequency was 35 respondents which has
income >RM 4000 with (8.8 %). The total numbers of students participated in this study
as respondent was 397 in frequency and 100% in percentage.

95
4.7 Mean and Standard Deviation
In this study, the mean and standard deviation were used. According to Fahd and Hoon
(2009), the mean is the average value of the data set. The purpose min used in this study
was to measure the central tendency and is calculated by dividing the sum of all values
along with the number of values in the data set. While the standard deviation is a
measure of dispersion given by the positive square root of the variance. Where, consult
the squared deviations of each value from the mean value and the sum is divided
variance and squared positive decision (Gorard, 2005). According to Sekaran (2003), the
standard deviation is used to calculate the spread and dispersion. In order to examine the
relationship between the dependent and independent variables. Researchers have
analyzed using mean and standard deviation.
Table 4.24
Statistical Analysis Descriptive Variables
Variable Mean Standard Deviation
Consumer Preference 26.70406 3.28075
Product 34.8791 4.64557
Price 24.7456 3.47840
Place 29.0227 4.66851
Promotion 33.8816 4.88283
Table 4.22 shows the mean and standard deviation for the data dependent and
independent variables for this study. The mean value for each score for each question
submitted is between 24.7456 to 34.8791. The mean value of the lowest score is the

96
24.7456 of price under the independent variables while the highest mean score is
34.8791 of product . For promotion, and place recorded 33.8816 and 29.0227.
4.8 Statistical Analysis Inference
Inference statistical analysis is used to present the findings. Rules used for this analysis
is to use the test method Test Independent Sample T-Test, One -Way ANNOVA, Pearson
Correlation and regression analysis to test the hypotheses that have been formed. 2-
tailed significant level of two-way used to test the correlation is 0.05, 0.025 for
independent T- test sample and 0.05 for the test One- Way ANNOVA.
4.8.1 Pearson Correlation Analysis
The correlation analysis describes a relationship between the dependent variable and the
independent variable whether exist or not. The purpose of this test is to determine
whether the objectives are stated in chapter one can be reached. In addition, these tests
can prove the hypothesis that has been established in studies either had a significant
relationship (significant) with the consumer preferences.
According to Cohen (1988) as cited in Utah (2013), where r is 0.50 to 1.00, it shows the
value of r is strong and large. However, if the value of r is 0:30 until 00:49, it is
considered moderate. While if the value of r is 0.10 to 0.29, it shows the value of r weak
or small. The results of the test are shown in Table 4.9 below:

97
Table 4.25
Result of Pearson Correlation Analysis
Product
Price
Place
Promotion
Consumer
Preferences
Product
1
Price
.553**
1
Place
.559**
.613**
1
Promotion
.497**
.483**
.541**
1
Consumer
Preferences
.545**
.381**
.494**
.445**
1
**. Correlation is significant at the 0.01 level (2-tailed).
Based on the test results of correlation analysis as table 4.25 above, all the independent
variables price, place, and promotion demonstrate the value of r is less than 0.5 in which
the price of the variable r is 0.381 and the place is 0.494 while the promotion is 0.445.
These three independent variables has a moderate relationship with consumer
preferences. Meanwhile, with products with a r value of more than 0.5 which is 0.545,
which has a strong correlation with consumer preferences.

98
4.8.2 Multiple Regression Analysis
To test the effect of the relationship between independent variables and the dependent
variable, multiple regression analysis test (Multiple Regression Analysis) was used. The
results of multiple regression analysis can determine the strength of the relationship
between a independent variable which is more significant (significant) towards
consumer preferences. Table 4.26, Table 4.27 and Table 4.28 shows the results of
multiple regression analysis tests that have been carried out.
Table 4.26
Model Summary
Model Summary
Model R R Square Adjusted R Square
Std. Error of the
Estimate
1 .604a .365 .359 2.62677
Table 4.27
Regression Analysis
Model
Unstandardized
Coefficients
Standardized
Coefficients
t Sig. B Std. Error Beta
1 (Constant) 10.277 1.149 8.940 .000
Product .250 .037 .355 6.746 .000
Price -.031 .051 -.033 -.603 .547
Place .154 .038 .229 4.074 .000
Promotion .113 .035 .161 3.186 .002
Note: R2
=0.40; F= 56.433;Sig.= 0.00; **p<0.01 , p<0.05

99
The results of multiple regression analysis of Table 4.28 shows the product, price, place
and promotion of consumer preferences only affect as much as 36.5%. This value is
indicated by the variance of R2 (0.365) as factors that affect the independent variables on
consumer preferences. In summary score R2 by 63.5% representing other factors not
analyzed in this study.
Moreover, the overall results of the test results of multiple regression analysis showed
that not all independent variables have a relationship with the dependent variable,
namely the F = 56.433 (p = 0.000). The results of this test also found that there are only
three independent variables, namely dependent variable product (β = 0.355) and place (β
= 0.229) and promotions (β = 0.161) had a positive beta coefficient value. For the
dependent variable price rates beta coefficient indicates a negative value which is at β =
-0.033.
From the test results of multiple regression analysis, the independent variables for the
product (p = 0.000) and place (p = 0.000) and promotion (p = 0.002) showed a
significant relationship (significant) and the dependent variable as the three variable has
a value of p <0.01 and p <0.05. However, another independent variable, were the price
did not show any effect and influence on consumer preferences for value p> 0.05, were
0.547

100
4.9 Summary of Hypothesis Testing
Summary results of hypothesis testing described in Table 4.29 below.
Table 4.28
Summary of Hypothesis Testing
DESCRIPTION OF HYPOTHETICAL
RESULT
H1
There is significant relationship between product
and consumer preferences towards supplement
product among Universiti Utara Malaysia
students.
ACCEPTED
H2
There is significant relationship between price
and consumer preferences towards supplement
product among Universiti Utara Malaysia
students.
REJECTED
H3
There is significant relationship between place
and consumer preferences towards supplement
product among Universiti Utara Malaysia
students
ACCEPTED
H4
There is significant relationship between
promotion and consumer preferences towards
supplement product among Universiti Utara
Malaysia students
ACCEPTED

101
4.10 Conclusion
Chapter 4 describes the results of the analysis. Data were analyzed using SPSS version
22 and the whole process involves the analysis of the respondent, reliability analysis,
filter data, factor analysis, descriptive analysis, analysis, inference and hypothesis testing.
This chapter want to shows the relationship between the effects of consumer preferences
on supplement product among the students of the University that have a positive
relationship. Analysis in this chapter is to examine and determine the relationship
between the dependent variable with independent variables and hypotheses. The next
chapter will discuss the findings, recommendations and conclusions of the study results.

102
CHAPTER 5
DISCUSSION AND CONCLUSION
5.1 Introduction
Findings of this study were presents in previous chapter. This chapter will elaborate the
discussion and conclusion of the study. In this chapter will seek to summarize the outline
the key recommendation that is arrived based on the finding of this research. This
chapter will conclude with final conclusion on the overall study at the end.
5.2 Discussion of the findings
From this section initiated the discussion on the factors that have been studied 4P
marketing mix and the impact of consumer preferences among students as a source of
health in the use of supplements. In particular, the five objectives in this study, namely: -
1. Explain whether the relationship marketing mix give impact with consumer
preferences for supplement products.
2. Proving whether the product as a marketing element has a relationship with the
consumer preferences in making the product as a health supplement products.
3. Evaluate whether the factor of price marketing of products with a significant
supplement to consumer preferences.
4. To prove the suitability of the location or distribution channel had contact with the
consumer preferences in term to find the place to get the supplements.

103
5. Evaluate the effectiveness of the promotion factor has a relationship with the
consumer preferences in the supplement products.
5.3 Summary of Finding
5.3.1 There is a Relationship between Product with the Consumer Preferences to
use Supplements Product
For the production of a product is through the process of consideration by the
manufacturer stating the factors on diversity issues, product design, characteristics of the
product, the brand products, product size, packaging, service and warranty upon
purchase of a product. Employers should emphasize the following key features in
providing the best health products and foster loyalty consumers to choose to buy goods.
The results of this study prove consumer agree on aspects of the product but the average
level. The relationship between the product and the consumer preferences of the product
is significantly positive. This is because, in terms of acceptance of the product itself, the
answer is uncertain election score is the second public after agreeing with the differences
were not so significant. The findings support the study Ibrahim Jantan (2006) which
mentions the problem of the supply of supplement product. In this study found the
product that includes the diversity of products, product design, product features, product
brands, product size, packaging, service and warranty upon purchase of a product has a
problem and affect the consumer preferences as one of the important things in their lives.

104
5.3.2 There is a Relationship between Price with the Consumer Preferences to use
Supplements Product
In fact, according to Armstrong and Kotler (2000) states that among the items found in
the price is the list price, discounts, allowances, payment periods and credit conditions.
There is no doubt that if the price factor can be managed properly will give you
satisfaction and build customer loyalty to make a choice in which to select the product
worth the price offered. Price involves the ability of the consumer to acquire goods or to
attract consumers to buy goods in a long time.
Results of this study prove the consumer not agrees with aspects of marketing
management in the price. However, the relationship between the price and consumer
preferences not significantly. Most respondents were in a state of uncertainty on all
matters concerned with price factors such as price lists, discounts, allowances, payment
periods and credit conditions on supplement products. In this case has shown that
consumers see the product in use supplement product, but at the same time, the price is
also a concern for the continued to make a purchase of the product. Moreover,
consumers generally make their choices considering the product information, product
attributes and evaluating the consequences of using the product. Consumers consider
health as an important parameter and then they buy the product. For some reason, when
buying the supplement product, the content of chemicals in the product are not known
and the risk to consumers. But that does not obtain approval from the Ministry of Health
(MOH) has sold widely. This makes the concern for consumers and lead to anxiety to
buy the supplement product. Objective price is the actual price of the product while

105
perceive price is individual believe of the price in relation to the quality of the product
(Donald R., Lichtenstein & Scot B., 1989) .Consumer perception with respect to price is
different and has a positive and a negative influence on the buying behavior. The results
of this study support the research done by Iwan Kurniawan (2008) who found a
customer preferences depends on the price.
5.3.3 There is a Relationship between Place or Distribution with the Consumer
Preferences to use Supplements Product
According to Kotler and Armstrong (2000) refers to the distribution activities create,
maintain, or change attitudes or behavior of customers in an area of the product to be
marketed. There are several factors that must be considered in making the choice of such
coverage, channel, classification, location, logistics, transport and inventory (Svandson
and Gronhoug, 2011). According to Primo and Amundson (2002) manufacturers should
consider the various factors before deciding the selection of a place. From these
statements clearly indicate that the distribution factor made a significant impact on a
product being marketed.
The results of this study show that consumers agree with aspects of marketing
management in distribution but in the medium level. However, the relationship between
the distribution of consumer preferences is significantly positive. This illustrates that the
management of the distribution is not at a good level while the important factors in
influencing customer preferences . In this study most evident when the distribution

106
factors influencing consumer preferences than to factors other marketing. The results of
this study support the study by Chung and Lee (2003), the position of the image or place
is an important factor in the marketing mix which affects the consumer purchases of
products.
5.3.4 There is a Relationship between Promotion with the Consumer Preferences to
use Supplements Product
The concept of marketing mix 4P underlined that under the promotion factor containing
advertising, personal selling, sales promotion, and public relations (Armstrong & Kotler,
2000). Or a combination of some of these elements are considered as a promotion that
gives direct persuasion through the use of various incentives and can be measured to
stimulate the purchase of products with charm, reach, and frequency of promotions
(Sethi, 2001).
Results of this study prove the user agrees with the marketing management in the aspect
of promotion but in the medium level. However, the relationship between the promotion
of consumer preferences is significantly positive. Researchers concluded that there are
inherent weaknesses in the management factors that undermine customer preferences
promotion. The results of this study support the study Ariffin (2010) which calls for
effective management of promotional factor is important to ensure that a business is to
survive long in the market.

107
5.4 Implication of Research
In this section, researchers will discuss the implications of the study are divided into
several parties. From the beginning of the discussion of this study, the researchers have
discussed the importance of the research supported by previous studies, statements from
individuals who have an interest in the country, researchers from the Institute of Higher
Learning (IPTA), director of health products and so on.
The sequence of the study through questionnaires were carried out and analyzed
carefully to see the actual effectiveness 4P marketing mix and the impact on consumer
preferences in using supplements. Although the study only focused on the northern areas
alone, but respondents in this study are those that are usually exposed to the acquisition
of health products, especially in this era are exposed to electronic media about the
importance of taking these supplements. The researchers concluded that this study
provide useful theoretical implications, entrepreneurs health products supplements,
consumers and government. Here is the division of the implications and statements made
by some support to strengthen the statement.

108
5.4.1 Implications of Research on Entrepreneur Products Supplements
Generally these studies have an impact on all employers from a variety of businesses,
but in particular the implications of this study is to entrepreneurs health products.
Growth entrepreneurs health products is very positive. This is evidenced by the dumping
of health products based on herbs and marketed in the market either for beauty of the
face, fitness, general health and the treatment of chronic pain.
So with this study, may indicate to the operators health products may be shortcomings in
managing the marketing mix 4P wisely. Positive growth should be maintained and a
place in the market in a long time. Among the aspects that should be emphasized is
health products issued accordingly have the approval of the Ministry of Health to ensure
the safety of users. In addition, the packaging of the product should be attractive and
have enough information regarding the diet drug ingredients are mixed in a drug, dose,
and so on. In addition, the price is also reasonable, flexible and consistent.
Flexible means the prices offered have pieces that draw (Off), installment payments, and
so on. With this, users are not burdened with pricing that is placed. Furthermore,
according to a study discussed in chapter two, the price is quite expensive health
products of modern medicine because of the manufacturing process involves a rigorous
process and partly imported from abroad. Consistency also means, pricing is not easily
changed in a short time.

109
In addition, the promotion will also need to be more creative and consistent. For
example, the promotion involves celebrities more appealing to consumers through
advertisements on television, radio, internet, magazines, and so on. With creative
promotions and consistently as indirectly able to win the hearts of consumers to buy
local herbal health products. According to Arifin (2010) says that the use of celebrities
(public figure) in a variety of advertising, especially for new products, is one of the
effective marketing strategies to gain or maintain market. In addition, efficient
management and consistent distribution should also facilitate users to obtain local herbal
health products. According to Anantha Raj (2012) states that an efficient distribution
channel can help producers, manufacturers, and users in carrying out the tasks of
distribution. Therefore, employers should be aware of and committed to the distribution
either in the selection of a business location, channel, distribution and so on. Efficient
distribution management can manage costs while making it easier for users to get local
herbal health products easily.
In conclusion, the study of marketing mix 4P have implications for local entrepreneurs
herbal health products. The basic things need to be addressed and any shortcomings
should be increased to the maximum as the taproot of a business must be strong to keep
up a high level with the operators of the supplement products that have been successful,
particularly at the international level.

110
5.4.2 Implications of Research on Consumer
Consumers are the ones who determine what that business continues to get up and go
forward. In this case, of course awareness of supplement products as a source of good
health and do not have a high risk in the long run is expected. Knowledge about
medicine as a source of health indirectly affect consumer preferences in using local
health products over a long period. In this study, researchers have been analyzing
everything related to supplement products in Malaysia, whether from the cultural aspect
of the Malays with herbs, nutrients herbs found in plants that live around us, the reaction
treatment using herbal health products and so on . With it, the researchers hope that this
study gives inspiration and awareness to appreciate the efficacy of supplement products
that actually is one of healthy lifestyle factors.
5.4.3 Implications of Research on Government Planning
In addition, with respect to the speech of the Prime Minister, YAB Dato 'Sri Najib Tun
Razak, in his speech to promote health tourism industry further intensified since seen the
industry has generated almost RM600 million a year and has a bright future for further
development, then this study shows that Malaysia also has a great potential in promoting
health tourism industry from a medical point of supplement product from local
entreprenuer approved by the MOH. Thus, the tourism industry can be diversified
treatment services offered to patients from abroad to improve the health tourism industry
more attractive

111
5.5 Limitation of Research
During this study, there are some limitations to be difficult for researchers to complete
the study so perfect. The first limitation is the lack of cooperation from some quarters of
the respondents in the data collection process. The main focus is on the student at
Universiti Utara Malaysia from undergraduate and postgraduate. However, the
assistance given is simple, especially in answering the questionnaire. This is evident
when the form is not returned questionnaires completely. The second limitation is the
lack of updated information in respect of the issue of supplement products among
students. This is quite difficult for researchers to get the latest information on issues that
arise in order to strengthen the research problem, especially in the aspect of the
marketing mix 4P. The problem seems to get less attention and impact entrepreneurs
who are not responsible for selling supplement products without the approval of the
Ministry of Health. Without realizing it pose a danger to consumers and bring down the
good name of the product itself.
5.6 Future research
The results of this study found that the 4P marketing mix and the impact of consumer
preferences in using supplements is 40 percent . This suggests that there are other factors
that can improve the methodology of the study so the results of studies. Therefore, the
researchers suggested that studies be made in the future to study other aspects such as
perception, attitude, culture and others.

112
In addition, this study is limited in the northern region of Malaysia only, at Universiti
Utara Malaysia. Thus, the decision is limited in the range of respondents in the north
only. Therefore, researchers are encouraged that so enlarged the scope of the study to
other countries so that the consumer preferences of supplements can be identified more
precisely.
5.7 Conclusion
Overall this study, have found that robust health product marketing supplements is at an
average level either in terms of management of marketing and consumer preferences.
However, the results of this study prove that there is a significant and positive
relationship between marketing mix 4P and the consumer preferences in using the health
supplement products. This shows that the marketing of health products supplements is to
support the concept of the marketing mix 4P. The analysis results showed that the
theoretical framework developed by the researchers was successful where the consumer
preferences in using supplements is influenced by the marketing mix 4P. Thus, the
operators and the consumer should take a lesson from this study to support and improve
the marketing of supplement products in addition to marketing health products may
continue to be marketed more aggressively in the local and international levels.

113
REFERENCES
Ab Halim, M. & A. Ahmad, (2012). The possibility of uniformity on halal standards in
Organization of Islamic Countries (OIC) country. 17 World Applied Science
Journal: 6.
Anantha, R. A. A. (2012). The effect of marketing mix and customer perception on
brand loyalty. IOSR Journal of Business and Management, 4(2), 01–11, 6–10.
Akgam, H. A. (2013). Study of customer satisfaction in the banking sector in Libya.
Alvaro. G. M, Oscar. G. B, and Mercedes. M. P (2016). Influence of Customer Quality
Perception on the Effectiveness of Comemercial Stimuli for Electronic Products:
Front Psychol (7).
Arifin, S. (2010). Pengaruh celebrity endorser ridho rhoma dan rhoma irama terhadap
minat membeli kartu As.
Armstrong, P. K. (2000). Prinsip Pemasaran (Eight ed.). (G. Jaffar, Ed., & N. M. ariffin,
Trans.) Selangor: Prentice Hall
Awais Bhatti,M., & Veera Pandiyan Kaliani Sundram ( 2015). Business Research
Bakewell, C. & Mithcell, V. W. (2006). Male versus female consumer decision making
styles, Journal of Business Research, 59, pp. 1297-1300.
Bennett, A. R. (1997). The five Vs – a buyer’s perspective of the marketing. Marketing
Intelligence & Planning, 15(3), 151–156.

114
Berbard, H. R., P. J. Pelto, O. Werner, J. Boster, A. K. Romney, A. Johnson, C. R.
Ember & A. Kasakoff. (1986). The construction of primary data in cultural
anthropology. Current Anthropology 27: 382-396.
Brewer, P.c.& T.W. Speh, 2000. Using The Balanced Scorecard to Measure Supply
Chain Performance. Journal of Business Logistics, 21(1): 1-16
Bernard, H. R. (2002). Research Methods in Anthropology: Qualitative and quantitative
methods. 3rd edition. AltaMira Press, Walnut Creek, California.
Boonajsevee, B. (2005). Relationship marketing: Loyalty intentions in New Era of Thai
Bank Marketing. Nova Southeastern University.
Chebat, J C., Filiatrault, P., Gelinas-Chebat, C., & Vaninsky, A. (1995). Impact of
Waiting Attribution and Consumer’s Mood on Perceived Quality. Journal of
Business Research, (34), pp. 191-196.
Chung, I.-K., & Lee, M.-M. (2003). A study of influencing factors for repurchase
intention in internet shopping malls. In Parallel and Distributed Processing
Symposium Proceedings International (p. 243a). Nice, France.
Cruz Amorim, J. (2000). Dietary habits and Nutritional Status of Adolescents over
Europe-Southern Europe. Eur. J. Clin. Nutr., 54: (Suppl 1) S29-S35.
David, M. & C. D. Sutton, (2004). The Basics. Thousand Oaks: Sage Publications.
Davies, A., Tittrington,A.J. & Cochrane, C. (1995) Who buys organics food:A
profile or purchasers of organic food in northern Ireland. British Food Journal,
97(10), 17-23.

115
Deliya. M.M & Parmar. J.B (2012). Role of Packaging on Consumer Buying
Behaviour-Patan District; Global Journal of Management and Business Research.
12(10).
Devla. N. M, Acharya.R. S. Acharya.S N. & Kumar. V. (2011). Dietary Supplements: A
Legal Status In India & In Foreign Countries: International Journal of Pharmacy
and Pharmaceutical Sciences 3 (3).
Dietary Supplement Health and Education 1994. (2015, May 13). Retrieved from
http://www.anh-usa.org/dshea/#What%20is%20DSHEA
Food and Drug Administration Consumer Health Information. (2015, May 13).
Retrieved from www.fda.gov/consumer/updates/supplements080408.html
Doroodgar, M. R., Nazari, K., & Emami, M. (2012). The study of the relation between
marketing mix and attract customers. Journal of Basic and Applied Scientific
Research, 2(8), 7734–7740.
Dutka, A. (1995). AMA handbook for customer satisfaction: A complete guide to
research, planning, & implementations. Lincolnwood: NTC Business Books
Euromonitor,(2015). Consumer Health in Malaysia. Retrived from
http://www.euromonitor.com/consumer-health-in-malaysia/report
Geoffrey p. Webb (2006). Dietary Supplements and Functional Foods. The British
Dietetic Association, pp.19(4).
Ghazali, E., Mutum, D. and Lee, L. L. (2006). Dietary Supplement Users vs Non-users.
Malaysia: Profile Comparisons for marketing Purposes. Eds. Welsh, D.H.B. et al.
In: Proceeding of AGBA 3rd World Congress, Advance in Global Business
Research, 3(1), 4-6 January 2006, Kuala Lumpur, Malaysia, pp. 43-54

116
Grunert.G. K, Wills.M.J, and Celemin. F.L (2010). Nutrition knowledge, and use and
understanding of nutrion information on food labels among consumers in UK.:
Research Report 13.
Hardinsyah dan Aries M., 2012. Jenis Pangan Sarapan dan Perannya dalam Asupan Gizi
Harian Anak Usia 6-12 Tahun di Indonesia. Jurnal Gizi dan Pangan. Departemen
Gizi Masyarakat FEMA-IPB. 7(2),pp 94.
Haeckel, Stephan H. (1997), “Preface,” in Reflections on the futures of marketing,
Donald R. Lehman and Katherine Jocz, eds. Cambridge, MA: Marketing Science
Institute.
Hair, J.E.; Anderson, R.E.; Tatham, R.L; & Black, W.C. (2007). Multivariate Data
Analysis, 4th Edition, New York, Prentice-Hall International.
Hawkins, D. l, Best, R. J., & Coney, K. A. (1995). Consumer behavior: Building
marketing strategy. Chicago: McGraw-Hill/Irwin.
Hennig-Thurau, T., Gwinner, K. P., & Gremler, D. D. (2002). Understanding
relationship marketing outcomes: An integration of relational benefits and
relationship quality. Journal of Service Research, 4, 230–247.
Herbalife Annual Report ( 2015). Retrived from http://ir.herbalife.com/annuals.cfm
Isa, K. A. M. & Masuri, M. G. (2011). The Association of Breakfast Consumption
Habit, Snacking Behaviour and body mass Index among University Students.
American Journal of Food and Nutrition. 1 (2) pp55-60
Jones .S (2007), Exploring corporate strategy: text & cases. 8th edition.

117
Johnson, M. D., & Gustafsson, A. (2000). Improving customer satisfaction, loyalty, and
profit: An integrated measurement and management system (1st ed.). Francisco:
Jossey-Bass.
Johnson, R. A., & Wichern, D. W. (1992). Applied multivariate analysis (3rd ed.). New
Jersey: Prentice Hall Inc.
Krejcie, R. V., & Morgan, D. W. (1970). Determining sample size for research
activities. Educational and Psychological Measurement, 30, 607-610.
Kotler, P. (2005). Marketing: an introduction. New Jersey: Pearson Education Inc.
Kotler, P. & Amstrong, P. (2008). Principles of Marketing 12th ed, New Jersey: Pearson
Prentice Hall.
Kotler, P., & Keller, K. L. (2009). Marketing management. Upper Saddle River, N.J:
Pearson Prentice Hall.
Kotler, P. & Keller, K. L (2011). Marketing Management 14th ed, New Jersey:
Pearson Prentice Hall.
Leslie, L. Z. (2011). Celebrity in 21st century. ABC-CLIO, LLC. California.
Lamb, C. W., Hair, J.F., & McDaniel, C. (2009). Essential of Marketing, 6th Edition.
United State of America: Nelson Education, Ltd.
M. Ariffin, A. A., M. Salleh, A. H., A. Aziz, N. & Asbudin , A. A. (2008). Service
Quality and Satisfaction for Low Cost Carriers. International Review of Business
Research Papers. 6(1), February 2010, pp. 47-56.

118
Malhotra, N. (2014). Marketing Research: An Applied Orientation, 3rd Ed, Prentice-
Hall,Sydney.
Malaysia Organization of Phamarceutical Industries. 2001 . 14th
Asia Phamarceutical
Conference(online) http://www/mopi.org.my/main.html
Martyn Shuttleworth. Pilot Study. (2015, May 14). Retrived from
https://explorable.com/pilot-study
Mason, M. J., & Scammon, D. L. (2000). Health claims and disclaimers: Extended
boundaries and research opportunities in consumer interpretation. Journal of
Public Policy & Marketing, 19(1), 144–150.
McCracken, G. (1989). Who is the celebrity endorser? Cultural foundations of the
endorsement. Journal of Consumer Research, 16(1), 310–321.
McColl-Kennedy, J. R. and Kiel, G. C. (2000) .Marketing: A strategic approach.
Melbourne: Nelson Thomson Learning.
Md. Nor Othman, Ong, F. S. & Wong, H. W. (2008). Demographic and Lifestyle
Profiles of Ethnocentric and Non-Ethnocentric Urban Malaysian Consumers:
Asian Journal of Business and Accounting, 1(1), pp. 5-26.
Meghan Jain, & Fang Han. (2012). Identifying the essential factors in the marketing
design (The case of Personal Protective Equipment), Center of Entrepreneurship,
University of Oslo. Pp 18-97.
Meyer, L. S., Gamst, G., & Guarino, J. (2006). Analysis of Variance Designs: A
Conceptual and Computational Approach with SPSS and SAS. UK: Cambridge
University Press.

119
Meyers, L.S.; Gamst, G. & Guarino, A. (2006). Applied multivariate research: Design
and interpretation research: Thousand Oaks: SAGE.
Moehji, S. (2003). Ilmu Gizi 2. Jakarta: Papas Sinar Sinanti.
Mohd. Najib Ghafar (1998). “Penyelidikan Pendidikan.” Skudai: Universiti Teknologi
Malaysia.
Mohammad, A.H, Wang, A. & Sunayya, B. (2012). Investigating on Tourist satisfaction:
An empirical study on East Lake. European Journal of Business and
Management. 4(7).
Mowen, J. C. (1993). Consumer behavior. New York: McMillan Publishing Company
Mowen, John C dan Michael Minor. (2002). Perilaku Konsumen. Jakarta: Erlangga.
Musaiger, A.O. (1993). Socio-cultural and economic factors affecting food consumption
patterns in the Arab countries. Journal of the Royal Society for the Promotion of
Health, 113(2), 68-74.
Murray, H. (2011). Expanding the Malaysia herbal industry by developing the
farmer–government University Nexus. In 7th Malaysian Agro –Bio International
Conference with the 12th Malaysian International Food and Beverage Trade
Fair (pp. 12–15). Putra World Trade Centre, Kuala Lumpur,Malaysia.
Natila Ahmad. 2002 Nutritional Supplements, Nutraceutical, Herbal Medicines. Retrived
on Mac 2015, from
http://strategis.ic.gc.calepic/internetlinimr-ri.nsf/en/gr111702e.html

120
Noyer C. and Dimajo.S. (2015). Exploring brands celebrity endorsement on facebook:
Master Thesis Business Administration. Karlstand Busisness School University.
O. C. Ferrell, M. H. (2010). Marketing Strategy. Cengage Learning, 2010.
Oliver, P., & Jupp, V. (2006). Purposive sampling. In: The SAGE dictionary of social
research methods. Sage, pp. 244-245.
Oliver, R. L. (1999). Whence consumer loyalty. Journal of Marketing, 63(Special Issue),
33–44.
Ottley, C. (2001) – Beyond the Balanced Diet. Trends in food Science and
Technology.12: 249-251
Orth, U. R. (2009), ‘The Power of Packages – New Insights from Consumer Psychology
Research,’ Fruit Processing 5/2009, p. 234-236.
Pallant, J. (2013). SPSS Survival Manual: A Step By Step Guide To Data Analysis Using
IBM SPSS (5th ed.). New York: McGraw-Hill.
Papadaki, A., Hondros, G., Scott, J. A. and Kapsokefalou, M. (2007). Eating habits of
University students living at, or away from home in Greece Appetite Volume 49,
Issue 1 pp169-176
Peter, P.J. & Donelly, J.H. (2007). Marketing management: Knowledge and skills (8th
ed.). New York: McGraw-Hill.
Pinya. S. & Speece.M (2007) The importance of packaging attributes; A Conjoint
Analysis Approach’ European Journal Of Marketing .41 pp.1495-1517.

121
Poon, M, W (2010). Guidelines for Entry in Malaysian Supplements Market: Retreived
from http://newhope.com/news/guidelines-entry-malaysian-supplements-market
Polit, DF & Hungler, BP. (1999). Nursing research: Principles and methods. 6th edition.
Philadelphia: Lippincott.
Portal Rasmi Kementerian Perdagangan Dalam Negeri, Koperasi dan Kepenggunaan.
(2015, Jun 7). Retrived from https://ttpm.kpdnkk.gov.my/portal/index.php/my/
Portal Rasmi Kementerian Kesihatan Malaysia. (2013, Oktober 3).Retrived from
www.moh.gov.my/index.php/pages/view/362
Prendergast, P.G. and Pitt, L. (1996), “Packaging, marketing, logistics and the
environment: are there trade-offs?”, International Journal of Physical Distribution
& Logistics Management, 26(6), pp. 60-72.
Rozin, P., Fischler, C., Imada, S. & Wrzesniewski, A. (1999). Attitudes to food and the
role of food in life in the U.S.A, Japan, Flemish, Belgium and France: Possible
implications forthe diet-health debate. Appetite. 33:163-180
Rojer, K. & Worthington, P. (2004) Young, Middle age and Older Adults, Worthington, P.
(ed). Practical Aspect of Nutritional Support Guide Advanced, Philadelphia:
Saundress.
Rettie, R. & Brewer, C. (2000). The verbal and visual components of package design.
Journal of Product and Brand Management. 9(1), pp. 56-70
Salant, P. & Dilman, D. A. (1994). How to conduct Your Own Survey, New York: Wiley
Schiffman L., Kanuk, L. L. (2010). Consumer Behaviour, Global Tenth Edition. United
State of America: Pearson Education, Inc.

122
Sekaran, U. (2006). Research method for business: A skill building approach (4th ed.).
New Delhi: Sharda Ofsett Press.
Sekaran, U., & Bougie, R. (2009). Research Methods for Business: A Skill Building
Approach. United Kingdom: John Wiley and Sons Ltd.
Sekaran, U. & Bougie, R. (2013). Research Methods for Business: A skill-building
approach (6th ed.). John Wiley & Sons Ltd
Shah. S, Ahmad .A, & Ahmad.N (2013): Role of Packaging in Consumer Buying
Behavior; A study of University students of Peshawar Region KPK Pakiston.
International Review of Basic and Applied Sciences. 1(2).
Shimizu, T. (2003): Health Claims and Scientific Substantiation of Functional Foods -
Japanese System Aiming the Global Standard, Current topics in Nutraceutical
Research, 1(2), pp. 1-12.
Shimp, T. A. (2003). Advertising, promotion and supplemental aspects of marketing
communications (6th ed., p. 650). Thomson South-Western
Schiffman, L. G., & Kanuk, L. L. (1997). Consumer behavior. New Jersey: Prentice Hall.
Sudarin, A. (2008). A Study of Factor on Buying Decision of Customers towards Dietry
Supplement Food Products: Master Project. Srinakharinwirot University.
Simamora, B. (2001). Remarketing for business recovery. Jakarta: Gramedia Pustaka
Utama.
Tabachnick,B.G. & Fidell, L.S. (2013). Using multivariate statistics (6th ed.), Boston:
Pearson Education.

123
Tee, E.S. (1999). Nutrition of Malaysians: Where Are We Heading? Malaysia Journal of
Nutrition. 5: 87-109.
Tjiptono,F (2000), Manajemen Jasa, Penerbit Andi Yogyakarta
Underwood, R. L., Klein, N. M., & Burke, R. R., (2001). Packaging communication:
attentional effects of products imagery. Journal of Product and Brand
Management, 10(7), p. 403-422.
Utah, R., (2013). E-book IBM Statistics for Window Versi 21.0. Pejabat Teknologi
Maklumat 19/02/2013.
Van Riel, C.R.A., Mortangers, C.P.de & Streukens, S. (2005). Marketing Antecedents of
Industrial Brand Equity: An Empirical Investigation in Special Chemicals. The
Journal of Industrial Marketing Management, 34(8), 841-847.
Vrontis, D., Thrassou, A. & Lamprianou, I. (2009). ‘International marketing adaptation
versus standardisation of multinational companies’. International Marketing
Review, 26(4), pp. 477-500.
Wathieu, L., & Bertini, M. (2007). Price as a stimulus to think: The case for wilfull over
pricing. Marketing Science, 26(1), 118-129.
Wigunaningsih Wuri, (2007). Salah Konsumsi Suplemen Bisa Keracunan.
(perspektif–koranpakoles2007.blogspot.com20080salah-konsumsi-suplemen-bisa
-keracunan.html)
Yonca Limon, Lynn R. Kahle, and Ulrich R. Orth (2009) Package Design as a
Communications Vehicle in Cross-Cultural Values Shopping. Journal of
International Marketing: March 2009, 17 (1), pp. 30-57.

124
Yoo, B., Donthu, N. & Lee, S. (2000). ‘An Examination of Selected Marketing Mix
Elements and Brand Equity’. Journal of the Academy of Marketing Scince, pp.
195-211.
Zailinawati, A. H., Schattner P., & Mazza, D. (2006). Doing a pilot study: why is it
essential? Malaysian Family Physician, 1(2&3), pp. 70-73.
(2013, Jun 26). Berita Harian. Retrived in June 23, 2016 from
http://www.bharian.com.my/
Zikmund, W.; Babin, B. Carr,J. & Griffin, M. (2013). Business Research Methods.
Canada: South-Western.
Zeithaml, V. A., & Bitner, M. J. (1996). Service marketing. New York: McGraw Hill
Companies Inc.

125
Appendix A
BORANG SOAL SELIDIK/ QUESTIONAIRE
THE IMPACT OF MARKETING MIX ELEMENTS ON CONSUMER PREFERENCE
TOWARDS SUPPLEMENT PRODUCT AMONG UUM STUDENTS
Responden yang dihormati,
Saya merupakan seorang pelajar Sarjana (Sains) Pengurusan di Universiti Utara Malaysia.
Borang soal selidik ini mengandungi TIGA (3) bahagian iaitu bahagian I, II dan III. Tujuan
borang soal selidik ini dibuat adalah untuk mengenalpasti faktor yang mempengaruhi pemilihan
pengguna terhadap makanan tambahan. Semua maklumat yang diberikan adalah RAHSIA dan
hanya digunakan bagi tujuan akademik sahaja. Kami tidak akan menerbitkan sebarang maklumat
yang akan melibatkan sebarang individu atau organisasi bagi tujuan lain. Terima kasih atas masa
dan dan kerjasama anda dalam menjayakan usaha penyelidikan ini.
Dear respondent,
I am a student of Master (Science) Management in Universiti Utara Malaysia. The questionnaire
contains THREE (3) parts, I,II and III. The purpose of this questionnaire is to identify the
factors that affect the customer preferences towards supplement products. All information
provided is CONFIDENTIAL and only used for academic purposes only. We will not publish
any information that would involve any individual or organization for other purposes. Thank you
for your time and cooperation in the success of this research.
Penyelidik: Maisarah Binti Masri 818172
Sarjana Muda (Sains) Pengurusan. Universiti Utara Malaysia
Email: [email protected]

126
BAHAGIAN I / PART I :
LATAR BELAKANG RESPONDEN/ BACKGROUND OF RESPONDENT
Seksyen ini bertujuan untuk mendapatkan maklumat tentang latar belakang responden.
Responden dikehendaki tandakan [√] pada pilihan yang berkenaan. Hanya satu pilihan
sahaja yang diperlukan untuk setiap soalan.
This section is intended to obtain information about the background of the respondents.
Respondents are required to tick [√] in the appropriate selection. Only one option is only
necessary for each question.
1. Jantina / Gender
Lelaki/ Male Perempuan/ Female
2. Umur/Age
<18-23 35-45
24-34 46>
3. Bangsa/ Race
Melayu/Malay India/ Indian
Cina/ Chinese Lain-lain/ Others
4 Taraf Perkhawinan/ Marital Status
Bujang/Single
Berkhawin/ Married
Bercerai/ Divorce
4. Tahap Pendidikan/ Education Level
Diploma/ Asasi
Ijazah Sarjana Muda /Bachelor Degree
Sarjana /Master
Phd

127
5. Pendapatan Bulanan/ Monthly Income
≤ RM 2,000 ≥ RM 2,000 – RM 4,000
≥ RM 4,000 lain-lain/ others: ________
BAHAGIAN II/ PART II: SOAL SELIDIK BERKENAAN PEMILIHAN PENGGUNA
Kenyataan berikut merupakan faktor pemilihan pengguna terhadap produk makanan
tambahan. / The following is a selection factor for consumer preferences against
supplement product.
Sila (bulat) jawapan di ruang yang disediakan mengikut skala penilaian berikut./Please
(circle) answer in the space provided in accordance with the following rating scale.
Skala Penilaian/ Rating scale
1- Sangat tidak setuju/ Strongly Disagree: 2- Tidak Setuju/ Disagree: 3- Biasa/ Neutral:
4- Bersetuju/ Agree: 5- Sangat Bersetuju/ Strongly Agree.
No
Item /Soalan
1
2
3
4
5
1
Kualiti adalah salah satu faktor yang
mempengaruhi keputusan pembelian saya
terhadap produk makanan tambahan
Quality is one of the factors that influence my
purchasing decisions on supplement products.
2
Jenama produk menjadi kebimbangan saya
apabila saya membeli produk makanan
tambahan.
Brand products into my concerns when I buy
supplement products.

128
3
Saya perlu sentiasa membeli produk
makanan tambahan dibuat daripada Malaysia
berbanding produk import .
I should always buy supplement products
made from Malaysia compared to imported
products.
4
Produk makanan tambahan yang dijual di
Malaysia adalah yang terbaik.
Supplement products sold in Malaysia is the
best.
5
Saya akan mengambil masa untuk melihat
label untuk mengetahui mengenai produk
makanan tambahan.
I will take the time to look at the label to find
out about supplement products.
6
Saya akan mengesyorkan kepada orang lain
untuk membeli produk makanan tambahan.
I would recommend to others to buy
supplement products.
7
Gaya hidup saya akan mempengaruhi pilihan
pembelian saya terhadap produk makanan
tambahan.
My lifestyle choices will affect my purchase
of supplement products

129
BAHAGIAN III/ PART III: SOAL SELIDIK BERKENAAN CAMPURAN
PEMASARAN
Kenyataan berikut merupakan kesan campuran pemasaran kepada pemilihan pengguna. /
The following is the marketing mix impact on consumer preferences.
Sila ( / ) jawapan di ruang yang disediakan mengikut skala penilaian berikut./Please ( / )
answer in the space provided in accordance with the following rating scale.
Skala Penilaian/ Rating scale
1- Sangat tidak setuju/ Strongly Disagree: 2- Tidak Setuju/ Disagree: 3- Biasa/ Neutral:
4- Bersetuju/ Agree: 5- Sangat Bersetuju/ Strongly Agree.
Produk/ Product
No
Item/ Soalan
1
2
3
4
5
1
Saya merasakan produk makanan tambahan
berkesan dalam menyelesaikan permasalahan
kesihatan yang saya hadapi.
I feel supplements are effective in solving health
problems that I face.
2
Saya merasakan ada kesan sampingan apabila
menggunakan produk makanan tambahan tempatan
I feel there are side effect when using local
supplement products
3
Semua produk makanan tambahan yang saya lihat
mempunyai kelulusan Kementerian Kesihatan
Malaysia (KKM)
All products are supplement s that I've seen have
the approval of the Ministry of Health (MOH).

130
4
Saya tahu bahawa produk makanan tambahan
tempatan mempunyai pelbagai jenis keluaran
I know that the local supplement products have a
wide range of output
5
Produk makanan tambahan yang saya gunakan
mempunyai jenama yang terkenal.
Supplements that I use has a well known brand.
6
Saya sering mematuhi cara pemakanan produk
makanan tambahan yang disyorkan di bungkusan
produk.
I often observe supplements are recommended on
packaging product.
7
Pembungkusan produk makanan tambahan adalah
memuaskan
Supplement packaging of products is satisfactory
8
Saya mengutamakan kualiti dalam pemilihan
produk makanan tambahan yang saya gunakan.
My priority in selecting quality health supplement
products that I use.
9
Saya yakin produk makanan tambahan adalah
terjamin keberkesanannya.
I believe supplements are guaranteed
effectiveness.

131
Harga/ Price
No.
Item /Soalan
1
2
3
4
5
1
Saya mendapati harga produk makanan
tambahan adalah mahal.
I found the price supplements are expensive.
2
Saya merasakan harga adalah berpatutan
I feel the price is reasonable .
3
Saya mendapati harga produk makanan
tambahan adalah konsisten dari tahun lepas ke
tahun ini.
I found the price supplements is consistent last
year to this year.
4
Harga produk makanan tambahan adalah
berpadanan dengan kepuasan saya dapat.
Supplement product prices are compatible with
satisfaction that I got.
5
Peniaga produk makanan tambahan
menawarkan diskaun pada musim- musim
tertentu.
Dealers supplements offer discounts at certain
seasons.
6
Saya tidak merasakan harga sebagai satu
bebanan kepada saya untuk terus menggunakan
produk makanan tambahan.
I do not feel the price as a burden to me to
continue to use supplements.

132
7
Pada saya, harga produk suplemen adalah lebih
murah berbanding dengan harga produk
makanan tambahan dari luar negara.
To me, the price supplement product is cheaper
compared with the cost of others supplement
products from abroad.
Promosi/ Promotion
No
Item / Soalan
1
2
3
4
5
1
Medium pengiklanan melalui media cetak
mempengaruhi saya untuk menggunakan produk
makanan tambahan.
Medium advertising through print media
influence me to use supplements.
2
Medium pengiklanan melalui media elektronik
mempengaruhi saya untuk menggunakan produk
makanan tambahan.
Medium advertising through electronic media
influenced me to use supplements.
3
Saya merasa kurangnya kaedah pengiklanan
menyebabkan produk makanan tambahan
kurang mendapat sambutan.
I feel the lack of advertising methods lead to
supplement products lukewarm.
4
Saya tertarik dengan iklan produk makanan
tambahan yang disiarkan di televisyen
I am interested in advertising supplements
televised
5
Saya meminati teknik promosi jualan langsung
oleh jurujual produk makanan tambahan.

133
I am interested in direct sales promotion
technique by the salesman supplements.
6
Saya mendapati kebanyakan iklan produk
makanan tambahan adalah bertujuan untuk
mempengaruhi pengguna berbanding memberi
manfaat kepada pengguna.
I found that most product advertising
supplement is intended to affect the user than
the benefit of consumers.
7
Saya merasakan teknik jualan langsung
memberikan kefahaman yang jelas kepada saya
berkenaan produk suplemen.
I feel the direct selling technique gave me a
clear understanding of the supplement products.
8
Saya pernah melihat promosi jualan produk
suplemen melalui laman social.
I once saw a supplement product sales
promotion through social sites.
9
Saya pernah mengesyorkan mana- mana produk
suplemen kepada orang lain untuk dicuba.
I have recommended any supplements to others
to try.
Pengedaran/Place distribute
No
Item/ Soalan
1
2
3
4
5
1
Saya mudah untuk membeli produk makanan
tambahan di mana- mana premis jualan.
I'm easy to buy supplement products in any
premises sales.

134
2
Saya mudah berhubung dengan pengedar untuk
mendapatkan bekalan produk makanan
tambahan.
I easily get in touch with distributors to supply
supplement products.
3
Pengedaran produk makanan tambahan yang
saya guna menyediakan perkhidmatan selepas
jualan dengan cepat.
Distribution of supplement products that I use
provides after-sales service quickly.
4
Saya mudah untuk mendapatkan semula produk
makanan tambahan tempatan yang telah habis
digunakan.
I'm easy to retrieve local supplement products
that have been used up.
5
Imej kedai produk makanan tambahan yang
sering saya kunjungi adalah menarik.
Image store supplement products that often I
visit is interesting.
6
Saya berpendapat bahawa lokasi pembelian
produk makanan tambahan adalah sesuai.
I thought the location of the purchase of
supplement products are suitable.
7
Saya mendapat bahawa produk makanan
tambahan turut dijual kepada pelancong luar
negara.
I get that supplement products are sold to
foreigner

135
8
Faktor lokasi pembelian mempengaruhi saya
untuk membeli produk makanan tambahan.
Purchase location factors influenced me to buy
supplement products.
Thank you for your cooperation
Related Documents