The extraction of precious metals from an alkaline cyanided medium by granular activated carbon by CLEOPHACE NGOIE MPINGA Thesis presented in partial fulfilment of the requirements for the degree of Master of Science in Engineering (Extractive Metallurgical Engineering) in the Faculty of Engineering at Stellenbosch University Supervisor: Prof. Steven Bradshaw Co-Supervisor: Prof. Guven Akdogan December 2012

Welcome message from author
This document is posted to help you gain knowledge. Please leave a comment to let me know what you think about it! Share it to your friends and learn new things together.
Transcript
The extraction of precious metals from an alkaline
cyanided medium by granular activated carbon
by
CLEOPHACE NGOIE MPINGA
Thesis presented in partial fulfilment of the requirements for the degree
of
Master of Science in Engineering
(Extractive Metallurgical Engineering)
in the Faculty of Engineering at Stellenbosch University
Supervisor: Prof. Steven Bradshaw
Co-Supervisor: Prof. Guven Akdogan
December 2012
DECLARATION
The extraction of precious metals from alkaline cyanided medium by granular activated carbon ii
DECLARATION
By submitting this thesis electronically, I declare that the entirety of the work contained
therein is my own, original work, that I am the sole author thereof (save to the extent
explicitly otherwise stated), that reproduction and publication thereof by Stellenbosch
University will not infringe any third party rights and that I have not previously in its entirety or
in part submitted it for obtaining any qualification.
Ngoie Mpinga Friday 23 November 2012
Signature Date
Copyright © 2012 Stellenbosch University
All rights reserved
Stellenbosch University http://scholar.sun.ac.za
SYNOPSIS
The extraction of precious metals from alkaline cyanided medium by granular activated carbon iii
SYNOPSIS
A 2 stage heap leach process to extract base and precious metals from the Platreef ore is
currently being investigated industrially. A first stage bioleach is used to extract the base
metals. In the 2nd stage, cyanide is used as the lixiviant at high pH to extract the platinum
group metals and gold. By analogy with current gold recovery practices, the present study
investigates the preferential and quantitative adsorption of precious metals (Pt, Pd, Rh and
Au) over base metals (Cu, Ni and Fe) from an alkaline cyanide medium, by means of
granular activated carbon.
Experiments were designed statistically to optimise the process parameters using synthetic
alkaline cyanide solutions close in composition to those expected from plant leach solutions.
The statistical approach allowed the development of a reliable quantitative approach to
express adsorption as a response variable on the basis of a number of experiments. A 2IV(7-2)
fractional factorial design approach was carried out in a batch adsorption study to identify
significant experimental variables along with their combined effects for the simultaneous
adsorption of Pt(II), Pd(II), Rh(III) and Au(I). The adsorbent was characterized using SEM-
EDX, and XRF. Precious metals adsorption efficiency was studied in terms of process
recovery as a function of different adsorption parameters such as solution pH, copper, nickel,
free cyanide ion, thiocyanate, initial precious metal (Pt, Pd, Rh and Au) ion and activated
carbon concentrations.
It was shown that adsorption rates within the first 60 minutes were very high (giving more
than 90% extraction of precious metals) and thereafter the adsorption proceeds at a slower
rate until pseudo-equilibrium was reached. Among the different adsorption parameters, at
95% confidence interval, nickel concentration had the most influential effect on the
adsorption process followed by the adsorbent concentration. Adsorption of Ni was found to
proceed at approximately the same rate and with the same recovery as the precious metals,
showing a recovery of approximately 90% in two hours. The kinetics of Cu adsorption were
slower, with less than 30% being recovered at the 120 minute period. This suggests that the
co-adsorption of Cu can be minimised by shortening the residence time.
Adsorption of Fe was found to be less than 5%, while the recovery of Rh was negligibly
small. The effect of thiocyanate ion concentration was not as important as the effect of free
cyanide ion concentration but still had some influence. The correlation among different
adsorption parameters was studied using multivariate analysis.
Stellenbosch University http://scholar.sun.ac.za
SYNOPSIS
The extraction of precious metals from alkaline cyanided medium by granular activated carbon iv
The optimum experimental conditions resulted in a solution with pH of 9.5, [Cu(I)] of 10 ppm,
[Ni(II)] of 10 ppm, [CN ] of 132.44 ppm, [SCN ] of 98.95 ppm, [PMs] of 2.03 ppm and [AC]
of 10 g/L. Under these conditions, predicted adsorption percentages of Pt, Pd and Au were
approximately 98, 92 and 100%, at the level of 95% probability within two hours as an
effective loading time. The negative values of ΔG° for all ions under optimum conditions
indicate the feasibility and spontaneous nature of the adsorption process. Chemisorption was
found to be the predominant mechanism in the adsorption process of Pt(II), Pd(II) and Au(I).
Based on their distribution coefficients, the affinity of activated carbon for metal ions follows
the selectivity sequence expressed below.
Au(CN) > Pt(CN) > Pd(CN) > Ni(CN) > Cu(CN)
Finally, it is important that additional research and development activities in the future should
prove the economic viability of the process. Future work is also needed to investigate the
adsorption of precious metals (PMs) by comparing the efficiencies and kinetics of adsorption
when using sodium hydroxide (in this study) or lime, respectively, in order to control the pH.
2
2
4
2
4
2
4
2
3
Stellenbosch University http://scholar.sun.ac.za
OPSOMMING
The extraction of precious metals from alkaline cyanided medium by granular activated carbon v
OPSOMMING
ʼn Tweefasige hooploogproses vir die ontginning van basis- en edelmetale van die Platrif-erts
word tans industrieel ondersoek. ʼn Eerstefase-bioloog word gebruik om die basismetale te
ontgin. In die 2de fase word sianied gebruik as die uitloog by hoë pH om die platinum-
groepmetale en goud te ontgin. Na analogie van hedendaagse goudherwinningspraktyke het
die huidige studie die voorkeur- en kwantitatiewe adsorpsie van edelmetale (Pt, Pd, Rh en
Au) bo basismetale (Cu, Ni en Fe) vanuit ʼn alkaliese sianiedmedium met behulp van
korrelrige geaktiveerde koolstof ondersoek.
Eksperimente is op statistiese wyse ontwerp om die parameters van die proses te
optimaliseer deur van sintetiese alkaliese sianiedoplossings wat in hulle samestelling nou
ooreenstem met dié wat van oplossings van plant-loog verwag word, gebruik te maak. Die
statistiese benadering het die ontwikkeling van ʼn betroubare kwantitatiewe benadering om
adsorpsie as ʼn responsveranderlike op grond van ʼn aantal eksperimente uit te druk, moontlik
gemaak. ʼn 2IV(7-2) -Fraksionele faktoriale ontwerp-benadering is tydens ʼn lot-adsorpsiestudie
gevolg om beduidende eksperimentele veranderlikes tesame met hulle gekombineerde
uitwerkings vir die gelyktydige adsorpsie van Pt(II), Pd(II), Rh(III) en Au(I) te identifiseer. Die
adsorbeermiddel is met behulp van SEM-EDX en XRF gekenmerk.
Adsorpsiedoeltreffendheid van edelmetale is bestudeer ten opsigte van proseskinetika en
herwinning as ʼn funksie van verskillende adsorpsieparameters soos oplossing-pH, koper,
nikkel, vry sianiedioon, tiosianaat, aanvanklike edelmetaal (Pt, Pd, Rh en Au)-ioon en
geaktiveerde koolstofkonsentrasies.
Daar is aangetoon dat adsorpsietempo‟s binne die eerste 60 minute baie hoog was (het
meer as 90% ekstraksie van edelmetale opgelewer) en daarna het die adsorpsie teen ʼn
stadiger tempo voortgegaan totdat pseudo-ekwilibrium bereik is. Onder die verskillende
adsorpsieparameters, by 95%-vertroubaarheidsinterval, het nikkel-konsentrasie die grootste
invloed op die adsorpsieproses gehad, gevolg deur konsentrasie van die adsorbeermiddel.
Daar is bevind dat die adsorpsie van Ni teen nagenoeg dieselfde tempo en met dieselfde
herwinning as die edelmetale voortgegaan het, wat ná twee uur ʼn herwinning van nagenoeg
90% getoon het. Die kinetika van Cu-adsorpsie was stadiger, met minder as 30% wat teen
die 120-minute-tydperk herwin is. Dit dui daarop dat die ko-adsorpsie van Cu tot die
minimum beperk kan word deur verkorting van die verblyftyd.
Daar is bevind dat die adsorpsie van Fe minder as 5% is, terwyl die herwinning van Rh
onbeduidend klein was. Die uitwerking van die konsentrasie van die tiosianaatione was nie
Stellenbosch University http://scholar.sun.ac.za
OPSOMMING
The extraction of precious metals from alkaline cyanided medium by granular activated carbon vi
so belangrik as die uitwerking van die konsentrasie van vry sianiedione nie maar het steeds
ʼn mate van invloed gehad. Die korrelasie tussen verskillende adsorpsieparameters is met
behulp van meerveranderlike analise bestudeer.
Die optimale eksperimentele toestande het gelei tot ʼn oplossing met ʼn pH van 9.5, [Cu(I)]
van 10 dpm, [Ni(II)] van 10 dpm, [CN ] van 132.44 dpm, [SCN ] van 98.95 dpm, [EM‟e] van
2.03 dpm en [AC] van 10 g/L. Onder hierdie toestande was die voorspelde
adsorpsiepersentasies van Pt, Pd en Au nagenoeg 98, 92 en 100%, op die vlak van 95%-
waarskynlikheid binne twee uur as ʼn doeltreffende laaityd. Die negatiewe waardes van ΔG°
vir alle ione onder optimale toestande dui op die uitvoerbaarheid en spontane aard van die
adsorpsieproses. Daar is bevind dat chemiesorpsie die deurslaggewende meganisme by die
adsorpsieproses van Pt(II), Pd(II) en Au(I) is. Gebaseer op hulle distribusiekoeffisiënte volg
die affiniteit van geaktiveerde koolstof vir metaalione die selektiwiteitsvolgorde soos
hieronder voorgestel.
Au(CN) > Pt(CN) > Pd(CN) > Ni(CN) > Cu(CN)
Laastens, dit is belangrik dat addisionele navorsing en ontwikkelingsaktiwiteite in die
toekoms die ekonomiese haalbaarheid van die proses bewys. Werk in die toekoms is nodig
om die adsorpsie van edelmetale (EM‟e) te ondersoek deur vergelyking van die
doeltreffendhede en kinetika van adsorpsie wanneer natriumhidroksied (in hierdie studie) of
kalk, onderskeidelik, gebruik word ten einde die pH te beheer.
2
2
4
2
4
2
4
2
3
Stellenbosch University http://scholar.sun.ac.za
ACKNOWLEDGEMENTS
The extraction of precious metals from alkaline cyanided medium by granular activated carbon vii
ACKNOWLEDGEMENTS
The work described in this thesis was carried out in the Department of Chemical Engineering
at Stellenbosch University between July 2010 and January 2012. The investigation was
financially supported by Lonmin Plc and Stellenbosch University. Hence, it is a pleasure to
convey my gratitude to all of people involved in this study.
Praises to my heavenly Father, my Lord and Saviour Jesus Christ, everything comes from
you (Dieu Seul Donne) and all I do is for your honour: fulfilling your prophecies. Thank you
Jehovah God for giving me the health, strength and ability to write this thesis.
The biggest thanks go to the Professors Steven Bradshaw and Guven Akdogan who were
my supervisors and mentors for believing in my abilities as a researcher and a scientist. Your
persistent motivation, visionary guidance, continual support and inspiration made this project
possible. I hope to keep up our collaboration in the future.
I would like to thank all the members of the Department of Process Engineering for the
challenging, pleasant and social working environment you have provided.
Finally, I would like to acknowledge every member of my family for their understanding,
patience and loving support during my studies.
Stellenbosch University http://scholar.sun.ac.za
DEDICATION
The extraction of precious metals from alkaline cyanided medium by granular activated carbon viii
DEDICATION
To my dear wife Francine, my kids Celine, Herman, Adonai and Benita for your tolerance,
patience, understanding and support.
Stellenbosch University http://scholar.sun.ac.za
TABLE OF CONTENTS
The extraction of precious metals from alkaline cyanided medium by granular activated carbon ix
TABLE OF CONTENTS
DECLARATION ..................................................................................................................... II
SYNOPSIS ........................................................................................................................... III
OPSOMMING ........................................................................................................................ V
ACKNOWLEDGEMENTS.................................................................................................... VII
DEDICATION ..................................................................................................................... VIII
TABLE OF CONTENTS ....................................................................................................... IX
LIST OF FIGURES ............................................................................................................. XIII
LIST OF TABLES .............................................................................................................. XVI
NOMENCLATURE ........................................................................................................... XVII
LIST OF ABBREVIATIONS ............................................................................................. XVIII
CHAPTER 1 : INTRODUCTION ............................................................................................ 1
1.1 PROBLEM STATEMENT ................................................................................................. 2
1.2 OVERVIEW OF TREATMENT METHODS FOR PRECIOUS METALS RECOVERY
FROM LEACH SOLUTIONS .................................................................................................. 2
1.2.1 Solvent extraction route ............................................................................................. 3
1.2.2 Resin ion-exchange process ...................................................................................... 3
1.2.3 Merrill – Crowe zinc precipitation technology ............................................................. 4
1.2.4 Cyanidation and possible extraction methods from the PLS, analogous to those used
for Au .................................................................................................................................. 5
1.2.5 Comparison of aforementioned approaches .............................................................. 6
1.2.6 Gold cyano complex adsorption mechanisms proposed in the literature .................... 6
1.2.7 Platinum group metal (PGM) complexes uptake ........................................................ 7
1.3 OBJECTIVES OF THE RESEARCH ................................................................................ 7
1.4 IMPORTANCE AND BENEFITS OF THE RESEARCH .................................................... 9
1.5 RESEARCH DESIGN AND METHODOLOGY ................................................................. 9
1.6 THESIS OVERVIEW ...................................................................................................... 10
CHAPTER 2 : LITERATURE REVIEW ................................................................................ 11
2.1 MINERALOGY OF PLATREEF ORES ........................................................................... 11
2.2 EFFECT OF MINERALOGY ON CYANIDE LEACHING AND ADSORPTION ONTO
ACTIVATED CARBON ........................................................................................................ 13
2.2.1 Pyrite – Pyrrhotite – Arsenopyrite............................................................................. 13
Stellenbosch University http://scholar.sun.ac.za
TABLE OF CONTENTS
The extraction of precious metals from alkaline cyanided medium by granular activated carbon x
2.2.2 Copper ..................................................................................................................... 13
A. Behaviour of copper on carbon adsorption processes ........................................ 14
B. Behaviour of other metals .................................................................................. 15
2.2.3 Sulphide mineral chemistry – Thiocyanate and Thiosulphate formation ................... 15
2.2.4 Effect of thiocyanate – Complex stability .................................................................. 16
2.3 SIMULTANEOUS DETERMINATION OF [CN ] AND [SCN ] IN AQUEOUS
SOLUTIONS ........................................................................................................................ 17
2.4 ADSORPTION OF PRECIOUS METALS ....................................................................... 20
2.4.1 Speciation of aqueous PGM cyano complexes ........................................................ 20
2.4.2 Adsorption mechanisms ........................................................................................... 21
2.4.2.1 Dicyanoaurate (I) complex ................................................................................. 21
2.4.2.2 PGM cyano complexes ...................................................................................... 22
2.4.3 Activated carbon – Electrochemical reduction .......................................................... 23
2.4.4 Adsorption loading capacity ..................................................................................... 24
2.4.5 Activated carbon fouling – Carbon retention time ..................................................... 26
2.4.6 Carbon transfer ........................................................................................................ 27
2.5 CHOICE OF ACTIVATED CARBON .............................................................................. 28
2.6 THERMODYNAMICS OF ADSORPTION – TEMPERATURE EFFECT ......................... 28
2.6.1 Cyanide complex solubility ....................................................................................... 28
2.6.2 Standard Gibbs free energy of adsorption ................................................................ 28
2.7 SUMMARY OF LITERATURE REVIEW ......................................................................... 29
CHAPTER 3 : MATERIALS AND METHODS ..................................................................... 30
3.1 MATERIALS .................................................................................................................. 30
3.1.1 Pregnant leach solution (PLS) ................................................................................. 30
3.1.2 Synthetic solutions ................................................................................................... 31
3.1.3 Activated carbon ...................................................................................................... 32
3.2 METHODS ..................................................................................................................... 34
3.2.1 Factorial design ....................................................................................................... 34
3.2.2 Sampling strategy .................................................................................................... 34
3.2.2.1 Input factors set at two levels each .................................................................... 34
3.2.2.2 Choice of the two levels used in the experimental design .................................. 35
A Two level – pH ....................................................................................................... 35
B Two level – free cyanide [CN ] and [Cu(I)] ......................................................... 36
C Two level – adsorbent and initial metal ion concentrations .................................. 37
Stellenbosch University http://scholar.sun.ac.za
TABLE OF CONTENTS
The extraction of precious metals from alkaline cyanided medium by granular activated carbon xi
3.2.3 Analytical methods ................................................................................................... 37
3.2.4 Experimental set-up and equilibrium tests ................................................................ 38
3.2.5 Data treatment ......................................................................................................... 39
3.2.5.1 Adsorption mechanism – Rate-limiting step ....................................................... 39
3.2.5.2 Equilibrium constant, adsorption percentage, capacity and selectivity ............... 41
CHAPTER 4 : PRELIMINARY ADSORPTION TESTS ........................................................ 43
4.1 RESULTS AND DISCUSSION ....................................................................................... 43
4.1.1 Characterisation of GAC .......................................................................................... 43
4.1.1.1 Scanning electron microscope (SEM) analysis of unloaded GAC ...................... 43
4.1.1.2 Scanning electron microscope (SEM) analysis of loaded GAC .......................... 46
4.1.1.3 Virgin activated carbon – X-ray fluorescence (XRF) analysis ............................. 47
4.1.2 Metal loading ........................................................................................................... 48
4.1.3 Effect of activated carbon concentration .................................................................. 49
4.1.4 Adsorption profiles ................................................................................................... 49
4.1.5 Adsorption mechanism ............................................................................................ 54
4.2 CONCLUDING REMARKS ............................................................................................ 54
CHAPTER 5 : EFFECT OF SELECTED OPERATING PARAMETERS ON THE
ADSORPTION PROCESS – RESULTS AND DISCUSSION ............................................... 55
5.1 SELECTION OF OPERATING VARIABLES .................................................................. 55
5.2 EXPERIMENTAL PROCEDURE .................................................................................... 56
5.3 RESULTS AND DISCUSSION ....................................................................................... 56
5.3.1 Adsorption equilibrium time of PMs: Pt, Pd and Au .................................................. 56
5.3.2 Screening important factors – Analysis of variance (ANOVA) .................................. 57
5.3.2.1 Half-normal plot (Daniel plot) ............................................................................. 57
5.3.2.2 Pareto chart ....................................................................................................... 59
5.3.3 Examining main effects ............................................................................................ 64
5.3.3.1 Influence of pH .................................................................................................. 64
5.3.3.2 Influence of copper concentration ...................................................................... 65
5.3.3.3 Influence of nickel concentration ........................................................................ 67
5.3.3.4 Influence of free cyanide [CN ] concentration .................................................. 68
5.3.3.5 Influence of thiocyanate [SCN ] concentration ................................................ 68
5.3.3.6 Influence of initial concentration of precious metal ions ..................................... 68
5.3.3.7 Influence of adsorbent concentration ................................................................. 69
5.3.4 Assessment of significant interactions in PMs adsorption process ........................... 70
Stellenbosch University http://scholar.sun.ac.za
TABLE OF CONTENTS
The extraction of precious metals from alkaline cyanided medium by granular activated carbon xii
5.3.4.1 Interaction involved in Pt(II) adsorption: [Ni(II)] – [Activated carbon] .................. 71
5.3.4.2 Interactions involved in Pd(II) adsorption process .............................................. 72
A. Influence of [Ni(II)] – [CN ] on Pd(II) adsorption ............................................... 72
B. Influence of [Ni(II)] – [Activated carbon] on Pd(II) adsorption............................. 72
5.3.4.3 Interactions involved in Au(I) adsorption process ............................................... 73
A. Influence of [Ni(II)] – pH on Au(I) adsorption ..................................................... 73
B. Influence of [Ni(II)] – [Cu(I)] on Au(I) adsorption ................................................ 73
C. Influence of [Ni(II)] – [PMs] on Au(I) adsorption................................................. 74
D. Influence of [SCN ] – [CN ] on Au(I) adsorption ............................................. 74
E. Three factor interactions: pH – [CN ] – [AC] and [Ni(II)] – [CN ] – [AC] .......... 74
5.3.5 Simultaneous optimization strategy .......................................................................... 78
5.3.5.1 Desirability function approach ............................................................................ 78
5.3.5.2 Setting the optimization criteria .......................................................................... 80
5.3.6 Predictive Anova model ........................................................................................... 83
5.3.7 Model validation ....................................................................................................... 84
5.3.8 Experimental error – reproducibility of the adsorption process ................................. 88
5.4 MEASURING ADSORPTION CAPACITY ...................................................................... 90
5.5 DISTRIBUTION COEFFICIENT – LOADING SELECTIVITY .......................................... 94
5.6 ADSORPTION MECHANISM APPROACH .................................................................... 94
5.6.1 Assessment of rate-limiting step .............................................................................. 94
5.6.2 Thermodynamic evaluation of the process – Standard Gibbs free energy ................ 96
5.7 CONCLUDING REMARKS ............................................................................................ 96
CHAPTER 6 : OVERALL CONCLUSIONS AND RECOMMENDATIONS ........................... 97
CHAPTER 7 : REFERENCES ............................................................................................. 99
APPENDICES ................................................................................................................... 110
APPENDIX A: TABULATION OF EXPERIMENTAL DATA DERIVED FROM THE
SCREENING AND ACTUAL TESTS .................................................................................. 111
APPENDIX B: FIGURES ................................................................................................... 138
APPENDIX C: TABULATION OF STATISTICAL DATA ..................................................... 159
APPENDIX D: SUPPORTING CALCULATIONS DERIVED FROM SYNTHETIC STOCK
SOLUTION PREPARATION – MEAN PARTICLE SIZE OF ACTIVATED CARBON .......... 164
APPENDIX E: RISK MANAGEMENT PLAN FOR AKANANI PLATINUM PROJECT ......... 170
APPENDIX F: PUBLICATIONS FROM THIS THESIS ....................................................... 180
Stellenbosch University http://scholar.sun.ac.za
LIST OF FIGURES
The extraction of precious metals from alkaline cyanided medium by granular activated carbon xiii
LIST OF FIGURES
Figure 1.1: Conceptual flowsheet for precious and base metals recovery ............................. 8
Figure 2.1: General classification of cyanide compounds .................................................... 18
Figure 2.2: Carbon-in-pulp process schematic flowsheet .................................................... 27
Figure 3.1: Granular MC 110 coconut shell derived carbon................................................. 33
Figure 3.2: Adsorption experimental set-up: (1) Roller (2) 2.5 litre bottles containing 500 mL
of the solution (3) pH meter Hanna HI 2211 (4) Probes Hanna HI 1131 and HI 7662-T for pH
and temperature measuring, respectively ............................................................................ 39
Figure 4.1: Scanning electron micrograph of fresh, unwashed activated carbon particles
illustrating the nature of the carbon porosity observed at 2000x magnification ..................... 44
Figure 4.2: Scanning electron micrograph of fresh, unwashed activated carbon particles,
showing the inside of the activated carbon (cross-section) observed at 1000x magnification
............................................................................................................................................ 44
Figure 4.3: Scanning electron micrograph of fresh, unwashed activated carbon particles
observed at 2000x magnification ......................................................................................... 45
Figure 4.4: Scanning electron micrograph of fresh, acid washed activated carbon particles
observed at 2000x magnification ......................................................................................... 45
Figure 4.5: Scanning electron microscope image showing mineral assemblage on loaded
activated carbon particles after platinum compounds adsorption observed at 2460x
magnification ....................................................................................................................... 46
Figure 4.6: EDX spectrum of Figure 4.5 at S-Cu-Ni-Fe position .......................................... 47
Figure 4.7: Dimensionless time-concentration profiles for precious metal adsorption
(Conditions: pH = 10, [CN] = 12.5 ppm, [SCN] = 3670 ppm, [Activated carbon] = 10 g/L and
contact time = 72 hours) ...................................................................................................... 50
Figure 4.8: Dimensionless time-concentration profiles for precious metal adsorption
(Conditions: pH = 10, [CN] = 12.5 ppm, [SCN] = 3670 ppm, [Activated carbon] = 20 g/L and
contact time = 72 hours) ...................................................................................................... 51
Figure 4.9: Dimensionless time-concentration profiles for base metal adsoprtion (Conditions:
pH = 10, [CN] = 12.5 ppm, [SCN] = 3670 ppm, [Activated carbon] = 10 g/L and contact time =
72 hours) ............................................................................................................................. 52
Figure 4.10: Dimensionless time-concentration profiles for base metal adsorption
(Conditions: pH = 10, [CN] = 12.5 ppm, [SCN] = 3670 ppm, [Activated carbon] = 20 g/L and
contact time = 72 hours) ...................................................................................................... 52
Figure 4.11: Summary of results obtained from studying the kinetics of the activated
carbon/PM-BMs adsorption; unless otherwise stated, experimental conditions were: pH = 10,
[CN] = 12.5 ppm, [SCN] = 3670 ppm, [Activated carbon] = 10 g/L and contact time = 72
hours ................................................................................................................................... 53
Stellenbosch University http://scholar.sun.ac.za
LIST OF FIGURES
The extraction of precious metals from alkaline cyanided medium by granular activated carbon xiv
Figure 4.12: Summary of results obtained from studying the kinetics of the activated
carbon/PM-BMs adsorption; unless otherwise stated, experimental conditions were: pH = 10,
[CN] = 12.5 ppm, [SCN] = 3670 ppm, [Activated carbon] = 20 g/L and contact time = 72
hours ................................................................................................................................... 54
Figure 5.1: Effect of contact time on the adsorption efficiency of precious and base metals
under the specified conditions: (Adsorbent concentration: 10 g/L; [Cu(I)]: 10 ppm; [Ni(II)]:
10 ppm; pH: 9.5; [CN]: 300 ppm; [SCN]: 100 ppm; [PMs]: 0.63 ppm) ................................... 57
Figure 5.2: Half – normal probability plot of effects on Pt(II) adsorption .............................. 58
Figure 5.3: Half – normal probability plot of effects on Pd(II) adsorption.............................. 58
Figure 5.4: Half – normal probability plot of effects on Au(I) adsorption .............................. 59
Figure 5.5: Pareto chart of standardized effects for Pt(II) adsorption onto activated carbon 60
Figure 5.6: Pareto chart of standardized effects for Pd(II) adsorption onto activated carbon61
Figure 5.7: Pareto chart of standardized effects for Au(I) adsorption onto activated carbon 61
Figure 5.8: Effect of pH on the adsorption efficiency of PMs (Pt, Pd and Au) ...................... 65
Figure 5.9: Effect of copper on the adsorption efficiency of PMs (Pt, Pd and Au) ................ 66
Figure 5.10: Effect of nickel on the adsorption efficiency of PMs (Pt, Pd and Au) ................ 67
Figure 5.11: Effect of initial [PMs] concentration on their adsorption efficiencies ................. 69
Figure 5.12: Effect of activated carbon concentration on the adsorption efficiency of PMs .. 70
Figure 5.13: Interaction graph for the effects of Ni(II) and [AC] on the adsorption of Pt(II) ... 71
Figure 5.14: Interaction graph for the effects of Ni(II) and [CN] on the adsorption of Pd(II) . 72
Figure 5.15: Interaction graph for the effects of Ni(II) and [AC] on the adsorption of Pd(II) .. 73
Figure 5.16: Interaction graph for the effects of Ni(II) and pH on the adsorption of Au(I) ..... 75
Figure 5.17: Interaction graph for the effects of Ni(II) and Cu(I) on the adsorption of Au(I) .. 75
Figure 5.18: Interaction graph for the effects of Ni(II) and PMs on the adsorption of Au(I) .. 76
Figure 5.19: Interaction graph for the effects of CN and SCN on the adsorption of Au(I) ..... 76
Figure 5.20: Cube plot of the interaction pH – [CN] – [AC] for Au(I) adsorption ................... 77
Figure 5.21: Cube plot of the interaction [Ni(II)] – [CN] – [AC] for Au(I) adsorption .............. 77
Figure 5.22: Desirability bar graph representing individual desirability of all responses (di) in
correspondence with combined desirability (D) .................................................................... 81
Figure 5.23: Predicted vs. Experimental values for adsorption capacity of the activated
carbon for the adsorption of Pt(II) ions ................................................................................. 85
Figure 5.24: Predicted vs. Experimental values for adsorption capacity of the activated
carbon for the adsorption of Pd(II) ions ................................................................................ 85
Figure 5.25: Predicted vs. Experimental values for adsorption capacity of the activated
carbon for the adsorption of Au(I) ions ................................................................................. 86
Figure 5.26: Influence plot for detection of outliers in relation with Pt(II) uptake .................. 86
Figure 5.27: Influence plot for detection of outliers in relation with Pd(II) uptake ................. 87
Figure 5.28: Influence plot for detection of outliers in relation with Au(I) uptake .................. 87
Stellenbosch University http://scholar.sun.ac.za
LIST OF FIGURES
The extraction of precious metals from alkaline cyanided medium by granular activated carbon xv
Figure 5.29: Corresponding percentage adsorption profiles for Pt (II), Pd(II) and ................ 90
Figure 5.30: Loading of precious and base metals from synthetic solution onto activated
carbon; unless otherwise stated, experimental conditions were: pH = 9.5, [CN] = 132.44 ppm,
[SCN] = 98.95 ppm and [Activated carbon] = 10 g/L ............................................................ 91
Figure 5.31: Competitive site occupation of precious and base metals loaded onto activated
carbon under optimum conditions: pH = 9.5, Pt(II) = 0.86 ppm, Pd(II) = 1 ppm, Au(I) = 0.17
ppm, Cu(I) = 10 ppm, Ni(II) = 10 ppm, [CN] = 132.44 ppm, [SCN] = 98.95 ppm and 10 times
contact ................................................................................................................................. 92
Figure 5.32: Pseudo-second order adsorption kinetics of Pt(II), Pd(II) and Au(I) onto
activated carbon as a function of time measured at solution pH of 9.5, adsorbent
concentration of 10 g/L, [Pt(II)] of 0.86 ppm, [Pd(II)] of 1 ppm, [Au(I)] of 0.17 ppm, [Cu(I)] of
10 ppm, [Ni(II)] of 10 ppm at 25°C and 2 hours contact time ................................................ 95
Stellenbosch University http://scholar.sun.ac.za
LIST OF TABLES
The extraction of precious metals from alkaline cyanided medium by granular activated carbon xvi
LIST OF TABLES
Table 2.1: Characteristics of Platreef PGM ore types .......................................................... 12
Table 2.2: Ni/PGM Platreef concentrate .............................................................................. 13
Table 2.3: Stability constants and standard reduction potentials for a selection of complexes
of gold (I and III) at 25ºC ...................................................................................................... 24
Table 3.1: Elemental composition of heap cyanide pregnant solution as received ............... 31
Table 3.2: Averaged amount of PMs (Pt, Pd and Au) cyanide in mixed synthetic solutions . 32
Table 3.3: Physical property of activated carbon used in this study ..................................... 32
Table 3.4: Size fraction analysis of granular ........................................................................ 33
Table 3.5: Individual levels of the seven operating factors ................................................... 35
Table 4.1: Activated carbon examined by XRF technique ................................................... 48
Table 4.2: Pseudo-equilibrium uptake of precious and base metals (one loading cycle) ...... 48
Table 5.1: Factors and levels used in factorial design ......................................................... 56
Table 5.2: Standardised main effects from the fitted models for the responses Pt(II), Pd(II)
and Au(I) .............................................................................................................................. 62
Table 5.3: Coefficient of Pt(II), Pd(II) and Au(I) model responses in coded form .................. 63
Table 5.4: Typical range of PM in final concentrates after base metal extraction ................. 80
Table 5.5: Optimization of individual responses (di) in order to obtain the overall desirability
response (D) ........................................................................................................................ 81
Table 5.6: Suitable combination of optimization on PMs (Pt, Pd and Au) adsorption ........... 82
Table 5.7: Feed solution used in loading capacity tests ....................................................... 90
Table 5.8: Profiles for precious and base metals in solution, loading capacity of Pt(II), Pd(II)
and Au(I) under optimum conditions .................................................................................... 93
Table 5.9: Distribution coefficients for adsorption of base and PMs onto activated carbon .. 94
Table 5.10: Standard Gibbs free energy for the adsorption ................................................. 96
Stellenbosch University http://scholar.sun.ac.za
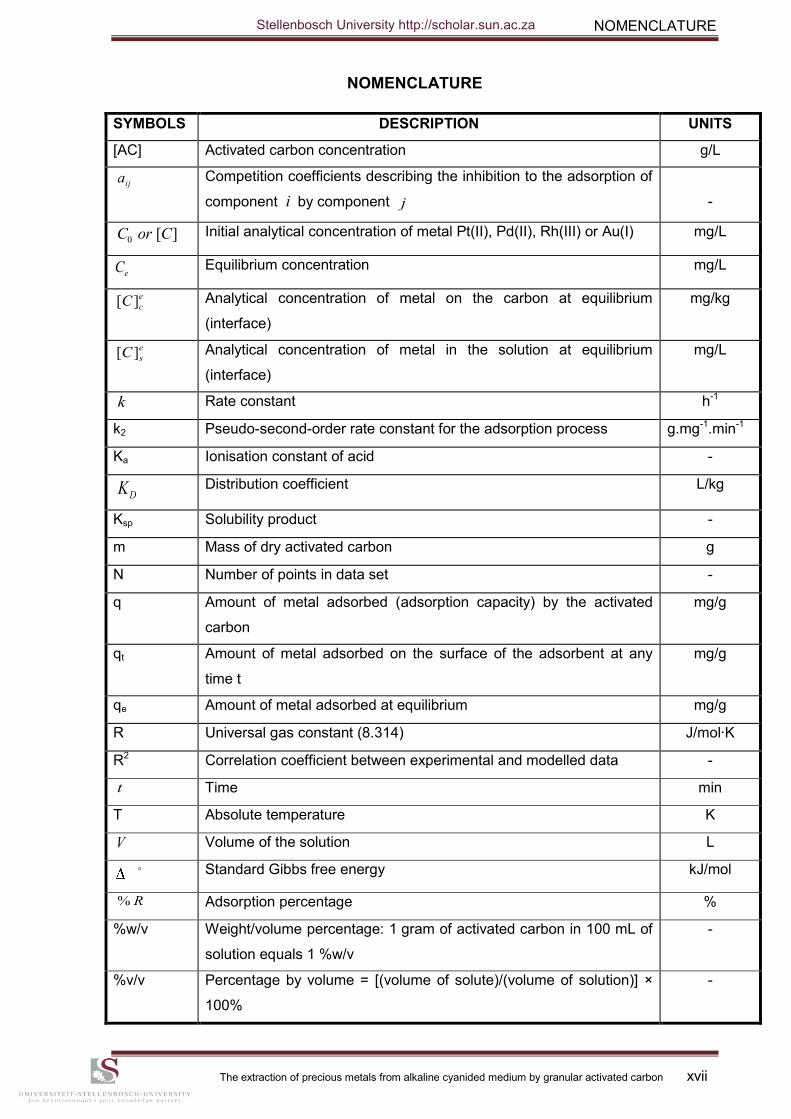
NOMENCLATURE
The extraction of precious metals from alkaline cyanided medium by granular activated carbon xvii
NOMENCLATURE
SYMBOLS DESCRIPTION UNITS
[AC]
Activated carbon concentration g/L
Competition coefficients describing the inhibition to the adsorption of
component by component
-
Initial analytical concentration of metal Pt(II), Pd(II), Rh(III) or Au(I) mg/L
Equilibrium concentration mg/L
Analytical concentration of metal on the carbon at equilibrium
(interface)
mg/kg
Analytical concentration of metal in the solution at equilibrium
(interface)
mg/L
Rate constant h-1
k2 Pseudo-second-order rate constant for the adsorption process g.mg-1.min-1
Ka Ionisation constant of acid -
Distribution coefficient L/kg
Ksp Solubility product -
m Mass of dry activated carbon
g
N Number of points in data set -
q Amount of metal adsorbed (adsorption capacity) by the activated
carbon
mg/g
qt Amount of metal adsorbed on the surface of the adsorbent at any
time t
mg/g
qe Amount of metal adsorbed at equilibrium mg/g
R Universal gas constant (8.314) J/mol·K
R2 Correlation coefficient between experimental and modelled data -
Time min
T Absolute temperature K
Volume of the solution L
G Standard Gibbs free energy kJ/mol
Adsorption percentage %
%w/v
Weight/volume percentage: 1 gram of activated carbon in 100 mL of
solution equals 1 %w/v
-
%v/v Percentage by volume = [(volume of solute)/(volume of solution)] ×
100%
-
ija
i j
][0 CorC
eC
e
cC][
e
sC][
k
DK
t
V
R%
Stellenbosch University http://scholar.sun.ac.za
LIST OF ABBREVIATONS
The extraction of precious metals from alkaline cyanided medium by granular activated carbon xviii
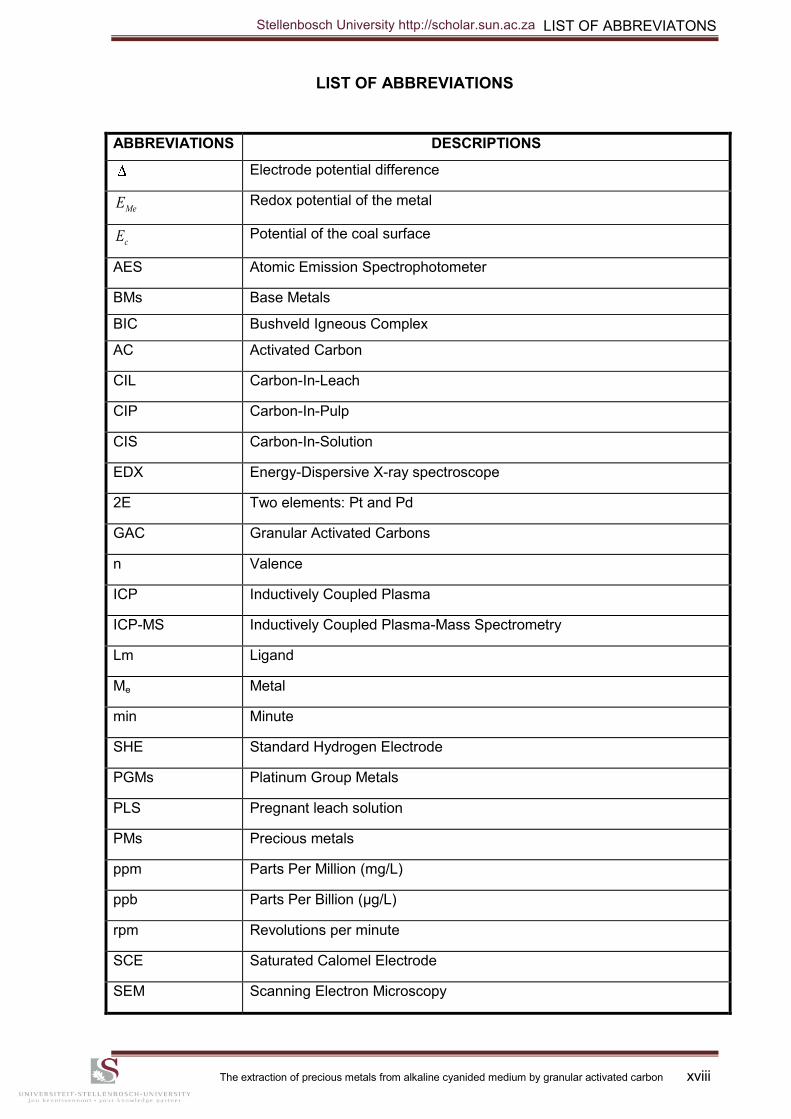
LIST OF ABBREVIATIONS
ABBREVIATIONS DESCRIPTIONS
Electrode potential difference
Redox potential of the metal
Potential of the coal surface
AES Atomic Emission Spectrophotometer
BMs
Base Metals
BIC Bushveld Igneous Complex
AC Activated Carbon
CIL Carbon-In-Leach
CIP Carbon-In-Pulp
CIS Carbon-In-Solution
EDX Energy-Dispersive X-ray spectroscope
2E Two elements: Pt and Pd
GAC Granular Activated Carbons
n Valence
ICP Inductively Coupled Plasma
ICP-MS Inductively Coupled Plasma-Mass Spectrometry
Lm Ligand
Me
Metal
min Minute
SHE Standard Hydrogen Electrode
PGMs Platinum Group Metals
PLS Pregnant leach solution
PMs Precious metals
ppm Parts Per Million (mg/L)
ppb Parts Per Billion (µg/L)
rpm Revolutions per minute
SCE Saturated Calomel Electrode
SEM Scanning Electron Microscopy
E
MeE
cE
Stellenbosch University http://scholar.sun.ac.za
LIST OF ABBREVIATONS
The extraction of precious metals from alkaline cyanided medium by granular activated carbon xix
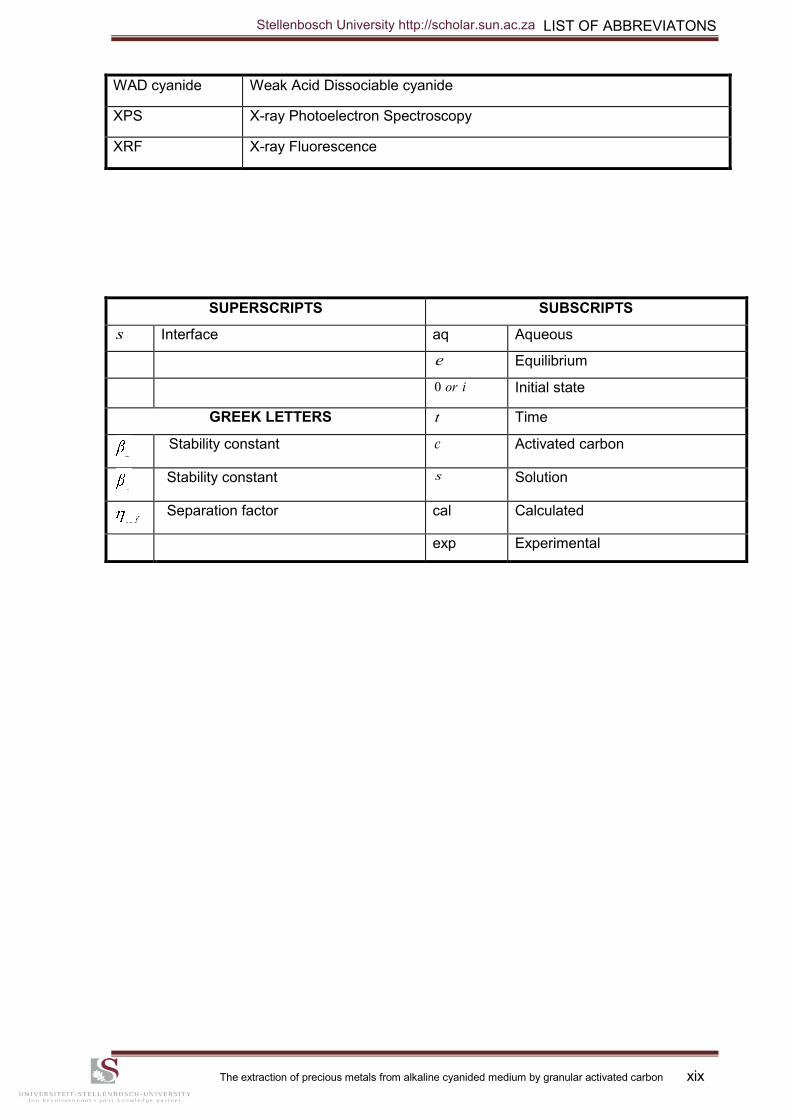
WAD cyanide Weak Acid Dissociable cyanide
XPS X-ray Photoelectron Spectroscopy
XRF X-ray Fluorescence
SUPERSCRIPTS SUBSCRIPTS
Interface aq Aqueous
Equilibrium
Initial state
GREEK LETTERS Time
Stability constant Activated carbon
Stability constant Solution
XY Separation factor cal Calculated
exp Experimental
s
e
ior0
t
2c
4s
Stellenbosch University http://scholar.sun.ac.za
CHAPTER 1 INTRODUCTION
The extraction of precious metals from alkaline cyanided medium by granular activated carbon 1
CHAPTER 1 : INTRODUCTION
This chapter provides an introduction to the research work presented in this thesis. It
describes the research background and explains the motivation for pursuing this work.
The major portion of platinum and palladium produced today originate from the Bushveld
Igneous Complex in South Africa. The most important reefs mined are the Merensky, Upper
Group Two (UG2) and Platreef. Ore grades range from 3 to 8 g PGM/t, with associated
nickel and copper in the 0.1 to 0.2% range present mainly as sulphides (Kyriakakis, 2005).
The platinum group metals were initially recovered from high grade concentrate by the
traditional matte-smelting technique. The smelting has serious environmental impacts – large
carbon footprint due to huge quantities of FeS per PGM-unit which has to be converted to
Fe-bearing slag and SO2 gas – and the lengthy overall flowsheet resulting in unavoidable
losses of PGMs (Chen and Huang, 2006).
However high-grade precious metal reserves have been diminished and the remaining
reserves contain low-grade ores associated with high chromite grades (in the case of UG2)
or high pyrrhotite content (in the case of Platreef), which invariably leads to high smelting
costs (low-grade) and smelter integrity risks (due to the chromite). In this regard a low-cost
hydrometallurgical process, alternative to the smelting, consisting of a heap bioleach process
to first extract the base metals (BMs); followed by a caustic rinse of the residue material and
a heap cyanidation process to subsequently extract the PGMs, has been suggested for
treating low-grade ore concentrate (Mwase, 2009). Lonmin Plc has developed and patented
a novel integrated hydrometallurgical method, suitable to treat low-grade PGM sulphide ores
efficiently and economically (Bax et al., 2009).
Unlike the gold industry, where carbon adsorption has found widespread use in extracting
value from low-grade solutions, no such methods have been widely applied at an industrial
level in the PGM industry. Therefore the recovery of platinum, palladium and eventually other
noble metals from their alkaline cyanide solutions by adsorption onto carbonized supports, is
complex and requires extensive fundamental studies of the mechanism by which activated
carbon adsorbs; with particular regard to possible impurities in the ore body and leach
solution which may interfere. A literature survey of the above requirements revealed very
little relevant information. This work was aimed to fill this gap.
Stellenbosch University http://scholar.sun.ac.za
CHAPTER 1 INTRODUCTION
The extraction of precious metals from alkaline cyanided medium by granular activated carbon 2
1.1 PROBLEM STATEMENT
The present research formed part of a concomitant program of work at the University of
Cape Town on heap bioleaching and cyanide leaching, exploring the practicability of a two
stage heap leach process for the extraction and recovery of PGMs and Au from the Platreef
ore body, with the specific task of investigating the technical feasibility of using granular
activated carbons (GAC) to adsorb Pt(II), Pd(II), Rh(III) and associated Au(I) from the
pregnant leach solution (PLS). Its purpose was to examine the role that some selected
parameters play in understanding and optimizing the conditions favouring the simultaneous
adsorption of Pt(II), Pd(II), Au(I) and Rh(III) on activated carbon. The recent papers by
Mwase et al. (2012) provide further general background to the process development.
Following their analogous behaviour to cyanidation (PGMs and Au), the application of carbon
adsorption for extracting PGMs is much more time saving for comparing results than the use
of underdeveloped and/or costly techniques such as: chemical precipitation, solvent
extraction, Merrill-Crowe process and resin exchange. PGM extraction is susceptible to large
number of influences of which the feed composition is the main control parameter; thereby
carbon adsorption was regarded as an invaluable asset for adsorbing PGMs that could lead
to potential optimization. Previous PGM-carbon adsorption of various complexities has been
attempted but still fall short of providing a complete picture of simultaneous extraction of Pt,
Pd and Au in the presence of large amount of base metals, and then several scenarios such
as high thiocyanate and nickel concentrations are yet to be addressed.
1.2 OVERVIEW OF TREATMENT METHODS FOR PRECIOUS METALS RECOVERY
FROM LEACH SOLUTIONS
Various techniques for recovering precious metals from pregnant solutions after cyanide
leaching, including solvent extraction, resin ion-exchange, Merrill-Crowe zinc precipitation
technology and adsorption onto activated carbon, have been used (Kyriakakis, 2005; Cortina
et al., 1998; Kordosky et al., 1992). Each method has its own advantages and
disadvantages, and may be effective in recovery of precious metals from the common
concentration of clear solutions, but may become less efficient or even inadequate when
trace precious metal ions are to be recovered from cyanided pulp (e.g. solvent extraction).
However, the adsorption of precious metal cyanide ions onto activated carbon is probably the
most suitable as large volumes of very dilute solutions can be treated economically. The
adsorption method is widely used for aurocyanide treatment because of its convenient
operation, effectiveness and relatively low cost. Activated carbon is the main adsorbent
material used in the adsorption process due to its high specific surface area, which is
Stellenbosch University http://scholar.sun.ac.za
CHAPTER 1 INTRODUCTION
The extraction of precious metals from alkaline cyanided medium by granular activated carbon 3
normally in the range of 800 to 1500 m2/g (Hu et al., 2000; Hassler, 1963). Hence in this
study, the analogous route to Au extraction was used for extracting PGMs.
1.2.1 Solvent extraction route
Efforts have been made to investigate the use of liquid extractants for various separations
and purification processes involving base and precious metal ions. Recently, Mintek has
developed a gold (from chloride media) refining process based on solvent extraction (Feather
et al., 1997). Mooiman and Miller (1991) have used tributyl phosphate (TBP) and ditributyl
butyl phosphate (DBBP) as carriers for quantitative extraction of Au(I) from cyanide alkaline
medium. They demonstrated that the adsorptive behaviour of Au(CN) in presence of
solvating extractants is analogous to that observed onto activated carbon. Riveros (1990)
studied the recovery of gold from real cyanide solutions using commercial quaternary amines
and aromatic diluent, found that quaternary amines exhibited fast kinetics, high loading
capacity, low water solubility and good selectivity for gold over base metals.
However according to Kargari et al. (2004), solvent extraction is very difficult for the
separation of trace amounts of metal ions (≈ 0.1 ppm in this work) because of low driving
force, and then a large amount of solvent is required. These make the extraction and
stripping of desired species very expensive. Niu and Volesky (1999) stressed that solvent
extraction is restricted to treatment of clarified solutions and liquid extractants have some
solubility in water, which results in solvent and gold losses to the aqueous phase as well as a
pollution issue.
1.2.2 Resin ion-exchange process
Like solvent extraction, adsorption by ion-exchange resins often offers higher selectivity (Niu
and Volesky, 1999). The uptake of gold and silver cyano complexes from dilute cyanide
solutions can be accomplished with both strong and weak-base resins. Strong-base resins
have the advantage of fast loading rates and high loading capacity, but with the drawback of
poor selectivity with respect to base metals and more difficult elution than weak-base
resins (Ciminelli, 2002). According to Grosse et al. (2003), the use of resin adsorbents for the
recovery of precious metals is relatively underdeveloped area of hydrometallurgy. The
principal reason behind this is the abundance and efficacy of cheap activated carbon
adsorbents. Wan and Miller quoted by Flett (1992) caution that additional contributions in the
area of resin synthesis are still required, and that elution procedures for strong base resins
are still not satisfactory despite the demonstrated ability to elute gold from strong base resins
with alkaline zinc cyanide.
2
Stellenbosch University http://scholar.sun.ac.za
CHAPTER 1 INTRODUCTION
The extraction of precious metals from alkaline cyanided medium by granular activated carbon 4
1.2.3 Merrill – Crowe zinc precipitation technology
The Merrill-Crowe process is a classic cementation reaction involving oxidation and
reduction. Normally it is applied to solutions generated either from a solid-liquid separation
step downstream of a grinding and leaching operation, or from solutions originating from
heap-leaching, if the concentration of gold in solution is not below a nominal of
1.42 ppm (Heinen et al., l978). It has also been used on eluates from carbon stripping and
solutions from intensive cyanidation (Walton, 2005). The process was first used to treat hot,
high-grade solutions produced by carbon elution in 1981 in the United States and South
Africa, and have subsequently been applied widely around the world as an alternative to
electrowinning (Marsden and House, 2006).
The Merrill-Crowe procedure, in which gold is precipitated with zinc dust in accordance with
the reaction shown in Equation 1.1, is the traditional technology (Laxen et al., 1979). The
precipitant, carefully chosen for redox potential, stochiometrically reduces the precious
metals in solution. The more common precipitants are copper and zinc, although iron or
aluminium are sometimes employed (Grosse et al., 2003).
(1.1)
The drawback with the Merrill-Crowe process is the separation stage prior to cementation.
The solution is clarified and degassed to remove the remaining solids and oxygen,
respectively. Such a process is costly and usually results in a loss of approximately 1% of the
gold in solution (Fleming, 1992).
From the previously published literature, the results are sometimes conflicting and often the
conditions used are not described in much detail. Miller et al. (1990) stated that the Merrill-
Crowe process is generally used for gold precipitation from dilute aurocyanide solutions.
According to Parga et al. (2007), the process is preferred for a very rich pregnant solution.
Paul et al. (1983) have defined a concentrated aurocyanide solution as having gold
concentrations ranging from 50 to 2000 ppm, while dilute aurocyanide solutions from heaps
are defined as those having gold concentrations in the range of 1 to 10 ppm Au.
McDougall and Hancock (1981) have demonstrated that activated carbon is an excellent
scavenger for small concentrations of dissolved gold (0.2 mg/L or less), while the Merrill-
Crowe process as currently practised in South Africa requires very careful control in order to
yield barren solutions analysing less than 0.01 ppm of gold. Thus it is sometimes difficult to
interpret the results found from this literature, given their inconsistencies.
2
2
422 21)(2)( HOHCNZnAuCNOHCNAuZn
Stellenbosch University http://scholar.sun.ac.za
CHAPTER 1 INTRODUCTION
The extraction of precious metals from alkaline cyanided medium by granular activated carbon 5
Furthermore, many of the more common constituents of gold-cyanidation solutions such as
sodium sulphide, cyanide complexes of copper, arsenic and antimony significantly decrease
the cementation recovery of gold when they are present in concentrations of more than
M10 5 (Davidson et al., 1979). Fleming (1992) argued that the only species that have a
marked deleterious effect on cementation process – effect observed even at very low
concentrations of 1 ppm and lower – appear to be sulphide ions, soluble compounds of
arsenic and antimony.
Finally, the Merrill-Crowe process is preferred over carbon adsorption for the treatment of
high-grade gold solutions, or for solutions which contain a large amount of silver; typically a
recoverable silver content of more than 10 g/t (0.3 oz/ton) of ore (Kappes, 2005; Walton,
2005; Kongolo and Mwema, 1998).
1.2.4 Cyanidation and possible extraction methods from the PLS, analogous to
those used for Au
Mwase et al. (2012) and Baghalha et al. (2009) observed that at room temperature and
pressure, the reaction between sodium cyanide and platinum group metals proceeds slowly
due to poor kinetics. Cortina et al. (1998) studied speciation in leaching process of platinum
group metals (PGMs) and revealed that at room temperature (25°C) Pt(CN) , Pd(CN)
and Rh(CN) are the predominant species present in solution over the pH working range of
9 to 12.5. Other metal-cyanide complexes in typical mine leaching solutions such as
2)(CNAg , Fe(CN) , Cu(CN)2
3 , Ni(CN) have been also reported by Nguyen et
al. (1997a).
As in the case of gold, the reactions for PGMs dissolution (Equations 1.3 to 1.5) reported
follow kinetics described by the Elsner Equation 1.2 (Chen and Huang, 2006; Aguilar et al.,
1997; Trexler et al., 1990).
(1.2)
(1.3)
(1.4)
(1.5)
The recovery of gold by adsorption of aurocyanide complexes onto activated carbon is a
well-established commercial metallurgical process. The carbon-in-pulp (CIP) process, which
2
4
3
5
3
6
4
6
2
4
OHCNAuOHOCNAu 4)(4284 222
OHCNPtOHOCNPt 4)(2282 2
422
OHCNPdOHOCNPd 4)(22102 3
522
OHCNRhOHOCNRh 12)(463244 3
622
Stellenbosch University http://scholar.sun.ac.za
CHAPTER 1 INTRODUCTION
The extraction of precious metals from alkaline cyanided medium by granular activated carbon 6
eliminates the necessity of filtrating and thickening, is a complex technique involving
treatment with cyanide under aerobic conditions at high pH (9.5 to 11), to give Au(CN) ions
according to the generally accepted Elsner Equation 1.2 (Heinen et al., l978). The ions are
then recovered by adsorption on activated carbon, followed by elution process in cyanide
caustic solution and electrowinning of the gold (Acton, 1982). A similar approach may be
envisaged for PGMs extraction.
1.2.5 Comparison of aforementioned approaches
As can be seen, both solvent extraction and Merrill-Crowe require solid-liquid separation to
produce clear solutions before their application, while resin ion-exchange is more costly than
adsorption onto activated carbon (Aktas and Morcali, 2011). Thus, complication and
additional expenses render the carbon adsorption process more attractive (Sun and
Yen, 1993). Heinen et al. (l978) stressed that the preferred method for recovering precious
metal values from heap-leach effluents when the concentration of the metal ion in solution is
below a nominal of 1.42 ppm is by adsorption on activated carbon. According to Mwase et
al. (2012) the expected concentration of PGMs in the solution under investigation is most
likely to be in the ppm range.
This makes adsorption on GAC potentially appropriate for the current study, because of the
expected PGM and Au concentrations ranging between 0.5 to 1 ppm each. Barnes et
al. (2000) indicated that the process is repeated in several stages, or tanks, called cascades.
The barren effluent, which is discarded, contains less than 0.04 ppm of gold. By replacing the
Merrill-Crowe zinc cementation step, carbon-in-pulp (CIP) recovery provides a process that
allows the treatment of lower grade and problematic ores (e.g. high-clay ores), at lower
capital, operating costs and higher metal recoveries (Staunton, 2005). Although the CIP
process is generally used to treat low grade gold ore feed, it can also be used for
concentrated feed (Acton, 1982).
1.2.6 Gold cyano complex adsorption mechanisms proposed in the literature
Despite the extensive industrial application of this technology (carbon adsorption) and
numerous studies made on the subject, the mechanism of the adsorption of metal cyano
complexes, including gold, silver etc., onto activated carbons still remains assumptive (Jia et
al., 1998). However, it transpires from the examination of the literature, a common
consensus among most authors with regard to the occurrence of two distinct and successive
(or overlapping) mechanisms of metal cyanides adsorption on activated carbon. These
incorporate both the external film and intraparticle diffusion. This assumption is made by
most authors when modelling the adsorption of gold on activated carbon (e.g. Fleming and
Nicol, 1984; Westermark, 1975).
2
Stellenbosch University http://scholar.sun.ac.za
CHAPTER 1 INTRODUCTION
The extraction of precious metals from alkaline cyanided medium by granular activated carbon 7
1.2.7 Platinum group metal (PGM) complexes uptake
Literature for adsorption of PGMs in cyanide medium using activated carbon is scarce.
Ageeva et al. (2001) had examined the adsorption behaviour of platinum, palladium and gold
from chloride solutions using activated carbon. With regard to Pt, Pd and Au adsorption,
optimal conditions were found to be pH of 1 to 3. Chand et al. (2009) studied the adsorption
process in a hydrochloric acid medium to evaluate the extraction of precious metals from
other divalent base metals like Fe, Ni, Cu. They used porous carbon prepared by
carbonisation from agro-waste. Preferential quantitative adsorption of Au, Pd and Pt was
achieved over various base metals. Cox et al. (2005) reported that activated carbon prepared
from flax shive can be used for gold, silver, palladium and platinum adsorption in hydrochloric
acid medium. Adsorption efficiency decreased in the order Au(III) > Pd(II) > Ag(I) > Pt(II)
Pt(IV). This behaviour could be associated with their respective redox potentials (Simanova
et al., 2008).
Fu et al. (1995) reported on the reducing action of activated carbon fibers. Depending on the
reaction conditions (acidic or alkaline), they observed that metallic platinum precipitated on
the activated carbon fiber surface either as elemental platinum or PtO. Chen et al. (2007)
similarly studied, in hydrochloric acid medium, the reduction-adsorption behaviour of
platinum ions on activated carbon fibers. They indicated that most of the adsorbed platinum
ions were reduced into metallic platinum and about 25% of platinum atoms remained as Pt(II)
or Pt(IV). According to Simanova et al. (2008), activated coals and activated carbon fibers
either usual or modified (for example with coordinating compounds) are capable of
quantitatively and selectively adsorbing trace amounts of the platinum metals from solution.
Although these studies were carried out in clarified synthetic solutions, they present one
common point that activated carbon exhibits not only pronounced ability to ion-exchange, but
also significant reducing ability. Acton (1982) revealed that the oxidation treatment of the
activated carbon not only can be used to selectively erode its surface, create porosity and
thereby increase the surface area; but it gives a variety of oxygen-containing functional
groups on the surface which can play an important role in the adsorption process. Therefore,
knowledge of all aspects taking place at the activated carbon – liquid interface will channel to
a better understanding of the entire PMs adsorption process. Consequently, this will in turn
lead to an efficient process and increased adsorption efficiency.
1.3 OBJECTIVES OF THE RESEARCH
From the literature review, it was apparent that much research has been and is still being
devoted to the performance of gold adsorption and how to improve such performance. There
were no reliable data available in open literature on PGM adsorption behaviour using
Stellenbosch University http://scholar.sun.ac.za
CHAPTER 1 INTRODUCTION
The extraction of precious metals from alkaline cyanided medium by granular activated carbon 8
activated carbon in an alkaline cyanided medium. Thereby, the problem of precious metals
recovery from their cyanided solution by adsorption onto carbonised supports may be
complex and requires extensive fundamental studies of the mechanism.
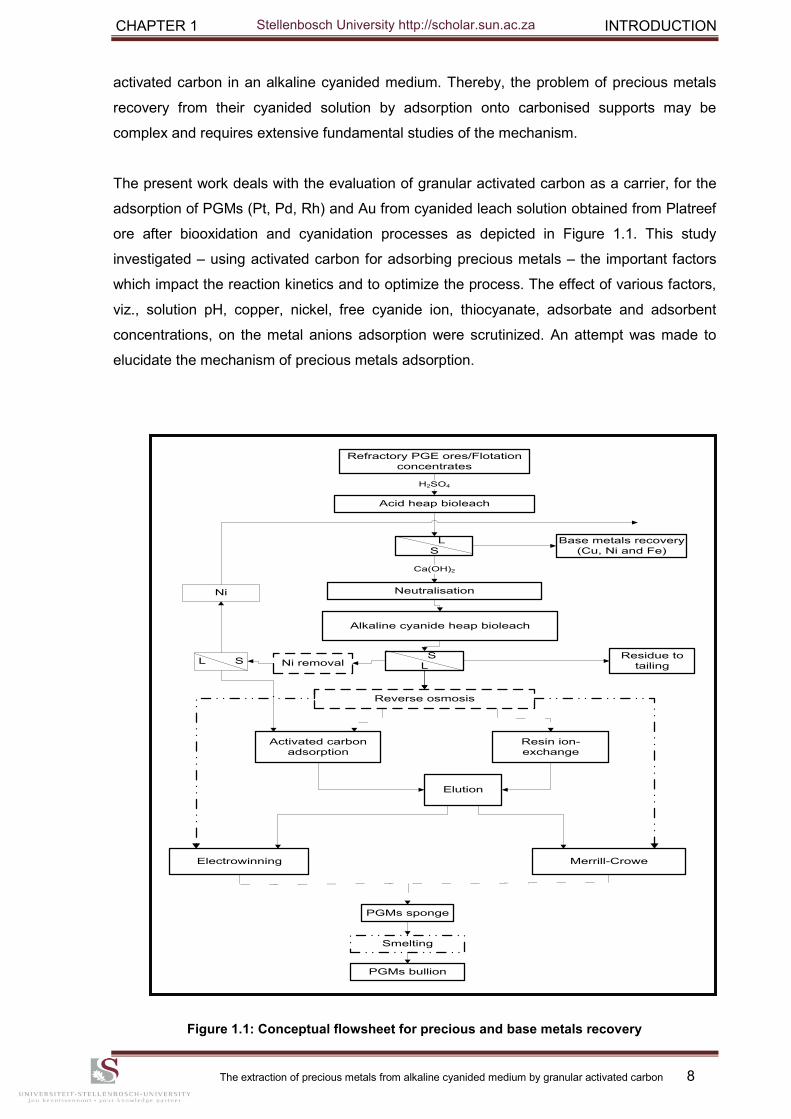
The present work deals with the evaluation of granular activated carbon as a carrier, for the
adsorption of PGMs (Pt, Pd, Rh) and Au from cyanided leach solution obtained from Platreef
ore after biooxidation and cyanidation processes as depicted in Figure 1.1. This study
investigated – using activated carbon for adsorbing precious metals – the important factors
which impact the reaction kinetics and to optimize the process. The effect of various factors,
viz., solution pH, copper, nickel, free cyanide ion, thiocyanate, adsorbate and adsorbent
concentrations, on the metal anions adsorption were scrutinized. An attempt was made to
elucidate the mechanism of precious metals adsorption.
Figure 1.1: Conceptual flowsheet for precious and base metals recovery
Refractory PGE ores/Flotation
concentrates
Acid heap bioleach
L
S
Neutralisation
Base metals recovery
(Cu, Ni and Fe)
Alkaline cyanide heap bioleach
S
L
Activated carbon
adsorption
Reverse osmosis
Merrill-Crowe
Resin ion-
exchange
H2SO4
Elution
Electrowinning
Residue to
tailing
PGMs sponge
Ca(OH)2
Smelting
PGMs bullion
Ni removalL S
Ni
Stellenbosch University http://scholar.sun.ac.za
CHAPTER 1 INTRODUCTION
The extraction of precious metals from alkaline cyanided medium by granular activated carbon 9
In order to complete the abovementioned aim, the following tasks have been identified for the
research, namely:
To investigate possible factors influencing the adsorption process, emphasizing the
effect of the selected parameters. Furthermore, the test program should provide the
opportunity to elucidate the possible transport mechanism.
To investigate and develop a simple empirical model that can predict the extent to
which activated carbon extraction methods can be used to adsorb PM ions from a
cyanided leachate.
1.4 IMPORTANCE AND BENEFITS OF THE RESEARCH
This study will be of significance in developing efficient, cost effective procedure of PMs
recovery from cyanided solution using activated carbon adsorption route. Moreover, this
research project will provide the researcher with experimental values, which will be useful for
a test on a pilot scale, as well as contribute to the academic discourse and debate within this
discipline.
The objectives of the current study are encompassed in the following research questions:
Can activated carbon be used to adsorb PGMs?
What are the effects of key operating parameters?
What is the loading capacity of the carbon?
When the activated carbon exhibits its dual features (physical and chemical), which
one is predominant over another?
1.5 RESEARCH DESIGN AND METHODOLOGY
Even though the traditional approach „„one-factor-at-a-time‟‟ experimentation can be useful in
finding predominant factors in a given situation, it is a time and energy consuming
method (Diamond, 1989). Furthermore, since the results are valid only under fixed
experimental conditions, prediction based on them for other conditions is
uncertain (Robinson, 2000). Design of experiments is a process of testing using a structured
plan in which the input factors are varied in an organized manner to optimize efficiently
output responses of interest with minimal variability (Frey et al., 2003).
Stellenbosch University http://scholar.sun.ac.za
CHAPTER 1 INTRODUCTION
The extraction of precious metals from alkaline cyanided medium by granular activated carbon 10
Thus in order to achieve significant information with the smallest number of experiments,
reducing overall working costs, fractional factorial design and scrutiny of tests were used in
an attempt to not only predict adsorption rate accurately but also to incorporate selected
operating parameters namely: solution pH, copper, nickel, free cyanide ion, thiocyanate,
adsorbent and initial metal ion (Pt, Pd, Rh and Au) concentrations.
1.6 THESIS OVERVIEW
The first chapter of this thesis presents the overall objectives for the study. Currently used
techniques for extracting PMs are also discussed. Chapter 2 is a review of the literature,
providing background information on the extraction processes and a review of the methods
employed in the recovery of gold and PGMs from cyanide solutions. Major references related
to this study are cited. Several factors that influence the adsorption process performance are
reviewed. This chapter provides a comprehensive overview of recent research and
illuminates on-going investigations and open issues to provide a foundation for further study.
In Chapter 3, the experimental methodologies to address the problem are outlined. This
chapter provides also the experimental procedure used to achieve the objectives expressed
in section 1.3. Chapter 4 presents the findings of the preliminary adsorption tests, outlining
the effects of iron, copper, nickel and thiocyanate on the adsorption of Pt(II), Pd(II) and Au(I).
Chapter 5 provides a discussion of the results of the investigation. Quantitative data were
analysed and the emergent findings of the investigation are presented in this chapter. The
chapter also explores approaches involving formal statistical analysis to support the
arguments on effects of process parameters.
Chapter 6 summarizes major findings of the entire research study. Recommendations for
future research are also listed in this chapter. Appendix A gives the tabulation of
experimental data derived from the screening and actual tests, whilst Appendix B provides
figures. The tabulation of statistical data is displayed in Appendix C, while Appendix D
provides the supporting calculations derived from synthetic stock solution preparation and
mean particle size of activated carbon. Appendix E gives an overview of the risk
management plan of the Akanani platinum project and Appendix F provides publications from
this thesis.
Stellenbosch University http://scholar.sun.ac.za
CHAPTER 2 LITERATURE REVIEW
The extraction of precious metals from alkaline cyanided medium by granular activated carbon 11
CHAPTER 2 : LITERATURE REVIEW
This chapter provides an overview of relevant academic studies on the topic under
discussion, as well as an evaluation of theory related to the subject. In addition it provides an
overview of the approach taken as well as of the results obtained.
The most important parts in activated carbon-based recovery processes are the leaching and
the adsorption sections, because the efficiency of these operations determines the amount of
soluble metals lost in the residues from a plant. The need to treat increasingly low grade
and/or refractory PGM ores and the continuing search for improvements in the economics of
existing operations has led to several developments and innovations in PGM extraction
metallurgy during the last two decades (Liddell and Adams, 2012; Prasad et al., 1991). A
comprehensive review exploring test-work on sulphide PGMs leaching, in which a variety of
lixiviants were evaluated, has been presented by Green et al. (2004). However, more recent
works by Mwase et al., 2012; Chen and Huang (2006); Huang et al. (2006) have focused
attention upon a direct hydrometallurgical processing of sulphide flotation concentrates.
2.1 MINERALOGY OF PLATREEF ORES
Three broad ore types are found within the Bushveld Igneous Complex (BIC) and exploited
for their PGM values: the Merensky reef, Upper-Group-Two (UG2) reef and Platreef (Cramer,
2001). Numerous studies have been carried out on the mineralogy of the main PGM-bearing
horizons in the Eastern and Western limbs of the Bushveld Complex (i.e. the Merensky and
UG2 reefs), but new information is only just beginning to emerge on the mineralogy of the
PGM-bearing lithologies of the Northern Limb (Hutchinson and McDonald, 2008).
Generally PGM ores are grouped into three primary classes based on the combination of
PGMs content and the mode of geological occurrence (Xiao and Laplante, 2004): 1) PGM
dominant ores, 2) Ni-Cu dominant ores, 3) Miscellaneous ores. The Platreef in the northern
limb of the Bushveld Igneous Complex (BIC) area, near Potgietersrus can be classified in the
second category. Grades are low on average, at 2 to 5 g/t, but with high nickel and copper
grades of 0.2 to 0.3% and 0.15 to 0.20%, respectively (Cramer, 2001).
From their studies, Schouwstra and Kinloch (2000) found that the Platreef mineralogy
consists of a complex assemblage of pyroxenites, serpentinites and calc-silicates. Both PGM
and BM populations display large mineralogical variability in value as well as in distribution.
The PGMs occurrence of the Platreef has been also described by Newell (2008). He
Stellenbosch University http://scholar.sun.ac.za
CHAPTER 2 LITERATURE REVIEW
The extraction of precious metals from alkaline cyanided medium by granular activated carbon 12
revealed a PGM assemblage dominated by different phases including: Pt-Pd tellurides,
followed by the arsenides, alloys and sulphides. Newell (2008) argued that PGMs are
coarser than those in the Merensky reef ores, PGM tellurides and arsenides are
encapsulated in the silicate gangue. The following PGM minerals have been identified:
Moncheite [(Pt,Pd)(Bi,Te)2 – PtTe2)] + Merenskyite [(Pd,Pt)(Bi,Te)2 – PdTe2] >> Sperrylite
(PtAs2) > Isoferroplatinum (Pt3Fe) > Braggite (Pt,Pd,Ni)S.
Cramer (2001) has indicated that PGM mineralogy in the Platreef is more complex and
erratic. Tellurides and arsenides are more common minerals. Sperrylite (PtAs2) is the most
common PGM mineral, and the platinum-palladium ratios are typically 1:1 within the
Platreef (Lee, 1996). Schouwstra and Kinloch (2000) found that common base metal
sulphides include pyrrhotite (Fe(1-x)S, 0 < x < 0.2), pentlandite (Ni,Fe)9S8 and chalcopyrite
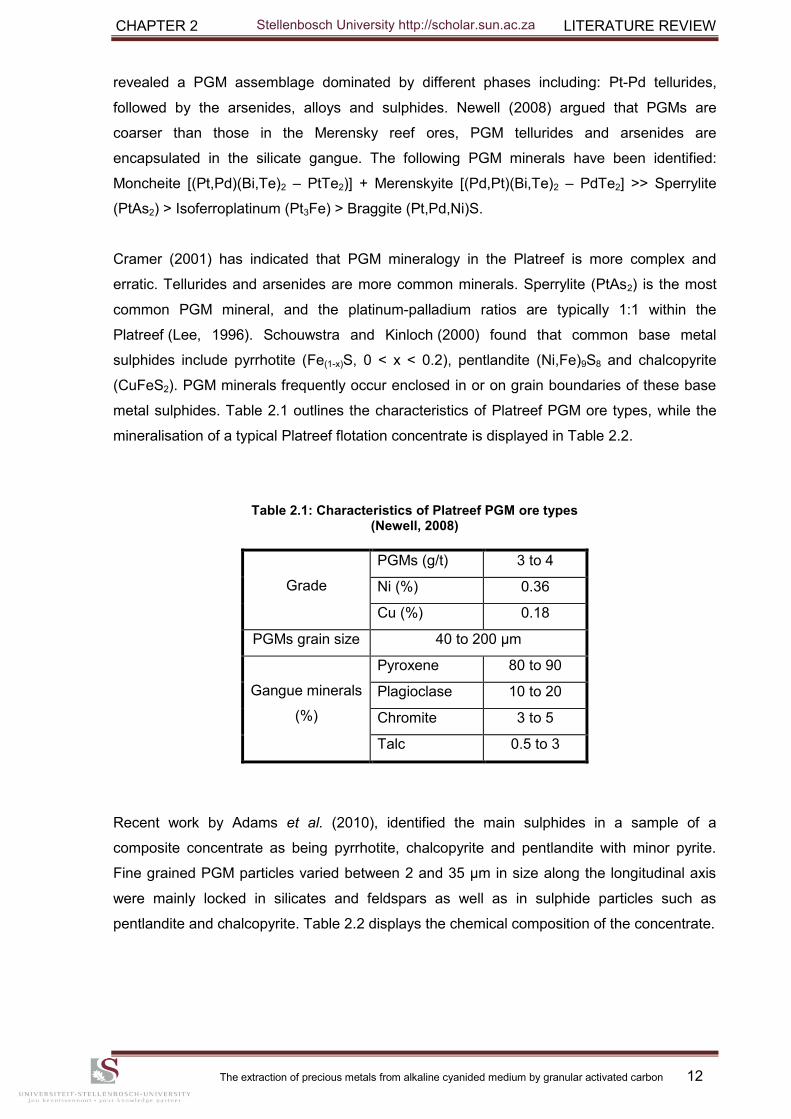
(CuFeS2). PGM minerals frequently occur enclosed in or on grain boundaries of these base
metal sulphides. Table 2.1 outlines the characteristics of Platreef PGM ore types, while the
mineralisation of a typical Platreef flotation concentrate is displayed in Table 2.2.
Table 2.1: Characteristics of Platreef PGM ore types (Newell, 2008)
Grade
PGMs (g/t) 3 to 4
Ni (%) 0.36
Cu (%) 0.18
PGMs grain size 40 to 200 µm
Gangue minerals
(%)
Pyroxene 80 to 90
Plagioclase 10 to 20
Chromite 3 to 5
Talc 0.5 to 3
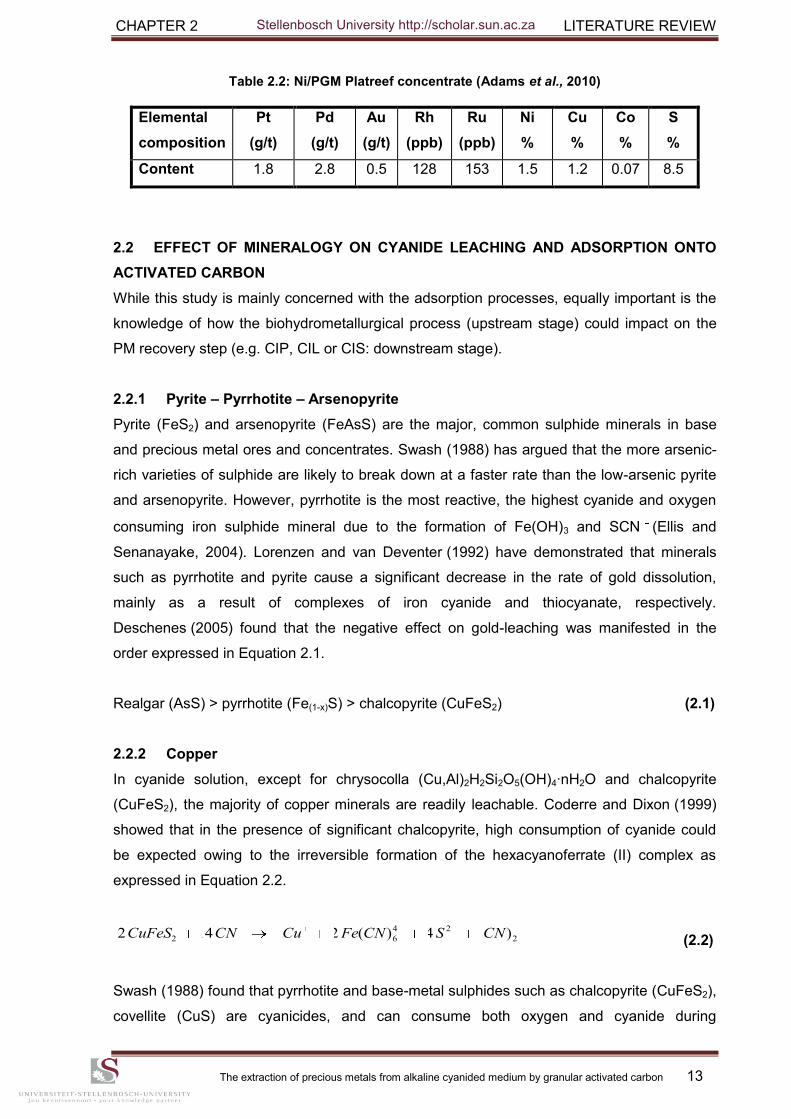
Recent work by Adams et al. (2010), identified the main sulphides in a sample of a
composite concentrate as being pyrrhotite, chalcopyrite and pentlandite with minor pyrite.
Fine grained PGM particles varied between 2 and 35 µm in size along the longitudinal axis
were mainly locked in silicates and feldspars as well as in sulphide particles such as
pentlandite and chalcopyrite. Table 2.2 displays the chemical composition of the concentrate.
Stellenbosch University http://scholar.sun.ac.za
CHAPTER 2 LITERATURE REVIEW
The extraction of precious metals from alkaline cyanided medium by granular activated carbon 13
Table 2.2: Ni/PGM Platreef concentrate (Adams et al., 2010)
Elemental
composition
Pt
(g/t)
Pd
(g/t)
Au
(g/t)
Rh
(ppb)
Ru
(ppb)
Ni
%
Cu
%
Co
%
S
%
Content 1.8 2.8 0.5 128 153 1.5 1.2 0.07 8.5
2.2 EFFECT OF MINERALOGY ON CYANIDE LEACHING AND ADSORPTION ONTO
ACTIVATED CARBON
While this study is mainly concerned with the adsorption processes, equally important is the
knowledge of how the biohydrometallurgical process (upstream stage) could impact on the
PM recovery step (e.g. CIP, CIL or CIS: downstream stage).
2.2.1 Pyrite – Pyrrhotite – Arsenopyrite
Pyrite (FeS2) and arsenopyrite (FeAsS) are the major, common sulphide minerals in base
and precious metal ores and concentrates. Swash (1988) has argued that the more arsenic-
rich varieties of sulphide are likely to break down at a faster rate than the low-arsenic pyrite
and arsenopyrite. However, pyrrhotite is the most reactive, the highest cyanide and oxygen
consuming iron sulphide mineral due to the formation of Fe(OH)3 and SCN (Ellis and
Senanayake, 2004). Lorenzen and van Deventer (1992) have demonstrated that minerals
such as pyrrhotite and pyrite cause a significant decrease in the rate of gold dissolution,
mainly as a result of complexes of iron cyanide and thiocyanate, respectively.
Deschenes (2005) found that the negative effect on gold-leaching was manifested in the
order expressed in Equation 2.1.
Realgar (AsS) > pyrrhotite (Fe(1-x)S) > chalcopyrite (CuFeS2) (2.1)
2.2.2 Copper
In cyanide solution, except for chrysocolla (Cu,Al)2H2Si2O5(OH)4·nH2O and chalcopyrite
(CuFeS2), the majority of copper minerals are readily leachable. Coderre and Dixon (1999)
showed that in the presence of significant chalcopyrite, high consumption of cyanide could
be expected owing to the irreversible formation of the hexacyanoferrate (II) complex as
expressed in Equation 2.2.
(2.2)
Swash (1988) found that pyrrhotite and base-metal sulphides such as chalcopyrite (CuFeS2),
covellite (CuS) are cyanicides, and can consume both oxygen and cyanide during
2
24
62 )(4)(22142 CNSCNFeCuCNCuFeS
Stellenbosch University http://scholar.sun.ac.za
CHAPTER 2 LITERATURE REVIEW
The extraction of precious metals from alkaline cyanided medium by granular activated carbon 14
cyanidation; thereby giving rise to problems in the extraction of precious metals. According to
Deschenes (2005), copper sulphides usually show higher cyanide consumptions than iron
sulphides.
A. Behaviour of copper on carbon adsorption processes
As stated earlier, copper dissolves readily in alkaline cyanide solution to give the di-, tri- and
tetracyanocuprate (I) complexes, of which Cu(CN) is the predominant complex ion; while
Cu(CN) is the least stable complex and tends to disproportionate to Cu(CN)
and
Cu(CN)solid (Coderre and Dixon, 1999). On acidification or lowering of the cyanide level,
Cu(CN) is formed, which is strongly adsorbed onto activated carbon, resulting in an
increase in the rate of free cyanide (CN ) destruction (van Deventer and Ross, 1991). The
adsorption of copper species onto activated carbon increases in the following order
expressed in Equation 2.3 (Marsden and House, 2006). This order could be related to their
respective ionic solvation energy (charge density).
Cu(CN) < Cu(CN) < Cu(CN) (2.3)
Marsden and House (2006) stated that copper concentration as low as 100 mg/L can
interfere severely with gold adsorption processes. The molar ratio of cyanide to copper
should be maintained at or above 4:1 in leach solutions prior to feeding the carbon
adsorption processes. According to Nguyen et al. (1997b), under normal leaching conditions,
the presence of copper, whether in synthetic or native form, causes the cementation of gold,
which is strongly dependent on the cyanide concentration and temperature. In the presence
of copper, polysulfides precipitate with copper to form CuS whose solubility product, Ksp,
equals 6×10-16 at 25°C; with solubility of 2.34 ppb (Aylmore, 2005). The low value for the
solubility product indicates that the salt is not very soluble and the concentration of ions in a
saturated solution is very low.
However, in the presence of oxygen and sufficient free cyanide, the cemented gold can be
redissolved into the solution (see Equation 1.2). Marsden and House (2006) stressed that,
processes that treat materials containing high concentrations of cyanide-soluble copper, that
is, yielding more than 200 mg/L Cu in solution; may be unsuitable for treatment by carbon
adsorption because they require very careful control of pH and cyanide to allow satisfactory
treatment.
2
3
22
3
2
3
4
2
3 2
Stellenbosch University http://scholar.sun.ac.za
CHAPTER 2 LITERATURE REVIEW
The extraction of precious metals from alkaline cyanided medium by granular activated carbon 15
B. Behaviour of other metals
McDougall and Hancock (1981) have observed that, with the exception of copper and to a
lesser extent nickel, metal-cyanide complexes have little effect on gold adsorption efficiency
if they are present in very low concentrations. It can be seen (Equation 2.4) that activated
carbon is highly selective for gold and silver over most other metal species. However
Marsden and House (2006) have postulated that high loadings of nonprecious metals could
be achieved onto activated carbon in the absence of significant precious metal values.
Au(CN) > Hg(CN) > Ag(CN) > Cu(CN) > Zn(CN) > Ni(CN) >> Fe(CN) (2.4)
2.2.3 Sulphide mineral chemistry – Thiocyanate and Thiosulphate formation
It is generally believed that thiocyanate (SCN ) is formed during cyanidation as a result of
reactions between CN and sulphur species (solid or dissolved sulphur). Some of these
reactions are listed in Equations 2.5 to 2.7 below (Botz et al., 2001).
(2.5)
(2.6)
(2.7)
According to Coderre and Dixon (1999), thiosulphate is the primary product of sulphide
oxidation above pH of 8.5, regardless of the S2-/O2 mole ratio, in accordance with the
reaction shown in Equation 2.8.
(2.8)
Lan et al. (1994) found that the amount of elemental sulphur existing in the residue from
bacterial leaching increased with the biooxidation time. Coderre and Dixon (1999) suggested
the dominant reaction pathways for the formation of thiocyanate from the oxidation products
of sulphide to be reaction with either polysulphides or thiosulphate as expressed in Equations
2.9 and 2.10, respectively.
(2.9)
(2.10)
2 2 2
2
3
2
4
2
4
4
6
SCNCNS
OHSCNOOHCNS 221 22
2
SCNSOCNOS 2
3
2
32
OHOSHOS 2
2
322
2 222
SCNSSCNSS xx
2
1
2
SCNSOCNOS 2
3
2
32
Stellenbosch University http://scholar.sun.ac.za
CHAPTER 2 LITERATURE REVIEW
The extraction of precious metals from alkaline cyanided medium by granular activated carbon 16
Lorenzen and van Deventer (1992) indicated that pyrrhotite varying in chemical composition
from Fe5S6 to Fe16S17, readily reacts with cyanide to form thiocyanate. According to Lizima et
al. (2005) in heap bioleaching, several chemical reactions occur simultaneously, individual
metal extractions cannot be studied separately; sulphur may be formed by the reaction
between pyrrhotite and ferric iron as in Equation 2.11. Holtum and Murray (1994) have
shown that sulphur may also be formed by the reaction between pyrite and ferric iron in
Equation 2.12. Jones and Hackl (1999) argued that thiocyanate results from the reaction of
cyanide with incompletely oxidized, meta-stable sulphur compounds that form during
biooxidation.
(2.11)
(2.12)
Iglesias and Carranza (1996) have concluded that any elemental sulphur formed during the
ferric pre-treatment, can cause serious difficulties in the further cyanide leaching stage,
because it produces thiocyanate ions; these may reduce gold dissolution, increasing the
consumption of cyanide. Jeffrey and Breuer (2000) argued that at the typical pH of gold
processing, ten or more, any S2- present in solution is converted to HS . It was found that
sulphide species decreased the dissolution rate of gold and also counteracted the
accelerating effect of lead species within the potential range typically encountered in
conventional gold leaching, i.e. from - 600 to 0 mV (SCE) (Tshilombo and Sandenbergh,
2001).
Bacteria can oxidize elemental sulphur to sulphate. The oxidation involves several
intermediates (e.g. thiosulphate, tetrathionate, sulphite) in the oxidative pathway to sulphate
formation. According to Bevilaqua et al. (2002), the oxidation rate appears to be slower than
the rate of elemental sulphur formation, because elemental sulphur is often found in solid
residues from bacterial leaching systems. As can be seen, the analysis for all individual
sulphur components of such mixture (solution) is desirable since the measurement of total
sulphur content does not usually provide sufficient information.
2.2.4 Effect of thiocyanate – Complex stability
Depending on the solution potential, acidified thiocyanate in aqueous solutions can dissolve
gold to form both Au(I) and Au(III) complexes (Kuzugüdenli and Kantar, 1999).
Aylmore (2005) found that gold can be leached by thiocyanate at potentials of around 0.4 to
0.45 V and pH of 1 to 3 in the presence of either ferric ions or peroxide as oxidant. Therefore,
it is imperative that an oxidizer and complexing agent are present in solution to extract gold.
023 32 SFeFeFeS
023
2 232 SFeFeFeS
Stellenbosch University http://scholar.sun.ac.za
CHAPTER 2 LITERATURE REVIEW
The extraction of precious metals from alkaline cyanided medium by granular activated carbon 17
Higher redox potentials and relatively acidic conditions are required as compared with
cyanide solutions (Iglesias and Carranza, 1996). The simplified reaction can be written as in
Equation 2.13.
(2.13)
Thiocyanate anions were shown to have a very detrimental effect on the rates and capacity
constants of gold adsorption, when added individually to a synthetic solution at the
approximate concentration levels of 100 ppm as found in the plant solutions (Davidson et al.,
1979). Whereas Cortina et al. (1998) have observed a very high concentration of SCN ,
about 150 ppm, due to the dissolution of pyrrhotite that was present at only 1.5% level in the
treated minerals.
SCN being a strong complexing agent can further react with metals to form thiocyanate
complexes such as Au(SCN) and Au(SCN) (Iglesias and Carranza, 1996). Furthermore,
the same authors have argued that silver, like gold, can form a series of thiocyanate
complexes: AgSCN has both solid and soluble forms. The solid AgSCN is a very stable
compound under the cyanide leaching conditions [Ksp at 25ºC = 1.03×10⁻¹², with solubility of
168.4 ppb. For Pd(SCN)2, Ksp = 4.39×10⁻²³, with solubility of 4.95 ppb]. Thiocyanate is also
known to form complexes with several metal cations. For instance, a precipitate, probably
Cu(CNS)2, is formed with copper (Aylmore, 2005).
Gallagher et al. (1990) have established the effectiveness of activated carbon in removing
complexed gold from aqueous solutions, as decreasing in the following ligand order: SCN >
SC(NH2)2 > CN > S2O The capacity of activated carbon for the gold (I) complexes also
follows this order. The same authors investigated gold adsorption properties of activated
carbon through scanning electron microscopy, and concluded that dithiocyanatoaurate (I),
Au(SCN) , adsorbed onto carbon as metallic gold with no evidence that the Au(I) complex
was present. It bears noting that the dicyanoaurate (I) eluted more readily with deionized
water, while the thiocyanato complex was only removed through a chemisorption process.
2.3 SIMULTANEOUS DETERMINATION OF [CN ] AND [SCN ] IN AQUEOUS
SOLUTIONS
Young et al. (2008) stated that the analysis of cyanide is frequently a source of concern and
confusion for industry; especially in the understanding of the methods, limitations as well as
the cyanide chemistry. In its document, AngloGold Ashanti Limited (Maree, 2008) stressed
2
4
3 3)(34 FeSCNAuFeSCNAu
2 4
.2
3
2
Stellenbosch University http://scholar.sun.ac.za
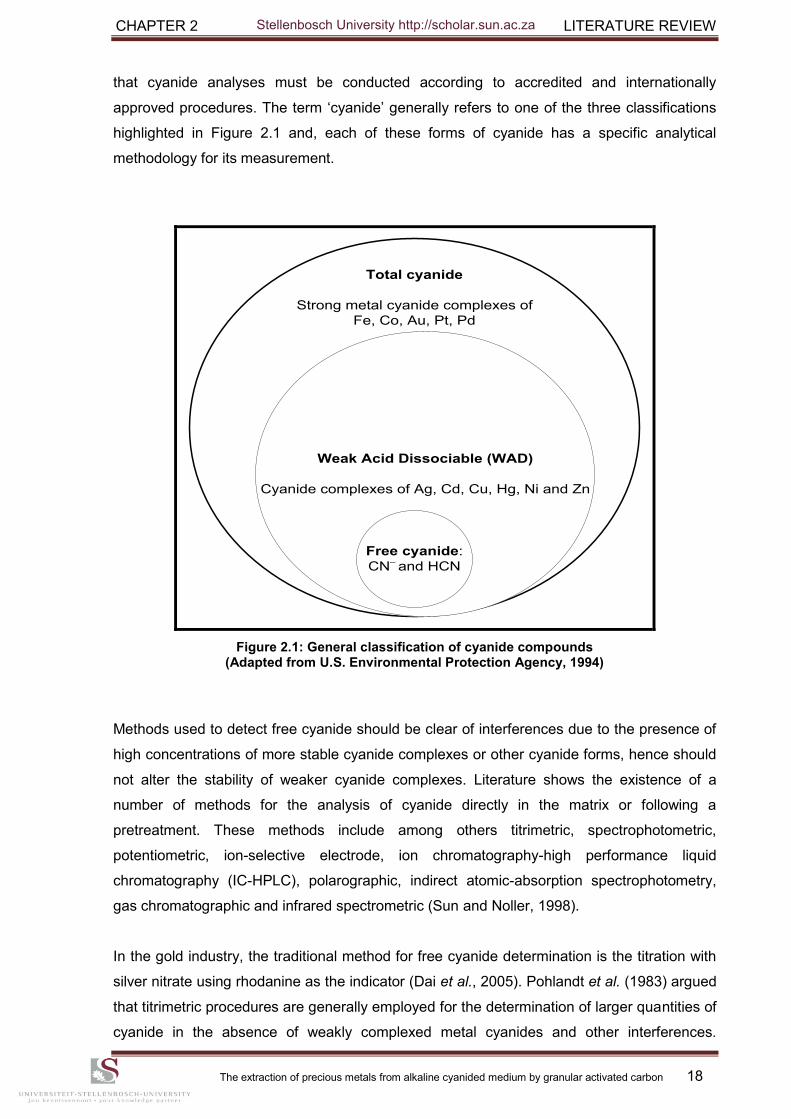
CHAPTER 2 LITERATURE REVIEW
The extraction of precious metals from alkaline cyanided medium by granular activated carbon 18
that cyanide analyses must be conducted according to accredited and internationally
approved procedures. The term „cyanide‟ generally refers to one of the three classifications
highlighted in Figure 2.1 and, each of these forms of cyanide has a specific analytical
methodology for its measurement.
Total cyanide
Strong metal cyanide complexes of
Fe, Co, Au, Pt, Pd
Weak Acid Dissociable (WAD)
Cyanide complexes of Ag, Cd, Cu, Hg, Ni and Zn
Free cyanide:
CN– and HCN
Figure 2.1: General classification of cyanide compounds (Adapted from U.S. Environmental Protection Agency, 1994)
Methods used to detect free cyanide should be clear of interferences due to the presence of
high concentrations of more stable cyanide complexes or other cyanide forms, hence should
not alter the stability of weaker cyanide complexes. Literature shows the existence of a
number of methods for the analysis of cyanide directly in the matrix or following a
pretreatment. These methods include among others titrimetric, spectrophotometric,
potentiometric, ion-selective electrode, ion chromatography-high performance liquid
chromatography (IC-HPLC), polarographic, indirect atomic-absorption spectrophotometry,
gas chromatographic and infrared spectrometric (Sun and Noller, 1998).
In the gold industry, the traditional method for free cyanide determination is the titration with
silver nitrate using rhodanine as the indicator (Dai et al., 2005). Pohlandt et al. (1983) argued
that titrimetric procedures are generally employed for the determination of larger quantities of
cyanide in the absence of weakly complexed metal cyanides and other interferences.
Stellenbosch University http://scholar.sun.ac.za
CHAPTER 2 LITERATURE REVIEW
The extraction of precious metals from alkaline cyanided medium by granular activated carbon 19
However, in addition to the free cyanide and solubilized PMs, typical leach liquor also
contains numerous other species produced by reaction of cyanide with components of the
ore. These species include other metal cyanide complexes (especially those of iron and
copper) and thiocyanate (Fagan and Haddad, 1991).
Breuer et al. (2011) clearly demonstrated that the use of rhodanine as indicator in the
determination of free cyanide in cyanidation leach solutions containing copper and/or
thiosulfate, over-estimated free cyanide concentration and could not be compared directly
against an online cyanide analyser using a potentiometric determination. Fagan and Haddad
(1991) pointed out that the presence of copper cyanide caused interference during titration
with silver nitrate because Cu(CN) is a dissociable complex and the loss of CN from the
copper/cyanide complex increases the value for free cyanide according to Equations 2.14
and 2.15.
Cu(CN) Cu(CN) + CN (2.14)
Cu(CN) Cu(CN) + CN (2.15)
Rhodanine titrations performed on solutions containing sulphide ions are masked by silver
sulphide precipitate. Young et al. (2008) have shown that the most serious interferences
during silver nitrate titration are caused by copper, sulphide and thiosulphate. Samples
containing high sulphide and thiosulphate levels will impart a positive interference in the
silver nitrate titration method through its reaction to yield silver sulphide during titration (Ag2S,
Ksp at 25ºC equals 6×10-50, with solubility of 6.11×10⁻⁹ ppb). Moreover, SCN reacts with Ag+
according to the Volhard titration illustrated in Equation 2.16 (Law and Gabriel, 1986).
Ag + SCN AgSCN (2.16)
Pohlandt et al. (1983) reported that sulphide and thiocyanate complexes are responsible for
the most serious interferences in cyanide determination. Barnes et al. (2000) observed that
sulphide and thiocyanate usually distil with the cyanide and interfere with most analytical
methods. Young et al. (2008) have argued that in the presence of nitrate, thiocyanate
decomposes to form CN , resulting in a positive bias during cyanide distillations; as both
thiocyanate and nitrate are common by-products of cyanidation practice in gold industry.
3
4
3
4
2
3
2
3 2
Stellenbosch University http://scholar.sun.ac.za
CHAPTER 2 LITERATURE REVIEW
The extraction of precious metals from alkaline cyanided medium by granular activated carbon 20
Thus routine titration procedures applied to copper-containing ores can yield erroneously
high results for free cyanide. Failure to make this correction can lead to a decrease in the
rate of PGMs dissolution in the leaching process and ultimately, a reduction in precious
metals recovery at both stages: leaching and adsorption (Fagan and Haddad, 1991).
Pohlandt et al. (1983) have shown that potentially accurate methods for the simultaneous
determination of ionic cyanide and its accompanying interferent, i.e. thiocyanate, include ion
chromatography and indirect atomic-absorption spectrophotometry. According to Gumus et
al. (2000), Fagan and Haddad (1991); thiocyanate is the common interferent in almost all
spectrophotometric determinations of cyanide. When comparing assay techniques for
cyanide and related species, Breuer et al. (2009) and Adams (2001) have mentioned ion
chromatography method as an approach to the simultaneous determination of free cyanide,
cyanate complexes and thiocyanate in cyanidation leach liquor samples.
2.4 ADSORPTION OF PRECIOUS METALS
According to Bailey quoted by Stange (1999), the successful operation of a carbon-in-pulp
plant is centred on the adsorption section, which is expected to extract more than 99.6% of
the gold present in solution. Adsorption processes may be classified as chemical
(chemisorption) and physical adsorption (physisorption), depending on the nature of the
interactive forces. The former, generally irreversible, refers to processes involving homopolar
forces (ionic or covalent bonds), while in the latter (physisorption) interactive forces are
relatively weak: van der Waals forces also dipole-dipole interactions and hydrogen
bonding (McDougall, 1991).
2.4.1 Speciation of aqueous PGM cyano complexes
Knowledge of chemical speciation of the target metals in the leaching solutions to be treated
and the nature and structure of the metal complex to be extracted is very important in
understanding the metal-extraction reactions and selectivity factors (Cortina et al., 1998). As
stated earlier in section 1.2.4, speciation studies by Roijals et al. (1996); Cortina et al. (1998),
revealed Pt(CN) and Pd(CN) ions at room temperature, while Pd(CN) is formed at
140°C. Chen and Huang (2006) pointed out that Pd(CN) is not stable at high temperature
and is easily decomposed to Pd metal when the reaction temperature was higher than
160ºC, whilst the Pt and Rh cyanide complexes remained relatively stable in solution at
180ºC. However, McInnes et al. (1994) have mentioned Pd(CN) complexes formed at
ambient temperature. Considering their divergence, all are assumed doubtful until additional
supporting data are forthcoming.
2
4
3
5
2
4
2
4
2
4
Stellenbosch University http://scholar.sun.ac.za
CHAPTER 2 LITERATURE REVIEW
The extraction of precious metals from alkaline cyanided medium by granular activated carbon 21
There are not sufficient equilibrium data of Rh cyanide complex formation, but several
references point to the formation of Rh(CN) 3
6 in excess CN at 25°C (Aguilar et al., 1997;
Roijals et al., 1996). The most stable oxidation state in Cu, Ag and gold cyano compounds is
one (Sharpe, 1976). The dissolution of gold in an aqueous cyanide solution gives just one
anionic complex (Equation 1.2). Silver dissolves readily in alkaline cyanide solution to give
the di-, tri- and tetracyanosilverate (I) complexes with almost similar formation
constants (Gomes et al., 2001).
2.4.2 Adsorption mechanisms
2.4.2.1 Dicyanoaurate (I) complex
A number of adsorption mechanisms of dicyanoaurate (I) complex on activated carbons have
been proposed over the years (Woollacott et al., 1990; McDougall et al., 1980; Davidson,
1974). Despite years of research and development with activated carbon related to its
commercial importance, there is still not a complete agreement of the gold adsorption
mechanism. The main reason for this is the fact that activated carbon cannot be investigated
by direct physical procedures such as infrared spectroscopy or X-ray diffraction, so that very
little is known about the adsorbent itself (McDougall et al., 1980). The mechanisms proposed
over the years can be simplified into one of the following four different
approaches (McDougall and Hancock, 1981):
Au(CN) ion is adsorbed without undergoing chemical change and held by
electrostatic or van der Waals forces,
adsorption of Au(CN) accompanied by the reduction of the group to metallic gold
Au(0),
adsorption of the aurocyanide ion group in the form of a metal complex
,
Au(CN) decomposition to AuCN and adsorbed as such.
According to Lagerge et al. (1997), the two most widely accepted theories reduce to:
adsorption involving ion pairs, and
adsorption of unpaired Au(CN) ions onto activated carbons.
McDougall and Hancock (1981) have argued that the nature of the mechanism depends on
several parameters such as solution pH, adsorbent and metal ion properties. According to
Yin et al. (2007), activated carbon as an inert porous carrier material, is capable of
distributing chemicals on its large hydrophobic internal surface; thus making them accessible
2
2
n
n CNAuM ])([ 2
2
n
n CNAuM ])([ 2
2
Stellenbosch University http://scholar.sun.ac.za
CHAPTER 2 LITERATURE REVIEW
The extraction of precious metals from alkaline cyanided medium by granular activated carbon 22
to reactants. It is also well established that activated carbon has a very low affinity for small,
highly hydrated inorganic ions (McDougall and Hancock, 1981).
2.4.2.2 PGM cyano complexes
Although the kinetics of gold adsorption onto activated carbon are well documented, the
consensus on the mechanism is only recently being achieved (Poinern et al., 2011). As far
as the kinetics of PGM cyano complexes adsorption on activated carbon are concerned, the
information available is rather limited.
Aguilar et al. (1997) reported their study on adsorption (onto activated carbon) of Fe(II),
Cu(I), Ni(II), Pd(II), Pt(II), Rh(III)-cyano complexes and NO ions from a mixture of leaching
solutions. With regard to the adsorption uptake, they found that Pt(II), Pd(II) and Ni(II)
cyanides were selectively adsorbed in a short time, while Rh(III) and Fe(II) cyanide showed
much slower and lower adsorption. They concluded that the selective uptake could be bound
to their chemical structures: square planar for Pd(II), Pt(II) and Ni(II) while octahedral for
Fe(II) and Rh(III).
Ionic solvation energy theory has also been used to explain the selective adsorption
mechanism onto activated carbon (Jia et al., 1998; McDougall and Hancock, 1981).
According to the theory, a large, weakly hydrated anion (with low charge density) will be
specifically adsorbed on the adsorbent surface after losing some of its primary-hydration
water molecules. Small anions with a large number of strongly bound water molecules in
their primary hydration shells (high charge density) will not be specifically adsorbed and will
therefore remain in the outer part of the electrical double layer (McDougall et al., 1980).
The aforementioned behaviour is possibly a consequence of densely charged species having
larger hydration shells, have lower coulombic interaction with their counterions than those
with smaller hydration shells (Bernardis et al., 2005). The larger cations, however, are less
well hydrated resulting in an enhanced extractability into the hydrophobic carbon
phase (Adams et al., 1987). According to the charge density principle, Pt(CN) (2 electric
charges are carried out by 9 atoms) can be expected to be more strongly extracted than the
highly hydrated Rh(CN) complex (Cortina et al., 1998). It is also generally known that if two
species in a loading solution are competing for adsorption onto carbon, the latter will prefer
the least soluble (McDougall and Hancock, 1981). Walter and Weber (1974) stressed that
the more hydrophilic a substance, the less likely it is to be adsorbed. Conversely, a
hydrophobic substance will more likely be adsorbed.
3
2
4
3
6
Stellenbosch University http://scholar.sun.ac.za
CHAPTER 2 LITERATURE REVIEW
The extraction of precious metals from alkaline cyanided medium by granular activated carbon 23
By analogy to what is observed in gold complex coordination compounds which incorporate
cyanide as a ligand, these considerations give rise to the statement that the dissolved PGM
cyanide is adsorbed as the cation PGM cyanide ion pair. Thus, it is reasonable to assume
that the mechanism of PGMs recovery from cyanide solutions could occur as proposed
in Equation 2.17.
(2.17)
where X denotes Pt, Pd or Rh, is an appropriate metal ion such as Na+, K+, Ca2+ or H+;
m = 1, 2 or 3.
Moreover, a simple approach to the problem of whether platinum and palladium are present
as Pt(CN) and Pd(CN) ,would involve the analysis of loaded carbons for their PGM and
nitrogen contents, which would indicate how many cyanide ions are associated with the
PGMs on the carbon. Surface analysis studies of the barren and loaded carbon will
contribute to a better understanding of the mechanisms involved in the PGMs adsorption
process. Furthermore, an additional evidence of the proposed mechanism will come through
the magnitude of standard Gibbs free energy (see section 2.6.2).
2.4.3 Activated carbon – Electrochemical reduction
Although the adsorption capacity of activated carbons is determined mainly by their porous
structure, it is also influenced by the chemical structure of their inner surface (Swiatkowski,
1999). Due to its structural imperfections, there are many opportunities for reactions with
carbon atoms forming the edges of the planar layers. These reactions result in the formation
of oxygen containing functional groups on the surface of the carbon (McDougall, 1991). A
large number of these groups have been identified and it has been suggested though that
they may belong to the following groups: carboxyl, penolic hydroxyl, quinone-type carbonyl,
normal lactones, fluorescein-type lactones, carboxylic acid anhydrides and cyclic
peroxides (Yin et al., 2007; McDougall and Hancock, 1981). However, carbon is not readily
amenable to physical investigation by techniques such as infrared spectroscopy, therefore;
very little information is available about the surface functional groups present on
it (McDougall et al., 1980).
The important role of these groups is to impart a hydrophilic character to the predominantly
hydrophobic skeleton of the carbon (McDougall and Hancock, 1981). The chemical nature of
activated carbon depends on conditions during and after manufacture (McDougall, 1991).
Depending on the presence of surface functional groups, it is an established fact that the
activated carbon surface can display acidic, basic and/or neutral characteristics (Yin et al.,
n
m
m
nm
m
n CNXMCNnXM ])([)( 22
nM
2
4
3
5
Stellenbosch University http://scholar.sun.ac.za
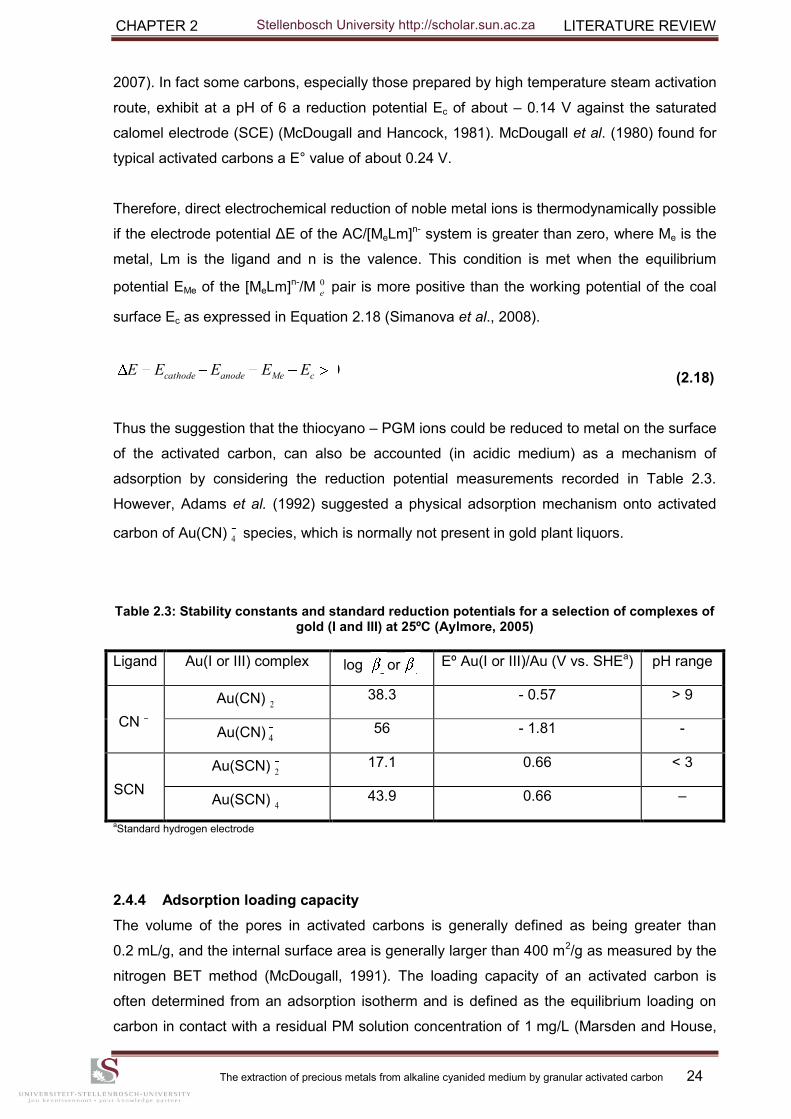
CHAPTER 2 LITERATURE REVIEW
The extraction of precious metals from alkaline cyanided medium by granular activated carbon 24
2007). In fact some carbons, especially those prepared by high temperature steam activation
route, exhibit at a pH of 6 a reduction potential Ec of about – 0.14 V against the saturated
calomel electrode (SCE) (McDougall and Hancock, 1981). McDougall et al. (1980) found for
typical activated carbons a E° value of about 0.24 V.
Therefore, direct electrochemical reduction of noble metal ions is thermodynamically possible
if the electrode potential ΔE of the AC/[MeLm]n- system is greater than zero, where Me is the
metal, Lm is the ligand and n is the valence. This condition is met when the equilibrium
potential EMe of the [MeLm]n-/M pair is more positive than the working potential of the coal
surface Ec as expressed in Equation 2.18 (Simanova et al., 2008).
(2.18)
Thus the suggestion that the thiocyano – PGM ions could be reduced to metal on the surface
of the activated carbon, can also be accounted (in acidic medium) as a mechanism of
adsorption by considering the reduction potential measurements recorded in Table 2.3.
However, Adams et al. (1992) suggested a physical adsorption mechanism onto activated
carbon of Au(CN) species, which is normally not present in gold plant liquors.
Table 2.3: Stability constants and standard reduction potentials for a selection of complexes of gold (I and III) at 25ºC (Aylmore, 2005)
Ligand Au(I or III) complex log or Eº Au(I or III)/Au (V vs. SHEa) pH range
CN
Au(CN) 38.3 - 0.57 > 9
Au(CN) 4 56 - 1.81 -
SCN
Au(SCN) 17.1 0.66 < 3
Au(SCN) 43.9 0.66 –
aStandard hydrogen electrode
2.4.4 Adsorption loading capacity
The volume of the pores in activated carbons is generally defined as being greater than
0.2 mL/g, and the internal surface area is generally larger than 400 m2/g as measured by the
nitrogen BET method (McDougall, 1991). The loading capacity of an activated carbon is
often determined from an adsorption isotherm and is defined as the equilibrium loading on
carbon in contact with a residual PM solution concentration of 1 mg/L (Marsden and House,
0
e
0cMeanodecathode EEEEE
4
2 4
2
2
4
Stellenbosch University http://scholar.sun.ac.za
CHAPTER 2 LITERATURE REVIEW
The extraction of precious metals from alkaline cyanided medium by granular activated carbon 25
2006). Most laboratories such as The Parker Centre, Mintek, Norit and Anglo American
Research Laboratories have developed methods involving contacting varying masses of
pulverized carbon with a volume of gold cyanide solution for 20 hours or more (Staunton,
2005; Davidson et al., 1982). The development of equilibrium adsorption isotherms from
these data also allows fitting of isotherm models, such as the Langmuir or Freundlich
models, which may yield insight into the nature of the adsorption.
However in the Pica procedure, a sample of carbon is contacted for 1 hour with 1 L of
10 mg/L gold solution. The carbon is recovered and put into a new fresh batch solution for a
further hour. This is repeated 11 times or more if the carbon has high gold-loading capacity.
The cumulative gold loading after each contact is calculated and the data points are plotted
to show the increase in the gold loading on the carbon with increasing number of solution
contacts (Staunton, 2005). Although this method does not appear to include a means of
calculating a definitive value of the loading capacity of the carbon, the time required for
multiple contacts; including the extraction per stage, would be of some interest in the
development of industrial processes.
In practice only a small fraction of the total adsorption capacity of carbon for gold is
utilized (Yalcin and Arol, 2002). Syna and Valix (2003) have observed the adsorption
capacities exhibited by physically activated bagasse ranged between 11 and 229 mg Au/g of
carbon. It has been shown in the laboratory that gold loading levels as high as 45 mg Au/g of
carbon can be achieved, whereas the loading of gold on carbon in the first stage of a carbon-
in-pulp plant seldom exceeds 10 mg Au/g of carbon (Yalcin and Arol, 2002). According to
Heinen et al. (l978), typical loadings obtained commercially range from 5.670 to 22.680 mg of
gold, or combination of gold and silver, per gram of carbon. More recently Marsden and
House (2006) have demonstrated that the rate of gold adsorption and the equilibrium loading
capacity both increase with increasing gold concentration in solution. In practice at CIP gold
plants, gold-loading rates of 0.01 to 0.1 mg Au/hr/g of carbon and loadings of 5 to 10 mg
Au/g of carbon are achieved.
It can be seen that a consistent correlation between the adsorption capacity of each
individual carbon is often difficult to obtain. All the characteristics of the carbon change
simultaneously as a function of burnoff. Changes in burnoff result in the total surface area to
increase accompanied by changes in the pore diameter, carbon pH and other surface
chemical properties (Yalcin and Arol, 2002). Heinen et al. (l978) pointed out some factors
that influence the loading such as (1) the concentration of gold and silver in cyanide leach
solutions, (2) the ratio of gold to silver, (3) the pH of leach solution, (4) the concentration of
impurities, (5) the flow rate, (6) the type and particle size of granular carbon employed.
Stellenbosch University http://scholar.sun.ac.za
CHAPTER 2 LITERATURE REVIEW
The extraction of precious metals from alkaline cyanided medium by granular activated carbon 26
Loaded carbon is stripped in hot caustic cyanide solution to produce a concentrated solution
in the range of 50 to 1000 ppm Au from which the gold is electrowon (Brandon et al., 1987).
The same authors have suggested that heap leaching procedures could be simplified by
electrowinning gold directly from the dilute heap leach liquor, in order to eliminate the
activated carbon adsorption, stripping and regeneration steps. However they concluded that
direct electrowinning was more expensive than a conventional carbon system for treating
heap leach liquors because of large volumes of liquor held within the process coupled with
the very low outlet gold concentration demanded.
Finally reverse osmosis has also been investigated as a means to concentrate the dilute gold
solutions. Williams (2003) postulated that reverse osmosis systems could replace or be used
in conjunction with other treatment processes such as oxidation, adsorption, stripping, or
biological treatment (as well as many others) to produce a high quality product water that can
be reused or discharged.
2.4.5 Activated carbon fouling – Carbon retention time
Carbon adsorbs organic and inorganic species such as silica, alumina, iron oxide, flotation
reagents and calcium from the pulp in the adsorption plant. These species are poisons in that
they tend to reduce the carbon‟s capacity for gold adsorption (Stange, 1999). The fouling of
the adsorbent results both in higher soluble losses and lower loadings on the activated
carbon (van Der Walt and van Deventer, 1992). The longer the carbon remains in contact
with pulp, the more poisons are adsorbed. Thus, lengthy contact between the pulp and the
carbon will invariably result in more poisoning and poorer adsorption of gold (Stange, 1999).
An acid washing with HCl is able to remove most of these precipitates and thus improve
adsorption performance (Stange, 1999; Laxen, 1984).
Researchers have reported that equilibrium between gold cyanide and activated carbon had
not been achieved after three months and, in another case, after six months (Le Roux et al.,
1991). Conventional practice is to have a mean pulp residence time of about an hour in each
tank (Stange, 1999). According to Laxen et al. (1979), contact times of between 20 and
60 minutes are reported, and then contact times of 30 minutes are used frequently. Another
similar investigation by Nicol et al. (1984) demonstrated that the residence time of carbon
seldom exceeds 48 hours per stage in an operating plant, so that true equilibrium is never
achieved. Hence any rational approach to the modelling of the adsorption process should
therefore be based on the kinetics of the adsorption reaction.
Stellenbosch University http://scholar.sun.ac.za
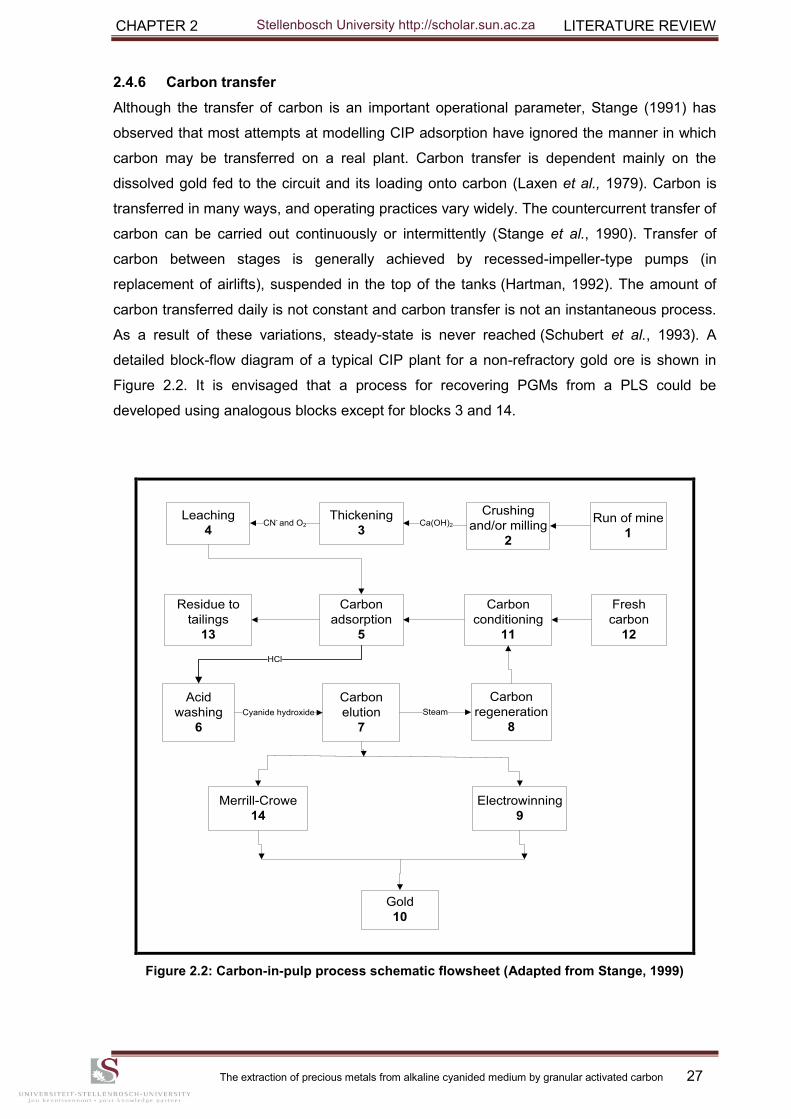
CHAPTER 2 LITERATURE REVIEW
The extraction of precious metals from alkaline cyanided medium by granular activated carbon 27
2.4.6 Carbon transfer
Although the transfer of carbon is an important operational parameter, Stange (1991) has
observed that most attempts at modelling CIP adsorption have ignored the manner in which
carbon may be transferred on a real plant. Carbon transfer is dependent mainly on the
dissolved gold fed to the circuit and its loading onto carbon (Laxen et al., 1979). Carbon is
transferred in many ways, and operating practices vary widely. The countercurrent transfer of
carbon can be carried out continuously or intermittently (Stange et al., 1990). Transfer of
carbon between stages is generally achieved by recessed-impeller-type pumps (in
replacement of airlifts), suspended in the top of the tanks (Hartman, 1992). The amount of
carbon transferred daily is not constant and carbon transfer is not an instantaneous process.
As a result of these variations, steady-state is never reached (Schubert et al., 1993). A
detailed block-flow diagram of a typical CIP plant for a non-refractory gold ore is shown in
Figure 2.2. It is envisaged that a process for recovering PGMs from a PLS could be
developed using analogous blocks except for blocks 3 and 14.
Run of mine
1
Crushing
and/or milling
2
Thickening
3
Leaching
4
Carbon
adsorption
5
Residue to
tailings
13
Carbon
conditioning
11
Fresh
carbon
12
Ca(OH)2 CN- and O2
Carbon
regeneration
8
Carbon
elution
7
Acid
washing
6
Merrill-Crowe
14
Electrowinning
9
HCl
Cyanide hydroxide Steam
Gold
10
Figure 2.2: Carbon-in-pulp process schematic flowsheet (Adapted from Stange, 1999)
Stellenbosch University http://scholar.sun.ac.za
CHAPTER 2 LITERATURE REVIEW
The extraction of precious metals from alkaline cyanided medium by granular activated carbon 28
2.5 CHOICE OF ACTIVATED CARBON
The pore structure and pore size distribution are largely predetermined by the nature of the
starting material, while the chemical nature of the surface oxides and surface area of the
activated carbon are developed during the carbonisation and activation
processes (McDougall and Hancock, 1981). Pore structure and pore size distribution are
more important factors in controlling gold adsorption capacity (Jia et al., 1998). The size of
pores developed during activation has an important influence on adsorption behaviour
because pores act as a screen, preventing the adsorption of large molecules, while
promoting the adsorption of adsorbates that fit snugly into the pores (McDougall, 1991). The
suitability of an activated carbon for a particular application depends on the ratio in which
pores of different sizes are present (Swiatkowski, 1999). A good activated carbon must have
a combination of the micro and macropore ranges (Duong, 1998).
Hardness, surface area and iodine number are the most critical properties of the activated
carbon. While hardness is required to withstand abrasion (hence precious metal losses),
surface area and iodine number are related to the adsorption characteristics (pore structure)
of the carbon. Iodine numbers are a measure of the amount of micropores in carbons (Yalcin
and Arol, 2002). Finally according to Ibragimova et al. (2007), in a real industrial adsorption
process performed in the counter-current mode, the value of the pseudokinetic adsorption
rate constant at 25°C is within the range of 80 to 100 h-1 and should remain approximately
constant in all tanks of the cascade, irrespective of the concentration of Au(CN)2 anion in the
liquid phase in each vessel.
2.6 THERMODYNAMICS OF ADSORPTION – TEMPERATURE EFFECT
2.6.1 Cyanide complex solubility
Temperature is the most complex factor affecting the equilibrium in adsorption processes.
McDougall (1991) observed that generally gold adsorption decreases with increasing
temperature. In other words, increase in temperature could decrease the adsorption due to
the increased solubility of the complex at higher temperatures (McDougall et al., 1980).
2.6.2 Standard Gibbs free energy of adsorption
Thermodynamic considerations of an adsorption process are necessary to conclude whether
the process is spontaneous or not. However in actual reactions, the composition of the
reaction mixture seldom corresponds to standard-state pressures and concentrations. Free
energy change ΔG for a reaction when reactants and products are present at non-standard
state is given in Equation 2.19 (McMurry and Fay, 1995).
Stellenbosch University http://scholar.sun.ac.za
CHAPTER 2 LITERATURE REVIEW
The extraction of precious metals from alkaline cyanided medium by granular activated carbon 29
DKRTGG ln (2.19)
At equilibrium ΔG = 0, then 2.19 gives 2.20.
DD KRTKRTG log303.2ln (2.20)
Considering corrections from Milonjić (2007), Equation 2.20 gives Equation 2.21.
DKRTG 5.55log303.2 (2.21)
From the thermodynamic point of view, the sign of the standard Gibbs free energy change of
adsorption, expressed in Equation 2.21, is the fundamental criterion of spontaneity (probable
occurrence). Reaction occurs spontaneously at a given temperature if the value of ΔG° is
negative. According to McDougall (1991), surface adsorption, regardless of the energy of the
interaction, must always proceed with a negative change in free energy. It may be noted that
spontaneous does not imply that it is instantaneous, it could happen over the course of years
or decades.
The extent of standard free energy can also give an idea about whether the adsorption
process is physical or chemical. Generally, values of ΔG° up to – 20 kJ/mol are consistent
with electrostatic interaction between adsorbate molecules and the adsorbent surface
(physical adsorption), while ΔG° values more negative than – 40 kJ/mol involve charge
sharing or transfer from the adsorbate molecules to the adsorbent surface to form a
coordinate type of bond which indicates chemical adsorption (Horsfall et al., 2006).
2.7 SUMMARY OF LITERATURE REVIEW
This chapter started by giving a brief background to the mineralogy of Platreef ores, their
effect on cyanide leaching and adsorption onto activated carbon, as well as the simultaneous
determination of [CN ] and [SCN ] in cyanide solutions. The following chapter (Chapter 3)
provides the preparative steps before the experimental tests. These latter include: a)
screening tests on the PLS resulting from cyanide extraction of Platreef ore; b) a series of
tests constructed through a factorial design matrix, to demonstrate the influence of selected
factors and their interactions with each other on the equilibrium isotherm. This is followed by
the adsorption mechanism, loading capacity and reproducibility tests.
Stellenbosch University http://scholar.sun.ac.za
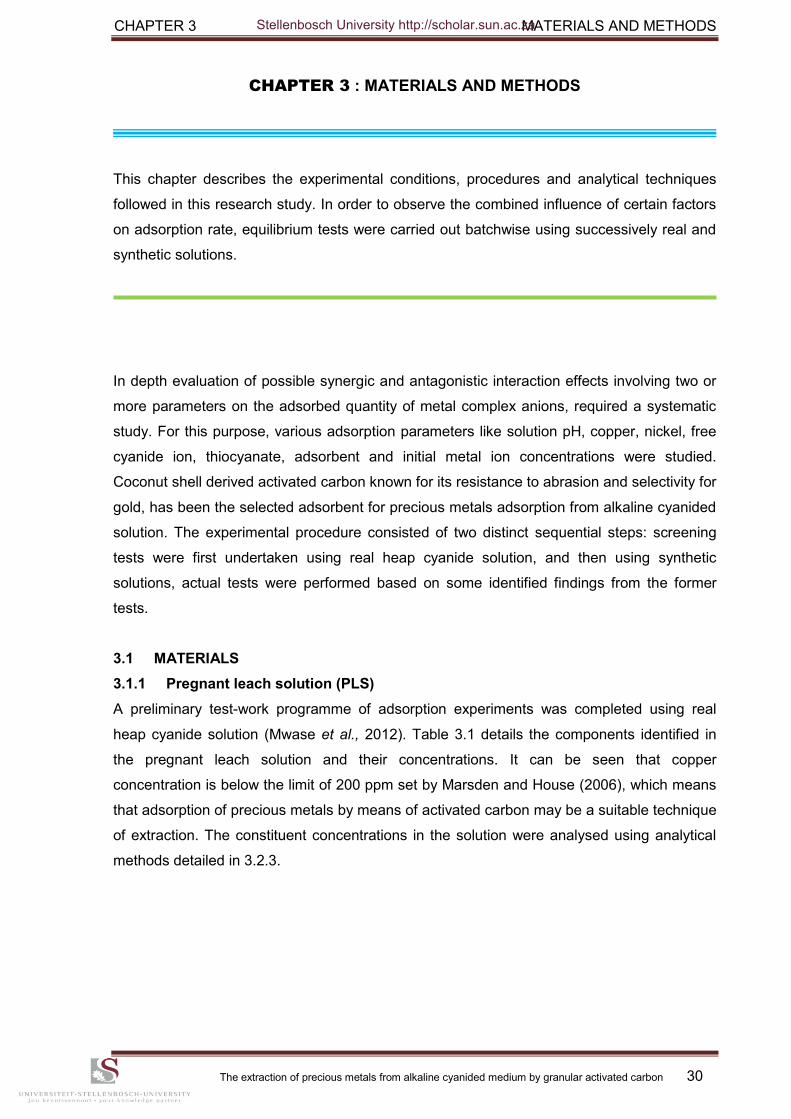
CHAPTER 3 MATERIALS AND METHODS
The extraction of precious metals from alkaline cyanided medium by granular activated carbon 30
CHAPTER 3 : MATERIALS AND METHODS
This chapter describes the experimental conditions, procedures and analytical techniques
followed in this research study. In order to observe the combined influence of certain factors
on adsorption rate, equilibrium tests were carried out batchwise using successively real and
synthetic solutions.
In depth evaluation of possible synergic and antagonistic interaction effects involving two or
more parameters on the adsorbed quantity of metal complex anions, required a systematic
study. For this purpose, various adsorption parameters like solution pH, copper, nickel, free
cyanide ion, thiocyanate, adsorbent and initial metal ion concentrations were studied.
Coconut shell derived activated carbon known for its resistance to abrasion and selectivity for
gold, has been the selected adsorbent for precious metals adsorption from alkaline cyanided
solution. The experimental procedure consisted of two distinct sequential steps: screening
tests were first undertaken using real heap cyanide solution, and then using synthetic
solutions, actual tests were performed based on some identified findings from the former
tests.
3.1 MATERIALS
3.1.1 Pregnant leach solution (PLS)
A preliminary test-work programme of adsorption experiments was completed using real
heap cyanide solution (Mwase et al., 2012). Table 3.1 details the components identified in
the pregnant leach solution and their concentrations. It can be seen that copper
concentration is below the limit of 200 ppm set by Marsden and House (2006), which means
that adsorption of precious metals by means of activated carbon may be a suitable technique
of extraction. The constituent concentrations in the solution were analysed using analytical
methods detailed in 3.2.3.
Stellenbosch University http://scholar.sun.ac.za
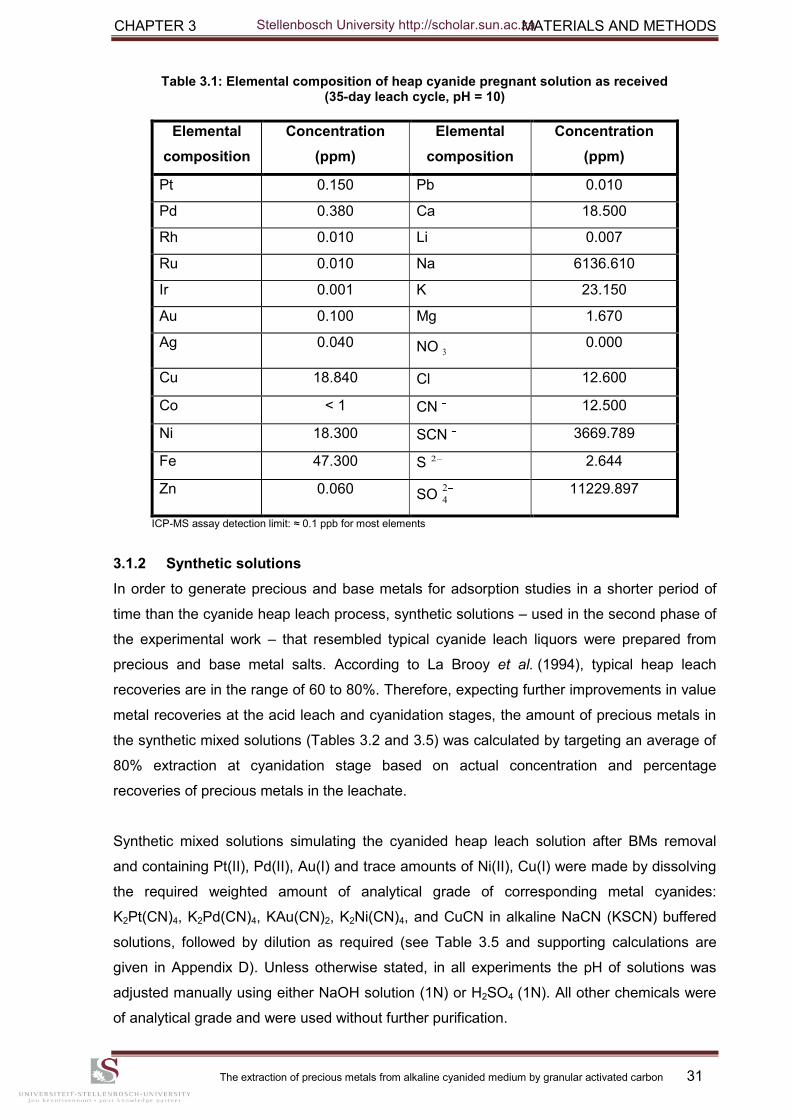
CHAPTER 3 MATERIALS AND METHODS
The extraction of precious metals from alkaline cyanided medium by granular activated carbon 31
Table 3.1: Elemental composition of heap cyanide pregnant solution as received (35-day leach cycle, pH = 10)
Elemental
composition
Concentration
(ppm)
Elemental
composition
Concentration
(ppm)
Pt 0.150 Pb 0.010
Pd 0.380 Ca 18.500
Rh 0.010 Li 0.007
Ru 0.010 Na 6136.610
Ir 0.001 K 23.150
Au 0.100 Mg 1.670
Ag 0.040 NO 0.000
Cu 18.840 Cl 12.600
Co < 1 CN 12.500
Ni 18.300 SCN 3669.789
Fe 47.300 S 2.644
Zn 0.060 SO 11229.897
ICP-MS assay detection limit: ≈ 0.1 ppb for most elements
3.1.2 Synthetic solutions
In order to generate precious and base metals for adsorption studies in a shorter period of
time than the cyanide heap leach process, synthetic solutions – used in the second phase of
the experimental work – that resembled typical cyanide leach liquors were prepared from
precious and base metal salts. According to La Brooy et al. (1994), typical heap leach
recoveries are in the range of 60 to 80%. Therefore, expecting further improvements in value
metal recoveries at the acid leach and cyanidation stages, the amount of precious metals in
the synthetic mixed solutions (Tables 3.2 and 3.5) was calculated by targeting an average of
80% extraction at cyanidation stage based on actual concentration and percentage
recoveries of precious metals in the leachate.
Synthetic mixed solutions simulating the cyanided heap leach solution after BMs removal
and containing Pt(II), Pd(II), Au(I) and trace amounts of Ni(II), Cu(I) were made by dissolving
the required weighted amount of analytical grade of corresponding metal cyanides:
K2Pt(CN)4, K2Pd(CN)4, KAu(CN)2, K2Ni(CN)4, and CuCN in alkaline NaCN (KSCN) buffered
solutions, followed by dilution as required (see Table 3.5 and supporting calculations are
given in Appendix D). Unless otherwise stated, in all experiments the pH of solutions was
adjusted manually using either NaOH solution (1N) or H2SO4 (1N). All other chemicals were
of analytical grade and were used without further purification.
3
2
2
4
Stellenbosch University http://scholar.sun.ac.za
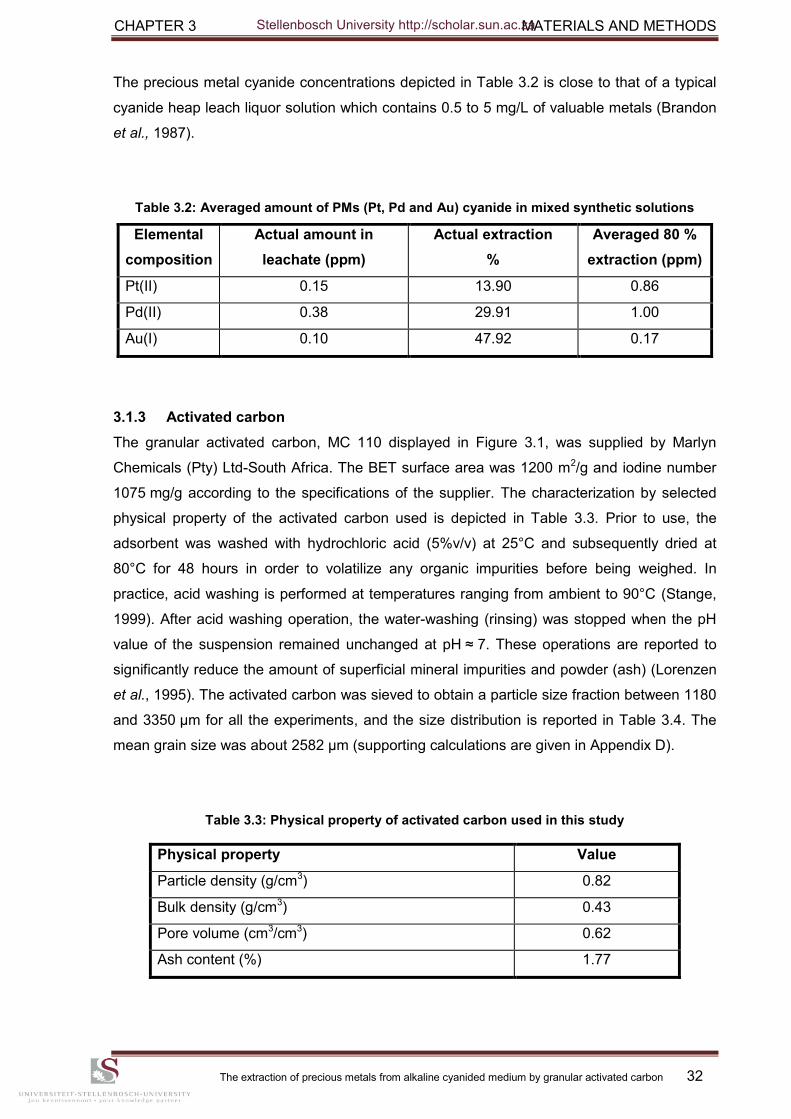
CHAPTER 3 MATERIALS AND METHODS
The extraction of precious metals from alkaline cyanided medium by granular activated carbon 32
The precious metal cyanide concentrations depicted in Table 3.2 is close to that of a typical
cyanide heap leach liquor solution which contains 0.5 to 5 mg/L of valuable metals (Brandon
et al., 1987).
Table 3.2: Averaged amount of PMs (Pt, Pd and Au) cyanide in mixed synthetic solutions
3.1.3 Activated carbon
The granular activated carbon, MC 110 displayed in Figure 3.1, was supplied by Marlyn
Chemicals (Pty) Ltd-South Africa. The BET surface area was 1200 m2/g and iodine number
1075 mg/g according to the specifications of the supplier. The characterization by selected
physical property of the activated carbon used is depicted in Table 3.3. Prior to use, the
adsorbent was washed with hydrochloric acid (5%v/v) at 25°C and subsequently dried at
80°C for 48 hours in order to volatilize any organic impurities before being weighed. In
practice, acid washing is performed at temperatures ranging from ambient to 90°C (Stange,
1999). After acid washing operation, the water-washing (rinsing) was stopped when the pH
value of the suspension remained unchanged at pH ≈ 7. These operations are reported to
significantly reduce the amount of superficial mineral impurities and powder (ash) (Lorenzen
et al., 1995). The activated carbon was sieved to obtain a particle size fraction between 1180
and 3350 μm for all the experiments, and the size distribution is reported in Table 3.4. The
mean grain size was about 2582 µm (supporting calculations are given in Appendix D).
Table 3.3: Physical property of activated carbon used in this study
Physical property Value
Particle density (g/cm3) 0.82
Bulk density (g/cm3) 0.43
Pore volume (cm3/cm3) 0.62
Ash content (%) 1.77
Elemental
composition
Actual amount in
leachate (ppm)
Actual extraction
%
Averaged 80 %
extraction (ppm)
Pt(II) 0.15 13.90 0.86
Pd(II) 0.38 29.91 1.00
Au(I) 0.10 47.92 0.17
Stellenbosch University http://scholar.sun.ac.za
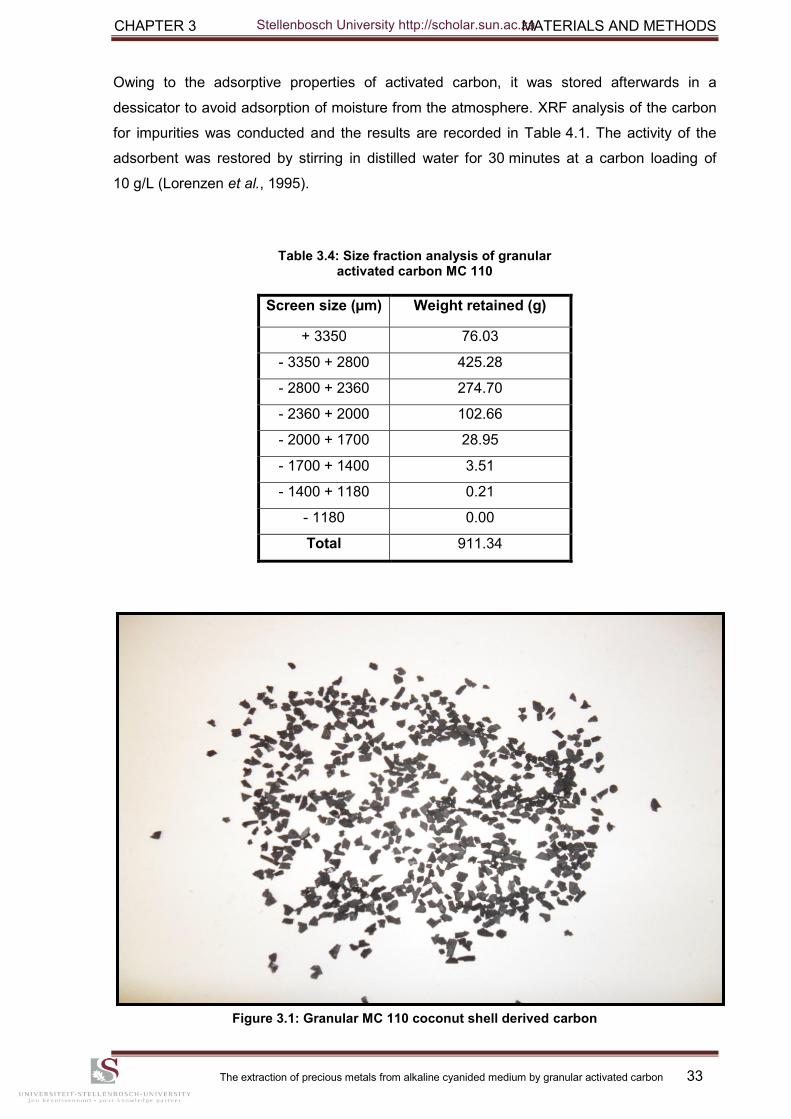
CHAPTER 3 MATERIALS AND METHODS
The extraction of precious metals from alkaline cyanided medium by granular activated carbon 33
Owing to the adsorptive properties of activated carbon, it was stored afterwards in a
dessicator to avoid adsorption of moisture from the atmosphere. XRF analysis of the carbon
for impurities was conducted and the results are recorded in Table 4.1. The activity of the
adsorbent was restored by stirring in distilled water for 30 minutes at a carbon loading of
10 g/L (Lorenzen et al., 1995).
Table 3.4: Size fraction analysis of granular activated carbon MC 110
Screen size (µm) Weight retained (g)
+ 3350 76.03
- 3350 + 2800 425.28
- 2800 + 2360 274.70
- 2360 + 2000 102.66
- 2000 + 1700 28.95
- 1700 + 1400 3.51
- 1400 + 1180 0.21
- 1180 0.00
Total 911.34
Figure 3.1: Granular MC 110 coconut shell derived carbon
Stellenbosch University http://scholar.sun.ac.za
CHAPTER 3 MATERIALS AND METHODS
The extraction of precious metals from alkaline cyanided medium by granular activated carbon 34
3.2 METHODS
3.2.1 Factorial design
In order to develop an adsorption process, a good basic understanding of parameters
influencing the process is essential. However, the study of each and every factor is quite
tedious and time consuming (Diamond, 1989). Such a study can involve a prohibitively large
number of experiments and severely limits predictive ability essential to the control of long-
term performance (Sheridan et al., 2002). This because most chemical systems are affected
by more than one independent variable or factor (multifactor systems), and exhibit
interactions between two or more factors.
In the aforementioned approach, if one wants to optimize many variables or parameters that
influence a given response [such as the Pt(CN) loading onto carbon], each factor is
independently varied whilst holding all others constant. Thus, instead of conducting a series
of independent studies, fractional factorial design technique minimized the above difficulties
by optimizing all the affecting parameters collectively at a time. Factorial design, comprising
a greater precision in estimating the overall main factor effects and interactions of different
factors, was employed to reduce the total number of experiments in order to achieve the best
overall optimization of the process. Design-Expert® software 8.0.2 was used for the
regression analysis, statistical and optimization calculations.
3.2.2 Sampling strategy
A common experimental design is one with all input factors set at two levels each. These
levels are called „low‟ and „high‟ or „−1‟ and „+1‟, respectively. If there are f factors each at
two-levels, a full factorial design has 2f runs. In the present study, seven-factor, two-level
fractional factorial design was used for the modelling of the adsorption process. The Plackett-
Burman matrix (Resolution IV) reduced the number of trials to forty, and the experimental
layout for these parameters is listed in Appendix A. At each combination of those process
settings, the adsorption percentages were recorded. The goal was to maximize the
adsorption rate of PMs and also try to find conditions that would allow a reduction in the
concentration of copper, nickel, thiocyanate and/or activated carbon; therefore, final PMs
adsorption was the higher-the-better performance characteristic.
3.2.2.1 Input factors set at two levels each
The factors involved in the design have been shown to have significant influence on gold
adsorption. Hence in light of some previously established optimum values for gold
adsorption, the individual levels denoted by (-1) and (+1) for all seven input factors are
shown in Table 3.5 below.
2
4
Stellenbosch University http://scholar.sun.ac.za
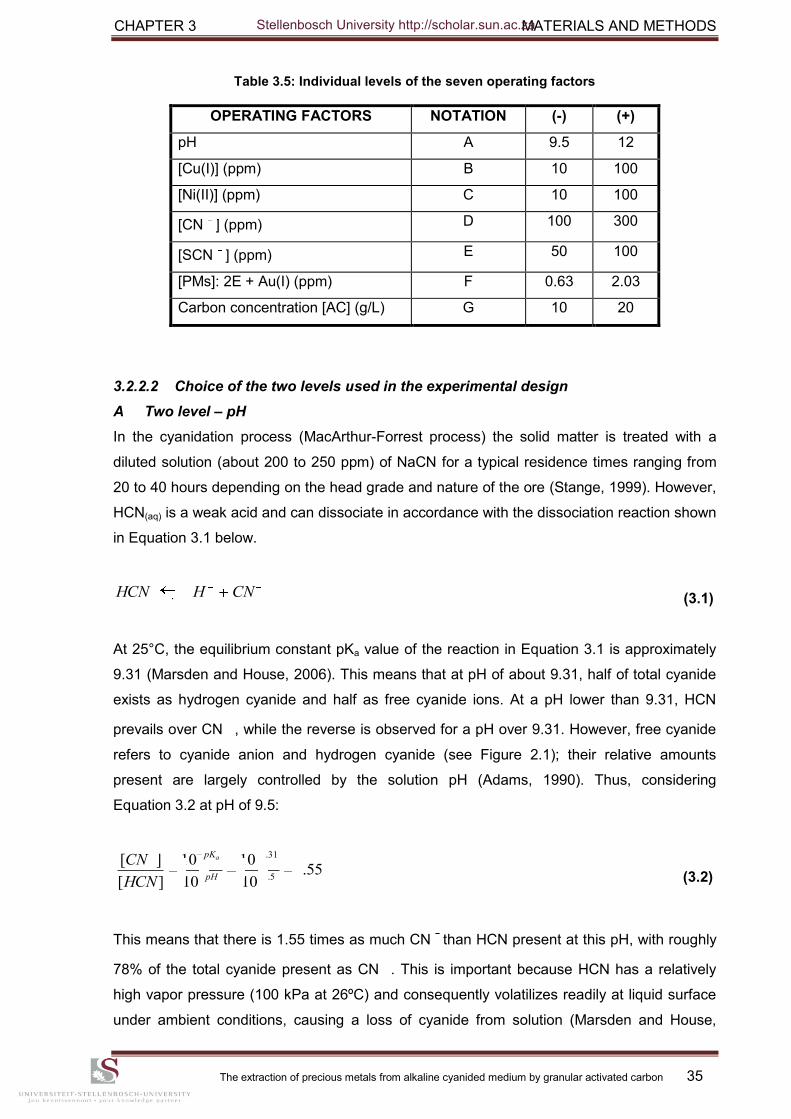
CHAPTER 3 MATERIALS AND METHODS
The extraction of precious metals from alkaline cyanided medium by granular activated carbon 35
Table 3.5: Individual levels of the seven operating factors
OPERATING FACTORS NOTATION (-) (+)
pH A 9.5 12
[Cu(I)] (ppm) B 10 100
[Ni(II)] (ppm) C 10 100
[CN ] (ppm) D 100 300
[SCN ] (ppm) E 50 100
[PMs]: 2E + Au(I) (ppm) F 0.63 2.03
Carbon concentration [AC] (g/L) G 10 20
3.2.2.2 Choice of the two levels used in the experimental design
A Two level – pH
In the cyanidation process (MacArthur-Forrest process) the solid matter is treated with a
diluted solution (about 200 to 250 ppm) of NaCN for a typical residence times ranging from
20 to 40 hours depending on the head grade and nature of the ore (Stange, 1999). However,
HCN(aq) is a weak acid and can dissociate in accordance with the dissociation reaction shown
in Equation 3.1 below.
(3.1)
At 25°C, the equilibrium constant pKa value of the reaction in Equation 3.1 is approximately
9.31 (Marsden and House, 2006). This means that at pH of about 9.31, half of total cyanide
exists as hydrogen cyanide and half as free cyanide ions. At a pH lower than 9.31, HCN
prevails over CN , while the reverse is observed for a pH over 9.31. However, free cyanide
refers to cyanide anion and hydrogen cyanide (see Figure 2.1); their relative amounts
present are largely controlled by the solution pH (Adams, 1990). Thus, considering
Equation 3.2 at pH of 9.5:
(3.2)
This means that there is 1.55 times as much CN than HCN present at this pH, with roughly
78% of the total cyanide present as CN . This is important because HCN has a relatively
high vapor pressure (100 kPa at 26ºC) and consequently volatilizes readily at liquid surface
under ambient conditions, causing a loss of cyanide from solution (Marsden and House,
CNHHCN
55.110
10
10
10
][
][5.9
31.9
pH
pKa
HCN
CN
Stellenbosch University http://scholar.sun.ac.za
CHAPTER 3 MATERIALS AND METHODS
The extraction of precious metals from alkaline cyanided medium by granular activated carbon 36
2006). However Sheya and Palmer (1989) have reported, in cyanide solutions, maximum
gold cyanide adsorption onto activated carbon (96%) below pH of 8.
Although this seems conflicting, it is advantageous to work at pH above the pKa in order to
prevent the build up of and possible release of HCN, to ensure that most of the cyanide is in
the ionic form (Fleming, 1992). Therefore a high pH is necessary for both safety and
economic reasons. By maintaining the alkalinity of the leach solution at pH of 10 or 11, the
possibility of generating hydrogen cyanide gas (HCN) is minimized, and only trace amounts
of HCN can be released by interaction of NaCN and CO2 in the environment according to
the 3.3 reaction (Heinen et al., l978).
(3.3)
Finally the pH can affect the ionicity, chemical nature of species present and their relative
concentration, knowing that generally carbon has a low affinity for ions with a high charge-to-
surface ratio (McDougall, 1991).
B Two level – free cyanide [CN ] and [Cu(I)]
The loading of copper in the adsorption process of gold is controlled by the pH value and free
cyanide ion concentration of the solution. At low pH values, the predominant copper complex
present is Cu(CN) which loads very well onto carbon, while at high free cyanide
concentration; the predominant copper complexes are Cu(CN) and Cu(CN) , which do
not easily load onto activated carbon (Davidson et al., 1979). In conventional CIP plants, high
levels of free cyanide ion are maintained to favour the adsorption of the Au(CN) anion over
Cu(CN) and Cu(CN) anions (Marsden and House, 2006). Deschenes and
Wallingford (1995) reported that the usual concentrations of free cyanide are between 150 to
280 ppm to process normal gold ores. Yannopoulos (1991) argued that the concentration of
cyanide ion in the leaching process is normally of the order of 200 ppm at the start of the
process and falls to 120 ppm at the end because of side reactions with cyanide-consuming
agents contained in the ore, reaction with dissolved carbonic acid and hydrolysis of the
cyanide.
La Brooy et al. (1994) stated that sufficient cyanide is added to leave a concentration of 100
to 250 ppm at about pH of 10 by the end of the leach. Meinhardt et al. (1996) found that
cyanide concentration changes through the mineral leaching step from values of 1000 ppm
(starting point) to 100 – 200 ppm (closing point). According to Kappes (2005), the level of
322 NaHCOHCNOHCONaCN
2
2
3
3
4
2
2
3
3
4
Stellenbosch University http://scholar.sun.ac.za
CHAPTER 3 MATERIALS AND METHODS
The extraction of precious metals from alkaline cyanided medium by granular activated carbon 37
cyanide in the heap onflow solution ranges from 100 to 600 ppm NaCN and averages
240 ppm, while a heap discharge solution (pregnant solution) averages 110 ppm. Finally
Sheya and Palmer (1989) reported that a cyanide concentration above 2 g/L inhibited the
loading rate of gold on activated carbon. Thus, the effect of free cyanide concentration on
PM-cyanides adsorption was evaluated in the range of 100 to 300 ppm expected from the
processing of mineral ores (cyanide leaching). Additional information can be obtained in
part A of section 2.2.2.
C Two level – adsorbent and initial metal ion concentrations
Conventionally, gold leached by cyanidation process is recovered by contacting the pulp with
10 to 20 grams of carbon per litre of solution, but on occasions up to 40 grams per litre have
been used (Butler, 1993). The effect of initial metal ion concentration on the adsorption
equilibrium was studied by varying the initial PM concentrations between its current
concentration and a predicted one, as the typical range for any heap leach solutions is
between 0.5 and 5 mg/L (Brandon et al., 1987). The initial concentration of both Cu(I) and
Ni(II) solutions tested were 10 and 100 ppm in accordance with their minimum average
concentrations in the leachate and those (from the literature) believed to be detrimental for
PMs adsorption, respectively (Marsden and House, 2006).
3.2.3 Analytical methods
Morphological characteristics and qualitative analyses of both fresh and loaded samples of
granulated activated carbon were examined under scanning electron microscope (SEM-
EDX) with a detection limit of around 0.1% for most elements. Fresh activated carbon was
also subjected to XRF to analyse the chemical compositions of some minerals that are
present on its surface. To visualize the size, structure and surface morphology of the solid
particles, and hence evaluate the active sites on activated carbon; SEM images were
obtained using a Zeiss EVO® MA15 Scanning Electron Microscope at Stellenbosch
University.
Quantitative analysis and backscatter images required 15 micrometer thickness (peacock
blue colour) of carbon coating, a flat and polished surface. Samples were identified with
backscattered electron (BSE) and/or secondary electron images. Phase compositions were
quantified by EDX analysis using an Oxford Instruments® X-Max 20 mm2 detector and
Oxford INCA software. Beam conditions during the quantitative analyses were 20 kV, with a
working distance of 8.5 mm and approximately beam current of – 20 nA. The counting time
was 10 seconds live-time. Internal Astimex Scientific mineral standards were used for
standardization and verification of the analyses. Pure Co was used periodically to correct
detector drift.
Stellenbosch University http://scholar.sun.ac.za
CHAPTER 3 MATERIALS AND METHODS
The extraction of precious metals from alkaline cyanided medium by granular activated carbon 38
Metal concentrations in the aqueous phase were measured by ICP-MS and, where
necessary, for CN , SCN , by potentiometric titration, High-Performance Liquid
Chromatography (HPLC) and ion chromatography techniques, respectively (refer to
section 2.3 for additional information). A gas detector and a tachometer were used to monitor
any HCN gas release and for speed measurements, respectively. Special care was taken in
the choice of the filter material, to avoid any losses of the test substance on it (Samiullah,
1985).
3.2.4 Experimental set-up and equilibrium tests
Precious metal adsorption tests were performed with the traditional bottle-on-rolls method in
2.5 litre bottles containing 500 mL of the solution (Figure 3.2). According to Fleming et
al. (2011) this procedure (bottle-on-rolls) gives similar kinetic performance to that achieved in
large conventional CIP tanks. Varying amounts of carbon were contacted with 500 mL of the
cyanided solution of known precious and base metal concentrations, adjusted at appropriate
pH. The effect of alkalinity on the PMs profile was investigated at two different levels, namely
pH of 9.5 and 12.
In order to ensure that pseudo-equilibrium was attained, the mixture was rotated for
72 hours. This duration was selected on the basis of gold adsorption experiments (assuming
pseudo-equilibrium conditions) reported by van Deventer (1984), who showed that
equilibrium was still not achieved between gold cyanide and activated carbon after several
weeks of adsorption. Liebenberg and van Deventer (1997) indicated that pseudo-equilibrium
isotherms could be used, but carbon/solution contacting times of less than 72 hours could
lead to ineffective modelling.
The rate of loading of gold cyanide onto carbon in a rolling bottle test is insensitive to the rate
at which the bottle is rolled as long as the inside of the bottle smooth without baffles (Fleming
et al., 2011). However, preventing any eventual attrition of the activated carbon (still assuring
a good solid/liquid contact), the rotational rate was kept at 105 rpm as this was the maximum
speed of the used device.
Solution sampling was done at pre-determined times depending on screening, actual or
optimum tests and involved withdrawal of 5 mL of solution using 0.22 µm pore size syringe
filters (to remove any carbon fines that might be present in the solution) followed by ICP-MS
analysis of the filtrate. The uptake of PMs (Pt, Pd, Au and Rh) with activated carbon was
determined from the difference of PM concentrations in the initial and final solutions. Unless
stated otherwise, all adsorption experiments were performed at the temperature of 25ºC and
rotational rate of 105 rpm.
2S
Stellenbosch University http://scholar.sun.ac.za
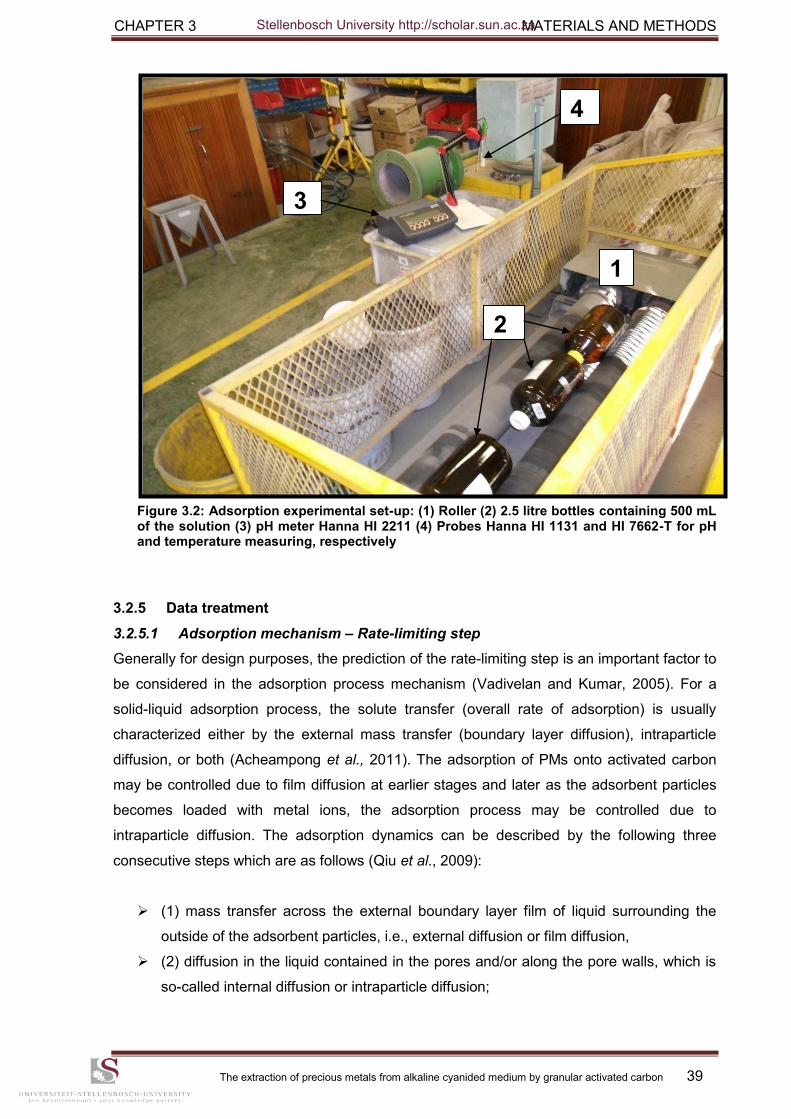
CHAPTER 3 MATERIALS AND METHODS
The extraction of precious metals from alkaline cyanided medium by granular activated carbon 39
Figure 3.2: Adsorption experimental set-up: (1) Roller (2) 2.5 litre bottles containing 500 mL of the solution (3) pH meter Hanna HI 2211 (4) Probes Hanna HI 1131 and HI 7662-T for pH and temperature measuring, respectively
3.2.5 Data treatment
3.2.5.1 Adsorption mechanism – Rate-limiting step
Generally for design purposes, the prediction of the rate-limiting step is an important factor to
be considered in the adsorption process mechanism (Vadivelan and Kumar, 2005). For a
solid-liquid adsorption process, the solute transfer (overall rate of adsorption) is usually
characterized either by the external mass transfer (boundary layer diffusion), intraparticle
diffusion, or both (Acheampong et al., 2011). The adsorption of PMs onto activated carbon
may be controlled due to film diffusion at earlier stages and later as the adsorbent particles
becomes loaded with metal ions, the adsorption process may be controlled due to
intraparticle diffusion. The adsorption dynamics can be described by the following three
consecutive steps which are as follows (Qiu et al., 2009):
(1) mass transfer across the external boundary layer film of liquid surrounding the
outside of the adsorbent particles, i.e., external diffusion or film diffusion,
(2) diffusion in the liquid contained in the pores and/or along the pore walls, which is
so-called internal diffusion or intraparticle diffusion;
1
2
3
4
Stellenbosch University http://scholar.sun.ac.za
CHAPTER 3 MATERIALS AND METHODS
The extraction of precious metals from alkaline cyanided medium by granular activated carbon 40
(3) adsorption and desorption between the adsorbate and active sites, i.e., mass
action.
The last step is considered to be an equilibrium step. For physical adsorption, mass action is
a very rapid process and can be neglected in kinetic studies. Thus, the kinetics of the
adsorption process are always controlled by either liquid film diffusion or intraparticle
diffusion, i.e., one of the processes will be the rate-limiting step. Walter and Weber (1974)
argued that for most operating conditions, transport of adsorbate through the „surface film‟ or
boundary layer is rate-limiting. If sufficient turbulence is provided, transport of the adsorbate
within the porous carbon may control the rate of uptake.
A plot of ln(1−qt/qe) vs. t (Equation 3.4) should be a straight line if the film diffusion is the rate
limiting step (Qiu et al., 2009), where k is the overall rate constant, qe and qt (mg/g) are the
adsorption capacities at equilibrium and time t (minute), respectively.
ln(1−qt/qe) = - kt (3.4)
The most commonly used technique for evaluating the mechanism involved in the adsorption
process is by fitting an intraparticle diffusion plot described in Equation 3.5 (Vimonses et
al., 2009).
(3.5)
where values of Cid give information on the thickness of the boundary layer (intercept),
kid (mg/g.min1/2) is the intraparticle diffusion rate constant (slope).
The intraparticle diffusion is the sole rate-limiting step in determining the kinetics of the
process if the plot of qt against t1/2 is linear and the line passes through the origin. Otherwise,
some other mechanism such as ion-exchange may also control the rate of adsorption (Wang
et al., 2010).
However, adsorption reaction models originating from chemical reaction kinetics are based
on the whole process of adsorption without considering these steps mentioned above (Qiu et
al., 2009). According to Allard et al. quoted by Sutherland and Venkobachar (2010), there are
three further pathways by which adsorption may occur onto the surface:
ididt Ctkq 21
Stellenbosch University http://scholar.sun.ac.za
CHAPTER 3 MATERIALS AND METHODS
The extraction of precious metals from alkaline cyanided medium by granular activated carbon 41
(1) physical adsorption which is considered rapid, reversible and is due to non-
specific forces of attraction (e.g. van der Waals forces);
(2) electrostatic adsorption due to coulombic forces of attraction between charged
solute species and the adsorbing phase - this process is usually rapid and largely
reversible;
(3) specific adsorption due to the action of chemical forces of attraction which leads to
surface bonding at a specific site on the solid phase - this process can be slow and
partly irreversible.
If the pseudo-second order kinetic model holds true, the rate law for the reaction is
expressed as in Equation 3.6 based on adsorption equilibrium capacity (Ho and
McKay, 1999).
eetq
t
qkq
t2
2
1 (3.6)
3.2.5.2 Equilibrium constant, adsorption percentage, capacity and selectivity
The distribution coefficient KD is often used to characterise the mobility of metal ions in
solutions. It describes the binding ability of the adsorbent surface for an element and
measures how well-extracted a species is. Low KD values imply that most metal remains in
solution, and high KD values indicate that the metal has great affinity for the
adsorbent (Echeverria et al., 1998). The distribution coefficient is defined as the ratio of the
metal concentration in the solid phase to that in the equilibrium solution after a specified
reaction time as expressed in Equation 3.7 below.
solutionLadsorbatemg
adsorbentkgadsorbatemg
C
CK
e
s
e
cD
/
/
][
][ (3.7)
The percentage adsorption for each metal ion was calculated using the following 3.8
Equation:
(3.8)
The amount of metal adsorbed (adsorption capacity, equilibrium uptake) by the activated
carbon, q (mg PMs/g of dry activated carbon) was evaluated using Equation 3.9.
0
0100%C
CCR e
Stellenbosch University http://scholar.sun.ac.za
CHAPTER 3 MATERIALS AND METHODS
The extraction of precious metals from alkaline cyanided medium by granular activated carbon 42
(3.9)
where C0 and eC are the concentrations of PM ions in solution before and after
adsorption (mg/L); V is the solution volume (L); m is the weight of activated carbon (g) (Lam
et al., 2007).
m
VCCq e )( 0
Stellenbosch University http://scholar.sun.ac.za
CHAPTER 4 PRELIMINARY ADSORPTION TESTS
The extraction of precious metals from alkaline cyanided medium by granular activated carbon 43
CHAPTER 4 : PRELIMINARY ADSORPTION TESTS
Preliminary adsorption tests were performed and the emergent findings of the investigation
are presented in the present chapter.
This present chapter reports on preliminary adsorption tests performed on a pregnant
alkaline leach solution resulting from cyanide extraction of the Platreef ore performed in
column leach tests. Two fractions of a low grade sulphide ore originating from the Platreef
deposit were leached in two separate columns run in up-flow mode (Mwase, 2009). BM and
PM values were recovered from the ore in a two-stage leaching process comprising a first
extraction with an aqueous acid solution to remove part of the base metals and a second
extraction with cyanide to remove PM values and the residual base metals from the residue.
Leachate from column 1 after the second extraction (cyanide), whose chemical composition
is displayed in Table 3.1, was used for screening adsorption tests. Tests were conducted for
72 hours and two carbon concentrations were used, viz. 10 and 20 g/L. The granular
activated carbon was investigated before and after adsorption by SEM-EDX. X-ray
fluorescence (XRF) was used to analyse the chemical compositions of some minerals that
are present on the fresh activated carbon surface.
4.1 RESULTS AND DISCUSSION
4.1.1 Characterisation of GAC
4.1.1.1 Scanning electron microscope (SEM) analysis of unloaded GAC
The SEM images of the fresh and acid washed coconut shell MC 110 are shown in
Figures 4.1 to 4.4. These illustrate that the granules have a coarse, porous surface with
irregular pores, and show the presence of small cavities; cracks, asperities, attached fine
particles and many cavernous structures over the activated carbon surface, forming a system
of complicated pore networks. The surface character of the GAC is likely to be significant in
the loading of PMs. Pleysier et al. (2008) report that at gold loadings typical of CIP plants,
gold is predominantly adsorbed onto the external surface of the carbon. As similar or lower
loadings are expected in the current application, with some similarities in the species being
adsorbed, it can be expected that the mechanism might be similar.
Stellenbosch University http://scholar.sun.ac.za
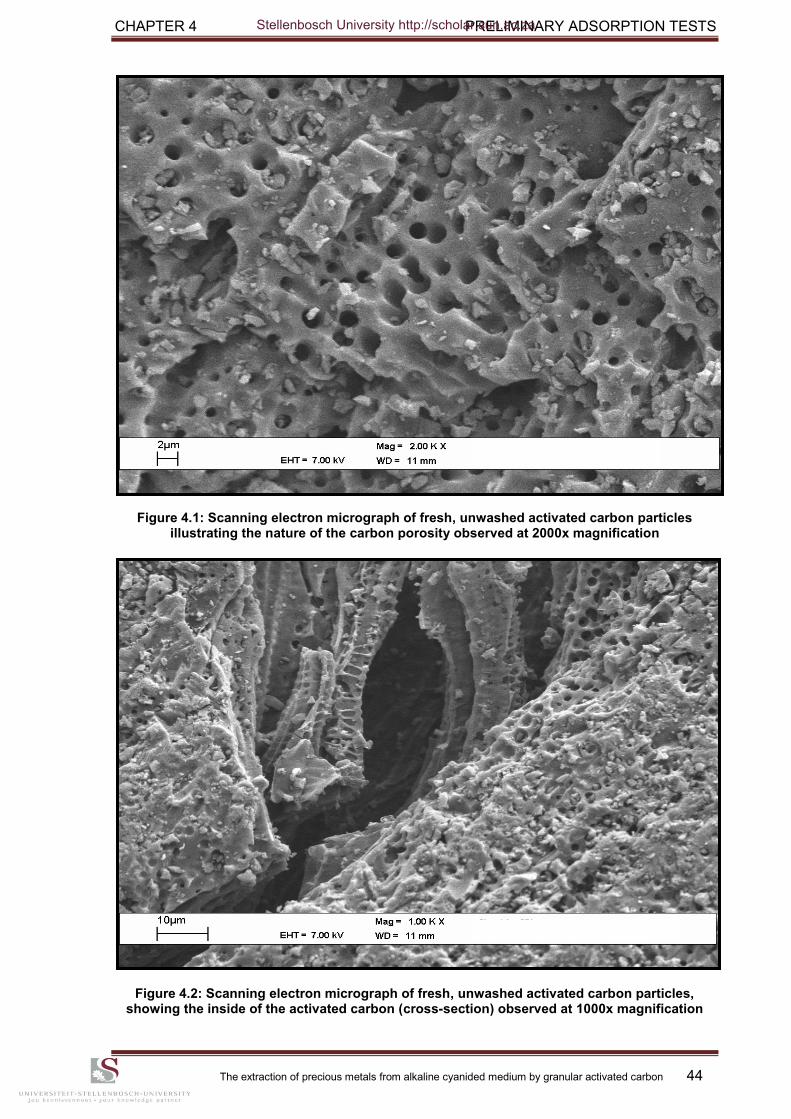
CHAPTER 4 PRELIMINARY ADSORPTION TESTS
The extraction of precious metals from alkaline cyanided medium by granular activated carbon 44
Figure 4.1: Scanning electron micrograph of fresh, unwashed activated carbon particles illustrating the nature of the carbon porosity observed at 2000x magnification
Figure 4.2: Scanning electron micrograph of fresh, unwashed activated carbon particles, showing the inside of the activated carbon (cross-section) observed at 1000x magnification
Stellenbosch University http://scholar.sun.ac.za
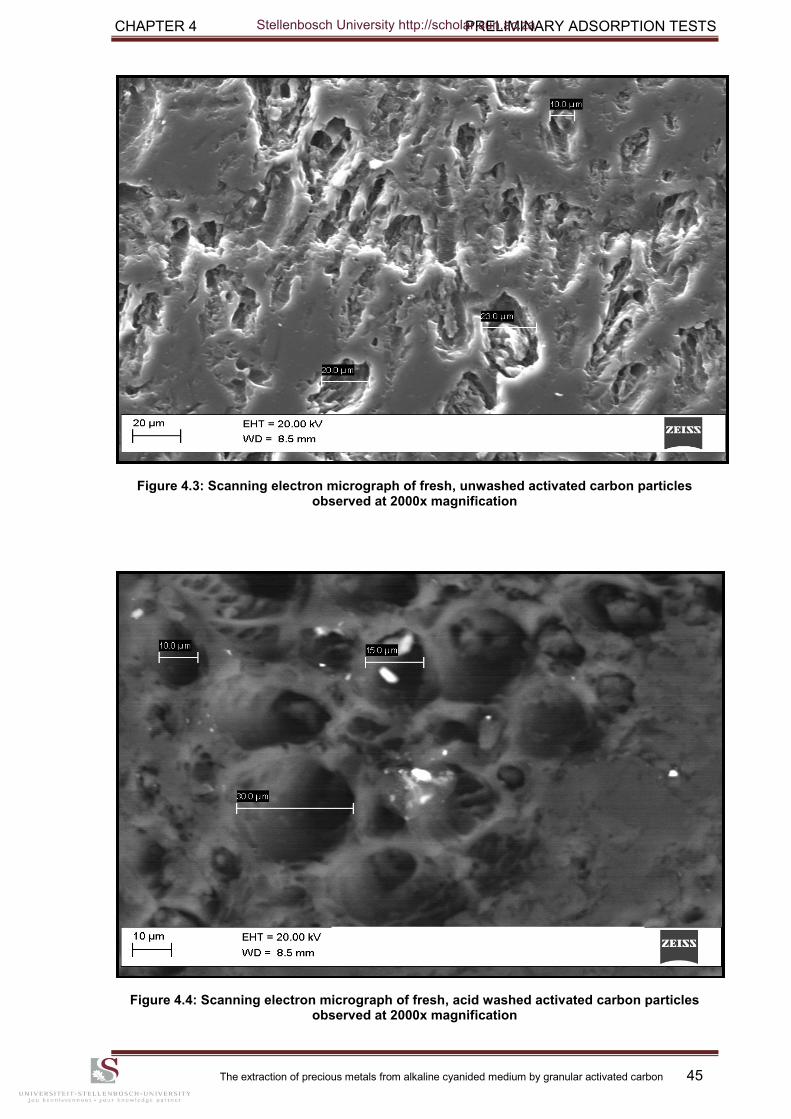
CHAPTER 4 PRELIMINARY ADSORPTION TESTS
The extraction of precious metals from alkaline cyanided medium by granular activated carbon 45
Figure 4.3: Scanning electron micrograph of fresh, unwashed activated carbon particles observed at 2000x magnification
Figure 4.4: Scanning electron micrograph of fresh, acid washed activated carbon particles observed at 2000x magnification
Stellenbosch University http://scholar.sun.ac.za
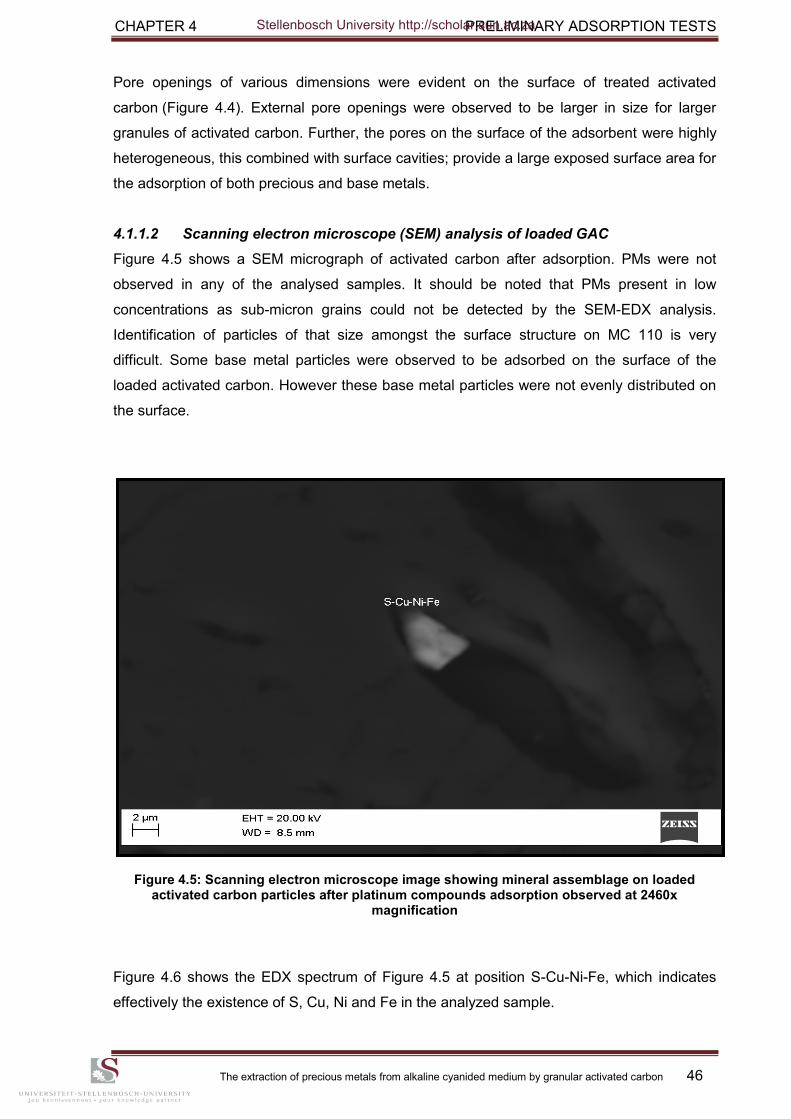
CHAPTER 4 PRELIMINARY ADSORPTION TESTS
The extraction of precious metals from alkaline cyanided medium by granular activated carbon 46
Pore openings of various dimensions were evident on the surface of treated activated
carbon (Figure 4.4). External pore openings were observed to be larger in size for larger
granules of activated carbon. Further, the pores on the surface of the adsorbent were highly
heterogeneous, this combined with surface cavities; provide a large exposed surface area for
the adsorption of both precious and base metals.
4.1.1.2 Scanning electron microscope (SEM) analysis of loaded GAC
Figure 4.5 shows a SEM micrograph of activated carbon after adsorption. PMs were not
observed in any of the analysed samples. It should be noted that PMs present in low
concentrations as sub-micron grains could not be detected by the SEM-EDX analysis.
Identification of particles of that size amongst the surface structure on MC 110 is very
difficult. Some base metal particles were observed to be adsorbed on the surface of the
loaded activated carbon. However these base metal particles were not evenly distributed on
the surface.
Figure 4.5: Scanning electron microscope image showing mineral assemblage on loaded activated carbon particles after platinum compounds adsorption observed at 2460x
magnification
Figure 4.6 shows the EDX spectrum of Figure 4.5 at position S-Cu-Ni-Fe, which indicates
effectively the existence of S, Cu, Ni and Fe in the analyzed sample.
Stellenbosch University http://scholar.sun.ac.za
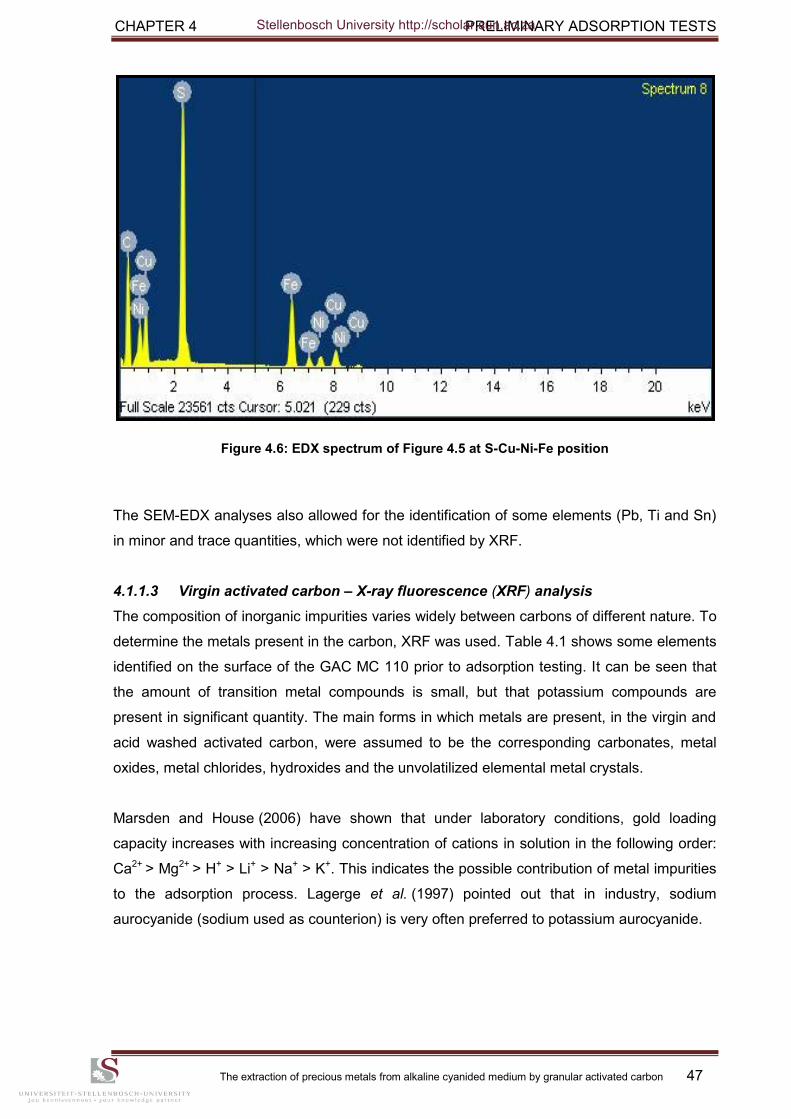
CHAPTER 4 PRELIMINARY ADSORPTION TESTS
The extraction of precious metals from alkaline cyanided medium by granular activated carbon 47
Figure 4.6: EDX spectrum of Figure 4.5 at S-Cu-Ni-Fe position
The SEM-EDX analyses also allowed for the identification of some elements (Pb, Ti and Sn)
in minor and trace quantities, which were not identified by XRF.
4.1.1.3 Virgin activated carbon – X-ray fluorescence (XRF) analysis
The composition of inorganic impurities varies widely between carbons of different nature. To
determine the metals present in the carbon, XRF was used. Table 4.1 shows some elements
identified on the surface of the GAC MC 110 prior to adsorption testing. It can be seen that
the amount of transition metal compounds is small, but that potassium compounds are
present in significant quantity. The main forms in which metals are present, in the virgin and
acid washed activated carbon, were assumed to be the corresponding carbonates, metal
oxides, metal chlorides, hydroxides and the unvolatilized elemental metal crystals.
Marsden and House (2006) have shown that under laboratory conditions, gold loading
capacity increases with increasing concentration of cations in solution in the following order:
Ca2+ > Mg2+ > H+ > Li+ > Na+ > K+. This indicates the possible contribution of metal impurities
to the adsorption process. Lagerge et al. (1997) pointed out that in industry, sodium
aurocyanide (sodium used as counterion) is very often preferred to potassium aurocyanide.
Stellenbosch University http://scholar.sun.ac.za
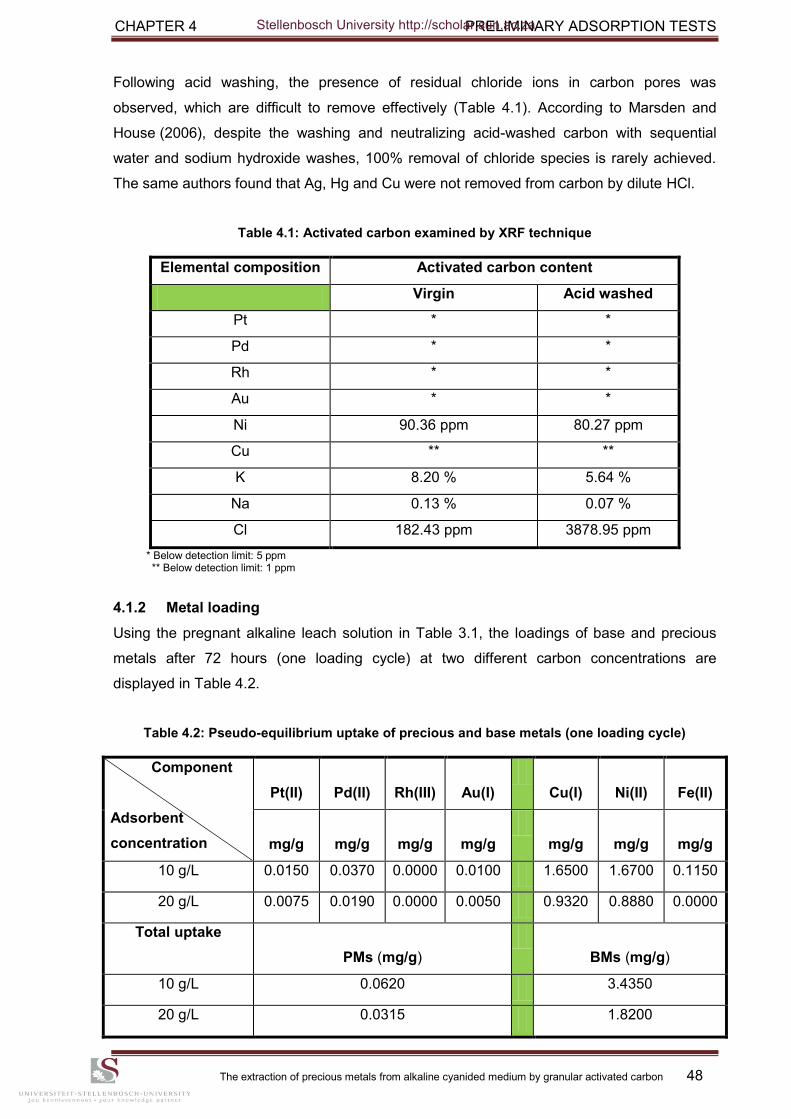
CHAPTER 4 PRELIMINARY ADSORPTION TESTS
The extraction of precious metals from alkaline cyanided medium by granular activated carbon 48
Following acid washing, the presence of residual chloride ions in carbon pores was
observed, which are difficult to remove effectively (Table 4.1). According to Marsden and
House (2006), despite the washing and neutralizing acid-washed carbon with sequential
water and sodium hydroxide washes, 100% removal of chloride species is rarely achieved.
The same authors found that Ag, Hg and Cu were not removed from carbon by dilute HCl.
Table 4.1: Activated carbon examined by XRF technique
Elemental composition Activated carbon content
Virgin Acid washed
Pt * *
Pd * *
Rh * *
Au * *
Ni 90.36 ppm 80.27 ppm
Cu ** **
K 8.20 % 5.64 %
Na 0.13 % 0.07 %
Cl 182.43 ppm 3878.95 ppm
* Below detection limit: 5 ppm ** Below detection limit: 1 ppm
4.1.2 Metal loading
Using the pregnant alkaline leach solution in Table 3.1, the loadings of base and precious
metals after 72 hours (one loading cycle) at two different carbon concentrations are
displayed in Table 4.2.
Table 4.2: Pseudo-equilibrium uptake of precious and base metals (one loading cycle)
Component
Adsorbent
concentration
Pt(II)
Pd(II)
Rh(III)
Au(I)
Cu(I)
Ni(II)
Fe(II)
mg/g
mg/g
mg/g
mg/g
mg/g
mg/g
mg/g
10 g/L 0.0150 0.0370 0.0000 0.0100 1.6500 1.6700 0.1150
20 g/L 0.0075 0.0190 0.0000 0.0050 0.9320 0.8880 0.0000
Total uptake
PMs (mg/g)
BMs (mg/g)
10 g/L 0.0620 3.4350
20 g/L 0.0315 1.8200
Stellenbosch University http://scholar.sun.ac.za
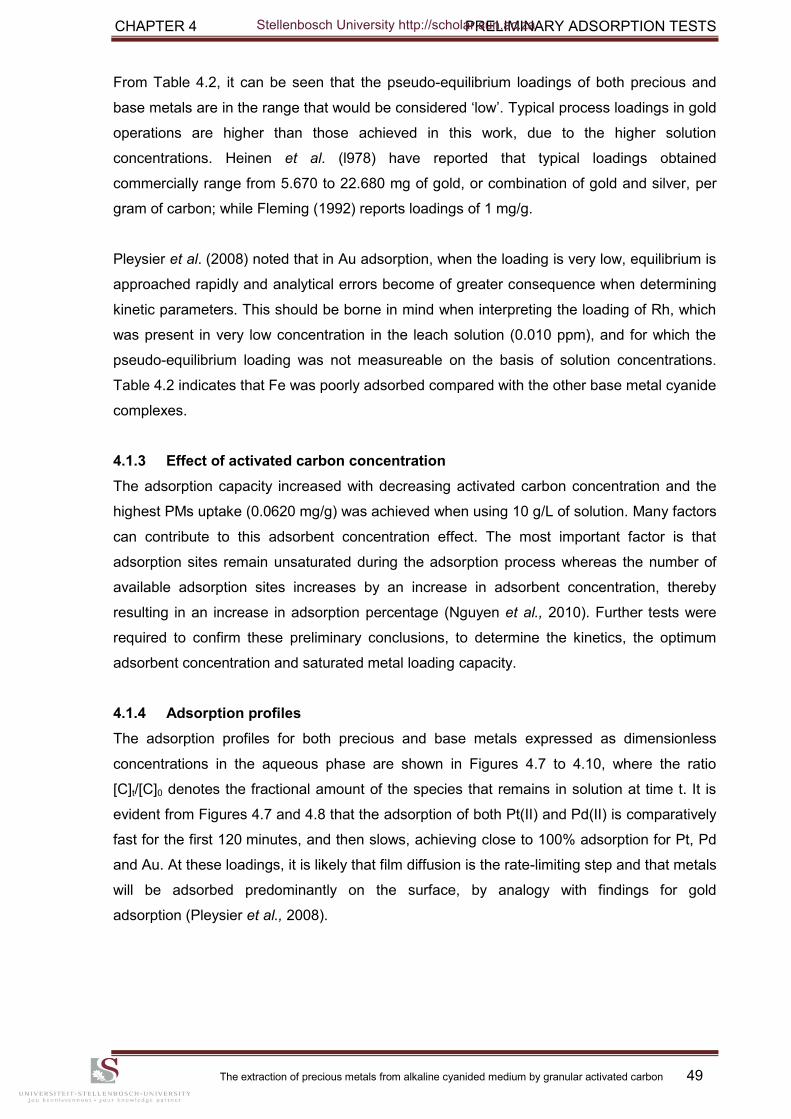
CHAPTER 4 PRELIMINARY ADSORPTION TESTS
The extraction of precious metals from alkaline cyanided medium by granular activated carbon 49
From Table 4.2, it can be seen that the pseudo-equilibrium loadings of both precious and
base metals are in the range that would be considered „low‟. Typical process loadings in gold
operations are higher than those achieved in this work, due to the higher solution
concentrations. Heinen et al. (l978) have reported that typical loadings obtained
commercially range from 5.670 to 22.680 mg of gold, or combination of gold and silver, per
gram of carbon; while Fleming (1992) reports loadings of 1 mg/g.
Pleysier et al. (2008) noted that in Au adsorption, when the loading is very low, equilibrium is
approached rapidly and analytical errors become of greater consequence when determining
kinetic parameters. This should be borne in mind when interpreting the loading of Rh, which
was present in very low concentration in the leach solution (0.010 ppm), and for which the
pseudo-equilibrium loading was not measureable on the basis of solution concentrations.
Table 4.2 indicates that Fe was poorly adsorbed compared with the other base metal cyanide
complexes.
4.1.3 Effect of activated carbon concentration
The adsorption capacity increased with decreasing activated carbon concentration and the
highest PMs uptake (0.0620 mg/g) was achieved when using 10 g/L of solution. Many factors
can contribute to this adsorbent concentration effect. The most important factor is that
adsorption sites remain unsaturated during the adsorption process whereas the number of
available adsorption sites increases by an increase in adsorbent concentration, thereby
resulting in an increase in adsorption percentage (Nguyen et al., 2010). Further tests were
required to confirm these preliminary conclusions, to determine the kinetics, the optimum
adsorbent concentration and saturated metal loading capacity.
4.1.4 Adsorption profiles
The adsorption profiles for both precious and base metals expressed as dimensionless
concentrations in the aqueous phase are shown in Figures 4.7 to 4.10, where the ratio
[C]t/[C]0 denotes the fractional amount of the species that remains in solution at time t. It is
evident from Figures 4.7 and 4.8 that the adsorption of both Pt(II) and Pd(II) is comparatively
fast for the first 120 minutes, and then slows, achieving close to 100% adsorption for Pt, Pd
and Au. At these loadings, it is likely that film diffusion is the rate-limiting step and that metals
will be adsorbed predominantly on the surface, by analogy with findings for gold
adsorption (Pleysier et al., 2008).
Stellenbosch University http://scholar.sun.ac.za
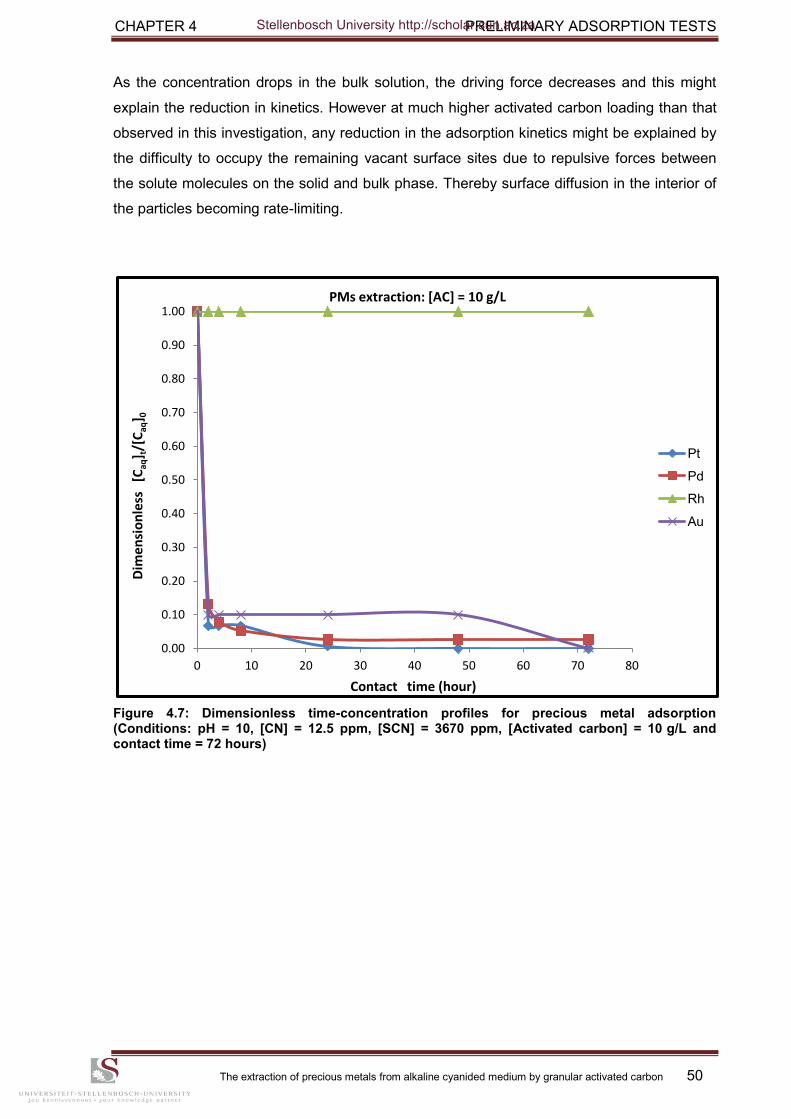
CHAPTER 4 PRELIMINARY ADSORPTION TESTS
The extraction of precious metals from alkaline cyanided medium by granular activated carbon 50
As the concentration drops in the bulk solution, the driving force decreases and this might
explain the reduction in kinetics. However at much higher activated carbon loading than that
observed in this investigation, any reduction in the adsorption kinetics might be explained by
the difficulty to occupy the remaining vacant surface sites due to repulsive forces between
the solute molecules on the solid and bulk phase. Thereby surface diffusion in the interior of
the particles becoming rate-limiting.
Figure 4.7: Dimensionless time-concentration profiles for precious metal adsorption (Conditions: pH = 10, [CN] = 12.5 ppm, [SCN] = 3670 ppm, [Activated carbon] = 10 g/L and contact time = 72 hours)
0.00
0.10
0.20
0.30
0.40
0.50
0.60
0.70
0.80
0.90
1.00
0 10 20 30 40 50 60 70 80
Dim
en
sio
nle
ss
[Caq
] t/[
Caq
] 0
Contact time (hour)
PMs extraction: [AC] = 10 g/L
Pt
Pd
Rh
Au
Stellenbosch University http://scholar.sun.ac.za
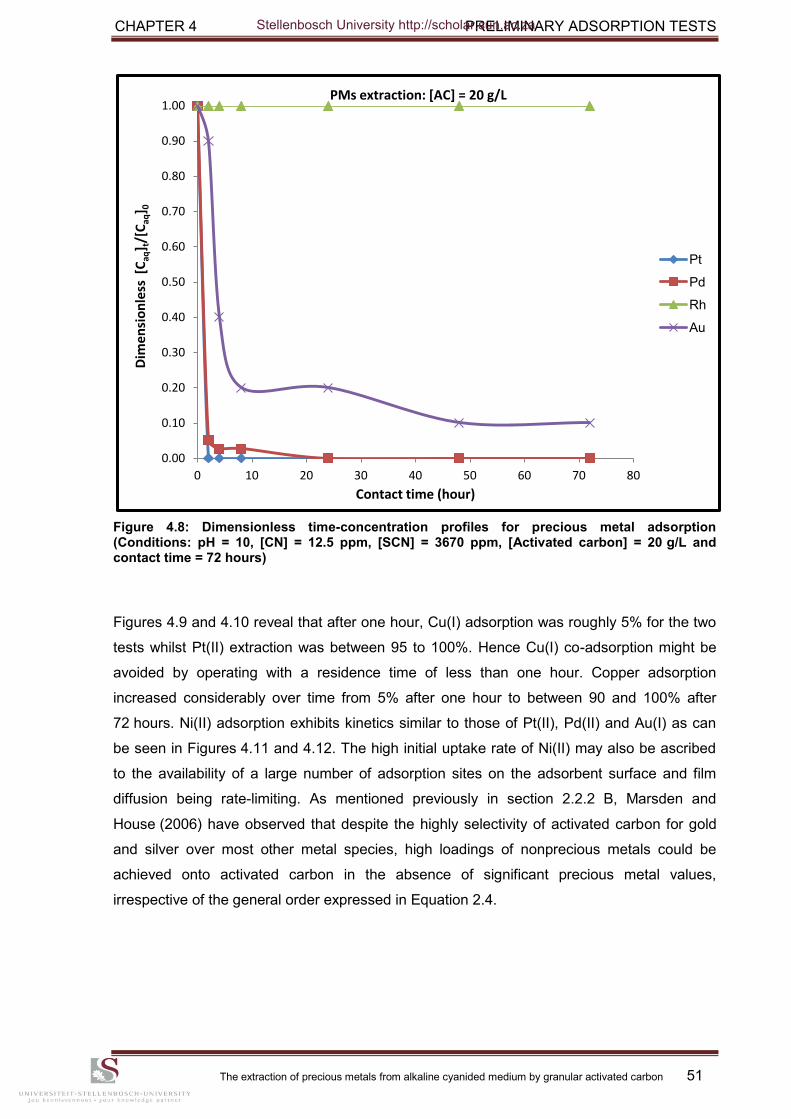
CHAPTER 4 PRELIMINARY ADSORPTION TESTS
The extraction of precious metals from alkaline cyanided medium by granular activated carbon 51
Figure 4.8: Dimensionless time-concentration profiles for precious metal adsorption (Conditions: pH = 10, [CN] = 12.5 ppm, [SCN] = 3670 ppm, [Activated carbon] = 20 g/L and contact time = 72 hours)
Figures 4.9 and 4.10 reveal that after one hour, Cu(I) adsorption was roughly 5% for the two
tests whilst Pt(II) extraction was between 95 to 100%. Hence Cu(I) co-adsorption might be
avoided by operating with a residence time of less than one hour. Copper adsorption
increased considerably over time from 5% after one hour to between 90 and 100% after
72 hours. Ni(II) adsorption exhibits kinetics similar to those of Pt(II), Pd(II) and Au(I) as can
be seen in Figures 4.11 and 4.12. The high initial uptake rate of Ni(II) may also be ascribed
to the availability of a large number of adsorption sites on the adsorbent surface and film
diffusion being rate-limiting. As mentioned previously in section 2.2.2 B, Marsden and
House (2006) have observed that despite the highly selectivity of activated carbon for gold
and silver over most other metal species, high loadings of nonprecious metals could be
achieved onto activated carbon in the absence of significant precious metal values,
irrespective of the general order expressed in Equation 2.4.
0.00
0.10
0.20
0.30
0.40
0.50
0.60
0.70
0.80
0.90
1.00
0 10 20 30 40 50 60 70 80
Dim
en
sio
nle
ss [
Caq
] t/[
Caq
] 0
Contact time (hour)
PMs extraction: [AC] = 20 g/L
Pt
Pd
Rh
Au
Stellenbosch University http://scholar.sun.ac.za
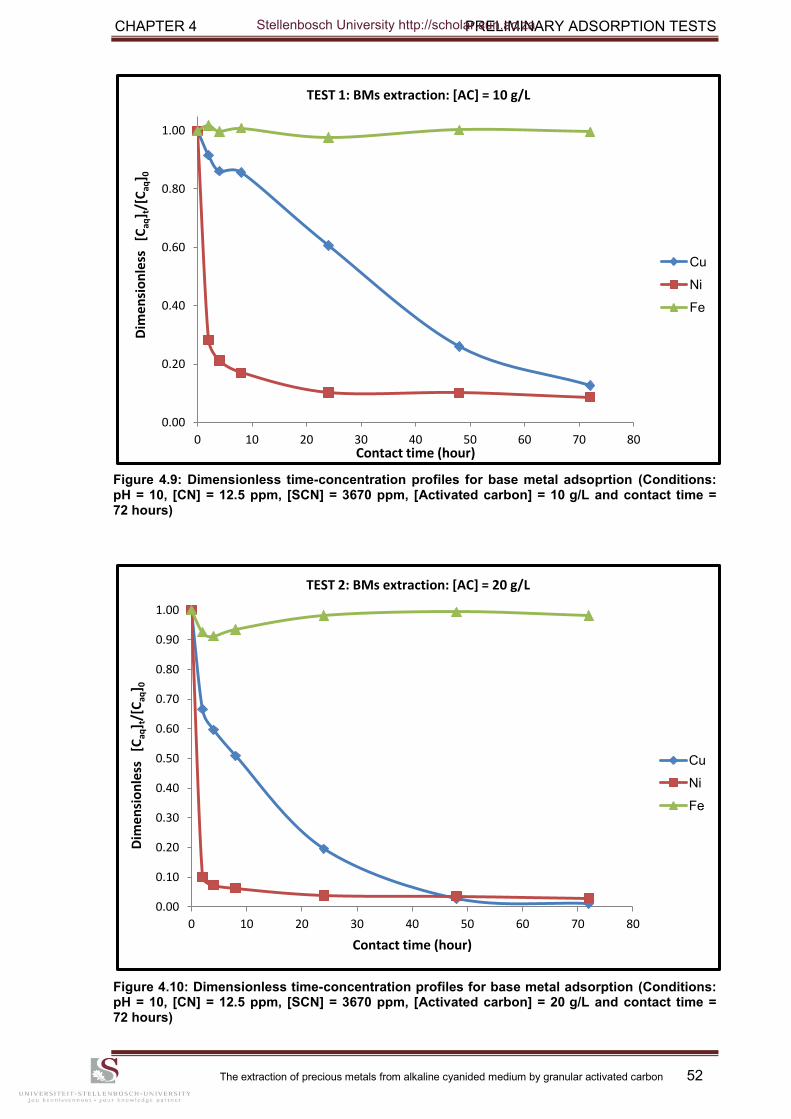
CHAPTER 4 PRELIMINARY ADSORPTION TESTS
The extraction of precious metals from alkaline cyanided medium by granular activated carbon 52
Figure 4.9: Dimensionless time-concentration profiles for base metal adsoprtion (Conditions: pH = 10, [CN] = 12.5 ppm, [SCN] = 3670 ppm, [Activated carbon] = 10 g/L and contact time = 72 hours)
Figure 4.10: Dimensionless time-concentration profiles for base metal adsorption (Conditions: pH = 10, [CN] = 12.5 ppm, [SCN] = 3670 ppm, [Activated carbon] = 20 g/L and contact time = 72 hours)
0.00
0.20
0.40
0.60
0.80
1.00
0 10 20 30 40 50 60 70 80
Dim
en
sio
nle
ss
[Caq
] t/[
Caq
] 0
Contact time (hour)
TEST 1: BMs extraction: [AC] = 10 g/L
Cu
Ni
Fe
0.00
0.10
0.20
0.30
0.40
0.50
0.60
0.70
0.80
0.90
1.00
0 10 20 30 40 50 60 70 80
Dim
en
sio
nle
ss
[Caq
] t/[
Caq
] 0
Contact time (hour)
TEST 2: BMs extraction: [AC] = 20 g/L
Cu
Ni
Fe
Stellenbosch University http://scholar.sun.ac.za
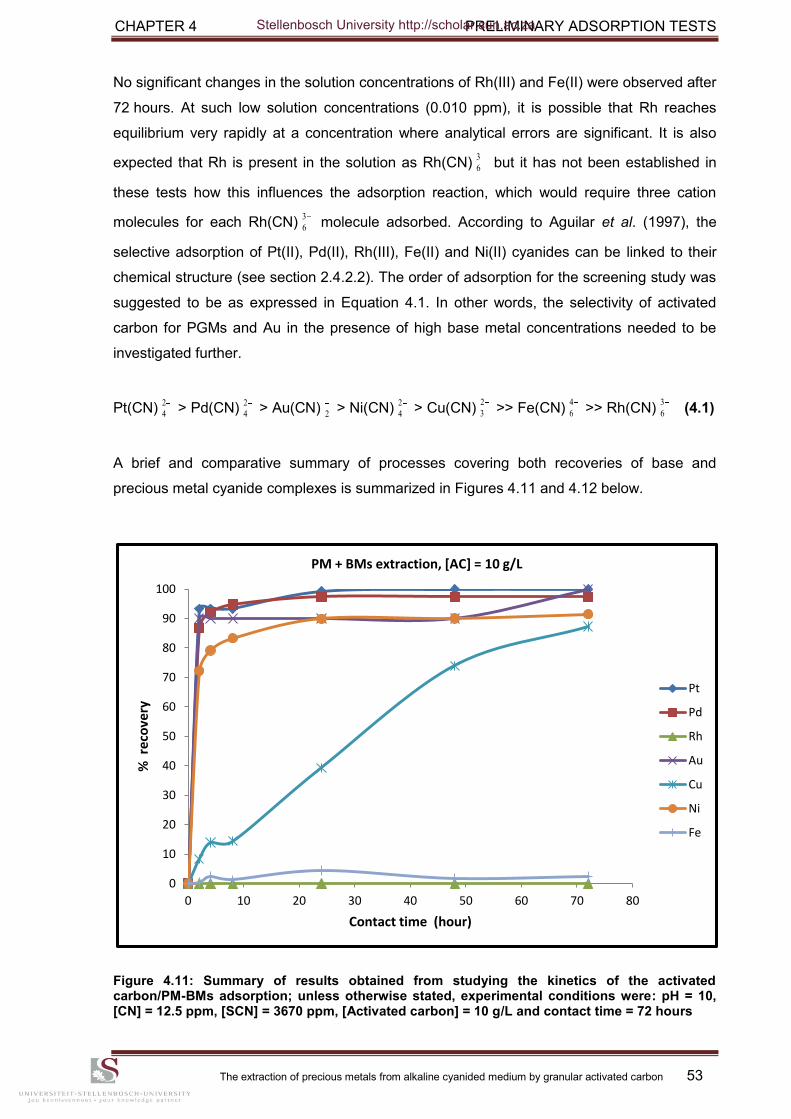
CHAPTER 4 PRELIMINARY ADSORPTION TESTS
The extraction of precious metals from alkaline cyanided medium by granular activated carbon 53
No significant changes in the solution concentrations of Rh(III) and Fe(II) were observed after
72 hours. At such low solution concentrations (0.010 ppm), it is possible that Rh reaches
equilibrium very rapidly at a concentration where analytical errors are significant. It is also
expected that Rh is present in the solution as Rh(CN) but it has not been established in
these tests how this influences the adsorption reaction, which would require three cation
molecules for each Rh(CN) molecule adsorbed. According to Aguilar et al. (1997), the
selective adsorption of Pt(II), Pd(II), Rh(III), Fe(II) and Ni(II) cyanides can be linked to their
chemical structure (see section 2.4.2.2). The order of adsorption for the screening study was
suggested to be as expressed in Equation 4.1. In other words, the selectivity of activated
carbon for PGMs and Au in the presence of high base metal concentrations needed to be
investigated further.
Pt(CN) > Pd(CN) > Au(CN) > Ni(CN) > Cu(CN) >> Fe(CN) >> Rh(CN)
(4.1)
A brief and comparative summary of processes covering both recoveries of base and
precious metal cyanide complexes is summarized in Figures 4.11 and 4.12 below.
Figure 4.11: Summary of results obtained from studying the kinetics of the activated carbon/PM-BMs adsorption; unless otherwise stated, experimental conditions were: pH = 10, [CN] = 12.5 ppm, [SCN] = 3670 ppm, [Activated carbon] = 10 g/L and contact time = 72 hours
3
6
3
6
2
4
2
4 2
2
4
2
3
4
6
3
6
0
10
20
30
40
50
60
70
80
90
100
0 10 20 30 40 50 60 70 80
% r
eco
very
Contact time (hour)
PM + BMs extraction, [AC] = 10 g/L
Pt
Pd
Rh
Au
Cu
Ni
Fe
Stellenbosch University http://scholar.sun.ac.za
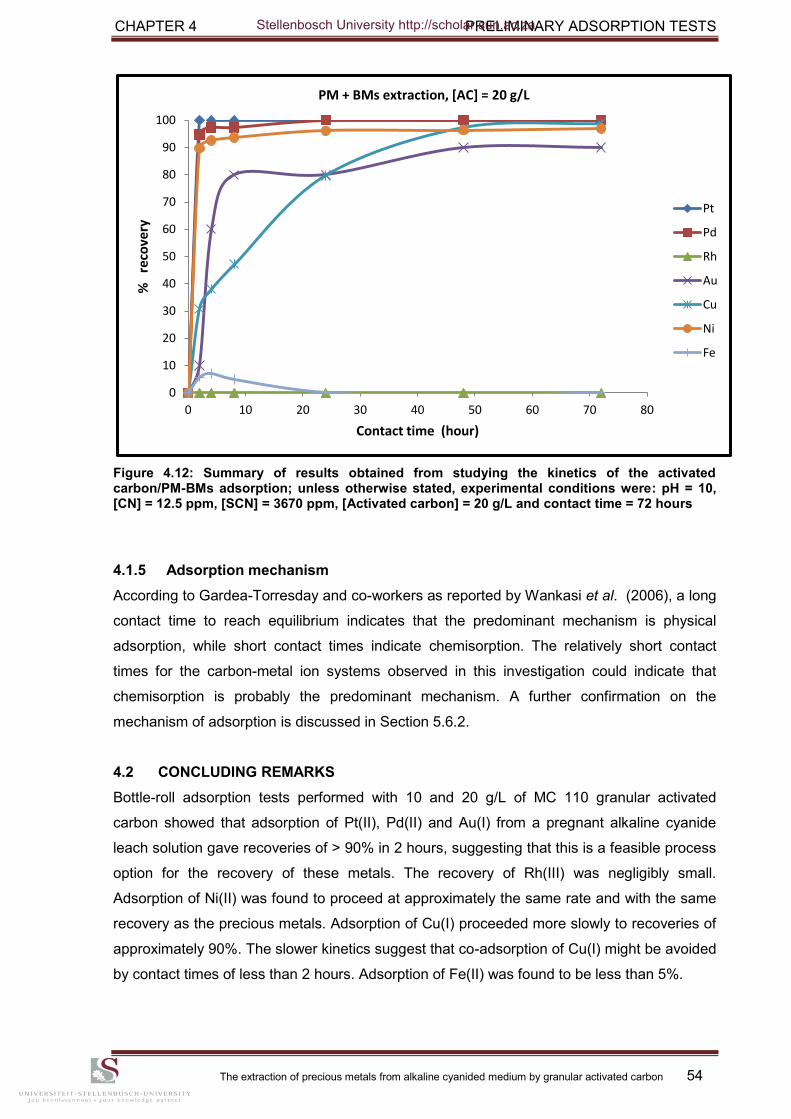
CHAPTER 4 PRELIMINARY ADSORPTION TESTS
The extraction of precious metals from alkaline cyanided medium by granular activated carbon 54
Figure 4.12: Summary of results obtained from studying the kinetics of the activated carbon/PM-BMs adsorption; unless otherwise stated, experimental conditions were: pH = 10, [CN] = 12.5 ppm, [SCN] = 3670 ppm, [Activated carbon] = 20 g/L and contact time = 72 hours
4.1.5 Adsorption mechanism
According to Gardea-Torresday and co-workers as reported by Wankasi et al. (2006), a long
contact time to reach equilibrium indicates that the predominant mechanism is physical
adsorption, while short contact times indicate chemisorption. The relatively short contact
times for the carbon-metal ion systems observed in this investigation could indicate that
chemisorption is probably the predominant mechanism. A further confirmation on the
mechanism of adsorption is discussed in Section 5.6.2.
4.2 CONCLUDING REMARKS
Bottle-roll adsorption tests performed with 10 and 20 g/L of MC 110 granular activated
carbon showed that adsorption of Pt(II), Pd(II) and Au(I) from a pregnant alkaline cyanide
leach solution gave recoveries of > 90% in 2 hours, suggesting that this is a feasible process
option for the recovery of these metals. The recovery of Rh(III) was negligibly small.
Adsorption of Ni(II) was found to proceed at approximately the same rate and with the same
recovery as the precious metals. Adsorption of Cu(I) proceeded more slowly to recoveries of
approximately 90%. The slower kinetics suggest that co-adsorption of Cu(I) might be avoided
by contact times of less than 2 hours. Adsorption of Fe(II) was found to be less than 5%.
0
10
20
30
40
50
60
70
80
90
100
0 10 20 30 40 50 60 70 80
%
reco
very
Contact time (hour)
PM + BMs extraction, [AC] = 20 g/L
Pt
Pd
Rh
Au
Cu
Ni
Fe
Stellenbosch University http://scholar.sun.ac.za
CHAPTER 5 EFFECT OF SELECTED OPERATING PARAMETERS: ACTUAL TESTS
The extraction of precious metals from alkaline cyanided medium by granular activated carbon 55
CHAPTER 5 : EFFECT OF SELECTED OPERATING PARAMETERS ON THE ADSORPTION PROCESS – RESULTS AND DISCUSSION
Findings, discussions and interpretation of results are presented in the present chapter. As
mentioned previously in Chapter 3, the general experimental procedure consisted of two
distinct sequential steps: screening tests were first undertaken in Chapter 4, and then
statistically designed experiments in Chapter 5 were performed based on findings from the
former chapter.
The preceding chapter described preliminary studies of the adsorption of precious and base
metal cyanides from actual heap leach solutions by activated carbon MC 110. However, in
optimizing the performance of any particular carbon-adsorption process, it is necessary to
examine in detail the various parameters that influence the adsorption, and to assess their
relative importance on the adsorption performance characteristic. In this chapter, results are
reported of experiments in which the influence of a number of variables on the rate of
adsorption, loading, equilibrium capacity of platinum group metal and gold cyanides was
examined.
5.1 SELECTION OF OPERATING VARIABLES
The choice of parameter values can greatly affect the final outcome of a process. Thus care
must be taken in their determination. In order to best select operating variables for the test-
work, consideration of the behaviour of copper during precious metals leaching and carbon
adsorption processes was important. Copper remains one of the most troubling elements in
both processes. The variables affecting its adsorption on activated carbon included among
others, the solution pH and free cyanide (CN ) concentration. As stated earlier in Chapter 4,
nickel cyanide complexes were fully loaded on activated carbon. Previous studies by
Davidson et al. (1979) have shown that thiocyanate ion (SCN ) is generated from cyanide
treatment of refractory sulphide ore/concentrate, with its potential negative implication on
gold adsorption.
Finally, it is usually acknowledged that increasing adsorbent and initial metal ion
concentrations would result in the increase of adsorption rate. Hence, parameters to be
investigated in this experimental study were: solution pH, copper, nickel, free cyanide ion,
thiocyanate, adsorbent and initial metal ion (Pt, Pd and Au) concentrations. Iron and rhodium
adsorptions were omitted from this study as their effective adsorption were found negligibly
small in the preceding chapter.
Stellenbosch University http://scholar.sun.ac.za
CHAPTER 5 EFFECT OF SELECTED OPERATING PARAMETERS: ACTUAL TESTS
The extraction of precious metals from alkaline cyanided medium by granular activated carbon 56
5.2 EXPERIMENTAL PROCEDURE
Two sets of laboratory scale experiments were conducted using synthetic solutions whose
chemical composition is displayed in Tables 5.1 and 5.7. The first set consisted of loading
tests that were designed to generate the optimum operating conditions of the adsorption
process. The second set of experiments consisted of loading capacity studies. From the first
set, a screening approach based on factorial design was used to select factors displaying the
most effects on the adsorption process. In a multi-response situation the problem is more
complex than in the single response case. Having high adsorption efficiency with the least
amount of adsorbent usage is more favourable. High loading capacity avoids excess carbon
to elution and regeneration stages. Simultaneous optimization of adsorption responses (R)
excluding adsorption capacity (q) was carried out for simplification purposes.
Table 5.1: Factors and levels used in factorial design
OPERATING FACTORS NOTATION Low level High level
pH A 9.5 12
[Cu(I)] (ppm) B 10 100
[Ni(II)] (ppm) C 10 100
[CN ] (ppm) D 100 300
[SCN ] (ppm) E 50 100
[PMs]: 2E + Au(I) (ppm) F 0.63 2.03
Carbon concentration [AC] (g/L) G 10 20
5.3 RESULTS AND DISCUSSION
5.3.1 Adsorption equilibrium time of PMs: Pt, Pd and Au
The effect of contact time on the adsorption of PMs onto activated carbon was studied over
mixing times of 0 to 72 hours, using different initial precious and base metal concentrations.
Figures in Appendix B showed that the adsorption of PMs increases rapidly in the first
contact time of 2 hours and then achieves pseudo-equilibrium in almost 10 hours. The initial
rapid stage is probably due to the abundant availability of functional groups at the surface of
the adsorbent. The initial concentration of PMs (Pt, Pd and Au) did not have a significant
effect on the contact time to achieve equilibrium. On the contrary, the quick adsorption of
PMs suggests that chemical adsorption rather than physical adsorption could contribute to
their adsorption. However, the longer the residence time of the process, the more copper and
nickel are adsorbed. As a result, a contact time of 2 hours was selected as the effective
loading time – as depicted for illustration purposes in Figure 5.1 – in order to prevent
excessive co-adsorption of those two base metals, particularly copper.
Stellenbosch University http://scholar.sun.ac.za
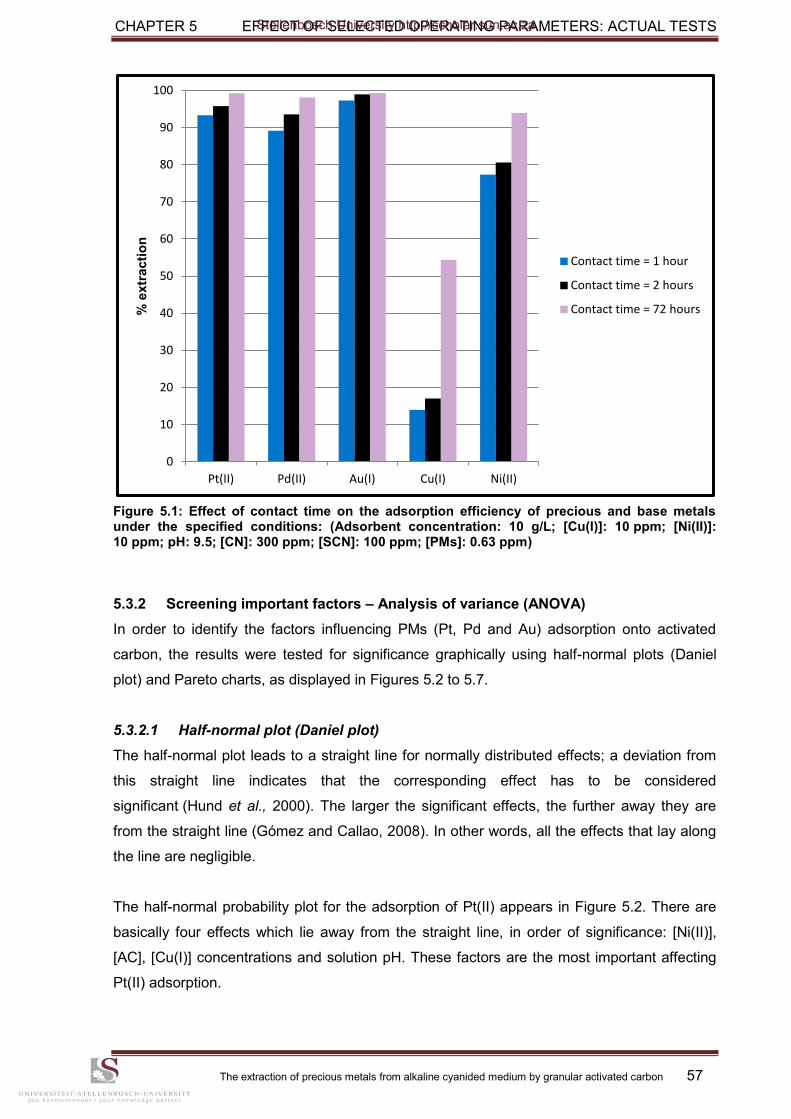
CHAPTER 5 EFFECT OF SELECTED OPERATING PARAMETERS: ACTUAL TESTS
The extraction of precious metals from alkaline cyanided medium by granular activated carbon 57
Figure 5.1: Effect of contact time on the adsorption efficiency of precious and base metals under the specified conditions: (Adsorbent concentration: 10 g/L; [Cu(I)]: 10 ppm; [Ni(II)]: 10 ppm; pH: 9.5; [CN]: 300 ppm; [SCN]: 100 ppm; [PMs]: 0.63 ppm)
5.3.2 Screening important factors – Analysis of variance (ANOVA)
In order to identify the factors influencing PMs (Pt, Pd and Au) adsorption onto activated
carbon, the results were tested for significance graphically using half-normal plots (Daniel
plot) and Pareto charts, as displayed in Figures 5.2 to 5.7.
5.3.2.1 Half-normal plot (Daniel plot)
The half-normal plot leads to a straight line for normally distributed effects; a deviation from
this straight line indicates that the corresponding effect has to be considered
significant (Hund et al., 2000). The larger the significant effects, the further away they are
from the straight line (Gómez and Callao, 2008). In other words, all the effects that lay along
the line are negligible.
The half-normal probability plot for the adsorption of Pt(II) appears in Figure 5.2. There are
basically four effects which lie away from the straight line, in order of significance: [Ni(II)],
[AC], [Cu(I)] concentrations and solution pH. These factors are the most important affecting
Pt(II) adsorption.
0
10
20
30
40
50
60
70
80
90
100
Pt(II) Pd(II) Au(I) Cu(I) Ni(II)
% e
xtr
acti
on
Contact time = 1 hour
Contact time = 2 hours
Contact time = 72 hours
Stellenbosch University http://scholar.sun.ac.za
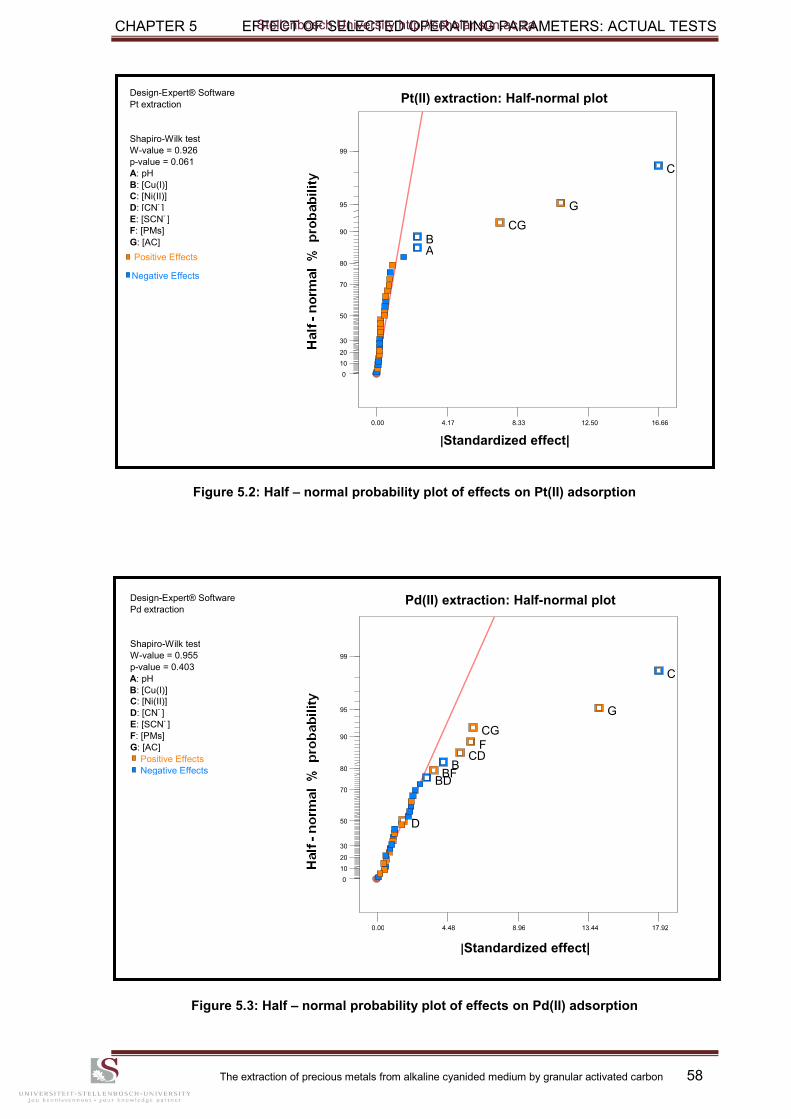
CHAPTER 5 EFFECT OF SELECTED OPERATING PARAMETERS: ACTUAL TESTS
The extraction of precious metals from alkaline cyanided medium by granular activated carbon 58
Figure 5.2: Half – normal probability plot of effects on Pt(II) adsorption
Figure 5.3: Half – normal probability plot of effects on Pd(II) adsorption
Design-Expert® Software Pd extraction
Shapiro-Wilk test W-value = 0.955 p-value = 0.403 C: [Ni(II)] D: [CN
- ]
E: [SCN- ]
F: [PMs] G: [AC]
Positive Effects Negative Effects
0.00 4.48 8.96 13.44 17.92
0 10 20 30
50
70
80
90
95
99
B
C
D
F
G
BD BF
CD
CG
Pd(II) extraction: Half-normal plot
|Standardized effect|
A: pH B: [Cu(I)]
Design-Expert® Software Pt extraction
Shapiro-Wilk test W-value = 0.926 p-value = 0.061 A: pH B: [Cu(I)] C: [Ni(II)] D: [CN
- ]
E: [SCN- ]
F: [PMs] G: [AC] Positive Effects
Negative Effects
Pt(II) extraction: Half-normal plot
|Standardized effect|
0.00 4.17 8.33 12.50 16.66
0 10 20 30
50
70
80
90
95
99
A B
C
G
CG
Stellenbosch University http://scholar.sun.ac.za
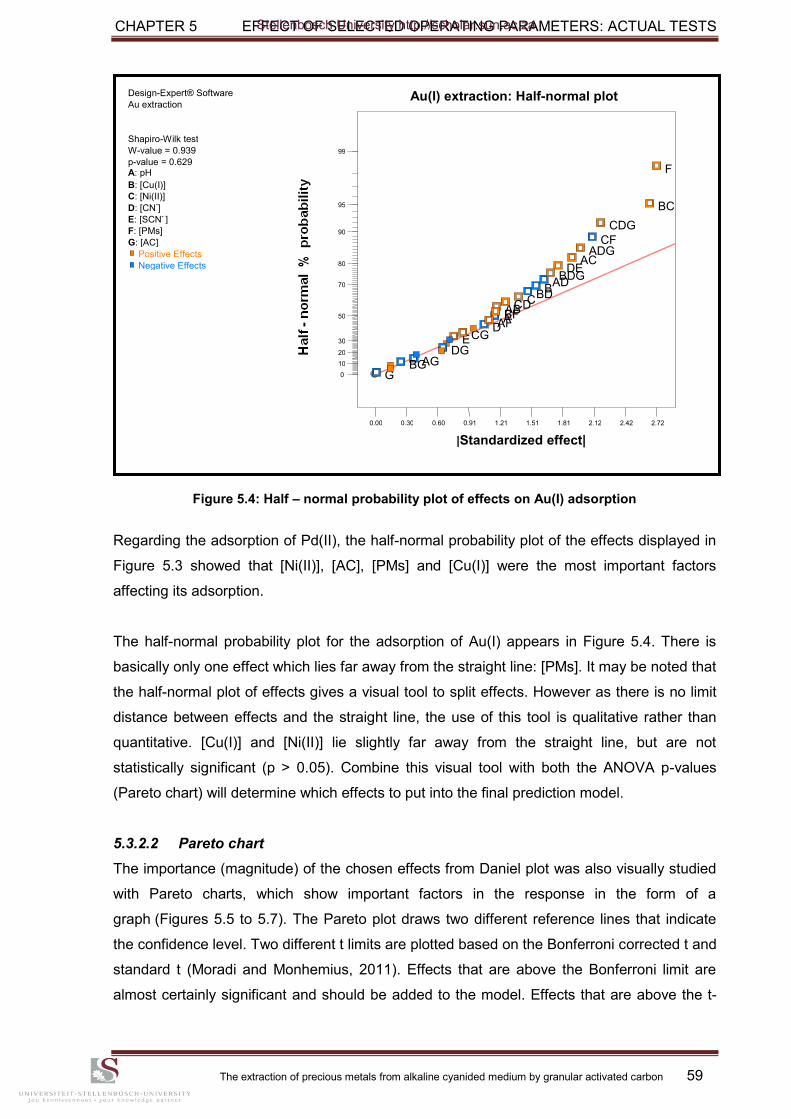
CHAPTER 5 EFFECT OF SELECTED OPERATING PARAMETERS: ACTUAL TESTS
The extraction of precious metals from alkaline cyanided medium by granular activated carbon 59
Figure 5.4: Half – normal probability plot of effects on Au(I) adsorption
Regarding the adsorption of Pd(II), the half-normal probability plot of the effects displayed in
Figure 5.3 showed that [Ni(II)], [AC], [PMs] and [Cu(I)] were the most important factors
affecting its adsorption.
The half-normal probability plot for the adsorption of Au(I) appears in Figure 5.4. There is
basically only one effect which lies far away from the straight line: [PMs]. It may be noted that
the half-normal plot of effects gives a visual tool to split effects. However as there is no limit
distance between effects and the straight line, the use of this tool is qualitative rather than
quantitative. [Cu(I)] and [Ni(II)] lie slightly far away from the straight line, but are not
statistically significant (p > 0.05). Combine this visual tool with both the ANOVA p-values
(Pareto chart) will determine which effects to put into the final prediction model.
5.3.2.2 Pareto chart
The importance (magnitude) of the chosen effects from Daniel plot was also visually studied
with Pareto charts, which show important factors in the response in the form of a
graph (Figures 5.5 to 5.7). The Pareto plot draws two different reference lines that indicate
the confidence level. Two different t limits are plotted based on the Bonferroni corrected t and
standard t (Moradi and Monhemius, 2011). Effects that are above the Bonferroni limit are
almost certainly significant and should be added to the model. Effects that are above the t-
Design-Expert® Software Au extraction
Shapiro-Wilk test W-value = 0.939 p-value = 0.629 C: [Ni(II)] D: [CN
-]
E: [SCN- ]
F: [PMs] G: [AC]
Positive Effects Negative Effects
0.00 0.30 0.60 0.91 1.21 1.51 1.81 2.12 2.42 2.72
0 10 20 30
50
70
80
90
95
99
A
B C
D E
F
G
AB
AC
AD
AF
AG
BC
BD
BF
BG
CD
CF
CG
DE
DG
ADG
BDG
CDG
Au(I) extraction: Half-normal plot
|Standardized effect|
B: [Cu(I)] A: pH
Stellenbosch University http://scholar.sun.ac.za
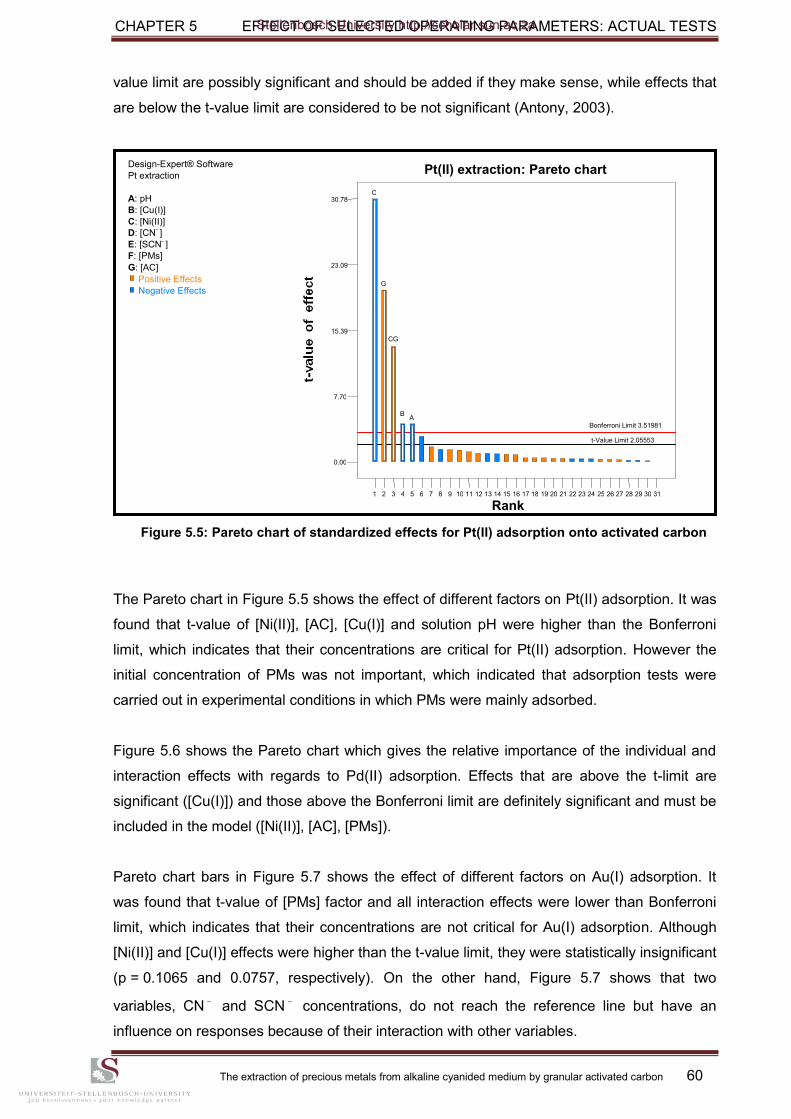
CHAPTER 5 EFFECT OF SELECTED OPERATING PARAMETERS: ACTUAL TESTS
The extraction of precious metals from alkaline cyanided medium by granular activated carbon 60
value limit are possibly significant and should be added if they make sense, while effects that
are below the t-value limit are considered to be not significant (Antony, 2003).
Figure 5.5: Pareto chart of standardized effects for Pt(II) adsorption onto activated carbon
The Pareto chart in Figure 5.5 shows the effect of different factors on Pt(II) adsorption. It was
found that t-value of [Ni(II)], [AC], [Cu(I)] and solution pH were higher than the Bonferroni
limit, which indicates that their concentrations are critical for Pt(II) adsorption. However the
initial concentration of PMs was not important, which indicated that adsorption tests were
carried out in experimental conditions in which PMs were mainly adsorbed.
Figure 5.6 shows the Pareto chart which gives the relative importance of the individual and
interaction effects with regards to Pd(II) adsorption. Effects that are above the t-limit are
significant ([Cu(I)]) and those above the Bonferroni limit are definitely significant and must be
included in the model ([Ni(II)], [AC], [PMs]).
Pareto chart bars in Figure 5.7 shows the effect of different factors on Au(I) adsorption. It
was found that t-value of [PMs] factor and all interaction effects were lower than Bonferroni
limit, which indicates that their concentrations are not critical for Au(I) adsorption. Although
[Ni(II)] and [Cu(I)] effects were higher than the t-value limit, they were statistically insignificant
(p = 0.1065 and 0.0757, respectively). On the other hand, Figure 5.7 shows that two
variables, CN and SCN concentrations, do not reach the reference line but have an
influence on responses because of their interaction with other variables.
Design-Expert® Software Pt extraction
A: pH B: [Cu(I)] C: [Ni(II)] D: [CN
- ]
E: [SCN- ]
F: [PMs] G: [AC]
Positive Effects Negative Effects
Pt(II) extraction: Pareto chart
Rank
0.00
7.70
15.39
23.09
30.78
1 2 3 4 5 6 7 8 9 10 11 12 13 14 15 16 17 18 19 20 21 22 23 24 25 26 27 28 29 30 31
Bonferroni Limit 3.51981 t-Value Limit 2.05553
C
G
CG
B A
Stellenbosch University http://scholar.sun.ac.za
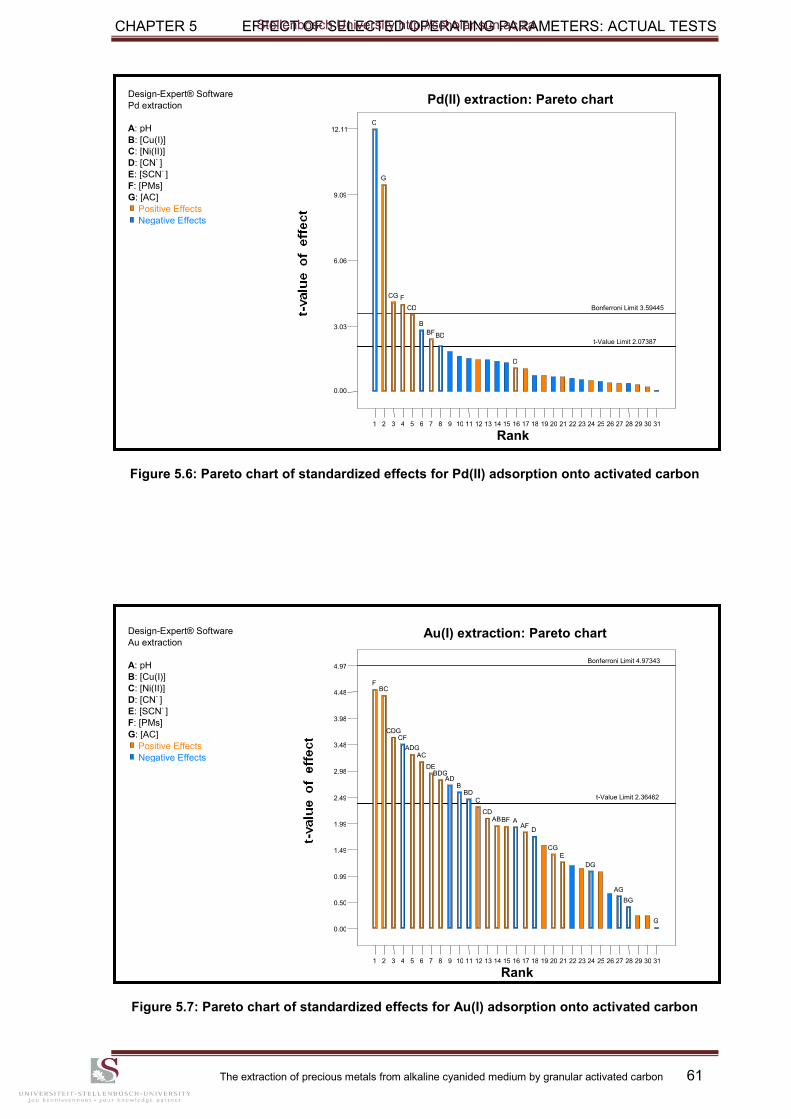
CHAPTER 5 EFFECT OF SELECTED OPERATING PARAMETERS: ACTUAL TESTS
The extraction of precious metals from alkaline cyanided medium by granular activated carbon 61
Figure 5.6: Pareto chart of standardized effects for Pd(II) adsorption onto activated carbon
Figure 5.7: Pareto chart of standardized effects for Au(I) adsorption onto activated carbon
Design-Expert® Software Au extraction
A: pH B: [Cu(I)] C: [Ni(II)] D: [CN
- ]
E: [SCN- ]
F: [PMs] G: [AC]
Positive Effects Negative Effects
Rank
0.00
0.50
0.99
1.49
1.99
2.49
2.98
3.48
3.98
4.48
4.97
1 2 3 4 5 6 7 8 9 10 11 12 13 14 15 16 17 18 19 20 21 22 23 24 25 26 27 28 29 30 31
Bonferroni Limit 4.97343
t-Value Limit 2.36462
F BC
CDG CF
ADG AC
DE BDG
AD B
BD C
CD AB BF A
AF D
CG E
DG
AG BG
G
Au(I) extraction: Pareto chart
Design-Expert® Software Pd extraction
A: pH B: [Cu(I)] C: [Ni(II)] D: [CN
- ]
E: [SCN- ]
F: [PMs] G: [AC]
Positive Effects Negative Effects
Pd(II) extraction: Pareto chart
Rank
0.00
3.03
6.06
9.09
12.11
1 2 3 4 5 6 7 8 9 10 11 12 13 14 15 16 17 18 19 20 21 22 23 24 25 26 27 28 29 30 31
Bonferroni Limit 3.59445
t-Value Limit 2.07387
C
G
CG F CD
B BF BD
D
Stellenbosch University http://scholar.sun.ac.za
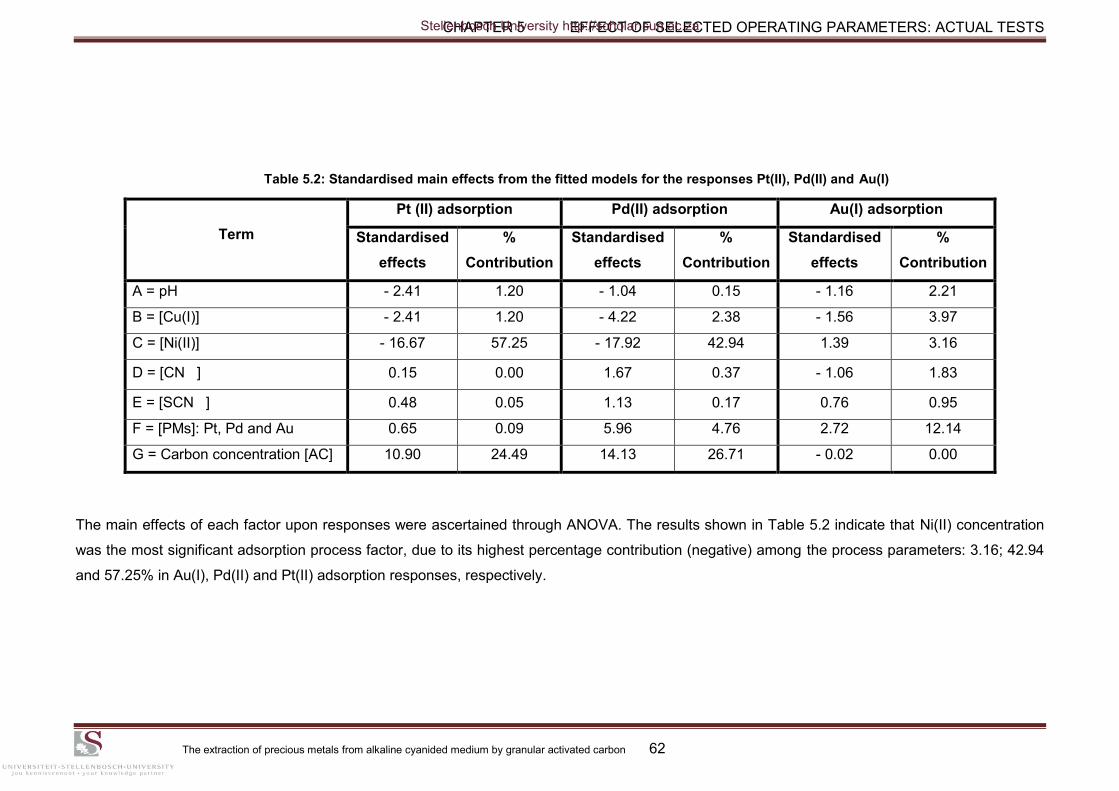
CHAPTER 5 EFFECT OF SELECTED OPERATING PARAMETERS: ACTUAL TESTS
The extraction of precious metals from alkaline cyanided medium by granular activated carbon 62
Table 5.2: Standardised main effects from the fitted models for the responses Pt(II), Pd(II) and Au(I)
The main effects of each factor upon responses were ascertained through ANOVA. The results shown in Table 5.2 indicate that Ni(II) concentration
was the most significant adsorption process factor, due to its highest percentage contribution (negative) among the process parameters: 3.16; 42.94
and 57.25% in Au(I), Pd(II) and Pt(II) adsorption responses, respectively.
Term
Pt (II) adsorption Pd(II) adsorption Au(I) adsorption
Standardised
effects
%
Contribution
Standardised
effects
%
Contribution
Standardised
effects
%
Contribution
A = pH - 2.41 1.20 - 1.04 0.15 - 1.16 2.21
B = [Cu(I)] - 2.41 1.20 - 4.22 2.38 - 1.56 3.97
C = [Ni(II)] - 16.67 57.25 - 17.92 42.94 1.39 3.16
D = [CN ] 0.15 0.00 1.67 0.37 - 1.06 1.83
E = [SCN ] 0.48 0.05 1.13 0.17 0.76 0.95
F = [PMs]: Pt, Pd and Au 0.65 0.09 5.96 4.76 2.72 12.14
G = Carbon concentration [AC] 10.90 24.49 14.13 26.71 - 0.02 0.00
Stellenbosch University http://scholar.sun.ac.za

CHAPTER 5 EFFECT OF SELECTED OPERATING PARAMETERS: ACTUAL TESTS
The extraction of precious metals from alkaline cyanided medium by granular activated carbon 63
Table 5.3: Coefficient of Pt(II), Pd(II) and Au(I) model responses in coded form
Response Intercept
A
pH
B
[Cu(I)]
C
[Ni(II)]
D
[CN ]
E
[SCN ]
F
[PMs]
G
[AC]
AB
pH-[Cu(I)]
AC
pH-[Ni(II)]
AD
pH-[CN ]
AF
pH-[PMs]
Pt(II) 88.7318 - 1.2066 - 1.2072 - 8.332
5.4491
p =
0.0156 0.0156 < 0.0001
< 0.0001
Pd(II) 83.8173
- 2.1091 - 8.9578 0.8309
2.9822 7.0647
p =
0.0355 < 0.0001 0.3879
0.0044 < 0.0001
Au(I) 97.3695 - 0.5803 - 0.7784 0.6941 - 0.5278 0.3816 1.3609 - 0.0084 1.314 2.1278 - 0.8178 0.5522
p =
0.1669 0.0757 0.1065 0.2041 0.3467 0.0073 0.9829 0.1622 0.0373 0.0645 0.1860
Table 5.3 (continued)
Response
AG
pH-[AC]
BC
[Cu(I)]-[Ni(II)]
BD
[Cu(I)]-[CN ]
BF
[Cu(I)]-[PMs]
BG
[Cu(I)]-[AC]
CD
[Ni(II)]-[CN ]
CF
[Ni(II)]-[PMs]
CG
[Ni(II)]-[AC]
DE
[CN ]-[SCN ]
Pt(II)
3.6509
p =
< 0.0001
Pd(II)
- 1.5822 1.8078
2.6503
3.0628
p =
0.1073 0.0681
0.0100
0.0036
Au(I) - 0.1884 2.9672 - 0.7397 0.5841 - 0.1266 0.6303 - 1.0497 0.4247 1.9791
p = 0.6348 0.0084 0.0886 0.1645 0.7487 0.1372 0.0250 0.2981 0.0490
Stellenbosch University http://scholar.sun.ac.za
CHAPTER 5 EFFECT OF SELECTED OPERATING PARAMETERS: ACTUAL TESTS
The extraction of precious metals from alkaline cyanided medium by granular activated carbon 64
Table 5.3 (continued and end)
Legend: In italic are significant factors and interactions (p ≤ 0.05)
From Table 5.3, p-values of less than 0.05 implie that there is more than 95% chance that
the observed change in the response variable is due change in the given model
term (Antony, 2003). The small p-values (< 0.05) mean that not all the main effects and
interactions are zero at the 5% significance level. In other words, there is reasonably strong
evidence that at least some of the main effects and interactions are not equal to zero.
Generally, a term that has a probability value less than or equal to 0.05 would be considered
as significant effect at a confidence level ≥ 95%, while a probability value greater than 0.10 is
generally regarded as not significant. In the latter case, the term should be removed from the
model, unless it is needed to satisfy the hierarchy i.e., it is a parent term of a significant
interaction. Thus the dominant factors assessed using Daniel plots and Pareto charts were
found in order of decreasing ranking of importance to be: [Ni(II)], [AC], [PMs], [Cu(I)]
and solution pH.
5.3.3 Examining main effects
5.3.3.1 Influence of pH
It has been reported by Das (2010) that the solution pH is one of the most important
variables affecting the surface charge of the activated carbon through dissociation of
functional groups on its surface active sites, the speciation of metals in solution through
hydrolysis, complexation and redox reactions during metal recovery. Adams et al. (1987)
indicated that the aurocyanide complex adsorption onto activated carbon decreases with
increasing equilibrium pH, possibly due to the carbon deprotonation at higher pH values.
Fleming and Nicol (1984) have observed that an increase in the concentration of free
cyanide depresses the rate of loading and the equilibrium capacity of gold adsorption. Lu et
Response
DG
[CN ]-[AC]
ADG
pH-[CN ]-[AC]
BDG
[Cu(I)]-[CN ]-[AC]
CDG
[Ni(II)]-[CN ]-[AC]
Pt(II)
p =
Pd(II)
p =
Au(I) - 0.3284 2.2191 1.8972 2.4384
p = 0.4145 0.0316 0.0569 0.0212
Stellenbosch University http://scholar.sun.ac.za
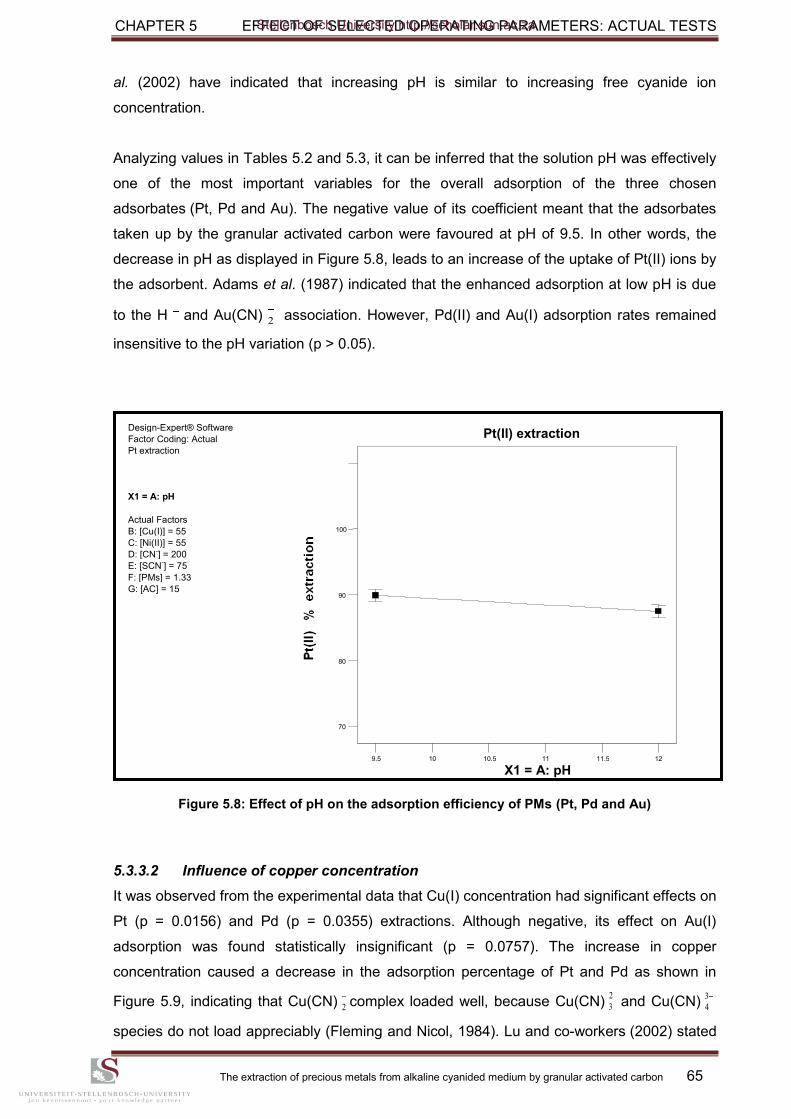
CHAPTER 5 EFFECT OF SELECTED OPERATING PARAMETERS: ACTUAL TESTS
The extraction of precious metals from alkaline cyanided medium by granular activated carbon 65
al. (2002) have indicated that increasing pH is similar to increasing free cyanide ion
concentration.
Analyzing values in Tables 5.2 and 5.3, it can be inferred that the solution pH was effectively
one of the most important variables for the overall adsorption of the three chosen
adsorbates (Pt, Pd and Au). The negative value of its coefficient meant that the adsorbates
taken up by the granular activated carbon were favoured at pH of 9.5. In other words, the
decrease in pH as displayed in Figure 5.8, leads to an increase of the uptake of Pt(II) ions by
the adsorbent. Adams et al. (1987) indicated that the enhanced adsorption at low pH is due
to the H and Au(CN) association. However, Pd(II) and Au(I) adsorption rates remained
insensitive to the pH variation (p > 0.05).
Figure 5.8: Effect of pH on the adsorption efficiency of PMs (Pt, Pd and Au)
5.3.3.2 Influence of copper concentration
It was observed from the experimental data that Cu(I) concentration had significant effects on
Pt (p = 0.0156) and Pd (p = 0.0355) extractions. Although negative, its effect on Au(I)
adsorption was found statistically insignificant (p = 0.0757). The increase in copper
concentration caused a decrease in the adsorption percentage of Pt and Pd as shown in
Figure 5.9, indicating that Cu(CN) complex loaded well, because Cu(CN) and Cu(CN)
species do not load appreciably (Fleming and Nicol, 1984). Lu and co-workers (2002) stated
2
2
2
3
3
4
Design-Expert® Software Factor Coding: Actual Pt extraction
X1 = A: pH
Actual Factors B: [Cu(I)] = 55 C: [Ni(II)] = 55 D: [CN
-] = 200
E: [SCN-] = 75
F: [PMs] = 1.33 G: [AC] = 15
9.5 10 10.5 11 11.5 12 X1 = A: pH
70
80
90
100
Pt(II) extraction
Stellenbosch University http://scholar.sun.ac.za
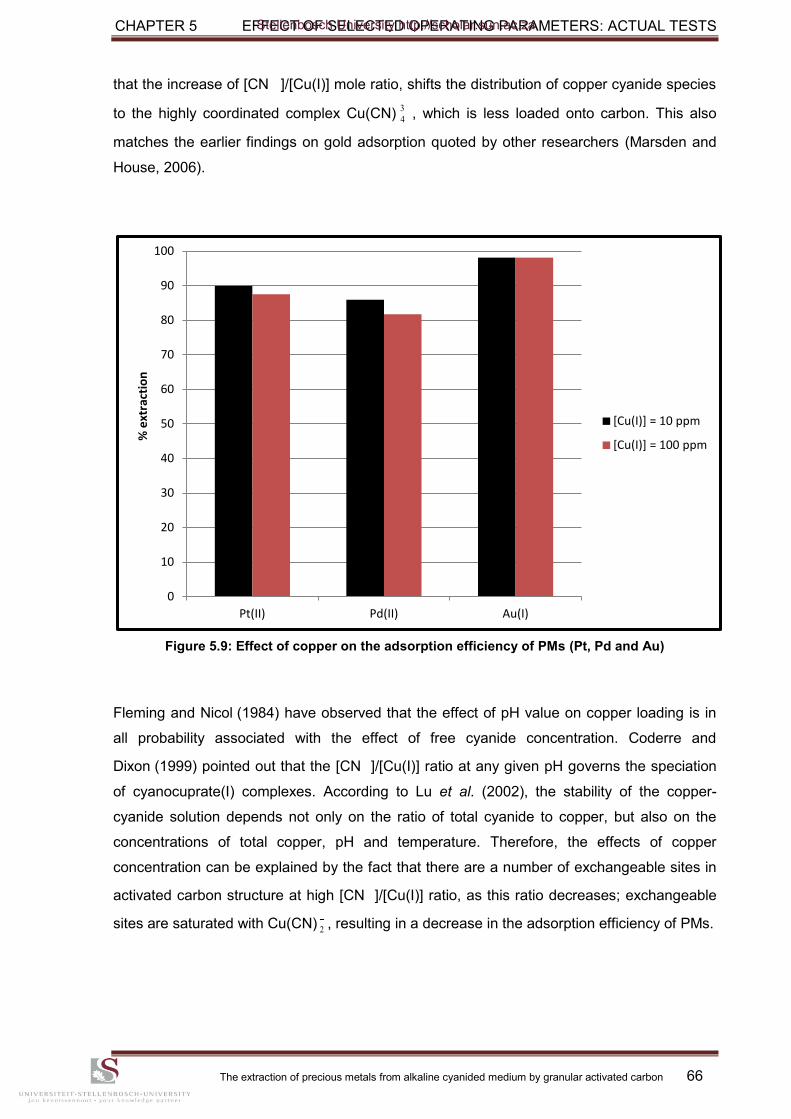
CHAPTER 5 EFFECT OF SELECTED OPERATING PARAMETERS: ACTUAL TESTS
The extraction of precious metals from alkaline cyanided medium by granular activated carbon 66
that the increase of [CN ]/[Cu(I)] mole ratio, shifts the distribution of copper cyanide species
to the highly coordinated complex Cu(CN) , which is less loaded onto carbon. This also
matches the earlier findings on gold adsorption quoted by other researchers (Marsden and
House, 2006).
Figure 5.9: Effect of copper on the adsorption efficiency of PMs (Pt, Pd and Au)
Fleming and Nicol (1984) have observed that the effect of pH value on copper loading is in
all probability associated with the effect of free cyanide concentration. Coderre and
Dixon (1999) pointed out that the [CN ]/[Cu(I)] ratio at any given pH governs the speciation
of cyanocuprate(I) complexes. According to Lu et al. (2002), the stability of the copper-
cyanide solution depends not only on the ratio of total cyanide to copper, but also on the
concentrations of total copper, pH and temperature. Therefore, the effects of copper
concentration can be explained by the fact that there are a number of exchangeable sites in
activated carbon structure at high [CN ]/[Cu(I)] ratio, as this ratio decreases; exchangeable
sites are saturated with Cu(CN) 2 , resulting in a decrease in the adsorption efficiency of PMs.
3
4
0
10
20
30
40
50
60
70
80
90
100
Pt(II) Pd(II) Au(I)
% e
xtra
ctio
n
[Cu(I)] = 10 ppm
[Cu(I)] = 100 ppm
Stellenbosch University http://scholar.sun.ac.za
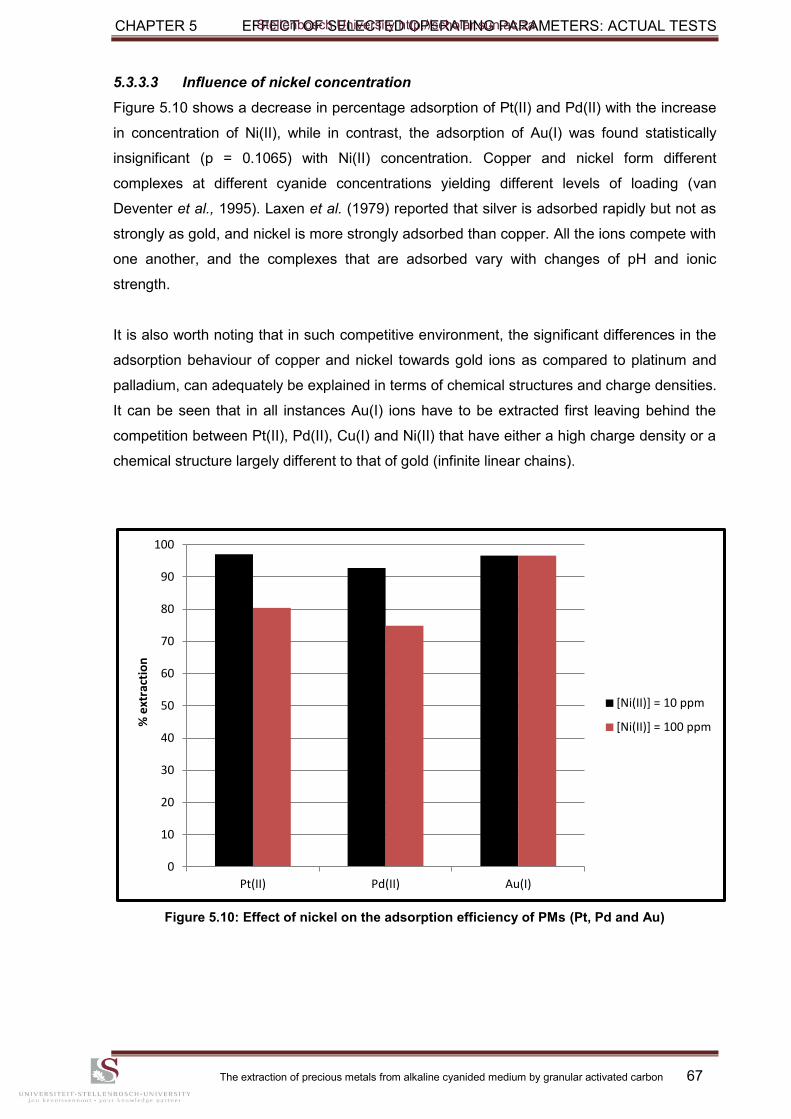
CHAPTER 5 EFFECT OF SELECTED OPERATING PARAMETERS: ACTUAL TESTS
The extraction of precious metals from alkaline cyanided medium by granular activated carbon 67
5.3.3.3 Influence of nickel concentration
Figure 5.10 shows a decrease in percentage adsorption of Pt(II) and Pd(II) with the increase
in concentration of Ni(II), while in contrast, the adsorption of Au(I) was found statistically
insignificant (p = 0.1065) with Ni(II) concentration. Copper and nickel form different
complexes at different cyanide concentrations yielding different levels of loading (van
Deventer et al., 1995). Laxen et al. (1979) reported that silver is adsorbed rapidly but not as
strongly as gold, and nickel is more strongly adsorbed than copper. All the ions compete with
one another, and the complexes that are adsorbed vary with changes of pH and ionic
strength.
It is also worth noting that in such competitive environment, the significant differences in the
adsorption behaviour of copper and nickel towards gold ions as compared to platinum and
palladium, can adequately be explained in terms of chemical structures and charge densities.
It can be seen that in all instances Au(I) ions have to be extracted first leaving behind the
competition between Pt(II), Pd(II), Cu(I) and Ni(II) that have either a high charge density or a
chemical structure largely different to that of gold (infinite linear chains).
Figure 5.10: Effect of nickel on the adsorption efficiency of PMs (Pt, Pd and Au)
0
10
20
30
40
50
60
70
80
90
100
Pt(II) Pd(II) Au(I)
% e
xtra
ctio
n
[Ni(II)] = 10 ppm
[Ni(II)] = 100 ppm
Stellenbosch University http://scholar.sun.ac.za
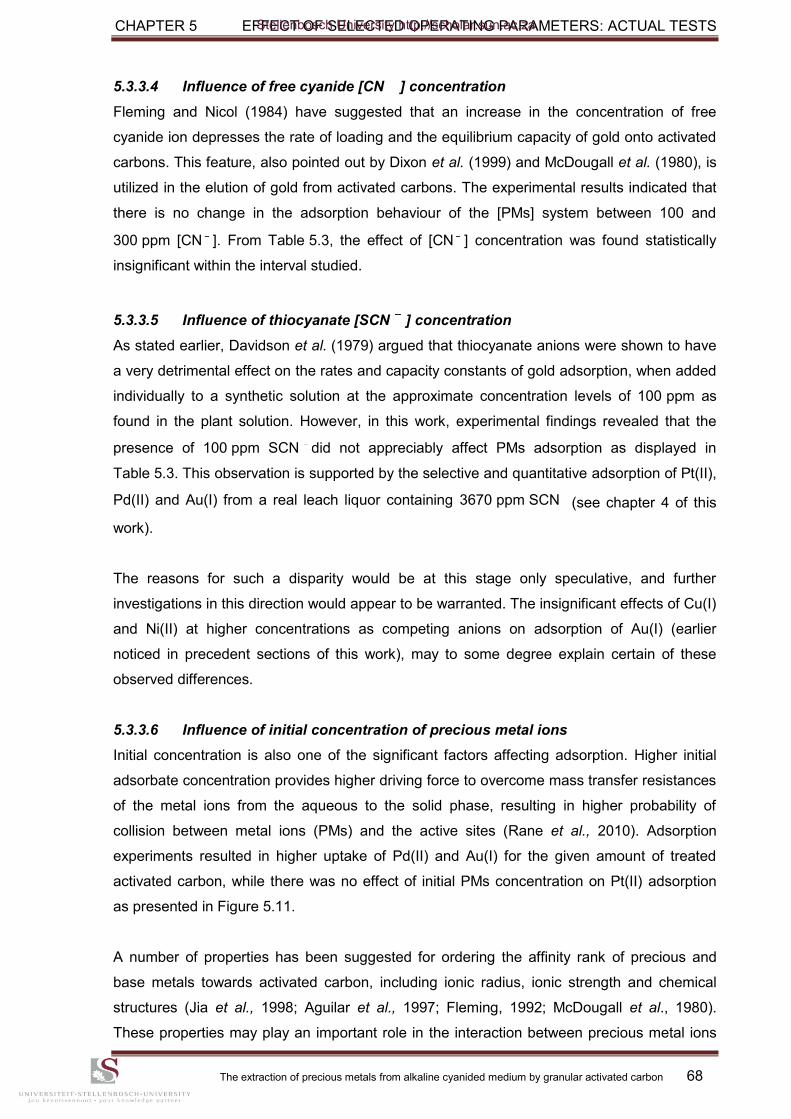
CHAPTER 5 EFFECT OF SELECTED OPERATING PARAMETERS: ACTUAL TESTS
The extraction of precious metals from alkaline cyanided medium by granular activated carbon 68
5.3.3.4 Influence of free cyanide [CN ] concentration
Fleming and Nicol (1984) have suggested that an increase in the concentration of free
cyanide ion depresses the rate of loading and the equilibrium capacity of gold onto activated
carbons. This feature, also pointed out by Dixon et al. (1999) and McDougall et al. (1980), is
utilized in the elution of gold from activated carbons. The experimental results indicated that
there is no change in the adsorption behaviour of the [PMs] system between 100 and
300 ppm [CN ]. From Table 5.3, the effect of [CN ] concentration was found statistically
insignificant within the interval studied.
5.3.3.5 Influence of thiocyanate [SCN ] concentration
As stated earlier, Davidson et al. (1979) argued that thiocyanate anions were shown to have
a very detrimental effect on the rates and capacity constants of gold adsorption, when added
individually to a synthetic solution at the approximate concentration levels of 100 ppm as
found in the plant solution. However, in this work, experimental findings revealed that the
presence of 100 ppm SCN did not appreciably affect PMs adsorption as displayed in
Table 5.3. This observation is supported by the selective and quantitative adsorption of Pt(II),
Pd(II) and Au(I) from a real leach liquor containing 3670 ppm SCN (see chapter 4 of this
work).
The reasons for such a disparity would be at this stage only speculative, and further
investigations in this direction would appear to be warranted. The insignificant effects of Cu(I)
and Ni(II) at higher concentrations as competing anions on adsorption of Au(I) (earlier
noticed in precedent sections of this work), may to some degree explain certain of these
observed differences.
5.3.3.6 Influence of initial concentration of precious metal ions
Initial concentration is also one of the significant factors affecting adsorption. Higher initial
adsorbate concentration provides higher driving force to overcome mass transfer resistances
of the metal ions from the aqueous to the solid phase, resulting in higher probability of
collision between metal ions (PMs) and the active sites (Rane et al., 2010). Adsorption
experiments resulted in higher uptake of Pd(II) and Au(I) for the given amount of treated
activated carbon, while there was no effect of initial PMs concentration on Pt(II) adsorption
as presented in Figure 5.11.
A number of properties has been suggested for ordering the affinity rank of precious and
base metals towards activated carbon, including ionic radius, ionic strength and chemical
structures (Jia et al., 1998; Aguilar et al., 1997; Fleming, 1992; McDougall et al., 1980).
These properties may play an important role in the interaction between precious metal ions
Stellenbosch University http://scholar.sun.ac.za
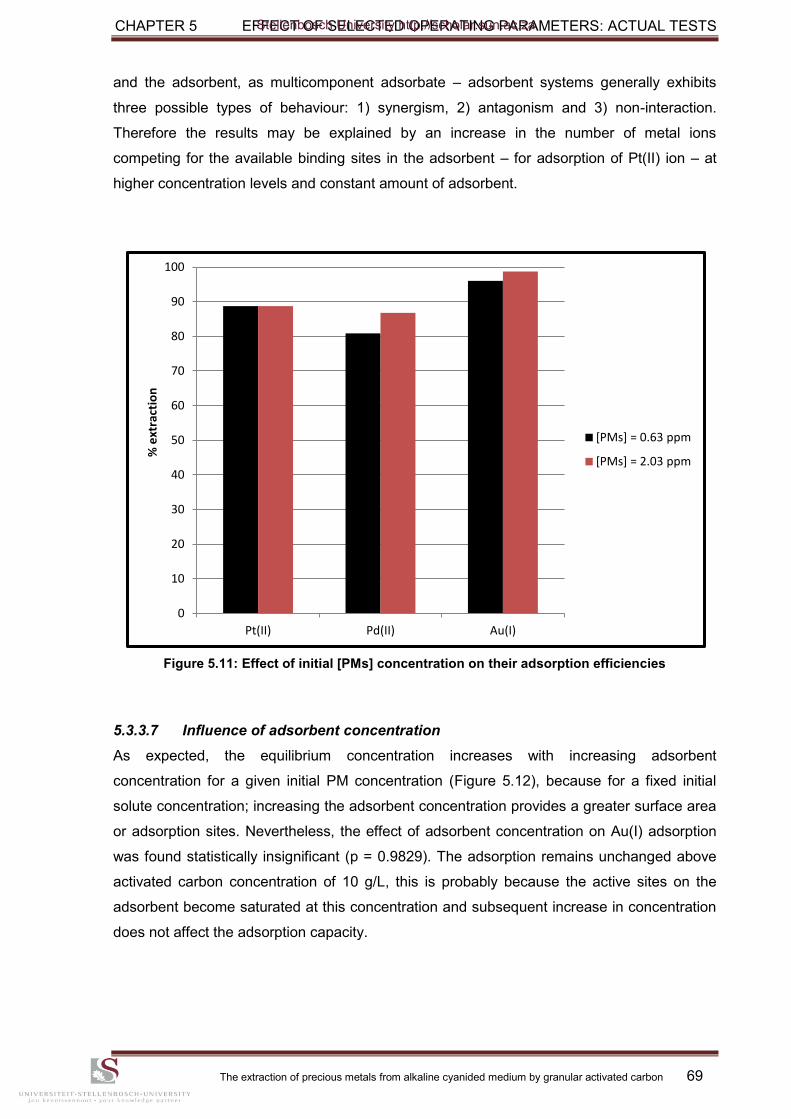
CHAPTER 5 EFFECT OF SELECTED OPERATING PARAMETERS: ACTUAL TESTS
The extraction of precious metals from alkaline cyanided medium by granular activated carbon 69
and the adsorbent, as multicomponent adsorbate – adsorbent systems generally exhibits
three possible types of behaviour: 1) synergism, 2) antagonism and 3) non-interaction.
Therefore the results may be explained by an increase in the number of metal ions
competing for the available binding sites in the adsorbent – for adsorption of Pt(II) ion – at
higher concentration levels and constant amount of adsorbent.
Figure 5.11: Effect of initial [PMs] concentration on their adsorption efficiencies
5.3.3.7 Influence of adsorbent concentration
As expected, the equilibrium concentration increases with increasing adsorbent
concentration for a given initial PM concentration (Figure 5.12), because for a fixed initial
solute concentration; increasing the adsorbent concentration provides a greater surface area
or adsorption sites. Nevertheless, the effect of adsorbent concentration on Au(I) adsorption
was found statistically insignificant (p = 0.9829). The adsorption remains unchanged above
activated carbon concentration of 10 g/L, this is probably because the active sites on the
adsorbent become saturated at this concentration and subsequent increase in concentration
does not affect the adsorption capacity.
0
10
20
30
40
50
60
70
80
90
100
Pt(II) Pd(II) Au(I)
% e
xtra
ctio
n
[PMs] = 0.63 ppm
[PMs] = 2.03 ppm
Stellenbosch University http://scholar.sun.ac.za
CHAPTER 5 EFFECT OF SELECTED OPERATING PARAMETERS: ACTUAL TESTS
The extraction of precious metals from alkaline cyanided medium by granular activated carbon 70
Amarasinghe and Williams (2007) pointed out that, in some cases, the amount of metal ions
adsorbed per unit weight of adsorbent (q) decreases with the adsorbent concentration. This
is due to the fact that at higher adsorbent concentration, the solution ion concentration drops
to a lower value and the system reaches equilibrium at lower values of (q), indicating that the
adsorption sites remain unsaturated.
Figure 5.12: Effect of activated carbon concentration on the adsorption efficiency of PMs
5.3.4 Assessment of significant interactions in PMs adsorption process
The main effect plots in Figures 5.8 to 5.12 are helpful in visualizing which factors most affect
the responses. If there were no significant interactions between the factors, a main effects
plot would adequately describe where it is possible to obtain the biggest payoff for changes
to the adsorption process. Because the interactions in this study were found to be
significant (Figures 5.13 to 5.21 and Table 5.3), the interaction plots should be
examined next.
p-values were used to determine the significance of each of the interactions among the
variables. Interactions (factors) with negative influence (coefficient) indicate that these are
interactions (factors) that reduce efficacy of the adsorption process (antagonistic effect).
Similarly, interactions (factors) with positive influence indicate that these are interactions
(factors) that increase efficacy of adsorption (synergistic effect). The ranking of the
importance of each interaction and factor in the global processes of adsorption will depend
0
10
20
30
40
50
60
70
80
90
100
Pt(II) Pd(II) Au(I)
% e
xtra
ctio
n
[AC] = 10 g/L
[AC] = 20 g/L
Stellenbosch University http://scholar.sun.ac.za
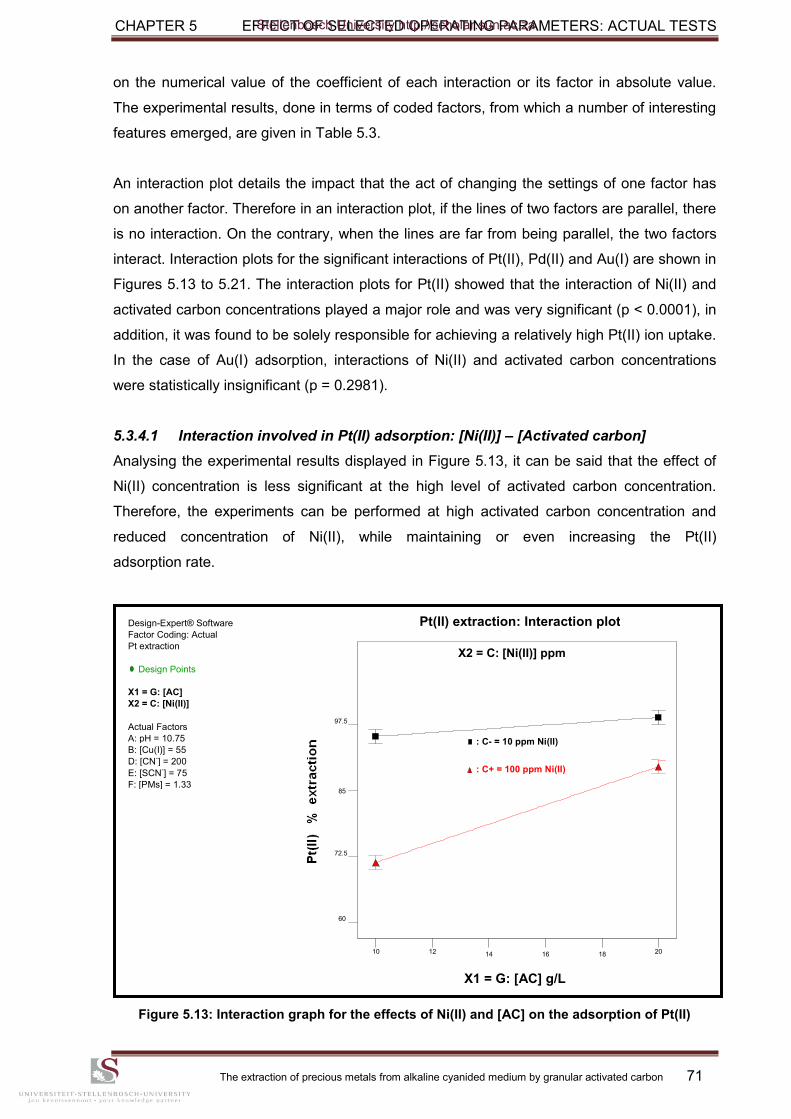
CHAPTER 5 EFFECT OF SELECTED OPERATING PARAMETERS: ACTUAL TESTS
The extraction of precious metals from alkaline cyanided medium by granular activated carbon 71
on the numerical value of the coefficient of each interaction or its factor in absolute value.
The experimental results, done in terms of coded factors, from which a number of interesting
features emerged, are given in Table 5.3.
An interaction plot details the impact that the act of changing the settings of one factor has
on another factor. Therefore in an interaction plot, if the lines of two factors are parallel, there
is no interaction. On the contrary, when the lines are far from being parallel, the two factors
interact. Interaction plots for the significant interactions of Pt(II), Pd(II) and Au(I) are shown in
Figures 5.13 to 5.21. The interaction plots for Pt(II) showed that the interaction of Ni(II) and
activated carbon concentrations played a major role and was very significant (p < 0.0001), in
addition, it was found to be solely responsible for achieving a relatively high Pt(II) ion uptake.
In the case of Au(I) adsorption, interactions of Ni(II) and activated carbon concentrations
were statistically insignificant (p = 0.2981).
5.3.4.1 Interaction involved in Pt(II) adsorption: [Ni(II)] – [Activated carbon]
Analysing the experimental results displayed in Figure 5.13, it can be said that the effect of
Ni(II) concentration is less significant at the high level of activated carbon concentration.
Therefore, the experiments can be performed at high activated carbon concentration and
reduced concentration of Ni(II), while maintaining or even increasing the Pt(II)
adsorption rate.
Figure 5.13: Interaction graph for the effects of Ni(II) and [AC] on the adsorption of Pt(II)
Design-Expert® Software Factor Coding: Actual Pt extraction
Design Points
X1 = G: [AC] X2 = C: [Ni(II)]
Actual Factors A: pH = 10.75 B: [Cu(I)] = 55 D: [CN
-] = 200
E: [SCN-] = 75
F: [PMs] = 1.33
: C- = 10 ppm Ni(II)
: C+ = 100 ppm Ni(II)
X2 = C: [Ni(II)] ppm
10 12 14 16 18 20
X1 = G: [AC] g/L
60
72.5
85
97.5
Pt(II) extraction: Interaction plot
Stellenbosch University http://scholar.sun.ac.za
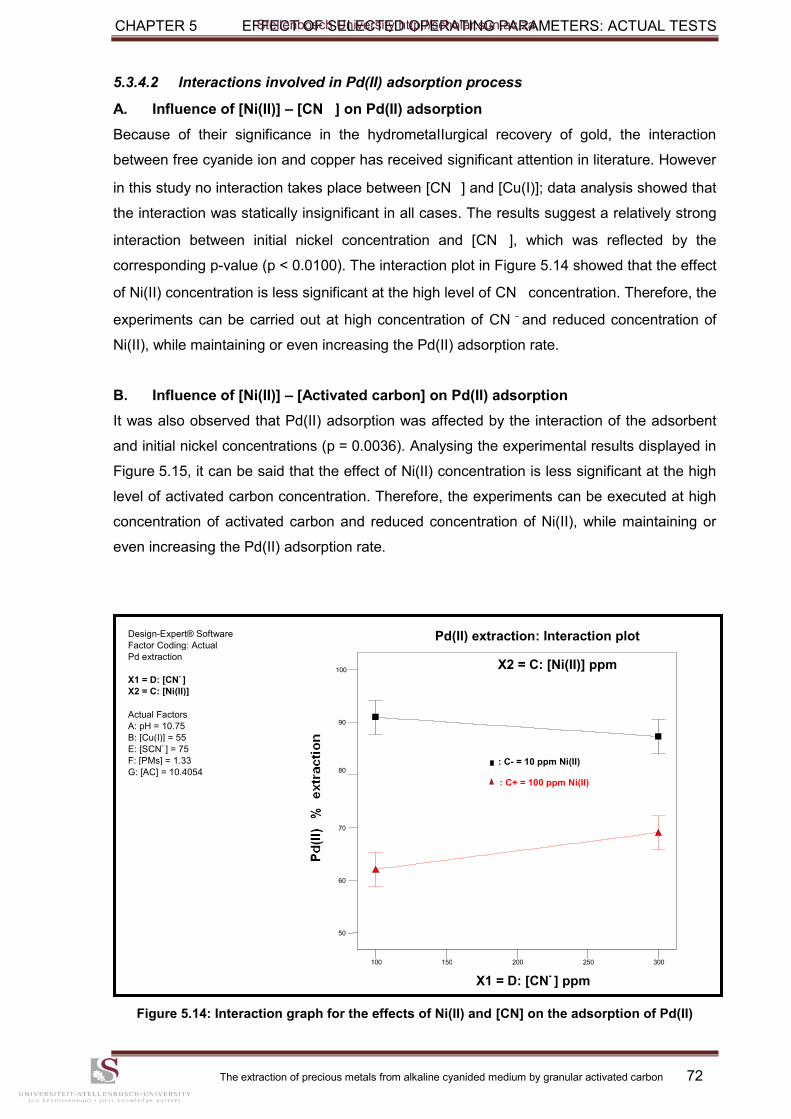
CHAPTER 5 EFFECT OF SELECTED OPERATING PARAMETERS: ACTUAL TESTS
The extraction of precious metals from alkaline cyanided medium by granular activated carbon 72
5.3.4.2 Interactions involved in Pd(II) adsorption process
A. Influence of [Ni(II)] – [CN ] on Pd(II) adsorption
Because of their significance in the hydrometaIIurgical recovery of gold, the interaction
between free cyanide ion and copper has received significant attention in literature. However
in this study no interaction takes place between [CN ] and [Cu(I)]; data analysis showed that
the interaction was statically insignificant in all cases. The results suggest a relatively strong
interaction between initial nickel concentration and [CN ], which was reflected by the
corresponding p-value (p < 0.0100). The interaction plot in Figure 5.14 showed that the effect
of Ni(II) concentration is less significant at the high level of CN concentration. Therefore, the
experiments can be carried out at high concentration of CN and reduced concentration of
Ni(II), while maintaining or even increasing the Pd(II) adsorption rate.
B. Influence of [Ni(II)] – [Activated carbon] on Pd(II) adsorption
It was also observed that Pd(II) adsorption was affected by the interaction of the adsorbent
and initial nickel concentrations (p = 0.0036). Analysing the experimental results displayed in
Figure 5.15, it can be said that the effect of Ni(II) concentration is less significant at the high
level of activated carbon concentration. Therefore, the experiments can be executed at high
concentration of activated carbon and reduced concentration of Ni(II), while maintaining or
even increasing the Pd(II) adsorption rate.
Figure 5.14: Interaction graph for the effects of Ni(II) and [CN] on the adsorption of Pd(II)
Design-Expert® Software Factor Coding: Actual Pd extraction
X1 = D: [CN- ]
X2 = C: [Ni(II)]
Actual Factors A: pH = 10.75 B: [Cu(I)] = 55 E: [SCN
- ] = 75
F: [PMs] = 1.33 G: [AC] = 10.4054
X2 = C: [Ni(II)] ppm
100 150 200 250 300
X1 = D: [CN- ] ppm
50
60
70
80
90
100
Pd(II) extraction: Interaction plot
: C+ = 100 ppm Ni(II)
: C- = 10 ppm Ni(II)
Stellenbosch University http://scholar.sun.ac.za
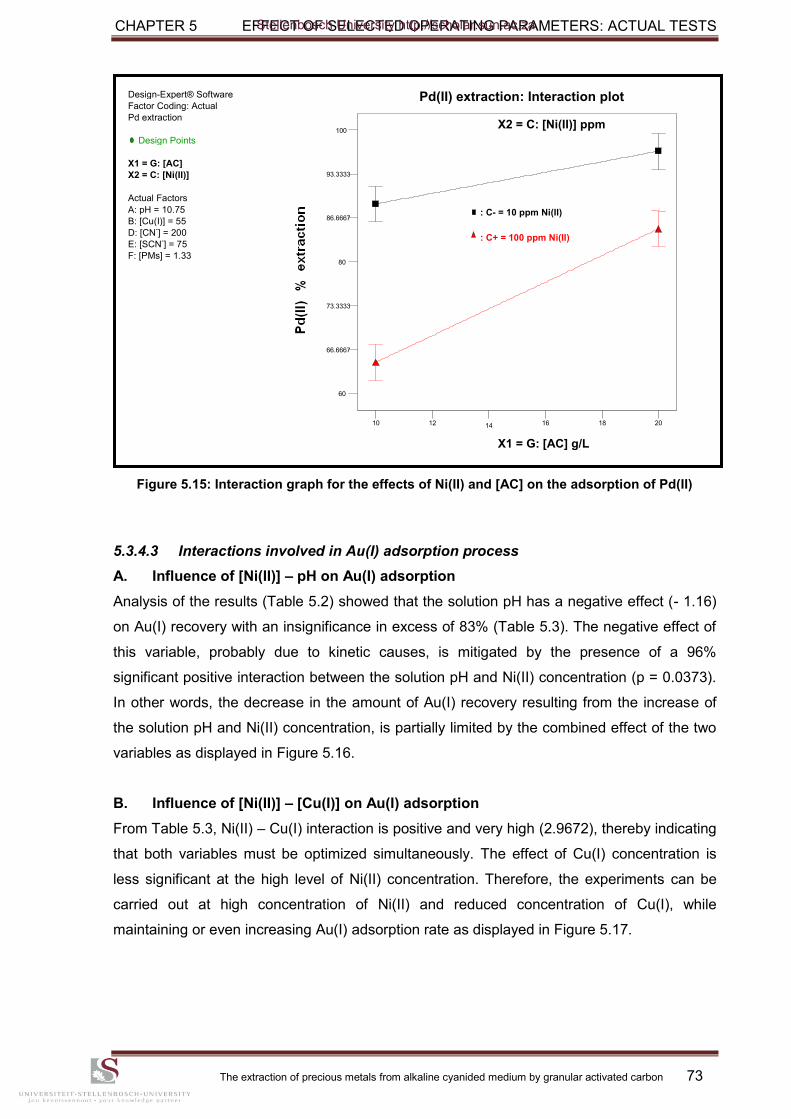
CHAPTER 5 EFFECT OF SELECTED OPERATING PARAMETERS: ACTUAL TESTS
The extraction of precious metals from alkaline cyanided medium by granular activated carbon 73
Figure 5.15: Interaction graph for the effects of Ni(II) and [AC] on the adsorption of Pd(II)
5.3.4.3 Interactions involved in Au(I) adsorption process
A. Influence of [Ni(II)] – pH on Au(I) adsorption
Analysis of the results (Table 5.2) showed that the solution pH has a negative effect (- 1.16)
on Au(I) recovery with an insignificance in excess of 83% (Table 5.3). The negative effect of
this variable, probably due to kinetic causes, is mitigated by the presence of a 96%
significant positive interaction between the solution pH and Ni(II) concentration (p = 0.0373).
In other words, the decrease in the amount of Au(I) recovery resulting from the increase of
the solution pH and Ni(II) concentration, is partially limited by the combined effect of the two
variables as displayed in Figure 5.16.
B. Influence of [Ni(II)] – [Cu(I)] on Au(I) adsorption
From Table 5.3, Ni(II) – Cu(I) interaction is positive and very high (2.9672), thereby indicating
that both variables must be optimized simultaneously. The effect of Cu(I) concentration is
less significant at the high level of Ni(II) concentration. Therefore, the experiments can be
carried out at high concentration of Ni(II) and reduced concentration of Cu(I), while
maintaining or even increasing Au(I) adsorption rate as displayed in Figure 5.17.
Design-Expert® Software Factor Coding: Actual Pd extraction
Design Points
X1 = G: [AC] X2 = C: [Ni(II)]
Actual Factors A: pH = 10.75 B: [Cu(I)] = 55 D: [CN
-] = 200
E: [SCN-] = 75
F: [PMs] = 1.33
X2 = C: [Ni(II)] ppm
10 12 14 16 18 20
X1 = G: [AC] g/L
60
66.6667
73.3333
80
86.6667
93.3333
100
Pd(II) extraction: Interaction plot
: C+ = 100 ppm Ni(II)
: C- = 10 ppm Ni(II)
Stellenbosch University http://scholar.sun.ac.za
CHAPTER 5 EFFECT OF SELECTED OPERATING PARAMETERS: ACTUAL TESTS
The extraction of precious metals from alkaline cyanided medium by granular activated carbon 74
C. Influence of [Ni(II)] – [PMs] on Au(I) adsorption
The interaction effect between Ni(II) and PM concentrations was also significant (p = 0.0250).
Interpreting the interaction shown in Figure 5.18, it can be said that the effect of PM
concentration is less significant at the high level of Ni(II) concentration. Therefore, the
experiments can be achieved at high concentration of Ni(II) and reduced concentration of
PMs, although this would not be an appropriate operating strategy; while maintaining or even
increasing the Au(I) adsorption rate. This is only relevant in terms of this particular interaction
and its effect on Au(I) adsorption.
D. Influence of [SCN ] – [CN ] on Au(I) adsorption
The individual contributions of [SCN ] (0.76) and [CN ] (- 1.06) were positive and negative,
respectively (see Table 5.2). However, interaction [SCN ] – [CN ] showed a positive effect
on the experimental response (p = 0.0490). It can be said that the effect of
concentration is less significant at the high level of SCN concentration. Therefore, the
experiments can be achieved at high SCN concentration and reduce the concentration of
CN , while maintaining or even increasing Au(I) adsorption rate as shown in Figure 5.19.
E. Three factor interactions: pH – [CN ] – [AC] and [Ni(II)] – [CN ] – [AC]
In addition to the main and two factor interaction of the selected variables, interactions
between three variables were found in the Au(I) adsorption response. As shown in Figures
5.20 and 5.21, all treatment combinations are displayed geometrically as cubes. This type of
plot is helpful for visualizing interactions between three factors. Each dimension of the cube
plot represents one factor. The corners of the cube are the low and high levels selected for
that factor.
Figure 5.20 represents the cube plot which depicts the three-factor interaction among
solution pH (A), free cyanide ion (D) and activated carbon concentration (G). According to
the plot, three combinations can be made in order to maximize the outcome: 1) Low pH –
High [CN ] and low [AC], 2) Low pH – low [CN ] and high [AC], 3) High pH – low [CN ]
and low [AC].
Figure 5.21 displays the cube plot which depicts the three-factor interaction among Ni(II) (C),
free cyanide ion (D) and activated carbon concentration (G). According to the plot, two
combinations can be performed for maximizing Au(I) adsorption: 1) Low CN – low [Ni(II)]
and high [AC], 2) High CN – high [Ni(II)] and high [AC].
CN
Stellenbosch University http://scholar.sun.ac.za
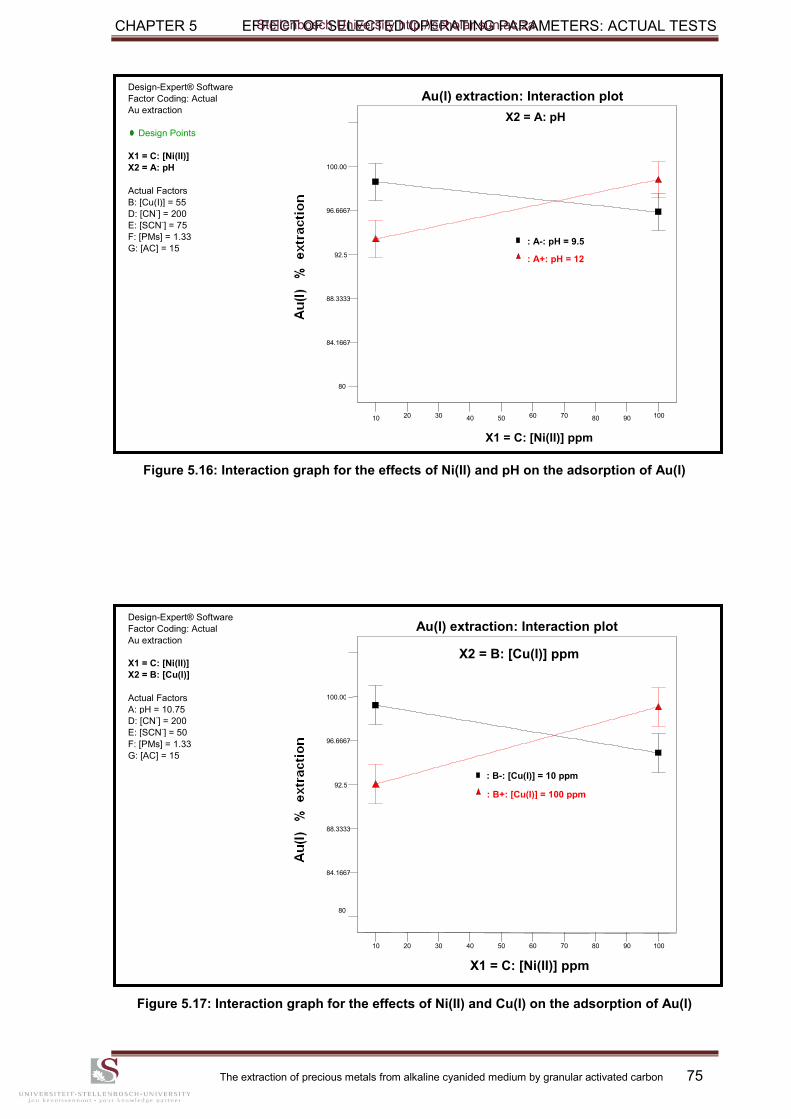
CHAPTER 5 EFFECT OF SELECTED OPERATING PARAMETERS: ACTUAL TESTS
The extraction of precious metals from alkaline cyanided medium by granular activated carbon 75
Figure 5.16: Interaction graph for the effects of Ni(II) and pH on the adsorption of Au(I)
Figure 5.17: Interaction graph for the effects of Ni(II) and Cu(I) on the adsorption of Au(I)
Design-Expert® Software Factor Coding: Actual Au extraction
X1 = C: [Ni(II)] X2 = B: [Cu(I)]
Actual Factors A: pH = 10.75 D: [CN
-] = 200
E: [SCN-] = 50
F: [PMs] = 1.33 G: [AC] = 15
X2 = B: [Cu(I)] ppm
10 20 30 40 50 60 70 80 90 100
80
84.1667
88.3333
92.5
96.6667
100.00
X1 = C: [Ni(II)] ppm
Au(I) extraction: Interaction plot
: B-: [Cu(I)] = 10 ppm
: B+: [Cu(I)] = 100 ppm
Design-Expert® Software Factor Coding: Actual Au extraction
Design Points
X1 = C: [Ni(II)] X2 = A: pH
Actual Factors B: [Cu(I)] = 55 D: [CN
-] = 200
E: [SCN-] = 75
F: [PMs] = 1.33 G: [AC] = 15
: A-: pH = 9.5
: A+: pH = 12
X2 = A: pH
10 20 30 40 50 60 70 80 90 100
X1 = C: [Ni(II)] ppm
80
84.1667
88.3333
92.5
96.6667
100.00
Au(I) extraction: Interaction plot
Stellenbosch University http://scholar.sun.ac.za
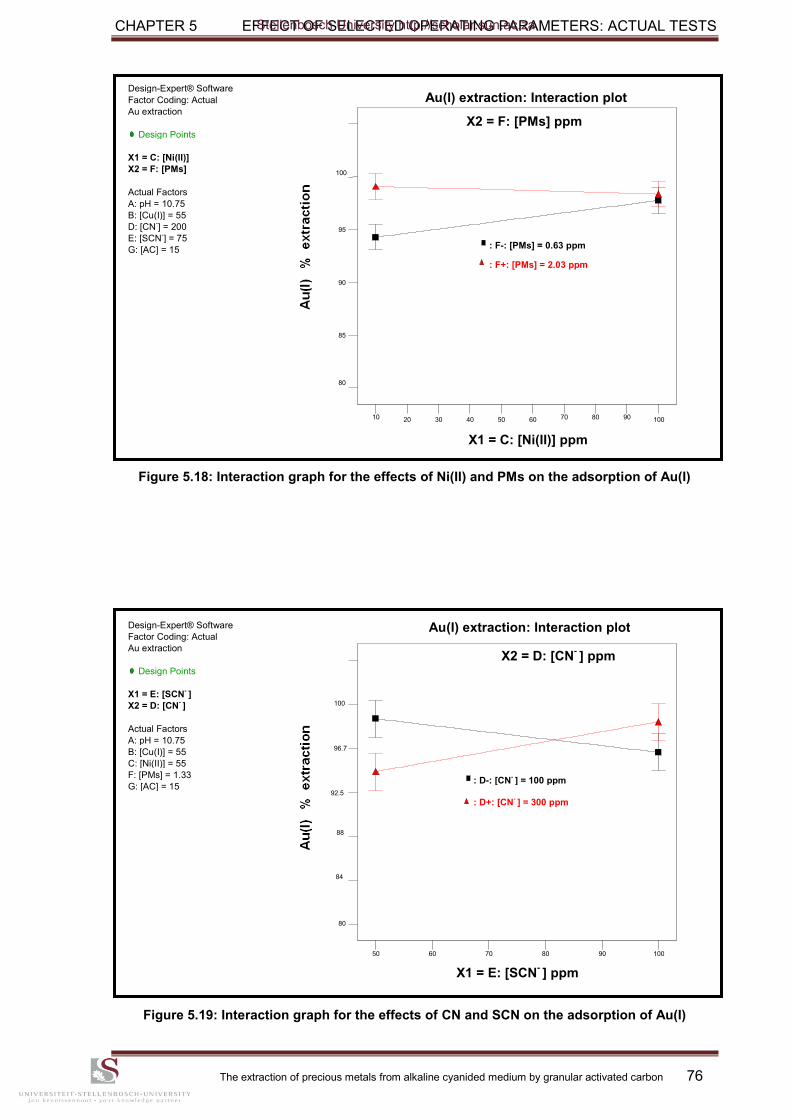
CHAPTER 5 EFFECT OF SELECTED OPERATING PARAMETERS: ACTUAL TESTS
The extraction of precious metals from alkaline cyanided medium by granular activated carbon 76
Figure 5.18: Interaction graph for the effects of Ni(II) and PMs on the adsorption of Au(I)
Figure 5.19: Interaction graph for the effects of CN and SCN on the adsorption of Au(I)
Design-Expert® Software Factor Coding: Actual Au extraction
Design Points
X1 = E: [SCN- ]
X2 = D: [CN- ]
Actual Factors A: pH = 10.75 B: [Cu(I)] = 55 C: [Ni(II)] = 55 F: [PMs] = 1.33 G: [AC] = 15
X2 = D: [CN- ] ppm
50 60 70 80 90 100
X1 = E: [SCN- ] ppm
80
84
88
92.5
96.7
100
Au(I) extraction: Interaction plot
: D-: [CN- ] = 100 ppm
: D+: [CN- ] = 300 ppm
Design-Expert® Software Factor Coding: Actual Au extraction
Design Points
X1 = C: [Ni(II)] X2 = F: [PMs]
Actual Factors A: pH = 10.75 B: [Cu(I)] = 55 D: [CN
-] = 200
E: [SCN-] = 75
G: [AC] = 15
X2 = F: [PMs] ppm
10 20 30 40 50 60 70 80 90 100
X1 = C: [Ni(II)] ppm
80
85
90
95
100
Au(I) extraction: Interaction plot
: F-: [PMs] = 0.63 ppm
: F+: [PMs] = 2.03 ppm
Stellenbosch University http://scholar.sun.ac.za
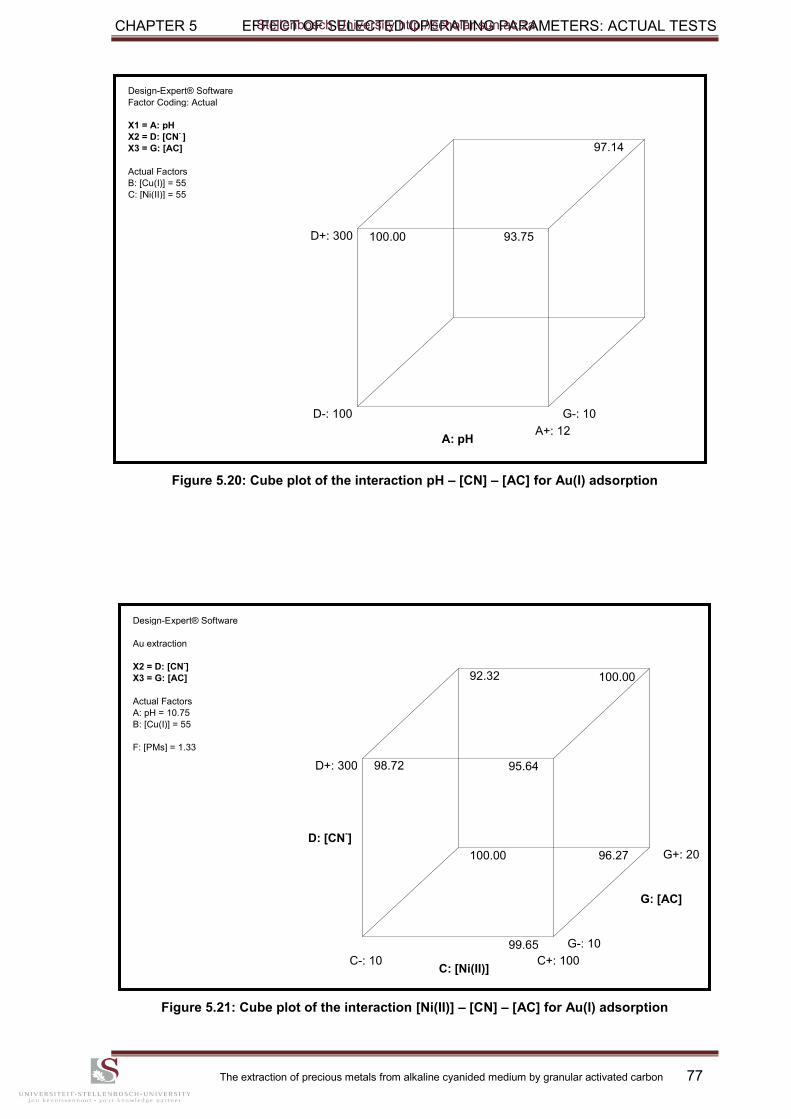
CHAPTER 5 EFFECT OF SELECTED OPERATING PARAMETERS: ACTUAL TESTS
The extraction of precious metals from alkaline cyanided medium by granular activated carbon 77
Figure 5.20: Cube plot of the interaction pH – [CN] – [AC] for Au(I) adsorption
Figure 5.21: Cube plot of the interaction [Ni(II)] – [CN] – [AC] for Au(I) adsorption
Design-Expert® Software
Au extraction
X2 = D: [CN-]
X3 = G: [AC]
Actual Factors A: pH = 10.75 B: [Cu(I)] = 55
F: [PMs] = 1.33
C: [Ni(II)]
D: [CN-]
G: [AC]
C-: 10 C+: 100
D+: 300
G-: 10
G+: 20 100.00
98.72
92.32
99.65
96.27
95.64
100.00
Design-Expert® Software Factor Coding: Actual
X1 = A: pH X2 = D: [CN
- ]
X3 = G: [AC]
Actual Factors B: [Cu(I)] = 55 C: [Ni(II)] = 55
A: pH A+: 12
D-: 100
D+: 300
G-: 10
100.00 93.75
97.14
Stellenbosch University http://scholar.sun.ac.za
CHAPTER 5 EFFECT OF SELECTED OPERATING PARAMETERS: ACTUAL TESTS
The extraction of precious metals from alkaline cyanided medium by granular activated carbon 78
As is seen from the plots, there are interactions between factors within the experimental
domain. However, it is difficult to optimize these responses under the same conditions,
because the interest regions of factors are different; several variables need to be controlled,
i.e., reagent concentrations, solution pH, etc. Accordingly, there is a need for a practical
optimization of the adsorption process.
5.3.5 Simultaneous optimization strategy
One of the main aims of this study was to determine values of the design parameters at
which the response reaches its optimum. The latter could be either a maximum or a
minimum of a function of the design parameters (e.g. high PM and less BM adsorption). The
conventional „„one-variable-at-a-time‟‟ approach to optimization will require a great many
adsorption experiments, and even this approach may fail to predict such optimum conditions
precisely due to lack of interactions among factors (Czitrom, 1999). One of the
methodologies for obtaining the optimum results, through a relatively smaller number of
systematic experiments that can reduce time, cost and resources (achieving a high quality
product), is response surface methodology (RSM). The main objective of RSM is to
determine the optimum operational conditions of a process or to determine a region that
satisfies the operating specifications. However, it is noteworthy that the response surface
methodology does not elucidate the mechanism of the processes studied, but only ascertains
the effects of factors upon response and the interactions between factors. The numerical
optimization of the software has been chosen in order to find the specific point that either
maximizes or minimizes the desirability function.
5.3.5.1 Desirability function approach
The desirability function is a popular and established technique for the simultaneous
determination of optimum settings of input variables that can determine optimum
performance levels for one or more responses (Azharul et al., 2009). Desirability is an
objective function that ranges from zero outside of the limits, to one at the goal. Desirability
function approaches are based on the idea that, when one of the quality characteristics of an
industrial process or product with many characteristics is not in the desired limits, then the
entire quality of the industrial process or the product is not desirable (Pasandideh and Niaki,
2006). The desired goal was selected by adjusting the weight or importance that might alter
the characteristics of a goal. The goal fields for response have five options: maximum,
minimum, target, within range and none. For simultaneous optimization, each response must
have a low and high value assigned to each goal (Table 5.5). The meanings of the goal
parameters are as follows:
Stellenbosch University http://scholar.sun.ac.za
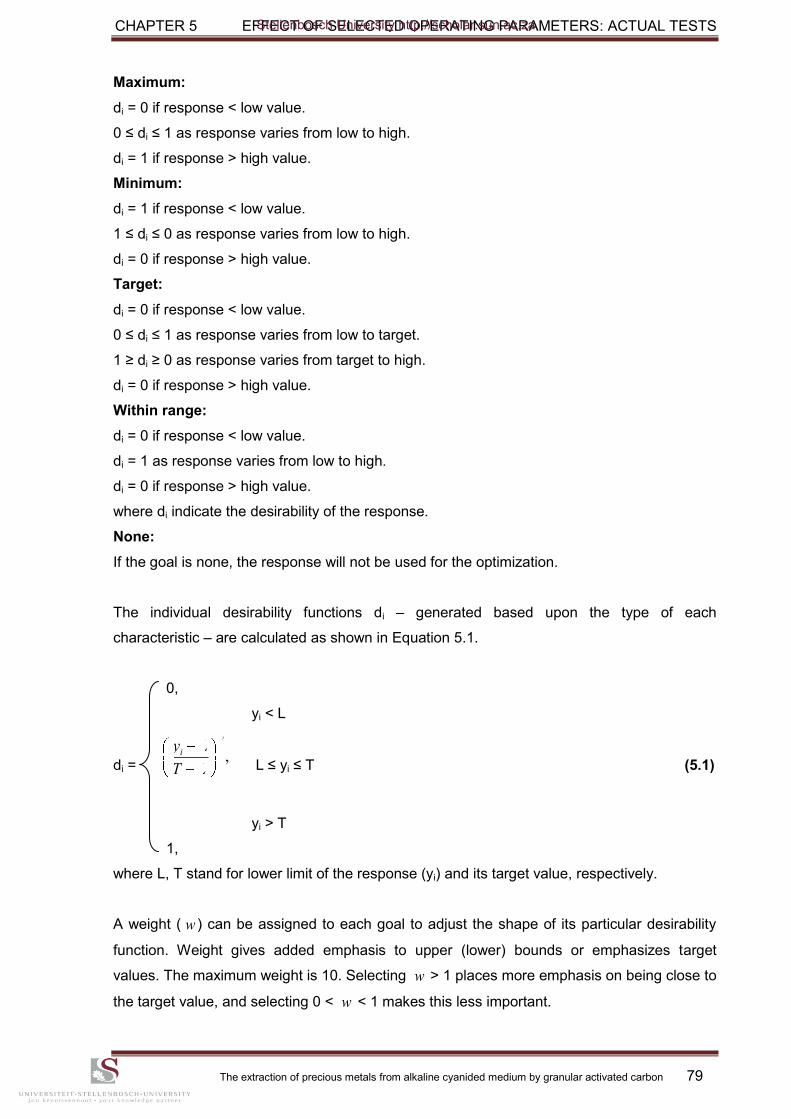
CHAPTER 5 EFFECT OF SELECTED OPERATING PARAMETERS: ACTUAL TESTS
The extraction of precious metals from alkaline cyanided medium by granular activated carbon 79
Maximum:
di = 0 if response < low value.
0 ≤ di ≤ 1 as response varies from low to high.
di = 1 if response > high value.
Minimum:
di = 1 if response < low value.
1 ≤ di ≤ 0 as response varies from low to high.
di = 0 if response > high value.
Target:
di = 0 if response < low value.
0 ≤ di ≤ 1 as response varies from low to target.
1 ≥ di ≥ 0 as response varies from target to high.
di = 0 if response > high value.
Within range:
di = 0 if response < low value.
di = 1 as response varies from low to high.
di = 0 if response > high value.
where di indicate the desirability of the response.
None:
If the goal is none, the response will not be used for the optimization.
The individual desirability functions di – generated based upon the type of each
characteristic – are calculated as shown in Equation 5.1.
0,
yi < L
di = L ≤ yi ≤ T (5.1)
yi > T
1,
where L, T stand for lower limit of the response (yi) and its target value, respectively.
A weight ( ) can be assigned to each goal to adjust the shape of its particular desirability
function. Weight gives added emphasis to upper (lower) bounds or emphasizes target
values. The maximum weight is 10. Selecting > 1 places more emphasis on being close to
the target value, and selecting 0 < < 1 makes this less important.
,
w
i
LT
Ly
w
w
w
Stellenbosch University http://scholar.sun.ac.za
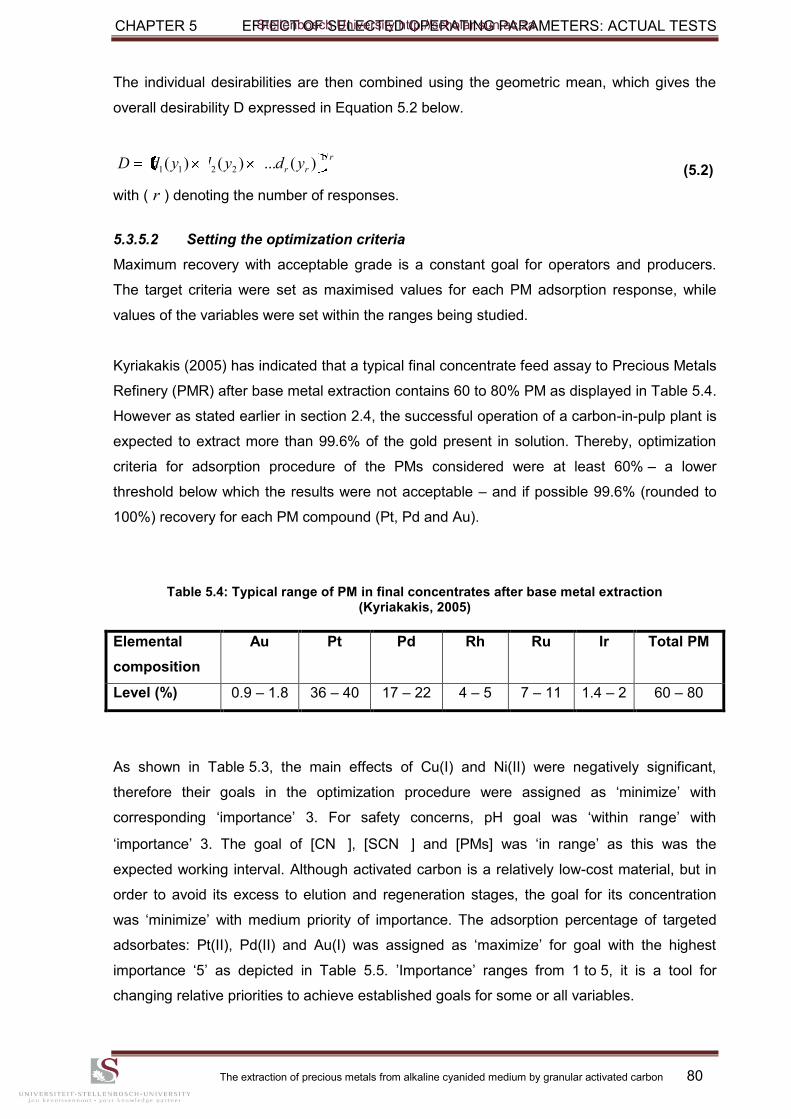
CHAPTER 5 EFFECT OF SELECTED OPERATING PARAMETERS: ACTUAL TESTS
The extraction of precious metals from alkaline cyanided medium by granular activated carbon 80
The individual desirabilities are then combined using the geometric mean, which gives the
overall desirability D expressed in Equation 5.2 below.
(5.2)
with ( ) denoting the number of responses.
5.3.5.2 Setting the optimization criteria
Maximum recovery with acceptable grade is a constant goal for operators and producers.
The target criteria were set as maximised values for each PM adsorption response, while
values of the variables were set within the ranges being studied.
Kyriakakis (2005) has indicated that a typical final concentrate feed assay to Precious Metals
Refinery (PMR) after base metal extraction contains 60 to 80% PM as displayed in Table 5.4.
However as stated earlier in section 2.4, the successful operation of a carbon-in-pulp plant is
expected to extract more than 99.6% of the gold present in solution. Thereby, optimization
criteria for adsorption procedure of the PMs considered were at least 60% – a lower
threshold below which the results were not acceptable – and if possible 99.6% (rounded to
100%) recovery for each PM compound (Pt, Pd and Au).
Table 5.4: Typical range of PM in final concentrates after base metal extraction (Kyriakakis, 2005)
Elemental
composition
Au Pt Pd Rh Ru Ir Total PM
Level (%) 0.9 – 1.8 36 – 40 17 – 22 4 – 5 7 – 11 1.4 – 2 60 – 80
As shown in Table 5.3, the main effects of Cu(I) and Ni(II) were negatively significant,
therefore their goals in the optimization procedure were assigned as „minimize‟ with
corresponding „importance‟ 3. For safety concerns, pH goal was „within range‟ with
„importance‟ 3. The goal of [CN ], [SCN ] and [PMs] was „in range‟ as this was the
expected working interval. Although activated carbon is a relatively low-cost material, but in
order to avoid its excess to elution and regeneration stages, the goal for its concentration
was „minimize‟ with medium priority of importance. The adsorption percentage of targeted
adsorbates: Pt(II), Pd(II) and Au(I) was assigned as „maximize‟ for goal with the highest
importance „5‟ as depicted in Table 5.5. ‟Importance‟ ranges from 1 to 5, it is a tool for
changing relative priorities to achieve established goals for some or all variables.
r
rr ydydydD/1
2211 )(.....)()(
r
Stellenbosch University http://scholar.sun.ac.za
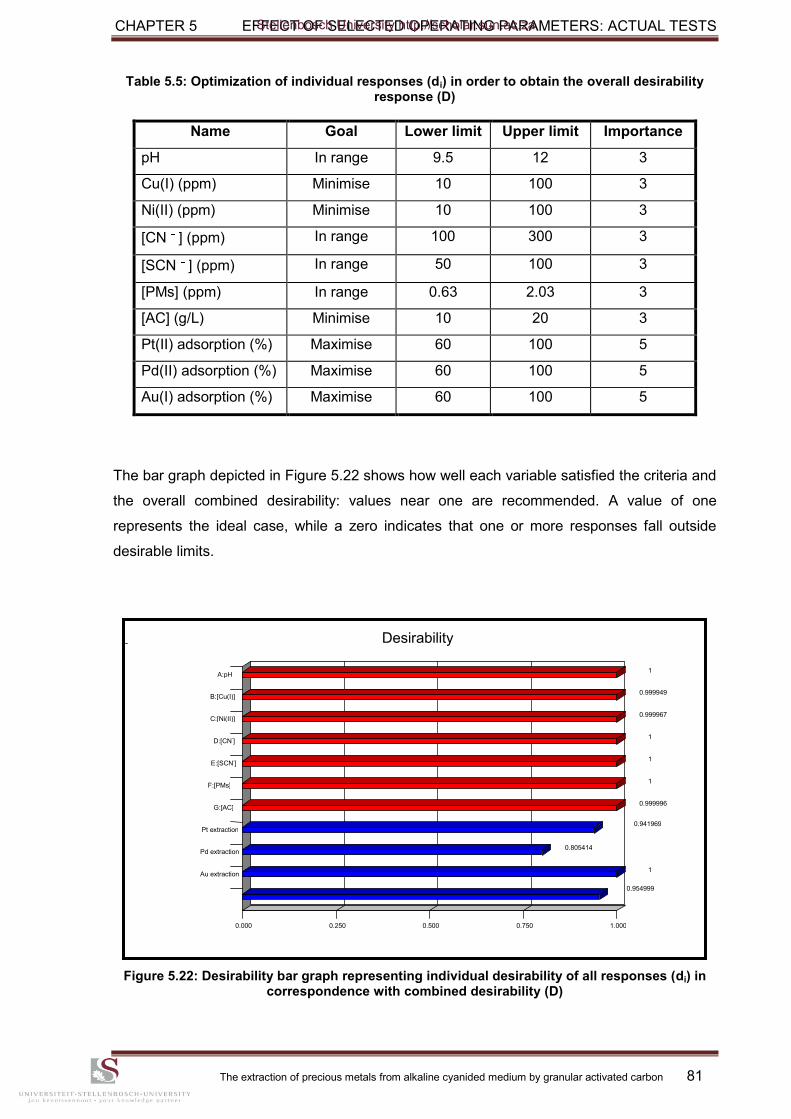
CHAPTER 5 EFFECT OF SELECTED OPERATING PARAMETERS: ACTUAL TESTS
The extraction of precious metals from alkaline cyanided medium by granular activated carbon 81
Table 5.5: Optimization of individual responses (di) in order to obtain the overall desirability response (D)
Name Goal Lower limit Upper limit Importance
pH In range 9.5 12 3
Cu(I) (ppm) Minimise 10 100 3
Ni(II) (ppm) Minimise 10 100 3
[CN ] (ppm) In range 100 300 3
[SCN ] (ppm) In range 50 100 3
[PMs] (ppm) In range 0.63 2.03 3
[AC] (g/L) Minimise 10 20 3
Pt(II) adsorption (%) Maximise 60 100 5
Pd(II) adsorption (%) Maximise 60 100 5
Au(I) adsorption (%) Maximise 60 100 5
The bar graph depicted in Figure 5.22 shows how well each variable satisfied the criteria and
the overall combined desirability: values near one are recommended. A value of one
represents the ideal case, while a zero indicates that one or more responses fall outside
desirable limits.
Figure 5.22: Desirability bar graph representing individual desirability of all responses (di) in correspondence with combined desirability (D)
1
0.999949
0.999967
1
1
1
0.999996
0.941969
0.805414
1
0.954999
Desirability
0.000 0.250 0.500 0.750 1.000
A:pH
B:[Cu(I)]
C:[Ni(II)]
D:[CN-]
E:[SCN-]
F:[PMs]
G:[AC]
Pt extraction
Pd extraction
Au extraction
Stellenbosch University http://scholar.sun.ac.za
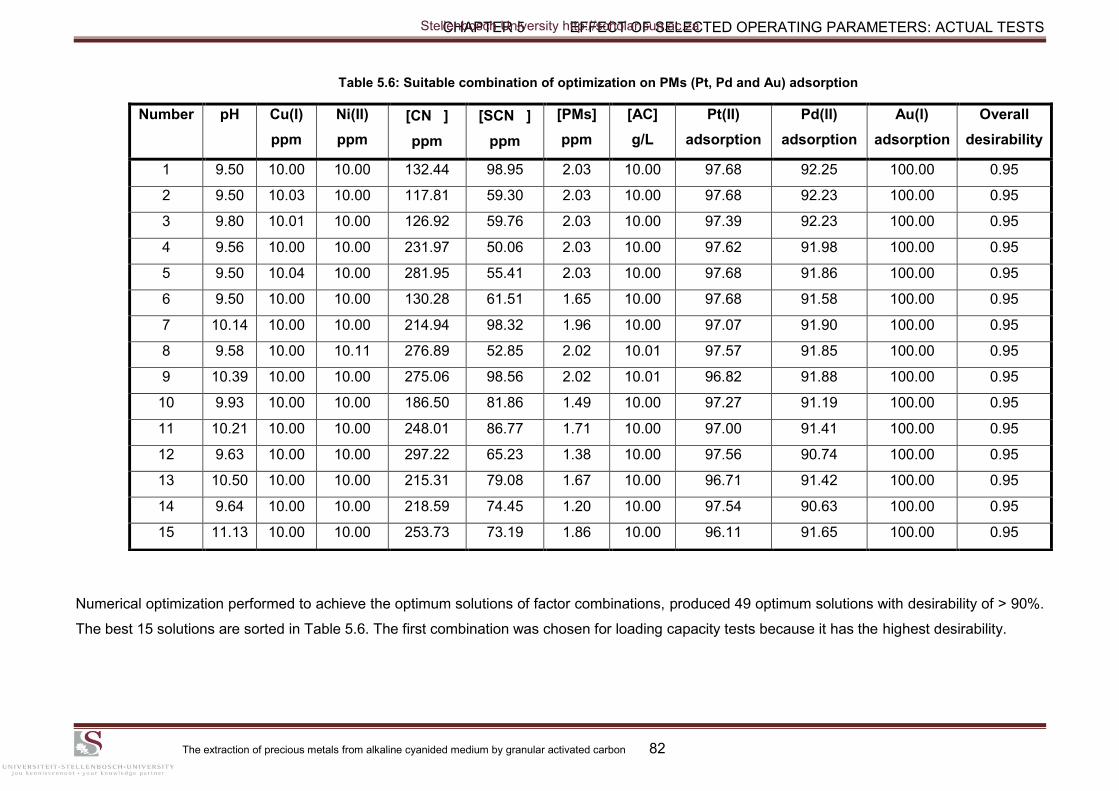
CHAPTER 5 EFFECT OF SELECTED OPERATING PARAMETERS: ACTUAL TESTS
The extraction of precious metals from alkaline cyanided medium by granular activated carbon 82
Table 5.6: Suitable combination of optimization on PMs (Pt, Pd and Au) adsorption
Numerical optimization performed to achieve the optimum solutions of factor combinations, produced 49 optimum solutions with desirability of > 90%.
The best 15 solutions are sorted in Table 5.6. The first combination was chosen for loading capacity tests because it has the highest desirability.
Number pH Cu(I)
ppm
Ni(II)
ppm
[CN ]
ppm
[SCN ]
ppm
[PMs]
ppm
[AC]
g/L
Pt(II)
adsorption
Pd(II)
adsorption
Au(I)
adsorption
Overall
desirability
1 9.50 10.00 10.00 132.44 98.95 2.03 10.00 97.68 92.25 100.00 0.95
2 9.50 10.03 10.00 117.81 59.30 2.03 10.00 97.68 92.23 100.00 0.95
3 9.80 10.01 10.00 126.92 59.76 2.03 10.00 97.39 92.23 100.00 0.95
4 9.56 10.00 10.00 231.97 50.06 2.03 10.00 97.62 91.98 100.00 0.95
5 9.50 10.04 10.00 281.95 55.41 2.03 10.00 97.68 91.86 100.00 0.95
6 9.50 10.00 10.00 130.28 61.51 1.65 10.00 97.68 91.58 100.00 0.95
7 10.14 10.00 10.00 214.94 98.32 1.96 10.00 97.07 91.90 100.00 0.95
8 9.58 10.00 10.11 276.89 52.85 2.02 10.01 97.57 91.85 100.00 0.95
9 10.39 10.00 10.00 275.06 98.56 2.02 10.01 96.82 91.88 100.00 0.95
10 9.93 10.00 10.00 186.50 81.86 1.49 10.00 97.27 91.19 100.00 0.95
11 10.21 10.00 10.00 248.01 86.77 1.71 10.00 97.00 91.41 100.00 0.95
12 9.63 10.00 10.00 297.22 65.23 1.38 10.00 97.56 90.74 100.00 0.95
13 10.50 10.00 10.00 215.31 79.08 1.67 10.00 96.71 91.42 100.00 0.95
14 9.64 10.00 10.00 218.59 74.45 1.20 10.00 97.54 90.63 100.00 0.95
15 11.13 10.00 10.00 253.73 73.19 1.86 10.00 96.11 91.65 100.00 0.95
Stellenbosch University http://scholar.sun.ac.za
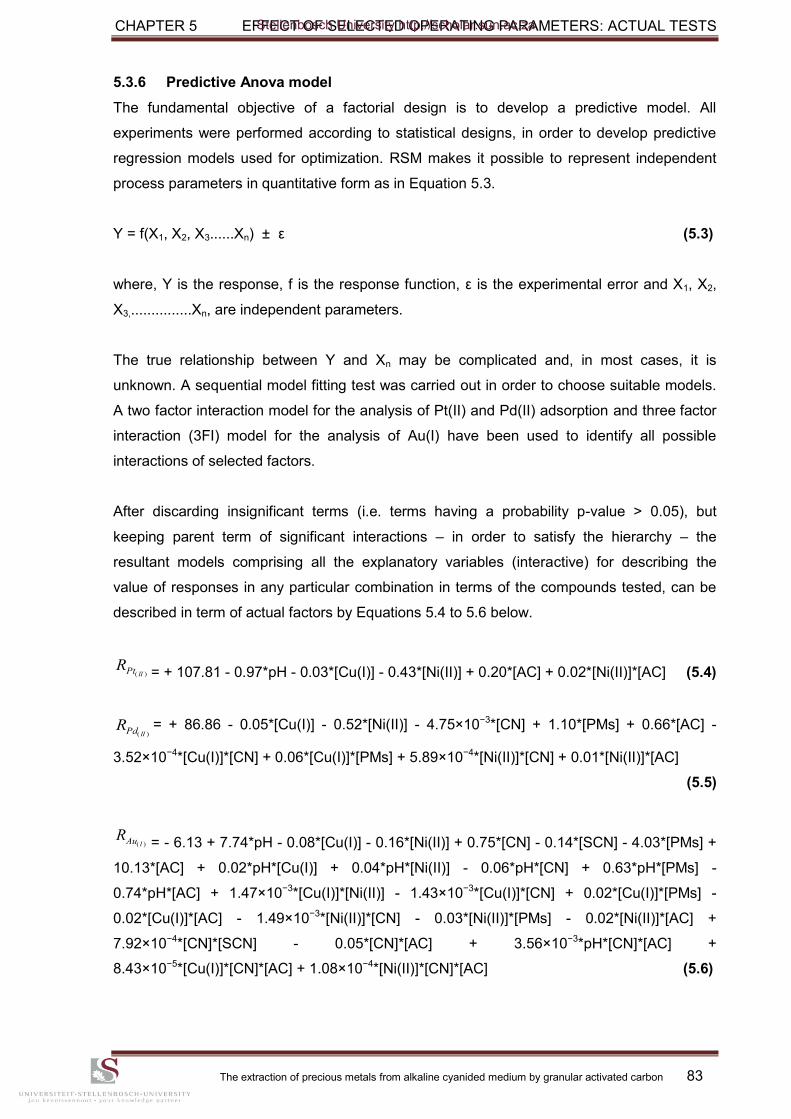
CHAPTER 5 EFFECT OF SELECTED OPERATING PARAMETERS: ACTUAL TESTS
The extraction of precious metals from alkaline cyanided medium by granular activated carbon 83
5.3.6 Predictive Anova model
The fundamental objective of a factorial design is to develop a predictive model. All
experiments were performed according to statistical designs, in order to develop predictive
regression models used for optimization. RSM makes it possible to represent independent
process parameters in quantitative form as in Equation 5.3.
Y = f(X1, X2, X3......Xn) ± ε (5.3)
where, Y is the response, f is the response function, ε is the experimental error and X1, X2,
X3,...............Xn, are independent parameters.
The true relationship between Y and Xn may be complicated and, in most cases, it is
unknown. A sequential model fitting test was carried out in order to choose suitable models.
A two factor interaction model for the analysis of Pt(II) and Pd(II) adsorption and three factor
interaction (3FI) model for the analysis of Au(I) have been used to identify all possible
interactions of selected factors.
After discarding insignificant terms (i.e. terms having a probability p-value > 0.05), but
keeping parent term of significant interactions – in order to satisfy the hierarchy – the
resultant models comprising all the explanatory variables (interactive) for describing the
value of responses in any particular combination in terms of the compounds tested, can be
described in term of actual factors by Equations 5.4 to 5.6 below.
= + 107.81 - 0.97*pH - 0.03*[Cu(I)] - 0.43*[Ni(II)] + 0.20*[AC] + 0.02*[Ni(II)]*[AC] (5.4)
= + 86.86 - 0.05*[Cu(I)] - 0.52*[Ni(II)] - 4.75×10⁻³*[CN] + 1.10*[PMs] + 0.66*[AC] -
3.52×10⁻⁴*[Cu(I)]*[CN] + 0.06*[Cu(I)]*[PMs] + 5.89×10⁻⁴*[Ni(II)]*[CN] + 0.01*[Ni(II)]*[AC]
(5.5)
= - 6.13 + 7.74*pH - 0.08*[Cu(I)] - 0.16*[Ni(II)] + 0.75*[CN] - 0.14*[SCN] - 4.03*[PMs] +
10.13*[AC] + 0.02*pH*[Cu(I)] + 0.04*pH*[Ni(II)] - 0.06*pH*[CN] + 0.63*pH*[PMs] -
0.74*pH*[AC] + 1.47×10⁻³*[Cu(I)]*[Ni(II)] - 1.43×10⁻³*[Cu(I)]*[CN] + 0.02*[Cu(I)]*[PMs] -
0.02*[Cu(I)]*[AC] - 1.49×10⁻³*[Ni(II)]*[CN] - 0.03*[Ni(II)]*[PMs] - 0.02*[Ni(II)]*[AC] +
7.92×10⁻⁴*[CN]*[SCN] - 0.05*[CN]*[AC] + 3.56×10⁻³*pH*[CN]*[AC] +
8.43×10⁻⁵*[Cu(I)]*[CN]*[AC] + 1.08×10⁻⁴*[Ni(II)]*[CN]*[AC] (5.6)
)( IIPtR
)( IIPdR
)( IAuR
Stellenbosch University http://scholar.sun.ac.za
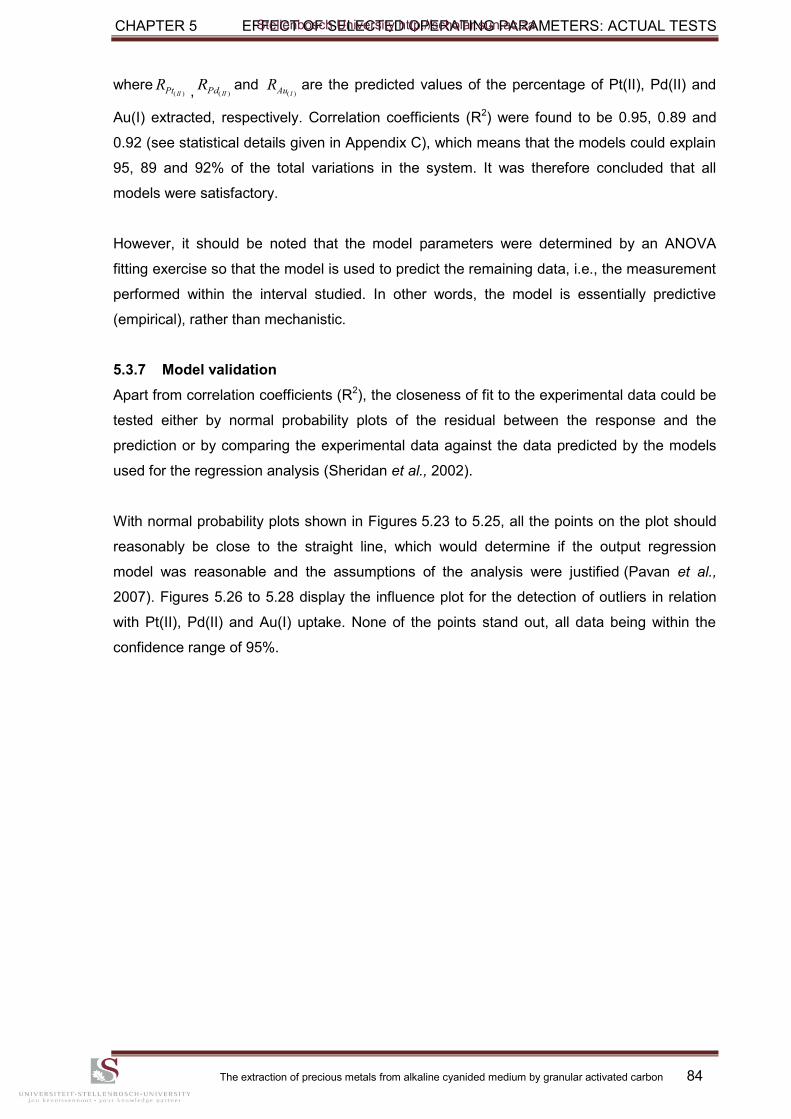
CHAPTER 5 EFFECT OF SELECTED OPERATING PARAMETERS: ACTUAL TESTS
The extraction of precious metals from alkaline cyanided medium by granular activated carbon 84
where , and are the predicted values of the percentage of Pt(II), Pd(II) and
Au(I) extracted, respectively. Correlation coefficients (R2) were found to be 0.95, 0.89 and
0.92 (see statistical details given in Appendix C), which means that the models could explain
95, 89 and 92% of the total variations in the system. It was therefore concluded that all
models were satisfactory.
However, it should be noted that the model parameters were determined by an ANOVA
fitting exercise so that the model is used to predict the remaining data, i.e., the measurement
performed within the interval studied. In other words, the model is essentially predictive
(empirical), rather than mechanistic.
5.3.7 Model validation
Apart from correlation coefficients (R2), the closeness of fit to the experimental data could be
tested either by normal probability plots of the residual between the response and the
prediction or by comparing the experimental data against the data predicted by the models
used for the regression analysis (Sheridan et al., 2002).
With normal probability plots shown in Figures 5.23 to 5.25, all the points on the plot should
reasonably be close to the straight line, which would determine if the output regression
model was reasonable and the assumptions of the analysis were justified (Pavan et al.,
2007). Figures 5.26 to 5.28 display the influence plot for the detection of outliers in relation
with Pt(II), Pd(II) and Au(I) uptake. None of the points stand out, all data being within the
confidence range of 95%.
)( IIPtR )( IIPdR )( IAuR
Stellenbosch University http://scholar.sun.ac.za
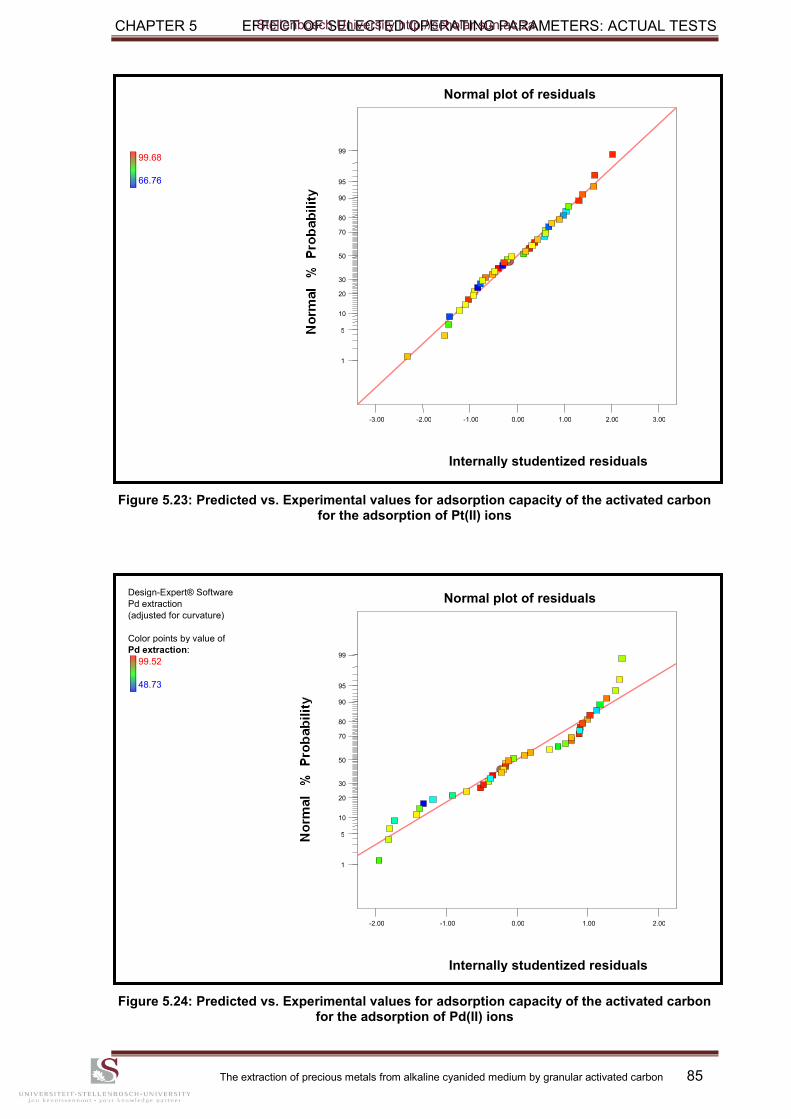
CHAPTER 5 EFFECT OF SELECTED OPERATING PARAMETERS: ACTUAL TESTS
The extraction of precious metals from alkaline cyanided medium by granular activated carbon 85
Figure 5.23: Predicted vs. Experimental values for adsorption capacity of the activated carbon for the adsorption of Pt(II) ions
Figure 5.24: Predicted vs. Experimental values for adsorption capacity of the activated carbon for the adsorption of Pd(II) ions
Design-Expert® Software Pd extraction (adjusted for curvature)
Color points by value of Pd extraction:
99.52
48.73
Internally studentized residuals
Normal plot of residuals
-2.00 -1.00 0.00 1.00 2.00
1
5
10
20 30
50
70 80
90
95
99
99.68
66.76
Internally studentized residuals
Normal plot of residuals
-3.00 -2.00 -1.00 0.00 1.00 2.00 3.00
1
5
10
20 30
50
70 80
90
95
99
Stellenbosch University http://scholar.sun.ac.za
CHAPTER 5 EFFECT OF SELECTED OPERATING PARAMETERS: ACTUAL TESTS
The extraction of precious metals from alkaline cyanided medium by granular activated carbon 86
Figure 5.25: Predicted vs. Experimental values for adsorption capacity of the activated carbon for the adsorption of Au(I) ions
Figure 5.26: Influence plot for detection of outliers in relation with Pt(II) uptake
Design-Expert® Software Pt extraction (adjusted for curvature)
Color points by value of Pt extraction:
99.68
66.76
Run Number
Pt(II) extraction: Externally studentized residuals
-4.00
-2.00
0.00
2.00
4.00
1 14 27 40
Design-Expert® Software Au extraction (adjusted for curvature)
Color points by value of Au extraction:
99.83
82.48
Internally studentized residuals
Normal plot of residuals
-3.00 -2.00 -1.00 0.00 1.00 2.00 3.00
1
5
10
20 30
50
70 80
90
95
99
Stellenbosch University http://scholar.sun.ac.za
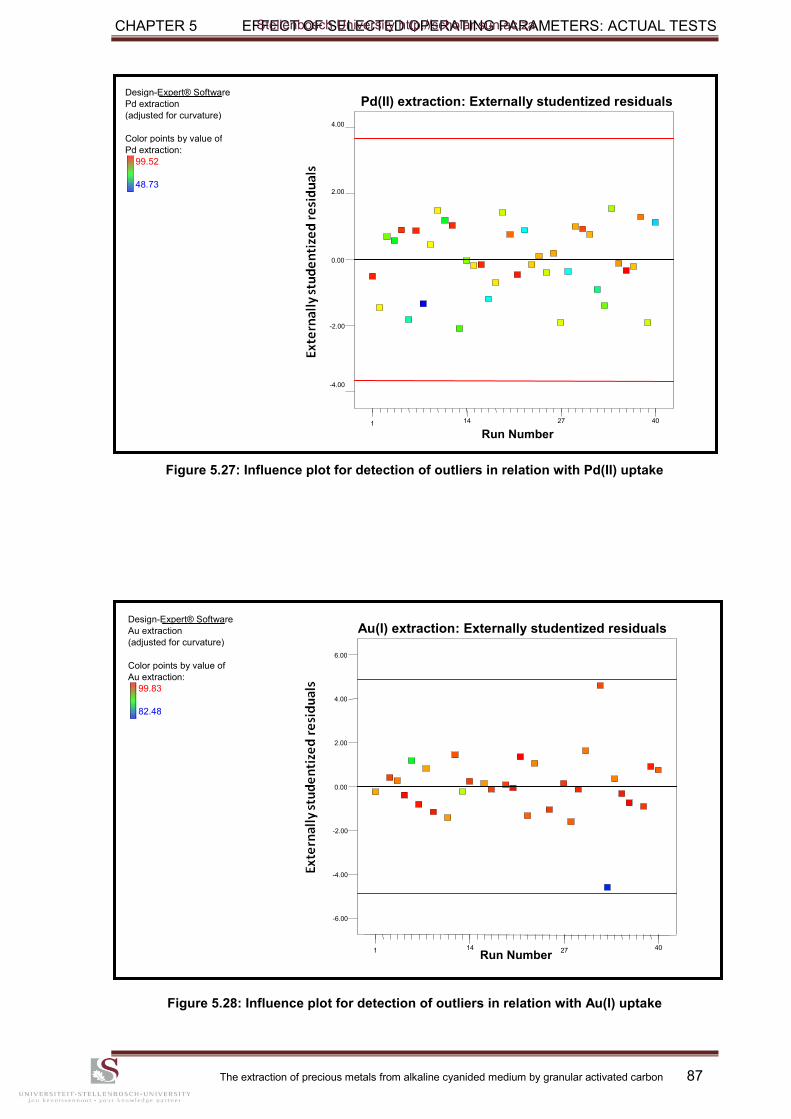
CHAPTER 5 EFFECT OF SELECTED OPERATING PARAMETERS: ACTUAL TESTS
The extraction of precious metals from alkaline cyanided medium by granular activated carbon 87
Figure 5.27: Influence plot for detection of outliers in relation with Pd(II) uptake
Figure 5.28: Influence plot for detection of outliers in relation with Au(I) uptake
Design-Expert® Software Au extraction (adjusted for curvature)
Color points by value of Au extraction:
99.83
82.48
Run Number
-6.00
-4.00
-2.00
0.00
2.00
4.00
6.00
1 14 27 40
Au(I) extraction: Externally studentized residuals
Design-Expert® Software Pd extraction (adjusted for curvature)
Color points by value of Pd extraction:
99.52
48.73
Run Number
-4.00
-2.00
0.00
2.00
4.00
1 14 27 40
Pd(II) extraction: Externally studentized residuals
Stellenbosch University http://scholar.sun.ac.za
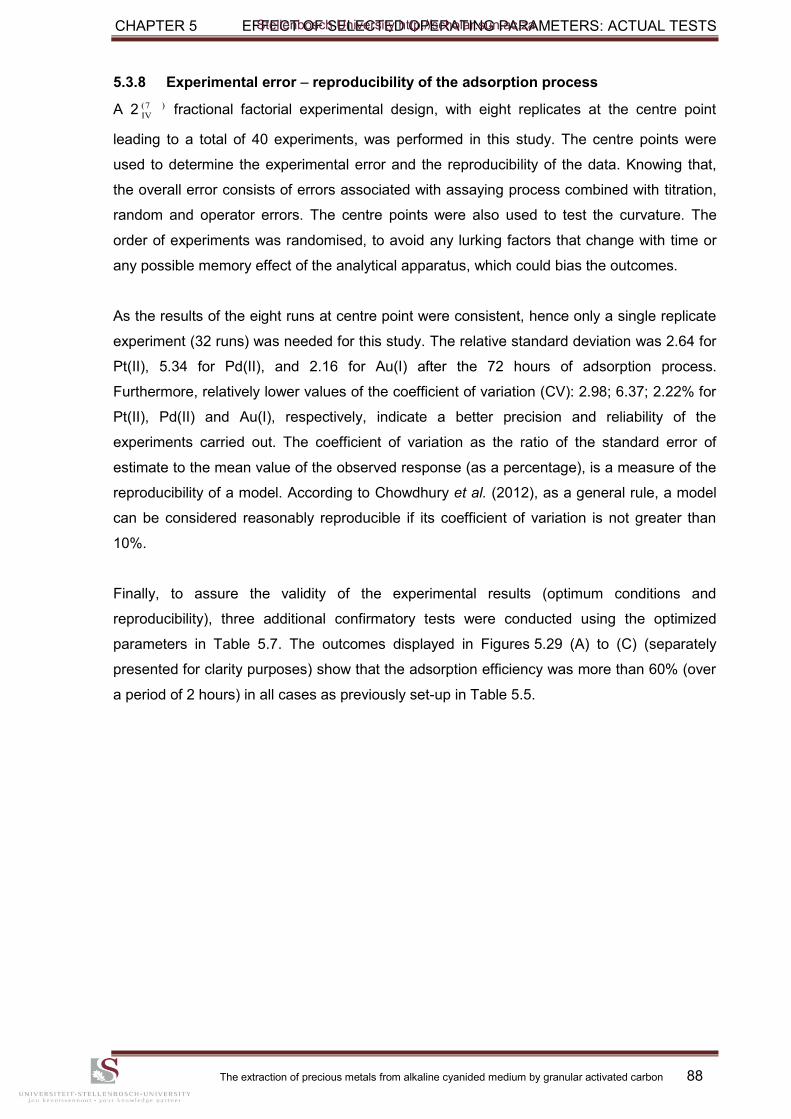
CHAPTER 5 EFFECT OF SELECTED OPERATING PARAMETERS: ACTUAL TESTS
The extraction of precious metals from alkaline cyanided medium by granular activated carbon 88
5.3.8 Experimental error – reproducibility of the adsorption process
A 2 )27(
IV
fractional factorial experimental design, with eight replicates at the centre point
leading to a total of 40 experiments, was performed in this study. The centre points were
used to determine the experimental error and the reproducibility of the data. Knowing that,
the overall error consists of errors associated with assaying process combined with titration,
random and operator errors. The centre points were also used to test the curvature. The
order of experiments was randomised, to avoid any lurking factors that change with time or
any possible memory effect of the analytical apparatus, which could bias the outcomes.
As the results of the eight runs at centre point were consistent, hence only a single replicate
experiment (32 runs) was needed for this study. The relative standard deviation was 2.64 for
Pt(II), 5.34 for Pd(II), and 2.16 for Au(I) after the 72 hours of adsorption process.
Furthermore, relatively lower values of the coefficient of variation (CV): 2.98; 6.37; 2.22% for
Pt(II), Pd(II) and Au(I), respectively, indicate a better precision and reliability of the
experiments carried out. The coefficient of variation as the ratio of the standard error of
estimate to the mean value of the observed response (as a percentage), is a measure of the
reproducibility of a model. According to Chowdhury et al. (2012), as a general rule, a model
can be considered reasonably reproducible if its coefficient of variation is not greater than
10%.
Finally, to assure the validity of the experimental results (optimum conditions and
reproducibility), three additional confirmatory tests were conducted using the optimized
parameters in Table 5.7. The outcomes displayed in Figures 5.29 (A) to (C) (separately
presented for clarity purposes) show that the adsorption efficiency was more than 60% (over
a period of 2 hours) in all cases as previously set-up in Table 5.5.
Stellenbosch University http://scholar.sun.ac.za
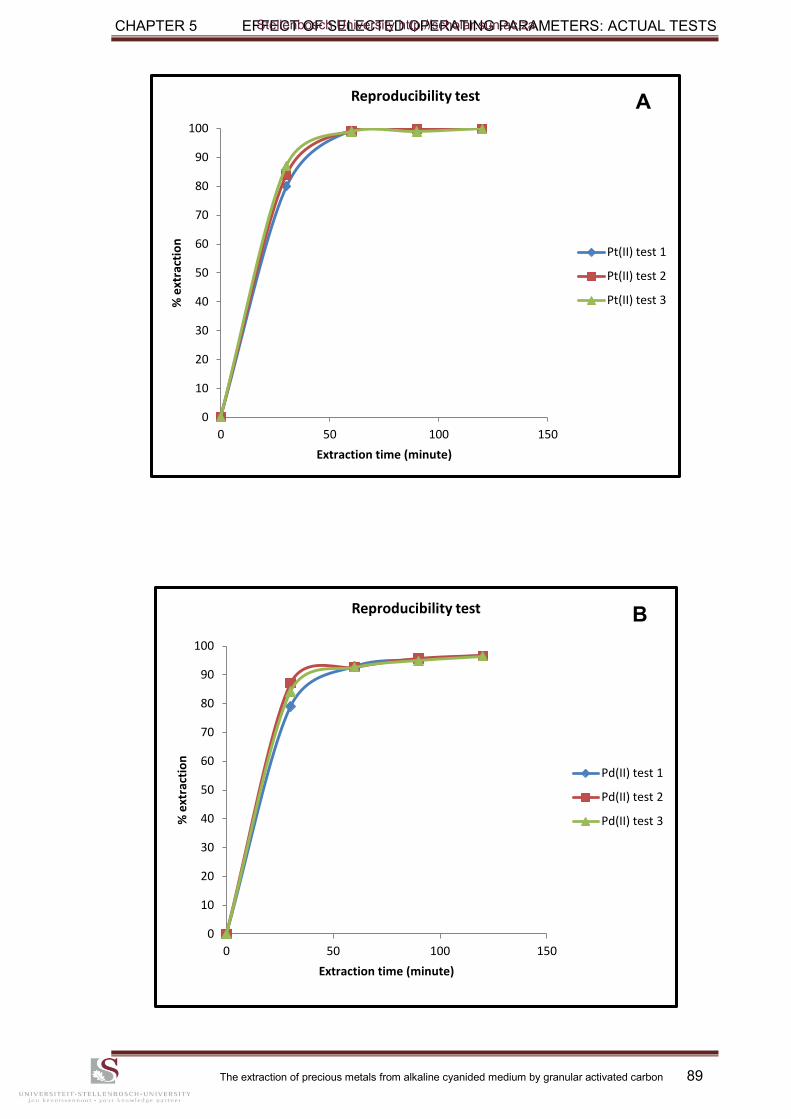
CHAPTER 5 EFFECT OF SELECTED OPERATING PARAMETERS: ACTUAL TESTS
The extraction of precious metals from alkaline cyanided medium by granular activated carbon 89
0
10
20
30
40
50
60
70
80
90
100
0 50 100 150
% e
xtra
ctio
n
Extraction time (minute)
Reproducibility test
Pt(II) test 1
Pt(II) test 2
Pt(II) test 3
A
0
10
20
30
40
50
60
70
80
90
100
0 50 100 150
% e
xtra
ctio
n
Extraction time (minute)
Reproducibility test
Pd(II) test 1
Pd(II) test 2
Pd(II) test 3
B
Stellenbosch University http://scholar.sun.ac.za
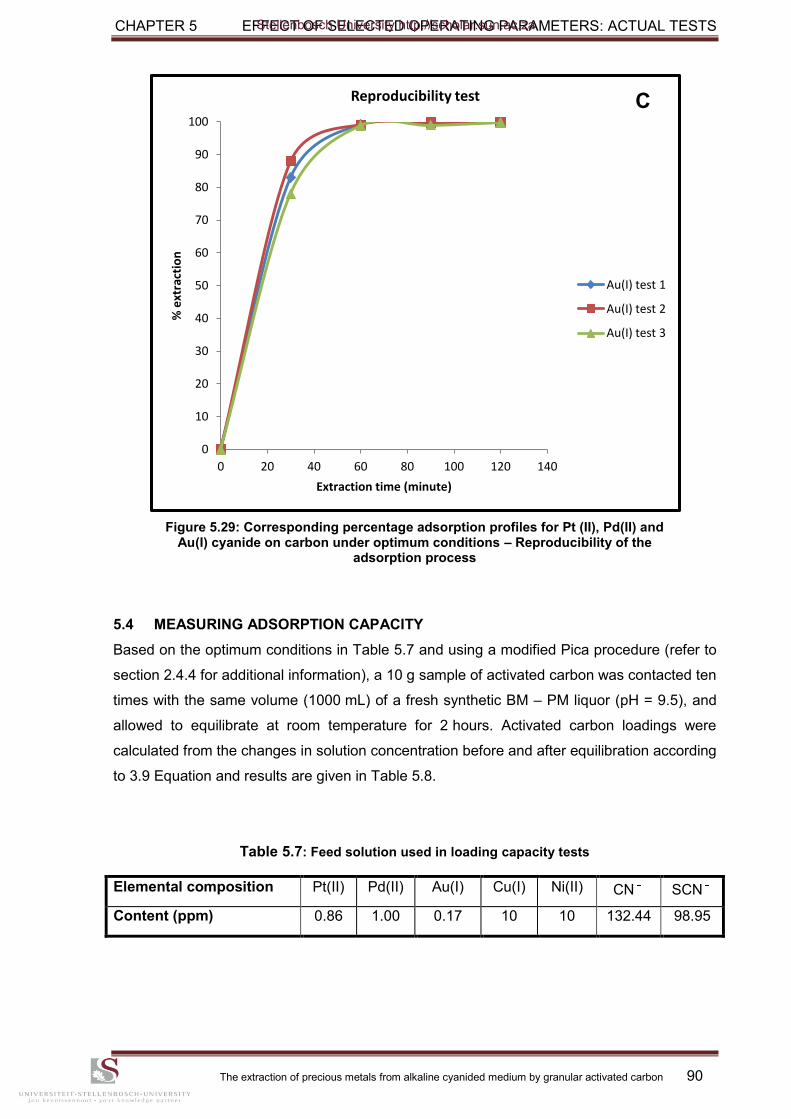
CHAPTER 5 EFFECT OF SELECTED OPERATING PARAMETERS: ACTUAL TESTS
The extraction of precious metals from alkaline cyanided medium by granular activated carbon 90
Figure 5.29: Corresponding percentage adsorption profiles for Pt (II), Pd(II) and Au(I) cyanide on carbon under optimum conditions – Reproducibility of the
adsorption process
5.4 MEASURING ADSORPTION CAPACITY
Based on the optimum conditions in Table 5.7 and using a modified Pica procedure (refer to
section 2.4.4 for additional information), a 10 g sample of activated carbon was contacted ten
times with the same volume (1000 mL) of a fresh synthetic BM – PM liquor (pH = 9.5), and
allowed to equilibrate at room temperature for 2 hours. Activated carbon loadings were
calculated from the changes in solution concentration before and after equilibration according
to 3.9 Equation and results are given in Table 5.8.
Table 5.7: Feed solution used in loading capacity tests
Elemental composition Pt(II) Pd(II) Au(I) Cu(I) Ni(II) CN SCN
Content (ppm) 0.86 1.00 0.17 10 10 132.44 98.95
0
10
20
30
40
50
60
70
80
90
100
0 20 40 60 80 100 120 140
% e
xtra
ctio
n
Extraction time (minute)
Reproducibility test
Au(I) test 1
Au(I) test 2
Au(I) test 3
C
Stellenbosch University http://scholar.sun.ac.za
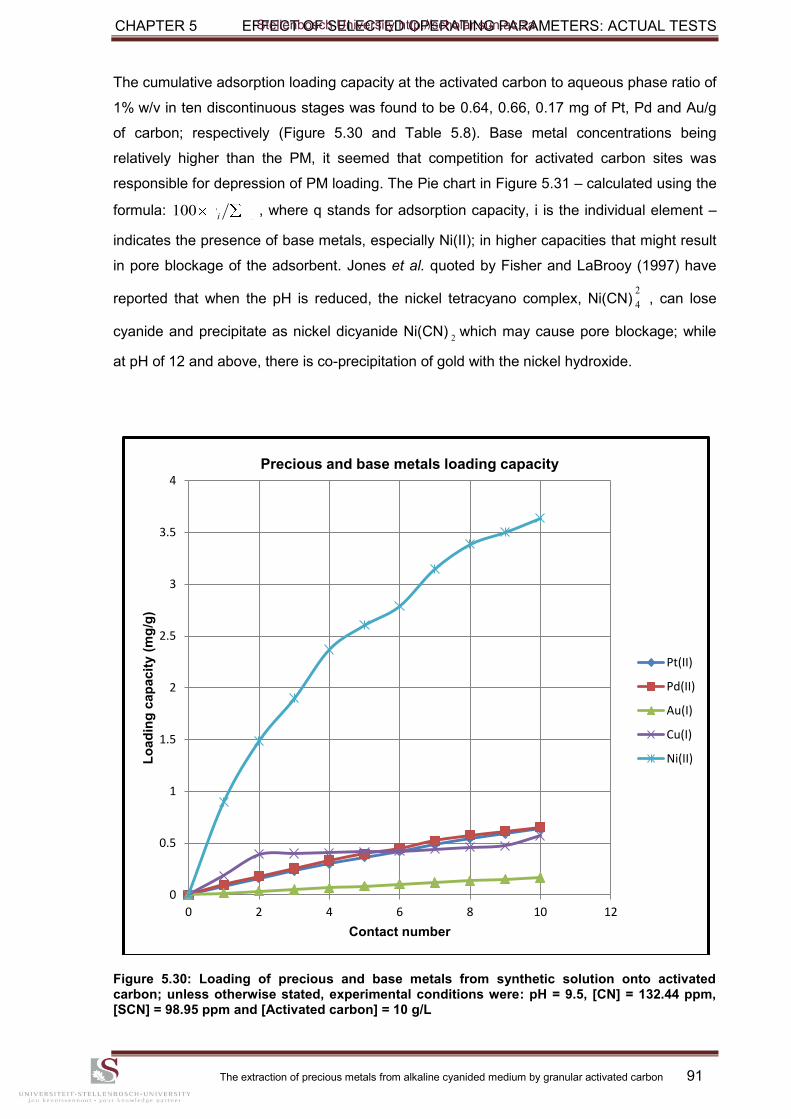
CHAPTER 5 EFFECT OF SELECTED OPERATING PARAMETERS: ACTUAL TESTS
The extraction of precious metals from alkaline cyanided medium by granular activated carbon 91
The cumulative adsorption loading capacity at the activated carbon to aqueous phase ratio of
1% w/v in ten discontinuous stages was found to be 0.64, 0.66, 0.17 mg of Pt, Pd and Au/g
of carbon; respectively (Figure 5.30 and Table 5.8). Base metal concentrations being
relatively higher than the PM, it seemed that competition for activated carbon sites was
responsible for depression of PM loading. The Pie chart in Figure 5.31 – calculated using the
formula: ii qq100 , where q stands for adsorption capacity, i is the individual element –
indicates the presence of base metals, especially Ni(II); in higher capacities that might result
in pore blockage of the adsorbent. Jones et al. quoted by Fisher and LaBrooy (1997) have
reported that when the pH is reduced, the nickel tetracyano complex, Ni(CN)2
4, can lose
cyanide and precipitate as nickel dicyanide Ni(CN)2
which may cause pore blockage; while
at pH of 12 and above, there is co-precipitation of gold with the nickel hydroxide.
Figure 5.30: Loading of precious and base metals from synthetic solution onto activated carbon; unless otherwise stated, experimental conditions were: pH = 9.5, [CN] = 132.44 ppm, [SCN] = 98.95 ppm and [Activated carbon] = 10 g/L
0
0.5
1
1.5
2
2.5
3
3.5
4
0 2 4 6 8 10 12
Lo
ad
ing
cap
acit
y (
mg
/g)
Contact number
Precious and base metals loading capacity
Pt(II)
Pd(II)
Au(I)
Cu(I)
Ni(II)
Stellenbosch University http://scholar.sun.ac.za
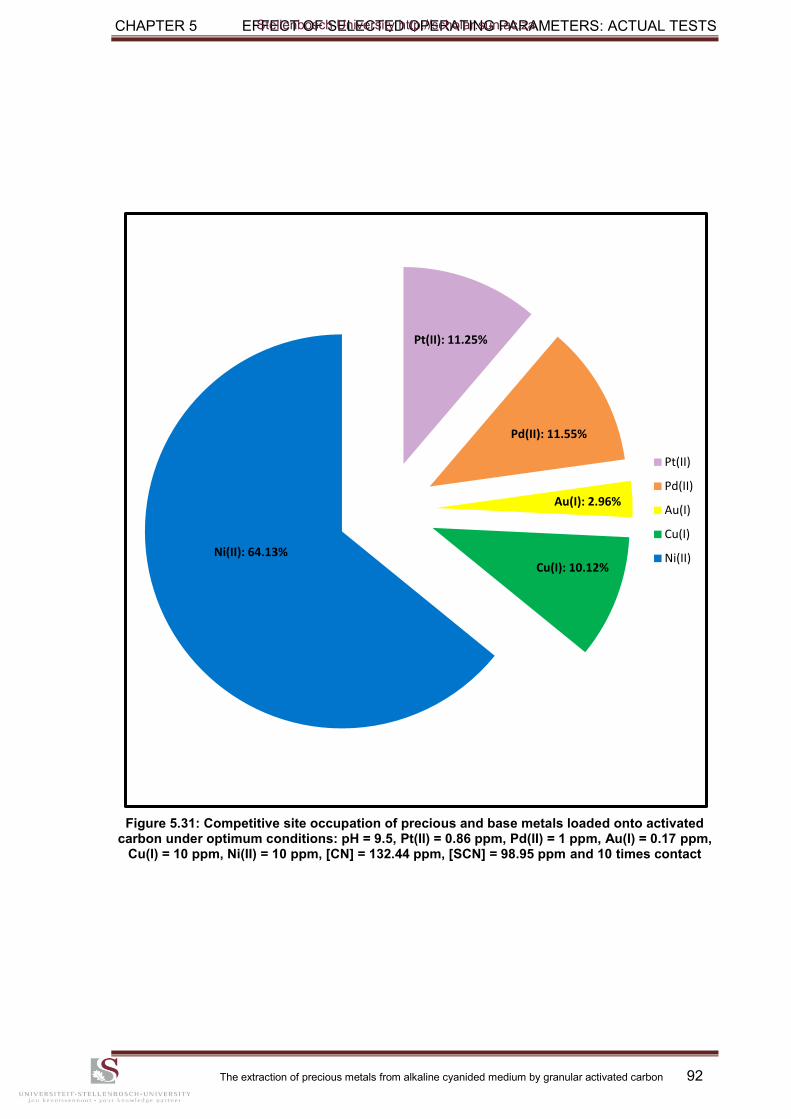
CHAPTER 5 EFFECT OF SELECTED OPERATING PARAMETERS: ACTUAL TESTS
The extraction of precious metals from alkaline cyanided medium by granular activated carbon 92
Figure 5.31: Competitive site occupation of precious and base metals loaded onto activated carbon under optimum conditions: pH = 9.5, Pt(II) = 0.86 ppm, Pd(II) = 1 ppm, Au(I) = 0.17 ppm,
Cu(I) = 10 ppm, Ni(II) = 10 ppm, [CN] = 132.44 ppm, [SCN] = 98.95 ppm and 10 times contact
Pt(II): 11.25%
Pd(II): 11.55%
Au(I): 2.96%
Cu(I): 10.12% Ni(II): 64.13%
Pt(II)
Pd(II)
Au(I)
Cu(I)
Ni(II)
Stellenbosch University http://scholar.sun.ac.za
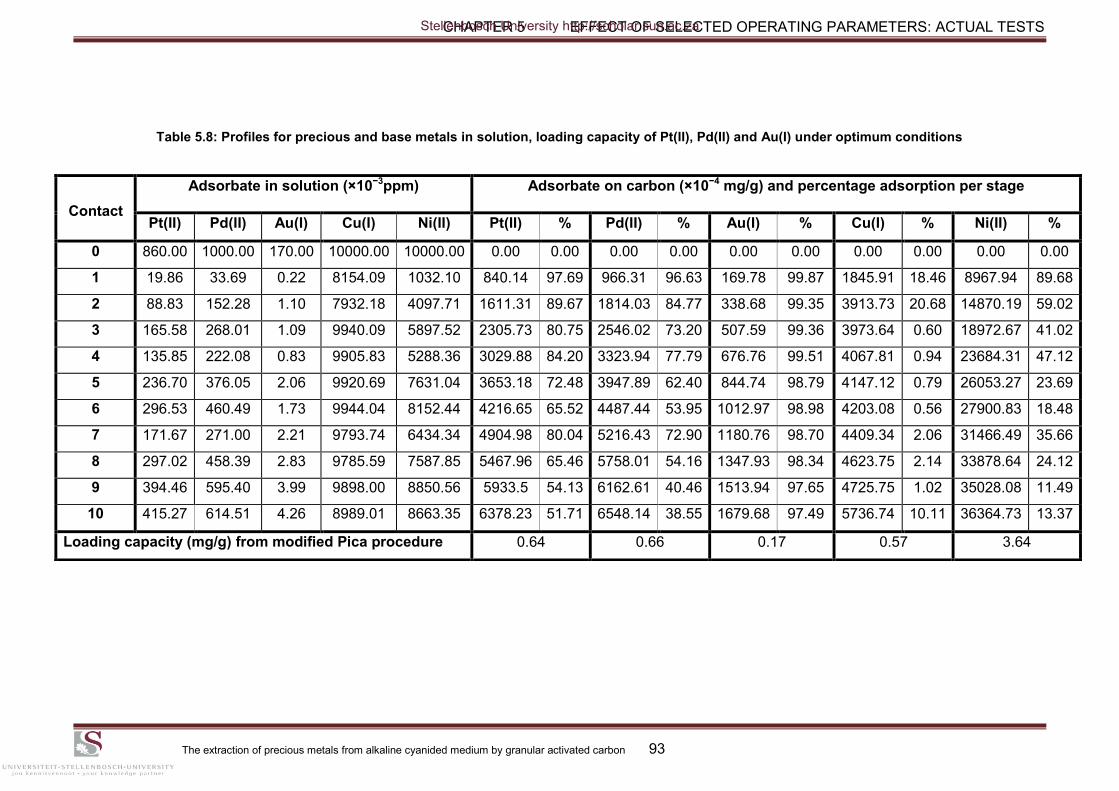
CHAPTER 5 EFFECT OF SELECTED OPERATING PARAMETERS: ACTUAL TESTS
The extraction of precious metals from alkaline cyanided medium by granular activated carbon 93
Table 5.8: Profiles for precious and base metals in solution, loading capacity of Pt(II), Pd(II) and Au(I) under optimum conditions
Contact
Adsorbate in solution (×10−3ppm) Adsorbate on carbon (×10−4 mg/g) and percentage adsorption per stage
Pt(II) Pd(II) Au(I) Cu(I) Ni(II) Pt(II) % Pd(II) % Au(I) % Cu(I) % Ni(II) %
0 860.00 1000.00 170.00 10000.00 10000.00 0.00 0.00 0.00 0.00 0.00 0.00 0.00 0.00 0.00 0.00
1 19.86 33.69 0.22 8154.09 1032.10 840.14 97.69 966.31 96.63 169.78 99.87 1845.91 18.46 8967.94 89.68
2 88.83 152.28 1.10 7932.18 4097.71 1611.31 89.67 1814.03 84.77 338.68 99.35 3913.73 20.68 14870.19 59.02
3 165.58 268.01 1.09 9940.09 5897.52 2305.73 80.75 2546.02 73.20 507.59 99.36 3973.64 0.60 18972.67 41.02
4 135.85 222.08 0.83 9905.83 5288.36 3029.88 84.20 3323.94 77.79 676.76 99.51 4067.81 0.94 23684.31 47.12
5 236.70 376.05 2.06 9920.69 7631.04 3653.18 72.48 3947.89 62.40 844.74 98.79 4147.12 0.79 26053.27 23.69
6 296.53 460.49 1.73 9944.04 8152.44 4216.65 65.52 4487.44 53.95 1012.97 98.98 4203.08 0.56 27900.83 18.48
7 171.67 271.00 2.21 9793.74 6434.34 4904.98 80.04 5216.43 72.90 1180.76 98.70 4409.34 2.06 31466.49 35.66
8 297.02 458.39 2.83 9785.59 7587.85 5467.96 65.46 5758.01 54.16 1347.93 98.34 4623.75 2.14 33878.64 24.12
9 394.46 595.40 3.99 9898.00 8850.56 5933.5 54.13 6162.61 40.46 1513.94 97.65 4725.75 1.02 35028.08 11.49
10 415.27 614.51 4.26 8989.01 8663.35 6378.23 51.71 6548.14 38.55 1679.68 97.49 5736.74 10.11 36364.73 13.37
Loading capacity (mg/g) from modified Pica procedure 0.64 0.66 0.17 0.57 3.64
Stellenbosch University http://scholar.sun.ac.za
CHAPTER 5 EFFECT OF SELECTED OPERATING PARAMETERS: ACTUAL TESTS
The extraction of precious metals from alkaline cyanided medium by granular activated carbon 94
5.5 DISTRIBUTION COEFFICIENT – LOADING SELECTIVITY
The distribution coefficient, defined as the ratio of the metal concentration in the solid phase
to that in the equilibrium solution after a specified reaction time, was calculated using
Equation 3.7. KD
describes the extent to which adsorbates are adsorbed onto activated
carbon. The experiment was carried out with solution of initial concentrations of 0.86, 1, 0.17,
10 and 10 ppm for Pt(II), Pd(II), Au(I), Cu(I) and Ni(II) respectively; at CN concentration of
132.44 ppm, SCN concentration of 98.95 ppm, solution pH of 9.5, for a contact time of
72 hours.
Table 5.9: Distribution coefficients for adsorption of base and PMs onto activated carbon
Species Pt(II) Pd(II) Au(I) Cu(I) Ni(II)
Distribution coefficient KD (L/kg) 1535.92 1065.58 39429.11 63.82 419.75
The highest KD values (Table 5.9) were found for Au(I) followed by those of Pt(II) and Pd(II),
while those of Ni(II) showed intermediate KD values. However, low KD values were
pronounced for Cu(I). This implies that under competitive conditions, Au(I) is the most
strongly adsorbed metal, whereas Cu(I) is the least adsorbed one. Lower solubility leads to
higher distribution coefficients on carbon. No sequence is available in open literature for the
order of adsorption of Pt and Pd cyanide complexes onto activated carbon. Based on their
distribution coefficients, the affinity of activated carbon for metal ions follows the selectivity
sequence expressed in Equation 5.7.
Au(CN) > Pt(CN) > Pd(CN) > Ni(CN) > Cu(CN) (5.7)
5.6 ADSORPTION MECHANISM APPROACH
5.6.1 Assessment of rate-limiting step
Sarkar et al. (2003) observed that external transport is usually the rate-limiting step for a
system having (a) poor mixing, (b) dilute solute concentration, (c) small particle size of
adsorbent and (d) high affinity of solute for adsorbent. In contrast, intraparticle diffusion
usually limits the overall transfer for a system having (a) good mixing, (b) high solute
concentration, (c) larger particle size of adsorbent, and (d) low affinity of solute for adsorbent.
According to Fleming and Nicol (1984) the rate of extraction of gold cyanide by resins and
activated carbon is controlled by film diffusion in the initial stages (less than 30% of gold
loading) and by both film and intraparticle diffusion in the latter stages, as equilibrium is
approached.
2
2
4
2
4
2
4
2
3
Stellenbosch University http://scholar.sun.ac.za
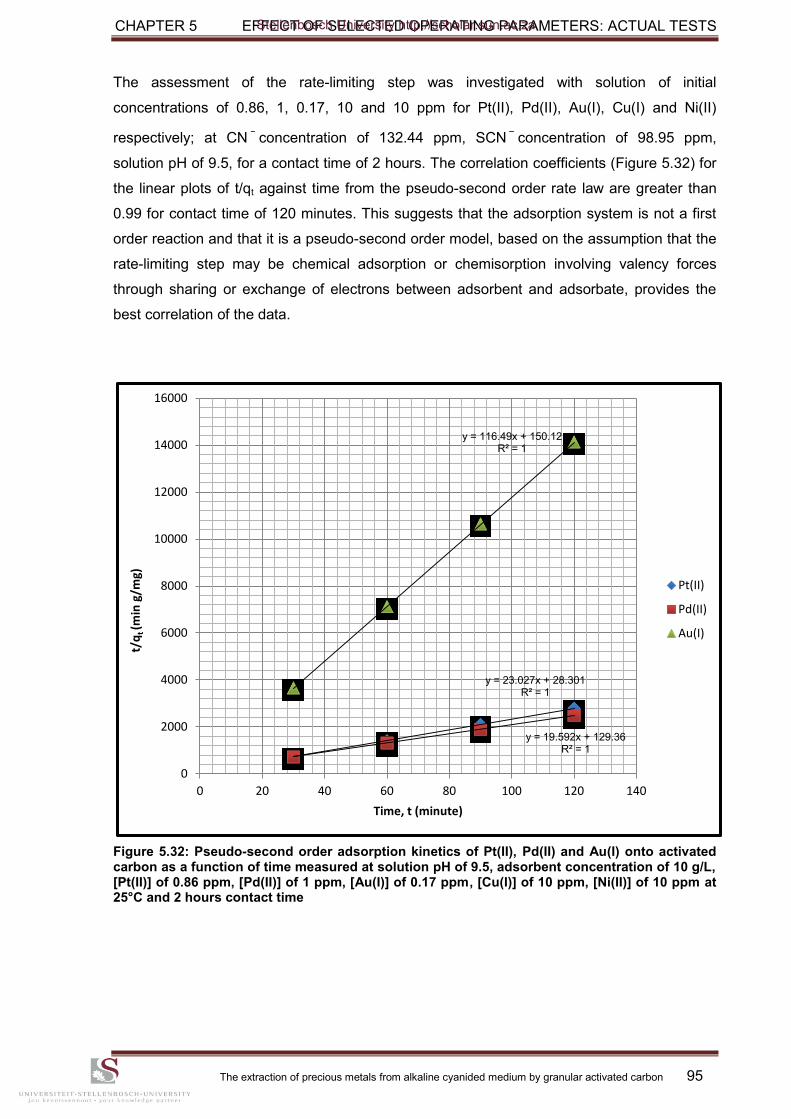
CHAPTER 5 EFFECT OF SELECTED OPERATING PARAMETERS: ACTUAL TESTS
The extraction of precious metals from alkaline cyanided medium by granular activated carbon 95
The assessment of the rate-limiting step was investigated with solution of initial
concentrations of 0.86, 1, 0.17, 10 and 10 ppm for Pt(II), Pd(II), Au(I), Cu(I) and Ni(II)
respectively; at CN concentration of 132.44 ppm, SCN concentration of 98.95 ppm,
solution pH of 9.5, for a contact time of 2 hours. The correlation coefficients (Figure 5.32) for
the linear plots of t/qt against time from the pseudo-second order rate law are greater than
0.99 for contact time of 120 minutes. This suggests that the adsorption system is not a first
order reaction and that it is a pseudo-second order model, based on the assumption that the
rate-limiting step may be chemical adsorption or chemisorption involving valency forces
through sharing or exchange of electrons between adsorbent and adsorbate, provides the
best correlation of the data.
Figure 5.32: Pseudo-second order adsorption kinetics of Pt(II), Pd(II) and Au(I) onto activated carbon as a function of time measured at solution pH of 9.5, adsorbent concentration of 10 g/L, [Pt(II)] of 0.86 ppm, [Pd(II)] of 1 ppm, [Au(I)] of 0.17 ppm, [Cu(I)] of 10 ppm, [Ni(II)] of 10 ppm at 25°C and 2 hours contact time
y = 23.027x + 28.301 R² = 1
y = 19.592x + 129.36 R² = 1
y = 116.49x + 150.12 R² = 1
0
2000
4000
6000
8000
10000
12000
14000
16000
0 20 40 60 80 100 120 140
t/q
t (m
in g
/mg)
Time, t (minute)
Pt(II)
Pd(II)
Au(I)
Stellenbosch University http://scholar.sun.ac.za
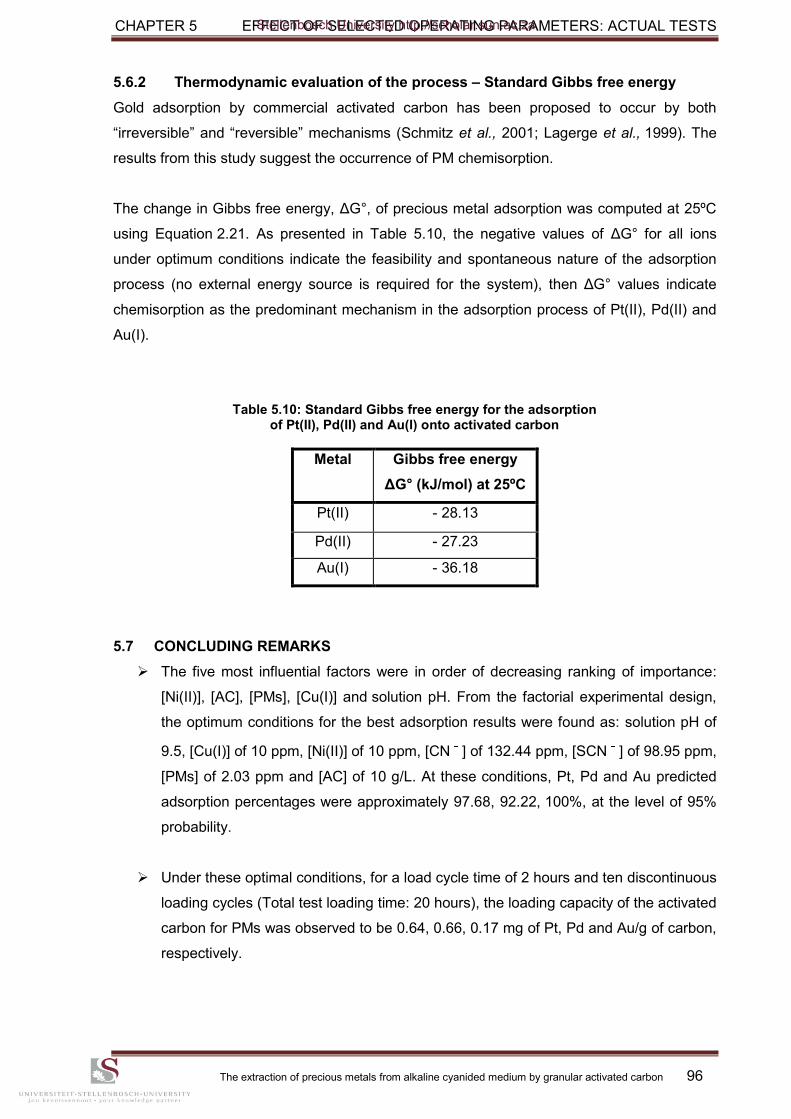
CHAPTER 5 EFFECT OF SELECTED OPERATING PARAMETERS: ACTUAL TESTS
The extraction of precious metals from alkaline cyanided medium by granular activated carbon 96
5.6.2 Thermodynamic evaluation of the process – Standard Gibbs free energy
Gold adsorption by commercial activated carbon has been proposed to occur by both
“irreversible” and “reversible” mechanisms (Schmitz et al., 2001; Lagerge et al., 1999). The
results from this study suggest the occurrence of PM chemisorption.
The change in Gibbs free energy, ΔG°, of precious metal adsorption was computed at 25ºC
using Equation 2.21. As presented in Table 5.10, the negative values of ΔG° for all ions
under optimum conditions indicate the feasibility and spontaneous nature of the adsorption
process (no external energy source is required for the system), then ΔG° values indicate
chemisorption as the predominant mechanism in the adsorption process of Pt(II), Pd(II) and
Au(I).
Table 5.10: Standard Gibbs free energy for the adsorption of Pt(II), Pd(II) and Au(I) onto activated carbon
Metal Gibbs free energy
ΔG° (kJ/mol) at 25ºC
Pt(II) - 28.13
Pd(II) - 27.23
Au(I) - 36.18
5.7 CONCLUDING REMARKS
The five most influential factors were in order of decreasing ranking of importance:
[Ni(II)], [AC], [PMs], [Cu(I)] and solution pH. From the factorial experimental design,
the optimum conditions for the best adsorption results were found as: solution pH of
9.5, [Cu(I)] of 10 ppm, [Ni(II)] of 10 ppm, [CN ] of 132.44 ppm, [SCN ] of 98.95 ppm,
[PMs] of 2.03 ppm and [AC] of 10 g/L. At these conditions, Pt, Pd and Au predicted
adsorption percentages were approximately 97.68, 92.22, 100%, at the level of 95%
probability.
Under these optimal conditions, for a load cycle time of 2 hours and ten discontinuous
loading cycles (Total test loading time: 20 hours), the loading capacity of the activated
carbon for PMs was observed to be 0.64, 0.66, 0.17 mg of Pt, Pd and Au/g of carbon,
respectively.
Stellenbosch University http://scholar.sun.ac.za
CHAPTER 6 OVERALL CONCLUSIONS AND RECOMMENDATIONS
The extraction of precious metals from alkaline cyanided medium by granular activated carbon 97
CHAPTER 6 : OVERALL CONCLUSIONS AND RECOMMENDATIONS
This concluding chapter presents conclusions and suggests useful avenues for future
research.
The use of a factorial experimental design has allowed the identification of the most
important factors influencing Pt(II), Pd(II) and Au(I) ions adsorption from cyanide media
employing coconut shell MC 110 as adsorbent. The following conclusions were drawn:
Adsorption rates of Pt, Pd and Au – within the first 60 minutes – were observed to be
very high and thereafter the reaction proceeds at a slower rate until equilibrium was
obtained. The saturation loading time was found to be 120 minutes based on the
initial metal concentration.
It was found that [SCN ] concentration was not identified as a significant (preventing)
factor for PM adsorption, while Ni(II) concentration was the most significant
adsorption process parameter due to its highest percentage contribution (negative)
among the process parameters.
The five most influential factors were, in order of decreasing ranking of importance,
[Ni(II)], [AC], [PMs], [Cu(I)] and solution pH. From the factorial experimental design,
the optimum conditions for the best adsorption results were found to be: solution pH
of 9.5, [Cu(I)] of 10 ppm, [Ni(II)] of 10 ppm, [CN ] of 132.44 ppm, [SCN ] of
98.95 ppm, [PMs] of 2.03 ppm and [AC] of 10 g/L. At these conditions, Pt, Pd and Au
predicted adsorption percentages were approximately 98, 92, 100%, at the level of
95% probability.
Under these optimal conditions, for a load cycle time of 2 hours and ten discontinuous
loading cycles (Total test loading time: 20 hours), the loading capacity of the activated
carbon for PMs was observed to be 0.64, 0.66, 0.17 mg of Pt, Pd and Au/g of carbon,
respectively.
Base metal concentrations being relatively higher than the PM in the PLS, it seemed
that competition for activated carbon sites was responsible for depression of PM
loading.
Stellenbosch University http://scholar.sun.ac.za
CHAPTER 6 OVERALL CONCLUSIONS AND RECOMMENDATIONS
The extraction of precious metals from alkaline cyanided medium by granular activated carbon 98
Thermodynamic data analysis revealed that the adsorption process is spontaneous
and chemical in nature.
Based on their distribution coefficients, the affinity of activated carbon for metal ions
follows the selectivity sequence expressed below.
Au(CN) > Pt(CN) > Pd(CN) > Ni(CN) > Cu(CN)
RECOMMENDATIONS AND FUTURE WORK
It is well-known that batch kinetics cannot be scaled-up directly to simulate a large scale
CIL/CIP plant in view of differences in hydrodynamics. Nevertheless, a change in batch
behaviour gives a relative indication of changes to be expected on a continuous plant.
Selective adsorption of specific adsorbates has been indicated. Some of the key parameters
important for controlling adsorption have been described in this work, providing the
necessary foundation for the next step, which is to establish the economic viability of the
technology which is important for its industrial application.
Maximum control of the stability of nickel complexes would be a key factor for success,
especially for the heap leach operation. In other words, for PMs (Pt, Pd and Au) to be
efficiently extracted from clarified or plant pregnant solution, it is necessary for all the nickel
in solution to be extracted first. Although the strategy used in this work has given very
promising results, there are a number of areas that need further investigation. These include:
The need to investigate the adsorption of PMs by comparing the efficiencies and
kinetics of adsorption when using sodium hydroxide (in this study) or lime,
respectively, in order to control the pH.
An investigation on separation and preconcentration of PM cyanide ions from dilute
and large volume of solutions using reverse osmosis.
An eventual incorporation of all the experimental data to formulate a computer
package which will assist plant operators in the optimization of the carbon-in-pulp
circuit.
2
2
4
2
4
2
4
2
3
Stellenbosch University http://scholar.sun.ac.za
CHAPTER 7 REFERENCES
The extraction of precious metals from alkaline cyanided medium by granular activated carbon 99
CHAPTER 7 : REFERENCES
Acheampong, M.A., Pereira, J.P.C., Meulepas, R.J.W. & Lens, P.N.L. 2011. Kinetics modelling of Cu(II) biosorption on to coconut shell and Moringa oleifera seeds from tropical regions. Environmental Technology, (1-9). Acton, C.F. 1982. The technology of gold and silver extraction. The American Institute of Chemical Engineers, 78(216). Adams, M., Liddell, K. & Holohan, T. 2010. Hydrometallurgical processing of Platreef flotation concentrate. Minerals Engineering, Article in Press. Adams, M.D. 1990. The chemical behaviour of cyanide in the extraction of gold. 1. Kinetics of cyanide loss in the presence and absence of activated carbon. Journal of The South African Institute of Mining and Metallurgy, 90(2):37-44. Adams, M.D. 2001. A methodology for determining the deportment of cyanide losses in gold plants. Minerals Engineering, 14(4):383-390.
Adams, M.D., Friedl, J. & Wagner, F.E. 1992. The mechanism of adsorption of Au(CN) onto
activated carbon. Hydrometallurgy, 31:265-275. Adams, M.D., McDougall, G.J. & Hancock, R.D. 1987. Models for the adsorption of aurocyanide onto activated carbon. Part III: Comparison between the extraction of aurocyanide by activated carbon, Polymeric adsorbents and 1-Pentanol. Hydrometallurgy, 19:95-115. Ageeva, L.D., Kolpakova, N.A., Kovyrkina, T.V., Potsyapun, N.P. & Buinovskii, A.S. 2001. Mechanism and Kinetics of the Sorption of Platinum, Palladium, and Gold on Activated Carbon from UV-Illuminated Chloride Solutions. Journal of Analytical Chemistry, 56(2):137-139. Aguilar, M., Farran, A. & Marti, V. 1997. Capillary electrophoretic determination of cyanide leaching solutions from automobile catalytic converters. Journal of chromatography A, 778:397-402. Aktas, S. and Morcali, M.H. 2011. Platinum recovery from dilute platinum solutions using activated carbon. Transactions of Nonferrous Metals Society of China, 21:2554-2558. Amarasinghe, B.M.W.P.K. & Williams, R.A. 2007. Tea waste as a low cost adsorbent for the removal of Cu and Pb from wastewater. Chemical Engineering Journal, 132(1-3):299-309. Antony, J. 2003. Design of Experiments for Engineers and Scientists. England: Jordan Hill, Oxford OX2 8DP. Aylmore, M.G. 2005. Alternative lixiviants to cyanide for leaching gold ores. Developments in Mineral Processing, (15):501-539.
Azharul, I.M., Sakkas, V. & Triantafyllos, A.A. 2009. Application of statistical design of experiment with desirability functions for the removal of organophosphorus pesticide from aqueous solution by low-cost material. Journal of Hazardous Materials, 170(1):230-238.
4
Stellenbosch University http://scholar.sun.ac.za
CHAPTER 7 REFERENCES
The extraction of precious metals from alkaline cyanided medium by granular activated carbon 100
Baghalha, M., Khosravian, Gh.H. & Mortaheb, H.R. 2009. Kinetics of platinum extraction from spent reforming catalysts in aqua-regia solutions. Hydrometallurgy, 95(3-4):247-253. Barnes, D.E., Wright, P.J., Graham, S.M. & Jones-Watson, E.A. 2000. Techniques for the determination of cyanide in a process environment: A Review. The Journal of Geostandards and Geoanalysis, 24:(2)183-195. Bax, A., Dunn, G.M. & Lewins, D. 2009. Recovery of platinum group metals. USA patent 7544231 B2. Bernardis, F.L., Grant, R.A. & Sherrington, D.C. 2005. A review of methods of separation of the platinum-group metals through their chloro-complexes. Reactive & Functional Polymers, 65:205-217. Bevilaqua, D., Leite, A.L.L.C., Garcia, O., Jr. & Tuovinen, O.H. 2002. Oxidation of chalcopyrite by Acidithiobacillus ferrooxidans and Acidithiobacillus thiooxidans in shake flasks. Process Biochemistry, 38:587-592. Botz, M.M., Dimitriadis, D., Polglase, T., Phillips, W. & Jenny, R. 2001. Processes for the regeneration of cyanide from thiocyanate. Minerals and metallurgical processing, 18(3). Brandon, N.P., Mahmood, M.N., Page, P.W. & Roberts, C.A. 1987. The direct electrowinning of gold from dilute cyanide leach liquors. Hydrometallurgy, 18:305-319. Breuer, P.L. Sutcliffe, C.A. & Meakin, R.L. 2011. Cyanide measurement by silver nitrate titration: Comparison of rhodanine and potentiometric end-points. Hydrometallurgy, 106:135-140. Breuer, P.L., Hewitt, D.M., Sutcliffe, C.A. & Jeffrey, M.I. 2009. The quantification of cyanide and its reaction products during leaching and cyanide destruction processes. The Southern African Institute of Mining and Metallurgy, World Gold Conference 2009. Butler, D.R. 1993. Recovery of gold, silver and platinum group metals with various leachants at low pulp density. USA patent 5215575. Chand, R., Watari, T., Inoue, K., Kawakita, H., Luitel, H.N., Parajuli, D., Torikai, T. & Yada, M. 2009. Selective adsorption of precious metals from hydrochloric acid solutions using porous carbon prepared from barley straw and rice husk. Minerals Engineering, 22:1277-1282. Chen, J. & Huang, K. 2006. A new technique for extraction of platinum group metals by pressure cyanidation. Hydrometallurgy, 82:164-171. Chen, S., Xu, R., Huang, H., Yi, F. Zhou, X. & Zeng, H. 2007. Reduction-adsorption behaviour of platinum ions on activated carbon fibers. Journal of Materials Science, 42:9572-9581. Chowdhury, Z.Z., Zain, S.M., Khan, R.A., Ahmad, A.A. and Khalid, K. 2012. Application of Response Surface Methodology (RSM) for Optimizing Production Condition for Removal of Pb(II) and Cu(II) Onto Kenaf Fiber Based Activated Carbon. Research Journal of Applied Sciences Engineering and Technology, 4(5): 458-465. Ciminelli, V.S.T. 2002. Ion Exchange Resins in the Gold Industry. Journal of Operations Management, October 2002. Coderre, F. & Dixon, D.G. 1999. Modeling the cyanide heap leaching of cupriferous gold ores Part 1: Introduction and interpretation of laboratory column leaching data. Hydrometallurgy, 52:151-175.
Stellenbosch University http://scholar.sun.ac.za
CHAPTER 7 REFERENCES
The extraction of precious metals from alkaline cyanided medium by granular activated carbon 101
Cortina, J.L., Meinhardt, E., Roijals, 0. & Marti, V. 1998. Modification and preparation of polymeric adsorbents for precious-metal extraction in hydrometallurgical processes. Reactive & Functional Polymers, 36:149-165. Cox, M., Pichugin, A.A., El-Shafey, E.I. & Appleton, Q. 2005. Sorption of precious metals onto chemically prepared carbon from flax shive. Hydrometallurgy, 78:137-144. Cramer, L.A. 2001. The Extractive Metallurgy of South Africa‟s Platinum Ores. Journal of the South African institute of Mining and Metallurgy, October 2001. Czitrom, V. 1999. One-Factor-at-a-Time Versus Designed Experiments. The American Statistician, 53(2). Dai, X. & Breuer, P.L. 2009. Cyanide and copper cyanide recovery by activated carbon. Minerals Engineering, 22:469-476. Dai, X., Jeffrey, M.I. & Breuer, P.L. 2005. The development of a flow injection analysis method for the quantification of free cyanide and copper cyanide complexes in gold leaching solutions. Hydrometallurgy, 76:87-96. Das, N. 2010. Recovery of precious metals through biosorption – A review. Hydrometallurgy, 103:180-189. Davidson, R.J. 1974. The mechanism of gold adsorption on activated charcoal. Journal of the South African institute of Mining and Metallurgy, November 1974. Davidson, R.J., Veronese, V. & Nkosi, M.V. 1979. The use of activated carbon for the recovery of gold and silver from gold-plant solutions. Journal of the South African Institute of Mining and Metallurgy, May. Davidson, R.J., Douglas, W.D. and Tumilty, J.A. 1982. The selection of granular activated carbon for use in a carbon-in-pulp operation. In: Proceedings, AusIMM/WAIT Conference on Carbon-in-Pulp Technology, July 1982, Kalgoorlie, Western Australia. Australasian Institute of Mining and Metallurgy, Melbourne. Deschenes, G. & Wallingford, G. 1995. Effect of oxygen and lead nitrate on the cyanidation of a sulphide bearing gold ore. Minerals Engineering, 8(8):923-931. Deschenes, G. 2005. Advances in the cyanidation of gold. Developments in Mineral Processing, 15: 479-500. Diamond, W.J. 1989. Practical Experiment Design for engineers and scientists 2nd edition. New York: Van Nostrand Reinhold. Duong, D.D. 1998. Adsorption analysis: Equilibria and kinetics. London: Imperial College Press. Echeverria, J.C., Morera, M.T., Mazkiarin, C. & Garrido, J.J. 1998. Competitive sorption of heavy metal by soils. Isotherms and fractional factorial experiments. Environmental Pollution, 101:275-284. Ellis, S. & Senanayake, G. 2004. The effects of dissolved oxygen and cyanide dosage on gold extraction from a pyrrhotite-rich ore. Hydrometallurgy, 72:39-50. Fagan, P.A. & Haddad, P.R. 1991. Determination of free cyanide in gold cyanidation process liquors by ion-interaction chromatography with post-column derivatization. Journal of Chromatography, 550:559-571.
Stellenbosch University http://scholar.sun.ac.za
CHAPTER 7 REFERENCES
The extraction of precious metals from alkaline cyanided medium by granular activated carbon 102
Feather, A., Sole, K.C. & Bryson, L.J. 1997. Gold refining by solvent extraction-the Minataur™ Process. The Journal of The South African Institute of Mining and Metallurgy, July/August. Fisher, M.J. & LaBrooy, S.R. 1997. The effect of nickel on gold recovery during adsorption and elution. World gold conference, Singapore, 1-3 September 1997. Fleming, C.A. & Nicol, M.J. 1984. The absorption of gold cyanide onto activated carbon. Ill. Factors influencing the rate of loading and the equilibrium capacity. The Journal of The South African Institute of Mining and Metallurgy, 84 (4): 85-93. Fleming, C.A. 1992. Hydrometallurgy of precious metals recovery. Hydrometallurgy, 30:127-162. Fleming, C.A., Mezei, A., Bourricaudy, E., Canizares, M. & Ashbury, M. 2011. Factors influencing the rate of gold cyanide leaching and adsorption on activated carbon, and their impact on the design of CIL and CIP circuits. Minerals Engineering, 24(6):484-494. Flett, D.S. 1992. Solution purification. Hydrometallurgy, 30:327-344. Frey, D.D., Engelhardt, F. & Greitzer, E.M. 2003. A role for „„one-factor-at-a-time‟‟ experimentation in parameter design. Research in Engineering Design, 14:65-74. Fu, R., Zeng, H., Lu, Y., Lai, S.Y., Chan, W.H. & Ng, C.F. 1995. The reduction of Pt(IV) with activated carbon fibers-an XPS study. Carbon, 33(5):657-661. Gallagher, N.P., Hendrix, J.L., Milosavljevic, E.B., Nelson, J.H. & Solujic, L. 1990. Affinity of activated carbon towards some gold (I) complexes. Hydrometallurgy, 25:305-316. Gomes, C.P., Almeida, M.F. & Loureiro, J.M. 2001. Gold recovery with ion exchange used resins. Separation and Purification Technology, 24(1-2):35-57. Gómez, V. & Callao, M.P. 2008. Modeling the adsorption of dyes onto activated carbon by using experimental designs. Talanta, 77(1):84-89. Green, B.R., Smit, D.M.C., Maumela, H. & Coetzer, G. 2004. Leaching and recovery of platinum group metals from UG2 concentrates. The Journal of The South African Institute of Mining and Metallurgy, July 2004. Grosse, A.C., Dicinowski, G.W., Shaw, M.J. & Haddad, P.R. 2003. Leaching and recovery of gold using ammoniacal thiosulfate leach liquors (a review). Hydrometallurgy, 69:1-21. Gumus, G., Demirata, B. & Apak, R. 2000. Simultaneous spectrophotometric determination of cyanide and thiocyanate after separation on a melamine-formaldehyde resin. Talanta, 53: 305-315. Hartman, H.L. 1992. SME Mining Engineering Handbook 2nd Edition volume 2. United States of America: Society for Mining, Metallurgy, and Exploration, Inc. Hassler, J.W. 1963. Activated carbon. New York, United States of America: Chemical publishing CO., Inc. Heinen, H.J., Peterson, D.G. & Lindstrom, R.E. l978. Processing Gold Ores Using Heap Leach-Carbon Adsorption Methods. United States Department of the interior: Bureau of Mines Information Circular 8770.
Stellenbosch University http://scholar.sun.ac.za
CHAPTER 7 REFERENCES
The extraction of precious metals from alkaline cyanided medium by granular activated carbon 103
Ho, Y.S. and McKay, G. 1999. Pseudo-second order model for sorption processes. Process Biochemistry, 34: 451-465. Holtum, D.A. & Murray, D.M. 1994. Bacterial heap leaching of refractory gold/sulphide ores. Minerals Engineering, 7(5-6):619-631. Horsfall Jr. M., Abia, A.A. & Spiff, A.I. 2006. Kinetic studies on the adsorption of Cd2+, Cu2+ and Zn2+ ions from aqueous solutions by cassava (Manihot sculenta Cranz) tuber bark waste. Bioresource Technology, 97:283-291. Hu, Z., Srinivasan, M.P. & Ni, Y. 2000. Preparation of Mesoporous High-Surface-Area Activated Carbon. Advanced Materials, 12(1). Huang, K., Chen, J., Chen, Y.R., Zhao, J.C., Li, Q.W., Yang, Q.X. & Zhang, Y. 2006. Enrichment of platinum group metals (PGMs) by two-stage selective pressure leaching cementation from low-grade Pt-Pd sulfide concentrates. Metallurgical and materials transactions B, volume 37B, October. Hund, E., Heyden, Y. V., Haustein, M., Massart, D.L. & Smeyers-Verbeke, J. 2000. Comparison of several criteria to decide on the significance of effects in a robustness test with an asymmetrical factorial design. Analytica Chimica Acta, 404:257-271. Hutchinson, D. & McDonald, I. 2008. Laser ablation ICP-MS study of platinum-group elements in sulphides from the Platreef at Turfspruit, northern limb of the Bushveld Complex, South Africa. Miner Deposita, 43:695-711. Ibragimova, R.I., Mil‟chenko, A.I. & Vorob‟ev-Desyatovskii, N.V. 2007. Criteria for Choice of a Brand of Activated Carbon for Hydrometallurgical Recovery of Gold from Ore Pulps in Carbon-in-Leaching and Carbon-in-Pulp Processes. Russian Journal of Applied Chemistry, 80(6):891-903. Iglesias, N. & Carranza, F. 1996. Treatment of a gold bearing arsenopyrite concentrate by ferric sulphate leaching. Minerals Engineering, 9(3):317-330. Jeffrey, M.I. & Breuer, P.L. 2000. The cyanide leaching of gold in solutions containing sulphide. Minerals Engineering, 13(10-11):1097-1106. Jia, Y.F., Steele, C.J., Hayward, I.P. & Thomas, K.M. 1998. Mechanism of adsorption of gold and silver species on activated carbons. Carbon, 36(9):1299-1308. Jones, L. & Hackl, R.P. 1999. Sources of high cyanide consumption for a biooxidized refractory gold concentrate. Process Metallurgy, 9(1):337-346. Kappes, D.W. 2005. Heap Leaching of Gold and Silver Ores. Developments in Mineral Processing, 15:456-478. Kargari, A., Kaghazchi, T., Sohrabi, M. & Soleimani, M. 2004. Batch extraction of gold(III) ions from aqueous solutions using emulsion liquid membrane via facilitated carrier transport. Journal of Membrane Science, 233:1-10. Kongolo, K. & Mwema, M.D. 1998. The extractive metallurgy of gold. Hyperfine Interactions, 111:281-289. Kordosky, G.A., Sierakoski, J.M., Virnig, M.J. & Mattison, P.L. 1992. Gold solvent extraction from typical cyanide leach solutions. Hydrometallurgy, 30:291-305.
Stellenbosch University http://scholar.sun.ac.za
CHAPTER 7 REFERENCES
The extraction of precious metals from alkaline cyanided medium by granular activated carbon 104
Kuzugüdenli, Ö.E. & Kantar, Ç. 1999. Alternates to gold recovery by cyanide leaching. Erc. Üniv. Fen Bil. Derg. 15(1-2):119-127. Kyriakakis, G. 2005. Extraction of gold from platinum group metal (PGM) ores. Developments in Mineral Processing, (15):897-917. La Brooy, S.R., Linge, H.G. & Walker, G.S. 1994. Review of gold extraction from ores. Minerals Engineering, 7(10):1213-1241. Lagerge, S., Zajac, J., Partyka, S., Groszek, A.J. & Chesneau, M. 1997. A Two-Stage Adsorption of Cyanide Gold Complexes onto Activated Carbon Inferred from Various Experimental Studies. Langmuir, 13:4683-4692. Lagerge, S., Zajac, J., Partyka, S. & Groszek, A.J. 1999. Comparative Study on the Adsorption of Cyanide Gold Complexes onto Different Carbonaceous Samples: Measurement of the Reversibility of the Process and Assessment of the Active Surface Inferred by Flow Microcalorimetry. Langmuir, 1999, 15, 4803-4811. Lam, K.F., Fong, C.M. & Yeung, K.L. 2007. Separation of Precious Metals using Selective Mesoporous Adsorbents. Gold Bulletin 2007 • 40/3. Lan, X., Jiajun, K. & Rongqing, Q. 1994. Behaviour of elemental sulphur in biooxidation of gold-bearing sulphide ores. Transactions of The Nonferrous Metals Society of China, 4(4). Law, H.H. & Gabriel, N.E. 1986. A New Process for Recovering Gold as Potassium Gold Cyanide. Industrial and Engineering Chemistry Process Design and Development, 25:352-354. Laxen, P.A. 1984. Carbon-in-pulp processes in South Africa. Hydrometallurgy, 13:169-192. Laxen, P.A. Becker, G.S.M. & Rubin, R. 1979. Developments in the application of carbon-in pulp to the recovery of gold from South African ores. Journal of The South African Institute of Mining and Metallurgy, June 1979. Le Roux, J.O. Bryson, A.W. & Young, B.O. 1991. A comparison of several kinetic models for the adsorption of gold cyanide onto activated carbon. Journal of The South African Institute of Mining and Metallurgy, 91(3):95-103. Lee, C.A. 1996. A Review of Mineralization in the Bushveld Complex and some other Layered Intrusions. Developments in Petrology, 15:103-145. Liddell, K.S. & Adams, M.D. 2012. Kell hydrometallurgical process for extraction of platinum group metals and base metals from flotation concentrates. The Journal of The Southern African Institute of Mining and Metallurgy, Volume 112: January 2012. Liebenberg, S.P. & van Deventer, J.S.J. 1997. The dynamic simulation of in-pulp sorption processes using the lumping of competitive and fouling phenomena. Minerals Engineering, 10(9):959-972. Lizima, H.M., Harlamovs, J.R., McKay, D.J. & Dai, Z. 2005. Heap leaching kinetics are proportional to irrigation rate divided by heap height. Minerals Engineering, 18:623-630. Lorenzen, L. & van Deventer, J.S.J. 1992. The mechanism of leaching of gold from refractory ores. Minerals Engineering, 5(10-12):1377-1387. Lorenzen, L., van Deventer, J.S.J. & Landi, W.M. 1995. Factors affecting the mechanism of the adsorption of arsenic species on activated carbon. Minerals Engineering, 8(4-5):557-569.
Stellenbosch University http://scholar.sun.ac.za
CHAPTER 7 REFERENCES
The extraction of precious metals from alkaline cyanided medium by granular activated carbon 105
Lu, J., Dreisinger, D.B. & Cooper, W.C. 2002. Thermodynamics of the aqueous copper-cyanide system. Hydrometallurgy, 66:23-36. Maree, D.C.S. 2008. Africa region cyanide code volume 1 - gold extraction plants, tank leach circuit revision 05 February 2008. Private communication. Marsden, J.O. & House, I.C. 2006. The chemistry of gold extraction Second edition. United States of America: The society of Mining, Metallurgy, and Exploration, Inc. McDougall, G.J. & Hancock, R.D. 1981. Gold Complexes and activated carbon. Gold Bulletin, 14(4):138-153. McDougall, G.J. 1991. The physical nature and manufacture of activated carbon, Journal of South African Institute of Mining and Metallurgy, 91(4):109-120. McDougall, G.J., Hancock, R.D., Nicol, M.J., Wellington, O.L. & Copperthwaite, R.G. 1980. The Mechanism of the adsorption of gold cyanide on activated carbon. Journal of South African Institute of Mining and Metallurgy, 80:344-356. McInnes, C.M., Sparrow, G.J. & Woodcock, J.T. 1994. Extraction of platinum, palladium and gold by cyanidation of Coronation Hill ore. Hydrometallurgy, 35:141-159. McMurry, J. & Fay, R.C. 1995. Chemistry. United States of America: Prentice-Hall, Inc. Meinhardt, E., Marti, V., Sastre, A., Aguilar, M. & Cortina, J.L. 1996. Developments in impregnated and ion exchange resins for gold cyanide extraction. Ion exchange developments and applications: proceedings of IEX, 372-379. Miller, J.D., Wan, R.Y. & Parga, J.R. 1990. Characterization and electrochemical analysis of gold cementation from alkaline cyanide solution by suspended zinc particles. Hydrometallurgy, 24:373-392. Milonjić, S.K. 2007. A consideration of the correct calculation of thermodynamic parameters of adsorption. Journal of the Serbian Chemical Society, 72(12):1363-1367. Mooiman, M.B. & Miller, J.D. 1991. The chemistry of gold solvent extraction from alkaline cyanide solution by solvating extractants. Hydrometallurgy, 27:29-46. Moradi, S. & Monhemius, A.J. 2011. Mixed sulphide-oxide lead and zinc ores: Problems and solutions. Minerals Engineering, 24:1062-1076. Mwase, J. 2009. Hydrometallurgical Extraction of Platinum Group Metals from a Low-Grade Ore Concentrate. MSc Thesis, University of Cape Town. Mwase, J. 2011. Private communication. University of Cape Town. Mwase, J.M., Petersen, J. & Eksteen, J.J. 2012. A conceptual flowsheet for heap leaching of platinum group metals (PGMs) from a low-grade ore concentrate. Hydrometallurgy, 111-112: 129-135. Newell, A.J.H. 2008. The Processing of Platinum Group Metals (PGM)-Part 1. Pincock Perspectives, (89): March. Nguyen, H.H., Tran, T. & Wong, P.L.M. 1997a. Copper interaction during the dissolution of gold. Mineral Engineering, 10(5):491-505.
Stellenbosch University http://scholar.sun.ac.za
CHAPTER 7 REFERENCES
The extraction of precious metals from alkaline cyanided medium by granular activated carbon 106
Nguyen, H.N., Tran, T. & Wong, P.L.M. 1997b. A kinetic study of the cementation of gold from cyanide solutions onto copper. Hydrometallurgy, 46:55-69. Nguyen, N.V., Lee, J.C., Kim, S.K., Jha, M.K., Chung, K.S. & Jeong, J. 2010. Adsorption of gold(III) from waste rinse water of semiconductor manufacturing industries using Amberlite XAD-7HP resin. Gold Bulletin, 43(3). Nicol, M.J., Fleming, C.A. & Cromberge, G. 1984. The absorption of gold cyanide onto activated carbon. 1. The kinetics of absorption from pulps. Journal of The South African Institute of Mining and Metallurgy, 84(2):50-54. Niu, H. & Volesky, B. 1999. Characteristics of gold biosorption from cyanide solution. Journal of Chemical Technology and Biotechnology, 74:778-784. Parga, J.R., Valenzuela, J.L. & Cepeda, T.F. 2007. Pressure Cyanide Leaching for Precious Metals Recovery. Journal of the Minerals, Metals and Materials Society, October. Paul, R.L., Filmer, A.0. & Nicol, M.J. 1983. The Recovery of Gold from Concentrated Aurocyanide Solutions. Hydrometallurgy Research, Development and Plant Practice. Eds., Osseo-Asare, K. and Miller, J.D., TMS-AIME: New York. Pasandideh, S.H.R. & Niaki, S.T.A. 2006. Optimizing multi-response statiscal problems using a genetic algorithm. Scienta Iranica, 13(1):50-59. Pavan, F.A., Gushikem, Y., Mazzocato, A.C., Dias, S.L.P. & Lima, E.C. 2007. Statistical design of experiments as a tool for optimizing the batch conditions to methylene blue biosorption on yellow passion fruit and mandarin peels. Dyes and Pigments, 72:256-266. Pleysier, R., Dai, X., Wingate, C.J. & Jeffrey, M.I. 2008. Microtomography based identification of gold adsorption mechanisms, the measurement of activated carbon activity, and the effect of frothers on gold adsorption. Minerals Engineering, 21: 453-462. Pohlandt, C., Jones, E.A. & Lee, A.F. 1983. A critical evaluation of methods applicable to the determination of cyanides. Journal of the South African Institute of Mining and Metallurgy, January. Poinern, G.E.J., Senanayake, G., Shah, N., Thi-Le, X.N., Parkinson, G.M. & Fawcett, D.
2011. Adsorption of the aurocyanide, AuCN)2 complex on granular activated carbons derived
from macadamia nut shells – A preliminary study. Minerals Engineering, 24:1694-1702. Prasad, M.S., Mensah-Biney, R. & Pizarro, R.S. 1991. Modern trends in gold processing – overview. Minerals Engineering, 4(12):1257-1277. Qiu, H., Lv, L., Pan, B., Zhang, Q., Zhang, W. & Zhang, Q. 2009. Critical review in adsorption kinetic models. Journal of Zhejiang University Science A, 10(5):716-724. Qu, R., Sun, C., Wang, M., Ji, C., Xu, Q., Zhang, Y., Wang, C., Chen, H. & Yin, P. 2009. Adsorption of Au(III) from aqueous solution using cotton fiber/chitosan composite adsorbents. Hydrometallurgy, 100:65-71. Rane, N.M., Sapkal, R.S., Sapkal, V.S., Patil, M.B & Shewale, S.P. 2010. Use of naturally available low cost adsorbents for removal of Cr (VI) from waste water. International Journal of Chemical Sciences and Applications, 1(2):65-69. Riveros, P.A. 1990. Studies on the solvent extraction of gold from cyanide media. Hydrometallurgy, 24:135-156.
Stellenbosch University http://scholar.sun.ac.za
CHAPTER 7 REFERENCES
The extraction of precious metals from alkaline cyanided medium by granular activated carbon 107
Robinson, G.K. 2000. Practical Strategies for Experimenting. New York: John Wiley & Sons. Roijals, O., Marti, V., Meinhardt, E., Cortina, J.L. & Aguilar, M. 1996. Characterization of spent automotive catalyst residues for precious metal recycling using hydrometallurgical technologies. Chemical industry and environment, 2:419-428. Samiullah, Y. 1985. Adsorption of platinum, gold and silver by filter paper and borosilicate glass and its relevance to biogeochemical studies. Journal of geochemical exploration, 23:193-202. Sarkar, M., Acharya, P.K. & Bhattacharya, B. 2003. Modeling the adsorption kinetics of some priority organic pollutants in water from diffusion and activation energy parameters. Journal of Colloid and Interface Science, 266:28-32. Schmitz, P.A., Duyvesteyn, S., Johnson W.P., Enloe, L. & McMullen, J. 2001. Adsorption of aurocyanide complexes onto carbonaceous matter from preg-robbing Goldstrike ore. Hydrometallurgy, 61:121-135. Schouwstra, R.P. & Kinloch, E.D. 2000. A Short Geological Review of the Bushveld Complex. Platinum Metals Review, 44(1):33-39. Schubert, J.H., Barker, I.J. & Swartz, C.L.E. 1993. Performance evaluation of a carbon-in-pulp plant by dynamic simulation. Journal of South African Institute of Mining and Metallurgy, 93(11-12):293-299. Sharpe, A.G. 1976. The chemistry of cyano complexes of the transition metals. London: Academic Press. Sheridan, M.S., Nagaraj, D.R., Fornasiero, D. & Ralston, J. 2002. The use of a factorial experimental design to study collector properties of N-allyl-O-alkyl thionocarbamate collector in the flotation of a copper ore. Minerals Engineering, 15:333-340. Sheya, S.A.N. & Palmer, G.R. 1989. Effect of metal impurities on adsorption of gold by activated carbon in cyanide solutions. Report of investigations 9268. United State of America: Bureau of mines. Simanova, S.A., Shukarev, A.V., Lysenko, A.A., Grebennikov, S.F. & Astashkina, O.V. 2008. Adsorption of palladium, platinum and gold chloride complexes by carbon fibers with various structures. Fibre Chemistry, 40(4). Stange, W. 1991. The optimization of the CIP process using mathematical and economic models. Minerals Engineering, 4(12):1279-1295. Stange, W. 1999. The process design of gold leaching and carbon-in-pulp circuits. The Journal of The South African Institute of Mining and Metallurgy, January/February. Stange, W., King, R.P. & Woollacott, L. 1990. Towards more effective simulation of CIP and CIL processes. 2. A population- balance-based simulation approach. The Journal of The South African Institute of Mining and Metallurgy, 90(11):307-314. Staunton, W.P. 2005. Carbon-in-pulp. Developments in Mineral Processing, (15):562-587. Sun, B. & Noller, B.N. 1998. Simultaneous determination of trace amounts of free cyanide and thiocyanate by a stopped-flow spectrophotometric method. Water Research, 32(12):3698-3704.
Stellenbosch University http://scholar.sun.ac.za
CHAPTER 7 REFERENCES
The extraction of precious metals from alkaline cyanided medium by granular activated carbon 108
Sun, T.M. & Yen, W.T. 1993. Kinetics of gold chloride adsorption onto activated carbon. Minerals Engineering, 6(1):17-29. Sutherland, C. & Venkobachar, C. 2010. A diffusion-chemisorption kinetic model for simulating biosorption using forest macro-fungus, fomes fasciatus. International Research Journal of Plant Science, 1(4):107-117. Swash, P.M. 1988. A mineralogical investigation of refractory gold ores and their beneficiation, with special reference to arsenical ores. Journal of the South African Institute of Mining and Metallurgy, 88(5):173-180. Swiatkowski, A. 1999. Industrial carbon adsorbents. Studies in Surface Science and Catalysis, 120(1):69-94. Syna, N. & Valix, M. 2003. Modelling of gold (I) cyanide adsorption based on the properties of activated bagasse. Minerals Engineering, 16:421-427. Tshilombo, A.F. & Sandenbergh, R.F. 2001. An electrochemical study of the effect of lead and sulphide ions on the dissolution rate of gold in alkaline cyanide solutions. Hydrometallurgy, 60(1):55-67. Trexler, D.T., Flynn, T. & Hendrix, J.L. 1990. Heap leaching. Geo-Heat Center Bulletin, Summer 1990. U.S. Environmental Protection Agency (EPA). 1994. Technical report treatment of cyanide heap leaches and tailings. September 1994. Vadivelan, V. & Kumar, K.V. 2005. Equilibrium, kinetics, mechanism, and process design for the sorption of methylene blue onto rice husk. Journal of Colloid and Interface Science, 286(1):90-100. Van Der Walt, T.J. & Van Deventer, J.S.J. 1992. Non-ideal behaviour in counter-current in-pulp adsorption cascades. Minerals Engineering, 5(10-12):1401-1420. Van Deventer, J.S.J. & Ross, V.E. 1991. The dynamic simulation of carbon-in-pulp systems: A review of recent developments. Minerals Engineering, 4(7-11):667-681. Van Deventer, J.S.J. 1984. Kinetic model for the adsorption of metal cyanides on activated charcoal. PhD thesis, University of Stellenbosch. Van Deventer, J.S.J., Liebenberg, S.P., Lorenzen, L. & Aldrich, C. 1995. Dynamic modeling of competitive elution of activated carbon in columns using neural networks. Minerals Engineering, 8(12):1489-1501. Vimonses, V., Lei, S., Jin, B., Chow, C.W.K. & Saint, C. 2009. Kinetic study and equilibrium isotherm analysis of Congo Red adsorption by clay materials. Chemical Engineering Journal, 148(2-3):354-364. Walter, J. & Weber, Jr. 1974. Adsorption processes. Pure and applied chemistry, 37(3):375. Walton, R. 2005. Zinc cementation. Developments in Mineral Processing, 15:589-601. Wang, L., Zhang, J., Zhao, R., Li, Y., Li, C. & Zhang, C. 2010. Adsorption of Pb(II) on activated carbon prepared from Polygonum orientale Linn: Kinetics, isotherms, pH, and ionic strength studies. Bioresource Technology, 101:5808-5814.
Stellenbosch University http://scholar.sun.ac.za
CHAPTER 7 REFERENCES
The extraction of precious metals from alkaline cyanided medium by granular activated carbon 109
Wankasi, D., Horsfall Jnr, M. & Spiff, A.I. 2006. Sorption kinetics of Pb2+ and Cu2+ ions from aqueous solution by Nipah palm (Nypa fruticans Wurmb) shoot biomass. Electronic Journal of Biotechnology: 9(5). Westermark, M. 1975. Kinetics of Activated Carbon Adsorption. Water Pollution Control Federation, 47(4):704-719. Williams, M.E. 2003. A Review of Wastewater Treatment by Reverse Osmosis. EET Corporation and Williams Engineering Services Company, Inc. Woollacott, L.C., Stange, W. & King, R.P. 1990. Towards more effective simulation of CIP and CIL processes. 1. The modelling of adsorption and leaching. Journal of The South African Institute of Mining and Metallurgy, 90(10):275-282. Xiao, Z. & Laplante, A.R. 2004. Characterizing and recovering the platinum group minerals – a review. Minerals Engineering, 17:961-979. Yalcin, M. & Arol, A.I. 2002. Gold cyanide adsorption characteristics of activated carbon of non-coconut shell origin. Hydrometallurgy, 63:201-206. Yannopoulos, J.C. 1991. The extractive metallurgy of gold. New-York: Von Nostrand Reinhold. Yin, C.Y., Aroua, M.K. & Daud, W.M.A.W. 2007. Review of modifications of activated carbon for enhancing contaminant uptakes from aqueous solutions. Separation and Purification Technology, 52:403-415. Young, C.A., Taylor, P.R., Anderson, C.G. & Choi, Y. 2008. Hydrometallurgy 2008: Proceedings of the sixth international symposium. United State of America: Society for Mining, Metallurgy, and Exploration, Inc. (SME).
Stellenbosch University http://scholar.sun.ac.za

APPENDICES
The extraction of precious metals from alkaline cyanided medium by granular activated carbon 110
APPENDICES
Stellenbosch University http://scholar.sun.ac.za
APPENDIX A: TABULATION OF EXPERIMENTAL DATA
The extraction of precious metals from alkaline cyanided medium by granular activated carbon 111
APPENDIX A
TABULATION OF EXPERIMENTAL DATA
DERIVED FROM THE
SCREENING AND ACTUAL TESTS
Stellenbosch University http://scholar.sun.ac.za
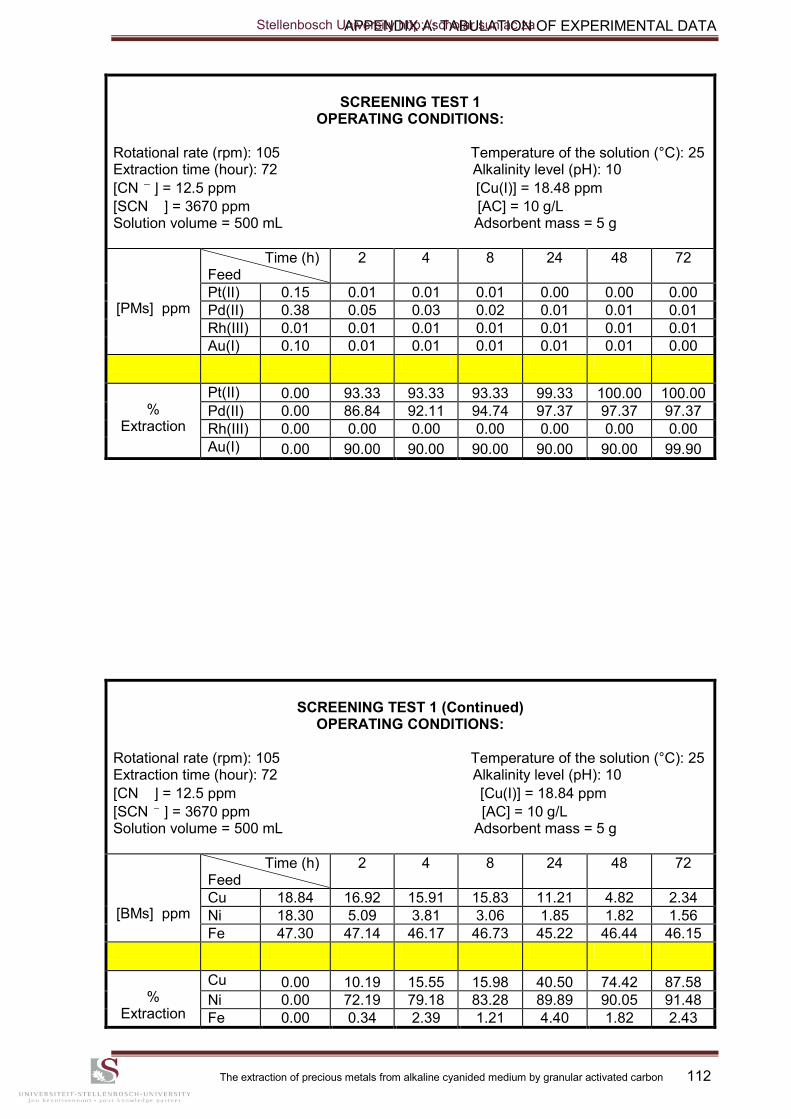
APPENDIX A: TABULATION OF EXPERIMENTAL DATA
The extraction of precious metals from alkaline cyanided medium by granular activated carbon 112
SCREENING TEST 1
OPERATING CONDITIONS: Rotational rate (rpm): 105 Temperature of the solution (°C): 25
Extraction time (hour): 72 Alkalinity level (pH): 10
[CN ] = 12.5 ppm [Cu(I)] = 18.48 ppm
[SCN ] = 3670 ppm [AC] = 10 g/L Solution volume = 500 mL Adsorbent mass = 5 g
[PMs] ppm
Time (h) Feed
2 4 8 24 48 72
Pt(II) 0.15 0.01 0.01 0.01 0.00 0.00 0.00
Pd(II) 0.38 0.05 0.03 0.02 0.01 0.01 0.01
Rh(III) 0.01 0.01 0.01 0.01 0.01 0.01 0.01
Au(I) 0.10 0.01 0.01 0.01 0.01 0.01 0.00
%
Extraction
Pt(II) 0.00 93.33 93.33 93.33 99.33 100.00 100.00
Pd(II) 0.00 86.84 92.11 94.74 97.37 97.37 97.37
Rh(III) 0.00 0.00 0.00 0.00 0.00 0.00 0.00
Au(I) 0.00 90.00 90.00 90.00 90.00 90.00 99.90
SCREENING TEST 1 (Continued)
OPERATING CONDITIONS: Rotational rate (rpm): 105 Temperature of the solution (°C): 25
Extraction time (hour): 72 Alkalinity level (pH): 10
[CN ] = 12.5 ppm [Cu(I)] = 18.84 ppm
[SCN ] = 3670 ppm [AC] = 10 g/L Solution volume = 500 mL Adsorbent mass = 5 g
[BMs] ppm
Time (h) Feed
2 4 8 24 48 72
Cu 18.84 16.92 15.91 15.83 11.21 4.82 2.34
Ni 18.30 5.09 3.81 3.06 1.85 1.82 1.56
Fe 47.30 47.14 46.17 46.73 45.22 46.44 46.15
%
Extraction
Cu 0.00 10.19 15.55 15.98 40.50 74.42 87.58
Ni 0.00 72.19 79.18 83.28 89.89 90.05 91.48
Fe 0.00 0.34 2.39 1.21 4.40 1.82 2.43
Stellenbosch University http://scholar.sun.ac.za
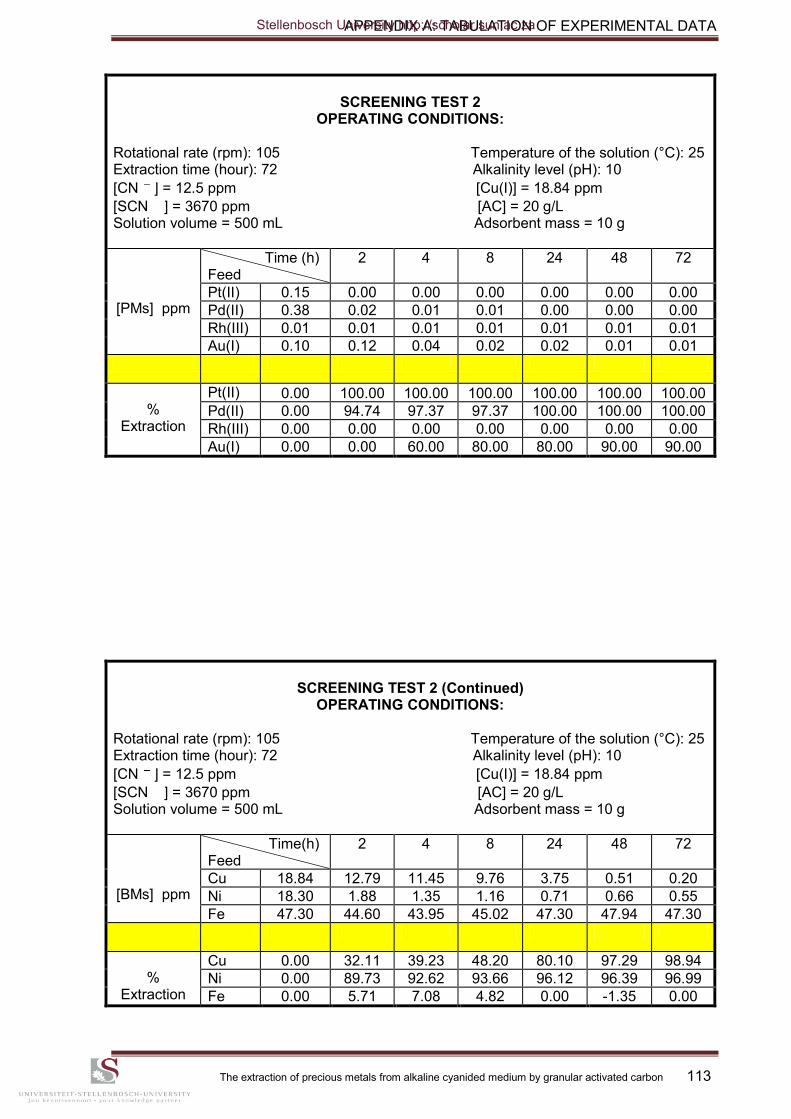
APPENDIX A: TABULATION OF EXPERIMENTAL DATA
The extraction of precious metals from alkaline cyanided medium by granular activated carbon 113
SCREENING TEST 2
OPERATING CONDITIONS: Rotational rate (rpm): 105 Temperature of the solution (°C): 25
Extraction time (hour): 72 Alkalinity level (pH): 10
[CN ] = 12.5 ppm [Cu(I)] = 18.84 ppm
[SCN ] = 3670 ppm [AC] = 20 g/L Solution volume = 500 mL Adsorbent mass = 10 g
[PMs] ppm
Time (h) Feed
2 4 8 24 48 72
Pt(II) 0.15 0.00 0.00 0.00 0.00 0.00 0.00
Pd(II) 0.38 0.02 0.01 0.01 0.00 0.00 0.00
Rh(III) 0.01 0.01 0.01 0.01 0.01 0.01 0.01
Au(I) 0.10 0.12 0.04 0.02 0.02 0.01 0.01
%
Extraction
Pt(II) 0.00 100.00 100.00 100.00 100.00 100.00 100.00
Pd(II) 0.00 94.74 97.37 97.37 100.00 100.00 100.00
Rh(III) 0.00 0.00 0.00 0.00 0.00 0.00 0.00
Au(I) 0.00 0.00 60.00 80.00 80.00 90.00 90.00
SCREENING TEST 2 (Continued)
OPERATING CONDITIONS:
Rotational rate (rpm): 105 Temperature of the solution (°C): 25
Extraction time (hour): 72 Alkalinity level (pH): 10
[CN ] = 12.5 ppm [Cu(I)] = 18.84 ppm
[SCN ] = 3670 ppm [AC] = 20 g/L Solution volume = 500 mL Adsorbent mass = 10 g
[BMs] ppm
Time(h) Feed
2 4 8 24 48 72
Cu 18.84 12.79 11.45 9.76 3.75 0.51 0.20
Ni 18.30 1.88 1.35 1.16 0.71 0.66 0.55
Fe 47.30 44.60 43.95 45.02 47.30 47.94 47.30
%
Extraction
Cu 0.00 32.11 39.23 48.20 80.10 97.29 98.94
Ni 0.00 89.73 92.62 93.66 96.12 96.39 96.99
Fe 0.00 5.71 7.08 4.82 0.00 -1.35 0.00
Stellenbosch University http://scholar.sun.ac.za

APPENDIX A: TABULATION OF EXPERIMENTAL DATA
The extraction of precious metals from alkaline cyanided medium by granular activated carbon 114
EXPERIMENT 1
OPERATING CONDITIONS: Rotational rate (rpm): 105 Temperature of the solution (°C): 25
Extraction time (hour): 72 Alkalinity level (pH): 9.5
[CN ] = 300 ppm [Cu(I)] = 10 ppm
[SCN ] = 50 ppm [AC] = 20 g/L Solution volume = 500 mL Adsorbent mass = 10 g
[PMs] and
[BMs]
in ppb
Time (h) Feed
1 2 3 6 24 48 72
Pt(II) 150 2.57 2.48 1.99 1.96 0.638 0.95 0.95
Pd(II) 380 10.33 7.97 6.57 5.26 1.40 4.78 4.78
Au(I) 100 3.05 3.01 3.37 0.63 2.711 0.60 0.60
Cu(I) 10000 7430 7320.2 6856.8 6572.6 3551.48 3428 2142.3
Ni(II) 10000 745.14 467.26 429.75 341.5 152.43 134.1 113
%
Extraction
Pt(II) 0.00 98.29 98.35 98.67 98.69 99.57 99.37 99.37
Pd(II) 0.00 97.28 97.90 98.27 98.62 99.63 98.74 98.74
Au(I) 0.00 96.95 96.99 96.63 99.37 97.29 99.40 99.40
Cu(I) 0.00 25.70 26.80 31.43 34.27 64.49 65.72 78.58
Ni(II) 0.00 92.55 95.33 95.70 96.59 98.48 98.66 98.87
EXPERIMENT 2
OPERATING CONDITIONS: Rotational rate (rpm): 105 Temperature of the solution (°C): 25
Extraction time (hour): 72 Alkalinity level (pH): 10.75
[CN ] = 200 ppm [Cu(I)] = 55 ppm
[SCN ] = 75 ppm [AC] = 15 g/L Solution volume = 500 mL Adsorbent mass = 7.5 g
[PMs] and
[BMs]
in ppb
Time (h) Feed
1 2 3 6 24 48 72
Pt(II) 505 65.15 45.82 38.14 30.15 14.14 9.95 9.39
Pd(II) 690 120.54 87.53 73.80 58.23 29.16 21.01 19.39
Au(I) 135 2.17 1.70 1.72 1.27 0.89 0.71 0.71
Cu(I) 55000 51594 51623 52237 51910 50610.6 49386 48509
Ni(II) 55000 25984 21443 19300 16482 9530.88 7562 7135.3
%
Extraction
Pt(II) 0.00 87.10 90.93 92.45 94.03 97.20 98.03 98.14
Pd(II) 0.00 82.53 87.31 89.30 91.56 95.77 96.96 97.19
Au(I) 0.00 98.39 98.74 98.73 99.06 99.34 99.47 99.47
Cu(I) 0.00 6.19 6.14 5.02 5.62 7.98 10.21 11.80
Ni(II) 0.00 52.76 61.01 64.91 70.03 82.67 86.25 87.03
Stellenbosch University http://scholar.sun.ac.za

APPENDIX A: TABULATION OF EXPERIMENTAL DATA
The extraction of precious metals from alkaline cyanided medium by granular activated carbon 115
EXPERIMENT 3
OPERATING CONDITIONS: Rotational rate (rpm): 105 Temperature of the solution (°C): 25
Extraction time (hour): 72 Alkalinity level (pH): 12
[CN ] = 100 ppm [Cu(I)] = 100 ppm
[SCN ] = 100 ppm [AC] = 20 g/L Solution volume = 500 mL Adsorbent mass = 10 g
[PMs] and
[BMs]
in ppb
Time (h) Feed
1 2 3 6 24 48 72
Pt(II) 150 27.867 21.613 17.238 14.088 7.5596 5.967 5.292
Pd(II) 380 93.77 75.18 61.02 49.60 27.56 22.33 20.27
Au(I) 100 1.88 1.26 1.06 0.81 0.64 0.62 0.68
Cu(I) 100000 91400 91741 82875 81308 76767 69257 63924
Ni(II) 100000 49145 45459 39404 34488 23720 20384 18845
%
Extraction
Pt(II) 0.00 81.42 85.59 88.51 90.61 94.96 96.02 96.47
Pd(II) 0.00 75.32 80.22 83.94 86.95 92.75 94.12 94.67
Au(I) 0.00 98.12 98.74 98.94 99.19 99.36 99.38 99.32
Cu(I) 0.00 8.60 8.26 17.13 18.69 23.23 30.74 36.08
Ni(II) 0.00 50.85 54.54 60.60 65.51 76.28 79.62 81.16
EXPERIMENT 4
OPERATING CONDITIONS: Rotational rate (rpm): 105 Temperature of the solution (°C): 25
Extraction time (hour): 72 Alkalinity level (pH): 12
[CN ] = 300 ppm [Cu(I)] = 100 ppm
[SCN ] = 50 ppm [AC] = 10 g/L Solution volume = 500 mL Adsorbent mass = 5 g
[PMs] and
[BMs]
in ppb
Time (h) Feed
1 2 3 6 24 48 72
Pt(II) 860 428.97 285.10 242.22 208.94 129.75 98.46 103.36
Pd(II) 1000 388.62 269.75 235.51 209.63 143.71 121.7 129.24
Au(I) 170 8.2567 4.0122 2.8004 2.2164 1.6451 1.300 1.369
Cu(I) 100000 76604 64411 56775 61679 58293 51788 57183
Ni(II) 100000 58902 46969 42891 41697 34178 30468 32513
%
Extraction
Pt(II) 0.00 50.12 66.85 71.84 75.70 84.91 88.55 87.98
Pd(II) 0.00 61.14 73.02 76.45 79.04 85.63 87.83 87.08
Au(I) 0.00 95.14 97.64 98.35 98.70 99.03 99.24 99.19
Cu(I) 0.00 23.40 35.59 43.23 38.32 41.71 48.21 42.82
Ni(II) 0.00 41.10 53.03 57.11 58.30 65.82 69.53 67.49
Stellenbosch University http://scholar.sun.ac.za

APPENDIX A: TABULATION OF EXPERIMENTAL DATA
The extraction of precious metals from alkaline cyanided medium by granular activated carbon 116
EXPERIMENT 5
OPERATING CONDITIONS: Rotational rate (rpm): 105 Temperature of the solution (°C): 25
Extraction time (hour): 72 Alkalinity level (pH): 9.5
[CN ] = 100 ppm [Cu(I)] = 10 ppm
[SCN ] = 100 ppm [AC] = 10 g/L Solution volume = 500 mL Adsorbent mass = 5 g
[PMs]
and [BMs]
In
ppb
Time (h) Feed
1 2 3 6 24 48 72
Pt(II) 860 33.23 16.94 11.14 7.40 3.68 1.79 0.73
Pd(II) 1000 58.03 30.58 19.56 14.28 6.58 3.58 1.39
Au(I) 170 1.52 0.65 0.59 0.38 0.35 0.27 0.10
Cu(I) 10000 8121.96 7612.75 7421.29 6938.48 5270 2229.8 338.29
Ni(II) 10000 1491.46 907.85 629.199 473.07 228.32 114.04 42.66
%
Extraction
Pt(II) 0.00 96.14 98.03 98.70 99.14 99.57 99.79 99.92
Pd(II) 0.00 94.20 96.94 98.04 98.57 99.34 99.64 99.86
Au(I) 0.00 99.11 99.62 99.65 99.78 99.79 99.84 99.94
Cu(I) 0.00 18.78 23.87 25.79 30.62 47.30 77.70 96.62
Ni(II) 0.00 85.09 90.92 93.71 95.27 97.72 98.86 99.57
EXPERIMENT 6
OPERATING CONDITIONS: Rotational rate (rpm): 105 Temperature of the solution (°C): 25
Extraction time (hour): 72 Alkalinity level (pH): 12
[CN ] = 300 ppm [Cu(I)] = 100 ppm
[SCN ] = 100 ppm [AC] = 10 g/L Solution volume = 500 mL Adsorbent mass = 5 g
[PMs] and
[BMs]
in ppb
Time (h) Feed
1 2 3 6 24 48 72
Pt(II) 150 20.16 13.53 12.18 8.83 4.22 3.30 3.12
Pd(II) 380 219.72 131.61 111.94 82.21 41.77 31.43 29.15
Au(I) 100 15.92 9.33 7.97 6.31 3.89 3.14 2.80
Cu(I) 100000 88670 90411 88283 86653 81312 80887 78155
Ni(II) 10000 3821.3 3056.97 2737.30 2242.18 1357.6 1189.6 1170.1
%
Extraction
Pt(II) 0.00 86.56 90.98 91.88 94.11 97.19 97.80 97.92
Pd(II) 0.00 42.18 65.37 70.54 78.37 89.01 91.73 92.33
Au(I) 0.00 84.08 90.67 92.03 93.69 96.11 96.86 97.20
Cu(I) 0.00 11.33 9.59 11.72 13.35 18.69 19.11 21.85
Ni(II) 0.00 61.79 69.43 72.63 77.58 86.42 88.10 88.30
Stellenbosch University http://scholar.sun.ac.za

APPENDIX A: TABULATION OF EXPERIMENTAL DATA
The extraction of precious metals from alkaline cyanided medium by granular activated carbon 117
EXPERIMENT 7
OPERATING CONDITIONS: Rotational rate (rpm): 105 Temperature of the solution (°C): 25
Extraction time (hour): 72 Alkalinity level (pH): 12
[CN ] = 100 ppm [Cu(I)] = 100 ppm
[SCN ] = 50 ppm [AC] = 20 g/L Solution volume = 500 mL Adsorbent mass = 10 g
[PMs] and
[BMs]
in ppb
Time (h) Feed
1 2 3 6 24 48 72
Pt(II) 860 20.64 13.86 9.56 9.11 3.82 2.77 1.85
Pd(II) 1000 37.36 24.24 18.11 16.03 7.06 5.18 3.62
Au(I) 170 1.88 1.07 2.711 0.36 0.39 2.711 2.711
Cu(I) 100000 82930 73234 51713 68686.17 56431.4 33647 25754.4
Ni(II) 10000 1331.6 909.71 592.49 668.33 331.91 223.64 172.13
%
Extraction
Pt(II) 0.00 97.60 98.39 98.89 98.94 99.56 99.68 99.78
Pd(II) 0.00 96.26 97.58 98.19 98.40 99.29 99.48 99.64
Au(I) 0.00 98.89 99.37 98.41 99.79 99.77 98.41 98.41
Cu(I) 0.00 17.07 26.77 48.29 31.31 43.57 66.35 74.25
Ni(II) 0.00 86.68 90.90 94.08 93.32 96.68 97.76 98.28
EXPERIMENT 8
OPERATING CONDITIONS: Rotational rate (rpm): 105 Temperature of the solution (°C): 25
Extraction time (hour): 72 Alkalinity level (pH): 9.5
[CN ] = 100 ppm [Cu(I)] = 10 ppm
[SCN ] = 50 ppm [AC] = 10 g/L Solution volume = 500 mL Adsorbent mass = 5 g
[PMs] and
[BMs]
in ppb
Time (h) Feed
1 2 3 6 24 48 72
Pt(II) 150 48.90 38.32 29.32 23.32 15.12 13.28 11.21
Pd(II) 380 234.16 194.82 147.59 122.45 83.79 72.59 63.03
Au(I) 100 4.57 2.94 2.06 1.68 1.41 1.38 1.17
Cu(I) 10000 9245 9654 8956 9204 8942 9292 8966
Ni(II) 100000 62878 56190 51199 46261.19 36723.8 33999 32329
%
Extraction
Pt(II) 0.00 67.40 74.45 80.45 84.45 89.92 91.15 92.53
Pd(II) 0.00 38.38 48.73 61.16 67.78 77.95 80.90 83.41
Au(I) 0.00 95.43 97.06 97.94 98.32 98.59 98.62 98.83
Cu(I) 0.00 7.55 3.46 10.44 7.96 10.58 7.08 10.34
Ni(II) 0.00 37.12 43.81 48.80 53.74 63.28 66.00 67.67
Stellenbosch University http://scholar.sun.ac.za
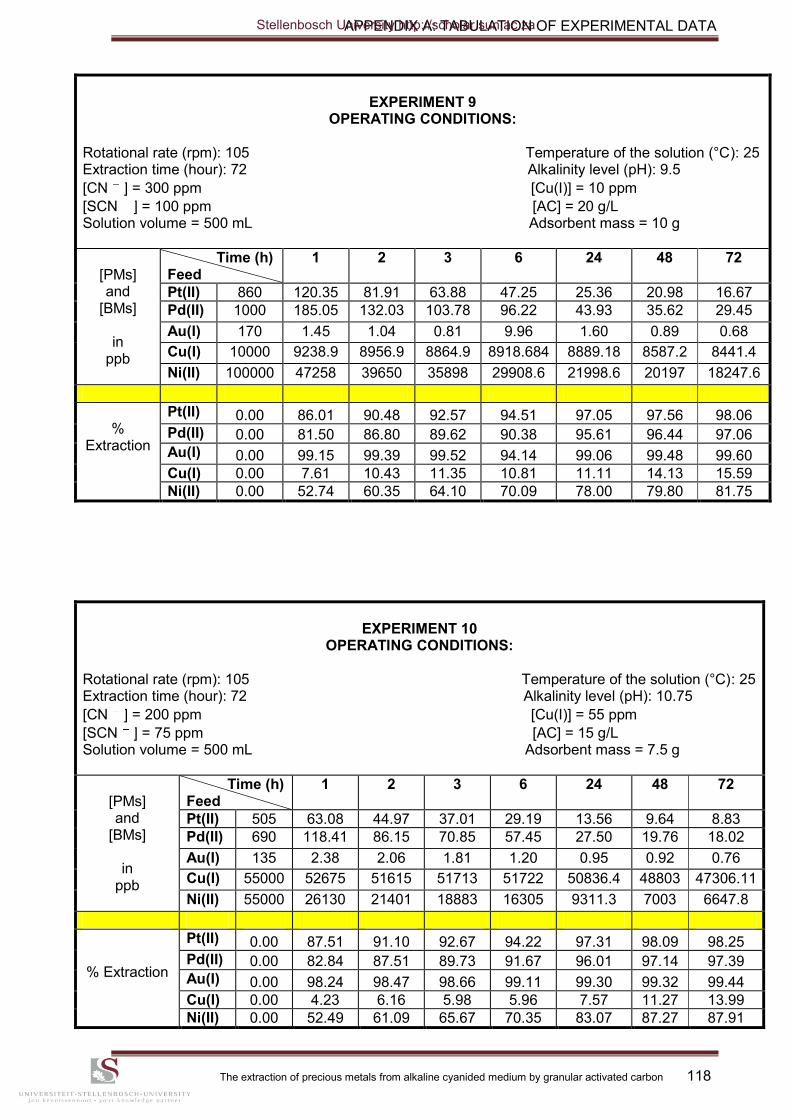
APPENDIX A: TABULATION OF EXPERIMENTAL DATA
The extraction of precious metals from alkaline cyanided medium by granular activated carbon 118
EXPERIMENT 9
OPERATING CONDITIONS: Rotational rate (rpm): 105 Temperature of the solution (°C): 25
Extraction time (hour): 72 Alkalinity level (pH): 9.5
[CN ] = 300 ppm [Cu(I)] = 10 ppm
[SCN ] = 100 ppm [AC] = 20 g/L Solution volume = 500 mL Adsorbent mass = 10 g
[PMs] and
[BMs]
in ppb
Time (h) Feed
1 2 3 6 24 48 72
Pt(II) 860 120.35 81.91 63.88 47.25 25.36 20.98 16.67
Pd(II) 1000 185.05 132.03 103.78 96.22 43.93 35.62 29.45
Au(I) 170 1.45 1.04 0.81 9.96 1.60 0.89 0.68
Cu(I) 10000 9238.9 8956.9 8864.9 8918.684 8889.18 8587.2 8441.4
Ni(II) 100000 47258 39650 35898 29908.6 21998.6 20197 18247.6
%
Extraction
Pt(II) 0.00 86.01 90.48 92.57 94.51 97.05 97.56 98.06
Pd(II) 0.00 81.50 86.80 89.62 90.38 95.61 96.44 97.06
Au(I) 0.00 99.15 99.39 99.52 94.14 99.06 99.48 99.60
Cu(I) 0.00 7.61 10.43 11.35 10.81 11.11 14.13 15.59
Ni(II) 0.00 52.74 60.35 64.10 70.09 78.00 79.80 81.75
EXPERIMENT 10
OPERATING CONDITIONS: Rotational rate (rpm): 105 Temperature of the solution (°C): 25
Extraction time (hour): 72 Alkalinity level (pH): 10.75
[CN ] = 200 ppm [Cu(I)] = 55 ppm
[SCN ] = 75 ppm [AC] = 15 g/L Solution volume = 500 mL Adsorbent mass = 7.5 g
[PMs] and
[BMs]
in ppb
Time (h) Feed
1 2 3 6 24 48 72
Pt(II) 505 63.08 44.97 37.01 29.19 13.56 9.64 8.83
Pd(II) 690 118.41 86.15 70.85 57.45 27.50 19.76 18.02
Au(I) 135 2.38 2.06 1.81 1.20 0.95 0.92 0.76
Cu(I) 55000 52675 51615 51713 51722 50836.4 48803 47306.11
Ni(II) 55000 26130 21401 18883 16305 9311.3 7003 6647.8
% Extraction
Pt(II) 0.00 87.51 91.10 92.67 94.22 97.31 98.09 98.25
Pd(II) 0.00 82.84 87.51 89.73 91.67 96.01 97.14 97.39
Au(I) 0.00 98.24 98.47 98.66 99.11 99.30 99.32 99.44
Cu(I) 0.00 4.23 6.16 5.98 5.96 7.57 11.27 13.99
Ni(II) 0.00 52.49 61.09 65.67 70.35 83.07 87.27 87.91
Stellenbosch University http://scholar.sun.ac.za

APPENDIX A: TABULATION OF EXPERIMENTAL DATA
The extraction of precious metals from alkaline cyanided medium by granular activated carbon 119
EXPERIMENT 11
OPERATING CONDITIONS: Rotational rate (rpm): 105 Temperature of the solution (°C): 25
Extraction time (hour): 72 Alkalinity level (pH): 12
[CN ] = 300 ppm [Cu(I)] = 10 ppm
[SCN ] = 100 ppm [AC] = 10 g/L Solution volume = 500 mL Adsorbent mass = 5 g
[PMs] and
[BMs]
in ppb
Time (h) Feed
1 2 3 6 24 48 72
Pt(II) 150 60.99 45.12 44.33 36.57 21.02 18.14 15.75
Pd(II) 380 134.4 104.8 104.8 89.1 52.1 44.5 40.9
Au(I) 100 4.78 2.88 1.62 1.253 1.303 1.6 0.75
Cu(I) 10000 6804.8 6628.3 7321.8 7064.03 6450.82 6644.7 6013.6
Ni(II) 100000 66763 60384 57876 55137 41354 38948 40028
%
Extraction
Pt(II) 0.00 59.34 69.92 70.45 75.62 85.99 87.91 89.50
Pd(II) 0.00 64.64 72.43 72.41 76.55 86.29 88.30 89.24
Au(I) 0.00 95.23 97.13 98.38 98.75 98.70 98.40 99.25
Cu(I) 0.00 31.95 33.72 26.78 29.36 35.49 33.55 39.86
Ni(II) 0.00 33.24 39.62 42.12 44.86 58.65 61.05 59.97
EXPERIMENT 12
OPERATING CONDITIONS: Rotational rate (rpm): 105 Temperature of the solution (°C): 25
Extraction time (hour): 72 Alkalinity level (pH): 9.5
[CN ] = 300 ppm [Cu(I)] = 100 ppm
[SCN ] = 100 ppm [AC] = 20 g/L Solution volume = 500 mL Adsorbent mass = 10 g
[PMs] and
[BMs]
in ppb
Time (h) Feed
1 2 3 6 24 48 72
Pt(II) 860 23.35 14.93 14.18 10.87 7 6.18 5.09
Pd(II) 1000 41.58 26.66 25.51 19.51 9 11.97 9.87
Au(I) 170 1.20 2.71 0.56 0.72 7 0.59 0.13
Cu(I) 100000 87783 58223.62 88263 82586 49348.6 75908 70903.6
Ni(II) 10000 1381 815.72 923.25 750.64 340.4 476.55 426.08
%
Extraction
Pt(II) 0.00 97.28 98.26 98.35 98.74 99.19 99.28 99.41
Pd(II) 0.00 95.84 97.33 97.45 98.05 99.10 98.80 99.01
Au(I) 0.00 99.29 98.41 99.67 99.58 95.88 99.65 99.92
Cu(I) 0.00 12.22 41.78 11.73 17.41 50.65 24.09 29.10
Ni(II) 0.00 86.19 91.84 90.77 92.49 96.60 95.23 95.74
Stellenbosch University http://scholar.sun.ac.za
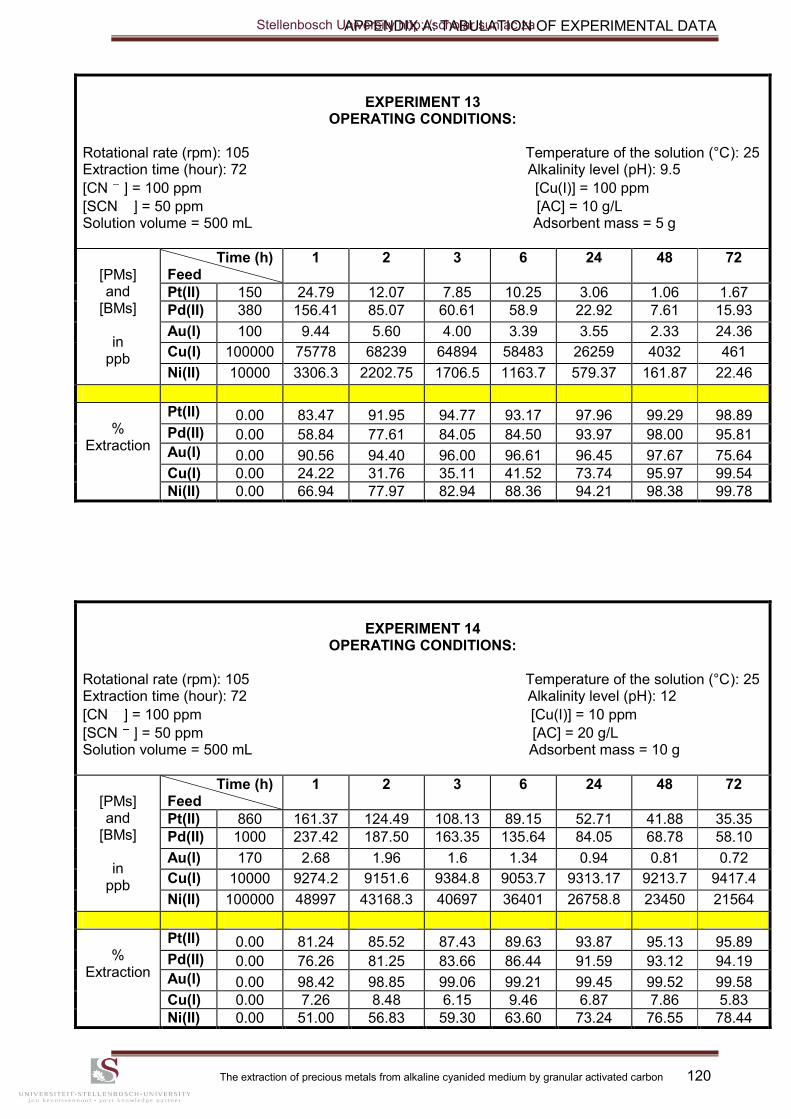
APPENDIX A: TABULATION OF EXPERIMENTAL DATA
The extraction of precious metals from alkaline cyanided medium by granular activated carbon 120
EXPERIMENT 13
OPERATING CONDITIONS: Rotational rate (rpm): 105 Temperature of the solution (°C): 25
Extraction time (hour): 72 Alkalinity level (pH): 9.5
[CN ] = 100 ppm [Cu(I)] = 100 ppm
[SCN ] = 50 ppm [AC] = 10 g/L Solution volume = 500 mL Adsorbent mass = 5 g
[PMs] and
[BMs]
in ppb
Time (h) Feed
1 2 3 6 24 48 72
Pt(II) 150 24.79 12.07 7.85 10.25 3.06 1.06 1.67
Pd(II) 380 156.41 85.07 60.61 58.9 22.92 7.61 15.93
Au(I) 100 9.44 5.60 4.00 3.39 3.55 2.33 24.36
Cu(I) 100000 75778 68239 64894 58483 26259 4032 461
Ni(II) 10000 3306.3 2202.75 1706.5 1163.7 579.37 161.87 22.46
%
Extraction
Pt(II) 0.00 83.47 91.95 94.77 93.17 97.96 99.29 98.89
Pd(II) 0.00 58.84 77.61 84.05 84.50 93.97 98.00 95.81
Au(I) 0.00 90.56 94.40 96.00 96.61 96.45 97.67 75.64
Cu(I) 0.00 24.22 31.76 35.11 41.52 73.74 95.97 99.54
Ni(II) 0.00 66.94 77.97 82.94 88.36 94.21 98.38 99.78
EXPERIMENT 14
OPERATING CONDITIONS: Rotational rate (rpm): 105 Temperature of the solution (°C): 25
Extraction time (hour): 72 Alkalinity level (pH): 12
[CN ] = 100 ppm [Cu(I)] = 10 ppm
[SCN ] = 50 ppm [AC] = 20 g/L Solution volume = 500 mL Adsorbent mass = 10 g
[PMs] and
[BMs]
in ppb
Time (h) Feed
1 2 3 6 24 48 72
Pt(II) 860 161.37 124.49 108.13 89.15 52.71 41.88 35.35
Pd(II) 1000 237.42 187.50 163.35 135.64 84.05 68.78 58.10
Au(I) 170 2.68 1.96 1.6 1.34 0.94 0.81 0.72
Cu(I) 10000 9274.2 9151.6 9384.8 9053.7 9313.17 9213.7 9417.4
Ni(II) 100000 48997 43168.3 40697 36401 26758.8 23450 21564
%
Extraction
Pt(II) 0.00 81.24 85.52 87.43 89.63 93.87 95.13 95.89
Pd(II) 0.00 76.26 81.25 83.66 86.44 91.59 93.12 94.19
Au(I) 0.00 98.42 98.85 99.06 99.21 99.45 99.52 99.58
Cu(I) 0.00 7.26 8.48 6.15 9.46 6.87 7.86 5.83
Ni(II) 0.00 51.00 56.83 59.30 63.60 73.24 76.55 78.44
Stellenbosch University http://scholar.sun.ac.za
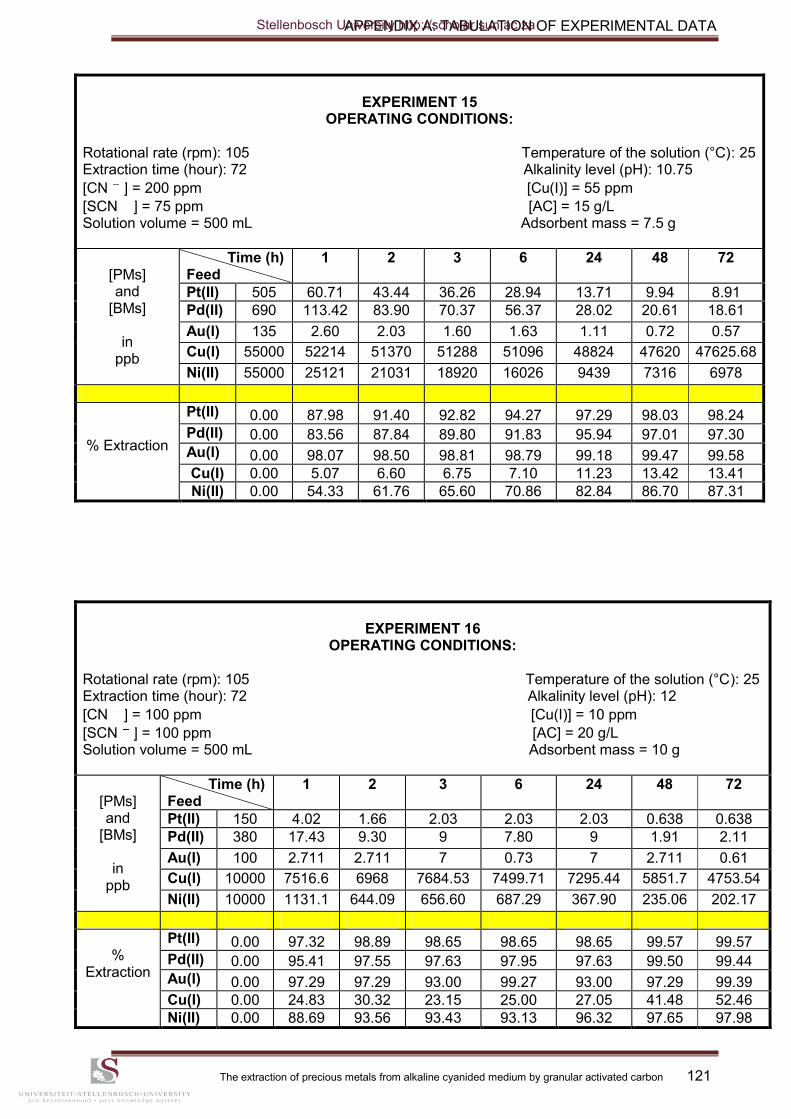
APPENDIX A: TABULATION OF EXPERIMENTAL DATA
The extraction of precious metals from alkaline cyanided medium by granular activated carbon 121
EXPERIMENT 15
OPERATING CONDITIONS: Rotational rate (rpm): 105 Temperature of the solution (°C): 25
Extraction time (hour): 72 Alkalinity level (pH): 10.75
[CN ] = 200 ppm [Cu(I)] = 55 ppm
[SCN ] = 75 ppm [AC] = 15 g/L Solution volume = 500 mL Adsorbent mass = 7.5 g
[PMs] and
[BMs]
in ppb
Time (h) Feed
1 2 3 6 24 48 72
Pt(II) 505 60.71 43.44 36.26 28.94 13.71 9.94 8.91
Pd(II) 690 113.42 83.90 70.37 56.37 28.02 20.61 18.61
Au(I) 135 2.60 2.03 1.60 1.63 1.11 0.72 0.57
Cu(I) 55000 52214 51370 51288 51096 48824 47620 47625.68
Ni(II) 55000 25121 21031 18920 16026 9439 7316 6978
% Extraction
Pt(II) 0.00 87.98 91.40 92.82 94.27 97.29 98.03 98.24
Pd(II) 0.00 83.56 87.84 89.80 91.83 95.94 97.01 97.30
Au(I) 0.00 98.07 98.50 98.81 98.79 99.18 99.47 99.58
Cu(I) 0.00 5.07 6.60 6.75 7.10 11.23 13.42 13.41
Ni(II) 0.00 54.33 61.76 65.60 70.86 82.84 86.70 87.31
EXPERIMENT 16
OPERATING CONDITIONS: Rotational rate (rpm): 105 Temperature of the solution (°C): 25
Extraction time (hour): 72 Alkalinity level (pH): 12
[CN ] = 100 ppm [Cu(I)] = 10 ppm
[SCN ] = 100 ppm [AC] = 20 g/L Solution volume = 500 mL Adsorbent mass = 10 g
[PMs] and
[BMs]
in ppb
Time (h) Feed
1 2 3 6 24 48 72
Pt(II) 150 4.02 1.66 2.03 2.03 2.03 0.638 0.638
Pd(II) 380 17.43 9.30 9 7.80 9 1.91 2.11
Au(I) 100 2.711 2.711 7 0.73 7 2.711 0.61
Cu(I) 10000 7516.6 6968 7684.53 7499.71 7295.44 5851.7 4753.54
Ni(II) 10000 1131.1 644.09 656.60 687.29 367.90 235.06 202.17
%
Extraction
Pt(II) 0.00 97.32 98.89 98.65 98.65 98.65 99.57 99.57
Pd(II) 0.00 95.41 97.55 97.63 97.95 97.63 99.50 99.44
Au(I) 0.00 97.29 97.29 93.00 99.27 93.00 97.29 99.39
Cu(I) 0.00 24.83 30.32 23.15 25.00 27.05 41.48 52.46
Ni(II) 0.00 88.69 93.56 93.43 93.13 96.32 97.65 97.98
Stellenbosch University http://scholar.sun.ac.za
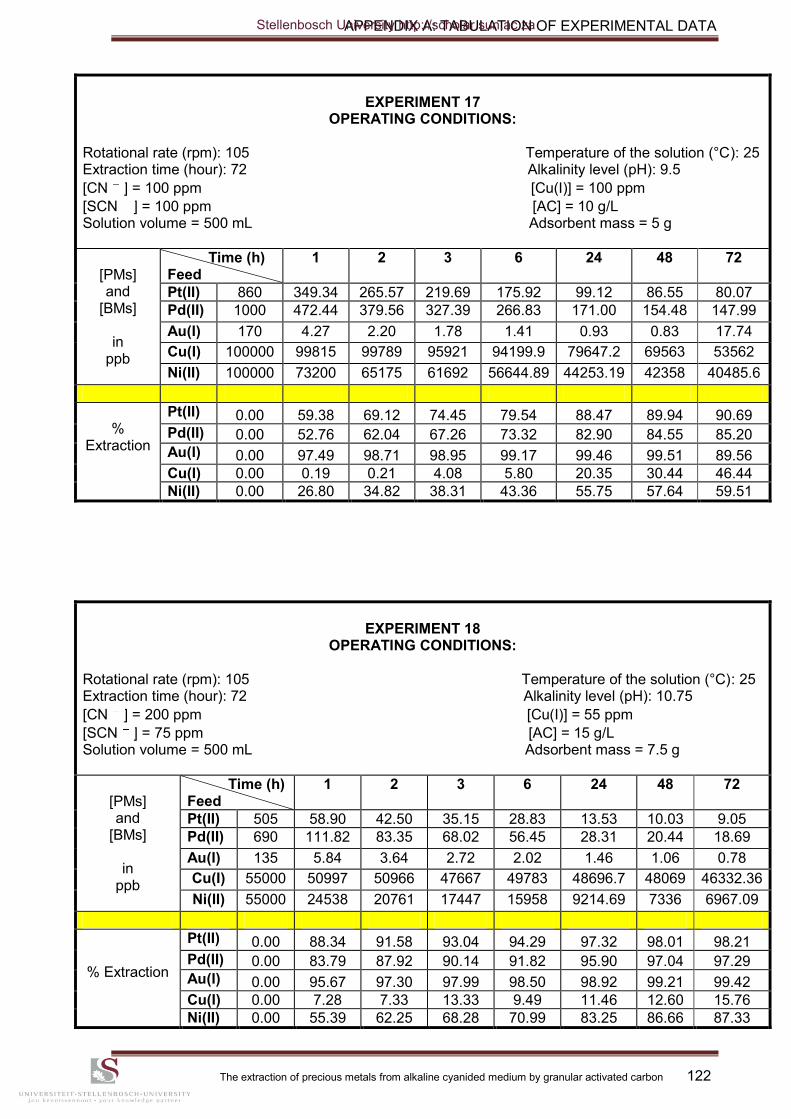
APPENDIX A: TABULATION OF EXPERIMENTAL DATA
The extraction of precious metals from alkaline cyanided medium by granular activated carbon 122
EXPERIMENT 17
OPERATING CONDITIONS: Rotational rate (rpm): 105 Temperature of the solution (°C): 25
Extraction time (hour): 72 Alkalinity level (pH): 9.5
[CN ] = 100 ppm [Cu(I)] = 100 ppm
[SCN ] = 100 ppm [AC] = 10 g/L Solution volume = 500 mL Adsorbent mass = 5 g
[PMs] and
[BMs]
in ppb
Time (h) Feed
1 2 3 6 24 48 72
Pt(II) 860 349.34 265.57 219.69 175.92 99.12 86.55 80.07
Pd(II) 1000 472.44 379.56 327.39 266.83 171.00 154.48 147.99
Au(I) 170 4.27 2.20 1.78 1.41 0.93 0.83 17.74
Cu(I) 100000 99815 99789 95921 94199.9 79647.2 69563 53562
Ni(II) 100000 73200 65175 61692 56644.89 44253.19 42358 40485.6
%
Extraction
Pt(II) 0.00 59.38 69.12 74.45 79.54 88.47 89.94 90.69
Pd(II) 0.00 52.76 62.04 67.26 73.32 82.90 84.55 85.20
Au(I) 0.00 97.49 98.71 98.95 99.17 99.46 99.51 89.56
Cu(I) 0.00 0.19 0.21 4.08 5.80 20.35 30.44 46.44
Ni(II) 0.00 26.80 34.82 38.31 43.36 55.75 57.64 59.51
EXPERIMENT 18
OPERATING CONDITIONS: Rotational rate (rpm): 105 Temperature of the solution (°C): 25
Extraction time (hour): 72 Alkalinity level (pH): 10.75
[CN ] = 200 ppm [Cu(I)] = 55 ppm
[SCN ] = 75 ppm [AC] = 15 g/L Solution volume = 500 mL Adsorbent mass = 7.5 g
[PMs] and
[BMs]
in ppb
Time (h) Feed
1 2 3 6 24 48 72
Pt(II) 505 58.90 42.50 35.15 28.83 13.53 10.03 9.05
Pd(II) 690 111.82 83.35 68.02 56.45 28.31 20.44 18.69
Au(I) 135 5.84 3.64 2.72 2.02 1.46 1.06 0.78
Cu(I) 55000 50997 50966 47667 49783 48696.7 48069 46332.36
Ni(II) 55000 24538 20761 17447 15958 9214.69 7336 6967.09
% Extraction
Pt(II) 0.00 88.34 91.58 93.04 94.29 97.32 98.01 98.21
Pd(II) 0.00 83.79 87.92 90.14 91.82 95.90 97.04 97.29
Au(I) 0.00 95.67 97.30 97.99 98.50 98.92 99.21 99.42
Cu(I) 0.00 7.28 7.33 13.33 9.49 11.46 12.60 15.76
Ni(II) 0.00 55.39 62.25 68.28 70.99 83.25 86.66 87.33
Stellenbosch University http://scholar.sun.ac.za
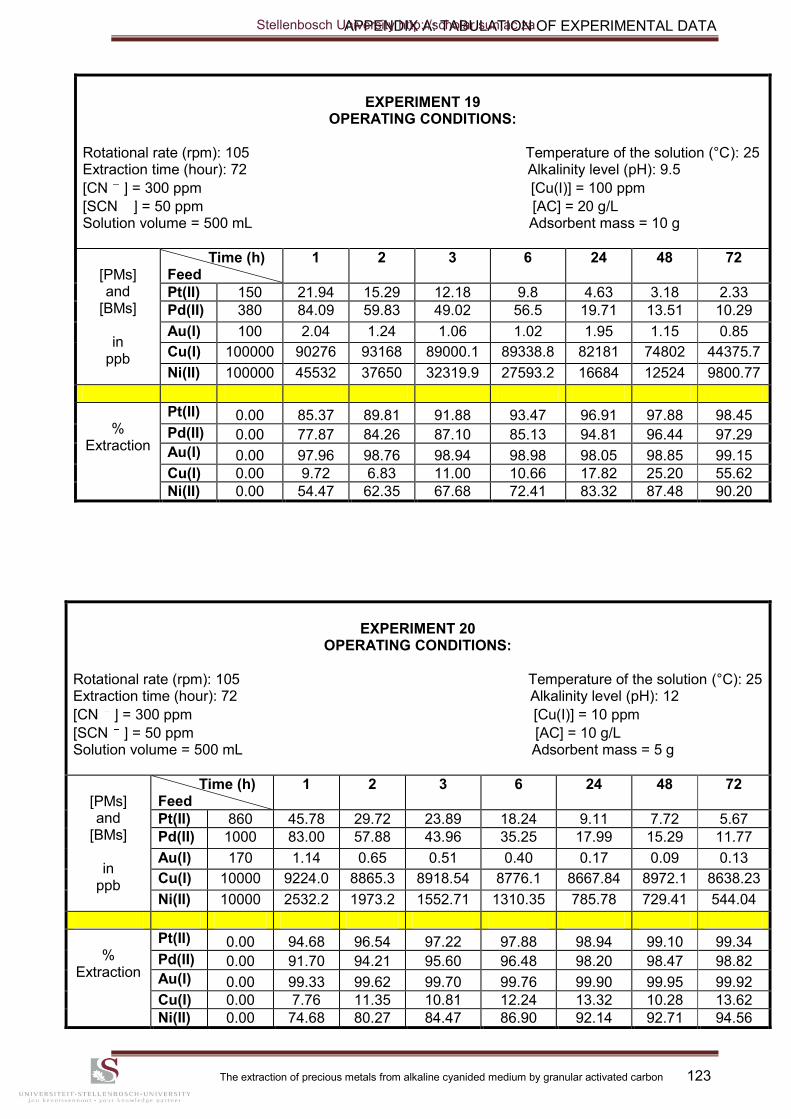
APPENDIX A: TABULATION OF EXPERIMENTAL DATA
The extraction of precious metals from alkaline cyanided medium by granular activated carbon 123
EXPERIMENT 19
OPERATING CONDITIONS: Rotational rate (rpm): 105 Temperature of the solution (°C): 25
Extraction time (hour): 72 Alkalinity level (pH): 9.5
[CN ] = 300 ppm [Cu(I)] = 100 ppm
[SCN ] = 50 ppm [AC] = 20 g/L Solution volume = 500 mL Adsorbent mass = 10 g
[PMs] and
[BMs]
in ppb
Time (h) Feed
1 2 3 6 24 48 72
Pt(II) 150 21.94 15.29 12.18 9.8 4.63 3.18 2.33
Pd(II) 380 84.09 59.83 49.02 56.5 19.71 13.51 10.29
Au(I) 100 2.04 1.24 1.06 1.02 1.95 1.15 0.85
Cu(I) 100000 90276 93168 89000.1 89338.8 82181 74802 44375.7
Ni(II) 100000 45532 37650 32319.9 27593.2 16684 12524 9800.77
%
Extraction
Pt(II) 0.00 85.37 89.81 91.88 93.47 96.91 97.88 98.45
Pd(II) 0.00 77.87 84.26 87.10 85.13 94.81 96.44 97.29
Au(I) 0.00 97.96 98.76 98.94 98.98 98.05 98.85 99.15
Cu(I) 0.00 9.72 6.83 11.00 10.66 17.82 25.20 55.62
Ni(II) 0.00 54.47 62.35 67.68 72.41 83.32 87.48 90.20
EXPERIMENT 20
OPERATING CONDITIONS: Rotational rate (rpm): 105 Temperature of the solution (°C): 25
Extraction time (hour): 72 Alkalinity level (pH): 12
[CN ] = 300 ppm [Cu(I)] = 10 ppm
[SCN ] = 50 ppm [AC] = 10 g/L Solution volume = 500 mL Adsorbent mass = 5 g
[PMs] and
[BMs]
in ppb
Time (h) Feed
1 2 3 6 24 48 72
Pt(II) 860 45.78 29.72 23.89 18.24 9.11 7.72 5.67
Pd(II) 1000 83.00 57.88 43.96 35.25 17.99 15.29 11.77
Au(I) 170 1.14 0.65 0.51 0.40 0.17 0.09 0.13
Cu(I) 10000 9224.0 8865.3 8918.54 8776.1 8667.84 8972.1 8638.23
Ni(II) 10000 2532.2 1973.2 1552.71 1310.35 785.78 729.41 544.04
%
Extraction
Pt(II) 0.00 94.68 96.54 97.22 97.88 98.94 99.10 99.34
Pd(II) 0.00 91.70 94.21 95.60 96.48 98.20 98.47 98.82
Au(I) 0.00 99.33 99.62 99.70 99.76 99.90 99.95 99.92
Cu(I) 0.00 7.76 11.35 10.81 12.24 13.32 10.28 13.62
Ni(II) 0.00 74.68 80.27 84.47 86.90 92.14 92.71 94.56
Stellenbosch University http://scholar.sun.ac.za
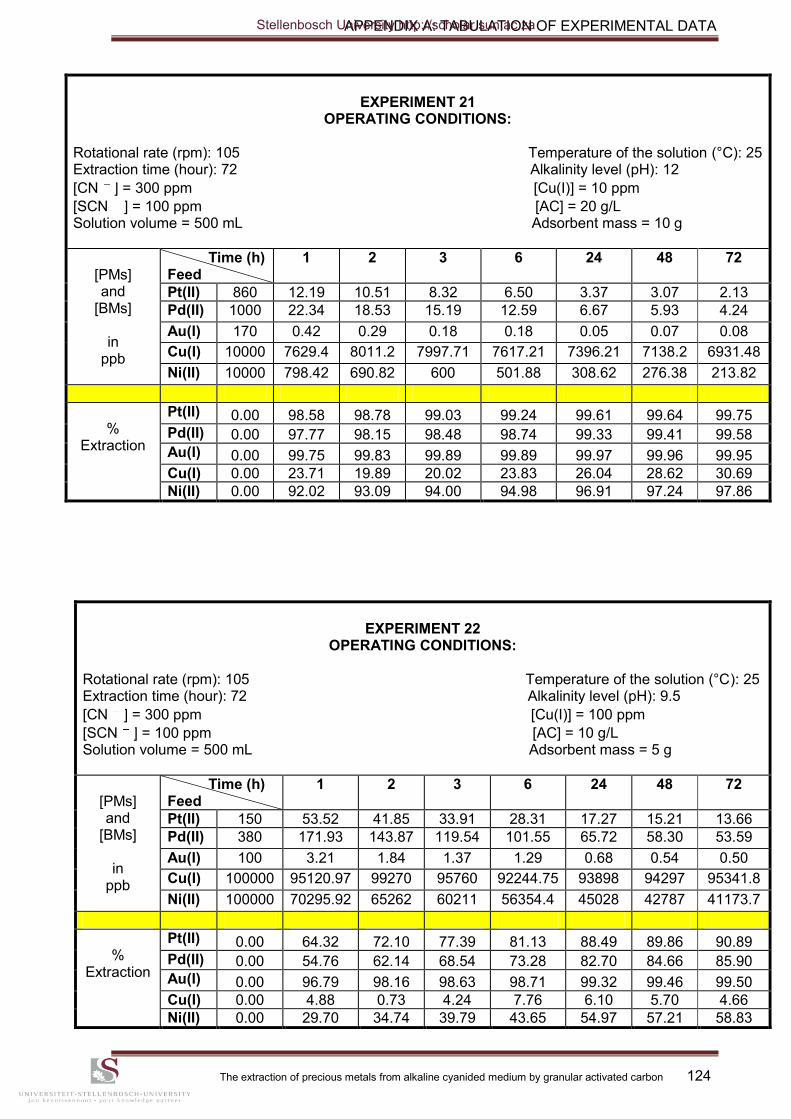
APPENDIX A: TABULATION OF EXPERIMENTAL DATA
The extraction of precious metals from alkaline cyanided medium by granular activated carbon 124
EXPERIMENT 21
OPERATING CONDITIONS: Rotational rate (rpm): 105 Temperature of the solution (°C): 25
Extraction time (hour): 72 Alkalinity level (pH): 12
[CN ] = 300 ppm [Cu(I)] = 10 ppm
[SCN ] = 100 ppm [AC] = 20 g/L Solution volume = 500 mL Adsorbent mass = 10 g
[PMs] and
[BMs]
in ppb
Time (h) Feed
1 2 3 6 24 48 72
Pt(II) 860 12.19 10.51 8.32 6.50 3.37 3.07 2.13
Pd(II) 1000 22.34 18.53 15.19 12.59 6.67 5.93 4.24
Au(I) 170 0.42 0.29 0.18 0.18 0.05 0.07 0.08
Cu(I) 10000 7629.4 8011.2 7997.71 7617.21 7396.21 7138.2 6931.48
Ni(II) 10000 798.42 690.82 600 501.88 308.62 276.38 213.82
%
Extraction
Pt(II) 0.00 98.58 98.78 99.03 99.24 99.61 99.64 99.75
Pd(II) 0.00 97.77 98.15 98.48 98.74 99.33 99.41 99.58
Au(I) 0.00 99.75 99.83 99.89 99.89 99.97 99.96 99.95
Cu(I) 0.00 23.71 19.89 20.02 23.83 26.04 28.62 30.69
Ni(II) 0.00 92.02 93.09 94.00 94.98 96.91 97.24 97.86
EXPERIMENT 22
OPERATING CONDITIONS: Rotational rate (rpm): 105 Temperature of the solution (°C): 25
Extraction time (hour): 72 Alkalinity level (pH): 9.5
[CN ] = 300 ppm [Cu(I)] = 100 ppm
[SCN ] = 100 ppm [AC] = 10 g/L Solution volume = 500 mL Adsorbent mass = 5 g
[PMs] and
[BMs]
in ppb
Time (h) Feed
1 2 3 6 24 48 72
Pt(II) 150 53.52 41.85 33.91 28.31 17.27 15.21 13.66
Pd(II) 380 171.93 143.87 119.54 101.55 65.72 58.30 53.59
Au(I) 100 3.21 1.84 1.37 1.29 0.68 0.54 0.50
Cu(I) 100000 95120.97 99270 95760 92244.75 93898 94297 95341.8
Ni(II) 100000 70295.92 65262 60211 56354.4 45028 42787 41173.7
%
Extraction
Pt(II) 0.00 64.32 72.10 77.39 81.13 88.49 89.86 90.89
Pd(II) 0.00 54.76 62.14 68.54 73.28 82.70 84.66 85.90
Au(I) 0.00 96.79 98.16 98.63 98.71 99.32 99.46 99.50
Cu(I) 0.00 4.88 0.73 4.24 7.76 6.10 5.70 4.66
Ni(II) 0.00 29.70 34.74 39.79 43.65 54.97 57.21 58.83
Stellenbosch University http://scholar.sun.ac.za

APPENDIX A: TABULATION OF EXPERIMENTAL DATA
The extraction of precious metals from alkaline cyanided medium by granular activated carbon 125
EXPERIMENT 23
OPERATING CONDITIONS: Rotational rate (rpm): 105 Temperature of the solution (°C): 25
Extraction time (hour): 72 Alkalinity level (pH): 12
[CN ] = 100 ppm [Cu(I)] = 10 ppm
[SCN ] = 50 ppm [AC] = 10 g/L Solution volume = 500 mL Adsorbent mass = 5 g
[PMs] and
[BMs]
in ppb
Time (h) Feed
1 2 3 6 24 48 72
Pt(II) 150 16.42 10.51 9.31 7.36 2.54 3.52 2.64
Pd(II) 380 70.3 41.01 38.28 28.9 13.37 13.32 12.92
Au(I) 100 2.711 2.41 4.79 1.17 2.711 0.48 0.82
Cu(I) 10000 8799.3 7182.3 6781.3 5563 1973.3 1677.3 570.34
Ni(II) 10000 3382 3104 2889.9 2454.9 1105.4 1245 944.1
%
Extraction
Pt(II) 0.00 89.05 92.99 93.79 95.09 98.31 97.65 98.24
Pd(II) 0.00 81.50 89.21 89.93 92.39 96.48 96.49 96.60
Au(I) 0.00 97.29 97.59 95.21 98.83 97.29 99.52 99.18
Cu(I) 0.00 12.01 28.18 32.19 44.37 80.27 83.23 94.30
Ni(II) 0.00 66.18 68.96 71.10 75.45 88.95 87.55 90.56
EXPERIMENT 24
OPERATING CONDITIONS: Rotational rate (rpm): 105 Temperature of the solution (°C): 25
Extraction time (hour): 72 Alkalinity level (pH): 10.75
[CN ] = 200 ppm [Cu(I)] = 55 ppm
[SCN ] = 75 ppm [AC] = 15 g/L Solution volume = 500 mL Adsorbent mass = 7.5 g
[PMs] and
[BMs]
in ppb
Time (h) Feed
1 2 3 6 24 48 72
Pt(II) 510 60.43 33.92 29.95 21.46 11.02 6.20 3.91
Pd(II) 690 110.77 65.95 56.53 40.85 21.70 11.94 7.29
Au(I) 135 7.36 3.26 2.40 1.83 1.25 1.15 0.93
Cu(I) 55000 51584 51503 52237 51950 50820.6 49596 48309
Ni(II) 55000 25984 21443 19300 16482 9530.88 7562 7325.3
% Extraction
Pt(II) 0.00 88.15 93.35 94.13 95.79 97.84 98.78 99.23
Pd(II) 0.00 83.95 90.44 91.81 94.08 96.86 98.27 98.94
Au(I) 0.00 94.55 97.59 98.22 98.64 99.07 99.15 99.31
Cu(I) 0.00 6.21 6.36 5.02 5.55 7.60 9.83 12.17
Ni(II) 0.00 52.76 61.01 64.91 70.03 82.67 86.25 86.68
Stellenbosch University http://scholar.sun.ac.za

APPENDIX A: TABULATION OF EXPERIMENTAL DATA
The extraction of precious metals from alkaline cyanided medium by granular activated carbon 126
EXPERIMENT 25
OPERATING CONDITIONS: Rotational rate (rpm): 105 Temperature of the solution (°C): 25
Extraction time (hour): 72 Alkalinity level (pH): 9.5
[CN ] = 100 ppm [Cu(I)] = 100 ppm
[SCN ] = 50 ppm [AC] = 20 g/L Solution volume = 500 mL Adsorbent mass = 10 g
[PMs] and
[BMs]
in ppb
Time (h) Feed
1 2 3 6 24 48 72
Pt(II) 860 147.08 95.96 75.72 54.36 24.66 18.46 13.97
Pd(II) 1000 231.61 156.85 125.93 93.27 47.48 37.20 29.34
Au(I) 170 3.22 1.93 1.47 1.17 0.85 0.80 0.55
Cu(I) 100000 88338 82434 80247 73002 46715 23240 10561
Ni(II) 100000 46528 37861 32332 26131 15434 12252 10293
%
Extraction
Pt(II) 0.00 82.90 88.84 91.20 93.68 97.13 97.85 98.38
Pd(II) 0.00 76.84 84.32 87.41 90.67 95.25 96.28 97.07
Au(I) 0.00 98.11 98.86 99.14 99.31 99.50 99.53 99.68
Cu(I) 0.00 11.66 17.57 19.75 27.00 53.29 76.76 89.44
Ni(II) 0.00 53.47 62.14 67.67 73.87 84.57 87.75 89.71
EXPERIMENT 26
OPERATING CONDITIONS: Rotational rate (rpm): 105 Temperature of the solution (°C): 25
Extraction time (hour): 72 Alkalinity level (pH): 10.75
[CN ] = 200 ppm [Cu(I)] = 55 ppm
[SCN ] = 75 ppm [AC] = 15 g/L Solution volume = 500 mL Adsorbent mass = 7.5 g
[PMs] and
[BMs]
in ppb
Time (h) Feed
1 2 3 6 24 48 72
Pt(II) 510 52.17 32.40 27.14 19.28 10.51 5.63 3.86
Pd(II) 690 97.12 62.40 51.84 36.95 20.62 11.12 7.07
Au(I) 135 2.69 2.31 1.84 1.71 1.47 1.25 1.28
Cu(I) 55000 52605 51600 51203 51722 50836.4 48803 47246.11
Ni(II) 55000 24130 21391 18883 16315 9210.3 7099 6587.8
% Extraction
Pt(II) 0.00 89.77 93.65 94.68 96.22 97.94 98.90 99.24
Pd(II) 0.00 85.92 90.96 92.49 94.64 97.01 98.39 98.98
Au(I) 0.00 98.01 98.29 98.64 98.73 98.91 99.07 99.05
Cu(I) 0.00 4.35 6.18 6.90 5.96 7.57 11.27 14.10
Ni(II) 0.00 56.13 61.11 65.67 70.34 83.25 87.09 88.02
Stellenbosch University http://scholar.sun.ac.za

APPENDIX A: TABULATION OF EXPERIMENTAL DATA
The extraction of precious metals from alkaline cyanided medium by granular activated carbon 127
EXPERIMENT 27
OPERATING CONDITIONS: Rotational rate (rpm): 105 Temperature of the solution (°C): 25
Extraction time (hour): 72 Alkalinity level (pH): 12
[CN ] = 300 ppm [Cu(I)] = 10 ppm
[SCN ] = 50 ppm [AC] = 20 g/L Solution volume = 500 mL Adsorbent mass = 10 g
[PMs] and
[BMs]
in ppb
Time (h) Feed
1 2 3 6 24 48 72
Pt(II) 150 22.47 15.70 13.32 10.48 6.46 5.56 4.83
Pd(II) 380 76.20 54.95 46.79 46.81 22.06 17.27 14.86
Au(I) 100 1.78 1.06 2.28 7.38 2.01 1.13 1.97
Cu(I) 10000 5795 5958 6112 3574 4778 5554 3683
Ni(II) 100000 45284.5 37624.1 34373.4 28853.8 19573.7 17074.1 16240.6
%
Extraction
Pt(II) 0.00 85.02 89.54 91.12 93.01 95.69 96.29 96.78
Pd(II) 0.00 79.95 85.54 87.69 87.68 94.19 95.46 96.09
Au(I) 0.00 98.22 98.94 97.72 92.62 97.99 98.87 98.03
Cu(I) 0.00 42.05 40.42 38.88 64.26 52.22 44.46 63.17
Ni(II) 0.00 54.72 62.38 65.63 71.15 80.43 82.93 83.76
EXPERIMENT 28
OPERATING CONDITIONS: Rotational rate (rpm): 105 Temperature of the solution (°C): 25
Extraction time (hour): 72 Alkalinity level (pH): 12
[CN ] = 100 ppm [Cu(I)] = 10 ppm
[SCN ] = 100 ppm [AC] = 10 g/L Solution volume = 500 mL Adsorbent mass = 5 g
[PMs] and
[BMs]
in ppb
Time (h) Feed
1 2 3 6 24 48 72
Pt(II) 860 331.61 261.03 226.92 199.91 136.72 117.94 102.85
Pd(II) 1000 466.46 382.19 340.61 306.37 221.12 192.77 173.04
Au(I) 170 5.32 2.99 2.49 1.99 1.12 0.95 0.88
Cu(I) 10000 9730.97 9700.20 9358.58 9605.52 10033.93 9757.79 9263.91
Ni(II) 100000 75270.52 71294.32 66755.32 64719.72 57305.92 54190.82 50499.92
%
Extraction
Pt(II) 0.00 61.44 69.65 73.61 76.75 84.10 86.29 88.04
Pd(II) 0.00 53.35 61.78 65.94 69.36 77.89 80.72 82.70
Au(I) 0.00 96.87 98.24 98.54 98.83 99.34 99.44 99.48
Cu(I) 0.00 2.69 3.00 6.42 3.95 -0.34 2.42 7.36
Ni(II) 0.00 24.73 28.71 33.24 35.28 42.69 45.81 49.50
Stellenbosch University http://scholar.sun.ac.za

APPENDIX A: TABULATION OF EXPERIMENTAL DATA
The extraction of precious metals from alkaline cyanided medium by granular activated carbon 128
EXPERIMENT 30
OPERATING CONDITIONS: Rotational rate (rpm): 105 Temperature of the solution (°C): 25
Extraction time (hour): 72 Alkalinity level (pH): 9.5
[CN ] = 100 ppm [Cu(I)] = 100 ppm
[SCN ] = 100 ppm [AC] = 20 g/L Solution volume = 500 mL Adsorbent mass = 10 g
[PMs] and
[BMs]
in ppb
Time (h) Feed
1 2 3 6 24 48 72
Pt(II) 150 7.96 3.27 2.13 1.25 0.42 0.16 0.12
Pd(II) 380 34.61 15.11 10.05 6.24 1.79 0.46 0.15
Au(I) 100 4.91 2.21 1.50 1.30 26.30 2.67 1.13
Cu(I) 100000 55287 46757 40226 27089 1016 179 114
Ni(II) 10000 1039.44 602.38 456.40 277.69 26.13 5.93 3.79
%
Extraction
Pt(II) 0.00 94.69 97.82 98.58 99.17 99.72 99.89 99.92
Pd(II) 0.00 90.89 96.02 97.36 98.36 99.53 99.88 99.96
Au(I) 0.00 95.09 97.79 98.50 98.70 73.70 97.33 98.87
Cu(I) 0.00 44.71 53.24 59.77 72.91 98.98 99.82 99.89
Ni(II) 0.00 89.61 93.98 95.44 97.22 99.74 99.94 99.96
EXPERIMENT 29
OPERATING CONDITIONS: Rotational rate (rpm): 105 Temperature of the solution (°C): 25
Extraction time (hour): 72 Alkalinity level (pH): 9.5
[CN ] = 300 ppm [Cu(I)] = 100 ppm
[SCN ] = 50 ppm [AC] = 10 g/L Solution volume = 500 mL Adsorbent mass = 5 g
[PMs] and
[BMs]
in ppb
Time (h) Feed
1 2 3 6 24 48 72
Pt(II) 860 83.17 52.29 34.99 29.48 14.87 16.94 14.88
Pd(II) 1000 140.77 90.10 63.26 52.91 27.96 33.65 28.14
Au(I) 170 2.36 1.31 0.95 0.67 0.64 0.29 1.18
Cu(I) 100000 95594 98849 93738 94286 90447.6 94260.6 96647
Ni(II) 10000 3677.1 2906 1855 1882.4 1091.83 1301.98 1183.46
%
Extraction
Pt(II) 0.00 90.33 93.92 95.93 96.57 98.27 98.03 98.27
Pd(II) 0.00 85.92 90.99 93.67 94.71 97.20 96.64 97.19
Au(I) 0.00 98.61 99.23 99.44 99.61 99.62 99.83 99.31
Cu(I) 0.00 4.41 1.15 6.26 5.71 9.55 5.74 3.35
Ni(II) 0.00 63.23 70.94 81.45 81.18 89.08 86.98 88.17
Stellenbosch University http://scholar.sun.ac.za

APPENDIX A: TABULATION OF EXPERIMENTAL DATA
The extraction of precious metals from alkaline cyanided medium by granular activated carbon 129
EXPERIMENT 31
OPERATING CONDITIONS: Rotational rate (rpm): 105 Temperature of the solution (°C): 25
Extraction time (hour): 72 Alkalinity level (pH): 10.75
[CN ] = 200 ppm [Cu(I)] = 55 ppm
[SCN ] = 75 ppm [AC] = 15 g/L Solution volume = 500 mL Adsorbent mass = 7.5 g
[PMs] and
[BMs]
in ppb
Time (h) Feed
1 2 3 6 24 48 72
Pt(II) 510 56.48 33.63 28.76 20.09 10.20 5.58 3.46
Pd(II) 690 106.80 66.07 55.55 46.20 21.78 11.78 7.17
Au(I) 135 5.12 3.86 3.43 3.40 3.34 4.03 3.05
Cu(I) 55000 52194 51290 51108 51096 48824 47520 47640
Ni(II) 55000 25121 21031 18920 16026 9499 7350 7415
% Extraction
Pt(II) 0.00 88.93 93.41 94.36 96.06 98.00 98.91 99.32
Pd(II) 0.00 84.52 90.42 91.95 93.30 96.84 98.29 98.96
Au(I) 0.00 96.21 97.14 97.46 97.48 97.53 97.01 97.74
Cu(I) 0.00 5.10 6.75 7.08 7.10 11.23 13.60 13.38
Ni(II) 0.00 54.33 61.76 65.60 70.86 82.73 86.64 86.52
EXPERIMENT 32
OPERATING CONDITIONS: Rotational rate (rpm): 105 Temperature of the solution (°C): 25
Extraction time (hour): 72 Alkalinity level (pH): 9.5
[CN ] = 300 ppm [Cu(I)] = 10 ppm
[SCN ] = 50 ppm [AC] = 10 g/L Solution volume = 500 mL Adsorbent mass = 5 g
[PMs] and
[BMs]
in ppb
Time (h) Feed
1 2 3 6 24 48 72
Pt(II) 860 284.72 220.13 186.85 147.54 95.25 85.47 75.49
Pd(II) 1000 397.55 322.63 283.27 227.62 154.17 139.43 124.43
Au(I) 170 4.01 2.29 1.72 1.29 0.86 0.68 0.58
Cu(I) 10000 9630.30 9060.08 9015.5 9257.3 8897.5 9122 8656.54
Ni(II) 100000 66694.80 60698.65 57835 52874 42424 41029 38363.3
%
Extraction
Pt(II) 0.00 66.89 74.40 78.27 82.84 88.92 90.06 91.22
Pd(II) 0.00 60.25 67.74 71.67 77.24 84.58 86.06 87.56
Au(I) 0.00 97.64 98.65 98.99 99.24 99.50 99.60 99.66
Cu(I) 0.00 3.70 9.40 9.85 7.43 11.03 8.78 13.44
Ni(II) 0.00 33.31 39.30 42.16 47.13 57.58 58.97 61.64
Stellenbosch University http://scholar.sun.ac.za

APPENDIX A: TABULATION OF EXPERIMENTAL DATA
The extraction of precious metals from alkaline cyanided medium by granular activated carbon 130
EXPERIMENT 33
OPERATING CONDITIONS: Rotational rate (rpm): 105 Temperature of the solution (°C): 25
Extraction time (hour): 72 Alkalinity level (pH): 12
[CN ] = 300 ppm [Cu(I)] = 100 ppm
[SCN ] = 50 ppm [AC] = 20 g/L Solution volume = 500 mL Adsorbent mass = 10 g
[PMs] and
[BMs]
in ppb
Time (h) Feed
1 2 3 6 24 48 72
Pt(II) 150 21.92 9.64 6.95 5.34 2.88 2.19 1.62
Pd(II) 380 217.92 76.96 44.50 31.37 16.62 12.80 9.73
Au(I) 100 76.13 16.94 11.60 15.59 5.07 4.01 3.11
Cu(I) 100000 70173 67296 62612 63517 56662 52001 48501
Ni(II) 10000 1447.48 1040.48 904.69 727.04 430.44 360.97 330.29
%
Extraction
Pt(II) 0.00 85.39 93.57 95.37 96.44 98.08 98.54 98.92
Pd(II) 0.00 42.65 79.75 88.29 91.74 95.63 96.63 97.44
Au(I) 0.00 23.87 83.06 88.40 84.41 94.93 95.99 96.89
Cu(I) 0.00 29.83 32.70 37.39 36.48 43.34 48.00 51.50
Ni(II) 0.00 85.53 89.60 90.95 92.73 95.70 96.39 96.70
EXPERIMENT 34
OPERATING CONDITIONS: Rotational rate (rpm): 105 Temperature of the solution (°C): 25
Extraction time (hour): 72 Alkalinity level (pH): 9.5
[CN ] = 100 ppm [Cu(I)] = 10 ppm
[SCN ] = 100 ppm [AC] = 20 g/L Solution volume = 500 mL Adsorbent mass = 10 g
[PMs] and
[BMs]
in ppb
Time (h) Feed
1 2 3 6 24 48 72
Pt(II) 150 21.59 12.37 11.73 9.72 4.62 3.55 1.55
Pd(II) 380 113.97 65.69 59.83 77.50 24.48 14.41 7.79
Au(I) 100 3.58 2.36 2.33 23.49 4.34 2.64 1.69
Cu(I) 10000 8746.994 9036.4 9696 8256.6 8522.8 4546.5 831.33
Ni(II) 100000 42723.19 30969.32 27331 20775 11181 6627.6 4094.8
%
Extraction
Pt(II) 0.00 85.61 91.75 92.18 93.52 96.92 97.63 98.97
Pd(II) 0.00 70.01 82.71 84.26 79.61 93.56 96.21 97.95
Au(I) 0.00 96.42 97.64 97.67 76.51 95.66 97.36 98.31
Cu(I) 0.00 12.53 9.64 3.04 17.43 14.77 54.53 91.69
Ni(II) 0.00 57.28 69.03 72.67 79.23 88.82 93.37 95.91
Stellenbosch University http://scholar.sun.ac.za

APPENDIX A: TABULATION OF EXPERIMENTAL DATA
The extraction of precious metals from alkaline cyanided medium by granular activated carbon 131
EXPERIMENT 35
OPERATING CONDITIONS: Rotational rate (rpm): 105 Temperature of the solution (°C): 25
Extraction time (hour): 72 Alkalinity level (pH): 12
[CN ] = 100 ppm [Cu(I)] = 100 ppm
[SCN ] = 100 ppm [AC] = 10 g/L Solution volume = 500 mL Adsorbent mass = 5 g
[PMs] and
[BMs]
in ppb
Time (h) Feed
1 2 3 6 24 48 72
Pt(II) 860 77.19 44.60 34.82 24.06 11.87 11.49 9.17
Pd(II) 1000 130.60 80.91 64.33 44.22 22.58 21.14 16.60
Au(I) 170 3.13 1.00 1.04 2.711 0.46 0.94 0.98
Cu(I) 100000 91372 84774 88745 54164 77340 74726 64936
Ni(II) 10000 3675.81 2748.31 2309.2 1404 1013.7 977.63 769.01
%
Extraction
Pt(II) 0.00 91.02 94.81 95.95 97.20 98.62 98.66 98.93
Pd(II) 0.00 86.94 91.91 93.57 95.58 97.74 97.89 98.34
Au(I) 0.00 98.16 99.41 99.39 98.41 99.73 99.45 99.42
Cu(I) 0.00 8.63 15.23 11.26 45.84 22.66 25.27 35.06
Ni(II) 0.00 63.24 72.52 76.91 85.96 89.86 90.22 92.31
EXPERIMENT 36
OPERATING CONDITIONS: Rotational rate (rpm): 105 Temperature of the solution (°C): 25
Extraction time (hour): 72 Alkalinity level (pH): 9.5
[CN ] = 100 ppm [Cu(I)] = 10 ppm
[SCN ] = 50 ppm [AC] = 20 g/L Solution volume = 500 mL Adsorbent mass = 10 g
[PMs] and
[BMs]
in ppb
Time (h) Feed
1 2 3 6 24 48 72
Pt(II) 860 4.20 2.71 1.86 1.55 0.53 0.49 0.27
Pd(II) 1000 7.55 4.83 3.30 2.49 1.11 0.85 0.73
Au(I) 170 0.59 0.33 0.35 0.31 0.23 0.32 0.07
Cu(I) 10000 6689.04 5278.6 4164.98 3310.31 810.92 261.35 172.46
Ni(II) 10000 232.52 156.91 101.58 74.80 17.40 4.32 3.94
%
Extraction
Pt(II) 0.00 99.51 99.68 99.78 99.82 99.94 99.94 99.97
Pd(II) 0.00 99.25 99.52 99.67 99.75 99.89 99.92 99.93
Au(I) 0.00 99.65 99.81 99.79 99.82 99.86 99.81 99.96
Cu(I) 0.00 33.11 47.21 58.35 66.90 91.89 97.39 98.28
Ni(II) 0.00 97.67 98.43 98.98 99.25 99.83 99.96 99.96
Stellenbosch University http://scholar.sun.ac.za

APPENDIX A: TABULATION OF EXPERIMENTAL DATA
The extraction of precious metals from alkaline cyanided medium by granular activated carbon 132
EXPERIMENT 37
OPERATING CONDITIONS: Rotational rate (rpm): 105 Temperature of the solution (°C): 25
Extraction time (hour): 72 Alkalinity level (pH): 10.75
[CN ] = 200 ppm [Cu(I)] = 55 ppm
[SCN ] = 75 ppm [AC] = 15 g/L Solution volume = 500 mL Adsorbent mass = 7.5 g
[PMs] and
[BMs]
in ppb
Time (h) Feed
1 2 3 6 24 48 72
Pt(II) 505 54.48 35.17 29.65 21.04 11.53 5.65 3.00
Pd(II) 690 105.97 70.40 59.27 43.96 24.66 13.06 7.33
Au(I) 135 30.84 23.65 15.03 12.13 9.58 6.10 6.25
Cu(I) 55000 50946 50959 47698 49795 48699.7 48086 46398.36
Ni(II) 55000 24599 20881 17987 15989 9550.69 7585 6995
% Extraction
Pt(II) 0.00 89.21 93.04 94.13 95.83 97.72 98.88 99.41
Pd(II) 0.00 84.64 89.80 91.41 93.63 96.43 98.11 98.94
Au(I) 0.00 77.16 82.48 88.87 91.01 92.90 95.48 95.37
Cu(I) 0.00 7.37 7.35 13.28 9.46 11.46 12.57 15.64
Ni(II) 0.00 55.27 62.03 67.30 70.93 82.64 86.21 87.28
EXPERIMENT 38
OPERATING CONDITIONS: Rotational rate (rpm): 105 Temperature of the solution (°C): 25
Extraction time (hour): 72 Alkalinity level (pH): 9.5
[CN ] = 300 ppm [Cu(I)] = 10 ppm
[SCN ] = 100 ppm [AC] = 10 g/L Solution volume = 500 mL Adsorbent mass = 5 g
[PMs] and
[BMs]
in ppb
Time (h) Feed
1 2 3 6 24 48 72
Pt(II) 150 10.05 6.37 3.74 4.11 1.61 1.4 1.16
Pd(II) 380 41.28 24.6 18.55 18.2 8.85 7.69 7.33
Au(I) 100 2.711 1.06 2.711 4.48 2.71 2.71 0.72
Cu(I) 10000 8602.48 8298.17 5791.67 5483.67 5303.17 5203.67 4564
Ni(II) 10000 2269 1941 1196 1534 702.6 643.7 602
%
Extraction
Pt(II) 0.00 93.30 95.75 97.51 97.26 98.93 99.07 99.23
Pd(II) 0.00 89.14 93.53 95.12 95.21 97.67 97.98 98.07
Au(I) 0.00 97.29 98.94 97.29 95.52 97.29 97.29 99.28
Cu(I) 0.00 13.98 17.02 42.08 45.16 46.97 47.96 54.36
Ni(II) 0.00 77.31 80.59 88.04 84.66 92.97 93.56 93.98
Stellenbosch University http://scholar.sun.ac.za

APPENDIX A: TABULATION OF EXPERIMENTAL DATA
The extraction of precious metals from alkaline cyanided medium by granular activated carbon 133
EXPERIMENT 39
OPERATING CONDITIONS: Rotational rate (rpm): 105 Temperature of the solution (°C): 25
Extraction time (hour): 72 Alkalinity level (pH): 12
[CN ] = 300 ppm [Cu(I)] = 100 ppm
[SCN ] = 100 ppm [AC] = 20 g/L Solution volume = 500 mL Adsorbent mass = 10 g
[PMs] and
[BMs]
in ppb
Time (h) Feed
1 2 3 6 24 48 72
Pt(II) 860 158.76 109.08 82.86 70.84 36.66 29.67 28.35
Pd(II) 1000 215.20 156.24 128.38 108.88 61.88 50.67 50.77
Au(I) 170 2.09 1.25 13.04 1.58 0.93 0.73 0.57
Cu(I) 100000 79065 77056 69130 73058 66308 61764 64554
Ni(II) 100000 44432 36754 32045 28637 19838 16793 17348
%
Extraction
Pt(II) 0.00 81.54 87.32 90.36 91.76 95.74 96.55 96.70
Pd(II) 0.00 78.48 84.38 87.16 89.11 93.81 94.93 94.92
Au(I) 0.00 98.77 99.27 92.33 99.07 99.45 99.57 99.67
Cu(I) 0.00 20.94 22.94 30.87 26.94 33.69 38.24 35.45
Ni(II) 0.00 55.57 63.25 67.95 71.36 80.16 83.21 82.65
EXPERIMENT 40
OPERATING CONDITIONS: Rotational rate (rpm): 105 Temperature of the solution (°C): 25
Extraction time (hour): 72 Alkalinity level (pH): 12
[CN ] = 100 ppm [Cu(I)] = 100 ppm
[SCN ] = 50 ppm [AC] = 10 g/L Solution volume = 500 mL Adsorbent mass = 5 g
[PMs] and
[BMs]
in ppb
Time (h) Feed
1 2 3 6 24 48 72
Pt(II) 150 60.25 49.86 42.24 36.99 23.32 19.92 17.83
Pd(II) 380 179.60 153.68 136.47 119.26 81.99 70.46 64.28
Au(I) 100 3.01 1.80 1.43 1.10 0.65 0.52 0.49
Cu(I) 100000 91643.18 92544.96 90020 89647 86787 87289 82222.2
Ni(II) 100000 73450.42 68396.52 65723 62135 51798 48763 46926.7
%
Extraction
Pt(II) 0.00 59.83 66.76 71.84 75.34 84.45 86.72 88.11
Pd(II) 0.00 52.74 59.56 64.09 68.62 78.42 81.46 83.09
Au(I) 0.00 96.99 98.20 98.57 98.90 99.35 99.48 99.51
Cu(I) 0.00 8.36 7.46 9.98 10.35 13.21 12.71 17.78
Ni(II) 0.00 26.55 31.60 34.28 37.87 48.20 51.24 53.07
Stellenbosch University http://scholar.sun.ac.za

APPENDIX A: TABULATION OF EXPERIMENTAL DATA
The extraction of precious metals from alkaline cyanided medium by granular activated carbon 134
PGM and BMs extraction for various bottles-on-roll operating conditions after 72 hours contact
time
Trial Block pH [Cu(I)]
mg/L
[Ni(II)]
mg/L
[CN-]
mg/L
[SCN-]
mg/L
[PMs]
mg/L
[AC]
g/L
PM and BMs extraction (%)
Pt(II) Pd(II) Au(I) Cu(I) Ni(II)
1
1
9.5 10 10 300 50 0.63 20 99.37 98.74 99.40 78.58 98.87
2 10.75 55 55 200 75 1.33 15 98.14 97.19 99.47 11.80 87.03
3 12 100 100 100 100 0.63 20 96.47 94.67 99.32 36.08 81.16
4 12 100 100 300 50 2.03 10 87.98 87.08 99.19 42.82 67.49
5 9.5 10 10 100 100 2.03 10 99.92 99.86 99.94 96.62 99.57
6
2
12 100 10 300 100 0.63 10 97.92 92.33 97.20 21.85 88.30
7 12 100 10 100 50 2.03 20 99.78 99.64 98.41 74.25 98.28
8 9.5 10 100 100 50 0.63 10 92.53 83.41 98.83 10.34 67.67
9 9.5 10 100 300 100 2.03 20 98.06 97.06 99.60 15.59 81.75
10 10.75 55 55 200 75 1.33 15 98.25 97.39 99.44 13.99 87.91
11
3
12 10 100 300 100 0.63 10 89.50 89.24 99.25 39.86 59.97
12 9.5 100 10 300 100 2.03 20 99.41 99.01 99.92 29.10 95.74
13 9.5 100 10 100 50 0.63 10 98.89 95.81 75.64 99.54 99.78
14 12 10 100 100 50 2.03 20 95.89 94.19 99.58 5.83 78.44
15 10.75 55 55 200 75 1.33 15 98.24 97.30 99.58 13.41 87.31
16
4
12 10 10 100 100 0.63 20 99.57 99.44 99.39 52.46 97.98
17 9.5 100 100 100 100 2.03 10 90.69 85.20 89.56 46.44 59.51
18 10.75 55 55 200 75 1.33 15 98.21 97.29 99.42 15.76 87.33
19 9.5 100 100 300 50 0.63 20 98.45 97.29 99.15 55.62 90.20
20 12 10 10 300 50 2.03 10 99.34
98.82
99.92
13.62
94.56
Stellenbosch University http://scholar.sun.ac.za

APPENDIX A: TABULATION OF EXPERIMENTAL DATA
The extraction of precious metals from alkaline cyanided medium by granular activated carbon 135
PGM and BMs extraction for various bottles-on-roll operating conditions after 72 hours contact time
Trial Block pH [Cu(I)]
mg/L
[Ni(II)]
mg/L
[CN-]
mg/L
[SCN-]
mg/L
[PMs]
mg/L
[AC]
g/L
PM and BMs extraction (%)
Pt(II) Pd(II) Au(I) Cu(I) Ni(II)
21
5
12 10 10 300 100 2.03 20 99.75 99.58 99.95 30.69 97.86
22 9.5 100 100 300 100 0.63 10 90.89 85.90 99.50 4.66 58.83
23 12 10 10 100 50 0.63 10 98.24 96.60 99.18 83.23 90.56
24 10.75 55 55 200 75 1.33 15 93.35 90.44 97.59 6.36 61.01
25 9.5 100 100 100 50 2.03 20 98.38 97.07 99.68 89.44 89.71
26
6
10.75 55 55 200 75 1.33 15 93.65 90.96 98.29 6.18 61.11
27 12 10 100 300 50 0.63 20 96.78 96.09 98.03 63.17 83.76
28 12 10 100 100 100 2.03 10 88.04 82.70 99.48 7.36 49.50
29 9.5 100 10 300 50 2.03 10 98.27 97.19 99.31 3.35 88.17
30 9.5 100 10 100 100 0.63 20 99.92 99.96 98.87 99.89 99.96
31
7
10.75 55 55 200 75 1.33 15 93.41 90.42 97.14 6.75 61.76
32 9.5 10 100 300 50 2.03 10 91.22 87.56 99.66 13.44 61.64
33 12 100 10 300 50 0.63 20 98.92 97.44 96.89 51.50 96.70
34 9.5 10 100 100 100 0.63 20 98.97 97.95 98.31 91.69 95.91
35 12 100 10 100 100 2.03 10 98.93 98.34 99.42 35.06 92.31
36
8
9.5 10 10 100 50 2.03 20 99.97 99.93 99.96 98.28 99.96
37 10.75 55 55 200 75 1.33 15 98.14 97.19 99.47 11.80 87.03
38 9.5 10 10 300 100 0.63 10 99.23 98.07 99.28 54.36 93.98
39 12 100 100 300 100 2.03 20 96.70 94.92 99.67 35.45 82.65
40 12 100 100 100 50 0.63 10 88.11 83.09 99.51 17.78 53.07
Stellenbosch University http://scholar.sun.ac.za

APPENDIX A: TABULATION OF EXPERIMENTAL DATA
The extraction of precious metals from alkaline cyanided medium by granular activated carbon 136
REPRODUCIBILITY TESTS N0 1
OPERATING CONDITIONS: Rotational rate (rpm): 105 Temperature of the solution (°C): 25 Extraction time (hour): 2 Alkalinity level (pH): 9.5
[CN ] = 133 ppm [Cu(I)] = 10 ppm
[SCN ] = 100 ppm [AC] = 10 g/L Solution volume = 500 Adsorbent mass = 5 g
[PMs] and
[BMs]
in ppb
Time (min) Feed
30 60 90 120
Pt(II) 860 102.56 42.59 27.90 19.11
Pd(II) 1000 149.28 70.03 48.43 34.12
Au(I) 170 3.98 2.25 2.10 0.30
Cu(I) 10000 9035.248 8880.073 8295.245 7773.384
Ni(II) 10000 2777.992 1704.592 1318.486 1026.806
%
Extraction
Pt(II) 0.00 88.07 95.05 96.76 97.78
Pd(II) 0.00 85.07 93.00 95.16 96.59
Au(I) 0.00 97.66 98.68 98.76 99.82
Cu(I) 0.00 9.65 11.20 17.05 22.27
Ni(II) 0.00 72.22 82.95 86.82 89.73
REPRODUCIBILITY TESTS N0 2
OPERATING CONDITIONS: Rotational rate (rpm): 105 Temperature of the solution (°C): 25 Extraction time (hour): 2 Alkalinity level (pH): 9.5
[CN ] = 133 ppm [Cu(I)] = 10 ppm
[SCN ] = 100 ppm [AC] = 10 g/L Solution volume = 500 Adsorbent mass = 5 g
[PMs] and
[BMs]
in ppb
Time (min) Feed
30 60 90 120
Pt(II) 860 115.30 42.74 24.02 18.38
Pd(II) 1000 164.20 68.50 40.22 31.70
Au(I) 170 4.96 1.74 0.31 0.28
Cu(I) 10000 6307.03 7163.89 7103.03 7068.48
Ni(II) 10000 2535.51 1439.38 1040.63 807.52
%
Extraction
Pt(II) 0.00 86.59 95.03 97.21 97.86
Pd(II) 0.00 83.58 93.15 95.98 96.83
Au(I) 0.00 97.08 98.98 99.82 99.84
Cu(I) 0.00 36.93 28.36 28.97 29.32
Ni(II) 0.00 74.64 85.61 89.59 91.92
Stellenbosch University http://scholar.sun.ac.za

APPENDIX A: TABULATION OF EXPERIMENTAL DATA
The extraction of precious metals from alkaline cyanided medium by granular activated carbon 137
REPRODUCIBILITY TESTS N0 3
OPERATING CONDITIONS: Rotational rate (rpm): 105 Temperature of the solution (°C): 25 Extraction time (hour): 2 Alkalinity level (pH): 9.5
[CN ] = 133 ppm [Cu(I)] = 10 ppm
[SCN ] = 100 ppm [AC] = 10 g/L Solution volume = 500 Adsorbent mass = 5 g
[PMs] and
[BMs]
in ppb
Time (min) Feed
30 60 90 120
Pt(II) 860 105.69 40.80 25.06 18.28
Pd(II) 1000 152.84 65.84 42.33 31.50
Au(I) 170 8.31 1.72 0.98 0.29
Cu(I) 10000 8083.76 7982.55 7191.71 7099.13
Ni(II) 10000 2792.27 1583.07 1053.85 811.85
%
Extraction
Pt(II) 0.00 87.71 95.26 97.09 97.87
Pd(II) 0.00 84.72 93.42 95.77 96.85
Au(I) 0.00 95.11 98.99 99.42 99.83
Cu(I) 0.00 19.16 20.17 28.08 29.01
Ni(II) 0.00 72.08 84.17 89.46 91.88
Stellenbosch University http://scholar.sun.ac.za
APPENDIX B: FIGURES
The extraction of precious metals from alkaline cyanided medium by granular activated carbon 138
APPENDIX B
FIGURES
Stellenbosch University http://scholar.sun.ac.za
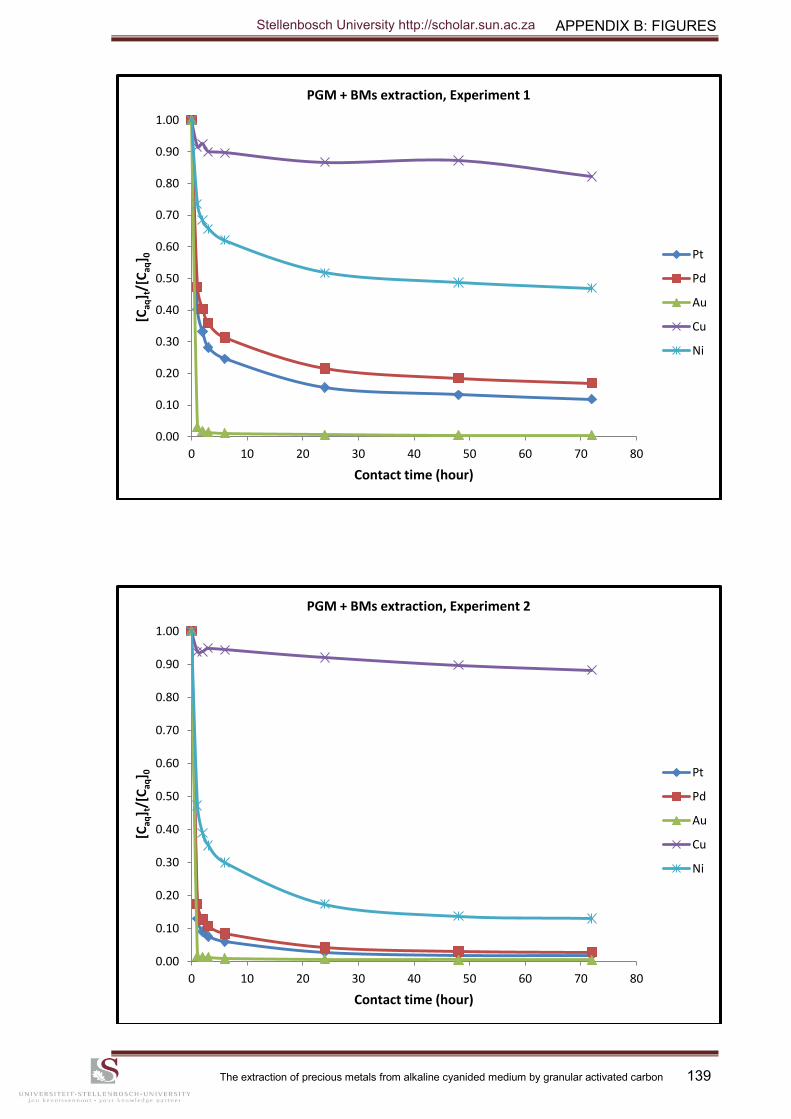
APPENDIX B: FIGURES
The extraction of precious metals from alkaline cyanided medium by granular activated carbon 139
0.00
0.10
0.20
0.30
0.40
0.50
0.60
0.70
0.80
0.90
1.00
0 10 20 30 40 50 60 70 80
[Caq
] t/[
Caq
] 0
Contact time (hour)
PGM + BMs extraction, Experiment 1
Pt
Pd
Au
Cu
Ni
0.00
0.10
0.20
0.30
0.40
0.50
0.60
0.70
0.80
0.90
1.00
0 10 20 30 40 50 60 70 80
[Caq
] t/[
Caq
] 0
Contact time (hour)
PGM + BMs extraction, Experiment 2
Pt
Pd
Au
Cu
Ni
Stellenbosch University http://scholar.sun.ac.za
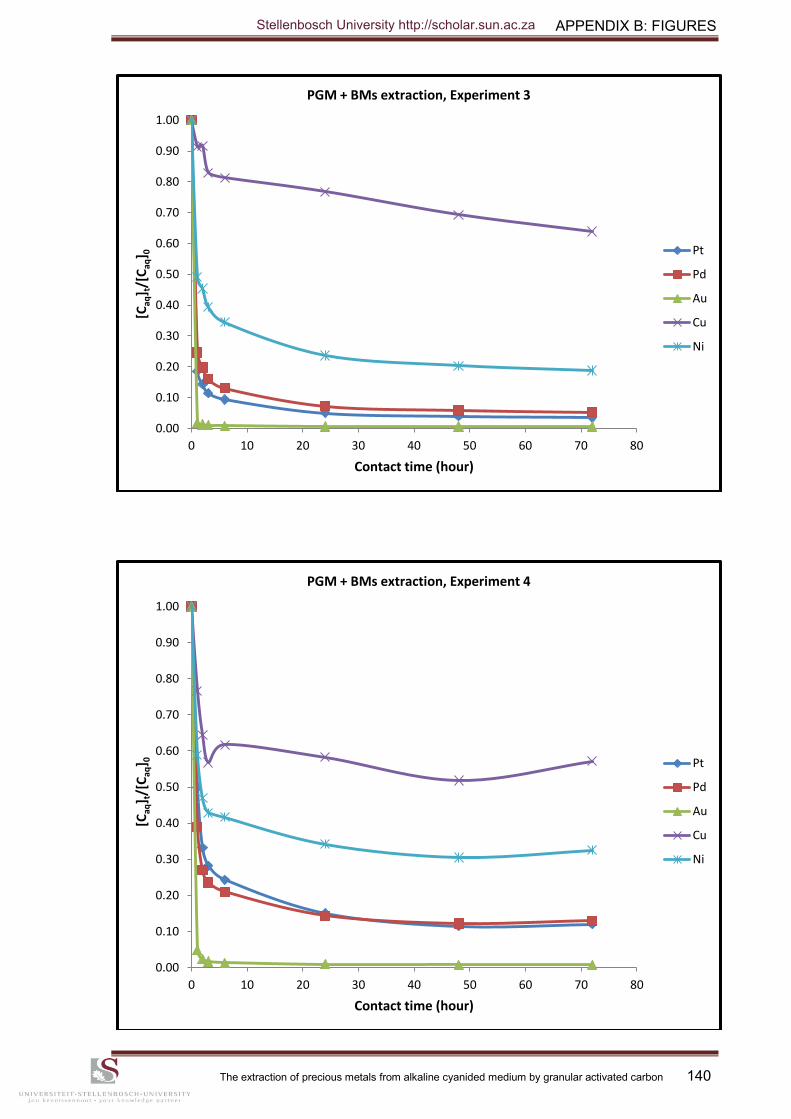
APPENDIX B: FIGURES
The extraction of precious metals from alkaline cyanided medium by granular activated carbon 140
0.00
0.10
0.20
0.30
0.40
0.50
0.60
0.70
0.80
0.90
1.00
0 10 20 30 40 50 60 70 80
[Caq
] t/[
Caq
] 0
Contact time (hour)
PGM + BMs extraction, Experiment 3
Pt
Pd
Au
Cu
Ni
0.00
0.10
0.20
0.30
0.40
0.50
0.60
0.70
0.80
0.90
1.00
0 10 20 30 40 50 60 70 80
[Caq
] t/[
Caq
] 0
Contact time (hour)
PGM + BMs extraction, Experiment 4
Pt
Pd
Au
Cu
Ni
Stellenbosch University http://scholar.sun.ac.za
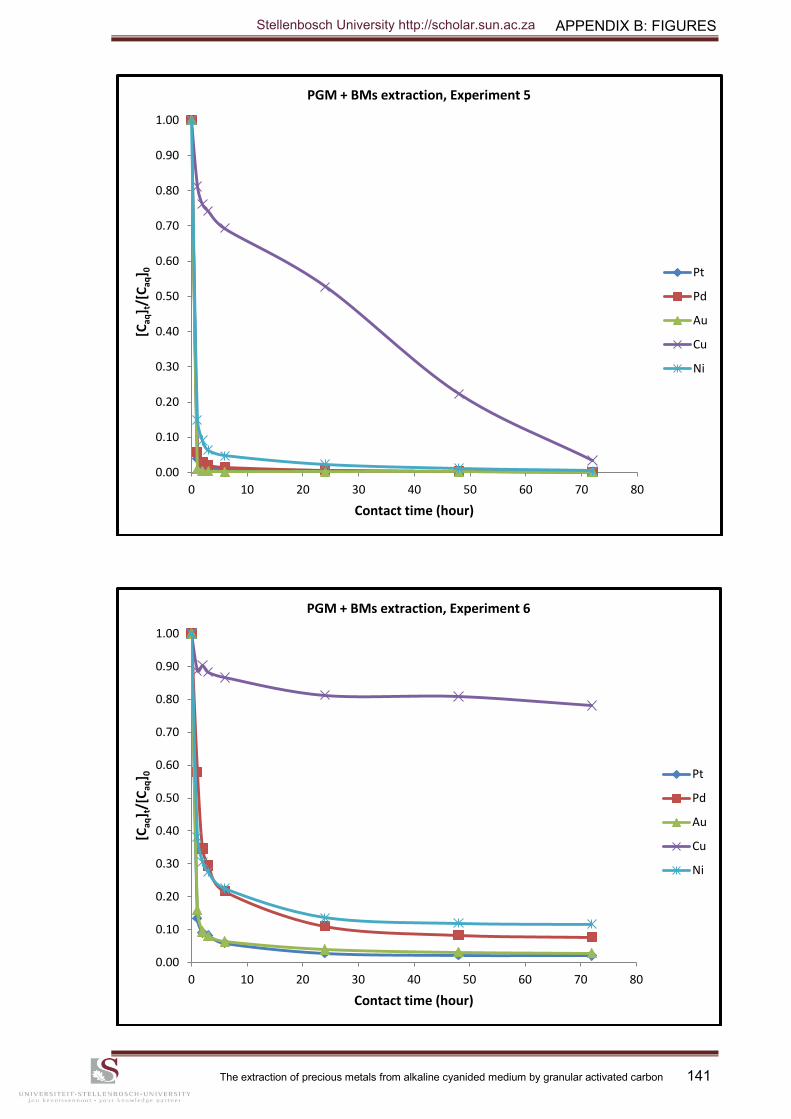
APPENDIX B: FIGURES
The extraction of precious metals from alkaline cyanided medium by granular activated carbon 141
0.00
0.10
0.20
0.30
0.40
0.50
0.60
0.70
0.80
0.90
1.00
0 10 20 30 40 50 60 70 80
[Caq
] t/[
Caq
] 0
Contact time (hour)
PGM + BMs extraction, Experiment 5
Pt
Pd
Au
Cu
Ni
0.00
0.10
0.20
0.30
0.40
0.50
0.60
0.70
0.80
0.90
1.00
0 10 20 30 40 50 60 70 80
[Caq
] t/[
Caq
] 0
Contact time (hour)
PGM + BMs extraction, Experiment 6
Pt
Pd
Au
Cu
Ni
Stellenbosch University http://scholar.sun.ac.za
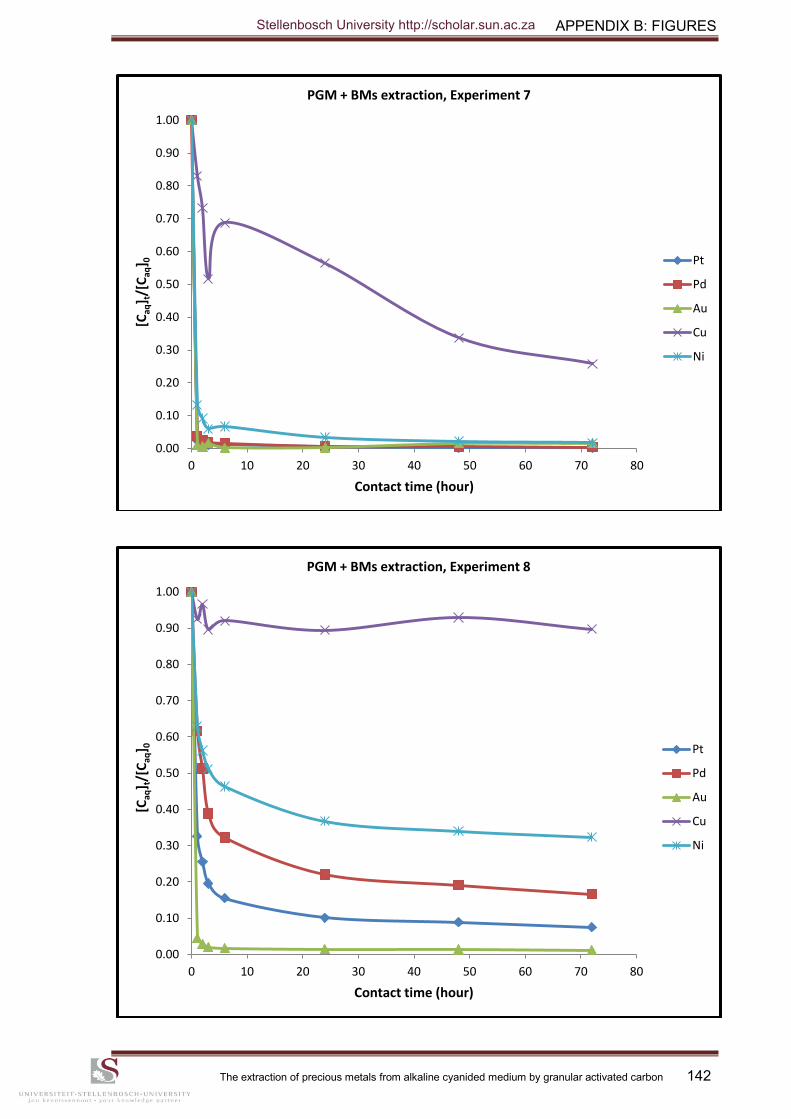
APPENDIX B: FIGURES
The extraction of precious metals from alkaline cyanided medium by granular activated carbon 142
0.00
0.10
0.20
0.30
0.40
0.50
0.60
0.70
0.80
0.90
1.00
0 10 20 30 40 50 60 70 80
[Caq
] t/[
Caq
] 0
Contact time (hour)
PGM + BMs extraction, Experiment 7
Pt
Pd
Au
Cu
Ni
0.00
0.10
0.20
0.30
0.40
0.50
0.60
0.70
0.80
0.90
1.00
0 10 20 30 40 50 60 70 80
[Caq
] t/[
Caq
] 0
Contact time (hour)
PGM + BMs extraction, Experiment 8
Pt
Pd
Au
Cu
Ni
Stellenbosch University http://scholar.sun.ac.za
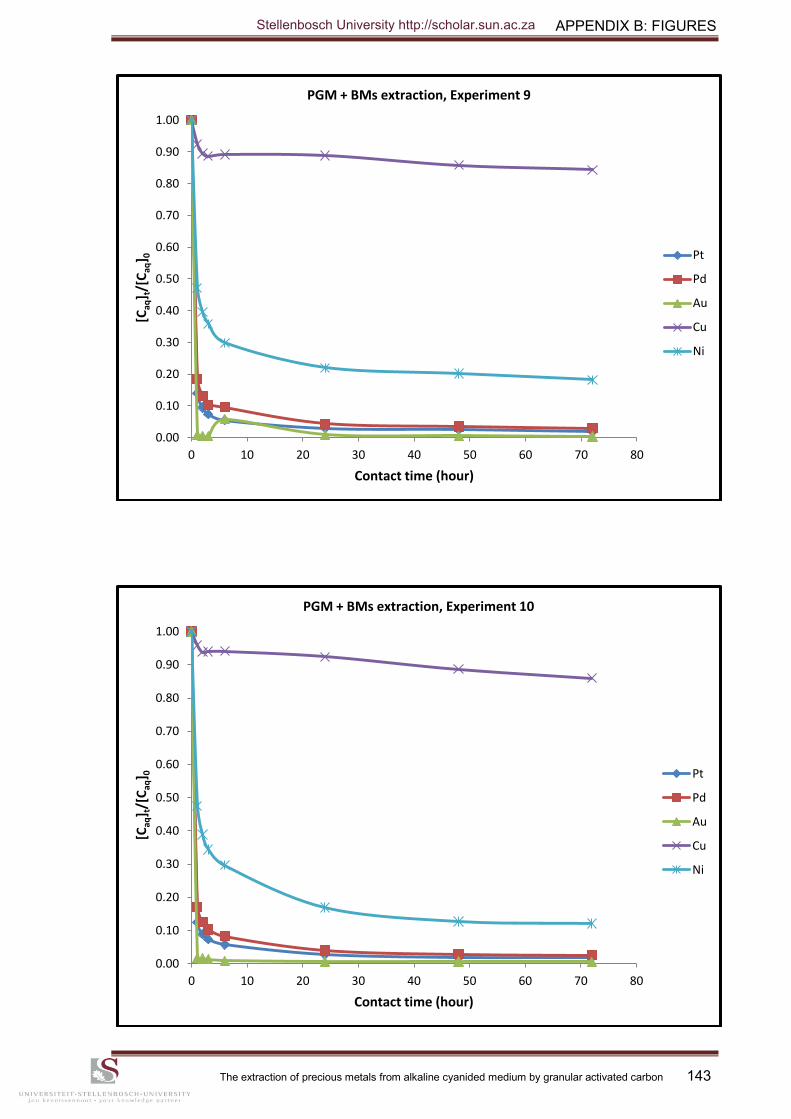
APPENDIX B: FIGURES
The extraction of precious metals from alkaline cyanided medium by granular activated carbon 143
0.00
0.10
0.20
0.30
0.40
0.50
0.60
0.70
0.80
0.90
1.00
0 10 20 30 40 50 60 70 80
[Caq
] t/[
Caq
] 0
Contact time (hour)
PGM + BMs extraction, Experiment 9
Pt
Pd
Au
Cu
Ni
0.00
0.10
0.20
0.30
0.40
0.50
0.60
0.70
0.80
0.90
1.00
0 10 20 30 40 50 60 70 80
[Caq
] t/[
Caq
] 0
Contact time (hour)
PGM + BMs extraction, Experiment 10
Pt
Pd
Au
Cu
Ni
Stellenbosch University http://scholar.sun.ac.za
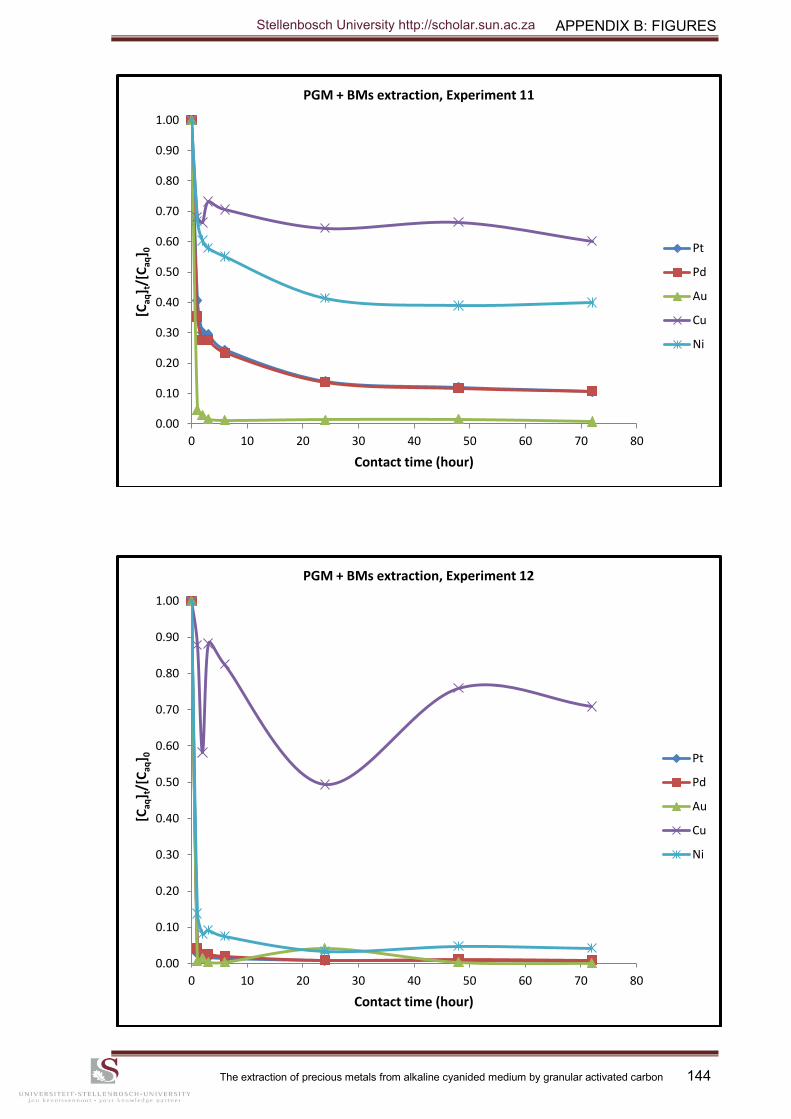
APPENDIX B: FIGURES
The extraction of precious metals from alkaline cyanided medium by granular activated carbon 144
0.00
0.10
0.20
0.30
0.40
0.50
0.60
0.70
0.80
0.90
1.00
0 10 20 30 40 50 60 70 80
[Caq
] t/[
Caq
] 0
Contact time (hour)
PGM + BMs extraction, Experiment 11
Pt
Pd
Au
Cu
Ni
0.00
0.10
0.20
0.30
0.40
0.50
0.60
0.70
0.80
0.90
1.00
0 10 20 30 40 50 60 70 80
[Caq
] t/[
Caq
] 0
Contact time (hour)
PGM + BMs extraction, Experiment 12
Pt
Pd
Au
Cu
Ni
Stellenbosch University http://scholar.sun.ac.za
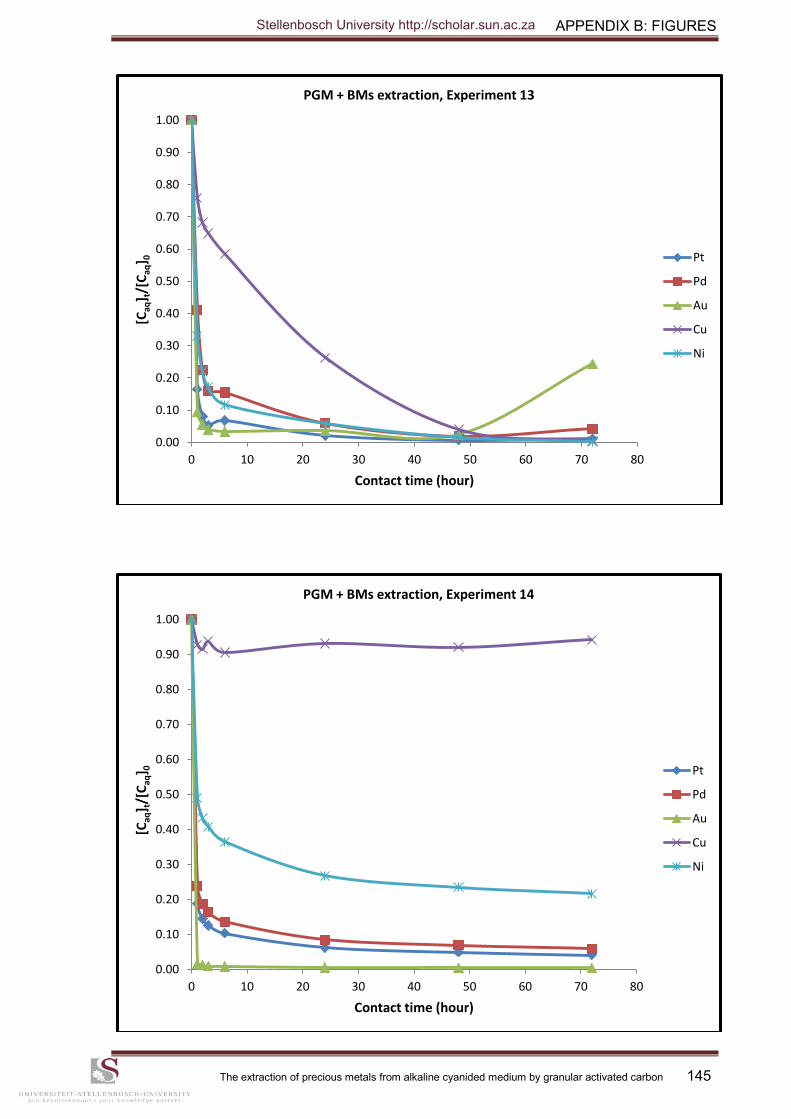
APPENDIX B: FIGURES
The extraction of precious metals from alkaline cyanided medium by granular activated carbon 145
0.00
0.10
0.20
0.30
0.40
0.50
0.60
0.70
0.80
0.90
1.00
0 10 20 30 40 50 60 70 80
[Caq
] t/[
Caq
] 0
Contact time (hour)
PGM + BMs extraction, Experiment 13
Pt
Pd
Au
Cu
Ni
0.00
0.10
0.20
0.30
0.40
0.50
0.60
0.70
0.80
0.90
1.00
0 10 20 30 40 50 60 70 80
[Caq
] t/[
Caq
] 0
Contact time (hour)
PGM + BMs extraction, Experiment 14
Pt
Pd
Au
Cu
Ni
Stellenbosch University http://scholar.sun.ac.za
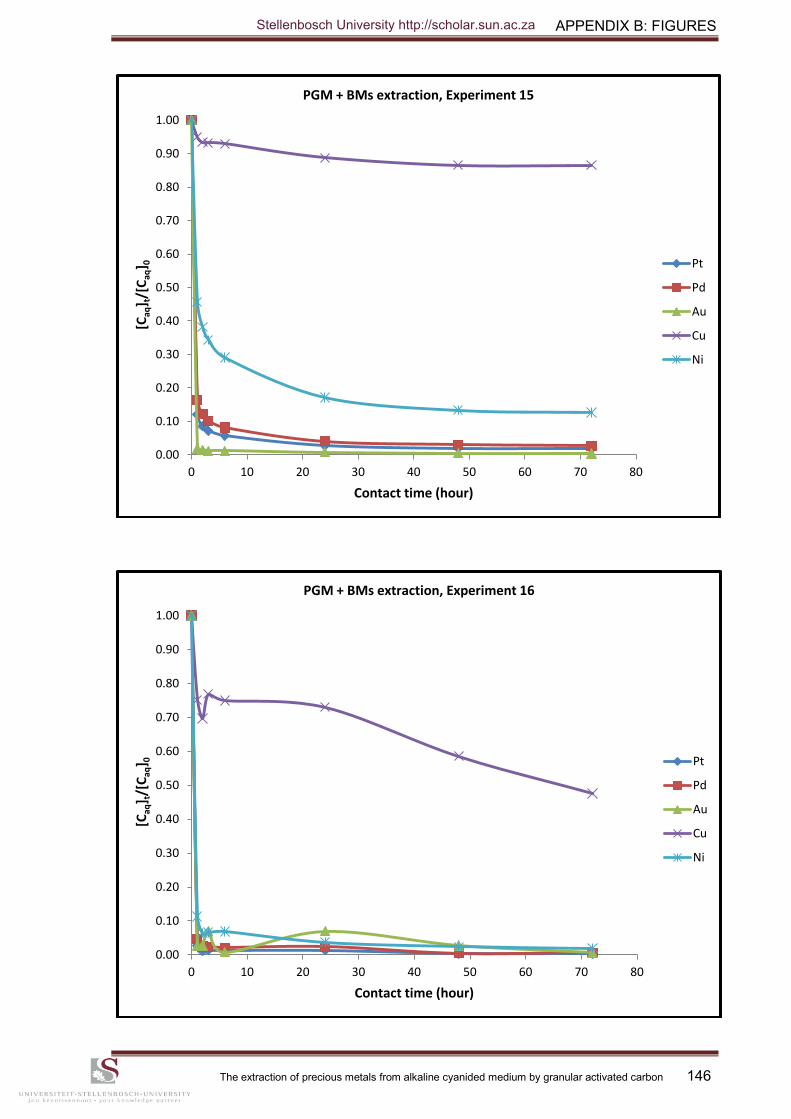
APPENDIX B: FIGURES
The extraction of precious metals from alkaline cyanided medium by granular activated carbon 146
0.00
0.10
0.20
0.30
0.40
0.50
0.60
0.70
0.80
0.90
1.00
0 10 20 30 40 50 60 70 80
[Caq
] t/[
Caq
] 0
Contact time (hour)
PGM + BMs extraction, Experiment 15
Pt
Pd
Au
Cu
Ni
0.00
0.10
0.20
0.30
0.40
0.50
0.60
0.70
0.80
0.90
1.00
0 10 20 30 40 50 60 70 80
[Caq
] t/[
Caq
] 0
Contact time (hour)
PGM + BMs extraction, Experiment 16
Pt
Pd
Au
Cu
Ni
Stellenbosch University http://scholar.sun.ac.za
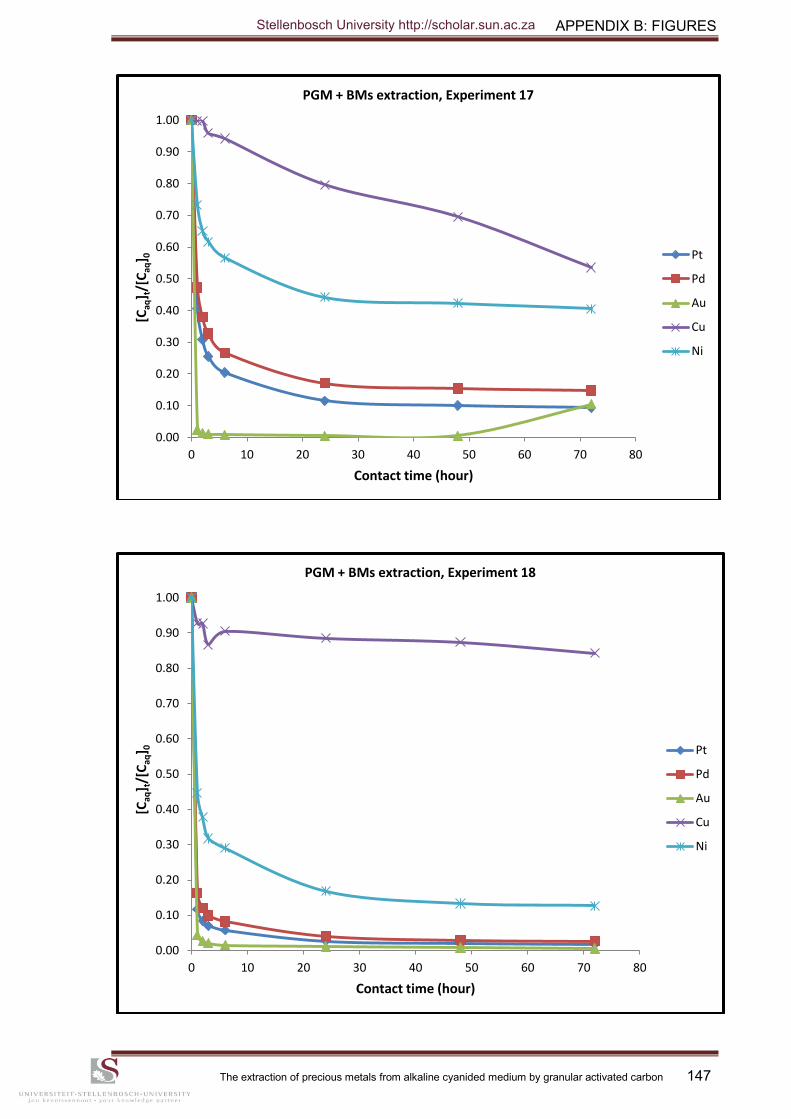
APPENDIX B: FIGURES
The extraction of precious metals from alkaline cyanided medium by granular activated carbon 147
0.00
0.10
0.20
0.30
0.40
0.50
0.60
0.70
0.80
0.90
1.00
0 10 20 30 40 50 60 70 80
[Caq
] t/[
Caq
] 0
Contact time (hour)
PGM + BMs extraction, Experiment 17
Pt
Pd
Au
Cu
Ni
0.00
0.10
0.20
0.30
0.40
0.50
0.60
0.70
0.80
0.90
1.00
0 10 20 30 40 50 60 70 80
[Caq
] t/[
Caq
] 0
Contact time (hour)
PGM + BMs extraction, Experiment 18
Pt
Pd
Au
Cu
Ni
Stellenbosch University http://scholar.sun.ac.za
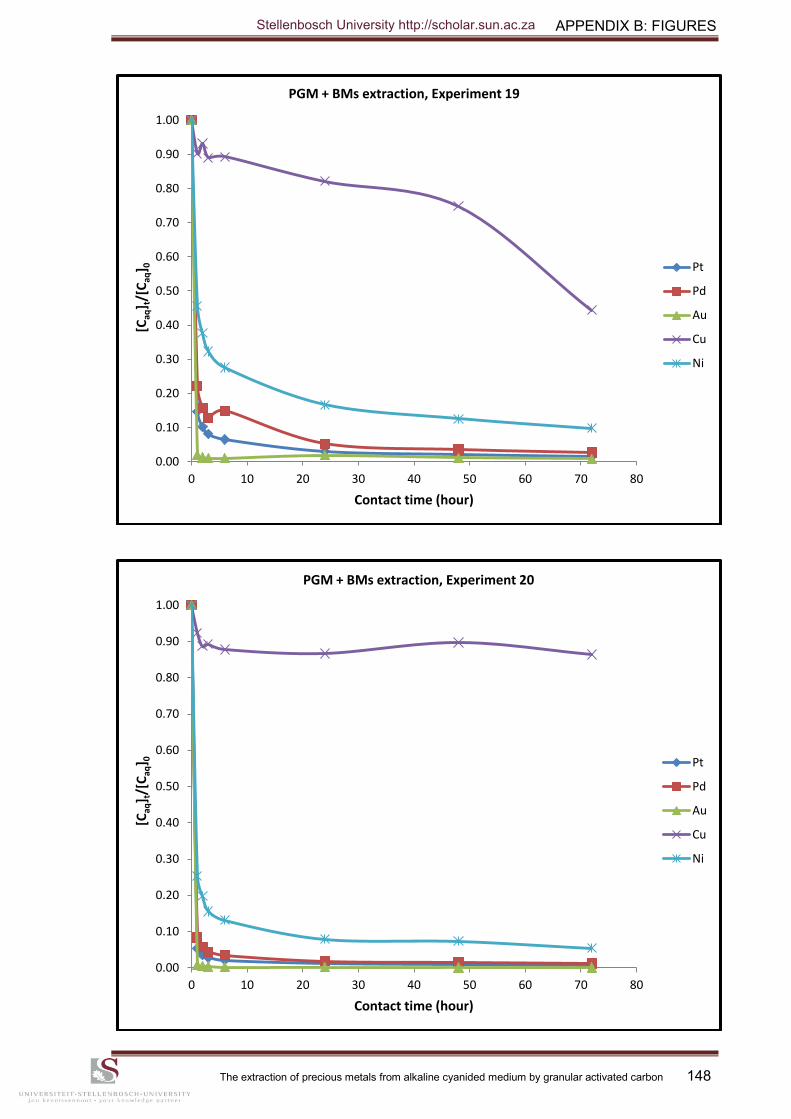
APPENDIX B: FIGURES
The extraction of precious metals from alkaline cyanided medium by granular activated carbon 148
0.00
0.10
0.20
0.30
0.40
0.50
0.60
0.70
0.80
0.90
1.00
0 10 20 30 40 50 60 70 80
[Caq
] t/[
Caq
] 0
Contact time (hour)
PGM + BMs extraction, Experiment 19
Pt
Pd
Au
Cu
Ni
0.00
0.10
0.20
0.30
0.40
0.50
0.60
0.70
0.80
0.90
1.00
0 10 20 30 40 50 60 70 80
[Caq
] t/[
Caq
] 0
Contact time (hour)
PGM + BMs extraction, Experiment 20
Pt
Pd
Au
Cu
Ni
Stellenbosch University http://scholar.sun.ac.za
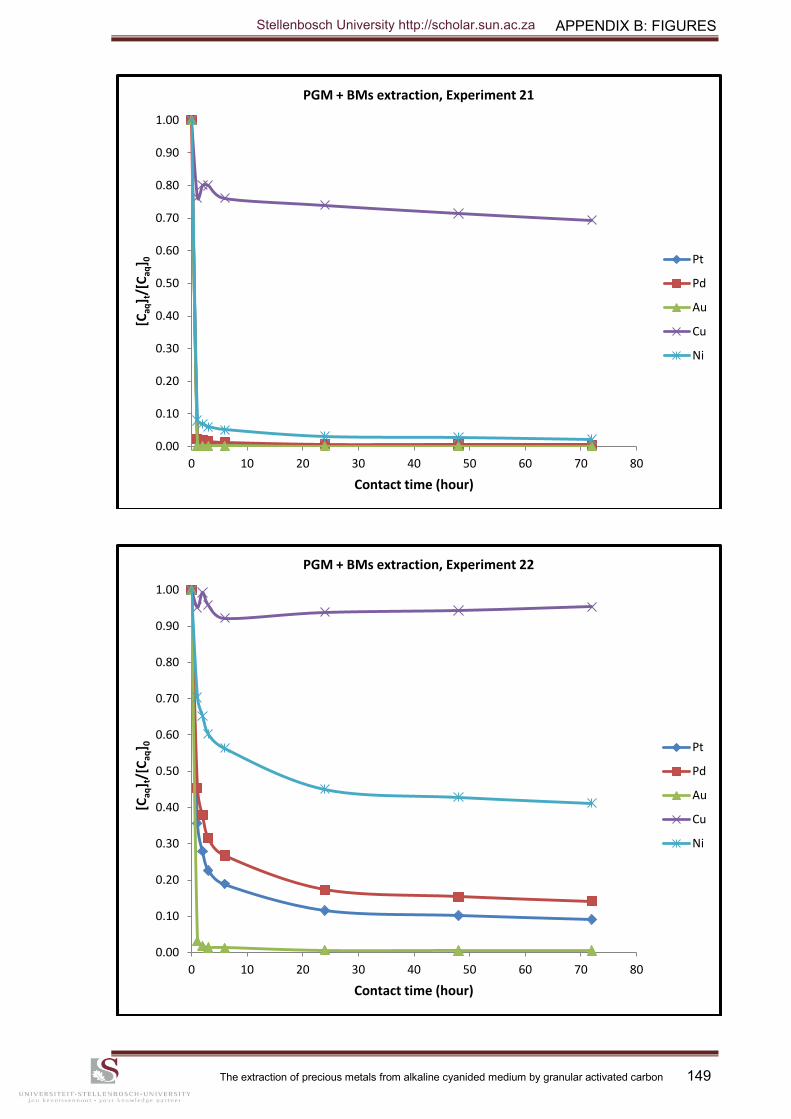
APPENDIX B: FIGURES
The extraction of precious metals from alkaline cyanided medium by granular activated carbon 149
0.00
0.10
0.20
0.30
0.40
0.50
0.60
0.70
0.80
0.90
1.00
0 10 20 30 40 50 60 70 80
[Caq
] t/[
Caq
] 0
Contact time (hour)
PGM + BMs extraction, Experiment 21
Pt
Pd
Au
Cu
Ni
0.00
0.10
0.20
0.30
0.40
0.50
0.60
0.70
0.80
0.90
1.00
0 10 20 30 40 50 60 70 80
[Caq
] t/[
Caq
] 0
Contact time (hour)
PGM + BMs extraction, Experiment 22
Pt
Pd
Au
Cu
Ni
Stellenbosch University http://scholar.sun.ac.za
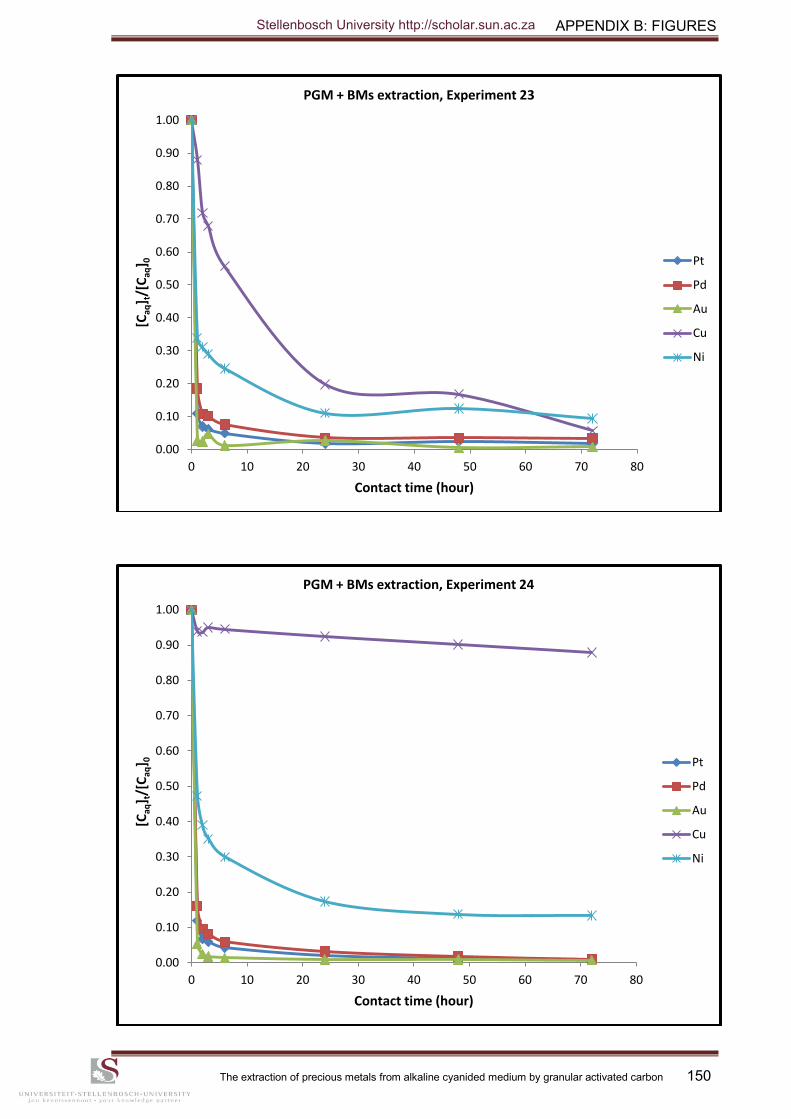
APPENDIX B: FIGURES
The extraction of precious metals from alkaline cyanided medium by granular activated carbon 150
0.00
0.10
0.20
0.30
0.40
0.50
0.60
0.70
0.80
0.90
1.00
0 10 20 30 40 50 60 70 80
[Caq
] t/[
Caq
] 0
Contact time (hour)
PGM + BMs extraction, Experiment 23
Pt
Pd
Au
Cu
Ni
0.00
0.10
0.20
0.30
0.40
0.50
0.60
0.70
0.80
0.90
1.00
0 10 20 30 40 50 60 70 80
[Caq
] t/[
Caq
] 0
Contact time (hour)
PGM + BMs extraction, Experiment 24
Pt
Pd
Au
Cu
Ni
Stellenbosch University http://scholar.sun.ac.za
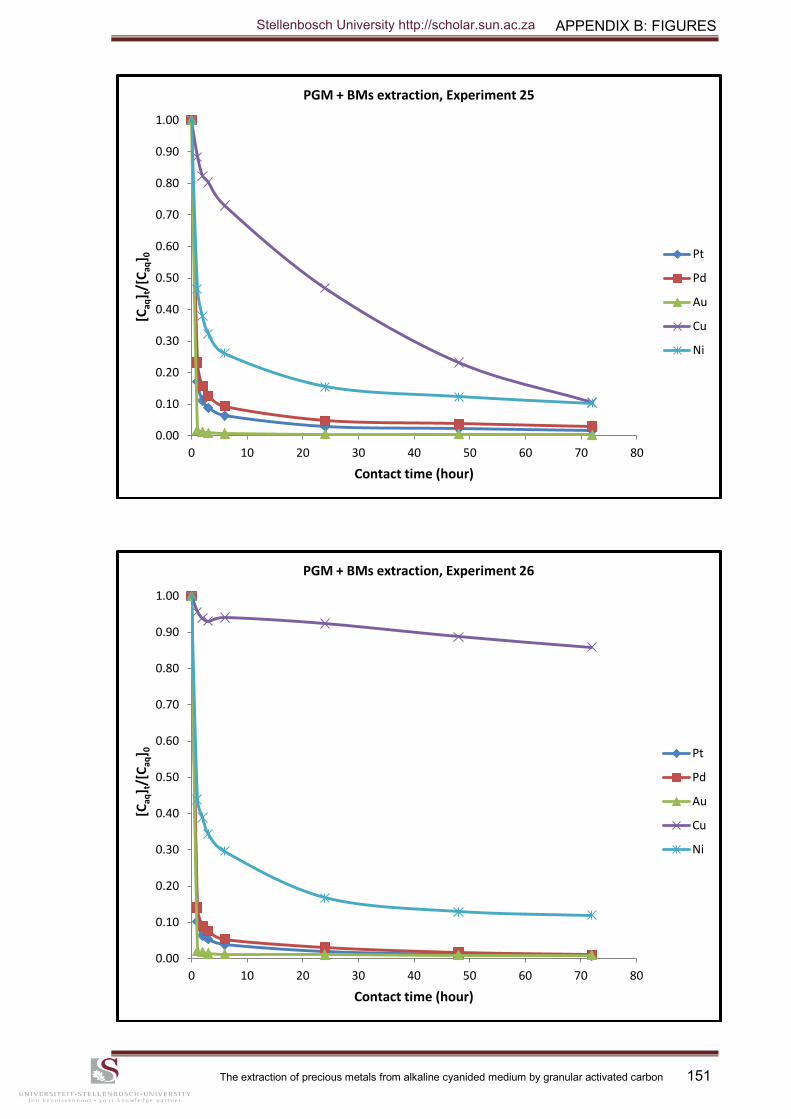
APPENDIX B: FIGURES
The extraction of precious metals from alkaline cyanided medium by granular activated carbon 151
0.00
0.10
0.20
0.30
0.40
0.50
0.60
0.70
0.80
0.90
1.00
0 10 20 30 40 50 60 70 80
[Caq
] t/[
Caq
] 0
Contact time (hour)
PGM + BMs extraction, Experiment 25
Pt
Pd
Au
Cu
Ni
0.00
0.10
0.20
0.30
0.40
0.50
0.60
0.70
0.80
0.90
1.00
0 10 20 30 40 50 60 70 80
[Caq
] t/[
Caq
] 0
Contact time (hour)
PGM + BMs extraction, Experiment 26
Pt
Pd
Au
Cu
Ni
Stellenbosch University http://scholar.sun.ac.za
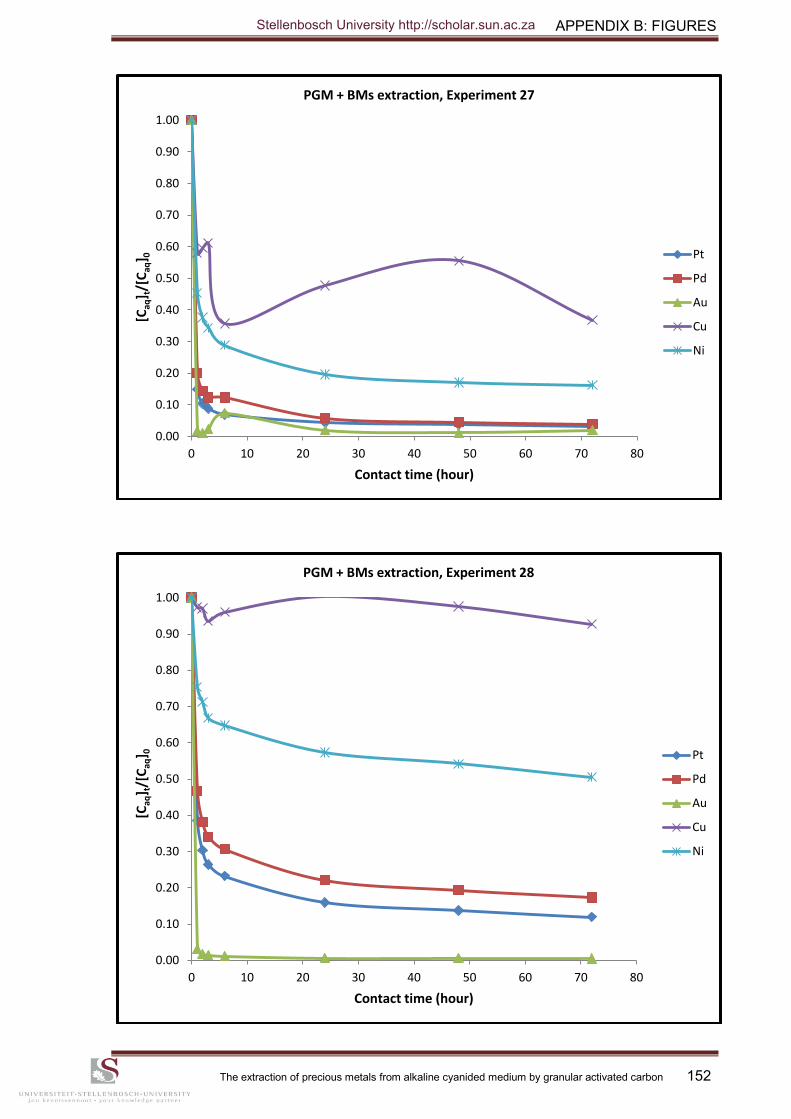
APPENDIX B: FIGURES
The extraction of precious metals from alkaline cyanided medium by granular activated carbon 152
0.00
0.10
0.20
0.30
0.40
0.50
0.60
0.70
0.80
0.90
1.00
0 10 20 30 40 50 60 70 80
[Caq
] t/[
Caq
] 0
Contact time (hour)
PGM + BMs extraction, Experiment 27
Pt
Pd
Au
Cu
Ni
0.00
0.10
0.20
0.30
0.40
0.50
0.60
0.70
0.80
0.90
1.00
0 10 20 30 40 50 60 70 80
[Caq
] t/[
Caq
] 0
Contact time (hour)
PGM + BMs extraction, Experiment 28
Pt
Pd
Au
Cu
Ni
Stellenbosch University http://scholar.sun.ac.za
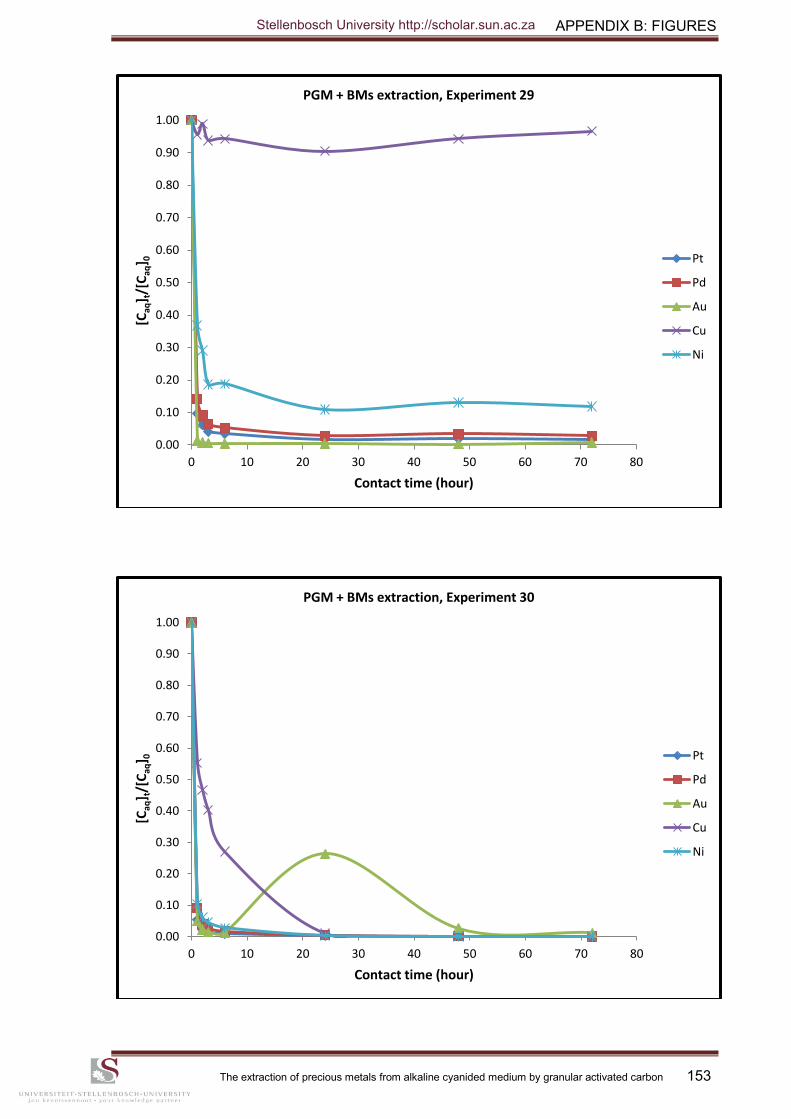
APPENDIX B: FIGURES
The extraction of precious metals from alkaline cyanided medium by granular activated carbon 153
0.00
0.10
0.20
0.30
0.40
0.50
0.60
0.70
0.80
0.90
1.00
0 10 20 30 40 50 60 70 80
[Caq
] t/[
Caq
] 0
Contact time (hour)
PGM + BMs extraction, Experiment 29
Pt
Pd
Au
Cu
Ni
0.00
0.10
0.20
0.30
0.40
0.50
0.60
0.70
0.80
0.90
1.00
0 10 20 30 40 50 60 70 80
[Caq
] t/[
Caq
] 0
Contact time (hour)
PGM + BMs extraction, Experiment 30
Pt
Pd
Au
Cu
Ni
Stellenbosch University http://scholar.sun.ac.za
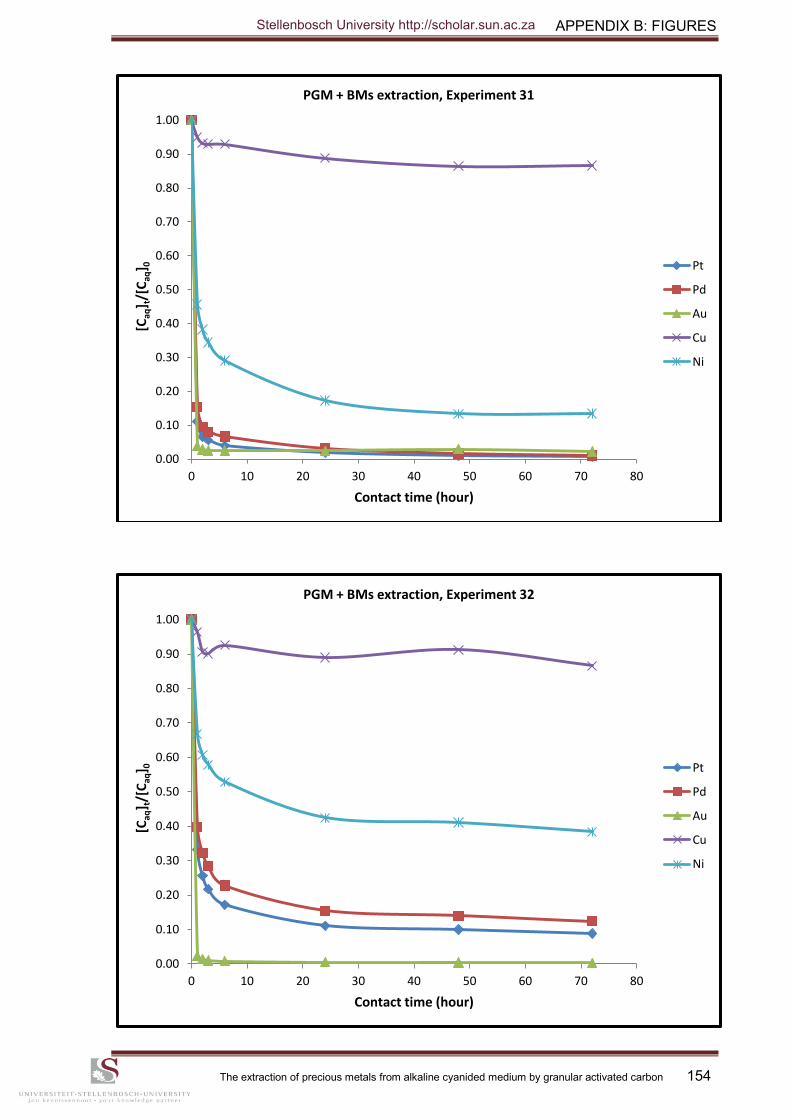
APPENDIX B: FIGURES
The extraction of precious metals from alkaline cyanided medium by granular activated carbon 154
0.00
0.10
0.20
0.30
0.40
0.50
0.60
0.70
0.80
0.90
1.00
0 10 20 30 40 50 60 70 80
[Caq
] t/[
Caq
] 0
Contact time (hour)
PGM + BMs extraction, Experiment 31
Pt
Pd
Au
Cu
Ni
0.00
0.10
0.20
0.30
0.40
0.50
0.60
0.70
0.80
0.90
1.00
0 10 20 30 40 50 60 70 80
[Caq
] t/[
Caq
] 0
Contact time (hour)
PGM + BMs extraction, Experiment 32
Pt
Pd
Au
Cu
Ni
Stellenbosch University http://scholar.sun.ac.za
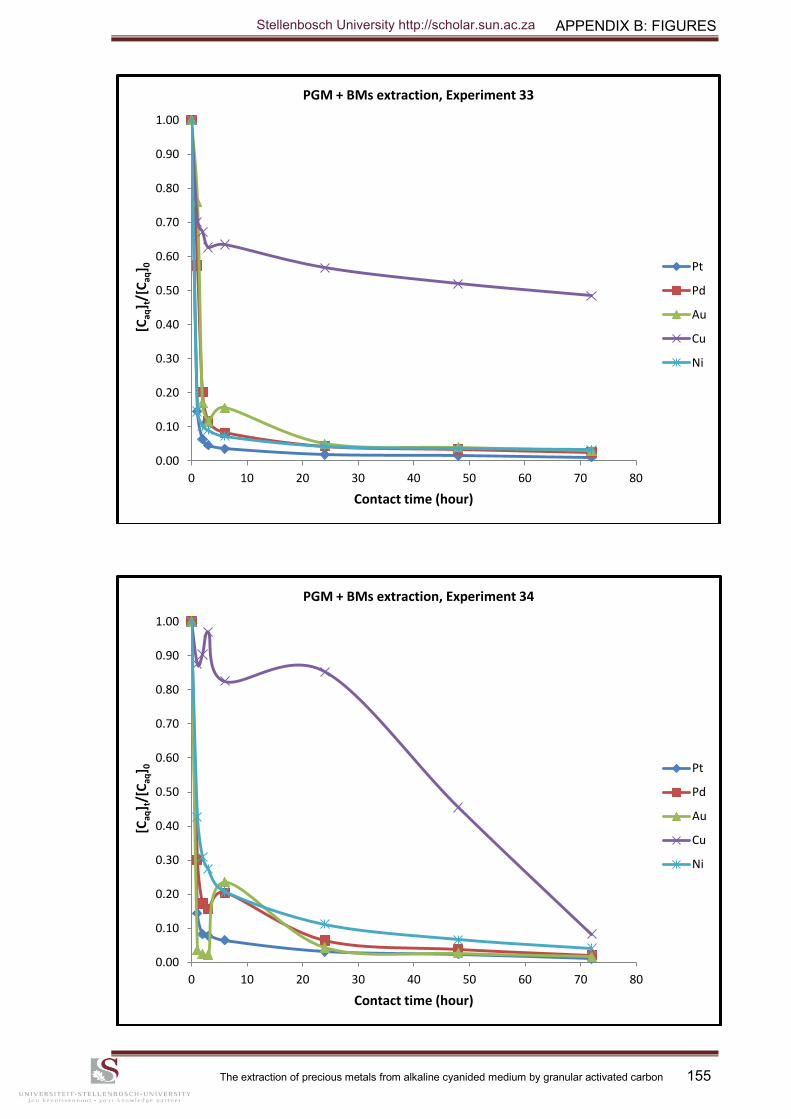
APPENDIX B: FIGURES
The extraction of precious metals from alkaline cyanided medium by granular activated carbon 155
0.00
0.10
0.20
0.30
0.40
0.50
0.60
0.70
0.80
0.90
1.00
0 10 20 30 40 50 60 70 80
[Caq
] t/[
Caq
] 0
Contact time (hour)
PGM + BMs extraction, Experiment 33
Pt
Pd
Au
Cu
Ni
0.00
0.10
0.20
0.30
0.40
0.50
0.60
0.70
0.80
0.90
1.00
0 10 20 30 40 50 60 70 80
[Caq
] t/[
Caq
] 0
Contact time (hour)
PGM + BMs extraction, Experiment 34
Pt
Pd
Au
Cu
Ni
Stellenbosch University http://scholar.sun.ac.za
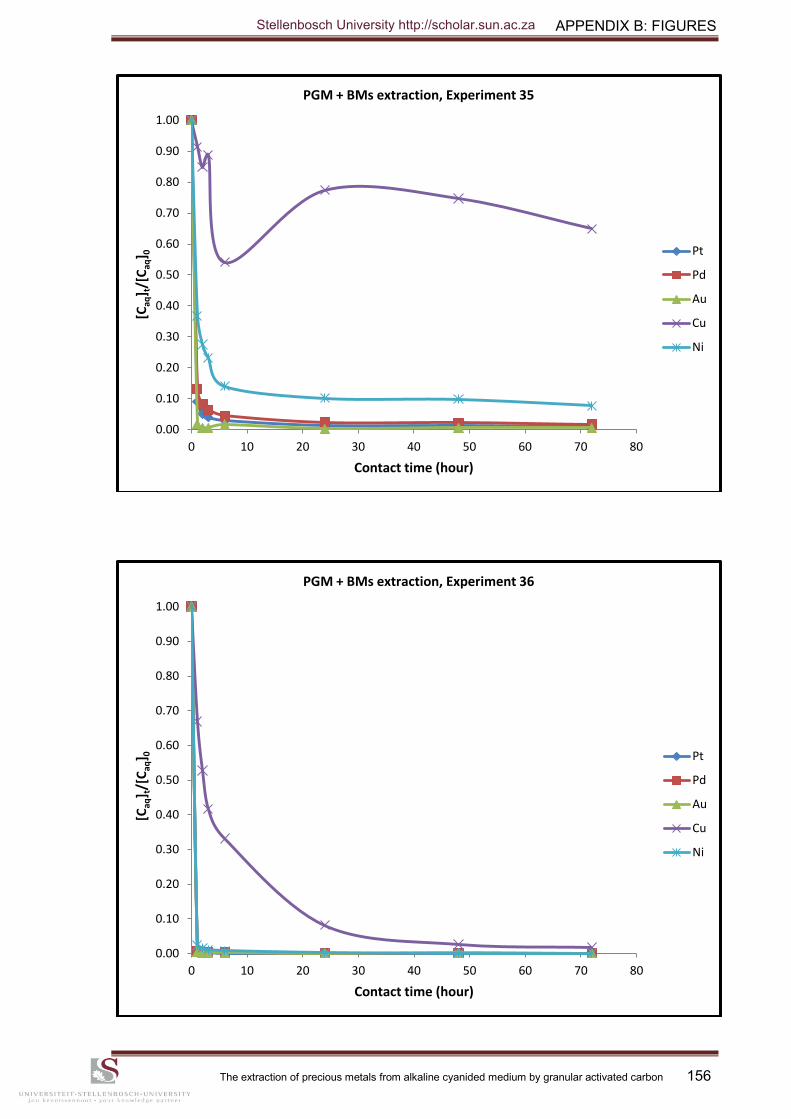
APPENDIX B: FIGURES
The extraction of precious metals from alkaline cyanided medium by granular activated carbon 156
0.00
0.10
0.20
0.30
0.40
0.50
0.60
0.70
0.80
0.90
1.00
0 10 20 30 40 50 60 70 80
[Caq
] t/[
Caq
] 0
Contact time (hour)
PGM + BMs extraction, Experiment 35
Pt
Pd
Au
Cu
Ni
0.00
0.10
0.20
0.30
0.40
0.50
0.60
0.70
0.80
0.90
1.00
0 10 20 30 40 50 60 70 80
[Caq
] t/[
Caq
] 0
Contact time (hour)
PGM + BMs extraction, Experiment 36
Pt
Pd
Au
Cu
Ni
Stellenbosch University http://scholar.sun.ac.za
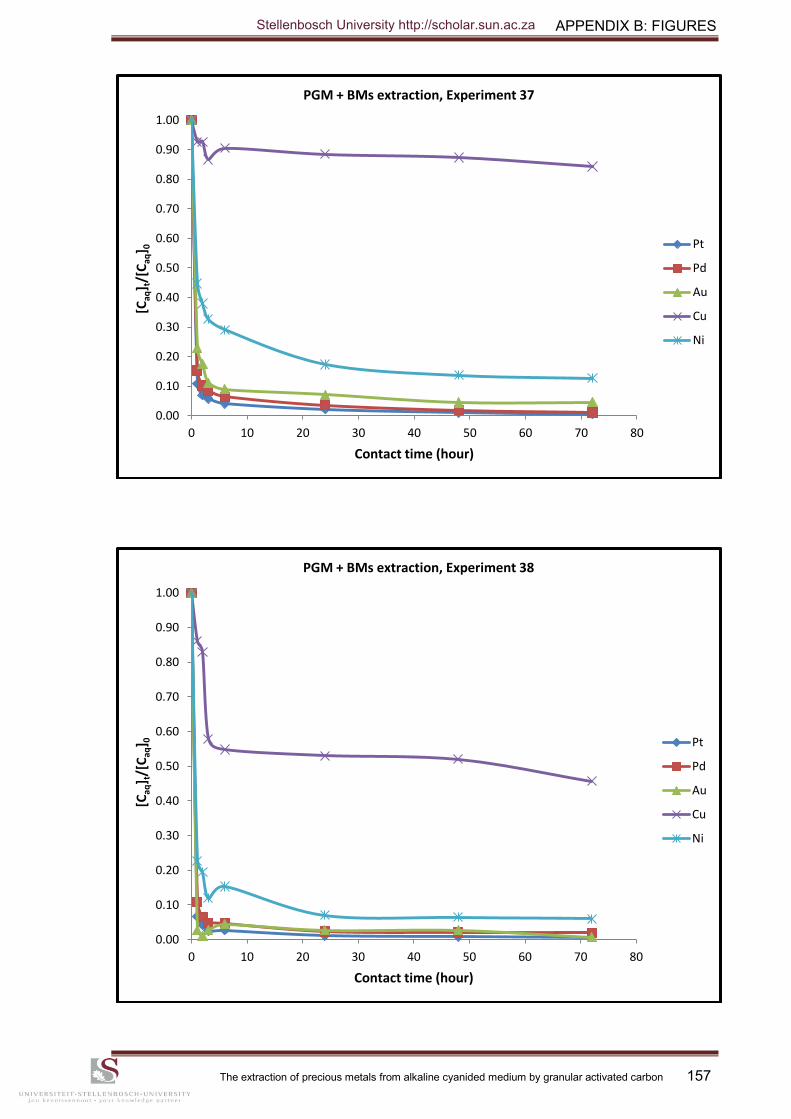
APPENDIX B: FIGURES
The extraction of precious metals from alkaline cyanided medium by granular activated carbon 157
0.00
0.10
0.20
0.30
0.40
0.50
0.60
0.70
0.80
0.90
1.00
0 10 20 30 40 50 60 70 80
[Caq
] t/[
Caq
] 0
Contact time (hour)
PGM + BMs extraction, Experiment 37
Pt
Pd
Au
Cu
Ni
0.00
0.10
0.20
0.30
0.40
0.50
0.60
0.70
0.80
0.90
1.00
0 10 20 30 40 50 60 70 80
[Caq
] t/[
Caq
] 0
Contact time (hour)
PGM + BMs extraction, Experiment 38
Pt
Pd
Au
Cu
Ni
Stellenbosch University http://scholar.sun.ac.za
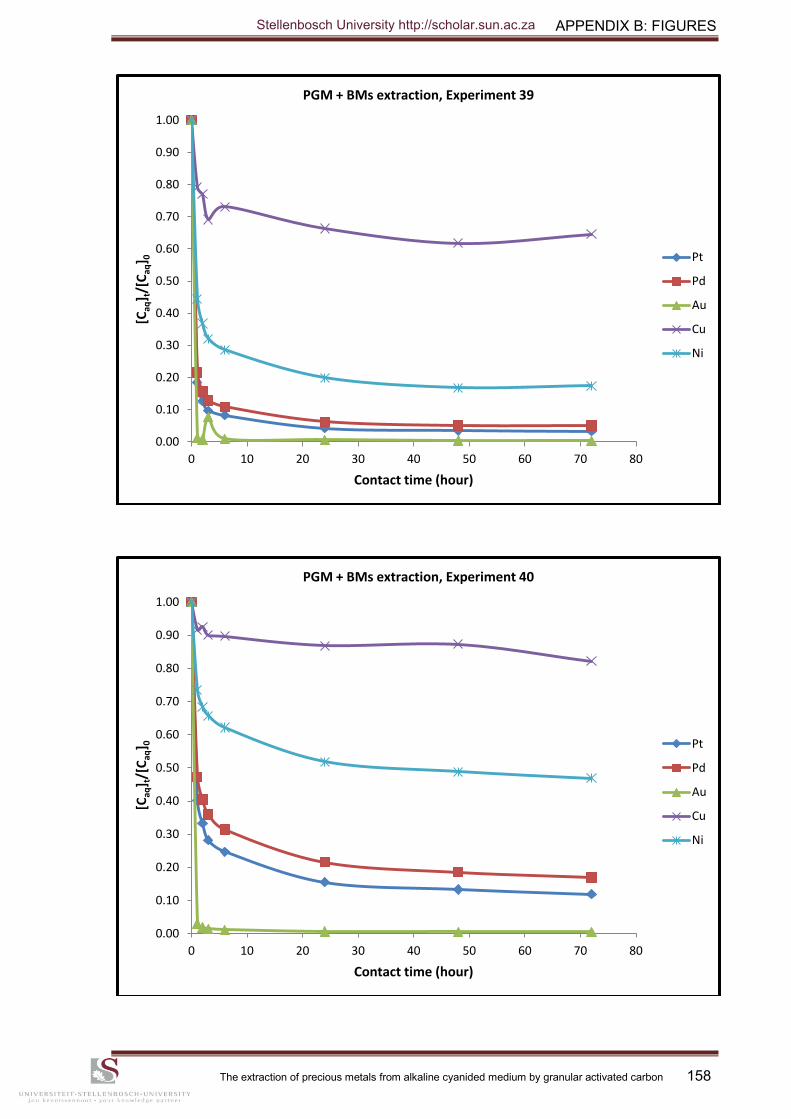
APPENDIX B: FIGURES
The extraction of precious metals from alkaline cyanided medium by granular activated carbon 158
0.00
0.10
0.20
0.30
0.40
0.50
0.60
0.70
0.80
0.90
1.00
0 10 20 30 40 50 60 70 80
[Caq
] t/[
Caq
] 0
Contact time (hour)
PGM + BMs extraction, Experiment 39
Pt
Pd
Au
Cu
Ni
0.00
0.10
0.20
0.30
0.40
0.50
0.60
0.70
0.80
0.90
1.00
0 10 20 30 40 50 60 70 80
[Caq
] t/[
Caq
] 0
Contact time (hour)
PGM + BMs extraction, Experiment 40
Pt
Pd
Au
Cu
Ni
Stellenbosch University http://scholar.sun.ac.za
APPENDIX C: TABULATION OF STATISTICAL DATA
The extraction of precious metals from alkaline cyanided medium by granular activated carbon 159
APPENDIX C
TABULATION OF STATISTICAL DATA
Stellenbosch University http://scholar.sun.ac.za
APPENDIX C: TABULATION OF STATISTICAL DATA
The extraction of precious metals from alkaline cyanided medium by granular activated carbon 160
Response 1: Pt(II) extraction, ANOVA for selected factorial model
Source
Sum of
squares df
Mean
square F value
p-value
Prob > F
Block 18.67 7 2.667517
Model 3691.19 5 738.2378 314.9059 < 0.0001 significant
A-pH 46.59 1 46.58538 19.87166 0.0001
B-[Cu(I)] 46.63 1 46.63365 19.89225 0.0001
C-[Ni(II)] 2221.28 1 2221.278 947.518 < 0.0001
G-[AC] 950.15 1 950.153 405.3014 < 0.0001
CG 426.54 1 426.539 181.9464 < 0.0001
Curvature 127.86 1 127.8599 54.54047 < 0.0001 significant
Residual 60.95 26 2.344312
Cor Total 3898.67 39
The model F-value of 105.57 implies the model is significant. There is only a 0.01% chance
that a "model F-value" this large could occur due to noise.
Std. Dev. 2.644435 R-squared 0.951337
Mean 88.73175 Adj R-squared 0.942325
C.V. % 2.980258 Pred R-squared 0.906527
PRESS 362.6771 Adeq precision 21.85568
ANOVA summary
Adjusted model Unadjusted model
F-value p-value F-value p-value
Model 314.9059 < 0.0001 105.5676 < 0.0001
Curvature 54.54047 < 0.0001
Stellenbosch University http://scholar.sun.ac.za
APPENDIX C: TABULATION OF STATISTICAL DATA
The extraction of precious metals from alkaline cyanided medium by granular activated carbon 161
Response 2: Pd(II) extraction, ANOVA for selected factorial model
The model F-value of 20.73 implies the model is significant. There is only a 0.01% chance
that a "model F-value" this large could occur due to noise.
Std. Dev. 5.341216 R-squared 0.890269
Mean 83.81725 Adj R-squared 0.847331
C.V. % 6.372454 Pred R-squared 0.694125
PRESS 1829.044 Adeq precision 13.74317
ANOVA summary
Adjusted model Unadjusted model
F-value p-value F-value p-value
Model 33.80459 < 0.0001 20.73376 < 0.0001
Curvature 15.4995 0.0007
Source
Sum of
squares df
Mean
square F value
p-value
Prob > F
Block 316.6363 7 45.23375
Model 5323.544 9 591.5048 20.73376 < 0.0001 significant
B-[Cu(I)] 142.3406 1 142.3406 4.989403 0.0355
C-[Ni(II)] 2567.757 1 2567.757 90.00646 < 0.0001
D-[CN] 22.09463 1 22.09463 0.774473 0.3879
F-[PMs] 284.5902 1 284.5902 9.975613 0.0044
G-[AC] 1597.114 1 1597.114 55.98293 < 0.0001
BD 80.10615 1 80.10615 2.807926 0.1073
BF 104.582 1 104.582 3.665865 0.0681
CD 224.773 1 224.773 7.878869 0.0100
CG 300.1863 1 300.1863 10.5223 0.0036
Residual 656.1575 23 28.52859
Cor Total 6296.337 39
Stellenbosch University http://scholar.sun.ac.za
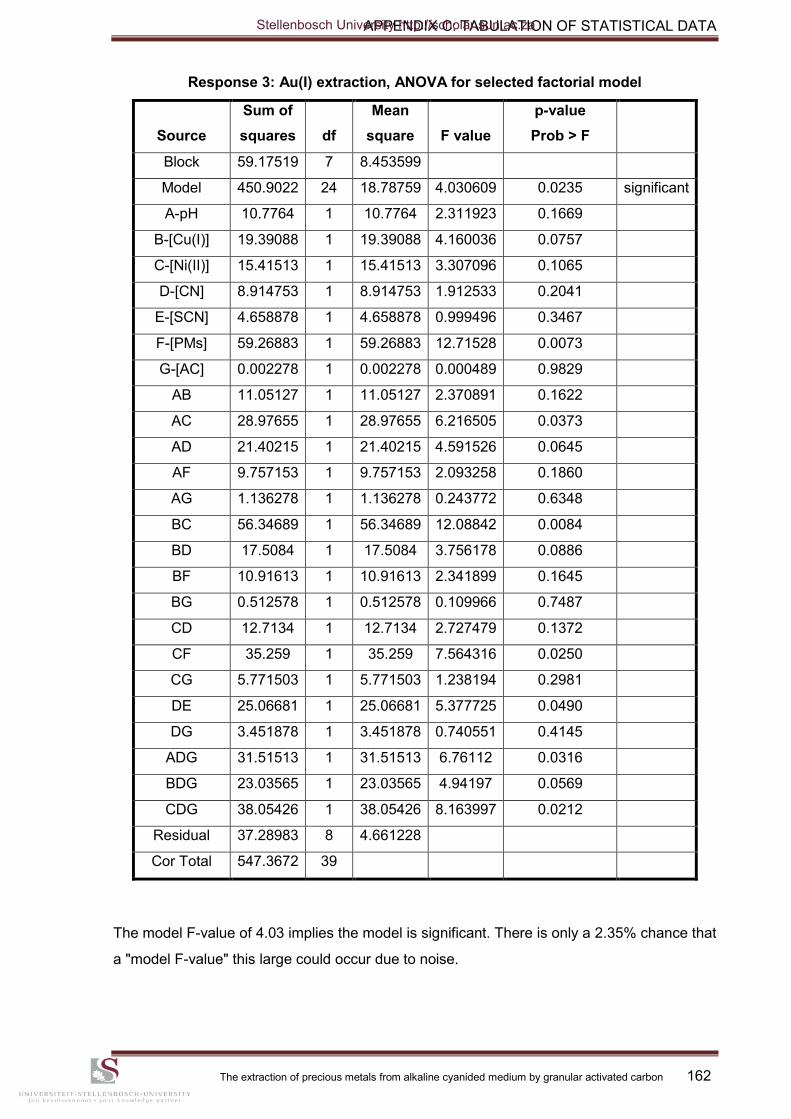
APPENDIX C: TABULATION OF STATISTICAL DATA
The extraction of precious metals from alkaline cyanided medium by granular activated carbon 162
Response 3: Au(I) extraction, ANOVA for selected factorial model
Source
Sum of
squares df
Mean
square F value
p-value
Prob > F
Block 59.17519 7 8.453599
Model 450.9022 24 18.78759 4.030609 0.0235 significant
A-pH 10.7764 1 10.7764 2.311923 0.1669
B-[Cu(I)] 19.39088 1 19.39088 4.160036 0.0757
C-[Ni(II)] 15.41513 1 15.41513 3.307096 0.1065
D-[CN] 8.914753 1 8.914753 1.912533 0.2041
E-[SCN] 4.658878 1 4.658878 0.999496 0.3467
F-[PMs] 59.26883 1 59.26883 12.71528 0.0073
G-[AC] 0.002278 1 0.002278 0.000489 0.9829
AB 11.05127 1 11.05127 2.370891 0.1622
AC 28.97655 1 28.97655 6.216505 0.0373
AD 21.40215 1 21.40215 4.591526 0.0645
AF 9.757153 1 9.757153 2.093258 0.1860
AG 1.136278 1 1.136278 0.243772 0.6348
BC 56.34689 1 56.34689 12.08842 0.0084
BD 17.5084 1 17.5084 3.756178 0.0886
BF 10.91613 1 10.91613 2.341899 0.1645
BG 0.512578 1 0.512578 0.109966 0.7487
CD 12.7134 1 12.7134 2.727479 0.1372
CF 35.259 1 35.259 7.564316 0.0250
CG 5.771503 1 5.771503 1.238194 0.2981
DE 25.06681 1 25.06681 5.377725 0.0490
DG 3.451878 1 3.451878 0.740551 0.4145
ADG 31.51513 1 31.51513 6.76112 0.0316
BDG 23.03565 1 23.03565 4.94197 0.0569
CDG 38.05426 1 38.05426 8.163997 0.0212
Residual 37.28983 8 4.661228
Cor Total 547.3672 39
The model F-value of 4.03 implies the model is significant. There is only a 2.35% chance that
a "model F-value" this large could occur due to noise.
Stellenbosch University http://scholar.sun.ac.za
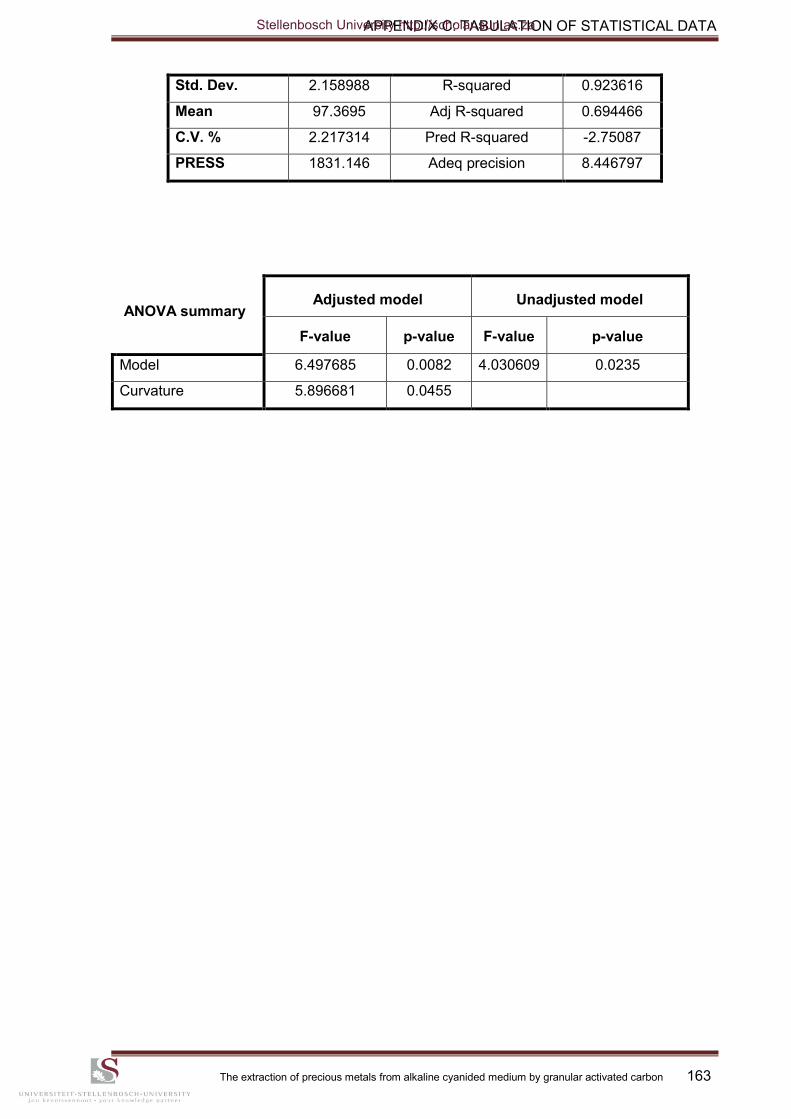
APPENDIX C: TABULATION OF STATISTICAL DATA
The extraction of precious metals from alkaline cyanided medium by granular activated carbon 163
Std. Dev. 2.158988 R-squared 0.923616
Mean 97.3695 Adj R-squared 0.694466
C.V. % 2.217314 Pred R-squared -2.75087
PRESS 1831.146 Adeq precision 8.446797
ANOVA summary
Adjusted model Unadjusted model
F-value p-value F-value p-value
Model 6.497685 0.0082 4.030609 0.0235
Curvature 5.896681 0.0455
Stellenbosch University http://scholar.sun.ac.za
APPENDIX D: SUPPORTING CALCULATIONS
The extraction of precious metals from alkaline cyanided medium by granular activated carbon 164
APPENDIX D
SUPPORTING CALCULATIONS DERIVED
FROM
SYNTHETIC STOCK SOLUTION
PREPARATION
–
MEAN PARTICLE SIZE
OF
ACTIVATED CARBON
Stellenbosch University http://scholar.sun.ac.za
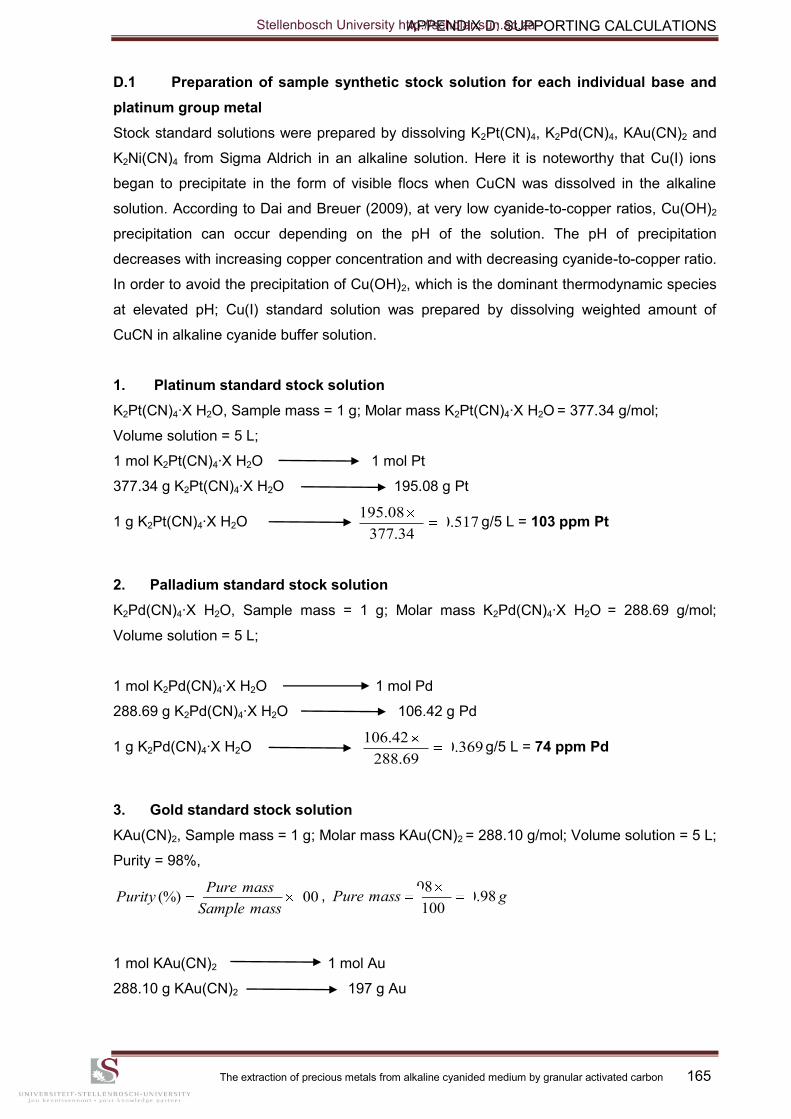
APPENDIX D: SUPPORTING CALCULATIONS
The extraction of precious metals from alkaline cyanided medium by granular activated carbon 165
D.1 Preparation of sample synthetic stock solution for each individual base and
platinum group metal
Stock standard solutions were prepared by dissolving K2Pt(CN)4, K2Pd(CN)4, KAu(CN)2 and
K2Ni(CN)4 from Sigma Aldrich in an alkaline solution. Here it is noteworthy that Cu(I) ions
began to precipitate in the form of visible flocs when CuCN was dissolved in the alkaline
solution. According to Dai and Breuer (2009), at very low cyanide-to-copper ratios, Cu(OH)2
precipitation can occur depending on the pH of the solution. The pH of precipitation
decreases with increasing copper concentration and with decreasing cyanide-to-copper ratio.
In order to avoid the precipitation of Cu(OH)2, which is the dominant thermodynamic species
at elevated pH; Cu(I) standard solution was prepared by dissolving weighted amount of
CuCN in alkaline cyanide buffer solution.
1. Platinum standard stock solution
K2Pt(CN)4·X H2O, Sample mass = 1 g; Molar mass K2Pt(CN)4·X H2O = 377.34 g/mol;
Volume solution = 5 L;
1 mol K2Pt(CN)4·X H2O 1 mol Pt
377.34 g K2Pt(CN)4·X H2O 195.08 g Pt
1 g K2Pt(CN)4·X H2O 517.034.377
108.195g/5 L = 103 ppm Pt
2. Palladium standard stock solution
K2Pd(CN)4·X H2O, Sample mass = 1 g; Molar mass K2Pd(CN)4·X H2O = 288.69 g/mol;
Volume solution = 5 L;
1 mol K2Pd(CN)4·X H2O 1 mol Pd
288.69 g K2Pd(CN)4·X H2O 106.42 g Pd
1 g K2Pd(CN)4·X H2O 369.069.288
142.106g/5 L = 74 ppm Pd
3. Gold standard stock solution
KAu(CN)2, Sample mass = 1 g; Molar mass KAu(CN)2 = 288.10 g/mol; Volume solution = 5 L;
Purity = 98%,
100(%)massSample
massPurePurity , gmassPure 98.0
100
198
1 mol KAu(CN)2 1 mol Au
288.10 g KAu(CN)2 197 g Au
Stellenbosch University http://scholar.sun.ac.za
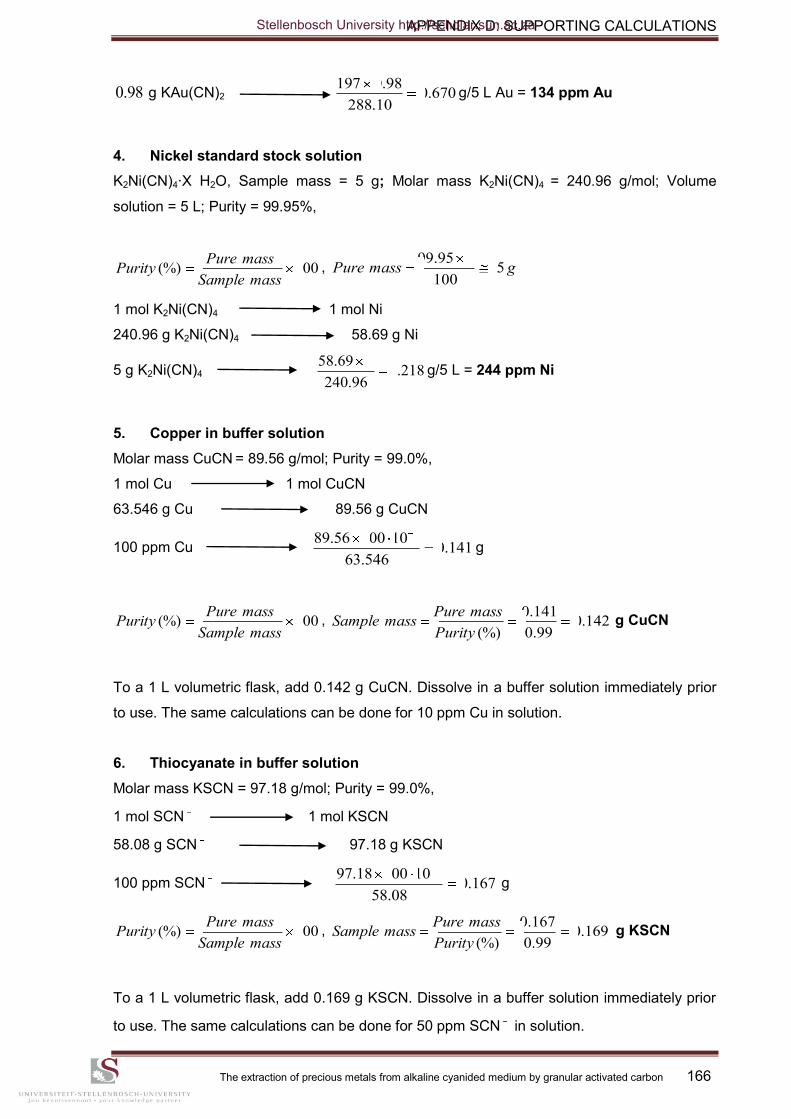
APPENDIX D: SUPPORTING CALCULATIONS
The extraction of precious metals from alkaline cyanided medium by granular activated carbon 166
98.0 g KAu(CN)2 670.010.288
98.0197g/5 L Au = 134 ppm Au
4. Nickel standard stock solution
K2Ni(CN)4·X H2O, Sample mass = 5 g; Molar mass K2Ni(CN)4 = 240.96 g/mol; Volume
solution = 5 L; Purity = 99.95%,
100(%)massSample
massPurePurity , gmassPure 5
100
595.99
1 mol K2Ni(CN)4 1 mol Ni
240.96 g K2Ni(CN)4 58.69 g Ni
5 g K2Ni(CN)4 218.196.240
569.58g/5 L = 244 ppm Ni
5. Copper in buffer solution
Molar mass CuCN = 89.56 g/mol; Purity = 99.0%,
1 mol Cu 1 mol CuCN
63.546 g Cu 89.56 g CuCN
100 ppm Cu 141.0546.63
1010056.89 3
g
100(%)massSample
massPurePurity , 142.0
99.0
141.0
(%)Purity
massPuremassSample g CuCN
To a 1 L volumetric flask, add 0.142 g CuCN. Dissolve in a buffer solution immediately prior
to use. The same calculations can be done for 10 ppm Cu in solution.
6. Thiocyanate in buffer solution
Molar mass KSCN = 97.18 g/mol; Purity = 99.0%,
1 mol SCN 1 mol KSCN
58.08 g SCN 97.18 g KSCN
100 ppm SCN 167.008.58
1010018.97 3
g
100(%)massSample
massPurePurity , 169.0
99.0
167.0
(%)Purity
massPuremassSample g KSCN
To a 1 L volumetric flask, add 0.169 g KSCN. Dissolve in a buffer solution immediately prior
to use. The same calculations can be done for 50 ppm SCN in solution.
Stellenbosch University http://scholar.sun.ac.za
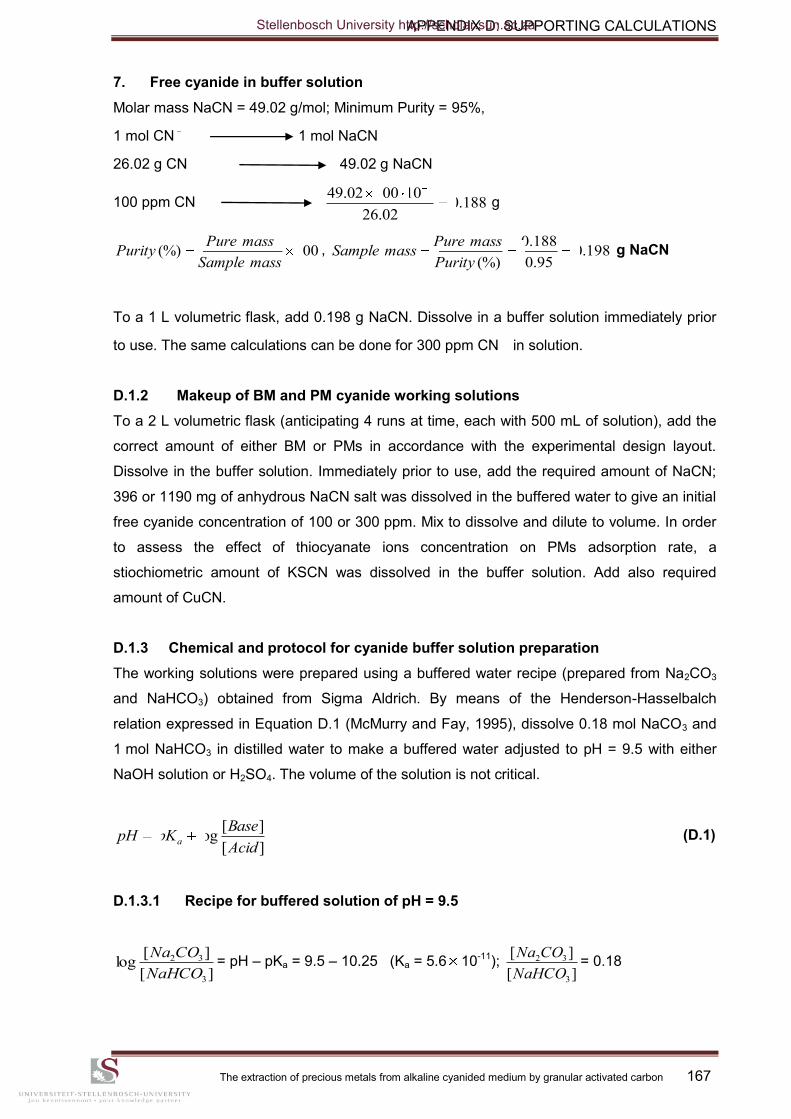
APPENDIX D: SUPPORTING CALCULATIONS
The extraction of precious metals from alkaline cyanided medium by granular activated carbon 167
7. Free cyanide in buffer solution
Molar mass NaCN = 49.02 g/mol; Minimum Purity = 95%,
1 mol CN 1 mol NaCN
26.02 g CN 49.02 g NaCN
100 ppm CN 188.002.26
1010002.49 3
g
100(%)massSample
massPurePurity , 198.0
95.0
188.0
(%)Purity
massPuremassSample g NaCN
To a 1 L volumetric flask, add 0.198 g NaCN. Dissolve in a buffer solution immediately prior
to use. The same calculations can be done for 300 ppm CN in solution.
D.1.2 Makeup of BM and PM cyanide working solutions
To a 2 L volumetric flask (anticipating 4 runs at time, each with 500 mL of solution), add the
correct amount of either BM or PMs in accordance with the experimental design layout.
Dissolve in the buffer solution. Immediately prior to use, add the required amount of NaCN;
396 or 1190 mg of anhydrous NaCN salt was dissolved in the buffered water to give an initial
free cyanide concentration of 100 or 300 ppm. Mix to dissolve and dilute to volume. In order
to assess the effect of thiocyanate ions concentration on PMs adsorption rate, a
stiochiometric amount of KSCN was dissolved in the buffer solution. Add also required
amount of CuCN.
D.1.3 Chemical and protocol for cyanide buffer solution preparation
The working solutions were prepared using a buffered water recipe (prepared from Na2CO3
and NaHCO3) obtained from Sigma Aldrich. By means of the Henderson-Hasselbalch
relation expressed in Equation D.1 (McMurry and Fay, 1995), dissolve 0.18 mol NaCO3 and
1 mol NaHCO3 in distilled water to make a buffered water adjusted to pH = 9.5 with either
NaOH solution or H2SO4. The volume of the solution is not critical.
][
][log
Acid
BasepKpH a
(D.1)
D.1.3.1 Recipe for buffered solution of pH = 9.5
][
][log
3
32
NaHCO
CONa= pH – pKa = 9.5 – 10.25 (Ka = 5.6 10-11);
][
][
3
32
NaHCO
CONa= 0.18
Stellenbosch University http://scholar.sun.ac.za
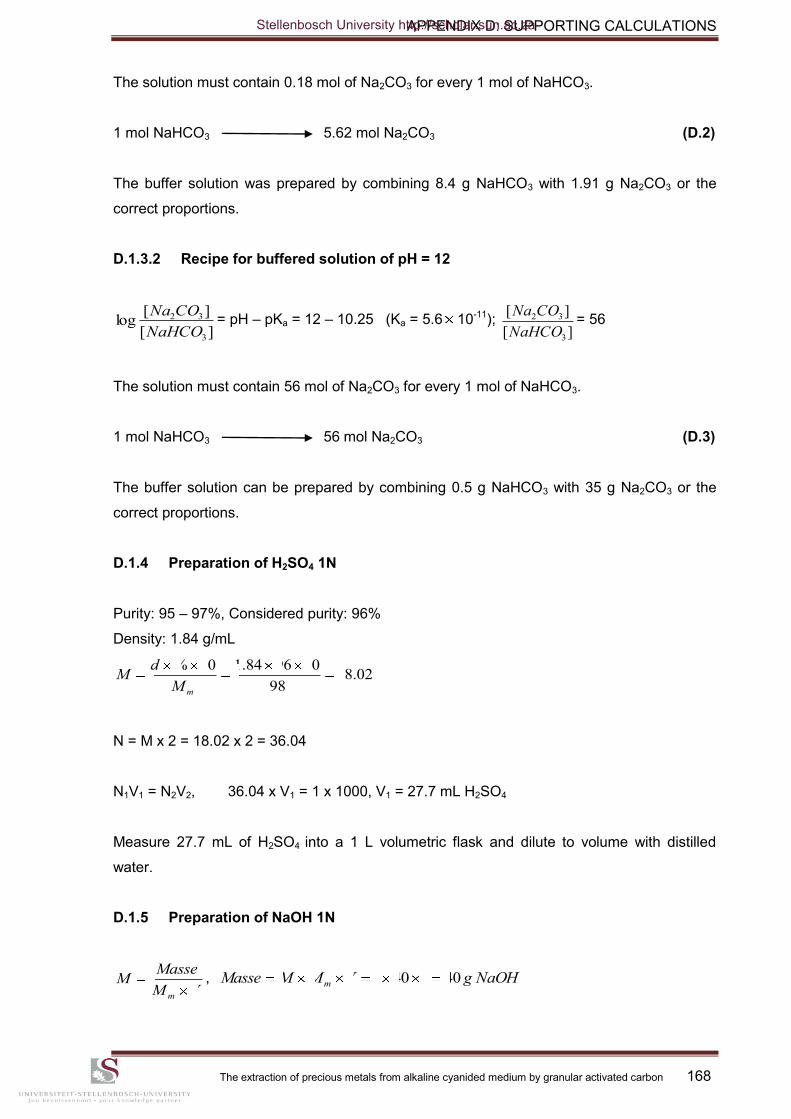
APPENDIX D: SUPPORTING CALCULATIONS
The extraction of precious metals from alkaline cyanided medium by granular activated carbon 168
The solution must contain 0.18 mol of Na2CO3 for every 1 mol of NaHCO3.
1 mol NaHCO3 5.62 mol Na2CO3 (D.2)
The buffer solution was prepared by combining 8.4 g NaHCO3 with 1.91 g Na2CO3 or the
correct proportions.
D.1.3.2 Recipe for buffered solution of pH = 12
][
][log
3
32
NaHCO
CONa= pH – pKa = 12 – 10.25 (Ka = 5.6 10-11);
][
][
3
32
NaHCO
CONa= 56
The solution must contain 56 mol of Na2CO3 for every 1 mol of NaHCO3.
1 mol NaHCO3 56 mol Na2CO3 (D.3)
The buffer solution can be prepared by combining 0.5 g NaHCO3 with 35 g Na2CO3 or the
correct proportions.
D.1.4 Preparation of H2SO4 1N
Purity: 95 – 97%, Considered purity: 96%
Density: 1.84 g/mL
02.1898
109684.110%
mM
dM
N = M x 2 = 18.02 x 2 = 36.04
N1V1 = N2V2, 36.04 x V1 = 1 x 1000, V1 = 27.7 mL H2SO4
Measure 27.7 mL of H2SO4 into a 1 L volumetric flask and dilute to volume with distilled
water.
D.1.5 Preparation of NaOH 1N
VM
MasseM
m
, NaOHgVMMMasse m 401401
Stellenbosch University http://scholar.sun.ac.za
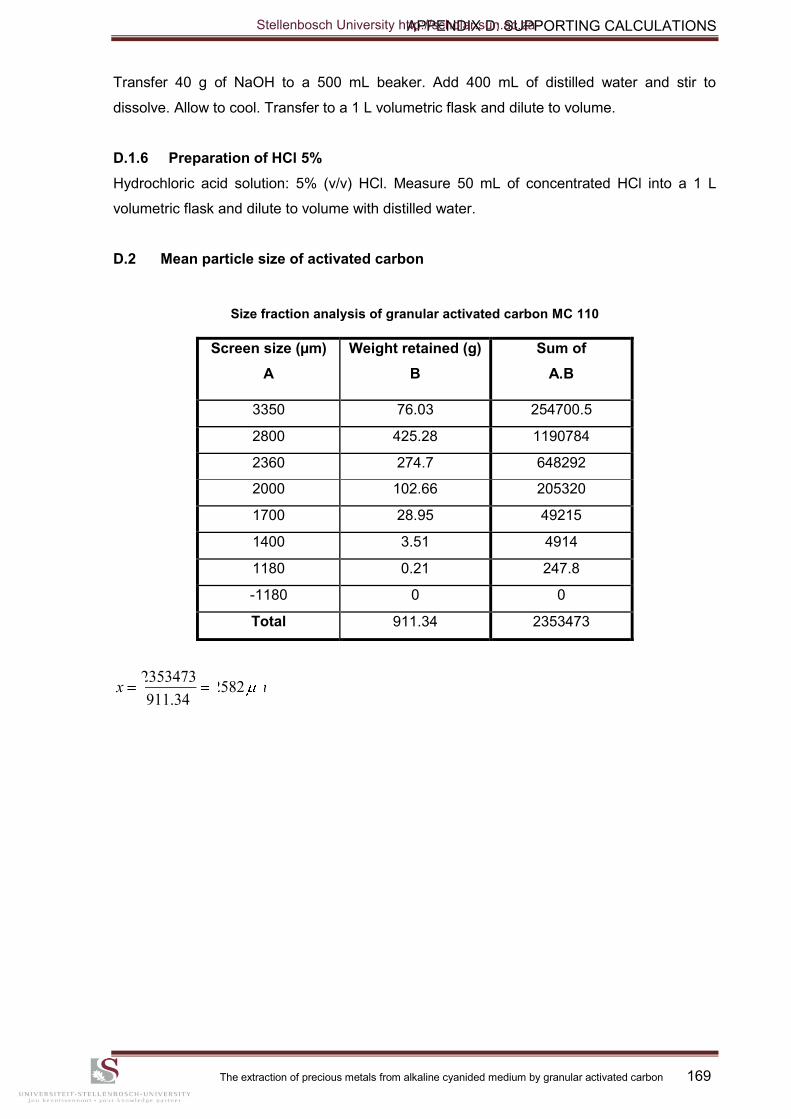
APPENDIX D: SUPPORTING CALCULATIONS
The extraction of precious metals from alkaline cyanided medium by granular activated carbon 169
Transfer 40 g of NaOH to a 500 mL beaker. Add 400 mL of distilled water and stir to
dissolve. Allow to cool. Transfer to a 1 L volumetric flask and dilute to volume.
D.1.6 Preparation of HCl 5%
Hydrochloric acid solution: 5% (v/v) HCl. Measure 50 mL of concentrated HCl into a 1 L
volumetric flask and dilute to volume with distilled water.
D.2 Mean particle size of activated carbon
Size fraction analysis of granular activated carbon MC 110
Screen size (µm)
A
Weight retained (g)
B
Sum of
A.B
3350 76.03 254700.5
2800 425.28 1190784
2360 274.7 648292
2000 102.66 205320
1700 28.95 49215
1400 3.51 4914
1180 0.21 247.8
-1180 0 0
Total 911.34 2353473
mx 258234.911
2353473
Stellenbosch University http://scholar.sun.ac.za
APPENDIX E: RISK MANAGEMENT PLAN
The extraction of precious metals from alkaline cyanided medium by granular activated carbon 170
APPENDIX E
RISK MANAGEMENT PLAN FOR AKANANI
PLATINUM PROJECT
(Adapted from Mwase, 2011)
Stellenbosch University http://scholar.sun.ac.za
APPENDIX E: RISK MANAGEMENT PLAN
The extraction of precious metals from alkaline cyanided medium by granular activated carbon 171
E.1 EXECUTIVE SUMMARY
Risk is defined as the likelihood of a desirable or undesirable event occurring and the
severity of the consequences (positive or negative) of the occurrence. All projects assume
some element of risk and it is through risk management where tools and techniques are
applied to monitor and track those events that have the potential to impact the outcome of a
project.
Cyanidation is a well established technology for recovery of gold and silver from grades of
ores. Despite the toxic nature of cyanide, all hydrometallurgical operations take place in open
reactor vessels (open heaps, tanks and vats) with the exception of pressure cyanidation
used exclusively for platinum recovery from spent petroleum and autocatalysts. This goes to
how well cyanide risk management has developed over time. The question now remains to
demonstrate how well cyanide risk management techniques employed in industry and
specialist laboratories like Mintek can be applied in the experimental phase of the proposed
project titled “Investigating the extraction of PMs from alkaline cyanided pulp by granular
activated carbon.” The investigation will be conducted by Ngoie Mpinga under the
supervision of Prof Steven Bradshaw and Guven Akdogan of Stellenbosch University.
Risk management is an ongoing process that continues through the life of a project. It
includes processes for risk management planning, identification, analysis, monitoring and
control. Many of these processes are updated throughout the project lifecycle as new risks
can be identified at any time.
E.2 PURPOSE
It is the objective of risk management to decrease the probability and impact of events
adverse to the project. On the other hand, any event that could have a positive impact should
be exploited. The present risk management plan is necessitated by the fact that Stellenbosch
University does not possess any dedicated facilities for conducting experimental work with
cyanide and as such, the proposed experimental work with cyanide will be conducted in a
shared work space with a number of individuals who are not directly linked to the
investigation.
This plan documents the processes, tools and procedures that will be used to manage and
control those events that could have a negative impact on the Akanani Platinum Project. It is
therefore, the controlling document for managing and controlling all project risks. It defines
roles and responsibilities for participants in the risk processes, risk management activities
that will be carried out.
Stellenbosch University http://scholar.sun.ac.za
APPENDIX E: RISK MANAGEMENT PLAN
The extraction of precious metals from alkaline cyanided medium by granular activated carbon 172
E.3 PROJECT BACKGROUND
The focus of the project is a low grade material generated by the mineral processing stage in
the platinum and base metal recovery process at Lonmin mine. What is being sought is a
method to adsorb PMs from a cyanided alkaline medium from bioheap leach process
excluding further treatments such as solid-liquid separation.
Given the success of the carbon-in-pulp process with gold bearing materials of a similar
nature: low metal value and high tonnage; it has been identified – the material under
investigation – as a suitable candidate for evaluation.
E.4 RISK MANAGEMENT STRATEGY
The proposed experimental work will involve PM adsorption tests that will be performed with
the traditional bottle-on-rolls method in 2.5 litre bottles containing 500 mL of a cyanided
solution. The procedure will be:
to contact varying amounts of carbon with 500 mL of the cyanided pulp solution of
known PM (Pt, Pd, Rh and Au) concentrations and adjusted at appropriate pH.
Throughout the adsorption process, bottles will be kept at a constant room
temperature.
Solution sampling taken at regular time intervals, involved withdrawal of 5 mL of pulp
using a syringe filter (to remove any carbon fines that might be present in the
solution) followed by ICP-MS analysis of the filtrate.
The uptakes of PMs with activated carbon will be determined from the difference of
PM concentrations in the initial and final solutions.
E.4.1 Risk identification
The focus of this section is to outline the risks that cyanide poses to the project, specifically
the investigator and individuals with whom the work space will be shared; also to outline
measures preventing and containing risks.
Risk identification consists of determining which risks are likely to affect the project and
documenting the characteristics of each. Risks can be identified from a number of different
sources. Some may be quite obvious and will be identified prior to project kickoff. Others will
be identified during the project lifecycle. A risk can be identified by anyone associated or not
with the project. Some risk will be inherent to the project itself, while others will be the result
of external influences that are completely outside the control of the project team. Throughout
all phases of the project, a specific topic of discussion will be risk identification. The intent is
to instruct the project team in the need for risk awareness, identification, documentation and
communication.
Stellenbosch University http://scholar.sun.ac.za
APPENDIX E: RISK MANAGEMENT PLAN
The extraction of precious metals from alkaline cyanided medium by granular activated carbon 173
Risk awareness requires that every project team member be aware of what constitutes a risk
to the project and being sensitive to specific events or factors that could potentially impact
the project in a positive or negative way. At any time during the project, any risk factors or
events should be brought to the attention of the Akanani platinum project manager using
Email or some other form of written communication to document the item. All identifiable
risks should be entered into a risk register and documented as a risk statement.
E.4.2 Health risks
Cyanide salts and solutions can be hazardous, toxic if consumed through the known points
of entry being the skin (absorbed), the eyes, inhalation of powder or hydrogen cyanide gas
and ingestion of salts or solution. The warning signs of cyanide poisoning include dizziness,
numbness, headache, rapid pulse, nausea, reddened skin, and bloodshot eyes. Prolonged
exposure results in vomiting, laboured breathing, followed by unconsciousness; cessation of
breathing, rapid weak heart beat and death. Severe exposure by inhalation can cause
immediate unconsciousness.
E.4.2.1 Inhalation
The threshold limit of HCN is 4.7 ppm and is defined as the maximum average safe exposure
limit for a 15-minute period by the Occupational Safety and Health Administration. Exposure
to 20 ppm causes slight warning signs after several hours; 50 ppm causes disturbances
within an hour and 100 ppm is dangerous for exposures of 30 to 60 minutes while 300 ppm
can be rapidly fatal.
E.4.2.2 Skin absorption
Normal skin absorbs HCN slowly, but nonetheless 2% HCN in air may cause poisoning in
3 minutes, 1% is dangerous in 10 minutes and 0.05% may produce symptoms after
30 minutes.
E.4.2.3 Ingestion
1 mg of cyanide salt per 1 kg of body weight can be fatal. The experimental work will proceed
with each experiment running with 500 mL of sodium cyanide solution at concentration of
6x10⁻³ M. This means there will be the following amount of cyanide for each run.
NaCN (E.1)
Looking at the reaction between free cyanide CN and acid proton to produce HCN as
expressed in Equation E.2:
CN + H+ → HCN (E.2)
glM 15.009.495.0106 3
Stellenbosch University http://scholar.sun.ac.za
APPENDIX E: RISK MANAGEMENT PLAN
The extraction of precious metals from alkaline cyanided medium by granular activated carbon 174
This represents a 1 to 1 molar ratio; hence from 0.15 g of NaCN, the following amount of
HCN will be evolved:
HCN (E.3)
This amounts to 83 mg of HCN in a 500 mL flask. Taking the immediate area of exposure to
the investigator as 1 m3; this amounts to a concentration of 83 mg/1000 L or 0.083 ppm. This
is below the maximum average safe exposure limit and can only be reached if all the cyanide
is converted.
E.4.3 Risk responsibilities
The responsibility for managing risk is shared amongst all the stakeholders of the project and
the rest of the laboratory users. Assigned project members are also responsible for
performing the steps of the mitigation plan and reporting progress to the risk officer weekly.
E.4.4 Risk contingency planning
E.4.4.1 The investigator
Gloves, eye goggles, half mask (protection against vapour, gas and dust particles) and a lab
coat will be employed when handling the salts and solutions.
All handing of salts and solutions will take place in a fume hood; this will include all
experimental procedures-preparation, sampling, filtering and transferring waste solutions to
25 L disposal containers.
Containers containing solutions or salts will be kept closed when not in use. The 25 L
disposal containers will additionally be kept in a heavy duty plastic bag as secondary
containment.
All glassware will be rinsed with EDTA and a bicarbonate solution to remove any metal ions
and acidic residues before using them for the cyanide solutions.
All solutions will be prepared using a buffered water recipe obtained from Sigma Aldrich.
A cyanide anti-dote kit will be kept within reach.
E.4.4.2 Individuals sharing the work space
Inform all students and staff working in the vicinity before working with the cyanide; educate
them of the warning signs and first aid measures for dealing with cyanide exposure.
The salts will be kept in a safe place where access is restricted.
Periodic material balances will be carried out on the salts, accounting for what has been
used and what remains.
g083.009.49
03.2715.0
Stellenbosch University http://scholar.sun.ac.za
APPENDIX E: RISK MANAGEMENT PLAN
The extraction of precious metals from alkaline cyanided medium by granular activated carbon 175
All stored containers having cyanide solutions will be clearly labelled showing the contents,
concentration and warning of the hazard.
A Materials Safety Data Sheet (MSDS) and warning labels will be put up in the area where
the experimental work is being conducted.
The lab coat used by the investigator will be hung in the lab coat wardrobe in a heavy duty
plastic bag.
E.4.5 Risk response – First aid measures
For each identified risk, a response must be identified. It is the responsibility of the Akanani
platinum project to select a risk response for each risk.
Eye contact: Immediately flush eyes with plenty of water for at least 15 minutes. Cold water
may be used. Get medical attention immediately.
Skin contact: Immediately flush skin with plenty of water for at least 15 minutes while
removing contaminated clothing and shoes. Cover the irritated skin with an emollient or apply
cold water. Wash clothing before reuse. Thoroughly clean shoes before reuse. Get medical
attention immediately.
Serious skin contact: Wash with a disinfectant soap and cover the contaminated skin with
an anti-bacterial cream. Seek immediate medical attention.
Inhalation: If inhaled but victim is conscious and speaking, with a gas mask and goggles on,
remove victim to fresh air. If the victim is unconscious but breathing, break an ampul of amyl
nitrite in a cloth and hold it under the victim‟s nose for 15 seconds. Repeat five or six times.
Use a fresh ampul every 3 minutes. Continue until the victim regains consciousness. Amyl
nitrite is a powerful cardiac stimulant and should not be used more than necessary. If the
patient is not breathing, apply artificial respiration; this can best be done using an oxygen
resuscitator. The amyl nitrite antidote should also be administered during resuscitation. Get
medical attention.
Ingestion and serious inhalation: If swallowed, do not induce vomiting unless directed to
do so by medical personnel. Never give anything by mouth to an unconscious person.
Loosen tight clothing such as a collar, tie, belt or waistband. Get medical attention
immediately. A suggested procedure for physicians or nurses is intravenous administration of
0.3 g (10 mL of a 3% solution) of sodium nitrite at the rate of 2.5 mL/minute followed by
12.5 g (50 mL of a 25% solution) of sodium thiosulfate at the same rate. Watch the patient for
24 to 48 hours, especially in cases of ingestion or skin absorption. If symptoms reappear,
repeat the injections in half the original amounts. These solutions should be kept readily
available. In some cases, first aid personnel have been trained to use the intravenous
medication subject to government regulations.
Stellenbosch University http://scholar.sun.ac.za
APPENDIX E: RISK MANAGEMENT PLAN
The extraction of precious metals from alkaline cyanided medium by granular activated carbon 176
E.4.6 Risk mitigation
Risk mitigation involves two steps:
Identifying the various activities or steps, to reduce the probability and/or impact of an
adverse risk.
Creation of a contingency plan to deal with the risk should it occur. Taking early steps
to reduce the probability of an adverse risk occurring may be more effective and less
costly than repairing the damage after a risk has occurred.
E.4.6.1 Handling and storage
All salt containers will be locked away from heat and sources of ignition. Container will be
kept in well ventilated storage where temperature will not exceed 24°C. All empty salt
containers will also be kept in the safe until they can be passed on the Enviroserv for
disposal. Not water will be added to these containers.
E.4.6.2 Fire risks
Sodium cyanide may be combustible at high temperatures but is flammable in the presence
of acids and moisture. It is not known whether there is a risk of explosion in the incidence of
mechanical impact or static discharge. But regardless, all the above situations will be
avoided in storing and handling the salts and/or solutions.
It must be noted that a fire resulting from the salt is dangerous on contact with acids, acid
fumes, water or steam as it results in the immediate formation of toxic and flammable
vapours of hydrogen cyanide gas and sodium oxide. When the salt is heated, it will thermally
decompose and emit fumes of hydrogen cyanide and oxides of nitrogen.
Small fires can be contained using a dry chemical powder or sand while larger ones using a
water spray or foam. If out of control, the Fire alarm will be activated and the emergency
number (107) will be dialled.
E.4.6.3 Accidental release
All salt handling and solution preparations will proceed on a large plastic tray so that in the
case of a spill, the salt or solution will be transferred from the tray back into the container or
disposal container, rather than being cleaned from the floor or bench.
In case of a solution spill on the floor, the area will be demarcated with coloured tape or a
sign. The solution will be mopped up and transferred to assigned container for disposal. The
cleaning aids such as the mop, dust pan, bucket will be dedicated, labelled and isolated for
cyanide use. This will be communicated to the rest of the laboratory users.
Stellenbosch University http://scholar.sun.ac.za
APPENDIX E: RISK MANAGEMENT PLAN
The extraction of precious metals from alkaline cyanided medium by granular activated carbon 177
E.4.6.4 Reactivity and stability risk
Violent reactions occur in contact of NaCN with fluorine gas, magnesium, nitrates and nitric
acid. The hazard of producing toxic and flammable vapours of hydrogen cyanide come with
the contact of acids, water, steam, strong oxidisers and carbon dioxide gas in ordinary air.
These compounds will not be allowed to contact the salts or solutions. To avoid hydrolysis of
cyanide (Equation E.4), reaction (i.e. leaching or adsorption) must be carried out under basic
conditions. The following reactions illustrate some of the above considerations.
NaCN + H2O → HCN + NaOH (E.4)
2 NaCN + H2SO4 → 2 HCN + Na2SO4 (E.5)
NaCN + CO2 + H2O → HCN + NaHCO3 (E.6)
2 NaCN + 2 SO2 + O2 + 2 H2O → 2 HCN + 2 NaHSO4 (E.7)
By far, the biggest risk to this project is the formation of hydrogen cyanide gas as a result of
any sudden pH drop due to an inappropriate addition of acid. This will be approached
through careful pH management above 9.5. As stated earlier, the solutions will be prepared
using a buffered water recipe obtained from Sigma Aldrich. The glassware will be rinsed with
EDTA and a bicarbonate solution before use and all preparations will proceed in the fume
cupboard. A schedule will be worked out to allow the cyanide experiments to run without
interference. During that period no acids or oxidisers will be found in the fume hood (see E.5
to E.7 reactions).
To prevent the possibility of any stray reactions in the 25 L disposal containers; the latter will
be rinsed with EDTA and bicarbonate solutions to remove metal ions and any acids, then it
will be rinsed with deionised water, allowed to stand and dry before being used to store the
waste cyanide solutions.
On completion of an experiment, glassware and other equipment will be decontaminated by
soaking them in a 0.5 M hydrogen peroxide solution for 1 hour. Other equipment such as
mops, clothes, paper towels used for cleaning up spills will be stored in heavy duty plastic
bags and handed over to Envirotech for disposal. All waste from experimental work
(including solutions and solid waste) will be handed over to Envirotech for disposal.
E.4.6.5 Step by step procedures for handling cyanide
1. All students and staff working in the surrounding vicinity will be informed before work with
cyanide commences.
2. All receiving vessels (reactor vessels, tubes, sample bottles, disposal containers) will be
soaked in 0.5 M (excess) EDTA solution for 1 hour.
Stellenbosch University http://scholar.sun.ac.za
APPENDIX E: RISK MANAGEMENT PLAN
The extraction of precious metals from alkaline cyanided medium by granular activated carbon 178
3. The vessels will then be rinsed with deionised water followed by a soak in buffered water
prepared from Na2CO3 and NaHCO3 for 1 hour. They will be left to dry over night. In this
case, the vessels will not be rinsed as any alkaline residue can only be beneficial to
keeping the pH above 10.
4. The equipment for weighing out the salt will be placed on two plastic trays; one for the
balance and one for the salt container. A labelled heavy duty paper bag will be kept
nearby for the used paper towels, spatulas, etc. A lab coat, double pair of gloves and half
mask will be worn at this stage.
5. After measuring the salt, container will be closed and placed out of sight in cupboard to
be later locked up in the poisons cupboard.
6. Reactor vessels in which salt was measured will be placed in the fume hood where the
cyanide solution will be made up from the salt using buffered water (prepared from
Na2CO3 and NaHCO3). The pH of the solution (10 or 12) will be verified using a standard
pH meter. All will be conducted in the fume hood.
7. The bulk solution will be labelled and stored in the fridge over night.
8. The bulk solution will be allowed to warm up to room temperature (in the fume hood) and
the pH measured before proceeding with experimental work.
9. Experimental work will involve adding 500 mL of bulk solution to 5 or 15 g of activated
carbon in bottles. Waste solution will be stored in the disposal container.
E.4.7 Tracking and reporting
Based on trigger events that have been documented during the risk analysis and mitigation
processes, the Akanani project managers will have the authority to enact contingency plans
as deemed appropriate. As project activities are conducted and completed, risk factors and
events will be monitored to determine if in fact trigger events have occurred that would
indicate the risk is now a reality.
E.4.8 Processes to address immediate unforeseen risks
The individual identifying the risk will immediately notify the Akanani project managers. If
required, they will insinuate a mitigating strategy and assign resources as necessary.
E.4.9 Risk control
The final step is to continually monitor risks, to identify any change in the status, or if they
turn into an issue. It is best to hold regular risk reviews to identify actions outstanding, risk
probability and impact, remove risks that have passed and identify new risks.
Stellenbosch University http://scholar.sun.ac.za
APPENDIX E: RISK MANAGEMENT PLAN
The extraction of precious metals from alkaline cyanided medium by granular activated carbon 179
SYMBOLS DESCRIPTION
EDTA Ethylenediaminetetraacetic acid
PPE Personal protective equipment
REFERENCES
Pesce, L.D. 2001. Cyanides Encyclopedia of Chemical Technology-Online. John Wiley & Sons, Inc. Lengyel, D. 2007. Exploration Systems Risk Management Plan. National Aeronautics and Space Administration. Northrop Grumman Corporation. 2007. Risk management plan.
Stellenbosch University http://scholar.sun.ac.za
APPENDIX F: PUBLICATION FROM THIS THESIS
The extraction of precious metals from alkaline cyanided medium by granular activated carbon 180
APPENDIX F
PUBLICATIONS FROM THIS THESIS
A novel energy efficient process for the extraction of platinum group metals through a
sequential stage high temperature heap bioleach and subsequent high temperature cyanide
heap leach utilising solar heat. (Eksteen, Mwase, Petersen, Bradshaw, Akdogan, Mpinga,
Snyders. Biohydrometallurgy, 2012).
Stellenbosch University http://scholar.sun.ac.za
Related Documents


