The Experiences of South Asian Immigrant Seniors Living in Edmonton, Alberta: Report to the Community Full Report with Tables By Cheuk Fan Ng, PhD Athabasca University Herbert C. Northcott, PhD University of Alberta Sharon McIrvin Abu-Laban, PhD University of Alberta October 21, 2004

Welcome message from author
This document is posted to help you gain knowledge. Please leave a comment to let me know what you think about it! Share it to your friends and learn new things together.
Transcript
The Experiences of South Asian Immigrant SeniorsLiving in Edmonton, Alberta:
Report to the Community
Full Report with Tables
By
Cheuk Fan Ng, PhDAthabasca University
Herbert C. Northcott, PhDUniversity of Alberta
Sharon McIrvin Abu-Laban, PhDUniversity of Alberta
October 21, 2004
The Experiences of Immigrant Seniors
2
Table of Contents Page
Introduction ……………………………………………………………………….. 3
Methods …………………………………………………………………………… 7
Characteristics of Respondents ……………………………………………………. 9
Respondents’ Children and Grandchildren ……………………………………..… 35
Occupation and Income …………………………………………………………… 45
Housing and Living Arrangements …………………………………………….…. 79
Neighbourhood Safety and Satisfaction …………………………………………. 111
Experience with Discrimination …………………….…………………………… 119
Transportation and Access to Services …………………………………………… 125
Community and Recreational Activities and Services …………………………… 143
Social Contacts and Satisfaction with Life ………………………………….…… 155
Feelings About Being Part of Canadian Society ………………………………… 187
Voting in Canada ………………………………………………………………… 203
Connections to Homeland ……………………………………………………….. 207
Daily Life ………………………………………………………………………… 219
Personal Identity in Canada ……………………………………………………… 233
Experience with Racism in Canada ………………………………………………. 249
Life as an Immigrant Living in Canada ………………………………………..… 251
Conclusion ……………………………………………………………………...… 265
Appendix A: Interview Questionnaire—English-language Version ……………………… 269
Appendix B: Coding Frames for Open-ended Questions …………………………………. 311
Appendix C: Interview Questionnaire—Hindi-language Version ………………………… 321
Appendix D: Interview Questionnaire—Punjabi-language Version ……………………….
The Experiences of Immigrant Seniors
3
Introduction
The successful integration and adaptation of immigrants to Canada is of central concern topolicy makers and service providers. However, for the most part, immigration researchfocuses on adults and, on a far smaller scale, youth. There is an absence of research on theadaptation and integration of immigrant seniors, on how advanced age relates to the processesand consequences of integration into a new society .
The Canadian population, as a whole, is aging. In 2001, 12 percent of the Canadianpopulation was seniors, that is, aged 65 and over, and 28 percent of Canadian seniors wereimmigrants. Of the immigrant seniors, 68 percent were of European background and 19%were from Asia (Statistics Canada, 2003). Most immigrant seniors have been in Canada for along time and are growing old in Canada. In contrast, only a small number immigrated toCanada when they were elderly. For example, about 3 percent of immigrants who arrived in1997 (less than 6,000) were seniors. About half of these immigrant seniors (43%) were fromAsia (McDonald, et al. 2001, as cited in Chappell, Gee, McDonald, & Stones, 2003). Theserecent immigrant seniors came to Canada at a later stage in life, often sponsored by their adultchildren. They are spending their old age in Canada, often in an unfamiliar physical, social,and cultural environment.
The experiences of these long-term and recent immigrant seniors who came to Canada indifferent life stages may be quite distinct. Immigration in older age may be associated withdifferent vulnerabilities. Alternatively, the consequences of immigration at a younger age witha settlement experience that includes aging and growing old in one’s adoptive country may beassociated with old age advantages. Neither the gerontology nor the immigration researchliterature sufficiently explores scholarly and policy issues regarding integration of immigrantsin advanced age, or age-related changes in adaptation among immigrants in later life. Eventhough gerontological research now encompasses concerns about the "minority elderly" (e.g.,Burr & Mutchler, 1993; Kamo & Zhou, 1994) it has rarely looked at the migrant elder.
The issue of "age" at immigration is relevant both theoretically and in terms of social policy.Implicit in the Canadian immigration code since 1967 when the federal government firstintroduced a point system for immigrant selection is that the ideal immigrant is a person whois in one's supposedly "vital" years. At the same time, immigration policy in Canada has alsoshifted to give preference for family unification resulting in older persons migrating toCanada to join their adult children who have migrated previously.
While foreign-born seniors who arrived in Canada when young have spent most of their adultyears in this country, acquiring the mantel of experience, incremental benefits of citizenshipand presumably incremental access to social and financial benefits, those who arrived later inlife have not had the same opportunity. Instead, for these migrant elders, not only were theiryoung and middle adult years spent elsewhere, often outside the Western system, but thedisruptive severing of ties with their country of origin and the challenge of building newrelationships and learning new skills in Canada are coming later in life. Little is known abouthow migrant elders adapt following immigration late in life
The Experiences of Immigrant Seniors
4
This lack of research is particularly evident with respect to South Asian immigrants to Canadaand the United States (Burr, 1992). In 2001, 4% of the immigrant seniors were of South Asianbackground (Statistics Canada, 2003) and people from South Asia were the second largestvisible minority group in Canada (The Daily, January 21, 2003). Yet there is little publishedresearch on South Asian immigrant seniors.
Persons who have migrated to Canada from their country of birth and are now growing old inCanada may face unique problems especially if they have migrated recently at an older age.This study focuses on persons born in South Asia who have come to live in Canada and whoare currently 60 or more years of age and living in Edmonton, Alberta. This study examines anumber of issues relating to adaptation and integration including proficiency in the Englishlanguage, education, economic security, health, marital status and family composition, livingarrangements, safety, discrimination and racism, transportation, access to services,community and recreational activities, social interaction and social relationships, votingparticipation, personal identity, and assessment of life in Canada. Because the experiences ofimmigrants living in Canada may vary depending on a number of factors including sex, lengthof time in Canada, and age when immigrated to Canada, the results of interviews with olderSouth Asian immigrants living in Edmonton are reported for males and females and for threetypes of age at entry and duration of Canadian experience :
(1) Recent immigrant, older age entry. These are seniors who first entered Canada in older age(55+) within the last 10 years.
(2) Established immigrant, older age entry. These are seniors who first entered Canada inolder age (55+) and have been in the country for more than ten years.
(3) Established immigrant, younger age entry. These are seniors who first entered Canada inyounger age(<55) and have been in the country for more than ten years.
References
Burr, J. A. (1992). Household status and headship among unmarried Asian Indian women inlater life: Availability, feasibility, and desirability factors. Research on Aging, 14, 199-225.
Burr, J. A., & Mutchler, J. E. (1993). Nativity, acculturation, and economic status:Explanations of Asian American living arrangements in later life. Journal of Gerontology:Social Sciences, 48, 555-563.
Chappell, N., Gee, E., McDonald, L., & Stones, M. (2003). Aging in contemporary Canada.Toronto, ON: Prentice Hall.
The Daily (January 21, 2003). Census of Population: Immigration, birthplace and birthplaceof parents, citizenship, ethnic origin, visible minorities and aboriginal peoples. StatisticCanada. Retrieved from http://www.statcan.ca/Daily/English/030121/d030121a.htm
The Experiences of Immigrant Seniors
5
Kamo, Y., & Zhou, M. (1994). Living arrangements of elderly Chinese and Japanese in theUnited States. Journal of Marriage and the Family, 56, 544-558.
McDonald, L., George, U., Daciuk, J., Yan, M., Rowan, H. (2001). A study on the settlementrelated needs of newly arrived immigrant seniors in Ontario. Toronto, ON: Centre forApplied Social Research, University of Toronto.
Statistics Canada (2003). Immigration status and place of birth, and age groups forpopulation, for Canada, provinces, territories, Census Metropolitan areas and censusagglomerations, 2001 Census, 20% sample data. Tabulation 95F0357XCB01004. (RetrievedMarch 18, 2004 from http://www12statcan.ca/english/census01)

The Experiences of Immigrant Seniors
6
The Experiences of Immigrant Seniors
7
Methods1
A survey questionnaire was administered face-to-face to a sample of 161 South Asianimmigrants 60 or more years of age living in Edmonton, Alberta. A draft of the questionnairewas reviewed by experts in the South Asian community. The interviews took place inrespondents’ homes. [Their homes were distributed all over Edmonton, with 39% in theMillwoods area.] The language of the interview was either English, Hindi, or Punjabi. Thequestionnaire, which was originally designed in English, was translated into Hindi andPunjabi and then translated back into English to identify problems in original translation. Theinterviewers, most of whom were female, were selected from the South Asian community. Amale interviewer was hired to interview some of the more traditional male Sikh respondents.The questionnaire contained both close-ended and open-ended questions and a typicalinterview lasted about two hours. At the end of the interview, the interviewee was given atwenty dollar participation fee. The research design received ethics approval from theUniversity of Alberta and Athabasca University. Data collection was conducted by thePopulation Research Laboratory at the University of Alberta.
Respondents were selected so that there were approximately equal numbers of females andmales, recent immigrants (ten years residence in Canada or less) and immigrants who came toCanada more than ten years ago, English-language speakers and non-English speakers, andamong the non-English speakers, equal numbers of Hindi and Punjabi speakers. Interviewerswere hired from the South Asian community and spoke English and Hindi and/or Punjabi.Respondents were selected in three ways. First, potential respondents were identified by a keyinformant from the South Asian Community who worked at a “welcome” centre forimmigrants. Second, potential respondents were identified by the South Asian interviewerswith the stipulation that they could not interview their own family members or relatives andshould select respondents to reflect the diversity in the community. Third, potentialrespondents were chosen by the snowball technique, that is, by referral from previousrespondents. There is no guarantee that this sample is representative of the population fromwhich it is drawn and caution should be exercised in generalising to the larger population. Forthe purposes of this study, the emphasis is on comparisons internal to the sample, that is,
1 This research project on the integration of older immigrants originated in the East Indian community in
Edmonton, Alberta (in particular, with Gita Das and the Indo-Canadian Women’s Association) and waschampioned by Baha Abu-Laban, Director of the Prairie Centre of Excellence for Research on Immigration and
Integration (PCERII) at the University of Alberta. Funding was provided by PCERII in the form of a researchgrant for 2001-2003 to Douglas Durst, principal investigator, at the University of Regina, and four co-
investigators: Michael MacLean at the University of Regina, Cheuk Fan Ng at Athabasca University, and Sharon
McIrvin Abu-Laban and Herbert Northcott at the University of Alberta. Valuable assistance and guidance forthis project was provided by Nayanika Kumar. We are most grateful to Liz White, the project field manager
employed by the Population Research Laboratory at the University of Alberta, and to the interviewers,translators and the 161 respondents who generously consented to be interviewed. Data entry and cleaning were
done in the Population Research Laboratory and we are grateful to Janet Ngo, Erin Stepney, and Nils Heyen.Irene Shankar, Rosanna Shih, Justine Shih, and Genevieve Shih assisted with the presentation of the cross-
tabular analyses.

The Experiences of Immigrant Seniors
8
between interviewees who are female and male, and who came to Canada recently and lessrecently.
An English-language pre-test was conducted in two stages: first, three pre-test interviewswere conducted in November 2002 and the questionnaire was then fine-tuned. The secondstage of the English-language pre-test involved eight interviews conducted in December 2002and January 2003 following which the questionnaire was finalised. English-languageinterviewing was completed by March 2003. The pre-test interviews were re-recorded on thefinal questionnaire with very little loss of data. The Hindi translation of the questionnaire waspre-tested (n=6) in March 2003 and the Punjabi questionnaire was pre-tested (n=3) in April2003. Hindi- and Punjabi-language interviewing was completed by April, 2003. Followingeach Hindi-language and Punjabi-language interview, the interviewers transferred the answersrecorded on the Hindi or Punjabi questionnaires onto English-language questionnaires tofacilitate data entry and the creation of an electronic data base. Data collection ceased beforethe intended number of 200 interviews was reached. The cost per interview was somewhathigher than expected and the limited budget required that data collection cease after 161interviews were complete.
The Experiences of Immigrant Seniors
9
Characteristics of Respondents
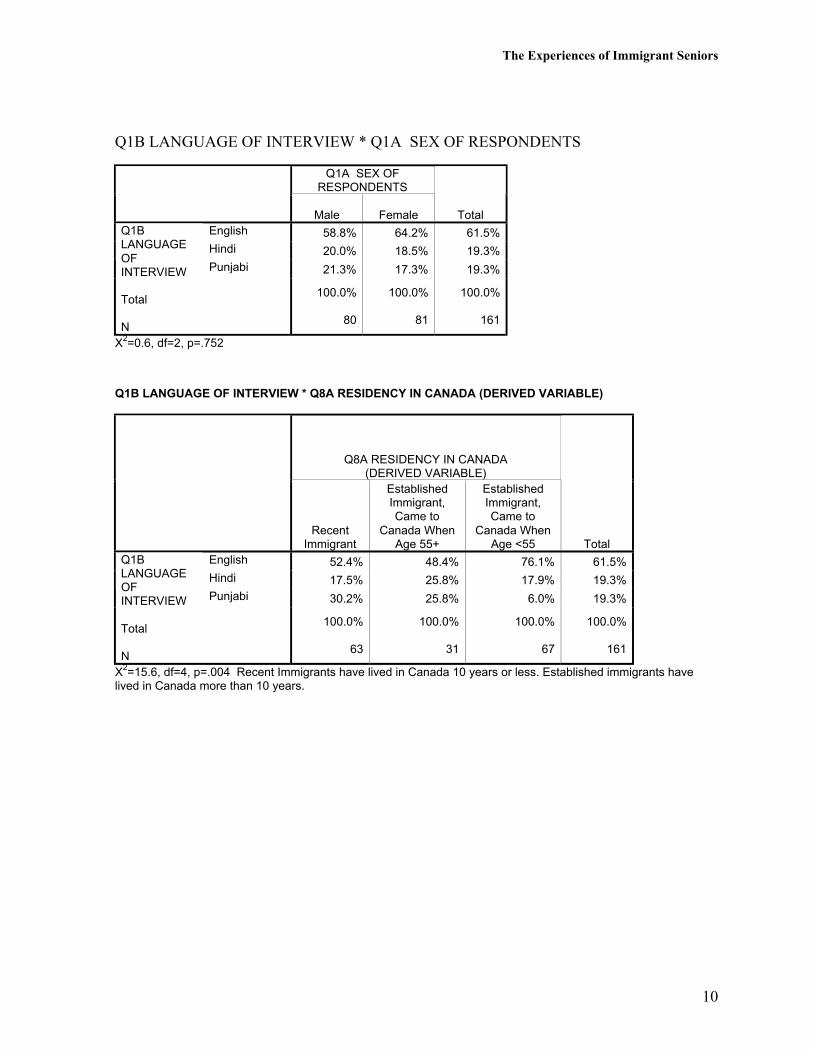
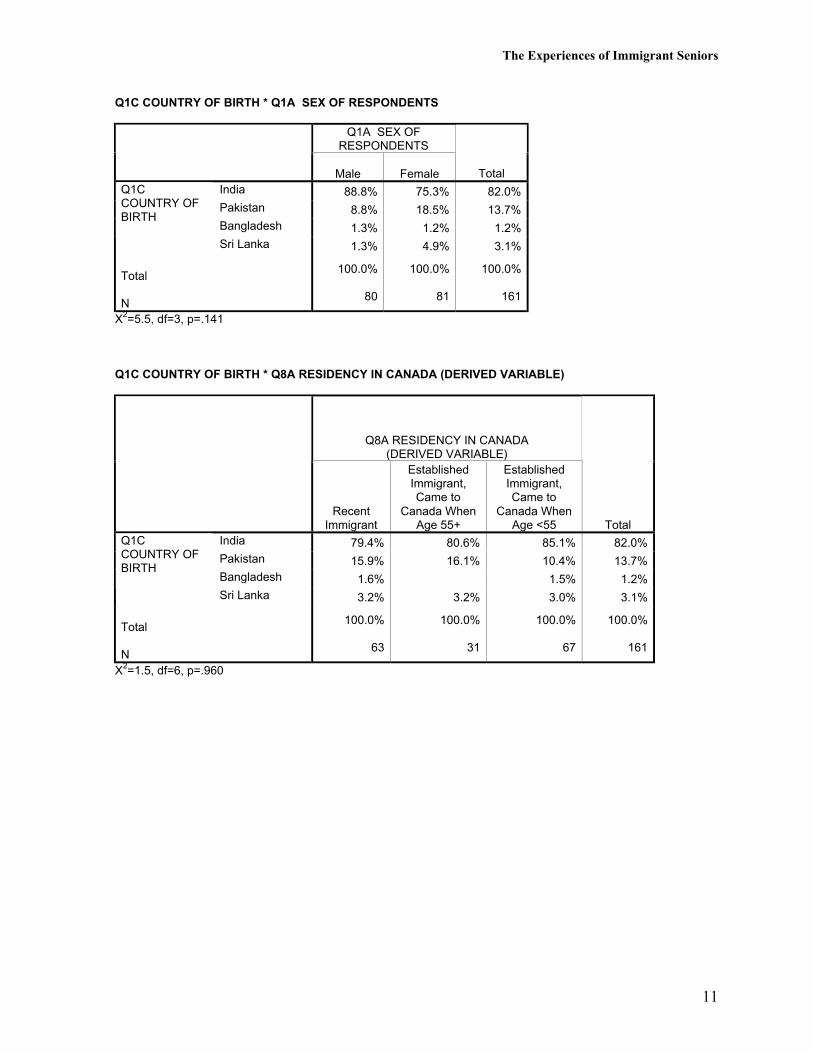
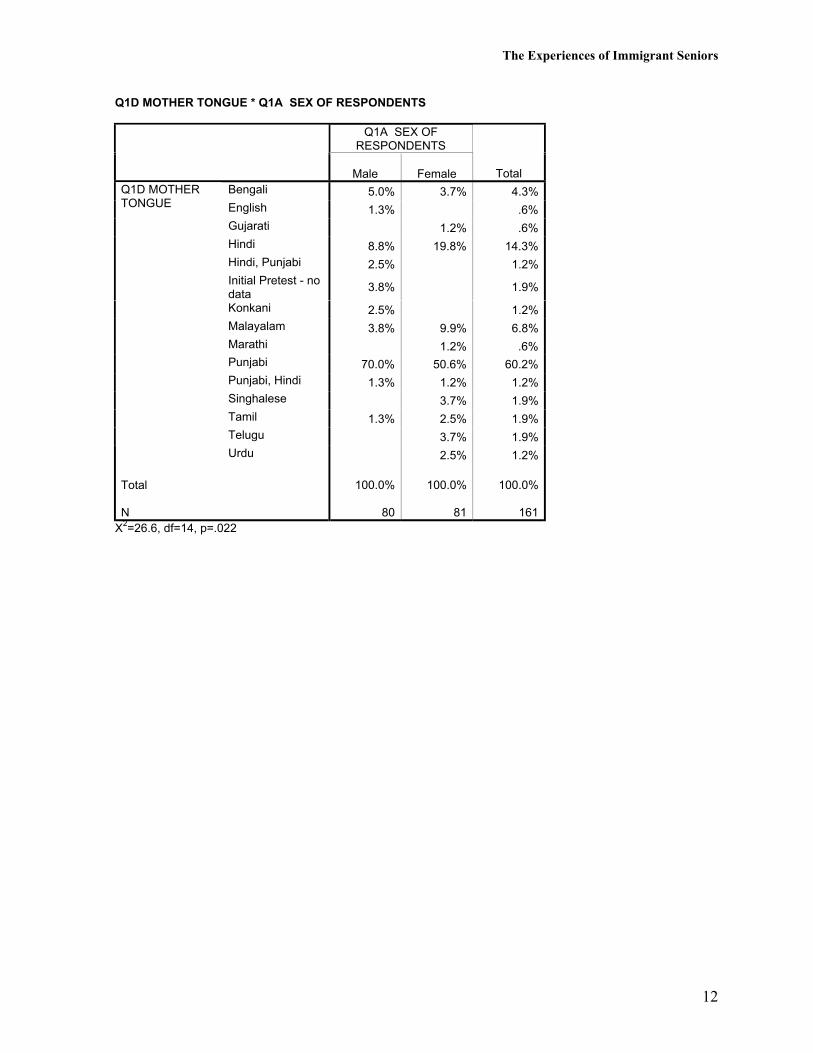
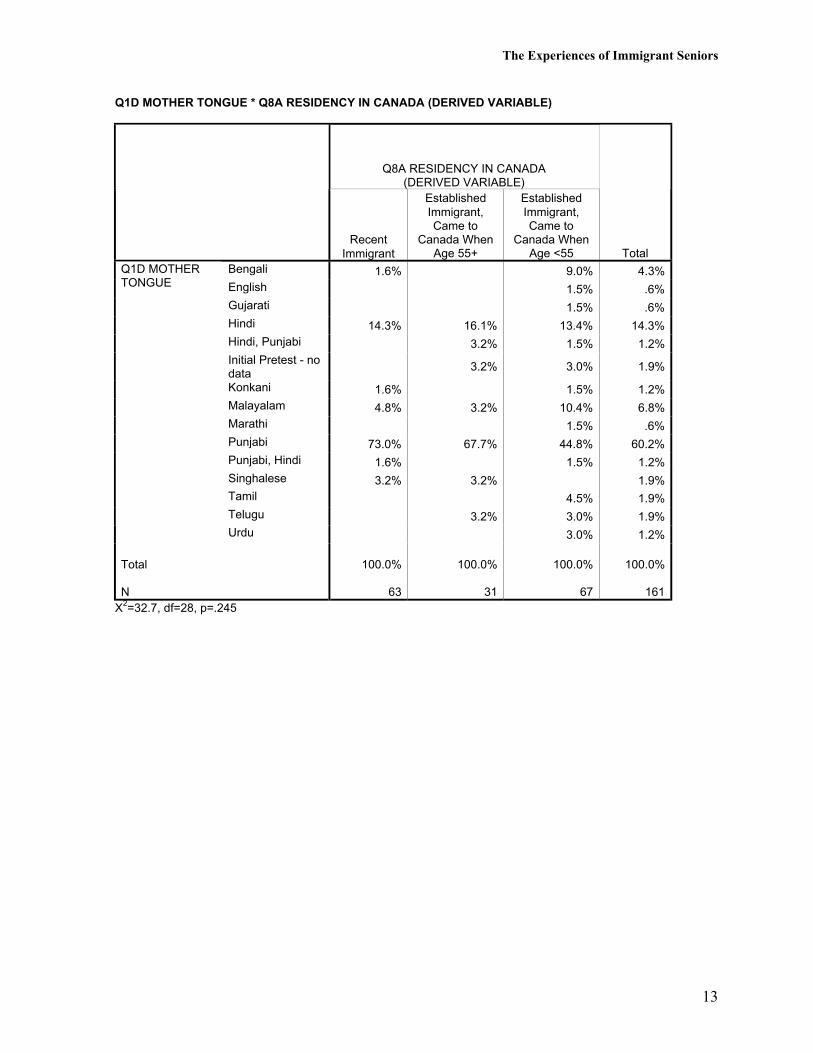
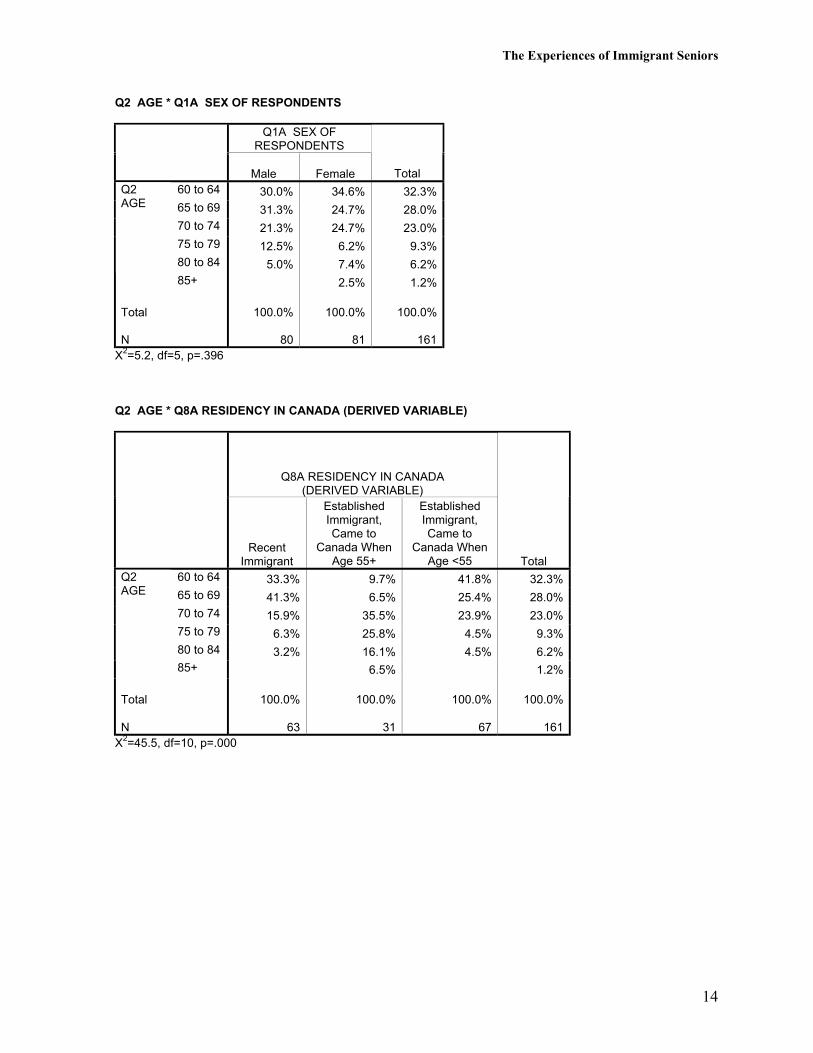
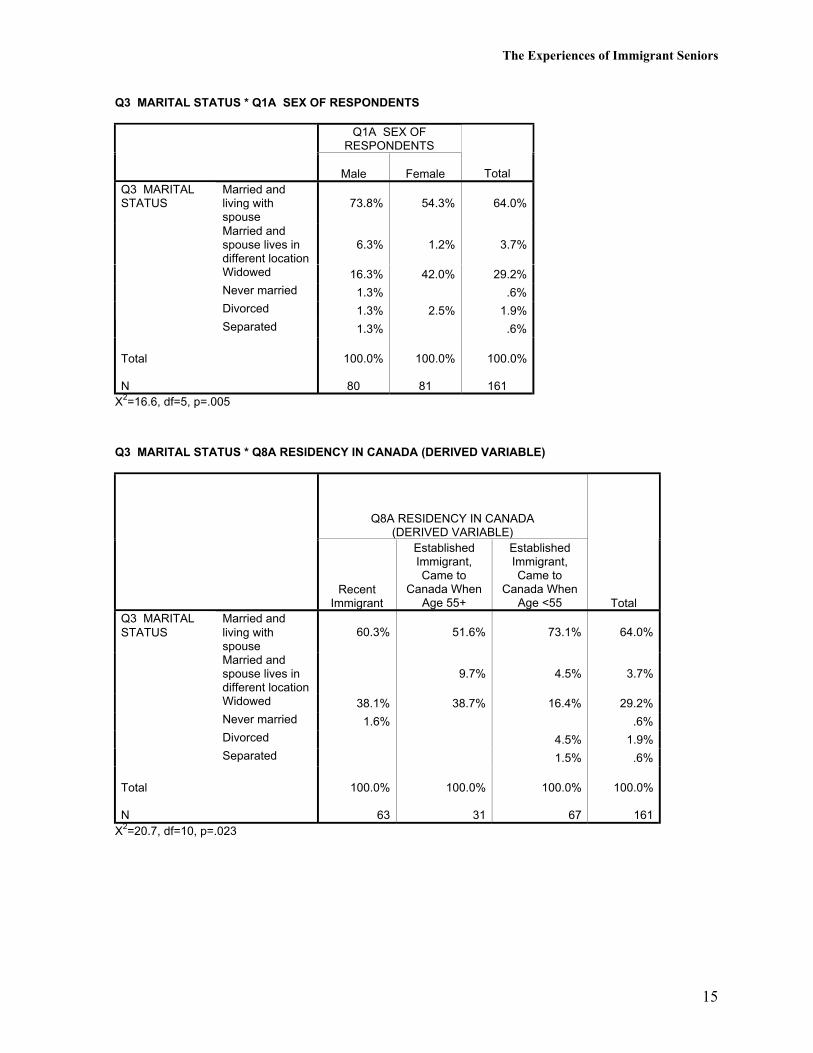
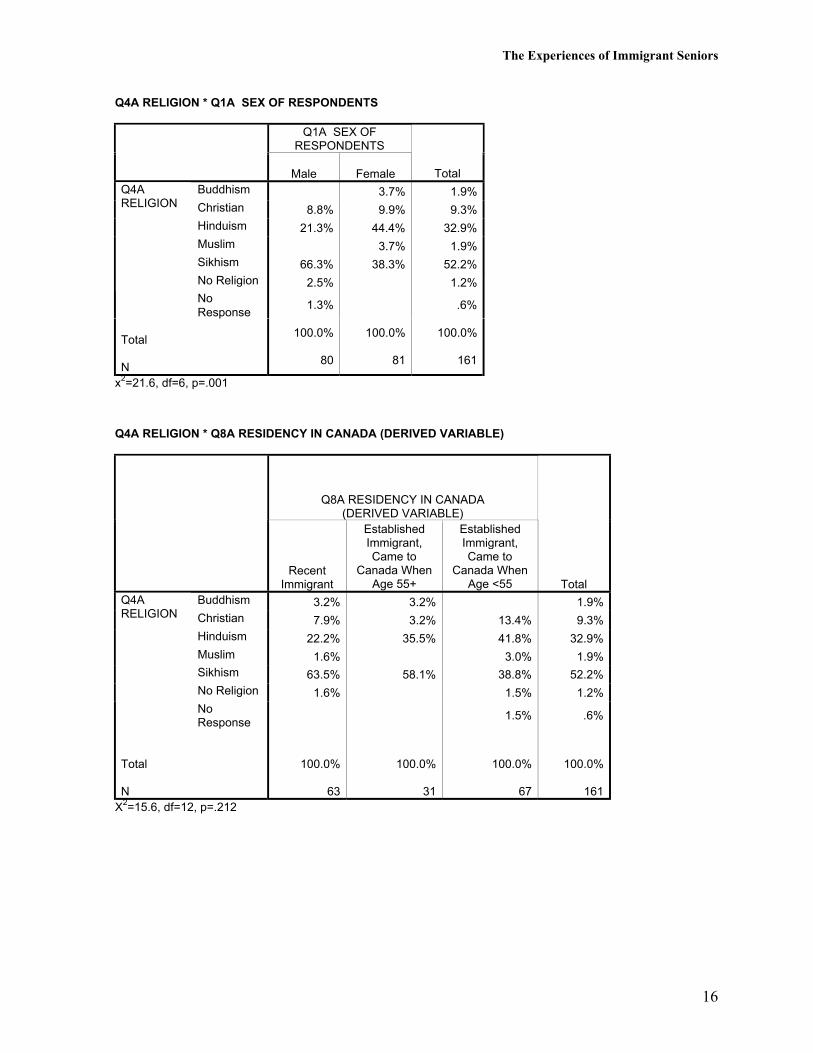
The 161 South Asian respondents aged 60 and older included 81 females and 80 males. Therewere 99 English-language interviews and 62 Hindi or Punjabi interviews (31 in eachlanguage). Countries of birth included India (n=132), Pakistan (n=22), Sri Lanka (n=5) andBangladesh (n=2). Mother tongue included Punjabi (n=99), Hindi (n=25), as well asMalayalam (n=11), Bengali (n=7), Singhalese (n=3), Tamil (n=3), Telugu (n=3), Konkani(n=2), Urdu (n=2), Gujarti (n=1), Marathi (n=1) and English (n=1). Religion includedSikhism (n=84), Hinduism (n=53), Christianity (n=15), Islam (n=3), and Buddhism (n=3).The age of the interviewees ranged from 60 to 92 with a median age of 67. Sixty percent(60%) of the interviewees were 60-69 years of age while 32% were aged 70-79 and 8% were80 years of age or older. Most were married and living with their spouse (64%) while 29%were widowed. The remainder included divorced (n=3), legally separated (n=1), nevermarried (n=1), and married with spouse living in a different location (n=6). Females weremore likely to be widowed than males and males were more likely to be currently marriedthan females.
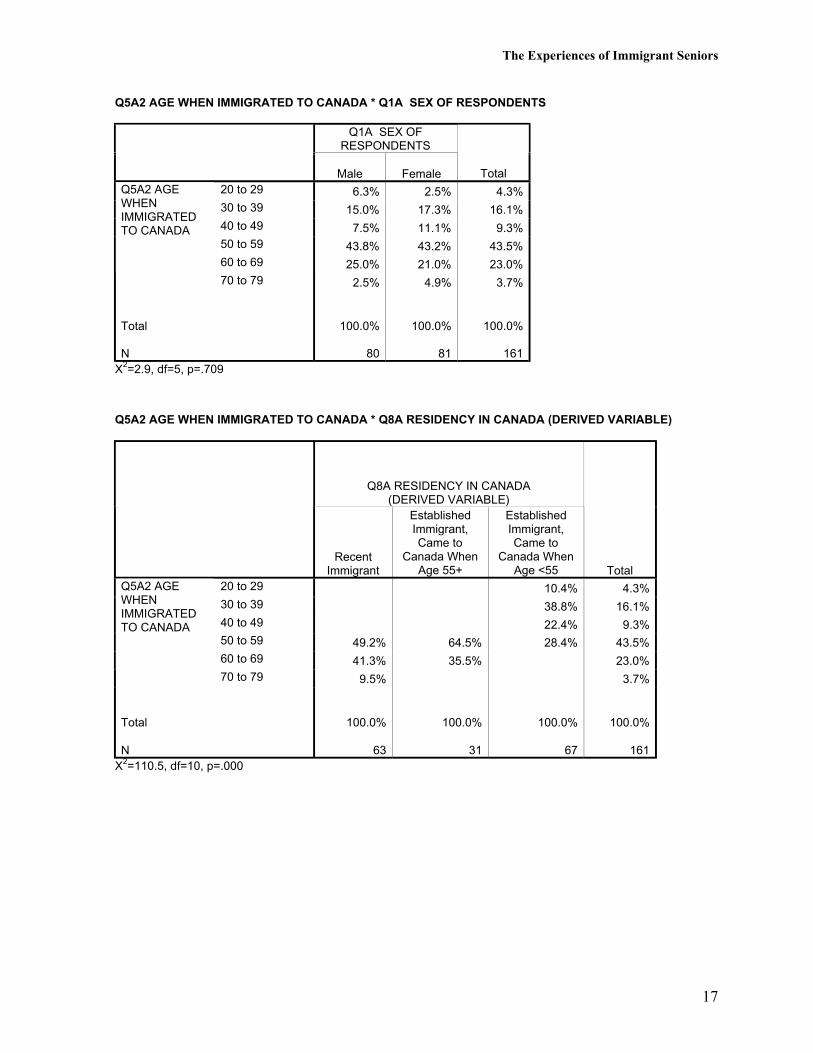
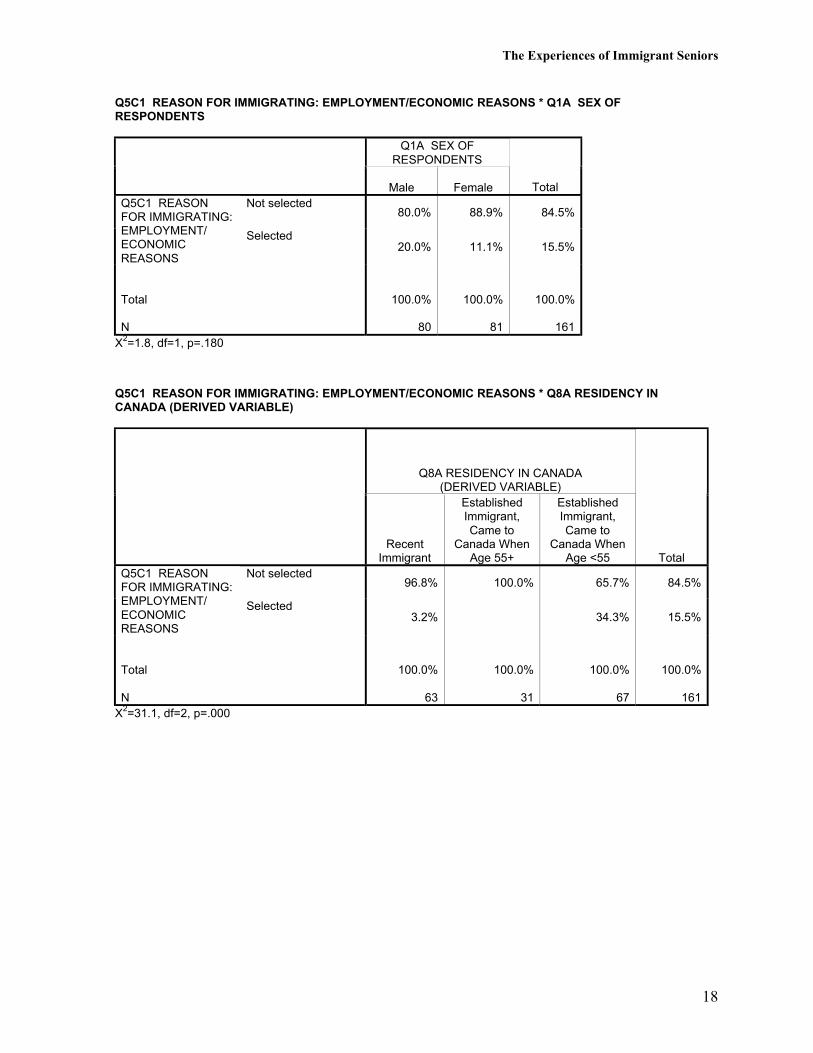
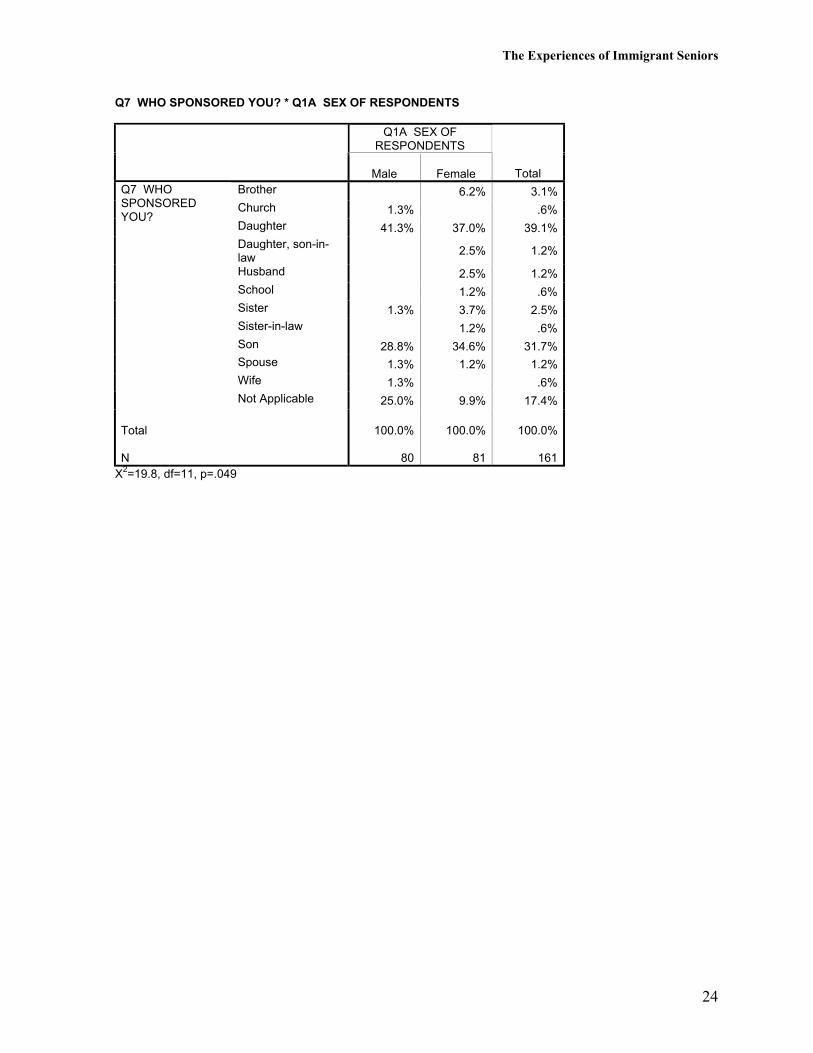
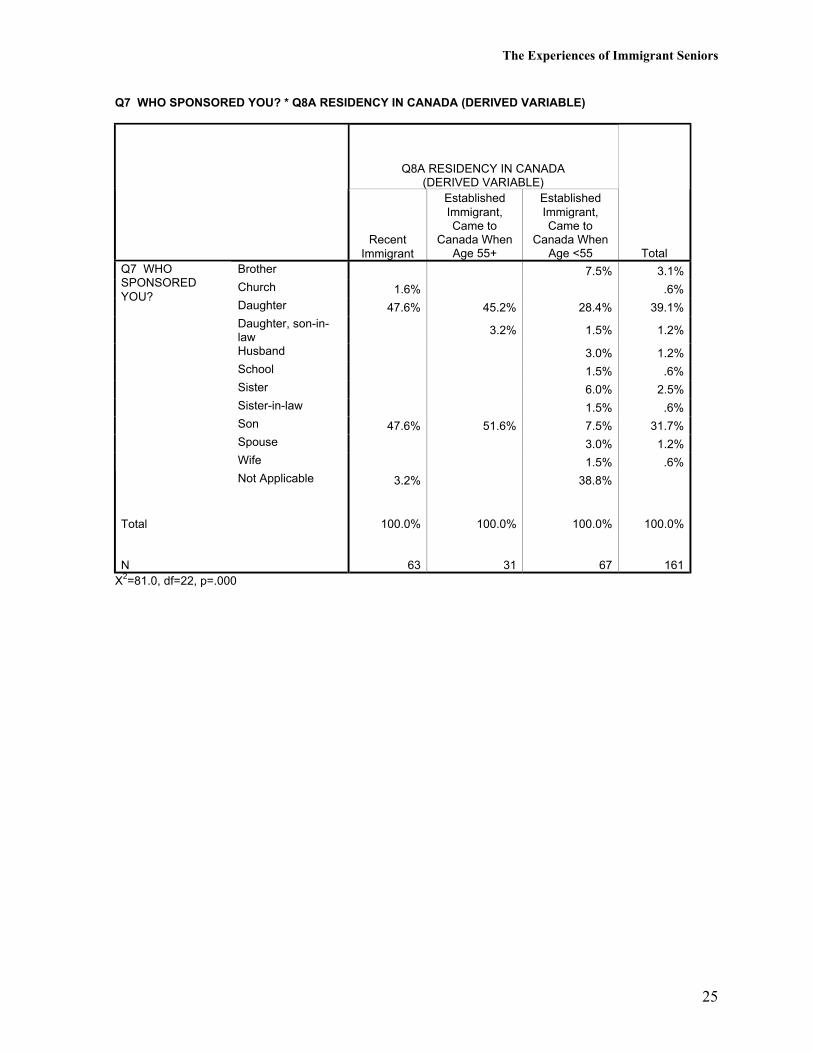
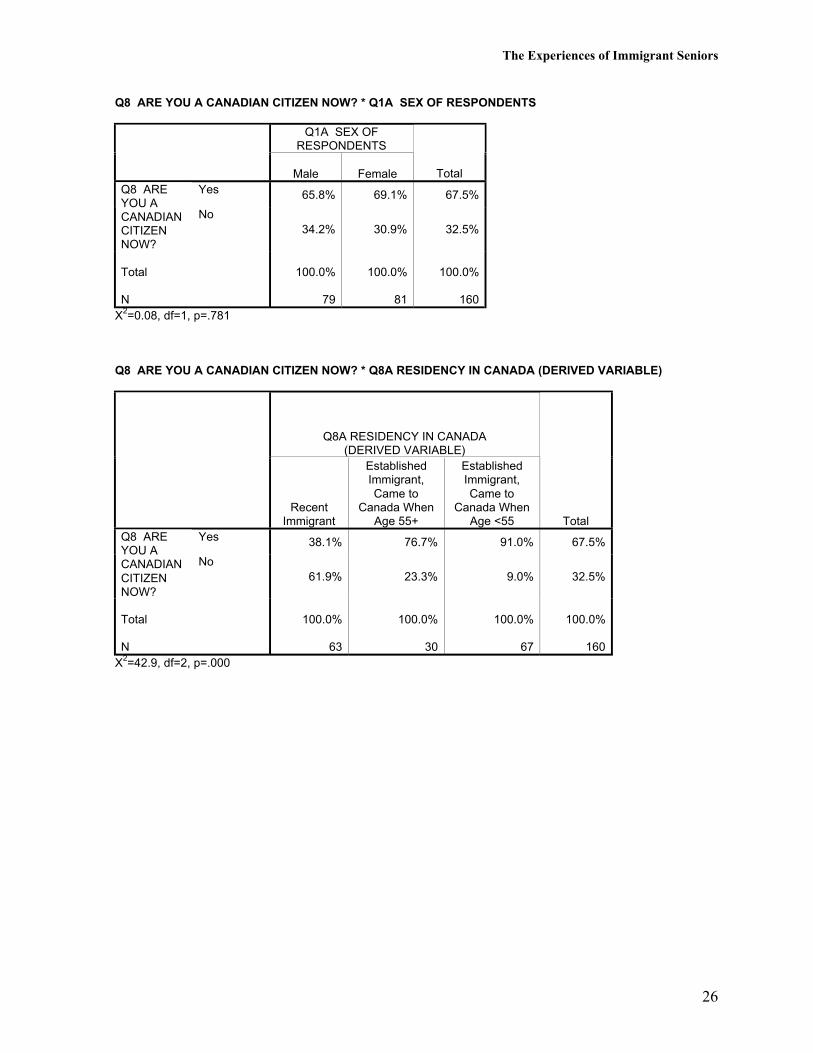
Thirty-nine percent (39%) of respondents came to Canada 10 years ago or more recentlywhile 61% came to Canada more than 10 years ago. The median number of years lived inCanada was 14. Two in three respondents (67%) came to Canada to be with family and most(83%) were sponsored by either a daughter or a son. Two in three respondents (68%) are nowCanadian citizens although fewer (38%) of the immigrants who came to Canada 10 or lessthan 10 years ago are now Canadian citizens.
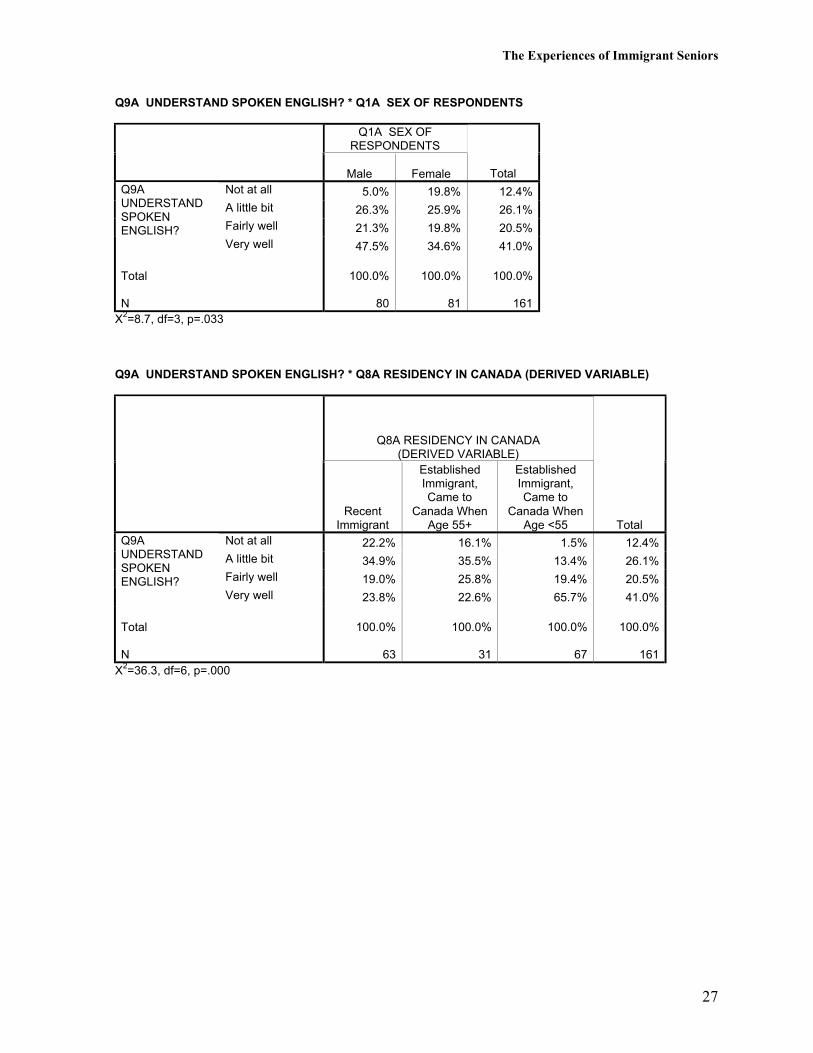
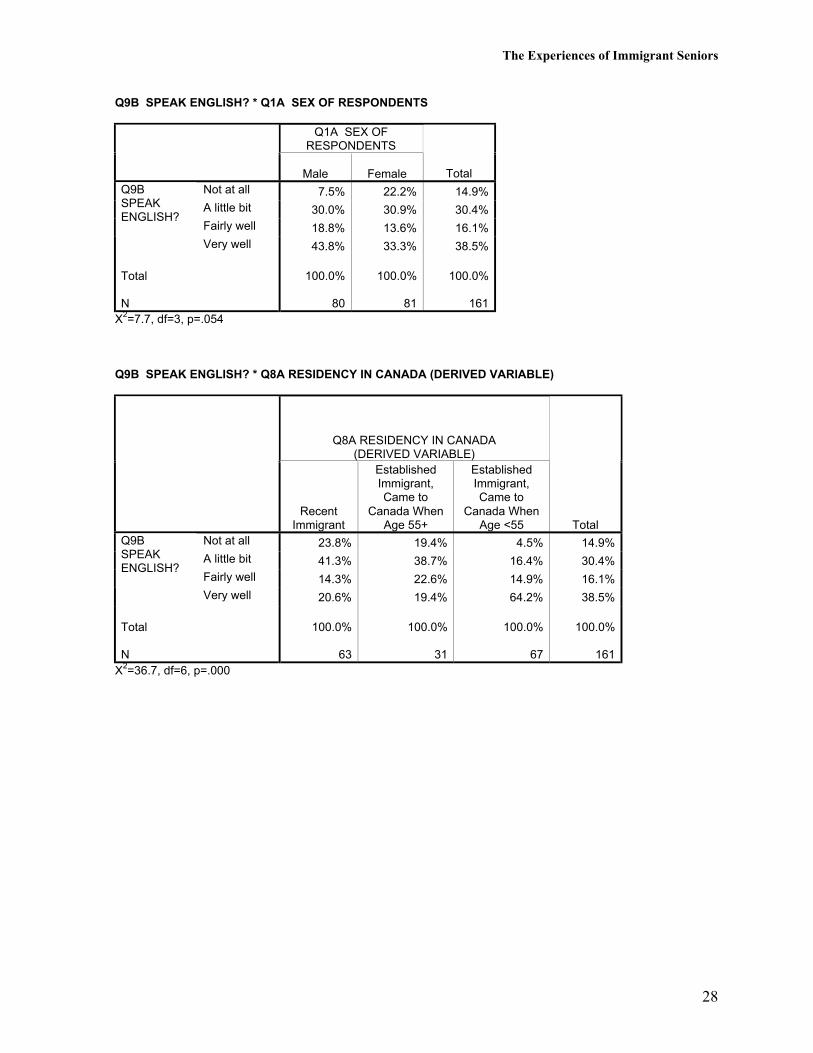
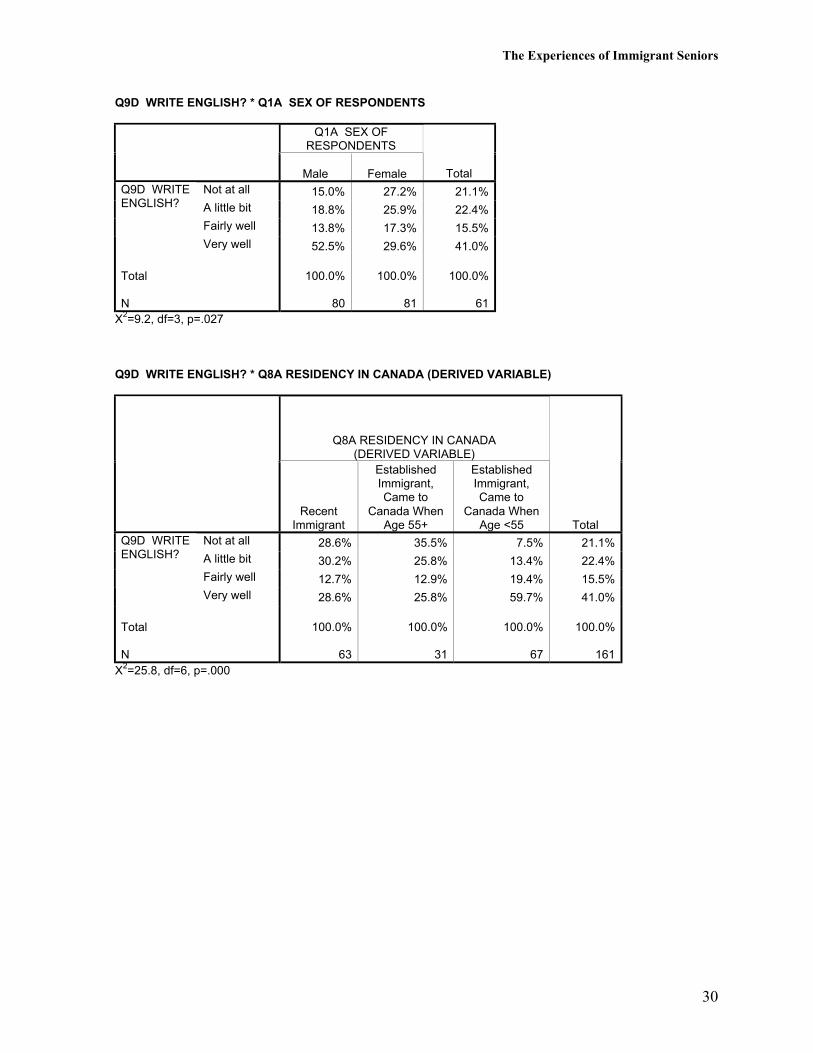
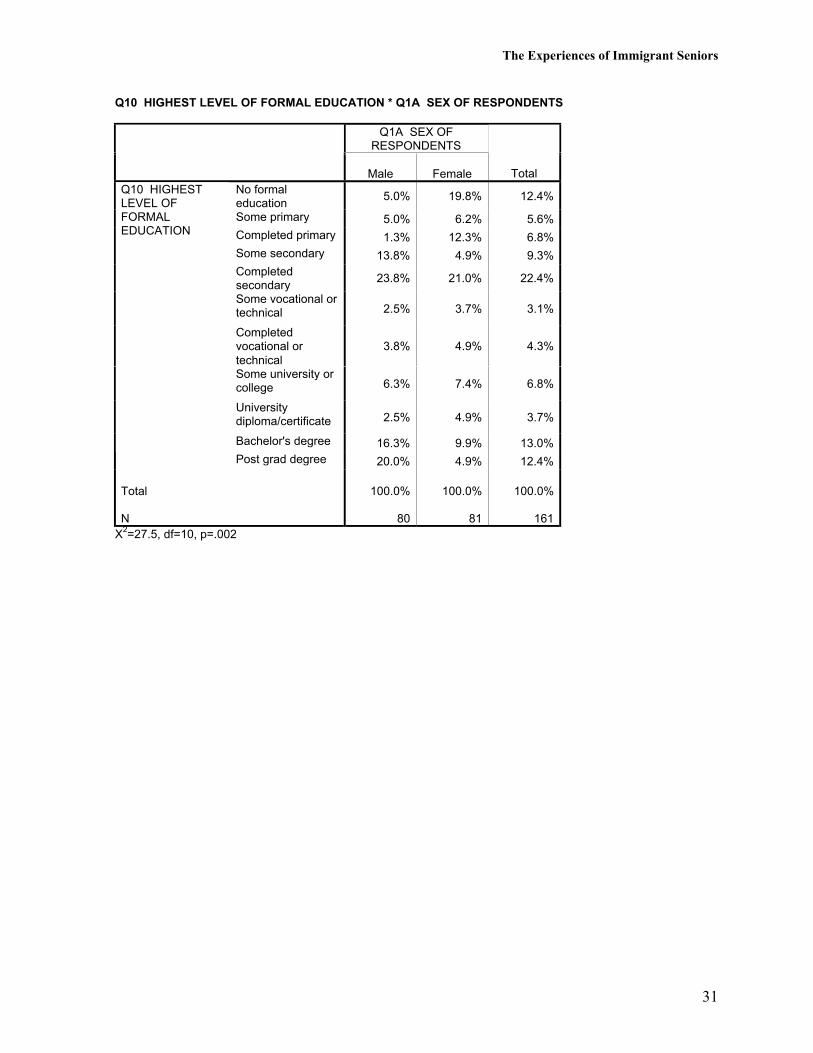
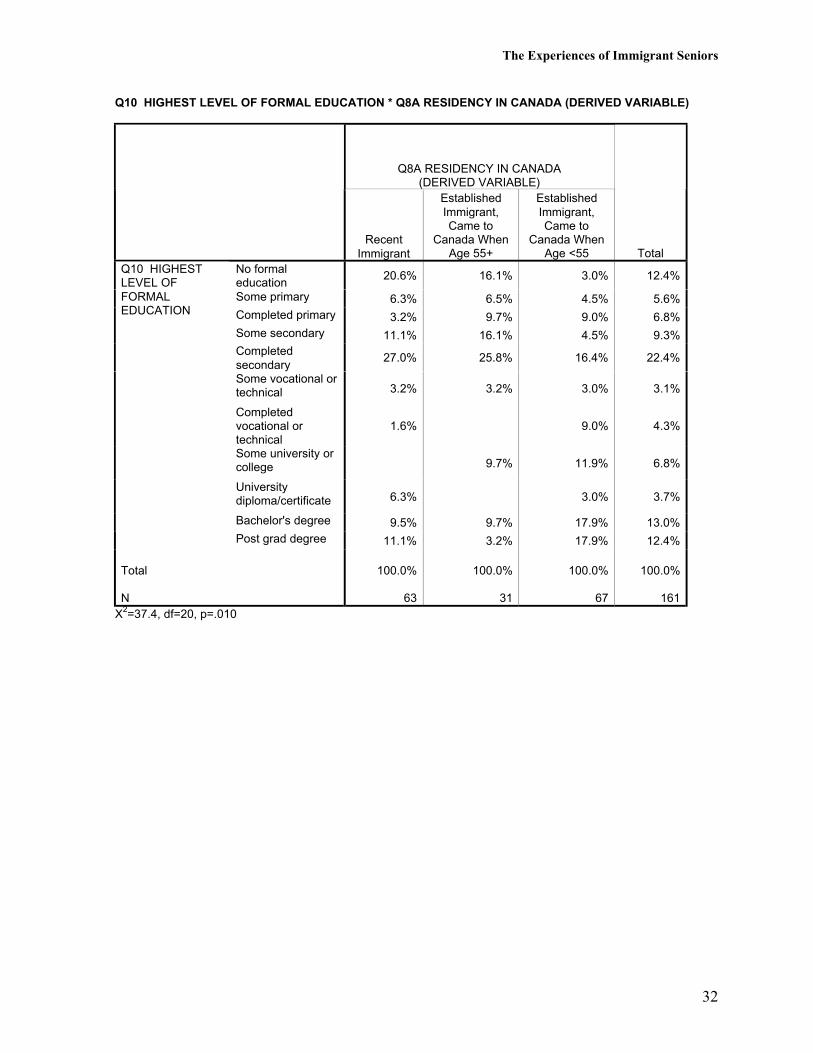
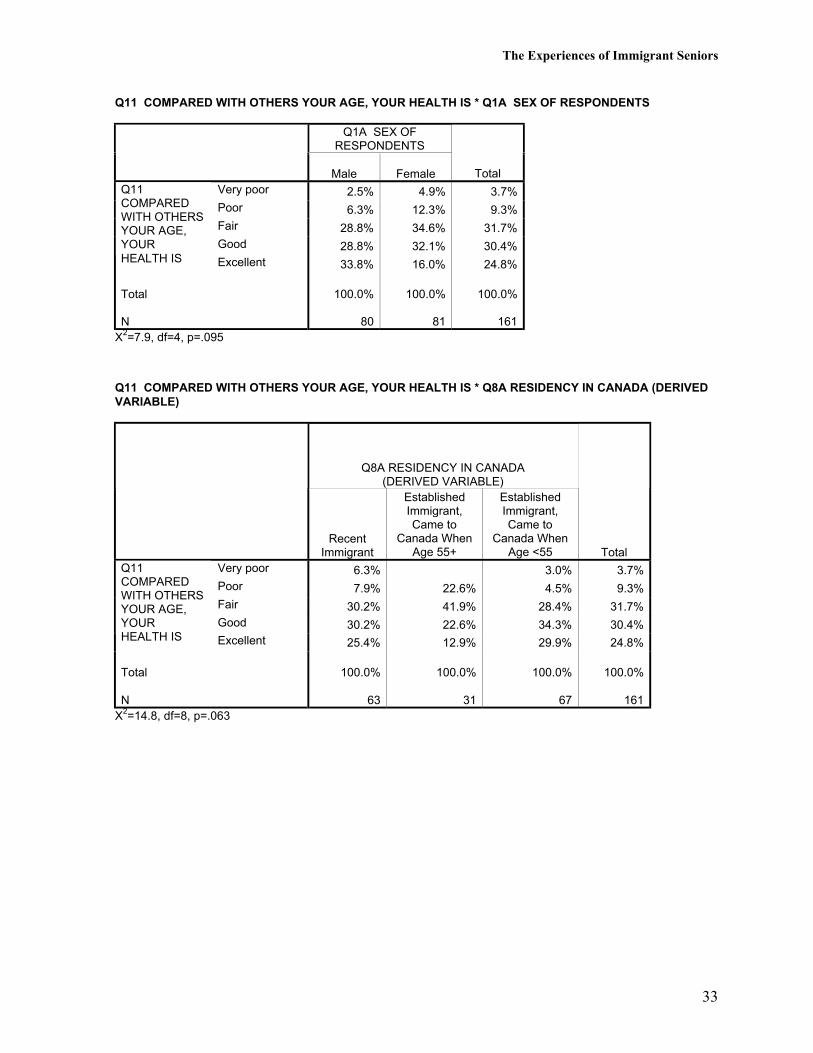
Twelve percent (12%) reported having had no formal education, another 22% reported havingeducation less than high school graduation. Twenty-two percent (22%) had completed highschool only and another 44% had at least some post-secondary education including 13% witha bachelor’s degree and 12% with a post-graduate degree. One in eight (12%) do notunderstand spoken English at all, 15% do not speak English at all, 19% do not read English atall, and 21% do not write English at all. Most report their health to be fair to excellent (4%very poor, 9% poor, 32% fair, 30% good, and 25% excellent) although 39% report that theyare limited by their health in their daily activities.
The following tables (all tables are included in the full report and excluded in the abbreviatedreport) show the characteristics of the persons interviewed for this study cross-tabulated bysex and by residency and age at entry into Canada. Recent immigrants are defined as personswho came to Canada 10 years ago or less (n=63) while established immigrants are defined aspersons who came to Canada more than 10 years ago (n=98). All persons interviewed for thisstudy were at least 60 years of age. Established immigrants may have entered Canada whenthey were younger than age 55 (n=67) while other established immigrants entered Canadawhen they were aged 55 or older (n=31).
The Experiences of Immigrant Seniors
10
Q1B LANGUAGE OF INTERVIEW * Q1A SEX OF RESPONDENTS
Q1A SEX OFRESPONDENTS
Male Female TotalEnglish 58.8% 64.2% 61.5%Hindi 20.0% 18.5% 19.3%
Q1BLANGUAGEOFINTERVIEW Punjabi 21.3% 17.3% 19.3%
Total
N
100.0%
80
100.0%
81
100.0%
161
X2=0.6, df=2, p=.752
Q1B LANGUAGE OF INTERVIEW * Q8A RESIDENCY IN CANADA (DERIVED VARIABLE)
Q8A RESIDENCY IN CANADA(DERIVED VARIABLE)
RecentImmigrant
EstablishedImmigrant,Came to
Canada WhenAge 55+
EstablishedImmigrant,Came to
Canada WhenAge <55 Total
English 52.4% 48.4% 76.1% 61.5%Hindi 17.5% 25.8% 17.9% 19.3%
Q1BLANGUAGEOFINTERVIEW Punjabi 30.2% 25.8% 6.0% 19.3%
Total
N
100.0%
63
100.0%
31
100.0%
67
100.0%
161
X2=15.6, df=4, p=.004 Recent Immigrants have lived in Canada 10 years or less. Established immigrants havelived in Canada more than 10 years.
The Experiences of Immigrant Seniors
11
Q1C COUNTRY OF BIRTH * Q1A SEX OF RESPONDENTS
Q1A SEX OFRESPONDENTS
Male Female TotalIndia 88.8% 75.3% 82.0%Pakistan 8.8% 18.5% 13.7%Bangladesh 1.3% 1.2% 1.2%
Q1CCOUNTRY OFBIRTH
Sri Lanka 1.3% 4.9% 3.1%
Total
N
100.0%
80
100.0%
81
100.0%
161
X2=5.5, df=3, p=.141
Q1C COUNTRY OF BIRTH * Q8A RESIDENCY IN CANADA (DERIVED VARIABLE)
Q8A RESIDENCY IN CANADA(DERIVED VARIABLE)
RecentImmigrant
EstablishedImmigrant,Came to
Canada WhenAge 55+
EstablishedImmigrant,Came to
Canada WhenAge <55 Total
India 79.4% 80.6% 85.1% 82.0%Pakistan 15.9% 16.1% 10.4% 13.7%Bangladesh 1.6% 1.5% 1.2%
Q1CCOUNTRY OFBIRTH
Sri Lanka 3.2% 3.2% 3.0% 3.1%
Total
N
100.0%
63
100.0%
31
100.0%
67
100.0%
161
X2=1.5, df=6, p=.960
The Experiences of Immigrant Seniors
12
Q1D MOTHER TONGUE * Q1A SEX OF RESPONDENTS
Q1A SEX OFRESPONDENTS
Male Female TotalBengali 5.0% 3.7% 4.3%English 1.3% .6%Gujarati 1.2% .6%Hindi 8.8% 19.8% 14.3%Hindi, Punjabi 2.5% 1.2%Initial Pretest - nodata
3.8% 1.9%
Konkani 2.5% 1.2%Malayalam 3.8% 9.9% 6.8%Marathi 1.2% .6%Punjabi 70.0% 50.6% 60.2%Punjabi, Hindi 1.3% 1.2% 1.2%Singhalese 3.7% 1.9%Tamil 1.3% 2.5% 1.9%Telugu 3.7% 1.9%
Q1D MOTHERTONGUE
Urdu 2.5% 1.2%
Total
N
100.0%
80
100.0%
81
100.0%
161X2=26.6, df=14, p=.022
The Experiences of Immigrant Seniors
13
Q1D MOTHER TONGUE * Q8A RESIDENCY IN CANADA (DERIVED VARIABLE)
Q8A RESIDENCY IN CANADA(DERIVED VARIABLE)
RecentImmigrant
EstablishedImmigrant,Came to
Canada WhenAge 55+
EstablishedImmigrant,Came to
Canada WhenAge <55 Total
Bengali 1.6% 9.0% 4.3%English 1.5% .6%Gujarati 1.5% .6%Hindi 14.3% 16.1% 13.4% 14.3%Hindi, Punjabi 3.2% 1.5% 1.2%Initial Pretest - nodata
3.2% 3.0% 1.9%
Konkani 1.6% 1.5% 1.2%Malayalam 4.8% 3.2% 10.4% 6.8%Marathi 1.5% .6%Punjabi 73.0% 67.7% 44.8% 60.2%Punjabi, Hindi 1.6% 1.5% 1.2%Singhalese 3.2% 3.2% 1.9%Tamil 4.5% 1.9%Telugu 3.2% 3.0% 1.9%
Q1D MOTHERTONGUE
Urdu 3.0% 1.2%
Total
N
100.0%
63
100.0%
31
100.0%
67
100.0%
161X2=32.7, df=28, p=.245
The Experiences of Immigrant Seniors
14
Q2 AGE * Q1A SEX OF RESPONDENTS
Q1A SEX OFRESPONDENTS
Male Female Total60 to 64 30.0% 34.6% 32.3%65 to 69 31.3% 24.7% 28.0%70 to 74 21.3% 24.7% 23.0%75 to 79 12.5% 6.2% 9.3%80 to 84 5.0% 7.4% 6.2%
Q2AGE
85+ 2.5% 1.2%
Total
N
100.0%
80
100.0%
81
100.0%
161X2=5.2, df=5, p=.396
Q2 AGE * Q8A RESIDENCY IN CANADA (DERIVED VARIABLE)
Q8A RESIDENCY IN CANADA(DERIVED VARIABLE)
RecentImmigrant
EstablishedImmigrant,Came to
Canada WhenAge 55+
EstablishedImmigrant,Came to
Canada WhenAge <55 Total
60 to 64 33.3% 9.7% 41.8% 32.3%65 to 69 41.3% 6.5% 25.4% 28.0%70 to 74 15.9% 35.5% 23.9% 23.0%75 to 79 6.3% 25.8% 4.5% 9.3%80 to 84 3.2% 16.1% 4.5% 6.2%
Q2AGE
85+ 6.5% 1.2%
Total
N
100.0%
63
100.0%
31
100.0%
67
100.0%
161X2=45.5, df=10, p=.000
The Experiences of Immigrant Seniors
15
Q3 MARITAL STATUS * Q1A SEX OF RESPONDENTS
Q1A SEX OFRESPONDENTS
Male Female TotalMarried andliving withspouse
73.8% 54.3% 64.0%
Married andspouse lives indifferent location
6.3% 1.2% 3.7%
Widowed 16.3% 42.0% 29.2%Never married 1.3% .6%Divorced 1.3% 2.5% 1.9%
Q3 MARITALSTATUS
Separated 1.3% .6%
Total
N
100.0%
80
100.0%
81
100.0%
161X2=16.6, df=5, p=.005
Q3 MARITAL STATUS * Q8A RESIDENCY IN CANADA (DERIVED VARIABLE)
Q8A RESIDENCY IN CANADA(DERIVED VARIABLE)
RecentImmigrant
EstablishedImmigrant,Came to
Canada WhenAge 55+
EstablishedImmigrant,Came to
Canada WhenAge <55 Total
Married andliving withspouse
60.3% 51.6% 73.1% 64.0%
Married andspouse lives indifferent location
9.7% 4.5% 3.7%
Widowed 38.1% 38.7% 16.4% 29.2%Never married 1.6% .6%Divorced 4.5% 1.9%
Q3 MARITALSTATUS
Separated 1.5% .6%
Total
N
100.0%
63
100.0%
31
100.0%
67
100.0%
161X2=20.7, df=10, p=.023
The Experiences of Immigrant Seniors
16
Q4A RELIGION * Q1A SEX OF RESPONDENTS
Q1A SEX OFRESPONDENTS
Male Female TotalBuddhism 3.7% 1.9%Christian 8.8% 9.9% 9.3%Hinduism 21.3% 44.4% 32.9%Muslim 3.7% 1.9%Sikhism 66.3% 38.3% 52.2%No Religion 2.5% 1.2%
Q4ARELIGION
NoResponse
1.3% .6%
Total
N
100.0%
80
100.0%
81
100.0%
161
x2=21.6, df=6, p=.001
Q4A RELIGION * Q8A RESIDENCY IN CANADA (DERIVED VARIABLE)
Q8A RESIDENCY IN CANADA(DERIVED VARIABLE)
RecentImmigrant
EstablishedImmigrant,Came to
Canada WhenAge 55+
EstablishedImmigrant,Came to
Canada WhenAge <55 Total
Buddhism 3.2% 3.2% 1.9%Christian 7.9% 3.2% 13.4% 9.3%Hinduism 22.2% 35.5% 41.8% 32.9%Muslim 1.6% 3.0% 1.9%Sikhism 63.5% 58.1% 38.8% 52.2%No Religion 1.6% 1.5% 1.2%
Q4ARELIGION
NoResponse
1.5% .6%
Total
N
100.0%
63
100.0%
31
100.0%
67
100.0%
161X2=15.6, df=12, p=.212
The Experiences of Immigrant Seniors
17
Q5A2 AGE WHEN IMMIGRATED TO CANADA * Q1A SEX OF RESPONDENTS
Q1A SEX OFRESPONDENTS
Male Female Total20 to 29 6.3% 2.5% 4.3%30 to 39 15.0% 17.3% 16.1%40 to 49 7.5% 11.1% 9.3%50 to 59 43.8% 43.2% 43.5%60 to 69 25.0% 21.0% 23.0%
Q5A2 AGEWHENIMMIGRATEDTO CANADA
70 to 79 2.5% 4.9% 3.7%
Total
N
100.0%
80
100.0%
81
100.0%
161X2=2.9, df=5, p=.709
Q5A2 AGE WHEN IMMIGRATED TO CANADA * Q8A RESIDENCY IN CANADA (DERIVED VARIABLE)
Q8A RESIDENCY IN CANADA(DERIVED VARIABLE)
RecentImmigrant
EstablishedImmigrant,Came to
Canada WhenAge 55+
EstablishedImmigrant,Came to
Canada WhenAge <55 Total
20 to 29 10.4% 4.3%30 to 39 38.8% 16.1%40 to 49 22.4% 9.3%50 to 59 49.2% 64.5% 28.4% 43.5%60 to 69 41.3% 35.5% 23.0%
Q5A2 AGEWHENIMMIGRATEDTO CANADA
70 to 79 9.5% 3.7%
Total
N
100.0%
63
100.0%
31
100.0%
67
100.0%
161X2=110.5, df=10, p=.000
The Experiences of Immigrant Seniors
18
Q5C1 REASON FOR IMMIGRATING: EMPLOYMENT/ECONOMIC REASONS * Q1A SEX OFRESPONDENTS
Q1A SEX OFRESPONDENTS
Male Female TotalNot selected
80.0% 88.9% 84.5%Q5C1 REASONFOR IMMIGRATING:EMPLOYMENT/ECONOMICREASONS
Selected20.0% 11.1% 15.5%
Total
N
100.0%
80
100.0%
81
100.0%
161X2=1.8, df=1, p=.180
Q5C1 REASON FOR IMMIGRATING: EMPLOYMENT/ECONOMIC REASONS * Q8A RESIDENCY INCANADA (DERIVED VARIABLE)
Q8A RESIDENCY IN CANADA(DERIVED VARIABLE)
RecentImmigrant
EstablishedImmigrant,Came to
Canada WhenAge 55+
EstablishedImmigrant,Came to
Canada WhenAge <55 Total
Not selected96.8% 100.0% 65.7% 84.5%
Q5C1 REASONFOR IMMIGRATING:EMPLOYMENT/ECONOMICREASONS
Selected3.2% 34.3% 15.5%
Total
N
100.0%
63
100.0%
31
100.0%
67
100.0%
161X2=31.1, df=2, p=.000

The Experiences of Immigrant Seniors
19
Q5C3 REASON FOR IMMIGRATING: TO BE WITH FAMILY * Q1A SEX OF RESPONDENTS
Q1A SEX OFRESPONDENTS
Male Female TotalNot selected 42.5% 23.5% 32.9%Q5C3 REASON
FORIMMIGRATING:TO BE WITHFAMILY
Selected57.5% 76.5% 67.1%
Total
N
100.0%
80
100.0%
81
100.0%
161
X2=5.8, df=1, p=.016
Q5C3 REASON FOR IMMIGRATING: TO BE WITH FAMILY * Q8A RESIDENCY IN CANADA (DERIVEDVARIABLE)
Q8A RESIDENCY IN CANADA(DERIVED VARIABLE)
RecentImmigrant
EstablishedImmigrant,Came to
Canada WhenAge 55+
EstablishedImmigrant,Came to
Canada WhenAge <55 Total
Not selected 17.5% 19.4% 53.7% 32.9%Q5C3 REASONFORIMMIGRATING:TO BE WITHFAMILY
Selected82.5% 80.6% 46.3% 67.1%
Total
N
100.0%
63
100.0%
31
100.0%
67
100.0%
161X2=22.5, df=2, p=.000
The Experiences of Immigrant Seniors
20
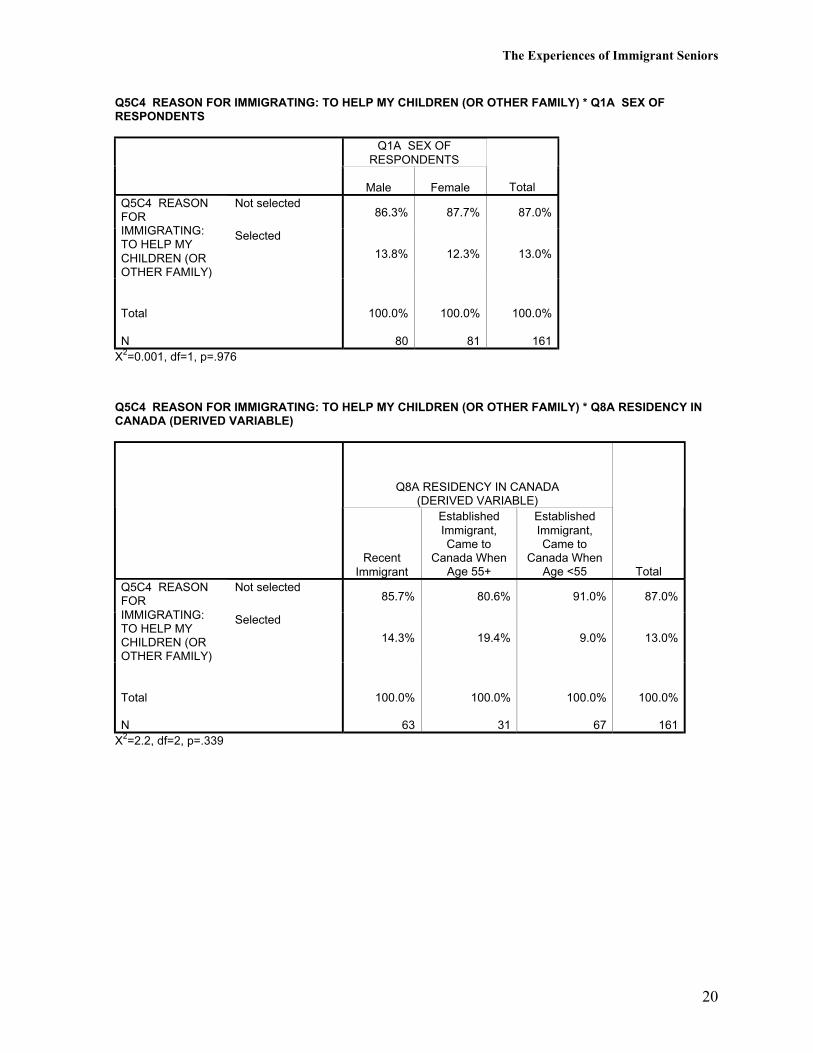
Q5C4 REASON FOR IMMIGRATING: TO HELP MY CHILDREN (OR OTHER FAMILY) * Q1A SEX OFRESPONDENTS
Q1A SEX OFRESPONDENTS
Male Female TotalNot selected
86.3% 87.7% 87.0%Q5C4 REASONFORIMMIGRATING:TO HELP MYCHILDREN (OROTHER FAMILY)
Selected
13.8% 12.3% 13.0%
Total
N
100.0%
80
100.0%
81
100.0%
161X2=0.001, df=1, p=.976
Q5C4 REASON FOR IMMIGRATING: TO HELP MY CHILDREN (OR OTHER FAMILY) * Q8A RESIDENCY INCANADA (DERIVED VARIABLE)
Q8A RESIDENCY IN CANADA(DERIVED VARIABLE)
RecentImmigrant
EstablishedImmigrant,Came to
Canada WhenAge 55+
EstablishedImmigrant,Came to
Canada WhenAge <55 Total
Not selected85.7% 80.6% 91.0% 87.0%
Q5C4 REASONFORIMMIGRATING:TO HELP MYCHILDREN (OROTHER FAMILY)
Selected
14.3% 19.4% 9.0% 13.0%
Total
N
100.0%
63
100.0%
31
100.0%
67
100.0%
161X2=2.2, df=2, p=.339
The Experiences of Immigrant Seniors
21
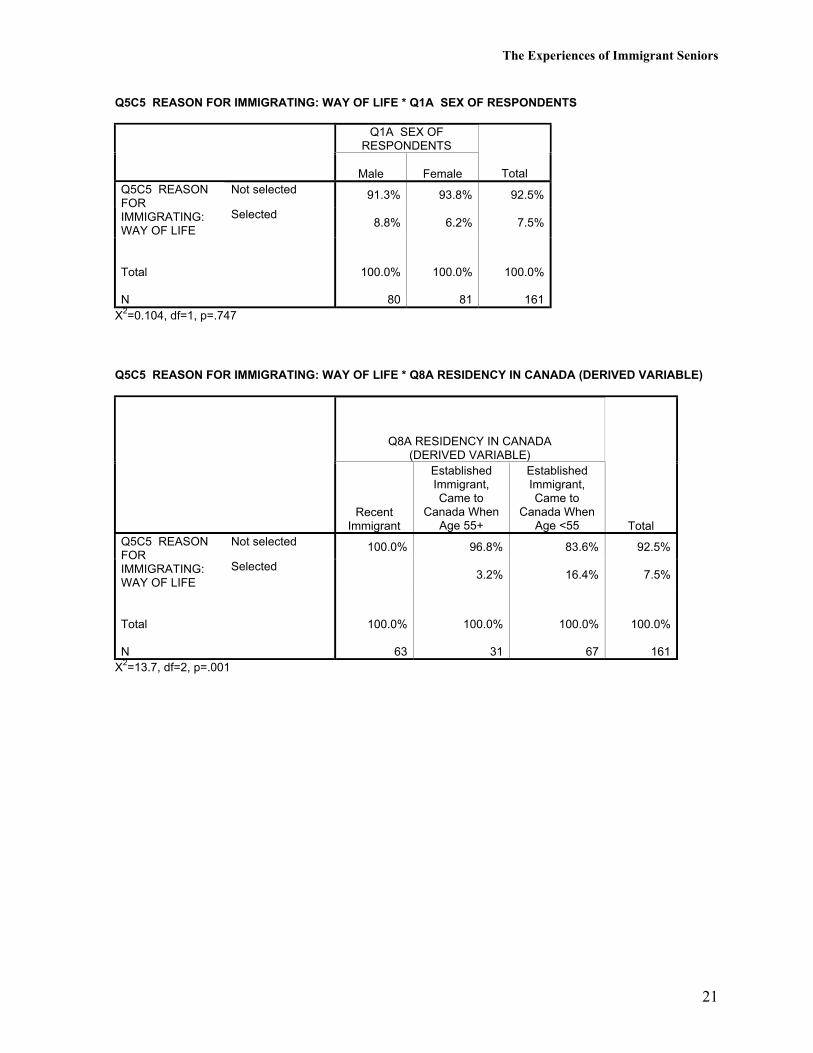
Q5C5 REASON FOR IMMIGRATING: WAY OF LIFE * Q1A SEX OF RESPONDENTS
Q1A SEX OFRESPONDENTS
Male Female TotalNot selected 91.3% 93.8% 92.5%Q5C5 REASON
FORIMMIGRATING:WAY OF LIFE
Selected8.8% 6.2% 7.5%
Total
N
100.0%
80
100.0%
81
100.0%
161X2=0.104, df=1, p=.747
Q5C5 REASON FOR IMMIGRATING: WAY OF LIFE * Q8A RESIDENCY IN CANADA (DERIVED VARIABLE)
Q8A RESIDENCY IN CANADA(DERIVED VARIABLE)
RecentImmigrant
EstablishedImmigrant,Came to
Canada WhenAge 55+
EstablishedImmigrant,Came to
Canada WhenAge <55 Total
Not selected 100.0% 96.8% 83.6% 92.5%Q5C5 REASONFORIMMIGRATING:WAY OF LIFE
Selected3.2% 16.4% 7.5%
Total
N
100.0%
63
100.0%
31
100.0%
67
100.0%
161X2=13.7, df=2, p=.001
The Experiences of Immigrant Seniors
22
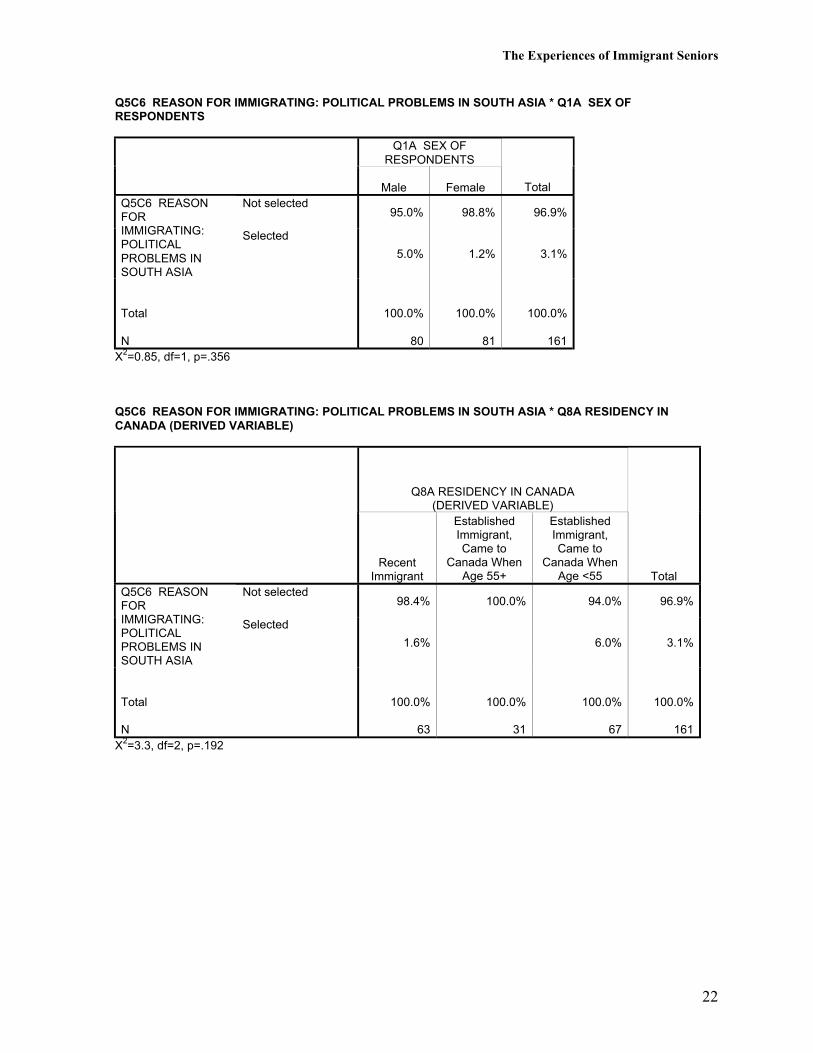
Q5C6 REASON FOR IMMIGRATING: POLITICAL PROBLEMS IN SOUTH ASIA * Q1A SEX OFRESPONDENTS
Q1A SEX OFRESPONDENTS
Male Female TotalNot selected
95.0% 98.8% 96.9%Q5C6 REASONFORIMMIGRATING:POLITICALPROBLEMS INSOUTH ASIA
Selected
5.0% 1.2% 3.1%
Total
N
100.0%
80
100.0%
81
100.0%
161X2=0.85, df=1, p=.356
Q5C6 REASON FOR IMMIGRATING: POLITICAL PROBLEMS IN SOUTH ASIA * Q8A RESIDENCY INCANADA (DERIVED VARIABLE)
Q8A RESIDENCY IN CANADA(DERIVED VARIABLE)
RecentImmigrant
EstablishedImmigrant,Came to
Canada WhenAge 55+
EstablishedImmigrant,Came to
Canada WhenAge <55 Total
Not selected98.4% 100.0% 94.0% 96.9%
Q5C6 REASONFORIMMIGRATING:POLITICALPROBLEMS INSOUTH ASIA
Selected
1.6% 6.0% 3.1%
Total
N
100.0%
63
100.0%
31
100.0%
67
100.0%
161X2=3.3, df=2, p=.192
The Experiences of Immigrant Seniors
23
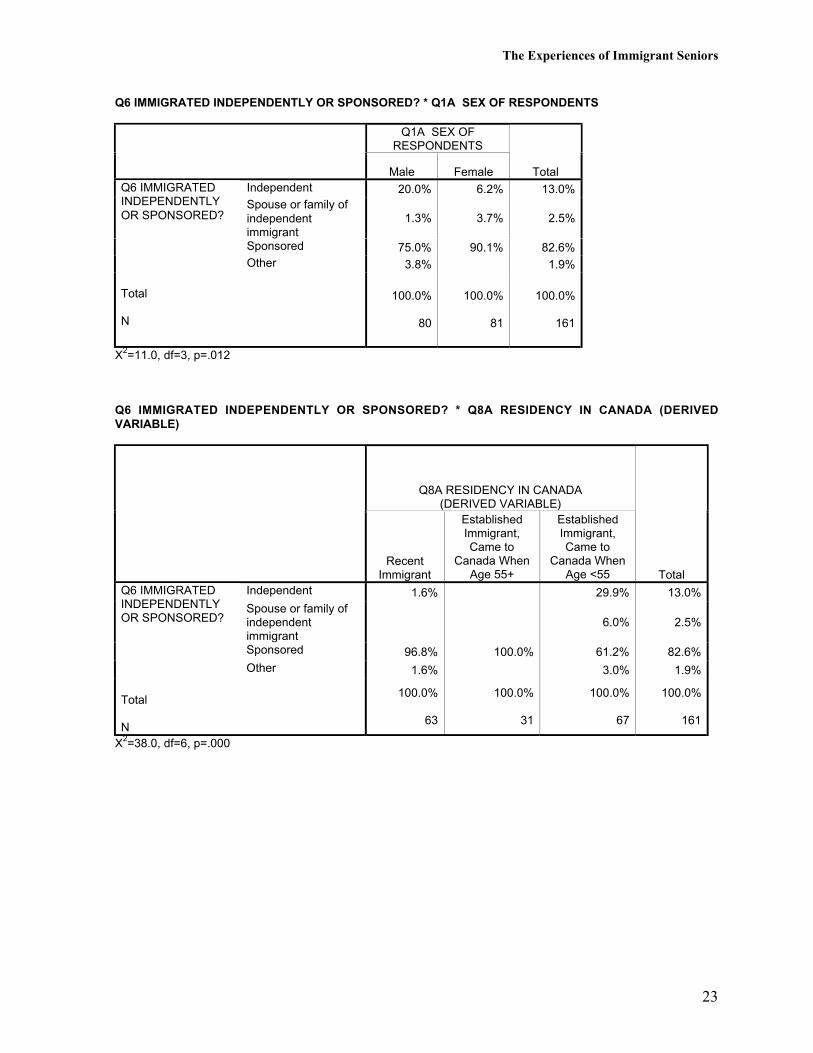
Q6 IMMIGRATED INDEPENDENTLY OR SPONSORED? * Q1A SEX OF RESPONDENTS
Q1A SEX OFRESPONDENTS
Male Female TotalIndependent 20.0% 6.2% 13.0%Spouse or family ofindependentimmigrant
1.3% 3.7% 2.5%
Sponsored 75.0% 90.1% 82.6%
Q6 IMMIGRATEDINDEPENDENTLYOR SPONSORED?
Other 3.8% 1.9%
Total
N
100.0%
80
100.0%
81
100.0%
161
X2=11.0, df=3, p=.012
Q6 IMMIGRATED INDEPENDENTLY OR SPONSORED? * Q8A RESIDENCY IN CANADA (DERIVEDVARIABLE)
Q8A RESIDENCY IN CANADA(DERIVED VARIABLE)
RecentImmigrant
EstablishedImmigrant,Came to
Canada WhenAge 55+
EstablishedImmigrant,Came to
Canada WhenAge <55 Total
Independent 1.6% 29.9% 13.0%Spouse or family ofindependentimmigrant
6.0% 2.5%
Sponsored 96.8% 100.0% 61.2% 82.6%
Q6 IMMIGRATEDINDEPENDENTLYOR SPONSORED?
Other 1.6% 3.0% 1.9%
Total
N
100.0%
63
100.0%
31
100.0%
67
100.0%
161
X2=38.0, df=6, p=.000
The Experiences of Immigrant Seniors
24
Q7 WHO SPONSORED YOU? * Q1A SEX OF RESPONDENTS
Q1A SEX OFRESPONDENTS
Male Female TotalBrother 6.2% 3.1%Church 1.3% .6%Daughter 41.3% 37.0% 39.1%Daughter, son-in-law
2.5% 1.2%
Husband 2.5% 1.2%School 1.2% .6%Sister 1.3% 3.7% 2.5%Sister-in-law 1.2% .6%Son 28.8% 34.6% 31.7%Spouse 1.3% 1.2% 1.2%Wife 1.3% .6%
Q7 WHOSPONSOREDYOU?
Not Applicable 25.0% 9.9% 17.4%
Total
N
100.0%
80
100.0%
81
100.0%
161X2=19.8, df=11, p=.049
The Experiences of Immigrant Seniors
25
Q7 WHO SPONSORED YOU? * Q8A RESIDENCY IN CANADA (DERIVED VARIABLE)
Q8A RESIDENCY IN CANADA(DERIVED VARIABLE)
RecentImmigrant
EstablishedImmigrant,Came to
Canada WhenAge 55+
EstablishedImmigrant,Came to
Canada WhenAge <55 Total
Brother 7.5% 3.1%Church 1.6% .6%Daughter 47.6% 45.2% 28.4% 39.1%Daughter, son-in-law
3.2% 1.5% 1.2%
Husband 3.0% 1.2%School 1.5% .6%Sister 6.0% 2.5%Sister-in-law 1.5% .6%Son 47.6% 51.6% 7.5% 31.7%Spouse 3.0% 1.2%Wife 1.5% .6%
Q7 WHOSPONSOREDYOU?
Not Applicable 3.2% 38.8%
Total
N
100.0%
63
100.0%
31
100.0%
67
100.0%
161X2=81.0, df=22, p=.000
The Experiences of Immigrant Seniors
26
Q8 ARE YOU A CANADIAN CITIZEN NOW? * Q1A SEX OF RESPONDENTS
Q1A SEX OFRESPONDENTS
Male Female TotalYes 65.8% 69.1% 67.5%Q8 ARE
YOU ACANADIANCITIZENNOW?
No34.2% 30.9% 32.5%
Total
N
100.0%
79
100.0%
81
100.0%
160X2=0.08, df=1, p=.781
Q8 ARE YOU A CANADIAN CITIZEN NOW? * Q8A RESIDENCY IN CANADA (DERIVED VARIABLE)
Q8A RESIDENCY IN CANADA(DERIVED VARIABLE)
RecentImmigrant
EstablishedImmigrant,Came to
Canada WhenAge 55+
EstablishedImmigrant,Came to
Canada WhenAge <55 Total
Yes 38.1% 76.7% 91.0% 67.5%Q8 AREYOU ACANADIANCITIZENNOW?
No61.9% 23.3% 9.0% 32.5%
Total
N
100.0%
63
100.0%
30
100.0%
67
100.0%
160X2=42.9, df=2, p=.000
The Experiences of Immigrant Seniors
27
Q9A UNDERSTAND SPOKEN ENGLISH? * Q1A SEX OF RESPONDENTS
Q1A SEX OFRESPONDENTS
Male Female TotalNot at all 5.0% 19.8% 12.4%A little bit 26.3% 25.9% 26.1%Fairly well 21.3% 19.8% 20.5%
Q9AUNDERSTANDSPOKENENGLISH?
Very well 47.5% 34.6% 41.0%
Total
N
100.0%
80
100.0%
81
100.0%
161X2=8.7, df=3, p=.033
Q9A UNDERSTAND SPOKEN ENGLISH? * Q8A RESIDENCY IN CANADA (DERIVED VARIABLE)
Q8A RESIDENCY IN CANADA(DERIVED VARIABLE)
RecentImmigrant
EstablishedImmigrant,Came to
Canada WhenAge 55+
EstablishedImmigrant,Came to
Canada WhenAge <55 Total
Not at all 22.2% 16.1% 1.5% 12.4%A little bit 34.9% 35.5% 13.4% 26.1%Fairly well 19.0% 25.8% 19.4% 20.5%
Q9AUNDERSTANDSPOKENENGLISH?
Very well 23.8% 22.6% 65.7% 41.0%
Total
N
100.0%
63
100.0%
31
100.0%
67
100.0%
161X2=36.3, df=6, p=.000
The Experiences of Immigrant Seniors
28
Q9B SPEAK ENGLISH? * Q1A SEX OF RESPONDENTS
Q1A SEX OFRESPONDENTS
Male Female TotalNot at all 7.5% 22.2% 14.9%A little bit 30.0% 30.9% 30.4%Fairly well 18.8% 13.6% 16.1%
Q9BSPEAKENGLISH?
Very well 43.8% 33.3% 38.5%
Total
N
100.0%
80
100.0%
81
100.0%
161X2=7.7, df=3, p=.054
Q9B SPEAK ENGLISH? * Q8A RESIDENCY IN CANADA (DERIVED VARIABLE)
Q8A RESIDENCY IN CANADA(DERIVED VARIABLE)
RecentImmigrant
EstablishedImmigrant,Came to
Canada WhenAge 55+
EstablishedImmigrant,Came to
Canada WhenAge <55 Total
Not at all 23.8% 19.4% 4.5% 14.9%A little bit 41.3% 38.7% 16.4% 30.4%Fairly well 14.3% 22.6% 14.9% 16.1%
Q9BSPEAKENGLISH?
Very well 20.6% 19.4% 64.2% 38.5%
Total
N
100.0%
63
100.0%
31
100.0%
67
100.0%
161X2=36.7, df=6, p=.000

The Experiences of Immigrant Seniors
29
Q9C READ ENGLISH? * Q1A SEX OF RESPONDENTS
Q1A SEX OFRESPONDENTS
Male Female TotalNot at all 11.3% 27.2% 19.3%A little bit 21.3% 22.2% 21.7%Fairly well 16.3% 14.8% 15.5%
Q9C READENGLISH?
Very well 51.3% 35.8% 43.5%
Total
N
100.0%
80
100.0%
81
100.0%
161X2=7.6, df=3, p=.056
Q9C READ ENGLISH? * Q8A RESIDENCY IN CANADA (DERIVED VARIABLE)
Q8A RESIDENCY IN CANADA(DERIVED VARIABLE)
RecentImmigrant
EstablishedImmigrant,Came to
Canada WhenAge 55+
EstablishedImmigrant,Came to
Canada WhenAge <55 Total
Not at all 27.0% 35.5% 4.5% 19.3%A little bit 27.0% 29.0% 13.4% 21.7%Fairly well 17.5% 12.9% 14.9% 15.5%
Q9C READENGLISH?
Very well 28.6% 22.6% 67.2% 43.5%
Total
N
100.0%
63
100.0%
31
100.0%
67
100.0%
161X2=32.8, df=6, p=.000
The Experiences of Immigrant Seniors
30
Q9D WRITE ENGLISH? * Q1A SEX OF RESPONDENTS
Q1A SEX OFRESPONDENTS
Male Female TotalNot at all 15.0% 27.2% 21.1%A little bit 18.8% 25.9% 22.4%Fairly well 13.8% 17.3% 15.5%
Q9D WRITEENGLISH?
Very well 52.5% 29.6% 41.0%
Total
N
100.0%
80
100.0%
81
100.0%
61X2=9.2, df=3, p=.027
Q9D WRITE ENGLISH? * Q8A RESIDENCY IN CANADA (DERIVED VARIABLE)
Q8A RESIDENCY IN CANADA(DERIVED VARIABLE)
RecentImmigrant
EstablishedImmigrant,Came to
Canada WhenAge 55+
EstablishedImmigrant,Came to
Canada WhenAge <55 Total
Not at all 28.6% 35.5% 7.5% 21.1%A little bit 30.2% 25.8% 13.4% 22.4%Fairly well 12.7% 12.9% 19.4% 15.5%
Q9D WRITEENGLISH?
Very well 28.6% 25.8% 59.7% 41.0%
Total
N
100.0%
63
100.0%
31
100.0%
67
100.0%
161X2=25.8, df=6, p=.000
The Experiences of Immigrant Seniors
31
Q10 HIGHEST LEVEL OF FORMAL EDUCATION * Q1A SEX OF RESPONDENTS
Q1A SEX OFRESPONDENTS
Male Female TotalNo formaleducation
5.0% 19.8% 12.4%
Some primary 5.0% 6.2% 5.6%Completed primary 1.3% 12.3% 6.8%Some secondary 13.8% 4.9% 9.3%Completedsecondary
23.8% 21.0% 22.4%
Some vocational ortechnical 2.5% 3.7% 3.1%
Completedvocational ortechnical
3.8% 4.9% 4.3%
Some university orcollege 6.3% 7.4% 6.8%
Universitydiploma/certificate 2.5% 4.9% 3.7%
Bachelor's degree 16.3% 9.9% 13.0%
Q10 HIGHESTLEVEL OFFORMALEDUCATION
Post grad degree 20.0% 4.9% 12.4%
Total
N
100.0%
80
100.0%
81
100.0%
161X2=27.5, df=10, p=.002
The Experiences of Immigrant Seniors
32
Q10 HIGHEST LEVEL OF FORMAL EDUCATION * Q8A RESIDENCY IN CANADA (DERIVED VARIABLE)
Q8A RESIDENCY IN CANADA(DERIVED VARIABLE)
RecentImmigrant
EstablishedImmigrant,Came to
Canada WhenAge 55+
EstablishedImmigrant,Came to
Canada WhenAge <55 Total
No formaleducation
20.6% 16.1% 3.0% 12.4%
Some primary 6.3% 6.5% 4.5% 5.6%Completed primary 3.2% 9.7% 9.0% 6.8%Some secondary 11.1% 16.1% 4.5% 9.3%Completedsecondary
27.0% 25.8% 16.4% 22.4%
Some vocational ortechnical 3.2% 3.2% 3.0% 3.1%
Completedvocational ortechnical
1.6% 9.0% 4.3%
Some university orcollege 9.7% 11.9% 6.8%
Universitydiploma/certificate 6.3% 3.0% 3.7%
Bachelor's degree 9.5% 9.7% 17.9% 13.0%
Q10 HIGHESTLEVEL OFFORMALEDUCATION
Post grad degree 11.1% 3.2% 17.9% 12.4%
Total
N
100.0%
63
100.0%
31
100.0%
67
100.0%
161X2=37.4, df=20, p=.010
The Experiences of Immigrant Seniors
33
Q11 COMPARED WITH OTHERS YOUR AGE, YOUR HEALTH IS * Q1A SEX OF RESPONDENTS
Q1A SEX OFRESPONDENTS
Male Female TotalVery poor 2.5% 4.9% 3.7%Poor 6.3% 12.3% 9.3%Fair 28.8% 34.6% 31.7%Good 28.8% 32.1% 30.4%
Q11COMPAREDWITH OTHERSYOUR AGE,YOURHEALTH IS Excellent 33.8% 16.0% 24.8%
Total
N
100.0%
80
100.0%
81
100.0%
161X2=7.9, df=4, p=.095
Q11 COMPARED WITH OTHERS YOUR AGE, YOUR HEALTH IS * Q8A RESIDENCY IN CANADA (DERIVEDVARIABLE)
Q8A RESIDENCY IN CANADA(DERIVED VARIABLE)
RecentImmigrant
EstablishedImmigrant,Came to
Canada WhenAge 55+
EstablishedImmigrant,Came to
Canada WhenAge <55 Total
Very poor 6.3% 3.0% 3.7%Poor 7.9% 22.6% 4.5% 9.3%Fair 30.2% 41.9% 28.4% 31.7%Good 30.2% 22.6% 34.3% 30.4%
Q11COMPAREDWITH OTHERSYOUR AGE,YOURHEALTH IS Excellent 25.4% 12.9% 29.9% 24.8%
Total
N
100.0%
63
100.0%
31
100.0%
67
100.0%
161X2=14.8, df=8, p=.063

The Experiences of Immigrant Seniors
34
Q12 LIMITED BY HEALTH IN DAILY ACTIVITIES? * Q1A SEX OF RESPONDENTS
Q1A SEX OFRESPONDENTS
Male Female TotalYes 23.8% 54.3% 39.1%Q12
LIMITED BYHEALTH INDAILYACTIVITIES?
No76.3% 45.7% 60.9%
Total
N
100.0%
80
100.0%
81
100.0%
161X2=14.5, df=1, p=.000
Q12 LIMITED BY HEALTH IN DAILY ACTIVITIES? * Q8A RESIDENCY IN CANADA (DERIVED VARIABLE)
Q8A RESIDENCY IN CANADA(DERIVED VARIABLE)
RecentImmigrant
EstablishedImmigrant,Came to
Canada WhenAge 55+
EstablishedImmigrant,Came to
Canada WhenAge <55 Total
Yes 36.5% 51.6% 35.8% 39.1%Q12LIMITED BYHEALTH INDAILYACTIVITIES?
No63.5% 48.4% 64.2% 60.9%
Total
N
100.0%
63
100.0%
31
100.0%
67
100.0%
161X2=2.5, df=2, p=.284
The Experiences of Immigrant Seniors
35
Respondents’ Children and Grandchildren
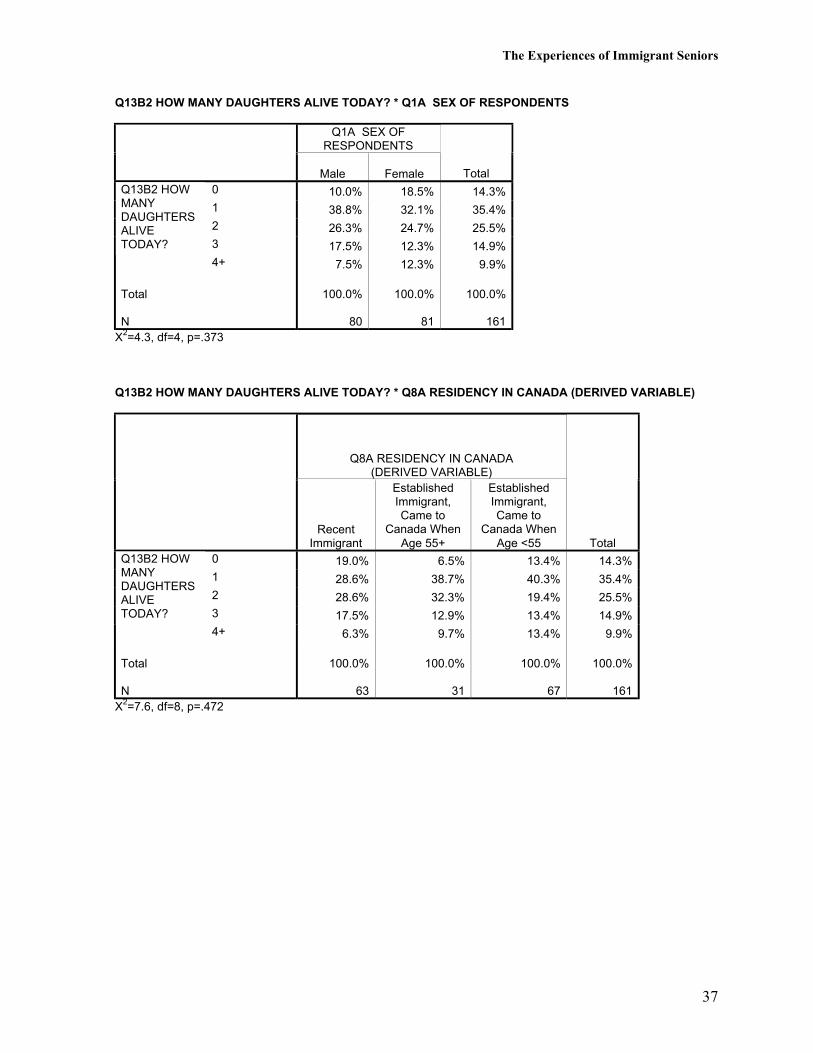
One in seven respondents (14%) reported having no living sons. Established immigrants whocame to Canada before the age of 55 were more likely to have no sons or one living son andless likely to have 2 or more sons. One in seven respondents (14%) also reported having noliving daughters.
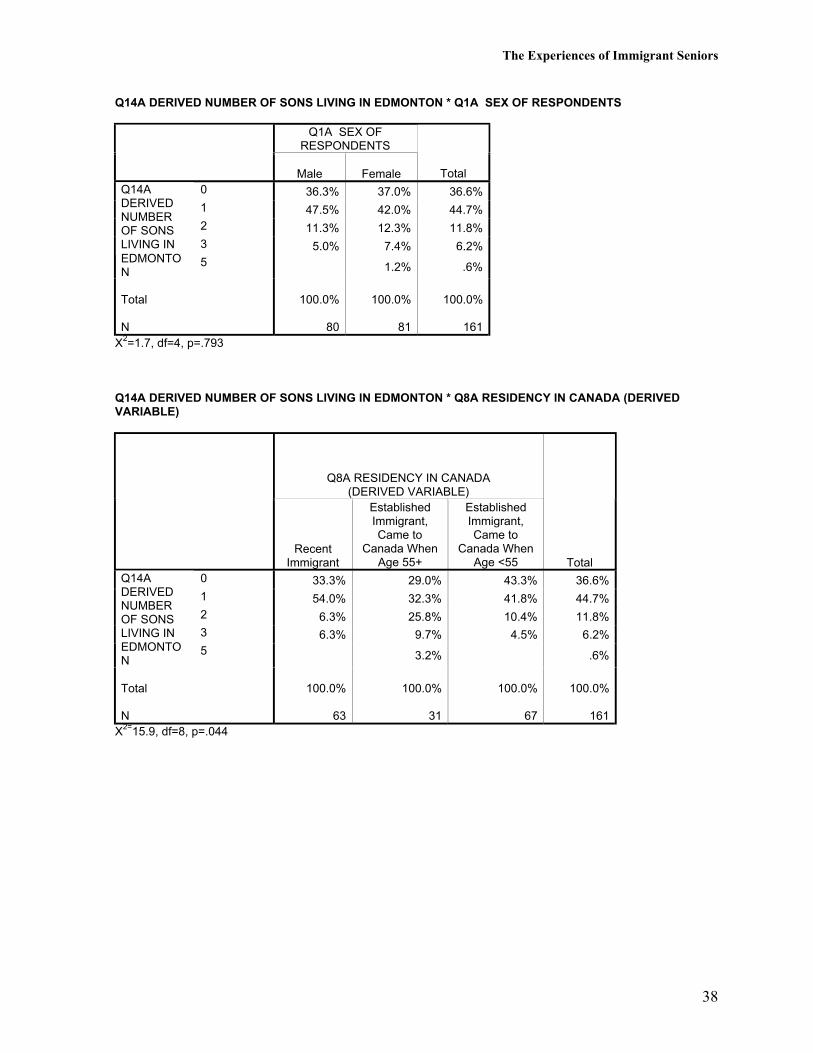
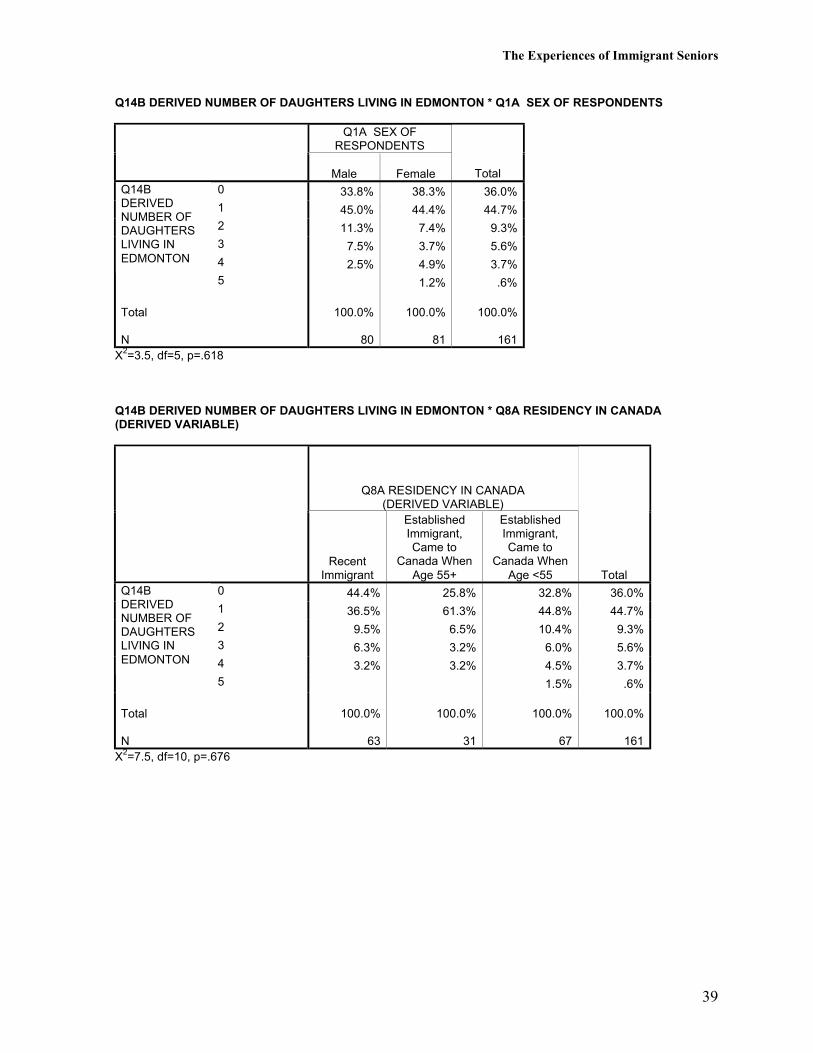
Over one third of respondents (37%) reported that they had no sons living in the Edmontonarea. Established immigrants who came to Canada before the age of 55 years were somewhatmore likely to have no sons living in the Edmonton area. Over one third of respondents (36%)reported that they had no daughters living in the Edmonton area.
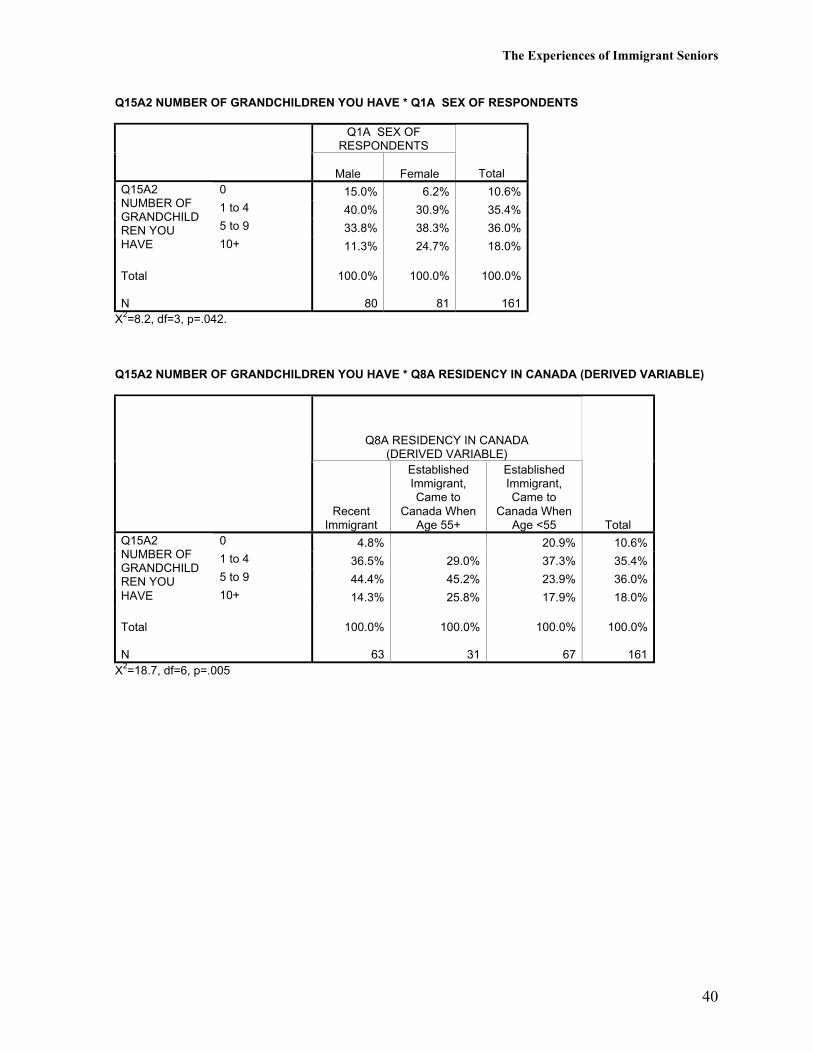
One in ten respondents (11%) reported having no grandchildren. Males were less likely tohave grandchildren than females (15% of males and 6% of females had no grandchildren) andestablished immigrants who came to Canada before the age of 55 years were more likely tohave no grandchildren than more recent immigrants.
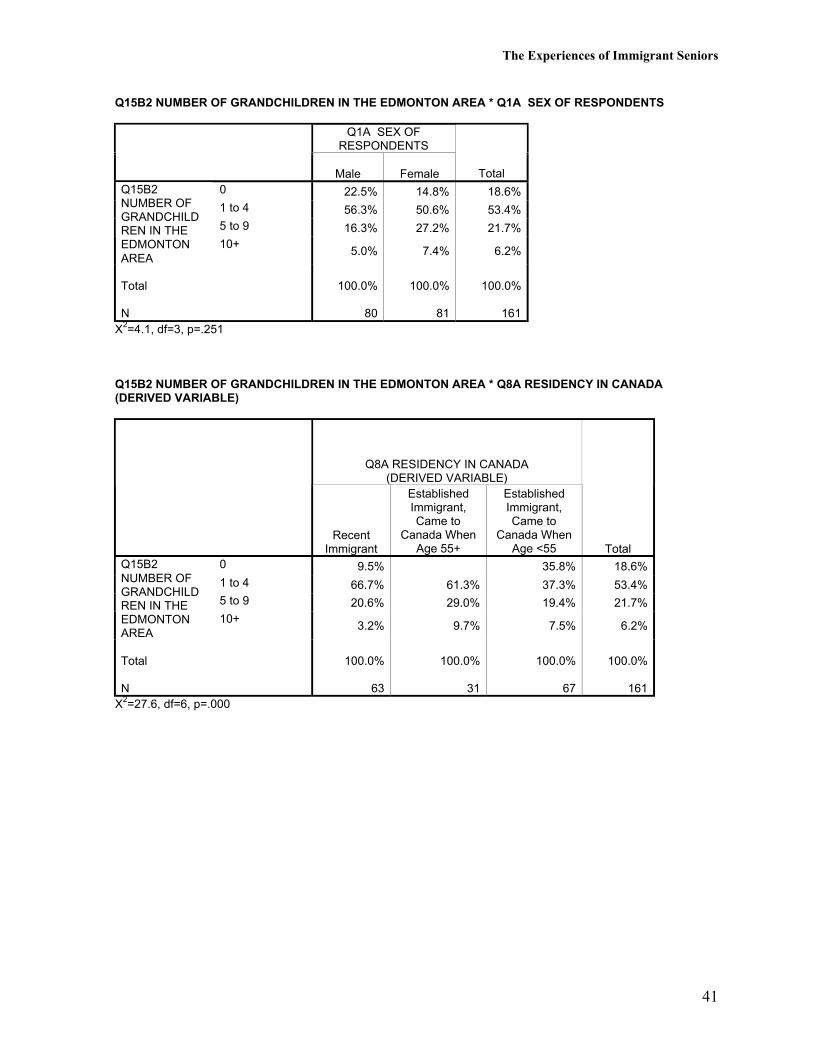
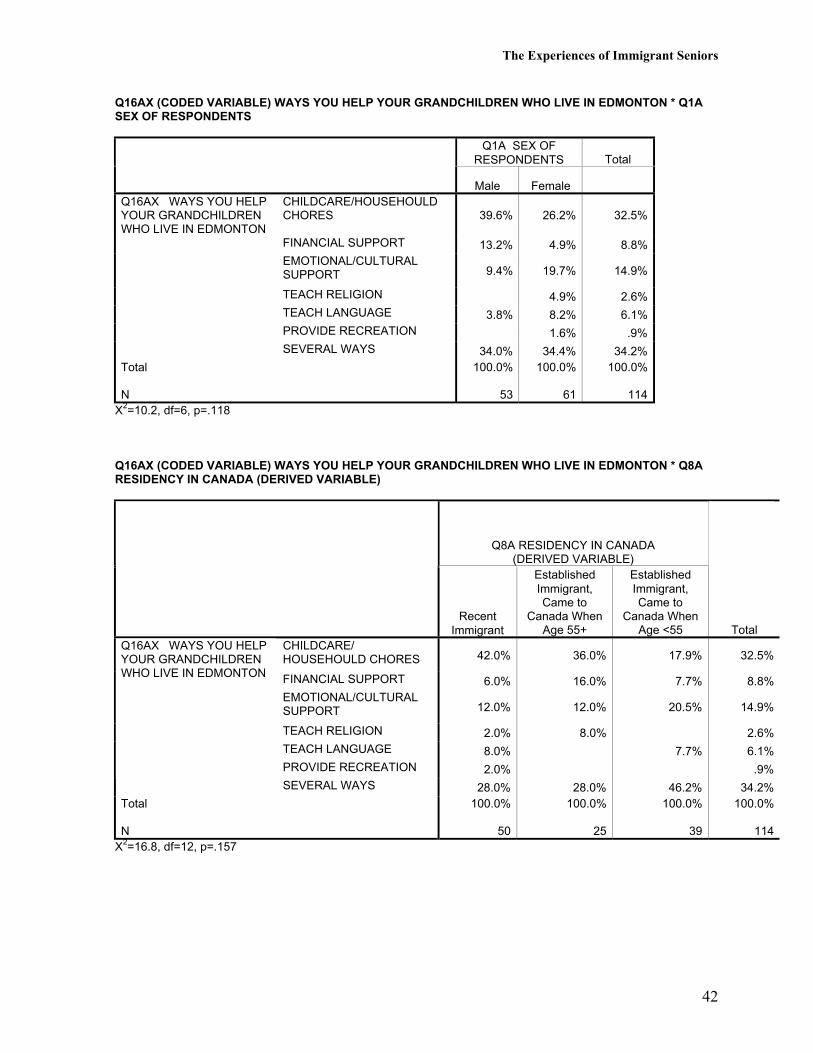
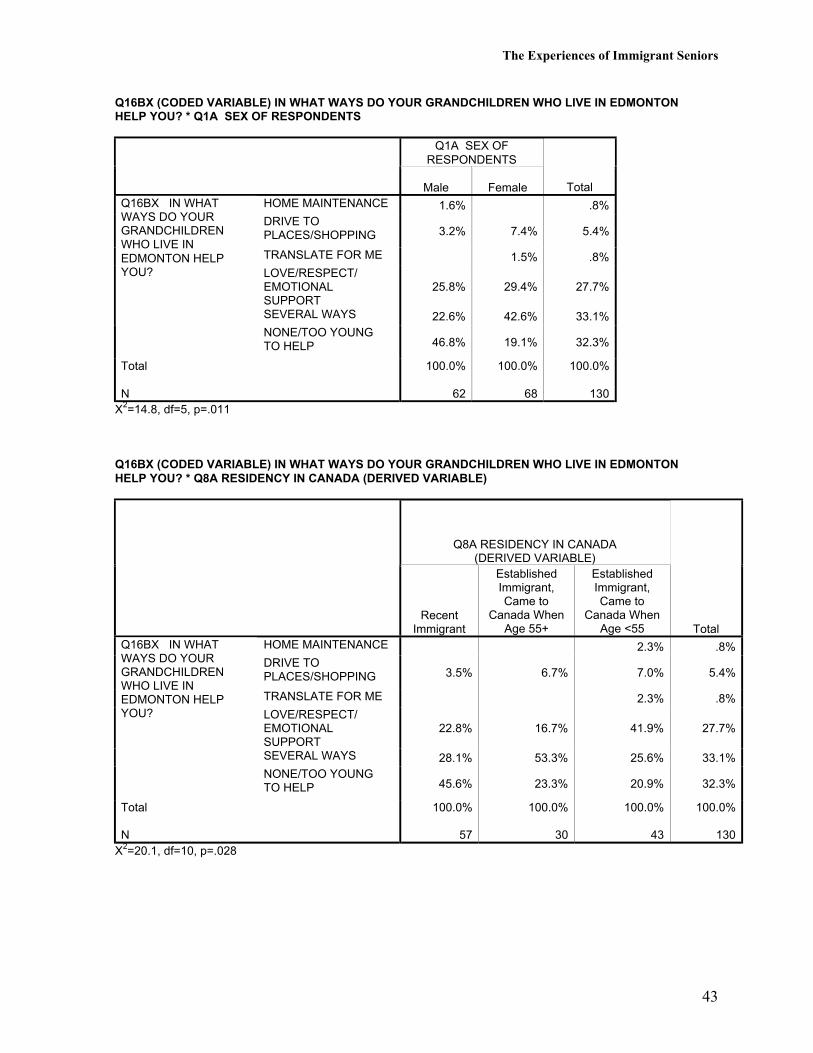
Almost one in five respondents (19%) reported that they had no grandchildren living in theEdmonton area. Established immigrants who came to Canada before the age of 55 years weremore likely to have no grandchildren living in the Edmonton area than more recentimmigrants. Respondents with grandchildren living in the Edmonton area indicated that theyhelped their grandchildren in a variety of ways including providing childcare and helping withhousehold chores. Respondents with grandchildren living in the Edmonton area indicated thattheir grandchildren helped the respondents in a variety of ways in particular by giving love,respect and emotional support, although one third of these respondents (32%) said that theirgrandchildren did not help them or were too young to help. There were some sex andresidency differences. That is, women were more likely to say that their grandchildren helpedthem in several ways while men were more likely to say that their grandchildren did not helpthem or were too young to help. With respect to residency, recent immigrants were morelikely to say that their grandchildren did not help them or were too young to help, establishedimmigrants who came to Canada at an older age were more likely to say that theirgrandchildren help them in several ways, while established immigrants who came to Canadaat a younger age were more likely to say that their grandchildren helped them by providinglove, respect and emotional support.
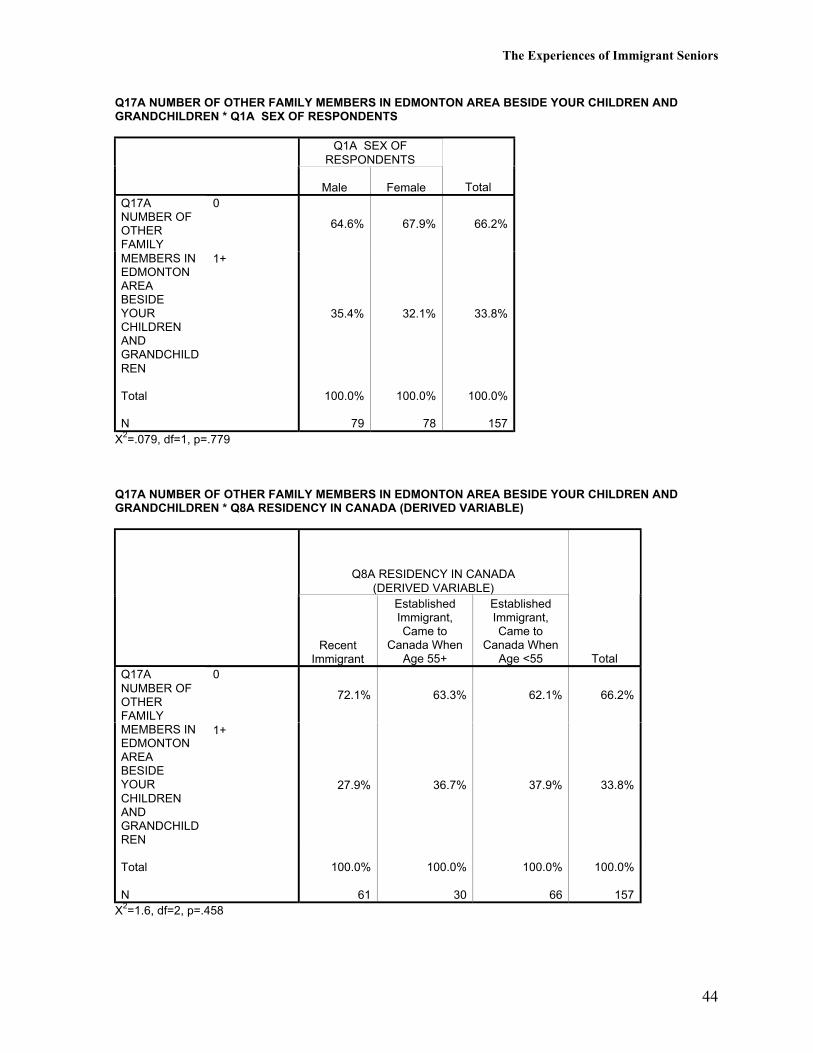
Finally, two thirds of respondents (66%) said that they did not have any other family membersliving in the Edmonton area beside their children and grandchildren.

The Experiences of Immigrant Seniors
36
Q13A2 HOW MANY SONS ALIVE TODAY? * Q1A SEX OF RESPONDENTS
Q1A SEX OFRESPONDENTS
Male Female Total0 11.3% 16.0% 13.7%1 51.3% 35.8% 43.5%2 25.0% 29.6% 27.3%3 10.0% 7.4% 8.7%
Q13A2HOWMANYSONSALIVETODAY? 4+ 2.5% 11.1% 6.8%
Total
N
100.0%
80
100.0%
81
100.0%
161X2=7.9, df=4, p=.096
Q13A2 HOW MANY SONS ALIVE TODAY? * Q8A RESIDENCY IN CANADA (DERIVED VARIABLE)
Q8A RESIDENCY IN CANADA(DERIVED VARIABLE)
RecentImmigrant
EstablishedImmigrant,Came to
Canada WhenAge 55+
EstablishedImmigrant,Came to
Canada WhenAge <55 Total
0 9.5% 9.7% 19.4% 13.7%1 41.3% 25.8% 53.7% 43.5%2 31.7% 38.7% 17.9% 27.3%3 12.7% 9.7% 4.5% 8.7%
Q13A2HOWMANYSONSALIVETODAY? 4+ 4.8% 16.1% 4.5% 6.8%
Total
N
100.0%
63
100.0%
31
100.0%
67
100.0%
161X2=18.2, df=8, p=.020
The Experiences of Immigrant Seniors
37
Q13B2 HOW MANY DAUGHTERS ALIVE TODAY? * Q1A SEX OF RESPONDENTS
Q1A SEX OFRESPONDENTS
Male Female Total0 10.0% 18.5% 14.3%1 38.8% 32.1% 35.4%2 26.3% 24.7% 25.5%3 17.5% 12.3% 14.9%
Q13B2 HOWMANYDAUGHTERSALIVETODAY?
4+ 7.5% 12.3% 9.9%
Total
N
100.0%
80
100.0%
81
100.0%
161X2=4.3, df=4, p=.373
Q13B2 HOW MANY DAUGHTERS ALIVE TODAY? * Q8A RESIDENCY IN CANADA (DERIVED VARIABLE)
Q8A RESIDENCY IN CANADA(DERIVED VARIABLE)
RecentImmigrant
EstablishedImmigrant,Came to
Canada WhenAge 55+
EstablishedImmigrant,Came to
Canada WhenAge <55 Total
0 19.0% 6.5% 13.4% 14.3%1 28.6% 38.7% 40.3% 35.4%2 28.6% 32.3% 19.4% 25.5%3 17.5% 12.9% 13.4% 14.9%
Q13B2 HOWMANYDAUGHTERSALIVETODAY?
4+ 6.3% 9.7% 13.4% 9.9%
Total
N
100.0%
63
100.0%
31
100.0%
67
100.0%
161X2=7.6, df=8, p=.472
The Experiences of Immigrant Seniors
38
Q14A DERIVED NUMBER OF SONS LIVING IN EDMONTON * Q1A SEX OF RESPONDENTS
Q1A SEX OFRESPONDENTS
Male Female Total0 36.3% 37.0% 36.6%1 47.5% 42.0% 44.7%2 11.3% 12.3% 11.8%3 5.0% 7.4% 6.2%
Q14ADERIVEDNUMBEROF SONSLIVING INEDMONTON
5 1.2% .6%
Total
N
100.0%
80
100.0%
81
100.0%
161X2=1.7, df=4, p=.793
Q14A DERIVED NUMBER OF SONS LIVING IN EDMONTON * Q8A RESIDENCY IN CANADA (DERIVEDVARIABLE)
Q8A RESIDENCY IN CANADA(DERIVED VARIABLE)
RecentImmigrant
EstablishedImmigrant,Came to
Canada WhenAge 55+
EstablishedImmigrant,Came to
Canada WhenAge <55 Total
0 33.3% 29.0% 43.3% 36.6%1 54.0% 32.3% 41.8% 44.7%2 6.3% 25.8% 10.4% 11.8%3 6.3% 9.7% 4.5% 6.2%
Q14ADERIVEDNUMBEROF SONSLIVING INEDMONTON
5 3.2% .6%
Total
N
100.0%
63
100.0%
31
100.0%
67
100.0%
161X2=15.9, df=8, p=.044
The Experiences of Immigrant Seniors
39
Q14B DERIVED NUMBER OF DAUGHTERS LIVING IN EDMONTON * Q1A SEX OF RESPONDENTS
Q1A SEX OFRESPONDENTS
Male Female Total0 33.8% 38.3% 36.0%1 45.0% 44.4% 44.7%2 11.3% 7.4% 9.3%3 7.5% 3.7% 5.6%4 2.5% 4.9% 3.7%
Q14BDERIVEDNUMBER OFDAUGHTERSLIVING INEDMONTON
5 1.2% .6%
Total
N
100.0%
80
100.0%
81
100.0%
161X2=3.5, df=5, p=.618
Q14B DERIVED NUMBER OF DAUGHTERS LIVING IN EDMONTON * Q8A RESIDENCY IN CANADA(DERIVED VARIABLE)
Q8A RESIDENCY IN CANADA(DERIVED VARIABLE)
RecentImmigrant
EstablishedImmigrant,Came to
Canada WhenAge 55+
EstablishedImmigrant,Came to
Canada WhenAge <55 Total
0 44.4% 25.8% 32.8% 36.0%1 36.5% 61.3% 44.8% 44.7%2 9.5% 6.5% 10.4% 9.3%3 6.3% 3.2% 6.0% 5.6%4 3.2% 3.2% 4.5% 3.7%
Q14BDERIVEDNUMBER OFDAUGHTERSLIVING INEDMONTON
5 1.5% .6%
Total
N
100.0%
63
100.0%
31
100.0%
67
100.0%
161X2=7.5, df=10, p=.676
The Experiences of Immigrant Seniors
40
Q15A2 NUMBER OF GRANDCHILDREN YOU HAVE * Q1A SEX OF RESPONDENTS
Q1A SEX OFRESPONDENTS
Male Female Total0 15.0% 6.2% 10.6%1 to 4 40.0% 30.9% 35.4%5 to 9 33.8% 38.3% 36.0%
Q15A2NUMBER OFGRANDCHILDREN YOUHAVE 10+ 11.3% 24.7% 18.0%
Total
N
100.0%
80
100.0%
81
100.0%
161X2=8.2, df=3, p=.042.
Q15A2 NUMBER OF GRANDCHILDREN YOU HAVE * Q8A RESIDENCY IN CANADA (DERIVED VARIABLE)
Q8A RESIDENCY IN CANADA(DERIVED VARIABLE)
RecentImmigrant
EstablishedImmigrant,Came to
Canada WhenAge 55+
EstablishedImmigrant,Came to
Canada WhenAge <55 Total
0 4.8% 20.9% 10.6%1 to 4 36.5% 29.0% 37.3% 35.4%5 to 9 44.4% 45.2% 23.9% 36.0%
Q15A2NUMBER OFGRANDCHILDREN YOUHAVE 10+ 14.3% 25.8% 17.9% 18.0%
Total
N
100.0%
63
100.0%
31
100.0%
67
100.0%
161X2=18.7, df=6, p=.005
The Experiences of Immigrant Seniors
41
Q15B2 NUMBER OF GRANDCHILDREN IN THE EDMONTON AREA * Q1A SEX OF RESPONDENTS
Q1A SEX OFRESPONDENTS
Male Female Total0 22.5% 14.8% 18.6%1 to 4 56.3% 50.6% 53.4%5 to 9 16.3% 27.2% 21.7%
Q15B2NUMBER OFGRANDCHILDREN IN THEEDMONTONAREA
10+5.0% 7.4% 6.2%
Total
N
100.0%
80
100.0%
81
100.0%
161X2=4.1, df=3, p=.251
Q15B2 NUMBER OF GRANDCHILDREN IN THE EDMONTON AREA * Q8A RESIDENCY IN CANADA(DERIVED VARIABLE)
Q8A RESIDENCY IN CANADA(DERIVED VARIABLE)
RecentImmigrant
EstablishedImmigrant,Came to
Canada WhenAge 55+
EstablishedImmigrant,Came to
Canada WhenAge <55 Total
0 9.5% 35.8% 18.6%1 to 4 66.7% 61.3% 37.3% 53.4%5 to 9 20.6% 29.0% 19.4% 21.7%
Q15B2NUMBER OFGRANDCHILDREN IN THEEDMONTONAREA
10+3.2% 9.7% 7.5% 6.2%
Total
N
100.0%
63
100.0%
31
100.0%
67
100.0%
161X2=27.6, df=6, p=.000
The Experiences of Immigrant Seniors
42
Q16AX (CODED VARIABLE) WAYS YOU HELP YOUR GRANDCHILDREN WHO LIVE IN EDMONTON * Q1ASEX OF RESPONDENTS
Q1A SEX OFRESPONDENTS Total
Male FemaleQ16AX WAYS YOU HELPYOUR GRANDCHILDRENWHO LIVE IN EDMONTON
CHILDCARE/HOUSEHOULDCHORES 39.6% 26.2% 32.5%
FINANCIAL SUPPORT 13.2% 4.9% 8.8%EMOTIONAL/CULTURALSUPPORT 9.4% 19.7% 14.9%
TEACH RELIGION 4.9% 2.6%TEACH LANGUAGE 3.8% 8.2% 6.1%PROVIDE RECREATION 1.6% .9%SEVERAL WAYS 34.0% 34.4% 34.2%
Total
N
100.0%
53
100.0%
61
100.0%
114X2=10.2, df=6, p=.118
Q16AX (CODED VARIABLE) WAYS YOU HELP YOUR GRANDCHILDREN WHO LIVE IN EDMONTON * Q8ARESIDENCY IN CANADA (DERIVED VARIABLE)
Q8A RESIDENCY IN CANADA(DERIVED VARIABLE)
RecentImmigrant
EstablishedImmigrant,Came to
Canada WhenAge 55+
EstablishedImmigrant,Came to
Canada WhenAge <55 Total
CHILDCARE/HOUSEHOULD CHORES 42.0% 36.0% 17.9% 32.5%
FINANCIAL SUPPORT 6.0% 16.0% 7.7% 8.8%EMOTIONAL/CULTURALSUPPORT 12.0% 12.0% 20.5% 14.9%
TEACH RELIGION 2.0% 8.0% 2.6%TEACH LANGUAGE 8.0% 7.7% 6.1%PROVIDE RECREATION 2.0% .9%
Q16AX WAYS YOU HELPYOUR GRANDCHILDRENWHO LIVE IN EDMONTON
SEVERAL WAYS 28.0% 28.0% 46.2% 34.2%Total
N
100.0%
50
100.0%
25
100.0%
39
100.0%
114X2=16.8, df=12, p=.157
The Experiences of Immigrant Seniors
43
Q16BX (CODED VARIABLE) IN WHAT WAYS DO YOUR GRANDCHILDREN WHO LIVE IN EDMONTONHELP YOU? * Q1A SEX OF RESPONDENTS
Q1A SEX OFRESPONDENTS
Male Female TotalHOME MAINTENANCE 1.6% .8%DRIVE TOPLACES/SHOPPING 3.2% 7.4% 5.4%
TRANSLATE FOR ME 1.5% .8%LOVE/RESPECT/EMOTIONALSUPPORT
25.8% 29.4% 27.7%
SEVERAL WAYS 22.6% 42.6% 33.1%
Q16BX IN WHATWAYS DO YOURGRANDCHILDRENWHO LIVE INEDMONTON HELPYOU?
NONE/TOO YOUNGTO HELP 46.8% 19.1% 32.3%
Total
N
100.0%
62
100.0%
68
100.0%
130X2=14.8, df=5, p=.011
Q16BX (CODED VARIABLE) IN WHAT WAYS DO YOUR GRANDCHILDREN WHO LIVE IN EDMONTONHELP YOU? * Q8A RESIDENCY IN CANADA (DERIVED VARIABLE)
Q8A RESIDENCY IN CANADA(DERIVED VARIABLE)
RecentImmigrant
EstablishedImmigrant,Came to
Canada WhenAge 55+
EstablishedImmigrant,Came to
Canada WhenAge <55 Total
HOME MAINTENANCE 2.3% .8%DRIVE TOPLACES/SHOPPING 3.5% 6.7% 7.0% 5.4%
TRANSLATE FOR ME 2.3% .8%LOVE/RESPECT/EMOTIONALSUPPORT
22.8% 16.7% 41.9% 27.7%
SEVERAL WAYS 28.1% 53.3% 25.6% 33.1%
Q16BX IN WHATWAYS DO YOURGRANDCHILDRENWHO LIVE INEDMONTON HELPYOU?
NONE/TOO YOUNGTO HELP 45.6% 23.3% 20.9% 32.3%
Total
N
100.0%
57
100.0%
30
100.0%
43
100.0%
130X2=20.1, df=10, p=.028
The Experiences of Immigrant Seniors
44
Q17A NUMBER OF OTHER FAMILY MEMBERS IN EDMONTON AREA BESIDE YOUR CHILDREN ANDGRANDCHILDREN * Q1A SEX OF RESPONDENTS
Q1A SEX OFRESPONDENTS
Male Female Total0
64.6% 67.9% 66.2%
Q17ANUMBER OFOTHERFAMILYMEMBERS INEDMONTONAREABESIDEYOURCHILDRENANDGRANDCHILDREN
1+
35.4% 32.1% 33.8%
Total
N
100.0%
79
100.0%
78
100.0%
157X2=.079, df=1, p=.779
Q17A NUMBER OF OTHER FAMILY MEMBERS IN EDMONTON AREA BESIDE YOUR CHILDREN ANDGRANDCHILDREN * Q8A RESIDENCY IN CANADA (DERIVED VARIABLE)
Q8A RESIDENCY IN CANADA(DERIVED VARIABLE)
RecentImmigrant
EstablishedImmigrant,Came to
Canada WhenAge 55+
EstablishedImmigrant,Came to
Canada WhenAge <55 Total
0
72.1% 63.3% 62.1% 66.2%
Q17ANUMBER OFOTHERFAMILYMEMBERS INEDMONTONAREABESIDEYOURCHILDRENANDGRANDCHILDREN
1+
27.9% 36.7% 37.9% 33.8%
Total
N
100.0%
61
100.0%
30
100.0%
66
100.0%
157X2=1.6, df=2, p=.458
The Experiences of Immigrant Seniors
45
Occupation and Income
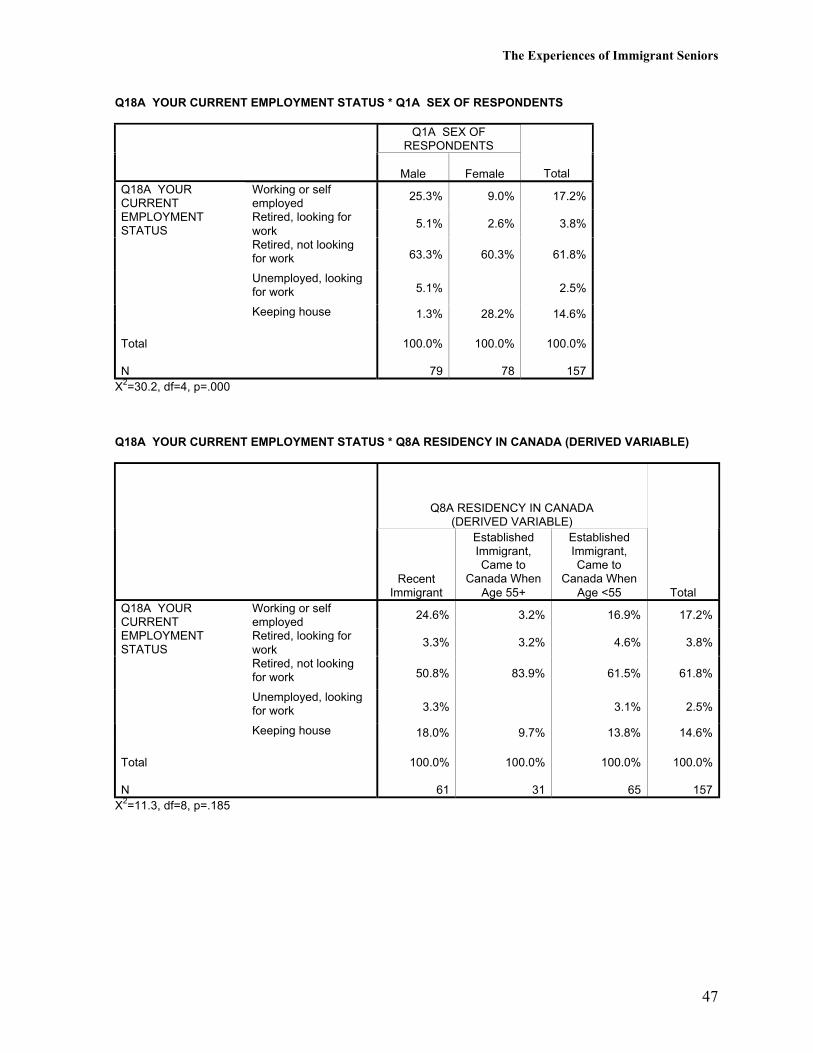
Twenty-five percent of the male respondents were in the labor force working at a job or wereself-employed. In comparison, 9% of the female respondents were in the labor force. Onepercent of males and 28% of females were “keeping house.” Almost two thirds of therespondents were retired and not looking for work (63% of males and 60% of females).Females were more likely to indicate that their spouse was retired while males were morelikely to say that their spouse was keeping house.
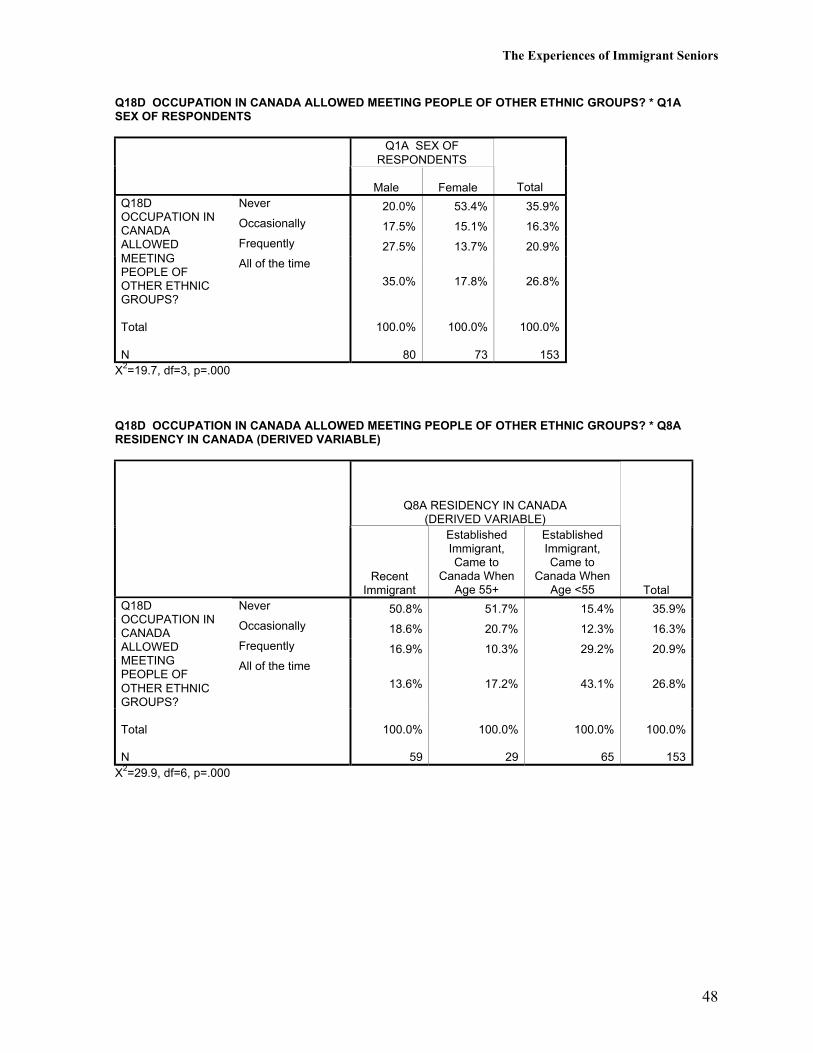
Over one-third of respondents (36%) said that their employment status in Canada “never”gives them the opportunity to meet people from other ethnic groups or cultural backgrounds.Furthermore, female respondents, recent immigrants and persons who immigrated to Canadaat an older age were more likely to say that their employment status in Canada never givesthem the opportunity to meet people from other ethnic groups or cultural backgrounds.
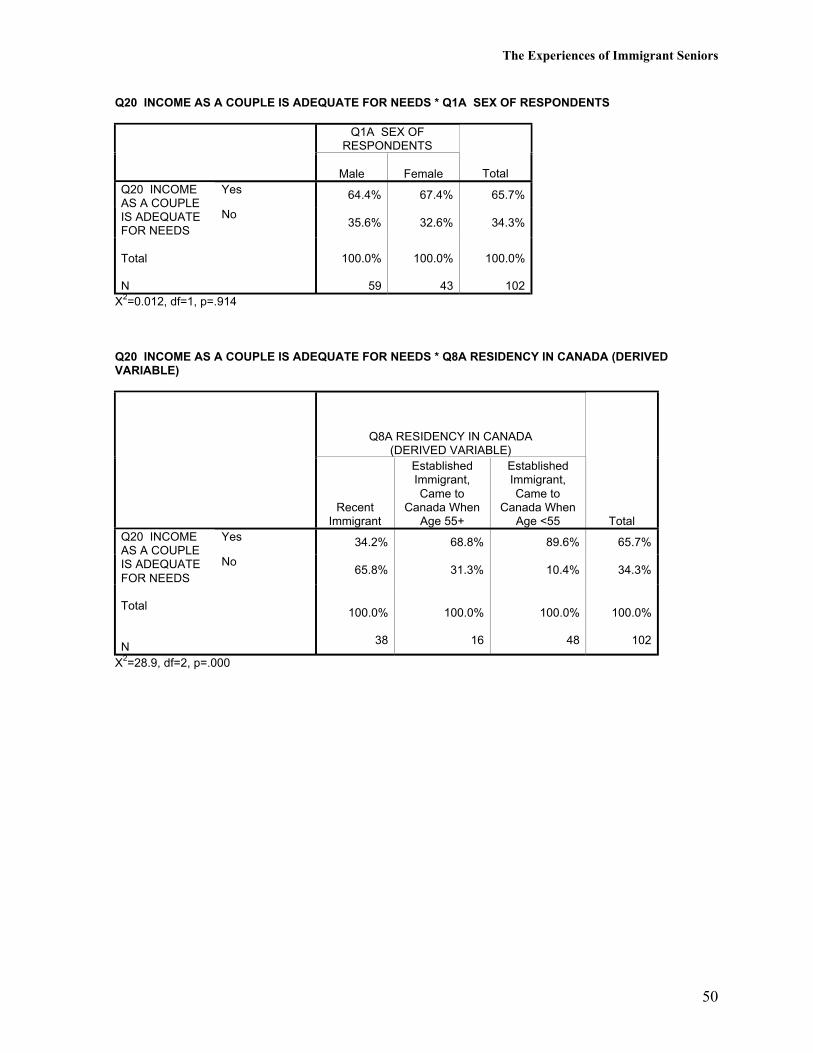
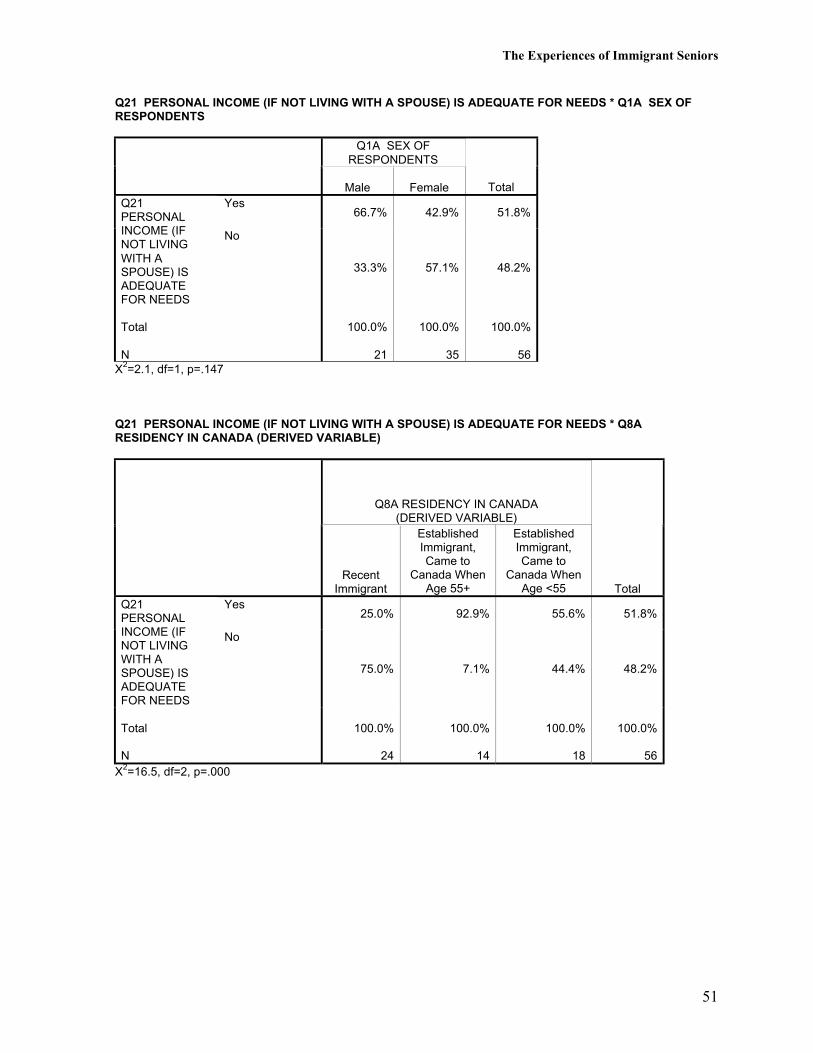
Two-thirds of respondents (66%) currently living with a spouse indicated that their income asa couple was adequate for their needs. Recent immigrants were less likely to indicate thattheir income was adequate (34% of recent immigrants versus 69% of established immigrantswho came to Canada at an older age and 90% of immigrants who came to Canada at ayounger age). Over half of respondents (52%) not living with a spouse indicated that theirpersonal income was adequate for their needs. This was more true of males (67% of malesversus 43% of females) although this difference was not statistically significant. Recentimmigrants were less likely to say that their personal income was adequate (25% of recentimmigrants versus 93% of established immigrants who came to Canada at an older age and56% of immigrants who came to Canada at a younger age).
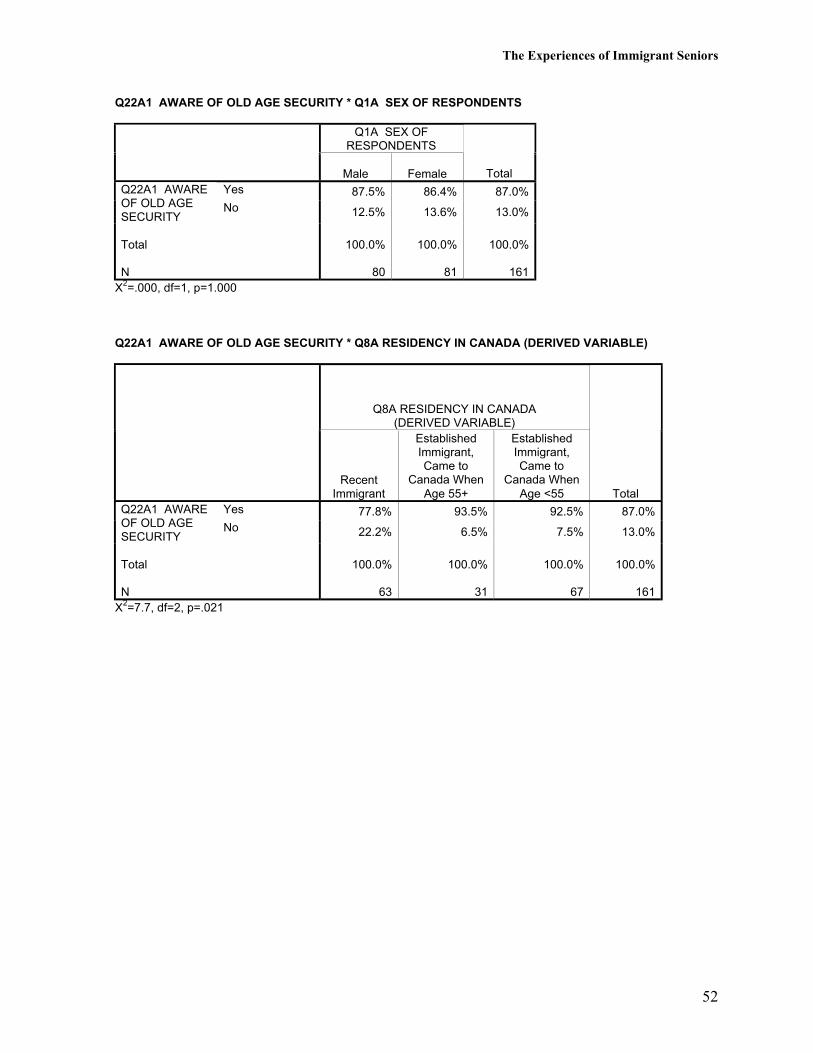
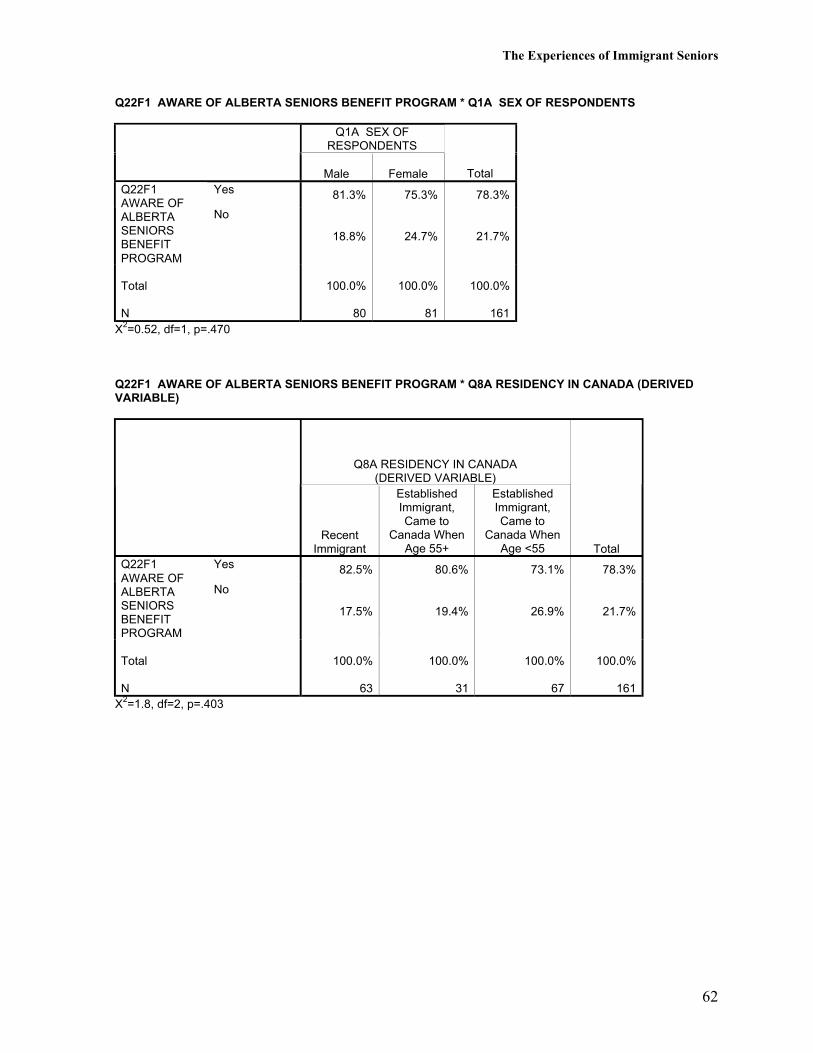
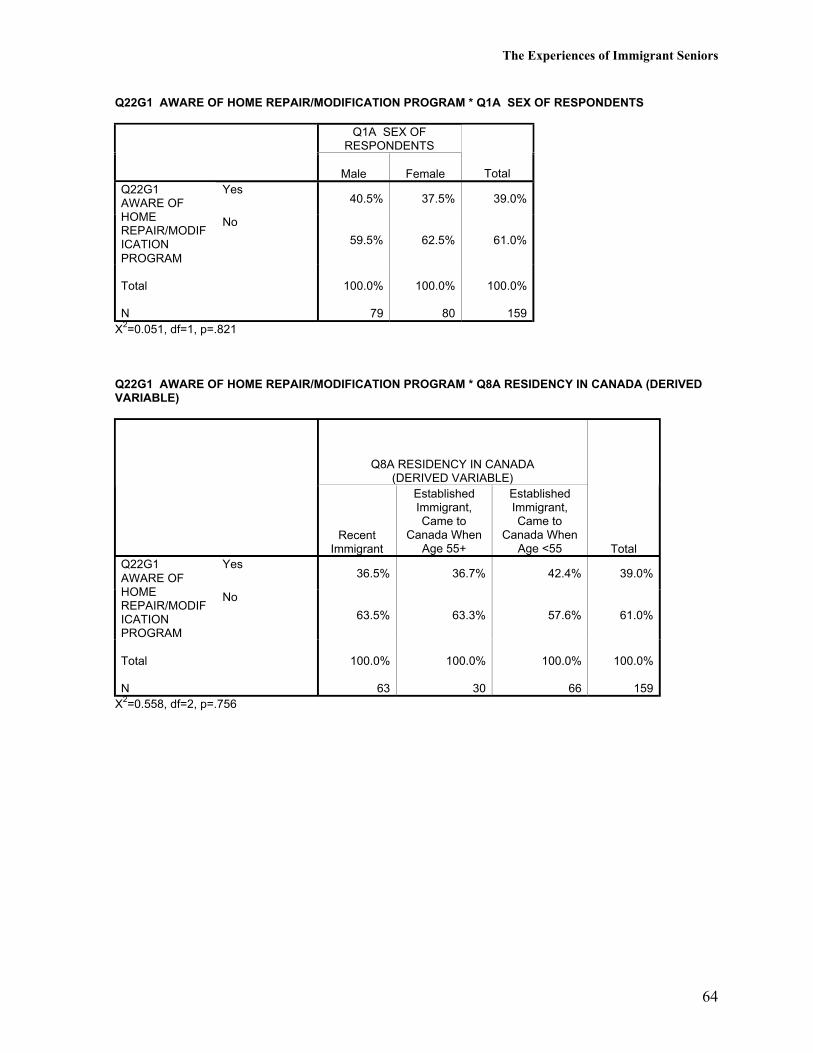
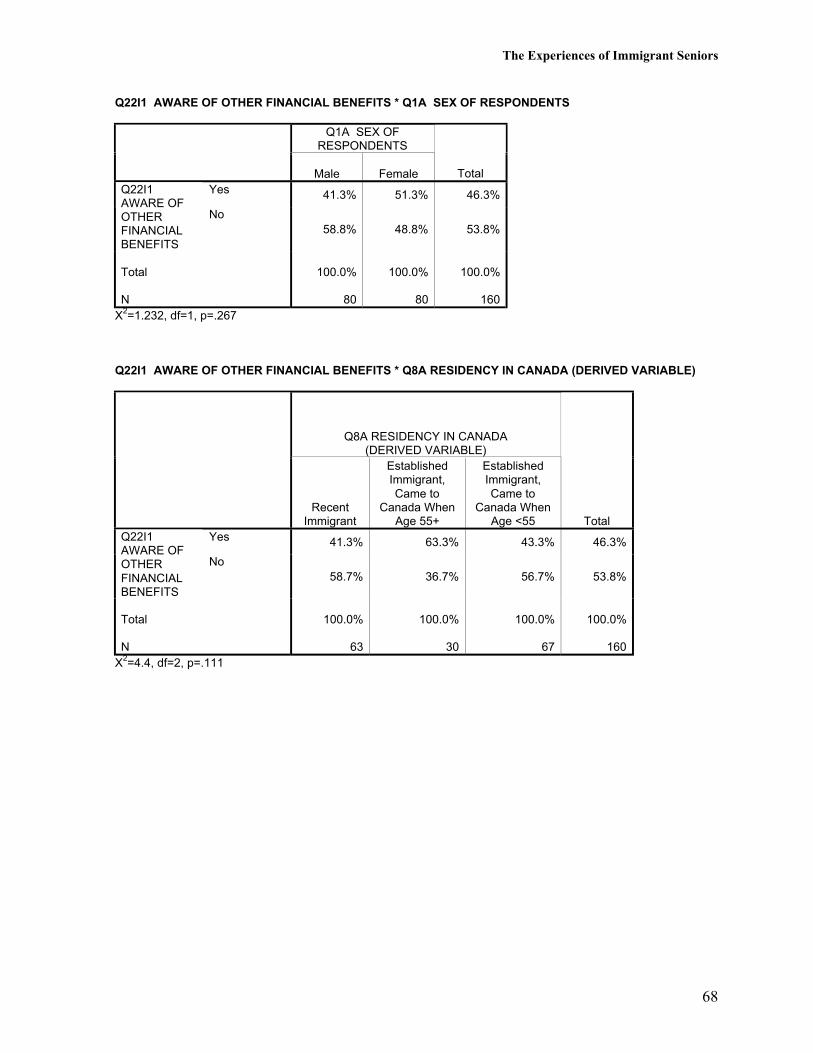
Most respondents were aware of governmental financial benefit programs such as old agesecurity, guaranteed income supplement, spouses allowance, widowed persons allowance,Canada pension plan, Alberta seniors benefit program, and seniors apartments and lodges.Less than half of respondents (39%) were aware of governmental home repair/homemodification programs. Recent immigrants were less likely than established immigrants to beaware of old age security, the guaranteed income supplement, and the spouses allowance.
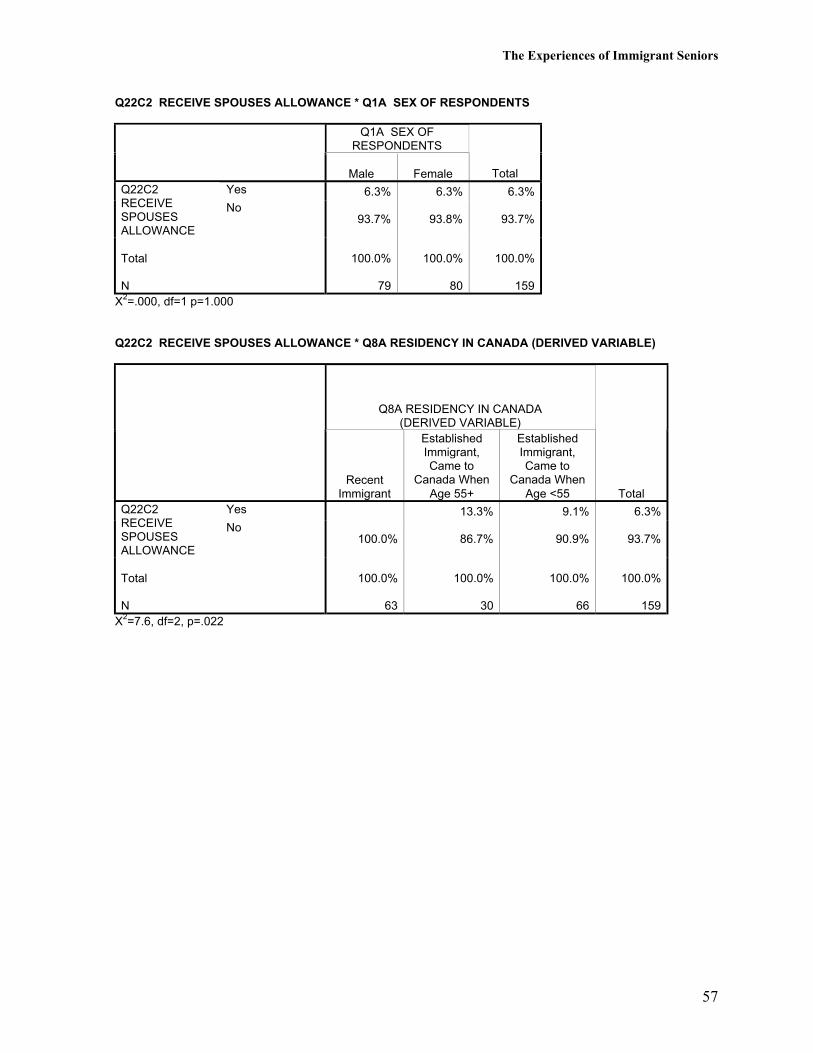
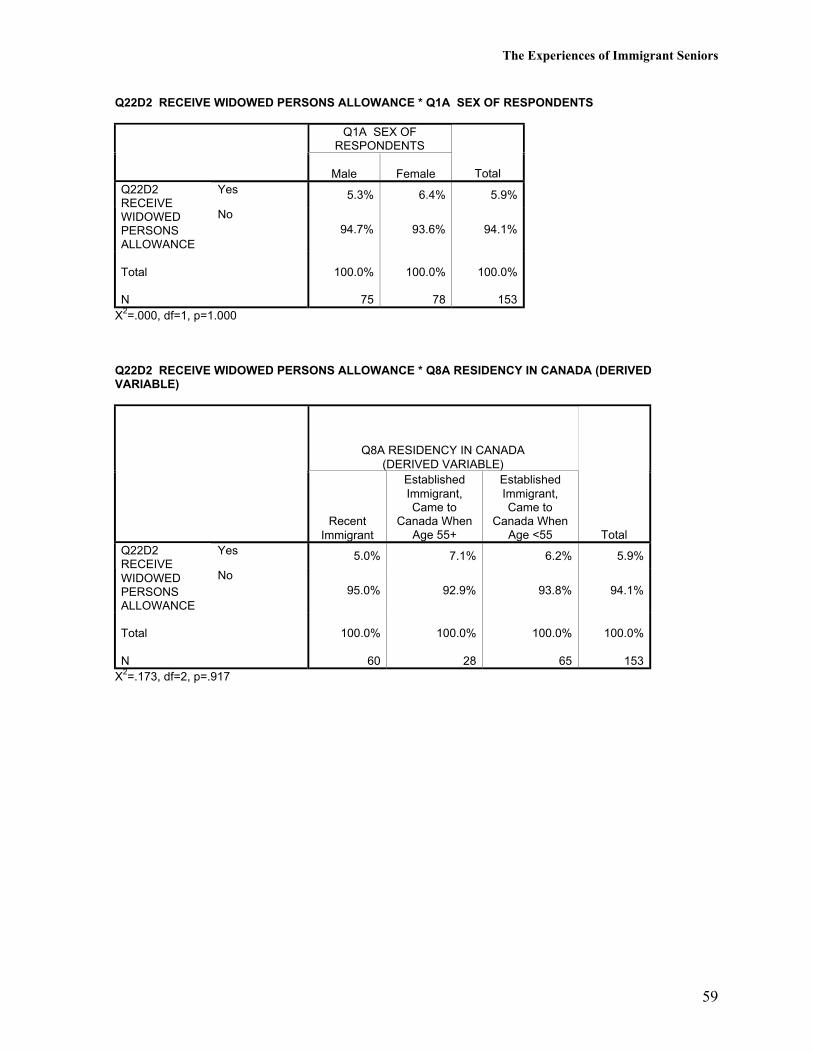
Almost half of the respondents were receiving old age security benefits (48%). Recentimmigrants were less likely than established immigrants to be receiving old age security.Twenty-eight percent of respondents were receiving the guaranteed income supplement.Again, recent immigrants were less likely than established immigrants to be receiving thisbenefit. Only 6% were receiving the spouses allowance and another 6% were receiving thewidowed persons allowance. Thirty-nine percent of respondents were receiving the CanadaPension and recent immigrants were less likely than established immigrants to be receivingthis benefit. Forty percent of respondents were receiving the Alberta Seniors Benefit.
Respondents were asked “How can the government increase the awareness of seniors such asyourself about the benefit programs offered by the government?” Responses were fairlyevenly divided across three categories: use of the mass media, information distributed bygovernment departments and agencies, and seminars and workshops.
The Experiences of Immigrant Seniors
46
One in six respondents (18%) received a pension separate from the government benefitsdiscussed above. Established immigrants were more likely to receive a personal pension.
Most respondents (84%) said that they had control over their own money. Establishedimmigrants were more likely to report that they had control over their own money (90% ofestablished immigrants who came to Canada at an older age and 93% of immigrants whocame to Canada at a younger age versus 71% of recent immigrants).
Over half of respondents (57%) said that they had given money to someone in their family inthe past year. Most who gave money did so “occasionally.” Recent immigrants were lesslikely than established immigrants to have given money to a family member. Over a quarterof respondents (28%) said that they had received money from someone in their family in thepast year. Most who received money did so “occasionally.” Recent immigrants were morelikely than established immigrants to have received money from a family member.
The Experiences of Immigrant Seniors
47
Q18A YOUR CURRENT EMPLOYMENT STATUS * Q1A SEX OF RESPONDENTS
Q1A SEX OFRESPONDENTS
Male Female TotalWorking or selfemployed
25.3% 9.0% 17.2%
Retired, looking forwork
5.1% 2.6% 3.8%
Retired, not lookingfor work 63.3% 60.3% 61.8%
Unemployed, lookingfor work 5.1% 2.5%
Q18A YOURCURRENTEMPLOYMENTSTATUS
Keeping house 1.3% 28.2% 14.6%
Total
N
100.0%
79
100.0%
78
100.0%
157X2=30.2, df=4, p=.000
Q18A YOUR CURRENT EMPLOYMENT STATUS * Q8A RESIDENCY IN CANADA (DERIVED VARIABLE)
Q8A RESIDENCY IN CANADA(DERIVED VARIABLE)
RecentImmigrant
EstablishedImmigrant,Came to
Canada WhenAge 55+
EstablishedImmigrant,Came to
Canada WhenAge <55 Total
Working or selfemployed
24.6% 3.2% 16.9% 17.2%
Retired, looking forwork
3.3% 3.2% 4.6% 3.8%
Retired, not lookingfor work 50.8% 83.9% 61.5% 61.8%
Unemployed, lookingfor work 3.3% 3.1% 2.5%
Q18A YOURCURRENTEMPLOYMENTSTATUS
Keeping house 18.0% 9.7% 13.8% 14.6%
Total
N
100.0%
61
100.0%
31
100.0%
65
100.0%
157X2=11.3, df=8, p=.185
The Experiences of Immigrant Seniors
48
Q18D OCCUPATION IN CANADA ALLOWED MEETING PEOPLE OF OTHER ETHNIC GROUPS? * Q1ASEX OF RESPONDENTS
Q1A SEX OFRESPONDENTS
Male Female TotalNever 20.0% 53.4% 35.9%
Occasionally 17.5% 15.1% 16.3%
Frequently 27.5% 13.7% 20.9%
Q18DOCCUPATION INCANADAALLOWEDMEETINGPEOPLE OFOTHER ETHNICGROUPS?
All of the time
35.0% 17.8% 26.8%
Total
N
100.0%
80
100.0%
73
100.0%
153X2=19.7, df=3, p=.000
Q18D OCCUPATION IN CANADA ALLOWED MEETING PEOPLE OF OTHER ETHNIC GROUPS? * Q8ARESIDENCY IN CANADA (DERIVED VARIABLE)
Q8A RESIDENCY IN CANADA(DERIVED VARIABLE)
RecentImmigrant
EstablishedImmigrant,Came to
Canada WhenAge 55+
EstablishedImmigrant,Came to
Canada WhenAge <55 Total
Never 50.8% 51.7% 15.4% 35.9%
Occasionally 18.6% 20.7% 12.3% 16.3%
Frequently 16.9% 10.3% 29.2% 20.9%
Q18DOCCUPATION INCANADAALLOWEDMEETINGPEOPLE OFOTHER ETHNICGROUPS?
All of the time
13.6% 17.2% 43.1% 26.8%
Total
N
100.0%
59
100.0%
29
100.0%
65
100.0%
153X2=29.9, df=6, p=.000

The Experiences of Immigrant Seniors
49
Q19A EMPLOYMENT STATUS OF SPOUSE * Q1A SEX OF RESPONDENTS
Q1A SEX OFRESPONDENTS
Male Female TotalWorking or selfemployed
22.0% 27.3% 24.3%
Retired, looking forwork
6.8% 2.9%
Retired, not lookingfor work 27.1% 63.6% 42.7%
Unemployed, lookingfor work 5.1% 2.9%
Q19AEMPLOYMENTSTATUS OFSPOUSE
Keeping house 45.8% 2.3% 27.2%
Total
N
100.0%
59
100.0%
44
100.0%
103X2=31.9, df=4, p=.000
Q19A EMPLOYMENT STATUS OF SPOUSE * Q8A RESIDENCY IN CANADA (DERIVED VARIABLE)
Q8A RESIDENCY IN CANADA(DERIVED VARIABLE)
RecentImmigrant
EstablishedImmigrant,Came to
Canada WhenAge 55+
EstablishedImmigrant,Came to
Canada WhenAge <55 Total
Working or selfemployed
21.1% 34.7% 24.3%
Retired, looking forwork
5.3% 2.0% 2.9%
Retired, not lookingfor work 21.1% 68.8% 51.0% 42.7%
Unemployed, lookingfor work 5.3% 2.0% 2.9%
Q19AEMPLOYMENTSTATUS OFSPOUSE
Keeping house 47.4% 31.3% 10.2% 27.2%
Total
N
100.0%
38
100.0%
16
100.0%
49
100.0%
103X2=27.4, df=8, p=.001
The Experiences of Immigrant Seniors
50
Q20 INCOME AS A COUPLE IS ADEQUATE FOR NEEDS * Q1A SEX OF RESPONDENTS
Q1A SEX OFRESPONDENTS
Male Female TotalYes 64.4% 67.4% 65.7%Q20 INCOME
AS A COUPLEIS ADEQUATEFOR NEEDS
No35.6% 32.6% 34.3%
Total
N
100.0%
59
100.0%
43
100.0%
102X2=0.012, df=1, p=.914
Q20 INCOME AS A COUPLE IS ADEQUATE FOR NEEDS * Q8A RESIDENCY IN CANADA (DERIVEDVARIABLE)
Q8A RESIDENCY IN CANADA(DERIVED VARIABLE)
RecentImmigrant
EstablishedImmigrant,Came to
Canada WhenAge 55+
EstablishedImmigrant,Came to
Canada WhenAge <55 Total
Yes 34.2% 68.8% 89.6% 65.7%Q20 INCOMEAS A COUPLEIS ADEQUATEFOR NEEDS
No65.8% 31.3% 10.4% 34.3%
Total
N
100.0%
38
100.0%
16
100.0%
48
100.0%
102
X2=28.9, df=2, p=.000
The Experiences of Immigrant Seniors
51
Q21 PERSONAL INCOME (IF NOT LIVING WITH A SPOUSE) IS ADEQUATE FOR NEEDS * Q1A SEX OFRESPONDENTS
Q1A SEX OFRESPONDENTS
Male Female TotalYes
66.7% 42.9% 51.8%Q21PERSONALINCOME (IFNOT LIVINGWITH ASPOUSE) ISADEQUATEFOR NEEDS
No
33.3% 57.1% 48.2%
Total
N
100.0%
21
100.0%
35
100.0%
56X2=2.1, df=1, p=.147
Q21 PERSONAL INCOME (IF NOT LIVING WITH A SPOUSE) IS ADEQUATE FOR NEEDS * Q8ARESIDENCY IN CANADA (DERIVED VARIABLE)
Q8A RESIDENCY IN CANADA(DERIVED VARIABLE)
RecentImmigrant
EstablishedImmigrant,Came to
Canada WhenAge 55+
EstablishedImmigrant,Came to
Canada WhenAge <55 Total
Yes25.0% 92.9% 55.6% 51.8%
Q21PERSONALINCOME (IFNOT LIVINGWITH ASPOUSE) ISADEQUATEFOR NEEDS
No
75.0% 7.1% 44.4% 48.2%
Total
N
100.0%
24
100.0%
14
100.0%
18
100.0%
56X2=16.5, df=2, p=.000
The Experiences of Immigrant Seniors
52
Q22A1 AWARE OF OLD AGE SECURITY * Q1A SEX OF RESPONDENTS
Q1A SEX OFRESPONDENTS
Male Female TotalYes 87.5% 86.4% 87.0%Q22A1 AWARE
OF OLD AGESECURITY
No 12.5% 13.6% 13.0%
Total
N
100.0%
80
100.0%
81
100.0%
161X2=.000, df=1, p=1.000
Q22A1 AWARE OF OLD AGE SECURITY * Q8A RESIDENCY IN CANADA (DERIVED VARIABLE)
Q8A RESIDENCY IN CANADA(DERIVED VARIABLE)
RecentImmigrant
EstablishedImmigrant,Came to
Canada WhenAge 55+
EstablishedImmigrant,Came to
Canada WhenAge <55 Total
Yes 77.8% 93.5% 92.5% 87.0%Q22A1 AWAREOF OLD AGESECURITY
No 22.2% 6.5% 7.5% 13.0%
Total
N
100.0%
63
100.0%
31
100.0%
67
100.0%
161X2=7.7, df=2, p=.021

The Experiences of Immigrant Seniors
53
Q22A2 RECEIVE OLD AGE SECURITY * Q1A SEX OF RESPONDENTS
Q1A SEX OFRESPONDENTS
Male Female TotalYes 42.5% 53.1% 47.8%Q22A2
RECEIVE OLDAGESECURITY
No57.5% 46.9% 52.2%
Total
N
100.0%
80
100.0%
81
100.0%
161X2=1.4, df=1, p=.235
Q22A2 RECEIVE OLD AGE SECURITY * Q8A RESIDENCY IN CANADA (DERIVED VARIABLE)
Q8A RESIDENCY IN CANADA(DERIVED VARIABLE)
RecentImmigrant
EstablishedImmigrant,Came to
Canada WhenAge 55+
EstablishedImmigrant,Came to
Canada WhenAge <55 Total
Yes 14.3% 83.9% 62.7% 47.8%Q22A2RECEIVE OLDAGESECURITY
No85.7% 16.1% 37.3% 52.2%
Total
N
100.0%
63
100.0%
31
100.0%
67
100.0%
161X2=50.5, df=2, p=.000

The Experiences of Immigrant Seniors
54
Q22B1 AWARE OF GUARANTEED INCOME SUPPLEMENT * Q1A SEX OF RESPONDENTS
Q1A SEX OFRESPONDENTS
Male Female TotalYes 72.2% 67.9% 70.0%Q22B1 AWARE
OFGUARANTEEDINCOMESUPPLEMENT
No27.8% 32.1% 30.0%
Total
N
100.0%
79
100.0%
81
100.0%
160X2=.171, df=1, p=.679
Q22B1 AWARE OF GUARANTEED INCOME SUPPLEMENT * Q8A RESIDENCY IN CANADA (DERIVEDVARIABLE)
Q8A RESIDENCY IN CANADA(DERIVED VARIABLE)
RecentImmigrant
EstablishedImmigrant,Came to
Canada WhenAge 55+
EstablishedImmigrant,Came to
Canada WhenAge <55 Total
Yes 60.3% 86.7% 71.6% 70.0%Q22B1 AWAREOFGUARANTEEDINCOMESUPPLEMENT
No39.7% 13.3% 28.4% 30.0%
Total
N
100.0%
63
100.0%
30
100.0%
67
100.0%
160X2=6.9, df=2, p=.032

The Experiences of Immigrant Seniors
55
Q22B2 RECEIVE GUARANTEED INCOME SUPPLEMENT * Q1A SEX OF RESPONDENTS
Q1A SEX OFRESPONDENTS
Male Female TotalYes 27.8% 28.8% 28.3%Q22B2
RECEIVEGUARANTEEDINCOMESUPPLEMENT
No72.2% 71.3% 71.7%
Total
N
100.0%
79
100.0%
80
100.0%
159X2=.000, df=1, p=1.000
Q22B2 RECEIVE GUARANTEED INCOME SUPPLEMENT * Q8A RESIDENCY IN CANADA (DERIVEDVARIABLE)
Q8A RESIDENCY IN CANADA(DERIVED VARIABLE)
RecentImmigrant
EstablishedImmigrant,Came to
Canada WhenAge 55+
EstablishedImmigrant,Came to
Canada WhenAge <55 Total
Yes 7.9% 73.3% 27.3% 28.3%Q22B2RECEIVEGUARANTEEDINCOMESUPPLEMENT
No92.1% 26.7% 72.7% 71.7%
Total
N
100.0%
63
100.0%
30
100.0%
66
100.0%
159X2=42.9, df=2, p=.000

The Experiences of Immigrant Seniors
56
Q22C1 AWARE OF SPOUSES ALLOWANCE * Q1A SEX OF RESPONDENTS
Q1A SEX OFRESPONDENTS
Male Female TotalYes 62.0% 61.3% 61.6%Q22C1 AWARE
OF SPOUSESALLOWANCE
No 38.0% 38.8% 38.4%
Total
N
100.0%
79
100.0%
80
100.0%
159X2=.000, df=1, p=1.000
Q22C1 AWARE OF SPOUSES ALLOWANCE * Q8A RESIDENCY IN CANADA (DERIVED VARIABLE)
Q8A RESIDENCY IN CANADA(DERIVED VARIABLE)
RecentImmigrant
EstablishedImmigrant,Came to
Canada WhenAge 55+
EstablishedImmigrant,Came to
Canada WhenAge <55 Total
Yes 49.2% 76.7% 66.7% 61.6%Q22C1 AWAREOF SPOUSESALLOWANCE
No 50.8% 23.3% 33.3% 38.4%
Total
N
100.0%
63
100.0%
30
100.0%
66
100.0%
159X2=7.7, df=2, p=.021
The Experiences of Immigrant Seniors
57
Q22C2 RECEIVE SPOUSES ALLOWANCE * Q1A SEX OF RESPONDENTS
Q1A SEX OFRESPONDENTS
Male Female TotalYes 6.3% 6.3% 6.3%Q22C2
RECEIVESPOUSESALLOWANCE
No93.7% 93.8% 93.7%
Total
N
100.0%
79
100.0%
80
100.0%
159X2=.000, df=1 p=1.000
Q22C2 RECEIVE SPOUSES ALLOWANCE * Q8A RESIDENCY IN CANADA (DERIVED VARIABLE)
Q8A RESIDENCY IN CANADA(DERIVED VARIABLE)
RecentImmigrant
EstablishedImmigrant,Came to
Canada WhenAge 55+
EstablishedImmigrant,Came to
Canada WhenAge <55 Total
Yes 13.3% 9.1% 6.3%Q22C2RECEIVESPOUSESALLOWANCE
No100.0% 86.7% 90.9% 93.7%
Total
N
100.0%
63
100.0%
30
100.0%
66
100.0%
159X2=7.6, df=2, p=.022

The Experiences of Immigrant Seniors
58
Q22D1 AWARE OF WIDOWED PERSONS ALLOWANCE * Q1A SEX OF RESPONDENTS
Q1A SEX OFRESPONDENTS
Male Female TotalYes 72.0% 69.2% 70.6%Q22D1
AWARE OFWIDOWEDPERSONSALLOWANCE
No28.0% 30.8% 29.4%
Total
N
100.0%
75
100.0%
78
100.0%
153X2=.039, df=1, p=.843
Q22D1 AWARE OF WIDOWED PERSONS ALLOWANCE * Q8A RESIDENCY IN CANADA (DERIVEDVARIABLE)
Q8A RESIDENCY IN CANADA(DERIVED VARIABLE)
RecentImmigrant
EstablishedImmigrant,Came to
Canada WhenAge 55+
EstablishedImmigrant,Came to
Canada WhenAge <55 Total
Yes 63.3% 75.0% 75.4% 70.6%Q22D1AWARE OFWIDOWEDPERSONSALLOWANCE
No36.7% 25.0% 24.6% 29.4%
Total
N
100.0%
60
100.0%
28
100.0%
65
100.0%
153X2=2.5, df=2, p=.290
The Experiences of Immigrant Seniors
59
Q22D2 RECEIVE WIDOWED PERSONS ALLOWANCE * Q1A SEX OF RESPONDENTS
Q1A SEX OFRESPONDENTS
Male Female TotalYes 5.3% 6.4% 5.9%Q22D2
RECEIVEWIDOWEDPERSONSALLOWANCE
No94.7% 93.6% 94.1%
Total
N
100.0%
75
100.0%
78
100.0%
153X2=.000, df=1, p=1.000
Q22D2 RECEIVE WIDOWED PERSONS ALLOWANCE * Q8A RESIDENCY IN CANADA (DERIVEDVARIABLE)
Q8A RESIDENCY IN CANADA(DERIVED VARIABLE)
RecentImmigrant
EstablishedImmigrant,Came to
Canada WhenAge 55+
EstablishedImmigrant,Came to
Canada WhenAge <55 Total
Yes 5.0% 7.1% 6.2% 5.9%Q22D2RECEIVEWIDOWEDPERSONSALLOWANCE
No95.0% 92.9% 93.8% 94.1%
Total
N
100.0%
60
100.0%
28
100.0%
65
100.0%
153X2=.173, df=2, p=.917

The Experiences of Immigrant Seniors
60
Q22E1 AWARE OF CANADA PENSION PLAN * Q1A SEX OF RESPONDENTS
Q1A SEX OFRESPONDENTS
Male Female TotalYes 93.8% 80.2% 87.0%Q22E1 AWARE
OF CANADAPENSION PLAN
No 6.3% 19.8% 13.0%
Total
N
100.0%
80
100.0%
81
100.0%
161X2=5.3, df=1, p=.021
Q22E1 AWARE OF CANADA PENSION PLAN * Q8A RESIDENCY IN CANADA (DERIVED VARIABLE)
Q8A RESIDENCY IN CANADA(DERIVED VARIABLE)
RecentImmigrant
EstablishedImmigrant,Came to
Canada WhenAge 55+
EstablishedImmigrant,Came to
Canada WhenAge <55 Total
Yes 82.5% 87.1% 91.0% 87.0%Q22E1 AWAREOF CANADAPENSION PLAN
No 17.5% 12.9% 9.0% 13.0%
Total
N
100.0%
63
100.0%
31
100.0%
67
100.0%
161X2=2.1, df=2, p=.355

The Experiences of Immigrant Seniors
61
Q22E2 RECEIVE CANADA PENSION PLAN * Q1A SEX OF RESPONDENTS
Q1A SEX OFRESPONDENTS
Male Female TotalYes 40.0% 37.0% 38.5%Q22E2
RECEIVECANADAPENSION PLAN
No60.0% 63.0% 61.5%
Total
N
100.0%
80
100.0%
81
100.0%
161X2=0.05, df=1, p=.823
Q22E2 RECEIVE CANADA PENSION PLAN * Q8A RESIDENCY IN CANADA (DERIVED VARIABLE)
Q8A RESIDENCY IN CANADA(DERIVED VARIABLE)
RecentImmigrant
EstablishedImmigrant,Came to
Canada WhenAge 55+
EstablishedImmigrant,Came to
Canada WhenAge <55 Total
Yes 6.3% 58.1% 59.7% 38.5%Q22E2RECEIVECANADAPENSION PLAN
No93.7% 41.9% 40.3% 61.5%
Total
N
100.0%
63
100.0%
31
100.0%
67
100.0%
161X2=45.2, df=2, p=.000
The Experiences of Immigrant Seniors
62
Q22F1 AWARE OF ALBERTA SENIORS BENEFIT PROGRAM * Q1A SEX OF RESPONDENTS
Q1A SEX OFRESPONDENTS
Male Female TotalYes 81.3% 75.3% 78.3%Q22F1
AWARE OFALBERTASENIORSBENEFITPROGRAM
No
18.8% 24.7% 21.7%
Total
N
100.0%
80
100.0%
81
100.0%
161X2=0.52, df=1, p=.470
Q22F1 AWARE OF ALBERTA SENIORS BENEFIT PROGRAM * Q8A RESIDENCY IN CANADA (DERIVEDVARIABLE)
Q8A RESIDENCY IN CANADA(DERIVED VARIABLE)
RecentImmigrant
EstablishedImmigrant,Came to
Canada WhenAge 55+
EstablishedImmigrant,Came to
Canada WhenAge <55 Total
Yes 82.5% 80.6% 73.1% 78.3%Q22F1AWARE OFALBERTASENIORSBENEFITPROGRAM
No
17.5% 19.4% 26.9% 21.7%
Total
N
100.0%
63
100.0%
31
100.0%
67
100.0%
161X2=1.8, df=2, p=.403

The Experiences of Immigrant Seniors
63
Q22F2 RECEIVE ALBERTA SENIORS BENEFIT PROGRAM * Q1A SEX OF RESPONDENTS
Q1A SEX OFRESPONDENTS
Male Female TotalYes 43.8% 37.0% 40.4%Q22F2
RECEIVEALBERTASENIORSBENEFITPROGRAM
No
56.3% 63.0% 59.6%
Total
N
100.0%
80
100.0%
81
100.0%
161X2=0.50,df=1, p=.479
Q22F2 RECEIVE ALBERTA SENIORS BENEFIT PROGRAM * Q8A RESIDENCY IN CANADA (DERIVEDVARIABLE)
Q8A RESIDENCY IN CANADA(DERIVED VARIABLE)
RecentImmigrant
EstablishedImmigrant,Came to
Canada WhenAge 55+
EstablishedImmigrant,Came to
Canada WhenAge <55 Total
Yes 42.9% 54.8% 31.3% 40.4%Q22F2RECEIVEALBERTASENIORSBENEFITPROGRAM
No
57.1% 45.2% 68.7% 59.6%
Total
N
100.0%
63
100.0%
31
100.0%
67
100.0%
161X2=5.125, df=2, p=.077
The Experiences of Immigrant Seniors
64
Q22G1 AWARE OF HOME REPAIR/MODIFICATION PROGRAM * Q1A SEX OF RESPONDENTS
Q1A SEX OFRESPONDENTS
Male Female TotalYes
40.5% 37.5% 39.0%Q22G1AWARE OFHOMEREPAIR/MODIFICATIONPROGRAM
No
59.5% 62.5% 61.0%
Total
N
100.0%
79
100.0%
80
100.0%
159X2=0.051, df=1, p=.821
Q22G1 AWARE OF HOME REPAIR/MODIFICATION PROGRAM * Q8A RESIDENCY IN CANADA (DERIVEDVARIABLE)
Q8A RESIDENCY IN CANADA(DERIVED VARIABLE)
RecentImmigrant
EstablishedImmigrant,Came to
Canada WhenAge 55+
EstablishedImmigrant,Came to
Canada WhenAge <55 Total
Yes36.5% 36.7% 42.4% 39.0%
Q22G1AWARE OFHOMEREPAIR/MODIFICATIONPROGRAM
No
63.5% 63.3% 57.6% 61.0%
Total
N
100.0%
63
100.0%
30
100.0%
66
100.0%
159X2=0.558, df=2, p=.756

The Experiences of Immigrant Seniors
65
Q22G2 RECEIVE HOME REPAIR/MODIFICATION PROGRAM * Q1A SEX OF RESPONDENTS
Q1A SEX OFRESPONDENTS
Male Female TotalYes 5.1% 2.5%Q22G2
RECEIVE HOMEREPAIR/MODIFICATIONPROGRAM
No94.9% 100.0% 97.5%
Total
N
100.0%
79
100.0%
80
100.0%
159X2=2.3, df=1, p=.126
Q22G2 RECEIVE HOME REPAIR/MODIFICATION PROGRAM * Q8A RESIDENCY IN CANADA (DERIVEDVARIABLE)
Q8A RESIDENCY IN CANADA(DERIVED VARIABLE)
RecentImmigrant
EstablishedImmigrant,Came to
Canada WhenAge 55+
EstablishedImmigrant,Came to
Canada WhenAge <55 Total
Yes 1.6% 6.7% 1.5% 2.5%Q22G2RECEIVE HOMEREPAIR/MODIFICATIONPROGRAM
No98.4% 93.3% 98.5% 97.5%
Total
N
100.0%
63
100.0%
30
100.0%
66
100.0%
159X2=2.6, df=2, p=.273

The Experiences of Immigrant Seniors
66
Q22H1 AWARE OF SENIORS APARTMENTS & LODGES * Q1A SEX OF RESPONDENTS
Q1A SEX OFRESPONDENTS
Male Female TotalYes 68.8% 62.5% 65.6%Q22H1 AWARE
OF SENIORSAPARTMENTS& LODGES
No31.3% 37.5% 34.4%
Total
N
100.0%
80
100.0%
80
100.0%
160X2=0.443, df=1, p=.506
Q22H1 AWARE OF SENIORS APARTMENTS & LODGES * Q8A RESIDENCY IN CANADA (DERIVEDVARIABLE)
Q8A RESIDENCY IN CANADA(DERIVED VARIABLE)
RecentImmigrant
EstablishedImmigrant,Came to
Canada WhenAge 55+
EstablishedImmigrant,Came to
Canada WhenAge <55 Total
Yes 65.1% 70.0% 64.2% 65.6%Q22H1 AWAREOF SENIORSAPARTMENTS& LODGES
No34.9% 30.0% 35.8% 34.4%
Total
N
100.0%
63
100.0%
30
100.0%
67
100.0%
160X2=0.325, df=2, p=.850

The Experiences of Immigrant Seniors
67
Q22H2 USE SENIORS APARTMENTS & LODGES * Q1A SEX OF RESPONDENTS
Q1A SEX OFRESPONDENTS
Male Female TotalYes 2.5% 1.3%Q22H2 USE
SENIORSAPARTMENTS& LODGES
No97.5% 100.0% 98.8%
Total
N
100.0%
80
100.0%
80
100.0%
160X2=0.506, df=1, p=.477
Q22H2 USE SENIORS APARTMENTS & LODGES * Q8A RESIDENCY IN CANADA (DERIVED VARIABLE)
Q8A RESIDENCY IN CANADA(DERIVED VARIABLE)
RecentImmigrant
EstablishedImmigrant,Came to
Canada WhenAge 55+
EstablishedImmigrant,Came to
Canada WhenAge <55 Total
Yes 1.6% 3.3% 1.3%Q22H2 USESENIORSAPARTMENTS& LODGES
No98.4% 96.7% 100.0% 98.8%
Total
N
100.0%
63
100.0%
30
100.0%
67
100.0%
160X2=1.96, df=2, p=.375
The Experiences of Immigrant Seniors
68
Q22I1 AWARE OF OTHER FINANCIAL BENEFITS * Q1A SEX OF RESPONDENTS
Q1A SEX OFRESPONDENTS
Male Female TotalYes 41.3% 51.3% 46.3%Q22I1
AWARE OFOTHERFINANCIALBENEFITS
No58.8% 48.8% 53.8%
Total
N
100.0%
80
100.0%
80
100.0%
160X2=1.232, df=1, p=.267
Q22I1 AWARE OF OTHER FINANCIAL BENEFITS * Q8A RESIDENCY IN CANADA (DERIVED VARIABLE)
Q8A RESIDENCY IN CANADA(DERIVED VARIABLE)
RecentImmigrant
EstablishedImmigrant,Came to
Canada WhenAge 55+
EstablishedImmigrant,Came to
Canada WhenAge <55 Total
Yes 41.3% 63.3% 43.3% 46.3%Q22I1AWARE OFOTHERFINANCIALBENEFITS
No58.7% 36.7% 56.7% 53.8%
Total
N
100.0%
63
100.0%
30
100.0%
67
100.0%
160X2=4.4, df=2, p=.111

The Experiences of Immigrant Seniors
69
Q22I2 RECEIVE OTHER FINANCIAL BENEFITS * Q1A SEX OF RESPONDENTS
Q1A SEX OFRESPONDENTS
Male Female TotalYes 12.5% 10.0% 11.3%Q22I2 RECEIVE
OTHERFINANCIALBENEFITS
No87.5% 90.0% 88.8%
Total
N
100.0%
80
100.0%
80
100.0%
160X2=0.063, df=1, p=.802
Q22I2 RECEIVE OTHER FINANCIAL BENEFITS * Q8A RESIDENCY IN CANADA (DERIVED VARIABLE)
Q8A RESIDENCY IN CANADA(DERIVED VARIABLE)
RecentImmigrant
EstablishedImmigrant,Came to
Canada WhenAge 55+
EstablishedImmigrant,Came to
Canada WhenAge <55 Total
Yes 9.5% 16.7% 10.4% 11.3%Q22I2 RECEIVEOTHERFINANCIALBENEFITS
No90.5% 83.3% 89.6% 88.8%
Total
N
100.0%
63
100.0%
30
100.0%
67
100.0%
160X2=1.1, df=2, p=.573
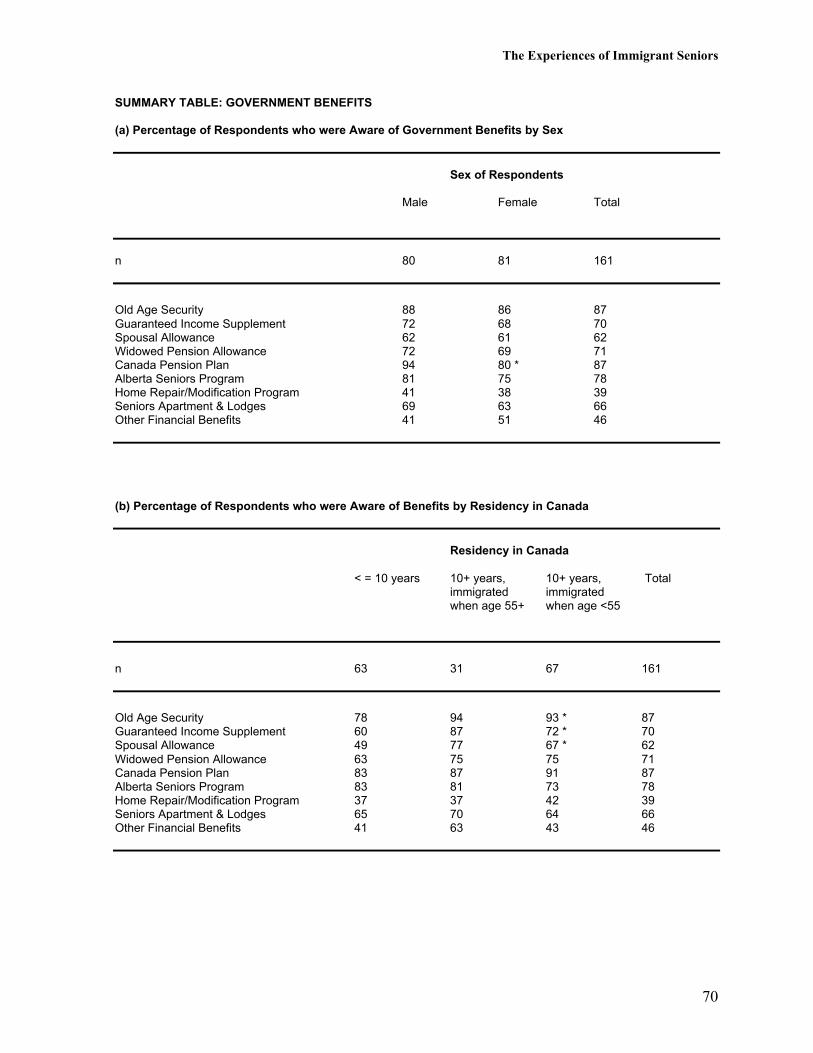
The Experiences of Immigrant Seniors
70
SUMMARY TABLE: GOVERNMENT BENEFITS
(a) Percentage of Respondents who were Aware of Government Benefits by Sex
Sex of Respondents
Male Female Total
n 80 81 161
Old Age Security 88 86 87Guaranteed Income Supplement 72 68 70Spousal Allowance 62 61 62Widowed Pension Allowance 72 69 71Canada Pension Plan 94 80 * 87Alberta Seniors Program 81 75 78Home Repair/Modification Program 41 38 39Seniors Apartment & Lodges 69 63 66Other Financial Benefits 41 51 46
(b) Percentage of Respondents who were Aware of Benefits by Residency in Canada
Residency in Canada
< = 10 years 10+ years, 10+ years, Totalimmigrated immigratedwhen age 55+ when age <55
n 63 31 67 161
Old Age Security 78 94 93 * 87Guaranteed Income Supplement 60 87 72 * 70Spousal Allowance 49 77 67 * 62Widowed Pension Allowance 63 75 75 71Canada Pension Plan 83 87 91 87Alberta Seniors Program 83 81 73 78Home Repair/Modification Program 37 37 42 39Seniors Apartment & Lodges 65 70 64 66Other Financial Benefits 41 63 43 46
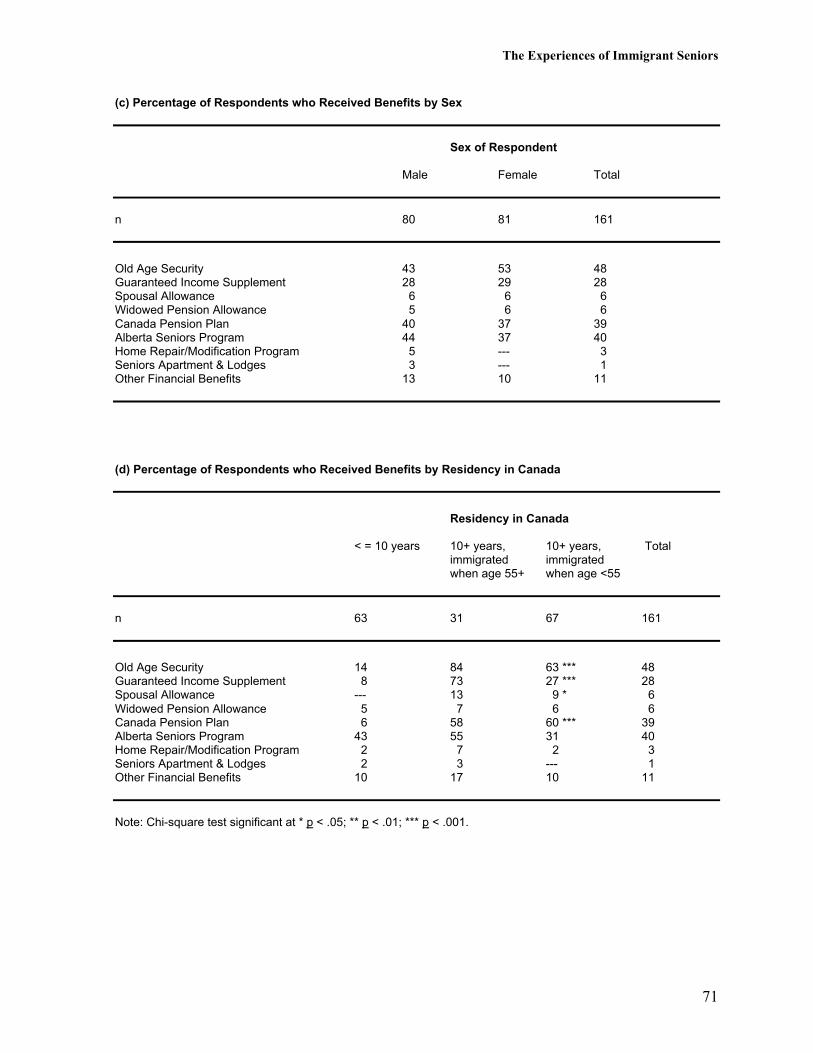
The Experiences of Immigrant Seniors
71
(c) Percentage of Respondents who Received Benefits by Sex
Sex of Respondent
Male Female Total
n 80 81 161
Old Age Security 43 53 48Guaranteed Income Supplement 28 29 28Spousal Allowance 6 6 6Widowed Pension Allowance 5 6 6Canada Pension Plan 40 37 39Alberta Seniors Program 44 37 40Home Repair/Modification Program 5 --- 3Seniors Apartment & Lodges 3 --- 1Other Financial Benefits 13 10 11
(d) Percentage of Respondents who Received Benefits by Residency in Canada
Residency in Canada
< = 10 years 10+ years, 10+ years, Totalimmigrated immigratedwhen age 55+ when age <55
n 63 31 67 161
Old Age Security 14 84 63 *** 48Guaranteed Income Supplement 8 73 27 *** 28Spousal Allowance --- 13 9 * 6Widowed Pension Allowance 5 7 6 6Canada Pension Plan 6 58 60 *** 39Alberta Seniors Program 43 55 31 40Home Repair/Modification Program 2 7 2 3Seniors Apartment & Lodges 2 3 --- 1Other Financial Benefits 10 17 10 11
Note: Chi-square test significant at * p < .05; ** p < .01; *** p < .001.
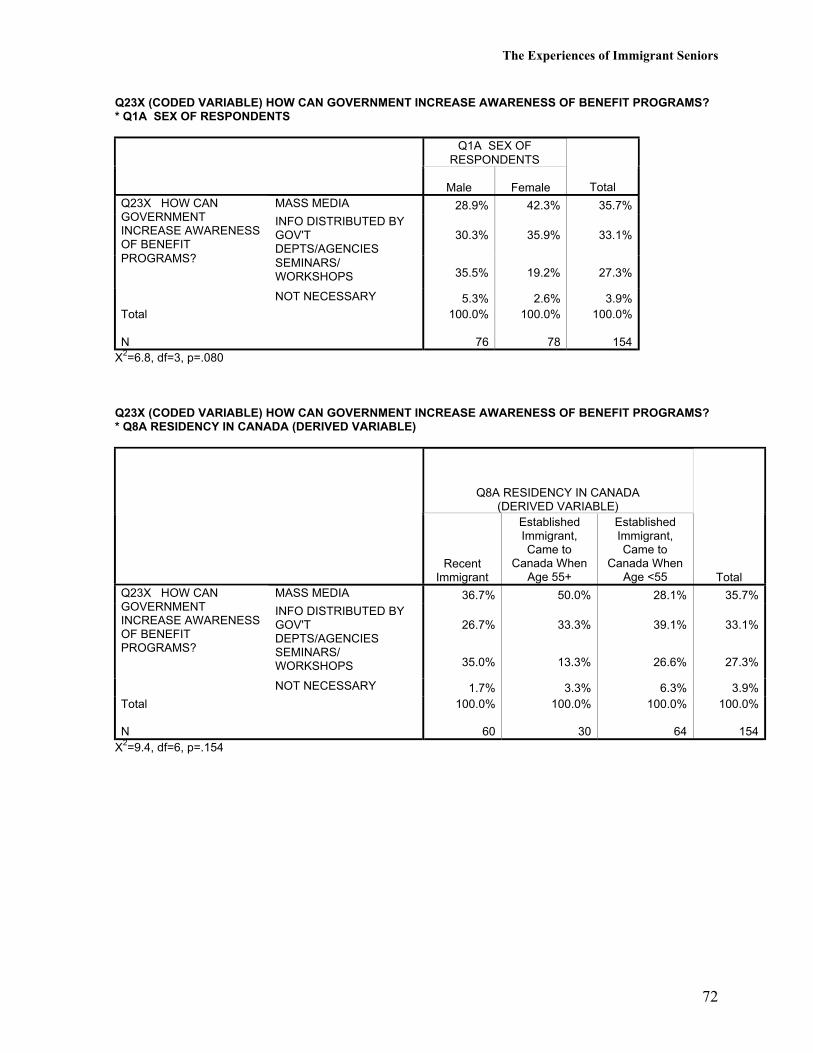
The Experiences of Immigrant Seniors
72
Q23X (CODED VARIABLE) HOW CAN GOVERNMENT INCREASE AWARENESS OF BENEFIT PROGRAMS?* Q1A SEX OF RESPONDENTS
Q1A SEX OFRESPONDENTS
Male Female TotalMASS MEDIA 28.9% 42.3% 35.7%INFO DISTRIBUTED BYGOV'TDEPTS/AGENCIES
30.3% 35.9% 33.1%
SEMINARS/WORKSHOPS 35.5% 19.2% 27.3%
Q23X HOW CANGOVERNMENTINCREASE AWARENESSOF BENEFITPROGRAMS?
NOT NECESSARY 5.3% 2.6% 3.9%Total
N
100.0%
76
100.0%
78
100.0%
154X2=6.8, df=3, p=.080
Q23X (CODED VARIABLE) HOW CAN GOVERNMENT INCREASE AWARENESS OF BENEFIT PROGRAMS?* Q8A RESIDENCY IN CANADA (DERIVED VARIABLE)
Q8A RESIDENCY IN CANADA(DERIVED VARIABLE)
RecentImmigrant
EstablishedImmigrant,Came to
Canada WhenAge 55+
EstablishedImmigrant,Came to
Canada WhenAge <55 Total
MASS MEDIA 36.7% 50.0% 28.1% 35.7%INFO DISTRIBUTED BYGOV'TDEPTS/AGENCIES
26.7% 33.3% 39.1% 33.1%
SEMINARS/WORKSHOPS 35.0% 13.3% 26.6% 27.3%
Q23X HOW CANGOVERNMENTINCREASE AWARENESSOF BENEFITPROGRAMS?
NOT NECESSARY 1.7% 3.3% 6.3% 3.9%Total
N
100.0%
60
100.0%
30
100.0%
64
100.0%
154X2=9.4, df=6, p=.154

The Experiences of Immigrant Seniors
73
Q24 RECEIVE A PENSION SEPARATE FROM PREVIOUS LIST * Q1A SEX OF RESPONDENTS
Q1A SEX OFRESPONDENTS
Male Female TotalYes 21.5% 13.8% 17.6%Q24 RECEIVE
A PENSIONSEPARATEFROMPREVIOUSLIST
No
78.5% 86.3% 82.4%
Total
N
100.0%
79
100.0%
80
100.0%
159
X2=1.161, df=1, p=.281
Q24 RECEIVE A PENSION SEPARATE FROM PREVIOUS LIST * Q8A RESIDENCY IN CANADA (DERIVEDVARIABLE)
Q8A RESIDENCY IN CANADA(DERIVED VARIABLE)
RecentImmigrant
EstablishedImmigrant,Came to
Canada WhenAge 55+
EstablishedImmigrant,Came to
Canada WhenAge <55 Total
Yes 1.6% 20.7% 31.3% 17.6%Q24 RECEIVEA PENSIONSEPARATEFROMPREVIOUSLIST
No
98.4% 79.3% 68.7% 82.4%
Total
N
100.0%
63
100.0%
29
100.0%
67
100.0%
159
X2=20.0, df=2, p=.000
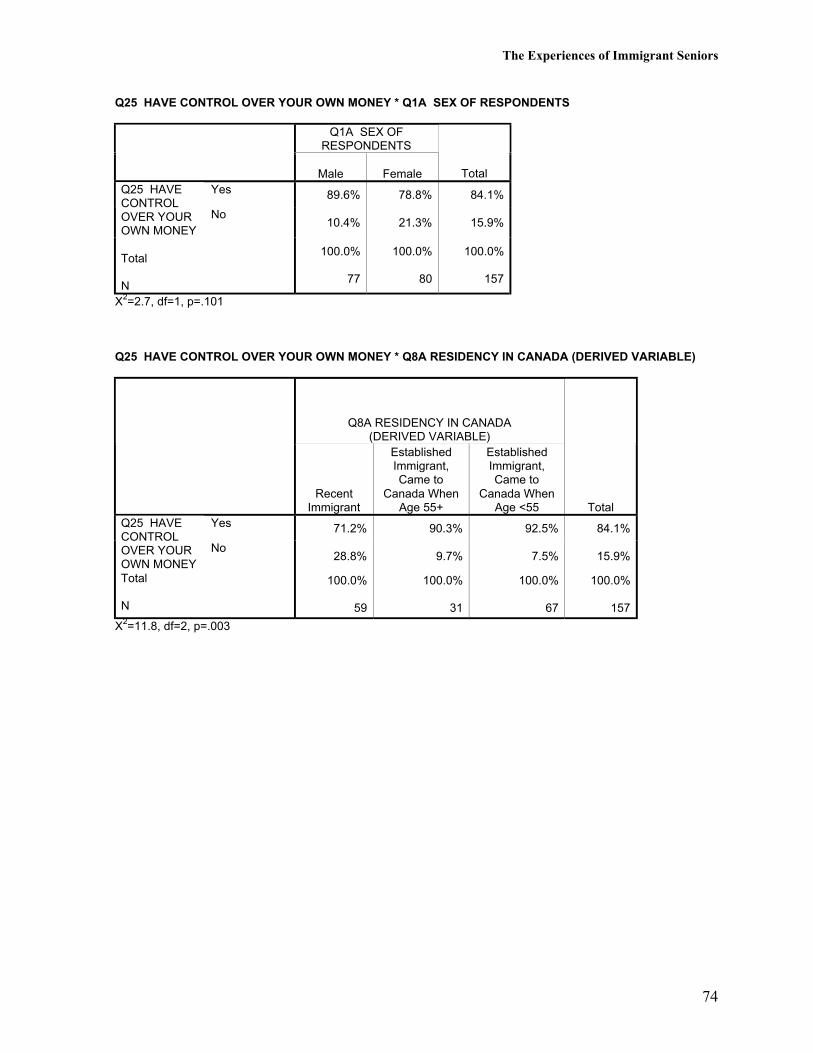
The Experiences of Immigrant Seniors
74
Q25 HAVE CONTROL OVER YOUR OWN MONEY * Q1A SEX OF RESPONDENTS
Q1A SEX OFRESPONDENTS
Male Female TotalYes 89.6% 78.8% 84.1%Q25 HAVE
CONTROLOVER YOUROWN MONEY
No10.4% 21.3% 15.9%
Total
N
100.0%
77
100.0%
80
100.0%
157
X2=2.7, df=1, p=.101
Q25 HAVE CONTROL OVER YOUR OWN MONEY * Q8A RESIDENCY IN CANADA (DERIVED VARIABLE)
Q8A RESIDENCY IN CANADA(DERIVED VARIABLE)
RecentImmigrant
EstablishedImmigrant,Came to
Canada WhenAge 55+
EstablishedImmigrant,Came to
Canada WhenAge <55 Total
Yes 71.2% 90.3% 92.5% 84.1%Q25 HAVECONTROLOVER YOUROWN MONEY
No28.8% 9.7% 7.5% 15.9%
Total
N
100.0%
59
100.0%
31
100.0%
67
100.0%
157
X2=11.8, df=2, p=.003
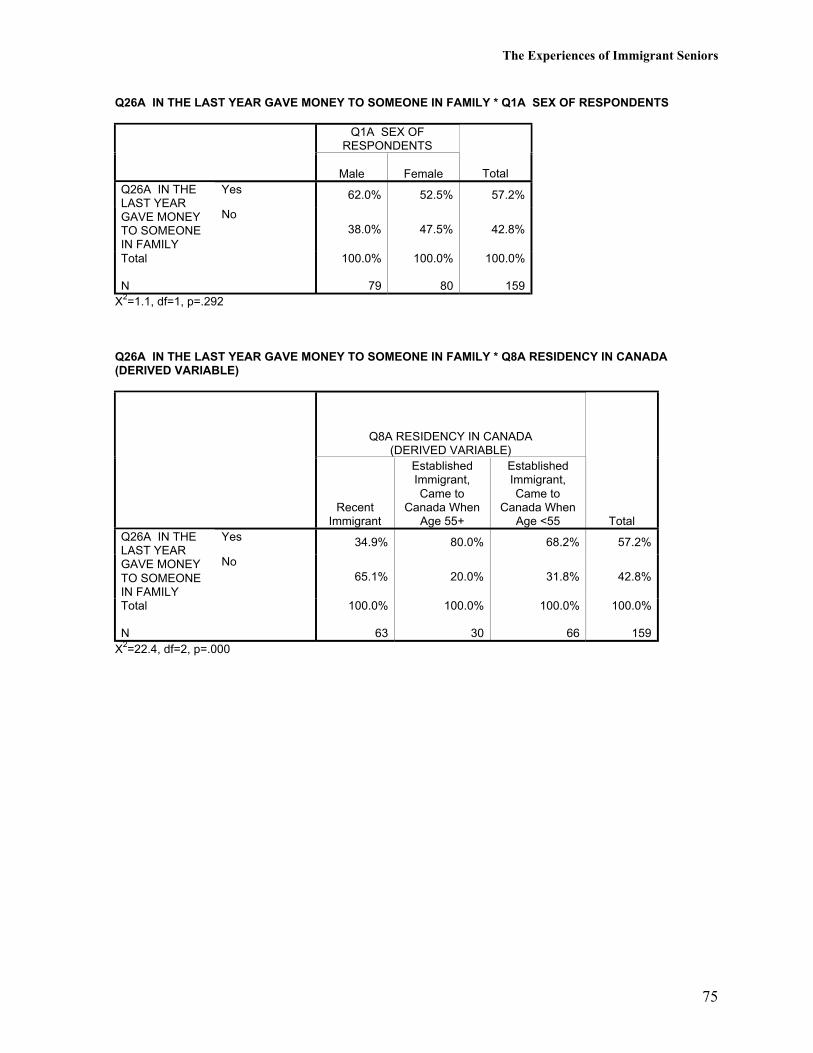
The Experiences of Immigrant Seniors
75
Q26A IN THE LAST YEAR GAVE MONEY TO SOMEONE IN FAMILY * Q1A SEX OF RESPONDENTS
Q1A SEX OFRESPONDENTS
Male Female TotalYes 62.0% 52.5% 57.2%Q26A IN THE
LAST YEARGAVE MONEYTO SOMEONEIN FAMILY
No38.0% 47.5% 42.8%
Total
N
100.0%
79
100.0%
80
100.0%
159X2=1.1, df=1, p=.292
Q26A IN THE LAST YEAR GAVE MONEY TO SOMEONE IN FAMILY * Q8A RESIDENCY IN CANADA(DERIVED VARIABLE)
Q8A RESIDENCY IN CANADA(DERIVED VARIABLE)
RecentImmigrant
EstablishedImmigrant,Came to
Canada WhenAge 55+
EstablishedImmigrant,Came to
Canada WhenAge <55 Total
Yes 34.9% 80.0% 68.2% 57.2%Q26A IN THELAST YEARGAVE MONEYTO SOMEONEIN FAMILY
No65.1% 20.0% 31.8% 42.8%
Total
N
100.0%
63
100.0%
30
100.0%
66
100.0%
159X2=22.4, df=2, p=.000

The Experiences of Immigrant Seniors
76
Q26B GAVE MONEY: HOW OFTEN IN THE LAST YEAR? * Q1A SEX OF RESPONDENTS
Q1A SEX OFRESPONDENTS
Male FemaleNever 38.5% 48.1% 43.4%Occasionally 30.8% 33.3% 32.1%
Q26B GAVEMONEY: HOWOFTEN IN THELAST YEAR? Frequently 23.1% 13.6% 18.2%
All of the time 7.7% 4.9% 6.3%Total
N
100.0%
78
100.0%
81
100.0%
159X2=3.4, df=3, p=.336
Q26B GAVE MONEY: HOW OFTEN IN THE LAST YEAR? * Q8A RESIDENCY IN CANADA (DERIVEDVARIABLE)
Q8A RESIDENCY IN CANADA(DERIVED VARIABLE)
RecentImmigrant
EstablishedImmigrant,Came to
Canada WhenAge 55+
EstablishedImmigrant,Came to
Canada WhenAge <55 Total
Never 65.1% 23.3% 31.8% 43.4%Occasionally 14.3% 43.3% 43.9% 32.1%Frequently 19.0% 26.7% 13.6% 18.2%
Q26B GAVEMONEY: HOWOFTEN IN THELAST YEAR?
All of the time 1.6% 6.7% 10.6% 6.3%Total
N
100.0%
63
100.0%
30
100.0%
66
100.0%
159X2=28.1, df=6, p=.000
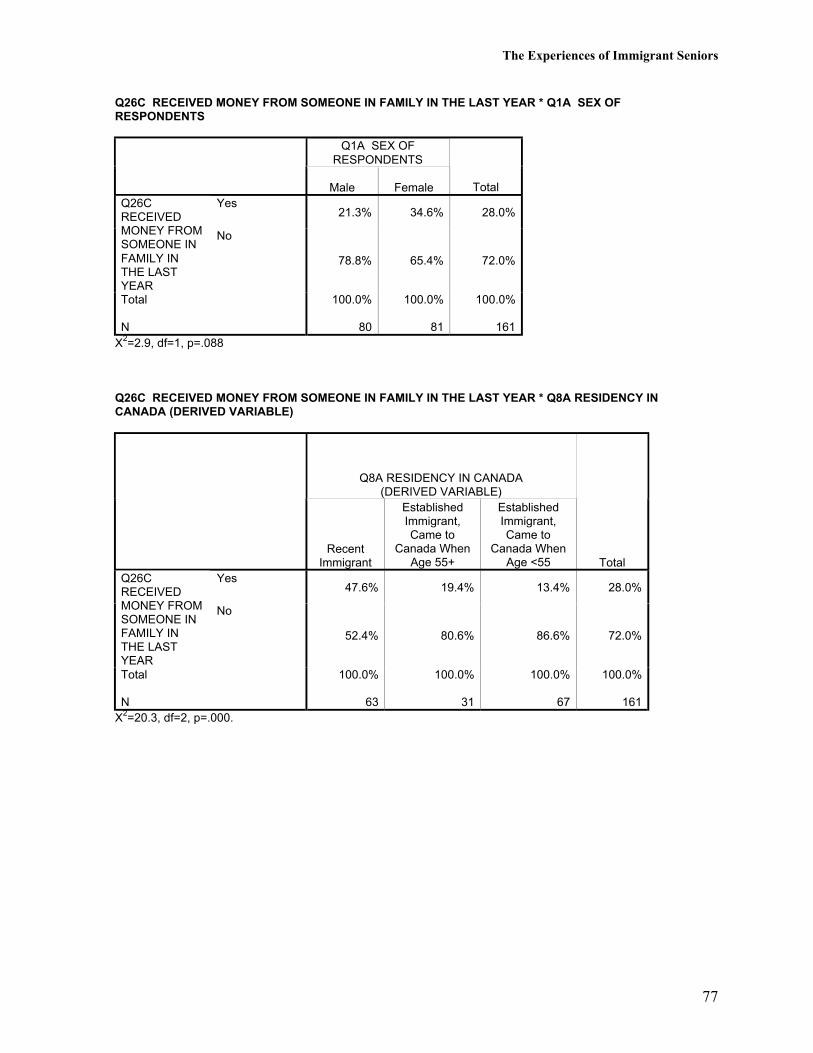
The Experiences of Immigrant Seniors
77
Q26C RECEIVED MONEY FROM SOMEONE IN FAMILY IN THE LAST YEAR * Q1A SEX OFRESPONDENTS
Q1A SEX OFRESPONDENTS
Male Female TotalYes
21.3% 34.6% 28.0%Q26CRECEIVEDMONEY FROMSOMEONE INFAMILY INTHE LASTYEAR
No
78.8% 65.4% 72.0%
Total
N
100.0%
80
100.0%
81
100.0%
161X2=2.9, df=1, p=.088
Q26C RECEIVED MONEY FROM SOMEONE IN FAMILY IN THE LAST YEAR * Q8A RESIDENCY INCANADA (DERIVED VARIABLE)
Q8A RESIDENCY IN CANADA(DERIVED VARIABLE)
RecentImmigrant
EstablishedImmigrant,Came to
Canada WhenAge 55+
EstablishedImmigrant,Came to
Canada WhenAge <55 Total
Yes47.6% 19.4% 13.4% 28.0%
Q26CRECEIVEDMONEY FROMSOMEONE INFAMILY INTHE LASTYEAR
No
52.4% 80.6% 86.6% 72.0%
Total
N
100.0%
63
100.0%
31
100.0%
67
100.0%
161X2=20.3, df=2, p=.000.

The Experiences of Immigrant Seniors
78
Q26D RECEIVED MONEY: HOW OFTEN IN THE LAST YEAR? * Q1A SEX OF RESPONDENTS
Q1A SEX OFRESPONDENTS
Male Female TotalNever 79.5% 65.4% 72.3%Occasionally 15.4% 18.5% 17.0%Frequently 3.8% 12.3% 8.2%
Q26D RECEIVEDMONEY: HOWOFTEN IN THELAST YEAR?
All of the time 1.3% 3.7% 2.5%Total
N
100.0%
78
100.0%
81
100.0%
159X2=5.8, df=3, p=.124
Q26D RECEIVED MONEY: HOW OFTEN IN THE LAST YEAR? * Q8A RESIDENCY IN CANADA (DERIVEDVARIABLE)
Q8A RESIDENCY IN CANADA(DERIVED VARIABLE)
RecentImmigrant
EstablishedImmigrant,Came to
Canada WhenAge 55+
EstablishedImmigrant,Came to
Canada WhenAge <55 Total
Never 53.2% 80.6% 86.4% 72.3%Occasionally 25.8% 12.9% 10.6% 17.0%Frequently 17.7% 3.0% 8.2%
Q26D RECEIVEDMONEY: HOWOFTEN IN THELAST YEAR?
All of the time 3.2% 6.5% 2.5%Total
N
100.0%
62
100.0%
31
100.0%
66
100.0%
159X2=25.3, df=6, p=.000
The Experiences of Immigrant Seniors
79
Housing and Living Arrangements
Living Arrangements
In general, our respondents were living in large households. Over half of our respondents(42%) were living with four or five other persons, and 10% were living with 6 to 11 otherpersons in the same household. One in four (24%) were living with one other person in thesame household. Only 5% lived alone. Recent immigrants were more likely than establishedimmigrants, especially those who came to Canada at a younger age, to live in largerhouseholds. Established immigrants who came to Canada at a younger age were more likelythan recent immigrants to live with one other person only.
Two-thirds of our respondents (64%) were living with their spouse. While 74% of men wereliving with their spouse, only 54% of women were.
Living with adult children’s family was common among our respondents. Half of ourrespondents (50%) were living with one or more sons, most commonly with one son (46%).Thirty-nine percent were living with a daughter-in-law. Established immigrants who came toCanada at a younger age were the least likely to be living with their son or daughter-in-law. Asmaller percentage of our respondents were living with one or more daughters (26%), mostcommonly with one daughter (23%). Only 14% were living with a son-in-law. Over half ofour respondents (55%) were living with their grandchildren, most commonly with twograndchildren (30%). Recent immigrants were more likely to live with their grandchildren(75%) than were established immigrants who came to Canada at an older age (58%) or thosewho came at a younger age (34%). Very few were living with relatives (4%) or non-relatives(3%).
Living alone was very rare among our respondents (5%). About one in five (22%) lived withtheir spouse only. Living with their adult children (presumably unmarried) and withoutgrandchildren present was quite common (16%).
Unlike seniors in the general Canadian population, living in extended families was the mostcommon living arrangement for our respondents. Over half (56%) lived in a three-generationfamily household—29% with their spouse and their son’s (19%) or their daughter’s family(10%), and 27 percent without their spouse and with their son’s (19%) or their daughter’s(8%) family. These seniors lived with, on average, 2.16 grandchildren. One household was afour-generation household, and a few three-generation families had other relatives living withthem. Living with the son’s family was more common than living with a daughter’s family(38% versus 18%).
Household type (alone, with spouse only, with adult children, multi-generational with spouse,and multi-generational without spouse) varied significantly by residency in Canada. Recentimmigrants and established immigrants who came to Canada at an older age were more likelythan established immigrants who came to Canada at a younger age to live in multi-generational families (75% & 70% vs. 35%, respectively). Established immigrants who cameto Canada at a younger age were more likely than recent immigrants and established
The Experiences of Immigrant Seniors
80
immigrants who came to Canada at an older age to live with their spouse only (41% vs. 8% &10%, respectively).
Household type also varied significantly by sex. Men were more likely than women to live inextended families with their spouse (40% vs. 21%), but women were more likely than men tolive in extended families without their spouse (40% vs. 14%). Men were also more likely thanwomen to live alone (9% vs. 1%).
Overall, our respondents seemed to be happy with their current living arrangements.When asked if they preferred a different living arrangement, 88% of our respondents said no.Their preferences did not vary by sex or residency in Canada. However, most of the 20respondents who preferred a different arrangement wanted to live either alone (45%) or to livewith family or relatives (25%). When asked what the barriers were to having their preferredliving arrangement, the most common response given by 11 of 18 respondents was too costlyor unaffordable (61%).
The majority of our respondents (87%) contributed to their households in various ways: 23%provided childcare, 14% contributed to household expenses, 10% prepared meals, and 30%contributed in several ways. Men were more likely than women to say they were providingchildcare and contributing to household expenses, whereas women were likely than men tosay they were preparing meals and doing household work. Recent immigrants were morelikely than established immigrants to contribute by providing childcare and preparing meals.Established immigrants who came to Canada at a younger age were the more likely tocontribute in several ways, whereas established immigrants who came to Canada at an olderage were the most likely to contribute to household expenses. Almost all of our respondentsate with members of their household (21% once a day and 75% more than once a day).
Housing
The majority of our respondents (74%) lived in single-detached houses, 12% lived intownhouses and duplexes, and only 8% lived in apartments in multi-unit buildings.
Home ownership was important to our respondents and their families. Four in five (79%) ofour respondents lived in dwellings owned by them or their families. Almost half (49%) of thedwellings were owned or rented by the respondents’ children, 40% were owned or rented bythe respondents and/or their spouse, and 9% were owned or rented jointly by them (or theirspouse) and their children. Recent immigrants (74%) and established immigrants who came toCanada at an older age (58%) were more likely than established immigrants who came toCanada at a younger age (21%) to live in dwellings owned or rented by their children.
Most of the dwellings (80%) had 3 to 5 bedrooms (87% had 3 or more bedrooms). Themajority (85%) felt their dwellings were just the right size for them and their families.However, 13% of the recent immigrants and established immigrants who came to Canada atan older age felt their dwelling was too small. In contrast, 15% of established immigrants whocame to Canada at a younger age felt that their dwelling was too large.
The Experiences of Immigrant Seniors
81
The average dwelling density (person per room) was 1.20 (range 0.33 to 4.00). Recentimmigrants and established immigrants who came to Canada at an older age lived insignificantly higher-density dwellings than established immigrants who came to Canada at ayounger age (1.42 and 1.39, respectively, vs. 0.91). However, perception of dwelling size inrelation to dwelling density varied significantly by residency in Canada. The average dwellingdensities that seniors considered to be just right were 1.42 for recent immigrants, 1.30 forestablished immigrants who came to Canada at an older age, and 0.93 for establishedimmigrants who came to Canada at a younger age. These differences suggest that theestablished immigrants who came to Canada at a younger age have acculturated in adoptingthe Canadian standard of acceptable dwelling density.
The majority of our respondents (83%) did not prefer to live in a different building or facility.The 28 respondents who preferred a different residence indicated their preference for a single-detached house (43%), a townhouse or duplex (21%), an apartment (7%), or a senior’sapartment, a senior’s lodge, or an assisted living facility (25%). When asked what preventedthem from living in the facilities they preferred, most of the 27 respondents said it was toocostly or unaffordable (78%).
All but one respondent indicated that their current dwelling allows them to maintain theirculture. Five out of the eight seniors who indicated a preference for a senior apartment, asenior lodge, or assisted living facilities preferred facilities specifically for people of theirown cultural background.
Most of our respondents rated the condition of their dwelling as good (45%) or excellent(40%). The great majority was satisfied with their housing (54% very satisfied and 38%satisfied). Responses did not vary by either sex or residency in Canada.
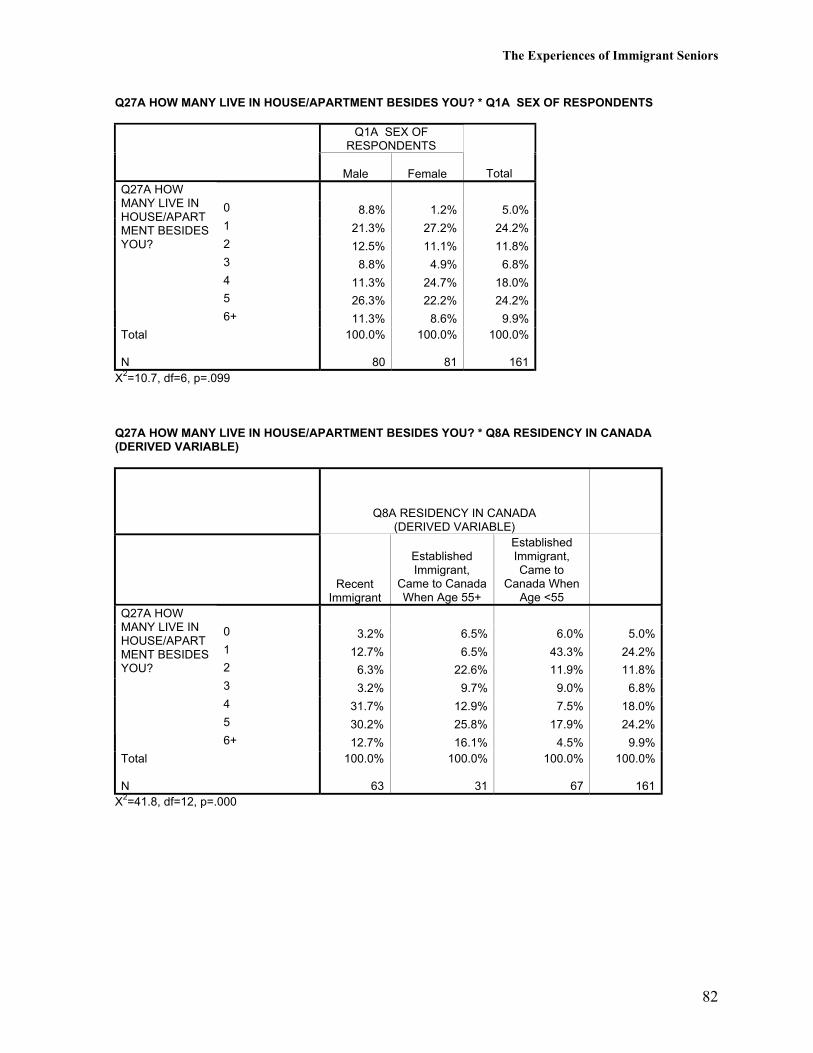
The Experiences of Immigrant Seniors
82
Q27A HOW MANY LIVE IN HOUSE/APARTMENT BESIDES YOU? * Q1A SEX OF RESPONDENTS
Q1A SEX OFRESPONDENTS
Male Female Total
0 8.8% 1.2% 5.0%1 21.3% 27.2% 24.2%2 12.5% 11.1% 11.8%3 8.8% 4.9% 6.8%4 11.3% 24.7% 18.0%5 26.3% 22.2% 24.2%
Q27A HOWMANY LIVE INHOUSE/APARTMENT BESIDESYOU?
6+ 11.3% 8.6% 9.9%Total
N
100.0%
80
100.0%
81
100.0%
161X2=10.7, df=6, p=.099
Q27A HOW MANY LIVE IN HOUSE/APARTMENT BESIDES YOU? * Q8A RESIDENCY IN CANADA(DERIVED VARIABLE)
Q8A RESIDENCY IN CANADA(DERIVED VARIABLE)
RecentImmigrant
EstablishedImmigrant,
Came to CanadaWhen Age 55+
EstablishedImmigrant,Came to
Canada WhenAge <55
0 3.2% 6.5% 6.0% 5.0%1 12.7% 6.5% 43.3% 24.2%2 6.3% 22.6% 11.9% 11.8%3 3.2% 9.7% 9.0% 6.8%4 31.7% 12.9% 7.5% 18.0%5 30.2% 25.8% 17.9% 24.2%
Q27A HOWMANY LIVE INHOUSE/APARTMENT BESIDESYOU?
6+ 12.7% 16.1% 4.5% 9.9%Total
N
100.0%
63
100.0%
31
100.0%
67
100.0%
161X2=41.8, df=12, p=.000
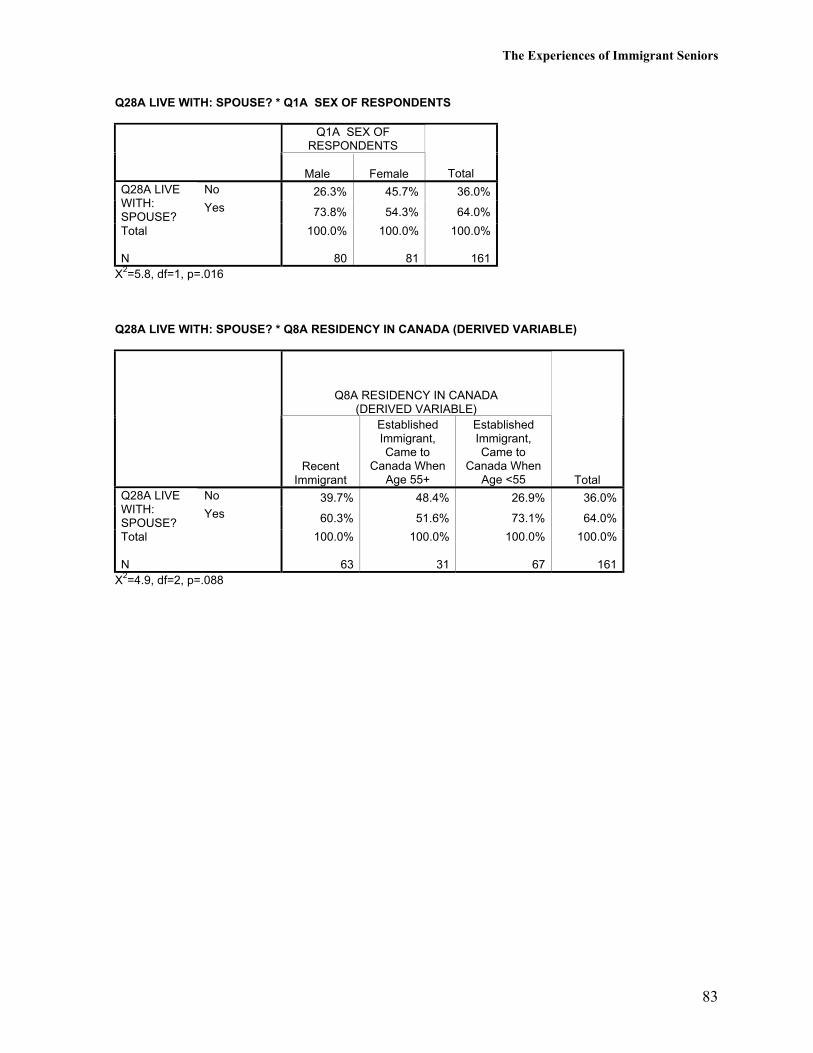
The Experiences of Immigrant Seniors
83
Q28A LIVE WITH: SPOUSE? * Q1A SEX OF RESPONDENTS
Q1A SEX OFRESPONDENTS
Male Female TotalNo 26.3% 45.7% 36.0%Q28A LIVE
WITH:SPOUSE?
Yes 73.8% 54.3% 64.0%
Total
N
100.0%
80
100.0%
81
100.0%
161X2=5.8, df=1, p=.016
Q28A LIVE WITH: SPOUSE? * Q8A RESIDENCY IN CANADA (DERIVED VARIABLE)
Q8A RESIDENCY IN CANADA(DERIVED VARIABLE)
RecentImmigrant
EstablishedImmigrant,Came to
Canada WhenAge 55+
EstablishedImmigrant,Came to
Canada WhenAge <55 Total
No 39.7% 48.4% 26.9% 36.0%Q28A LIVEWITH:SPOUSE?
Yes 60.3% 51.6% 73.1% 64.0%
Total
N
100.0%
63
100.0%
31
100.0%
67
100.0%
161X2=4.9, df=2, p=.088
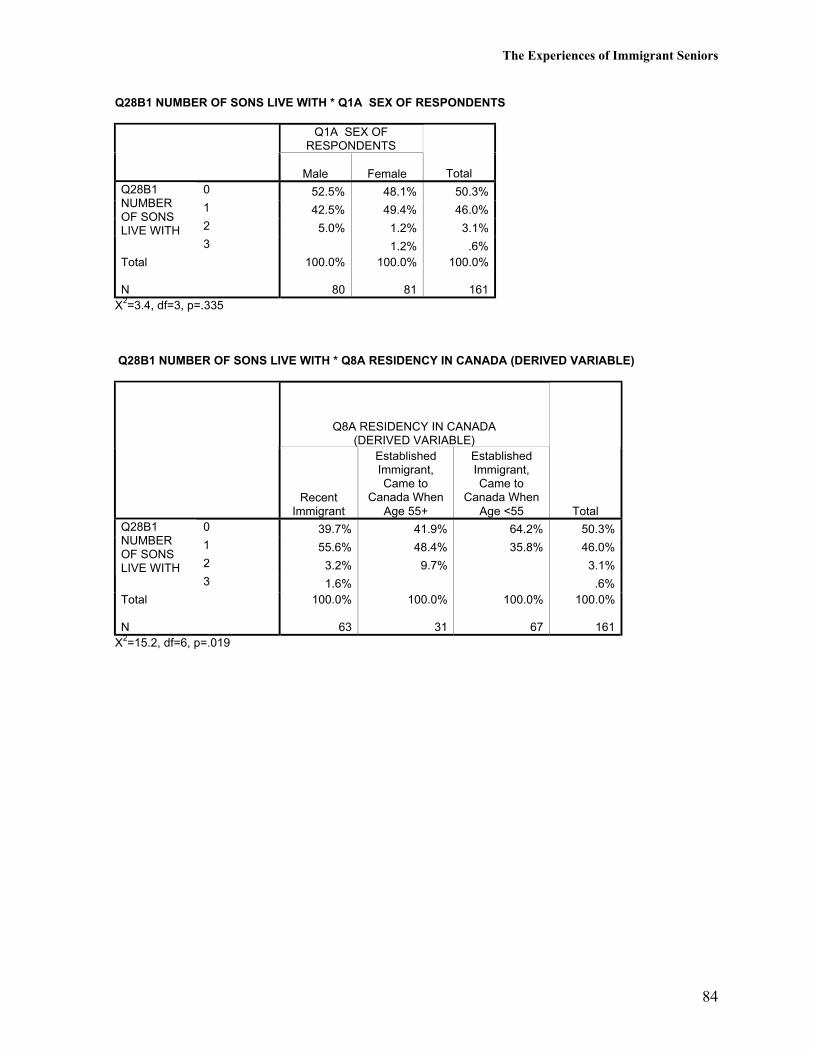
The Experiences of Immigrant Seniors
84
Q28B1 NUMBER OF SONS LIVE WITH * Q1A SEX OF RESPONDENTS
Q1A SEX OFRESPONDENTS
Male Female Total0 52.5% 48.1% 50.3%1 42.5% 49.4% 46.0%2 5.0% 1.2% 3.1%
Q28B1NUMBEROF SONSLIVE WITH
3 1.2% .6%Total
N
100.0%
80
100.0%
81
100.0%
161X2=3.4, df=3, p=.335
Q28B1 NUMBER OF SONS LIVE WITH * Q8A RESIDENCY IN CANADA (DERIVED VARIABLE)
Q8A RESIDENCY IN CANADA(DERIVED VARIABLE)
RecentImmigrant
EstablishedImmigrant,Came to
Canada WhenAge 55+
EstablishedImmigrant,Came to
Canada WhenAge <55 Total
0 39.7% 41.9% 64.2% 50.3%1 55.6% 48.4% 35.8% 46.0%2 3.2% 9.7% 3.1%
Q28B1NUMBEROF SONSLIVE WITH
3 1.6% .6%Total
N
100.0%
63
100.0%
31
100.0%
67
100.0%
161X2=15.2, df=6, p=.019
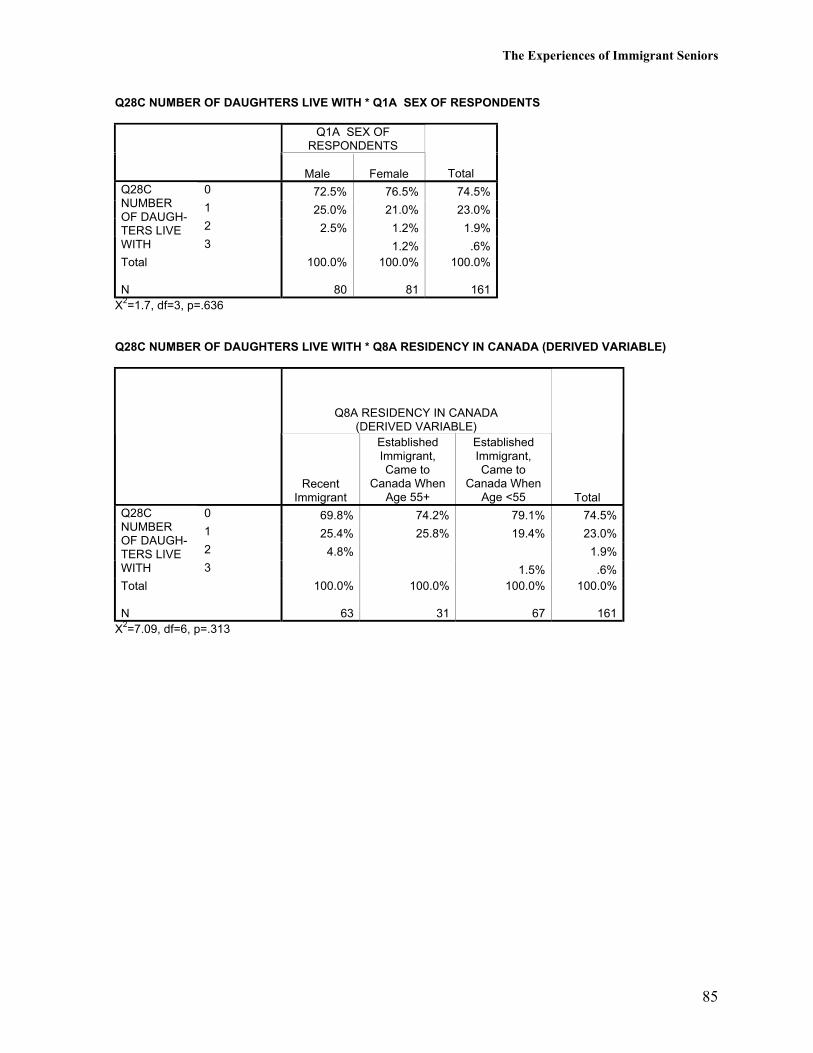
The Experiences of Immigrant Seniors
85
Q28C NUMBER OF DAUGHTERS LIVE WITH * Q1A SEX OF RESPONDENTS
Q1A SEX OFRESPONDENTS
Male Female Total0 72.5% 76.5% 74.5%1 25.0% 21.0% 23.0%2 2.5% 1.2% 1.9%
Q28CNUMBEROF DAUGH-TERS LIVEWITH 3 1.2% .6%Total
N
100.0%
80
100.0%
81
100.0%
161X2=1.7, df=3, p=.636
Q28C NUMBER OF DAUGHTERS LIVE WITH * Q8A RESIDENCY IN CANADA (DERIVED VARIABLE)
Q8A RESIDENCY IN CANADA(DERIVED VARIABLE)
RecentImmigrant
EstablishedImmigrant,Came to
Canada WhenAge 55+
EstablishedImmigrant,Came to
Canada WhenAge <55 Total
0 69.8% 74.2% 79.1% 74.5%1 25.4% 25.8% 19.4% 23.0%2 4.8% 1.9%
Q28CNUMBEROF DAUGH-TERS LIVEWITH 3 1.5% .6%Total
N
100.0%
63
100.0%
31
100.0%
67
100.0%
161X2=7.09, df=6, p=.313
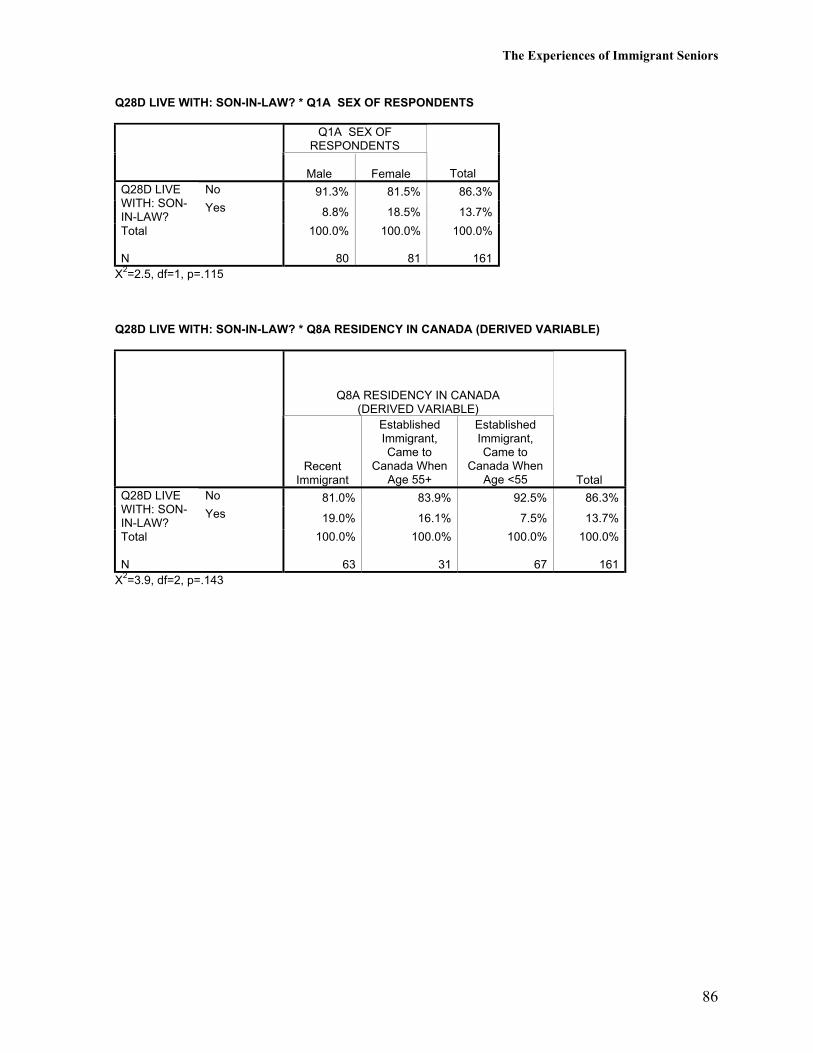
The Experiences of Immigrant Seniors
86
Q28D LIVE WITH: SON-IN-LAW? * Q1A SEX OF RESPONDENTS
Q1A SEX OFRESPONDENTS
Male Female TotalNo 91.3% 81.5% 86.3%Q28D LIVE
WITH: SON-IN-LAW?
Yes 8.8% 18.5% 13.7%
Total
N
100.0%
80
100.0%
81
100.0%
161X2=2.5, df=1, p=.115
Q28D LIVE WITH: SON-IN-LAW? * Q8A RESIDENCY IN CANADA (DERIVED VARIABLE)
Q8A RESIDENCY IN CANADA(DERIVED VARIABLE)
RecentImmigrant
EstablishedImmigrant,Came to
Canada WhenAge 55+
EstablishedImmigrant,Came to
Canada WhenAge <55 Total
No 81.0% 83.9% 92.5% 86.3%Q28D LIVEWITH: SON-IN-LAW?
Yes 19.0% 16.1% 7.5% 13.7%
Total
N
100.0%
63
100.0%
31
100.0%
67
100.0%
161X2=3.9, df=2, p=.143
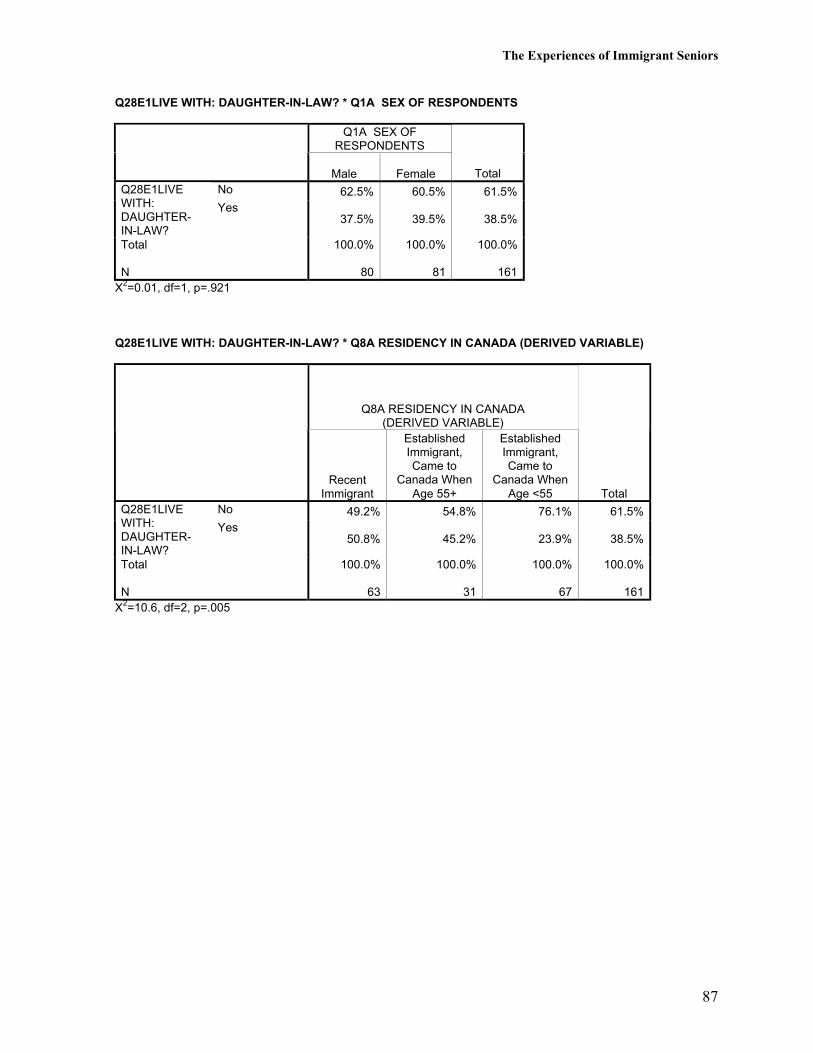
The Experiences of Immigrant Seniors
87
Q28E1LIVE WITH: DAUGHTER-IN-LAW? * Q1A SEX OF RESPONDENTS
Q1A SEX OFRESPONDENTS
Male Female TotalNo 62.5% 60.5% 61.5%Q28E1LIVE
WITH:DAUGHTER-IN-LAW?
Yes37.5% 39.5% 38.5%
Total
N
100.0%
80
100.0%
81
100.0%
161X2=0.01, df=1, p=.921
Q28E1LIVE WITH: DAUGHTER-IN-LAW? * Q8A RESIDENCY IN CANADA (DERIVED VARIABLE)
Q8A RESIDENCY IN CANADA(DERIVED VARIABLE)
RecentImmigrant
EstablishedImmigrant,Came to
Canada WhenAge 55+
EstablishedImmigrant,Came to
Canada WhenAge <55 Total
No 49.2% 54.8% 76.1% 61.5%Q28E1LIVEWITH:DAUGHTER-IN-LAW?
Yes50.8% 45.2% 23.9% 38.5%
Total
N
100.0%
63
100.0%
31
100.0%
67
100.0%
161X2=10.6, df=2, p=.005
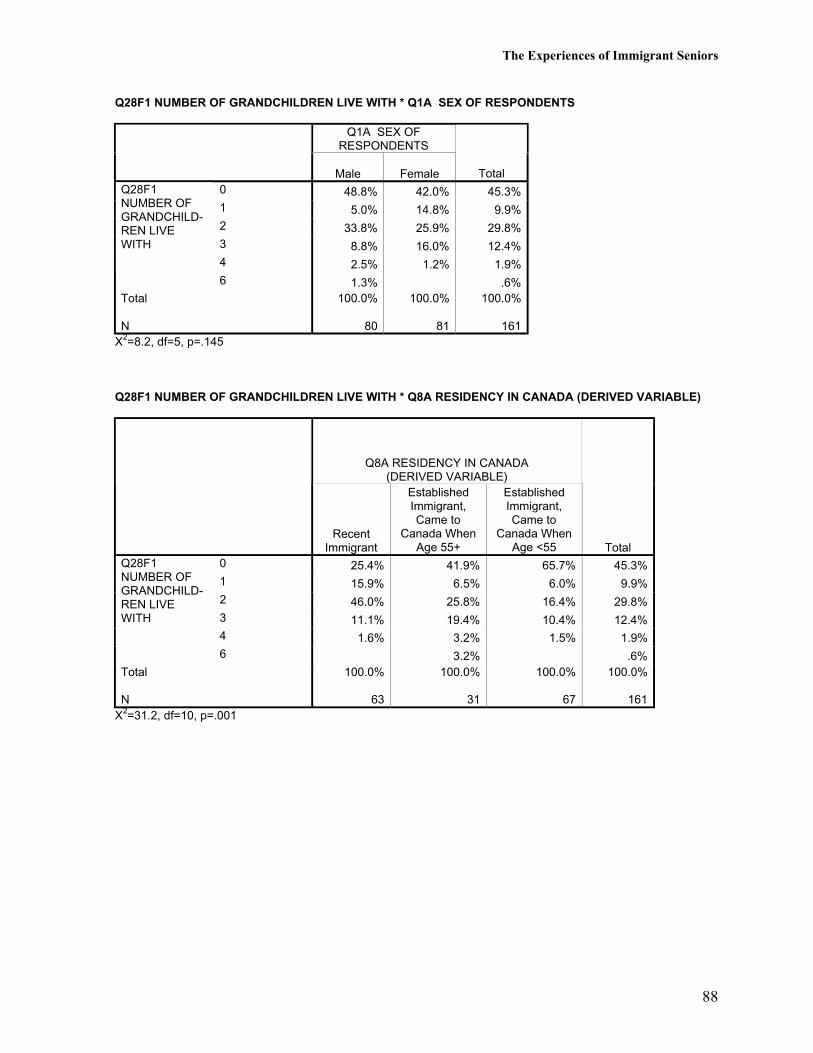
The Experiences of Immigrant Seniors
88
Q28F1 NUMBER OF GRANDCHILDREN LIVE WITH * Q1A SEX OF RESPONDENTS
Q1A SEX OFRESPONDENTS
Male Female Total0 48.8% 42.0% 45.3%1 5.0% 14.8% 9.9%2 33.8% 25.9% 29.8%3 8.8% 16.0% 12.4%4 2.5% 1.2% 1.9%
Q28F1NUMBER OFGRANDCHILD-REN LIVEWITH
6 1.3% .6%Total
N
100.0%
80
100.0%
81
100.0%
161X2=8.2, df=5, p=.145
Q28F1 NUMBER OF GRANDCHILDREN LIVE WITH * Q8A RESIDENCY IN CANADA (DERIVED VARIABLE)
Q8A RESIDENCY IN CANADA(DERIVED VARIABLE)
RecentImmigrant
EstablishedImmigrant,Came to
Canada WhenAge 55+
EstablishedImmigrant,Came to
Canada WhenAge <55 Total
0 25.4% 41.9% 65.7% 45.3%1 15.9% 6.5% 6.0% 9.9%2 46.0% 25.8% 16.4% 29.8%3 11.1% 19.4% 10.4% 12.4%4 1.6% 3.2% 1.5% 1.9%
Q28F1NUMBER OFGRANDCHILD-REN LIVEWITH
6 3.2% .6%Total
N
100.0%
63
100.0%
31
100.0%
67
100.0%
161X2=31.2, df=10, p=.001
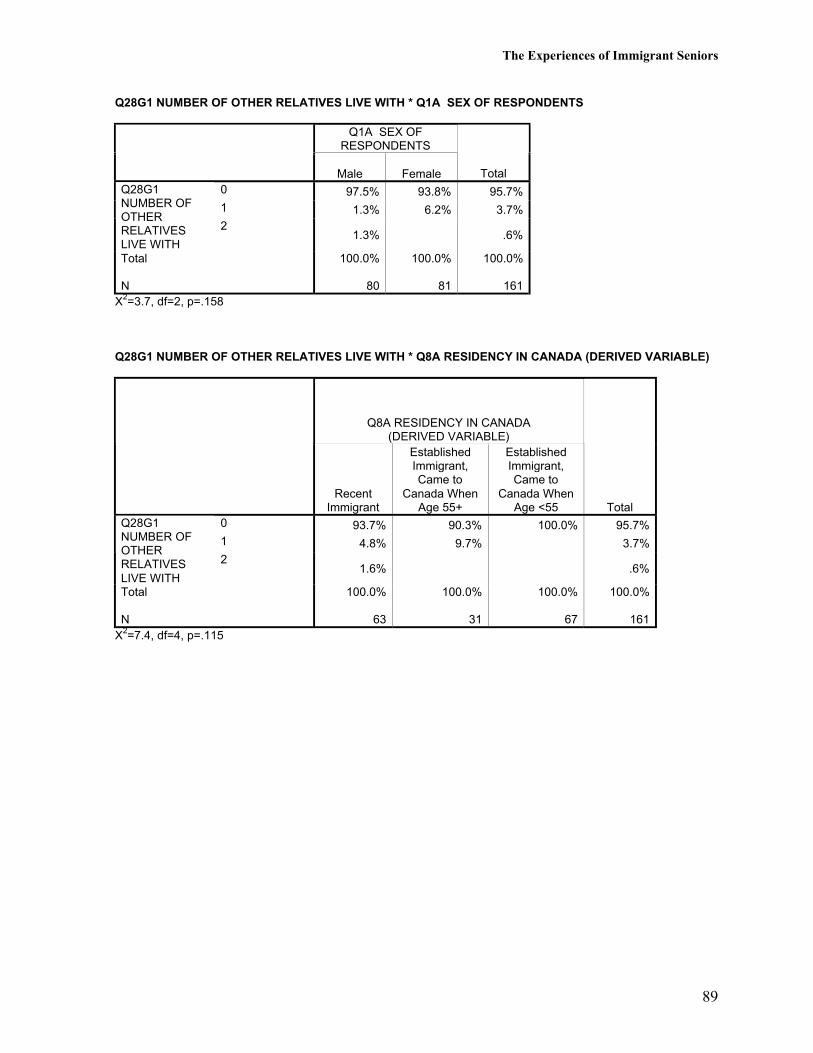
The Experiences of Immigrant Seniors
89
Q28G1 NUMBER OF OTHER RELATIVES LIVE WITH * Q1A SEX OF RESPONDENTS
Q1A SEX OFRESPONDENTS
Male Female Total0 97.5% 93.8% 95.7%1 1.3% 6.2% 3.7%
Q28G1NUMBER OFOTHERRELATIVESLIVE WITH
21.3% .6%
Total
N
100.0%
80
100.0%
81
100.0%
161X2=3.7, df=2, p=.158
Q28G1 NUMBER OF OTHER RELATIVES LIVE WITH * Q8A RESIDENCY IN CANADA (DERIVED VARIABLE)
Q8A RESIDENCY IN CANADA(DERIVED VARIABLE)
RecentImmigrant
EstablishedImmigrant,Came to
Canada WhenAge 55+
EstablishedImmigrant,Came to
Canada WhenAge <55 Total
0 93.7% 90.3% 100.0% 95.7%1 4.8% 9.7% 3.7%
Q28G1NUMBER OFOTHERRELATIVESLIVE WITH
21.6% .6%
Total
N
100.0%
63
100.0%
31
100.0%
67
100.0%
161X2=7.4, df=4, p=.115
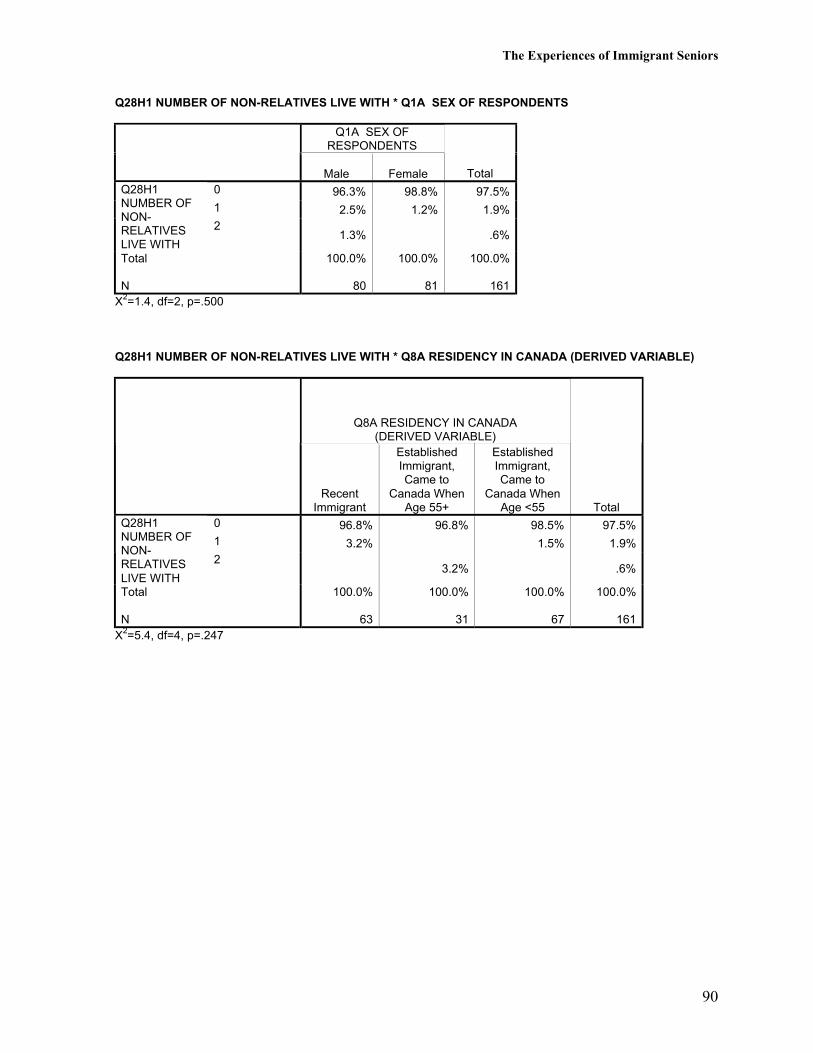
The Experiences of Immigrant Seniors
90
Q28H1 NUMBER OF NON-RELATIVES LIVE WITH * Q1A SEX OF RESPONDENTS
Q1A SEX OFRESPONDENTS
Male Female Total0 96.3% 98.8% 97.5%1 2.5% 1.2% 1.9%
Q28H1NUMBER OFNON-RELATIVESLIVE WITH
21.3% .6%
Total
N
100.0%
80
100.0%
81
100.0%
161X2=1.4, df=2, p=.500
Q28H1 NUMBER OF NON-RELATIVES LIVE WITH * Q8A RESIDENCY IN CANADA (DERIVED VARIABLE)
Q8A RESIDENCY IN CANADA(DERIVED VARIABLE)
RecentImmigrant
EstablishedImmigrant,Came to
Canada WhenAge 55+
EstablishedImmigrant,Came to
Canada WhenAge <55 Total
0 96.8% 96.8% 98.5% 97.5%1 3.2% 1.5% 1.9%
Q28H1NUMBER OFNON-RELATIVESLIVE WITH
23.2% .6%
Total
N
100.0%
63
100.0%
31
100.0%
67
100.0%
161X2=5.4, df=4, p=.247
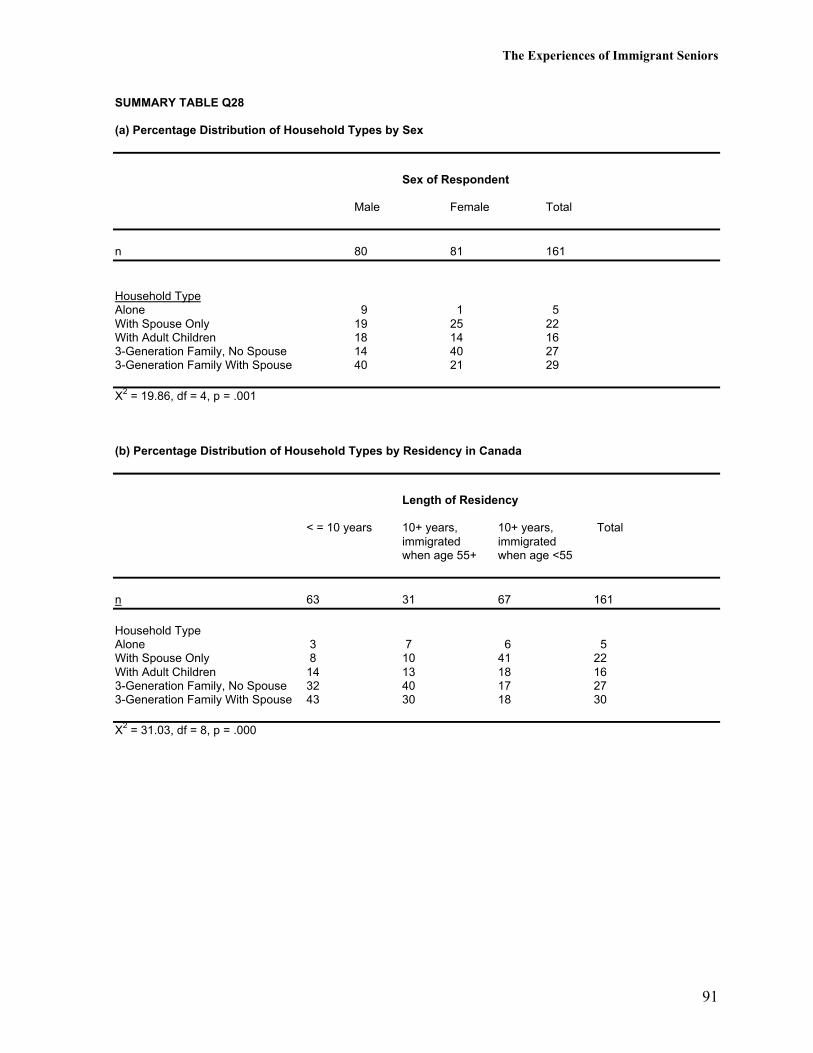
The Experiences of Immigrant Seniors
91
SUMMARY TABLE Q28
(a) Percentage Distribution of Household Types by Sex
Sex of Respondent
Male Female Total
n 80 81 161
Household TypeAlone 9 1 5With Spouse Only 19 25 22With Adult Children 18 14 163-Generation Family, No Spouse 14 40 273-Generation Family With Spouse 40 21 29
X2 = 19.86, df = 4, p = .001
(b) Percentage Distribution of Household Types by Residency in Canada
Length of Residency
< = 10 years 10+ years, 10+ years, Totalimmigrated immigratedwhen age 55+ when age <55
n 63 31 67 161
Household TypeAlone 3 7 6 5With Spouse Only 8 10 41 22With Adult Children 14 13 18 163-Generation Family, No Spouse 32 40 17 273-Generation Family With Spouse 43 30 18 30
X2 = 31.03, df = 8, p = .000
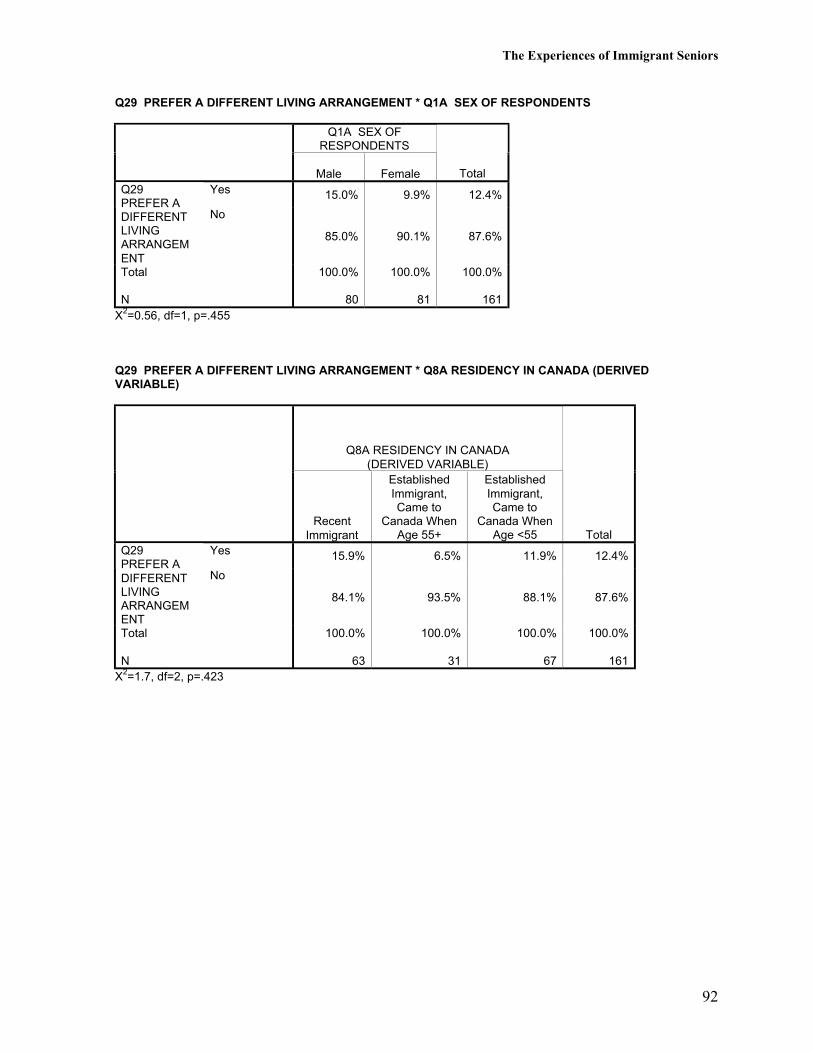
The Experiences of Immigrant Seniors
92
Q29 PREFER A DIFFERENT LIVING ARRANGEMENT * Q1A SEX OF RESPONDENTS
Q1A SEX OFRESPONDENTS
Male Female TotalYes 15.0% 9.9% 12.4%Q29
PREFER ADIFFERENTLIVINGARRANGEMENT
No
85.0% 90.1% 87.6%
Total
N
100.0%
80
100.0%
81
100.0%
161X2=0.56, df=1, p=.455
Q29 PREFER A DIFFERENT LIVING ARRANGEMENT * Q8A RESIDENCY IN CANADA (DERIVEDVARIABLE)
Q8A RESIDENCY IN CANADA(DERIVED VARIABLE)
RecentImmigrant
EstablishedImmigrant,Came to
Canada WhenAge 55+
EstablishedImmigrant,Came to
Canada WhenAge <55 Total
Yes 15.9% 6.5% 11.9% 12.4%Q29PREFER ADIFFERENTLIVINGARRANGEMENT
No
84.1% 93.5% 88.1% 87.6%
Total
N
100.0%
63
100.0%
31
100.0%
67
100.0%
161X2=1.7, df=2, p=.423
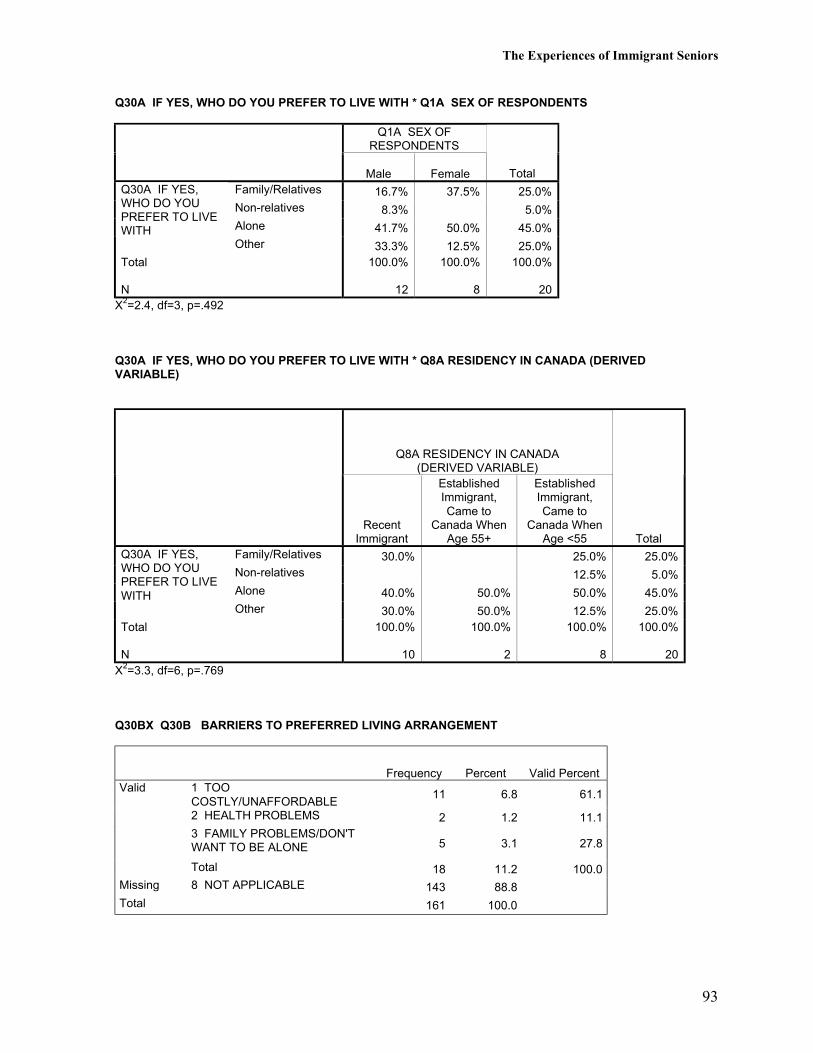
The Experiences of Immigrant Seniors
93
Q30A IF YES, WHO DO YOU PREFER TO LIVE WITH * Q1A SEX OF RESPONDENTS
Q1A SEX OFRESPONDENTS
Male Female TotalFamily/Relatives 16.7% 37.5% 25.0%Non-relatives 8.3% 5.0%Alone 41.7% 50.0% 45.0%
Q30A IF YES,WHO DO YOUPREFER TO LIVEWITH
Other 33.3% 12.5% 25.0%Total
N
100.0%
12
100.0%
8
100.0%
20X2=2.4, df=3, p=.492
Q30A IF YES, WHO DO YOU PREFER TO LIVE WITH * Q8A RESIDENCY IN CANADA (DERIVEDVARIABLE)
Q8A RESIDENCY IN CANADA(DERIVED VARIABLE)
RecentImmigrant
EstablishedImmigrant,Came to
Canada WhenAge 55+
EstablishedImmigrant,Came to
Canada WhenAge <55 Total
Family/Relatives 30.0% 25.0% 25.0%Non-relatives 12.5% 5.0%Alone 40.0% 50.0% 50.0% 45.0%
Q30A IF YES,WHO DO YOUPREFER TO LIVEWITH
Other 30.0% 50.0% 12.5% 25.0%Total
N
100.0%
10
100.0%
2
100.0%
8
100.0%
20X2=3.3, df=6, p=.769
Q30BX Q30B BARRIERS TO PREFERRED LIVING ARRANGEMENT
Frequency Percent Valid PercentValid 1 TOO
COSTLY/UNAFFORDABLE11 6.8 61.1
2 HEALTH PROBLEMS 2 1.2 11.13 FAMILY PROBLEMS/DON'TWANT TO BE ALONE 5 3.1 27.8
Total 18 11.2 100.0Missing 8 NOT APPLICABLE 143 88.8Total 161 100.0
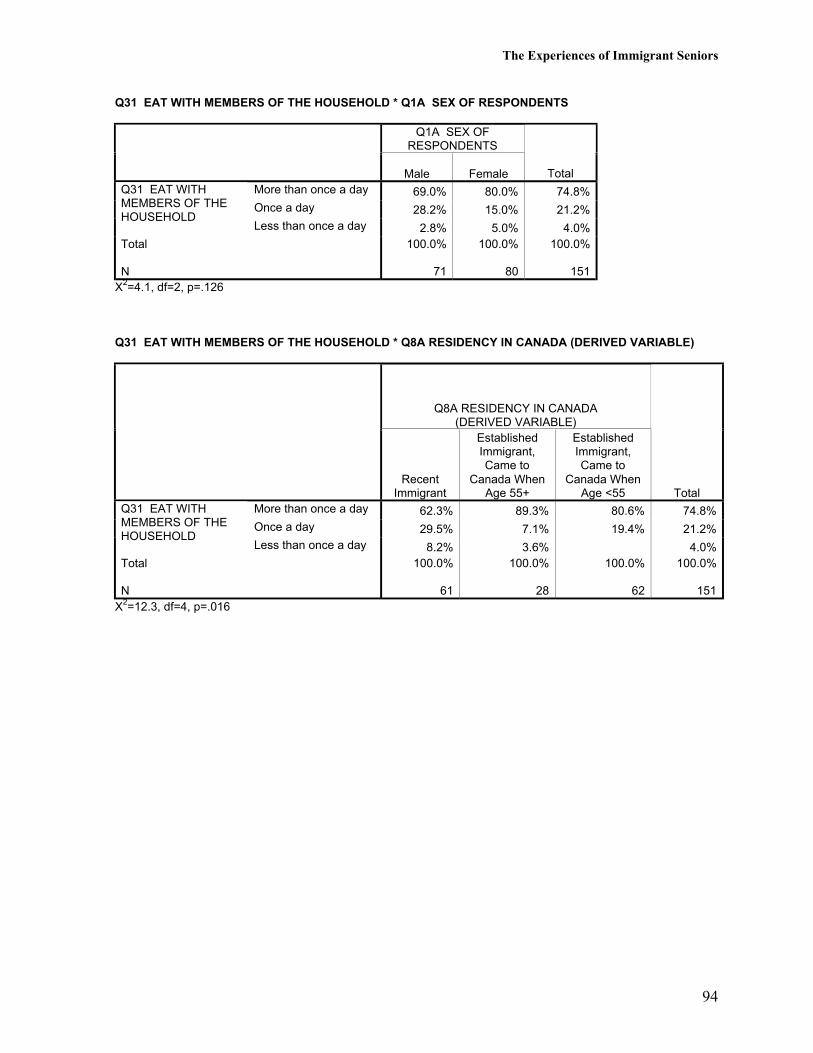
The Experiences of Immigrant Seniors
94
Q31 EAT WITH MEMBERS OF THE HOUSEHOLD * Q1A SEX OF RESPONDENTS
Q1A SEX OFRESPONDENTS
Male Female TotalMore than once a day 69.0% 80.0% 74.8%Once a day 28.2% 15.0% 21.2%
Q31 EAT WITHMEMBERS OF THEHOUSEHOLD
Less than once a day 2.8% 5.0% 4.0%Total
N
100.0%
71
100.0%
80
100.0%
151X2=4.1, df=2, p=.126
Q31 EAT WITH MEMBERS OF THE HOUSEHOLD * Q8A RESIDENCY IN CANADA (DERIVED VARIABLE)
Q8A RESIDENCY IN CANADA(DERIVED VARIABLE)
RecentImmigrant
EstablishedImmigrant,Came to
Canada WhenAge 55+
EstablishedImmigrant,Came to
Canada WhenAge <55 Total
More than once a day 62.3% 89.3% 80.6% 74.8%Once a day 29.5% 7.1% 19.4% 21.2%
Q31 EAT WITHMEMBERS OF THEHOUSEHOLD
Less than once a day 8.2% 3.6% 4.0%Total
N
100.0%
61
100.0%
28
100.0%
62
100.0%
151X2=12.3, df=4, p=.016
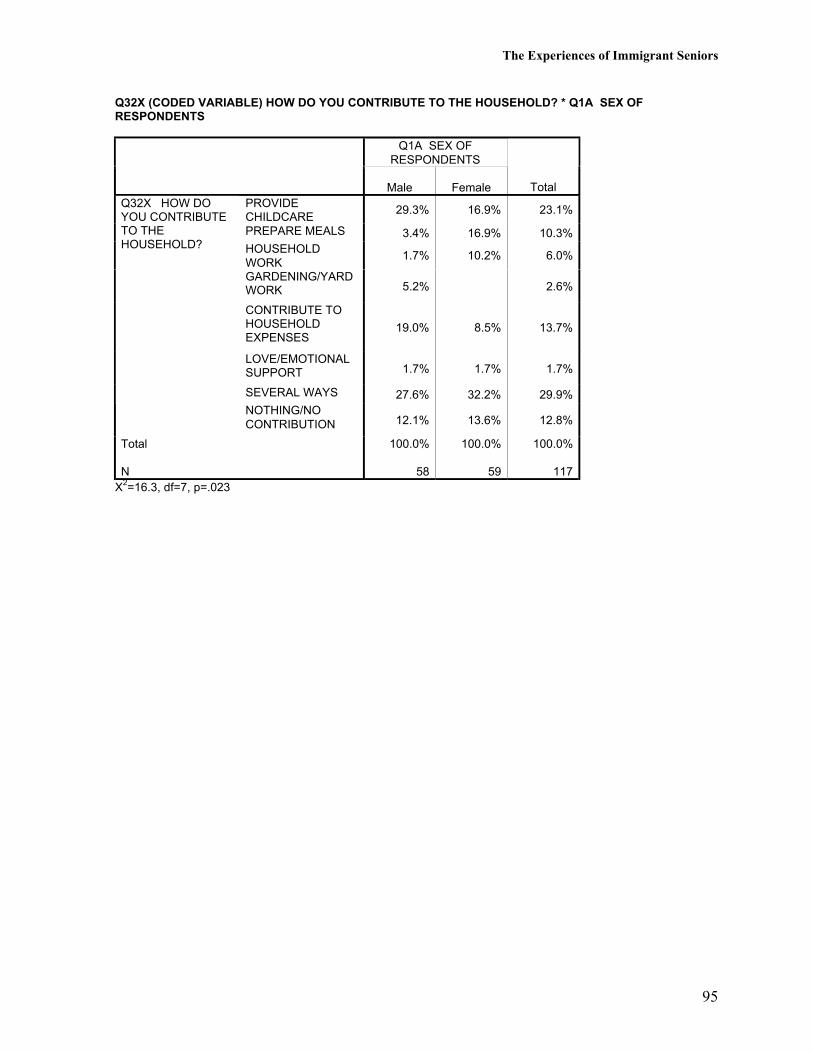
The Experiences of Immigrant Seniors
95
Q32X (CODED VARIABLE) HOW DO YOU CONTRIBUTE TO THE HOUSEHOLD? * Q1A SEX OFRESPONDENTS
Q1A SEX OFRESPONDENTS
Male Female TotalPROVIDECHILDCARE
29.3% 16.9% 23.1%
PREPARE MEALS 3.4% 16.9% 10.3%HOUSEHOLDWORK
1.7% 10.2% 6.0%
GARDENING/YARDWORK 5.2% 2.6%
CONTRIBUTE TOHOUSEHOLDEXPENSES
19.0% 8.5% 13.7%
LOVE/EMOTIONALSUPPORT 1.7% 1.7% 1.7%
SEVERAL WAYS 27.6% 32.2% 29.9%
Q32X HOW DOYOU CONTRIBUTETO THEHOUSEHOLD?
NOTHING/NOCONTRIBUTION 12.1% 13.6% 12.8%
Total
N
100.0%
58
100.0%
59
100.0%
117X2=16.3, df=7, p=.023
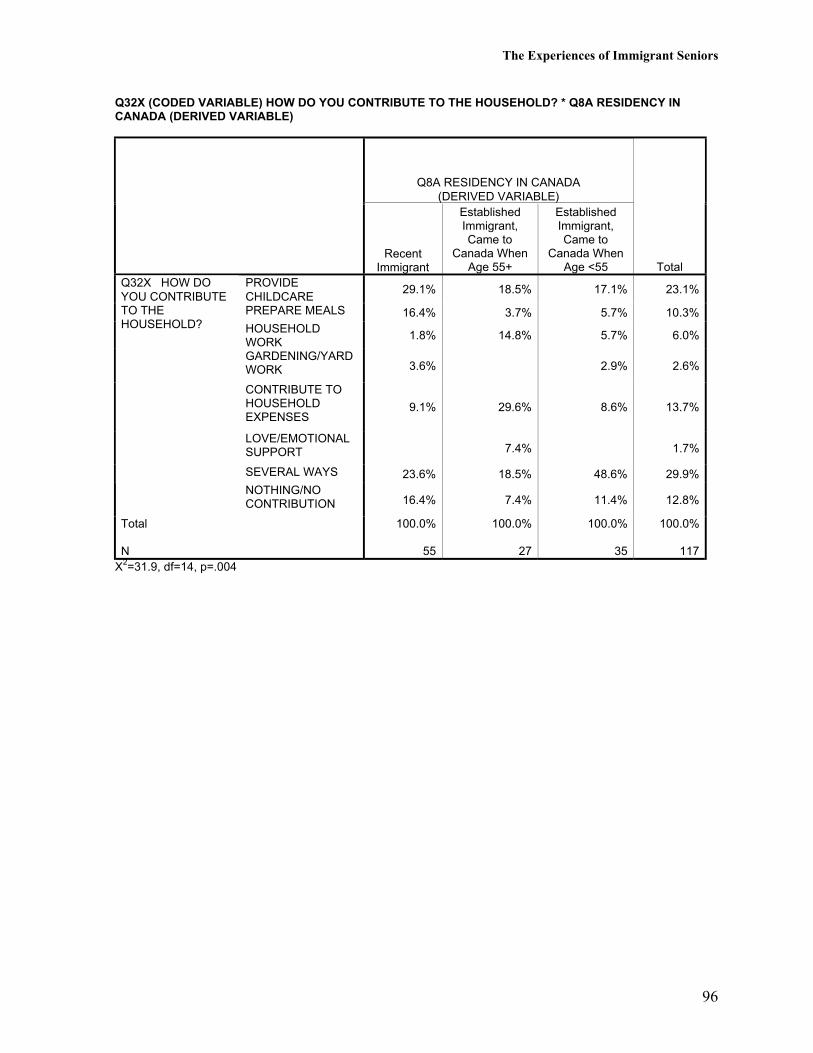
The Experiences of Immigrant Seniors
96
Q32X (CODED VARIABLE) HOW DO YOU CONTRIBUTE TO THE HOUSEHOLD? * Q8A RESIDENCY INCANADA (DERIVED VARIABLE)
Q8A RESIDENCY IN CANADA(DERIVED VARIABLE)
RecentImmigrant
EstablishedImmigrant,Came to
Canada WhenAge 55+
EstablishedImmigrant,Came to
Canada WhenAge <55 Total
PROVIDECHILDCARE
29.1% 18.5% 17.1% 23.1%
PREPARE MEALS 16.4% 3.7% 5.7% 10.3%HOUSEHOLDWORK
1.8% 14.8% 5.7% 6.0%
GARDENING/YARDWORK 3.6% 2.9% 2.6%
CONTRIBUTE TOHOUSEHOLDEXPENSES
9.1% 29.6% 8.6% 13.7%
LOVE/EMOTIONALSUPPORT 7.4% 1.7%
SEVERAL WAYS 23.6% 18.5% 48.6% 29.9%
Q32X HOW DOYOU CONTRIBUTETO THEHOUSEHOLD?
NOTHING/NOCONTRIBUTION 16.4% 7.4% 11.4% 12.8%
Total
N
100.0%
55
100.0%
27
100.0%
35
100.0%
117X2=31.9, df=14, p=.004
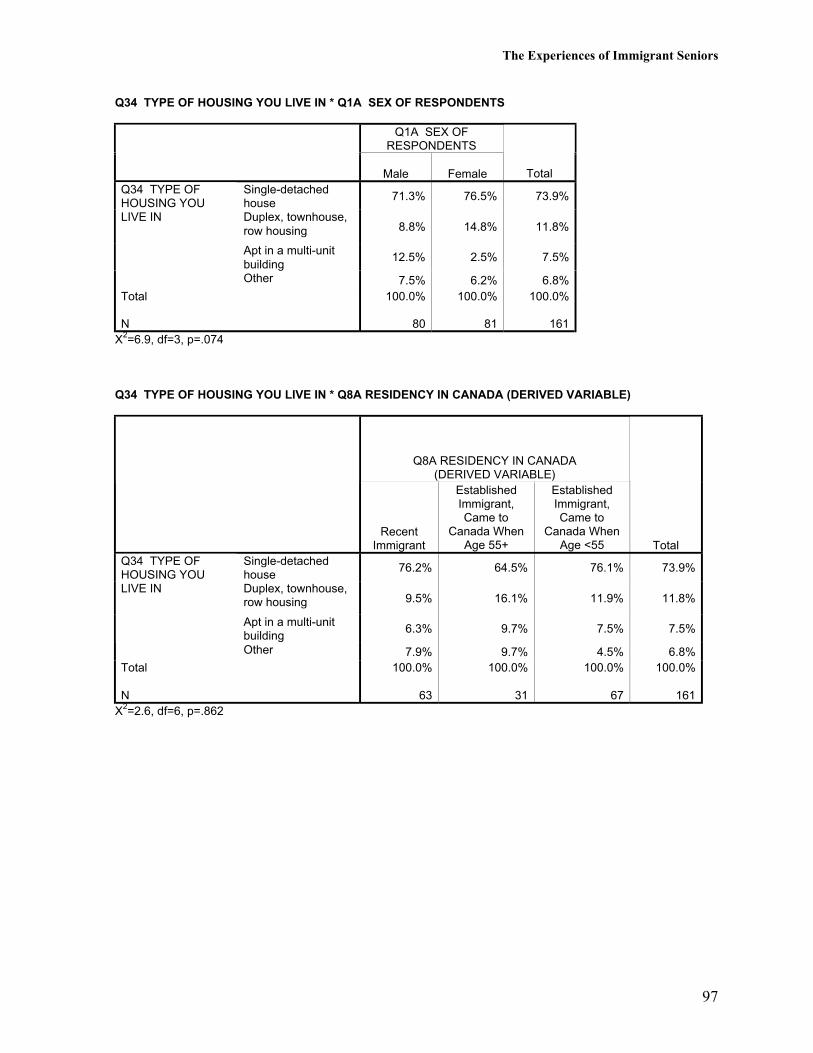
The Experiences of Immigrant Seniors
97
Q34 TYPE OF HOUSING YOU LIVE IN * Q1A SEX OF RESPONDENTS
Q1A SEX OFRESPONDENTS
Male Female TotalSingle-detachedhouse
71.3% 76.5% 73.9%
Duplex, townhouse,row housing 8.8% 14.8% 11.8%
Apt in a multi-unitbuilding
12.5% 2.5% 7.5%
Q34 TYPE OFHOUSING YOULIVE IN
Other 7.5% 6.2% 6.8%Total
N
100.0%
80
100.0%
81
100.0%
161X2=6.9, df=3, p=.074
Q34 TYPE OF HOUSING YOU LIVE IN * Q8A RESIDENCY IN CANADA (DERIVED VARIABLE)
Q8A RESIDENCY IN CANADA(DERIVED VARIABLE)
RecentImmigrant
EstablishedImmigrant,Came to
Canada WhenAge 55+
EstablishedImmigrant,Came to
Canada WhenAge <55 Total
Single-detachedhouse
76.2% 64.5% 76.1% 73.9%
Duplex, townhouse,row housing 9.5% 16.1% 11.9% 11.8%
Apt in a multi-unitbuilding
6.3% 9.7% 7.5% 7.5%
Q34 TYPE OFHOUSING YOULIVE IN
Other 7.9% 9.7% 4.5% 6.8%Total
N
100.0%
63
100.0%
31
100.0%
67
100.0%
161X2=2.6, df=6, p=.862
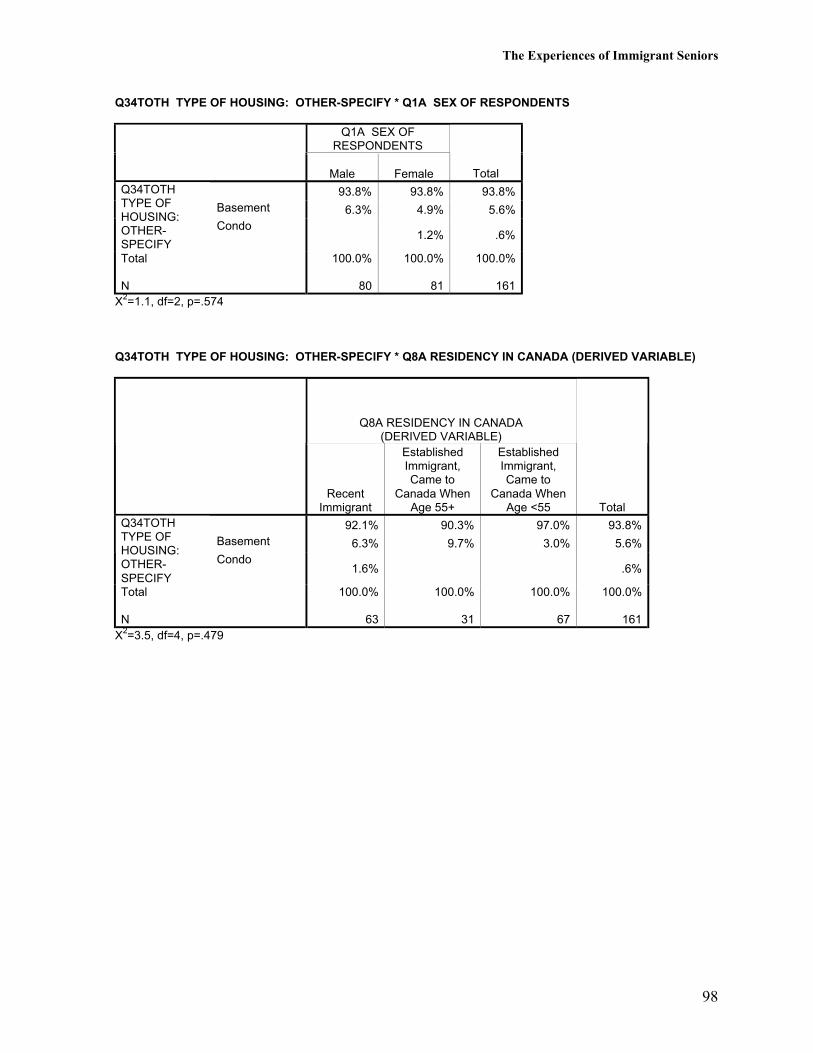
The Experiences of Immigrant Seniors
98
Q34TOTH TYPE OF HOUSING: OTHER-SPECIFY * Q1A SEX OF RESPONDENTS
Q1A SEX OFRESPONDENTS
Male Female Total
93.8% 93.8% 93.8%Basement 6.3% 4.9% 5.6%
Q34TOTHTYPE OFHOUSING:OTHER-SPECIFY
Condo1.2% .6%
Total
N
100.0%
80
100.0%
81
100.0%
161X2=1.1, df=2, p=.574
Q34TOTH TYPE OF HOUSING: OTHER-SPECIFY * Q8A RESIDENCY IN CANADA (DERIVED VARIABLE)
Q8A RESIDENCY IN CANADA(DERIVED VARIABLE)
RecentImmigrant
EstablishedImmigrant,Came to
Canada WhenAge 55+
EstablishedImmigrant,Came to
Canada WhenAge <55 Total
92.1% 90.3% 97.0% 93.8%Basement 6.3% 9.7% 3.0% 5.6%
Q34TOTHTYPE OFHOUSING:OTHER-SPECIFY
Condo1.6% .6%
Total
N
100.0%
63
100.0%
31
100.0%
67
100.0%
161X2=3.5, df=4, p=.479
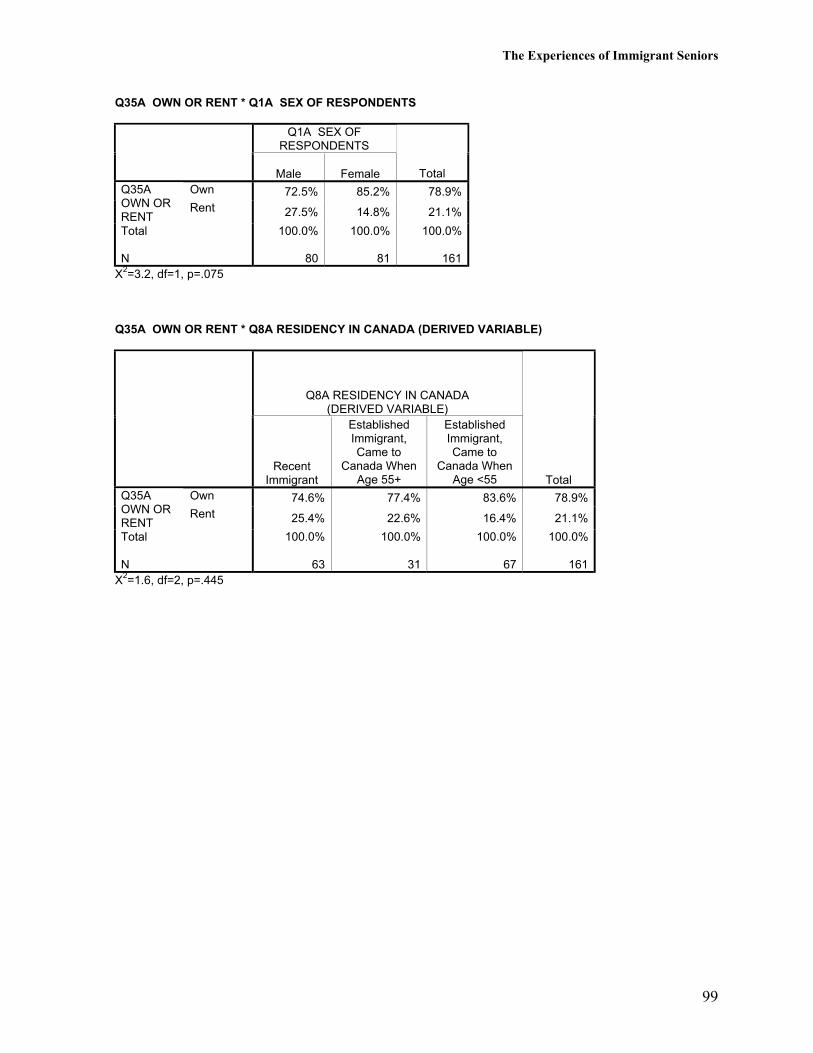
The Experiences of Immigrant Seniors
99
Q35A OWN OR RENT * Q1A SEX OF RESPONDENTS
Q1A SEX OFRESPONDENTS
Male Female TotalOwn 72.5% 85.2% 78.9%Q35A
OWN ORRENT
Rent 27.5% 14.8% 21.1%
Total
N
100.0%
80
100.0%
81
100.0%
161X2=3.2, df=1, p=.075
Q35A OWN OR RENT * Q8A RESIDENCY IN CANADA (DERIVED VARIABLE)
Q8A RESIDENCY IN CANADA(DERIVED VARIABLE)
RecentImmigrant
EstablishedImmigrant,Came to
Canada WhenAge 55+
EstablishedImmigrant,Came to
Canada WhenAge <55 Total
Own 74.6% 77.4% 83.6% 78.9%Q35AOWN ORRENT
Rent 25.4% 22.6% 16.4% 21.1%
Total
N
100.0%
63
100.0%
31
100.0%
67
100.0%
161X2=1.6, df=2, p=.445
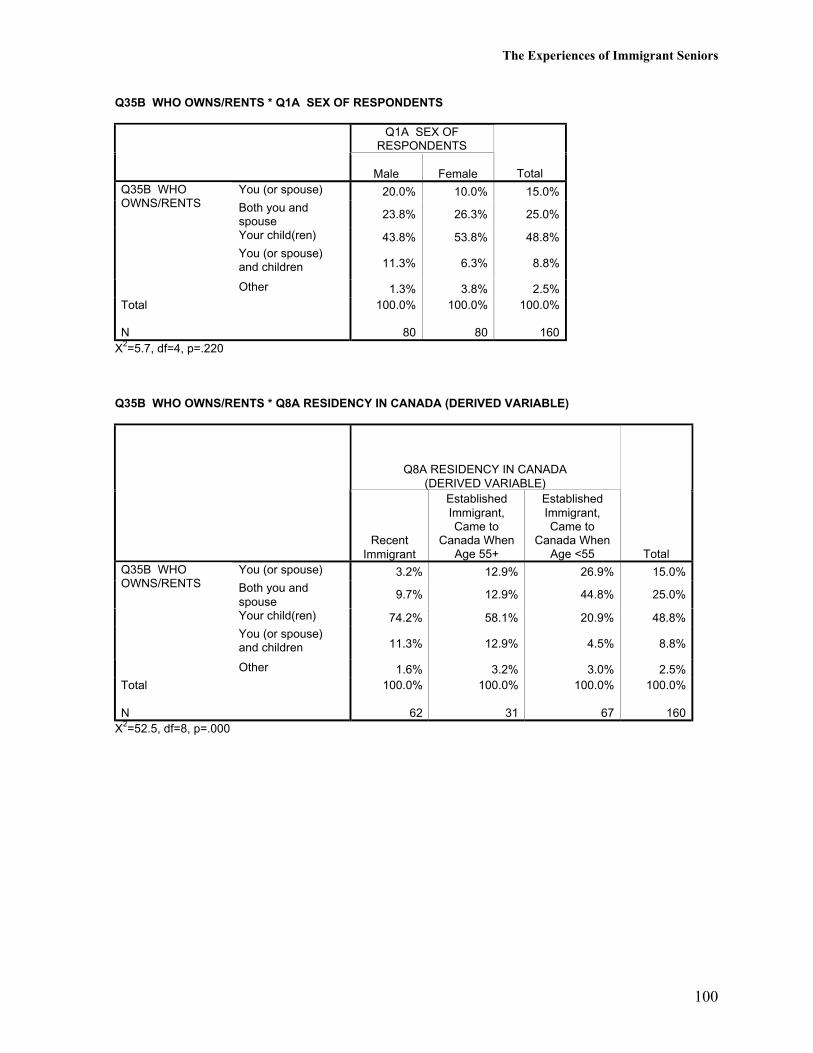
The Experiences of Immigrant Seniors
100
Q35B WHO OWNS/RENTS * Q1A SEX OF RESPONDENTS
Q1A SEX OFRESPONDENTS
Male Female TotalYou (or spouse) 20.0% 10.0% 15.0%Both you andspouse
23.8% 26.3% 25.0%
Your child(ren) 43.8% 53.8% 48.8%You (or spouse)and children 11.3% 6.3% 8.8%
Q35B WHOOWNS/RENTS
Other 1.3% 3.8% 2.5%Total
N
100.0%
80
100.0%
80
100.0%
160X2=5.7, df=4, p=.220
Q35B WHO OWNS/RENTS * Q8A RESIDENCY IN CANADA (DERIVED VARIABLE)
Q8A RESIDENCY IN CANADA(DERIVED VARIABLE)
RecentImmigrant
EstablishedImmigrant,Came to
Canada WhenAge 55+
EstablishedImmigrant,Came to
Canada WhenAge <55 Total
You (or spouse) 3.2% 12.9% 26.9% 15.0%Both you andspouse
9.7% 12.9% 44.8% 25.0%
Your child(ren) 74.2% 58.1% 20.9% 48.8%You (or spouse)and children 11.3% 12.9% 4.5% 8.8%
Q35B WHOOWNS/RENTS
Other 1.6% 3.2% 3.0% 2.5%Total
N
100.0%
62
100.0%
31
100.0%
67
100.0%
160X2=52.5, df=8, p=.000
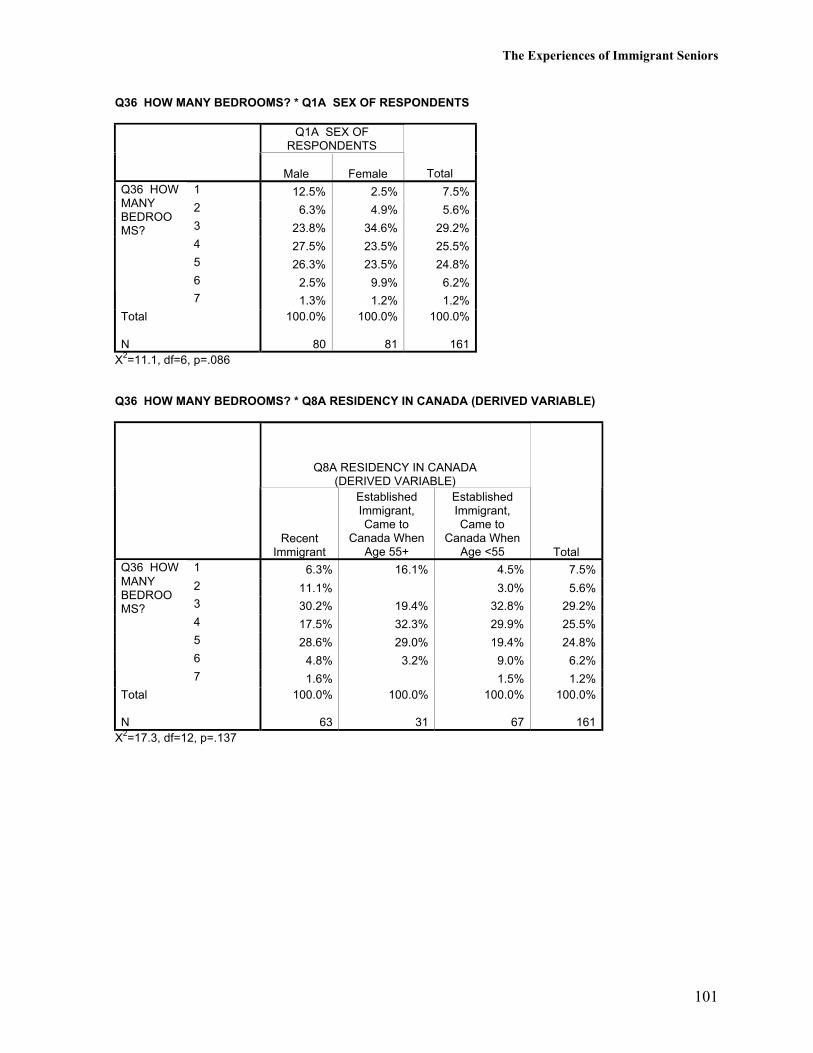
The Experiences of Immigrant Seniors
101
Q36 HOW MANY BEDROOMS? * Q1A SEX OF RESPONDENTS
Q1A SEX OFRESPONDENTS
Male Female Total1 12.5% 2.5% 7.5%2 6.3% 4.9% 5.6%3 23.8% 34.6% 29.2%4 27.5% 23.5% 25.5%5 26.3% 23.5% 24.8%6 2.5% 9.9% 6.2%
Q36 HOWMANYBEDROOMS?
7 1.3% 1.2% 1.2%Total
N
100.0%
80
100.0%
81
100.0%
161X2=11.1, df=6, p=.086
Q36 HOW MANY BEDROOMS? * Q8A RESIDENCY IN CANADA (DERIVED VARIABLE)
Q8A RESIDENCY IN CANADA(DERIVED VARIABLE)
RecentImmigrant
EstablishedImmigrant,Came to
Canada WhenAge 55+
EstablishedImmigrant,Came to
Canada WhenAge <55 Total
1 6.3% 16.1% 4.5% 7.5%2 11.1% 3.0% 5.6%3 30.2% 19.4% 32.8% 29.2%4 17.5% 32.3% 29.9% 25.5%5 28.6% 29.0% 19.4% 24.8%6 4.8% 3.2% 9.0% 6.2%
Q36 HOWMANYBEDROOMS?
7 1.6% 1.5% 1.2%Total
N
100.0%
63
100.0%
31
100.0%
67
100.0%
161X2=17.3, df=12, p=.137
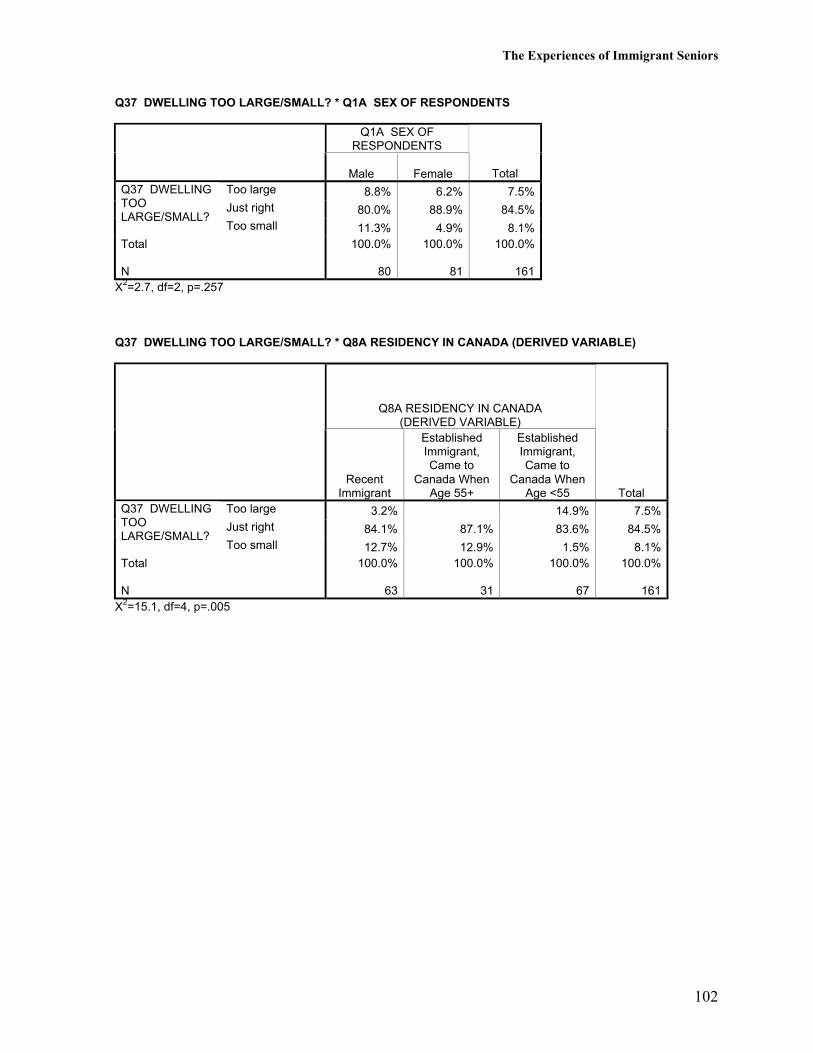
The Experiences of Immigrant Seniors
102
Q37 DWELLING TOO LARGE/SMALL? * Q1A SEX OF RESPONDENTS
Q1A SEX OFRESPONDENTS
Male Female TotalToo large 8.8% 6.2% 7.5%Just right 80.0% 88.9% 84.5%
Q37 DWELLINGTOOLARGE/SMALL?
Too small 11.3% 4.9% 8.1%Total
N
100.0%
80
100.0%
81
100.0%
161X2=2.7, df=2, p=.257
Q37 DWELLING TOO LARGE/SMALL? * Q8A RESIDENCY IN CANADA (DERIVED VARIABLE)
Q8A RESIDENCY IN CANADA(DERIVED VARIABLE)
RecentImmigrant
EstablishedImmigrant,Came to
Canada WhenAge 55+
EstablishedImmigrant,Came to
Canada WhenAge <55 Total
Too large 3.2% 14.9% 7.5%Just right 84.1% 87.1% 83.6% 84.5%
Q37 DWELLINGTOOLARGE/SMALL?
Too small 12.7% 12.9% 1.5% 8.1%Total
N
100.0%
63
100.0%
31
100.0%
67
100.0%
161X2=15.1, df=4, p=.005
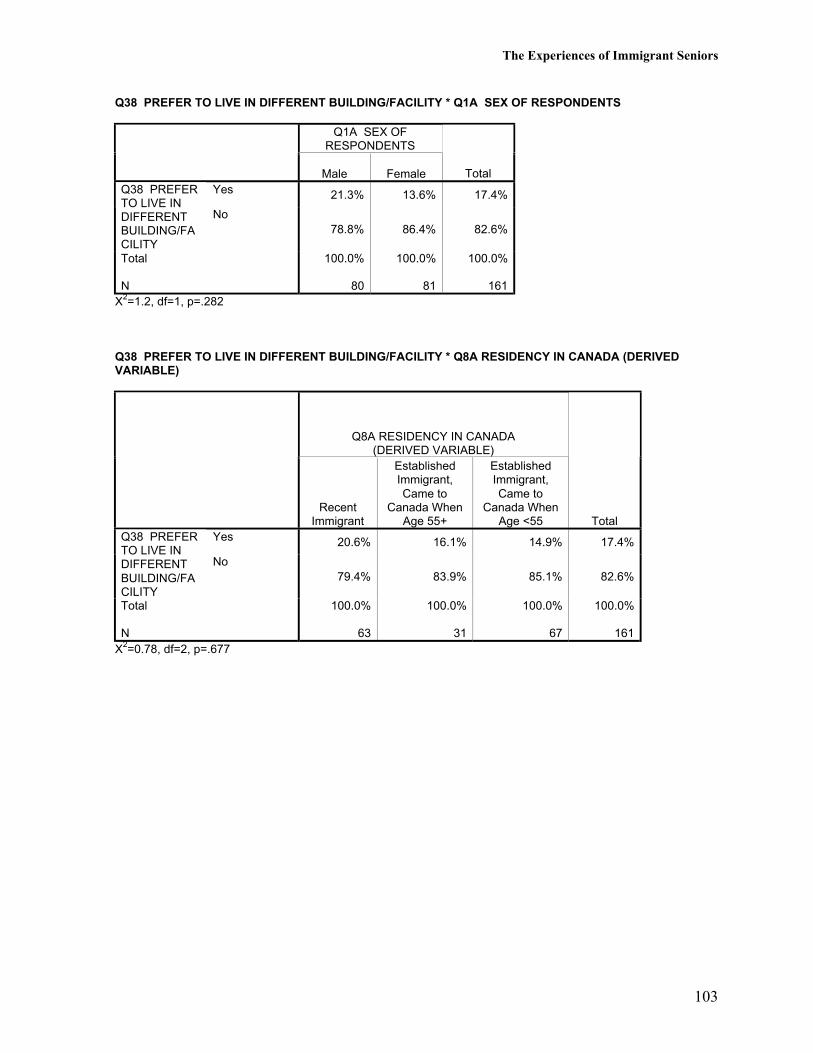
The Experiences of Immigrant Seniors
103
Q38 PREFER TO LIVE IN DIFFERENT BUILDING/FACILITY * Q1A SEX OF RESPONDENTS
Q1A SEX OFRESPONDENTS
Male Female TotalYes 21.3% 13.6% 17.4%Q38 PREFER
TO LIVE INDIFFERENTBUILDING/FACILITY
No78.8% 86.4% 82.6%
Total
N
100.0%
80
100.0%
81
100.0%
161X2=1.2, df=1, p=.282
Q38 PREFER TO LIVE IN DIFFERENT BUILDING/FACILITY * Q8A RESIDENCY IN CANADA (DERIVEDVARIABLE)
Q8A RESIDENCY IN CANADA(DERIVED VARIABLE)
RecentImmigrant
EstablishedImmigrant,Came to
Canada WhenAge 55+
EstablishedImmigrant,Came to
Canada WhenAge <55 Total
Yes 20.6% 16.1% 14.9% 17.4%Q38 PREFERTO LIVE INDIFFERENTBUILDING/FACILITY
No79.4% 83.9% 85.1% 82.6%
Total
N
100.0%
63
100.0%
31
100.0%
67
100.0%
161X2=0.78, df=2, p=.677
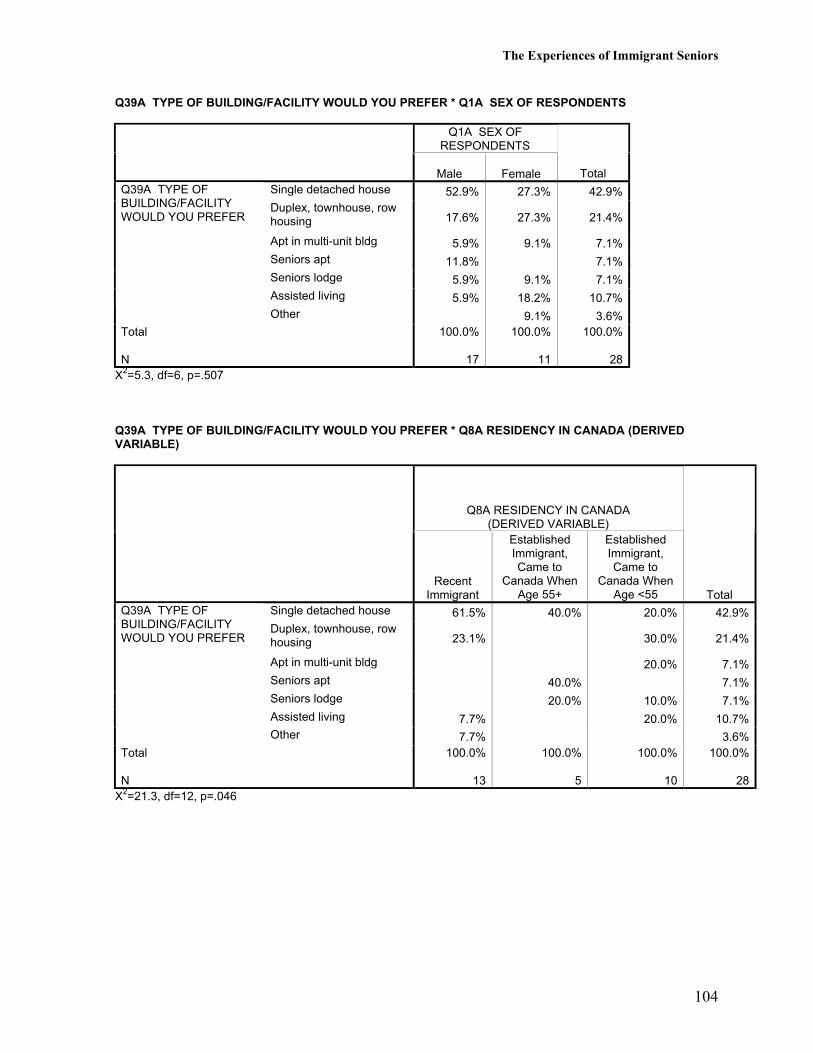
The Experiences of Immigrant Seniors
104
Q39A TYPE OF BUILDING/FACILITY WOULD YOU PREFER * Q1A SEX OF RESPONDENTS
Q1A SEX OFRESPONDENTS
Male Female TotalSingle detached house 52.9% 27.3% 42.9%Duplex, townhouse, rowhousing 17.6% 27.3% 21.4%
Apt in multi-unit bldg 5.9% 9.1% 7.1%Seniors apt 11.8% 7.1%Seniors lodge 5.9% 9.1% 7.1%Assisted living 5.9% 18.2% 10.7%
Q39A TYPE OFBUILDING/FACILITYWOULD YOU PREFER
Other 9.1% 3.6%Total
N
100.0%
17
100.0%
11
100.0%
28X2=5.3, df=6, p=.507
Q39A TYPE OF BUILDING/FACILITY WOULD YOU PREFER * Q8A RESIDENCY IN CANADA (DERIVEDVARIABLE)
Q8A RESIDENCY IN CANADA(DERIVED VARIABLE)
RecentImmigrant
EstablishedImmigrant,Came to
Canada WhenAge 55+
EstablishedImmigrant,Came to
Canada WhenAge <55 Total
Single detached house 61.5% 40.0% 20.0% 42.9%Duplex, townhouse, rowhousing 23.1% 30.0% 21.4%
Apt in multi-unit bldg 20.0% 7.1%Seniors apt 40.0% 7.1%Seniors lodge 20.0% 10.0% 7.1%Assisted living 7.7% 20.0% 10.7%
Q39A TYPE OFBUILDING/FACILITYWOULD YOU PREFER
Other 7.7% 3.6%Total
N
100.0%
13
100.0%
5
100.0%
10
100.0%
28X2=21.3, df=12, p=.046
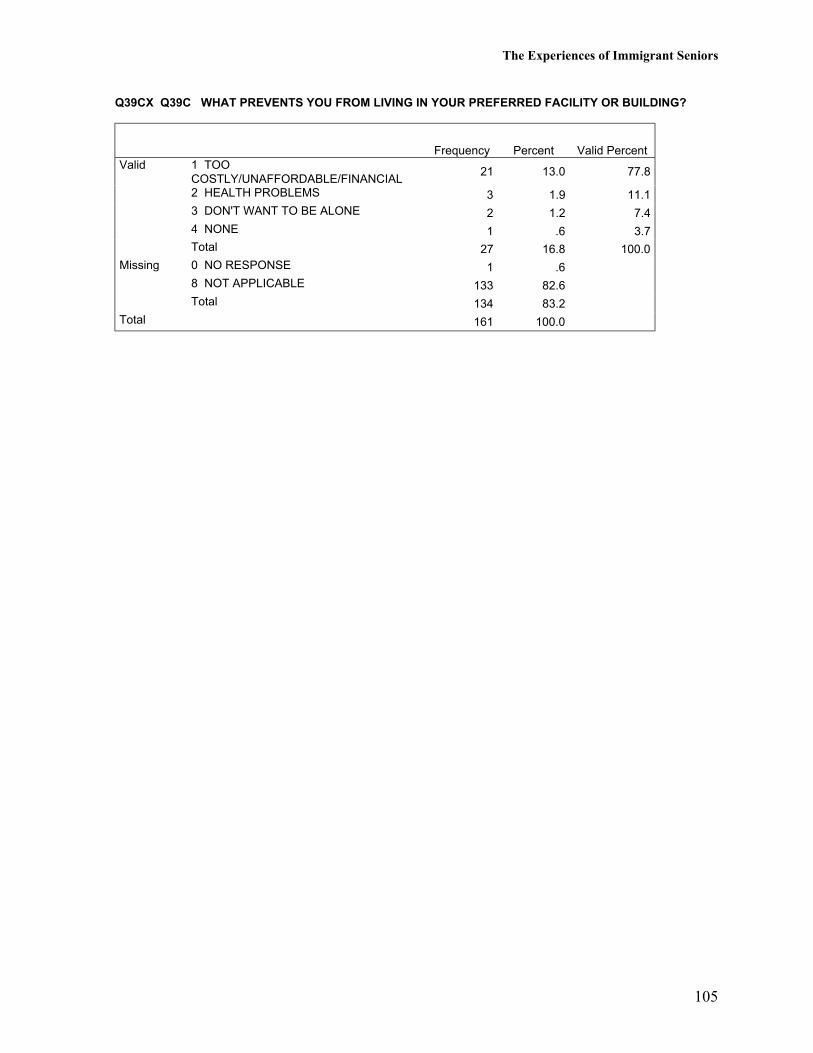
The Experiences of Immigrant Seniors
105
Q39CX Q39C WHAT PREVENTS YOU FROM LIVING IN YOUR PREFERRED FACILITY OR BUILDING?
Frequency Percent Valid PercentValid 1 TOO
COSTLY/UNAFFORDABLE/FINANCIAL21 13.0 77.8
2 HEALTH PROBLEMS 3 1.9 11.13 DON'T WANT TO BE ALONE 2 1.2 7.44 NONE 1 .6 3.7Total 27 16.8 100.0
Missing 0 NO RESPONSE 1 .68 NOT APPLICABLE 133 82.6Total 134 83.2
Total 161 100.0
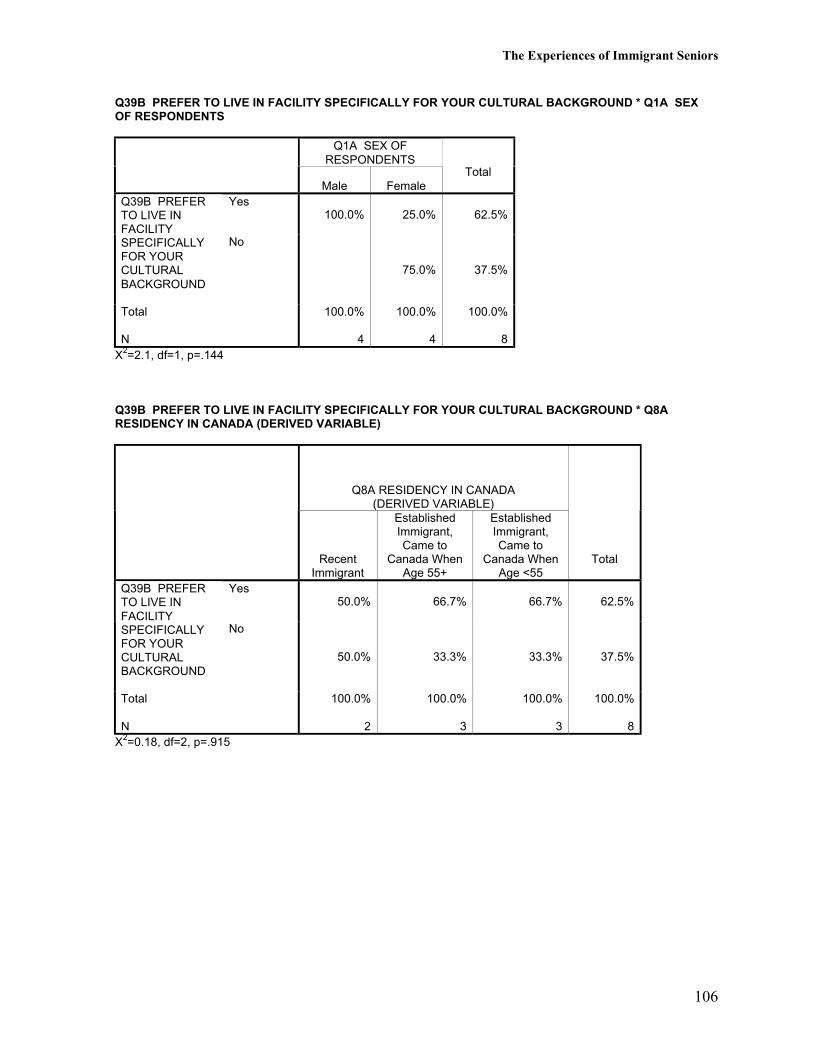
The Experiences of Immigrant Seniors
106
Q39B PREFER TO LIVE IN FACILITY SPECIFICALLY FOR YOUR CULTURAL BACKGROUND * Q1A SEXOF RESPONDENTS
Q1A SEX OFRESPONDENTS
Male FemaleTotal
Yes100.0% 25.0% 62.5%
Q39B PREFERTO LIVE INFACILITYSPECIFICALLYFOR YOURCULTURALBACKGROUND
No
75.0% 37.5%
Total
N
100.0%
4
100.0%
4
100.0%
8X2=2.1, df=1, p=.144
Q39B PREFER TO LIVE IN FACILITY SPECIFICALLY FOR YOUR CULTURAL BACKGROUND * Q8ARESIDENCY IN CANADA (DERIVED VARIABLE)
Q8A RESIDENCY IN CANADA(DERIVED VARIABLE)
RecentImmigrant
EstablishedImmigrant,Came to
Canada WhenAge 55+
EstablishedImmigrant,Came to
Canada WhenAge <55
Total
Yes50.0% 66.7% 66.7% 62.5%
Q39B PREFERTO LIVE INFACILITYSPECIFICALLYFOR YOURCULTURALBACKGROUND
No
50.0% 33.3% 33.3% 37.5%
Total
N
100.0%
2
100.0%
3
100.0%
3
100.0%
8X2=0.18, df=2, p=.915
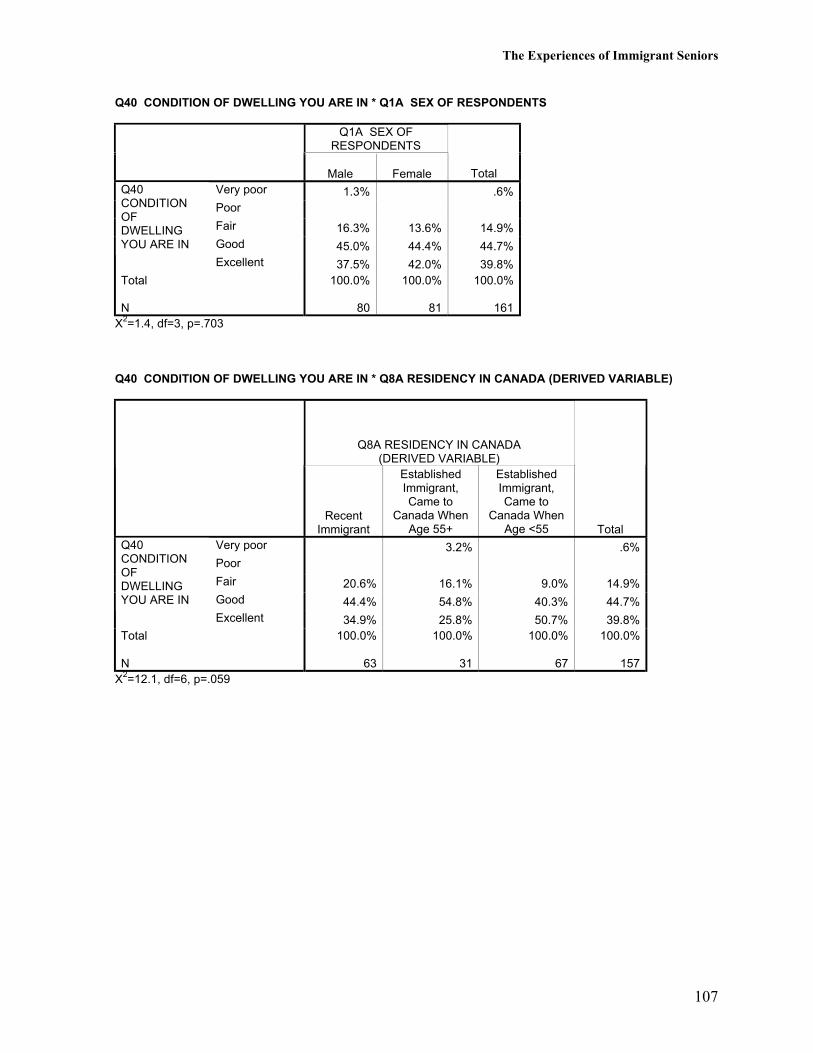
The Experiences of Immigrant Seniors
107
Q40 CONDITION OF DWELLING YOU ARE IN * Q1A SEX OF RESPONDENTS
Q1A SEX OFRESPONDENTS
Male Female TotalVery poor 1.3% .6%Poor
Fair 16.3% 13.6% 14.9%Good 45.0% 44.4% 44.7%
Q40CONDITIONOFDWELLINGYOU ARE IN
Excellent 37.5% 42.0% 39.8%Total
N
100.0%
80
100.0%
81
100.0%
161X2=1.4, df=3, p=.703
Q40 CONDITION OF DWELLING YOU ARE IN * Q8A RESIDENCY IN CANADA (DERIVED VARIABLE)
Q8A RESIDENCY IN CANADA(DERIVED VARIABLE)
RecentImmigrant
EstablishedImmigrant,Came to
Canada WhenAge 55+
EstablishedImmigrant,Came to
Canada WhenAge <55 Total
Very poor 3.2% .6%Poor
Fair 20.6% 16.1% 9.0% 14.9%Good 44.4% 54.8% 40.3% 44.7%
Q40CONDITIONOFDWELLINGYOU ARE IN
Excellent 34.9% 25.8% 50.7% 39.8%Total
N
100.0%
63
100.0%
31
100.0%
67
100.0%
157X2=12.1, df=6, p=.059
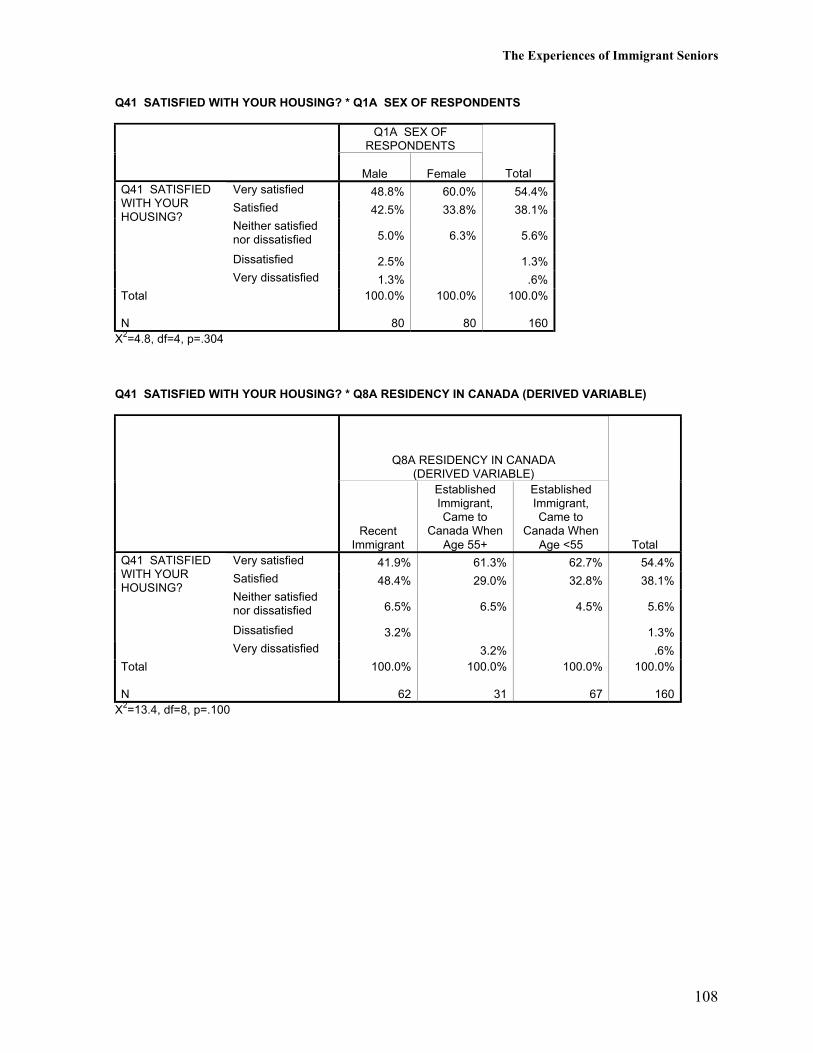
The Experiences of Immigrant Seniors
108
Q41 SATISFIED WITH YOUR HOUSING? * Q1A SEX OF RESPONDENTS
Q1A SEX OFRESPONDENTS
Male Female TotalVery satisfied 48.8% 60.0% 54.4%Satisfied 42.5% 33.8% 38.1%Neither satisfiednor dissatisfied 5.0% 6.3% 5.6%
Dissatisfied 2.5% 1.3%
Q41 SATISFIEDWITH YOURHOUSING?
Very dissatisfied 1.3% .6%Total
N
100.0%
80
100.0%
80
100.0%
160X2=4.8, df=4, p=.304
Q41 SATISFIED WITH YOUR HOUSING? * Q8A RESIDENCY IN CANADA (DERIVED VARIABLE)
Q8A RESIDENCY IN CANADA(DERIVED VARIABLE)
RecentImmigrant
EstablishedImmigrant,Came to
Canada WhenAge 55+
EstablishedImmigrant,Came to
Canada WhenAge <55 Total
Very satisfied 41.9% 61.3% 62.7% 54.4%Satisfied 48.4% 29.0% 32.8% 38.1%Neither satisfiednor dissatisfied 6.5% 6.5% 4.5% 5.6%
Dissatisfied 3.2% 1.3%
Q41 SATISFIEDWITH YOURHOUSING?
Very dissatisfied 3.2% .6%Total
N
100.0%
62
100.0%
31
100.0%
67
100.0%
160X2=13.4, df=8, p=.100
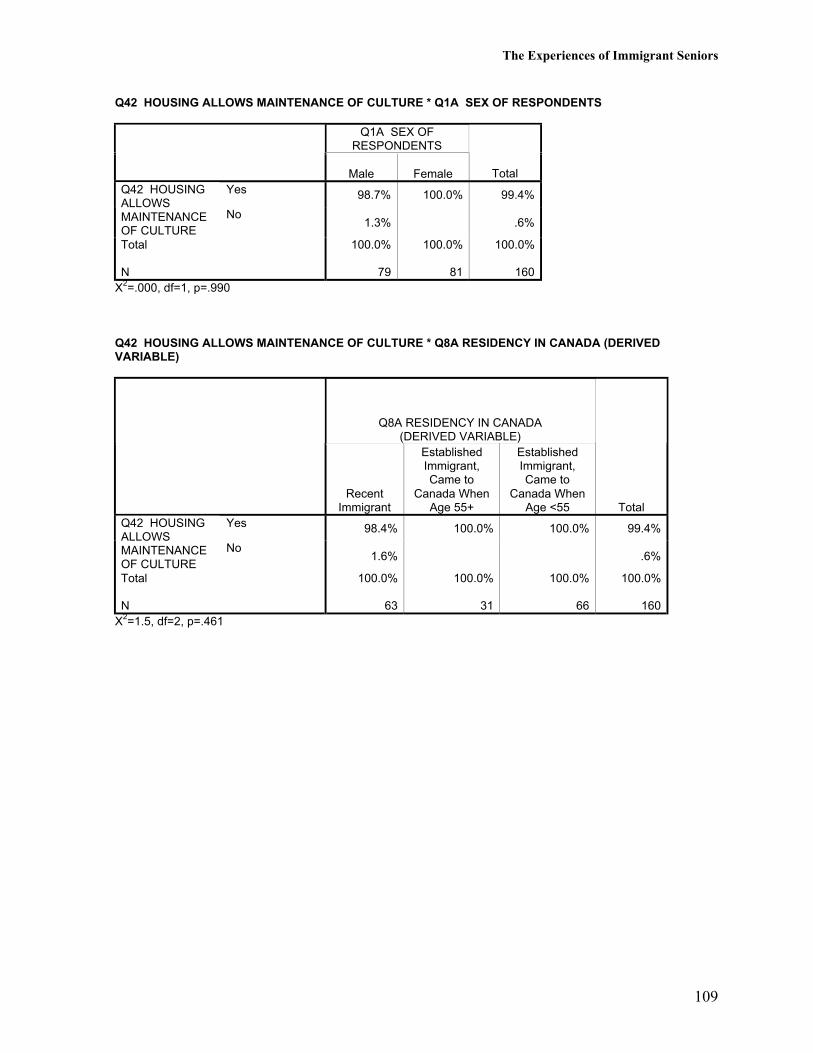
The Experiences of Immigrant Seniors
109
Q42 HOUSING ALLOWS MAINTENANCE OF CULTURE * Q1A SEX OF RESPONDENTS
Q1A SEX OFRESPONDENTS
Male Female TotalYes 98.7% 100.0% 99.4%Q42 HOUSING
ALLOWSMAINTENANCEOF CULTURE
No1.3% .6%
Total
N
100.0%
79
100.0%
81
100.0%
160X2=.000, df=1, p=.990
Q42 HOUSING ALLOWS MAINTENANCE OF CULTURE * Q8A RESIDENCY IN CANADA (DERIVEDVARIABLE)
Q8A RESIDENCY IN CANADA(DERIVED VARIABLE)
RecentImmigrant
EstablishedImmigrant,Came to
Canada WhenAge 55+
EstablishedImmigrant,Came to
Canada WhenAge <55 Total
Yes 98.4% 100.0% 100.0% 99.4%Q42 HOUSINGALLOWSMAINTENANCEOF CULTURE
No1.6% .6%
Total
N
100.0%
63
100.0%
31
100.0%
66
100.0%
160X2=1.5, df=2, p=.461

The Experiences of Immigrant Seniors
110
The Experiences of Immigrant Seniors
111
Neighbourhood Safety and Satisfaction
In summer, 79% of our respondents went out daily and another 12% went out several times aweek. In winter, respondents went out less often: 37% went out daily, 25% several times aweek, and 22% weekly. Men went out significantly more often than women, both in summerand in winter. Note that a small percentage (3%) of recent immigrants “almost never” wentout in summer, and about 6% of recent and established immigrants who came to Canada at anolder age “almost never” went out in winter.
The majority of our respondents (82%) said that they went out alone in the neighborhood. Alower percentage of women (68%) than men (96%) went out alone. A lower percentage ofestablished immigrants who came to Canada at an older age went out alone (55%) than didrecent immigrants (84%) or established immigrants who came to Canada at a younger age(93%).
The great majority of the 132 respondents who went out alone in the neighborhood reportedthat they felt very safe (91%) or somewhat safe (7%) walking alone in the neighborhood.Responses did not vary by sex or residency in Canada. Respondents were asked why they feltsafe or unsafe walking by themselves in the neighborhood. The most common positiveresponses given by 125 respondents included having good or friendly neighbors (48%),having experienced no problems or no crime (22%), and safe neighborhood, city, or country(18%). Some examples of these responses are, “All the people in this crescent live like a bigfamily and they all look after each other”, “I’ve never heard of any unsafe incidents here”,and “This is a peaceful country so I feel safe”. The three negative responses relate to ethnicityor rudeness, and physical condition of neighborhood.
The majority of respondents also said they felt very safe (90%) or somewhat safe (8%) athome alone. Again, responses did not vary by sex or residency in Canada. Respondents wereasked why they felt safe or unsafe alone at home. Eight of the 149 respondents replied theywere never alone at home. The most common positive responses given by 145 respondentsinclude good neighbors, laws, property, rights, or emergency services (27%), safeneighborhood, city, or country (26%), and having experienced no problems or crimes (16%).Three of the four negative responses relate to age, health, or language problems. Forexample, one respondent said, “In case something happens I don’t know the language.”
In general, our respondents were satisfied with their neighborhood, with 72% reporting verysatisfied and 27% satisfied. Responses did not vary by sex or residency in Canada.
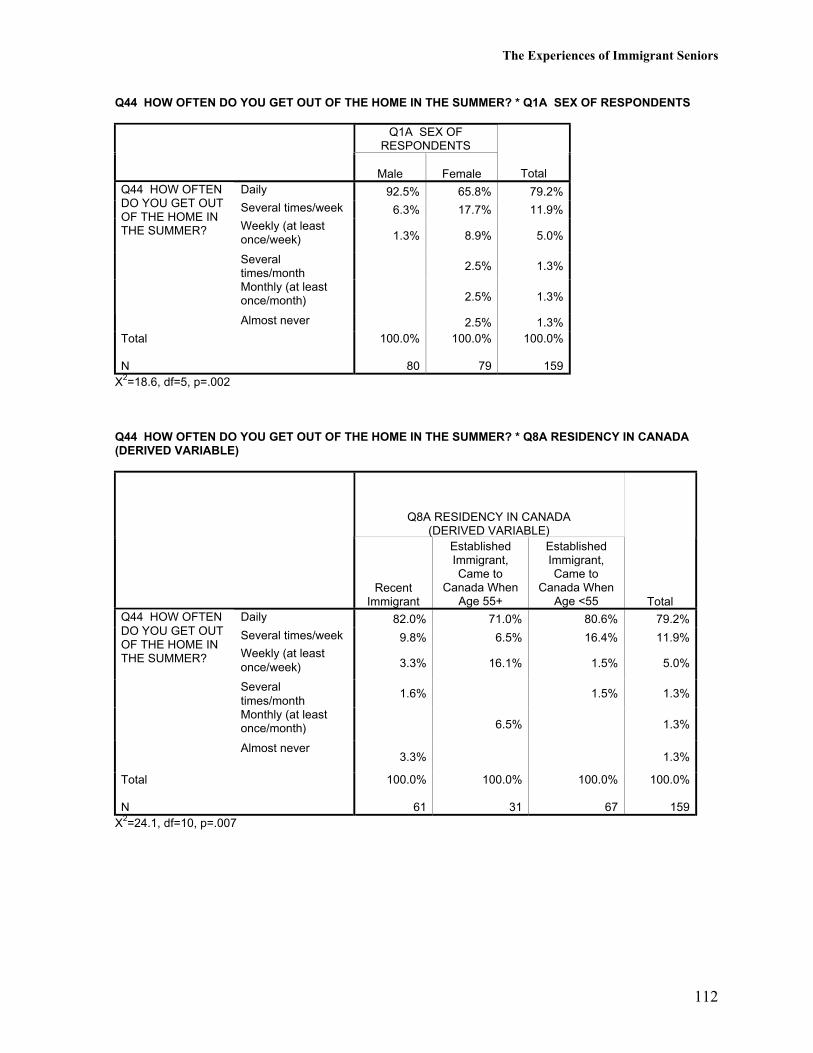
The Experiences of Immigrant Seniors
112
Q44 HOW OFTEN DO YOU GET OUT OF THE HOME IN THE SUMMER? * Q1A SEX OF RESPONDENTS
Q1A SEX OFRESPONDENTS
Male Female TotalDaily 92.5% 65.8% 79.2%Several times/week 6.3% 17.7% 11.9%Weekly (at leastonce/week) 1.3% 8.9% 5.0%
Severaltimes/month
2.5% 1.3%
Monthly (at leastonce/month) 2.5% 1.3%
Q44 HOW OFTENDO YOU GET OUTOF THE HOME INTHE SUMMER?
Almost never 2.5% 1.3%Total
N
100.0%
80
100.0%
79
100.0%
159X2=18.6, df=5, p=.002
Q44 HOW OFTEN DO YOU GET OUT OF THE HOME IN THE SUMMER? * Q8A RESIDENCY IN CANADA(DERIVED VARIABLE)
Q8A RESIDENCY IN CANADA(DERIVED VARIABLE)
RecentImmigrant
EstablishedImmigrant,Came to
Canada WhenAge 55+
EstablishedImmigrant,Came to
Canada WhenAge <55 Total
Daily 82.0% 71.0% 80.6% 79.2%Several times/week 9.8% 6.5% 16.4% 11.9%Weekly (at leastonce/week) 3.3% 16.1% 1.5% 5.0%
Severaltimes/month
1.6% 1.5% 1.3%
Monthly (at leastonce/month) 6.5% 1.3%
Q44 HOW OFTENDO YOU GET OUTOF THE HOME INTHE SUMMER?
Almost never3.3% 1.3%
Total
N
100.0%
61
100.0%
31
100.0%
67
100.0%
159X2=24.1, df=10, p=.007
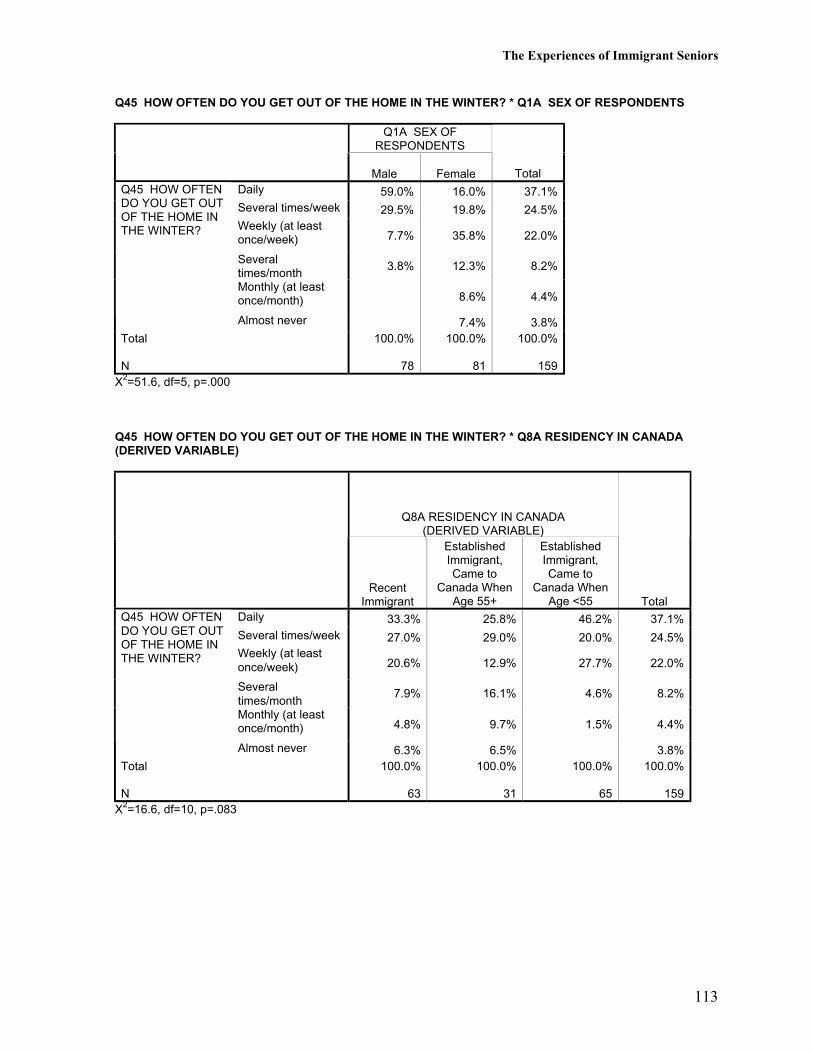
The Experiences of Immigrant Seniors
113
Q45 HOW OFTEN DO YOU GET OUT OF THE HOME IN THE WINTER? * Q1A SEX OF RESPONDENTS
Q1A SEX OFRESPONDENTS
Male Female TotalDaily 59.0% 16.0% 37.1%Several times/week 29.5% 19.8% 24.5%Weekly (at leastonce/week) 7.7% 35.8% 22.0%
Severaltimes/month
3.8% 12.3% 8.2%
Monthly (at leastonce/month) 8.6% 4.4%
Q45 HOW OFTENDO YOU GET OUTOF THE HOME INTHE WINTER?
Almost never 7.4% 3.8%Total
N
100.0%
78
100.0%
81
100.0%
159X2=51.6, df=5, p=.000
Q45 HOW OFTEN DO YOU GET OUT OF THE HOME IN THE WINTER? * Q8A RESIDENCY IN CANADA(DERIVED VARIABLE)
Q8A RESIDENCY IN CANADA(DERIVED VARIABLE)
RecentImmigrant
EstablishedImmigrant,Came to
Canada WhenAge 55+
EstablishedImmigrant,Came to
Canada WhenAge <55 Total
Daily 33.3% 25.8% 46.2% 37.1%Several times/week 27.0% 29.0% 20.0% 24.5%Weekly (at leastonce/week) 20.6% 12.9% 27.7% 22.0%
Severaltimes/month
7.9% 16.1% 4.6% 8.2%
Monthly (at leastonce/month) 4.8% 9.7% 1.5% 4.4%
Q45 HOW OFTENDO YOU GET OUTOF THE HOME INTHE WINTER?
Almost never 6.3% 6.5% 3.8%Total
N
100.0%
63
100.0%
31
100.0%
65
100.0%
159X2=16.6, df=10, p=.083
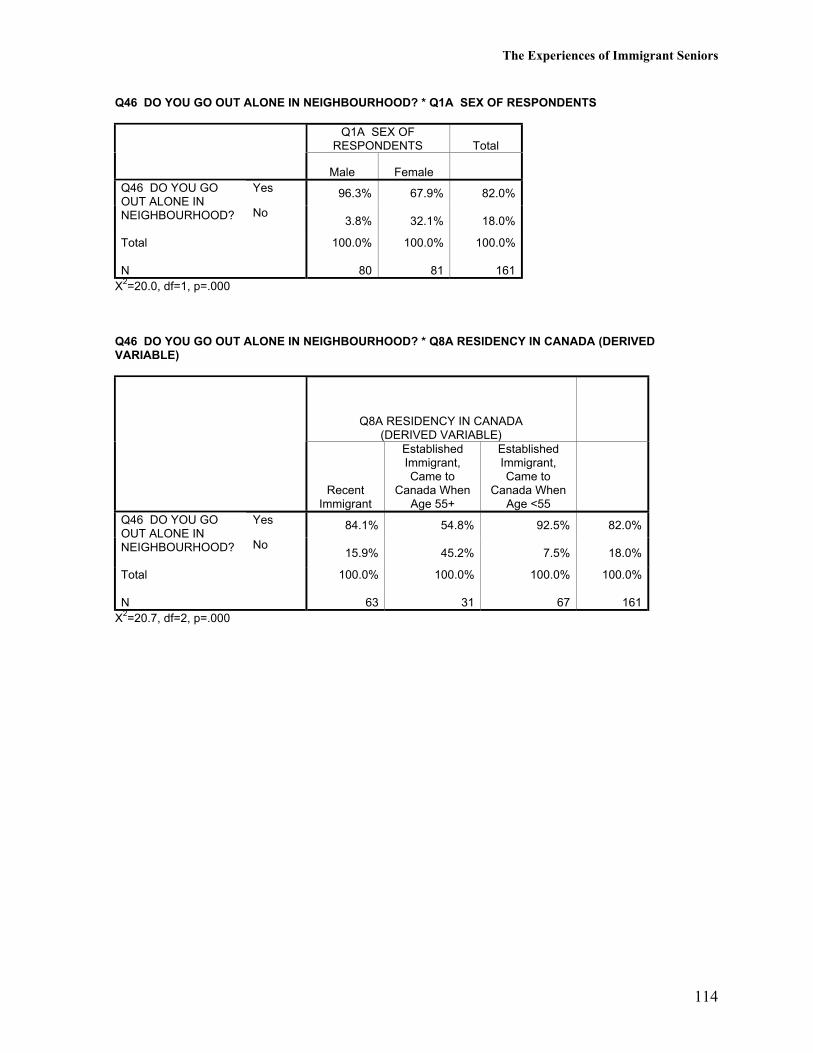
The Experiences of Immigrant Seniors
114
Q46 DO YOU GO OUT ALONE IN NEIGHBOURHOOD? * Q1A SEX OF RESPONDENTS
Q1A SEX OFRESPONDENTS Total
Male FemaleYes 96.3% 67.9% 82.0%Q46 DO YOU GO
OUT ALONE INNEIGHBOURHOOD? No
3.8% 32.1% 18.0%
Total
N
100.0%
80
100.0%
81
100.0%
161X2=20.0, df=1, p=.000
Q46 DO YOU GO OUT ALONE IN NEIGHBOURHOOD? * Q8A RESIDENCY IN CANADA (DERIVEDVARIABLE)
Q8A RESIDENCY IN CANADA(DERIVED VARIABLE)
RecentImmigrant
EstablishedImmigrant,Came to
Canada WhenAge 55+
EstablishedImmigrant,Came to
Canada WhenAge <55
Yes 84.1% 54.8% 92.5% 82.0%Q46 DO YOU GOOUT ALONE INNEIGHBOURHOOD? No
15.9% 45.2% 7.5% 18.0%
Total
N
100.0%
63
100.0%
31
100.0%
67
100.0%
161X2=20.7, df=2, p=.000
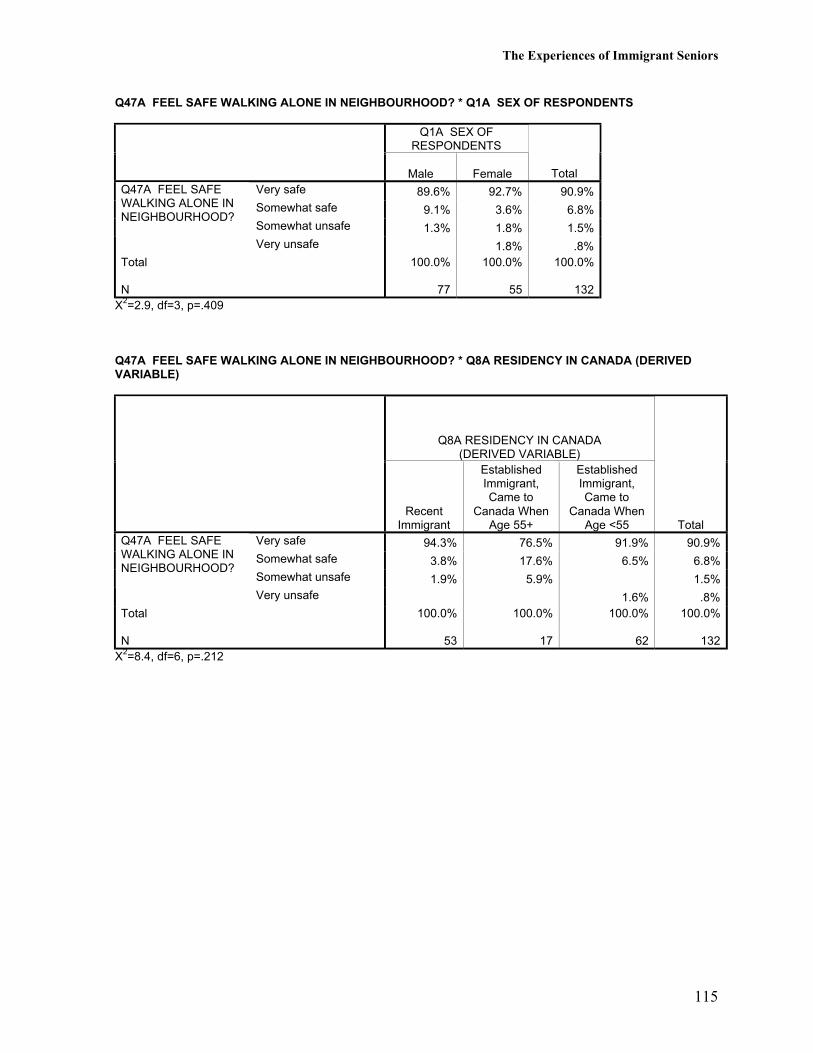
The Experiences of Immigrant Seniors
115
Q47A FEEL SAFE WALKING ALONE IN NEIGHBOURHOOD? * Q1A SEX OF RESPONDENTS
Q1A SEX OFRESPONDENTS
Male Female TotalVery safe 89.6% 92.7% 90.9%Somewhat safe 9.1% 3.6% 6.8%Somewhat unsafe 1.3% 1.8% 1.5%
Q47A FEEL SAFEWALKING ALONE INNEIGHBOURHOOD?
Very unsafe 1.8% .8%Total
N
100.0%
77
100.0%
55
100.0%
132X2=2.9, df=3, p=.409
Q47A FEEL SAFE WALKING ALONE IN NEIGHBOURHOOD? * Q8A RESIDENCY IN CANADA (DERIVEDVARIABLE)
Q8A RESIDENCY IN CANADA(DERIVED VARIABLE)
RecentImmigrant
EstablishedImmigrant,Came to
Canada WhenAge 55+
EstablishedImmigrant,Came to
Canada WhenAge <55 Total
Very safe 94.3% 76.5% 91.9% 90.9%Somewhat safe 3.8% 17.6% 6.5% 6.8%Somewhat unsafe 1.9% 5.9% 1.5%
Q47A FEEL SAFEWALKING ALONE INNEIGHBOURHOOD?
Very unsafe 1.6% .8%Total
N
100.0%
53
100.0%
17
100.0%
62
100.0%
132X2=8.4, df=6, p=.212
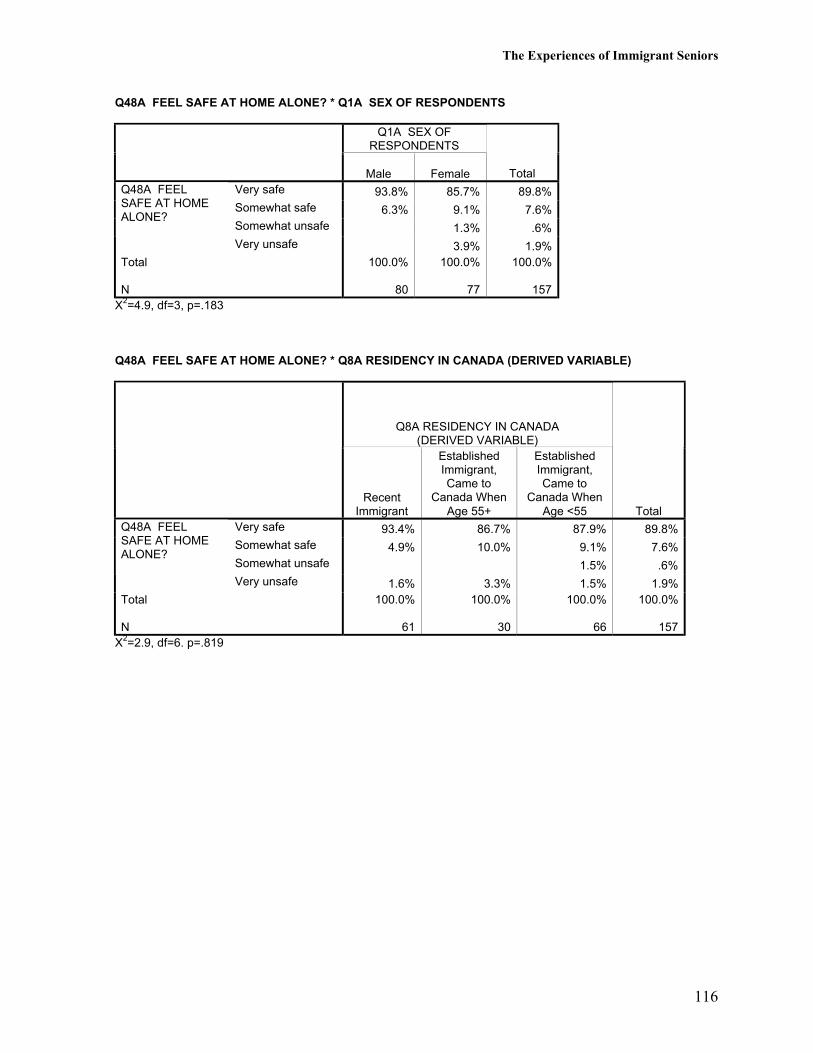
The Experiences of Immigrant Seniors
116
Q48A FEEL SAFE AT HOME ALONE? * Q1A SEX OF RESPONDENTS
Q1A SEX OFRESPONDENTS
Male Female TotalVery safe 93.8% 85.7% 89.8%Somewhat safe 6.3% 9.1% 7.6%Somewhat unsafe 1.3% .6%
Q48A FEELSAFE AT HOMEALONE?
Very unsafe 3.9% 1.9%Total
N
100.0%
80
100.0%
77
100.0%
157X2=4.9, df=3, p=.183
Q48A FEEL SAFE AT HOME ALONE? * Q8A RESIDENCY IN CANADA (DERIVED VARIABLE)
Q8A RESIDENCY IN CANADA(DERIVED VARIABLE)
RecentImmigrant
EstablishedImmigrant,Came to
Canada WhenAge 55+
EstablishedImmigrant,Came to
Canada WhenAge <55 Total
Very safe 93.4% 86.7% 87.9% 89.8%Somewhat safe 4.9% 10.0% 9.1% 7.6%Somewhat unsafe 1.5% .6%
Q48A FEELSAFE AT HOMEALONE?
Very unsafe 1.6% 3.3% 1.5% 1.9%Total
N
100.0%
61
100.0%
30
100.0%
66
100.0%
157X2=2.9, df=6. p=.819
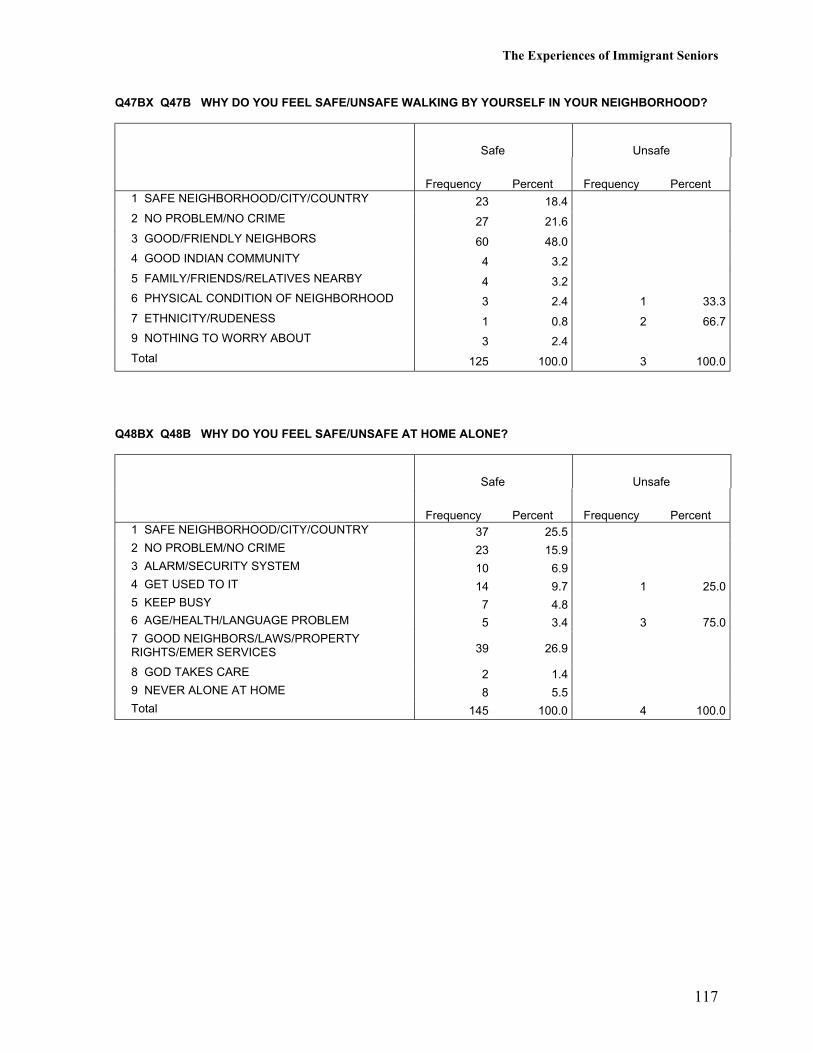
The Experiences of Immigrant Seniors
117
Q47BX Q47B WHY DO YOU FEEL SAFE/UNSAFE WALKING BY YOURSELF IN YOUR NEIGHBORHOOD?
Safe Unsafe
Frequency Percent Frequency Percent1 SAFE NEIGHBORHOOD/CITY/COUNTRY 23 18.4
2 NO PROBLEM/NO CRIME 27 21.6
3 GOOD/FRIENDLY NEIGHBORS 60 48.0
4 GOOD INDIAN COMMUNITY 4 3.2
5 FAMILY/FRIENDS/RELATIVES NEARBY 4 3.2
6 PHYSICAL CONDITION OF NEIGHBORHOOD 3 2.4 1 33.3
7 ETHNICITY/RUDENESS 1 0.8 2 66.7
9 NOTHING TO WORRY ABOUT 3 2.4
Total 125 100.0 3 100.0
Q48BX Q48B WHY DO YOU FEEL SAFE/UNSAFE AT HOME ALONE?
Safe Unsafe
Frequency Percent Frequency Percent1 SAFE NEIGHBORHOOD/CITY/COUNTRY 37 25.52 NO PROBLEM/NO CRIME 23 15.93 ALARM/SECURITY SYSTEM 10 6.94 GET USED TO IT 14 9.7 1 25.05 KEEP BUSY 7 4.86 AGE/HEALTH/LANGUAGE PROBLEM 5 3.4 3 75.07 GOOD NEIGHBORS/LAWS/PROPERTYRIGHTS/EMER SERVICES 39 26.9
8 GOD TAKES CARE 2 1.49 NEVER ALONE AT HOME 8 5.5Total 145 100.0 4 100.0
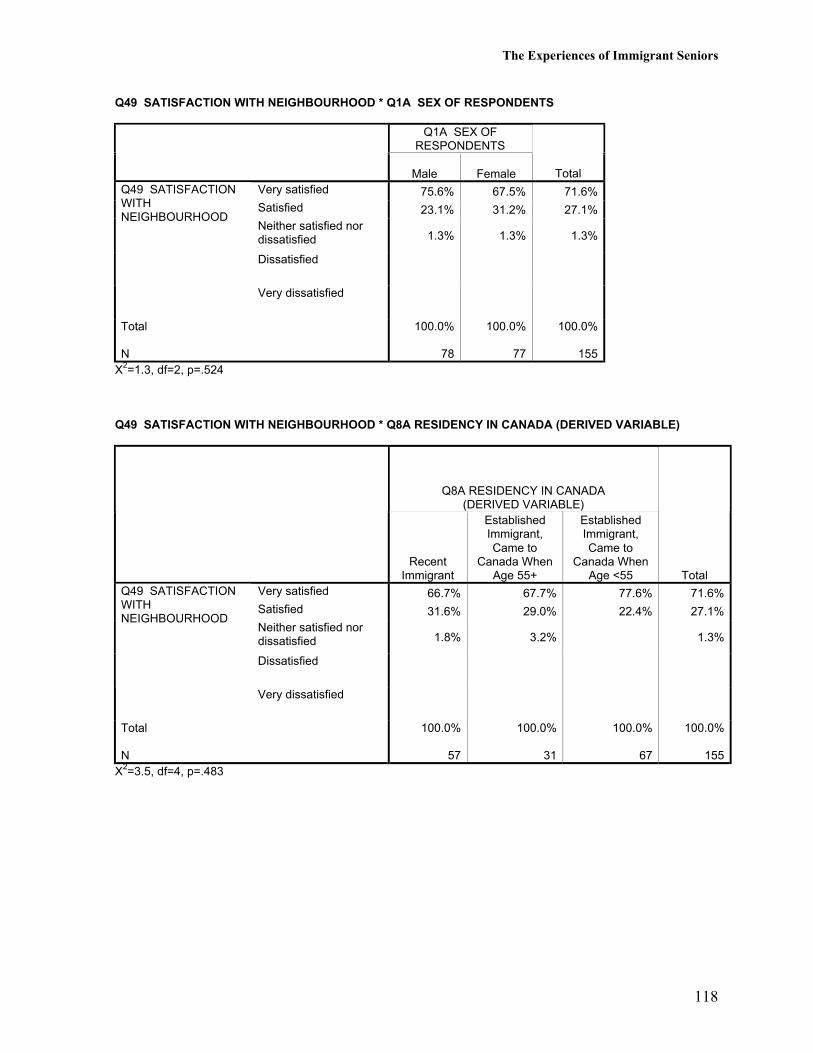
The Experiences of Immigrant Seniors
118
Q49 SATISFACTION WITH NEIGHBOURHOOD * Q1A SEX OF RESPONDENTS
Q1A SEX OFRESPONDENTS
Male Female TotalVery satisfied 75.6% 67.5% 71.6%Satisfied 23.1% 31.2% 27.1%Neither satisfied nordissatisfied 1.3% 1.3% 1.3%
Dissatisfied
Q49 SATISFACTIONWITHNEIGHBOURHOOD
Very dissatisfied
Total
N
100.0%
78
100.0%
77
100.0%
155X2=1.3, df=2, p=.524
Q49 SATISFACTION WITH NEIGHBOURHOOD * Q8A RESIDENCY IN CANADA (DERIVED VARIABLE)
Q8A RESIDENCY IN CANADA(DERIVED VARIABLE)
RecentImmigrant
EstablishedImmigrant,Came to
Canada WhenAge 55+
EstablishedImmigrant,Came to
Canada WhenAge <55 Total
Very satisfied 66.7% 67.7% 77.6% 71.6%Satisfied 31.6% 29.0% 22.4% 27.1%Neither satisfied nordissatisfied 1.8% 3.2% 1.3%
Dissatisfied
Q49 SATISFACTIONWITHNEIGHBOURHOOD
Very dissatisfied
Total
N
100.0%
57
100.0%
31
100.0%
67
100.0%
155X2=3.5, df=4, p=.483
The Experiences of Immigrant Seniors
119
Experience with Discrimination
When asked whether or not they or their families have experienced any acts of discriminationwhen looking for housing, 9% said yes. Men were significantly more likely than women toreport having experienced discrimination (15% vs. 3%), and established immigrants (10%)were more likely than recent immigrants (6%) to report having experienced discrimination.The incidents of discrimination given by 13 respondents were most often attributed to therespondent’s ethnicity, dress, or living style (46%). For example, one respondent said,“Applied for senior’s home and could not get it because of ethnicity.” Refusal to rent whenvacant was reported by 31% of those who have experienced discrimination, followed by non-cooperation (23%). For example, one respondent said, “It was very subtle. The building had avacancy sign but the lady said there was no vacancy.” Seven respondents referred to landlordslying about the non-availability of vacant accommodation or to owners or landlords refusingto show their houses.
When asked whether or not they or their families have experienced discrimination whileliving in the neighborhood, 5% said yes. All of these respondents were men. Over half (57%)of these respondents attributed the incidents of discrimination to pure ignorance, ethnicity, orskin colour. For example, one respondent said, “Some people think we are Bin Laden’s partybecause we are wearing turban and beard, moustache.” The other respondents (43%) reportedbeing treated rudely or having things thrown at them. For example, one respondent said,“English kids hate our culture and living style. They throw burning cigarette(s) or beerbottle(s) on me.” The victims of such incidents feel hurt, unhappy, unwanted, andheartbroken.
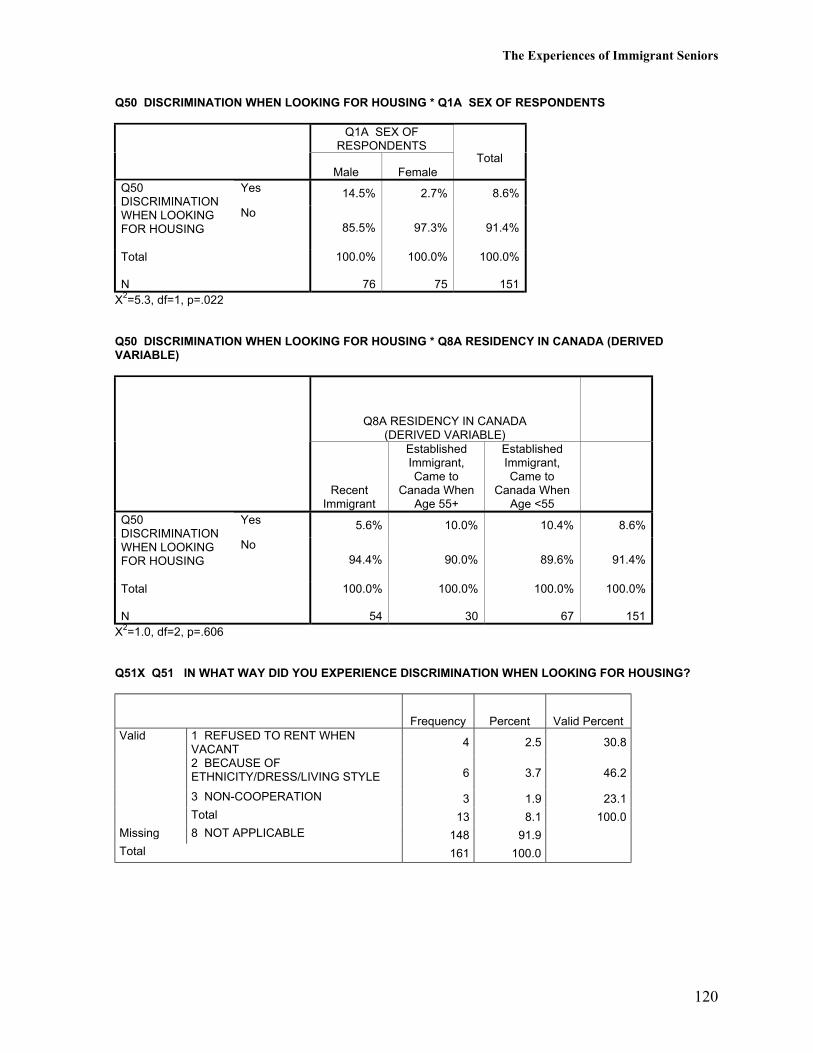
The Experiences of Immigrant Seniors
120
Q50 DISCRIMINATION WHEN LOOKING FOR HOUSING * Q1A SEX OF RESPONDENTS
Q1A SEX OFRESPONDENTS
Male FemaleTotal
Yes 14.5% 2.7% 8.6%Q50DISCRIMINATIONWHEN LOOKINGFOR HOUSING
No85.5% 97.3% 91.4%
Total
N
100.0%
76
100.0%
75
100.0%
151X2=5.3, df=1, p=.022
Q50 DISCRIMINATION WHEN LOOKING FOR HOUSING * Q8A RESIDENCY IN CANADA (DERIVEDVARIABLE)
Q8A RESIDENCY IN CANADA(DERIVED VARIABLE)
RecentImmigrant
EstablishedImmigrant,Came to
Canada WhenAge 55+
EstablishedImmigrant,Came to
Canada WhenAge <55
Yes 5.6% 10.0% 10.4% 8.6%Q50DISCRIMINATIONWHEN LOOKINGFOR HOUSING
No94.4% 90.0% 89.6% 91.4%
Total
N
100.0%
54
100.0%
30
100.0%
67
100.0%
151X2=1.0, df=2, p=.606
Q51X Q51 IN WHAT WAY DID YOU EXPERIENCE DISCRIMINATION WHEN LOOKING FOR HOUSING?
Frequency Percent Valid PercentValid 1 REFUSED TO RENT WHEN
VACANT4 2.5 30.8
2 BECAUSE OFETHNICITY/DRESS/LIVING STYLE 6 3.7 46.2
3 NON-COOPERATION 3 1.9 23.1Total 13 8.1 100.0
Missing 8 NOT APPLICABLE 148 91.9Total 161 100.0
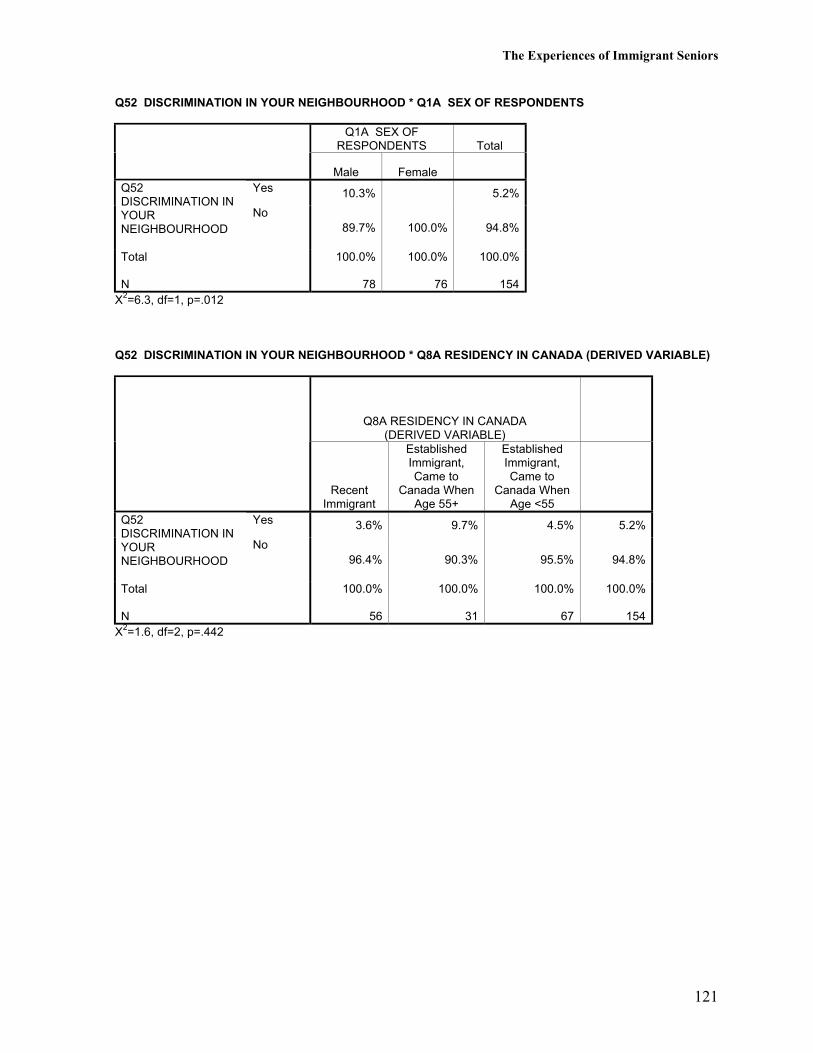
The Experiences of Immigrant Seniors
121
Q52 DISCRIMINATION IN YOUR NEIGHBOURHOOD * Q1A SEX OF RESPONDENTS
Q1A SEX OFRESPONDENTS Total
Male FemaleYes 10.3% 5.2%Q52
DISCRIMINATION INYOURNEIGHBOURHOOD
No89.7% 100.0% 94.8%
Total
N
100.0%
78
100.0%
76
100.0%
154X2=6.3, df=1, p=.012
Q52 DISCRIMINATION IN YOUR NEIGHBOURHOOD * Q8A RESIDENCY IN CANADA (DERIVED VARIABLE)
Q8A RESIDENCY IN CANADA(DERIVED VARIABLE)
RecentImmigrant
EstablishedImmigrant,Came to
Canada WhenAge 55+
EstablishedImmigrant,Came to
Canada WhenAge <55
Yes 3.6% 9.7% 4.5% 5.2%Q52DISCRIMINATION INYOURNEIGHBOURHOOD
No96.4% 90.3% 95.5% 94.8%
Total
N
100.0%
56
100.0%
31
100.0%
67
100.0%
154X2=1.6, df=2, p=.442
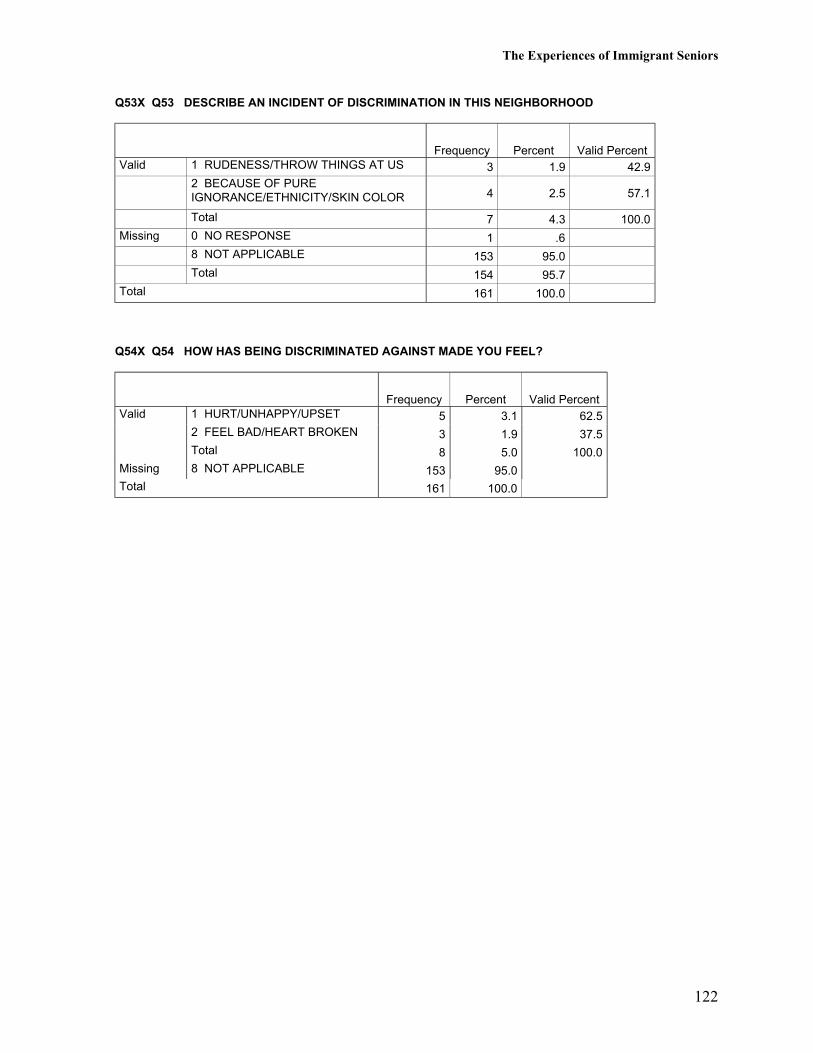
The Experiences of Immigrant Seniors
122
Q53X Q53 DESCRIBE AN INCIDENT OF DISCRIMINATION IN THIS NEIGHBORHOOD
Frequency Percent Valid PercentValid 1 RUDENESS/THROW THINGS AT US 3 1.9 42.9
2 BECAUSE OF PUREIGNORANCE/ETHNICITY/SKIN COLOR 4 2.5 57.1
Total 7 4.3 100.0Missing 0 NO RESPONSE 1 .6
8 NOT APPLICABLE 153 95.0Total 154 95.7
Total 161 100.0
Q54X Q54 HOW HAS BEING DISCRIMINATED AGAINST MADE YOU FEEL?
Frequency Percent Valid PercentValid 1 HURT/UNHAPPY/UPSET 5 3.1 62.5
2 FEEL BAD/HEART BROKEN 3 1.9 37.5Total 8 5.0 100.0
Missing 8 NOT APPLICABLE 153 95.0Total 161 100.0
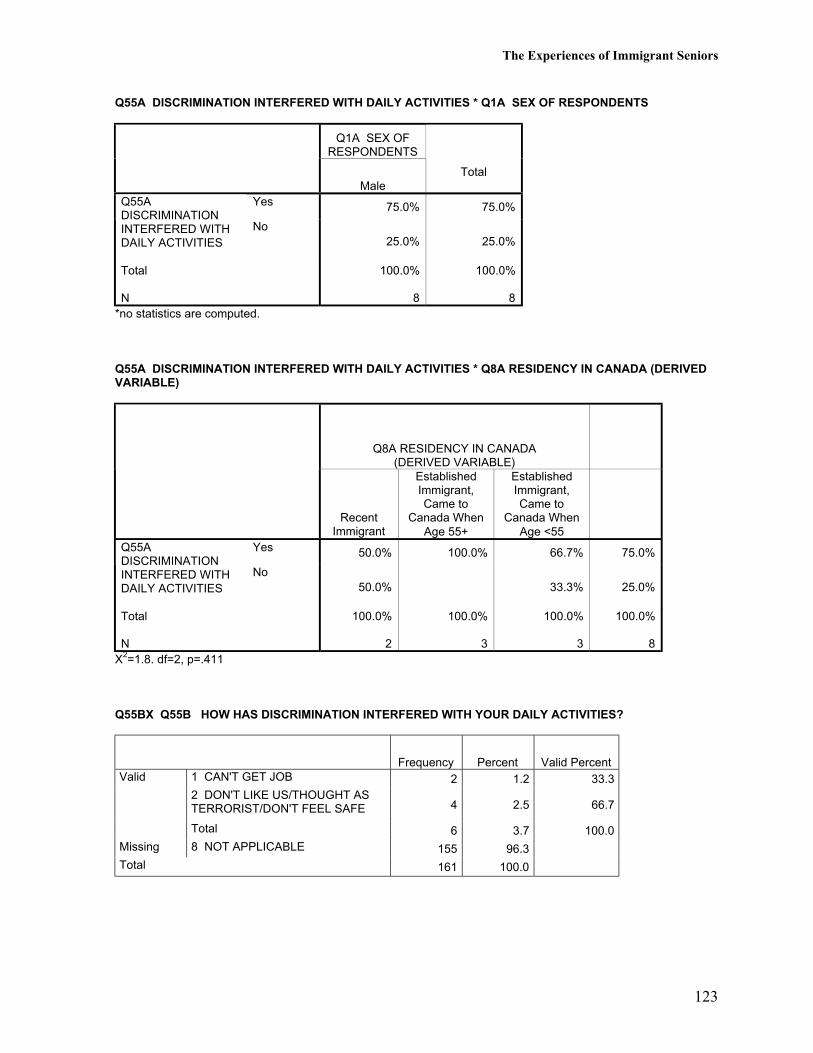
The Experiences of Immigrant Seniors
123
Q55A DISCRIMINATION INTERFERED WITH DAILY ACTIVITIES * Q1A SEX OF RESPONDENTS
Q1A SEX OFRESPONDENTS
MaleTotal
Yes 75.0% 75.0%Q55ADISCRIMINATIONINTERFERED WITHDAILY ACTIVITIES
No25.0% 25.0%
Total
N
100.0%
8
100.0%
8*no statistics are computed.
Q55A DISCRIMINATION INTERFERED WITH DAILY ACTIVITIES * Q8A RESIDENCY IN CANADA (DERIVEDVARIABLE)
Q8A RESIDENCY IN CANADA(DERIVED VARIABLE)
RecentImmigrant
EstablishedImmigrant,Came to
Canada WhenAge 55+
EstablishedImmigrant,Came to
Canada WhenAge <55
Yes 50.0% 100.0% 66.7% 75.0%Q55ADISCRIMINATIONINTERFERED WITHDAILY ACTIVITIES
No50.0% 33.3% 25.0%
Total
N
100.0%
2
100.0%
3
100.0%
3
100.0%
8X2=1.8. df=2, p=.411
Q55BX Q55B HOW HAS DISCRIMINATION INTERFERED WITH YOUR DAILY ACTIVITIES?
Frequency Percent Valid PercentValid 1 CAN'T GET JOB 2 1.2 33.3
2 DON'T LIKE US/THOUGHT ASTERRORIST/DON'T FEEL SAFE 4 2.5 66.7
Total 6 3.7 100.0Missing 8 NOT APPLICABLE 155 96.3Total 161 100.0

The Experiences of Immigrant Seniors
124
The Experiences of Immigrant Seniors
125
Transportation and Access to Services
The majority of our respondents lived in neighborhoods where there were some essentialfacilities within walking distance: grocery store (67%), pharmacy (62%), bank (54%), clinicor doctor (55%), and bus stop (91%). Those who came to Canada at a younger age were morelikely to live close to a pharmacy, or a clinic or doctor than those who came to Canada at anolder age.
Unlike seniors in the general Canadian population, the automobile is not a common means oftransportation for our respondents. Only 35% of our respondents had a valid Alberta driver’slicense, 36% had the use of a vehicle, and only 26% drove themselves when they needed to gosomewhere too far to walk.
Responses vary by sex and residency in Canada. Men were more likely than women to have adriver’s license (51% vs. 20%), to have the use of a vehicle (45% vs. 27%), and to drive (39%vs. 14%). Established immigrants who came to Canada at a younger age were more likelythan established immigrants who came at an older age or recent immigrants to have a driver’slicense (60% vs. 13% and 21%, respectively), to have the use of a vehicle (61% vs. 16% and19%, respectively), and to drive themselves when they needed to go somewhere too far towalk (48% vs. 10% and 11%, respectively).
The most common means of transportation for our respondents is a ride from family andfriends. Sixty-one percent of our respondents reported that they got a ride from someone intheir household. Women tended to rely on a ride from someone in the household (82%)significantly more than men (40%). Recent immigrants (67%) and established immigrantswho came to Canada at an older age (71%) were more likely to rely on a ride from someonein the household than established immigrants who came to Canada at a younger age (51%)[although these differences were statistically non-significant, p=.078]. Getting a ride fromsomeone outside the household was also quite common (29%).
Only 42% said they took the bus or used the light rail transit (LRT). Men were more likelythan women to use public transportation (63% vs. 22%). So were recent immigrants (49%)and established immigrants who came to Canada at an older age (55%) more likely to usepublic transportation than established immigrants who came to Canada at a younger age(30%). Only a few used the taxi (5%) or DATS services (6%).
The majority of our respondents reported that it was very easy (57%) or somewhat easy (13%)to get to places they needed to go. Responses did not vary by sex or residency in Canada.When asked why it was difficult for the respondents to get to places, 32 respondents replied.Of these replies, the most common response was needs a ride or does not drive (44%),followed by inconvenient public transportation (22%), health problems (19%), and winterconditions (13%). One said too busy babysitting.

The Experiences of Immigrant Seniors
126
Q56A GROCERY STORE CLOSE TO HOME * Q1A SEX OF RESPONDENTS
Q1A SEX OFRESPONDENTS
Male Female TotalYes 72.5% 62.0% 67.3%Q56A
GROCERYSTORE CLOSETO HOME
No27.5% 38.0% 32.7%
Total
N
100.0%
80
100.0%
79
100.0%
159X2=1.5, df=1, p=.215
Q56A GROCERY STORE CLOSE TO HOME * Q8A RESIDENCY IN CANADA (DERIVED VARIABLE)
Q8A RESIDENCY IN CANADA(DERIVED VARIABLE)
RecentImmigrant
EstablishedImmigrant,Came to
Canada WhenAge 55+
EstablishedImmigrant,Came to
Canada WhenAge <55 Total
Yes 62.9% 60.0% 74.6% 67.3%Q56AGROCERYSTORE CLOSETO HOME
No37.1% 40.0% 25.4% 32.7%
Total
N
100.0%
62
100.0%
30
100.0%
67
100.0%
159X2=2.9, df=2, p=.234
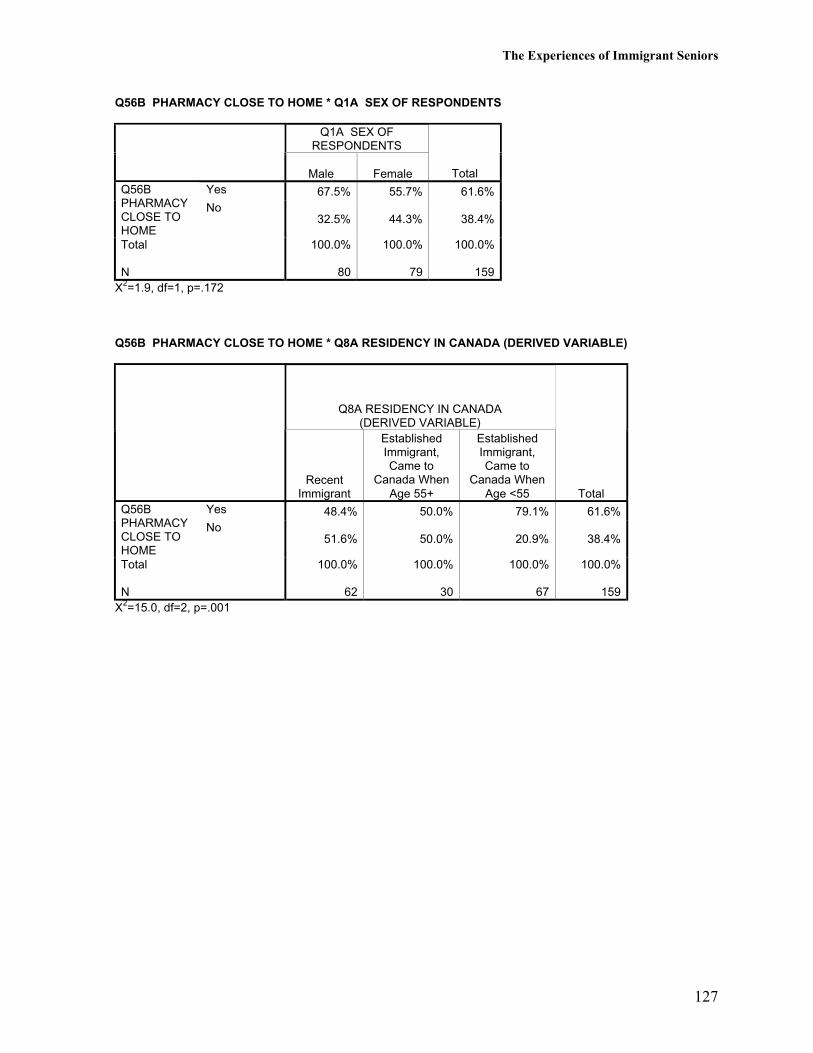
The Experiences of Immigrant Seniors
127
Q56B PHARMACY CLOSE TO HOME * Q1A SEX OF RESPONDENTS
Q1A SEX OFRESPONDENTS
Male Female TotalYes 67.5% 55.7% 61.6%Q56B
PHARMACYCLOSE TOHOME
No32.5% 44.3% 38.4%
Total
N
100.0%
80
100.0%
79
100.0%
159X2=1.9, df=1, p=.172
Q56B PHARMACY CLOSE TO HOME * Q8A RESIDENCY IN CANADA (DERIVED VARIABLE)
Q8A RESIDENCY IN CANADA(DERIVED VARIABLE)
RecentImmigrant
EstablishedImmigrant,Came to
Canada WhenAge 55+
EstablishedImmigrant,Came to
Canada WhenAge <55 Total
Yes 48.4% 50.0% 79.1% 61.6%Q56BPHARMACYCLOSE TOHOME
No51.6% 50.0% 20.9% 38.4%
Total
N
100.0%
62
100.0%
30
100.0%
67
100.0%
159X2=15.0, df=2, p=.001
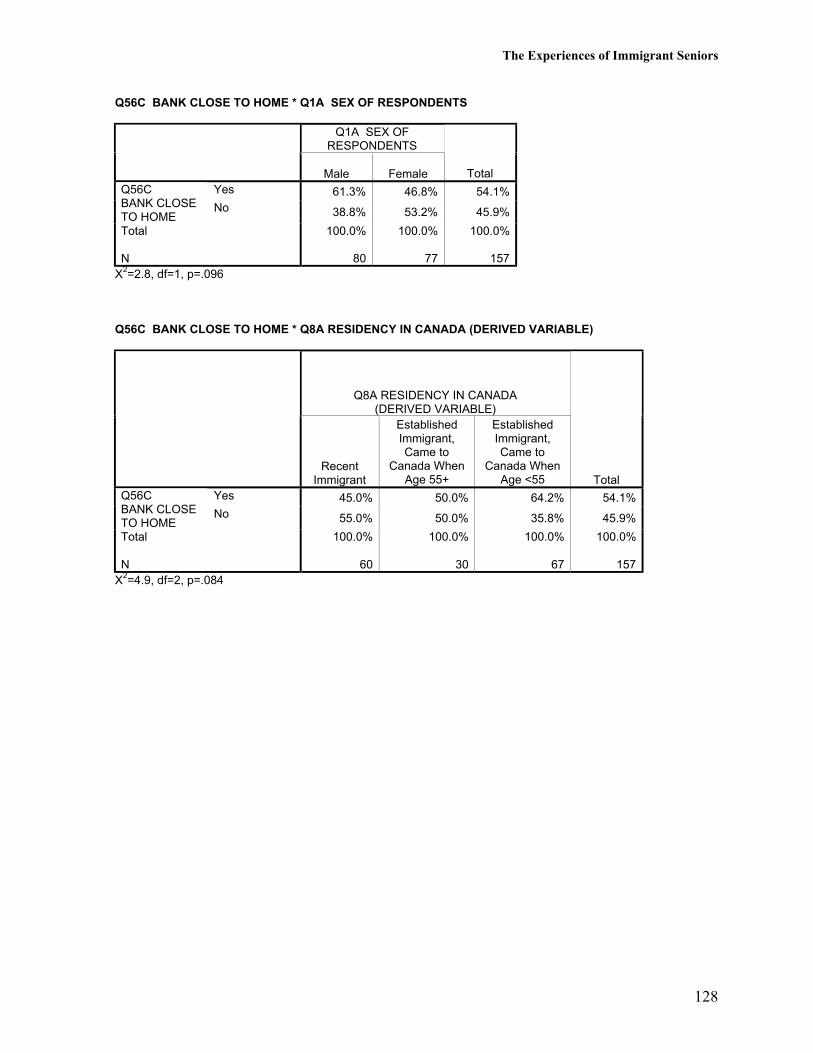
The Experiences of Immigrant Seniors
128
Q56C BANK CLOSE TO HOME * Q1A SEX OF RESPONDENTS
Q1A SEX OFRESPONDENTS
Male Female TotalYes 61.3% 46.8% 54.1%Q56C
BANK CLOSETO HOME
No 38.8% 53.2% 45.9%
Total
N
100.0%
80
100.0%
77
100.0%
157X2=2.8, df=1, p=.096
Q56C BANK CLOSE TO HOME * Q8A RESIDENCY IN CANADA (DERIVED VARIABLE)
Q8A RESIDENCY IN CANADA(DERIVED VARIABLE)
RecentImmigrant
EstablishedImmigrant,Came to
Canada WhenAge 55+
EstablishedImmigrant,Came to
Canada WhenAge <55 Total
Yes 45.0% 50.0% 64.2% 54.1%Q56CBANK CLOSETO HOME
No 55.0% 50.0% 35.8% 45.9%
Total
N
100.0%
60
100.0%
30
100.0%
67
100.0%
157X2=4.9, df=2, p=.084

The Experiences of Immigrant Seniors
129
Q56D CLINIC/DOCTOR CLOSE TO HOME * Q1A SEX OF RESPONDENTS
Q1A SEX OFRESPONDENTS
Male Female TotalYes 62.5% 47.5% 55.0%Q56D CLINIC/
DOCTORCLOSE TOHOME
No37.5% 52.5% 45.0%
Total
N
100.0%
80
100.0%
80
100.0%
160X2=3.06, df=1, p=.080
Q56D CLINIC/DOCTOR CLOSE TO HOME * Q8A RESIDENCY IN CANADA (DERIVED VARIABLE)
Q8A RESIDENCY IN CANADA (DERIVEDVARIABLE)
RecentImmigrant
EstablishedImmigrant,Came to
Canada WhenAge 55+
EstablishedImmigrant,Came to
Canada WhenAge <55 Total
Yes 43.5% 41.9% 71.6% 55.0%Q56D CLINIC/DOCTORCLOSE TOHOME
No56.5% 58.1% 28.4% 45.0%
Total
N
100.0%
62
100.0%
31
100.0%
67
100.0%
160X2=12.9, df=2, p=.002

The Experiences of Immigrant Seniors
130
Q56E BUS STOP CLOSE TO HOME * Q1A SEX OF RESPONDENTS
Q1A SEX OFRESPONDENTS
Male Female TotalYes 93.8% 88.5% 91.1%Q56E
BUS STOPCLOSE TOHOME
No6.3% 11.5% 8.9%
Total
N
100.0%
80
100.0%
78
100.0%
158X2=0.79, df=1, p=.374
Q56E BUS STOP CLOSE TO HOME * Q8A RESIDENCY IN CANADA (DERIVED VARIABLE)
Q8A RESIDENCY IN CANADA(DERIVED VARIABLE)
RecentImmigrant
EstablishedImmigrant,Came to
Canada WhenAge 55+
EstablishedImmigrant,Came to
Canada WhenAge <55 Total
Yes 85.2% 90.0% 97.0% 91.1%Q56EBUS STOPCLOSE TOHOME
No14.8% 10.0% 3.0% 8.9%
Total
N
100.0%
61
100.0%
30
100.0%
67
100.0%
158X2=5.5, df=2, p=.063

The Experiences of Immigrant Seniors
131
Q57 HAVE VALID ALBERTA DRIVER'S LICENCE? * Q1A SEX OF RESPONDENTS
Q1A SEX OFRESPONDENTS
Male Female TotalYes 51.3% 19.8% 35.4%Q57
HAVE VALIDALBERTADRIVER'SLICENCE?
No48.8% 80.2% 64.6%
Total
N
100.0%
80
100.0%
81
100.0%
161X2=16.1, df=1, p=.000
Q57 HAVE VALID ALBERTA DRIVER'S LICENCE? * Q8A RESIDENCY IN CANADA (DERIVED VARIABLE)
Q8A RESIDENCY IN CANADA(DERIVED VARIABLE)
RecentImmigrant
EstablishedImmigrant,Came to
Canada WhenAge 55+
EstablishedImmigrant,Came to
Canada WhenAge <55 Total
Yes 20.6% 12.9% 59.7% 35.4%Q57HAVE VALIDALBERTADRIVER'SLICENCE?
No79.4% 87.1% 40.3% 64.6%
Total
N
100.0%
63
100.0%
31
100.0%
67
100.0%
161X2=30.2, df=2, p=.000
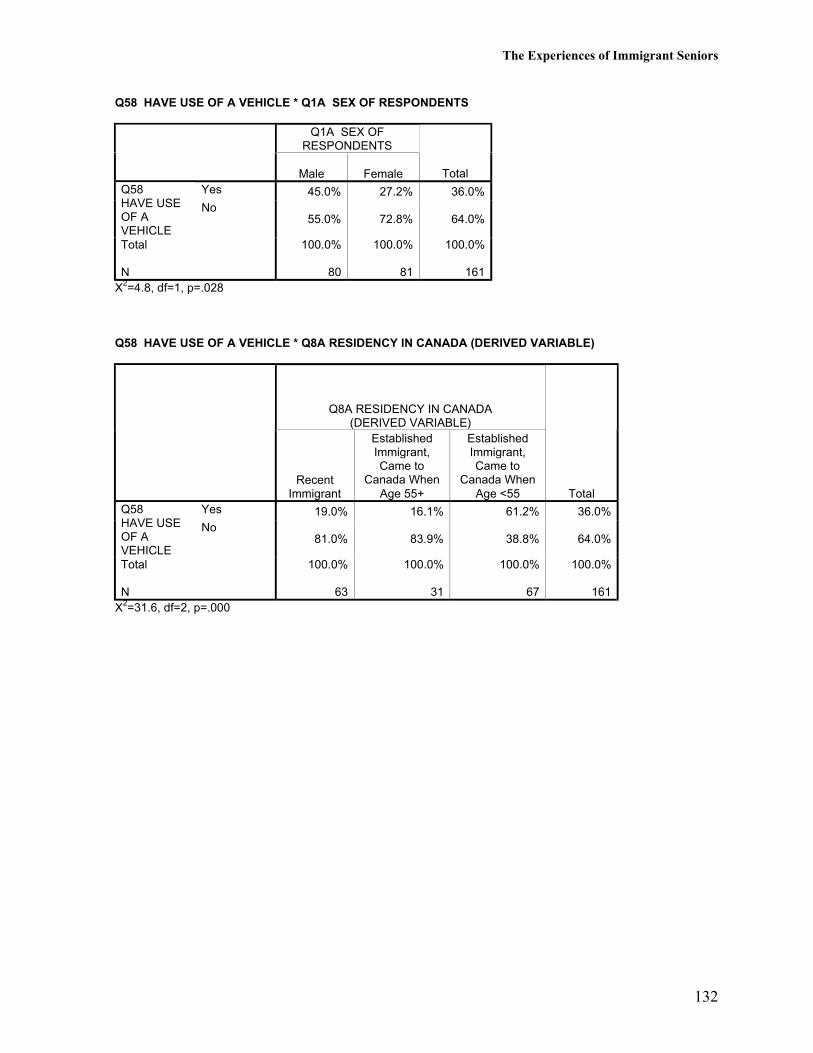
The Experiences of Immigrant Seniors
132
Q58 HAVE USE OF A VEHICLE * Q1A SEX OF RESPONDENTS
Q1A SEX OFRESPONDENTS
Male Female TotalYes 45.0% 27.2% 36.0%Q58
HAVE USEOF AVEHICLE
No55.0% 72.8% 64.0%
Total
N
100.0%
80
100.0%
81
100.0%
161X2=4.8, df=1, p=.028
Q58 HAVE USE OF A VEHICLE * Q8A RESIDENCY IN CANADA (DERIVED VARIABLE)
Q8A RESIDENCY IN CANADA(DERIVED VARIABLE)
RecentImmigrant
EstablishedImmigrant,Came to
Canada WhenAge 55+
EstablishedImmigrant,Came to
Canada WhenAge <55 Total
Yes 19.0% 16.1% 61.2% 36.0%Q58HAVE USEOF AVEHICLE
No81.0% 83.9% 38.8% 64.0%
Total
N
100.0%
63
100.0%
31
100.0%
67
100.0%
161X2=31.6, df=2, p=.000

The Experiences of Immigrant Seniors
133
Q59A TO GO SOMEPLACE TOO FAR TO WALK: DRIVE YOURSELF * Q1A SEX OF RESPONDENTS
Q1A SEX OFRESPONDENTS
Male Female TotalNot selected
61.3% 86.4% 73.9%Q59A TO GOSOMEPLACETOO FAR TOWALK: DRIVEYOURSELF
Selected38.8% 13.6% 26.1%
Total
N
100.0%
80
100.0%
81
100.0%
161X2=12.0, df=1, p=.001
Q59A TO GO SOMEPLACE TOO FAR TO WALK: DRIVE YOURSELF * Q8A RESIDENCY IN CANADA(DERIVED VARIABLE)
Q8A RESIDENCY IN CANADA(DERIVED VARIABLE)
RecentImmigrant
EstablishedImmigrant,Came to
Canada WhenAge 55+
EstablishedImmigrant,Came to
Canada WhenAge <55 Total
Not selected88.9% 90.3% 52.2% 73.9%
Q59A TO GOSOMEPLACETOO FAR TOWALK: DRIVEYOURSELF
Selected11.1% 9.7% 47.8% 26.1%
Total
N
100.0%
63
100.0%
31
100.0%
67
100.0%
161X2=28.0, df=2, p=.000

The Experiences of Immigrant Seniors
134
Q59B TO GO SOMEPLACE TOO FAR TO WALK: RIDE FROM HOUSEHOLD MEMBER * Q1A SEX OFRESPONDENTS
Q1A SEX OFRESPONDENTS
Male Female TotalNot selected
60.0% 18.5% 39.1%Q59B TO GOSOMEPLACE TOOFAR TO WALK:RIDE FROMHOUSEHOLDMEMBER
Selected
40.0% 81.5% 60.9%
Total
N
100.0%
80
100.0%
81
100.0%
161X2=27.4, df=1, p=.000
Q59B TO GO SOMEPLACE TOO FAR TO WALK: RIDE FROM HOUSEHOLD MEMBER * Q8A RESIDENCYIN CANADA (DERIVED VARIABLE)
Q8A RESIDENCY IN CANADA(DERIVED VARIABLE)
RecentImmigrant
EstablishedImmigrant,Came to
Canada WhenAge 55+
EstablishedImmigrant,Came to
Canada WhenAge <55 Total
Not selected33.3% 29.0% 49.3% 39.1%
Q59B TO GOSOMEPLACE TOOFAR TO WALK:RIDE FROMHOUSEHOLDMEMBER
Selected
66.7% 71.0% 50.7% 60.9%
Total
N
100.0%
63
100.0%
31
100.0%
67
100.0%
161X2=5.1, df=2, p=.078
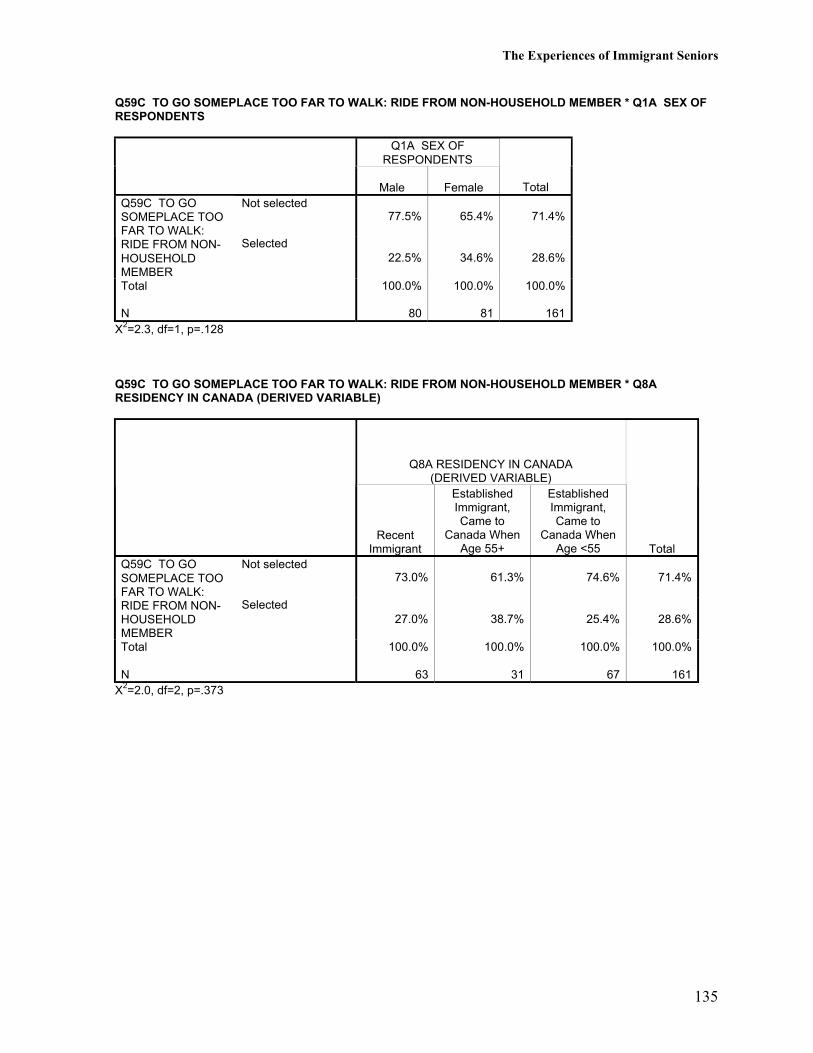
The Experiences of Immigrant Seniors
135
Q59C TO GO SOMEPLACE TOO FAR TO WALK: RIDE FROM NON-HOUSEHOLD MEMBER * Q1A SEX OFRESPONDENTS
Q1A SEX OFRESPONDENTS
Male Female TotalNot selected
77.5% 65.4% 71.4%Q59C TO GOSOMEPLACE TOOFAR TO WALK:RIDE FROM NON-HOUSEHOLDMEMBER
Selected22.5% 34.6% 28.6%
Total
N
100.0%
80
100.0%
81
100.0%
161X2=2.3, df=1, p=.128
Q59C TO GO SOMEPLACE TOO FAR TO WALK: RIDE FROM NON-HOUSEHOLD MEMBER * Q8ARESIDENCY IN CANADA (DERIVED VARIABLE)
Q8A RESIDENCY IN CANADA(DERIVED VARIABLE)
RecentImmigrant
EstablishedImmigrant,Came to
Canada WhenAge 55+
EstablishedImmigrant,Came to
Canada WhenAge <55 Total
Not selected73.0% 61.3% 74.6% 71.4%
Q59C TO GOSOMEPLACE TOOFAR TO WALK:RIDE FROM NON-HOUSEHOLDMEMBER
Selected27.0% 38.7% 25.4% 28.6%
Total
N
100.0%
63
100.0%
31
100.0%
67
100.0%
161X2=2.0, df=2, p=.373
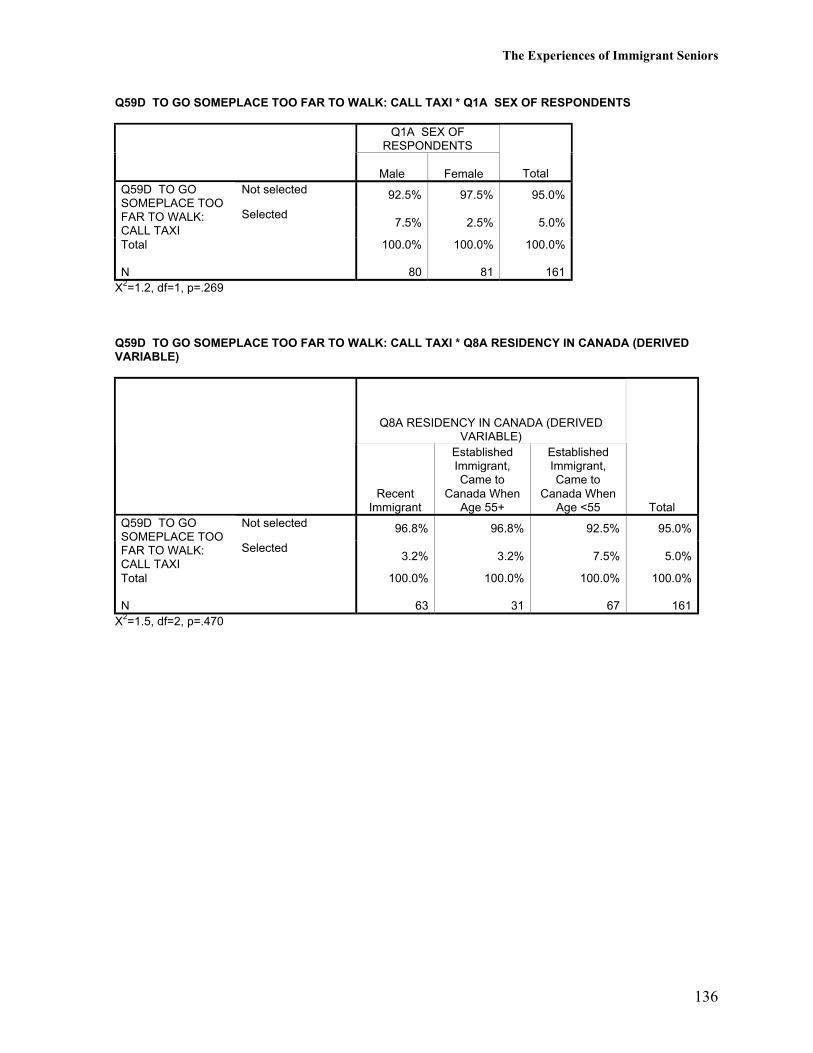
The Experiences of Immigrant Seniors
136
Q59D TO GO SOMEPLACE TOO FAR TO WALK: CALL TAXI * Q1A SEX OF RESPONDENTS
Q1A SEX OFRESPONDENTS
Male Female TotalNot selected 92.5% 97.5% 95.0%Q59D TO GO
SOMEPLACE TOOFAR TO WALK:CALL TAXI
Selected7.5% 2.5% 5.0%
Total
N
100.0%
80
100.0%
81
100.0%
161X2=1.2, df=1, p=.269
Q59D TO GO SOMEPLACE TOO FAR TO WALK: CALL TAXI * Q8A RESIDENCY IN CANADA (DERIVEDVARIABLE)
Q8A RESIDENCY IN CANADA (DERIVEDVARIABLE)
RecentImmigrant
EstablishedImmigrant,Came to
Canada WhenAge 55+
EstablishedImmigrant,Came to
Canada WhenAge <55 Total
Not selected 96.8% 96.8% 92.5% 95.0%Q59D TO GOSOMEPLACE TOOFAR TO WALK:CALL TAXI
Selected3.2% 3.2% 7.5% 5.0%
Total
N
100.0%
63
100.0%
31
100.0%
67
100.0%
161X2=1.5, df=2, p=.470

The Experiences of Immigrant Seniors
137
Q59E TO GO SOMEPLACE TOO FAR TO WALK: TAKE BUS OR LRT * Q1A SEX OF RESPONDENTS
Q1A SEX OFRESPONDENTS
Male Female TotalNot selected
37.5% 77.8% 57.8%Q59E TO GOSOMEPLACETOO FAR TOWALK: TAKEBUS OR LRT
Selected62.5% 22.2% 42.2%
Total
N
100.0%
80
100.0%
81
100.0%
161X2=25.1, df=1, p=.000
Q59E TO GO SOMEPLACE TOO FAR TO WALK: TAKE BUS OR LRT * Q8A RESIDENCY IN CANADA(DERIVED VARIABLE)
Q8A RESIDENCY IN CANADA(DERIVED VARIABLE)
RecentImmigrant
EstablishedImmigrant,Came to
Canada WhenAge 55+
EstablishedImmigrant,Came to
Canada WhenAge <55 Total
Not selected50.8% 45.2% 70.1% 57.8%
Q59E TO GOSOMEPLACETOO FAR TOWALK: TAKEBUS OR LRT
Selected49.2% 54.8% 29.9% 42.2%
Total
N
100.0%
63
100.0%
31
100.0%
67
100.0%
161X2=7.5, df=2, p=.024
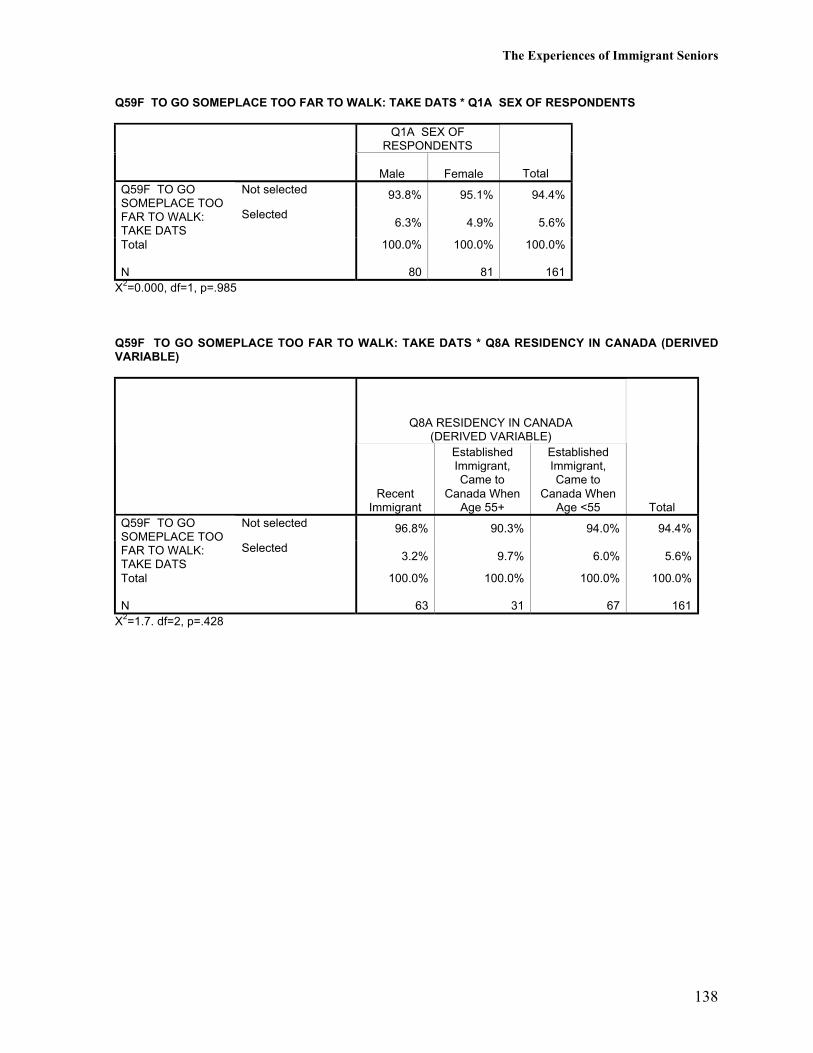
The Experiences of Immigrant Seniors
138
Q59F TO GO SOMEPLACE TOO FAR TO WALK: TAKE DATS * Q1A SEX OF RESPONDENTS
Q1A SEX OFRESPONDENTS
Male Female TotalNot selected 93.8% 95.1% 94.4%Q59F TO GO
SOMEPLACE TOOFAR TO WALK:TAKE DATS
Selected6.3% 4.9% 5.6%
Total
N
100.0%
80
100.0%
81
100.0%
161X2=0.000, df=1, p=.985
Q59F TO GO SOMEPLACE TOO FAR TO WALK: TAKE DATS * Q8A RESIDENCY IN CANADA (DERIVEDVARIABLE)
Q8A RESIDENCY IN CANADA(DERIVED VARIABLE)
RecentImmigrant
EstablishedImmigrant,Came to
Canada WhenAge 55+
EstablishedImmigrant,Came to
Canada WhenAge <55 Total
Not selected 96.8% 90.3% 94.0% 94.4%Q59F TO GOSOMEPLACE TOOFAR TO WALK:TAKE DATS
Selected3.2% 9.7% 6.0% 5.6%
Total
N
100.0%
63
100.0%
31
100.0%
67
100.0%
161X2=1.7. df=2, p=.428
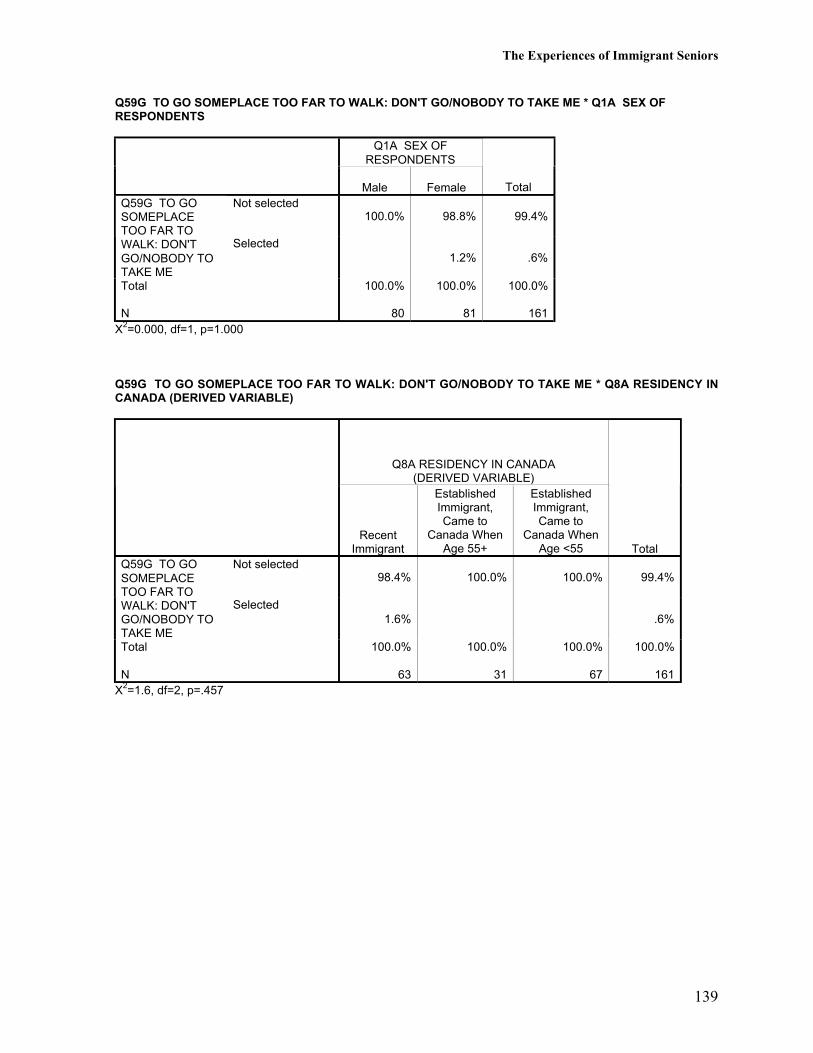
The Experiences of Immigrant Seniors
139
Q59G TO GO SOMEPLACE TOO FAR TO WALK: DON'T GO/NOBODY TO TAKE ME * Q1A SEX OFRESPONDENTS
Q1A SEX OFRESPONDENTS
Male Female TotalNot selected
100.0% 98.8% 99.4%Q59G TO GOSOMEPLACETOO FAR TOWALK: DON'TGO/NOBODY TOTAKE ME
Selected1.2% .6%
Total
N
100.0%
80
100.0%
81
100.0%
161X2=0.000, df=1, p=1.000
Q59G TO GO SOMEPLACE TOO FAR TO WALK: DON'T GO/NOBODY TO TAKE ME * Q8A RESIDENCY INCANADA (DERIVED VARIABLE)
Q8A RESIDENCY IN CANADA(DERIVED VARIABLE)
RecentImmigrant
EstablishedImmigrant,Came to
Canada WhenAge 55+
EstablishedImmigrant,Came to
Canada WhenAge <55 Total
Not selected98.4% 100.0% 100.0% 99.4%
Q59G TO GOSOMEPLACETOO FAR TOWALK: DON'TGO/NOBODY TOTAKE ME
Selected1.6% .6%
Total
N
100.0%
63
100.0%
31
100.0%
67
100.0%
161X2=1.6, df=2, p=.457
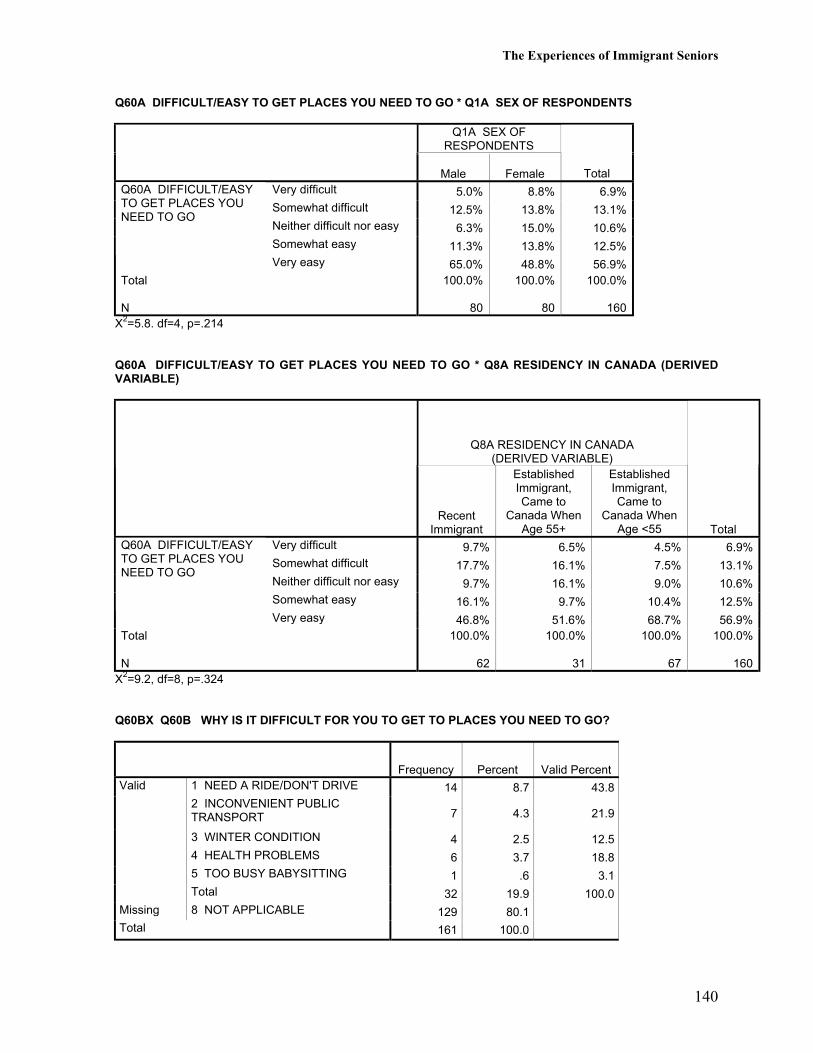
The Experiences of Immigrant Seniors
140
Q60A DIFFICULT/EASY TO GET PLACES YOU NEED TO GO * Q1A SEX OF RESPONDENTS
Q1A SEX OFRESPONDENTS
Male Female TotalVery difficult 5.0% 8.8% 6.9%Somewhat difficult 12.5% 13.8% 13.1%Neither difficult nor easy 6.3% 15.0% 10.6%Somewhat easy 11.3% 13.8% 12.5%
Q60A DIFFICULT/EASYTO GET PLACES YOUNEED TO GO
Very easy 65.0% 48.8% 56.9%Total
N
100.0%
80
100.0%
80
100.0%
160X2=5.8. df=4, p=.214
Q60A DIFFICULT/EASY TO GET PLACES YOU NEED TO GO * Q8A RESIDENCY IN CANADA (DERIVEDVARIABLE)
Q8A RESIDENCY IN CANADA(DERIVED VARIABLE)
RecentImmigrant
EstablishedImmigrant,Came to
Canada WhenAge 55+
EstablishedImmigrant,Came to
Canada WhenAge <55 Total
Very difficult 9.7% 6.5% 4.5% 6.9%Somewhat difficult 17.7% 16.1% 7.5% 13.1%Neither difficult nor easy 9.7% 16.1% 9.0% 10.6%Somewhat easy 16.1% 9.7% 10.4% 12.5%
Q60A DIFFICULT/EASYTO GET PLACES YOUNEED TO GO
Very easy 46.8% 51.6% 68.7% 56.9%Total
N
100.0%
62
100.0%
31
100.0%
67
100.0%
160X2=9.2, df=8, p=.324
Q60BX Q60B WHY IS IT DIFFICULT FOR YOU TO GET TO PLACES YOU NEED TO GO?
Frequency Percent Valid PercentValid 1 NEED A RIDE/DON'T DRIVE 14 8.7 43.8
2 INCONVENIENT PUBLICTRANSPORT 7 4.3 21.9
3 WINTER CONDITION 4 2.5 12.54 HEALTH PROBLEMS 6 3.7 18.85 TOO BUSY BABYSITTING 1 .6 3.1Total 32 19.9 100.0
Missing 8 NOT APPLICABLE 129 80.1Total 161 100.0
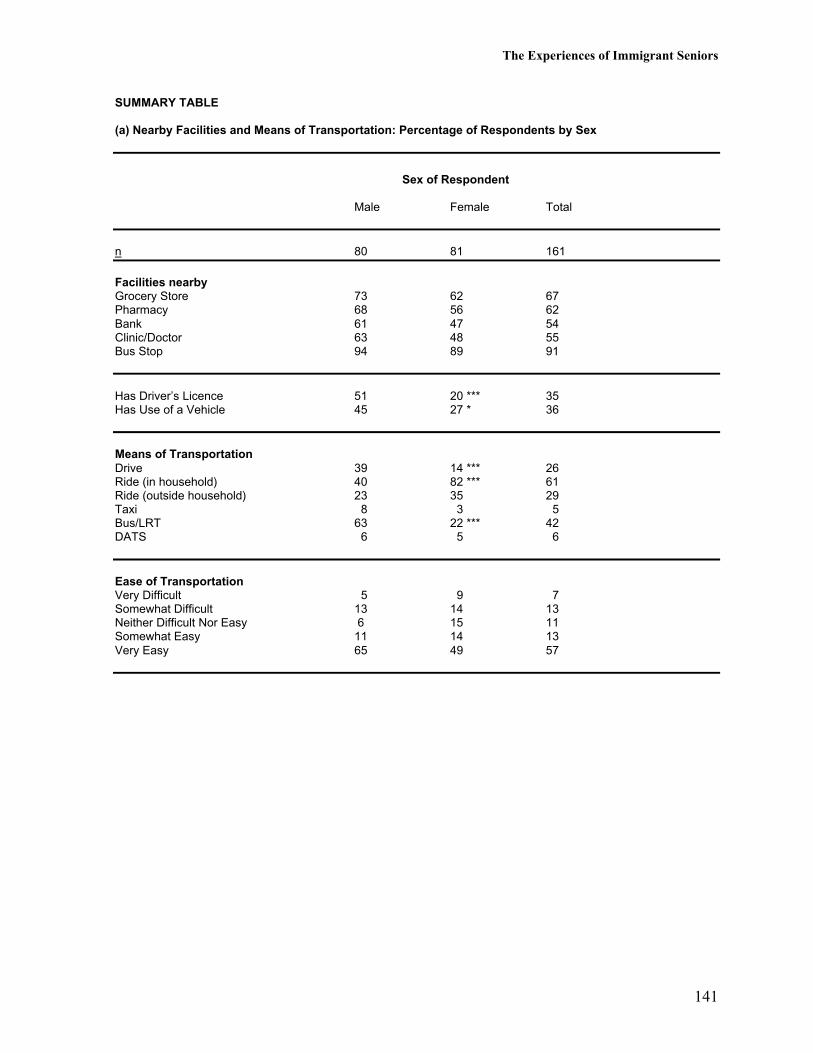
The Experiences of Immigrant Seniors
141
SUMMARY TABLE
(a) Nearby Facilities and Means of Transportation: Percentage of Respondents by Sex
Sex of Respondent
Male Female Total
n 80 81 161
Facilities nearbyGrocery Store 73 62 67Pharmacy 68 56 62Bank 61 47 54Clinic/Doctor 63 48 55Bus Stop 94 89 91
Has Driver’s Licence 51 20 *** 35Has Use of a Vehicle 45 27 * 36
Means of TransportationDrive 39 14 *** 26Ride (in household) 40 82 *** 61Ride (outside household) 23 35 29Taxi 8 3 5Bus/LRT 63 22 *** 42DATS 6 5 6
Ease of TransportationVery Difficult 5 9 7Somewhat Difficult 13 14 13Neither Difficult Nor Easy 6 15 11Somewhat Easy 11 14 13Very Easy 65 49 57
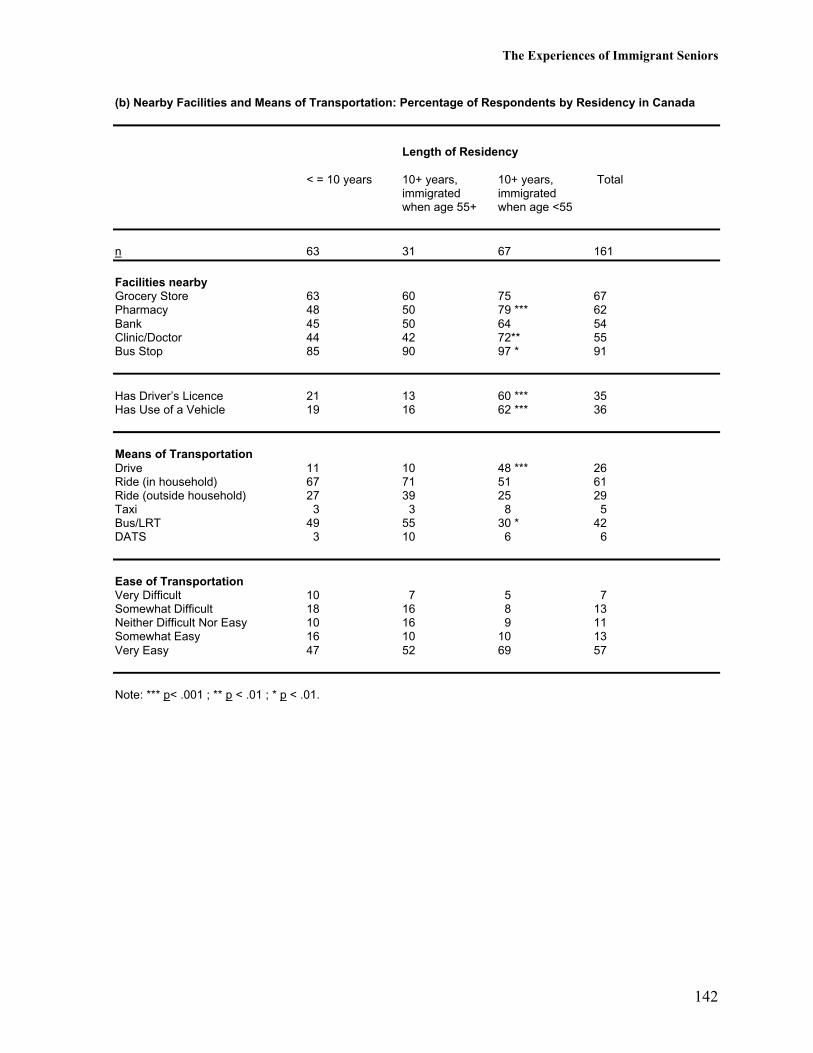
The Experiences of Immigrant Seniors
142
(b) Nearby Facilities and Means of Transportation: Percentage of Respondents by Residency in Canada
Length of Residency
< = 10 years 10+ years, 10+ years, Totalimmigrated immigratedwhen age 55+ when age <55
n 63 31 67 161
Facilities nearbyGrocery Store 63 60 75 67Pharmacy 48 50 79 *** 62Bank 45 50 64 54Clinic/Doctor 44 42 72** 55Bus Stop 85 90 97 * 91
Has Driver’s Licence 21 13 60 *** 35Has Use of a Vehicle 19 16 62 *** 36
Means of TransportationDrive 11 10 48 *** 26Ride (in household) 67 71 51 61Ride (outside household) 27 39 25 29Taxi 3 3 8 5Bus/LRT 49 55 30 * 42DATS 3 10 6 6
Ease of TransportationVery Difficult 10 7 5 7Somewhat Difficult 18 16 8 13Neither Difficult Nor Easy 10 16 9 11Somewhat Easy 16 10 10 13Very Easy 47 52 69 57
Note: *** p< .001 ; ** p < .01 ; * p < .01.
The Experiences of Immigrant Seniors
143
Community and Recreational Activities and Services
One in five (20%) of our respondents were doing volunteer work. Men were more likely thanwomen to be doing volunteer work (30% vs. 10%). Recent immigrants (23%) and establishedimmigrants who came to Canada at a younger age (25%) were more likely to be volunteersthan were established immigrants who came to Canada at an older age (3%). Of those who didvolunteer work, the most popular involvement was in community or cultural activities (41%),followed by temple activities (28%).
Three in four (75%) of our respondents participated in some kind of social groups. Responsesdid not vary by sex or residency in Canada. Of the 25% who did not take part in any socialgroup activities, age or health problems, transportation problems or distance, and lack of timewere the common reasons given for not participating, with each of these reasons accountingfor about 25% of the responses.
Most of our 120 respondents who participated in social groups in the past 12 months (69%)said they participated weekly or more often in such activities. Almost all (98%) were satisfiedwith their level of activity in these social groups. Almost half (45%) of those who weresatisfied said that these activities allowed them to meet more people and to socialize, and 32%said such activities gave them peace of mind or religious satisfaction.
Close to half (45%) of our respondents said that they used community and recreationalservices. Men and established immigrants were more likely to use these services. Among theservices offered, library service was the most popular, followed by physical exerciseprogrammes. Men were much more likely than women to use the library (41% vs. 7%), andestablished immigrants who came to Canada at a younger age were much more likely to takepart in physical exercise programmes than recent immigrants or established immigrants whocame to Canada at an older age (25% vs. 3%).
Of those who used community and recreational services, the great majority (93%) said it wasvery easy (74%) or somewhat easy (19%) to use these services in summer. However, asmaller percentage of respondents (61%) said it was very easy (39%) or somewhat easy(22%) to use these services in winter. Respondents were asked what made it difficult or easyfor them to use these services. Of 41 respondents who found it easy to use community andrecreational services the majority said that the availability of transportation made it easy forthem (78%). To those 21 respondents who found it difficult to use these services, the primaryobstacles were weather conditions (52%) and lack of transportation (38%). Thus, the majorityof these respondents (69%) saw improved transportation to be a big help in their using theseservices. For example, some respondents said, “Increase the public transportation in theevenings”, “Shuttle service, especially in the winter”, and “Start more minibus service sopeople don’t have to wait outside for long”.
When asked how they learned about these services, most respondents said either from friendsor relatives (31%), cultural, community, or religious organizations (26%), or family (23%).Men were more likely to learn of these services from cultural, community, or religious

The Experiences of Immigrant Seniors
144
organizations than women (39% vs. 15%), whereas women were more likely to learn of theseservices from family than men (36% vs. 10%).
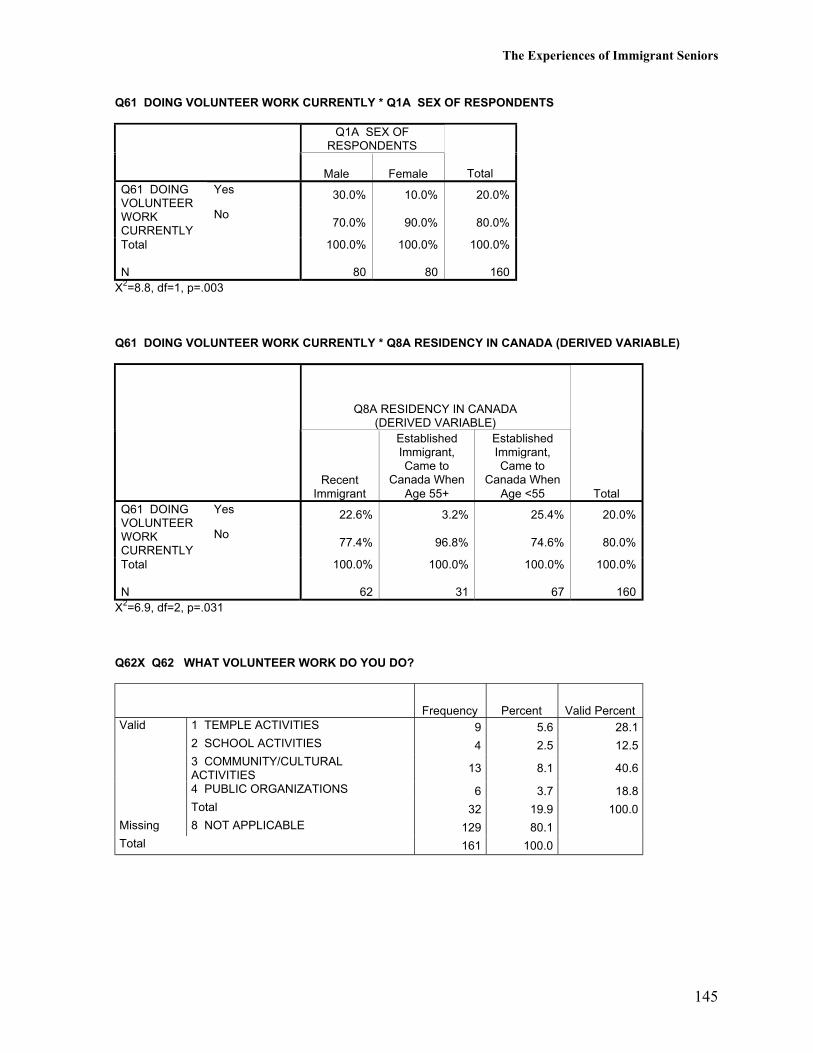
The Experiences of Immigrant Seniors
145
Q61 DOING VOLUNTEER WORK CURRENTLY * Q1A SEX OF RESPONDENTS
Q1A SEX OFRESPONDENTS
Male Female TotalYes 30.0% 10.0% 20.0%Q61 DOING
VOLUNTEERWORKCURRENTLY
No70.0% 90.0% 80.0%
Total
N
100.0%
80
100.0%
80
100.0%
160X2=8.8, df=1, p=.003
Q61 DOING VOLUNTEER WORK CURRENTLY * Q8A RESIDENCY IN CANADA (DERIVED VARIABLE)
Q8A RESIDENCY IN CANADA(DERIVED VARIABLE)
RecentImmigrant
EstablishedImmigrant,Came to
Canada WhenAge 55+
EstablishedImmigrant,Came to
Canada WhenAge <55 Total
Yes 22.6% 3.2% 25.4% 20.0%Q61 DOINGVOLUNTEERWORKCURRENTLY
No77.4% 96.8% 74.6% 80.0%
Total
N
100.0%
62
100.0%
31
100.0%
67
100.0%
160X2=6.9, df=2, p=.031
Q62X Q62 WHAT VOLUNTEER WORK DO YOU DO?
Frequency Percent Valid PercentValid 1 TEMPLE ACTIVITIES 9 5.6 28.1
2 SCHOOL ACTIVITIES 4 2.5 12.53 COMMUNITY/CULTURALACTIVITIES
13 8.1 40.6
4 PUBLIC ORGANIZATIONS 6 3.7 18.8Total 32 19.9 100.0
Missing 8 NOT APPLICABLE 129 80.1Total 161 100.0
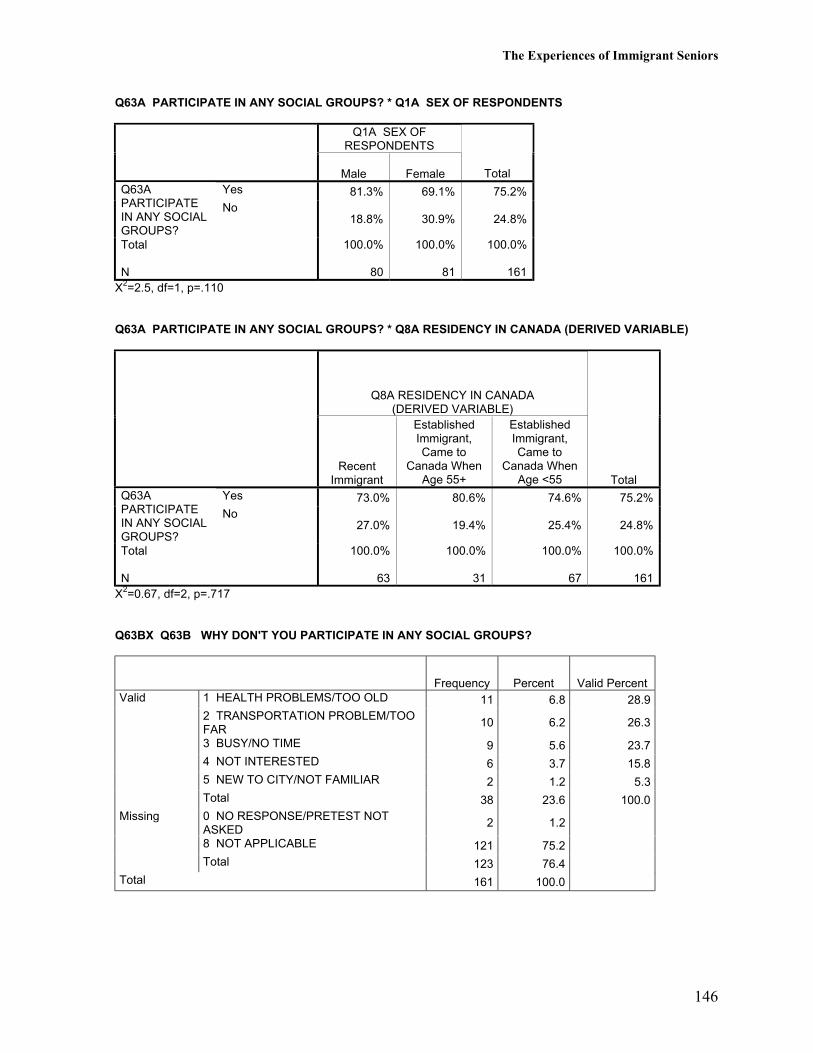
The Experiences of Immigrant Seniors
146
Q63A PARTICIPATE IN ANY SOCIAL GROUPS? * Q1A SEX OF RESPONDENTS
Q1A SEX OFRESPONDENTS
Male Female TotalYes 81.3% 69.1% 75.2%Q63A
PARTICIPATEIN ANY SOCIALGROUPS?
No18.8% 30.9% 24.8%
Total
N
100.0%
80
100.0%
81
100.0%
161X2=2.5, df=1, p=.110
Q63A PARTICIPATE IN ANY SOCIAL GROUPS? * Q8A RESIDENCY IN CANADA (DERIVED VARIABLE)
Q8A RESIDENCY IN CANADA(DERIVED VARIABLE)
RecentImmigrant
EstablishedImmigrant,Came to
Canada WhenAge 55+
EstablishedImmigrant,Came to
Canada WhenAge <55 Total
Yes 73.0% 80.6% 74.6% 75.2%Q63APARTICIPATEIN ANY SOCIALGROUPS?
No27.0% 19.4% 25.4% 24.8%
Total
N
100.0%
63
100.0%
31
100.0%
67
100.0%
161X2=0.67, df=2, p=.717
Q63BX Q63B WHY DON'T YOU PARTICIPATE IN ANY SOCIAL GROUPS?
Frequency Percent Valid PercentValid 1 HEALTH PROBLEMS/TOO OLD 11 6.8 28.9
2 TRANSPORTATION PROBLEM/TOOFAR
10 6.2 26.3
3 BUSY/NO TIME 9 5.6 23.74 NOT INTERESTED 6 3.7 15.85 NEW TO CITY/NOT FAMILIAR 2 1.2 5.3Total 38 23.6 100.0
Missing 0 NO RESPONSE/PRETEST NOTASKED
2 1.2
8 NOT APPLICABLE 121 75.2Total 123 76.4
Total 161 100.0
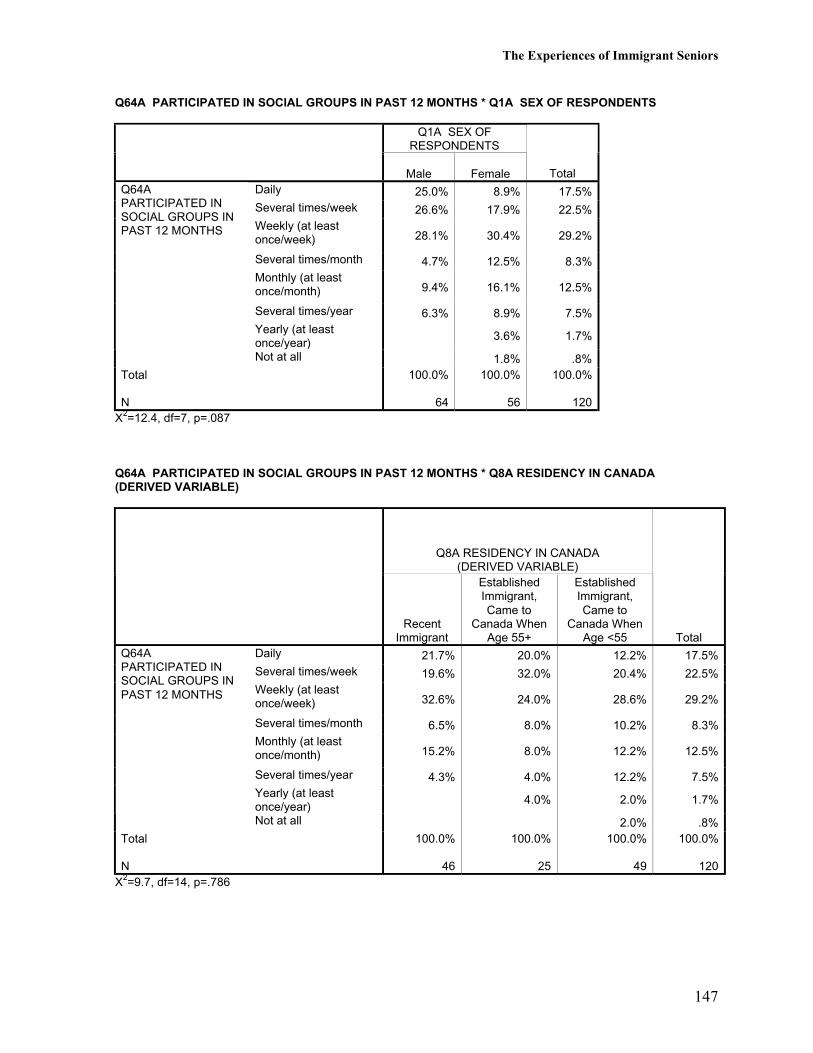
The Experiences of Immigrant Seniors
147
Q64A PARTICIPATED IN SOCIAL GROUPS IN PAST 12 MONTHS * Q1A SEX OF RESPONDENTS
Q1A SEX OFRESPONDENTS
Male Female TotalDaily 25.0% 8.9% 17.5%Several times/week 26.6% 17.9% 22.5%Weekly (at leastonce/week) 28.1% 30.4% 29.2%
Several times/month 4.7% 12.5% 8.3%Monthly (at leastonce/month) 9.4% 16.1% 12.5%
Several times/year 6.3% 8.9% 7.5%Yearly (at leastonce/year)
3.6% 1.7%
Q64APARTICIPATED INSOCIAL GROUPS INPAST 12 MONTHS
Not at all 1.8% .8%Total
N
100.0%
64
100.0%
56
100.0%
120X2=12.4, df=7, p=.087
Q64A PARTICIPATED IN SOCIAL GROUPS IN PAST 12 MONTHS * Q8A RESIDENCY IN CANADA(DERIVED VARIABLE)
Q8A RESIDENCY IN CANADA(DERIVED VARIABLE)
RecentImmigrant
EstablishedImmigrant,Came to
Canada WhenAge 55+
EstablishedImmigrant,Came to
Canada WhenAge <55 Total
Daily 21.7% 20.0% 12.2% 17.5%Several times/week 19.6% 32.0% 20.4% 22.5%Weekly (at leastonce/week) 32.6% 24.0% 28.6% 29.2%
Several times/month 6.5% 8.0% 10.2% 8.3%Monthly (at leastonce/month) 15.2% 8.0% 12.2% 12.5%
Several times/year 4.3% 4.0% 12.2% 7.5%Yearly (at leastonce/year)
4.0% 2.0% 1.7%
Q64APARTICIPATED INSOCIAL GROUPS INPAST 12 MONTHS
Not at all 2.0% .8%Total
N
100.0%
46
100.0%
25
100.0%
49
100.0%
120X2=9.7, df=14, p=.786
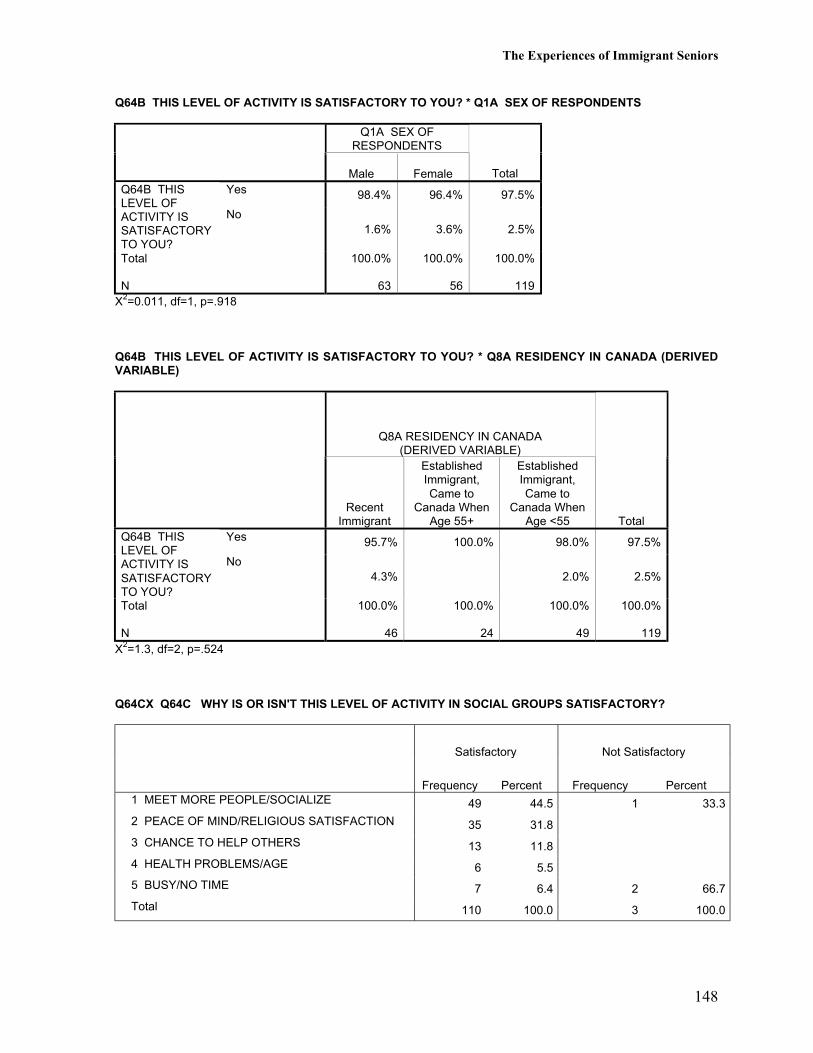
The Experiences of Immigrant Seniors
148
Q64B THIS LEVEL OF ACTIVITY IS SATISFACTORY TO YOU? * Q1A SEX OF RESPONDENTS
Q1A SEX OFRESPONDENTS
Male Female TotalYes 98.4% 96.4% 97.5%Q64B THIS
LEVEL OFACTIVITY ISSATISFACTORYTO YOU?
No1.6% 3.6% 2.5%
Total
N
100.0%
63
100.0%
56
100.0%
119X2=0.011, df=1, p=.918
Q64B THIS LEVEL OF ACTIVITY IS SATISFACTORY TO YOU? * Q8A RESIDENCY IN CANADA (DERIVEDVARIABLE)
Q8A RESIDENCY IN CANADA(DERIVED VARIABLE)
RecentImmigrant
EstablishedImmigrant,Came to
Canada WhenAge 55+
EstablishedImmigrant,Came to
Canada WhenAge <55 Total
Yes 95.7% 100.0% 98.0% 97.5%Q64B THISLEVEL OFACTIVITY ISSATISFACTORYTO YOU?
No4.3% 2.0% 2.5%
Total
N
100.0%
46
100.0%
24
100.0%
49
100.0%
119X2=1.3, df=2, p=.524
Q64CX Q64C WHY IS OR ISN'T THIS LEVEL OF ACTIVITY IN SOCIAL GROUPS SATISFACTORY?
Satisfactory Not Satisfactory
Frequency Percent Frequency Percent1 MEET MORE PEOPLE/SOCIALIZE 49 44.5 1 33.3
2 PEACE OF MIND/RELIGIOUS SATISFACTION 35 31.8
3 CHANCE TO HELP OTHERS 13 11.8
4 HEALTH PROBLEMS/AGE 6 5.5
5 BUSY/NO TIME 7 6.4 2 66.7
Total 110 100.0 3 100.0
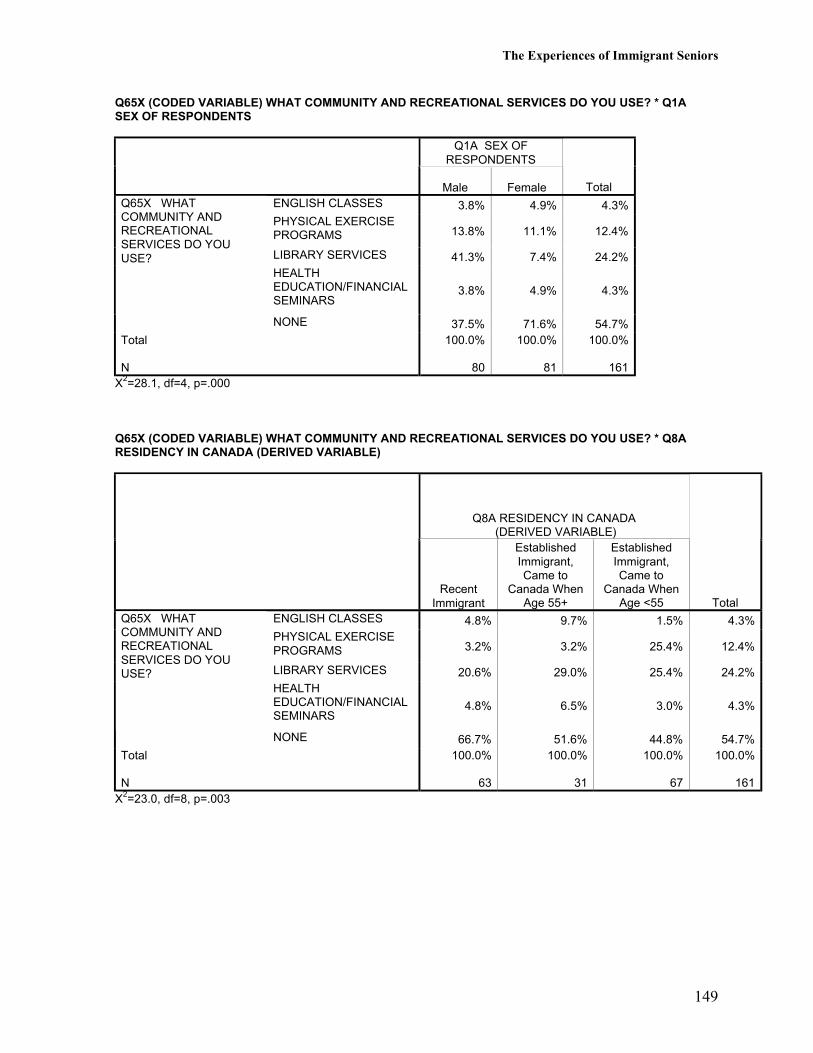
The Experiences of Immigrant Seniors
149
Q65X (CODED VARIABLE) WHAT COMMUNITY AND RECREATIONAL SERVICES DO YOU USE? * Q1ASEX OF RESPONDENTS
Q1A SEX OFRESPONDENTS
Male Female TotalENGLISH CLASSES 3.8% 4.9% 4.3%PHYSICAL EXERCISEPROGRAMS 13.8% 11.1% 12.4%
LIBRARY SERVICES 41.3% 7.4% 24.2%HEALTHEDUCATION/FINANCIALSEMINARS
3.8% 4.9% 4.3%
Q65X WHATCOMMUNITY ANDRECREATIONALSERVICES DO YOUUSE?
NONE 37.5% 71.6% 54.7%Total
N
100.0%
80
100.0%
81
100.0%
161X2=28.1, df=4, p=.000
Q65X (CODED VARIABLE) WHAT COMMUNITY AND RECREATIONAL SERVICES DO YOU USE? * Q8ARESIDENCY IN CANADA (DERIVED VARIABLE)
Q8A RESIDENCY IN CANADA (DERIVED VARIABLE)
RecentImmigrant
EstablishedImmigrant,Came to
Canada WhenAge 55+
EstablishedImmigrant,Came to
Canada WhenAge <55 Total
ENGLISH CLASSES 4.8% 9.7% 1.5% 4.3%PHYSICAL EXERCISEPROGRAMS 3.2% 3.2% 25.4% 12.4%
LIBRARY SERVICES 20.6% 29.0% 25.4% 24.2%HEALTHEDUCATION/FINANCIALSEMINARS
4.8% 6.5% 3.0% 4.3%
Q65X WHATCOMMUNITY ANDRECREATIONALSERVICES DO YOUUSE?
NONE 66.7% 51.6% 44.8% 54.7%Total
N
100.0%
63
100.0%
31
100.0%
67
100.0%
161X2=23.0, df=8, p=.003
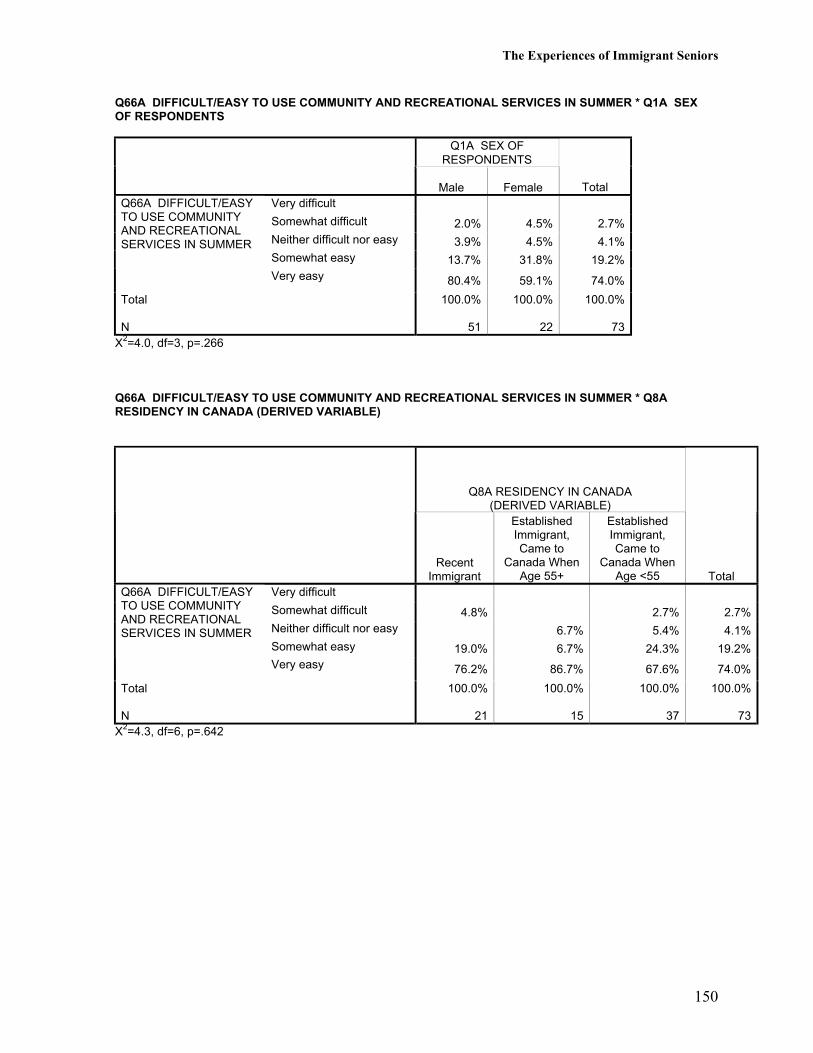
The Experiences of Immigrant Seniors
150
Q66A DIFFICULT/EASY TO USE COMMUNITY AND RECREATIONAL SERVICES IN SUMMER * Q1A SEXOF RESPONDENTS
Q1A SEX OFRESPONDENTS
Male Female TotalVery difficult
Somewhat difficult 2.0% 4.5% 2.7%Neither difficult nor easy 3.9% 4.5% 4.1%Somewhat easy 13.7% 31.8% 19.2%
Q66A DIFFICULT/EASYTO USE COMMUNITYAND RECREATIONALSERVICES IN SUMMER
Very easy 80.4% 59.1% 74.0%
Total
N
100.0%
51
100.0%
22
100.0%
73X2=4.0, df=3, p=.266
Q66A DIFFICULT/EASY TO USE COMMUNITY AND RECREATIONAL SERVICES IN SUMMER * Q8ARESIDENCY IN CANADA (DERIVED VARIABLE)
Q8A RESIDENCY IN CANADA(DERIVED VARIABLE)
RecentImmigrant
EstablishedImmigrant,Came to
Canada WhenAge 55+
EstablishedImmigrant,Came to
Canada WhenAge <55 Total
Very difficult
Somewhat difficult 4.8% 2.7% 2.7%Neither difficult nor easy 6.7% 5.4% 4.1%Somewhat easy 19.0% 6.7% 24.3% 19.2%
Q66A DIFFICULT/EASYTO USE COMMUNITYAND RECREATIONALSERVICES IN SUMMER
Very easy 76.2% 86.7% 67.6% 74.0%
Total
N
100.0%
21
100.0%
15
100.0%
37
100.0%
73X2=4.3, df=6, p=.642
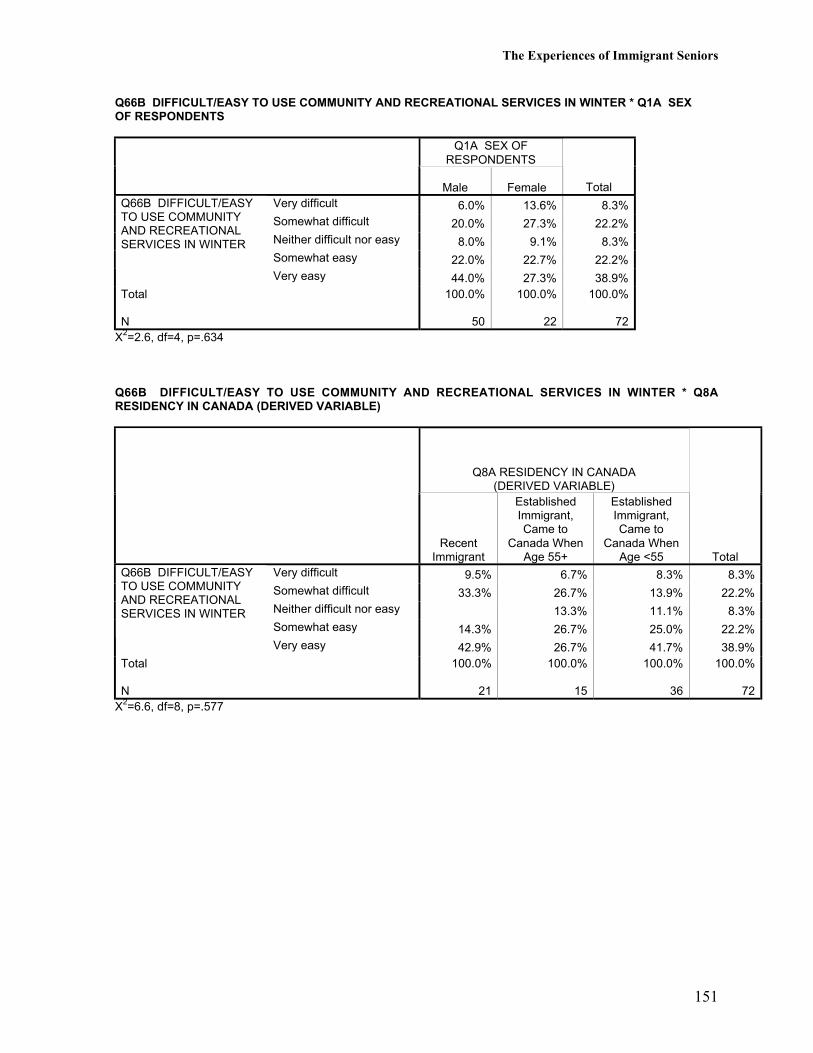
The Experiences of Immigrant Seniors
151
Q66B DIFFICULT/EASY TO USE COMMUNITY AND RECREATIONAL SERVICES IN WINTER * Q1A SEXOF RESPONDENTS
Q1A SEX OFRESPONDENTS
Male Female TotalVery difficult 6.0% 13.6% 8.3%Somewhat difficult 20.0% 27.3% 22.2%Neither difficult nor easy 8.0% 9.1% 8.3%Somewhat easy 22.0% 22.7% 22.2%
Q66B DIFFICULT/EASYTO USE COMMUNITYAND RECREATIONALSERVICES IN WINTER
Very easy 44.0% 27.3% 38.9%Total
N
100.0%
50
100.0%
22
100.0%
72X2=2.6, df=4, p=.634
Q66B DIFFICULT/EASY TO USE COMMUNITY AND RECREATIONAL SERVICES IN WINTER * Q8ARESIDENCY IN CANADA (DERIVED VARIABLE)
Q8A RESIDENCY IN CANADA(DERIVED VARIABLE)
RecentImmigrant
EstablishedImmigrant,Came to
Canada WhenAge 55+
EstablishedImmigrant,Came to
Canada WhenAge <55 Total
Very difficult 9.5% 6.7% 8.3% 8.3%Somewhat difficult 33.3% 26.7% 13.9% 22.2%Neither difficult nor easy 13.3% 11.1% 8.3%Somewhat easy 14.3% 26.7% 25.0% 22.2%
Q66B DIFFICULT/EASYTO USE COMMUNITYAND RECREATIONALSERVICES IN WINTER
Very easy 42.9% 26.7% 41.7% 38.9%Total
N
100.0%
21
100.0%
15
100.0%
36
100.0%
72X2=6.6, df=8, p=.577
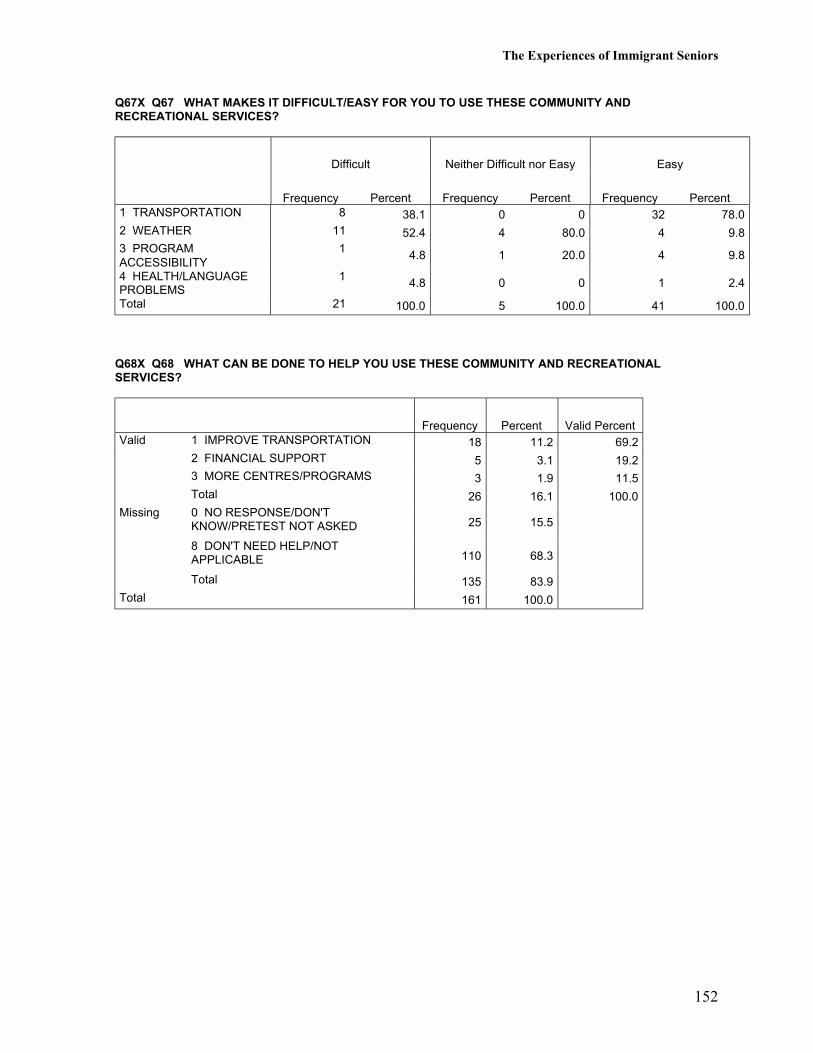
The Experiences of Immigrant Seniors
152
Q67X Q67 WHAT MAKES IT DIFFICULT/EASY FOR YOU TO USE THESE COMMUNITY ANDRECREATIONAL SERVICES?
Difficult Neither Difficult nor Easy Easy
Frequency Percent Frequency Percent Frequency Percent1 TRANSPORTATION 8 38.1 0 0 32 78.02 WEATHER 11 52.4 4 80.0 4 9.83 PROGRAMACCESSIBILITY
14.8 1 20.0 4 9.8
4 HEALTH/LANGUAGEPROBLEMS
14.8 0 0 1 2.4
Total 21 100.0 5 100.0 41 100.0
Q68X Q68 WHAT CAN BE DONE TO HELP YOU USE THESE COMMUNITY AND RECREATIONALSERVICES?
Frequency Percent Valid PercentValid 1 IMPROVE TRANSPORTATION 18 11.2 69.2
2 FINANCIAL SUPPORT 5 3.1 19.23 MORE CENTRES/PROGRAMS 3 1.9 11.5Total 26 16.1 100.0
Missing 0 NO RESPONSE/DON'TKNOW/PRETEST NOT ASKED 25 15.5
8 DON'T NEED HELP/NOTAPPLICABLE 110 68.3
Total 135 83.9Total 161 100.0
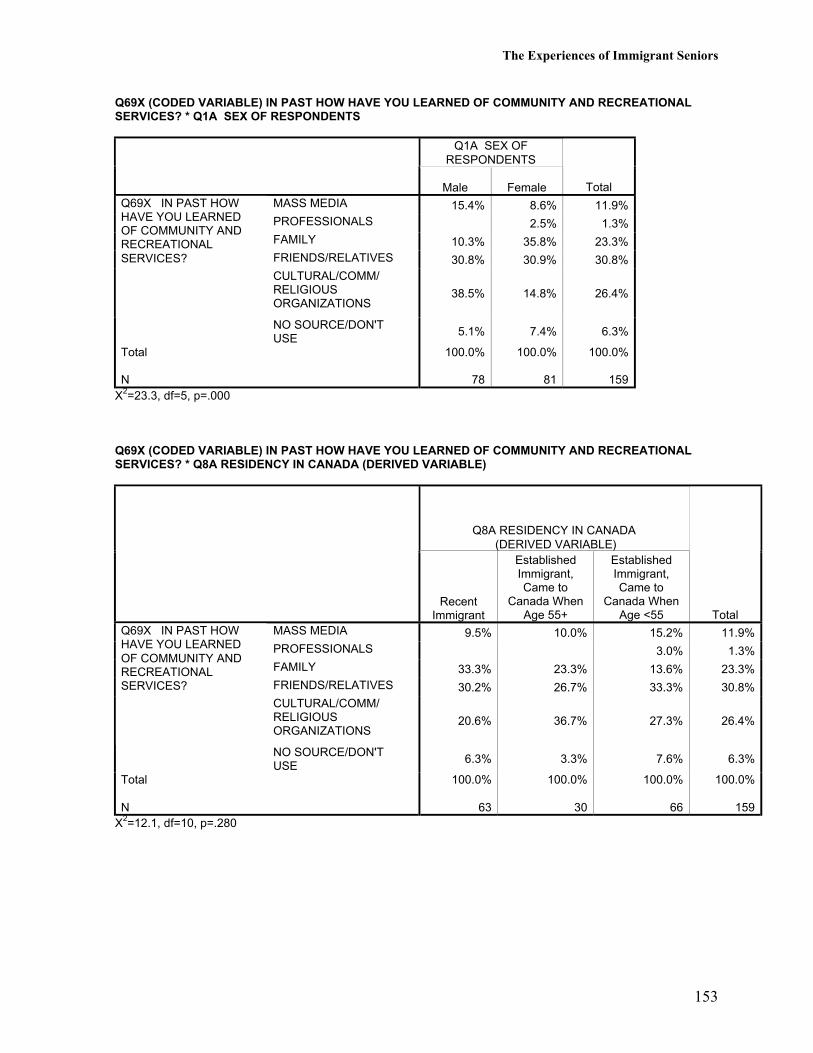
The Experiences of Immigrant Seniors
153
Q69X (CODED VARIABLE) IN PAST HOW HAVE YOU LEARNED OF COMMUNITY AND RECREATIONALSERVICES? * Q1A SEX OF RESPONDENTS
Q1A SEX OFRESPONDENTS
Male Female TotalMASS MEDIA 15.4% 8.6% 11.9%PROFESSIONALS 2.5% 1.3%FAMILY 10.3% 35.8% 23.3%FRIENDS/RELATIVES 30.8% 30.9% 30.8%CULTURAL/COMM/RELIGIOUSORGANIZATIONS
38.5% 14.8% 26.4%
Q69X IN PAST HOWHAVE YOU LEARNEDOF COMMUNITY ANDRECREATIONALSERVICES?
NO SOURCE/DON'TUSE
5.1% 7.4% 6.3%
Total
N
100.0%
78
100.0%
81
100.0%
159X2=23.3, df=5, p=.000
Q69X (CODED VARIABLE) IN PAST HOW HAVE YOU LEARNED OF COMMUNITY AND RECREATIONALSERVICES? * Q8A RESIDENCY IN CANADA (DERIVED VARIABLE)
Q8A RESIDENCY IN CANADA (DERIVED VARIABLE)
RecentImmigrant
EstablishedImmigrant,Came to
Canada WhenAge 55+
EstablishedImmigrant,Came to
Canada WhenAge <55 Total
MASS MEDIA 9.5% 10.0% 15.2% 11.9%PROFESSIONALS 3.0% 1.3%FAMILY 33.3% 23.3% 13.6% 23.3%FRIENDS/RELATIVES 30.2% 26.7% 33.3% 30.8%CULTURAL/COMM/RELIGIOUSORGANIZATIONS
20.6% 36.7% 27.3% 26.4%
Q69X IN PAST HOWHAVE YOU LEARNEDOF COMMUNITY ANDRECREATIONALSERVICES?
NO SOURCE/DON'TUSE
6.3% 3.3% 7.6% 6.3%
Total
N
100.0%
63
100.0%
30
100.0%
66
100.0%
159X2=12.1, df=10, p=.280

The Experiences of Immigrant Seniors
154
The Experiences of Immigrant Seniors
155
Social Contacts and Satisfaction with Life
Most respondents (58%) spent some time alone at home each day including 20% ofrespondents who spent 6 or more hours alone in a typical day. One in eight (13%) indicatedthat they would preferred to spend less time alone, although 83% prefer to spend the sameamount of time alone and 4% would like more time alone.
Thirty-nine percent of respondents said that they do not know people from other cultural orethnic groups than their own. Females and recent immigrants and immigrants who came toCanada at an older age were more likely to say that they do not know people from othercultural or ethnic groups.
Most respondents (77%) had frequent contact (daily or several times a week or weekly) byphone, letter or email with family, friends or relatives. Eighteen percent would prefer morefrequent contact. Recent immigrants and immigrants who came to Canada at an older agewere more likely to prefer additional contact than established immigrants who came toCanada at a younger age.
Most respondents (60%) had frequent (daily or several times a week or weekly) face-to-facevisits with family, friends or relatives in Edmonton. Twenty-one percent would prefer morefrequent visits. Recent immigrants reported less frequent visits than established immigrants.
Almost all respondents (92%) said that they have someone to confide in or talk to about theirprivate feelings or concerns. Confidants were typically a spouse, son or daughter, friend orother family member. Women were more likely than men to confide in a son or daughter andmen were more likely than women to confide in a friend and in family members in general.
Virtually all respondents (99%) said that they have someone they can really count on to helpout in a crisis situation. Respondents indicated that sons/daughters and family generally weremost likely to help out in a crisis. Established immigrants who came to Canada when youngeralso tended to rely on friends.
Almost all respondents (94%) said that they have someone to count on to give them advicewhen they are making important personal decisions. Advisors were typically a spouse, son ordaughter, friend or other family member.
Virtually all respondents (99%) said that they have someone that makes them feel loved.Respondents indicated that family in general was most likely to make them feel loved.
About one quarter of respondents (28%) said that they were aware of at least one other SouthAsian senior living in Edmonton who seemed to be lonely. Half of these respondents said thatthey were thinking of three or fewer seniors who seemed lonely. Respondents tended to thinkthat the sources of loneliness lay primarily in family problems and relationships and thatsolutions could be found mainly in senior housing, senior centres/programs, and increasedsocial contact.
The Experiences of Immigrant Seniors
156
Sixty-three percent of respondents indicated that they never feel lonely themselves. Maleswere more likely than females to say that they were lonely “frequently” (15% of males versus4% of females). However, 3% of females and none of the males said that they were lonely “allof the time.”
Most respondents indicated that people in their family ask for their opinion (advice/guidance),respect their decisions, share their values (males were more likely to say “occasionally” andfemales more likely to say “all of the time”), make it easy for them to eat the kind of foodthey like (males were more likely to say “occasionally” or “frequently” and females morelikely to say “all of the time”), make it easy for them to practice their customs and traditions(again males were more likely to say “occasionally” or “frequently” and females more likelyto say “all of the time”), ensure that they get enough rest and are not overworked (males weremore likely to say “frequently” and females more likely to say “all of the time”), take care ofthem when they are sick, ensure that they get a good diet and any needed medication, andensure that they get enough exercise.
Ninety-one percent of respondents were satisfied or very satisfied with their life as a whole.There were no statistically significant differences between males and females or betweenrecent and established immigrants.
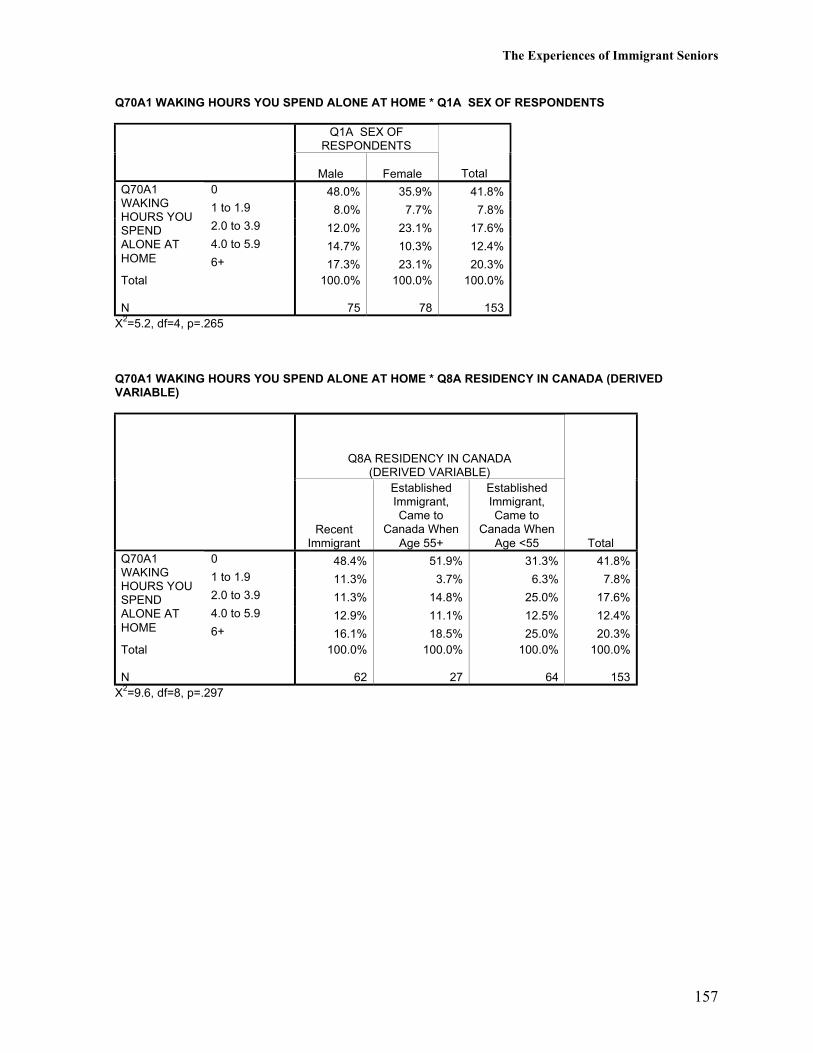
The Experiences of Immigrant Seniors
157
Q70A1 WAKING HOURS YOU SPEND ALONE AT HOME * Q1A SEX OF RESPONDENTS
Q1A SEX OFRESPONDENTS
Male Female Total0 48.0% 35.9% 41.8%1 to 1.9 8.0% 7.7% 7.8%2.0 to 3.9 12.0% 23.1% 17.6%4.0 to 5.9 14.7% 10.3% 12.4%
Q70A1WAKINGHOURS YOUSPENDALONE ATHOME 6+ 17.3% 23.1% 20.3%Total
N
100.0%
75
100.0%
78
100.0%
153X2=5.2, df=4, p=.265
Q70A1 WAKING HOURS YOU SPEND ALONE AT HOME * Q8A RESIDENCY IN CANADA (DERIVEDVARIABLE)
Q8A RESIDENCY IN CANADA(DERIVED VARIABLE)
RecentImmigrant
EstablishedImmigrant,Came to
Canada WhenAge 55+
EstablishedImmigrant,Came to
Canada WhenAge <55 Total
0 48.4% 51.9% 31.3% 41.8%1 to 1.9 11.3% 3.7% 6.3% 7.8%2.0 to 3.9 11.3% 14.8% 25.0% 17.6%4.0 to 5.9 12.9% 11.1% 12.5% 12.4%
Q70A1WAKINGHOURS YOUSPENDALONE ATHOME 6+ 16.1% 18.5% 25.0% 20.3%Total
N
100.0%
62
100.0%
27
100.0%
64
100.0%
153X2=9.6, df=8, p=.297
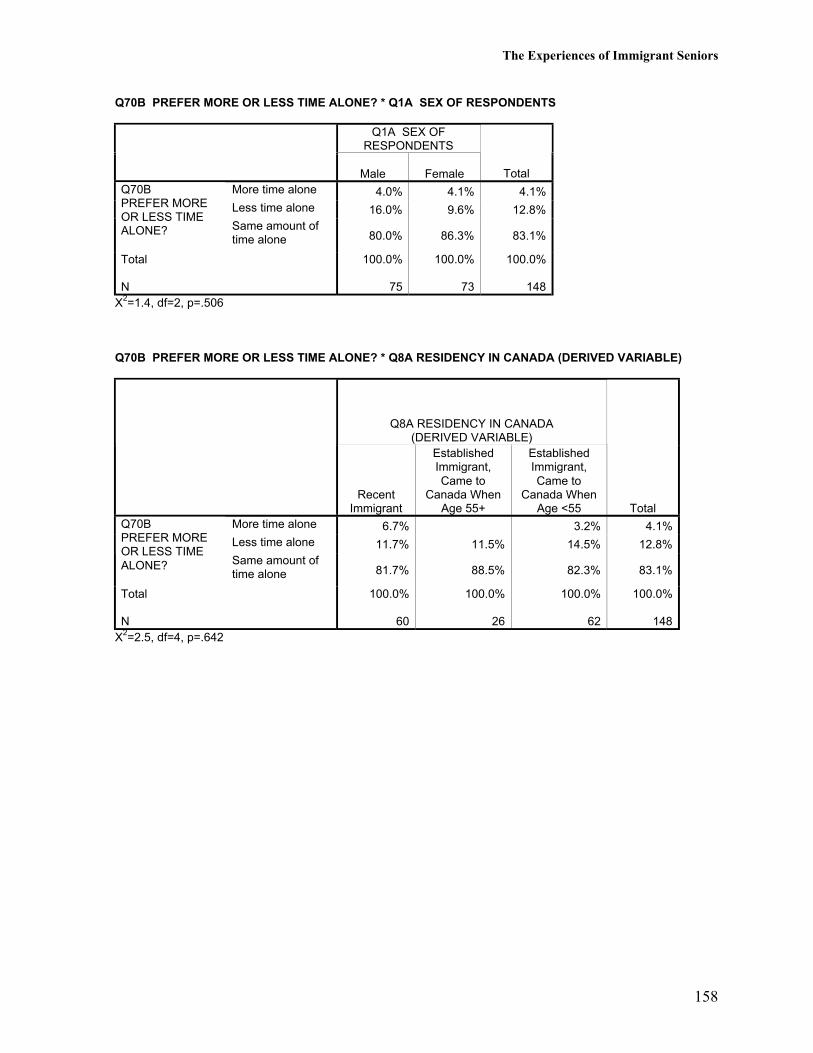
The Experiences of Immigrant Seniors
158
Q70B PREFER MORE OR LESS TIME ALONE? * Q1A SEX OF RESPONDENTS
Q1A SEX OFRESPONDENTS
Male Female TotalMore time alone 4.0% 4.1% 4.1%Less time alone 16.0% 9.6% 12.8%
Q70BPREFER MOREOR LESS TIMEALONE? Same amount of
time alone 80.0% 86.3% 83.1%
Total
N
100.0%
75
100.0%
73
100.0%
148X2=1.4, df=2, p=.506
Q70B PREFER MORE OR LESS TIME ALONE? * Q8A RESIDENCY IN CANADA (DERIVED VARIABLE)
Q8A RESIDENCY IN CANADA(DERIVED VARIABLE)
RecentImmigrant
EstablishedImmigrant,Came to
Canada WhenAge 55+
EstablishedImmigrant,Came to
Canada WhenAge <55 Total
More time alone 6.7% 3.2% 4.1%Less time alone 11.7% 11.5% 14.5% 12.8%
Q70BPREFER MOREOR LESS TIMEALONE? Same amount of
time alone 81.7% 88.5% 82.3% 83.1%
Total
N
100.0%
60
100.0%
26
100.0%
62
100.0%
148X2=2.5, df=4, p=.642
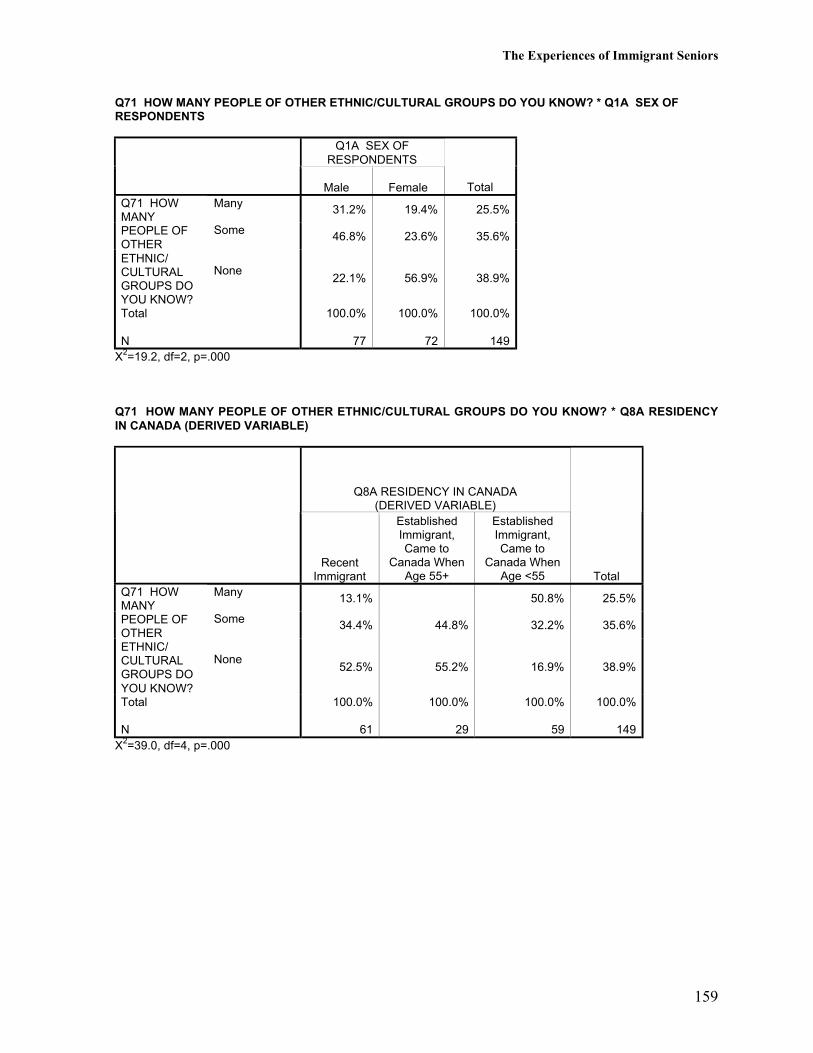
The Experiences of Immigrant Seniors
159
Q71 HOW MANY PEOPLE OF OTHER ETHNIC/CULTURAL GROUPS DO YOU KNOW? * Q1A SEX OFRESPONDENTS
Q1A SEX OFRESPONDENTS
Male Female TotalMany 31.2% 19.4% 25.5%
Some 46.8% 23.6% 35.6%
Q71 HOWMANYPEOPLE OFOTHERETHNIC/CULTURALGROUPS DOYOU KNOW?
None22.1% 56.9% 38.9%
Total
N
100.0%
77
100.0%
72
100.0%
149X2=19.2, df=2, p=.000
Q71 HOW MANY PEOPLE OF OTHER ETHNIC/CULTURAL GROUPS DO YOU KNOW? * Q8A RESIDENCYIN CANADA (DERIVED VARIABLE)
Q8A RESIDENCY IN CANADA(DERIVED VARIABLE)
RecentImmigrant
EstablishedImmigrant,Came to
Canada WhenAge 55+
EstablishedImmigrant,Came to
Canada WhenAge <55 Total
Many 13.1% 50.8% 25.5%
Some 34.4% 44.8% 32.2% 35.6%
Q71 HOWMANYPEOPLE OFOTHERETHNIC/CULTURALGROUPS DOYOU KNOW?
None52.5% 55.2% 16.9% 38.9%
Total
N
100.0%
61
100.0%
29
100.0%
59
100.0%
149X2=39.0, df=4, p=.000
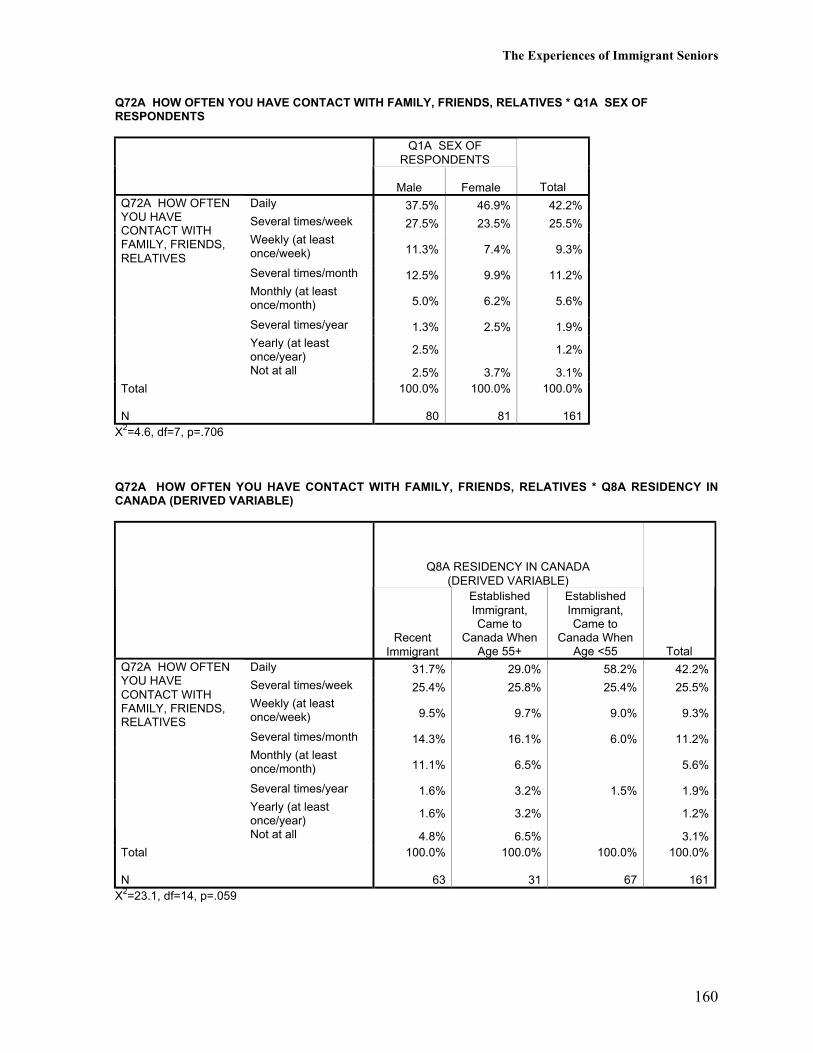
The Experiences of Immigrant Seniors
160
Q72A HOW OFTEN YOU HAVE CONTACT WITH FAMILY, FRIENDS, RELATIVES * Q1A SEX OFRESPONDENTS
Q1A SEX OFRESPONDENTS
Male Female TotalDaily 37.5% 46.9% 42.2%Several times/week 27.5% 23.5% 25.5%Weekly (at leastonce/week) 11.3% 7.4% 9.3%
Several times/month 12.5% 9.9% 11.2%Monthly (at leastonce/month) 5.0% 6.2% 5.6%
Several times/year 1.3% 2.5% 1.9%Yearly (at leastonce/year)
2.5% 1.2%
Q72A HOW OFTENYOU HAVECONTACT WITHFAMILY, FRIENDS,RELATIVES
Not at all 2.5% 3.7% 3.1%Total
N
100.0%
80
100.0%
81
100.0%
161X2=4.6, df=7, p=.706
Q72A HOW OFTEN YOU HAVE CONTACT WITH FAMILY, FRIENDS, RELATIVES * Q8A RESIDENCY INCANADA (DERIVED VARIABLE)
Q8A RESIDENCY IN CANADA(DERIVED VARIABLE)
RecentImmigrant
EstablishedImmigrant,Came to
Canada WhenAge 55+
EstablishedImmigrant,Came to
Canada WhenAge <55 Total
Daily 31.7% 29.0% 58.2% 42.2%Several times/week 25.4% 25.8% 25.4% 25.5%Weekly (at leastonce/week) 9.5% 9.7% 9.0% 9.3%
Several times/month 14.3% 16.1% 6.0% 11.2%Monthly (at leastonce/month) 11.1% 6.5% 5.6%
Several times/year 1.6% 3.2% 1.5% 1.9%Yearly (at leastonce/year)
1.6% 3.2% 1.2%
Q72A HOW OFTENYOU HAVECONTACT WITHFAMILY, FRIENDS,RELATIVES
Not at all 4.8% 6.5% 3.1%Total
N
100.0%
63
100.0%
31
100.0%
67
100.0%
161X2=23.1, df=14, p=.059
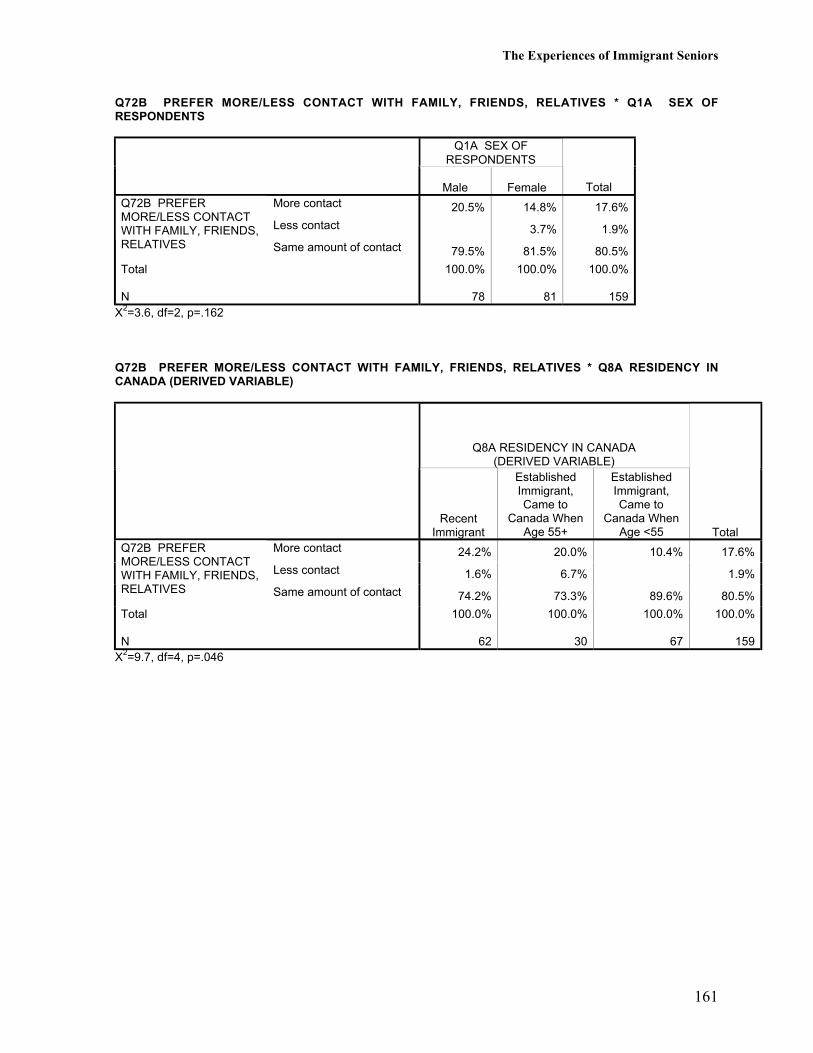
The Experiences of Immigrant Seniors
161
Q72B PREFER MORE/LESS CONTACT WITH FAMILY, FRIENDS, RELATIVES * Q1A SEX OFRESPONDENTS
Q1A SEX OFRESPONDENTS
Male Female TotalMore contact 20.5% 14.8% 17.6%
Less contact 3.7% 1.9%
Q72B PREFERMORE/LESS CONTACTWITH FAMILY, FRIENDS,RELATIVES Same amount of contact 79.5% 81.5% 80.5%
Total
N
100.0%
78
100.0%
81
100.0%
159X2=3.6, df=2, p=.162
Q72B PREFER MORE/LESS CONTACT WITH FAMILY, FRIENDS, RELATIVES * Q8A RESIDENCY INCANADA (DERIVED VARIABLE)
Q8A RESIDENCY IN CANADA(DERIVED VARIABLE)
RecentImmigrant
EstablishedImmigrant,Came to
Canada WhenAge 55+
EstablishedImmigrant,Came to
Canada WhenAge <55 Total
More contact 24.2% 20.0% 10.4% 17.6%
Less contact 1.6% 6.7% 1.9%
Q72B PREFERMORE/LESS CONTACTWITH FAMILY, FRIENDS,RELATIVES Same amount of contact 74.2% 73.3% 89.6% 80.5%
Total
N
100.0%
62
100.0%
30
100.0%
67
100.0%
159X2=9.7, df=4, p=.046
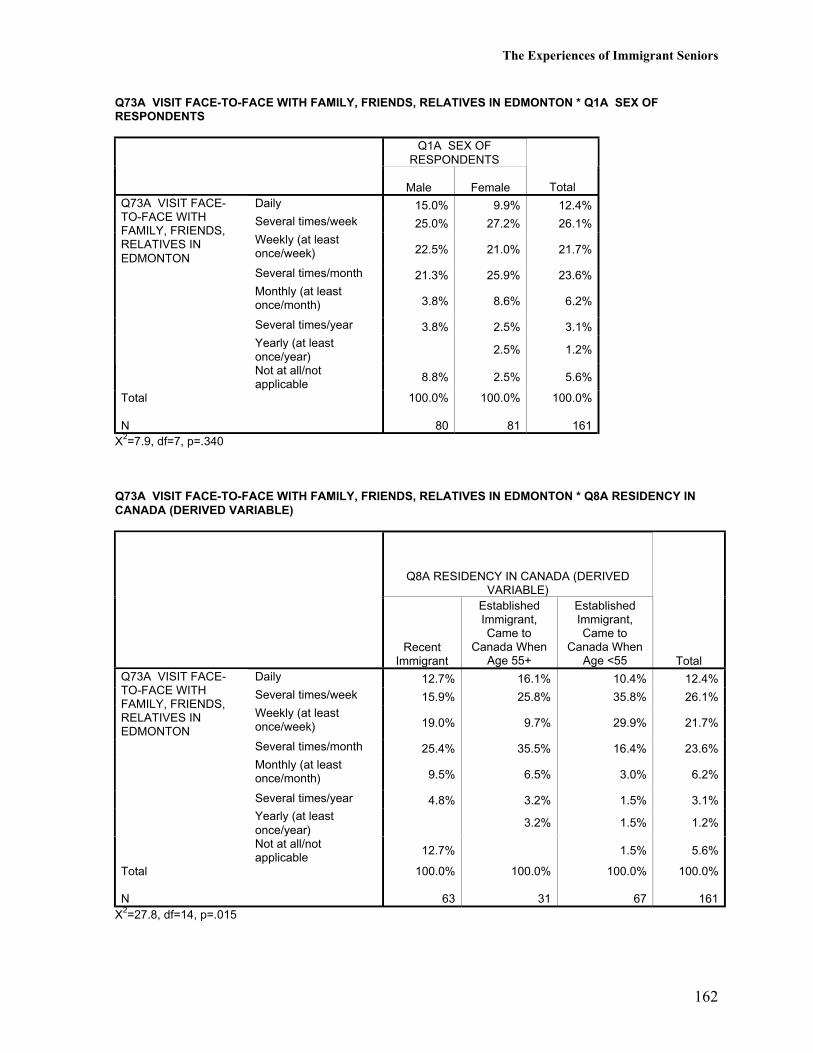
The Experiences of Immigrant Seniors
162
Q73A VISIT FACE-TO-FACE WITH FAMILY, FRIENDS, RELATIVES IN EDMONTON * Q1A SEX OFRESPONDENTS
Q1A SEX OFRESPONDENTS
Male Female TotalDaily 15.0% 9.9% 12.4%Several times/week 25.0% 27.2% 26.1%Weekly (at leastonce/week) 22.5% 21.0% 21.7%
Several times/month 21.3% 25.9% 23.6%Monthly (at leastonce/month) 3.8% 8.6% 6.2%
Several times/year 3.8% 2.5% 3.1%Yearly (at leastonce/year)
2.5% 1.2%
Q73A VISIT FACE-TO-FACE WITHFAMILY, FRIENDS,RELATIVES INEDMONTON
Not at all/notapplicable
8.8% 2.5% 5.6%
Total
N
100.0%
80
100.0%
81
100.0%
161X2=7.9, df=7, p=.340
Q73A VISIT FACE-TO-FACE WITH FAMILY, FRIENDS, RELATIVES IN EDMONTON * Q8A RESIDENCY INCANADA (DERIVED VARIABLE)
Q8A RESIDENCY IN CANADA (DERIVEDVARIABLE)
RecentImmigrant
EstablishedImmigrant,Came to
Canada WhenAge 55+
EstablishedImmigrant,Came to
Canada WhenAge <55 Total
Daily 12.7% 16.1% 10.4% 12.4%Several times/week 15.9% 25.8% 35.8% 26.1%Weekly (at leastonce/week) 19.0% 9.7% 29.9% 21.7%
Several times/month 25.4% 35.5% 16.4% 23.6%Monthly (at leastonce/month) 9.5% 6.5% 3.0% 6.2%
Several times/year 4.8% 3.2% 1.5% 3.1%Yearly (at leastonce/year)
3.2% 1.5% 1.2%
Q73A VISIT FACE-TO-FACE WITHFAMILY, FRIENDS,RELATIVES INEDMONTON
Not at all/notapplicable
12.7% 1.5% 5.6%
Total
N
100.0%
63
100.0%
31
100.0%
67
100.0%
161X2=27.8, df=14, p=.015
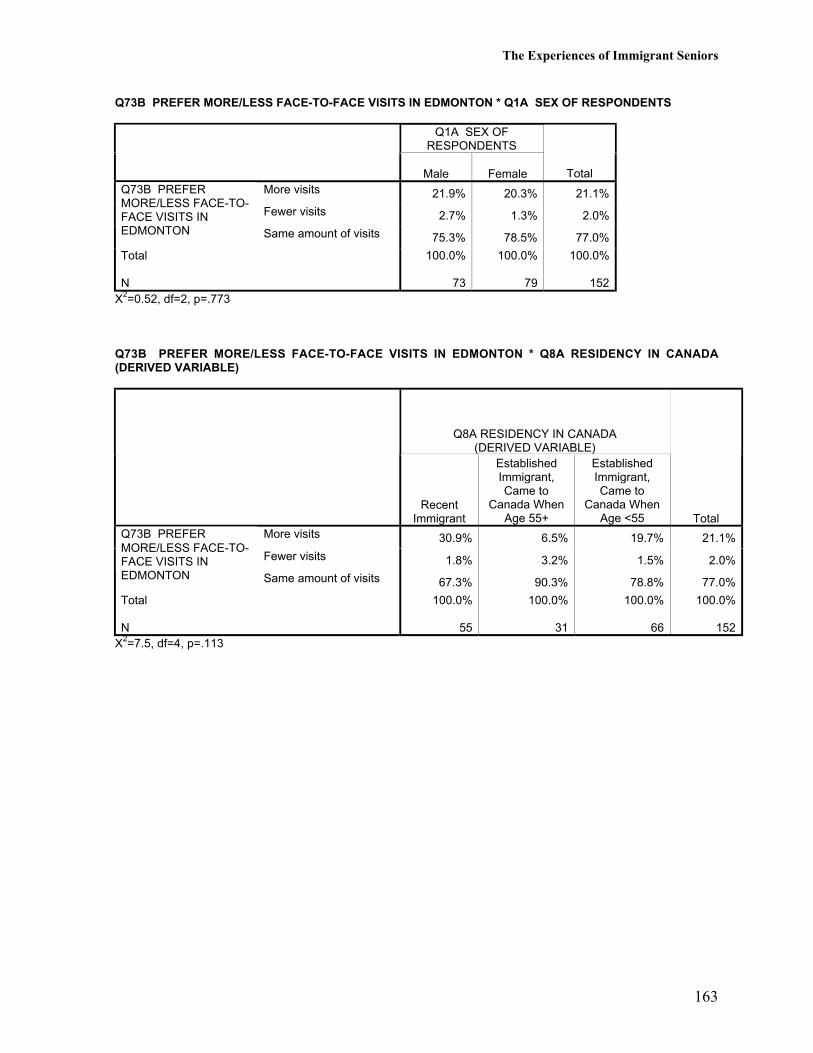
The Experiences of Immigrant Seniors
163
Q73B PREFER MORE/LESS FACE-TO-FACE VISITS IN EDMONTON * Q1A SEX OF RESPONDENTS
Q1A SEX OFRESPONDENTS
Male Female TotalMore visits 21.9% 20.3% 21.1%
Fewer visits 2.7% 1.3% 2.0%
Q73B PREFERMORE/LESS FACE-TO-FACE VISITS INEDMONTON Same amount of visits 75.3% 78.5% 77.0%
Total
N
100.0%
73
100.0%
79
100.0%
152X2=0.52, df=2, p=.773
Q73B PREFER MORE/LESS FACE-TO-FACE VISITS IN EDMONTON * Q8A RESIDENCY IN CANADA(DERIVED VARIABLE)
Q8A RESIDENCY IN CANADA(DERIVED VARIABLE)
RecentImmigrant
EstablishedImmigrant,Came to
Canada WhenAge 55+
EstablishedImmigrant,Came to
Canada WhenAge <55 Total
More visits 30.9% 6.5% 19.7% 21.1%
Fewer visits 1.8% 3.2% 1.5% 2.0%
Q73B PREFERMORE/LESS FACE-TO-FACE VISITS INEDMONTON Same amount of visits 67.3% 90.3% 78.8% 77.0%
Total
N
100.0%
55
100.0%
31
100.0%
66
100.0%
152X2=7.5, df=4, p=.113
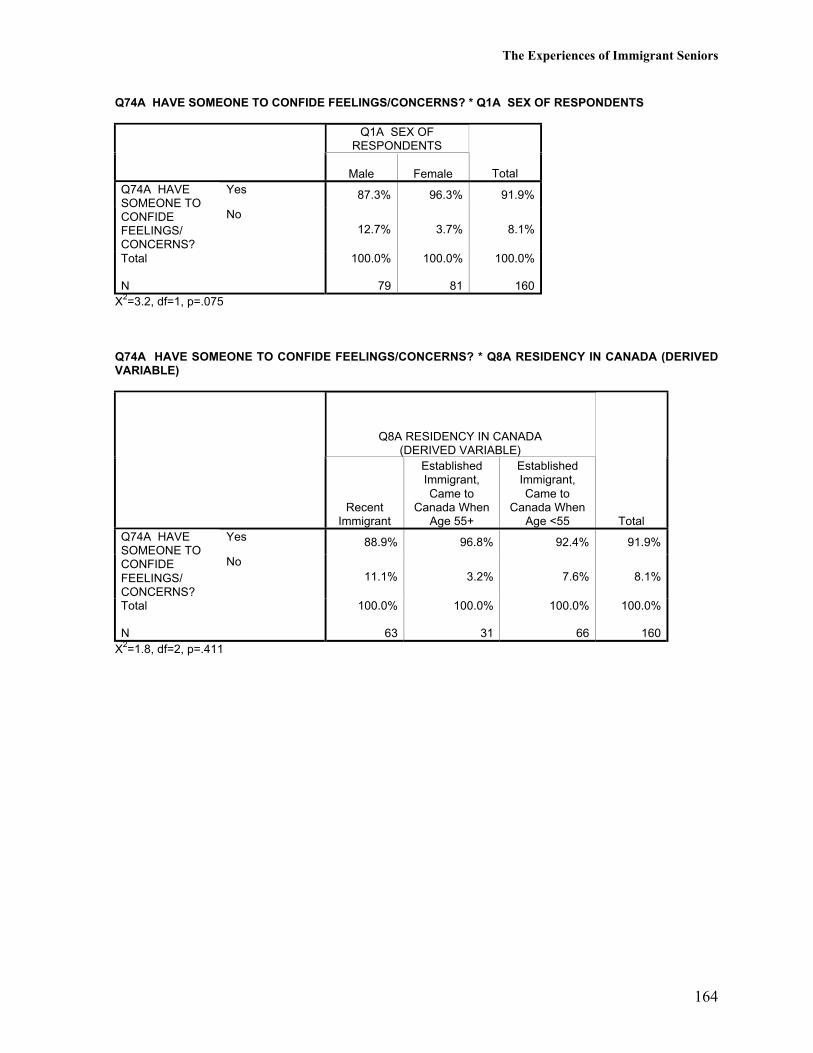
The Experiences of Immigrant Seniors
164
Q74A HAVE SOMEONE TO CONFIDE FEELINGS/CONCERNS? * Q1A SEX OF RESPONDENTS
Q1A SEX OFRESPONDENTS
Male Female TotalYes 87.3% 96.3% 91.9%Q74A HAVE
SOMEONE TOCONFIDEFEELINGS/CONCERNS?
No12.7% 3.7% 8.1%
Total
N
100.0%
79
100.0%
81
100.0%
160X2=3.2, df=1, p=.075
Q74A HAVE SOMEONE TO CONFIDE FEELINGS/CONCERNS? * Q8A RESIDENCY IN CANADA (DERIVEDVARIABLE)
Q8A RESIDENCY IN CANADA(DERIVED VARIABLE)
RecentImmigrant
EstablishedImmigrant,Came to
Canada WhenAge 55+
EstablishedImmigrant,Came to
Canada WhenAge <55 Total
Yes 88.9% 96.8% 92.4% 91.9%Q74A HAVESOMEONE TOCONFIDEFEELINGS/CONCERNS?
No11.1% 3.2% 7.6% 8.1%
Total
N
100.0%
63
100.0%
31
100.0%
66
100.0%
160X2=1.8, df=2, p=.411
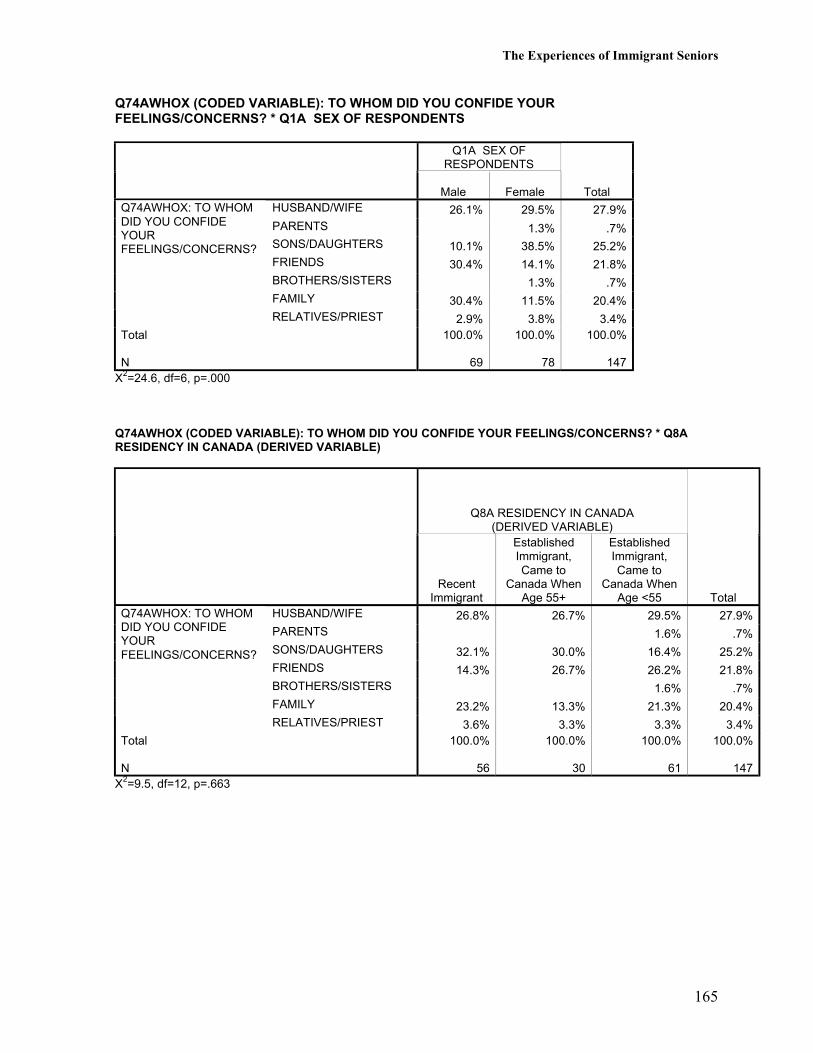
The Experiences of Immigrant Seniors
165
Q74AWHOX (CODED VARIABLE): TO WHOM DID YOU CONFIDE YOURFEELINGS/CONCERNS? * Q1A SEX OF RESPONDENTS
Q1A SEX OFRESPONDENTS
Male Female TotalHUSBAND/WIFE 26.1% 29.5% 27.9%PARENTS 1.3% .7%SONS/DAUGHTERS 10.1% 38.5% 25.2%FRIENDS 30.4% 14.1% 21.8%BROTHERS/SISTERS 1.3% .7%FAMILY 30.4% 11.5% 20.4%
Q74AWHOX: TO WHOMDID YOU CONFIDEYOURFEELINGS/CONCERNS?
RELATIVES/PRIEST 2.9% 3.8% 3.4%Total
N
100.0%
69
100.0%
78
100.0%
147X2=24.6, df=6, p=.000
Q74AWHOX (CODED VARIABLE): TO WHOM DID YOU CONFIDE YOUR FEELINGS/CONCERNS? * Q8ARESIDENCY IN CANADA (DERIVED VARIABLE)
Q8A RESIDENCY IN CANADA(DERIVED VARIABLE)
RecentImmigrant
EstablishedImmigrant,Came to
Canada WhenAge 55+
EstablishedImmigrant,Came to
Canada WhenAge <55 Total
HUSBAND/WIFE 26.8% 26.7% 29.5% 27.9%PARENTS 1.6% .7%SONS/DAUGHTERS 32.1% 30.0% 16.4% 25.2%FRIENDS 14.3% 26.7% 26.2% 21.8%BROTHERS/SISTERS 1.6% .7%FAMILY 23.2% 13.3% 21.3% 20.4%
Q74AWHOX: TO WHOMDID YOU CONFIDEYOURFEELINGS/CONCERNS?
RELATIVES/PRIEST 3.6% 3.3% 3.3% 3.4%Total
N
100.0%
56
100.0%
30
100.0%
61
100.0%
147X2=9.5, df=12, p=.663

The Experiences of Immigrant Seniors
166
Q74B HAVE SOMEONE TO HELP IN CRISIS? * Q1A SEX OF RESPONDENTS
Q1A SEX OFRESPONDENTS
Male Female TotalYes 98.8% 98.8% 98.8%Q74B HAVE
SOMEONE TOHELP INCRISIS?
No1.3% 1.2% 1.2%
Total
N
100.0%
80
100.0%
81
100.0%
161X2=0.00, df=1, p=1.000
Q74B HAVE SOMEONE TO HELP IN CRISIS? * Q8A RESIDENCY IN CANADA (DERIVED VARIABLE)
Q8A RESIDENCY IN CANADA(DERIVED VARIABLE)
RecentImmigrant
EstablishedImmigrant,Came to
Canada WhenAge 55+
EstablishedImmigrant,Came to
Canada WhenAge <55 Total
Yes 98.4% 100.0% 98.5% 98.8%Q74B HAVESOMEONE TOHELP INCRISIS?
No1.6% 1.5% 1.2%
Total
N
100.0%
63
100.0%
31
100.0%
67
100.0%
161X2=0.49, df=2, p=.785
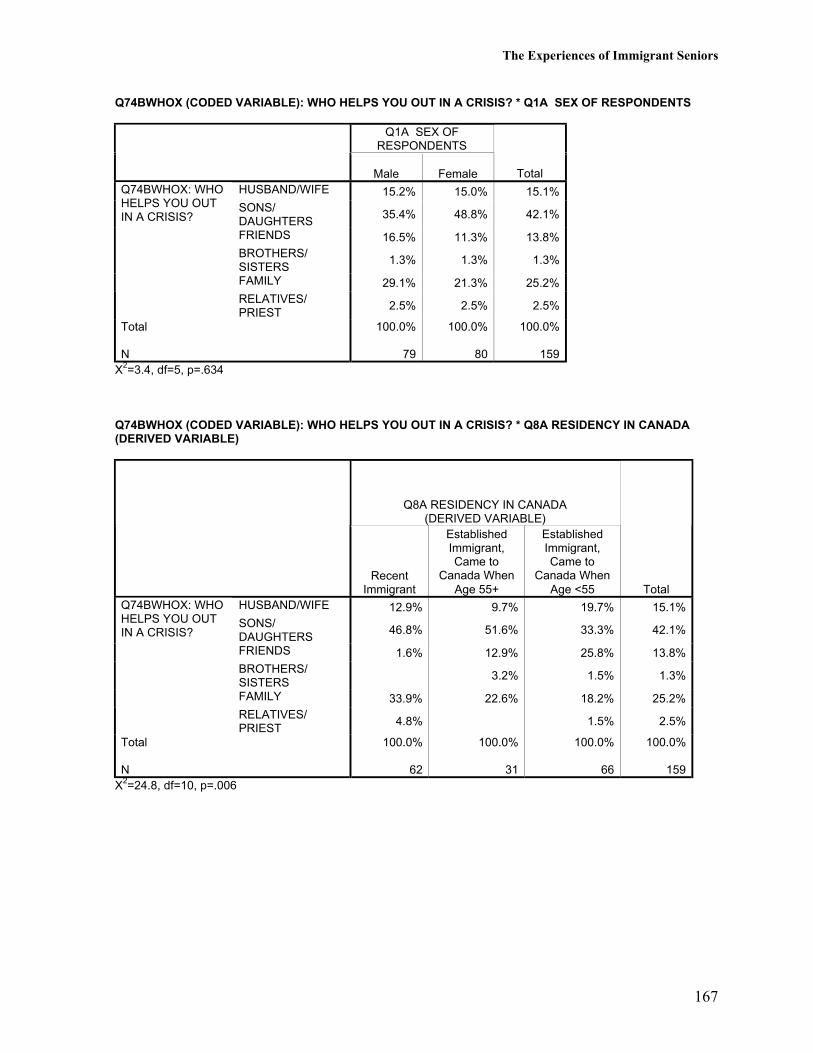
The Experiences of Immigrant Seniors
167
Q74BWHOX (CODED VARIABLE): WHO HELPS YOU OUT IN A CRISIS? * Q1A SEX OF RESPONDENTS
Q1A SEX OFRESPONDENTS
Male Female TotalHUSBAND/WIFE 15.2% 15.0% 15.1%SONS/DAUGHTERS
35.4% 48.8% 42.1%
FRIENDS 16.5% 11.3% 13.8%BROTHERS/SISTERS
1.3% 1.3% 1.3%
FAMILY 29.1% 21.3% 25.2%
Q74BWHOX: WHOHELPS YOU OUTIN A CRISIS?
RELATIVES/PRIEST
2.5% 2.5% 2.5%
Total
N
100.0%
79
100.0%
80
100.0%
159X2=3.4, df=5, p=.634
Q74BWHOX (CODED VARIABLE): WHO HELPS YOU OUT IN A CRISIS? * Q8A RESIDENCY IN CANADA(DERIVED VARIABLE)
Q8A RESIDENCY IN CANADA(DERIVED VARIABLE)
RecentImmigrant
EstablishedImmigrant,Came to
Canada WhenAge 55+
EstablishedImmigrant,Came to
Canada WhenAge <55 Total
HUSBAND/WIFE 12.9% 9.7% 19.7% 15.1%SONS/DAUGHTERS
46.8% 51.6% 33.3% 42.1%
FRIENDS 1.6% 12.9% 25.8% 13.8%BROTHERS/SISTERS
3.2% 1.5% 1.3%
FAMILY 33.9% 22.6% 18.2% 25.2%
Q74BWHOX: WHOHELPS YOU OUTIN A CRISIS?
RELATIVES/PRIEST
4.8% 1.5% 2.5%
Total
N
100.0%
62
100.0%
31
100.0%
66
100.0%
159X2=24.8, df=10, p=.006
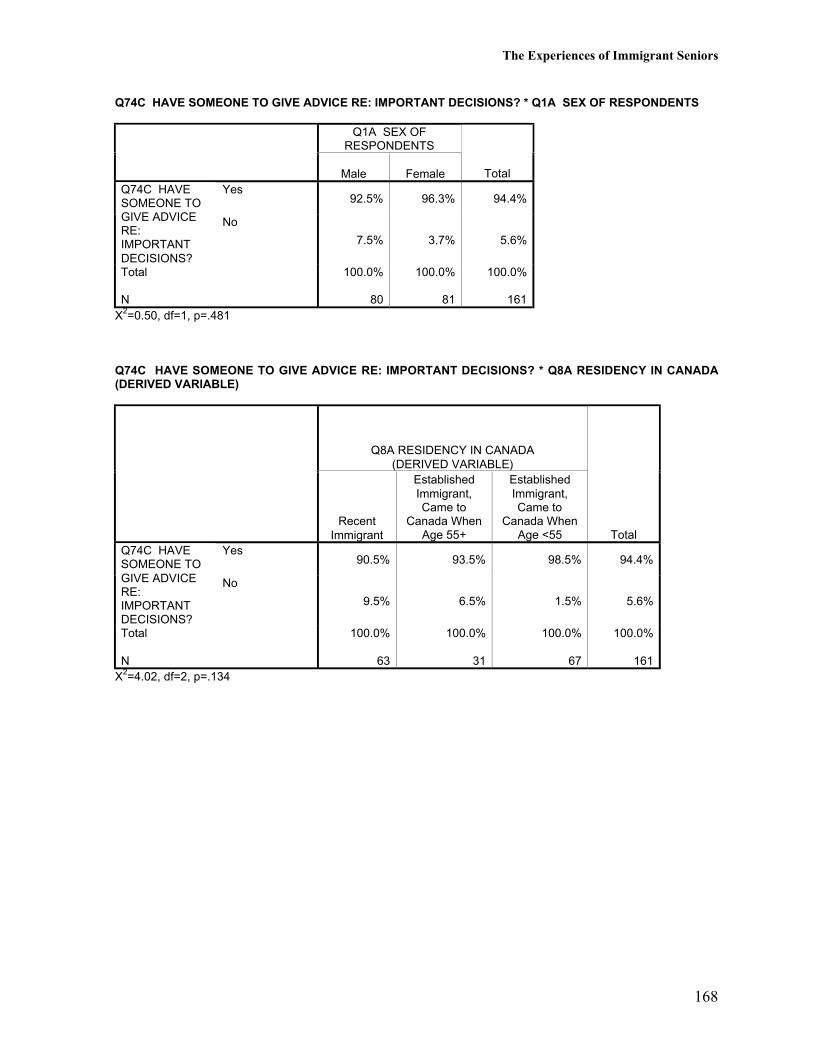
The Experiences of Immigrant Seniors
168
Q74C HAVE SOMEONE TO GIVE ADVICE RE: IMPORTANT DECISIONS? * Q1A SEX OF RESPONDENTS
Q1A SEX OFRESPONDENTS
Male Female TotalYes
92.5% 96.3% 94.4%Q74C HAVESOMEONE TOGIVE ADVICERE:IMPORTANTDECISIONS?
No
7.5% 3.7% 5.6%
Total
N
100.0%
80
100.0%
81
100.0%
161X2=0.50, df=1, p=.481
Q74C HAVE SOMEONE TO GIVE ADVICE RE: IMPORTANT DECISIONS? * Q8A RESIDENCY IN CANADA(DERIVED VARIABLE)
Q8A RESIDENCY IN CANADA(DERIVED VARIABLE)
RecentImmigrant
EstablishedImmigrant,Came to
Canada WhenAge 55+
EstablishedImmigrant,Came to
Canada WhenAge <55 Total
Yes90.5% 93.5% 98.5% 94.4%
Q74C HAVESOMEONE TOGIVE ADVICERE:IMPORTANTDECISIONS?
No
9.5% 6.5% 1.5% 5.6%
Total
N
100.0%
63
100.0%
31
100.0%
67
100.0%
161X2=4.02, df=2, p=.134
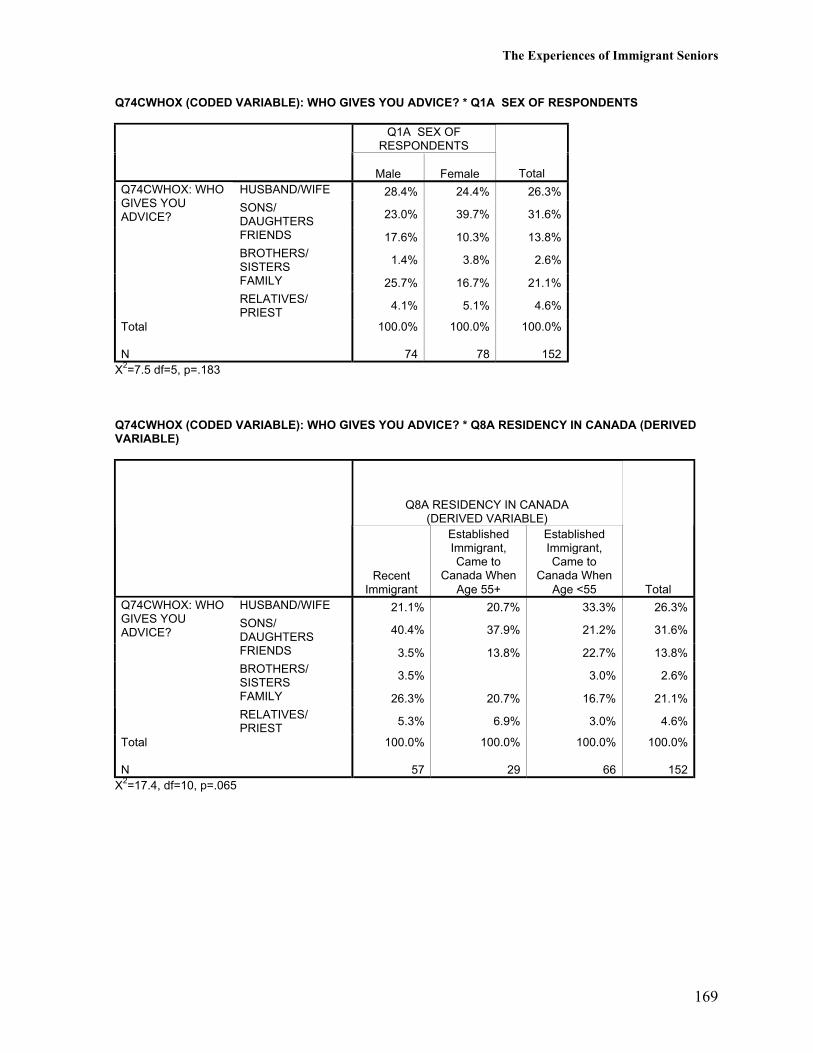
The Experiences of Immigrant Seniors
169
Q74CWHOX (CODED VARIABLE): WHO GIVES YOU ADVICE? * Q1A SEX OF RESPONDENTS
Q1A SEX OFRESPONDENTS
Male Female TotalHUSBAND/WIFE 28.4% 24.4% 26.3%SONS/DAUGHTERS
23.0% 39.7% 31.6%
FRIENDS 17.6% 10.3% 13.8%BROTHERS/SISTERS
1.4% 3.8% 2.6%
FAMILY 25.7% 16.7% 21.1%
Q74CWHOX: WHOGIVES YOUADVICE?
RELATIVES/PRIEST
4.1% 5.1% 4.6%
Total
N
100.0%
74
100.0%
78
100.0%
152X2=7.5 df=5, p=.183
Q74CWHOX (CODED VARIABLE): WHO GIVES YOU ADVICE? * Q8A RESIDENCY IN CANADA (DERIVEDVARIABLE)
Q8A RESIDENCY IN CANADA(DERIVED VARIABLE)
RecentImmigrant
EstablishedImmigrant,Came to
Canada WhenAge 55+
EstablishedImmigrant,Came to
Canada WhenAge <55 Total
HUSBAND/WIFE 21.1% 20.7% 33.3% 26.3%SONS/DAUGHTERS
40.4% 37.9% 21.2% 31.6%
FRIENDS 3.5% 13.8% 22.7% 13.8%BROTHERS/SISTERS
3.5% 3.0% 2.6%
FAMILY 26.3% 20.7% 16.7% 21.1%
Q74CWHOX: WHOGIVES YOUADVICE?
RELATIVES/PRIEST
5.3% 6.9% 3.0% 4.6%
Total
N
100.0%
57
100.0%
29
100.0%
66
100.0%
152X2=17.4, df=10, p=.065

The Experiences of Immigrant Seniors
170
Q74D HAVE SOMEONE THAT MAKES YOU FEEL LOVED? * Q1A SEX OF RESPONDENTS
Q1A SEX OFRESPONDENTS
Male Female TotalYes 98.8% 98.8% 98.8%Q74D HAVE
SOMEONETHAT MAKESYOU FEELLOVED?
No1.3% 1.2% 1.2%
Total
N
100.0%
80
100.0%
81
100.0%
161X2=0.00, df=1, p=1.000
Q74D HAVE SOMEONE THAT MAKES YOU FEEL LOVED? * Q8A RESIDENCY IN CANADA (DERIVEDVARIABLE)
Q8A RESIDENCY IN CANADA(DERIVED VARIABLE)
RecentImmigrant
EstablishedImmigrant,Came to
Canada WhenAge 55+
EstablishedImmigrant,Came to
Canada WhenAge <55 Total
Yes 98.4% 96.8% 100.0% 98.8%Q74D HAVESOMEONETHAT MAKESYOU FEELLOVED?
No1.6% 3.2% 1.2%
Total
N
100.0%
63
100.0%
31
100.0%
67
100.0%
161X2=1.9, df=2, p=.387
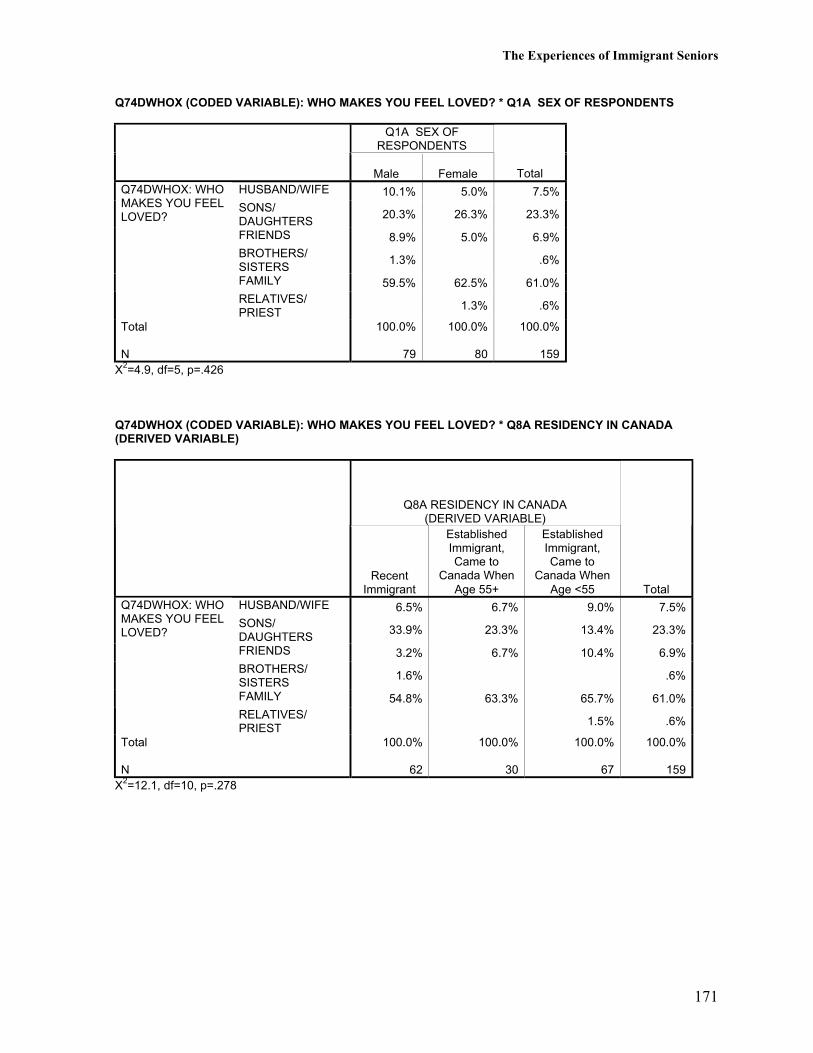
The Experiences of Immigrant Seniors
171
Q74DWHOX (CODED VARIABLE): WHO MAKES YOU FEEL LOVED? * Q1A SEX OF RESPONDENTS
Q1A SEX OFRESPONDENTS
Male Female TotalHUSBAND/WIFE 10.1% 5.0% 7.5%SONS/DAUGHTERS
20.3% 26.3% 23.3%
FRIENDS 8.9% 5.0% 6.9%BROTHERS/SISTERS
1.3% .6%
FAMILY 59.5% 62.5% 61.0%
Q74DWHOX: WHOMAKES YOU FEELLOVED?
RELATIVES/PRIEST
1.3% .6%
Total
N
100.0%
79
100.0%
80
100.0%
159X2=4.9, df=5, p=.426
Q74DWHOX (CODED VARIABLE): WHO MAKES YOU FEEL LOVED? * Q8A RESIDENCY IN CANADA(DERIVED VARIABLE)
Q8A RESIDENCY IN CANADA(DERIVED VARIABLE)
RecentImmigrant
EstablishedImmigrant,Came to
Canada WhenAge 55+
EstablishedImmigrant,Came to
Canada WhenAge <55 Total
HUSBAND/WIFE 6.5% 6.7% 9.0% 7.5%SONS/DAUGHTERS
33.9% 23.3% 13.4% 23.3%
FRIENDS 3.2% 6.7% 10.4% 6.9%BROTHERS/SISTERS
1.6% .6%
FAMILY 54.8% 63.3% 65.7% 61.0%
Q74DWHOX: WHOMAKES YOU FEELLOVED?
RELATIVES/PRIEST
1.5% .6%
Total
N
100.0%
62
100.0%
30
100.0%
67
100.0%
159X2=12.1, df=10, p=.278
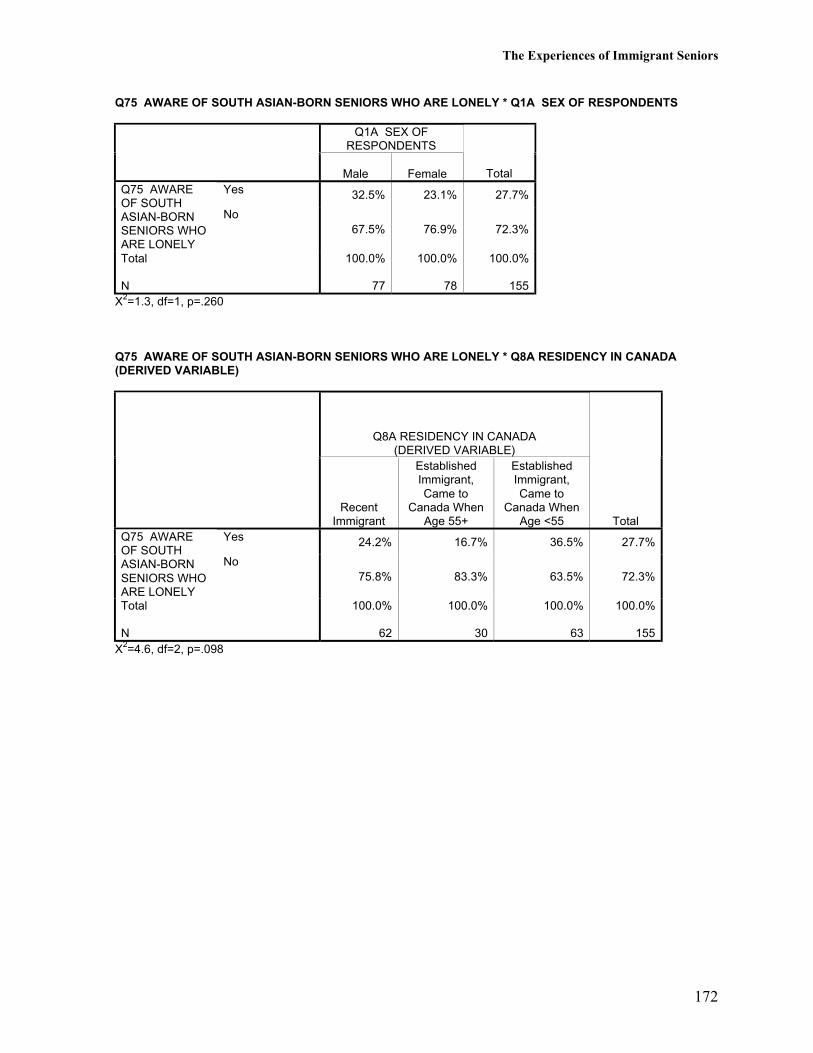
The Experiences of Immigrant Seniors
172
Q75 AWARE OF SOUTH ASIAN-BORN SENIORS WHO ARE LONELY * Q1A SEX OF RESPONDENTS
Q1A SEX OFRESPONDENTS
Male Female TotalYes 32.5% 23.1% 27.7%Q75 AWARE
OF SOUTHASIAN-BORNSENIORS WHOARE LONELY
No67.5% 76.9% 72.3%
Total
N
100.0%
77
100.0%
78
100.0%
155X2=1.3, df=1, p=.260
Q75 AWARE OF SOUTH ASIAN-BORN SENIORS WHO ARE LONELY * Q8A RESIDENCY IN CANADA(DERIVED VARIABLE)
Q8A RESIDENCY IN CANADA(DERIVED VARIABLE)
RecentImmigrant
EstablishedImmigrant,Came to
Canada WhenAge 55+
EstablishedImmigrant,Came to
Canada WhenAge <55 Total
Yes 24.2% 16.7% 36.5% 27.7%Q75 AWAREOF SOUTHASIAN-BORNSENIORS WHOARE LONELY
No75.8% 83.3% 63.5% 72.3%
Total
N
100.0%
62
100.0%
30
100.0%
63
100.0%
155X2=4.6, df=2, p=.098

The Experiences of Immigrant Seniors
173
Q76A NUMBER OF SOUTH ASIAN-BORN SENIORS WHO YOU KNOW ARE LONELY * Q1A SEX OFRESPONDENTS
Q1A SEX OFRESPONDENTS
Male Female Total1 24.0% 5.6% 16.3%2 20.0% 22.2% 20.9%3 8.0% 22.2% 14.0%
Q76ANUMBER OFSOUTH ASIAN-BORNSENIORSWHO YOUKNOW ARELONELY
4+
48.0% 50.0% 48.8%
Total
N
100.0%
25
100.0%
18
100.0%
43X2=3.7, df=3, p=.291
Q76A NUMBER OF SOUTH ASIAN-BORN SENIORS WHO YOU KNOW ARE LONELY * Q8A RESIDENCY INCANADA (DERIVED VARIABLE)
Q8A RESIDENCY IN CANADA(DERIVED VARIABLE)
RecentImmigrant
EstablishedImmigrant,Came to
Canada WhenAge 55+
EstablishedImmigrant,Came to
Canada WhenAge <55 Total
1 20.0% 40.0% 8.7% 16.3%2 6.7% 40.0% 26.1% 20.9%3 13.3% 17.4% 14.0%
Q76ANUMBER OFSOUTH ASIAN-BORNSENIORSWHO YOUKNOW ARELONELY
4+
60.0% 20.0% 47.8% 48.8%
Total
N
100.0%
15
100.0%
5
100.0%
23
100.0%
43X2=7.4, df=6, p=.284
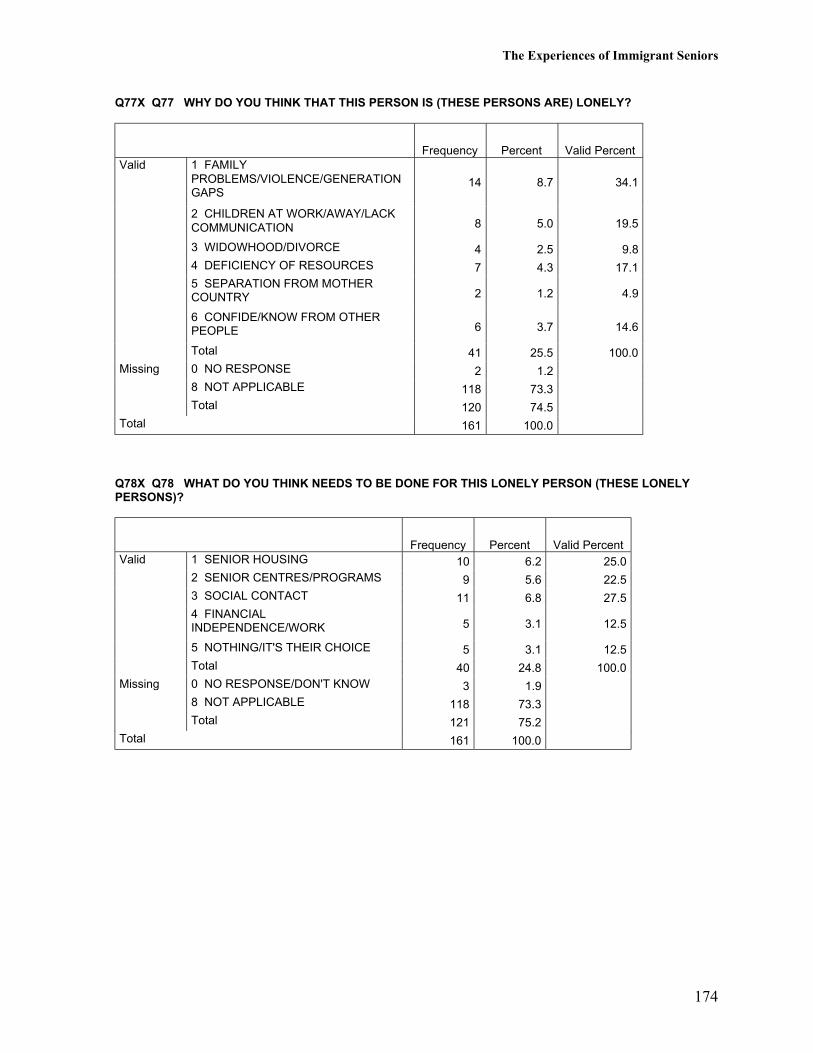
The Experiences of Immigrant Seniors
174
Q77X Q77 WHY DO YOU THINK THAT THIS PERSON IS (THESE PERSONS ARE) LONELY?
Frequency Percent Valid PercentValid 1 FAMILY
PROBLEMS/VIOLENCE/GENERATIONGAPS
14 8.7 34.1
2 CHILDREN AT WORK/AWAY/LACKCOMMUNICATION 8 5.0 19.5
3 WIDOWHOOD/DIVORCE 4 2.5 9.84 DEFICIENCY OF RESOURCES 7 4.3 17.15 SEPARATION FROM MOTHERCOUNTRY 2 1.2 4.9
6 CONFIDE/KNOW FROM OTHERPEOPLE 6 3.7 14.6
Total 41 25.5 100.0Missing 0 NO RESPONSE 2 1.2
8 NOT APPLICABLE 118 73.3Total 120 74.5
Total 161 100.0
Q78X Q78 WHAT DO YOU THINK NEEDS TO BE DONE FOR THIS LONELY PERSON (THESE LONELYPERSONS)?
Frequency Percent Valid PercentValid 1 SENIOR HOUSING 10 6.2 25.0
2 SENIOR CENTRES/PROGRAMS 9 5.6 22.53 SOCIAL CONTACT 11 6.8 27.54 FINANCIALINDEPENDENCE/WORK 5 3.1 12.5
5 NOTHING/IT'S THEIR CHOICE 5 3.1 12.5Total 40 24.8 100.0
Missing 0 NO RESPONSE/DON'T KNOW 3 1.98 NOT APPLICABLE 118 73.3Total 121 75.2
Total 161 100.0
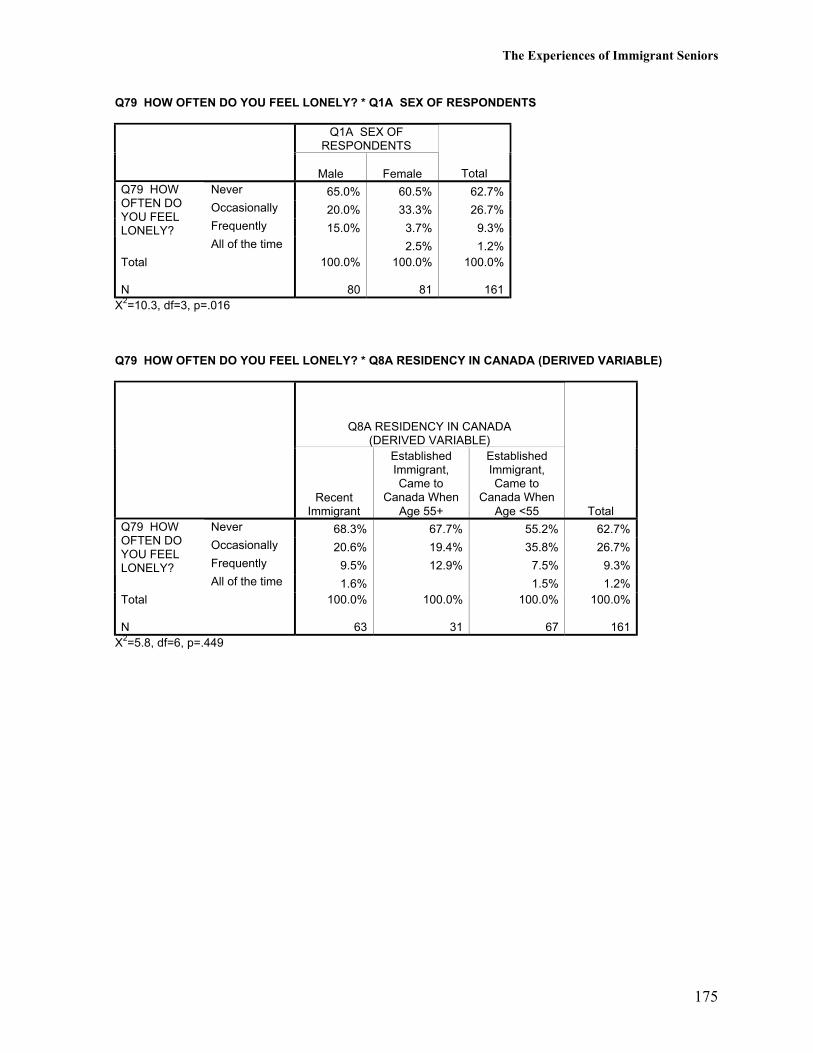
The Experiences of Immigrant Seniors
175
Q79 HOW OFTEN DO YOU FEEL LONELY? * Q1A SEX OF RESPONDENTS
Q1A SEX OFRESPONDENTS
Male Female TotalNever 65.0% 60.5% 62.7%Occasionally 20.0% 33.3% 26.7%Frequently 15.0% 3.7% 9.3%
Q79 HOWOFTEN DOYOU FEELLONELY?
All of the time 2.5% 1.2%Total
N
100.0%
80
100.0%
81
100.0%
161X2=10.3, df=3, p=.016
Q79 HOW OFTEN DO YOU FEEL LONELY? * Q8A RESIDENCY IN CANADA (DERIVED VARIABLE)
Q8A RESIDENCY IN CANADA(DERIVED VARIABLE)
RecentImmigrant
EstablishedImmigrant,Came to
Canada WhenAge 55+
EstablishedImmigrant,Came to
Canada WhenAge <55 Total
Never 68.3% 67.7% 55.2% 62.7%Occasionally 20.6% 19.4% 35.8% 26.7%Frequently 9.5% 12.9% 7.5% 9.3%
Q79 HOWOFTEN DOYOU FEELLONELY?
All of the time 1.6% 1.5% 1.2%Total
N
100.0%
63
100.0%
31
100.0%
67
100.0%
161X2=5.8, df=6, p=.449

The Experiences of Immigrant Seniors
176
Q80A PEOPLE IN YOUR FAMILY ASK YOUR OPINION * Q1A SEX OF RESPONDENTS
Q1A SEX OFRESPONDENTS
Male Female TotalNever 7.5% 8.6% 8.1%Occasionally 23.8% 22.2% 23.0%Frequently 25.0% 21.0% 23.0%
Q80A PEOPLE INYOUR FAMILYASK YOUROPINION
All of the time 43.8% 48.1% 46.0%Total
N
100.0%
80
100.0%
81
100.0%
161X2=0.56, df=3, p=.906
Q80A PEOPLE IN YOUR FAMILY ASK YOUR OPINION * Q8A RESIDENCY IN CANADA (DERIVEDVARIABLE)
Q8A RESIDENCY IN CANADA(DERIVED VARIABLE)
RecentImmigrant
EstablishedImmigrant,Came to
Canada WhenAge 55+
EstablishedImmigrant,Came to
Canada WhenAge <55 Total
Never 6.3% 12.9% 7.5% 8.1%Occasionally 20.6% 16.1% 28.4% 23.0%Frequently 27.0% 16.1% 22.4% 23.0%
Q80A PEOPLE INYOUR FAMILYASK YOUROPINION
All of the time 46.0% 54.8% 41.8% 46.0%Total
N
100.0%
63
100.0%
31
100.0%
67
100.0%
161X2=4.7, df=6, p=.589
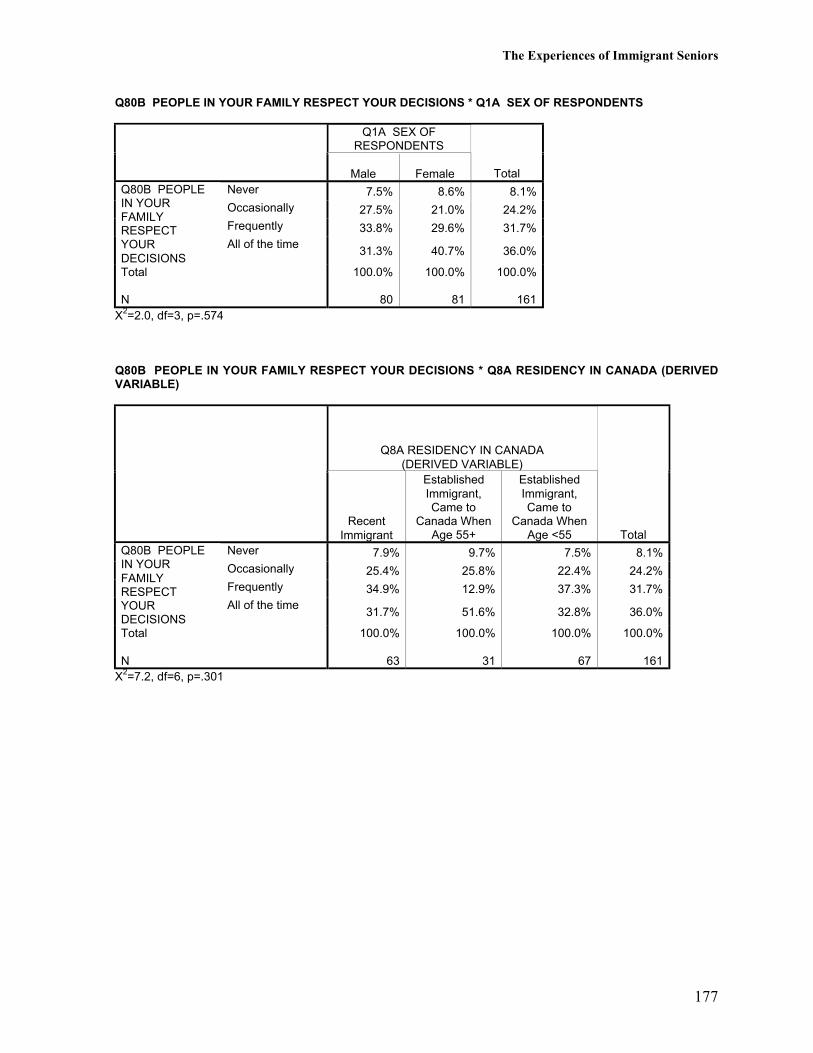
The Experiences of Immigrant Seniors
177
Q80B PEOPLE IN YOUR FAMILY RESPECT YOUR DECISIONS * Q1A SEX OF RESPONDENTS
Q1A SEX OFRESPONDENTS
Male Female TotalNever 7.5% 8.6% 8.1%Occasionally 27.5% 21.0% 24.2%Frequently 33.8% 29.6% 31.7%
Q80B PEOPLEIN YOURFAMILYRESPECTYOURDECISIONS
All of the time31.3% 40.7% 36.0%
Total
N
100.0%
80
100.0%
81
100.0%
161X2=2.0, df=3, p=.574
Q80B PEOPLE IN YOUR FAMILY RESPECT YOUR DECISIONS * Q8A RESIDENCY IN CANADA (DERIVEDVARIABLE)
Q8A RESIDENCY IN CANADA(DERIVED VARIABLE)
RecentImmigrant
EstablishedImmigrant,Came to
Canada WhenAge 55+
EstablishedImmigrant,Came to
Canada WhenAge <55 Total
Never 7.9% 9.7% 7.5% 8.1%Occasionally 25.4% 25.8% 22.4% 24.2%Frequently 34.9% 12.9% 37.3% 31.7%
Q80B PEOPLEIN YOURFAMILYRESPECTYOURDECISIONS
All of the time31.7% 51.6% 32.8% 36.0%
Total
N
100.0%
63
100.0%
31
100.0%
67
100.0%
161X2=7.2, df=6, p=.301

The Experiences of Immigrant Seniors
178
Q80C PEOPLE IN YOUR FAMILY SHARE YOUR VALUES * Q1A SEX OF RESPONDENTS
Q1A SEX OFRESPONDENTS
Male Female TotalNever 5.1% 2.5% 3.8%Occasionally 26.6% 12.3% 19.4%Frequently 34.2% 32.1% 33.1%
Q80C PEOPLEIN YOURFAMILY SHAREYOUR VALUES
All of the time 34.2% 53.1% 43.8%Total
N
100.0%
79
100.0%
81
100.0%
160X2=8.2, df=3, p=.042
Q80C PEOPLE IN YOUR FAMILY SHARE YOUR VALUES * Q8A RESIDENCY IN CANADA (DERIVEDVARIABLE)
Q8A RESIDENCY IN CANADA(DERIVED VARIABLE)
RecentImmigrant
EstablishedImmigrant,Came to
Canada WhenAge 55+
EstablishedImmigrant,Came to
Canada WhenAge <55 Total
Never 3.2% 6.5% 3.0% 3.8%Occasionally 21.0% 6.5% 23.9% 19.4%Frequently 35.5% 35.5% 29.9% 33.1%
Q80C PEOPLEIN YOURFAMILY SHAREYOUR VALUES
All of the time 40.3% 51.6% 43.3% 43.8%Total
N
100.0%
62
100.0%
31
100.0%
67
100.0%
160X2=5.2, df=6, p=.520
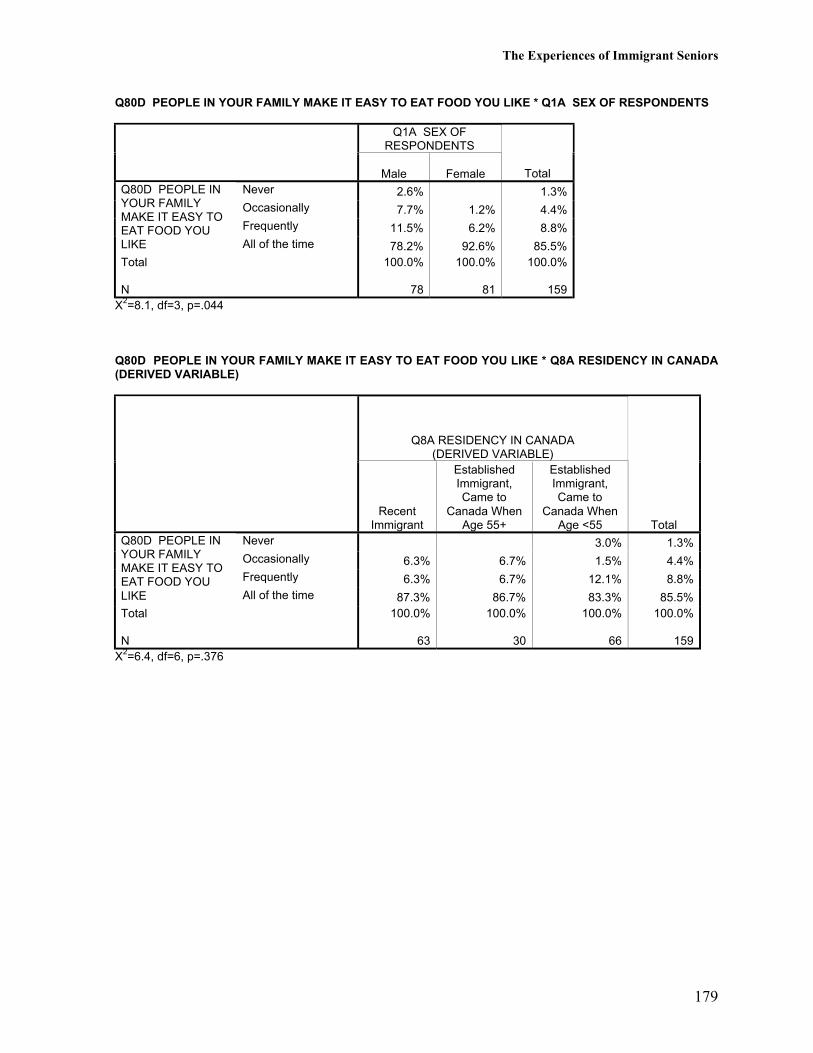
The Experiences of Immigrant Seniors
179
Q80D PEOPLE IN YOUR FAMILY MAKE IT EASY TO EAT FOOD YOU LIKE * Q1A SEX OF RESPONDENTS
Q1A SEX OFRESPONDENTS
Male Female TotalNever 2.6% 1.3%Occasionally 7.7% 1.2% 4.4%Frequently 11.5% 6.2% 8.8%
Q80D PEOPLE INYOUR FAMILYMAKE IT EASY TOEAT FOOD YOULIKE All of the time 78.2% 92.6% 85.5%Total
N
100.0%
78
100.0%
81
100.0%
159X2=8.1, df=3, p=.044
Q80D PEOPLE IN YOUR FAMILY MAKE IT EASY TO EAT FOOD YOU LIKE * Q8A RESIDENCY IN CANADA(DERIVED VARIABLE)
Q8A RESIDENCY IN CANADA(DERIVED VARIABLE)
RecentImmigrant
EstablishedImmigrant,Came to
Canada WhenAge 55+
EstablishedImmigrant,Came to
Canada WhenAge <55 Total
Never 3.0% 1.3%Occasionally 6.3% 6.7% 1.5% 4.4%Frequently 6.3% 6.7% 12.1% 8.8%
Q80D PEOPLE INYOUR FAMILYMAKE IT EASY TOEAT FOOD YOULIKE All of the time 87.3% 86.7% 83.3% 85.5%Total
N
100.0%
63
100.0%
30
100.0%
66
100.0%
159X2=6.4, df=6, p=.376
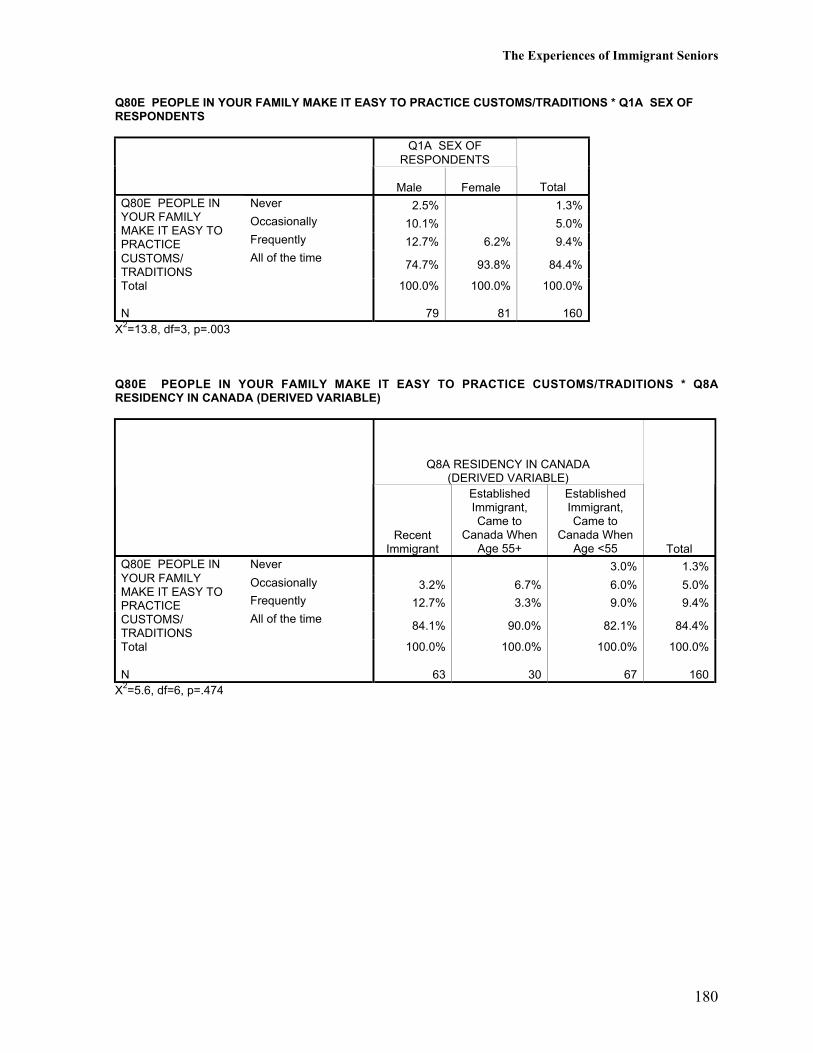
The Experiences of Immigrant Seniors
180
Q80E PEOPLE IN YOUR FAMILY MAKE IT EASY TO PRACTICE CUSTOMS/TRADITIONS * Q1A SEX OFRESPONDENTS
Q1A SEX OFRESPONDENTS
Male Female TotalNever 2.5% 1.3%Occasionally 10.1% 5.0%Frequently 12.7% 6.2% 9.4%
Q80E PEOPLE INYOUR FAMILYMAKE IT EASY TOPRACTICECUSTOMS/TRADITIONS
All of the time74.7% 93.8% 84.4%
Total
N
100.0%
79
100.0%
81
100.0%
160X2=13.8, df=3, p=.003
Q80E PEOPLE IN YOUR FAMILY MAKE IT EASY TO PRACTICE CUSTOMS/TRADITIONS * Q8ARESIDENCY IN CANADA (DERIVED VARIABLE)
Q8A RESIDENCY IN CANADA(DERIVED VARIABLE)
RecentImmigrant
EstablishedImmigrant,Came to
Canada WhenAge 55+
EstablishedImmigrant,Came to
Canada WhenAge <55 Total
Never 3.0% 1.3%Occasionally 3.2% 6.7% 6.0% 5.0%Frequently 12.7% 3.3% 9.0% 9.4%
Q80E PEOPLE INYOUR FAMILYMAKE IT EASY TOPRACTICECUSTOMS/TRADITIONS
All of the time84.1% 90.0% 82.1% 84.4%
Total
N
100.0%
63
100.0%
30
100.0%
67
100.0%
160X2=5.6, df=6, p=.474
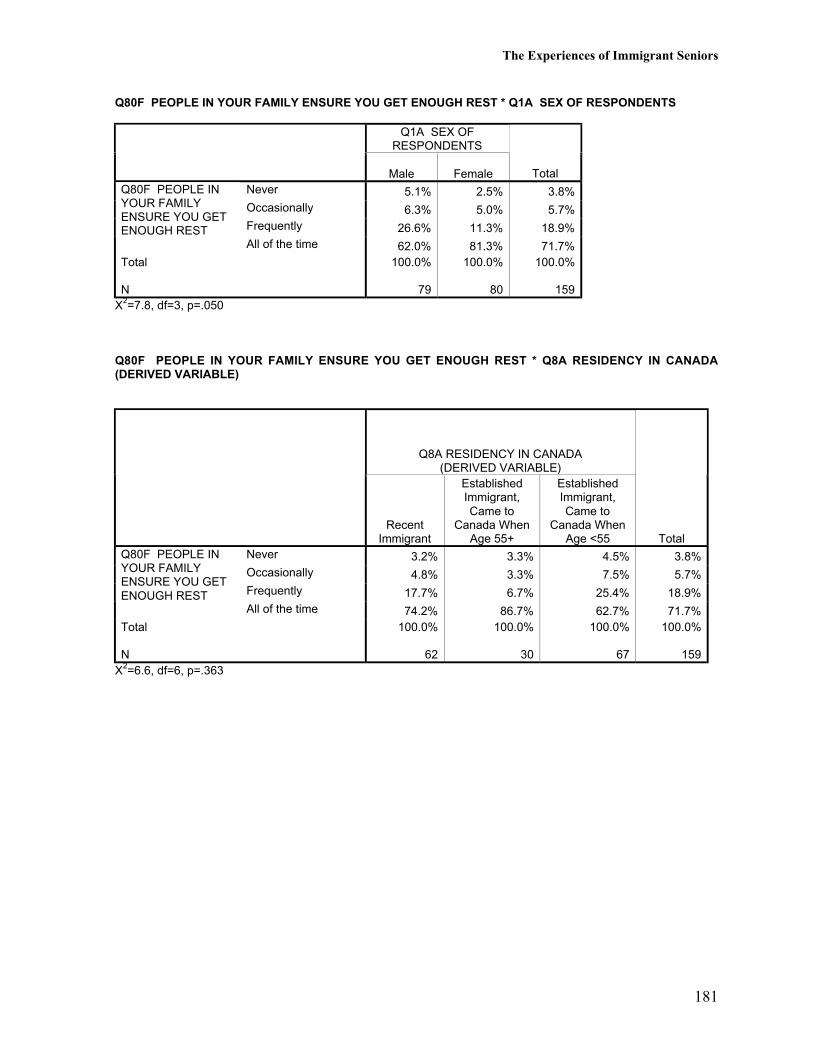
The Experiences of Immigrant Seniors
181
Q80F PEOPLE IN YOUR FAMILY ENSURE YOU GET ENOUGH REST * Q1A SEX OF RESPONDENTS
Q1A SEX OFRESPONDENTS
Male Female TotalNever 5.1% 2.5% 3.8%Occasionally 6.3% 5.0% 5.7%Frequently 26.6% 11.3% 18.9%
Q80F PEOPLE INYOUR FAMILYENSURE YOU GETENOUGH REST
All of the time 62.0% 81.3% 71.7%Total
N
100.0%
79
100.0%
80
100.0%
159X2=7.8, df=3, p=.050
Q80F PEOPLE IN YOUR FAMILY ENSURE YOU GET ENOUGH REST * Q8A RESIDENCY IN CANADA(DERIVED VARIABLE)
Q8A RESIDENCY IN CANADA(DERIVED VARIABLE)
RecentImmigrant
EstablishedImmigrant,Came to
Canada WhenAge 55+
EstablishedImmigrant,Came to
Canada WhenAge <55 Total
Never 3.2% 3.3% 4.5% 3.8%Occasionally 4.8% 3.3% 7.5% 5.7%Frequently 17.7% 6.7% 25.4% 18.9%
Q80F PEOPLE INYOUR FAMILYENSURE YOU GETENOUGH REST
All of the time 74.2% 86.7% 62.7% 71.7%Total
N
100.0%
62
100.0%
30
100.0%
67
100.0%
159X2=6.6, df=6, p=.363
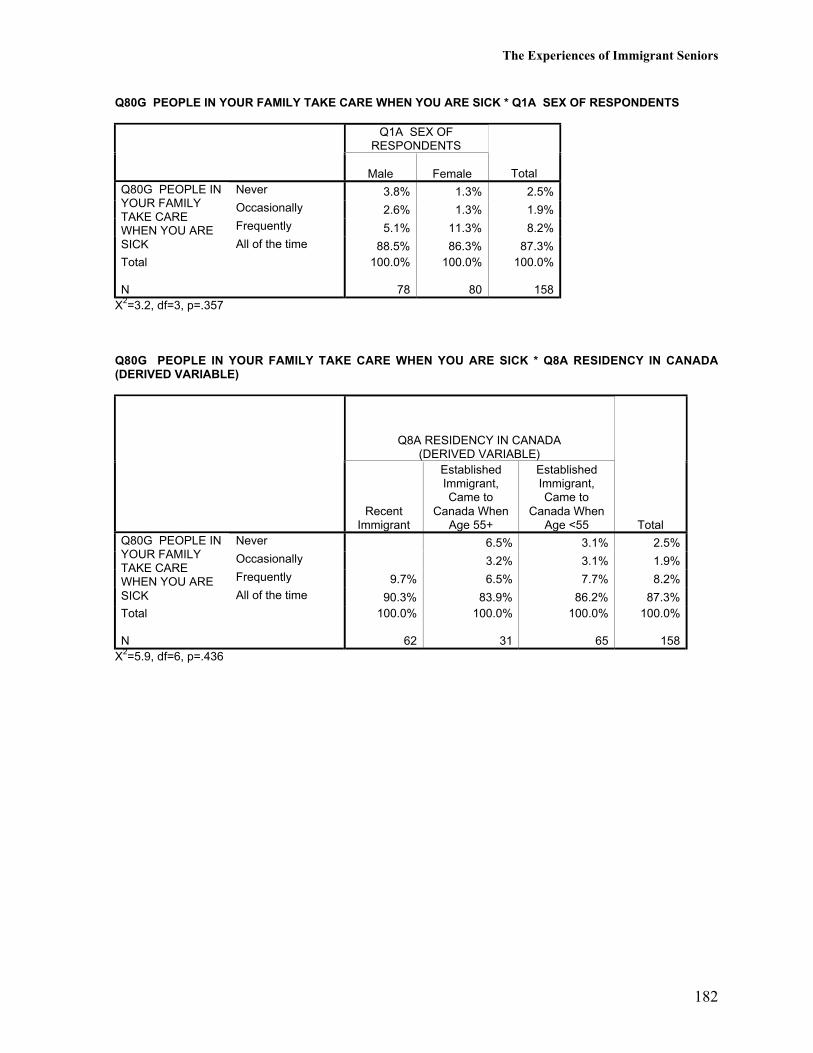
The Experiences of Immigrant Seniors
182
Q80G PEOPLE IN YOUR FAMILY TAKE CARE WHEN YOU ARE SICK * Q1A SEX OF RESPONDENTS
Q1A SEX OFRESPONDENTS
Male Female TotalNever 3.8% 1.3% 2.5%Occasionally 2.6% 1.3% 1.9%Frequently 5.1% 11.3% 8.2%
Q80G PEOPLE INYOUR FAMILYTAKE CAREWHEN YOU ARESICK All of the time 88.5% 86.3% 87.3%Total
N
100.0%
78
100.0%
80
100.0%
158X2=3.2, df=3, p=.357
Q80G PEOPLE IN YOUR FAMILY TAKE CARE WHEN YOU ARE SICK * Q8A RESIDENCY IN CANADA(DERIVED VARIABLE)
Q8A RESIDENCY IN CANADA(DERIVED VARIABLE)
RecentImmigrant
EstablishedImmigrant,Came to
Canada WhenAge 55+
EstablishedImmigrant,Came to
Canada WhenAge <55 Total
Never 6.5% 3.1% 2.5%Occasionally 3.2% 3.1% 1.9%Frequently 9.7% 6.5% 7.7% 8.2%
Q80G PEOPLE INYOUR FAMILYTAKE CAREWHEN YOU ARESICK All of the time 90.3% 83.9% 86.2% 87.3%Total
N
100.0%
62
100.0%
31
100.0%
65
100.0%
158X2=5.9, df=6, p=.436
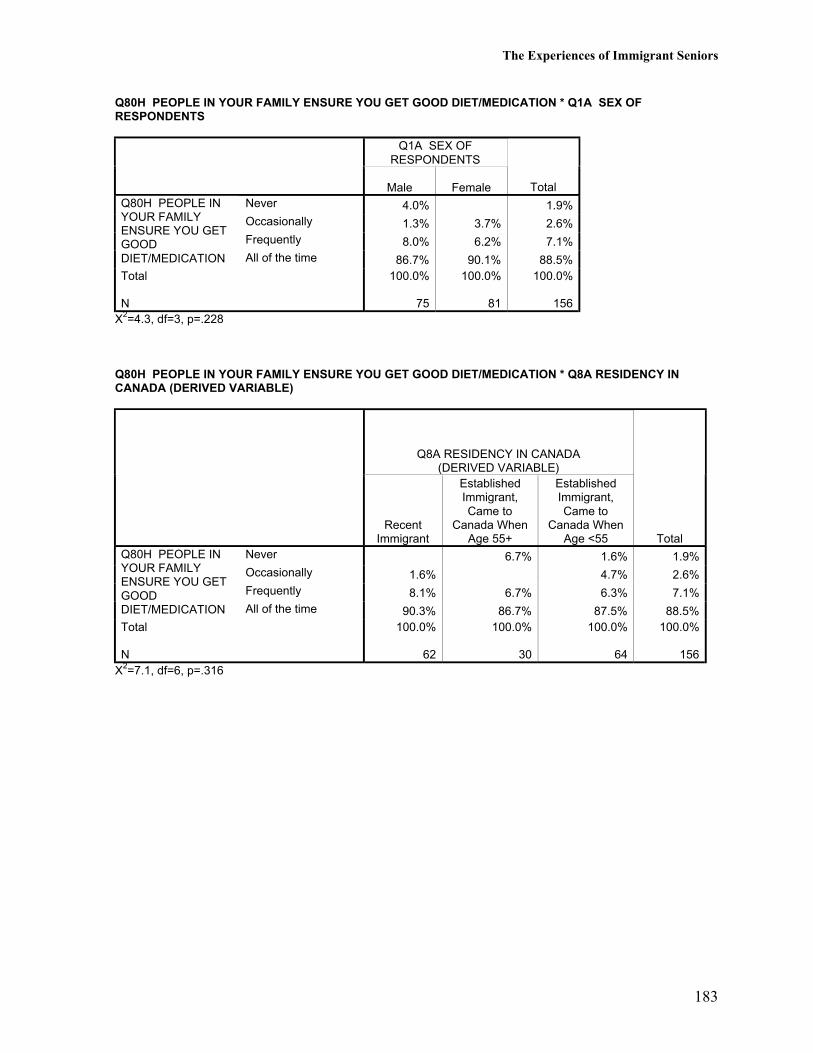
The Experiences of Immigrant Seniors
183
Q80H PEOPLE IN YOUR FAMILY ENSURE YOU GET GOOD DIET/MEDICATION * Q1A SEX OFRESPONDENTS
Q1A SEX OFRESPONDENTS
Male Female TotalNever 4.0% 1.9%Occasionally 1.3% 3.7% 2.6%Frequently 8.0% 6.2% 7.1%
Q80H PEOPLE INYOUR FAMILYENSURE YOU GETGOODDIET/MEDICATION All of the time 86.7% 90.1% 88.5%Total
N
100.0%
75
100.0%
81
100.0%
156X2=4.3, df=3, p=.228
Q80H PEOPLE IN YOUR FAMILY ENSURE YOU GET GOOD DIET/MEDICATION * Q8A RESIDENCY INCANADA (DERIVED VARIABLE)
Q8A RESIDENCY IN CANADA(DERIVED VARIABLE)
RecentImmigrant
EstablishedImmigrant,Came to
Canada WhenAge 55+
EstablishedImmigrant,Came to
Canada WhenAge <55 Total
Never 6.7% 1.6% 1.9%Occasionally 1.6% 4.7% 2.6%Frequently 8.1% 6.7% 6.3% 7.1%
Q80H PEOPLE INYOUR FAMILYENSURE YOU GETGOODDIET/MEDICATION All of the time 90.3% 86.7% 87.5% 88.5%Total
N
100.0%
62
100.0%
30
100.0%
64
100.0%
156X2=7.1, df=6, p=.316

The Experiences of Immigrant Seniors
184
Q80I PEOPLE IN YOUR FAMILY ENSURE YOU GET ENOUGH EXERCISE * Q1A SEX OF RESPONDENTS
Q1A SEX OFRESPONDENTS
Male Female TotalNever 7.0% 6.3% 6.7%Occasionally 16.9% 20.3% 18.7%Frequently 21.1% 15.2% 18.0%
Q80I PEOPLE INYOUR FAMILYENSURE YOUGET ENOUGHEXERCISE All of the time 54.9% 58.2% 56.7%Total
N
100.0%
71
100.0%
79
100.0%
150X2=1.1, df=3, p=.787
Q80I PEOPLE IN YOUR FAMILY ENSURE YOU GET ENOUGH EXERCISE * Q8A RESIDENCY IN CANADA(DERIVED VARIABLE)
Q8A RESIDENCY IN CANADA(DERIVED VARIABLE)
RecentImmigrant
EstablishedImmigrant,Came to
Canada WhenAge 55+
EstablishedImmigrant,Came to
Canada WhenAge <55 Total
Never 5.1% 10.3% 6.5% 6.7%Occasionally 23.7% 13.8% 16.1% 18.7%Frequently 15.3% 17.2% 21.0% 18.0%
Q80I PEOPLE INYOUR FAMILYENSURE YOUGET ENOUGHEXERCISE All of the time 55.9% 58.6% 56.5% 56.7%Total
N
100.0%
59
100.0%
29
100.0%
62
100.0%
150X2=2.8, df=6, p=.834
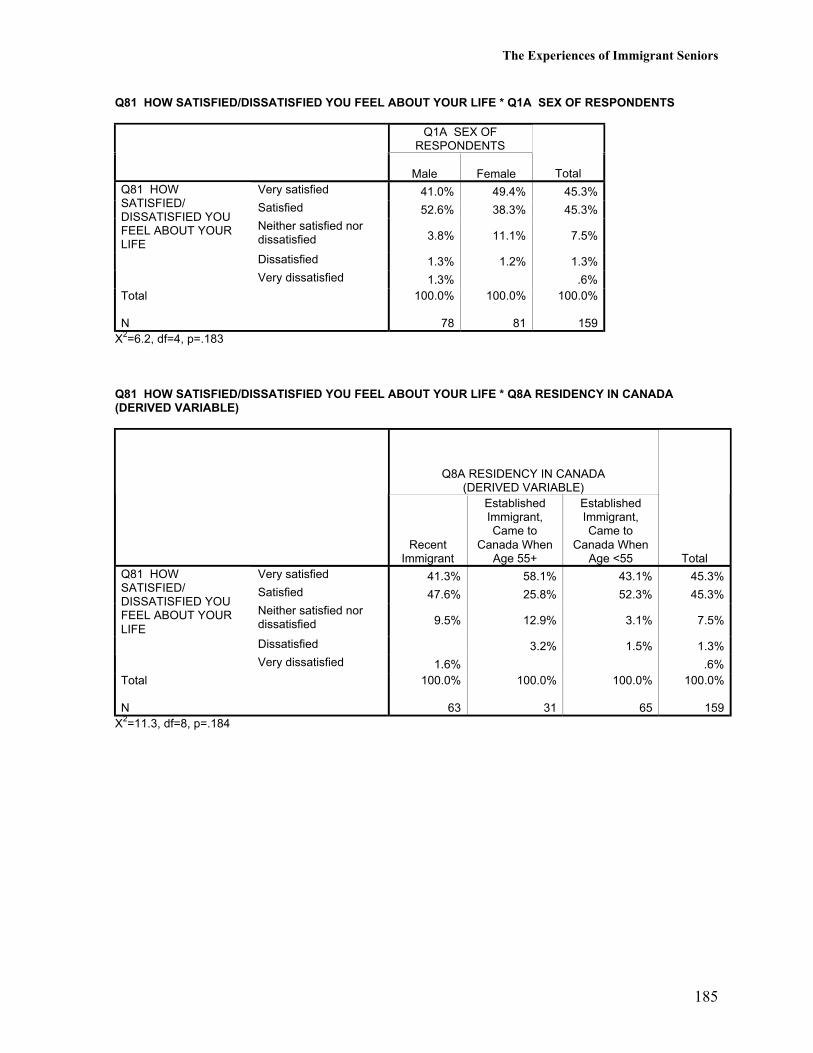
The Experiences of Immigrant Seniors
185
Q81 HOW SATISFIED/DISSATISFIED YOU FEEL ABOUT YOUR LIFE * Q1A SEX OF RESPONDENTS
Q1A SEX OFRESPONDENTS
Male Female TotalVery satisfied 41.0% 49.4% 45.3%Satisfied 52.6% 38.3% 45.3%Neither satisfied nordissatisfied 3.8% 11.1% 7.5%
Dissatisfied 1.3% 1.2% 1.3%
Q81 HOWSATISFIED/DISSATISFIED YOUFEEL ABOUT YOURLIFE
Very dissatisfied 1.3% .6%Total
N
100.0%
78
100.0%
81
100.0%
159X2=6.2, df=4, p=.183
Q81 HOW SATISFIED/DISSATISFIED YOU FEEL ABOUT YOUR LIFE * Q8A RESIDENCY IN CANADA(DERIVED VARIABLE)
Q8A RESIDENCY IN CANADA(DERIVED VARIABLE)
RecentImmigrant
EstablishedImmigrant,Came to
Canada WhenAge 55+
EstablishedImmigrant,Came to
Canada WhenAge <55 Total
Very satisfied 41.3% 58.1% 43.1% 45.3%Satisfied 47.6% 25.8% 52.3% 45.3%Neither satisfied nordissatisfied 9.5% 12.9% 3.1% 7.5%
Dissatisfied 3.2% 1.5% 1.3%
Q81 HOWSATISFIED/DISSATISFIED YOUFEEL ABOUT YOURLIFE
Very dissatisfied 1.6% .6%Total
N
100.0%
63
100.0%
31
100.0%
65
100.0%
159X2=11.3, df=8, p=.184

The Experiences of Immigrant Seniors
186
The Experiences of Immigrant Seniors
187
Feelings About Being Part of Canadian Society
When asked how concerned respondents were with selected issues, the majority ofrespondents said that they were concerned (scale values 4 and 5 where 1=not at all concernedand 5=very concerned) about: money (personal/family income), being part of Canadiansociety, the general quality of family life in Canada, moral standards in Canada, and aboutfriends, family or relatives outside of Canada. A minority were concerned about prejudice anddiscrimination in Canada. There were no differences by residency in Canada or by sex exceptthat females were more likely to say that they were “not at all concerned” with prejudice anddiscrimination in Canada (36% of females versus 17% of males).
When asked how important selected issues were for living in Canada, the majority ofrespondents indicated that the following were very important (scale value 5 where 1=not at allimportant and 5=very important): having family and relatives close by (79%; recentimmigrants and persons who came to Canada at an older age were more likely to rate havingfamily and relatives close by as very important than were established immigrants who came toCanada before age 55), having friends from the same cultural background (69%), feelingwelcome in Canada (74%; females were more likely to rate feeling welcome in Canada asvery important than were males), knowing English (80%; established immigrants who cameto Canada at ages younger than 55 were most likely to rate knowing English as very importantcompared to recent immigrants and immigrants who came to Canada at an older age), havingCanadian citizenship (77%), having a source of income (91%), and having a job or being self-employed (51%; having a job was more important to males than females). In contrast,relatively few rating having Canadian-born friends as very important (19%; rated moreimportant by established immigrants who came to Canada when younger than age 55), andrelatively few thought that being a member of a political party was very important (10%;females and recent immigrants were more likely to rate being a member of a political party as“not at all important”).
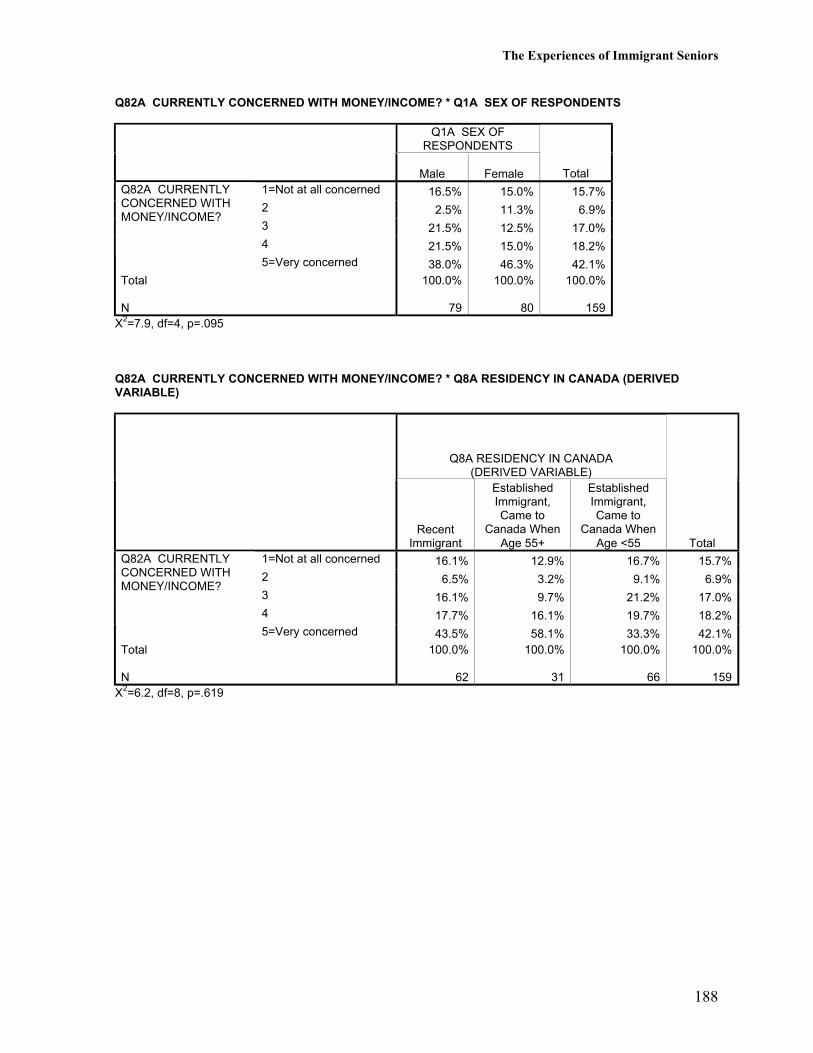
The Experiences of Immigrant Seniors
188
Q82A CURRENTLY CONCERNED WITH MONEY/INCOME? * Q1A SEX OF RESPONDENTS
Q1A SEX OFRESPONDENTS
Male Female Total1=Not at all concerned 16.5% 15.0% 15.7%2 2.5% 11.3% 6.9%3 21.5% 12.5% 17.0%4 21.5% 15.0% 18.2%
Q82A CURRENTLYCONCERNED WITHMONEY/INCOME?
5=Very concerned 38.0% 46.3% 42.1%Total
N
100.0%
79
100.0%
80
100.0%
159X2=7.9, df=4, p=.095
Q82A CURRENTLY CONCERNED WITH MONEY/INCOME? * Q8A RESIDENCY IN CANADA (DERIVEDVARIABLE)
Q8A RESIDENCY IN CANADA(DERIVED VARIABLE)
RecentImmigrant
EstablishedImmigrant,Came to
Canada WhenAge 55+
EstablishedImmigrant,Came to
Canada WhenAge <55 Total
1=Not at all concerned 16.1% 12.9% 16.7% 15.7%2 6.5% 3.2% 9.1% 6.9%3 16.1% 9.7% 21.2% 17.0%4 17.7% 16.1% 19.7% 18.2%
Q82A CURRENTLYCONCERNED WITHMONEY/INCOME?
5=Very concerned 43.5% 58.1% 33.3% 42.1%Total
N
100.0%
62
100.0%
31
100.0%
66
100.0%
159X2=6.2, df=8, p=.619
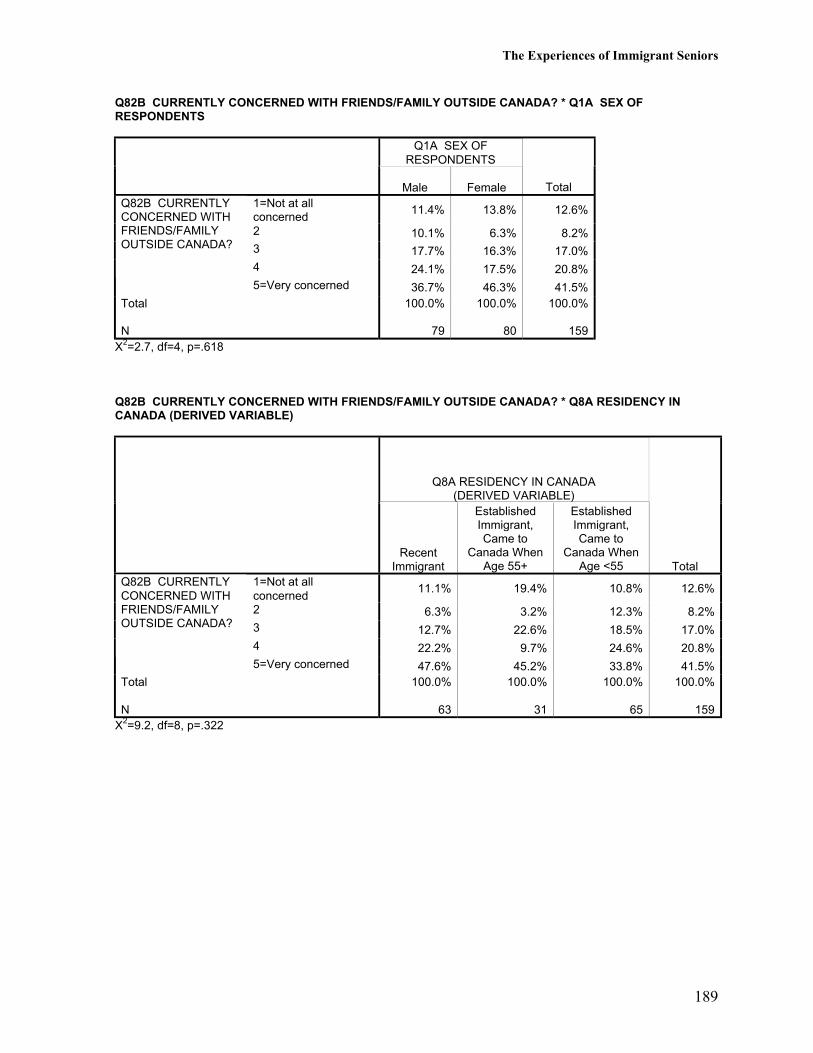
The Experiences of Immigrant Seniors
189
Q82B CURRENTLY CONCERNED WITH FRIENDS/FAMILY OUTSIDE CANADA? * Q1A SEX OFRESPONDENTS
Q1A SEX OFRESPONDENTS
Male Female Total1=Not at allconcerned
11.4% 13.8% 12.6%
2 10.1% 6.3% 8.2%3 17.7% 16.3% 17.0%4 24.1% 17.5% 20.8%
Q82B CURRENTLYCONCERNED WITHFRIENDS/FAMILYOUTSIDE CANADA?
5=Very concerned 36.7% 46.3% 41.5%Total
N
100.0%
79
100.0%
80
100.0%
159X2=2.7, df=4, p=.618
Q82B CURRENTLY CONCERNED WITH FRIENDS/FAMILY OUTSIDE CANADA? * Q8A RESIDENCY INCANADA (DERIVED VARIABLE)
Q8A RESIDENCY IN CANADA(DERIVED VARIABLE)
RecentImmigrant
EstablishedImmigrant,Came to
Canada WhenAge 55+
EstablishedImmigrant,Came to
Canada WhenAge <55 Total
1=Not at allconcerned
11.1% 19.4% 10.8% 12.6%
2 6.3% 3.2% 12.3% 8.2%3 12.7% 22.6% 18.5% 17.0%4 22.2% 9.7% 24.6% 20.8%
Q82B CURRENTLYCONCERNED WITHFRIENDS/FAMILYOUTSIDE CANADA?
5=Very concerned 47.6% 45.2% 33.8% 41.5%Total
N
100.0%
63
100.0%
31
100.0%
65
100.0%
159X2=9.2, df=8, p=.322
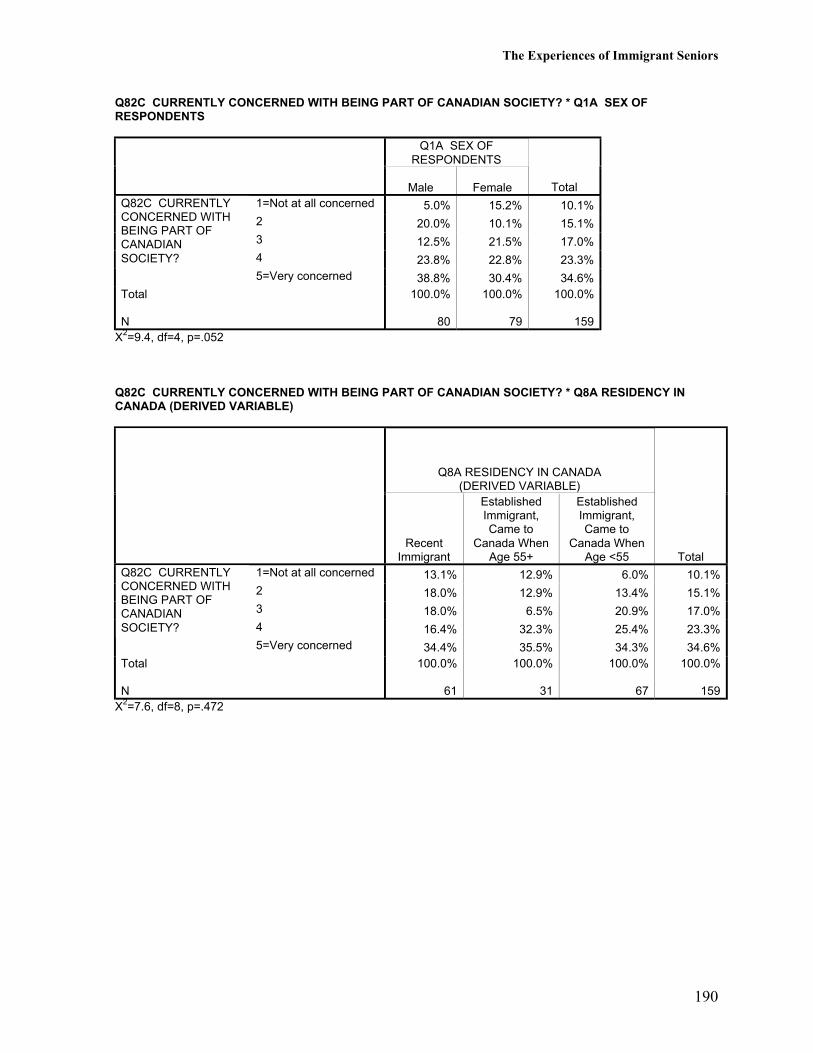
The Experiences of Immigrant Seniors
190
Q82C CURRENTLY CONCERNED WITH BEING PART OF CANADIAN SOCIETY? * Q1A SEX OFRESPONDENTS
Q1A SEX OFRESPONDENTS
Male Female Total1=Not at all concerned 5.0% 15.2% 10.1%2 20.0% 10.1% 15.1%3 12.5% 21.5% 17.0%4 23.8% 22.8% 23.3%
Q82C CURRENTLYCONCERNED WITHBEING PART OFCANADIANSOCIETY?
5=Very concerned 38.8% 30.4% 34.6%Total
N
100.0%
80
100.0%
79
100.0%
159X2=9.4, df=4, p=.052
Q82C CURRENTLY CONCERNED WITH BEING PART OF CANADIAN SOCIETY? * Q8A RESIDENCY INCANADA (DERIVED VARIABLE)
Q8A RESIDENCY IN CANADA(DERIVED VARIABLE)
RecentImmigrant
EstablishedImmigrant,Came to
Canada WhenAge 55+
EstablishedImmigrant,Came to
Canada WhenAge <55 Total
1=Not at all concerned 13.1% 12.9% 6.0% 10.1%2 18.0% 12.9% 13.4% 15.1%3 18.0% 6.5% 20.9% 17.0%4 16.4% 32.3% 25.4% 23.3%
Q82C CURRENTLYCONCERNED WITHBEING PART OFCANADIANSOCIETY?
5=Very concerned 34.4% 35.5% 34.3% 34.6%Total
N
100.0%
61
100.0%
31
100.0%
67
100.0%
159X2=7.6, df=8, p=.472
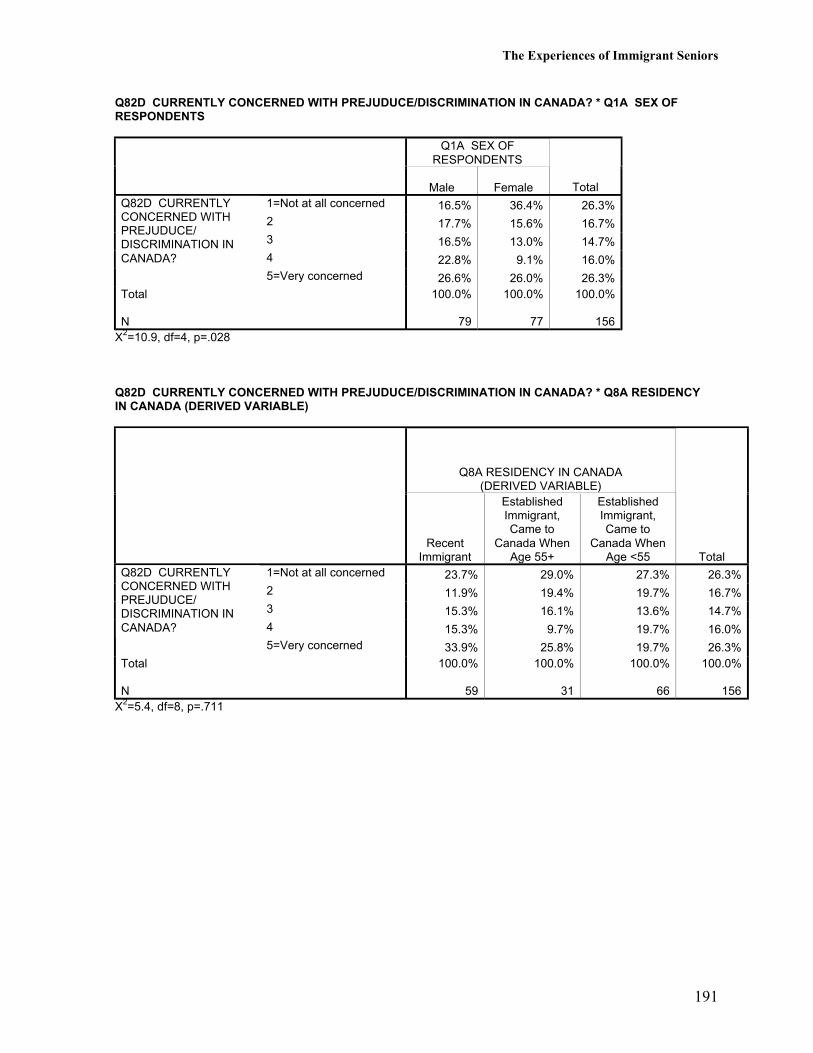
The Experiences of Immigrant Seniors
191
Q82D CURRENTLY CONCERNED WITH PREJUDUCE/DISCRIMINATION IN CANADA? * Q1A SEX OFRESPONDENTS
Q1A SEX OFRESPONDENTS
Male Female Total1=Not at all concerned 16.5% 36.4% 26.3%2 17.7% 15.6% 16.7%3 16.5% 13.0% 14.7%4 22.8% 9.1% 16.0%
Q82D CURRENTLYCONCERNED WITHPREJUDUCE/DISCRIMINATION INCANADA?
5=Very concerned 26.6% 26.0% 26.3%Total
N
100.0%
79
100.0%
77
100.0%
156X2=10.9, df=4, p=.028
Q82D CURRENTLY CONCERNED WITH PREJUDUCE/DISCRIMINATION IN CANADA? * Q8A RESIDENCYIN CANADA (DERIVED VARIABLE)
Q8A RESIDENCY IN CANADA(DERIVED VARIABLE)
RecentImmigrant
EstablishedImmigrant,Came to
Canada WhenAge 55+
EstablishedImmigrant,Came to
Canada WhenAge <55 Total
1=Not at all concerned 23.7% 29.0% 27.3% 26.3%2 11.9% 19.4% 19.7% 16.7%3 15.3% 16.1% 13.6% 14.7%4 15.3% 9.7% 19.7% 16.0%
Q82D CURRENTLYCONCERNED WITHPREJUDUCE/DISCRIMINATION INCANADA?
5=Very concerned 33.9% 25.8% 19.7% 26.3%Total
N
100.0%
59
100.0%
31
100.0%
66
100.0%
156X2=5.4, df=8, p=.711
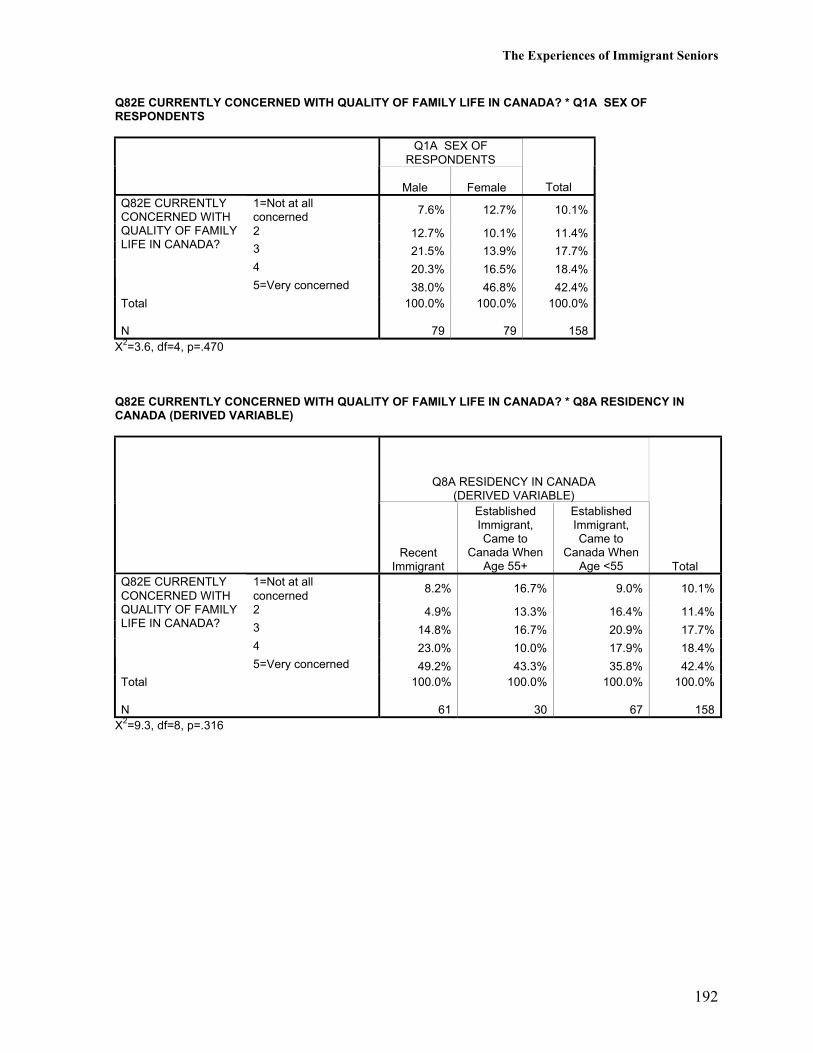
The Experiences of Immigrant Seniors
192
Q82E CURRENTLY CONCERNED WITH QUALITY OF FAMILY LIFE IN CANADA? * Q1A SEX OFRESPONDENTS
Q1A SEX OFRESPONDENTS
Male Female Total1=Not at allconcerned
7.6% 12.7% 10.1%
2 12.7% 10.1% 11.4%3 21.5% 13.9% 17.7%4 20.3% 16.5% 18.4%
Q82E CURRENTLYCONCERNED WITHQUALITY OF FAMILYLIFE IN CANADA?
5=Very concerned 38.0% 46.8% 42.4%Total
N
100.0%
79
100.0%
79
100.0%
158X2=3.6, df=4, p=.470
Q82E CURRENTLY CONCERNED WITH QUALITY OF FAMILY LIFE IN CANADA? * Q8A RESIDENCY INCANADA (DERIVED VARIABLE)
Q8A RESIDENCY IN CANADA(DERIVED VARIABLE)
RecentImmigrant
EstablishedImmigrant,Came to
Canada WhenAge 55+
EstablishedImmigrant,Came to
Canada WhenAge <55 Total
1=Not at allconcerned
8.2% 16.7% 9.0% 10.1%
2 4.9% 13.3% 16.4% 11.4%3 14.8% 16.7% 20.9% 17.7%4 23.0% 10.0% 17.9% 18.4%
Q82E CURRENTLYCONCERNED WITHQUALITY OF FAMILYLIFE IN CANADA?
5=Very concerned 49.2% 43.3% 35.8% 42.4%Total
N
100.0%
61
100.0%
30
100.0%
67
100.0%
158X2=9.3, df=8, p=.316
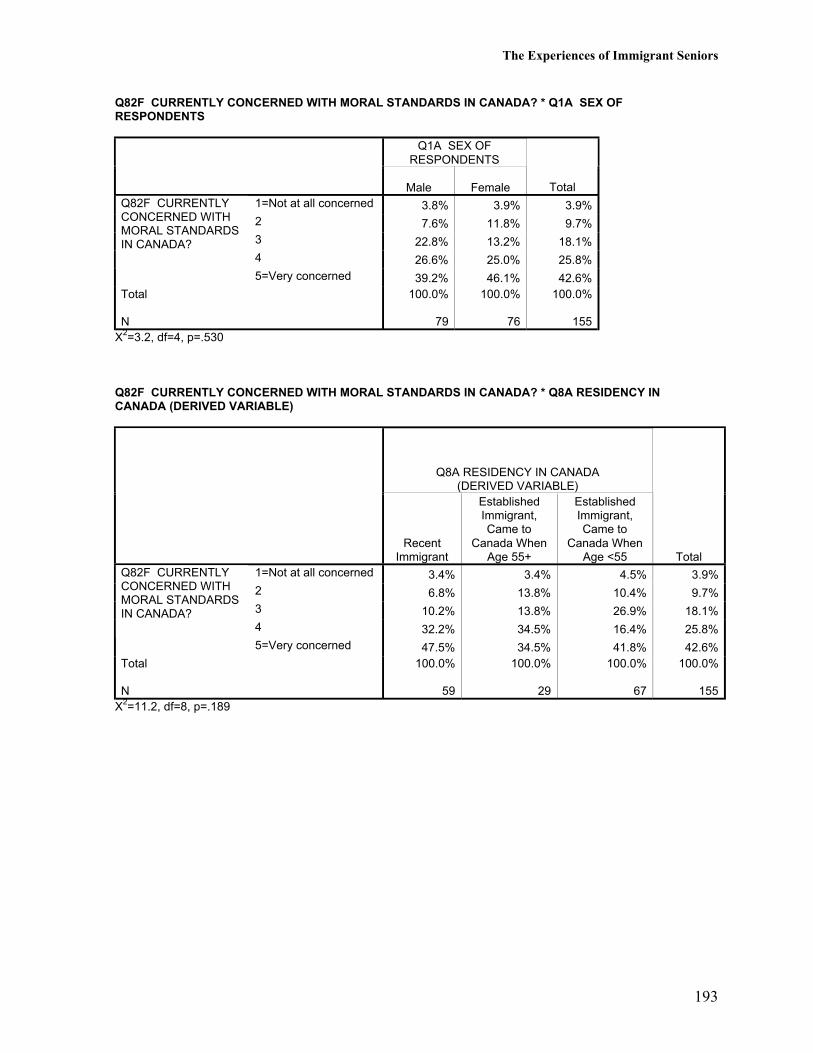
The Experiences of Immigrant Seniors
193
Q82F CURRENTLY CONCERNED WITH MORAL STANDARDS IN CANADA? * Q1A SEX OFRESPONDENTS
Q1A SEX OFRESPONDENTS
Male Female Total1=Not at all concerned 3.8% 3.9% 3.9%2 7.6% 11.8% 9.7%3 22.8% 13.2% 18.1%4 26.6% 25.0% 25.8%
Q82F CURRENTLYCONCERNED WITHMORAL STANDARDSIN CANADA?
5=Very concerned 39.2% 46.1% 42.6%Total
N
100.0%
79
100.0%
76
100.0%
155X2=3.2, df=4, p=.530
Q82F CURRENTLY CONCERNED WITH MORAL STANDARDS IN CANADA? * Q8A RESIDENCY INCANADA (DERIVED VARIABLE)
Q8A RESIDENCY IN CANADA(DERIVED VARIABLE)
RecentImmigrant
EstablishedImmigrant,Came to
Canada WhenAge 55+
EstablishedImmigrant,Came to
Canada WhenAge <55 Total
1=Not at all concerned 3.4% 3.4% 4.5% 3.9%2 6.8% 13.8% 10.4% 9.7%3 10.2% 13.8% 26.9% 18.1%4 32.2% 34.5% 16.4% 25.8%
Q82F CURRENTLYCONCERNED WITHMORAL STANDARDSIN CANADA?
5=Very concerned 47.5% 34.5% 41.8% 42.6%Total
N
100.0%
59
100.0%
29
100.0%
67
100.0%
155X2=11.2, df=8, p=.189
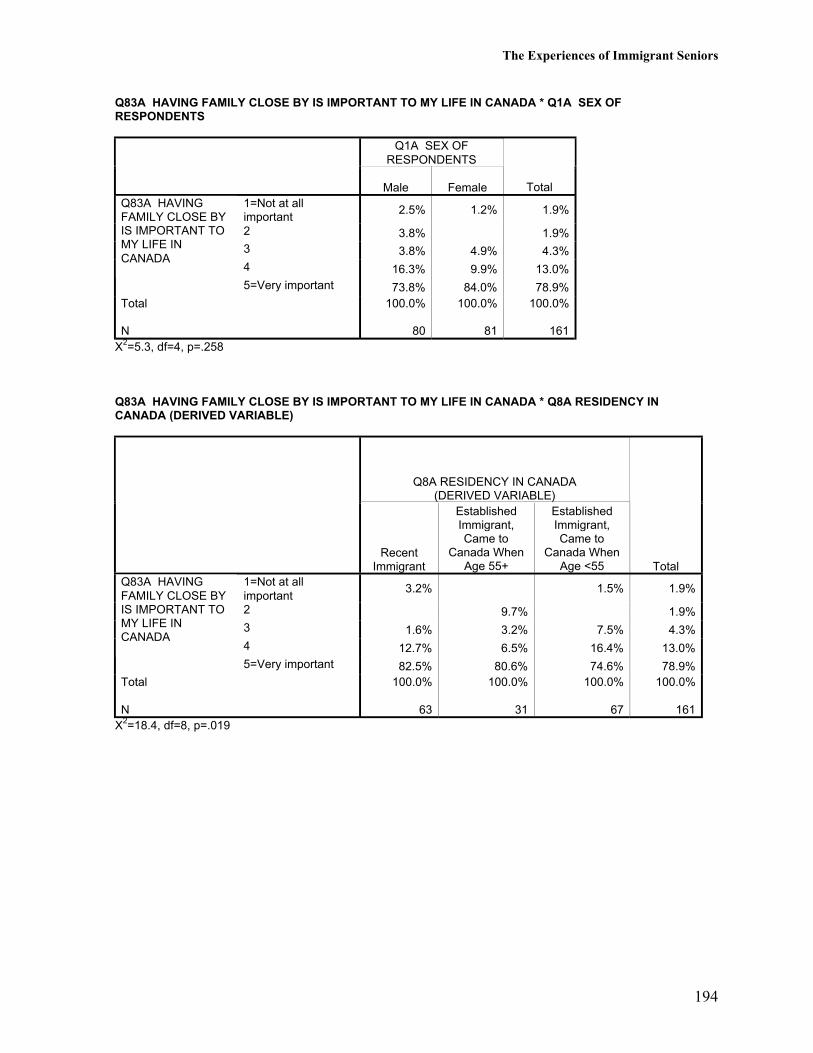
The Experiences of Immigrant Seniors
194
Q83A HAVING FAMILY CLOSE BY IS IMPORTANT TO MY LIFE IN CANADA * Q1A SEX OFRESPONDENTS
Q1A SEX OFRESPONDENTS
Male Female Total1=Not at allimportant
2.5% 1.2% 1.9%
2 3.8% 1.9%3 3.8% 4.9% 4.3%4 16.3% 9.9% 13.0%
Q83A HAVINGFAMILY CLOSE BYIS IMPORTANT TOMY LIFE INCANADA
5=Very important 73.8% 84.0% 78.9%Total
N
100.0%
80
100.0%
81
100.0%
161X2=5.3, df=4, p=.258
Q83A HAVING FAMILY CLOSE BY IS IMPORTANT TO MY LIFE IN CANADA * Q8A RESIDENCY INCANADA (DERIVED VARIABLE)
Q8A RESIDENCY IN CANADA(DERIVED VARIABLE)
RecentImmigrant
EstablishedImmigrant,Came to
Canada WhenAge 55+
EstablishedImmigrant,Came to
Canada WhenAge <55 Total
1=Not at allimportant
3.2% 1.5% 1.9%
2 9.7% 1.9%3 1.6% 3.2% 7.5% 4.3%4 12.7% 6.5% 16.4% 13.0%
Q83A HAVINGFAMILY CLOSE BYIS IMPORTANT TOMY LIFE INCANADA
5=Very important 82.5% 80.6% 74.6% 78.9%Total
N
100.0%
63
100.0%
31
100.0%
67
100.0%
161X2=18.4, df=8, p=.019
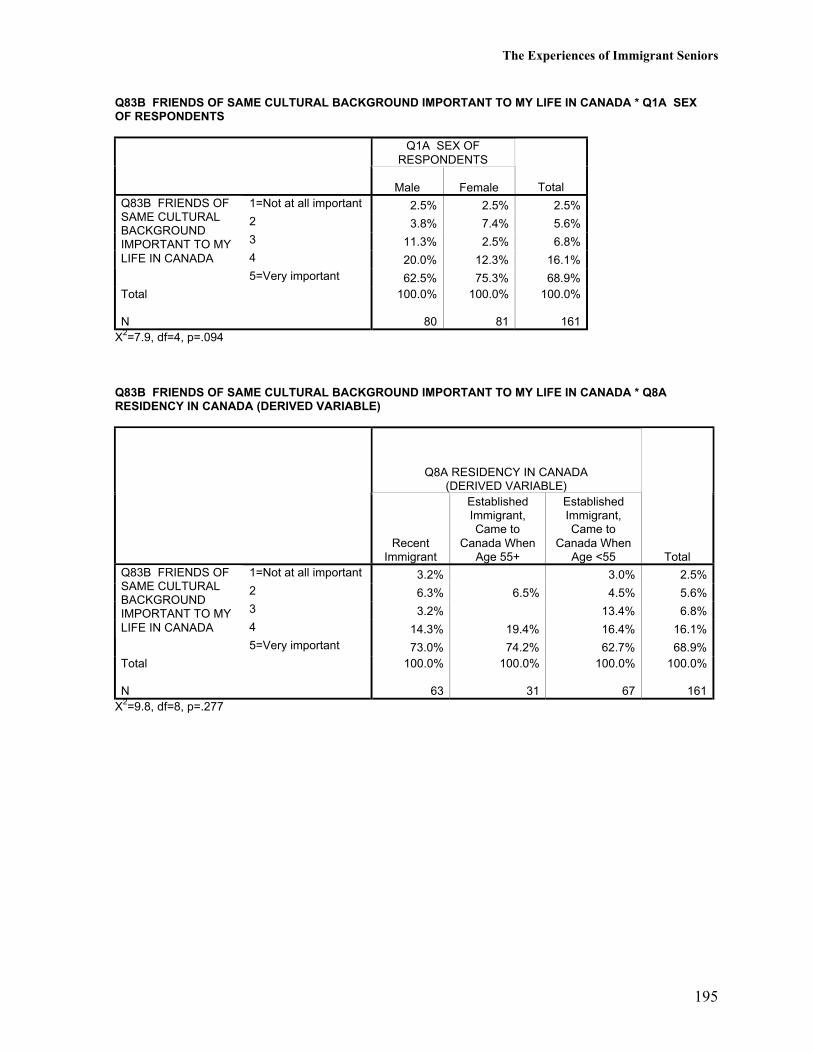
The Experiences of Immigrant Seniors
195
Q83B FRIENDS OF SAME CULTURAL BACKGROUND IMPORTANT TO MY LIFE IN CANADA * Q1A SEXOF RESPONDENTS
Q1A SEX OFRESPONDENTS
Male Female Total1=Not at all important 2.5% 2.5% 2.5%2 3.8% 7.4% 5.6%3 11.3% 2.5% 6.8%4 20.0% 12.3% 16.1%
Q83B FRIENDS OFSAME CULTURALBACKGROUNDIMPORTANT TO MYLIFE IN CANADA
5=Very important 62.5% 75.3% 68.9%Total
N
100.0%
80
100.0%
81
100.0%
161X2=7.9, df=4, p=.094
Q83B FRIENDS OF SAME CULTURAL BACKGROUND IMPORTANT TO MY LIFE IN CANADA * Q8ARESIDENCY IN CANADA (DERIVED VARIABLE)
Q8A RESIDENCY IN CANADA(DERIVED VARIABLE)
RecentImmigrant
EstablishedImmigrant,Came to
Canada WhenAge 55+
EstablishedImmigrant,Came to
Canada WhenAge <55 Total
1=Not at all important 3.2% 3.0% 2.5%2 6.3% 6.5% 4.5% 5.6%3 3.2% 13.4% 6.8%4 14.3% 19.4% 16.4% 16.1%
Q83B FRIENDS OFSAME CULTURALBACKGROUNDIMPORTANT TO MYLIFE IN CANADA
5=Very important 73.0% 74.2% 62.7% 68.9%Total
N
100.0%
63
100.0%
31
100.0%
67
100.0%
161X2=9.8, df=8, p=.277
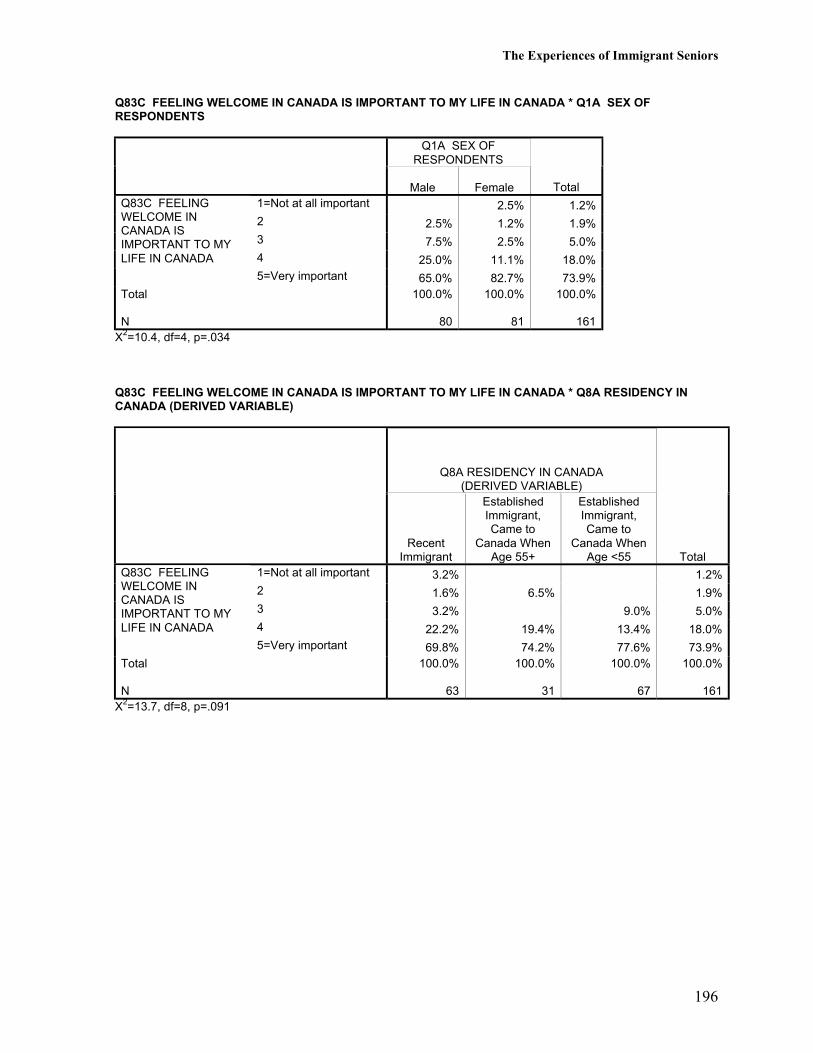
The Experiences of Immigrant Seniors
196
Q83C FEELING WELCOME IN CANADA IS IMPORTANT TO MY LIFE IN CANADA * Q1A SEX OFRESPONDENTS
Q1A SEX OFRESPONDENTS
Male Female Total1=Not at all important 2.5% 1.2%2 2.5% 1.2% 1.9%3 7.5% 2.5% 5.0%4 25.0% 11.1% 18.0%
Q83C FEELINGWELCOME INCANADA ISIMPORTANT TO MYLIFE IN CANADA
5=Very important 65.0% 82.7% 73.9%Total
N
100.0%
80
100.0%
81
100.0%
161X2=10.4, df=4, p=.034
Q83C FEELING WELCOME IN CANADA IS IMPORTANT TO MY LIFE IN CANADA * Q8A RESIDENCY INCANADA (DERIVED VARIABLE)
Q8A RESIDENCY IN CANADA(DERIVED VARIABLE)
RecentImmigrant
EstablishedImmigrant,Came to
Canada WhenAge 55+
EstablishedImmigrant,Came to
Canada WhenAge <55 Total
1=Not at all important 3.2% 1.2%2 1.6% 6.5% 1.9%3 3.2% 9.0% 5.0%4 22.2% 19.4% 13.4% 18.0%
Q83C FEELINGWELCOME INCANADA ISIMPORTANT TO MYLIFE IN CANADA
5=Very important 69.8% 74.2% 77.6% 73.9%Total
N
100.0%
63
100.0%
31
100.0%
67
100.0%
161X2=13.7, df=8, p=.091
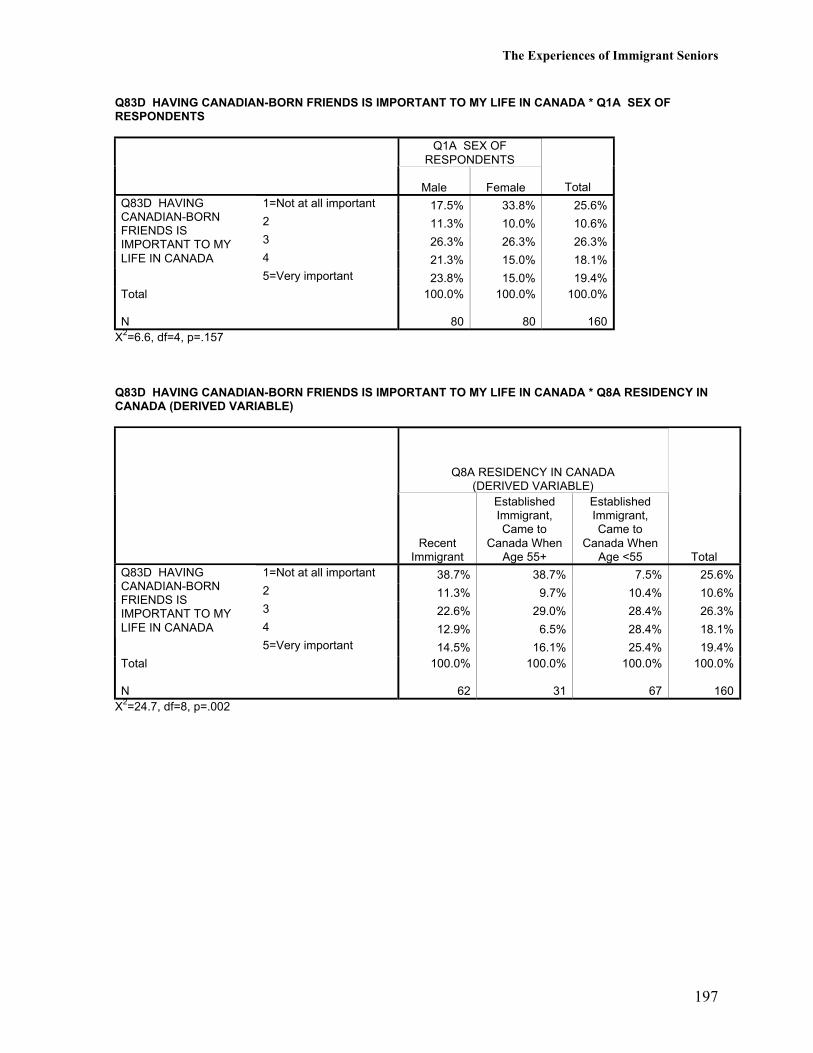
The Experiences of Immigrant Seniors
197
Q83D HAVING CANADIAN-BORN FRIENDS IS IMPORTANT TO MY LIFE IN CANADA * Q1A SEX OFRESPONDENTS
Q1A SEX OFRESPONDENTS
Male Female Total1=Not at all important 17.5% 33.8% 25.6%2 11.3% 10.0% 10.6%3 26.3% 26.3% 26.3%4 21.3% 15.0% 18.1%
Q83D HAVINGCANADIAN-BORNFRIENDS ISIMPORTANT TO MYLIFE IN CANADA
5=Very important 23.8% 15.0% 19.4%Total
N
100.0%
80
100.0%
80
100.0%
160X2=6.6, df=4, p=.157
Q83D HAVING CANADIAN-BORN FRIENDS IS IMPORTANT TO MY LIFE IN CANADA * Q8A RESIDENCY INCANADA (DERIVED VARIABLE)
Q8A RESIDENCY IN CANADA(DERIVED VARIABLE)
RecentImmigrant
EstablishedImmigrant,Came to
Canada WhenAge 55+
EstablishedImmigrant,Came to
Canada WhenAge <55 Total
1=Not at all important 38.7% 38.7% 7.5% 25.6%2 11.3% 9.7% 10.4% 10.6%3 22.6% 29.0% 28.4% 26.3%4 12.9% 6.5% 28.4% 18.1%
Q83D HAVINGCANADIAN-BORNFRIENDS ISIMPORTANT TO MYLIFE IN CANADA
5=Very important 14.5% 16.1% 25.4% 19.4%Total
N
100.0%
62
100.0%
31
100.0%
67
100.0%
160X2=24.7, df=8, p=.002
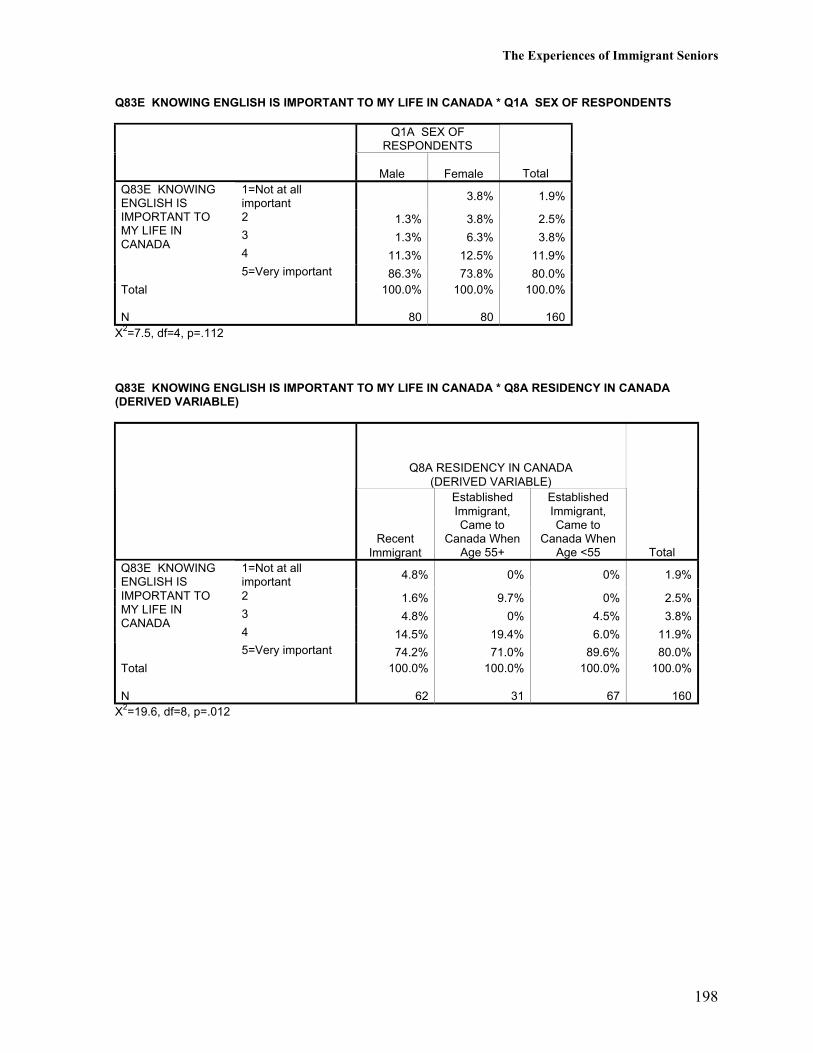
The Experiences of Immigrant Seniors
198
Q83E KNOWING ENGLISH IS IMPORTANT TO MY LIFE IN CANADA * Q1A SEX OF RESPONDENTS
Q1A SEX OFRESPONDENTS
Male Female Total1=Not at allimportant
3.8% 1.9%
2 1.3% 3.8% 2.5%3 1.3% 6.3% 3.8%4 11.3% 12.5% 11.9%
Q83E KNOWINGENGLISH ISIMPORTANT TOMY LIFE INCANADA
5=Very important 86.3% 73.8% 80.0%Total
N
100.0%
80
100.0%
80
100.0%
160X2=7.5, df=4, p=.112
Q83E KNOWING ENGLISH IS IMPORTANT TO MY LIFE IN CANADA * Q8A RESIDENCY IN CANADA(DERIVED VARIABLE)
Q8A RESIDENCY IN CANADA(DERIVED VARIABLE)
RecentImmigrant
EstablishedImmigrant,Came to
Canada WhenAge 55+
EstablishedImmigrant,Came to
Canada WhenAge <55 Total
1=Not at allimportant
4.8% 0% 0% 1.9%
2 1.6% 9.7% 0% 2.5%3 4.8% 0% 4.5% 3.8%4 14.5% 19.4% 6.0% 11.9%
Q83E KNOWINGENGLISH ISIMPORTANT TOMY LIFE INCANADA
5=Very important 74.2% 71.0% 89.6% 80.0%Total
N
100.0%
62
100.0%
31
100.0%
67
100.0%
160X2=19.6, df=8, p=.012

The Experiences of Immigrant Seniors
199
Q83F HAVING CANADIAN CITIZENSHIP IS IMPORTANT TO MY LIFE IN CANADA * Q1A SEX OFRESPONDENTS
Q1A SEX OFRESPONDENTS
Male Female Total1=Not at all important 3.7% 1.9%2 1.3% 3.7% 2.5%3 2.5% 3.7% 3.1%4 11.4% 19.8% 15.6%
Q83F HAVINGCANADIANCITIZENSHIP ISIMPORTANT TO MYLIFE IN CANADA
5=Very important 84.8% 69.1% 76.9%Total
N
100.0%
79
100.0%
81
100.0%
160X2=7.1, df=4, p=.130
Q83F HAVING CANADIAN CITIZENSHIP IS IMPORTANT TO MY LIFE IN CANADA * Q8A RESIDENCY INCANADA (DERIVED VARIABLE)
Q8A RESIDENCY IN CANADA(DERIVED VARIABLE)
RecentImmigrant
EstablishedImmigrant,Came to
Canada WhenAge 55+
EstablishedImmigrant,Came to
Canada WhenAge <55 Total
1=Not at all important 4.8% 1.9%2 4.8% 3.2% 2.5%3 4.8% 6.5% 3.1%4 19.4% 16.1% 11.9% 15.6%
Q83F HAVINGCANADIANCITIZENSHIP ISIMPORTANT TO MYLIFE IN CANADA
5=Very important 66.1% 74.2% 88.1% 76.9%Total
N
100.0%
62
100.0%
31
100.0%
67
100.0%
160X2=14.8, df=8, p=.063
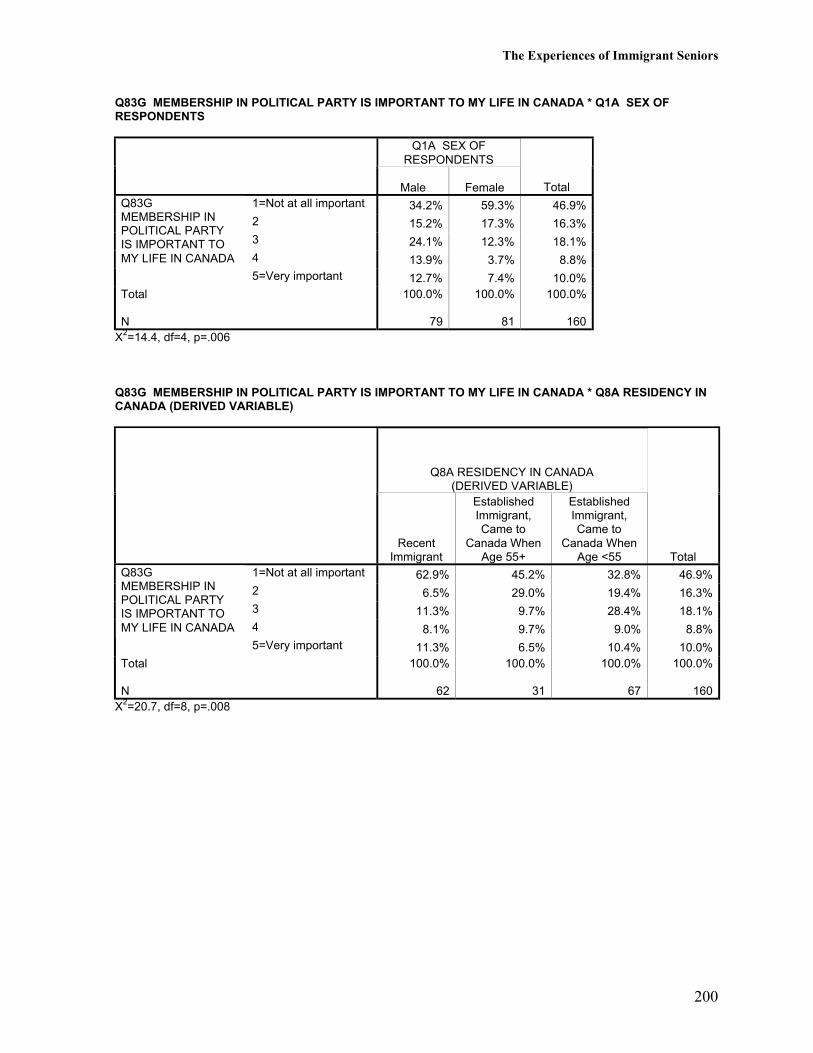
The Experiences of Immigrant Seniors
200
Q83G MEMBERSHIP IN POLITICAL PARTY IS IMPORTANT TO MY LIFE IN CANADA * Q1A SEX OFRESPONDENTS
Q1A SEX OFRESPONDENTS
Male Female Total1=Not at all important 34.2% 59.3% 46.9%2 15.2% 17.3% 16.3%3 24.1% 12.3% 18.1%4 13.9% 3.7% 8.8%
Q83GMEMBERSHIP INPOLITICAL PARTYIS IMPORTANT TOMY LIFE IN CANADA
5=Very important 12.7% 7.4% 10.0%Total
N
100.0%
79
100.0%
81
100.0%
160X2=14.4, df=4, p=.006
Q83G MEMBERSHIP IN POLITICAL PARTY IS IMPORTANT TO MY LIFE IN CANADA * Q8A RESIDENCY INCANADA (DERIVED VARIABLE)
Q8A RESIDENCY IN CANADA(DERIVED VARIABLE)
RecentImmigrant
EstablishedImmigrant,Came to
Canada WhenAge 55+
EstablishedImmigrant,Came to
Canada WhenAge <55 Total
1=Not at all important 62.9% 45.2% 32.8% 46.9%2 6.5% 29.0% 19.4% 16.3%3 11.3% 9.7% 28.4% 18.1%4 8.1% 9.7% 9.0% 8.8%
Q83GMEMBERSHIP INPOLITICAL PARTYIS IMPORTANT TOMY LIFE IN CANADA
5=Very important 11.3% 6.5% 10.4% 10.0%Total
N
100.0%
62
100.0%
31
100.0%
67
100.0%
160X2=20.7, df=8, p=.008
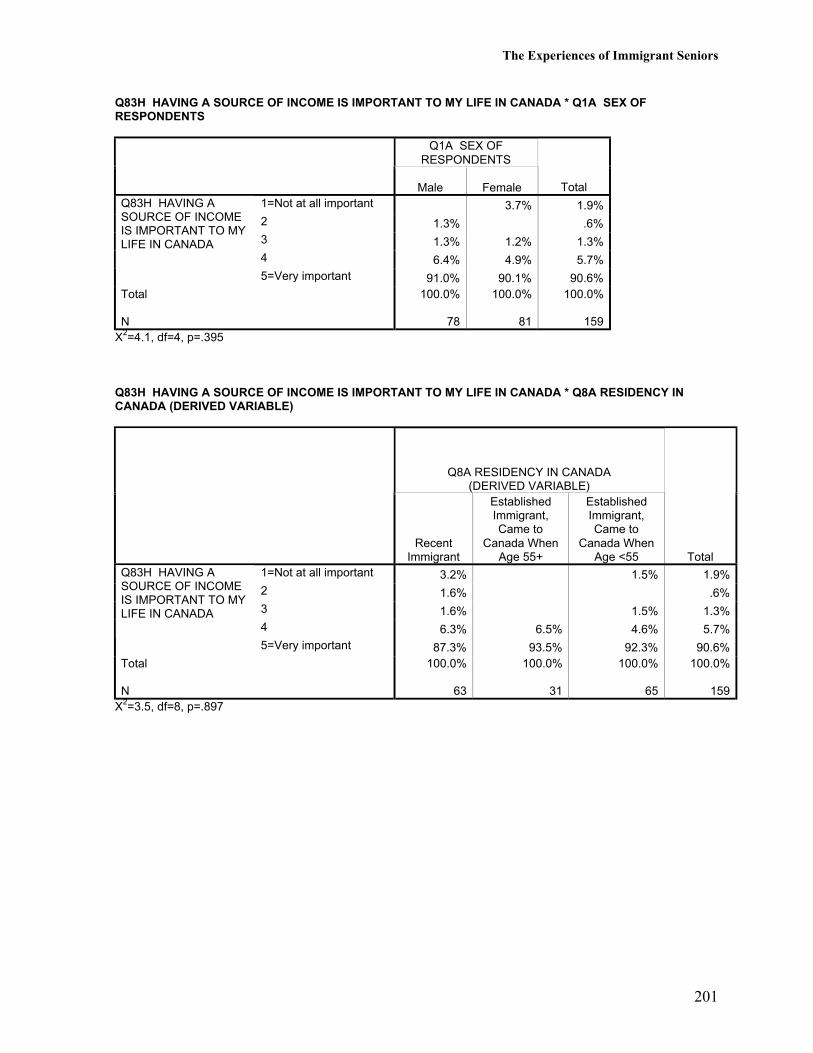
The Experiences of Immigrant Seniors
201
Q83H HAVING A SOURCE OF INCOME IS IMPORTANT TO MY LIFE IN CANADA * Q1A SEX OFRESPONDENTS
Q1A SEX OFRESPONDENTS
Male Female Total1=Not at all important 3.7% 1.9%2 1.3% .6%3 1.3% 1.2% 1.3%4 6.4% 4.9% 5.7%
Q83H HAVING ASOURCE OF INCOMEIS IMPORTANT TO MYLIFE IN CANADA
5=Very important 91.0% 90.1% 90.6%Total
N
100.0%
78
100.0%
81
100.0%
159X2=4.1, df=4, p=.395
Q83H HAVING A SOURCE OF INCOME IS IMPORTANT TO MY LIFE IN CANADA * Q8A RESIDENCY INCANADA (DERIVED VARIABLE)
Q8A RESIDENCY IN CANADA(DERIVED VARIABLE)
RecentImmigrant
EstablishedImmigrant,Came to
Canada WhenAge 55+
EstablishedImmigrant,Came to
Canada WhenAge <55 Total
1=Not at all important 3.2% 1.5% 1.9%2 1.6% .6%3 1.6% 1.5% 1.3%4 6.3% 6.5% 4.6% 5.7%
Q83H HAVING ASOURCE OF INCOMEIS IMPORTANT TO MYLIFE IN CANADA
5=Very important 87.3% 93.5% 92.3% 90.6%Total
N
100.0%
63
100.0%
31
100.0%
65
100.0%
159X2=3.5, df=8, p=.897
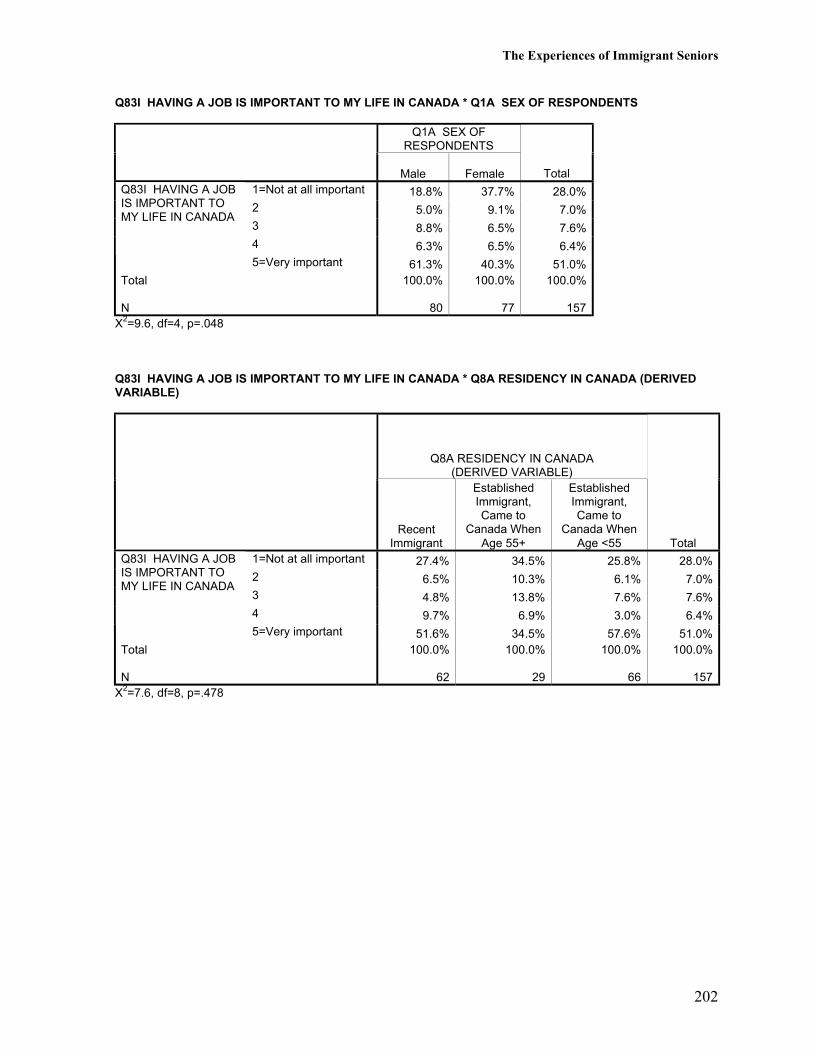
The Experiences of Immigrant Seniors
202
Q83I HAVING A JOB IS IMPORTANT TO MY LIFE IN CANADA * Q1A SEX OF RESPONDENTS
Q1A SEX OFRESPONDENTS
Male Female Total1=Not at all important 18.8% 37.7% 28.0%2 5.0% 9.1% 7.0%3 8.8% 6.5% 7.6%4 6.3% 6.5% 6.4%
Q83I HAVING A JOBIS IMPORTANT TOMY LIFE IN CANADA
5=Very important 61.3% 40.3% 51.0%Total
N
100.0%
80
100.0%
77
100.0%
157X2=9.6, df=4, p=.048
Q83I HAVING A JOB IS IMPORTANT TO MY LIFE IN CANADA * Q8A RESIDENCY IN CANADA (DERIVEDVARIABLE)
Q8A RESIDENCY IN CANADA(DERIVED VARIABLE)
RecentImmigrant
EstablishedImmigrant,Came to
Canada WhenAge 55+
EstablishedImmigrant,Came to
Canada WhenAge <55 Total
1=Not at all important 27.4% 34.5% 25.8% 28.0%2 6.5% 10.3% 6.1% 7.0%3 4.8% 13.8% 7.6% 7.6%4 9.7% 6.9% 3.0% 6.4%
Q83I HAVING A JOBIS IMPORTANT TOMY LIFE IN CANADA
5=Very important 51.6% 34.5% 57.6% 51.0%Total
N
100.0%
62
100.0%
29
100.0%
66
100.0%
157X2=7.6, df=8, p=.478

The Experiences of Immigrant Seniors
203
Voting in Canada
Just over half of all respondents indicated that they vote “all of the time” in city, provincialand federal elections. One in five said that they were not eligible to vote while almost 20%indicated that they never vote even though eligible.
Voting patterns did not differ among male and female respondents but did differ according toresidency. That is, recent immigrants were more likely to be ineligible to vote—almost half ofrecent immigrants were ineligible compared to 3% or less of established immigrants whocame to Canada before the age of 55—and recent immigrants were also more likely toindicate that they never vote. In contrast, among established immigrants who came to Canadabefore the age of 55, five in every six voted “all of the time.”
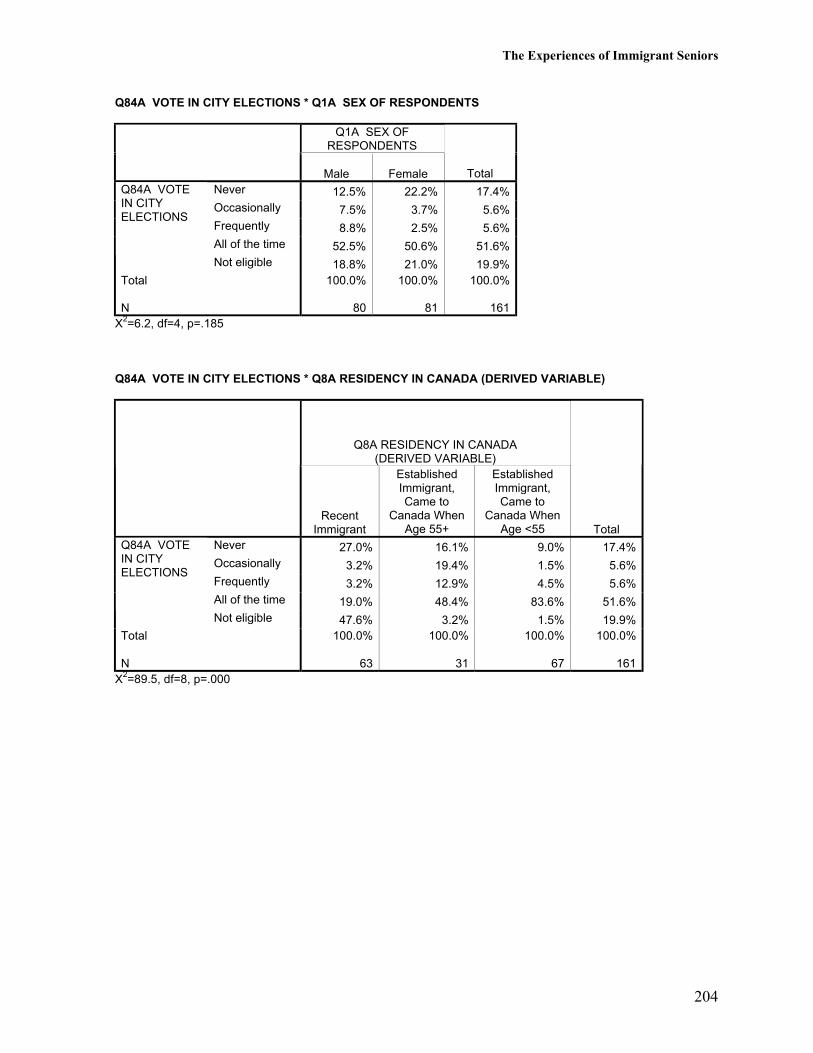
The Experiences of Immigrant Seniors
204
Q84A VOTE IN CITY ELECTIONS * Q1A SEX OF RESPONDENTS
Q1A SEX OFRESPONDENTS
Male Female TotalNever 12.5% 22.2% 17.4%Occasionally 7.5% 3.7% 5.6%Frequently 8.8% 2.5% 5.6%All of the time 52.5% 50.6% 51.6%
Q84A VOTEIN CITYELECTIONS
Not eligible 18.8% 21.0% 19.9%Total
N
100.0%
80
100.0%
81
100.0%
161X2=6.2, df=4, p=.185
Q84A VOTE IN CITY ELECTIONS * Q8A RESIDENCY IN CANADA (DERIVED VARIABLE)
Q8A RESIDENCY IN CANADA(DERIVED VARIABLE)
RecentImmigrant
EstablishedImmigrant,Came to
Canada WhenAge 55+
EstablishedImmigrant,Came to
Canada WhenAge <55 Total
Never 27.0% 16.1% 9.0% 17.4%Occasionally 3.2% 19.4% 1.5% 5.6%Frequently 3.2% 12.9% 4.5% 5.6%All of the time 19.0% 48.4% 83.6% 51.6%
Q84A VOTEIN CITYELECTIONS
Not eligible 47.6% 3.2% 1.5% 19.9%Total
N
100.0%
63
100.0%
31
100.0%
67
100.0%
161X2=89.5, df=8, p=.000
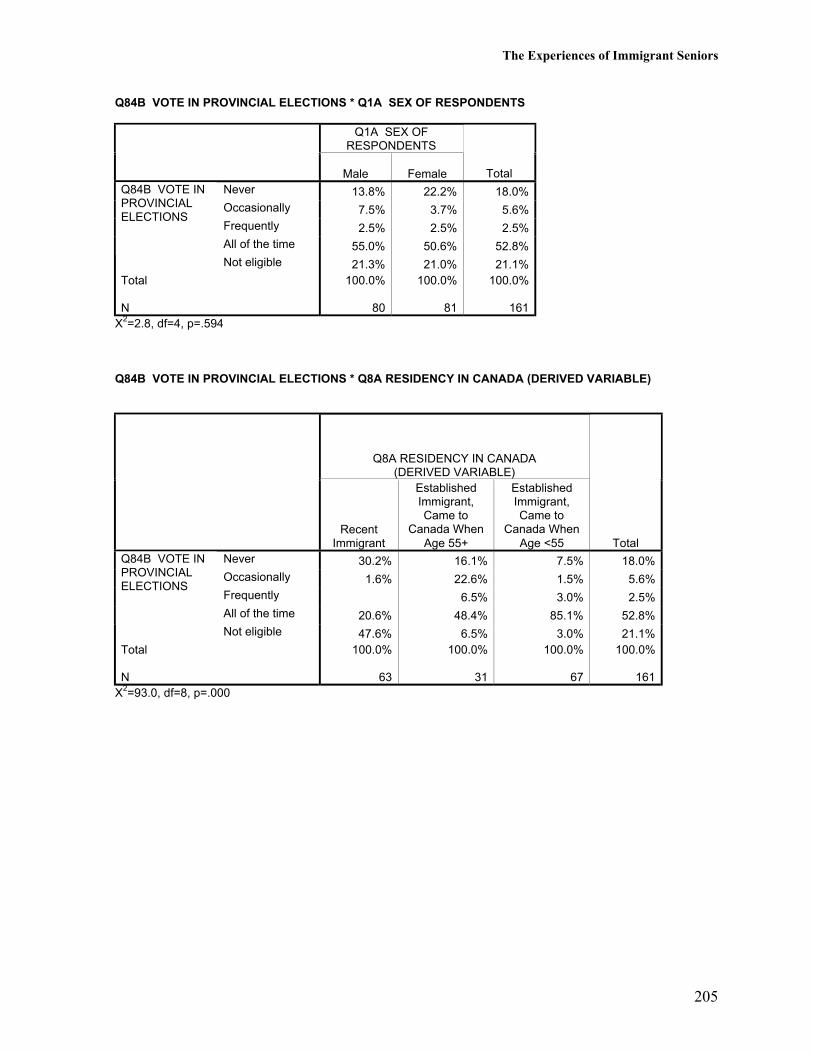
The Experiences of Immigrant Seniors
205
Q84B VOTE IN PROVINCIAL ELECTIONS * Q1A SEX OF RESPONDENTS
Q1A SEX OFRESPONDENTS
Male Female TotalNever 13.8% 22.2% 18.0%Occasionally 7.5% 3.7% 5.6%Frequently 2.5% 2.5% 2.5%All of the time 55.0% 50.6% 52.8%
Q84B VOTE INPROVINCIALELECTIONS
Not eligible 21.3% 21.0% 21.1%Total
N
100.0%
80
100.0%
81
100.0%
161X2=2.8, df=4, p=.594
Q84B VOTE IN PROVINCIAL ELECTIONS * Q8A RESIDENCY IN CANADA (DERIVED VARIABLE)
Q8A RESIDENCY IN CANADA(DERIVED VARIABLE)
RecentImmigrant
EstablishedImmigrant,Came to
Canada WhenAge 55+
EstablishedImmigrant,Came to
Canada WhenAge <55 Total
Never 30.2% 16.1% 7.5% 18.0%Occasionally 1.6% 22.6% 1.5% 5.6%Frequently 6.5% 3.0% 2.5%All of the time 20.6% 48.4% 85.1% 52.8%
Q84B VOTE INPROVINCIALELECTIONS
Not eligible 47.6% 6.5% 3.0% 21.1%Total
N
100.0%
63
100.0%
31
100.0%
67
100.0%
161X2=93.0, df=8, p=.000

The Experiences of Immigrant Seniors
206
Q84C VOTE IN FEDERAL ELECTIONS * Q1A SEX OF RESPONDENTS
Q1A SEX OFRESPONDENTS
Male Female TotalNever 16.5% 22.2% 19.4%Occasionally 5.1% 3.7% 4.4%Frequently 1.3% 2.5% 1.9%All of the time 55.7% 50.6% 53.1%
Q84C VOTEIN FEDERALELECTIONS
Not eligible 21.5% 21.0% 21.3%Total
N
100.0%
79
100.0%
81
100.0%
160X2=1.4, df=4, p=.850
Q84C VOTE IN FEDERAL ELECTIONS * Q8A RESIDENCY IN CANADA (DERIVED VARIABLE)
Q8A RESIDENCY IN CANADA(DERIVED VARIABLE)
RecentImmigrant
EstablishedImmigrant,Came to
Canada WhenAge 55+
EstablishedImmigrant,Came to
Canada WhenAge <55 Total
Never 30.6% 19.4% 9.0% 19.4%Occasionally 1.6% 19.4% 4.4%Frequently 6.5% 1.5% 1.9%All of the time 19.4% 48.4% 86.6% 53.1%
Q84C VOTEIN FEDERALELECTIONS
Not eligible 48.4% 6.5% 3.0% 21.3%Total
N
100.0%
62
100.0%
31
100.0%
67
100.0%
160X2=95.2, df=8, p=.000
The Experiences of Immigrant Seniors
207
Connections to Homeland
Most of the respondents had occasional or frequent contact by long-distance telephone withfamily and friends who live in their homeland. In addition most visited family and friends intheir homeland occasionally or frequently. Contact by electronic mail or fax was less common(70% never use email or fax) as was letter writing (41% never and 42% occasionally). Familyand friends from the homeland visited respondents in Edmonton less often than respondentsvisited family and friends in their homeland (43% were visited in Edmonton at leastoccasionally while 88% made at least an occasional visit to family and friends in theirhomeland).
Contact with family and friends in the homeland did not differ by sex and contact by long-distance telephone or by letter did not vary by residency in Canada. Nevertheless, visits inEdmonton with family and friends from the homeland and visits to family and friends in thehomeland were more common for established immigrants than recent immigrants.
Most of the respondents indicated that it was highly unlikely that they would ever move backto their homeland. Only 1 in 20 indicated that they planned to return. Responses did not varyby sex or residency in Canada. Similarly, most said that they were not at all concerned aboutreturning to their homeland to die, although 1 in 10 did indicate that they were veryconcerned. Again, responses did not vary by sex or residency in Canada. Half (49%) said thatthey were not concerned because their family was in Canada and Canada was their homelandnow.
Most respondents (86%) lived in Canada all year long. Most (74%) have visited theirhomeland in the past five years at least once. Recent immigrants were least likely to havemade a return visit in the past five years and established immigrants were more likely to havemade several return visits. About half of those who made a return visit or visits in the past fiveyears stayed longer than two months.
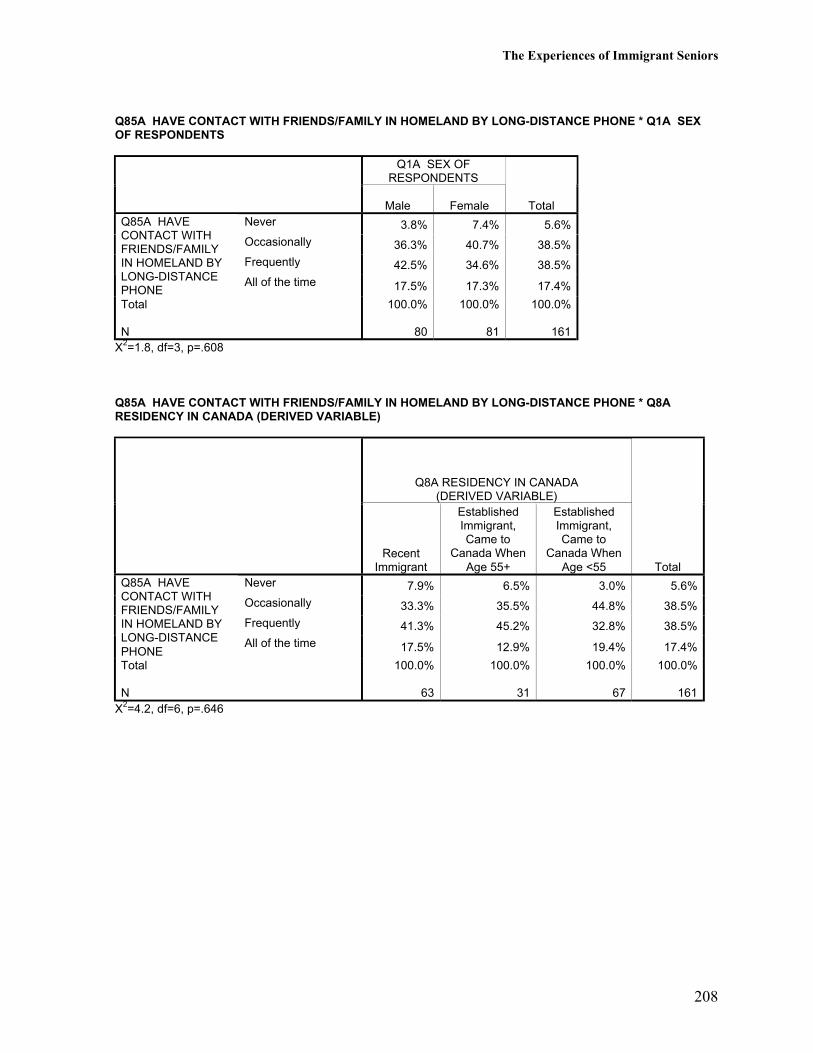
The Experiences of Immigrant Seniors
208
Q85A HAVE CONTACT WITH FRIENDS/FAMILY IN HOMELAND BY LONG-DISTANCE PHONE * Q1A SEXOF RESPONDENTS
Q1A SEX OFRESPONDENTS
Male Female TotalNever 3.8% 7.4% 5.6%
Occasionally 36.3% 40.7% 38.5%
Frequently 42.5% 34.6% 38.5%
Q85A HAVECONTACT WITHFRIENDS/FAMILYIN HOMELAND BYLONG-DISTANCEPHONE
All of the time 17.5% 17.3% 17.4%
Total
N
100.0%
80
100.0%
81
100.0%
161X2=1.8, df=3, p=.608
Q85A HAVE CONTACT WITH FRIENDS/FAMILY IN HOMELAND BY LONG-DISTANCE PHONE * Q8ARESIDENCY IN CANADA (DERIVED VARIABLE)
Q8A RESIDENCY IN CANADA(DERIVED VARIABLE)
RecentImmigrant
EstablishedImmigrant,Came to
Canada WhenAge 55+
EstablishedImmigrant,Came to
Canada WhenAge <55 Total
Never 7.9% 6.5% 3.0% 5.6%
Occasionally 33.3% 35.5% 44.8% 38.5%
Frequently 41.3% 45.2% 32.8% 38.5%
Q85A HAVECONTACT WITHFRIENDS/FAMILYIN HOMELAND BYLONG-DISTANCEPHONE
All of the time 17.5% 12.9% 19.4% 17.4%
Total
N
100.0%
63
100.0%
31
100.0%
67
100.0%
161X2=4.2, df=6, p=.646

The Experiences of Immigrant Seniors
209
Q85B HAVE CONTACT WITH FRIENDS/FAMILY IN HOMELAND BY E-MAIL OR FAX * Q1A SEX OFRESPONDENTS
Q1A SEX OFRESPONDENTS
Male Female TotalNever 73.8% 66.7% 70.2%Occasionally 7.5% 13.6% 10.6%Frequently 13.8% 17.3% 15.5%
Q85B HAVECONTACT WITHFRIENDS/FAMILYIN HOMELAND BYE-MAIL OR FAX All of the time 5.0% 2.5% 3.7%Total
N
100.0%
80
100.0%
81
100.0%
161X2=2.7, df=3, p=.438
Q85B HAVE CONTACT WITH FRIENDS/FAMILY IN HOMELAND BY E-MAIL OR FAX * Q8A RESIDENCY INCANADA (DERIVED VARIABLE)
Q8A RESIDENCY IN CANADA(DERIVED VARIABLE)
RecentImmigrant
EstablishedImmigrant,Came to
Canada WhenAge 55+
EstablishedImmigrant,Came to
Canada WhenAge <55 Total
Never 76.2% 90.3% 55.2% 70.2%Occasionally 12.7% 13.4% 10.6%Frequently 7.9% 9.7% 25.4% 15.5%
Q85B HAVECONTACT WITHFRIENDS/FAMILYIN HOMELAND BYE-MAIL OR FAX All of the time 3.2% 6.0% 3.7%Total
N
100.0%
63
100.0%
31
100.0%
67
100.0%
161X2=17.6, df=6, p=.007

The Experiences of Immigrant Seniors
210
Q85C HAVE CONTACT WITH FRIENDS/FAMILY IN HOMELAND BY LETTER * Q1A SEX OFRESPONDENTS
Q1A SEX OFRESPONDENTS
Male Female TotalNever 36.7% 44.4% 40.6%Occasionally 40.5% 43.2% 41.9%Frequently 16.5% 8.6% 12.5%
Q85C HAVECONTACT WITHFRIENDS/FAMILYIN HOMELAND BYLETTER All of the time 6.3% 3.7% 5.0%Total
N
100.0%
79
100.0%
81
100.0%
160X2=3.2, df=3, p=.367
Q85C HAVE CONTACT WITH FRIENDS/FAMILY IN HOMELAND BY LETTER * Q8A RESIDENCY INCANADA (DERIVED VARIABLE)
Q8A RESIDENCY IN CANADA(DERIVED VARIABLE)
RecentImmigrant
EstablishedImmigrant,Came to
Canada WhenAge 55+
EstablishedImmigrant,Came to
Canada WhenAge <55 Total
Never 36.5% 41.9% 43.9% 40.6%Occasionally 44.4% 45.2% 37.9% 41.9%Frequently 11.1% 9.7% 15.2% 12.5%
Q85C HAVECONTACT WITHFRIENDS/FAMILYIN HOMELAND BYLETTER All of the time 7.9% 3.2% 3.0% 5.0%Total
N
100.0%
63
100.0%
31
100.0%
66
100.0%
160X2=3.3, df=6, p=.764
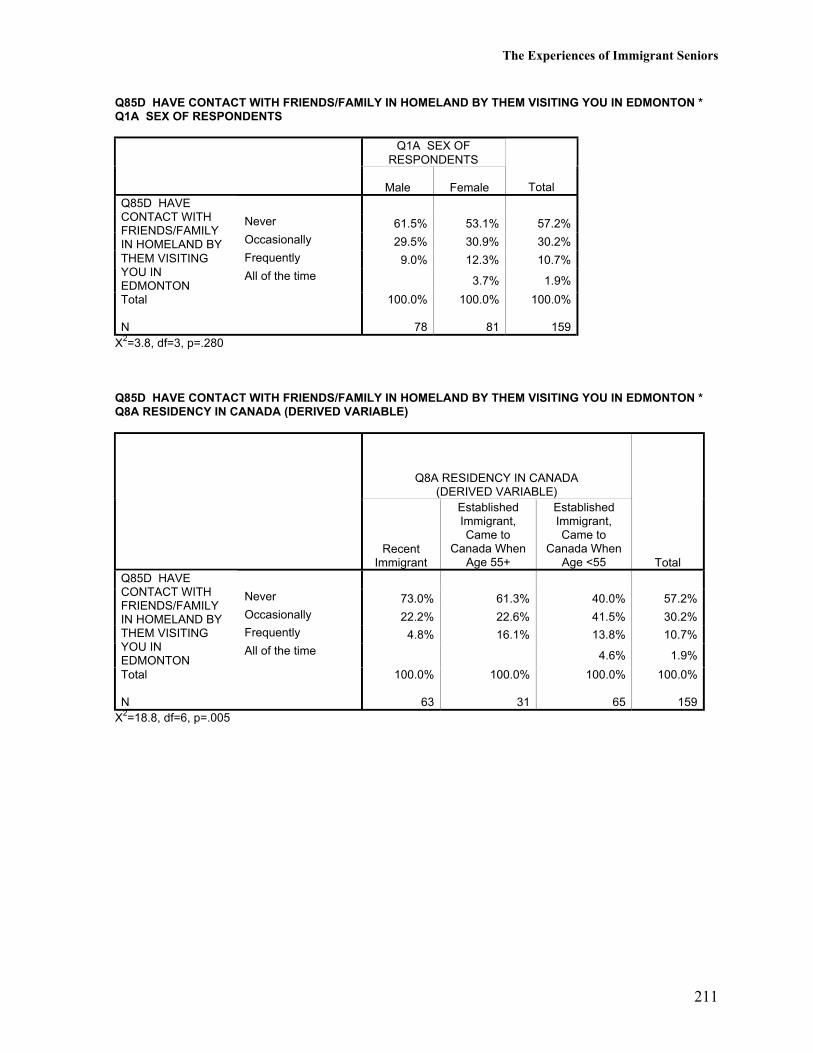
The Experiences of Immigrant Seniors
211
Q85D HAVE CONTACT WITH FRIENDS/FAMILY IN HOMELAND BY THEM VISITING YOU IN EDMONTON *Q1A SEX OF RESPONDENTS
Q1A SEX OFRESPONDENTS
Male Female Total
Never 61.5% 53.1% 57.2%Occasionally 29.5% 30.9% 30.2%Frequently 9.0% 12.3% 10.7%
Q85D HAVECONTACT WITHFRIENDS/FAMILYIN HOMELAND BYTHEM VISITINGYOU INEDMONTON
All of the time 3.7% 1.9%
Total
N
100.0%
78
100.0%
81
100.0%
159X2=3.8, df=3, p=.280
Q85D HAVE CONTACT WITH FRIENDS/FAMILY IN HOMELAND BY THEM VISITING YOU IN EDMONTON *Q8A RESIDENCY IN CANADA (DERIVED VARIABLE)
Q8A RESIDENCY IN CANADA(DERIVED VARIABLE)
RecentImmigrant
EstablishedImmigrant,Came to
Canada WhenAge 55+
EstablishedImmigrant,Came to
Canada WhenAge <55 Total
Never 73.0% 61.3% 40.0% 57.2%Occasionally 22.2% 22.6% 41.5% 30.2%Frequently 4.8% 16.1% 13.8% 10.7%
Q85D HAVECONTACT WITHFRIENDS/FAMILYIN HOMELAND BYTHEM VISITINGYOU INEDMONTON
All of the time 4.6% 1.9%
Total
N
100.0%
63
100.0%
31
100.0%
65
100.0%
159X2=18.8, df=6, p=.005

The Experiences of Immigrant Seniors
212
Q85E HAVE CONTACT WITH FRIENDS/FAMILY BY VISITING THEM IN HOMELAND * Q1A SEX OFRESPONDENTS
Q1A SEX OFRESPONDENTS
Male Female TotalNever 10.0% 13.8% 11.9%Occasionally 46.3% 53.8% 50.0%Frequently 32.5% 26.3% 29.4%
Q85E HAVECONTACT WITHFRIENDS/FAMILYBY VISITING THEMIN HOMELAND All of the time 11.3% 6.3% 8.8%Total
N
100.0%
80
100.0%
80
100.0%
160X2=2.6, df=3, p=.458
Q85E HAVE CONTACT WITH FRIENDS/FAMILY BY VISITIN THEM IN HOMELAND * Q8A RESIDENCY INCANADA (DERIVED VARIABLE)
Q8A RESIDENCY IN CANADA(DERIVED VARIABLE)
RecentImmigrant
EstablishedImmigrant,Came to
Canada WhenAge 55+
EstablishedImmigrant,Came to
Canada WhenAge <55 Total
Never 25.8% 6.5% 1.5% 11.9%Occasionally 41.9% 58.1% 53.7% 50.0%Frequently 25.8% 29.0% 32.8% 29.4%
Q85E HAVECONTACT WITHFRIENDS/FAMILYBY VISITING THEMIN HOMELAND All of the time 6.5% 6.5% 11.9% 8.8%Total
N
100.0%
62
100.0%
31
100.0%
67
100.0%
160X2=20.3, df=6, p=.002
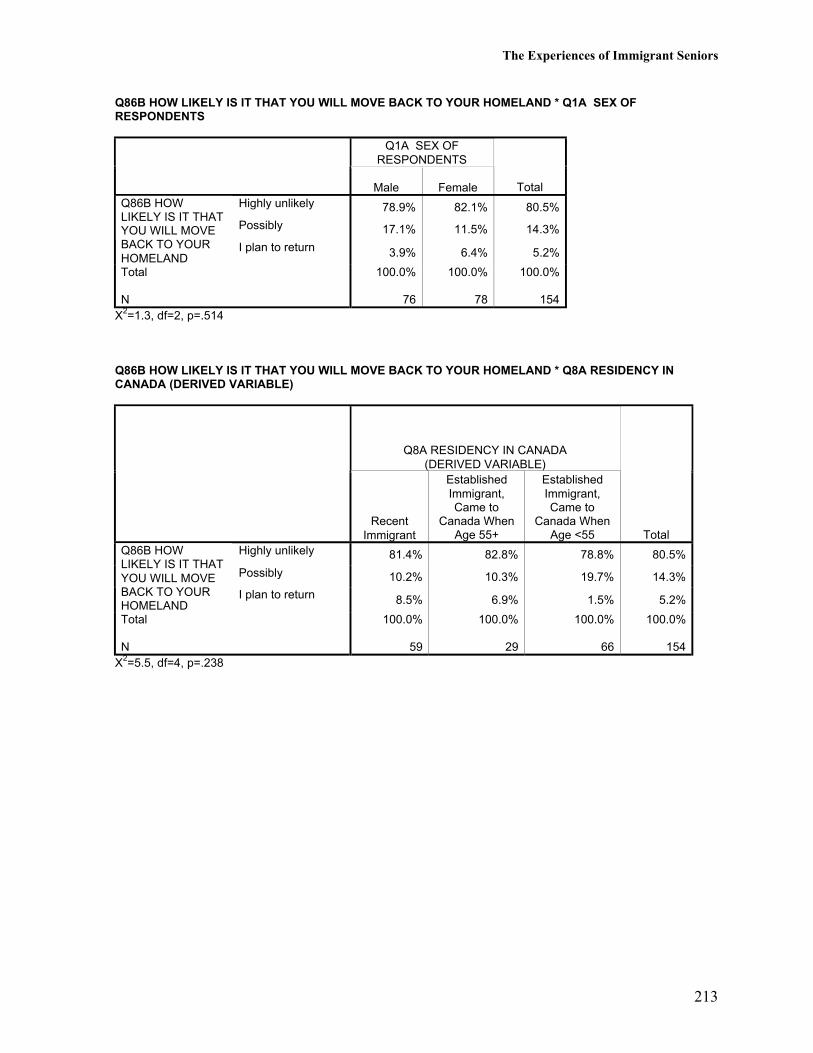
The Experiences of Immigrant Seniors
213
Q86B HOW LIKELY IS IT THAT YOU WILL MOVE BACK TO YOUR HOMELAND * Q1A SEX OFRESPONDENTS
Q1A SEX OFRESPONDENTS
Male Female TotalHighly unlikely 78.9% 82.1% 80.5%
Possibly 17.1% 11.5% 14.3%
Q86B HOWLIKELY IS IT THATYOU WILL MOVEBACK TO YOURHOMELAND
I plan to return 3.9% 6.4% 5.2%
Total
N
100.0%
76
100.0%
78
100.0%
154X2=1.3, df=2, p=.514
Q86B HOW LIKELY IS IT THAT YOU WILL MOVE BACK TO YOUR HOMELAND * Q8A RESIDENCY INCANADA (DERIVED VARIABLE)
Q8A RESIDENCY IN CANADA(DERIVED VARIABLE)
RecentImmigrant
EstablishedImmigrant,Came to
Canada WhenAge 55+
EstablishedImmigrant,Came to
Canada WhenAge <55 Total
Highly unlikely 81.4% 82.8% 78.8% 80.5%
Possibly 10.2% 10.3% 19.7% 14.3%
Q86B HOWLIKELY IS IT THATYOU WILL MOVEBACK TO YOURHOMELAND
I plan to return 8.5% 6.9% 1.5% 5.2%
Total
N
100.0%
59
100.0%
29
100.0%
66
100.0%
154X2=5.5, df=4, p=.238
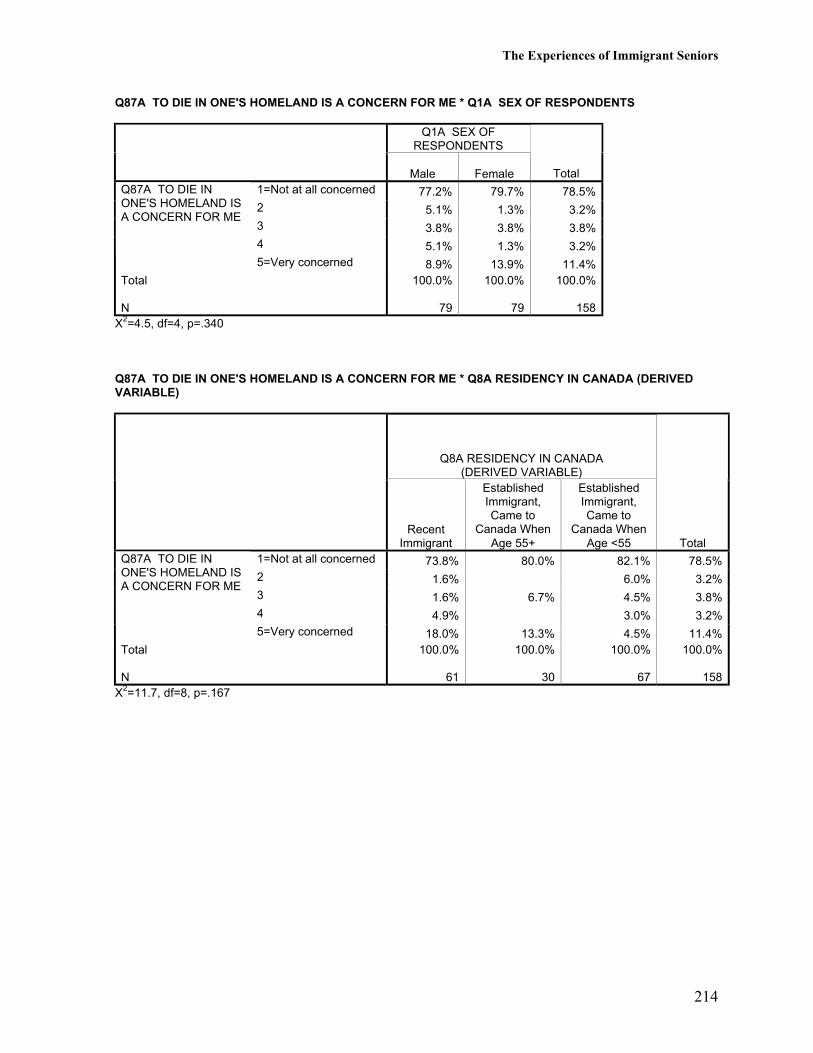
The Experiences of Immigrant Seniors
214
Q87A TO DIE IN ONE'S HOMELAND IS A CONCERN FOR ME * Q1A SEX OF RESPONDENTS
Q1A SEX OFRESPONDENTS
Male Female Total1=Not at all concerned 77.2% 79.7% 78.5%2 5.1% 1.3% 3.2%3 3.8% 3.8% 3.8%4 5.1% 1.3% 3.2%
Q87A TO DIE INONE'S HOMELAND ISA CONCERN FOR ME
5=Very concerned 8.9% 13.9% 11.4%Total
N
100.0%
79
100.0%
79
100.0%
158X2=4.5, df=4, p=.340
Q87A TO DIE IN ONE'S HOMELAND IS A CONCERN FOR ME * Q8A RESIDENCY IN CANADA (DERIVEDVARIABLE)
Q8A RESIDENCY IN CANADA(DERIVED VARIABLE)
RecentImmigrant
EstablishedImmigrant,Came to
Canada WhenAge 55+
EstablishedImmigrant,Came to
Canada WhenAge <55 Total
1=Not at all concerned 73.8% 80.0% 82.1% 78.5%2 1.6% 6.0% 3.2%3 1.6% 6.7% 4.5% 3.8%4 4.9% 3.0% 3.2%
Q87A TO DIE INONE'S HOMELAND ISA CONCERN FOR ME
5=Very concerned 18.0% 13.3% 4.5% 11.4%Total
N
100.0%
61
100.0%
30
100.0%
67
100.0%
158X2=11.7, df=8, p=.167
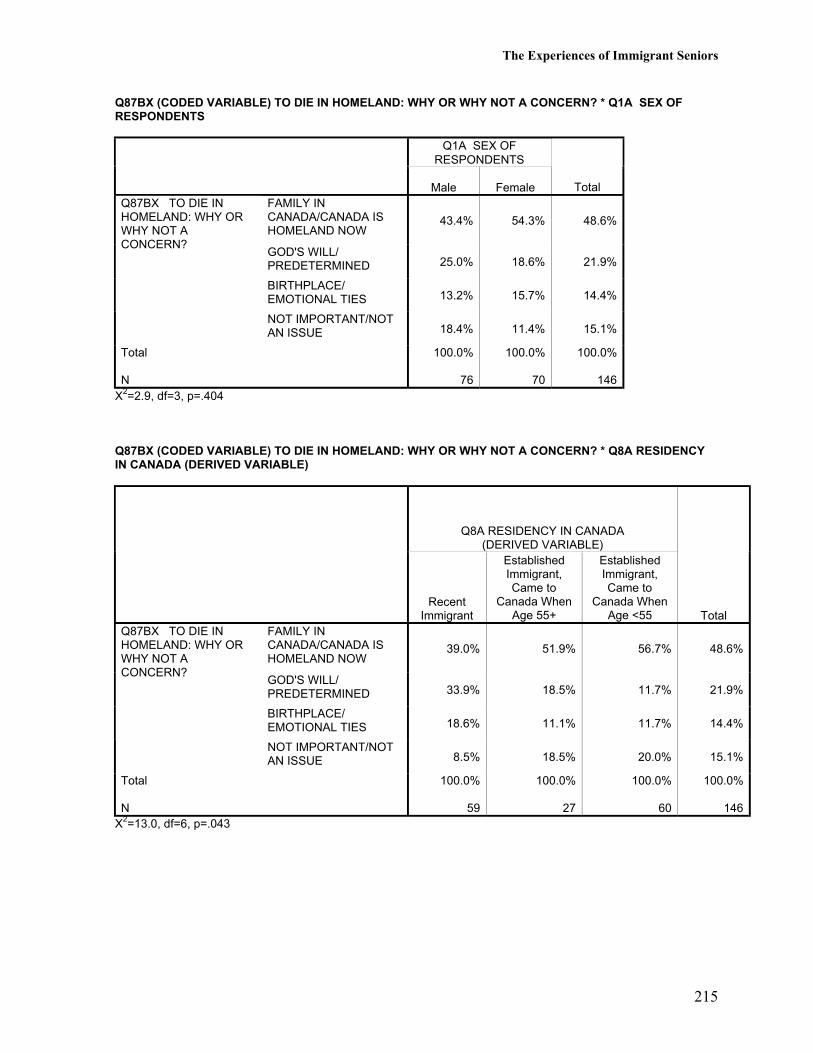
The Experiences of Immigrant Seniors
215
Q87BX (CODED VARIABLE) TO DIE IN HOMELAND: WHY OR WHY NOT A CONCERN? * Q1A SEX OFRESPONDENTS
Q1A SEX OFRESPONDENTS
Male Female TotalFAMILY INCANADA/CANADA ISHOMELAND NOW
43.4% 54.3% 48.6%
GOD'S WILL/PREDETERMINED 25.0% 18.6% 21.9%
BIRTHPLACE/EMOTIONAL TIES 13.2% 15.7% 14.4%
Q87BX TO DIE INHOMELAND: WHY ORWHY NOT ACONCERN?
NOT IMPORTANT/NOTAN ISSUE 18.4% 11.4% 15.1%
Total
N
100.0%
76
100.0%
70
100.0%
146X2=2.9, df=3, p=.404
Q87BX (CODED VARIABLE) TO DIE IN HOMELAND: WHY OR WHY NOT A CONCERN? * Q8A RESIDENCYIN CANADA (DERIVED VARIABLE)
Q8A RESIDENCY IN CANADA(DERIVED VARIABLE)
RecentImmigrant
EstablishedImmigrant,Came to
Canada WhenAge 55+
EstablishedImmigrant,Came to
Canada WhenAge <55 Total
FAMILY INCANADA/CANADA ISHOMELAND NOW
39.0% 51.9% 56.7% 48.6%
GOD'S WILL/PREDETERMINED 33.9% 18.5% 11.7% 21.9%
BIRTHPLACE/EMOTIONAL TIES 18.6% 11.1% 11.7% 14.4%
Q87BX TO DIE INHOMELAND: WHY ORWHY NOT ACONCERN?
NOT IMPORTANT/NOTAN ISSUE 8.5% 18.5% 20.0% 15.1%
Total
N
100.0%
59
100.0%
27
100.0%
60
100.0%
146X2=13.0, df=6, p=.043
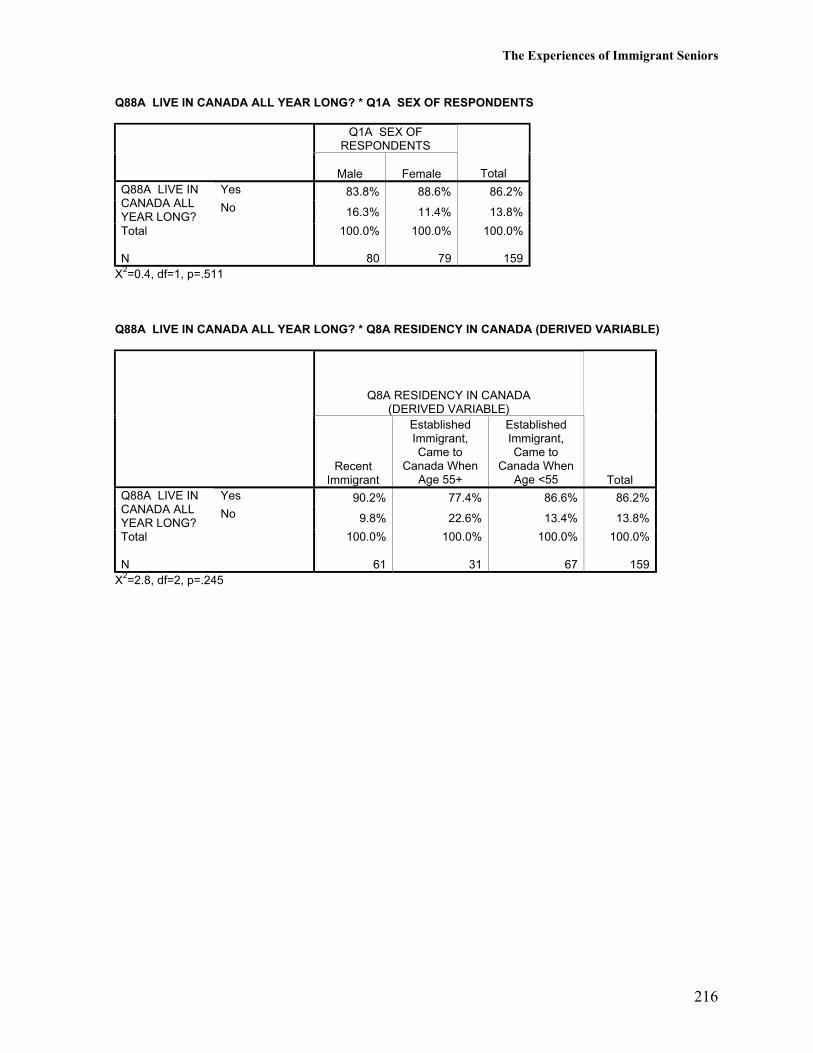
The Experiences of Immigrant Seniors
216
Q88A LIVE IN CANADA ALL YEAR LONG? * Q1A SEX OF RESPONDENTS
Q1A SEX OFRESPONDENTS
Male Female TotalYes 83.8% 88.6% 86.2%Q88A LIVE IN
CANADA ALLYEAR LONG?
No 16.3% 11.4% 13.8%
Total
N
100.0%
80
100.0%
79
100.0%
159X2=0.4, df=1, p=.511
Q88A LIVE IN CANADA ALL YEAR LONG? * Q8A RESIDENCY IN CANADA (DERIVED VARIABLE)
Q8A RESIDENCY IN CANADA(DERIVED VARIABLE)
RecentImmigrant
EstablishedImmigrant,Came to
Canada WhenAge 55+
EstablishedImmigrant,Came to
Canada WhenAge <55 Total
Yes 90.2% 77.4% 86.6% 86.2%Q88A LIVE INCANADA ALLYEAR LONG?
No 9.8% 22.6% 13.4% 13.8%
Total
N
100.0%
61
100.0%
31
100.0%
67
100.0%
159X2=2.8, df=2, p=.245
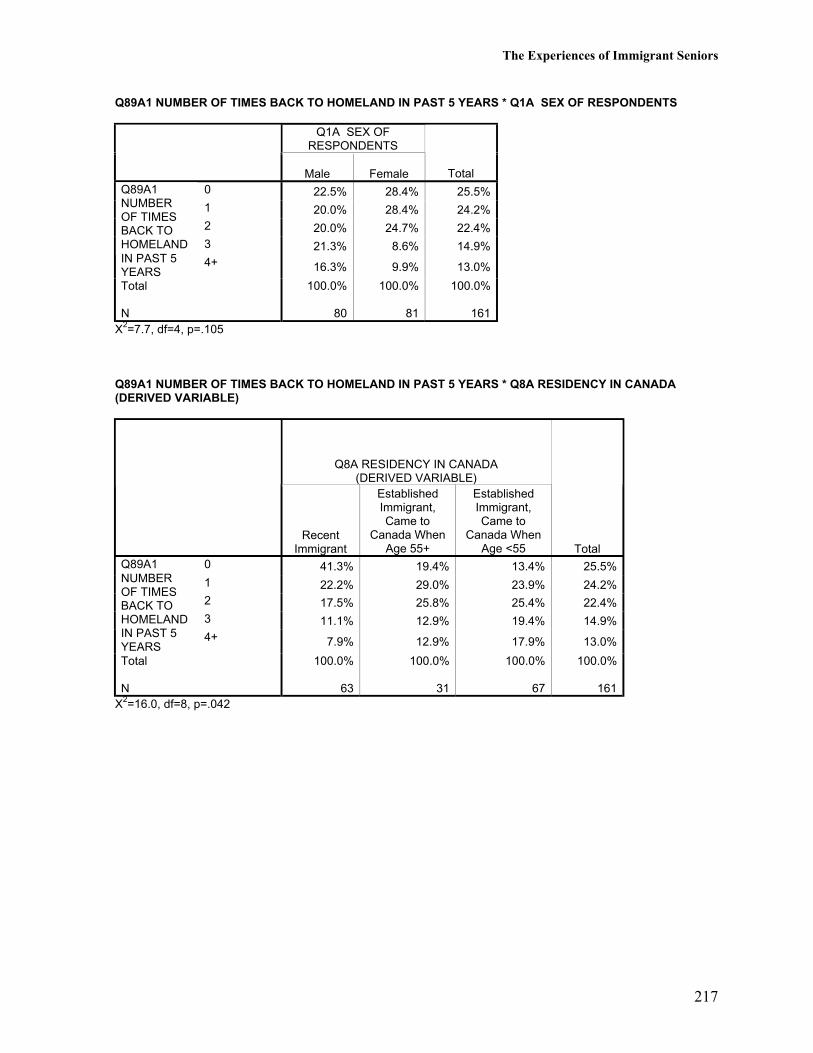
The Experiences of Immigrant Seniors
217
Q89A1 NUMBER OF TIMES BACK TO HOMELAND IN PAST 5 YEARS * Q1A SEX OF RESPONDENTS
Q1A SEX OFRESPONDENTS
Male Female Total0 22.5% 28.4% 25.5%1 20.0% 28.4% 24.2%2 20.0% 24.7% 22.4%3 21.3% 8.6% 14.9%
Q89A1NUMBEROF TIMESBACK TOHOMELANDIN PAST 5YEARS
4+ 16.3% 9.9% 13.0%
Total
N
100.0%
80
100.0%
81
100.0%
161X2=7.7, df=4, p=.105
Q89A1 NUMBER OF TIMES BACK TO HOMELAND IN PAST 5 YEARS * Q8A RESIDENCY IN CANADA(DERIVED VARIABLE)
Q8A RESIDENCY IN CANADA(DERIVED VARIABLE)
RecentImmigrant
EstablishedImmigrant,Came to
Canada WhenAge 55+
EstablishedImmigrant,Came to
Canada WhenAge <55 Total
0 41.3% 19.4% 13.4% 25.5%1 22.2% 29.0% 23.9% 24.2%2 17.5% 25.8% 25.4% 22.4%3 11.1% 12.9% 19.4% 14.9%
Q89A1NUMBEROF TIMESBACK TOHOMELANDIN PAST 5YEARS
4+ 7.9% 12.9% 17.9% 13.0%
Total
N
100.0%
63
100.0%
31
100.0%
67
100.0%
161X2=16.0, df=8, p=.042
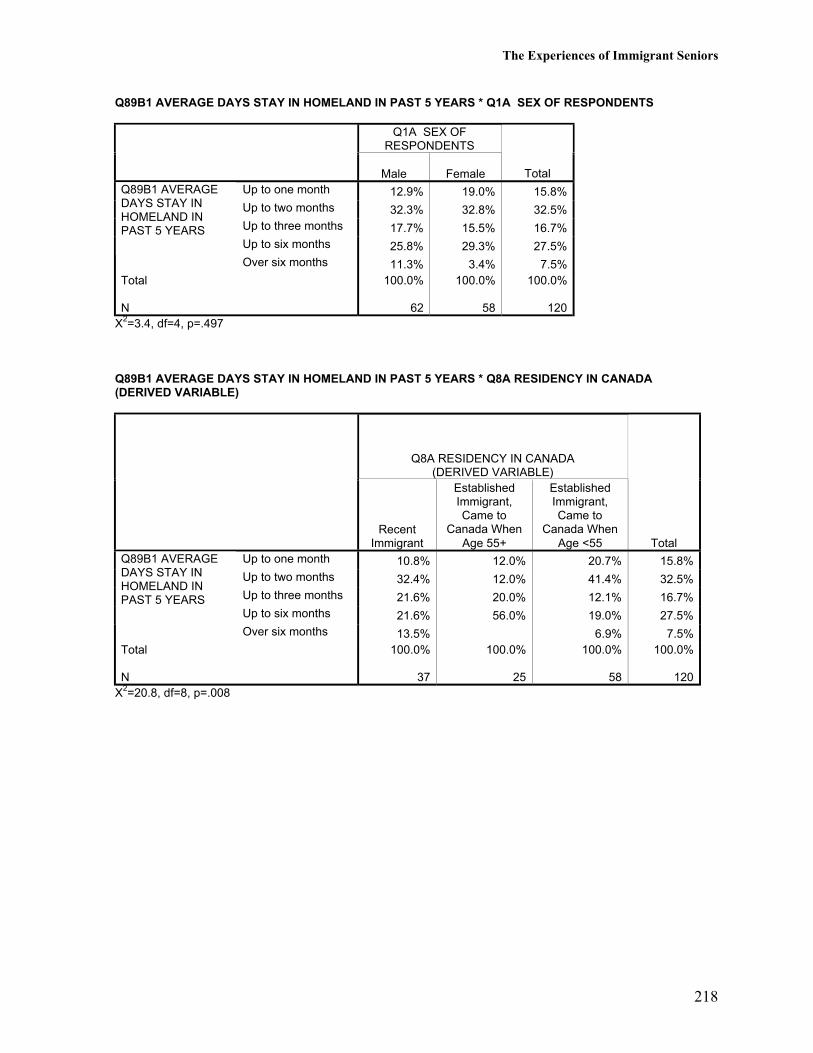
The Experiences of Immigrant Seniors
218
Q89B1 AVERAGE DAYS STAY IN HOMELAND IN PAST 5 YEARS * Q1A SEX OF RESPONDENTS
Q1A SEX OFRESPONDENTS
Male Female TotalUp to one month 12.9% 19.0% 15.8%Up to two months 32.3% 32.8% 32.5%Up to three months 17.7% 15.5% 16.7%Up to six months 25.8% 29.3% 27.5%
Q89B1 AVERAGEDAYS STAY INHOMELAND INPAST 5 YEARS
Over six months 11.3% 3.4% 7.5%Total
N
100.0%
62
100.0%
58
100.0%
120X2=3.4, df=4, p=.497
Q89B1 AVERAGE DAYS STAY IN HOMELAND IN PAST 5 YEARS * Q8A RESIDENCY IN CANADA(DERIVED VARIABLE)
Q8A RESIDENCY IN CANADA(DERIVED VARIABLE)
RecentImmigrant
EstablishedImmigrant,Came to
Canada WhenAge 55+
EstablishedImmigrant,Came to
Canada WhenAge <55 Total
Up to one month 10.8% 12.0% 20.7% 15.8%Up to two months 32.4% 12.0% 41.4% 32.5%Up to three months 21.6% 20.0% 12.1% 16.7%Up to six months 21.6% 56.0% 19.0% 27.5%
Q89B1 AVERAGEDAYS STAY INHOMELAND INPAST 5 YEARS
Over six months 13.5% 6.9% 7.5%Total
N
100.0%
37
100.0%
25
100.0%
58
100.0%
120X2=20.8, df=8, p=.008

The Experiences of Immigrant Seniors
219
Daily Life
The respondents shared information on various cultural practices and ways in which SouthAsian traditions were incorporated into their daily lives in Canada.
Fifty-two percent of the respondents (both men and women) reported that they wore SouthAsian clothing outside the home “all of the time.” In contrast, some respondents (29% of menand 17 % of women) reported never wearing distinctively South Asian dress outside thehome. Recency of immigration played a role in traditional dress practices. Recent immigrants(65%) were most likely to report wearing South Asian clothing outside the home all of thetime and the least likely (19%) to eschew South Asian dress outside the home.
Information on dietary practices indicates heavy focus on South Asian cuisine. Fifty-threepercent of the males and 59% of the females reported eating South Asian food all of the time.Most of the other respondents reported South Asian food preferences frequently oroccasionally. Only 10% of the respondents reported never eating South Asian Food.
Most respondents celebrated South Asian holidays and 69% indicated they commemoratethese events all the time. Although sex and residency differences were not statisticallysignificant, women (74%) appeared to be slightly more likely than men (65%) to celebrateSouth Asian holidays all of the time and recent immigrants (76%) were most likely tocelebrate South Asian holidays all of the time.
South Asian videos and movies are popular. Thirty-four percent of men and 48% of womenreported watching South Asian videos and movies all of the time. An additional 32% of menand 22% of women reported watching frequently. Interestingly, established immigrants whocame to Canada at a younger age were the most likely (47%) to report watching South Asianvideos/movies all of the time, in contrast to 38% of recent immigrants and 36% of establishedimmigrants who emigrated in older age, although these differences were not statisticallysignificant.
South Asian radio programs are popular, particularly with men. Seventy-one percent of menand 58% of women reported listening to South Asia radio frequently or all of the time. Recentimmigrants and established immigrants who came to Canada in older age appeared to be morelikely to listen to South Asian radio, although these differences were not statisticallysignificant.
Women were more likely (42%) than men (28%) to report that they watch South Asian TV allof the time. Established immigrants who came to Canada at a younger age (41%) were morelikely than recent immigrants (32%) or established immigrants who emigrated at an older age(29%) to report watching South Asian TV “all of the time” although these differences werenot statistically significant.
Men (66%) were much more likely to read local South Asian newspapers frequently or all thetime than women (37%). In contrast, reported use of South Asian Internet sites was not high.Seventy-three percent of men and 82% of women reported having never visited South Asian
The Experiences of Immigrant Seniors
220
Internet sites. Established immigrants who emigrated at a younger age were most likely tovisit South Asian Internet sites.
Most respondents (men and women) reported listening, viewing, or participating in SouthAsian music/dance or art. Only 17% of men and 19% of women reported never beinginvolved in these cultural activities. Recent immigrants (25%) were the most likely to reportnever participating in contrast to 16% of established immigrants who emigrated in older ageand 11% of established immigrants who emigrated at a younger age.
Use of one’s native language predominates with 82% of men and 86% of women reportingthat they speak their native language/dialect all of the time. Established immigrants whoemigrated when younger were least likely (74%) to report using their native language/dialectall of the time.
Eighty-four percent of men and 91% of women reported that they practice their religion all ofthe time. Six percent of men (but no women) indicated that they “never” or only“occasionally” practice their religion, although these differences were not statisticallysignificant. Established immigrants who came to Canada in older age (97%) and recentimmigrants (91%) were more likely to report practicing their religion all of the time thanestablished immigrants who emigrated in younger age (80%), although these differences werenot statistically significant.
Forty-three percent of men and 22% of women reported reading local newspapers such as theEdmonton Journal or the Globe and Mail all of the time. Exposure to these mass circulationnewspapers is most common among established immigrants who came to Canada at a youngerage. Forty-four percent of recent immigrants and 45% of established immigrants whoemigrated in older age reported “never” reading these newspapers, compared to 15% ofestablished immigrants who emigrated at a younger age.

The Experiences of Immigrant Seniors
221
Q90A WEAR SOUTH ASIAN CLOTHING OUTSIDE OF HOME * Q1A SEX OF RESPONDENTS
Q1A SEX OFRESPONDENTS
Male Female TotalNever 29.1% 17.3% 23.1%Occasionally 12.7% 21.0% 16.9%Frequently 6.3% 9.9% 8.1%
Q90A WEARSOUTH ASIANCLOTHINGOUTSIDE OFHOME All of the time 51.9% 51.9% 51.9%Total
N
100.0%
79
100.0%
81
100.0%
160X2=4.7, df=3, p=.196
Q90A WEAR SOUTH ASIAN CLOTHING OUTSIDE OF HOME * Q8A RESIDENCY IN CANADA (DERIVEDVARIABLE)
Q8A RESIDENCY IN CANADA(DERIVED VARIABLE)
RecentImmigrant
EstablishedImmigrant,Came to
Canada WhenAge 55+
EstablishedImmigrant,Came to
Canada WhenAge <55 Total
Never 19.0% 35.5% 21.2% 23.1%Occasionally 7.9% 9.7% 28.8% 16.9%Frequently 7.9% 6.5% 9.1% 8.1%
Q90A WEARSOUTH ASIANCLOTHINGOUTSIDE OFHOME All of the time 65.1% 48.4% 40.9% 51.9%Total
N
100.0%
63
100.0%
31
100.0%
66
100.0%
160X2=16.0, df=6, p=.014

The Experiences of Immigrant Seniors
222
Q90B EAT SOUTH ASIAN FOOD * Q1A SEX OF RESPONDENTS
Q1A SEX OFRESPONDENTS
Male Female TotalNever 11.3% 8.6% 9.9%Occasionally 18.8% 17.3% 18.0%Frequently 17.5% 14.8% 16.1%
Q90B EATSOUTH ASIANFOOD
All of the time 52.5% 59.3% 55.9%Total
N
100.0%
80
100.0%
81
100.0%
161X2=0.8, df=3, p=.842
Q90B EAT SOUTH ASIAN FOOD * Q8A RESIDENCY IN CANADA (DERIVED VARIABLE)
Q8A RESIDENCY IN CANADA(DERIVED VARIABLE)
RecentImmigrant
EstablishedImmigrant,Came to
Canada WhenAge 55+
EstablishedImmigrant,Came to
Canada WhenAge <55 Total
Never 15.9% 12.9% 3.0% 9.9%Occasionally 15.9% 19.4% 19.4% 18.0%Frequently 11.1% 6.5% 25.4% 16.1%
Q90B EATSOUTH ASIANFOOD
All of the time 57.1% 61.3% 52.2% 55.9%Total
N
100.0%
63
100.0%
31
100.0%
67
100.0%
161X2=12.7, df=6, p=.048
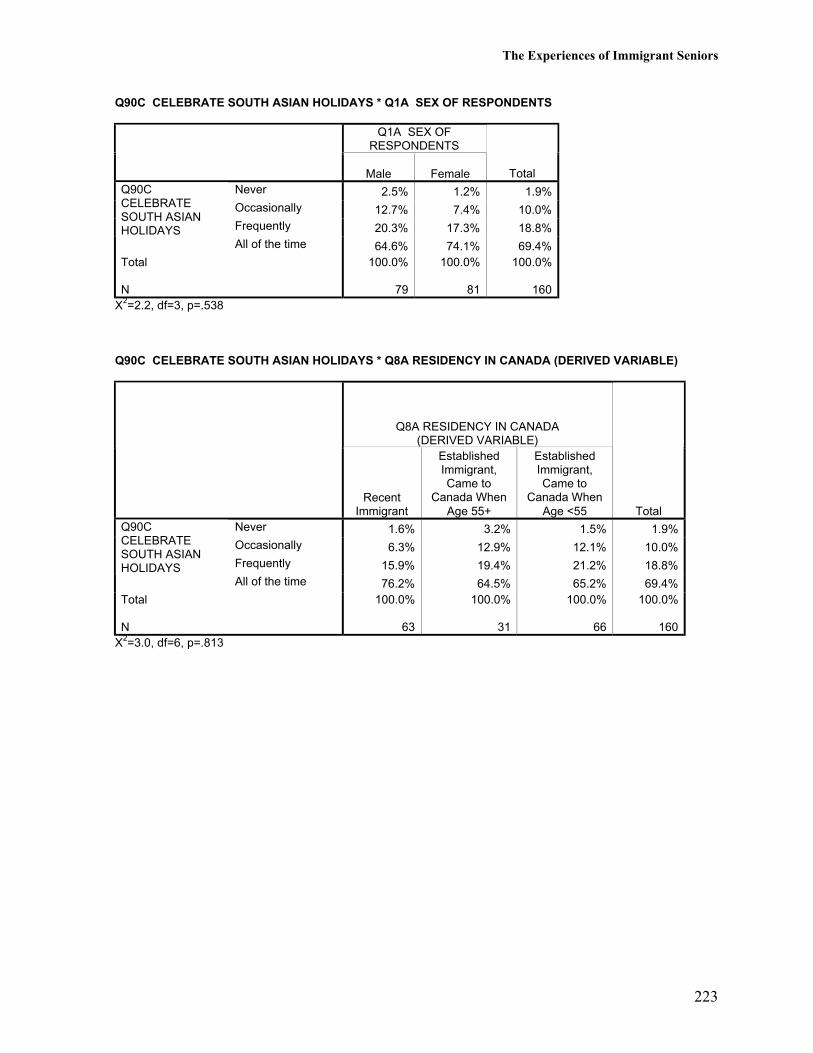
The Experiences of Immigrant Seniors
223
Q90C CELEBRATE SOUTH ASIAN HOLIDAYS * Q1A SEX OF RESPONDENTS
Q1A SEX OFRESPONDENTS
Male Female TotalNever 2.5% 1.2% 1.9%Occasionally 12.7% 7.4% 10.0%Frequently 20.3% 17.3% 18.8%
Q90CCELEBRATESOUTH ASIANHOLIDAYS
All of the time 64.6% 74.1% 69.4%Total
N
100.0%
79
100.0%
81
100.0%
160X2=2.2, df=3, p=.538
Q90C CELEBRATE SOUTH ASIAN HOLIDAYS * Q8A RESIDENCY IN CANADA (DERIVED VARIABLE)
Q8A RESIDENCY IN CANADA(DERIVED VARIABLE)
RecentImmigrant
EstablishedImmigrant,Came to
Canada WhenAge 55+
EstablishedImmigrant,Came to
Canada WhenAge <55 Total
Never 1.6% 3.2% 1.5% 1.9%Occasionally 6.3% 12.9% 12.1% 10.0%Frequently 15.9% 19.4% 21.2% 18.8%
Q90CCELEBRATESOUTH ASIANHOLIDAYS
All of the time 76.2% 64.5% 65.2% 69.4%Total
N
100.0%
63
100.0%
31
100.0%
66
100.0%
160X2=3.0, df=6, p=.813
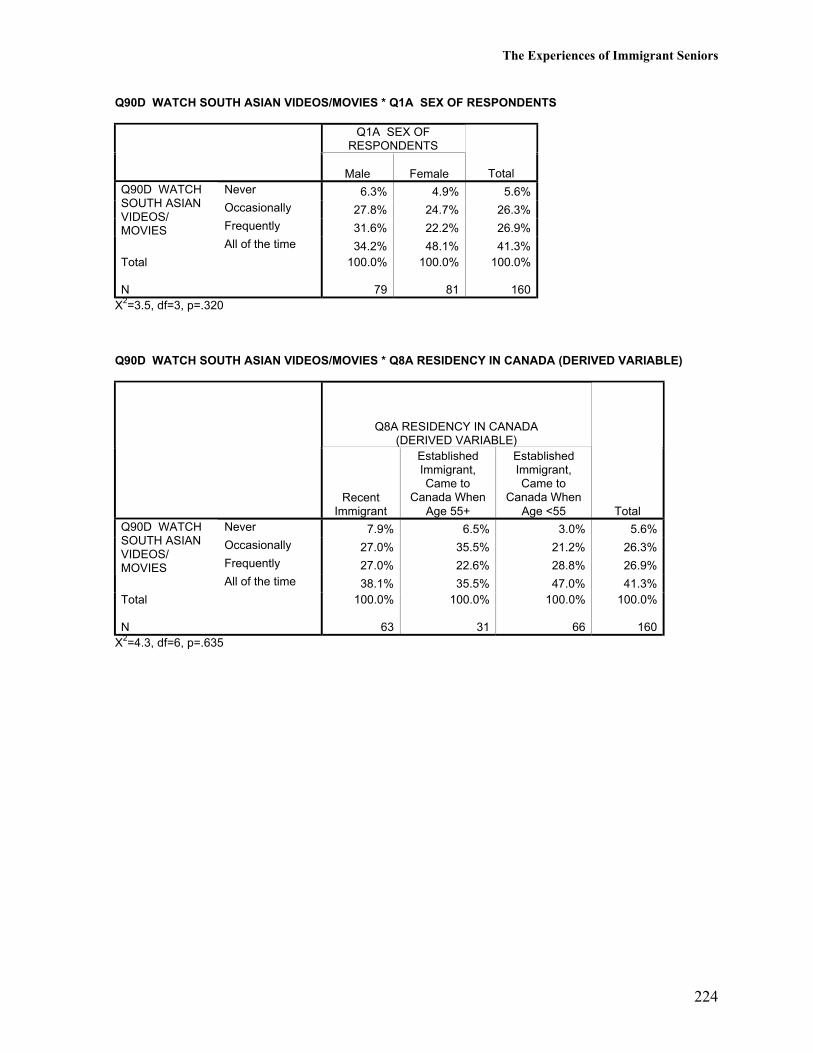
The Experiences of Immigrant Seniors
224
Q90D WATCH SOUTH ASIAN VIDEOS/MOVIES * Q1A SEX OF RESPONDENTS
Q1A SEX OFRESPONDENTS
Male Female TotalNever 6.3% 4.9% 5.6%Occasionally 27.8% 24.7% 26.3%Frequently 31.6% 22.2% 26.9%
Q90D WATCHSOUTH ASIANVIDEOS/MOVIES
All of the time 34.2% 48.1% 41.3%Total
N
100.0%
79
100.0%
81
100.0%
160X2=3.5, df=3, p=.320
Q90D WATCH SOUTH ASIAN VIDEOS/MOVIES * Q8A RESIDENCY IN CANADA (DERIVED VARIABLE)
Q8A RESIDENCY IN CANADA(DERIVED VARIABLE)
RecentImmigrant
EstablishedImmigrant,Came to
Canada WhenAge 55+
EstablishedImmigrant,Came to
Canada WhenAge <55 Total
Never 7.9% 6.5% 3.0% 5.6%Occasionally 27.0% 35.5% 21.2% 26.3%Frequently 27.0% 22.6% 28.8% 26.9%
Q90D WATCHSOUTH ASIANVIDEOS/MOVIES
All of the time 38.1% 35.5% 47.0% 41.3%Total
N
100.0%
63
100.0%
31
100.0%
66
100.0%
160X2=4.3, df=6, p=.635

The Experiences of Immigrant Seniors
225
Q90E LISTEN TO SOUTH ASIAN RADIO * Q1A SEX OF RESPONDENTS
Q1A SEX OFRESPONDENTS
Male Female TotalNever 20.3% 23.5% 21.9%Occasionally 8.9% 18.5% 13.8%Frequently 30.4% 23.5% 26.9%
Q90E LISTENTO SOUTHASIAN RADIO
All of the time 40.5% 34.6% 37.5%Total
N
100.0%
79
100.0%
81
100.0%
160X2=4.0, df=3, p=.263
Q90E LISTEN TO SOUTH ASIAN RADIO * Q8A RESIDENCY IN CANADA (DERIVED VARIABLE)
Q8A RESIDENCY IN CANADA(DERIVED VARIABLE)
RecentImmigrant
EstablishedImmigrant,Came to
Canada WhenAge 55+
EstablishedImmigrant,Came to
Canada WhenAge <55 Total
Never 17.5% 12.9% 30.3% 21.9%Occasionally 11.1% 22.6% 12.1% 13.8%Frequently 33.3% 22.6% 22.7% 26.9%
Q90E LISTENTO SOUTHASIAN RADIO
All of the time 38.1% 41.9% 34.8% 37.5%Total
N
100.0%
63
100.0%
31
100.0%
66
100.0%
160X2=8.0, df=6, p=.241
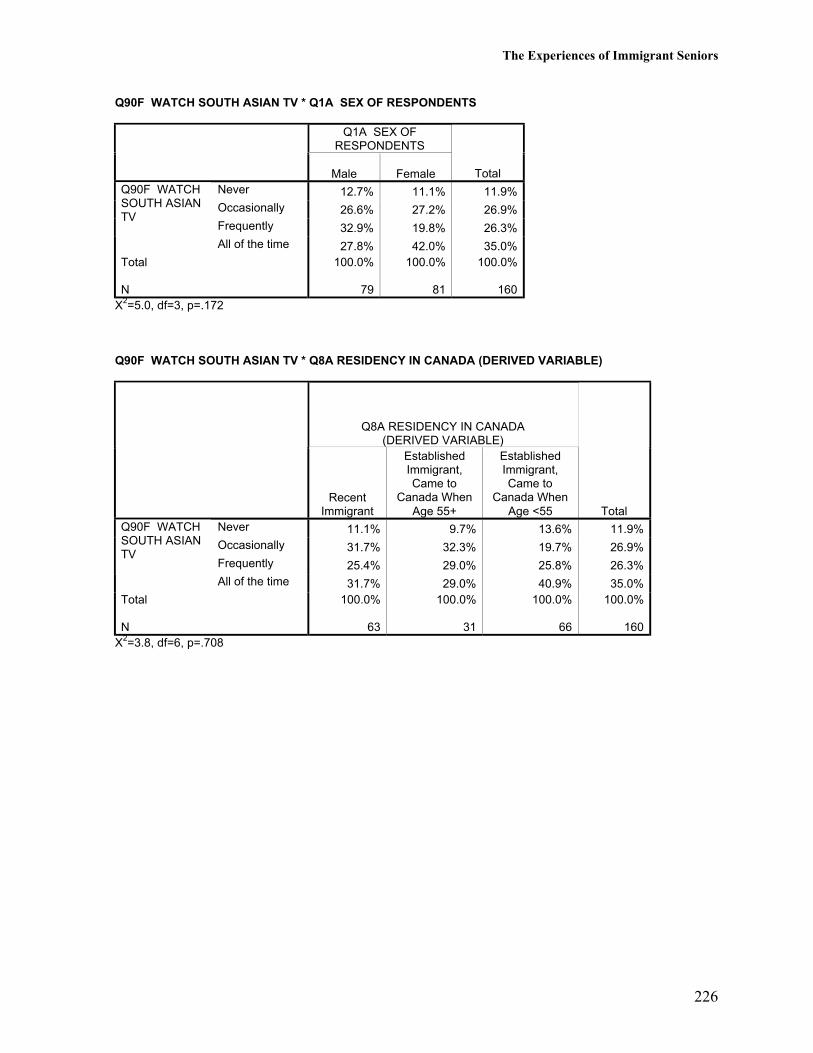
The Experiences of Immigrant Seniors
226
Q90F WATCH SOUTH ASIAN TV * Q1A SEX OF RESPONDENTS
Q1A SEX OFRESPONDENTS
Male Female TotalNever 12.7% 11.1% 11.9%Occasionally 26.6% 27.2% 26.9%Frequently 32.9% 19.8% 26.3%
Q90F WATCHSOUTH ASIANTV
All of the time 27.8% 42.0% 35.0%Total
N
100.0%
79
100.0%
81
100.0%
160X2=5.0, df=3, p=.172
Q90F WATCH SOUTH ASIAN TV * Q8A RESIDENCY IN CANADA (DERIVED VARIABLE)
Q8A RESIDENCY IN CANADA(DERIVED VARIABLE)
RecentImmigrant
EstablishedImmigrant,Came to
Canada WhenAge 55+
EstablishedImmigrant,Came to
Canada WhenAge <55 Total
Never 11.1% 9.7% 13.6% 11.9%Occasionally 31.7% 32.3% 19.7% 26.9%Frequently 25.4% 29.0% 25.8% 26.3%
Q90F WATCHSOUTH ASIANTV
All of the time 31.7% 29.0% 40.9% 35.0%Total
N
100.0%
63
100.0%
31
100.0%
66
100.0%
160X2=3.8, df=6, p=.708

The Experiences of Immigrant Seniors
227
Q90G READ LOCAL SOUTH ASIAN NEWSPAPERS * Q1A SEX OF RESPONDENTS
Q1A SEX OFRESPONDENTS
Male Female TotalNever 19.2% 37.0% 28.3%Occasionally 15.4% 25.9% 20.8%Frequently 26.9% 18.5% 22.6%
Q90G READLOCAL SOUTHASIANNEWSPAPERS
All of the time 38.5% 18.5% 28.3%Total
N
100.0%
78
100.0%
81
100.0%
159X2=13.4, df=3, p=.004
Q90G READ LOCAL SOUTH ASIAN NEWSPAPERS * Q8A RESIDENCY IN CANADA (DERIVED VARIABLE)
Q8A RESIDENCY IN CANADA(DERIVED VARIABLE)
RecentImmigrant
EstablishedImmigrant,Came to
Canada WhenAge 55+
EstablishedImmigrant,Came to
Canada WhenAge <55 Total
Never 31.7% 29.0% 24.6% 28.3%Occasionally 20.6% 16.1% 23.1% 20.8%Frequently 19.0% 29.0% 23.1% 22.6%
Q90G READLOCAL SOUTHASIANNEWSPAPERS
All of the time 28.6% 25.8% 29.2% 28.3%Total
N
100.0%
63
100.0%
31
100.0%
65
100.0%
159X2=2.1, df=6, p=.912
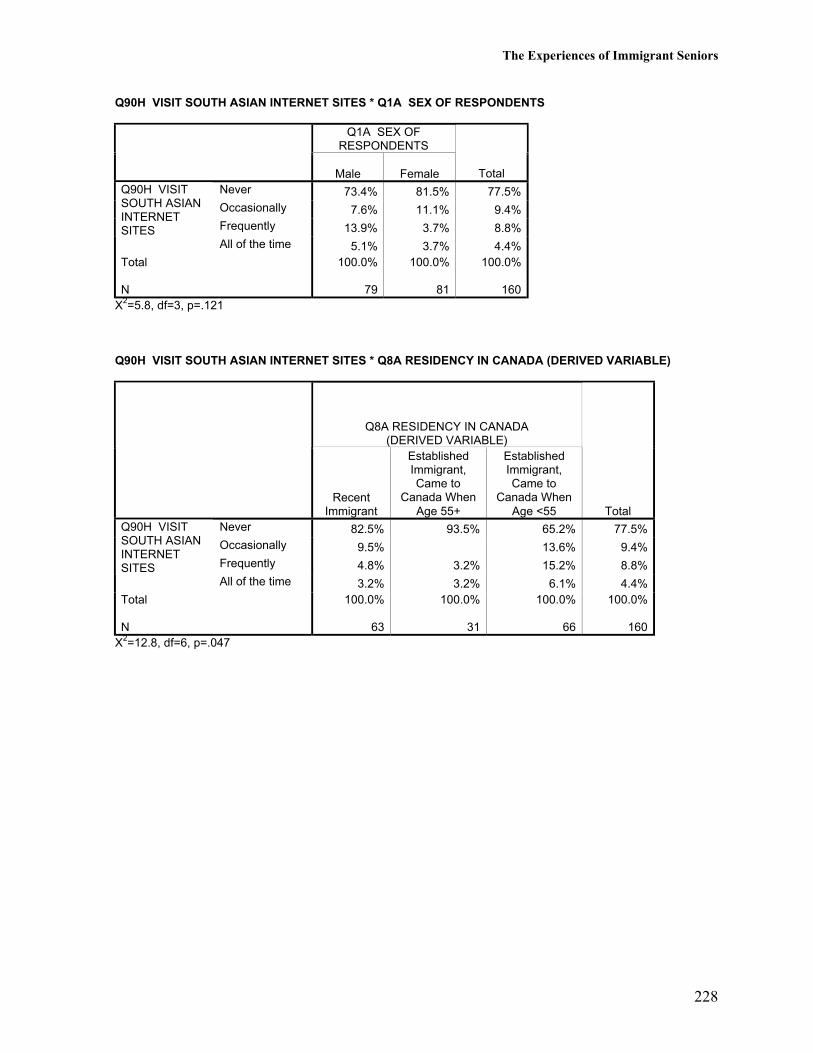
The Experiences of Immigrant Seniors
228
Q90H VISIT SOUTH ASIAN INTERNET SITES * Q1A SEX OF RESPONDENTS
Q1A SEX OFRESPONDENTS
Male Female TotalNever 73.4% 81.5% 77.5%Occasionally 7.6% 11.1% 9.4%Frequently 13.9% 3.7% 8.8%
Q90H VISITSOUTH ASIANINTERNETSITES
All of the time 5.1% 3.7% 4.4%Total
N
100.0%
79
100.0%
81
100.0%
160X2=5.8, df=3, p=.121
Q90H VISIT SOUTH ASIAN INTERNET SITES * Q8A RESIDENCY IN CANADA (DERIVED VARIABLE)
Q8A RESIDENCY IN CANADA(DERIVED VARIABLE)
RecentImmigrant
EstablishedImmigrant,Came to
Canada WhenAge 55+
EstablishedImmigrant,Came to
Canada WhenAge <55 Total
Never 82.5% 93.5% 65.2% 77.5%Occasionally 9.5% 13.6% 9.4%Frequently 4.8% 3.2% 15.2% 8.8%
Q90H VISITSOUTH ASIANINTERNETSITES
All of the time 3.2% 3.2% 6.1% 4.4%Total
N
100.0%
63
100.0%
31
100.0%
66
100.0%
160X2=12.8, df=6, p=.047

The Experiences of Immigrant Seniors
229
Q90I LISTEN, VIEW, PARTICIPATE IN SOUTH ASIAN MUSIC/DANCE/ART * Q1A SEX OF RESPONDENTS
Q1A SEX OFRESPONDENTS
Male Female TotalNever 16.5% 18.5% 17.5%Occasionally 27.8% 34.6% 31.3%Frequently 35.4% 24.7% 30.0%
Q90I LISTEN,VIEW,PARTICIPATE INSOUTH ASIANMUSIC/DANCE/ART
All of the time20.3% 22.2% 21.3%
Total
N
100.0%
79
100.0%
81
100.0%
160X2=2.3, df=3, p=.515
Q90I LISTEN, VIEW, PARTICIPATE IN SOUTH ASIAN MUSIC/DANCE/ART * Q8A RESIDENCY IN CANADA(DERIVED VARIABLE)
Q8A RESIDENCY IN CANADA(DERIVED VARIABLE)
RecentImmigrant
EstablishedImmigrant,Came to
Canada WhenAge 55+
EstablishedImmigrant,Came to
Canada WhenAge <55 Total
Never 25.4% 16.1% 10.6% 17.5%Occasionally 31.7% 35.5% 28.8% 31.3%Frequently 28.6% 38.7% 27.3% 30.0%
Q90I LISTEN,VIEW,PARTICIPATE INSOUTH ASIANMUSIC/DANCE/ART
All of the time14.3% 9.7% 33.3% 21.3%
Total
N
100.0%
63
100.0%
31
100.0%
66
100.0%
160X2=13.3, df=6, p=.039
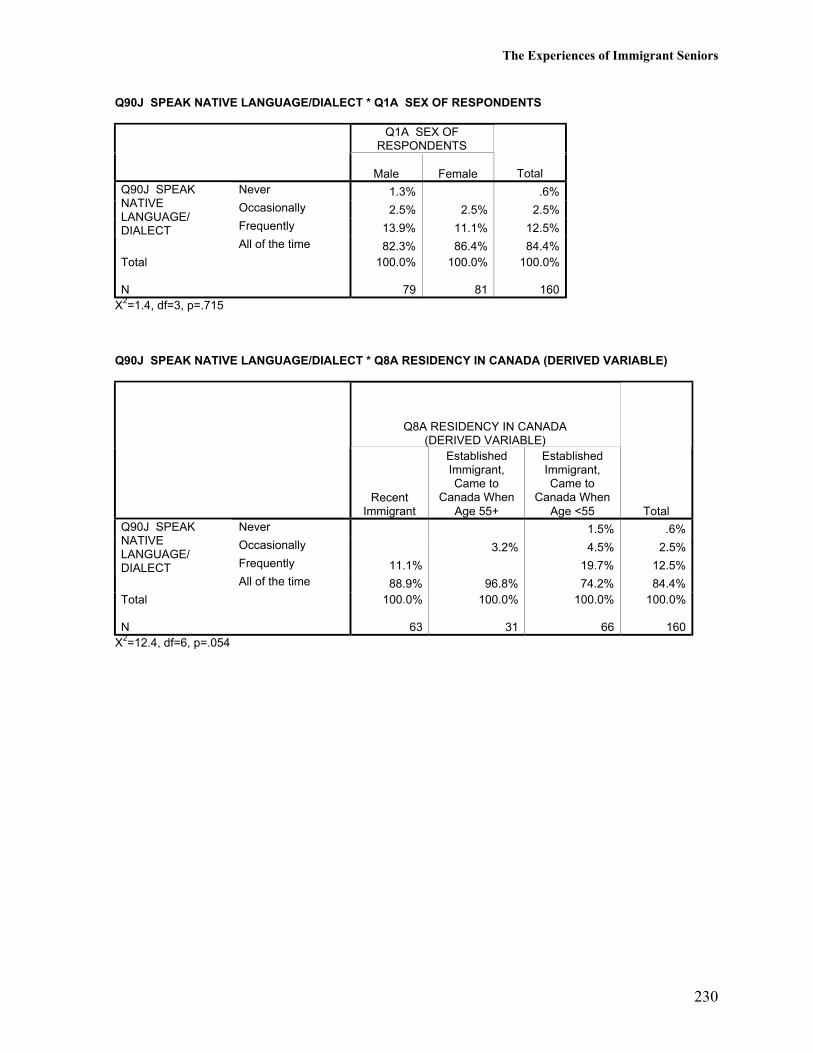
The Experiences of Immigrant Seniors
230
Q90J SPEAK NATIVE LANGUAGE/DIALECT * Q1A SEX OF RESPONDENTS
Q1A SEX OFRESPONDENTS
Male Female TotalNever 1.3% .6%Occasionally 2.5% 2.5% 2.5%Frequently 13.9% 11.1% 12.5%
Q90J SPEAKNATIVELANGUAGE/DIALECT
All of the time 82.3% 86.4% 84.4%Total
N
100.0%
79
100.0%
81
100.0%
160X2=1.4, df=3, p=.715
Q90J SPEAK NATIVE LANGUAGE/DIALECT * Q8A RESIDENCY IN CANADA (DERIVED VARIABLE)
Q8A RESIDENCY IN CANADA(DERIVED VARIABLE)
RecentImmigrant
EstablishedImmigrant,Came to
Canada WhenAge 55+
EstablishedImmigrant,Came to
Canada WhenAge <55 Total
Never 1.5% .6%Occasionally 3.2% 4.5% 2.5%Frequently 11.1% 19.7% 12.5%
Q90J SPEAKNATIVELANGUAGE/DIALECT
All of the time 88.9% 96.8% 74.2% 84.4%Total
N
100.0%
63
100.0%
31
100.0%
66
100.0%
160X2=12.4, df=6, p=.054
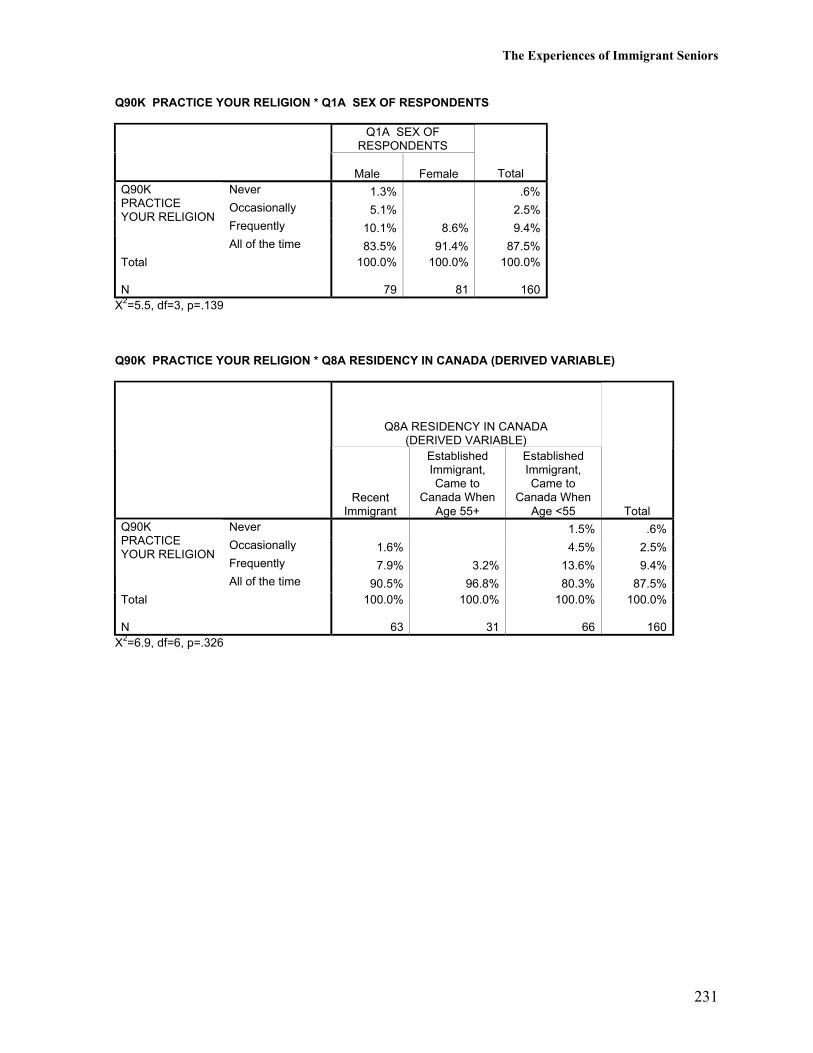
The Experiences of Immigrant Seniors
231
Q90K PRACTICE YOUR RELIGION * Q1A SEX OF RESPONDENTS
Q1A SEX OFRESPONDENTS
Male Female TotalNever 1.3% .6%Occasionally 5.1% 2.5%Frequently 10.1% 8.6% 9.4%
Q90KPRACTICEYOUR RELIGION
All of the time 83.5% 91.4% 87.5%Total
N
100.0%
79
100.0%
81
100.0%
160X2=5.5, df=3, p=.139
Q90K PRACTICE YOUR RELIGION * Q8A RESIDENCY IN CANADA (DERIVED VARIABLE)
Q8A RESIDENCY IN CANADA(DERIVED VARIABLE)
RecentImmigrant
EstablishedImmigrant,Came to
Canada WhenAge 55+
EstablishedImmigrant,Came to
Canada WhenAge <55 Total
Never 1.5% .6%Occasionally 1.6% 4.5% 2.5%Frequently 7.9% 3.2% 13.6% 9.4%
Q90KPRACTICEYOUR RELIGION
All of the time 90.5% 96.8% 80.3% 87.5%Total
N
100.0%
63
100.0%
31
100.0%
66
100.0%
160X2=6.9, df=6, p=.326
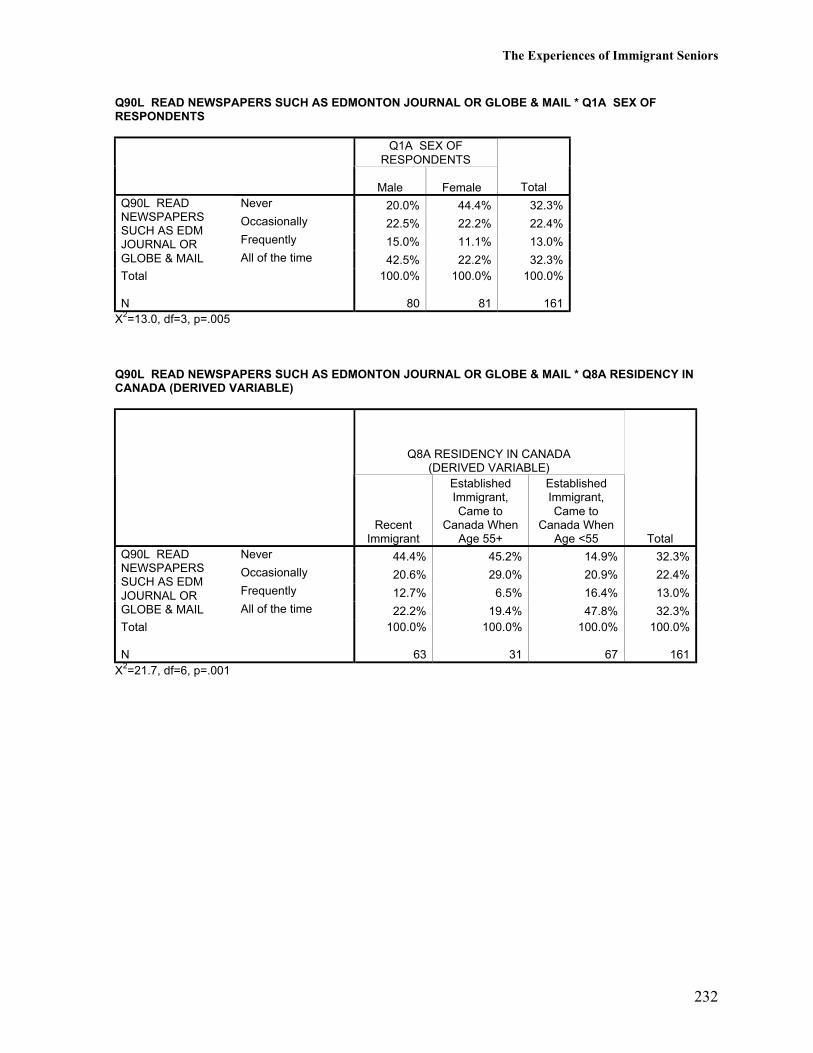
The Experiences of Immigrant Seniors
232
Q90L READ NEWSPAPERS SUCH AS EDMONTON JOURNAL OR GLOBE & MAIL * Q1A SEX OFRESPONDENTS
Q1A SEX OFRESPONDENTS
Male Female TotalNever 20.0% 44.4% 32.3%Occasionally 22.5% 22.2% 22.4%Frequently 15.0% 11.1% 13.0%
Q90L READNEWSPAPERSSUCH AS EDMJOURNAL ORGLOBE & MAIL All of the time 42.5% 22.2% 32.3%Total
N
100.0%
80
100.0%
81
100.0%
161X2=13.0, df=3, p=.005
Q90L READ NEWSPAPERS SUCH AS EDMONTON JOURNAL OR GLOBE & MAIL * Q8A RESIDENCY INCANADA (DERIVED VARIABLE)
Q8A RESIDENCY IN CANADA(DERIVED VARIABLE)
RecentImmigrant
EstablishedImmigrant,Came to
Canada WhenAge 55+
EstablishedImmigrant,Came to
Canada WhenAge <55 Total
Never 44.4% 45.2% 14.9% 32.3%Occasionally 20.6% 29.0% 20.9% 22.4%Frequently 12.7% 6.5% 16.4% 13.0%
Q90L READNEWSPAPERSSUCH AS EDMJOURNAL ORGLOBE & MAIL All of the time 22.2% 19.4% 47.8% 32.3%Total
N
100.0%
63
100.0%
31
100.0%
67
100.0%
161X2=21.7, df=6, p=.001
The Experiences of Immigrant Seniors
233
Personal Identity in Canada
Almost all respondents have neither changed nor anglicised their given names, nor have theychanged the spelling or pronunciation of their names in the process of settling into Canadianculture.
People who settle in a new country can have differing views of their national identity.Respondents were asked if they saw themselves as more South Asian than Canadian, aboutequally South Asian and Canadian or more Canadian than South Asian. Similar questionswere asked about how the respondents felt their children and their children’s children sawtheir own personal identity.
Fifty-nine percent of older people in this study saw themselves as more South Asian thanCanadian. About a third saw themselves as equally South Asian and Canadian, while 7% ofolder people saw themselves as more Canadian than South Asian. There is however a sexdifference. Thirteen percent of the older male respondents but only 1% of the older femalerespondents saw themselves as more Canadian than South Asian. In addition, residency wasrelated to seeing oneself as more Canadian than South Asian. Established immigrants whocame to Canada in older age were most likely (90%) to report seeing themselves as moreSouth Asian than Canadian. In contrast, 67% of recent immigrants and only 37% ofestablished immigrants who emigrated in younger age saw themselves as more South Asianthan Canadian.
Respondents were asked about their perceptions of generational differences. Men (53%) weremore likely than women (31%) to feel that their own children saw themselves as moreCanadian than South Asian. Established immigrants who came to Canada in younger agewere more likely (61%) to describe their children as seeing themselves as more Canadian thanSouth Asian than either recent immigrants (29%) or established immigrants who arrived inolder age (29%).
There is more consistency in reported views about grandchildren. Eighty-four percent of themen and 61% of the women said their grandchildren saw themselves as more Canadian thanSouth Asian. Length of residency in Canada was not related to respondents’ perceptions of thegrandchild generation.
Respondents were asked if there were any barriers to their developing their identities asCanadians. Seventy-four percent of men and 88% of women said there were no barriers.Recent immigrants (21%) and established residents who emigrated in older age (25%) weremore likely to report barriers than established immigrants who emigrated in youngerage (15%), although these differences were not statistically significant. Of those respondentswho cited barriers to developing their identities as Canadians, most mentioned language(43%) and cultural differences (39%), followed by skin color/ethnicity (18%).
Respondents were asked to assess the statement “I like the way of life in Canadian society.”Seventy-eight percent of men and 71% of women agreed or strongly agreed with thesentiment. Opinions were not related to residency.

The Experiences of Immigrant Seniors
234
When asked to assess the statement “I understand Canadian culture”, 76% of men and 75% ofwomen agreed or strongly agreed with the statement. Established immigrants who emigratedin younger age were the most likely (86%) to report feeling they understood Canadian culture,although these differences were not statistically significant.
There were sex differences in respondents’ reported feelings of acceptance by most Canadians(Chi-square p = .07). Seventy-four percent of men in contrast to 90% of women agreed orstrongly agreed that they felt accepted by most Canadians. Twelve percent of men and 2% ofwomen disagreed or strongly disagreed that they felt accepted by most Canadians. Establishedimmigrants who emigrated in younger age (88%) and recent immigrants (80%) were morelikely to agree or strongly agree that they felt “accepted by most Canadians” than establishedimmigrants who emigrated in older age (68%), although differences by length of residence inCanada were not statistically significant.
Seventy-nine percent of respondents agreed or strongly agreed that Canadians appreciate thecontributions of immigrants. Seven percent disagreed or strongly disagreed. Recentimmigrants and established immigrants who emigrated at a younger age were more likely thanestablished immigrants who emigrated in older age to strongly agree that Canadiansappreciate the contributions of immigrants.
Respondents were asked to what extent they felt that their acceptance by Canadians dependedon international political events. Men (49%) were more likely than women (26%) to perceiveacceptance as contingent on international political events (Chi-square p = .08). Thereappeared to be some relation to length of stay in Canada with established immigrants whoemigrated in younger age the least likely (34%) to report feeling that their acceptance iscontingent on international political events, although differences by residency in Canada werenot statistically significant.

The Experiences of Immigrant Seniors
235
Q91A HAVE YOU ANGLICIZED/CHANGED YOUR NAME * Q1A SEX OF RESPONDENTS
Q1A SEX OFRESPONDENTS
Male Female TotalYes 5.1% 1.2% 3.1%Q91A HAVE
YOUANGLICIZED/CHANGEDYOUR NAME
No94.9% 98.8% 96.9%
Total
N
100.0%
79
100.0%
81
100.0%
160X2=0.9, df=1, p=.349
Q91A HAVE YOU ANGLICIZED/CHANGED YOUR NAME * Q8A RESIDENCY IN CANADA (DERIVEDVARIABLE)
Q8A RESIDENCY IN CANADA(DERIVED VARIABLE)
RecentImmigrant
EstablishedImmigrant,Came to
Canada WhenAge 55+
EstablishedImmigrant,Came to
Canada WhenAge <55 Total
Yes 1.6% 6.0% 3.1%Q91A HAVEYOUANGLICIZED/CHANGEDYOUR NAME
No98.4% 100.0% 94.0% 96.9%
Total
N
100.0%
62
100.0%
31
100.0%
67
100.0%
160X2=3.3, df=2, p=.196
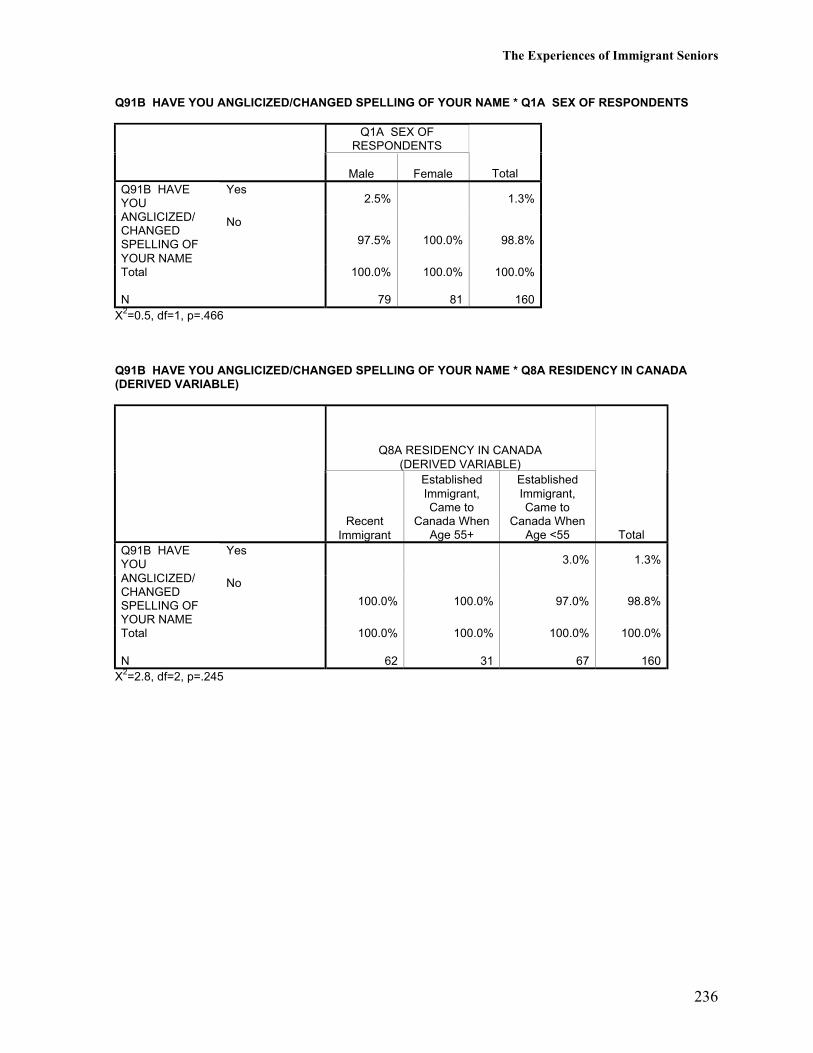
The Experiences of Immigrant Seniors
236
Q91B HAVE YOU ANGLICIZED/CHANGED SPELLING OF YOUR NAME * Q1A SEX OF RESPONDENTS
Q1A SEX OFRESPONDENTS
Male Female TotalYes
2.5% 1.3%Q91B HAVEYOUANGLICIZED/CHANGEDSPELLING OFYOUR NAME
No
97.5% 100.0% 98.8%
Total
N
100.0%
79
100.0%
81
100.0%
160X2=0.5, df=1, p=.466
Q91B HAVE YOU ANGLICIZED/CHANGED SPELLING OF YOUR NAME * Q8A RESIDENCY IN CANADA(DERIVED VARIABLE)
Q8A RESIDENCY IN CANADA(DERIVED VARIABLE)
RecentImmigrant
EstablishedImmigrant,Came to
Canada WhenAge 55+
EstablishedImmigrant,Came to
Canada WhenAge <55 Total
Yes3.0% 1.3%
Q91B HAVEYOUANGLICIZED/CHANGEDSPELLING OFYOUR NAME
No
100.0% 100.0% 97.0% 98.8%
Total
N
100.0%
62
100.0%
31
100.0%
67
100.0%
160X2=2.8, df=2, p=.245
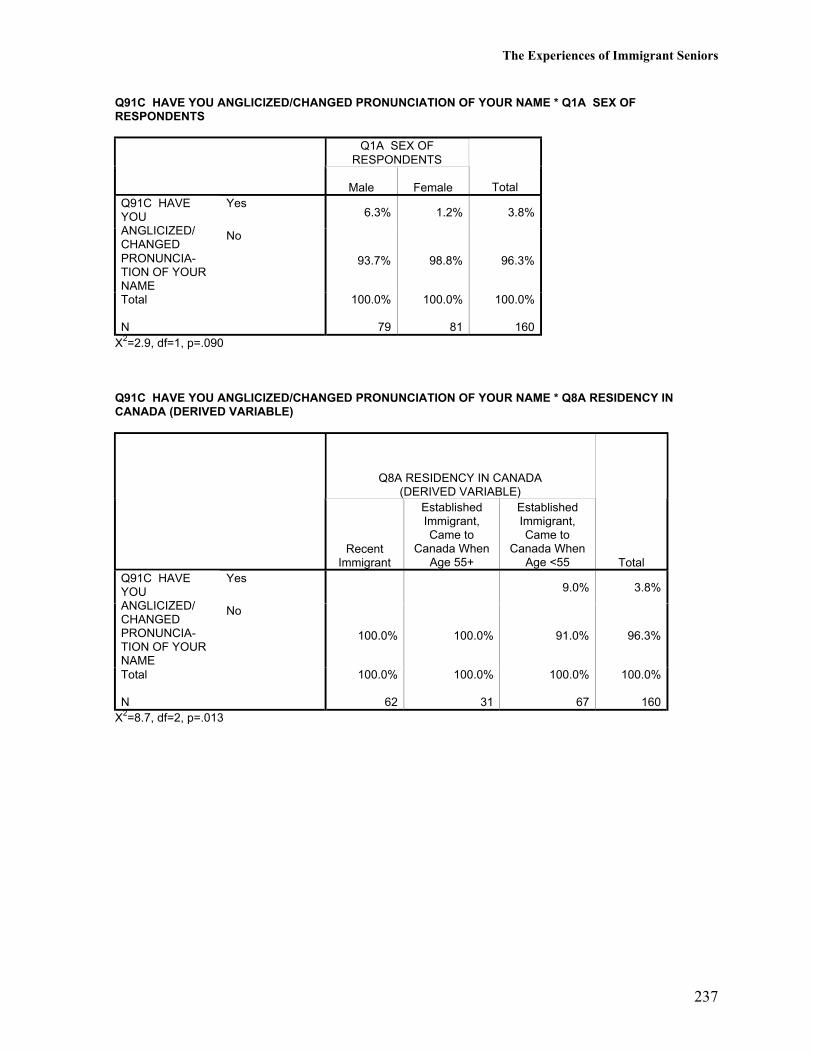
The Experiences of Immigrant Seniors
237
Q91C HAVE YOU ANGLICIZED/CHANGED PRONUNCIATION OF YOUR NAME * Q1A SEX OFRESPONDENTS
Q1A SEX OFRESPONDENTS
Male Female TotalYes
6.3% 1.2% 3.8%Q91C HAVEYOUANGLICIZED/CHANGEDPRONUNCIA-TION OF YOURNAME
No
93.7% 98.8% 96.3%
Total
N
100.0%
79
100.0%
81
100.0%
160X2=2.9, df=1, p=.090
Q91C HAVE YOU ANGLICIZED/CHANGED PRONUNCIATION OF YOUR NAME * Q8A RESIDENCY INCANADA (DERIVED VARIABLE)
Q8A RESIDENCY IN CANADA(DERIVED VARIABLE)
RecentImmigrant
EstablishedImmigrant,Came to
Canada WhenAge 55+
EstablishedImmigrant,Came to
Canada WhenAge <55 Total
Yes9.0% 3.8%
Q91C HAVEYOUANGLICIZED/CHANGEDPRONUNCIA-TION OF YOURNAME
No
100.0% 100.0% 91.0% 96.3%
Total
N
100.0%
62
100.0%
31
100.0%
67
100.0%
160X2=8.7, df=2, p=.013
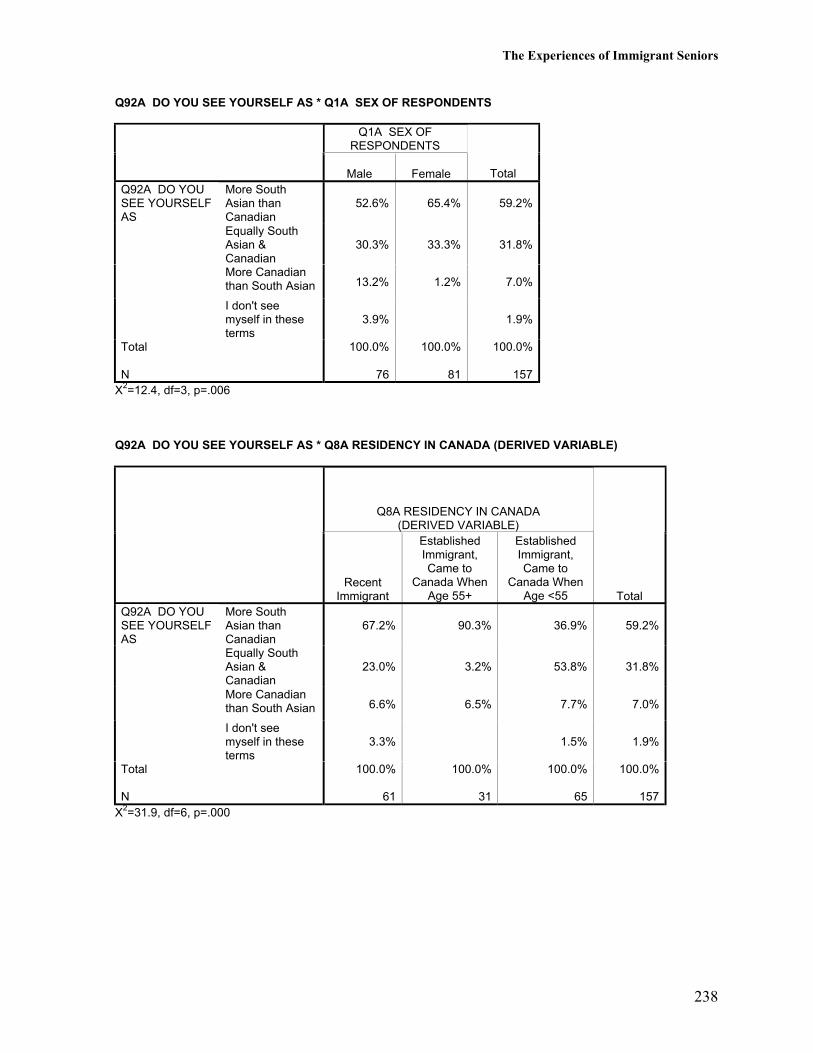
The Experiences of Immigrant Seniors
238
Q92A DO YOU SEE YOURSELF AS * Q1A SEX OF RESPONDENTS
Q1A SEX OFRESPONDENTS
Male Female TotalMore SouthAsian thanCanadian
52.6% 65.4% 59.2%
Equally SouthAsian &Canadian
30.3% 33.3% 31.8%
More Canadianthan South Asian 13.2% 1.2% 7.0%
Q92A DO YOUSEE YOURSELFAS
I don't seemyself in theseterms
3.9% 1.9%
Total
N
100.0%
76
100.0%
81
100.0%
157X2=12.4, df=3, p=.006
Q92A DO YOU SEE YOURSELF AS * Q8A RESIDENCY IN CANADA (DERIVED VARIABLE)
Q8A RESIDENCY IN CANADA(DERIVED VARIABLE)
RecentImmigrant
EstablishedImmigrant,Came to
Canada WhenAge 55+
EstablishedImmigrant,Came to
Canada WhenAge <55 Total
More SouthAsian thanCanadian
67.2% 90.3% 36.9% 59.2%
Equally SouthAsian &Canadian
23.0% 3.2% 53.8% 31.8%
More Canadianthan South Asian 6.6% 6.5% 7.7% 7.0%
Q92A DO YOUSEE YOURSELFAS
I don't seemyself in theseterms
3.3% 1.5% 1.9%
Total
N
100.0%
61
100.0%
31
100.0%
65
100.0%
157X2=31.9, df=6, p=.000
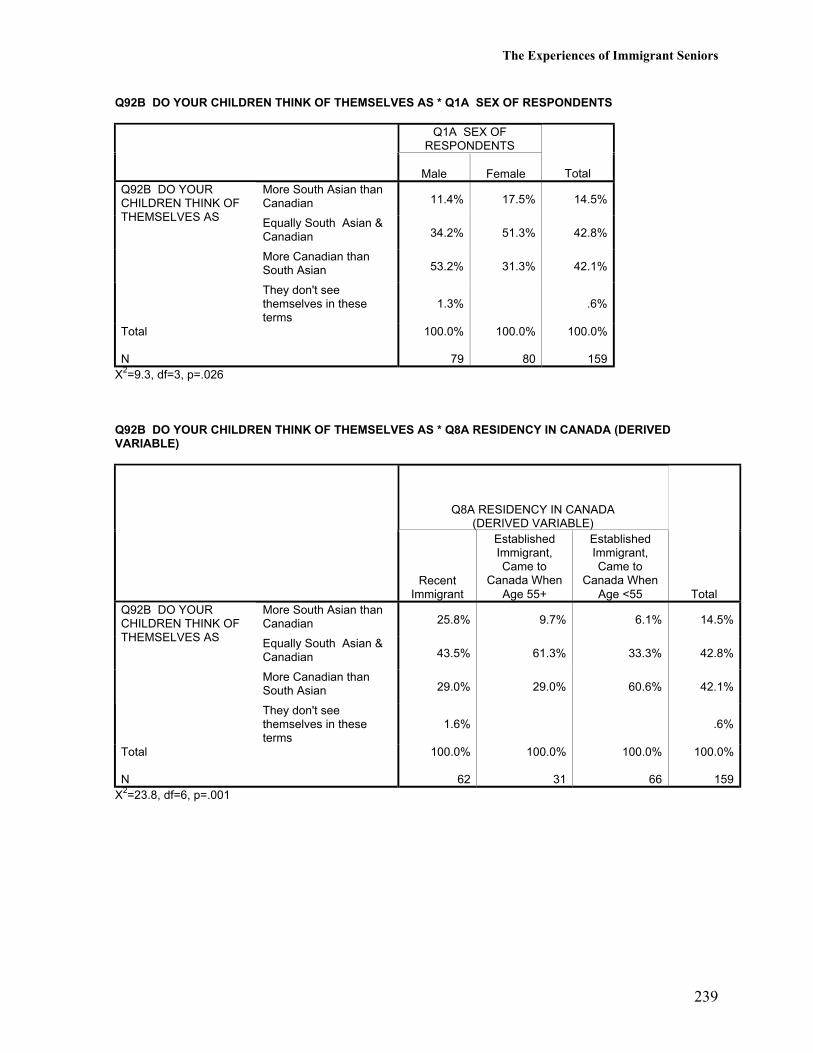
The Experiences of Immigrant Seniors
239
Q92B DO YOUR CHILDREN THINK OF THEMSELVES AS * Q1A SEX OF RESPONDENTS
Q1A SEX OFRESPONDENTS
Male Female TotalMore South Asian thanCanadian 11.4% 17.5% 14.5%
Equally South Asian &Canadian 34.2% 51.3% 42.8%
More Canadian thanSouth Asian 53.2% 31.3% 42.1%
Q92B DO YOURCHILDREN THINK OFTHEMSELVES AS
They don't seethemselves in theseterms
1.3% .6%
Total
N
100.0%
79
100.0%
80
100.0%
159X2=9.3, df=3, p=.026
Q92B DO YOUR CHILDREN THINK OF THEMSELVES AS * Q8A RESIDENCY IN CANADA (DERIVEDVARIABLE)
Q8A RESIDENCY IN CANADA(DERIVED VARIABLE)
RecentImmigrant
EstablishedImmigrant,Came to
Canada WhenAge 55+
EstablishedImmigrant,Came to
Canada WhenAge <55 Total
More South Asian thanCanadian 25.8% 9.7% 6.1% 14.5%
Equally South Asian &Canadian 43.5% 61.3% 33.3% 42.8%
More Canadian thanSouth Asian 29.0% 29.0% 60.6% 42.1%
Q92B DO YOURCHILDREN THINK OFTHEMSELVES AS
They don't seethemselves in theseterms
1.6% .6%
Total
N
100.0%
62
100.0%
31
100.0%
66
100.0%
159X2=23.8, df=6, p=.001
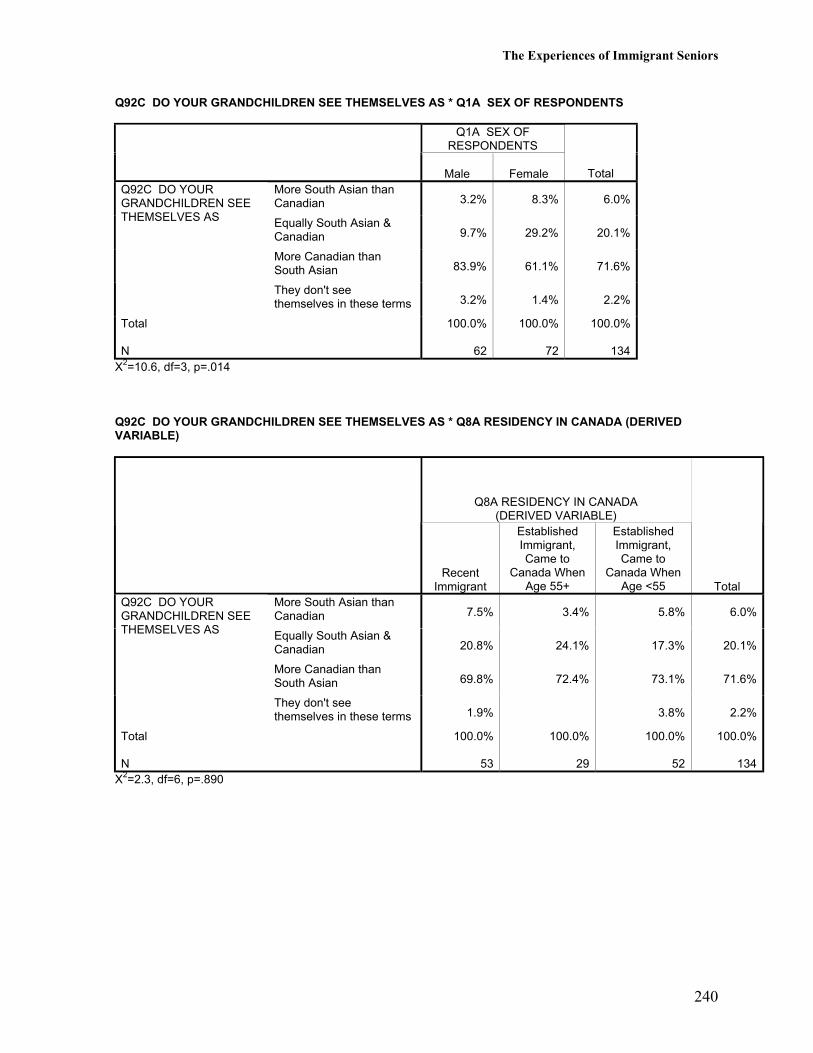
The Experiences of Immigrant Seniors
240
Q92C DO YOUR GRANDCHILDREN SEE THEMSELVES AS * Q1A SEX OF RESPONDENTS
Q1A SEX OFRESPONDENTS
Male Female TotalMore South Asian thanCanadian 3.2% 8.3% 6.0%
Equally South Asian &Canadian 9.7% 29.2% 20.1%
More Canadian thanSouth Asian 83.9% 61.1% 71.6%
Q92C DO YOURGRANDCHILDREN SEETHEMSELVES AS
They don't seethemselves in these terms 3.2% 1.4% 2.2%
Total
N
100.0%
62
100.0%
72
100.0%
134X2=10.6, df=3, p=.014
Q92C DO YOUR GRANDCHILDREN SEE THEMSELVES AS * Q8A RESIDENCY IN CANADA (DERIVEDVARIABLE)
Q8A RESIDENCY IN CANADA(DERIVED VARIABLE)
RecentImmigrant
EstablishedImmigrant,Came to
Canada WhenAge 55+
EstablishedImmigrant,Came to
Canada WhenAge <55 Total
More South Asian thanCanadian 7.5% 3.4% 5.8% 6.0%
Equally South Asian &Canadian 20.8% 24.1% 17.3% 20.1%
More Canadian thanSouth Asian 69.8% 72.4% 73.1% 71.6%
Q92C DO YOURGRANDCHILDREN SEETHEMSELVES AS
They don't seethemselves in these terms 1.9% 3.8% 2.2%
Total
N
100.0%
53
100.0%
29
100.0%
52
100.0%
134X2=2.3, df=6, p=.890

The Experiences of Immigrant Seniors
241
Q93A ARE THERE ANY BARRIERS TO YOUR DEVELOPING YOUR IDENTITY AS A CANADIAN? * Q1ASEX OF RESPONDENTS
Q1A SEX OFRESPONDENTS
Male Female TotalYes
25.6% 12.0% 19.0%Q93A ARETHERE ANYBARRIERS TOYOURDEVELOPINGYOUR IDENTITYAS ACANADIAN?
No
74.4% 88.0% 81.0%
Total
N
100.0%
78
100.0%
75
100.0%
153X2=4.6, df=1, p=.031
Q93A ARE THERE ANY BARRIERS TO YOUR DEVELOPING YOUR IDENTITY AS A CANADIAN? * Q8ARESIDENCY IN CANADA (DERIVED VARIABLE)
Q8A RESIDENCY IN CANADA(DERIVED VARIABLE)
RecentImmigrant
EstablishedImmigrant,Came to
Canada WhenAge 55+
EstablishedImmigrant,Came to
Canada WhenAge <55 Total
Yes20.7% 25.0% 14.9% 19.0%
Q93A ARETHERE ANYBARRIERS TOYOURDEVELOPINGYOUR IDENTITYAS ACANADIAN?
No
79.3% 75.0% 85.1% 81.0%
Total
N
100.0%
58
100.0%
28
100.0%
67
100.0%
153X2=1.5, df=2, p=.475
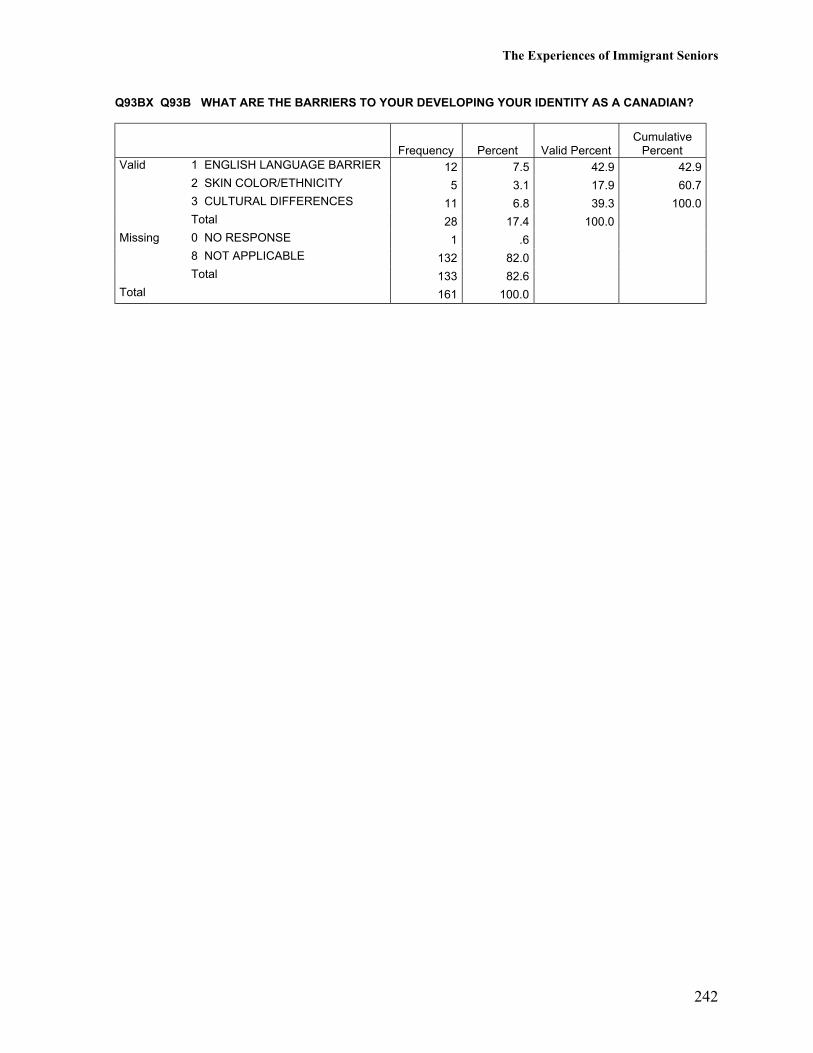
The Experiences of Immigrant Seniors
242
Q93BX Q93B WHAT ARE THE BARRIERS TO YOUR DEVELOPING YOUR IDENTITY AS A CANADIAN?
Frequency Percent Valid PercentCumulative
PercentValid 1 ENGLISH LANGUAGE BARRIER 12 7.5 42.9 42.9
2 SKIN COLOR/ETHNICITY 5 3.1 17.9 60.73 CULTURAL DIFFERENCES 11 6.8 39.3 100.0Total 28 17.4 100.0
Missing 0 NO RESPONSE 1 .68 NOT APPLICABLE 132 82.0Total 133 82.6
Total 161 100.0
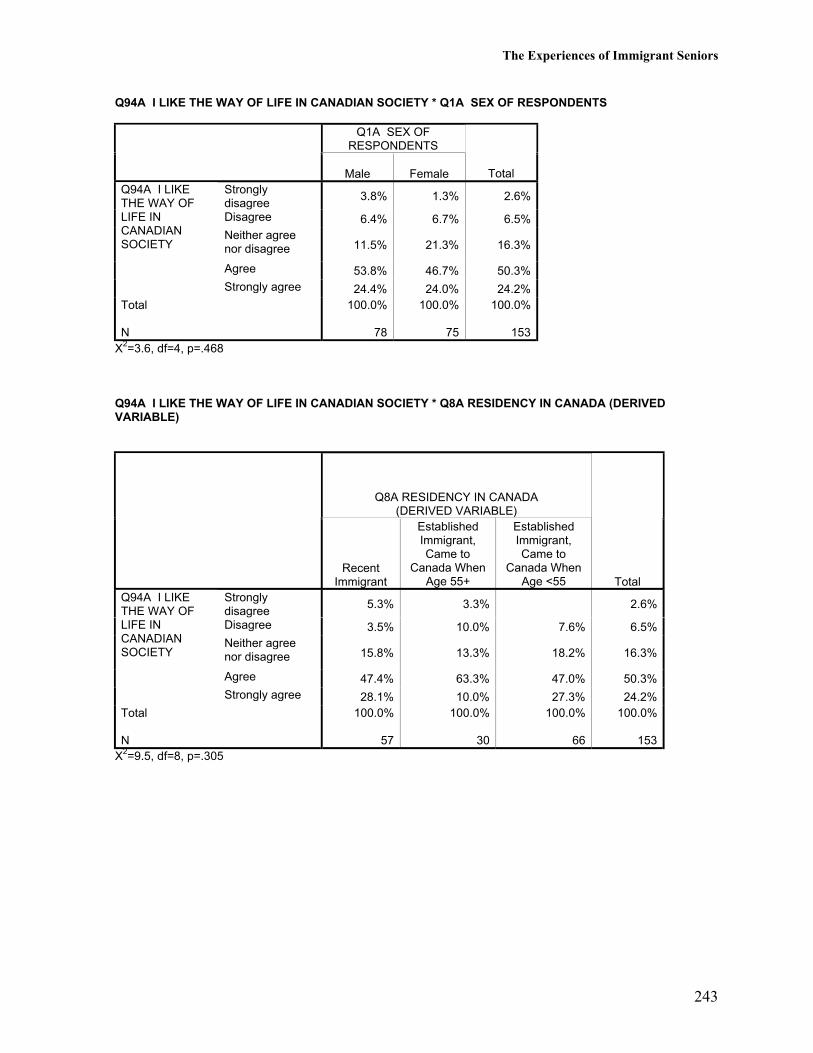
The Experiences of Immigrant Seniors
243
Q94A I LIKE THE WAY OF LIFE IN CANADIAN SOCIETY * Q1A SEX OF RESPONDENTS
Q1A SEX OFRESPONDENTS
Male Female TotalStronglydisagree
3.8% 1.3% 2.6%
Disagree 6.4% 6.7% 6.5%Neither agreenor disagree 11.5% 21.3% 16.3%
Agree 53.8% 46.7% 50.3%
Q94A I LIKETHE WAY OFLIFE INCANADIANSOCIETY
Strongly agree 24.4% 24.0% 24.2%Total
N
100.0%
78
100.0%
75
100.0%
153X2=3.6, df=4, p=.468
Q94A I LIKE THE WAY OF LIFE IN CANADIAN SOCIETY * Q8A RESIDENCY IN CANADA (DERIVEDVARIABLE)
Q8A RESIDENCY IN CANADA(DERIVED VARIABLE)
RecentImmigrant
EstablishedImmigrant,Came to
Canada WhenAge 55+
EstablishedImmigrant,Came to
Canada WhenAge <55 Total
Stronglydisagree
5.3% 3.3% 2.6%
Disagree 3.5% 10.0% 7.6% 6.5%Neither agreenor disagree 15.8% 13.3% 18.2% 16.3%
Agree 47.4% 63.3% 47.0% 50.3%
Q94A I LIKETHE WAY OFLIFE INCANADIANSOCIETY
Strongly agree 28.1% 10.0% 27.3% 24.2%Total
N
100.0%
57
100.0%
30
100.0%
66
100.0%
153X2=9.5, df=8, p=.305
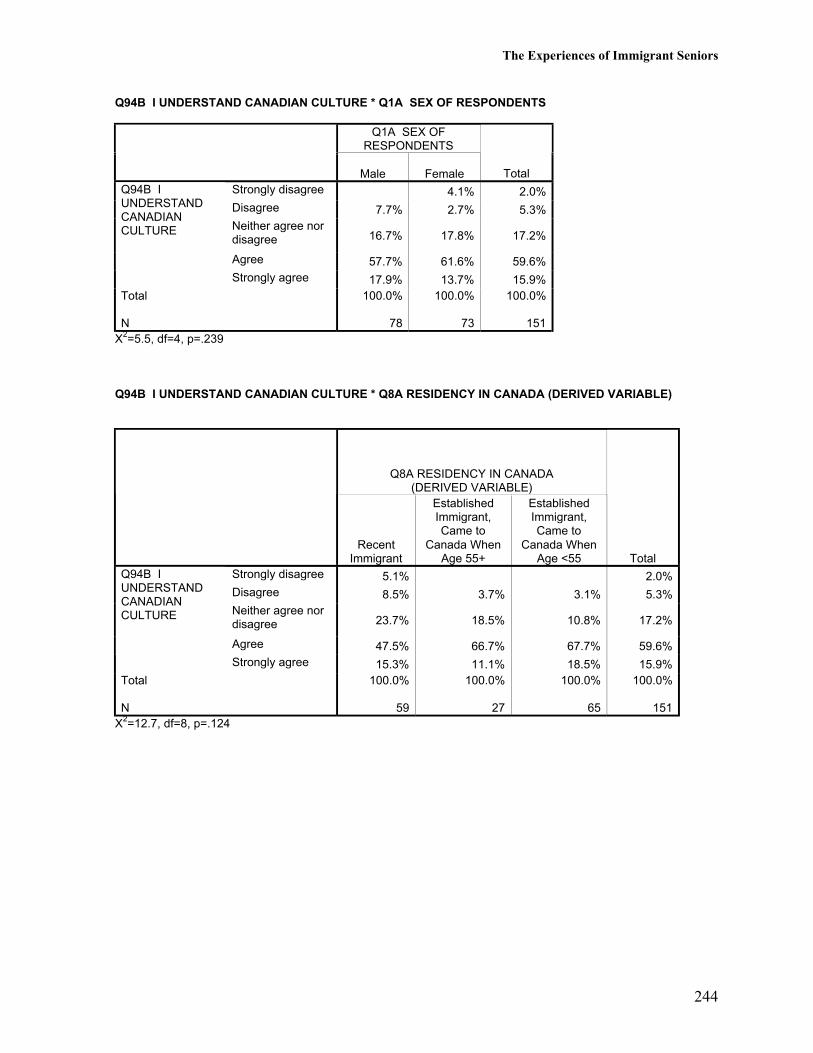
The Experiences of Immigrant Seniors
244
Q94B I UNDERSTAND CANADIAN CULTURE * Q1A SEX OF RESPONDENTS
Q1A SEX OFRESPONDENTS
Male Female TotalStrongly disagree 4.1% 2.0%Disagree 7.7% 2.7% 5.3%Neither agree nordisagree 16.7% 17.8% 17.2%
Agree 57.7% 61.6% 59.6%
Q94B IUNDERSTANDCANADIANCULTURE
Strongly agree 17.9% 13.7% 15.9%Total
N
100.0%
78
100.0%
73
100.0%
151X2=5.5, df=4, p=.239
Q94B I UNDERSTAND CANADIAN CULTURE * Q8A RESIDENCY IN CANADA (DERIVED VARIABLE)
Q8A RESIDENCY IN CANADA(DERIVED VARIABLE)
RecentImmigrant
EstablishedImmigrant,Came to
Canada WhenAge 55+
EstablishedImmigrant,Came to
Canada WhenAge <55 Total
Strongly disagree 5.1% 2.0%Disagree 8.5% 3.7% 3.1% 5.3%Neither agree nordisagree 23.7% 18.5% 10.8% 17.2%
Agree 47.5% 66.7% 67.7% 59.6%
Q94B IUNDERSTANDCANADIANCULTURE
Strongly agree 15.3% 11.1% 18.5% 15.9%Total
N
100.0%
59
100.0%
27
100.0%
65
100.0%
151X2=12.7, df=8, p=.124
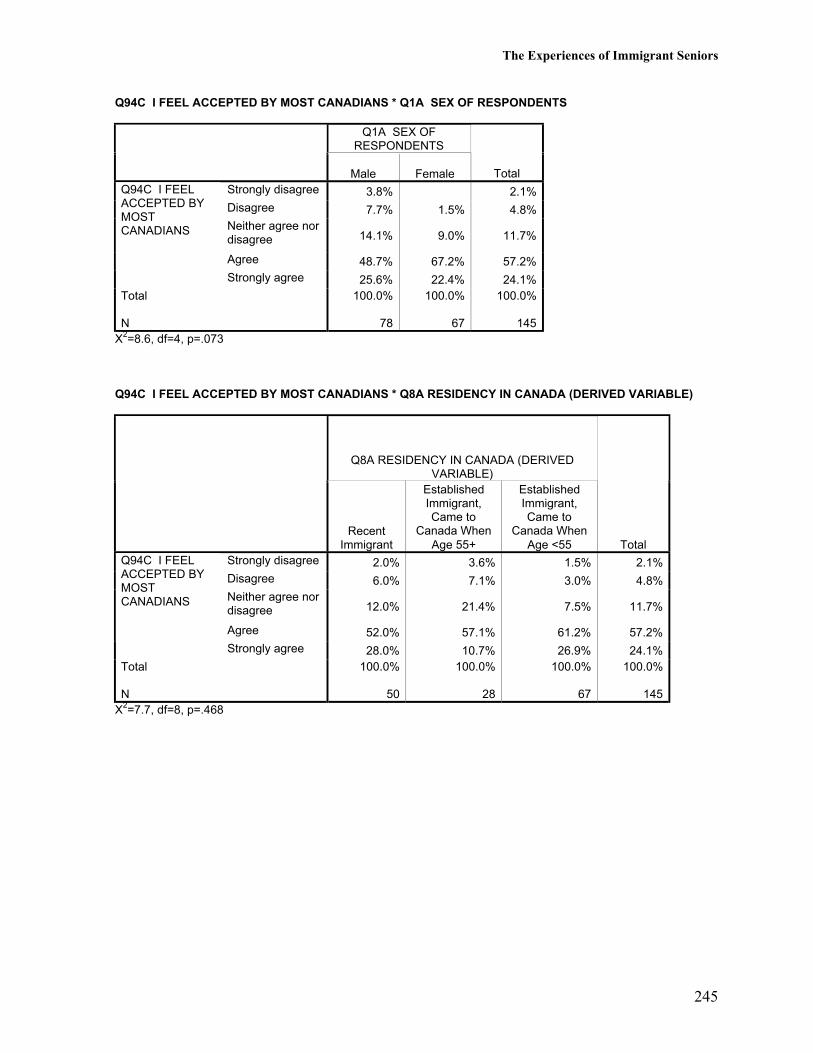
The Experiences of Immigrant Seniors
245
Q94C I FEEL ACCEPTED BY MOST CANADIANS * Q1A SEX OF RESPONDENTS
Q1A SEX OFRESPONDENTS
Male Female TotalStrongly disagree 3.8% 2.1%Disagree 7.7% 1.5% 4.8%Neither agree nordisagree 14.1% 9.0% 11.7%
Agree 48.7% 67.2% 57.2%
Q94C I FEELACCEPTED BYMOSTCANADIANS
Strongly agree 25.6% 22.4% 24.1%Total
N
100.0%
78
100.0%
67
100.0%
145X2=8.6, df=4, p=.073
Q94C I FEEL ACCEPTED BY MOST CANADIANS * Q8A RESIDENCY IN CANADA (DERIVED VARIABLE)
Q8A RESIDENCY IN CANADA (DERIVEDVARIABLE)
RecentImmigrant
EstablishedImmigrant,Came to
Canada WhenAge 55+
EstablishedImmigrant,Came to
Canada WhenAge <55 Total
Strongly disagree 2.0% 3.6% 1.5% 2.1%Disagree 6.0% 7.1% 3.0% 4.8%Neither agree nordisagree 12.0% 21.4% 7.5% 11.7%
Agree 52.0% 57.1% 61.2% 57.2%
Q94C I FEELACCEPTED BYMOSTCANADIANS
Strongly agree 28.0% 10.7% 26.9% 24.1%Total
N
100.0%
50
100.0%
28
100.0%
67
100.0%
145X2=7.7, df=8, p=.468
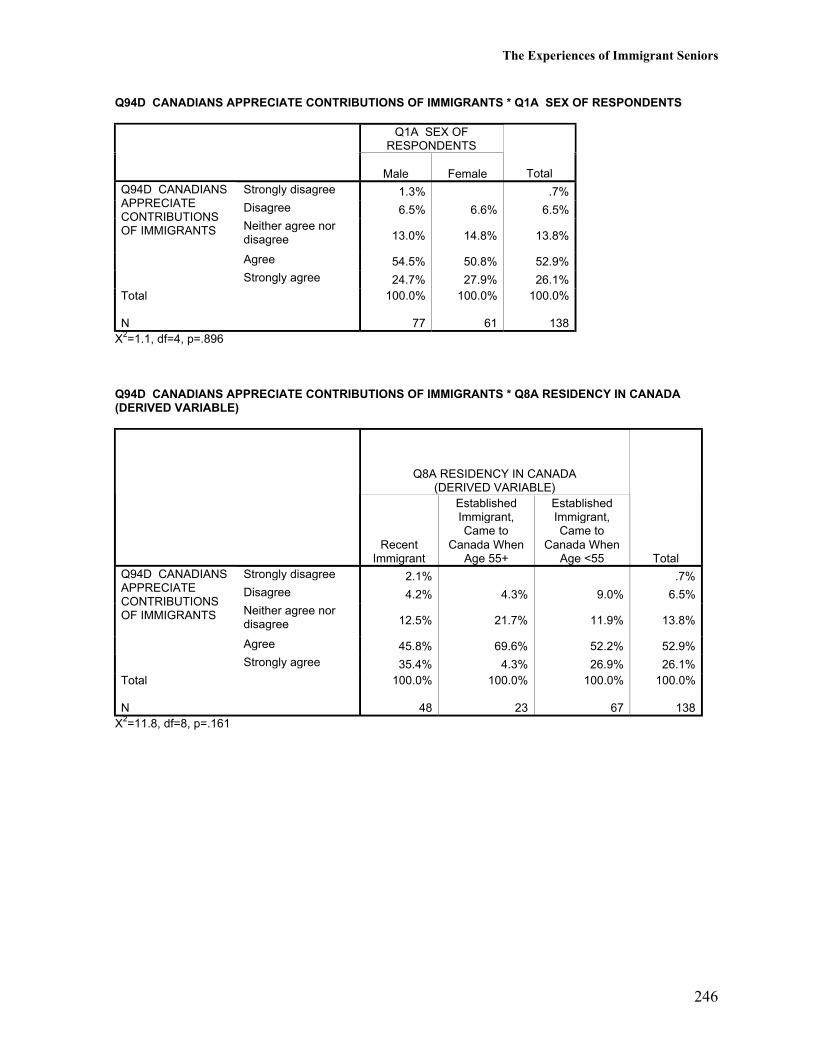
The Experiences of Immigrant Seniors
246
Q94D CANADIANS APPRECIATE CONTRIBUTIONS OF IMMIGRANTS * Q1A SEX OF RESPONDENTS
Q1A SEX OFRESPONDENTS
Male Female TotalStrongly disagree 1.3% .7%Disagree 6.5% 6.6% 6.5%Neither agree nordisagree 13.0% 14.8% 13.8%
Agree 54.5% 50.8% 52.9%
Q94D CANADIANSAPPRECIATECONTRIBUTIONSOF IMMIGRANTS
Strongly agree 24.7% 27.9% 26.1%Total
N
100.0%
77
100.0%
61
100.0%
138X2=1.1, df=4, p=.896
Q94D CANADIANS APPRECIATE CONTRIBUTIONS OF IMMIGRANTS * Q8A RESIDENCY IN CANADA(DERIVED VARIABLE)
Q8A RESIDENCY IN CANADA(DERIVED VARIABLE)
RecentImmigrant
EstablishedImmigrant,Came to
Canada WhenAge 55+
EstablishedImmigrant,Came to
Canada WhenAge <55 Total
Strongly disagree 2.1% .7%Disagree 4.2% 4.3% 9.0% 6.5%Neither agree nordisagree 12.5% 21.7% 11.9% 13.8%
Agree 45.8% 69.6% 52.2% 52.9%
Q94D CANADIANSAPPRECIATECONTRIBUTIONSOF IMMIGRANTS
Strongly agree 35.4% 4.3% 26.9% 26.1%Total
N
100.0%
48
100.0%
23
100.0%
67
100.0%
138X2=11.8, df=8, p=.161
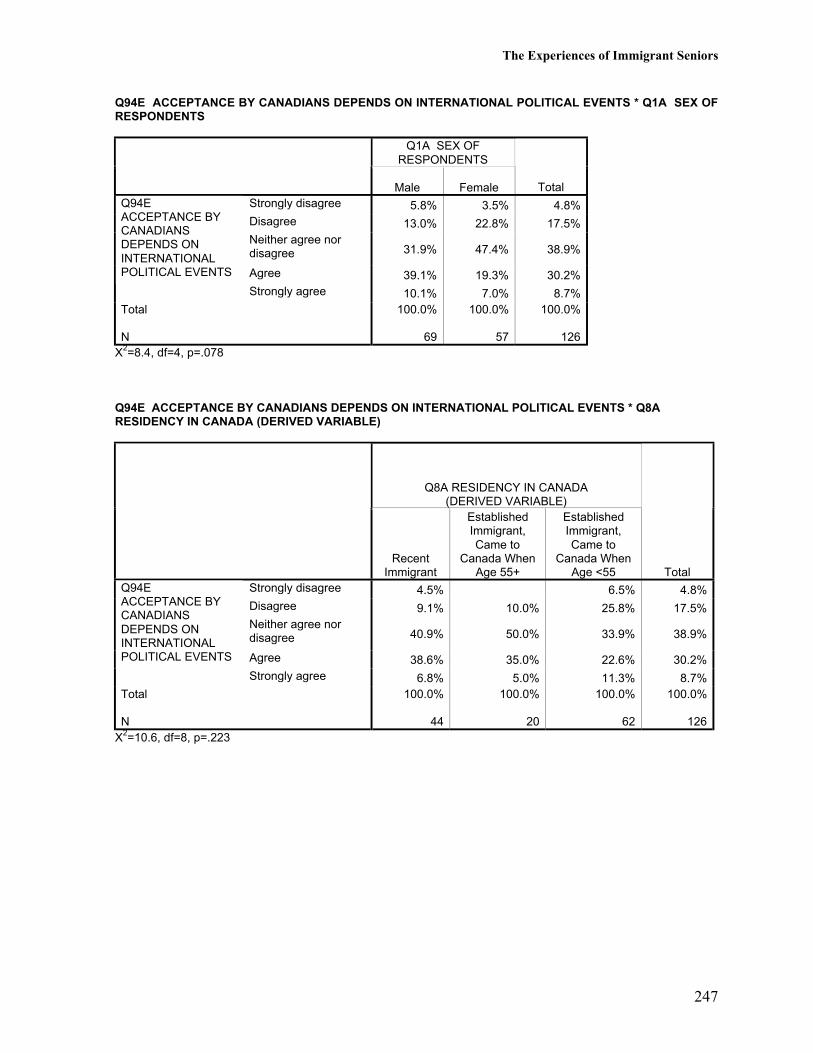
The Experiences of Immigrant Seniors
247
Q94E ACCEPTANCE BY CANADIANS DEPENDS ON INTERNATIONAL POLITICAL EVENTS * Q1A SEX OFRESPONDENTS
Q1A SEX OFRESPONDENTS
Male Female TotalStrongly disagree 5.8% 3.5% 4.8%Disagree 13.0% 22.8% 17.5%Neither agree nordisagree 31.9% 47.4% 38.9%
Agree 39.1% 19.3% 30.2%
Q94EACCEPTANCE BYCANADIANSDEPENDS ONINTERNATIONALPOLITICAL EVENTS
Strongly agree 10.1% 7.0% 8.7%Total
N
100.0%
69
100.0%
57
100.0%
126X2=8.4, df=4, p=.078
Q94E ACCEPTANCE BY CANADIANS DEPENDS ON INTERNATIONAL POLITICAL EVENTS * Q8ARESIDENCY IN CANADA (DERIVED VARIABLE)
Q8A RESIDENCY IN CANADA(DERIVED VARIABLE)
RecentImmigrant
EstablishedImmigrant,Came to
Canada WhenAge 55+
EstablishedImmigrant,Came to
Canada WhenAge <55 Total
Strongly disagree 4.5% 6.5% 4.8%Disagree 9.1% 10.0% 25.8% 17.5%Neither agree nordisagree 40.9% 50.0% 33.9% 38.9%
Agree 38.6% 35.0% 22.6% 30.2%
Q94EACCEPTANCE BYCANADIANSDEPENDS ONINTERNATIONALPOLITICAL EVENTS
Strongly agree 6.8% 5.0% 11.3% 8.7%Total
N
100.0%
44
100.0%
20
100.0%
62
100.0%
126X2=10.6, df=8, p=.223

The Experiences of Immigrant Seniors
248
The Experiences of Immigrant Seniors
249
Experience with Racism in Canada
Of the 140 persons who answered the question: “In the past three years, have you experiencedracism in Canada?” most (79%) said “never.” On the other hand, 16% said they haveoccasionally experienced racism, 4% frequently, and 1% “all of the time.” There weresignificant sex differences with 66% of males and 92% of females saying that they have neverexperienced racism in Canada in the past three years. There were no differences among recentand established immigrants.
When asked to explain, comments from persons who said that they had experienced racismincluded:
• Some people are coming and telling me to convert into Christianity• Seniors are not given seats designated for them on the bus• Sometimes, when I go to the store people do look, due to my turban and beard• Some ignorant Canadians don’t like the colour of my skin• Some English people do not like our culture and unity• Canadian companies do not give us job because of our dress• Some times when I go to the park, some children come on their bicycles and say all kinds
of things
On the other hand, comments from persons who said that they had never experienced racismin Canada in the past three years included:
• I haven’t experienced any racism in Canada personally and neither has my family• People here are very courteous• At work, I didn’t find any kind of discrimination• I always feel people are friendly regardless of their race• I always feel accepted by the people• Canadians are very generous and warm-hearted• Generally people are fair
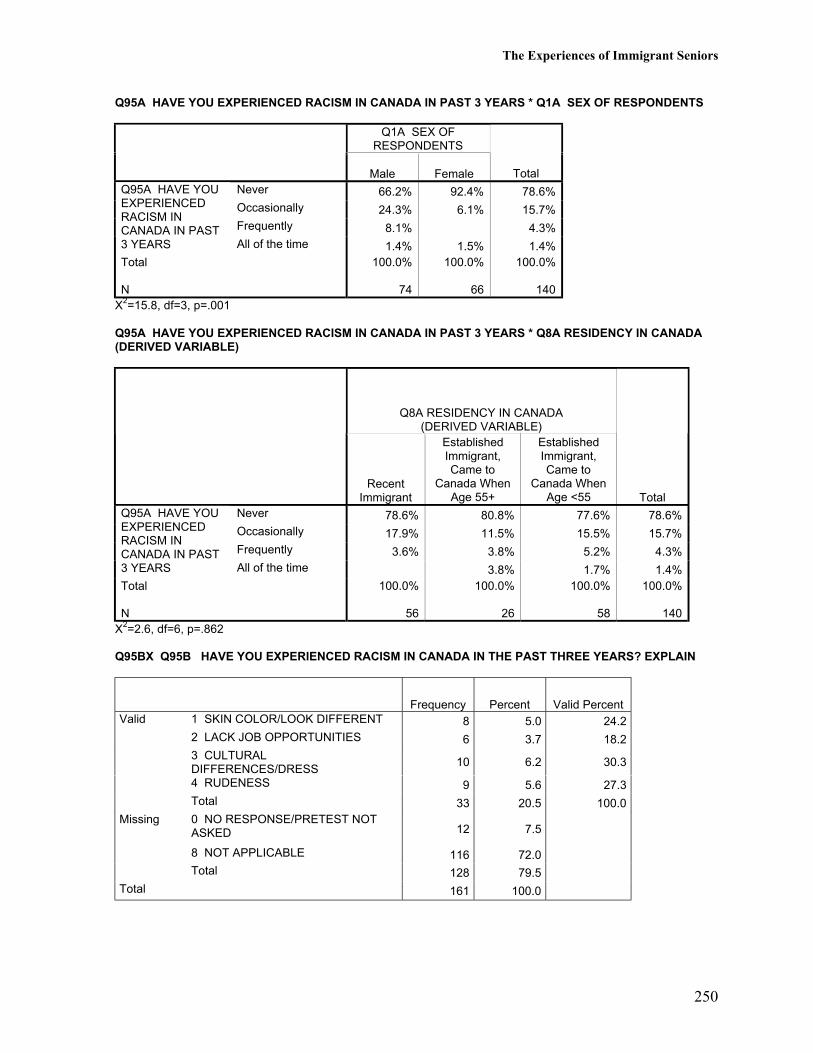
The Experiences of Immigrant Seniors
250
Q95A HAVE YOU EXPERIENCED RACISM IN CANADA IN PAST 3 YEARS * Q1A SEX OF RESPONDENTS
Q1A SEX OFRESPONDENTS
Male Female TotalNever 66.2% 92.4% 78.6%Occasionally 24.3% 6.1% 15.7%Frequently 8.1% 4.3%
Q95A HAVE YOUEXPERIENCEDRACISM INCANADA IN PAST3 YEARS All of the time 1.4% 1.5% 1.4%Total
N
100.0%
74
100.0%
66
100.0%
140X2=15.8, df=3, p=.001
Q95A HAVE YOU EXPERIENCED RACISM IN CANADA IN PAST 3 YEARS * Q8A RESIDENCY IN CANADA(DERIVED VARIABLE)
Q8A RESIDENCY IN CANADA(DERIVED VARIABLE)
RecentImmigrant
EstablishedImmigrant,Came to
Canada WhenAge 55+
EstablishedImmigrant,Came to
Canada WhenAge <55 Total
Never 78.6% 80.8% 77.6% 78.6%Occasionally 17.9% 11.5% 15.5% 15.7%Frequently 3.6% 3.8% 5.2% 4.3%
Q95A HAVE YOUEXPERIENCEDRACISM INCANADA IN PAST3 YEARS All of the time 3.8% 1.7% 1.4%Total
N
100.0%
56
100.0%
26
100.0%
58
100.0%
140X2=2.6, df=6, p=.862
Q95BX Q95B HAVE YOU EXPERIENCED RACISM IN CANADA IN THE PAST THREE YEARS? EXPLAIN
Frequency Percent Valid PercentValid 1 SKIN COLOR/LOOK DIFFERENT 8 5.0 24.2
2 LACK JOB OPPORTUNITIES 6 3.7 18.23 CULTURALDIFFERENCES/DRESS
10 6.2 30.3
4 RUDENESS 9 5.6 27.3Total 33 20.5 100.0
Missing 0 NO RESPONSE/PRETEST NOTASKED 12 7.5
8 NOT APPLICABLE 116 72.0Total 128 79.5
Total 161 100.0
The Experiences of Immigrant Seniors
251
Life as an Immigrant Living in Canada
For most of our respondents, Canada has provided a better life than it had had they stayed inSouth Asia. Half of our respondents (50%) said that if they lived in South Asia today, theirlife would be good or better (40% good; 10% excellent). Almost one-fifth said their lifewould be poor or worse (11% poor; 7% very poor). In contrast, 89% said that life in Canadafor them was good or better (44% good; 45% excellent), and no respondent said life inCanada for them was poor or very poor. Responses did not vary by sex or residency inCanada.
When asked what were the advantages of immigrating to Canada, most said being with family(26%), better health care (20%), or financial benefits (14%). Men were more likely thanwomen to say good government, safety, or freedom, good quality of life, and bettereducational or job opportunities, whereas women were more likely than men to say being withfamily. The main advantages of immigrating to Canada reported by recent immigrants andestablished immigrants who came to Canada at an older age were being with family and betterhealth care. For established immigrants who came to Canada at a younger age, the advantageswere more varied: opportunity for children and grandchildren, better educational or jobopportunities, good quality of life, financial benefits, and good government, security, orfreedom, better health care, and family.
The following are some examples of advantages described in our respondents’ own words.
Get to see the grandchildren and be with family members. Health benefits, traffic benefits, economic benefits. Good government system, health care is good. Having a very good standard of living Very safe and secure. Education opportunities, good life in general, children’s education.. Freedom of everything – language, religion, culture, speech, dress, healthcare. Value-wise and knowledge-wise I am gaining a lot everyday and I feel I am a
citizen of the global village. I feel that the climate/conditions are better, there is no pollution as compared to
South Asia. Health facilities are better than South Asia.
One in three of our respondents (32%) could not cite any disadvantages of immigrating toCanada. One-third (31%) cited missing family, friends, or relatives as the main disadvantage,10% said missing homeland, and 9% said missing or losing culture or identity. Women weremore likely than men to say missing family, friends, or relatives as the main disadvantage.Men’s responses were more varied and evenly spread across categories.
The following are some examples of disadvantages described in our respondents’ own words.
Lost touch with my country, family members, and friends. We are losing our identity. The climate is harsh here.

The Experiences of Immigrant Seniors
252
No financial assistance at this age. Loneliness when we arrived here and some cultural loss. Advancement in jobs because I’m a visible minority. My social position in society has been lowered.
When asked what made them happy in life, the majority of our respondents (69%) gavepeople-related responses: 48% said family, friends, or relatives, 16% said good socialrelations, and 5% said helping others.
The following are some comments in our respondents’ own words.
Good relations, high value, tolerance, and people being generally happy. Having family and friends close by and financial independence. To see the children and grandchildren prosper in life. Relationships, religious activities, lovable children, health. Serving society. Being loved and respected by everyone. Freedom and mobility.
Finally, respondents were asked to provide any additional information about their experiencesas an immigrant to Canada. About one-fifth (19%) mentioned good life in Canada or goodcountry, and 14% mentioned good health care. On the negative side, 19% suggested morefinancial assistance to immigrant seniors, and 16% mentioned cultural shock or loneliness.One in ten (11%) said no problem or well adjusted. Responses appear to vary by residency inCanada, although the differences are not statistically significant. Established immigrants weremore likely than recent immigrants to emphasize good life in Canada or good country. Thosewho came to Canada at an older age (both recent and established) were more likely thanestablished immigrants who came to Canada at a younger age to emphasize good health care.Recent immigrants were more likely than established immigrants to emphasize the need formore financial assistance. Established immigrants who came to Canada at a younger age weremore likely to mention cultural shock or loneliness.
The following are some comments in our respondents’ own words.
The life as a whole is good. Health care is really good. In Canada we have our own rights and freedom. Easy life and life security. I feel that when a senior comes to Canada as an immigrant he feels the cultural
shock and the loneliness. He is dependent on his family, he should be financiallywell off to stay here and for that I feel the government shouldn’t keep therestriction of 10 years to give the old age pension to South Asian seniors.
I feel that South Asian women who came as senior to Canada don’t have any kindof recreation and outings as they depend totally on their children. There should besome kind of recreation center at their religious place where they can interact withothers.
The Experiences of Immigrant Seniors
253
When parents are invited by children and due to unforeseen circumstances theylose their jobs or are deceased, what can the parents do to get support, as the 10years before old-age pension is too long to wait?
People come with a lot of hopes but realize it’s not a bed of roses, life is toughhere.
My experience has been very enjoyable and I have had no problems at all. If you want to adjust and adapt to a new culture and enjoy the Canadian way and
enjoy their festivals and participate activity, you can feel at home. If you want tokeep moving in life you have to compromise and adjust.
It was very hard at the beginning but now I am happy with Canadian life. Initial years of settlement is this country was very hard. Canadians do not
recognize foreign [educational] degrees. It has been positive for the most part, however, there has been some subtle
discrimination when aspiring to be upwardly mobile. In general I have very positive experiences because of my advantages of high
education, good jobs, my personal ability to get along and positive attitude. I did,however, experience some discrimination at the hands of some stupid, immatureand short-sighted white Canadians in the 60’s, 70’s, and 80’s. I feel, however,white Canadians’ attitude towards visible minorities is changing for the better.There is more acceptance and increasingly more intimate contacts between whiteCanadians and visible minorities like me. The future is bright for us.
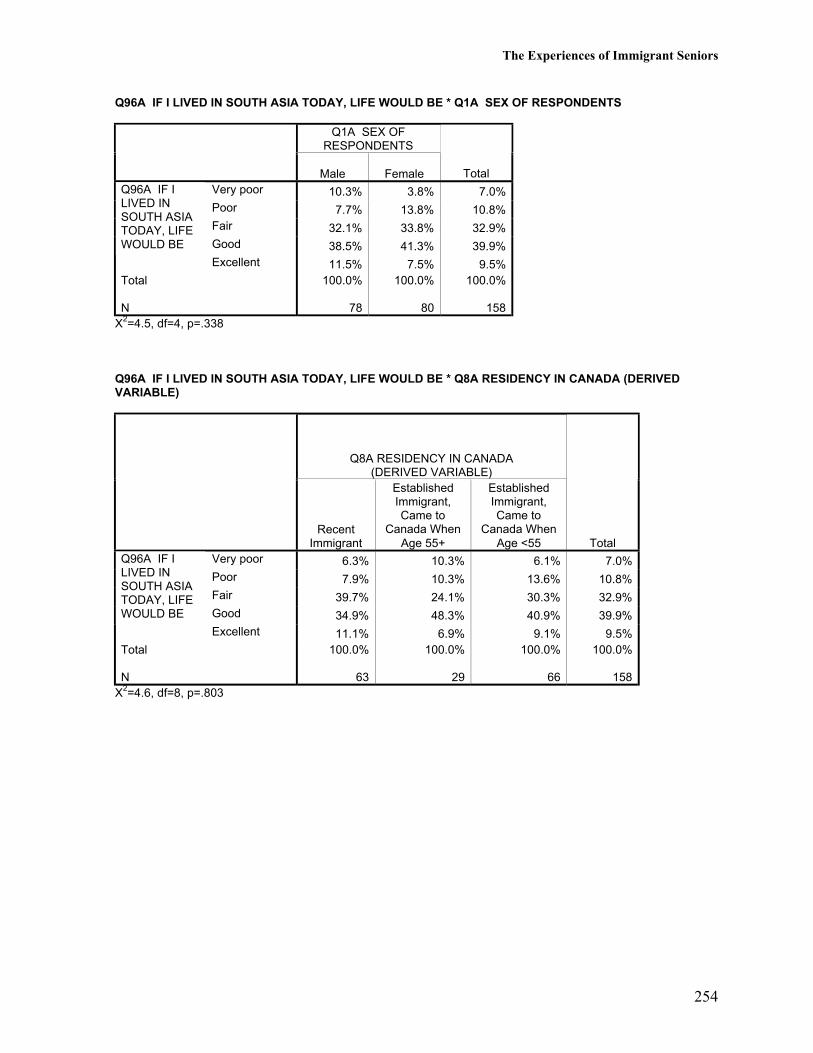
The Experiences of Immigrant Seniors
254
Q96A IF I LIVED IN SOUTH ASIA TODAY, LIFE WOULD BE * Q1A SEX OF RESPONDENTS
Q1A SEX OFRESPONDENTS
Male Female TotalVery poor 10.3% 3.8% 7.0%Poor 7.7% 13.8% 10.8%Fair 32.1% 33.8% 32.9%Good 38.5% 41.3% 39.9%
Q96A IF ILIVED INSOUTH ASIATODAY, LIFEWOULD BE
Excellent 11.5% 7.5% 9.5%Total
N
100.0%
78
100.0%
80
100.0%
158X2=4.5, df=4, p=.338
Q96A IF I LIVED IN SOUTH ASIA TODAY, LIFE WOULD BE * Q8A RESIDENCY IN CANADA (DERIVEDVARIABLE)
Q8A RESIDENCY IN CANADA(DERIVED VARIABLE)
RecentImmigrant
EstablishedImmigrant,Came to
Canada WhenAge 55+
EstablishedImmigrant,Came to
Canada WhenAge <55 Total
Very poor 6.3% 10.3% 6.1% 7.0%Poor 7.9% 10.3% 13.6% 10.8%Fair 39.7% 24.1% 30.3% 32.9%Good 34.9% 48.3% 40.9% 39.9%
Q96A IF ILIVED INSOUTH ASIATODAY, LIFEWOULD BE
Excellent 11.1% 6.9% 9.1% 9.5%Total
N
100.0%
63
100.0%
29
100.0%
66
100.0%
158X2=4.6, df=8, p=.803
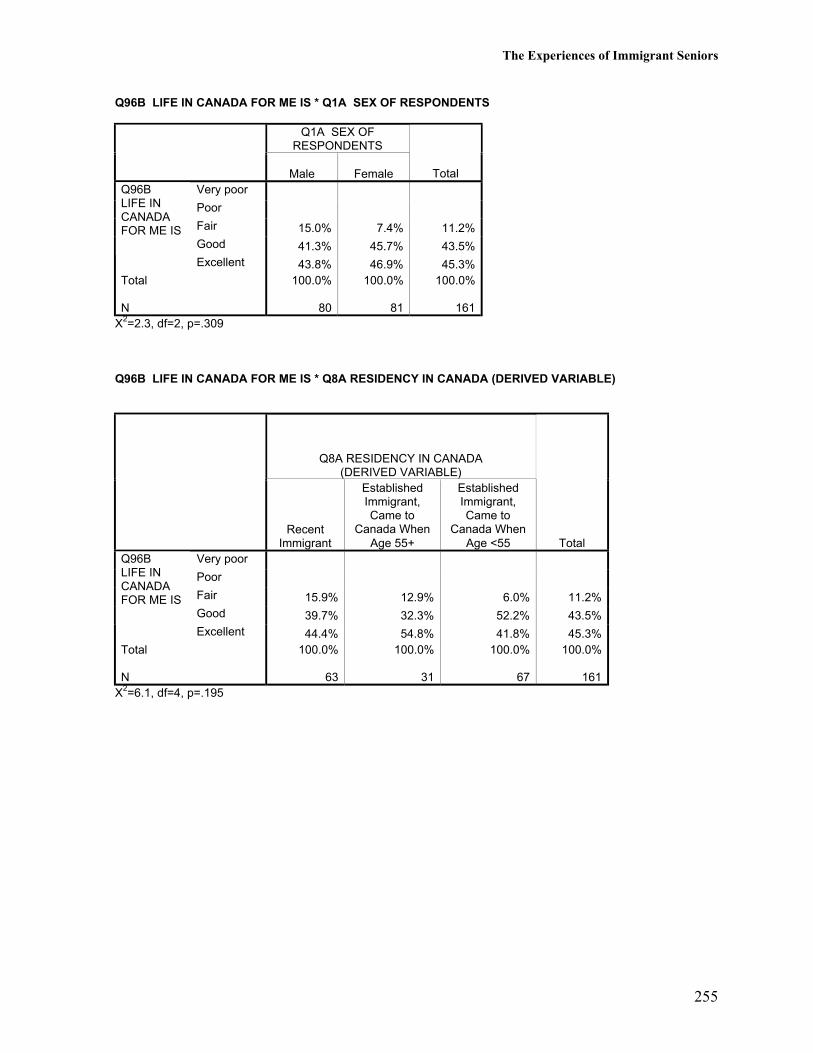
The Experiences of Immigrant Seniors
255
Q96B LIFE IN CANADA FOR ME IS * Q1A SEX OF RESPONDENTS
Q1A SEX OFRESPONDENTS
Male Female TotalVery poor
Poor
Fair 15.0% 7.4% 11.2%Good 41.3% 45.7% 43.5%
Q96BLIFE INCANADAFOR ME IS
Excellent 43.8% 46.9% 45.3%Total
N
100.0%
80
100.0%
81
100.0%
161X2=2.3, df=2, p=.309
Q96B LIFE IN CANADA FOR ME IS * Q8A RESIDENCY IN CANADA (DERIVED VARIABLE)
Q8A RESIDENCY IN CANADA(DERIVED VARIABLE)
RecentImmigrant
EstablishedImmigrant,Came to
Canada WhenAge 55+
EstablishedImmigrant,Came to
Canada WhenAge <55 Total
Very poor
Poor
Fair 15.9% 12.9% 6.0% 11.2%Good 39.7% 32.3% 52.2% 43.5%
Q96BLIFE INCANADAFOR ME IS
Excellent 44.4% 54.8% 41.8% 45.3%Total
N
100.0%
63
100.0%
31
100.0%
67
100.0%
161X2=6.1, df=4, p=.195

The Experiences of Immigrant Seniors
256
Q97X (CODED VARIABLE) ADVANTAGES OF IMMIGRATING TO CANADA * Q1A SEX OF RESPONDENTS
[First response only coded]
Q1A SEX OFRESPONDENTS
Male Female TotalFAMILY 17.7% 34.6% 26.3%BETTER HEALTHCARE
19.0% 21.0% 20.0%
FINANCIALBENEFITS
13.9% 13.6% 13.8%
GOODGOVERNMENT/SAFETY/FREEDOM
11.4% 7.4% 9.4%
GOOD QUALITY OFLIFE
12.7% 7.4% 10.0%
DIVERSITY/PEOPLE 2.5% 1.3%PHYSICALENVIRONMENT 2.5% 1.3%
OPPORTUNITY FORCHILDREN/GRANDCHILDREN
5.1% 7.4% 6.3%
EDUCATION/JOBOPPORTUNITIES 11.4% 1.2% 6.3%
HOUSING 2.5% 1.3%
Q97XADVANTAGES OFIMMIGRATING TOCANADA
NONE 3.8% 4.9% 4.4%Total
N
100.0%
79
100.0%
81
100.0%
160X2=19.3, df=10, p=.036
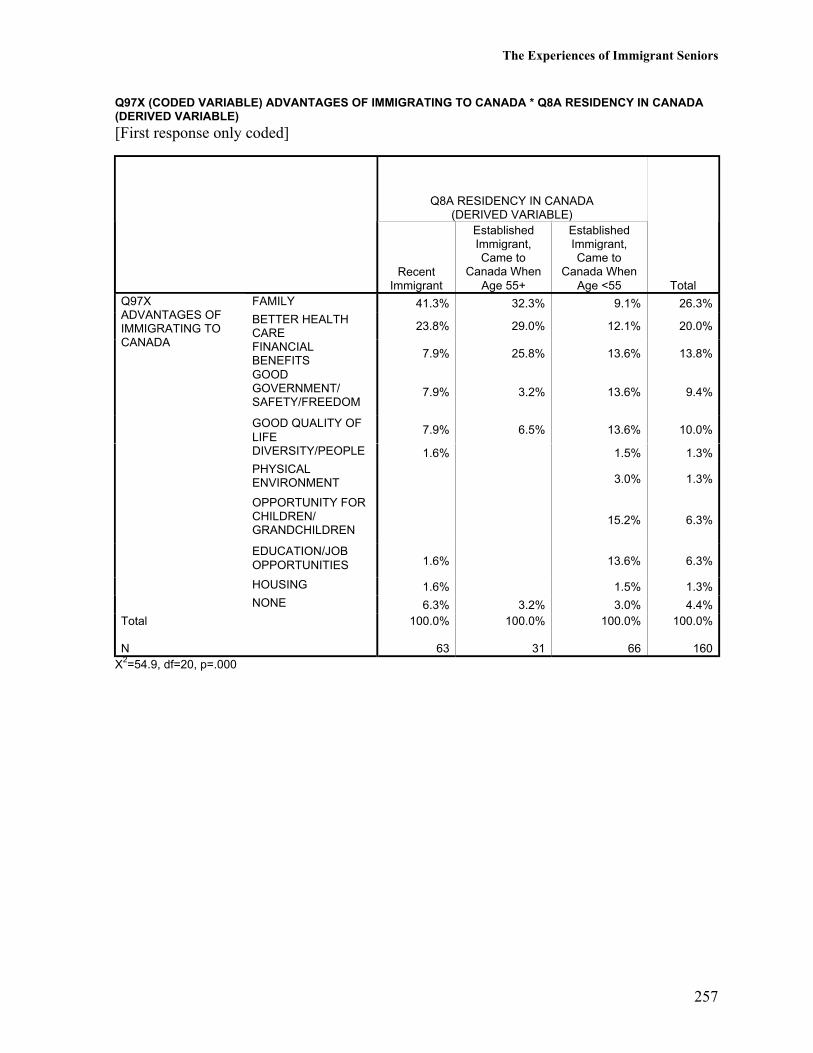
The Experiences of Immigrant Seniors
257
Q97X (CODED VARIABLE) ADVANTAGES OF IMMIGRATING TO CANADA * Q8A RESIDENCY IN CANADA(DERIVED VARIABLE)
[First response only coded]
Q8A RESIDENCY IN CANADA(DERIVED VARIABLE)
RecentImmigrant
EstablishedImmigrant,Came to
Canada WhenAge 55+
EstablishedImmigrant,Came to
Canada WhenAge <55 Total
FAMILY 41.3% 32.3% 9.1% 26.3%BETTER HEALTHCARE
23.8% 29.0% 12.1% 20.0%
FINANCIALBENEFITS
7.9% 25.8% 13.6% 13.8%
GOODGOVERNMENT/SAFETY/FREEDOM
7.9% 3.2% 13.6% 9.4%
GOOD QUALITY OFLIFE
7.9% 6.5% 13.6% 10.0%
DIVERSITY/PEOPLE 1.6% 1.5% 1.3%PHYSICALENVIRONMENT 3.0% 1.3%
OPPORTUNITY FORCHILDREN/GRANDCHILDREN
15.2% 6.3%
EDUCATION/JOBOPPORTUNITIES 1.6% 13.6% 6.3%
HOUSING 1.6% 1.5% 1.3%
Q97XADVANTAGES OFIMMIGRATING TOCANADA
NONE 6.3% 3.2% 3.0% 4.4%Total
N
100.0%
63
100.0%
31
100.0%
66
100.0%
160X2=54.9, df=20, p=.000
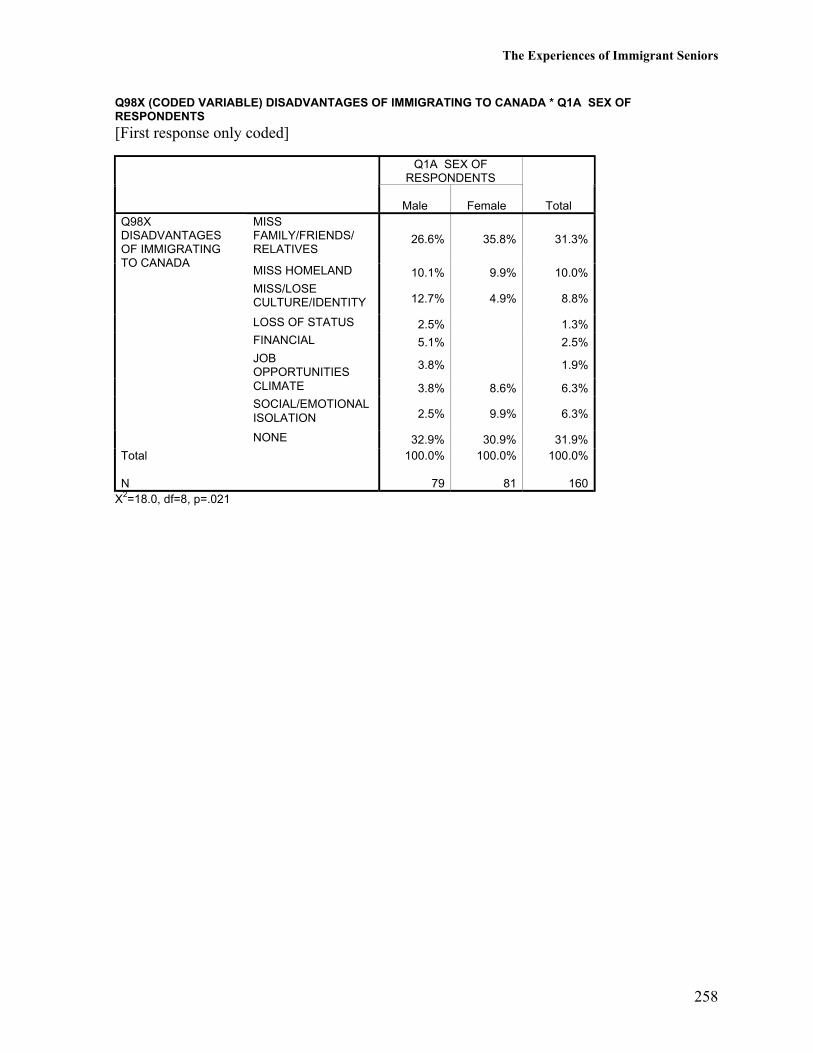
The Experiences of Immigrant Seniors
258
Q98X (CODED VARIABLE) DISADVANTAGES OF IMMIGRATING TO CANADA * Q1A SEX OFRESPONDENTS
[First response only coded]
Q1A SEX OFRESPONDENTS
Male Female TotalMISSFAMILY/FRIENDS/RELATIVES
26.6% 35.8% 31.3%
MISS HOMELAND 10.1% 9.9% 10.0%MISS/LOSECULTURE/IDENTITY 12.7% 4.9% 8.8%
LOSS OF STATUS 2.5% 1.3%FINANCIAL 5.1% 2.5%JOBOPPORTUNITIES
3.8% 1.9%
CLIMATE 3.8% 8.6% 6.3%SOCIAL/EMOTIONALISOLATION 2.5% 9.9% 6.3%
Q98XDISADVANTAGESOF IMMIGRATINGTO CANADA
NONE 32.9% 30.9% 31.9%Total
N
100.0%
79
100.0%
81
100.0%
160X2=18.0, df=8, p=.021
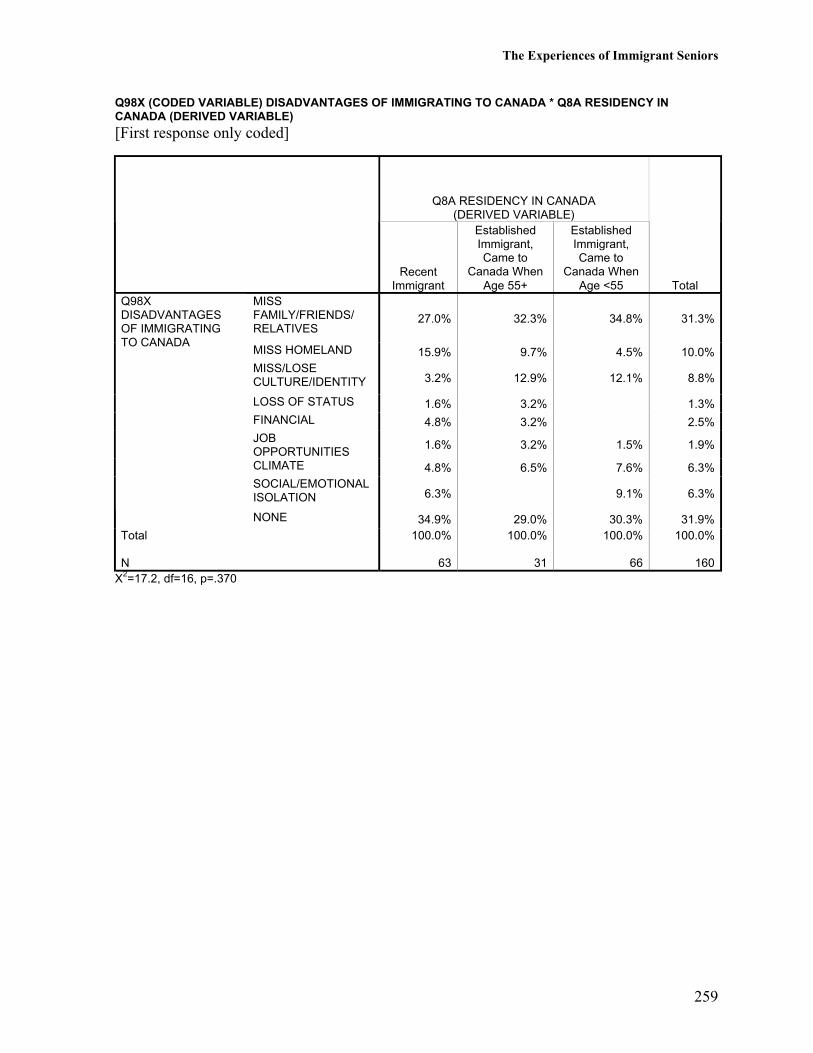
The Experiences of Immigrant Seniors
259
Q98X (CODED VARIABLE) DISADVANTAGES OF IMMIGRATING TO CANADA * Q8A RESIDENCY INCANADA (DERIVED VARIABLE)
[First response only coded]
Q8A RESIDENCY IN CANADA(DERIVED VARIABLE)
RecentImmigrant
EstablishedImmigrant,Came to
Canada WhenAge 55+
EstablishedImmigrant,Came to
Canada WhenAge <55 Total
MISSFAMILY/FRIENDS/RELATIVES
27.0% 32.3% 34.8% 31.3%
MISS HOMELAND 15.9% 9.7% 4.5% 10.0%MISS/LOSECULTURE/IDENTITY 3.2% 12.9% 12.1% 8.8%
LOSS OF STATUS 1.6% 3.2% 1.3%FINANCIAL 4.8% 3.2% 2.5%JOBOPPORTUNITIES
1.6% 3.2% 1.5% 1.9%
CLIMATE 4.8% 6.5% 7.6% 6.3%SOCIAL/EMOTIONALISOLATION 6.3% 9.1% 6.3%
Q98XDISADVANTAGESOF IMMIGRATINGTO CANADA
NONE 34.9% 29.0% 30.3% 31.9%Total
N
100.0%
63
100.0%
31
100.0%
66
100.0%
160X2=17.2, df=16, p=.370
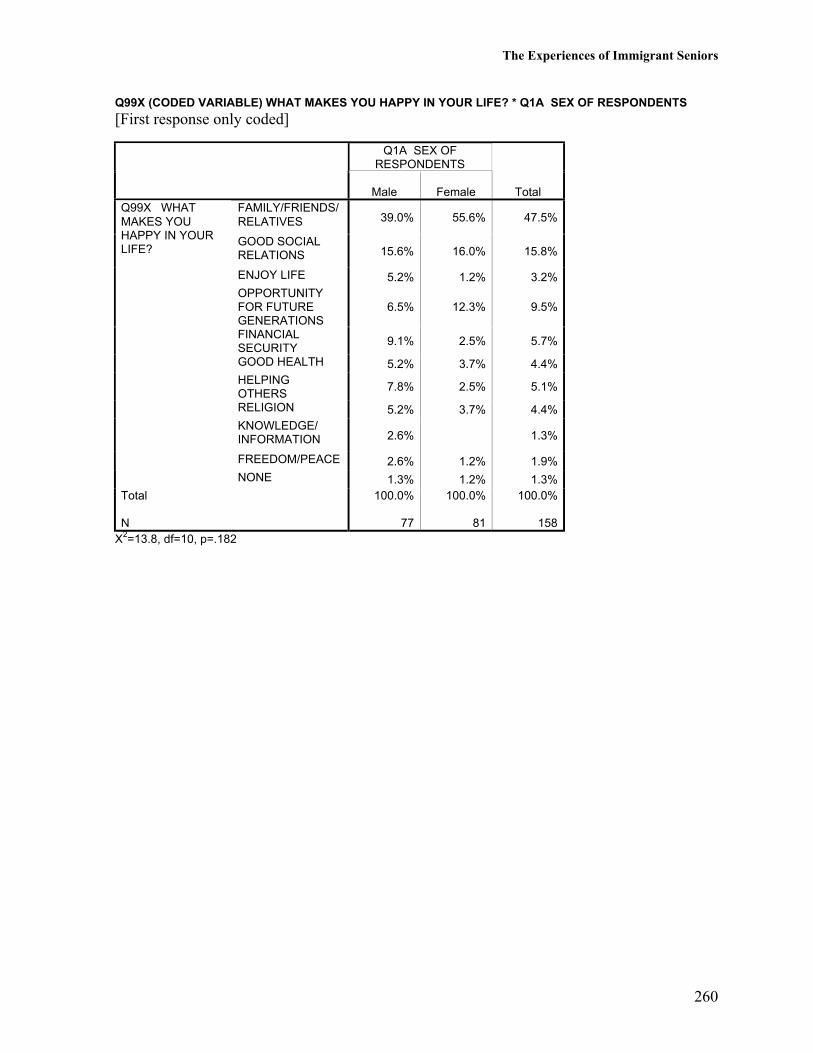
The Experiences of Immigrant Seniors
260
Q99X (CODED VARIABLE) WHAT MAKES YOU HAPPY IN YOUR LIFE? * Q1A SEX OF RESPONDENTS
[First response only coded]
Q1A SEX OFRESPONDENTS
Male Female TotalFAMILY/FRIENDS/RELATIVES 39.0% 55.6% 47.5%
GOOD SOCIALRELATIONS 15.6% 16.0% 15.8%
ENJOY LIFE 5.2% 1.2% 3.2%OPPORTUNITYFOR FUTUREGENERATIONS
6.5% 12.3% 9.5%
FINANCIALSECURITY
9.1% 2.5% 5.7%
GOOD HEALTH 5.2% 3.7% 4.4%HELPINGOTHERS
7.8% 2.5% 5.1%
RELIGION 5.2% 3.7% 4.4%KNOWLEDGE/INFORMATION 2.6% 1.3%
FREEDOM/PEACE 2.6% 1.2% 1.9%
Q99X WHATMAKES YOUHAPPY IN YOURLIFE?
NONE 1.3% 1.2% 1.3%Total
N
100.0%
77
100.0%
81
100.0%
158X2=13.8, df=10, p=.182
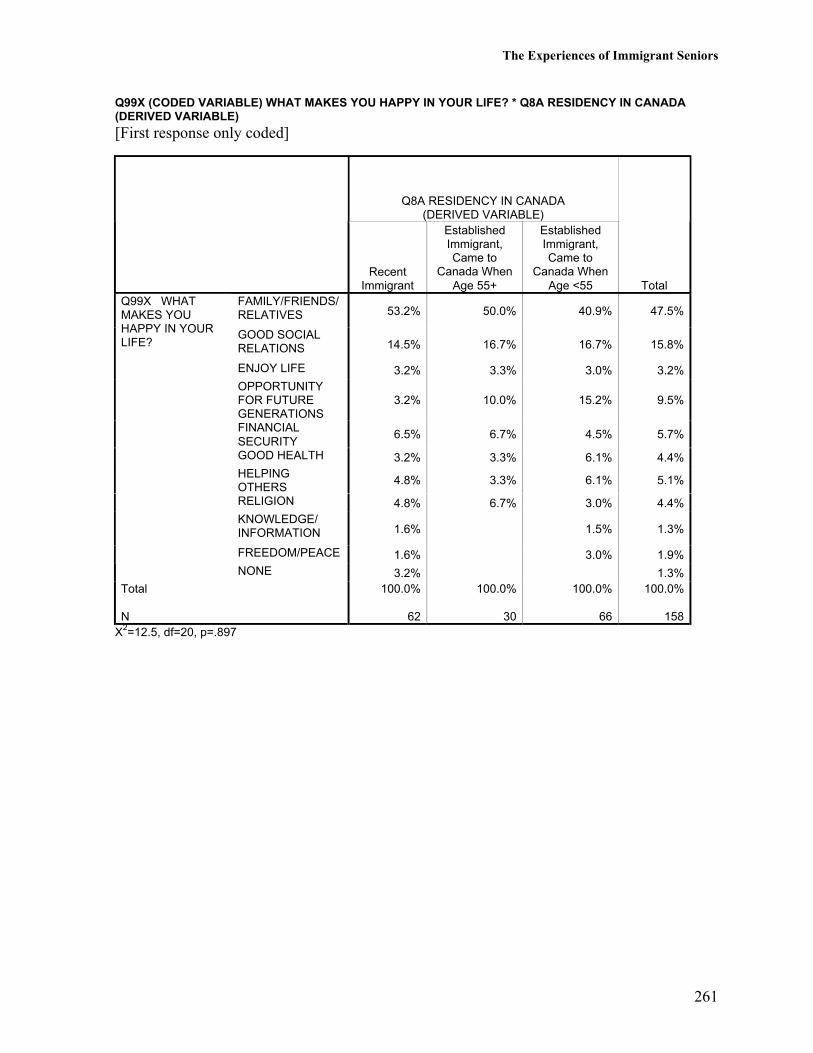
The Experiences of Immigrant Seniors
261
Q99X (CODED VARIABLE) WHAT MAKES YOU HAPPY IN YOUR LIFE? * Q8A RESIDENCY IN CANADA(DERIVED VARIABLE)
[First response only coded]
Q8A RESIDENCY IN CANADA(DERIVED VARIABLE)
RecentImmigrant
EstablishedImmigrant,Came to
Canada WhenAge 55+
EstablishedImmigrant,Came to
Canada WhenAge <55 Total
FAMILY/FRIENDS/RELATIVES 53.2% 50.0% 40.9% 47.5%
GOOD SOCIALRELATIONS 14.5% 16.7% 16.7% 15.8%
ENJOY LIFE 3.2% 3.3% 3.0% 3.2%OPPORTUNITYFOR FUTUREGENERATIONS
3.2% 10.0% 15.2% 9.5%
FINANCIALSECURITY
6.5% 6.7% 4.5% 5.7%
GOOD HEALTH 3.2% 3.3% 6.1% 4.4%HELPINGOTHERS
4.8% 3.3% 6.1% 5.1%
RELIGION 4.8% 6.7% 3.0% 4.4%KNOWLEDGE/INFORMATION 1.6% 1.5% 1.3%
FREEDOM/PEACE 1.6% 3.0% 1.9%
Q99X WHATMAKES YOUHAPPY IN YOURLIFE?
NONE 3.2% 1.3%Total
N
100.0%
62
100.0%
30
100.0%
66
100.0%
158X2=12.5, df=20, p=.897
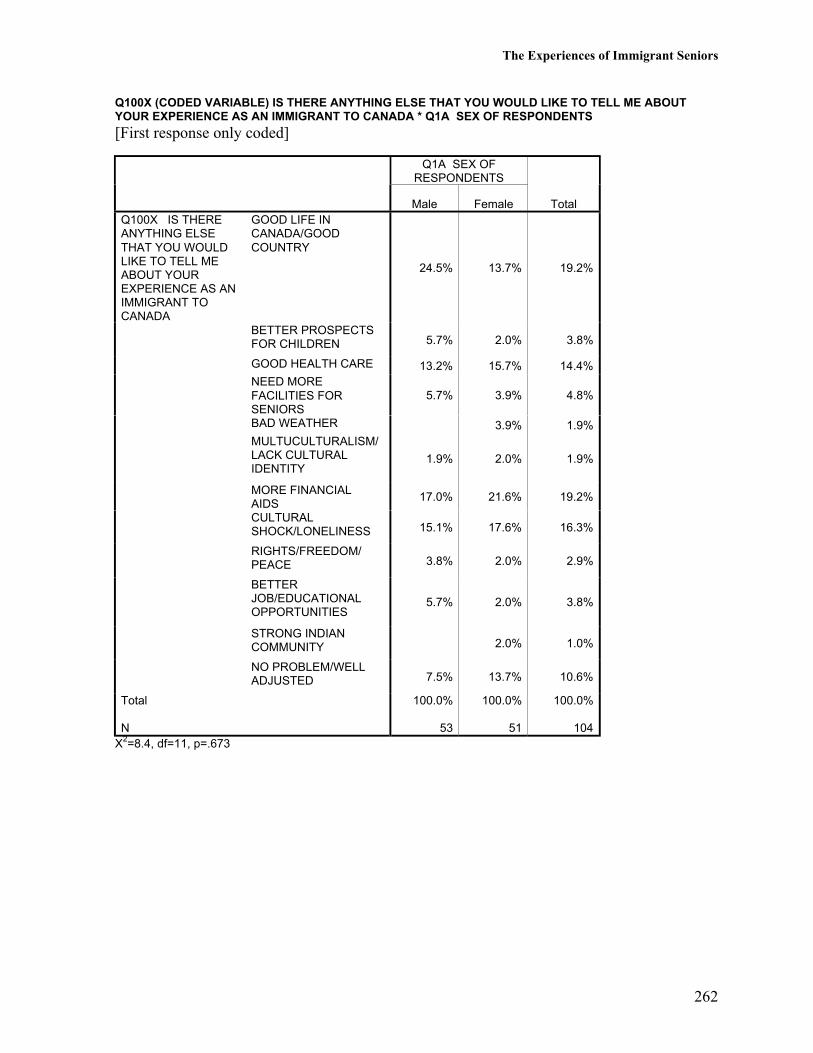
The Experiences of Immigrant Seniors
262
Q100X (CODED VARIABLE) IS THERE ANYTHING ELSE THAT YOU WOULD LIKE TO TELL ME ABOUTYOUR EXPERIENCE AS AN IMMIGRANT TO CANADA * Q1A SEX OF RESPONDENTS
[First response only coded]
Q1A SEX OFRESPONDENTS
Male Female TotalQ100X IS THEREANYTHING ELSETHAT YOU WOULDLIKE TO TELL MEABOUT YOUREXPERIENCE AS ANIMMIGRANT TOCANADA
GOOD LIFE INCANADA/GOODCOUNTRY
24.5% 13.7% 19.2%
BETTER PROSPECTSFOR CHILDREN 5.7% 2.0% 3.8%
GOOD HEALTH CARE 13.2% 15.7% 14.4%NEED MOREFACILITIES FORSENIORS
5.7% 3.9% 4.8%
BAD WEATHER 3.9% 1.9%MULTUCULTURALISM/LACK CULTURALIDENTITY
1.9% 2.0% 1.9%
MORE FINANCIALAIDS
17.0% 21.6% 19.2%
CULTURALSHOCK/LONELINESS 15.1% 17.6% 16.3%
RIGHTS/FREEDOM/PEACE 3.8% 2.0% 2.9%
BETTERJOB/EDUCATIONALOPPORTUNITIES
5.7% 2.0% 3.8%
STRONG INDIANCOMMUNITY 2.0% 1.0%
NO PROBLEM/WELLADJUSTED 7.5% 13.7% 10.6%
Total
N
100.0%
53
100.0%
51
100.0%
104X2=8.4, df=11, p=.673
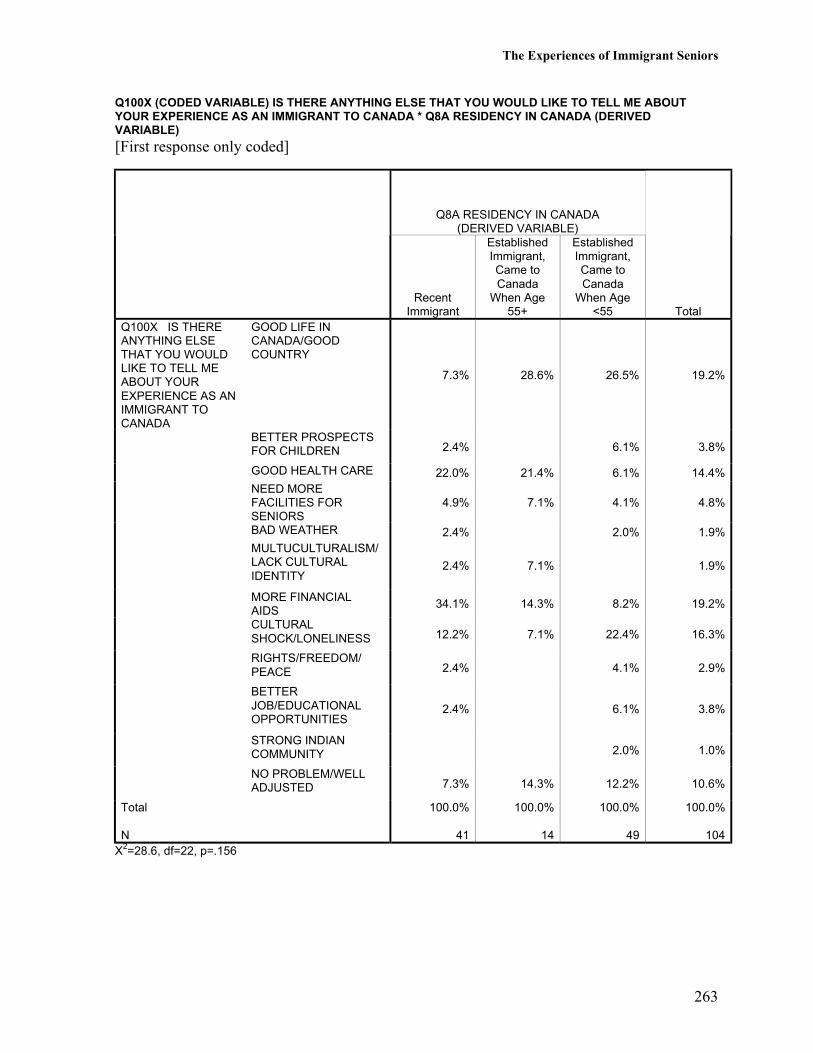
The Experiences of Immigrant Seniors
263
Q100X (CODED VARIABLE) IS THERE ANYTHING ELSE THAT YOU WOULD LIKE TO TELL ME ABOUTYOUR EXPERIENCE AS AN IMMIGRANT TO CANADA * Q8A RESIDENCY IN CANADA (DERIVEDVARIABLE)
[First response only coded]
Q8A RESIDENCY IN CANADA(DERIVED VARIABLE)
RecentImmigrant
EstablishedImmigrant,Came toCanada
When Age55+
EstablishedImmigrant,Came toCanada
When Age<55 Total
Q100X IS THEREANYTHING ELSETHAT YOU WOULDLIKE TO TELL MEABOUT YOUREXPERIENCE AS ANIMMIGRANT TOCANADA
GOOD LIFE INCANADA/GOODCOUNTRY
7.3% 28.6% 26.5% 19.2%
BETTER PROSPECTSFOR CHILDREN 2.4% 6.1% 3.8%
GOOD HEALTH CARE 22.0% 21.4% 6.1% 14.4%NEED MOREFACILITIES FORSENIORS
4.9% 7.1% 4.1% 4.8%
BAD WEATHER 2.4% 2.0% 1.9%MULTUCULTURALISM/LACK CULTURALIDENTITY
2.4% 7.1% 1.9%
MORE FINANCIALAIDS
34.1% 14.3% 8.2% 19.2%
CULTURALSHOCK/LONELINESS 12.2% 7.1% 22.4% 16.3%
RIGHTS/FREEDOM/PEACE 2.4% 4.1% 2.9%
BETTERJOB/EDUCATIONALOPPORTUNITIES
2.4% 6.1% 3.8%
STRONG INDIANCOMMUNITY 2.0% 1.0%
NO PROBLEM/WELLADJUSTED 7.3% 14.3% 12.2% 10.6%
Total
N
100.0%
41
100.0%
14
100.0%
49
100.0%
104X2=28.6, df=22, p=.156

The Experiences of Immigrant Seniors
264
The Experiences of Immigrant Seniors
265
Conclusion
Overall, the South Asian immigrant seniors in our study are satisfied with many aspects oftheir life in Canada: their current living arrangement and housing conditions; physical safetyin their neighborhood and at home; contact with and emotional support from their family,relatives, and friends, and social contact through community, cultural, and religiousparticipation in Edmonton. The majority of our respondents indicate that having family andrelatives close by is very important to them. There is some evidence of mutual help within thefamily, with the senior helping with childcare and household maintenance, and adult childrenand grandchildren helping the senior with daily living (e.g., transportation) and providingemotional support. For most of our respondents, the advantages of immigrating to Canadahave outweighed the disadvantages.
However, some respondents do experience difficulties in their lives. The top issue iseconomic security. About two in five of our respondents report not having adequate incomefor their needs. About one in ten say they feel lonely frequently or all the time. A smallnumber of respondents feel unsafe walking alone in their neighbourhood or at home becauseof discrimination, winter road conditions, health problems, unknown language, or crime.Some seniors have difficulty getting to places because of the lack of a ride and poor publictransportation. To some, language and cultural differences are the main barriers to developingtheir identity as Canadians.
Maintaining ties to their homeland and their South Asian identity is important for ourrespondents. Most of our respondents have connections with family and friends in theirhomeland, and maintain some of the cultural practices and traditions in their daily lives inCanada. The majority indicate that having friends from the same cultural background is veryimportant to them, and most see themselves as more South Asian than Canadian.
Our respondents see participating in the Canadian mainstream society as important in somerespects. Most indicate that feeling welcome in Canada, knowing English, having Canadiancitizenship, and being financially secure are very important to them. Other aspects ofCanadian life are, however, less important. Relatively few consider being a member of apolitical party or having Canadian-born friends as very important.
Age at Immigration and Length of Residency Differences
As proposed in the Introduction section of this report, the findings of this study confirm thatimmigrants who came to Canada at an older age (the migrant elder) and those who came toCanada at a younger age have different experiences. Compared with immigrants who came toCanada at a younger age, those who came at an older age are more likely to lack skillsessential to independent living in Canada (e.g., English, driving), to be more dependent ontheir children (e.g., for transportation, living in the homes of their children), to maintain thelifestyle of their homeland (e.g., in living arrangement, language spoken at home, notknowing people from other cultural or ethnic groups), and to have a stronger South Asianidentity. As almost all of these "migrant elders" came to Canada to be with their families, theyconsider having family and relatives close by as very important.
The Experiences of Immigrant Seniors
266
Among those immigrants who came to Canada at an older age, established immigrants (whohave been in Canada for more than 10 years) are better off financially. Recent immigrants,especially those not living with a spouse, are less likely to say that their income was adequate.Recent immigrants are much more likely to be ineligible for many government financialbenefits and are somewhat less aware of some of these benefits.
Apart from better financial circumstances, established immigrants who came to Canada at anolder age are not any more integrated than those who came recently. This suggests that age atimmigration has a greater influence on acculturation and integration than length of residency.Interestingly, there is some evidence that established immigrants are more likely than recentimmigrants to see themselves as more South Asian than Canadian.
Of the three groups of immigrant seniors, those who came to Canada at a younger age are themost acculturated to the Canadian way of life (e.g., living arrangement). They participate inthe Canadian society more actively (e.g., voting, meeting people from other cultural or ethnicgroup). These experiences are consistent with their motivation for immigrating to Canadawhen they were younger. Growing old in Canada is easier than spending old age in Canada asa relatively recent resident.
Sex Differences
In general, women are less integrated than men suggesting a multiple jeopardy effect (Novak& Campbell, 2001, p. 121) such that older, female recent immigrants are least integrated intoCanadian society. Compared with men, women without a spouse are much less likely to liveindependently. Women are less likely to have the skills essential for daily life in Canada (e.g.,English, driving), to participate in the mainstream society (e.g., voting, using community andrecreational facilities, knowing people from other cultural or ethnic groups). Women are lesslikely than men to see themselves, their children, or their grandchildren as more Canadianthan South Asian. On the other hand, men are much more likely than women to haveexperienced discrimination, which creates difficulty for integration into the mainstreamsociety.
Policy Implications
If our respondents in this small-sample survey were frank about their experiences as animmigrant in Canada, then it appears they are reasonably happy with their life in Canada. Tothose who came to Canada later in life, their family is their main source of support. It wouldmake sense for social and public policies to be directed towards helping these families, who inturn can help these seniors. However, when families fail to meet the needs of these seniors(e.g., when their sponsoring children lose their jobs), social agencies must step in to fill thevoid. The challenge is how to reach out to these seniors whose needs are not met by theirfamilies.
ReferencesNovak, M., & Campbell, L. (2001). Aging and society: A Canadian perspective (4th ed.).Scarborough, ON: Nelson Thomson Learning.

The Experiences of Immigrant Seniors
267

The Experiences of Immigrant Seniors
268

The Experiences of Immigrant Seniors
269
Appendix A
Interview Questionnaire
(English-language Version)
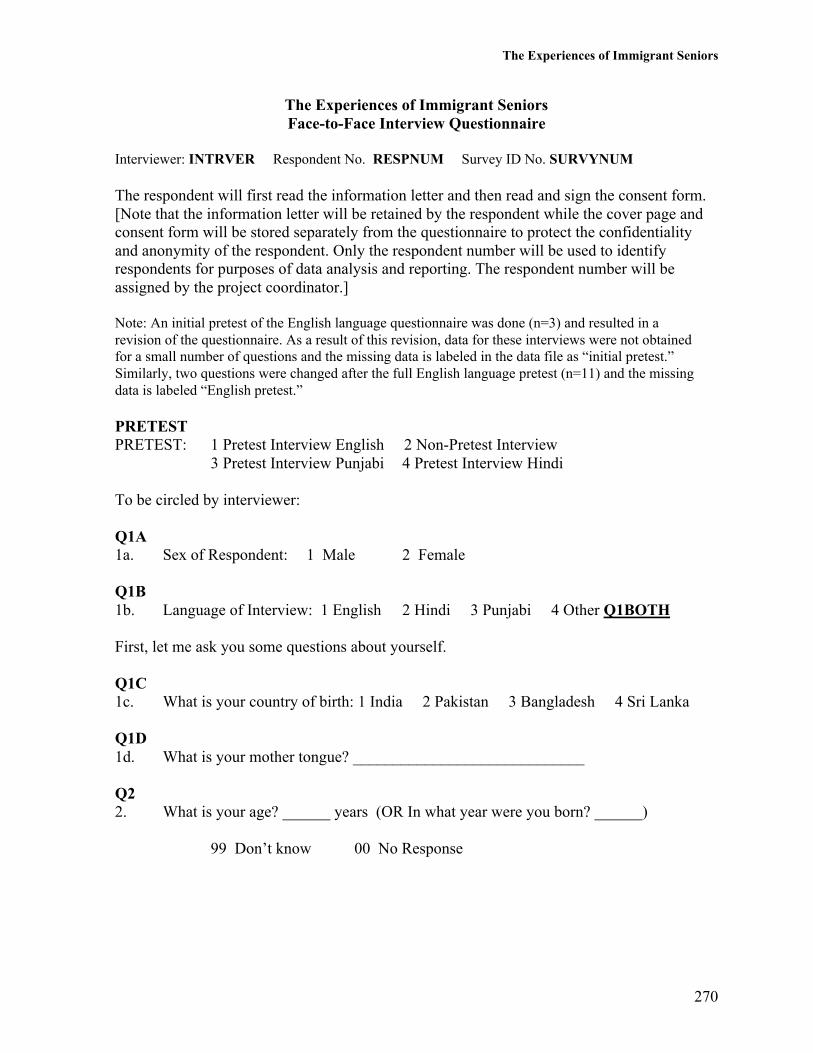
The Experiences of Immigrant Seniors
270
The Experiences of Immigrant SeniorsFace-to-Face Interview Questionnaire
Interviewer: INTRVER Respondent No. RESPNUM Survey ID No. SURVYNUM
The respondent will first read the information letter and then read and sign the consent form.[Note that the information letter will be retained by the respondent while the cover page andconsent form will be stored separately from the questionnaire to protect the confidentialityand anonymity of the respondent. Only the respondent number will be used to identifyrespondents for purposes of data analysis and reporting. The respondent number will beassigned by the project coordinator.]
Note: An initial pretest of the English language questionnaire was done (n=3) and resulted in arevision of the questionnaire. As a result of this revision, data for these interviews were not obtainedfor a small number of questions and the missing data is labeled in the data file as “initial pretest.”Similarly, two questions were changed after the full English language pretest (n=11) and the missingdata is labeled “English pretest.”
PRETESTPRETEST: 1 Pretest Interview English 2 Non-Pretest Interview
3 Pretest Interview Punjabi 4 Pretest Interview Hindi
To be circled by interviewer:
Q1A1a. Sex of Respondent: 1 Male 2 Female
Q1B1b. Language of Interview: 1 English 2 Hindi 3 Punjabi 4 Other Q1BOTH
First, let me ask you some questions about yourself.
Q1C1c. What is your country of birth: 1 India 2 Pakistan 3 Bangladesh 4 Sri Lanka
Q1D1d. What is your mother tongue? _____________________________
Q22. What is your age? ______ years (OR In what year were you born? ______)
99 Don’t know 00 No Response
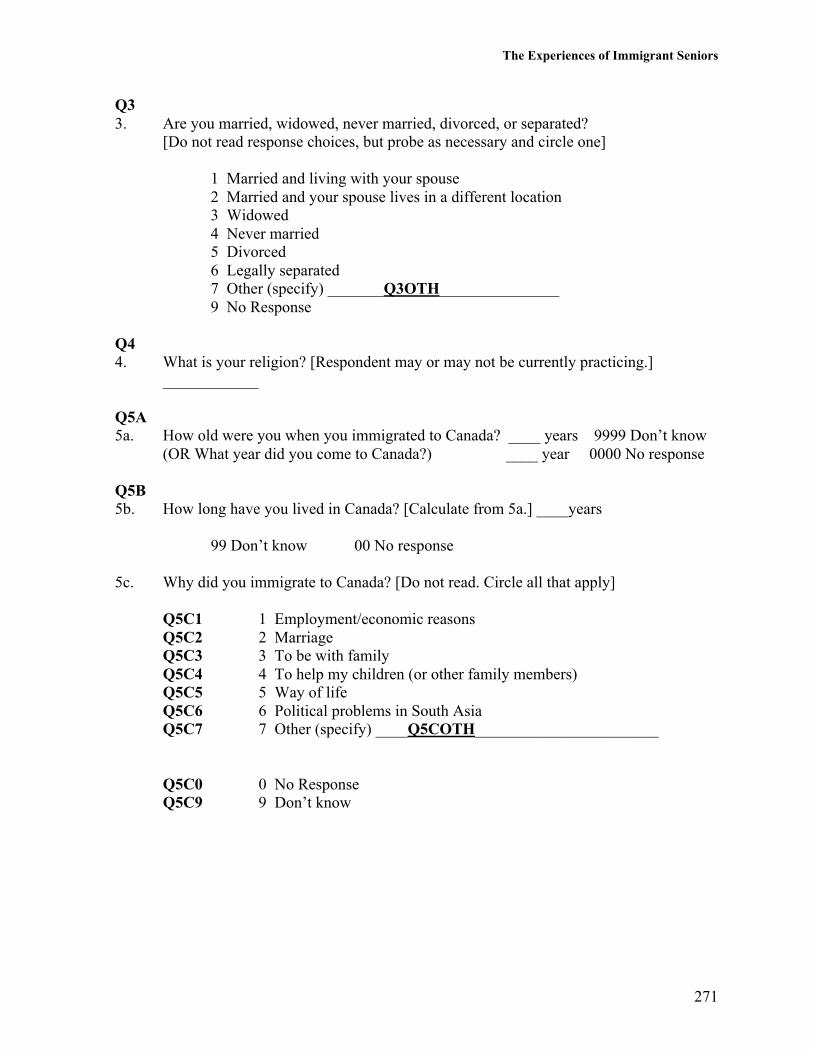
The Experiences of Immigrant Seniors
271
Q33. Are you married, widowed, never married, divorced, or separated?
[Do not read response choices, but probe as necessary and circle one]
1 Married and living with your spouse 2 Married and your spouse lives in a different location3 Widowed4 Never married5 Divorced 6 Legally separated7 Other (specify) _______Q3OTH_______________9 No Response
Q44. What is your religion? [Respondent may or may not be currently practicing.]
____________
Q5A5a. How old were you when you immigrated to Canada? ____ years 9999 Don’t know
(OR What year did you come to Canada?) ____ year 0000 No response
Q5B5b. How long have you lived in Canada? [Calculate from 5a.] ____years
99 Don’t know 00 No response
5c. Why did you immigrate to Canada? [Do not read. Circle all that apply]
Q5C1 1 Employment/economic reasonsQ5C2 2 MarriageQ5C3 3 To be with family Q5C4 4 To help my children (or other family members)Q5C5 5 Way of lifeQ5C6 6 Political problems in South AsiaQ5C7 7 Other (specify) ____Q5COTH_______________________
Q5C0 0 No ResponseQ5C9 9 Don’t know
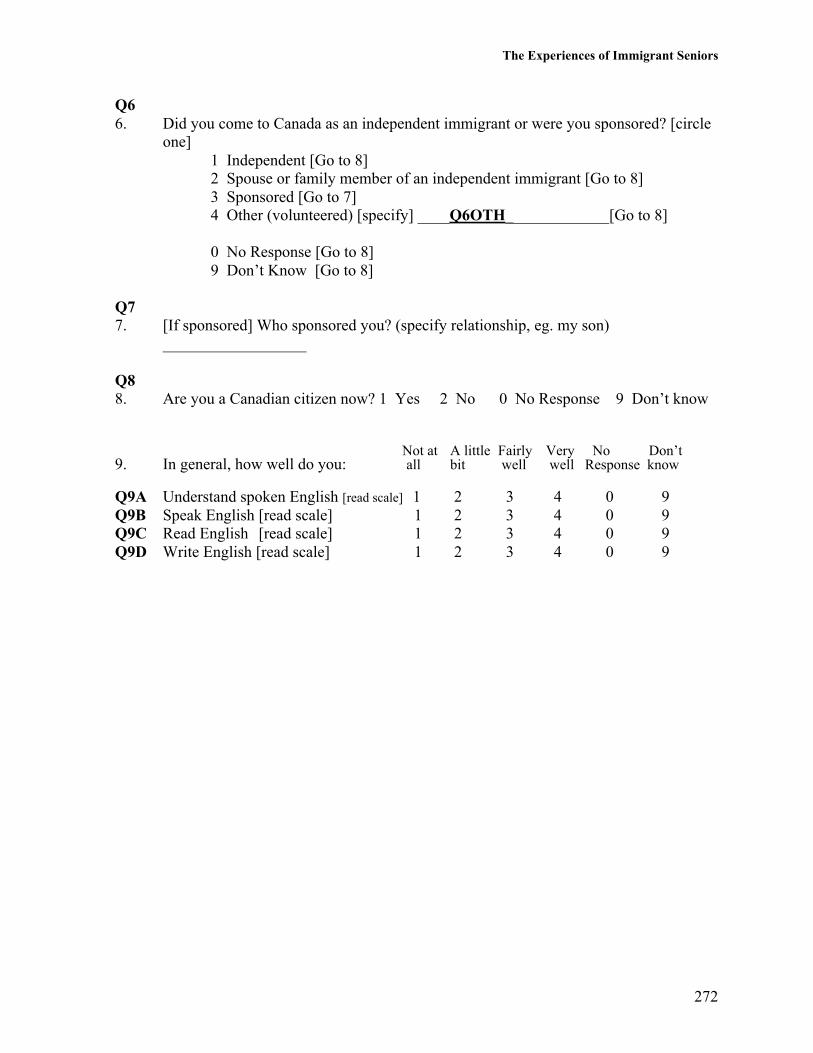
The Experiences of Immigrant Seniors
272
Q66. Did you come to Canada as an independent immigrant or were you sponsored? [circle
one]1 Independent [Go to 8]2 Spouse or family member of an independent immigrant [Go to 8]3 Sponsored [Go to 7]4 Other (volunteered) [specify] ____Q6OTH_____________[Go to 8]
0 No Response [Go to 8]9 Don’t Know [Go to 8]
Q77. [If sponsored] Who sponsored you? (specify relationship, eg. my son)
__________________
Q88. Are you a Canadian citizen now? 1 Yes 2 No 0 No Response 9 Don’t know
Not at A little Fairly Very No Don’t9. In general, how well do you: all bit well well Response know Q9A Understand spoken English [read scale] 1 2 3 4 0 9Q9B Speak English [read scale] 1 2 3 4 0 9Q9C Read English [read scale] 1 2 3 4 0 9Q9D Write English [read scale] 1 2 3 4 0 9
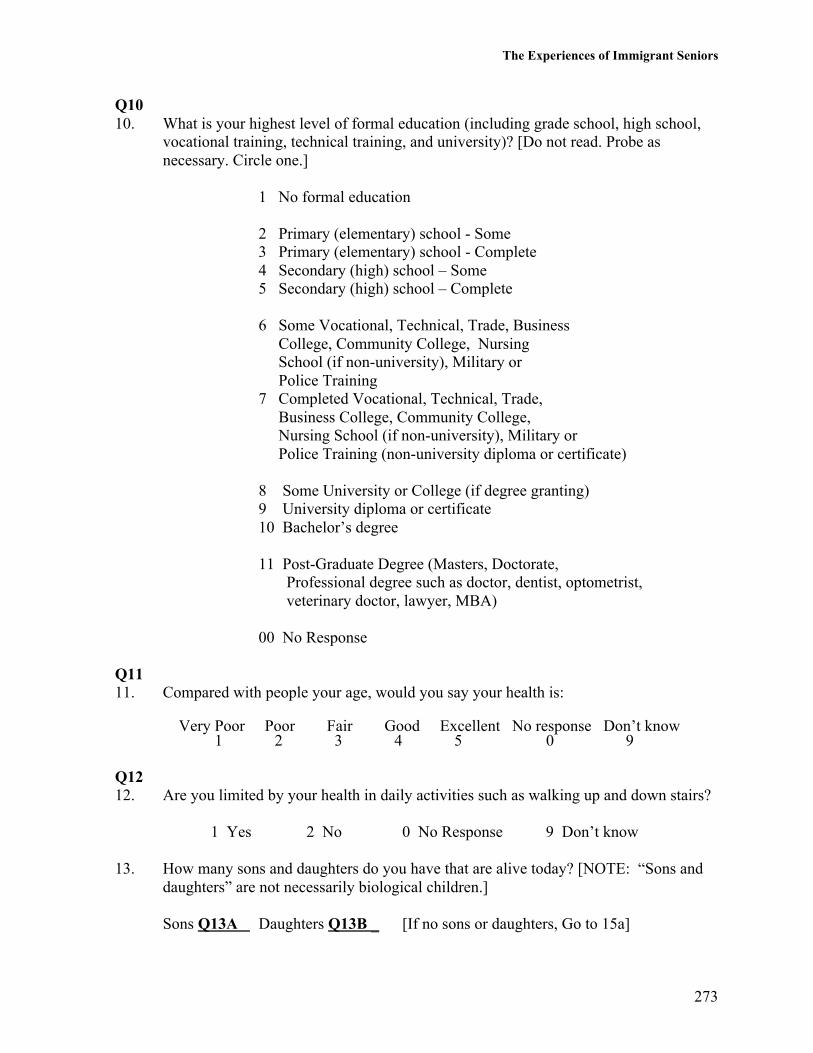
The Experiences of Immigrant Seniors
273
Q1010. What is your highest level of formal education (including grade school, high school,
vocational training, technical training, and university)? [Do not read. Probe asnecessary. Circle one.]
1 No formal education
2 Primary (elementary) school - Some 3 Primary (elementary) school - Complete 4 Secondary (high) school – Some 5 Secondary (high) school – Complete
6 Some Vocational, Technical, Trade, Business College, Community College, Nursing School (if non-university), Military or Police Training 7 Completed Vocational, Technical, Trade, Business College, Community College, Nursing School (if non-university), Military or Police Training (non-university diploma or certificate)
8 Some University or College (if degree granting)9 University diploma or certificate 10 Bachelor’s degree
11 Post-Graduate Degree (Masters, Doctorate, Professional degree such as doctor, dentist, optometrist, veterinary doctor, lawyer, MBA)
00 No Response
Q1111. Compared with people your age, would you say your health is:
Very Poor Poor Fair Good Excellent No response Don’t know 1 2 3 4 5 0 9
Q1212. Are you limited by your health in daily activities such as walking up and down stairs?
1 Yes 2 No 0 No Response 9 Don’t know
13. How many sons and daughters do you have that are alive today? [NOTE: “Sons anddaughters” are not necessarily biological children.]
Sons Q13A Daughters Q13B _ [If no sons or daughters, Go to 15a]
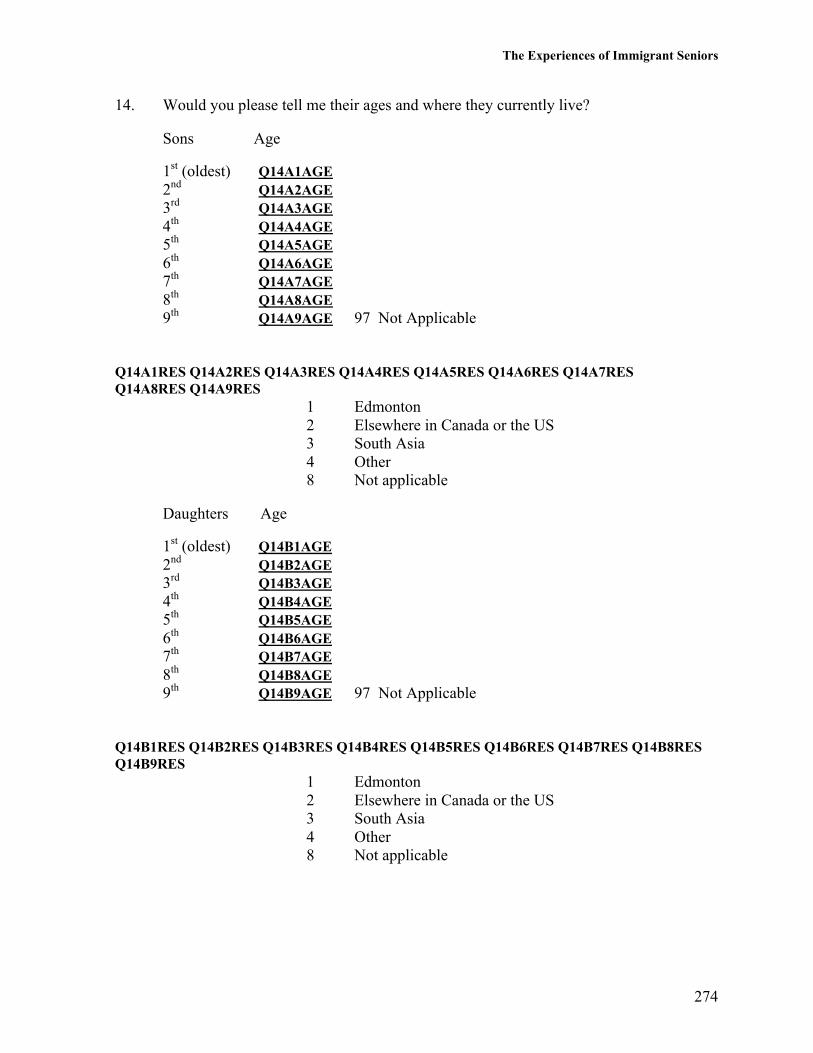
The Experiences of Immigrant Seniors
274
14. Would you please tell me their ages and where they currently live?
Sons Age
1st (oldest) Q14A1AGE 2nd Q14A2AGE3rd Q14A3AGE4th Q14A4AGE5th Q14A5AGE6th Q14A6AGE7th Q14A7AGE 8th Q14A8AGE9th Q14A9AGE 97 Not Applicable
Q14A1RES Q14A2RES Q14A3RES Q14A4RES Q14A5RES Q14A6RES Q14A7RESQ14A8RES Q14A9RES
1 Edmonton2 Elsewhere in Canada or the US3 South Asia4 Other8 Not applicable
Daughters Age
1st (oldest) Q14B1AGE2nd Q14B2AGE3rd Q14B3AGE4th Q14B4AGE5th Q14B5AGE6th Q14B6AGE7th Q14B7AGE8th Q14B8AGE9th Q14B9AGE 97 Not Applicable
Q14B1RES Q14B2RES Q14B3RES Q14B4RES Q14B5RES Q14B6RES Q14B7RES Q14B8RESQ14B9RES
1 Edmonton2 Elsewhere in Canada or the US3 South Asia4 Other8 Not applicable
The Experiences of Immigrant Seniors
275
Q15A15a. How many grandchildren do you have? ____ [If 0, Go to 17]
98 No Response 99 Don’t knowQ15B15b. How many grandchildren do you have living in the Edmonton area? ___ [If 0, Go to 17]
98 No Response 99 Don’t know 97 Not Applicable
Q15C15c. What is the age of the youngest grandchild living in the Edmonton area?____
98 No Response 99 Don’t know 97 Not Applicable
Q15D15d. What is the age of the oldest grandchild living in the Edmonton area? ____
98 No Response 99 Don’t know 97 Not ApplicableQ16A16a. In what ways, if any, do you help your grandchildren who live in the Edmonton area?
[probe as necessary: baby sit/provide childcare, contribute financially, emotionally,culturally, teach religion, teach language, provide recreation, etc.]____________________________________________________________________
____________________________________________________________________
Q16B16b. In what ways, if any, do your grandchildren who live in the Edmonton area help you?
[probe as necessary: help with home maintenance, drive you places, take youshopping, translate for you, give you emotional support, etc.]_____________________________________________________________________
_____________________________________________________________________
Q1717. Besides your children and grandchildren, how many other family members and
relatives do you have living in the Edmonton area? [NOTE: This could includeparents, uncles, aunts, brothers, sisters, cousins, nieces, nephews, in-laws.] _______
96 Many - not specified 98 No Response 99 Don’t know

The Experiences of Immigrant Seniors
276
Q18A18a. Are you [circle one]:
1 Working at a job or self-employed? 2 Retired and looking for paid work?3 Retired and not looking for paid work?4 Unemployed and looking for paid work? 5 Keeping house
0 No response
Q18B18b. What was your last primary occupation before you came to Canada?
____________________________________________________________________
Q18C18c. What was your last primary occupation in Canada? ___________________________
[Indicate if respondent has never worked outside of the home.]
Q18D18d. To what extent does/did your occupation in Canada give you the opportunity to meet
people from other ethnic or cultural groups (for example, people with European,Chinese, African or other backgrounds)? [NOTE: If respondent says “sometimes”when using this scale, ask if that is “occasionally” or “frequently”.]
Never Occasionally Frequently All of the time Don’t know No response 1 2 3 4 9 0
Q19A19a. Is your spouse [circle one]:
1 Working at a job or self-employed?2 Retired and looking for paid work?3 Retired and not looking for paid work?4 Unemployed and looking for paid work? 5 Keeping house6 Deceased/Divorced/Separated
8 Not applicable (never married) [Go to 21]0 No response

The Experiences of Immigrant Seniors
277
Q19B19b. What was your spouse’s last primary occupation before he/she came to Canada?
___________________________________________________________________
Q19C19c. What was your spouse’s last primary occupation in Canada?
___________________________________________________________________[Indicate if spouse never worked outside of the home.]
Q2020. Is your personal income as a couple adequate for your needs?
1 Yes [Go to 22]2 No [Go to 22]
6 Not Applicable (Never Married)8 Separated/Divorced/Widowed [Go to 21]9 Don’t know0 No response
Q2121. [If not living with a spouse] Is your personal income from all sources (including
government programs) adequate for your needs?
1 Yes 2 No 0 No response 9 Don’t know 8 Not Applicable
22. Here in Canada, many older persons receive financial benefits from the government.Are you aware of the following benefits and do you receive the following benefitsfrom the government?
Old Age SecurityQ22A1 Aware 1 yes 2 no 0 No response
Q22A2 Do you Receive 1 yes 2 no 0 No response
The Experiences of Immigrant Seniors
278
Guaranteed Income Supplement
Q22B1 Aware 1 yes 2 no 0 No response
Q22B2 Do you Receive 1 yes 2 no 0 No response
Spouses Allowance
Q22C1 Aware 1 yes 2 no 0 No response
Q22C2 Do you Receive 1 yes 2 no 0 No response
Widowed Persons Allowance
Q22D1 Aware 1 yes 2 no 0 No response
Q22D2 Do you Receive 1 yes 2 no 0 No response
Canada Pension Plan
Q22E1 Aware 1 yes 2 no 0 No response
Q22E2 Do you Receive 1 yes 2 no 0 No response
Alberta Seniors Benefit Program
Q22F1 Aware 1 yes 2 no 0 No response
Q22F2 Do you Receive 1 yes 2 no 0 No response
Home Repair/Modification Programs
Q22G1 Aware 1 yes 2 no 0 No response
Q22G2 Do you Receive 1 yes 2 no 0 No response
Seniors Apartments and Lodges
Q22H1 Aware 1 yes 2 no 0 No response
Q22H2 Do you Receive 1 yes 2 no 0 No response
Other financial benefits from government
Q22I1 Aware 1 yes 2 no 0 No response
Q22I2 Do you Receive 1 yes 2 no 0 No response
The Experiences of Immigrant Seniors
279
Q2323. How can the government increase the awareness of seniors such as yourself about the
benefit programs offered by the government? _______________________________
____________________________________________________________________
Q2424. Do you receive a pension of your own, separate from the benefits listed above?
1 Yes 2 No 0 No response 9 Don’t know
Q2525. Do you have control over your own money?
1 Yes 2 No 0 No response 9 Don’t know
Q26A26a. In the last year, did you give any money to someone in your family?
1 Yes 2 No 0 No response 9 Don’t know
Q26B26b. [If no, circle 1; if yes, ask:] How often?
Never Occasionally Frequently All of the time Don’t No Not Know Response Applicable
1 2 3 4 9 0 8
Q26C 26c. In the last year, did you receive any money from someone in your family?
1 Yes 2 No 0 No response 9 Don’t know
Q26D26d. [If no, circle 1; if yes, ask:] How often?
Never Occasionally Frequently All of the time Don’t No NotKnow Response Applicable
1 2 3 4 9 0 8
The Experiences of Immigrant Seniors
280
The next questions are about your housing and living arrangements.
Q2727. How many persons live in this house/apartment, beside you? ____ [If 0, Go to 29]
97 No response
28. Who are they? [check all that apply and indicate number, ages and occupation of thoseother than spouse.]
Q28A Spouse _____Current Occupation
Q28B Sons _____ Age(s) Q28BAGE1,2,3 _Q28BOCC1,2,3____Q28C Daughters _____ Age(s) Q28CAGE1,2,3 Q28COCC1,2,3____Q28D Sons-in-law _____ Age(s) Q28DAGE1____ _Q28DOCC1__ ___Q28E Daughters-in-law ___ Age(s) Q28EAGE1 _ _Q28EOCC1 Q28F Grandchildren _____ Age(s) Q28FAGE1,2,3,4,5 Q28FOCC1,2,3,4,5Q28G Other relatives
(specify) Q28GLIST Age (s) Q28GAGE1__ Q28GOCC1__Q28H Non-relatives
(specify) Q28HLIST Age (s) Q28HAGE1____ Q28HOCC1__|________________________| |___________________|0 None 9 Not Applicable 97 Not Applicable
Q2929. Would you prefer a different living arrangement?
1 Yes [Go to 30a]2 No [Go to 31]
9 Don’t know0 No Response
The Experiences of Immigrant Seniors
281
Q30A30a. [If Yes] Who would you prefer to live with? [Do not read. Circle one]
1 Family/Relatives2 Non-relatives3 Alone4 Other (specify) Q30AOTH9 Don’t know0 No Response8 Not Applicable
Q30B30b. What prevents you from having your preferred living arrangement? [Probe as
necessary: no adult children in Canada, no relatives or friends to share household, toocostly/can’t afford to, not enough room, health problems, do not want to be alone,language problem, cultural reasons, shame]____________________________________________________________________
____________________________________________________________________
Q3131. [Do not ask this question if respondent lives alone] How often do you eat with
members of this household?
1 More than once a day 2 Once a day 3 Less than once a day
8 Not Applicable (live alone) 9 Don’t know 0 No Response
Q3232. [Do not ask this question if respondent lives alone or with their spouse only.]
In what ways do you contribute to this household? [probe as necessary: provide childcare, prepare meals, do housework, do gardening/yard work, contribute to rent ormortgage payment or other household expenses]_____________________________________________________________________
_____________________________________________________________________
The Experiences of Immigrant Seniors
282
Q3333. [Interviewer to fill this out if interview takes place in respondent’s home. If not, ask.]
In which part of Edmonton do you live? ___________________________________
Q3434. [To be circled by interviewer. Ask only if not interviewed at home.] What type of
housing do you live in?
1 Single-detached house2 Duplex, townhouse, or row housing 3 Apartment in a multi-unit building4 Other (specify): ____Q34OTH_______
9 Don’t know0 No response
Q35A35a. Do you (or your family) own this place, or are you renting?
1 Own 2 Rent 9 Don’t know 0 No response
Q35B35b. Who owns/rents this place:
1 You (or your spouse)2 Both you and your spouse3 Your child(ren)4 Both you (or your spouse) and your child(ren)5 Other (specify) ____Q35BOTH__________
7 Initial pretest9 Don’t know0 No response
Q3636. How many bedrooms are there in your home? _________
[NOTE: a bedroom is any room used for sleeping, as defined by the respondent] 99 Don’t know 00 No Response
The Experiences of Immigrant Seniors
283
Q3737. Do you consider your dwelling to be too large, just right, or too small for you (and
your family)? 1 Too large
2 Just right3 Too small
9 Don’t know0 No response
Q3838. Would you prefer to live in a different building or facility?
1 Yes [Go to 39a]2 No [Go to 40]
9 Don’t know0 No Response
Q39A39a. What kind of building or facility would you prefer to live in? [Do not read. Circle one.]
1 single-detached house [Go to 39c]2 duplex, townhouse, or row housing [Go to 39c]3 apartment in a multi-unit building [Go to 39c]4 seniors apartment [Go to 39b]5 seniors lodge [Go to 39b]6 assisted living [Go to 39b]7 nursing home [Go to 39b]8 Other (specify) Q39AOTH_______________
97 Not Applicable98 No response [Go to 39c]99 Don’t Know [Go to 39c]
Q39B39b. Would you prefer this facility to be specifically for people with your cultural
background?
1 Yes 2 No 0 No response 8 Not Applicable 9 Don’t know
The Experiences of Immigrant Seniors
284
Q39C39c. What prevents you from living in the building or facility you prefer to live in?
[probe as necessary: no relatives or friends to share household, too costly/can’t affordto, health problems, do not want to be alone, language problem, cultural reasons]____________________________________________________________________
____________________________________________________________________
Q4040. What would you say is the condition of this place/the dwelling you are in?
Very Poor Poor Fair Good Excellent No response Don’t know 1 2 3 4 5 0 9
Q4141. Overall, how satisfied or dissatisfied are you with your housing?
1 Very satisfied2 Satisfied 3 Neither satisfied nor dissatisfied4 Dissatisfied5 Very dissatisfied
9 Don’t know0 No response
Q4242. Does this house/apartment allow you to maintain those aspects of your culture that you
wish to keep, for example, your worship, the foods you like to eat, seeing friends,listening to music?
1 Yes [Go to 44] 2 No 9 Don’t know 0 No response
Q4343. [If no] What is it about this place that prevents you from maintaining your culture? [probe if necessary: restrictions regarding worship, restrictions regarding cooking,
space limitations, difficulty entertaining/having visitors]
______________________________________________________________________
______________________________________________________________________

The Experiences of Immigrant Seniors
285
Q4444. How often do you get out of your home in the summer?
1 Daily2 Several times a week3 Weekly (at least once a week)4 Several times a month5 Monthly (at least once a month)6 Almost never
9 Don’t know0 No response
Q4545. How often do you get out of your home in the winter?
1 Daily2 Several times a week3 Weekly (at least once a week)4 Several times a month5 Monthly (at least once a month)6 Almost never
7 Initial pretest9 Don’t know0 No response
Q4646. Do you go out by yourself in your neighborhood ? [NOTE: “Neighborhood” is
defined as the area within 4-5 blocks of where the respondent lives.]
1 Yes 2 No [Go to 48a] 0 No response
The Experiences of Immigrant Seniors
286
Q47A47a. How safe or unsafe do you feel walking by yourself in your neighborhood?
1 Very safe2 Somewhat safe 3 Somewhat unsafe4 Very unsafe
8 Not Applicable9 Don’t know0 No response [Go to 48a]
Q47B47b. Why do you feel this way?
____________________________________________________________________
____________________________________________________________________
Q48A48a. How safe or unsafe do you feel staying at home by yourself?
1 Very safe 2 Somewhat safe 3 Somewhat unsafe 4 Very unsafe
9 Don’t know0 No response [Go to 49]
Q48B48b. Why? ________________________________________________________
Q4949. In general, how satisfied or dissatisfied are you with your neighborhood?
1 Very satisfied2 Satisfied3 Neither satisfied nor dissatisfied 4 Dissatisfied5 Very dissatisfied
9 Don’t know0 No response
The Experiences of Immigrant Seniors
287
Now I would like to ask you about discrimination you and/or your family may haveexperienced in your community.
Q5050. Did you experience any discrimination when you or your family was looking for
housing?
1 Yes 2 No [Go to 52] 9 Don’t know [Go to 52] 0 No response [Go to 52]
Q5151. [If yes] In what way? __________________________________________________
____________________________________________________________________
Q5252. Have you or your family experienced any discrimination while living in thisneighborhood?
1 Yes 2 No [Go to 56] 9 Don’t know [Go to 56] 0 No response [Go to 56]
Q5353. If yes, can you briefly describe one such incident? ___________________________
____________________________________________________________________
Q5454. How has being discriminated against made you feel? _________________________
____________________________________________________________________
Q55A55a. Has discrimination interfered with your daily activities?
1 Yes 2 No [Go to 56] 8 Not Applicable 9 Don’t know [Go to 56]
0 No response [Go to 56]
Q55B55b. [If yes] How? ________________________________________________________
____________________________________________________________________

The Experiences of Immigrant Seniors
288
Next, I would like to ask you some questions about your access to services and how easy it isfor you to get around in your community.
56. Are the following close by your home?
Q56A A grocery store 1 yes 2 no 9 Don’t know 0 No response
Q56B A pharmacy 1 yes 2 no 9 Don’t know 0 No response
Q56C A bank 1 yes 2 no 9 Don’t know 0 No response
Q56D A medical clinic/ doctor’s office 1 yes 2 no 9 Don’t know 0 No response
Q56E A bus stop 1 yes 2 no 9 Don’t know 0 No response
Q5757. Do you have a valid Alberta driver’s license?
1 Yes 2 No 0 No response
Q5858. Do you have the use of a vehicle?
1 Yes 2 No 0 No response

The Experiences of Immigrant Seniors
289
59. When you are going someplace that is too far to walk, how do you usually get there?[Do not read. Circle all that apply]
Q59A 1 Drive yourselfQ59B 2 Get a ride from someone in your homeQ59C 3 Get a ride from family or friends who do not live in your homeQ59D 4 Call a taxi cabQ59E 5 Take a bus or LRTQ59F 6 DATSQ59G 7 I don’t go/nobody to take me
Q59H 9 Don’t knowQ59I 0 No response
Q60A60a. How difficult or easy is it for you to get to places you need to go to?
1 Very difficult [Go to 60b]2 Somewhat difficult [Go to 60b]3 Neither difficult nor easy [Go to 61]4 Somewhat easy [Go to 61]5 Very easy [Go to 61]
9 Don’t know [Go to 61]0 No response [Go to 61]
Q60B60b. Why? _____________________________________________________________
__________________________________________________________________
Now, I would like to ask you about the activities you are involved in, including those of acommunity or recreational nature.
Q6161. Currently, are you doing any volunteer work? 1 Yes [Go to 62] 2 No [Go to 63a]
0 No Response [Go to 63a]
Q6262. What do you do? [Probe for what, where and how often]
____________________________________________________________________
____________________________________________________________________

The Experiences of Immigrant Seniors
290
Q62B What do you do? Continued…….
Q63A63a. Do you participate in any social groups such as a seniors’ group, a religious group, a
community center, an ethnic or immigrant association, a cultural group, or a social,civic or service club?
1 Yes [Go to 64a] 2 No [Go to 63b] 0 No response [Go to 65]
Q63B63b. Why is that?
____________________________________________________________________
____________________________________________________________________[Go to 65]
Q64A64a. In the past 12 months, how often did you participate in these activities?
1 Daily2 Several times a week3 Weekly (at least once a week)4 Several times a month5 Monthly (At least once a month)6 Several times a year7 Yearly (At least once a year)8 Not at all
9 Don’t know0 No response97 Not applicable
Q64B64b. Is this level of activity satisfactory to you?
1 Yes 2 No 0 No response [Go to 65] 7 Initial pretest
Q64C
64c. Why or why not?
____________________________________________________________________
____________________________________________________________________

The Experiences of Immigrant Seniors
291
Q65
65. What community and recreational services do you use? We are referring to suchservices as English language classes, physical exercise programs such as Yoga oraquasize, library services, health education seminars, handicraft programs, and thelike.
[If none, go to 69]____________________________________________________________________
____________________________________________________________________
Q66A66a. How difficult or easy is it for you to use these services in the summer?
1 Very difficult2 Somewhat difficult3 Neither difficult nor easy4 Somewhat easy5 Very easy
8 Not Applicable9 Don’t know0 No response
Q66B66b. How difficult or easy is it for you to use these services in the winter?
1 Very difficult2 Somewhat difficult3 Neither difficult nor easy4 Somewhat easy5 Very easy
7 Initial pretest8 Not applicable9 Don’t know0 No response
Q6767. What makes it difficult or easy for you to use these services?
___________________________________________________________________
___________________________________________________________________
The Experiences of Immigrant Seniors
292
Q6868. What can be done to help you use these services? ___________________________
___________________________________________________________________
Q6969. In the past, how have you learned about community and recreational services that are
of interest to you?___________________________________________________________________
___________________________________________________________________
The next questions ask about your social contacts and satisfaction with life.
Q70A70a. In a typical day, about how many waking hours are you alone in this house/apartment?
_____ hours 98 No response 99 Don’t know
Q70B70b. Would you like more time alone, less time alone, or the same amount of time alone?
1 More time alone2 Less time alone3 Same amount of time alone
7 Initial pretest9 Don’t know0 No response
Q7171. How many people from other ethnic and cultural groups do you know (for example,
people with European, Chinese, African or other backgrounds)?
1 Many2 Some3 None
7 English pretest (Note: Question was changed and data for English pretest group is excluded.)
9 Don’t know0 No response
The Experiences of Immigrant Seniors
293
Q72A72a. How often do you have contact by phone, letter or e-mail with family, friends, or
relatives? [NOTE: These contacts are with people in Edmonton or elsewhere.]
1 Daily2 Several times a week3 Weekly (at least once a week)4 Several times a month5 Monthly (At least once a month)6 Several times a year7 Yearly (At least once a year)8 Not at all
9 Don’t know0 No response
Q72B72b. Would you like more contact (by phone, letter or email), less contact, or the same
amount of contact with family, friends, or relatives?
1 More contact2 Less contact3 Same amount of contact
9 Don’t know0 No response
Q73A73a. How often do you visit (face-to-face) with family, friends, or relatives in Edmonton?
1 Daily2 Several times a week3 Weekly (at least once a week)4 Several times a month5 Monthly (At least once a month)6 Several times a year7 Yearly (At least once a year)8 Not at all/Not Applicable (no family or friends in Edmonton) [Specify]
____Q73AOTH____ [Go to 73B]
9 Don’t know0 No response

The Experiences of Immigrant Seniors
294
Q73B73b. Would you like more visits, fewer visits, or the same amount of visits with family,
friends, or relatives in Edmonton?
1 More visits2 Fewer visits3 Same amount of visits
8 Not applicable9 Don’t know0 No response
Q74A74a. Do you have someone you confide in, or talk to about your private feelings or
concerns?
1 Yes [If yes] Who? (relationship) ____Q74AWHO_____2 No
9 Don’t know0 No response
Q74B74b. Do you have someone you can really count on to help you out in a crisis situation?
1 Yes [If yes] Who? (relationship) ____Q74BWHO____2 No
9 Don’t know0 No response
Q74C74c. Do you have someone you can really count on to give you advice when you are
making important personal decisions?
1 Yes [If yes] Who? (relationship) ____ Q74CWHO____2 No
9 Don’t know0 No response
The Experiences of Immigrant Seniors
295
Q74D74d. Do you have someone that makes you feel loved?
1 Yes [If yes] Who? (relationship) ____ Q74DWHO____2 No
9 Don’t know0 No response
Q7575. Thinking of seniors (60 years of age and older) who were born in South Asia that you
know in the Edmonton area, are you aware of any who seem to be lonely?
1 Yes [Go to 76]2 No [Go to 79]
9 Don’t know [Go to 79]0 No response [Go to 79]
Q7676. How many persons are you thinking of? ___________
94 One family 95 A few – not specified96 Many – not specified 97 Not applicable
Q7777. Why do you think that this person is (these persons are) lonely? ________________
___________________________________________________________________
Q7878. What do you think needs to be done for this person (these persons)?
___________________________________________________________________
___________________________________________________________________
Q7979. How often do you feel lonely?
Never Occasionally Frequently All of the time Don’t know No response 1 2 3 4 9 0
The Experiences of Immigrant Seniors
296
80. To what extent do people in your family: [NOTE: “People” can be a spouse, childrenor other family members.]
Q80A a. Ask for your opinion (advice/guidance)?
Never Occasionally Frequently All of the time Don’t know No response 1 2 3 4 9 0
Q80B b. Respect your decisions (let you have your way)?
Never Occasionally Frequently All of the time Don’t know No response 1 2 3 4 9 0
Q80C c. Share your values?
Never Occasionally Frequently All of the time Don’t know No response 1 2 3 4 9 0
Q80D d. Make it easy for you to eat the kind of food you like?
Never Occasionally Frequently All of the time Don’t know No response 1 2 3 4 9 0
Q80E e. Make it easy for you to practice your customs and traditions withinyour family? [This can include having a place for prayer.]
Never Occasionally Frequently All of the time Don’t know No response 1 2 3 4 9 0
Q80F f. Ensure that you get enough rest and are not overworked?
Never Occasionally Frequently All of the time Don’t know No response 1 2 3 4 9 0

The Experiences of Immigrant Seniors
297
Q80G g. Take care of you when you are sick?
Never Occasionally Frequently All of the time Don’t know No response 1 2 3 4 9 0
Q80H h. Ensure that you get a good diet and medication, if necessary?
Never Occasionally Frequently All of the time Initial pretest Don’t know No response 1 2 3 4 7 9 0
Q80I i. Ensure that you get enough exercise?
Never Occasionally Frequently All of the time Initial pretest Don’t know No response 1 2 3 4 7 9 0
Q8181. How satisfied or dissatisfied do you feel about your life as a whole?
1 Very satisfied2 Satisfied 3 Neither satisfied nor dissatisfied4 Dissatisfied5 Very dissatisfied
9 Don’t know0 No response
The next questions ask about how you feel about being part of Canadian society.
82. Currently, how concerned are you with each of the following issues? Please answer ona scale of 1 to 5 where 1 means “not at all concerned” and 5 means “very concerned.”How concerned are you with:
Q82Aa. Money (personal/family income)?
Not at all Concerned Very Concerned Don’t know No Response1 2 3 4 5 9 0

The Experiences of Immigrant Seniors
298
Q82Bb. Friends, family, or relatives outside Canada?
Not at all Concerned Very Concerned Don’t know No Response1 2 3 4 5 9 0
Q82Cc. Being part of Canadian society?
Not at all Concerned Very Concerned Don’t know No Response1 2 3 4 5 9 0
Q82Dd. Prejudice and discrimination in Canada?
Not at all Concerned Very Concerned Don’t know No Response1 2 3 4 5 9 0
Q82Ee. The general quality of family life in Canada?
Not at all Concerned Very Concerned Don’t know No Response1 2 3 4 5 9 0
Q82Ff. Moral standards in Canada?
Not at all Concerned Very Concerned Don’t know No Response1 2 3 4 5 9 0
The Experiences of Immigrant Seniors
299
83. Now, for each of the following, please tell me how important you think each is forliving in Canada. Please answer on a scale of 1 to 5, where 1 means “not at allimportant” and 5 means “very important.” How important for your life in Canada is:
Q83Aa. Having family and relatives close by
Not at all Important Very Important Don’t know No Response1 2 3 4 5 9 0
Q83Bb. Having friends from the same cultural background
Not at all Important Very Important Don’t know No Response1 2 3 4 5 9 0
Q83Cc. Feeling welcome in Canada
Not at all Important Very Important Don’t know No Response1 2 3 4 5 9 0
Q83Dd. Having Canadian-born friends
Not at all Important Very Important Don’t know No Response1 2 3 4 5 9 0
Q83Ee. Knowing English
Not at all Important Very Important Don’t know No Response1 2 3 4 5 9 0
Q83Ff. Having Canadian citizenship
Not at all Important Very Important Don’t know No Response1 2 3 4 5 9 0

The Experiences of Immigrant Seniors
300
Q83Gg. Being a member of a political party
Not at all Important Very Important Don’t know No Response1 2 3 4 5 9 0
Q83Hh. Having a source of income
Not at all Important Very Important Initial pretest Don’t know No response1 2 3 4 5 7 9 0
Q83Ii. Having a job [NOTE: This includes self-employment.]
Not at all Important Very Important Don’t know No Response1 2 3 4 5 9 0
Q84A84a. How often do you vote in city elections?
Never Occasionally Frequently All of the time Not Eligible Don’t know No response 1 2 3 4 5 9 0
Q84B84b. How often do you vote in provincial elections?
Never Occasionally Frequently All of the time Not Eligible Don’t know No response 1 2 3 4 5 9 0
Q84C84c. How often do you vote in federal elections?
Never Occasionally Frequently All of the time Not Eligible Don’t know No response 1 2 3 4 5 9 0
The Experiences of Immigrant Seniors
301
85. I would like to ask you about your contact with family and friends who live in yourhomeland. How often do you have contact with these people by:
Q85A
a. long-distance telephone
Never Occasionally Frequently All of the time Don’t know No response
1 2 3 4 9 0
Q85Bb. electronic mail/or fax
Never Occasionally Frequently All of the time Don’t know No response 1 2 3 4 9 0
Q85C
c. letter
Never Occasionally Frequently All of the time Initial pretest Don’t know No response 1 2 3 4 7 9 0
Q85D
d. them visiting you in Edmonton
Never Occasionally Frequently All of the time Initial pretest Don’t know No response 1 2 3 4 7 9 0
Q85E
e. visiting them in your homeland
Never Occasionally Frequently All of the time Don’t know No response 1 2 3 4 9 0

The Experiences of Immigrant Seniors
302
Q86
86. Do you think you would ever move back to your homeland? Please answer on a scaleof 1 to 5 where l means “highly unlikely” and 5 means “I plan to return.”
Highly Unlikely I Plan to Return Don’t know No response1 2 3 4 5 9 0
Q87A87a. Sometimes people who settle in a new country feel that, at the end of life, it is
preferable to die in one’s homeland. How much is this a concern of yours? Pleaseanswer on a scale of 1 to 5, where 1 means “not at all concerned” and 5 means “veryconcerned.”
Not at all Concerned Very Concerned Don’t know No Response1 2 3 4 5 9 0
Q87B87b. Why is that?
____________________________________________________________________
____________________________________________________________________
Q88A88a. Do you live in Canada all year long?
1 Yes [Go to 89a] 2 No 0 No response [Go to 89a]
Q88B88b. [If no] What other country or countries do you live in? ______________________
Q89A89a. In the past five years, how many times have you been to your homeland? ____ [If 0,
go to 90]98 No response 99 Don’t know
Q89B89b. Thinking of the past five years, how long was your average stay in your homeland?
_____ days 97 Not applicable 98 No response 99 Don’t know

The Experiences of Immigrant Seniors
303
90. I would like to ask you some questions about your day-to-day life. How frequently doyou:
Q90Aa. wear clothing that is distinctive to South Asia when you are outside your home?
Never Occasionally Frequently All of the time Initial pretest Don’t know No response1 2 3 4 7 9 0
Q90Bb. eat food that is distinctive to South Asia?
Never Occasionally Frequently All of the time Don’t know No response 1 2 3 4 9 0
Q90Cc. celebrate holidays traditional to South Asia?
Never Occasionally Frequently All of the time Don’t know No response 1 2 3 4 9 0
Q90Dd. watch South Asian videos or movies?
Never Occasionally Frequently All of the time Don’t know No response 1 2 3 4 9 0
Q90Ee. listen to South Asian radio?
Never Occasionally Frequently All of the time Don’t know No response 1 2 3 4 9 0
Q90Ff. watch South Asian TV?
Never Occasionally Frequently All of the time Don’t know No response 1 2 3 4 9 0
Q90Gg. read local South Asian newspapers
Never Occasionally Frequently All of the time Initial pretest Don’t know No response 1 2 3 4 7 9 0

The Experiences of Immigrant Seniors
304
Q90Hh. visit South Asian internet web sites
Never Occasionally Frequently All of the time Don’t know No response 1 2 3 4 9 0
Q90Ii. listen to, view, or participate in South Asian music, dance or art
Never Occasionally Frequently All of the time Don’t know No response 1 2 3 4 9 0
Q90Jj. speak your (native) language or dialect
Never Occasionally Frequently All of the time Don’t know No response 1 2 3 4 9 0
Q90Kk. practice your religion
Never Occasionally Frequently All of the time Don’t know No response 1 2 3 4 9 0
Q90Ll. read newspapers such as the Edmonton Journal or Globe & Mail
Never Occasionally Frequently All of the time Don’t know No response 1 2 3 4 9 0
91. Have you anglicised your name, that is:
Q91Aa. Have you changed your name (either formally or informally)?
1 Yes 2 No 0 No response 9 Don’t know
Q91Bb. Have you changed the spelling of your name?
1 Yes 2 No 0 No response 9 Don’t know
The Experiences of Immigrant Seniors
305
Q91Cc. Have you changed the pronunciation of your name?
1 Yes 2 No 0 No response 9 Don’t know
Q92A92a. People who settle in a new country can have differing views of their national identity.
Do you see yourself as: [read responses 1-3]
1 More South Asian than Canadian?2 About equally South Asian and Canadian?3 More Canadian than South Asian?4 I don’t see myself in these terms [volunteered]
9 Don’t know0 No response
Q92B92b. How do you think your children (living in Canada ) think of themselves? [read
responses 1-3]
1 More South Asian than Canadian?2 About equally South Asian and Canadian?3 More Canadian than South Asian?4 They don’t see themselves in these terms [volunteered]
8 Not applicable (don’t have children or children don’t live in Canada)9 Don’t know0 No response
Q92C92c. How do you think your grandchildren (living in Canada) see themselves? [read
responses 1-3]1 More South Asian than Canadian?2 About equally South Asian and Canadian?3 More Canadian than South Asian?4 They don’t see themselves in these terms [volunteered]
8 Not applicable (don’t have grandchildren/grandchildren don’t live inCanada)
9 Don’t know0 No response

The Experiences of Immigrant Seniors
306
Q93A93a. Are there any barriers to your developing your identity as a Canadian?
1 Yes 2 No [Go to 94] 9 Don’t know [Go to 94] 0 No response [Go to 94]
Q93B93b. [If yes] What are the barriers to your developing your identity as a Canadian?
____________________________________________________________________
____________________________________________________________________
94. The process of settling in a new country presents challenges. To what extent do youagree or disagree with the following statements?
Q94Aa. I like the way of life in Canadian society.
1 Strongly Disagree2 Disagree3 Neither Agree nor Disagree4 Agree5 Strongly Agree
9 Don’t Know0 No response
Q94Bb. I understand Canadian culture.
1 Strongly Disagree2 Disagree3 Neither Agree nor Disagree4 Agree5 Strongly Agree
9 Don’t Know0 No response

The Experiences of Immigrant Seniors
307
Q94Cc. I generally feel accepted by most Canadians.
1 Strongly Disagree2 Disagree3 Neither Agree nor Disagree4 Agree5 Strongly Agree
9 Don’t Know0 No response
Q94Dd. I feel Canadians generally appreciate the contributions of immigrants.
1 Strongly Disagree2 Disagree3 Neither Agree nor Disagree4 Agree5 Strongly Agree
9 Don’t Know0 No response
Q94Ee. I feel my acceptance by Canadians depends on international political events.
1 Strongly Disagree2 Disagree3 Neither Agree nor Disagree4 Agree5 Strongly Agree
9 Don’t Know0 No response
Q95A95a. In the past three years, have you experienced racism in Canada?
Never Occasionally Frequently All of the time English pretest* Don’t know No response 1 2 3 4 7 9 0* Note: Question was changed and data for English pretest group is excluded.

The Experiences of Immigrant Seniors
308
Q95B95b. Please explain:
_________________________________________________________________
_________________________________________________________________
Finally, let me ask you some questions about life as an older person and as an immigrantliving in Canada.
Q96A96a. How do you think your life would be if you lived in South Asia today?
Very Poor Poor Fair Good Excellent No response Don’t know 1 2 3 4 5 0 9
Q96B96b. How do you feel life is for you in Canada today?
Very Poor Poor Fair Good Excellent No response Don’t know 1 2 3 4 5 0 9
Q9797. What have been the advantages for you of immigrating to Canada?
______________________________________________________________
______________________________________________________________
Q9898. What have been the disadvantages for you of immigrating to Canada?
______________________________________________________________
______________________________________________________________
Q9999. What makes you happy in your life? ________________________________
______________________________________________________________

The Experiences of Immigrant Seniors
309
Q100100. Is there anything else that you would like to tell me about your experience as an
immigrant to Canada?______________________________________________________________
______________________________________________________________
______________________________________________________________
______________________________________________________________
Q100BAnything else … (continued)
Q100CAnything else… (continued)
We have reached the end of the questionnaire. Thank you very much for your participation.
Q101101. Would you be interested in participating in a further study sometime in the future?
1 Yes ____ 2 No ____

The Experiences of Immigrant Seniors
310

The Experiences of Immigrant Seniors
311
Appendix B
Coding Frames for Open-ended Questions

The Experiences of Immigrant Seniors
312
The Experience of Immigrant Seniors
Coding Frames for Open-ended Questions
16a. In what ways, if any, do you help your grandchildren who live in theEdmonton area?
1 Babysitting/Provide childcare/Household chores2 Contribute financially3 Contribute emotionally/culturally4 Teach religion5 Teach language6 Provide recreation7 Several of the above ways8 Not applicable/None
16b. In what ways, if any, do your grandchildren who live in the Edmonton areahelp you?
1 Home maintenance2 Drive to places/Shopping3 Translate for me4 Emotional support/Love and respect5 Several of the above ways6 None/Too young to help8 Not applicable
23. How can the government increase the awareness of seniors such as yourselfabout the benefit program offered by the government?
1 Publicize in mass media2 Information distributed by government department and agencies3 Hold seminars, workshops in cultural/community/religious organizations4 Not necessary0 No response

The Experiences of Immigrant Seniors
313
30b. What prevents you from having your preferred living arrangement?
1 Too costly/Can’t afford to2 Health problems3 Family problems/Don’t want to be alone4 None8 Not applicable
32. In what way do you contribute to this household?
1 Provide childcare2 Prepare meals3 Do household work4 Do gardening/yard work5 Contribute to household expenses6 Love and emotional support7 Several of the above ways8 Not applicable9 Nothing/No contribution
39c. What prevents you from living in the building or facility you prefer to live in?
1 Too costly/Can’t afford to/Financial2 Health problems3 Do not want to be alone4 None8 Not applicable0 No response
47b. Why do you feel safe or unsafe walking by yourself in your neighborhood?
1 Safe neighborhood, city, country2 Experienced no problem/no crime3 Good neighbors/Friendly neighborhood4 Good community (Indian)5 Family, friends, relatives nearby6 Physical condition of neighborhood7 Ethnicity/Rudeness8 Not applicable9 Nothing to worry about0 No response/Don’t know/Pretest not asked

The Experiences of Immigrant Seniors
314
48b. Why do you feel safe or unsafe staying at home by yourself?
1 Safe neighborhood, city, country2 No problems/No crime3 Alarm/Security system4 Get used to it5 Keeps busy6 Health problems/Language problem/Age7 Good neighbors, good laws, property rights, emergency services8 God takes care/Pray to God9 Never alone at home
0 No response
51. In what way did you experience discrimination when you or your family waslooking for housing?
1 Claim no vacancy/Refused to rent when vacant2 Because of Ethnicity/Dress/Living style3 Non-cooperation8 Not applicable
53. Describe one such incident of discrimination while living in thisneighborhood.
1 Rudeness/Throw things at us 2 Because of Pure ignorance/Ethnicity/Color 0 No response 8 Not applicable
54. How has being discriminated against made you feel?
1 Hurt/Unhappy/Upset2 Feel bad/Heart broken8 Not applicable
55b. How has discrimination interfered with your daily activities?
1 Cannot get job2 Thought of as terrorist/Don’t like us/Don’t feel safe8 Not applicable

The Experiences of Immigrant Seniors
315
60b. Why is it difficult for you to get to places you need to go to?
1 Need a ride/Don’t drive2 Inconvenient public transportation3 Winter condition4 Health problems5 Too busy babysitting8 Not applicable
62. What volunteer work do you do?
1 Help in temple activities2 Help in school activities3 Help in community/cultural activities4 Help in public organizations8 Not applicable
63b. Why don’t you participate in any social groups?
1 Health problems/Too old2 Transportation problem/Too far3 Busy/No time4 Not interested/Happy staying at home5 New to city/Not familiar8 Not applicable
0 No response/Pretest not asked
64c. Why is or isn’t this level of activity in social groups satisfactory to you?
1 Meet more people/Socialize with friends/Chance to get out of house2 Peace of mind/Religious satisfaction3 Personal satisfaction/Chance to help others/community4 Health problems/Age5 Busy/No time/Family responsibilities0 No response8 Not applicable
65. What community and recreational services do you use?
1 English classes2 Physical exercise programs3 Library services4 Health education/Financial seminars5 None

The Experiences of Immigrant Seniors
316
67. What makes it difficult or easy for you to use these services?
1 Transportation2 Weather3 Accessibility of programs4 Health problems/Language problem8 No difficulties/Not applicable0 No response/Pretest not asked
68. What can be done to help you use these services?
1 Improve transportation2 Financial support3 Open more centres or programs8 Don’t need any help/Not applicable
0 No response/Don’t know/No suggestion/Pretest not asked
69. In the past, how have you learned about community and recreational servicesthat are of interest to you?
1 Mass media2 Government departments and agencies3 Professionals4 Family5 Friends and relatives6 Cultural/Community/Religious organizations7 No sources/Don’t use0 No response

The Experiences of Immigrant Seniors
317
74a. Do you have someone you confide in, or talk to about your private feelings orconcerns?
74b. Do you have someone you can really count on to help you out in a crisissituation?
74c. Do you have someone you can really count on to give you advice when you aremaking important personal decisions?
74d. Do you have someone that makes you feel loved?
1 Spouse: Husband/Wife2 Parents3 Children: Sons/Daughters4 Friends5 Siblings: Brothers/Sisters6 Family7 Relatives/Priest8 No One, Don’t Know, No Response
77. Why do you think that this person is (these persons are) lonely?
1 Family problems/Family violence/Don’t get along/Generation gaps(extended family)
2 Children at work/Children away/Lack of communication with children3 Widowhood/Divorce4 Deficiency of resources/No productive work/Language barrier5 Separation from mother country/Miss their native land6 People confide in me/Know from other people/From their action and facial
expressions8 Not applicable0 No response
78. What do you think needs to be done for this lonely person (these lonelypersons)?
1 Senior housing2 Senior centres and programs/Awareness of rights3 Social contact4 Financial independence and work5 Nothing/It’s their choice8 Not applicable0 No response/Don’t know

The Experiences of Immigrant Seniors
318
87b. To die in homeland: why or why not a concern?
1 Family in Canada/Canada is my homeland now2 God’s will/Predetermined/Destiny/Death is certain3 Want to die in birthplace/Ancestors/Emotional ties4 Not important/Not an issue
0 Don’t know/No response/Pretest not asked
93b. What are the barriers to your developing your identity as a Canadian?
1 English language/Language barrier2 Skin color/Ethnicity3 Cultural differences/Turban/Dress/Living style8 Not applicable
0 No response
95b. Have you experienced racism in Canada in the past three years? Pleaseexplain.
1 Skin color/Look different2 Lack job opportunities/Hostile job environment3 Cultural differences/Turban/Dress4 Rudeness/Spitting/Name calling/General feeling
8 No experience/Can’t comment/Not applicable 0 No response/Pretest not asked
97. What have been the advantages for you of immigrating to Canada?[First response only coded]
1 Family2 Better health/medical care3 Financial benefits4 Good government, safety, freedom5 Good quality of life6 Diversity/People7 Physical environment8 Opportunities for children and grandchildren9 Educational/Job opportunities
10 Housing 12 None 0 No response

The Experiences of Immigrant Seniors
319
98. What have been the disadvantages for you of immigrating to Canada?[First response only coded]
1 Miss family, friends and relatives2 Miss homeland3 Miss and lose culture and identity4 Loss of status5 Financial6 Job opportunities7 Climate8 Social and emotional isolation9 Food10 Government12 None 0 No response
99. What makes you happy in your life?[First response only coded]
1 Be with family, friends and relatives2 Good social relations3 Enjoying life4 Opportunity for future generations5 Financial security6 Good health7 Helping others8 Religion9 To be recognized10 Knowledge and information11 Freedom and Peace12 None 0 No response
The Experiences of Immigrant Seniors
320
100. Is there anything else that you would like to tell me about your experienceas an immigrant to Canada?[First response only coded]
1 Good life in Canada/Good country/Good benefits/Friendly people2 Better prospects for children3 Good health care4 Need better facilities/More social gathering places for seniors5 Bad weather6 Multiculturalism/Lack of cultural identity7 More benefits/More financial aids/Old Age Pension rule8 Cultural shock/Initial hardship/Loneliness/Family problems/Lack of recognition9 Rights and freedom/Peace/Free to practice religion10 Better job opportunities/better education11 Strong Indian community12 No problem/Well adjusted/Happy/Family is here0 None/No response

The Experiences of Immigrant Seniors
321
Appendix C
Interview Questionnaire
(Hindi-language Version)

The Experiences of Immigrant Seniors
322
Appendix D
Interview Questionnaire
(Punjabi-language Version)
Related Documents