1 The expenditure on children in Japan † Masahiro Hori Hitotsubashi University, and Economic and Social Research Institute, Cabinet Office November 7, 2011 Abstract This study estimates average expenditures on children by families in Japan on the basis of the rich information about household expenditures and demographics obtained from the Family Income and Expenditure Survey. We show that the total expenditure on the first child accumulated from birth through age 18 is approximately 16.5 million yen based on 2004–2008 data. Average per child expenditure (accumulated over the same age period) in a household with two children is reduced to about 11 million yen, suggesting partly that there are economies of scale in child rearing activities and that families with two children have less money to spend on each child. The share of child rearing expenditure in total consumption appears to have been steadily increasing since mid-1980s. 1 Introduction Japan is facing a demographic crisis due to declining fertility rates coupled with rising longevity. While fewer than three workers currently support a retiree in Japan, this ratio is projected to drop to two workers for every aged dependent by 2025. Although Japan’s has been successful thus far in maintaining a relatively generous social security system, maintaining this system will be increasingly difficult, given the inevitable shrinking of the working population. The solution to Japan’s aging crisis appears to be straightforward but not easy to implement: increase the participation of women and the elderly in the workforce; reform the pension system; raise taxes to pay for the cost of social security; and encourage society to be more supportive of child rearing in order to boost fertility. † This paper was prepared for presentation at the ESRI & MIRI Workshop for the international collaboration project on February 22, 2011. I am grateful to Junya Hamaaki, Koichiro Iwamoto, Keiko Murata, and Ralph Paprzycki for their valuable comments on an earlier draft of this paper. I am also grateful to the Ministry of Internal Affairs and Communications for providing data to our ESRI project. Finally, we acknowledge the financial assistance of Japan Society for the Promotion of Science (JSPS) (Grant-in-Aid for Scientific Research (A) 23243046; Micro-data based analyses on the economic behaviors of households and policy effectiveness in Japan). The views expressed are mine and should not be attributed to any of the organizations with which I am affiliated. Any errors and omissions are my own.

Welcome message from author
This document is posted to help you gain knowledge. Please leave a comment to let me know what you think about it! Share it to your friends and learn new things together.
Transcript

1
The expenditure on children in Japan†
Masahiro Hori
Hitotsubashi University, and Economic and Social Research Institute, Cabinet Office
November 7, 2011
Abstract This study estimates average expenditures on children by families in Japan on the basis of the rich information about household expenditures and demographics obtained from the Family Income and Expenditure Survey. We show that the total expenditure on the first child accumulated from birth through age 18 is approximately 16.5 million yen based on 2004–2008 data. Average per child expenditure (accumulated over the same age period) in a household with two children is reduced to about 11 million yen, suggesting partly that there are economies of scale in child rearing activities and that families with two children have less money to spend on each child. The share of child rearing expenditure in total consumption appears to have been steadily increasing since mid-1980s.
1 Introduction
Japan is facing a demographic crisis due to declining fertility rates coupled with rising longevity.
While fewer than three workers currently support a retiree in Japan, this ratio is projected to drop to
two workers for every aged dependent by 2025. Although Japan’s has been successful thus far in
maintaining a relatively generous social security system, maintaining this system will be
increasingly difficult, given the inevitable shrinking of the working population. The solution to
Japan’s aging crisis appears to be straightforward but not easy to implement: increase the
participation of women and the elderly in the workforce; reform the pension system; raise taxes to
pay for the cost of social security; and encourage society to be more supportive of child rearing in
order to boost fertility.
†This paper was prepared for presentation at the ESRI & MIRI Workshop for the international collaboration project on February 22, 2011. I am grateful to Junya Hamaaki, Koichiro Iwamoto, Keiko Murata, and Ralph Paprzycki for their valuable comments on an earlier draft of this paper. I am also grateful to the Ministry of Internal Affairs and Communications for providing data to our ESRI project. Finally, we acknowledge the financial assistance of Japan Society for the Promotion of Science (JSPS) (Grant-in-Aid for Scientific Research (A) 23243046; Micro-data based analyses on the economic behaviors of households and policy effectiveness in Japan). The views expressed are mine and should not be attributed to any of the organizations with which I am affiliated. Any errors and omissions are my own.

2
This study focuses on the last of these issues, namely ways to provide greater support for child
rearing, by attempting to estimate the average family expenditure on children in Japan. Based on the
perception that the cost of child rearing is a key factor in a married couple’s decision to have a baby
(at least from the viewpoint of economics), there have been several recent attempts to examine
expenditures on children, including Rosenbaum and Ruhm (2007) for the United States, Bargain
and Donni (2010) for France, Bargain, Donni, and Gbakou for Ireland (2010), and Menon and
Perali (2009) for Italy. Among others, the U.S. Department of Agriculture has provided annual
figures on expenditures on children since 1960,1 and its child rearing expense estimates are often
used in determining state child support guidelines and child care payments. Despite the importance
of this issue for a country experiencing a decline in fertility, there are few empirical studies
investigating how much parents in Japan spend on their children. A few studies using equivalence
scales to examine child rearing costs in Japan do exist (see Suruga, 1993, and Oyama, 2006), but
they focus only on a relatively short period in the past and the estimates are likely to be too outdated
to provide a reliable assessment of the present situation.2
The present study seeks to address this dearth of research by estimating the average expenditure
on children by families in Japan over the past quarter of a century, using the rich information on
household expenditures and demographics available from the Family Income and Expenditure
Survey (FIES). Instead of using equivalence scales, which, although widely used in the literature,
rest on debatable assumptions, this study tries to calculate average child rearing expenditure by
individual household members, taking into account their age, sex, and several other attributes, in
order to arrive at average household child rearing expenditures. The results of our simple regression
analysis indicate that average total cumulative expenditure (excluding housing expenses) for the
first child from birth through age 18 was approximately 16.5 million yen in the period 2004–2008.
Furthermore, when there are two or more children in a household, the average expenditure per child
is substantially lower; for example, in households with two children, it was approximately 11
1 See Lino (2001, 2010) for a description of U.S. Department of Agriculture estimates of expenditures on children. 2 Suruga (1993) used aggregate data from the 1984 National Survey of Family Income and Expenditure. Even Oyama’s (2006) study, which is much more recent, only covers the period up to 1999, using data from the Japanese Panel Survey on Consumers. Finally, using micro-level data from the 2003 Family Income and Expenditure Survey, Cabinet Office (2005) estimated the total cost of rearing a child (arriving at a figure of 13 million yen), but this is not a rigorous academic study.
3
million yen, partly reflecting economies of scale in child rearing activity. Note that there is no
significant gender-based difference in the total child rearing expenditure. Further, the estimated
average total expenditure per child shows a clear upward trend not only in absolute terms but also
relative to what parents spend on themselves.
The rest of the paper is organized as follows. The next section describes the dataset and
empirical strategy used. Section 3 presents the results of a preliminary estimation obtained by
simply applying the methodology employed here to the total consumption expenditure by individual
households; in addition, the section highlights a few problems that need to be addressed to make the
estimates more reliable. Section 4 then reports the main estimates of the expenditure on children for
the period 2004–2008. Next, Section 5 considers historical trends in child rearing costs in Japan
since the mid-1980s. Finally, Section 6 concludes.
2 Data and Methodology
2.1 Data Source
To estimate the expenditure on children in an average Japanese household, the household-level data
from the Family Income and Expenditure Survey (FIES) from the mid-1980s is used. The FIES
provides detailed monthly information on household income and expenditure, and household
members’ characteristics (sex, age, relationship to the household head, etc.) for a nationally
representative sample of 8,000–9,000 households. The monthly data is compiled from a diary
collected twice a month, and each household is surveyed for six months before being replaced.
Another source of detailed household expenditure data for Japan is the National Survey of
Family Income and Expenditure (NSFIE), which is implemented every five years and covers a
larger sample of more than 50,000 households. However, the NSFIE data are not suitable for the
purpose of the analysis here, since the survey period is only from September to November and the
data may therefore be highly susceptible to expenditure seasonality.3
The analysis in this study focuses on observations for households of two or more persons 3 For example, school tuition fees, which are typically paid in March or April, the turn of the fiscal year in Japan, are not picked up by the NSFIE.
4
(with/without children). Moreover, in order to ensure a sufficiently large number of observations is
available for the regression analysis, which employs an exceptionally large number of independent
variables, expenditure patterns for three selected five-year intervals (instead of each year), namely
1984–1988, 1994–1998, and 2004–2008 are examined. The number of observations for each of the
three intervals is approximately 480,000 (8,000 × 12 × 5 = 480,000). In order to improve the
estimates, the sample will be restricted to households without large remittance expenditures,4 since
remittances are expenses for relatives who live away from the household head and cannot be
assigned to a specific family member listed in the FIES.5 Even after the exclusion of households
with large remittances, there are more than 440,000 observations for each interval.
In addition to the total of households’ monthly consumption expenditure, expenditure on the
following 10 broad categories of consumption is examined: (1) food; (2) housing; (3) fuel, light,
and water charges; (4) furniture and household utensils; (5) clothes and footwear; (6) medical care;
(7) transportation and communication; (8) education; (9) culture and recreation; and (10) other
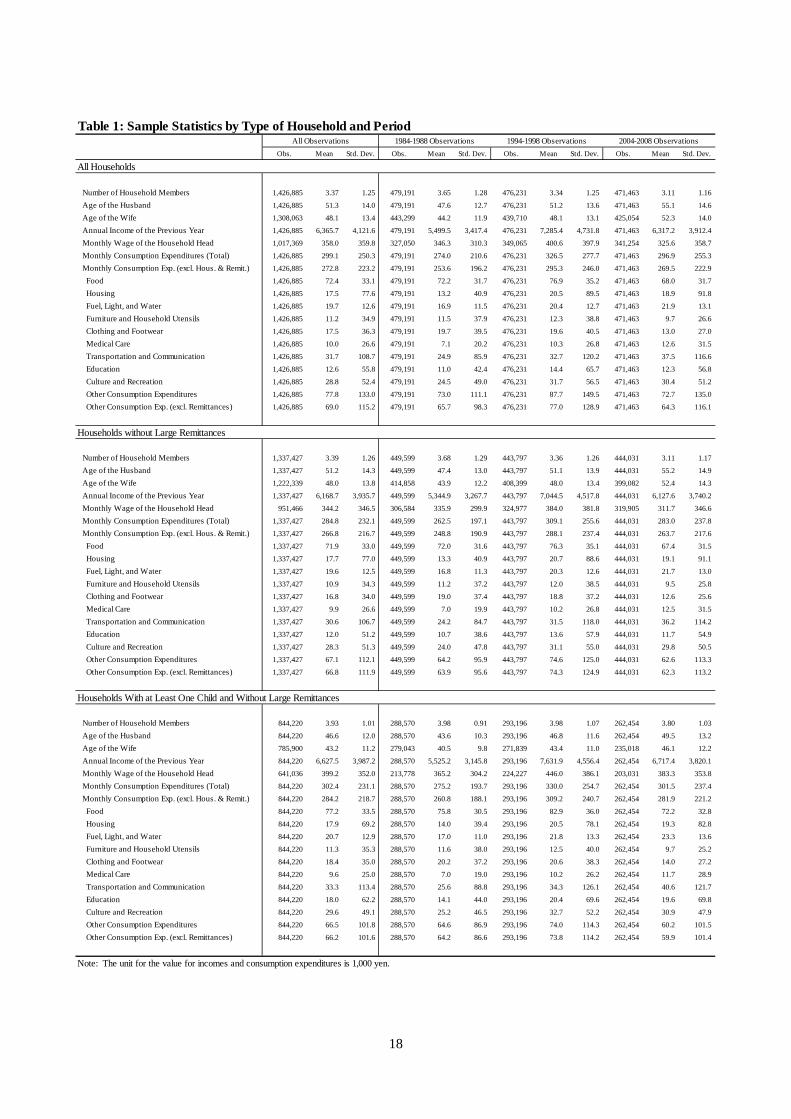
consumption expenditures. Summary statistics of the key variables are shown in Table 1.
Given that the aim of the study is to examine expenditure on children, the central explanatory
variables of the analysis are those concerning household demographic structure. Specifically, the
analysis starts with a comparison of the expenditure patterns of married couples without children
and married couples with at least one child to examine the effects that having a child or children on
the consumption behavior of a couple. In the sample of households without large remittances,
roughly two-thirds of households have at least one child, while the share of households with
children has been declining in recent years. In addition to the presence/absence of children, the
analysis in this study employs information on the age and sex of all household members (and not
only the household head) – something that has not been done in earlier studies. Figure 1 shows the
age-sex pyramid of the population included in the dataset (the observations in the three five-year
intervals aggregated together) as well as the pyramid for each of the five-year intervals.
4 Households are excluded from the restricted sample if their average monthly remittances are more than 25,000 yen. This level is set based on the finding (from a survey by the National Federation of University Co-operative Associations) that more than 95% of college students who receive remittances from their parents receive more than 30,000 yen a month. 5 A household in the FIES is composed of a household head and his or her family members. Relatives, living-in business employees, and household maids are considered as household members if they share living expenses. Accordingly, family members living in a separate house or lodgers maintaining a separate budget are excluded from households surveyed in the FIES.
5
Unfortunately, the age-sex pyramids based on the FIES data appear not to follow the pattern for the
national population as a whole; that is, young adults seem to be underrepresented in the age-sex
pyramids based on the FIES data. The reason is the way that household members are defined in the
FIES, i.e., children are counted as household members only when they live with the household head.
However, thanks to the large sample size of the FIES, it is possible to obtain a sufficiently large
number of observations for all age-sex brackets, including for young adults. The changing
demographics resulting from the aging of the Japanese population are well mirrored in the changing
shape of the FIES pyramids.
2.2 Methodology
Household expenditures are made either on shared goods, such as housing, or on individually
consumed goods, such as food, and it is usually impossible to directly observe expenditures on
behalf of a specific household member, for example, a child. Therefore, it is necessary to use an
indirect approach to assign household expenditures to a specific household member and to estimate
household expenditure on children. A relatively widely used approach is the marginal cost method,
which measures expenditures on children as the difference in expenses between families with
children and equivalent families without children. However, there is no generally accepted
equivalency measure in the economics literature, and it is known that estimates vary substantially
depending on the choice of equivalency measure. In addition, the marginal cost method does not
allow for the possibility that parents change expenditure on themselves after a child is added to the
household.
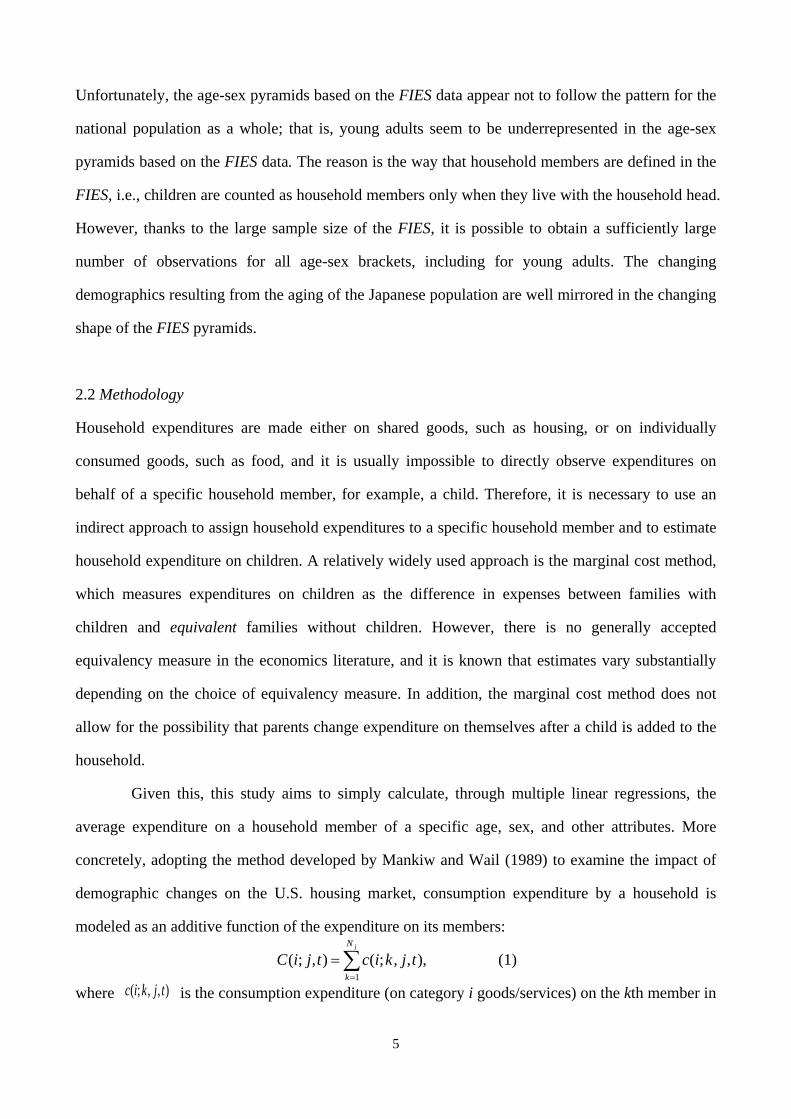
Given this, this study aims to simply calculate, through multiple linear regressions, the
average expenditure on a household member of a specific age, sex, and other attributes. More
concretely, adopting the method developed by Mankiw and Wail (1989) to examine the impact of
demographic changes on the U.S. housing market, consumption expenditure by a household is
modeled as an additive function of the expenditure on its members:
,),,;(),;(1∑=
=jN
k
tjkictjiC (1)
where ),,;( tjkic is the consumption expenditure (on category i goods/services) on the kth member in
6
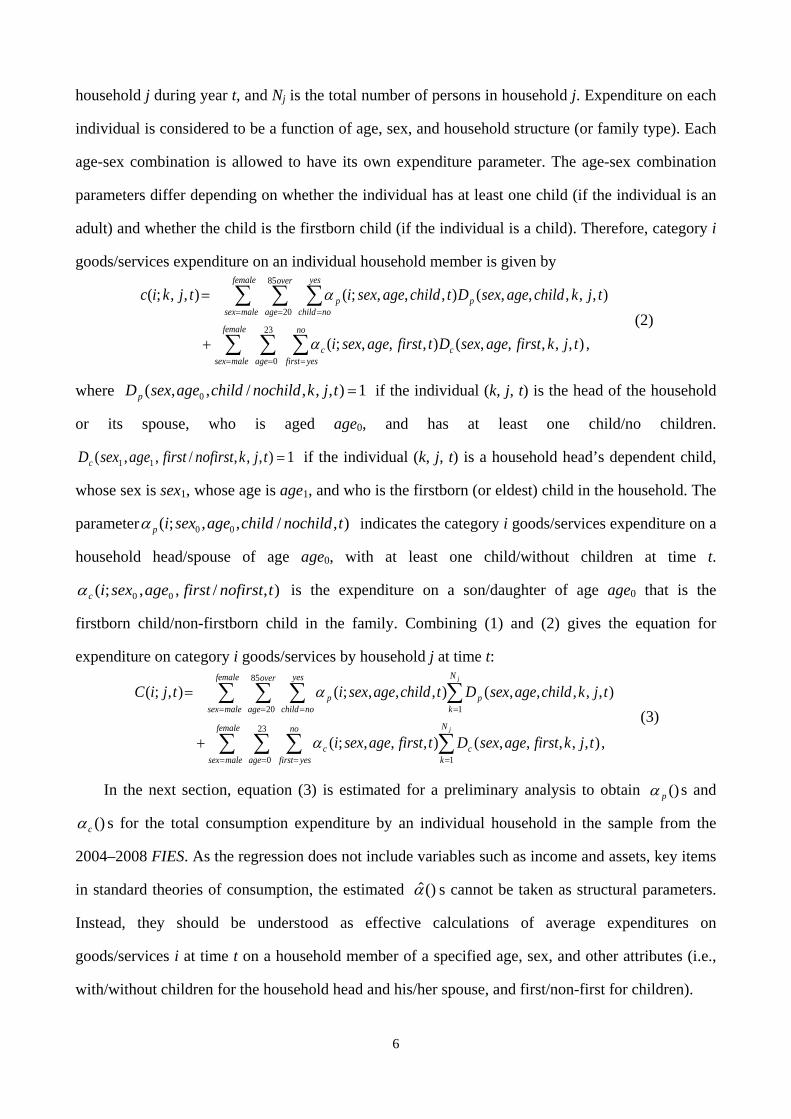
household j during year t, and Nj is the total number of persons in household j. Expenditure on each
individual is considered to be a function of age, sex, and household structure (or family type). Each
age-sex combination is allowed to have its own expenditure parameter. The age-sex combination
parameters differ depending on whether the individual has at least one child (if the individual is an
adult) and whether the child is the firstborn child (if the individual is a child). Therefore, category i
goods/services expenditure on an individual household member is given by
,),,,,,(),,,;(
),,,,,(),,,;(),,;(
23
0
85
20
∑ ∑ ∑
∑ ∑ ∑
= = =
= = =
+
=
female
malesex age
no
yesfirstcc
female
malesex
over
age
yes
nochildpp
tjkfirstagesexDtfirstagesexi
tjkchildagesexDtchildagesexitjkic
α
α
(2)
where 1),,,/,,( 0 =tjknochildchildagesexDp if the individual (k, j, t) is the head of the household
or its spouse, who is aged age0, and has at least one child/no children.
1),,,/,,( 11 =tjknofirstfirstagesexDc if the individual (k, j, t) is a household head’s dependent child,
whose sex is sex1, whose age is age1, and who is the firstborn (or eldest) child in the household. The
parameter ),/,,;( 00 tnochildchildagesexipα indicates the category i goods/services expenditure on a
household head/spouse of age age0, with at least one child/without children at time t.
),/,,;( 00 tnofirstfirstagesexicα is the expenditure on a son/daughter of age age0 that is the
firstborn child/non-firstborn child in the family. Combining (1) and (2) gives the equation for
expenditure on category i goods/services by household j at time t:
,),,,,,(),,,;(
),,,,,(),,,;(),;(
23
0 1
85
20 1
∑ ∑ ∑ ∑
∑ ∑ ∑ ∑
= = = =
= = = =
+
=
female
malesex age
no
yesfirst
N
kcc
female
malesex
over
age
yes
nochild
N
kpp
j
j
tjkfirstagesexDtfirstagesexi
tjkchildagesexDtchildagesexitjiC
α
α
(3)
In the next section, equation (3) is estimated for a preliminary analysis to obtain ()pα s and
()cα s for the total consumption expenditure by an individual household in the sample from the
2004–2008 FIES. As the regression does not include variables such as income and assets, key items
in standard theories of consumption, the estimated ()α̂ s cannot be taken as structural parameters.
Instead, they should be understood as effective calculations of average expenditures on
goods/services i at time t on a household member of a specified age, sex, and other attributes (i.e.,
with/without children for the household head and his/her spouse, and first/non-first for children).

7
It is additionally assumed that ),,,;( tfirstagesexipα and ),,,;( tfirstagesexicα vary with the
month, reflecting consumption seasonality, but are constant over the years in the five-year interval
from 2004 to 2008, since economic growth (and inflation) were roughly zero in that period. Based
on these assumptions, the average annual expenditure on goods/services i for the period on an
individual of a specified age, sex, and other attributes can be calculated as
∑ ==
12
1 000000 ),,,;(ˆ),,,(month p monthchildagesexichildagesexiC α for parents, and
∑ ==
12
1 111111 ),,,;(ˆ),,,(month c monthfirstagesexifirstagesexiC α for children. (4)
If we were interested in consumption expenditures over some specific age interval in the course of a
person’s life, say from age a0 to a1, the average consumption over the period could be calculated as
∑ ∑∑ = ==== 1
0
12
1 111
0 111101 ),,,;(ˆ),,,(),,,( a
aage month ca
aagemonthfirstagesexifirstagesexiCfirstaasexiC α (5)
As the aim of this study is to estimate the expenditure on child rearing in a typical household in
Japan, (5) is calculated over the age interval from birth through age 18. Although expenditure on
children often continues beyond the age of 18, the estimation here focuses on expenditures up until
this age. The reason is that expenditures on children aged 19 and older differ considerably across
households and, more crucially, the FIES definition of household members, which excludes
children living separately from their parents, makes it impossible to estimate expenditures on such
household members, since children aged 19 and over often start to live separately to attend college.
Therefore, although the following sections also report the expenditure on college-aged children (i.e.,
aged 19 to 23), these estimates should be treated with caution.6 In addition, for reference, the
average expenditure by parents on themselves is reported to gain a sense of the relative magnitude
of child rearing expenditures. Such estimates are also useful for examining how the consumption
behavior of the household head and his/her spouse are affected by having children.
3 Tentative Application to Total Consumption Expenditure
To illustrate the methodology introduced above, this section presents a simple application to total
consumption expenditure by an individual household (in the sample period 2004–2008). Although
6 The expenditure estimate for the age interval from 19 to 23 is likely to be an underestimate, since it does not include the large expenditure on children who live away from their parents to go to college.

8
this simple application is useful for revealing several interesting facts about household expenditure
on children in Japan, it also turns out that there are a number of aspects that need to be improved to
obtain more reliable estimates.
3.1 Preliminary Findings
The results of the simple application of the methodology, i.e., equations (5) and (4), to total
consumption expenditure are shown in Table 2 and Figure 2, respectively. Beginning with Table 2.1
and Figure 2.1, the results reveal a number of interesting facts about child rearing expenditure in
Japan. First, there are hardly any gender-based differences in the expenditure on children. Annual
expenditure per child (for the first child) is slightly less than 1 million yen for children up to their
early teens and 1.5 million yen for children of high school age. Total expenditure on the firstborn
child from birth through age 18 is around 19 million yen. Second, when there are two or more
children in a household, the increases in expenditure due to the second or later children are much
smaller than that for the first child. The average expenditure per child (cumulated over the age
interval from birth through age 18) in households with two children falls to approximately 11
million yen, suggesting partly that there are economies of scale in child rearing activities and that
families with two children have less money to spend on each child. Third, consumption expenditure
by the household head and the spouse in households with at least one child is substantially lower
than in households without children.
Given that remittances, which fall into the “other consumption expenditure” category, represent
an expenditure on those living outside the household, and therefore cannot be assigned to a specific
household member listed in the FIES household questionnaire, expenditures were re-estimated after
removing remittances from household consumption (Table 2.2 and Figure 2.2). While the estimate
of the total expenditure on the first child (cumulated from birth through age 18) decreases to around
17 million yen, and the rise in expenditure on a middle-aged childless wife (observed in Figure 2.1)
disappears in Figure 2.2, the overall patterns in the expenditure on children are not very different
from those found in the first regression, before excluding remittances.

9
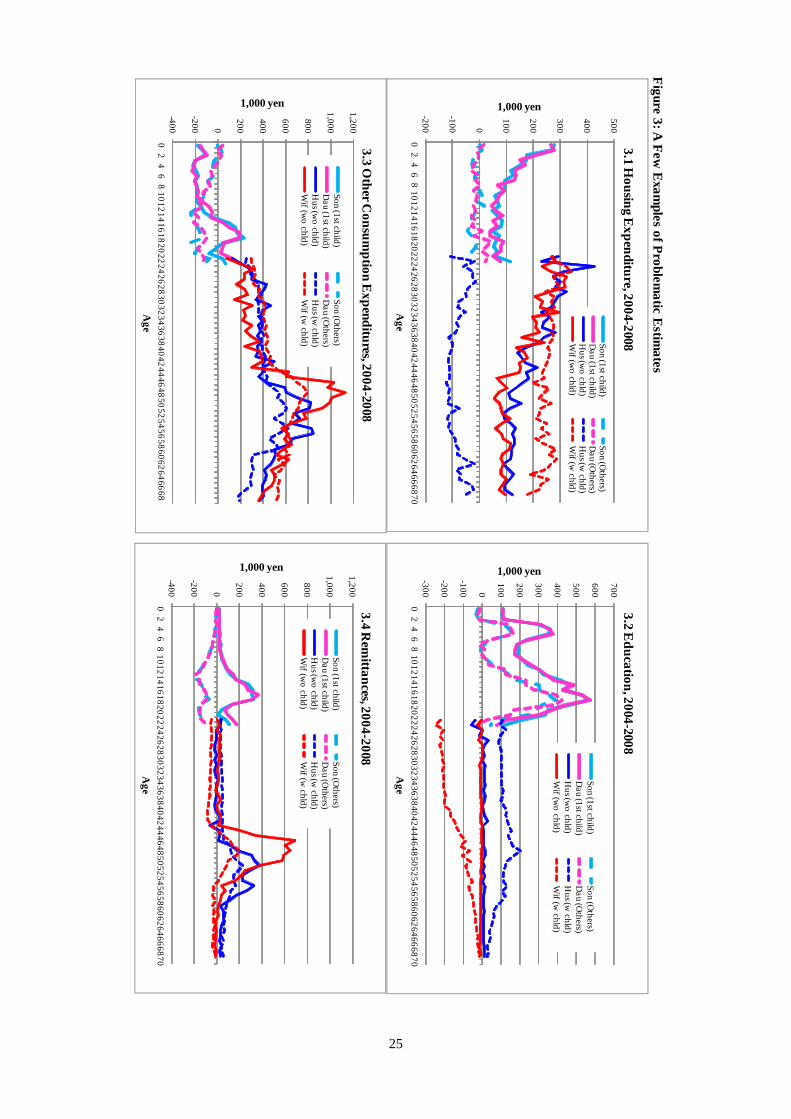
3.2 Problems Found in the Estimates on Subcategories
Although the findings above suggest that the methodology employed for estimating the expenditure
on each household member is useful, the estimates need to be treated with caution. Space
constraints mean that it is not possible to discuss the reasons here in full, but essentially some flaws
emerge when the same methodology is applied to the subcategories of consumption. In theory,
exactly the same results should be obtained for average per capita expenditure (on a household
member of a specific age, sex, and other attributes) regardless of whether total expenditure or the
sum of the estimates for the subcategories are used. Therefore, similar regressions were performed
for the 10 broad subcategories and these show that at least for a few items, the estimates contain
obvious biases. They include the following:
1. housing expenses are estimated to decrease as household members become older (see Figure
3.1);
2. educational expenses for a female parent with at least one child are estimated to be negative,
probably causing an overestimation of the cost of education for children (see Figure 3.2); and
3. the estimates of other consumption expenditures on children become large negative values;
moreover, the estimates for this category appear to be considerably affected by remittances
(see Figures 3.3 and 3.4).
The problem regarding housing expenses probably arises because the FIES does not regard
mortgage repayments by homeowners as housing expenditure. The counterintuitive estimates
indicate not only that housing expenditure by homeowners is not well captured, but also that
estimating housing expenditure is difficult, as it is strongly affected by the behavior of homebuyers.
The second problem regarding the education category probably indicates the presence of
multicollinearity due to the large number of independent variables. As education expenses by adults
without children appear to be almost zero, better estimates can probably be obtained by restricting
education expenses by parents to be also zero. A similar multicollinearity underlies the third issue
concerning “other consumption expenditures” and, unlike the multicollinearity regarding education
expenses, presents a much more substantial problem for the analysis in this study. More specifically,
the “other consumption” category contains remittances, which make up a sizable share but which

10
represent consumption expenditures on somebody (including relatives) not included in the FIES
households, and therefore the methodology employed here cannot (and should not) allocate such
expenditure to reported members in the FIES households. In a nutshell, the information available
from the FIES household questionnaires is insufficient to identify the number of children in each
household, especially when the household makes large remittances, which may or may not be for a
child (or children) aged 19 or older and living separately, e.g., to attend college.
3.3 Remedies
In order to overcome the problems discussed above, the following strategy is adopted in the
subsequent sections. First, to ensure that any of the problems described in the previous section are
avoided, the expenditure on children in each subcategory is first estimated and the total is then
calculated as the sum of the category estimates. Second, given the difficulties in dealing with
remittances, only observations on households without large monthly remittances are used, as
already noted in the data section. Excluding observations on households with large monthly
remittances not only avoids the problem of how to assign remittances to a specific member in a
household, but also mitigates the problems resulting from the incomplete coverage of household
members in the FIES. Third, given the problems regarding housing expenditure and remittances
mentioned above, expenditure on children is calculated excluding these two subcategories.7 Fourth,
given the multicollinearity observed for education expenditures and other consumption expenditures,
zero restrictions are imposed on some of the parameters to reduce the number of independent
variables. More specifically, it is presumed that education expenses are for dependent children
(from birth through age 23) and that other consumption expenditures are for adult members in each
household.8
7 A possible criticism is that the exclusion of housing expenses may result in considerable underestimation of total child rearing costs. Lino and Carlson (2010), for example, report that, in the United States, housing expenses are usually the largest expense on children parents incur. However, their definition of housing expenses is much broader than the one employed here and includes utilities as well as house furnishings and equipment. Therefore, excluding housing expenses here does not necessarily greatly underestimate total child rearing costs, and calculation of imputed rent, which would be necessary to estimate the housing costs of homeowner households, is beyond the scope of this short article. 8 Other consumption expenditures in the FIES consist of miscellaneous expenditures (such as personal care goods/services and tobacco), pocket money (details of the use of which are unknown), social expenses, and remittances.

11
4 Estimates by Consumption Category
This section presents the estimates of the expenditure on children following the procedure discussed
in the previous section; that is, the expenditure on children for each consumption category is
estimated and the total is then calculated as the sum of the category estimates.
4.1 Food (Figure 4.1 and Table 3)
Notwithstanding the finding in the previous section that there appear to be no differences in the total
expenditure on male and female children, when age-consumption profiles for individual
consumption categories are examined, differences in expenditures on boys and girls can be
observed. As for food expenditure, this is greater for boys than for girls and the gender gap in
consumption becomes most evident during adolescence. The increase in food expenditure due to a
second or later child is less than half of that due to the first child. Food expenditure on parents
appears to decrease substantially, especially during the first half of their child rearing period.
4.2 Fuel, Light, and Water Charges (Figure 4.2 and Table 3)
Fuel, light, and water charges related to child rearing increase as a child grows older, although
expenditure on such charges is smaller than such expenditure on parents. The increase in
expenditure on charges due to a second or later child is approximately half of that due to the first
child, again suggesting economies of scale in child rearing.
4.3 Furniture and Household Utensils (Figure 4.3 and Table 3)
Increases in expenditure on furniture and household utensils due to having a child appear to be
small, except in the short period immediately after the birth of the first child. Those due to a second
or later child are almost negligible.
4.4 Clothes and Footwear (Figure 4.4 and Table 3)
Clothing is the category in which the gender gap in consumption is the most prominent. In line with
expectations, clothing expenditure on girls is significantly higher than that on boys. Households
12
economize on clothing expenses for a second or later child, although it appears that they will
invariably incur higher clothing expenditures for girls during their adolescence. The gender gap in
clothing consumption also holds good for parental couples. Mothers typically spend more on
clothes and footwear than their spouse, although they spend less than comparable childless wives.
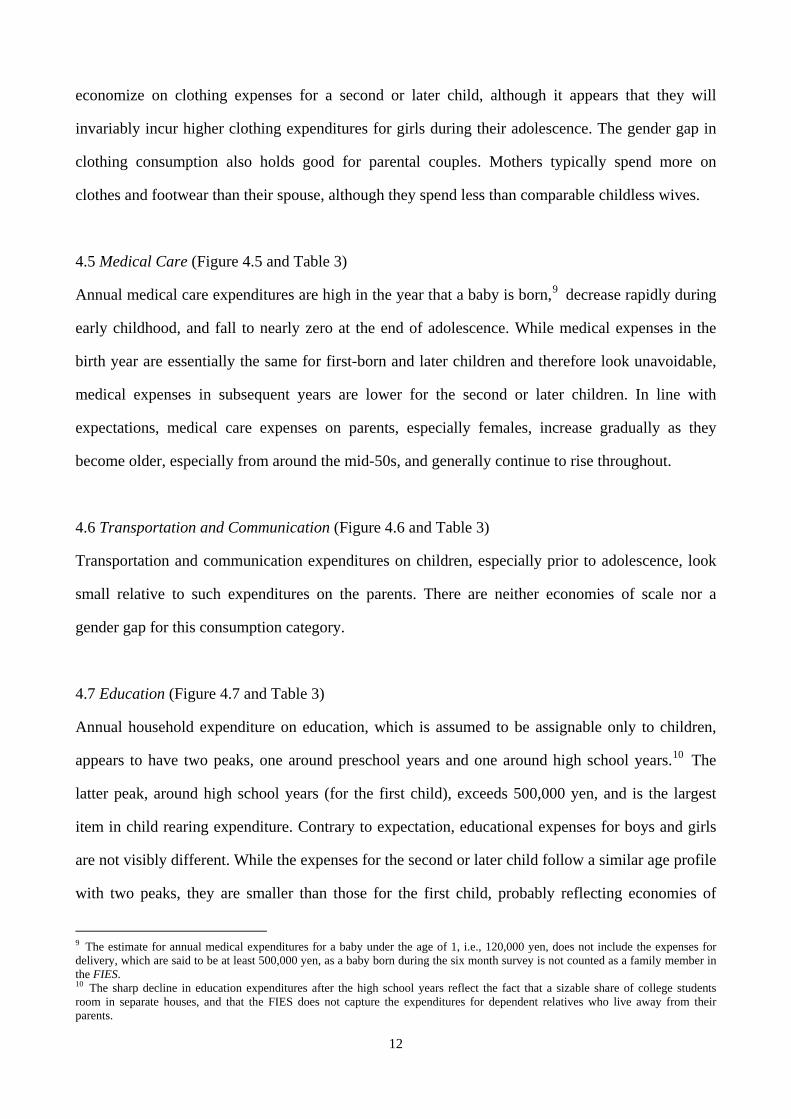
4.5 Medical Care (Figure 4.5 and Table 3)
Annual medical care expenditures are high in the year that a baby is born,9 decrease rapidly during
early childhood, and fall to nearly zero at the end of adolescence. While medical expenses in the
birth year are essentially the same for first-born and later children and therefore look unavoidable,
medical expenses in subsequent years are lower for the second or later children. In line with
expectations, medical care expenses on parents, especially females, increase gradually as they
become older, especially from around the mid-50s, and generally continue to rise throughout.
4.6 Transportation and Communication (Figure 4.6 and Table 3)
Transportation and communication expenditures on children, especially prior to adolescence, look
small relative to such expenditures on the parents. There are neither economies of scale nor a
gender gap for this consumption category.
4.7 Education (Figure 4.7 and Table 3)
Annual household expenditure on education, which is assumed to be assignable only to children,
appears to have two peaks, one around preschool years and one around high school years.10 The
latter peak, around high school years (for the first child), exceeds 500,000 yen, and is the largest
item in child rearing expenditure. Contrary to expectation, educational expenses for boys and girls
are not visibly different. While the expenses for the second or later child follow a similar age profile
with two peaks, they are smaller than those for the first child, probably reflecting economies of
9 The estimate for annual medical expenditures for a baby under the age of 1, i.e., 120,000 yen, does not include the expenses for delivery, which are said to be at least 500,000 yen, as a baby born during the six month survey is not counted as a family member in the FIES. 10 The sharp decline in education expenditures after the high school years reflect the fact that a sizable share of college students room in separate houses, and that the FIES does not capture the expenditures for dependent relatives who live away from their parents.

13
scale or the fact that parents spend more on educating an only child.
4.8 Culture and Recreation (Figure 4.8 and Table 3)
Culture and recreation expenditures have a single peak around the elementary school years, which
is in contrast with expenditures for education. As a child reaches its teens and educational costs start
to increase, parents probably save on culture and recreation expenses in order to provide their child
with a satisfactory education. Increases in household expenditure on culture and recreation due to a
second or later child are less than one-third of the increase due to the first child. Expenses on
culture and recreation by parents on themselves decrease substantially during the first half of their
child rearing period.
4.9 Other Consumption (Figure 4.9 and Table 3)
The age-consumption profiles for other consumption expenditures (excluding remittances), which
are assumed to be assignable only to parents, differ greatly between fathers and mothers. Other
consumption expenditures for fathers look broadly constant, except for a fall after retirement age,
whereas those for mothers continue increasing until they reach retirement age. In addition, “other
expenditures” by men are noticeably reduced when they have at least one child, although those by
women remain unchanged.
4.10 Total Consumption Expenditures (Figure 5 and Table 3)
Total consumption expenditure on a child can now be calculated as the sum of the estimates for the
nine consumption categories above. First, irrespective of gender, the total expenditure on the first
child cumulated over the period from birth through age 18 is about 16.5 million yen. While this
estimate appears more or less comparable with that reported in Table 2.2 for total consumption
excluding remittances, it should be noted that the corrected estimate here does not include housing
expenses, so that the overall expenditure is actually greater than that reported in Table 2.2. On the
other hand, the estimate of the cumulative expenditure on a second or later child of roughly 5.6
million yen is larger now than that in the preliminary estimate, suggesting that the economies of
14
scale in child rearing appear to have been exaggerated in the preliminary estimates. Although
expenditures on boys and girls turn out to be significantly different for most of the subcategories,
the total expenditure appears to be approximately the same for both, thus supporting the finding in
the preliminary regression.
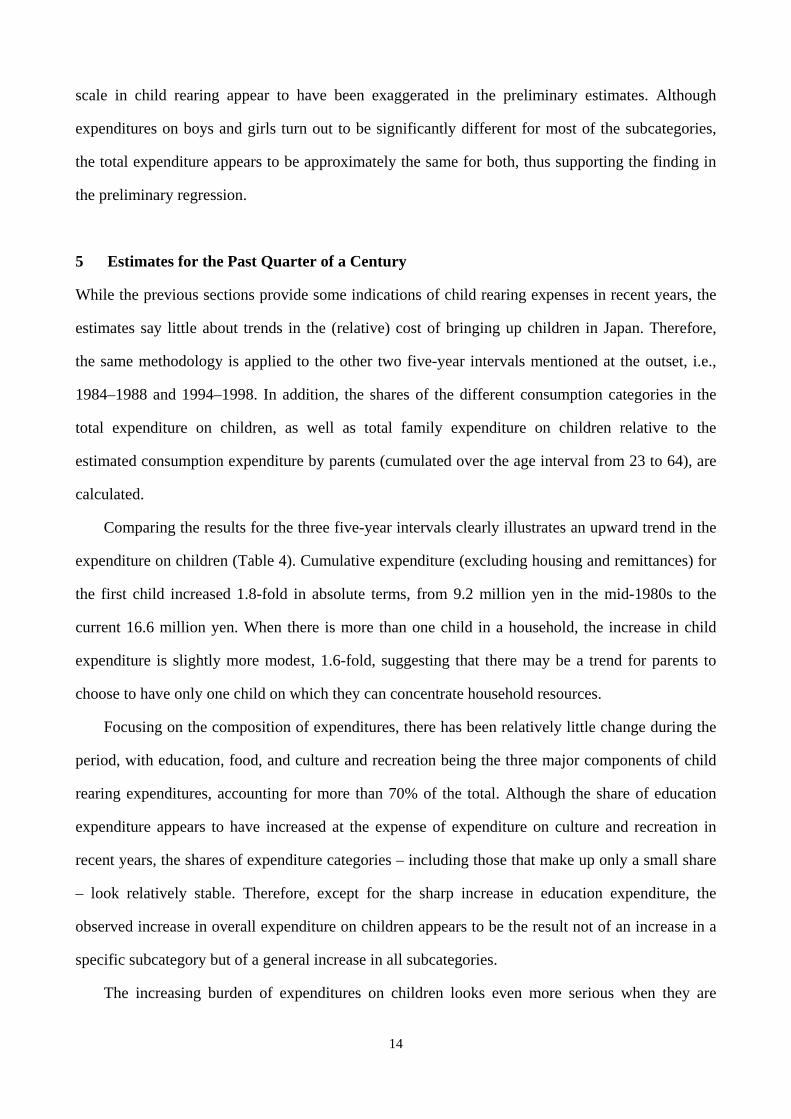
5 Estimates for the Past Quarter of a Century
While the previous sections provide some indications of child rearing expenses in recent years, the
estimates say little about trends in the (relative) cost of bringing up children in Japan. Therefore,
the same methodology is applied to the other two five-year intervals mentioned at the outset, i.e.,
1984–1988 and 1994–1998. In addition, the shares of the different consumption categories in the
total expenditure on children, as well as total family expenditure on children relative to the
estimated consumption expenditure by parents (cumulated over the age interval from 23 to 64), are
calculated.
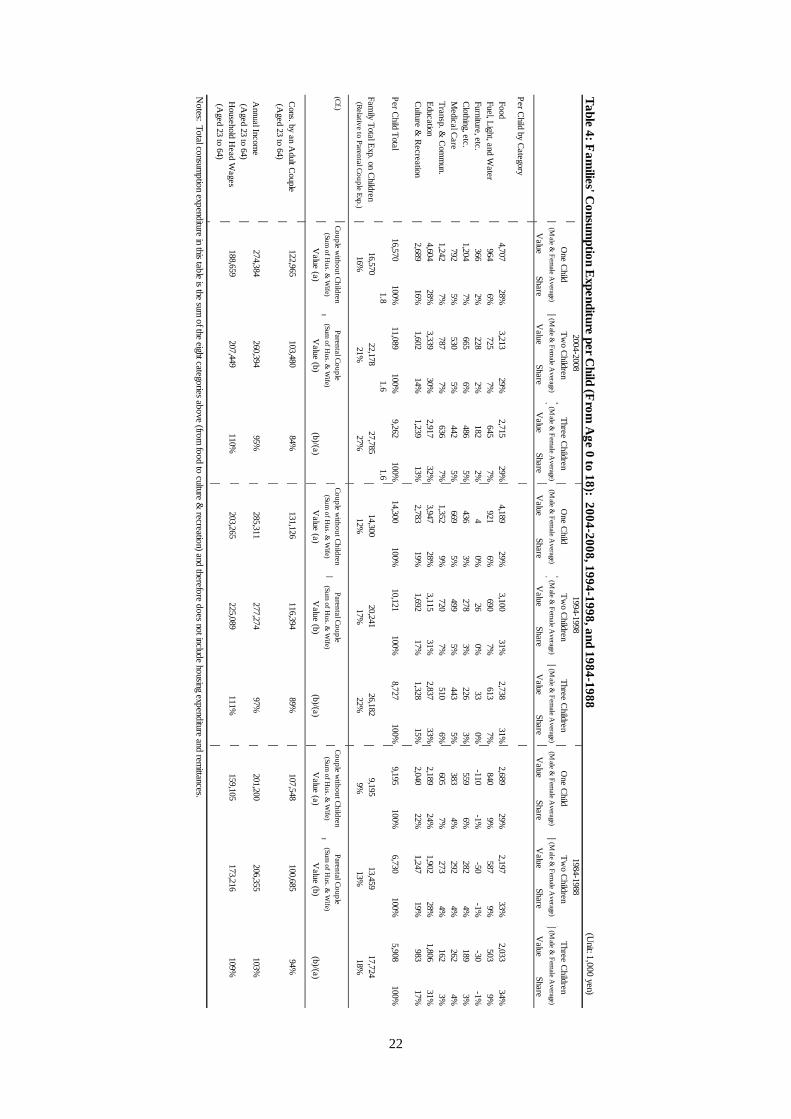
Comparing the results for the three five-year intervals clearly illustrates an upward trend in the
expenditure on children (Table 4). Cumulative expenditure (excluding housing and remittances) for
the first child increased 1.8-fold in absolute terms, from 9.2 million yen in the mid-1980s to the
current 16.6 million yen. When there is more than one child in a household, the increase in child
expenditure is slightly more modest, 1.6-fold, suggesting that there may be a trend for parents to
choose to have only one child on which they can concentrate household resources.
Focusing on the composition of expenditures, there has been relatively little change during the
period, with education, food, and culture and recreation being the three major components of child
rearing expenditures, accounting for more than 70% of the total. Although the share of education
expenditure appears to have increased at the expense of expenditure on culture and recreation in
recent years, the shares of expenditure categories – including those that make up only a small share
– look relatively stable. Therefore, except for the sharp increase in education expenditure, the
observed increase in overall expenditure on children appears to be the result not of an increase in a
specific subcategory but of a general increase in all subcategories.
The increasing burden of expenditures on children looks even more serious when they are

15
examined relative to the estimated expenditure by parents on themselves. In the case of households
with one child, the ratio of child rearing expenditure to the parents’ expenditure on themselves
increased from 9% in 1984–1988 to 16% in 2004–2008. Meanwhile, for two children households,
the ratio increased from 13% to 21%, and for three children households from 18% to 27%. These
increases in the ratio mean that while expenditures on children increased drastically, parents were
forced to curtail expenditure on themselves. Comparing consumption expenditure on themselves by
adult couples with and without children (see the column labeled “(b)/(a)” in the row showing the
consumption by an adult couple in Table 4) provides further indication that, in more recent years,
parental couples have reduced expenditure on themselves relative to couples without a child.
Although the results obtained here by themself do not allow a definite conclusion, they suggest that
an important factor underlying Japan’s declining birthrate is the increasing cost of child rearing both
in absolute terms and as a share in household expenditure.
6 Conclusion
This study attempted to estimate the average expenditure on children by families in Japan – an issue
of considerable pertinence given the country’s declining birthrate. On the basis of rich information
on household expenditure and demographics obtained from the FIES, several regressions were
performed to assign household expenditures to a specific member of each household.
Calculating total child rearing expenditure as the sum of the estimates for individual
consumption subcategories, it was found that, for the period 2004–2008, total expenditure on the
first child (excluding housing expenses and remittances) cumulated from birth through age 18 came
to about 16.5 million yen. When there are two or more children in a household, the expenditure
increase due to a second or later child is much smaller than that due to the first child, suggesting
economies of scale in child rearing. While expenditures on boys and girls differ significantly when
examined on a subcategory basis, there is little gender-based difference in the total expenditure on a
child. Estimates of the expenditure on children show a clear upward trend, not only in absolute
terms, but also relative to the expenditure by parents on themselves. Parents, especially fathers,
appear to have been forced to more and more curtail their own expenses (relative to childless adult
16
males) in recent years, indicating that the burden of child rearing in Japan is increasing.
The findings obtained in this study have numerous policy implications. For example, the large
and rapidly increase in child rearing costs suggest that there is a need for child rearing support,
given Japan’s very low birthrate. The estimate of child rearing expenditures obtained here could be
used to determine child allowances. Several of the findings regarding the items and timing of child
rearing expenses, such as the heavy medical costs around childbirth and the costs of education
during high school years, may be useful in locating problem areas on which child-support programs
need to focus.11 The observed economies of scale in child rearing suggest that the government
should design programs to target second and later children, rather than treating all children
(including only children) equally, to make the programs more effective as a countermeasure to the
falling birthrate. The estimates of expenditure on children in this study are experimental and several
important items are not included, such as housing costs, costs related to childbirth, parental
expenses on children after age 19, including college education costs, and the indirect costs involved
in child rearing. This means that further studies on these and related issues in the context of
evidence-based policy are all the more necessary.
11 Although the Japanese government took a step in the direction of lowering child rearing costs in 2010 by introducing child allowances and waiving/subsidizing tuition for high schools, the policy decision was not necessarily based on empirical evidence on the expenses of bringing up children and little more than a year later the government decided to scrap the child allowance again due to budget constraints.
17
References
Bargain O. and Donni O. (2010), “The Measurement of Child Costs: A Rothbarth-Type Method
Consistent with Scale Economies and Parents’ Bargaining,” CEPS/INSTEAD Working
Papers No. 2010-30.
Bargain O., Donni O., and Gbakou M. (2010), “The Measurement of Child Costs: Evidence from
Ireland,” The Economic and Social Review 41(1): 1-20.
Bassi J. L. and Barnow S. B. (1993), “Expenditures on Children and Child Support Guidelines,”
Journal of Policy Analysis and Management 12(3): 478-497.
Cabinet Office (2005), “The Cost and Time of Child Rearing,” chapter 3 of the White Paper on the
National Lifestyle 2005 (in Japanese).
Lino M. (2001), “Expenditures on Children by Families: U.S. Department of Agriculture Estimates
and Alternative Estimators,” Journal of Legal Economics 11(2): 31-48.
Lino M. (2010), Expenditures on Children by Families, 2009, U.S. Department of Agriculture,
Center for Nutrition Policy and Promotion, Miscellaneous Publication No. 1528-2009.
Lino M. and Carlson A. (2010), “Estimating Housing Expenses on Children: A Comparison of
Methodologies,” Journal of Legal Economics 16(2), 61-79.
Mankiw G. N. and Weil D. N. (1989), “The Baby Boom, the Baby Bust, and the Housing Market,”
Regional Science and Urban Economics, 19(2): 235-258.
Menon M. and Perali F. (2009), “Econometric Identification of the Cost of Maintaining a Child,”
Department of Economics Working Paper Series No. 63, University of Verona.
Oyama M. (2006) “Measuring Cost of Children Using Equivalence Scale on Japanese Panel Data”
(sic), Applied Economics Letters 13(7): 409-415.
Rosenbaum D. T. and Ruhm C. J. (2007), “Family Expenditures on Child Care,” The B.E. Journal
of Economic Analysis & Policy 7(1), Topics, Article 34.
Suruga T. (1993), “Estimation of Equivalence Scale using Japanese Data” (sic), The Economic
Studies Quarterly 4(2), 169-177.
18
Table 1: Sample Statistics by Type of Household and Period
Obs. Mean Std. Dev. Obs. Mean Std. Dev. Obs. Mean Std. Dev. Obs. Mean Std. Dev.
All Households
Number of Household Members 1,426,885 3.37 1.25 479,191 3.65 1.28 476,231 3.34 1.25 471,463 3.11 1.16
Age of the Husband 1,426,885 51.3 14.0 479,191 47.6 12.7 476,231 51.2 13.6 471,463 55.1 14.6
Age of the Wife 1,308,063 48.1 13.4 443,299 44.2 11.9 439,710 48.1 13.1 425,054 52.3 14.0
Annual Income of the Previous Year 1,426,885 6,365.7 4,121.6 479,191 5,499.5 3,417.4 476,231 7,285.4 4,731.8 471,463 6,317.2 3,912.4
Monthly Wage of the Household Head 1,017,369 358.0 359.8 327,050 346.3 310.3 349,065 400.6 397.9 341,254 325.6 358.7
Monthly Consumption Expenditures (Total) 1,426,885 299.1 250.3 479,191 274.0 210.6 476,231 326.5 277.7 471,463 296.9 255.3
Monthly Consumption Exp. (excl. Hous. & Remit.) 1,426,885 272.8 223.2 479,191 253.6 196.2 476,231 295.3 246.0 471,463 269.5 222.9
Food 1,426,885 72.4 33.1 479,191 72.2 31.7 476,231 76.9 35.2 471,463 68.0 31.7
Housing 1,426,885 17.5 77.6 479,191 13.2 40.9 476,231 20.5 89.5 471,463 18.9 91.8
Fuel, Light, and Water 1,426,885 19.7 12.6 479,191 16.9 11.5 476,231 20.4 12.7 471,463 21.9 13.1
Furniture and Household Utensils 1,426,885 11.2 34.9 479,191 11.5 37.9 476,231 12.3 38.8 471,463 9.7 26.6
Clothing and Footwear 1,426,885 17.5 36.3 479,191 19.7 39.5 476,231 19.6 40.5 471,463 13.0 27.0
Medical Care 1,426,885 10.0 26.6 479,191 7.1 20.2 476,231 10.3 26.8 471,463 12.6 31.5
Transportation and Communication 1,426,885 31.7 108.7 479,191 24.9 85.9 476,231 32.7 120.2 471,463 37.5 116.6
Education 1,426,885 12.6 55.8 479,191 11.0 42.4 476,231 14.4 65.7 471,463 12.3 56.8
Culture and Recreation 1,426,885 28.8 52.4 479,191 24.5 49.0 476,231 31.7 56.5 471,463 30.4 51.2
Other Consumption Expenditures 1,426,885 77.8 133.0 479,191 73.0 111.1 476,231 87.7 149.5 471,463 72.7 135.0
Other Consumption Exp. (excl. Remittances) 1,426,885 69.0 115.2 479,191 65.7 98.3 476,231 77.0 128.9 471,463 64.3 116.1
Households without Large Remittances
Number of Household Members 1,337,427 3.39 1.26 449,599 3.68 1.29 443,797 3.36 1.26 444,031 3.11 1.17
Age of the Husband 1,337,427 51.2 14.3 449,599 47.4 13.0 443,797 51.1 13.9 444,031 55.2 14.9
Age of the Wife 1,222,339 48.0 13.8 414,858 43.9 12.2 408,399 48.0 13.4 399,082 52.4 14.3
Annual Income of the Previous Year 1,337,427 6,168.7 3,935.7 449,599 5,344.9 3,267.7 443,797 7,044.5 4,517.8 444,031 6,127.6 3,740.2
Monthly Wage of the Household Head 951,466 344.2 346.5 306,584 335.9 299.9 324,977 384.0 381.8 319,905 311.7 346.6
Monthly Consumption Expenditures (Total) 1,337,427 284.8 232.1 449,599 262.5 197.1 443,797 309.1 255.6 444,031 283.0 237.8
Monthly Consumption Exp. (excl. Hous. & Remit.) 1,337,427 266.8 216.7 449,599 248.8 190.9 443,797 288.1 237.4 444,031 263.7 217.6
Food 1,337,427 71.9 33.0 449,599 72.0 31.6 443,797 76.3 35.1 444,031 67.4 31.5
Housing 1,337,427 17.7 77.0 449,599 13.3 40.9 443,797 20.7 88.6 444,031 19.1 91.1
Fuel, Light, and Water 1,337,427 19.6 12.5 449,599 16.8 11.3 443,797 20.3 12.6 444,031 21.7 13.0
Furniture and Household Utensils 1,337,427 10.9 34.3 449,599 11.2 37.2 443,797 12.0 38.5 444,031 9.5 25.8
Clothing and Footwear 1,337,427 16.8 34.0 449,599 19.0 37.4 443,797 18.8 37.2 444,031 12.6 25.6
Medical Care 1,337,427 9.9 26.6 449,599 7.0 19.9 443,797 10.2 26.8 444,031 12.5 31.5
Transportation and Communication 1,337,427 30.6 106.7 449,599 24.2 84.7 443,797 31.5 118.0 444,031 36.2 114.2
Education 1,337,427 12.0 51.2 449,599 10.7 38.6 443,797 13.6 57.9 444,031 11.7 54.9
Culture and Recreation 1,337,427 28.3 51.3 449,599 24.0 47.8 443,797 31.1 55.0 444,031 29.8 50.5
Other Consumption Expenditures 1,337,427 67.1 112.1 449,599 64.2 95.9 443,797 74.6 125.0 444,031 62.6 113.3
Other Consumption Exp. (excl. Remittances) 1,337,427 66.8 111.9 449,599 63.9 95.6 443,797 74.3 124.9 444,031 62.3 113.2
Households With at Least One Child and Without Large Remittances
Number of Household Members 844,220 3.93 1.01 288,570 3.98 0.91 293,196 3.98 1.07 262,454 3.80 1.03
Age of the Husband 844,220 46.6 12.0 288,570 43.6 10.3 293,196 46.8 11.6 262,454 49.5 13.2
Age of the Wife 785,900 43.2 11.2 279,043 40.5 9.8 271,839 43.4 11.0 235,018 46.1 12.2
Annual Income of the Previous Year 844,220 6,627.5 3,987.2 288,570 5,525.2 3,145.8 293,196 7,631.9 4,556.4 262,454 6,717.4 3,820.1
Monthly Wage of the Household Head 641,036 399.2 352.0 213,778 365.2 304.2 224,227 446.0 386.1 203,031 383.3 353.8
Monthly Consumption Expenditures (Total) 844,220 302.4 231.1 288,570 275.2 193.7 293,196 330.0 254.7 262,454 301.5 237.4
Monthly Consumption Exp. (excl. Hous. & Remit.) 844,220 284.2 218.7 288,570 260.8 188.1 293,196 309.2 240.7 262,454 281.9 221.2
Food 844,220 77.2 33.5 288,570 75.8 30.5 293,196 82.9 36.0 262,454 72.2 32.8
Housing 844,220 17.9 69.2 288,570 14.0 39.4 293,196 20.5 78.1 262,454 19.3 82.8
Fuel, Light, and Water 844,220 20.7 12.9 288,570 17.0 11.0 293,196 21.8 13.3 262,454 23.3 13.6
Furniture and Household Utensils 844,220 11.3 35.3 288,570 11.6 38.0 293,196 12.5 40.0 262,454 9.7 25.2
Clothing and Footwear 844,220 18.4 35.0 288,570 20.2 37.2 293,196 20.6 38.3 262,454 14.0 27.2
Medical Care 844,220 9.6 25.0 288,570 7.0 19.0 293,196 10.2 26.2 262,454 11.7 28.9
Transportation and Communication 844,220 33.3 113.4 288,570 25.6 88.8 293,196 34.3 126.1 262,454 40.6 121.7
Education 844,220 18.0 62.2 288,570 14.1 44.0 293,196 20.4 69.6 262,454 19.6 69.8
Culture and Recreation 844,220 29.6 49.1 288,570 25.2 46.5 293,196 32.7 52.2 262,454 30.9 47.9
Other Consumption Expenditures 844,220 66.5 101.8 288,570 64.6 86.9 293,196 74.0 114.3 262,454 60.2 101.5
Other Consumption Exp. (excl. Remittances) 844,220 66.2 101.6 288,570 64.2 86.6 293,196 73.8 114.2 262,454 59.9 101.4
Note: The unit for the value for incomes and consumption expenditures is 1,000 yen.
All Observations 1984-1988 Observations 1994-1998 Observations 2004-2008 Observations

19
Table 2: Cumulated Consumption Expenditure (Based on 2004-2008 FIES Observations)
Age Without With at Least Without With at LeastChildren One Child Children One Child
7.2.1 Consumption Expenditure (Total)
0-18 18,856 3,315 19,012 3,605(1,042) (222) (1,043) (224)
19-23 4,300 1,174 4,608 1,397(262) (160) (260) (149)
23-43 36,989 23,896 30,606 23,674(999) (805) (928) (1,304)
44-64 39,207 29,676 42,133 42,292(593) (484) (606) (911)
Statistical Significance of the Differences
(Son) (Daughter) (1st Child) (Others) (Husband) (Wife) (Without Ch.) (With Ch.)0-18 *** ***
19-23 *** *** *
23-43 *** *** (***/**) ( / )
44-64 *** (***/ ) (***/***)
Number of Observations 471,463Adjusted R-squared 0.601
7.2.2 Consumption Expenditure Excluding Remittances
0-18 16,878 4,690 17,049 4,936(995) (212) (997) (214)
19-23 3,937 1,880 3,989 2,062(250) (153) (249) (143)
23-43 37,107 23,011 30,274 24,931(955) (769) (886) (1246)
44-64 35,948 27,311 37,269 41,602(567) (463) (579) (871)
Statistical Significance of the Differences
(Son) (Daughter) (1st Child) (Others) (Husband) (Wife) (Without Ch.) (With Ch.)0-18 *** ***
19-23 *** ***
23-43 *** *** (***/***) ( /***)
44-64 *** *** ( /* ) (***/***)
Number of Observations 471,463Adjusted R-squared 0.607
Note: Parameters are estimated by OLS.
1st Child vs. Other Children Son vs. Daughter With vs. Without Children Husband vs. Wife
1st Child vs. Other Children Son vs. Daughter With vs. Without Children Husband vs. Wife
Son Daughter Husband (Father) Wife (Mother)
1st Child Others 1st Child Others

20

21
Table 3 (continued): Cum
ulated Consum
ption Expenditure by C
ategory (based on 2004-2008 FIES
data)(U
nit: 1,000 yen)
Without
With at Least
Without
With at Least
Children
One C
hildC
hildren O
ne Child
(Son)(D
aughter)(1st child)
(Others)
(Husband)
(Wife)
(Without Ch.(W
ith Ch.)
(6) Transport. &
Com
munication
Num
ber of Observations=
444,102A
djusted R-squared=
0.099
13-181,250
4301,235
235**
19-23626
433531
36723-43
5,9734,763
5,1804,834
**( / )
( / )
44-644,992
3,8814,911
5,407***
( / )(** /***)
(7) Education
Num
ber of Observations=
444,102A
djusted R-squared=
0.197
0-184,622
2,0434,586
2,105***
***
19-231,576
9071,449
668***
******
***
(8) Culture &
Recreation
Num
ber of Observations=
444,102A
djusted R-squared=
0.274
0-182,524
4172,854
611***
******
***
19-23129
-70235
110***
*****
***
23-433,969
2,5073,834
1,028***
***( / )
(***/***)
44-643,354
3,2204,231
3,884(***/** )
( /***)
(9) Other C
onsumption ex. R
emitt.
Num
ber of Observations=
444,102A
djusted R-squared=
0.248
23-437,752
6,5965,350
5,375**
(***/** )(** / )
44-648,306
7,03510,268
10,598***
( /***)(***/***)
Total C
onsumption E
xpenditures (=(1)+(2)+(3)+(4)+(5)+(6)+(7)+(8)+(9))
0-1816,547
5,62016,593
5,59519-23
3,7872,182
3,7212,033
23-4331,706
22,02025,443
19,78444-64
31,08725,957
34,72935,718
Notes. Estim
ation is by OLS. The coefficient estim
ates give the predicted average consumption expenditures by age, sex, etc. Estim
ates reported in this table are calculated as sums of the estim
ated parameters over the respective age ranges.
***, **, and * denote that the null hypothesis is rejected at the 1, 5, and 10 percent significance level, respectively. Total consum
ption expenditure is the sum of the nine categories and therefore does not include housing expenditure and rem
ittances.
With vs. W
ithout a ChildH
usband vs. Wife
1st childO
thers1st child
Others
1st Child vs. O
ther Children
Son vs. Daughter
SonD
aughterH
usband (Father)W
ife (Mother)
Statistical Significance of the Differences
22
Table 4: Fam
ilies' Consum
ption Expenditure per C
hild (From
Age 0 to 18): 2004-2008, 1994-1998, and 1984-1988
Value
ShareV
alueShare
Value
ShareV
alueShare
Value
ShareV
alueShare
Value
ShareV
alueShare
Value
Share
Per Child by C
ategory
Food4,707
28%3,213
29%2,715
29%4,189
29%3,100
31%2,738
31%2,689
29%2,197
33%2,033
34% Fuel, Light, and W
ater964
6%725
7%645
7%921
6%690
7%613
7%840
9%587
9%503
9% Furniture, etc.
3662%
2282%
1822%
40%
260%
330%
-110-1%
-50-1%
-30-1%
Clothing, etc.
1,2047%
6656%
4865%
4363%
2783%
2263%
5596%
2824%
1893%
Medical C
are792
5%530
5%442
5%669
5%499
5%443
5%383
4%292
4%262
4% Transp. &
Com
mun.
1,2427%
7877%
6367%
1,3529%
7207%
5106%
6057%
2734%
1623%
Education4,604
28%3,339
30%2,917
32%3,947
28%3,115
31%2,837
33%2,189
24%1,902
28%1,806
31% C
ulture & R
ecreation2,689
16%1,602
14%1,239
13%2,783
19%1,692
17%1,328
15%2,040
22%1,247
19%983
17%
Per Child Total
16,570100%
11,089100%
9,262100%
14,300100%
10,121100%
8,727100%
9,195100%
6,730100%
5,908100%
1.81.6
1.6Fam
ily Total Exp. on Children
(Relative to Parental Couple Exp.)
(Cf.)
Cons. by an A
dult Couple
(Aged 23 to 64)
Annual Incom
e (A
ged 23 to 64) H
ousehold Head W
ages (A
ged 23 to 64)
Notes: Total consum
ption expenditure in this table is the sum of the eight categories above (from
food to culture & recreation) and therefore does not include housing expenditure and rem
ittances.
188,659207,449
110%203,265
225,089
97%201,200
206,355103%
159,105173,216
109%111%
274,384260,394
95%285,311
277,274
122,965103,480
84%131,126
116,39489%
107,548100,685
94%
Value (a)
Value (b)
(b)/(a)V
alue (a)V
alue (b)(b)/(a)
Value (a)
Value (b)
(b)/(a)(Sum
of Hus. &
Wife)
(Sum of H
us. & W
ife)(Sum
of Hus. &
Wife)
(Sum of H
us. & W
ife)(Sum
of Hus. &
Wife)
Couple without Children
Parental CoupleCouple w
ithout ChildrenParental Couple
Couple without Children
22%9%
13%18%
(Sum of H
us. & W
ife)Parental Couple
16%21%
27%12%
17%
(Male &
Female A
verage)
16,57022,178
27,78514,300
20,24126,182
9,19513,459
17,724
(Male &
Female A
verage)(M
ale & Fem
ale Average)
(Male &
Female A
verage)(M
ale & Fem
ale Average)
(Male &
Female A
verage)(M
ale & Fem
ale Average)
(Male &
Female A
verage)
(Unit: 1,000 yen)
2004-20081994-1998
1984-1988O
ne Child
Two C
hildrenThree C
hildrenO
ne Child
Two C
hildrenThree C
hildrenO
ne Child
Two C
hildrenThree C
hildren(M
ale & Fem
ale Average)

23
Figure 1: Number of Individual Observations in the FIES by Sex and Age
50,000 40,000 30,000 20,000 10,000 0 10,000 20,000 30,000 40,000 50,0000
11223344556677
All available observations
Female
Male
50,000 40,000 30,000 20,000 10,000 0 10,000 20,000 30,000 40,000 50,0000
1020304050607080
Observations for all periods but excluding households with large remittances
Female
Male
20,000 15,000 10,000 5,000 0 5,000 10,000 15,000 20,0000
1020304050607080
Observations for 1984-88 excluding households with large remittances
Female
Male
20,000 15,000 10,000 5,000 0 5,000 10,000 15,000 20,0000
11223344556677
Observations for 1994-98 excluding households with large remittances
Female
Male
20,000 15,000 10,000 5,000 0 5,000 10,000 15,000 20,0000
11223344556677
Observations for 2004-08 excluding households with large remittances
Female
Male

24
Figure 2: Annual Consumption by Sex, Age, Etc., Calculated from the Estimates
Note: Average consumption expenditures by age are calculated using OLS estimated parameters.
-500
0
500
1,000
1,500
2,000
2,500
3,000
0 2 4 6 8 10121416182022242628303234363840424446485052545658606264666870
1,00
0 ye
n
Age
2.1 Consumption Expenditure (Total), 2004-2008
Son (1st child) Son (Others)
Dau (1st child) Dau (Others)
Hus (wo chld) Hus (w chld)
Wif (wo chld) Wif (w chld)
-500
0
500
1,000
1,500
2,000
2,500
3,000
0 2 4 6 8 10121416182022242628303234363840424446485052545658606264666870
1,00
0 ye
n
Age
2.2 Consumption Exp. (excl. Remittances), 2004-2008
Son (1st child) Son (Others)Dau (1st child) Dau (Others)Hus (wo chld) Hus (w chld)Wif (wo chld) Wif (w chld)
25
Figure 3: A Few
Exam
ples of Problematic E
stimates
-200
-100 0
100
200
300
400
500
02
46
81012141618 2022242628303234363840424446485052545658606264666870
1,000 yen
Age
3.1 Housing E
xpenditure, 2004-2008Son (1st child)Son (O
thers)D
au (1st child)D
au (Others)
Hus (w
o chld)H
us (w chld)
Wif (w
o chld)W
if (w chld)
-400
-200 0
200
400
600
800
1,000
1,200
02
46
8101214161820222426283032343638404244464850525456586062646668
1,000 yen
Age
3.3 Other C
onsumption E
xpenditures, 2004-2008
Son (1st child)Son (O
thers)D
au (1st child)D
au (Others)
Hus (w
o chld)H
us (w chld)
Wif (w
o chld)W
if (w chld)
-300
-200
-100 0
100
200
300
400
500
600
700
02
46
810121416182022242628303234363840424446485052545658606264666870
1,000 yen
Age
3.2 Education, 2004-2008
Son (1st child)Son (O
thers)D
au (1st child)D
au (Others)
Hus (w
o chld)H
us (w chld)
Wif (w
o chld)W
if (w chld)
-400
-200 0
200
400
600
800
1,000
1,200
02
46
810121416182022242628303234363840424446485052545658606264666870
1,000 yen
Age
3.4 Rem
ittances, 2004-2008
Son (1st child)Son (O
thers)D
au (1st child)D
au (Others)
Hus (w
o chld)H
us (w chld)
Wif (w
o chld)W
if (w chld)

26
Figure 4: Annual C
onsumption by C
ategory (2004-2008) Calculated from
the OL
S Estim
ates
0
100
200
300
400
500
600
03
69
1215
1821
2427
3033
3639
4245
4851
5457
6063
6669
1,000 yen
Age
4.1 Food Son (1st child.)
Son (Others)
Dau (1st child.)
Dau (O
thers)H
us (wo chld)
Hus (w
chld)W
if (wo chld)
Wif (w
chld)
0
40
80
120
160
03
69
1215
1821
2427
3033
3639
4245
4851
5457
6063
6669
1,000 yen
Age
4.2 Fuel, Light, and W
ater
-40 0
40
80
120
03
69
1215
1821
2427
3033
3639
4245
4851
5457
6063
6669
1,000 yen
Age
4.3 Furniture and Household U
tensils
-40 0
40
80
120
160
03
69
1215
1821
2427
3033
3639
4245
4851
5457
6063
6669
1,000 yen
Age
4.4 Clothing and Footw
ear
-40 0
40
80
120
160
03
69
1215
1821
2427
3033
3639
4245
4851
5457
6063
6669
1,000 yen
Age
4.5 Medical C
are
-100 0
100
200
300
400
500
03
69
1215
1821
2427
3033
3639
4245
4851
5457
6063
6669
1,000 yen
Age
4.6 Transportation and Com
munication
-100 0
100
200
300
400
500
600
700
03
69
1215
1821
2427
3033
3639
4245
4851
5457
6063
6669
1,000 yen
Age
4.7 Education
-100
-50 0
50
100
150
200
250
300
03
69
1215
1821
2427
3033
3639
4245
4851
5457
6063
6669
1,000 yen
Age
4.8 Culture and R
ecreation
0
100
200
300
400
500
600
700
03
69
1215
1821
2427
3033
3639
4245
4851
5457
6063
6669
1,000 yen
Age
4.9 Other C
onsumption E
xpenditures (excl. Rem
ittances)

27
Figure 5: Annual Consumption Calculated as the Sum of Individual Categories
Note: Average consumption (by age, sex, …) is calculated as the sum of the eight estimated consumption categories.
0
500
1000
1500
2000
2500
0 3 6 9 12 15 18 21 24 27 30 33 36 39 42 45 48 51 54 57 60 63 66 69
1,00
0 ye
n
Age
Consumption (excl. Housing Expenditure and Remittances), 2004-2008
Son (1st child.) Son (Others)
Dau (1st child.) Dau (Others)
Hus (wo chld) Hus (w chld)
Wif (wo chld) Wif (w chld)
Related Documents