The evolutionary history of the Mediterranean centipede Scolopendra cingulata (Latreille, 1829) (Chilopoda: Scolopendridae) across the Aegean archipelago STYLIANOS M. SIMAIAKIS 1 , AGGELIKI DIMOPOULOU 1 , ANASTASIOS MITRAKOS 2 , MOISIS MYLONAS 1 and ARISTEIDIS PARMAKELIS 2 * 1 Natural History Museum of Crete, University of Crete, Heraklion, GR-71409, PO Box 2208, Crete, Greece 2 Department of Ecology and Taxonomy, Faculty of Biology, University of Athens, Panepistimioupoli Zografou, GR-15784 Athens, Greece Received 11 July 2011; revised 15 September 2011; accepted for publication 16 September 2011In this study we investigate the evolutionary relationships of Scolopendra cingulata (Latreille, 1829) within insular Greece. Our main goal is to infer the time frame of the differentiation of the species in the study area. In this regard, sequence data originating from three mitochondrial genes are used to reconstruct the evolutionary history of 47 insular populations of S. cingulata from the Aegean archipelago. Within the phylogenetic framework and by implementing a relaxed molecular clock methodology, we infer the time estimates of separations of the S. cingulata lineages. The results of the phylogenetic analysis support the presence of three distinct S. cingulata groups in the region. The first group accommodates populations from the eastern Aegean islands, and is closely related to the second group that hosts mainly populations of northern and central Cyclades. The third group is composed of insular populations originating from southern Cyclades. Different temporal splitting scenarios have been evalu- ated. Based on the scenario strongly supported by the data, we propose a biogeographical scenario that could account for the contemporary distribution of the species’ lineages. The splitting events of S. cingulata are estimated to have occurred within the late Miocene. The historical events of the last 13.77 Myr have shaped, through a series of mostly vicariant and dispersal incidents, the present-day biogeographical pattern of the species. © 2012 The Linnean Society of London, Biological Journal of the Linnean Society, 2012, ••, ••–••. ADDITIONAL KEYWORDS: eastern Mediterranean – Messinian Salinity Crisis – Mid-Aegean trench – mtDNA – phylogeography. INTRODUCTION The Aegean archipelago has particular characteristics that make it of interest as a study area for phylo- geography; the high levels of diversity and endemism reflect the complexity of the palaeogeographical history of the Aegean area (Strid & Tan, 1997; Sfenthourakis & Legakis, 2001; Bittkau & Comes, 2005, 2009; Parmakelis et al., 2006a) together with intense faunal and floral invasions, originating from three different geographical regions (Europe, Africa, Asia) (Triantis & Mylonas, 2009). Consequently, this part of the north-eastern Mediterranean region con- stitutes a challenging geographical area of complex geological history to investigate phylogeographical events. Several phylogeographical studies have shed light on the evolutionary history of the Aegean (Douris et al., 1995; Poulakakis et al., 2003, 2005a, b; Parmakelis et al., 2006a, b); nevertheless, discrepan- cies among these testify to the need for further studies, with a focus on a variety of taxonomic groups (Parmakelis et al., 2006a). In this regard, this study reconstructs the evolutionary history of a centipede species distributed in the Aegean. The Aegean centipede fauna has only recently been the focus of systematic, biogeographical and ecological studies (Zapparoli, 2002; Simaiakis, 2005; Simaiakis, *Corresponding author. E-mail: [email protected] Biological Journal of the Linnean Society, 2012, ••, ••–••. With 4 figures © 2012 The Linnean Society of London, Biological Journal of the Linnean Society, 2012, ••, ••–•• 1

Welcome message from author
This document is posted to help you gain knowledge. Please leave a comment to let me know what you think about it! Share it to your friends and learn new things together.
Transcript
The evolutionary history of the Mediterranean centipedeScolopendra cingulata (Latreille, 1829) (Chilopoda:Scolopendridae) across the Aegean archipelago
STYLIANOS M. SIMAIAKIS1, AGGELIKI DIMOPOULOU1, ANASTASIOS MITRAKOS2,MOISIS MYLONAS1 and ARISTEIDIS PARMAKELIS2*
1Natural History Museum of Crete, University of Crete, Heraklion, GR-71409, PO Box 2208, Crete,Greece2Department of Ecology and Taxonomy, Faculty of Biology, University of Athens, PanepistimioupoliZografou, GR-15784 Athens, Greece
Received 11 July 2011; revised 15 September 2011; accepted for publication 16 September 2011bij_1813 1..15
In this study we investigate the evolutionary relationships of Scolopendra cingulata (Latreille, 1829) within insularGreece. Our main goal is to infer the time frame of the differentiation of the species in the study area. In thisregard, sequence data originating from three mitochondrial genes are used to reconstruct the evolutionary historyof 47 insular populations of S. cingulata from the Aegean archipelago. Within the phylogenetic framework and byimplementing a relaxed molecular clock methodology, we infer the time estimates of separations of the S. cingulatalineages. The results of the phylogenetic analysis support the presence of three distinct S. cingulata groups in theregion. The first group accommodates populations from the eastern Aegean islands, and is closely related to thesecond group that hosts mainly populations of northern and central Cyclades. The third group is composed ofinsular populations originating from southern Cyclades. Different temporal splitting scenarios have been evalu-ated. Based on the scenario strongly supported by the data, we propose a biogeographical scenario that couldaccount for the contemporary distribution of the species’ lineages. The splitting events of S. cingulata are estimatedto have occurred within the late Miocene. The historical events of the last 13.77 Myr have shaped, through a seriesof mostly vicariant and dispersal incidents, the present-day biogeographical pattern of the species. © 2012 TheLinnean Society of London, Biological Journal of the Linnean Society, 2012, ••, ••–••.
ADDITIONAL KEYWORDS: eastern Mediterranean – Messinian Salinity Crisis – Mid-Aegean trench –mtDNA – phylogeography.
INTRODUCTION
The Aegean archipelago has particular characteristicsthat make it of interest as a study area for phylo-geography; the high levels of diversity and endemismreflect the complexity of the palaeogeographicalhistory of the Aegean area (Strid & Tan, 1997;Sfenthourakis & Legakis, 2001; Bittkau & Comes,2005, 2009; Parmakelis et al., 2006a) together withintense faunal and floral invasions, originating fromthree different geographical regions (Europe, Africa,Asia) (Triantis & Mylonas, 2009). Consequently, thispart of the north-eastern Mediterranean region con-
stitutes a challenging geographical area of complexgeological history to investigate phylogeographicalevents.
Several phylogeographical studies have shedlight on the evolutionary history of the Aegean(Douris et al., 1995; Poulakakis et al., 2003, 2005a, b;Parmakelis et al., 2006a, b); nevertheless, discrepan-cies among these testify to the need for furtherstudies, with a focus on a variety of taxonomic groups(Parmakelis et al., 2006a). In this regard, this studyreconstructs the evolutionary history of a centipedespecies distributed in the Aegean.
The Aegean centipede fauna has only recently beenthe focus of systematic, biogeographical and ecologicalstudies (Zapparoli, 2002; Simaiakis, 2005; Simaiakis,*Corresponding author. E-mail: [email protected]
Biological Journal of the Linnean Society, 2012, ••, ••–••. With 4 figures
© 2012 The Linnean Society of London, Biological Journal of the Linnean Society, 2012, ••, ••–•• 1
Minelli & Mylonas, 2005). Following these studies,however, several questions, summarized in Simaiakis& Mylonas (2008), have been raised. Besides the factthat the phylogenetic relationships of the Scolopendraspecies distributed in the area remain incompletelyresolved (Simaiakis, Giokas & Korsós, 2011), the pat-terns of distribution exhibited by the species withinthe Aegean area are difficult to interpret. Forinstance, Scolopendra canidens can only be found in asmall group of islands in the south-west part of theCyclades and in a single island of the south-eastAegean islands. At the same time, Scolopendra cin-gulata, a species distributed throughout the Mediter-annean region, is absent from Crete and its satelliteislands. Finally, the island of Crete (and satelliteislands) hosts the endemic species Scolopendracretica.
The order Chilopoda comprises around 3150 recog-nized species, while Scolopendromorpha includesnearly 700 species, belonging to 34 genera, and five
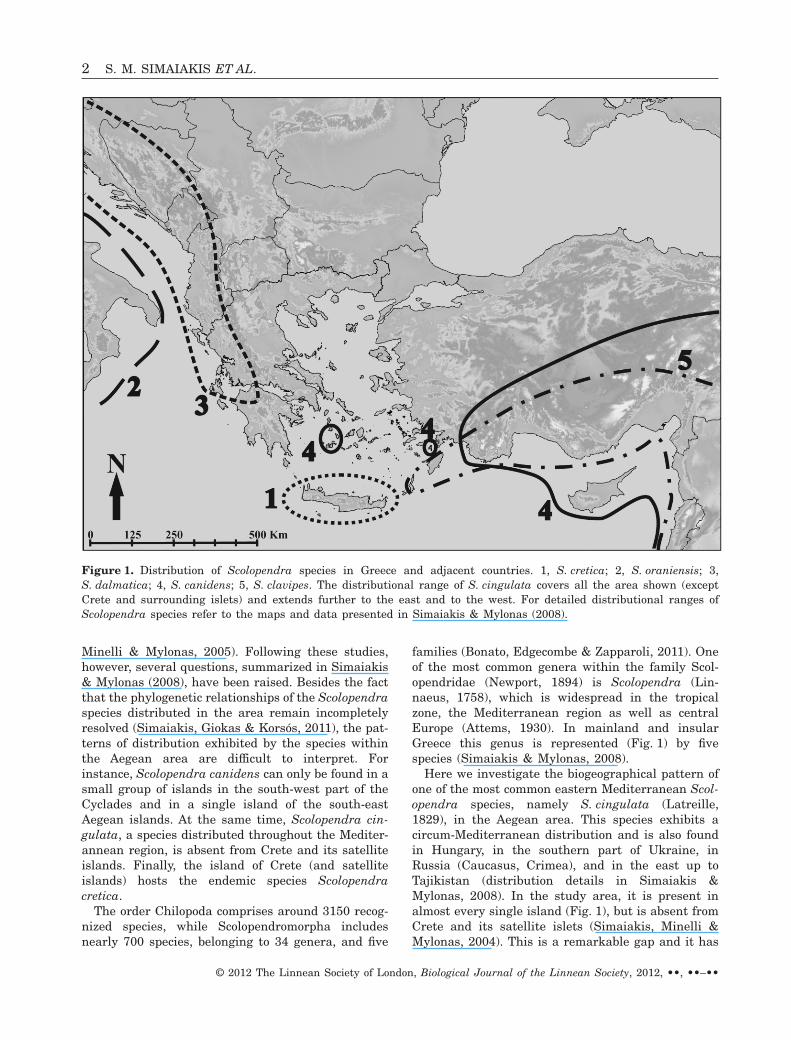
families (Bonato, Edgecombe & Zapparoli, 2011). Oneof the most common genera within the family Scol-opendridae (Newport, 1894) is Scolopendra (Lin-naeus, 1758), which is widespread in the tropicalzone, the Mediterranean region as well as centralEurope (Attems, 1930). In mainland and insularGreece this genus is represented (Fig. 1) by fivespecies (Simaiakis & Mylonas, 2008).
Here we investigate the biogeographical pattern ofone of the most common eastern Mediterranean Scol-opendra species, namely S. cingulata (Latreille,1829), in the Aegean area. This species exhibits acircum-Mediterranean distribution and is also foundin Hungary, in the southern part of Ukraine, inRussia (Caucasus, Crimea), and in the east up toTajikistan (distribution details in Simaiakis &Mylonas, 2008). In the study area, it is present inalmost every single island (Fig. 1), but is absent fromCrete and its satellite islets (Simaiakis, Minelli &Mylonas, 2004). This is a remarkable gap and it has
Figure 1. Distribution of Scolopendra species in Greece and adjacent countries. 1, S. cretica; 2, S. oraniensis; 3,S. dalmatica; 4, S. canidens; 5, S. clavipes. The distributional range of S. cingulata covers all the area shown (exceptCrete and surrounding islets) and extends further to the east and to the west. For detailed distributional ranges ofScolopendra species refer to the maps and data presented in Simaiakis & Mylonas (2008).
2 S. M. SIMAIAKIS ET AL.
© 2012 The Linnean Society of London, Biological Journal of the Linnean Society, 2012, ••, ••–••
been documented to occur in other major islands ofthe Mediterranean as well as the Balearic Islands,Corsica, and Sardinia (Simaiakis & Mylonas, 2008).This is the first study that uses molecular data toinvestigate the phylogeographical pattern of S. cingu-lata in the Aegean area. Using sequence data origi-nating from three mtDNA loci, we reconstruct theevolutionary history of the species in insular Greece.In conjunction with the well-studied palaeogeographyof the north-eastern Mediterranean region, we esti-mate the time frame of the species differentiation inthe area. Finally, we propose the most plausible sce-nario accounting for the present-day biogeographicalaffinities of its populations.
MATERIAL AND METHODSSPECIMENS
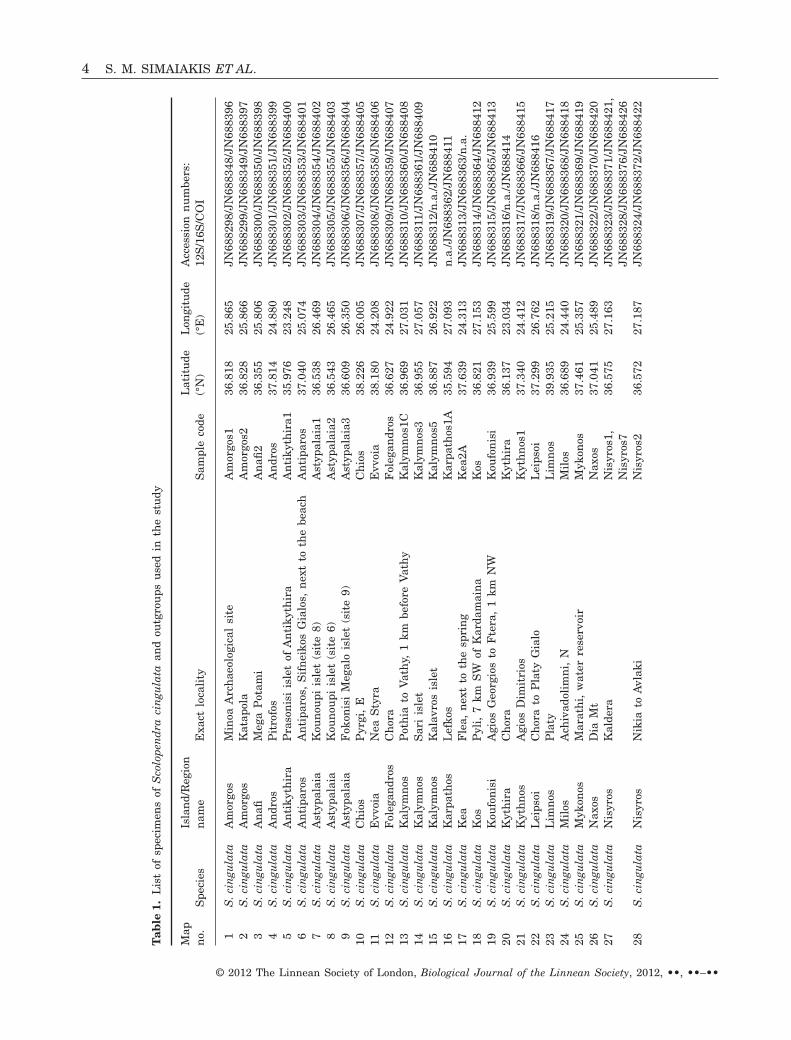
All the specimens used in the study were hand col-lected and then immediately placed in 95% ethanolsolution. Specimens were preserved in ethanol untilfurther processing. A total of 47 specimens of S. cin-gulata were collected from locations originating fromAegean island populations. There was a single sam-pling locality (Nisyros, Kaldera) from which twospecimens were used. In all other cases one individualfrom each sampling location was used in the analysis(Table 1). All the samples involved in the study havebeen deposited in the collections of the NaturalHistory Museum of Crete (NHMC). Details of thesampling locations are presented in Table 1 andFigure 2. In practice the samples of S. cingulataincluded in the study cover the whole distributionalrange of the species within the Aegean archipelago. Inthe course of using the most appropriate outgroupspecies for our analysis, several closely related (con-specific or not) species were tested. Our goal in theoutgroup choice was to obtain a well-resolved phylo-genetic tree. Among those species tested, we con-cluded that S. cretica (Attems, 1911) and S. clavipes(Newport, 1844) were the most appropriate for thisstudy. These two species are Aegean ‘residents’ andtogether with S. cingulata and S. clavipes they com-plete the Scolopendra species of the Aegean (Fig. 1).S. cretica is endemic to the island of Crete and itsadjacent small islands and samples from two loca-tions (Table 1) were used. Scolopendra canidens has awide distributional range in the Mediterranean. Itwas represented in our analysis with two specimensoriginating from two islands of the Cyclades region(Table 1).
DNA ISOLATION, AMPLIFICATION AND SEQUENCING
Total genomic DNA was extracted using variousDNA extraction protocols. Some samples were pro-
cessed using commercially available kits such asthe Nucleospin Tissue (Macherey-Nagel, Düren,Germany) or the DNAeasy Blood and Tissue kit(Qiagen, Valencia, CA, USA), whereas others weretreated using conventional DNA extraction protocolssuch as the CTAB 2X protocol (Winnepenninckx,Backeljau & De Wachter, 1993) as described by Par-makelis et al. (2003). The starting material in everyDNA extraction assay was muscle tissue obtainedfrom various body parts of the specimens. DNA wasultimately extracted from 51 specimens, including theingroup and outgroup taxa (Table 1). Fragments ofthree mitochondrial genes, namely 12S rDNA (12S),16S rDNA (16S) and cytochrome c oxidase subunit I(COI), were amplified using optimized PCR protocols(Saiki et al., 1988). For amplification of the COI gene,two pairs of primers were used. The first pairincluded the primers C1-J-1718 (mt6) and C1-N-2191(nancy) as reported by Simon et al. (1994), whereasthe second pair involved the primer LCO1490 (Folmeret al., 1994) and the primer HCOoutout (Prendini,Weygoldt & Wheeler, 2005). The former primer pairtargets a fragment of 470 bp and the latter a frag-ment of 850 bp. The primer pair SR-J-14233 (12Sbi)and SR-N-14588 (12Sai) (Simon et al., 1994) was usedto amplify a fragment of 12S rDNA approximately350 bp in length. Finally, for 16S rDNA, the primers16Sbr and 16Sar (Simon et al., 1994) were used, tar-geting a fragment of 510 bp. A typical PCR pro-gramme consisted of an initial denaturation step at95 °C for 3 min, 40 amplification cycles (94 °C for1 min, 45 °C for 1 min, 72 °C for 1.5 min), and a finalstep at 72 °C for 10 min in a TProfessional (BiometraGmbH, Göttingen, Germany) or a MyCycler (Bio-RadLaboratories, Inc) thermocycler. However, specificconditions were optimized for specimens and primerpairs. PCR products were visually inspected on a1.5% agarose gel. The products were purified usingcommercially available kits, and sequenced in bothdirections in a 3730 ABI capillary sequencer. Theprimers in the sequencing reactions were the same asin the PCRs. All sequences produced for this studyhave been deposited in GenBank under accessionnumbers JN688298 to JN688442 (Table 1).
DNA SEQUENCE HANDLING
Sequences were manually inspected and edited withCodonCode Aligner v.2.0.6. (CodonCode Corp.,Dedham, MA, USA). The homology of the producedsequences to the targeted mtDNA loci and organismwas validated through a comparison (via the BLASTtool) of our sequences with those available in publicgenetic databanks. Sequences were then alignedusing CodonCode Aligner. In each mtDNA gene setwe evaluated (results not shown) the possibility of
EVOLUTION OF SCOLOPENDRA CINGULATA IN THE AEGEAN 3
© 2012 The Linnean Society of London, Biological Journal of the Linnean Society, 2012, ••, ••–••
Tab
le1.
Lis
tof
spec
imen
sof
Sco
lope
nd
raci
ngu
lata
and
outg
rou
psu
sed
inth
est
udy
Map
no.
Spe
cies
Isla
nd/
Reg
ion
nam
eE
xact
loca
lity
Sam
ple
code
Lat
itu
de(°
N)
Lon
gitu
de(°
E)
Acc
essi
onn
um
bers
:12
S/1
6S/C
OI
1S
.cin
gula
taA
mor
gos
Min
oaA
rch
aeol
ogic
alsi
teA
mor
gos1
36.8
1825
.865
JN68
8298
/JN
6883
48/J
N68
8396
2S
.cin
gula
taA
mor
gos
Kat
apol
aA
mor
gos2
36.8
2825
.866
JN68
8299
/JN
6883
49/J
N68
8397
3S
.cin
gula
taA
nafi
Meg
aP
otam
iA
nafi
236
.355
25.8
06JN
6883
00/J
N68
8350
/JN
6883
984
S.c
ingu
lata
An
dros
Pit
rofo
sA
ndr
os37
.814
24.8
80JN
6883
01/J
N68
8351
/JN
6883
995
S.c
ingu
lata
An
tiky
thir
aP
raso
nis
iis
let
ofA
nti
kyth
ira
An
tiky
thir
a135
.976
23.2
48JN
6883
02/J
N68
8352
/JN
6884
006
S.c
ingu
lata
An
tipa
ros
An
tipa
ros,
Sif
nei
kos
Gia
los,
nex
tto
the
beac
hA
nti
paro
s37
.040
25.0
74JN
6883
03/J
N68
8353
/JN
6884
017
S.c
ingu
lata
Ast
ypal
aia
Kou
nou
piis
let
(sit
e8)
Ast
ypal
aia1
36.5
3826
.469
JN68
8304
/JN
6883
54/J
N68
8402
8S
.cin
gula
taA
styp
alai
aK
oun
oupi
isle
t(s
ite
6)A
styp
alai
a236
.543
26.4
65JN
6883
05/J
N68
8355
/JN
6884
039
S.c
ingu
lata
Ast
ypal
aia
Fok
onis
iM
egal
ois
let
(sit
e9)
Ast
ypal
aia3
36.6
0926
.350
JN68
8306
/JN
6883
56/J
N68
8404
10S
.cin
gula
taC
hio
sP
yrgi
,E
Ch
ios
38.2
2626
.005
JN68
8307
/JN
6883
57/J
N68
8405
11S
.cin
gula
taE
vvoi
aN
eaS
tyra
Evv
oia
38.1
8024
.208
JN68
8308
/JN
6883
58/J
N68
8406
12S
.cin
gula
taF
oleg
andr
osC
hor
aF
oleg
andr
os36
.627
24.9
22JN
6883
09/J
N68
8359
/JN
6884
0713
S.c
ingu
lata
Kal
ymn
osP
oth
iato
Vat
hy,
1km
befo
reV
ath
yK
alym
nos
1C36
.969
27.0
31JN
6883
10/J
N68
8360
/JN
6884
0814
S.c
ingu
lata
Kal
ymn
osS
ari
isle
tK
alym
nos
336
.955
27.0
57JN
6883
11/J
N68
8361
/JN
6884
0915
S.c
ingu
lata
Kal
ymn
osK
alav
ros
isle
tK
alym
nos
536
.887
26.9
22JN
6883
12/n
.a./J
N68
8410
16S
.cin
gula
taK
arpa
thos
Lef
kos
Kar
path
os1A
35.5
9427
.093
n.a
./JN
6883
62/J
N68
8411
17S
.cin
gula
taK
eaF
lea,
nex
tto
the
spri
ng
Kea
2A37
.639
24.3
13JN
6883
13/J
N68
8363
/n.a
.18
S.c
ingu
lata
Kos
Pyl
i,7
kmS
Wof
Kar
dam
ain
aK
os36
.821
27.1
53JN
6883
14/J
N68
8364
/JN
6884
1219
S.c
ingu
lata
Kou
fon
isi
Agi
osG
eorg
ios
toF
tera
,1
kmN
WK
oufo
nis
i36
.939
25.5
99JN
6883
15/J
N68
8365
/JN
6884
1320
S.c
ingu
lata
Kyt
hir
aC
hor
aK
yth
ira
36.1
3723
.034
JN68
8316
/n.a
./JN
6884
1421
S.c
ingu
lata
Kyt
hn
osA
gios
Dim
itri
osK
yth
nos
137
.340
24.4
12JN
6883
17/J
N68
8366
/JN
6884
1522
S.c
ingu
lata
Lei
psoi
Ch
ora
toP
laty
Gia
loL
eips
oi37
.299
26.7
62JN
6883
18/n
.a./J
N68
8416
23S
.cin
gula
taL
imn
osP
laty
Lim
nos
39.9
3525
.215
JN68
8319
/JN
6883
67/J
N68
8417
24S
.cin
gula
taM
ilos
Ach
ivad
olim
ni,
NM
ilos
36.6
8924
.440
JN68
8320
/JN
6883
68/J
N68
8418
25S
.cin
gula
taM
ykon
osM
arat
hi,
wat
erre
serv
oir
Myk
onos
37.4
6125
.357
JN68
8321
/JN
6883
69/J
N68
8419
26S
.cin
gula
taN
axos
Dia
Mt
Nax
os37
.041
25.4
89JN
6883
22/J
N68
8370
/JN
6884
2027
S.c
ingu
lata
Nis
yros
Kal
dera
Nis
yros
1,N
isyr
os7
36.5
7527
.163
JN68
8323
/JN
6883
71/J
N68
8421
,JN
6883
28/J
N68
8376
/JN
6884
2628
S.c
ingu
lata
Nis
yros
Nik
iato
Avl
aki
Nis
yros
236
.572
27.1
87JN
6883
24/J
N68
8372
/JN
6884
22
4 S. M. SIMAIAKIS ET AL.
© 2012 The Linnean Society of London, Biological Journal of the Linnean Society, 2012, ••, ••–••
29S
.cin
gula
taN
isyr
osM
oni
Eva
nge
list
rias
,ro
adto
Pal
aiok
astr
oN
isyr
os3
36.6
0127
.151
JN68
8325
/JN
6883
73/J
N68
8423
30S
.cin
gula
taN
isyr
osP
ach
eia
isle
tN
isyr
os4
36.5
6827
.072
JN68
8326
/JN
6883
74/J
N68
8424
31S
.cin
gula
taN
isyr
osP
ergo
usa
isle
tN
isyr
os5
36.5
8627
.040
JN68
8327
/JN
6883
75/J
N68
8425
32S
.cin
gula
taP
aros
Agi
oiP
ante
spe
akP
aros
37.0
4025
.178
JN68
8329
/JN
6883
77/J
N68
8427
33S
.cin
gula
taP
atm
osC
hor
ato
Kou
vari
,n
ext
toP
rofi
tis
Ilia
sP
atm
os1
37.2
9926
.546
JN68
8330
/JN
6883
78/J
N68
8428
34S
.cin
gula
taP
atm
osK
ampo
sto
Ger
anos
Pat
mos
2A37
.349
26.5
96JN
6883
31/J
N68
8379
/JN
6884
2935
S.c
ingu
lata
Pse
rim
osP
seri
mos
isle
t,N
WP
seri
mos
136
.939
27.1
30JN
6883
32/J
N68
8380
/JN
6884
3036
S.c
ingu
lata
Rod
osP
raso
nis
iR
odos
35.8
9327
.776
JN68
8333
/JN
6883
81/J
N68
8431
37S
.cin
gula
taS
alam
ina
Mav
rovo
un
iM
tS
alam
ina
37.9
2823
.494
JN68
8334
/JN
6883
82/J
N68
8432
38S
.cin
gula
taS
amos
Psi
liA
mm
osS
amos
3_1
37.7
0727
.025
JN68
8335
/JN
6883
83/J
N68
8433
39S
.cin
gula
taS
erif
osP
lake
s,A
gios
Geo
rgio
sS
erif
os1
37.1
5924
.492
JN68
8336
/JN
6883
84/n
.a.
40S
.cin
gula
taS
ifn
osA
gios
An
trea
s,h
isto
rica
lA
crop
ole
Sif
nos
136
.956
24.7
25JN
6883
37/J
N68
8385
/n.a
.41
S.c
ingu
lata
Sif
nos
Agi
osS
ymeo
npe
akS
ifn
os2
37.0
0124
.685
JN68
8338
/JN
6883
86/n
.a.
42S
.cin
gula
taS
ymi
Mon
iP
anor
mit
ito
Sym
i,5
kmaf
ter
Pan
orm
iti
Sym
i36
.571
27.8
43JN
6883
39/J
N68
8387
/JN
6884
34
43S
.cin
gula
taS
yros
Mav
riR
ach
i,A
eoli
anpa
rkS
yros
137
.462
24.9
16JN
6883
40/J
N68
8388
/JN
6884
3544
S.c
ingu
lata
Th
ira
Fir
a,5
kmS
Th
ira
36.3
8825
.437
JN68
8341
/JN
6883
89/J
N68
8436
45S
.cin
gula
taT
hir
aP
rofi
tis
Ilia
sM
t,cl
ose
tom
onas
tery
Th
ira2
36.3
6925
.462
JN68
8342
/JN
6883
90/J
N68
8437
46S
.cin
gula
taT
ilos
Mik
roC
hor
ioT
ilos
36.4
2327
.371
JN68
8343
/JN
6883
91/J
N68
8438
OU
TG
RO
UP
S47
S.c
reti
caC
rete
Irak
leio
,V
agio
nia
Irak
leio
1B35
.013
25.0
01JN
6883
44/J
N68
8392
/JN
6884
3948
S.c
reti
caC
rete
Psi
lore
itis
Mt.
,K
rou
son
as,
Agi
aA
ikat
erin
igo
rge
Psi
lore
itis
35.2
5224
.944
JN68
8345
/JN
6883
93/J
N68
8440
49S
.can
iden
sS
erif
osA
krot
iri
Ser
ifos
37.1
3724
.528
JN68
8346
/JN
6883
94/J
N68
8441
50S
.can
iden
sS
ifn
osA
gios
An
trea
s,h
isto
rica
lA
crop
ole
Sif
nos
36.9
5624
.725
JN68
8347
/JN
6883
95/J
N68
8442
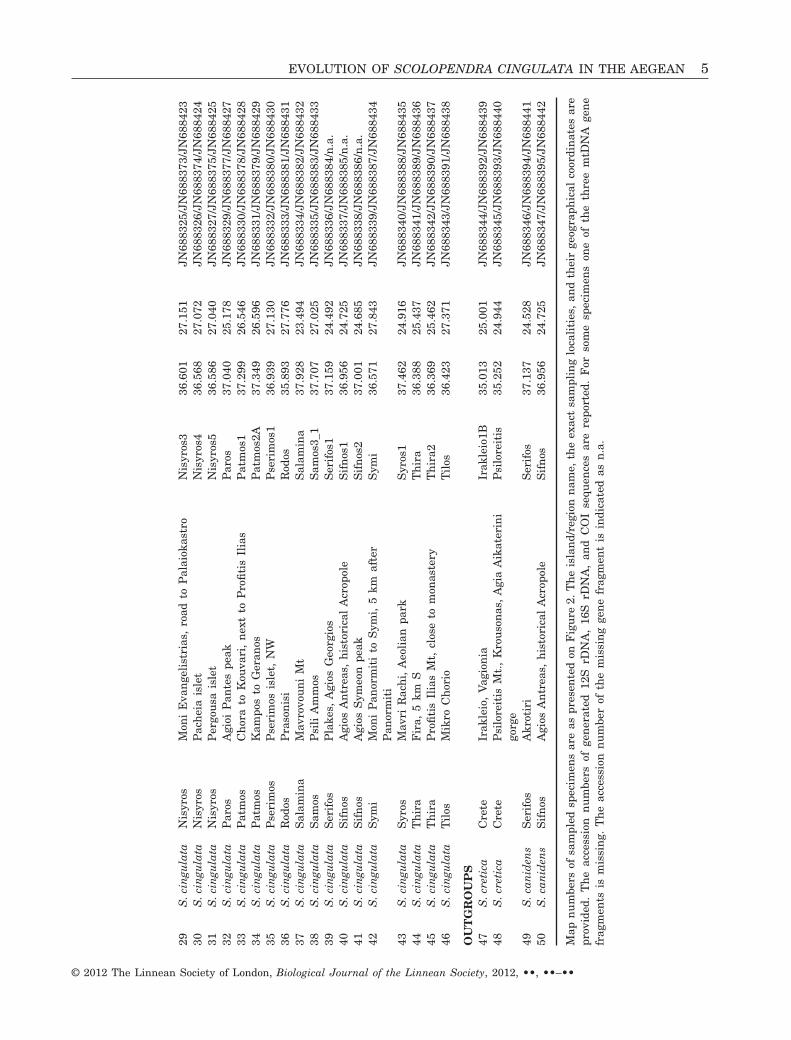
Map
nu
mbe
rsof
sam
pled
spec
imen
sar
eas
pres
ente
don
Fig
ure
2.T
he
isla
nd/
regi
onn
ame,
the
exac
tsa
mpl
ing
loca
liti
es,
and
thei
rge
ogra
phic
alco
ordi
nat
esar
epr
ovid
ed.
Th
eac
cess
ion
nu
mbe
rsof
gen
erat
ed12
SrD
NA
,16
SrD
NA
,an
dC
OI
sequ
ence
sar
ere
port
ed.
For
som
esp
ecim
ens
one
ofth
eth
ree
mtD
NA
gen
efr
agm
ents
ism
issi
ng.
Th
eac
cess
ion
nu
mbe
rof
the
mis
sin
gge
ne
frag
men
tis
indi
cate
das
n.a
.
EVOLUTION OF SCOLOPENDRA CINGULATA IN THE AEGEAN 5
© 2012 The Linnean Society of London, Biological Journal of the Linnean Society, 2012, ••, ••–••
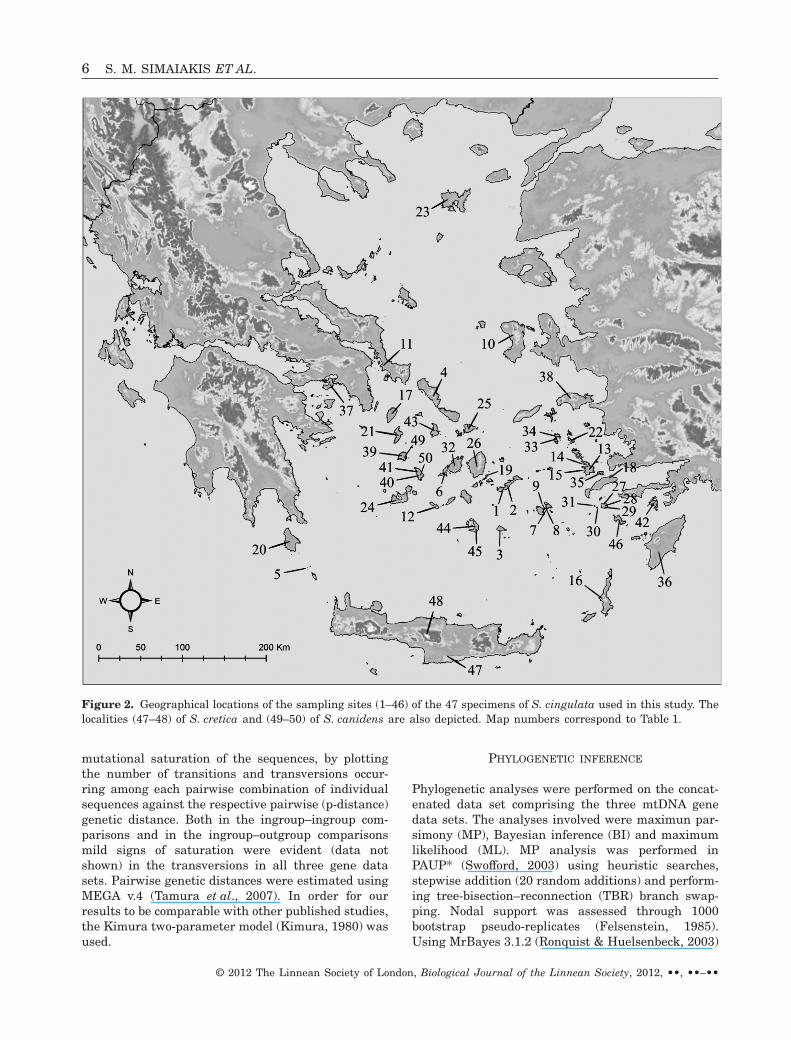
mutational saturation of the sequences, by plottingthe number of transitions and transversions occur-ring among each pairwise combination of individualsequences against the respective pairwise (p-distance)genetic distance. Both in the ingroup–ingroup com-parisons and in the ingroup–outgroup comparisonsmild signs of saturation were evident (data notshown) in the transversions in all three gene datasets. Pairwise genetic distances were estimated usingMEGA v.4 (Tamura et al., 2007). In order for ourresults to be comparable with other published studies,the Kimura two-parameter model (Kimura, 1980) wasused.
PHYLOGENETIC INFERENCE
Phylogenetic analyses were performed on the concat-enated data set comprising the three mtDNA genedata sets. The analyses involved were maximun par-simony (MP), Bayesian inference (BI) and maximumlikelihood (ML). MP analysis was performed inPAUP* (Swofford, 2003) using heuristic searches,stepwise addition (20 random additions) and perform-ing tree-bisection–reconnection (TBR) branch swap-ping. Nodal support was assessed through 1000bootstrap pseudo-replicates (Felsenstein, 1985).Using MrBayes 3.1.2 (Ronquist & Huelsenbeck, 2003)
Figure 2. Geographical locations of the sampling sites (1–46) of the 47 specimens of S. cingulata used in this study. Thelocalities (47–48) of S. cretica and (49–50) of S. canidens are also depicted. Map numbers correspond to Table 1.
6 S. M. SIMAIAKIS ET AL.
© 2012 The Linnean Society of London, Biological Journal of the Linnean Society, 2012, ••, ••–••
BI was also performed. In each mtDNA gene, themodel suggested by Modeltest 3.7 (Posada & Cran-dall, 1998) according to the Akaike Information Cri-terion (Akaike, 1974) was applied. Model parametervalues were estimated during the run. The separategenes were treated as unlinked. The number of gen-erations was set to 8 ¥ 106 and two independent runswere performed simultaneously. In each run eightchains were involved. The average standard deviationof split frequencies of the four simultaneous andindependent runs performed by MrBayes 3.1.2 wasused to determine the stationarity point of likelihoods(see MrBayes 3.1.2 manual). According to this index,stationarity was achieved well before 2 ¥ 106 genera-tions. A tree was sampled every 100th generation and,consequently, the summaries of the BI relied on160 ¥ 103 samples (sum of two runs). From each run60 001 samples were used, while 19 999 were dis-carded as burn-in phase. From the remaining 120 002trees (sum of two runs), a 50% majority rule consen-sus tree was constructed. Support of the nodes wasassessed with the posterior probabilities of recon-structed clades. ML analysis was performed on theconcatenated data using GARLI (Zwickl, 2006) v.2.0.We performed heuristic phylogenetic searches underthe GTR + G + I nucleotide substitution model.GARLI calculates the maximum likelihood of a topol-ogy using a genetic algorithm (Lewis, 1998) to evalu-ate more efficiently alternative topologies. The mostlikely GARLI tree topology was inferred from 30independent runs starting from random trees.Besides the number of runs, all remaining param-eters of GARLI were set to their default values. Theindependent analyses were considered to have con-verged when the likelihood values were not more thanone likelihood unit different. The ML tree with thehighest likelihood score was considered the best. Theparameters estimated for the best tree were fixed inthe bootstrap analysis involving 200 pseudo-replicates. Based on the trees of the bootstrap analy-ses, a 50% majority rule consensus tree was createdusing SumTrees as proposed in the advanced topicssite of GARLI (https://www.nescent.org/wg_garli/Advanced_topics#Using_SumTrees). The supportvalues at each node on the consensus tree weredepicted on the best tree found by GARLI.
MOLECULAR CLOCK AND ESTIMATION OF
DIVERGENCE TIMES
A likelihood ratio test (LRT) was performed accordingto Huelsenbeck & Crandall (1997) to evaluatewhether our sequences conform to a molecular clockmode of evolution. The molecular clock test was per-formed by comparing the ML value for the giventopology with and without the molecular clock con-
straints. During this analysis, the substitutionmodels selected by Modeltest were enforced in themtDNA genes. The null hypothesis of equal evolution-ary rate throughout the tree was rejected at a 5%significance level (P < 0). Consequently, divergencetime points between clades and lineages were esti-mated with BEAST version 1.6.1 (Drummond &Rambaut, 2007). BEAST involves a Bayesian MarkovChain Monte Carlo (MCMC) method that incorpo-rates a relaxed molecular clock model, thus account-ing for the time-dependent nature of the evolutionaryprocess. Rates are uncorrelated across the tree, beingindependently drawn from a parametric distribution(Drummond & Rambaut, 2007). In the BEAST analy-sis the data were partitioned according to gene and adifferent substitution model (see the BI settings) wasapplied to each mtDNA gene. The relaxed uncorre-lated lognormal clock model (Drummond et al., 2006)was used in all partitions. The coalescence methodand a constant population size was chosen (Drum-mond & Rambaut, 2009) in the tree priors. Further-more, the BEAST analysis was constrained to inferthe monophyletic clades indicated by the BI analysis.The BEAST analysis chain length (generations) wasset to 40 ¥ 106 and parameters were sampled every2000 generations. The TreeAnnotator of the BEASTpackage was used to produce the summary of thesampled trees. The burn-in was set to 25%, and thus15 001 trees were used to infer the consensus tree ofthe BEAST analysis. Each analysis was run severaltimes in different processors to ensure analysis con-vergence. Adequate sampling and convergence of thechain to stationarity distribution were confirmed byinspection of the MCMC samples using Tracer v1.5.0(Rambaut & Drummond, 2007). The effective samplesize (ESS) values of all parameters were well above200, which is usually considered a sufficient level ofsampling (Drummond & Rambaut, 2009).
To set the differentiation time frame of the speciesin the study area, we implemented two alternativetemporal splitting schemes. In the first scheme wecalibrated the node (see Fig. 3) leading to clades C1and C2 at 10.5 ± 0.6 Mya (values sampled from anormal distribution with a mean 10.5 Mya and valuesranging from 9 to 12 Mya), whereas in the second therespective node was calibrated at 5.63 ± 0.15 Mya(values sampled from a normal distribution with amean 5.63 Mya and values ranging from 5.9 to5.33 Mya). These time intervals (10.5, 5.63 Mya) werechosen because throughout the history of the Ägäis(or Aegeid plate) that starts some 20 Mya (Steininger& Roegl, 1984; Meulenkamp & Sissingh, 2003; Jolivetet al., 2006), the two geographical areas hosted byclades C1 (eastern Aegean islands) and C2 (northernand central Cyclades) were isolated from each otheronce during the late Miocene and once during the
EVOLUTION OF SCOLOPENDRA CINGULATA IN THE AEGEAN 7
© 2012 The Linnean Society of London, Biological Journal of the Linnean Society, 2012, ••, ••–••
early Pliocene (Creutzburg, 1963; Anastasakis & Der-mitzakis, 1990; Dermitzakis, 1990). The periodaround 10.5 ± 0.6 Mya covers the formation of themid-Aegean trench during which a sea barrier led tothe isolation of the eastern Aegean islands from theCyclades. These areas were partially reconnected vialand-bridges formed during the Messinian SalinityCrisis. At the end of this period, approximately5.33 Mya, flooding of the Mediterranean restored themarine conditions and isolation of the island groupswas re-established. To determine which of the twocompeting biogeographical scenarios best fits ourdata, we applied a Bayesian model selectionapproach. More specifically, we implemented theBayes factor approach as described in Kass & Raftery(1993). The Bayes factor comparison of the variousgeological scenarios is considered an important addi-tion to the arsenal of comparing genetic divergencepatterns with biogeographical events and has repeat-edly been used for such inferences (Akın et al., 2010;Pfenninger et al., 2010; Jesse et al., 2011). The mar-ginal likelihoods of each biogeographical scenariowere estimated using Tracer v1.5.0 (Rambaut &Drummond, 2007). The normal logarithms of theBayes factors were used, and the interpretationsmentioned in Kass & Raftery (1993) were applied toidentify the best-fitting geological scenario. Based onthe same (BEAST) settings of the two competingbiogeographical scenarios, we performed an addi-tional analysis in which no temporal constraints wereimposed on the nodes. The unconstrained analysiswas used for comparison.
RESULTSSEQUENCE DATA
For the majority of the specimens we successfullyamplified and sequenced all targeted mtDNA genes.However, there were some specimens for which wewere not able to determine the sequences for all threemtDNA gene fragments (Table 1). More specifically,for the 16S rDNA and COI genes the sequences ofthree and four specimens, respectively, were notobtained. Accordingly, we did not determine thesequence of a single specimen for the 12S rDNAfragment. Nevertheless, because only one gene frag-ment was missing from each specimen, the specificindividuals were included in the analyses and the
undetermined sequence data were coded as missing.The average length of the obtained sequences was 355and 465 bp for the 12S rDNA, and 16S rDNA genefragments, respectively. For the COI fragment,depending on the primer pair used for ampificationthe average length of the generated sequences was463 or 717 bp. The aligned dataset of 12S rDNAconsisted of 423 bp, of which 198 were variable and159 were parsimony-informative. The 16S rDNA dataset consisted of 597 aligned base pairs. Of these, 228were variable and 165 parsimony-informative.Finally, the COI aligned data set comprised 815 bpwith 223 being parsimony-informative in a set of 276variable positions. The concatenated data setincluded 1835 characters, all of which were analysed.The average genetic distance separating individualS. cingulata specimens was 5.6, 4.0 and 7.4% in the12S rDNA, 16S rDNA and COI gene fragments,respectively.
PHYLOGENY AND ESTIMATE OF THE TIME FRAME
OF LINEAGE DIVERGENCE
The best-fit model selected by Modeltest 3.7 (Posada& Crandall, 1998) for the 12S rDNA and 16S rDNAgenes was TrN+G, whereas for the COI locus themodel favoured was GTR+I+G.
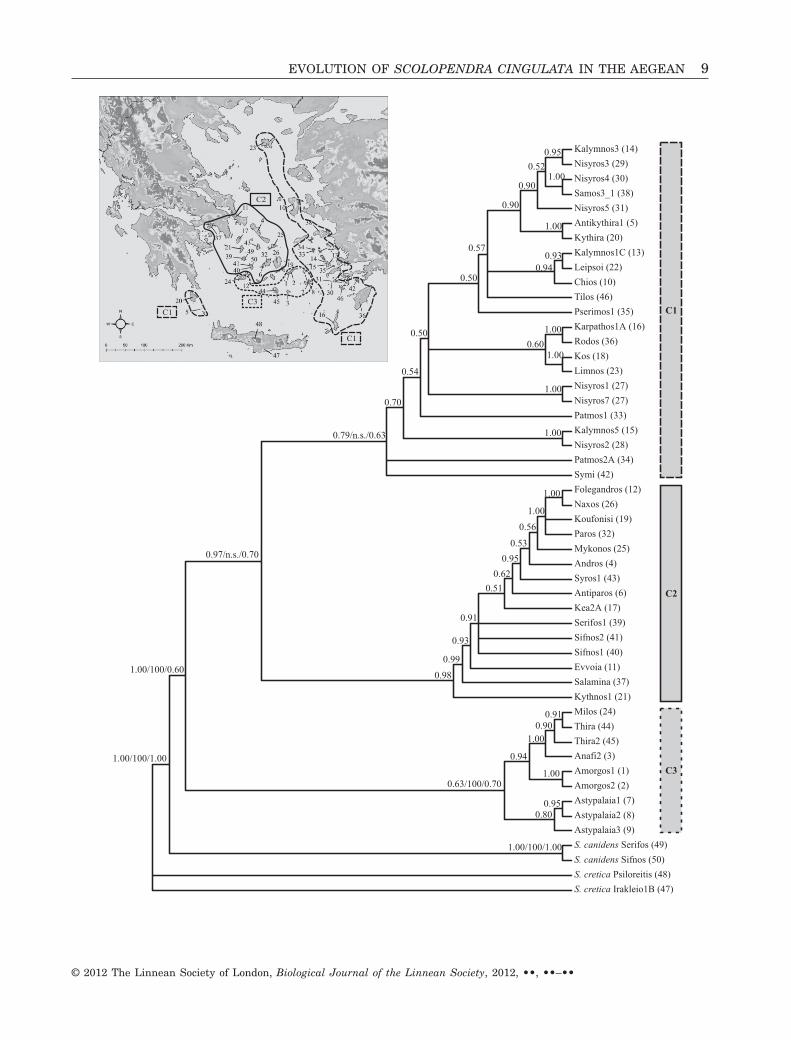
The topology of the trees inferred from the threedifferent phylogenetic methods was identical, butwith differences in the supporting values of clades. InFigure 3 the 50% majority rule consensus tree of theBayesian analysis is presented. Support values foreach clade are displayed on the tree. The phylogeneticanalyses indicate the presence of three distinct S. cin-gulata groups in the region. The first group (C1)accommodates populations from the eastern Aegeanislands, and is closely related to the second group(C2), which hosts mainly populations of the northernand central Cyclades. The third supported group (C3)is composed of insular populations originating fromthe southern Cyclades. These clades were not consis-tently supported with high nodal values by all threeanalyses, but each clade was inferred and adequatelysupported by at least two different phylogeneticmethods. Based on this, we consider the obtainedtopology to be adequately resolved and robust.
The results of all BEAST analyses performed vali-dated the results of the likelihood ratio test indicating
�Figure 3. Bayesian inference (BI) tree (50% majority-rule consensus tree). Numbers at nodes indicate posteriorprobabilities (only values above 0.5 are presented) in the BI analysis. For the major clades inferred by the phylogeneticanalyses, the nodal support values according to the MP (1000 bootstrap replicates) and ML inference (200 pseudo-replicates) are also presented (BI/MP/ML). The denotation n.s. indicates topology not supported by the correspondinganalysis. Numbers in parentheses following specimen names correspond to the map numbers given in Table 1. Thedistribution of the major phylogenetic clades is shown on the inset map.
8 S. M. SIMAIAKIS ET AL.
© 2012 The Linnean Society of London, Biological Journal of the Linnean Society, 2012, ••, ••–••
EVOLUTION OF SCOLOPENDRA CINGULATA IN THE AEGEAN 9
© 2012 The Linnean Society of London, Biological Journal of the Linnean Society, 2012, ••, ••–••
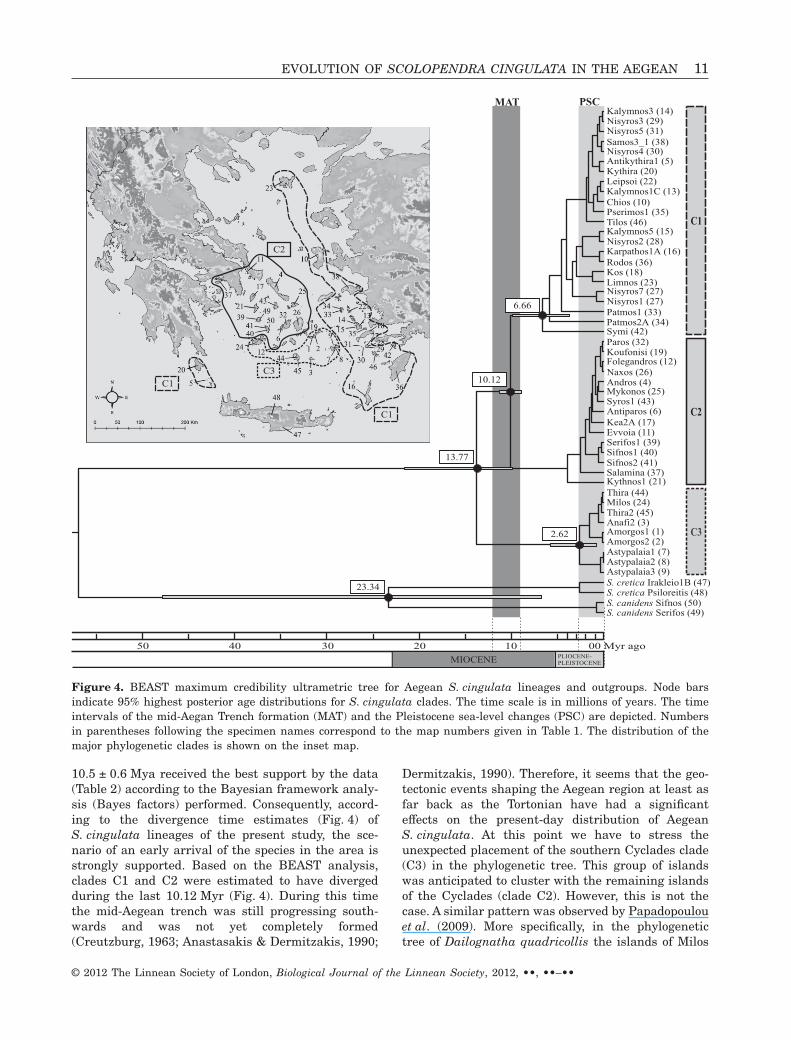
a non-clock-like behaviour of our data set. Theconstraint of node separating C1 from C2 to10.5 ± 0.6 Mya, i.e. during the formation of the mid-Aegean trench, received the best support by the data(Table 2). Bayes factor analysis provided very strongsupport for this model in comparison with the sce-nario constraining the split immediately after theMessinian Salinity Crisis and the unconstrained sce-nario. The time estimates of lineages splits and theirrespective 95% highest posterior age distributionintervals inferred from the favoured BEAST analysisare presented in Figure 4. The time estimate (meanvalue) for the separation of clade C3 from C1/C2 is13.77 Mya, whereas the north-central Cyclades (C2)appear to have diverged from the islands of the eastAegean (C1) 10.12 Mya.
DISCUSSIONGENETIC DIVERGENCE, PHYLOGENY AND TIME
FRAME OF THE AEGEAN DIFFERENTIATION
The levels of genetic divergence separating conspecificpopulations recorded in S. cingulata are quite high inall three gene segments. The distances separatingconspecific populations are clearly within the rangeof species-level divergence of other invertebratetaxa. For instance, France & Kocher (1996) report a4–5% 16S rDNA distance among amphipod species.By contrast, Hebert, Ratnasingham & deWaard(2003) present a 11.2% level of COI divergenceamong several invertebrate congeneric species.Finally, many isopod species diverge by 13–28% (COI:Rivera et al., 2002; McGaughran et al., 2006, 16SrRNA/12S rRNA: Baratti, Khebiza & Messana, 2004).Therefore, caution is needed in interpreting the levelsof genetic divergence observed between conspecificpopulations, especially when many arguments existagainst the use of genetic-distance measures inmaking taxonomic inferences, as such estimates arenot equivalent across the enormous diversity of taxa(Avise & Aquadro, 1982; Avise & Johns, 1999). Fur-thermore, it seems that high levels of genetic diver-
gence both within and between centipede species isa common feature (Murienne, Edgecombe & Giribet,2010, 2011). For instance, in Cryptops niuensis meanCOI divergence between specimens originating fromdifferent islands was 12.5% (Murienne et al., 2011).
In the search for an appropriate outgroup for ourphylogenetic analysis we tested several outgroupspecies (congeneric and not). To produce a well-resolved phylogenetic tree, we concluded that themost appropriate ones to use were S. cretica andS. canidens. As anticipated based on the highintraspecific levels of divergence estimated for S. cin-gulata, divergence between ingroup and outgroupsequences was 24.5% (concatenated dataset). At thesame time S. cretica diverged from S. canidens by asmuch as 16.5%.
Phylogenetic analyses indicated the existence ofthree S. cingulata clades (Fig. 3) in the study area.Strong correspondence between clades and geographi-cal origin of the specimens is evident in the phylog-eny. The clustering of the sampled islands as depictedin Figure 3 suggests a mainly vicariant pattern ofdifferentiation of the species in the study area.According to Minelli (1983), S. cingulata is a recentinvader of southern Europe (Iberian peninsula,Italian peninsula including Sicily, Balkan peninsula).However, following a series of logical arguments andin consensus with the palaeogeographical history ofthe eastern Mediterranean region, Simaiakis &Mylonas (2008) concluded that there are two equallyprobable scenarios regarding the time frame of thespecies differentiation. The first supports the differ-entiation of S. cingulata in the Aegean approximately5.5 Mya following the complete isolation of Crete fromall surrounding mainland and insular regions. Thesecond scenario involves a much earlier differentia-tion of the species in the Aegean in the late Miocenebefore the formation of the mid-Aegean trench(12–9 Mya), when the Aegean region was still anextended landmass (Creutzburg, 1963; Anastasakis& Dermitzakis, 1990; Dermitzakis, 1990). Theconstraint of the node separating C1 from C2 at
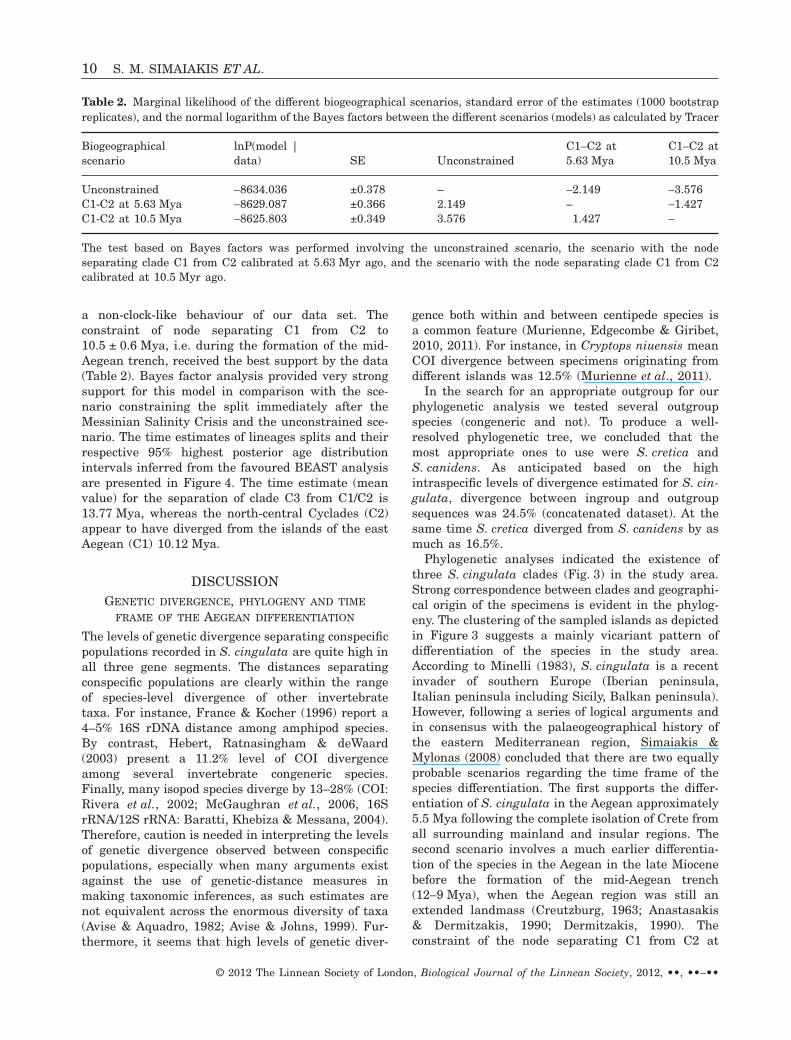
Table 2. Marginal likelihood of the different biogeographical scenarios, standard error of the estimates (1000 bootstrapreplicates), and the normal logarithm of the Bayes factors between the different scenarios (models) as calculated by Tracer
Biogeographicalscenario
lnP(model |data) SE Unconstrained
C1–C2 at5.63 Mya
C1–C2 at10.5 Mya
Unconstrained -8634.036 ±0.378 – -2.149 -3.576C1-C2 at 5.63 Mya -8629.087 ±0.366 2.149 – -1.427C1-C2 at 10.5 Mya -8625.803 ±0.349 3.576 1.427 –
The test based on Bayes factors was performed involving the unconstrained scenario, the scenario with the nodeseparating clade C1 from C2 calibrated at 5.63 Myr ago, and the scenario with the node separating clade C1 from C2calibrated at 10.5 Myr ago.
10 S. M. SIMAIAKIS ET AL.
© 2012 The Linnean Society of London, Biological Journal of the Linnean Society, 2012, ••, ••–••
10.5 ± 0.6 Mya received the best support by the data(Table 2) according to the Bayesian framework analy-sis (Bayes factors) performed. Consequently, accord-ing to the divergence time estimates (Fig. 4) ofS. cingulata lineages of the present study, the sce-nario of an early arrival of the species in the area isstrongly supported. Based on the BEAST analysis,clades C1 and C2 were estimated to have divergedduring the last 10.12 Myr (Fig. 4). During this timethe mid-Aegean trench was still progressing south-wards and was not yet completely formed(Creutzburg, 1963; Anastasakis & Dermitzakis, 1990;
Dermitzakis, 1990). Therefore, it seems that the geo-tectonic events shaping the Aegean region at least asfar back as the Tortonian have had a significanteffects on the present-day distribution of AegeanS. cingulata. At this point we have to stress theunexpected placement of the southern Cyclades clade(C3) in the phylogenetic tree. This group of islandswas anticipated to cluster with the remaining islandsof the Cyclades (clade C2). However, this is not thecase. A similar pattern was observed by Papadopoulouet al. (2009). More specifically, in the phylogenetictree of Dailognatha quadricollis the islands of Milos
Figure 4. BEAST maximum credibility ultrametric tree for Aegean S. cingulata lineages and outgroups. Node barsindicate 95% highest posterior age distributions for S. cingulata clades. The time scale is in millions of years. The timeintervals of the mid-Aegan Trench formation (MAT) and the Pleistocene sea-level changes (PSC) are depicted. Numbersin parentheses following the specimen names correspond to the map numbers given in Table 1. The distribution of themajor phylogenetic clades is shown on the inset map.
EVOLUTION OF SCOLOPENDRA CINGULATA IN THE AEGEAN 11
© 2012 The Linnean Society of London, Biological Journal of the Linnean Society, 2012, ••, ••–••
and Sifnos cluster apart from the remaining Cycladesislands and are basal with regard to the wider cladehosting the remaining Cyclades islands and theislands of the eastern Aegean (fig. S1 of Papadopoulouet al., 2009). Furthermore, in the case of the scorpionspecies Mesobuthus gibbosus (Parmakelis et al.,2006a), the Cyclades islands are not monophyleticand it is a clade involving Milos Island (and others)that creates the Cyclades paraphyly. Therefore, thenon-monophyly of the Cyclades islands caused byislands of the southern Cyclades clustering apartfollowing a pattern similar to the current study seemsto be a recurring theme in the phylogeography ofAegean invertebrates. This could be due to a likelybut unverified geological event occurring during thelate Miocene that resulted in the isolation of at leastMilos Island from the remaining Cyclades. Therefore,as concluded by Parmakelis et al. (2006a), the sepa-ration of the southern Cyclades islands from thenorthern Cyclades plateau – which occurred 3.5 Myaand had a significant impact on the present-day dis-tribution of some Aegean taxa (Kasapidis et al., 2005)– is not the only factor affecting the biogeographicalpatterns observed in the Cyclades islands today. MilosIsland hosts one additional Scolopendra species,S. canidens. This species has a quite extended distri-bution in Anatolia (Fig. 1), but can only be found inthe islands of Serifos, Sifnos, and Milos in the Aegeanregion. Simaiakis & Mylonas (2008) suggested thatS. canidens is a relict representative distributed inthe Mediterranean area before the formation of themid-Aegean trench. The relictual lineage seems tohold for S. cingulata clade C3 as well, and more likelythe C3 clade represents the remains of an ancestralS. cingulata lineage that has been differentiating inthe region over the last 13.77 Myr, since before theformation of the mid-Aegean trench.
A puzzling issue in the phylogenetic tree is theclustering of Prasonisi (satellite islet of Antikythira)and Kythira within clade C1, which accommodatesthe eastern Aegean islands. This cannot be easilyjustified unless one invokes a dispersal event. Dis-persal events have been reported before in severalAegean phylogeographic studies (for detailedexamples see Lymberakis & Poulakakis, 2010). Forinstance, the Ablepharus kitaibeli lineage present onthe islet of Mikronisi (satelite islet of eastern Crete)has been claimed to have reached there via sea dis-persal from the Kasos–Karpathos complex (Pou-lakakis et al., 2005a). However, all these casesinvolved dispersal from adjacent geographical areasand not distant ones as is the case of Antikythira(Prasonisi)–Kythira and the eastern Aegean islands.To account for this geographically inconsistent place-ment of Kythira–Prasonisi within the eastern Aegeanclade (C1) we assume a dispersal event facilitated by
Pleistocene sea-level changes. Unfortunately, the dis-persal route cannot be inferred and seems to be of acompletely stochastic nature.
In conclusion, our data indicate that S. cingulata isan old ‘resident’ of the Aegean. As the species hasbeen differentiating in the region since before theformation of the mid-Aegean trench, it would havebeen feasible for it to enter the island of Crete. Cretebecame completely isolated from the Cyclades plateau9.7 Mya (see fig. 6 of Parmakelis et al., 2005, andreferences therein). Therefore, S. cingulata couldhave arrived in Crete before the island’s isolation. Apossible explanation for the absence of S. cingulatafrom Crete would be competitive exclusion from itscongenerer and endemic Cretan species S. cretica.Minelli (1983) suggested that competitive exclusioncannot be claimed as an interpretation for theabsence of S. cingulata from major Mediterraneanislands. This was based on the fact that S. cingulatacoexists with S. oraniensis or S. canidens (Foddai,Minelli & Zapparoli, 1995) in many Italian islands.The same argument was presented by Simaiakis &Mylonas (2008) based on the co-occurrence of S. cin-gulata with S. canidens in several Aegean islands.However, in a morphometric study (Simaiakis et al.,2011) performed on an extensive network of S. cingu-lata populations originating from the Mediterraneanbasin, the authors concluded that the west–east mor-phological differentiation trend of S. cingulata couldbe due to competition with S. oraniensis. Therefore,the absence of competitive exclusion cannot be com-pletely ruled out and a formal testing of the competi-tive exclusion scenario needs to be performed.
Our findings support that S. cingulata has beendifferentiating in the Aegean region before the forma-tion of the mid-Aegean trench and therefore its pres-ence in the eastern Mediterranean region is at leastequally old. Therefore, the presence of the species inthe island of Cyprus posses no mystery in the senseexpressed in Simaiakis & Mylonas (2008). Accordingto recent claims (Hadjisterkotis, Masala & Reese,2000; Jolivet et al., 2006) Cyprus was connected toAnatolia during the Messinian Salinity Crisis andbecame an isolated entity immediately after that time(Akın et al., 2010). Consequently, S. cingulata reachedthe island of Cyprus from Anatolia 5.5 Mya. Finally,to understand the evolutionary history of Scolopendrawithin the Mediterranean region fully, the phylogenyand biogeographical history of all the species distrib-uted in the region need to be reconstructed.
ACKNOWLEDGEMENTS
We thank Manolis Nikolakakis for helping us to con-struct the ArcGIS maps. We also thank Kostas Tri-antis for providing useful comments and fruitful
12 S. M. SIMAIAKIS ET AL.
© 2012 The Linnean Society of London, Biological Journal of the Linnean Society, 2012, ••, ••–••
discussions regarding the palaeogeographical evolu-tion of the eastern Mediterranean region. Finally, thecomments of three anonymous reviewers greatlyimproved our manuscript and for that we wish toexpress our gratitude.
REFERENCES
Akaike H. 1974. New look at statistical-model identification.IEEE Transactions on Automatic Control Ac19: 716–723.
Akın Ç, Bilgin CC, Beerli P, Westaway R, Ohst T, Litvin-chuk SN, Uzzell T, Bilgin M, Hotz H, Guex GD, PlötnerJ. 2010. Phylogeographic patterns of genetic diversity ineastern Mediterranean water frogs were determined bygeological processes and climate change in the Late Ceno-zoic. Journal of Biogeography 37: 2111–2124.
Anastasakis GC, Dermitzakis DM. 1990. Post-Middle-Miocene palaeogeographic evolution of the central AegeanSea and detailed Quaternary reconstruction of the region.Its possible influence on the distribution of the Quaternarymammals of the Cyclades Islands. Neues Jahrbuch fürGeologie und Paläontologie Monatshefte 1: 1–16.
Attems C. 1930. Myriapoda 2. Scolopendromorpha. Das Tier-reich 54: 1–308.
Avise JC, Aquadro CF. 1982. A comparative summary ofgenetic distances in the vertebrates – patterns and correla-tions. Evolutionary Biology 15: 151–185.
Avise JC, Johns GC. 1999. Proposal for a standardizedtemporal scheme of biological classification for extantspecies. Proceedings of the National Academy of Sciences ofthe United States of America 96: 7358–7363.
Baratti M, Khebiza MY, Messana G. 2004. Microevolution-ary processes in the stygobitic genus Typhlocirolana(Isopoda Flabellifera Cirolanidae) as inferred by partial 12Sand 16S rDNA sequences. Journal of Zoological Systematicsand Evolutionary Research 42: 27–32.
Bittkau C, Comes HP. 2005. Evolutionary processes in acontinental island system: molecular phylogeography of theAegean Nigella arvensis alliance (Ranunculaceae) inferredfrom chloroplast DNA. Molecular Ecology 14: 4065–4083.
Bittkau C, Comes HP. 2009. Molecular inference of a LatePleistocene diversification shift in Nigella s. lat. (Ranuncu-laceae) resulting from increased speciation in the Aegeanarchipelago. Journal of Biogeography 36: 1346–1360.
Bonato L, Edgecombe GD, Zapparoli M. 2011. Chilopoda– taxonomic overview. In: Minelli A, ed. Treatise on zoology– the Myriapoda. Leiden: Brill, 363–443.
Creutzburg N. 1963. Paleogeographic evolution of Cretefrom Miocene till our days. Cretan Annals 15/16: 336–342.
Dermitzakis DM. 1990. Paleogeography, geodynamic pro-cesses and event stratigraphy during the late Cenozoic ofthe Aegean area. Accademia Nazionale de Lincei 85: 263–288.
Douris V, Rodakis GC, Giokas S, Mylonas M, LecanidouR. 1995. Mitochondrial DNA and morphological differentia-tion of Albinaria populations (Gastropoda, Clausiliidae).Journal of Molluscan Studies 61: 65–78.
Drummond AJ, Ho SYW, Phillips MJ, Rambaut A. 2006.Relaxed phylogenetics and dating with confidence. PLoSBiology 4: 699–710.
Drummond AJ, Rambaut A. 2007. BEAST: Bayesian evo-lutionary analysis by sampling trees. BMC EvolutionaryBiology 7: 214.
Drummond AJ, Rambaut A. 2009. Bayesian evolutionaryanalysis by sampling trees. In: Lemey P, Salemi M, Van-damme A-M, eds. The phylogenetic handbook. A practicalapproach to phylogenetic analysis and hypothesis testing,2nd edn. Cambridge: Cambridge University Press, 564–590.
Felsenstein J. 1985. Phylogenies and the comparativemethod. American Naturalist 125: 1–15.
Foddai D, Minelli A, Zapparoli M. 1995. I Chilopodi delleIsole Circumsarde nel contesto del popolamento insularedell’ area Tirrenica s. l. Biogeographia 18: 357–376.
Folmer O, Black M, Hoeh W, Lutz R, Vrijenhoek R. 1994.DNA primers for amplification of mitochondrial cytochromec oxidase subunit I from diverse metazoan invertebrates.Molecular Marine Biology and Biotechnology 3: 294–299.
France SC, Kocher TD. 1996. Geographic and bathymetricpatterns of mitochondrial 16S rRNA sequence divergenceamong deep sea amphipods, Eurythenes gryllus. MarineBiology 126: 633–643.
Hadjisterkotis E, Masala B, Reese DS. 2000. The originand extinction of the large endemic Pleistocene mammals ofCyprus. Biogeographia 21: 593–606.
Hebert PDN, Ratnasingham S, deWaard JR. 2003. Bar-coding animal life: cytochrome c oxidase subunit 1 diver-gences among closely related species. Proceedings of theRoyal Society of London Series B-Biological Sciences 270:S96–S99.
Huelsenbeck JP, Crandall KA. 1997. Phylogeny estimationand hypothesis testing using maximum likelihood. AnnualReview of Ecology and Systematics 28: 437–466.
Jesse R, Grudinski M, Klaus S, Streit B, Pfenninger M.2011. Evolution of freshwater crab diversity in the Aegeanregion (Crustacea: Brachyura: Potamidae). Molecular Phy-logenetics and Evolution 59: 23–33.
Jolivet L, Augier R, Robin C, Suc JP, Rouchy JM. 2006.Lithospheric-scale geodynamic context of the Messiniansalinity crisis. Sedimentary Geology 188: 9–33.
Kasapidis P, Magoulas A, Mylonas M, Zouros E. 2005.The phylogeography of the gecko Cyrtopodion kotschyi (Rep-tilia: Gekkonidae) in the Aegean archipelago. MolecularPhylogenetics and Evolution 35: 612–623.
Kass RE, Raftery AE. 1993. Bayes factors. Journal of theAmerican Statistical Association 90: 773–795.
Kimura M. 1980. A simple method for estimating evolution-ary rates of base substitutions through comparative studiesof nucleotide-sequences. Journal of Molecular Evolution 16:111–120.
Lewis PO. 1998. A genetic algorithm for maximum-likelihoodphylogeny inference using nucleotide sequence data.Molecular Biology and Evolution 15: 277–283.
Lymberakis P, Poulakakis N. 2010. Three continentsclaiming an Archipelago: the evolution of Aegean’s herpeto-faunal diversity. Diversity 2: 233–255.
EVOLUTION OF SCOLOPENDRA CINGULATA IN THE AEGEAN 13
© 2012 The Linnean Society of London, Biological Journal of the Linnean Society, 2012, ••, ••–••
McGaughran A, Hogg ID, Stevens MI, Chadderton WL,Winterbourn MJ. 2006. Genetic divergence of three fresh-water isopod species from southern New Zealand. Journalof Biogeography 33: 23–30.
Meulenkamp JE, Sissingh W. 2003. Tertiary palaeogeogra-phy and tectonostratigraphic evolution of the Northern andSouthern Peri-Tethys platforms and the intermediatedomains of the African–Eurasian convergent plate boundaryzone. Palaeogeography Palaeoclimatology Palaeoecology196: 209–228.
Minelli A. 1983. Note critiche sui Chilopodi della Sardegna.Lavori della Società Italiana di Biogeografia, Nuova Serie 8:401–416.
Murienne J, Edgecombe GD, Giribet G. 2010. Includingsecondary structure, fossils and molecular dating in thecentipede tree of life. Molecular Phylogenetics and Evolution57: 301–313.
Murienne J, Edgecombe GD, Giribet G. 2011. Compara-tive phylogeography of the centipedes Cryptops pictus andC. niuensis (Chilopoda) in New Caledonia, Fiji and Vanuatu.Organisms Diversity & Evolution 11: 61–74.
Papadopoulou A, Anastasiou I, Keskin B, Vogler AP.2009. Comparative phylogeography of tenebrionid beetles inthe Aegean archipelago: the effect of dispersal ability andhabitat preference. Molecular Ecology 18: 2503–2517.
Parmakelis A, Spanos E, Papagiannakis G, Louis C,Mylonas M. 2003. Mitochondrial DNA phylogeny and mor-phological diversity in the genus Mastus (Beck, 1837): astudy in a recent (Holocene) island group (Koufonisi, south-east Crete). Biological Journal of the Linnean Society 78:383–399.
Parmakelis A, Pfenninger M, Spanos L, PapagiannakisG, Louis C, Mylonas M. 2005. Inference of a radiation inMastus (Gastropoda, Pulmonata, Enidae) on the island ofCrete. Evolution 59: 991–1005.
Parmakelis A, Stathi I, Chatzaki M, Simaiakis S, SpanosL, Louis C, Mylonas M. 2006a. Evolution of Mesobuthusgibbosus (Brulle, 1832) (Scorpiones: Buthidae) in the north-eastern Mediterranean region. Molecular Ecology 15: 2883–2894.
Parmakelis A, Stathi I, Spanos L, Louis C, Mylonas M.2006b. Phylogeography of Iurus dufoureius (Brulle, 1832)(Scorpiones, Iuridae). Journal of Biogeography 33: 251–260.
Pfenninger M, Vela E, Jesse R, Elejalde MA, Liberto F,Magnin F, Martinez-Orti A. 2010. Temporal speciationpattern in the western Mediterranean genus Tudorella P.Fischer, 1885 (Gastropoda, Pomatiidae) supports the Tyr-rhenian vicariance hypothesis. Molecular Phylogenetics andEvolution 54: 427–436.
Posada D, Crandall KA. 1998. MODELTEST: testing themodel of DNA substitution. Bioinformatics 14: 817–818.
Poulakakis N, Lymberakis P, Antoniou A, Chalkia D,Zouros E, Mylonas M, Valakos E. 2003. Molecular phy-logeny and biogeography of the wall-lizard Podarcis erhar-dii (Squamata: Lacertidae). Molecular Phylogenetics andEvolution 28: 38–46.
Poulakakis N, Lymberakis P, Tsigenopoulos CS, Magou-las A, Mylonas M. 2005a. Phylogenetic relationships and
evolutionary history of snake-eyed skink Ablepharus kitai-belii (Sauria: Scincidae). Molecular Phylogenetics and Evo-lution 34: 245–256.
Poulakakis N, Lymberakis P, Valakos E, Pafilis P,Zouros E, Mylonas M. 2005b. Phylogeography of Balkanwall lizard (Podarcis taurica) and its relatives inferred frommitochondrial DNA sequences. Molecular Ecology 14: 2433–2443.
Prendini L, Weygoldt P, Wheeler WC. 2005. Systematics ofthe Damon variegatus group of African whip spiders (Che-licerata: Amblypygi): evidence from behaviour, morphologyand DNA. Organisms Diversity & Evolution 5: 203–236.
Rambaut A, Drummond A. 2007. Tracer, MCMC TraceAnalysis Tool, v1.5.0. Available at: http://beast.bio.ed.ac.uk/Tracer
Rivera MAJ, Howarth FG, Taiti S, Roderick GK. 2002.Evolution in Hawaiian cave-adapted isopods (Oniscidea:Philosciidae): vicariant speciation or adaptive shifts?Molecular Phylogenetics and Evolution 25: 1–9.
Ronquist F, Huelsenbeck JP. 2003. MrBayes 3: Bayesianphylogenetic inference under mixed models. Bioinformatics19: 1572–1574.
Saiki RK, Gelfand DH, Stoffel S, Scharf SJ, Higuchi R,Horn GT, Mullis KB, Erlich HA. 1988. Primer-directedenzymatic amplification of DNA with a thermostable DNA-polymerase. Science 239: 487–491.
Sfenthourakis S, Legakis A. 2001. Hotspots of endemicterrestrial invertebrates in southern Greece. Biodiversityand Conservation 10: 1387–1417.
Simaiakis S. 2005. Systematics, biogeography and ecology ofcentipedes of the south Aegean islands. D. Phil. Thesis,University of Crete.
Simaiakis S, Giokas S, Korsós Z. 2011. Morphometric andmeristic diversity of the species Scolopendra cingulataLatreille, 1829 (Chilopoda: Scolopendridae) in the Mediter-ranean region. Zoologischer Anzeiger – A Journal of Com-parative Zoology 250: 67–79.
Simaiakis S, Minelli A, Mylonas M. 2004. The centipedefauna (Chilopoda) of Crete and its satellite islands (Greece,Eastern Mediterranean). Israel Journal of Zoology 50: 367–418.
Simaiakis S, Minelli A, Mylonas M. 2005. The centipedefauna (Chilopoda) of the south Aegean Archipelago (Greece,Eastern Mediterranean). Israel Journal of Zoology 51: 241–307.
Simaiakis S, Mylonas M. 2008. The Scolopendra species(Chilopoda: Scolopendromorpha: Scolopendridae) of Greece(E-Mediterranean): a theoretical approach on the effect ofgeography and palaeogeography on their distribution.Zootaxa 1792: 39–53.
Simon C, Frati F, Beckenbach A, Crespi B, Liu H, FlookP. 1994. Evolution, weighting, and phylogenetic utility ofmitochondrial gene-sequences and a compilation of con-served polymerase chain-reaction primers. Annals of theEntomological Society of America 87: 651–701.
Steininger FF, Roegl F. 1984. Paleogeography and palins-pastic reconstruction of the Neogene of the Mediterraneanand Paratethys. In: Dixon JE, Robertson AHF, eds. The
14 S. M. SIMAIAKIS ET AL.
© 2012 The Linnean Society of London, Biological Journal of the Linnean Society, 2012, ••, ••–••
geological evolution of the Eastern Mediterranean. Oxford:Blackwell Scientific Publications, 659–668.
Strid A, Tan K. 1997. Flora hellenica, vol. 1. Konigstein:Koeltz Scientific Books.
Swofford DL. 2003. Paup*. Phylogenetic analysis using par-simony (*and other methods), 4th edn. Sunderland, MA:Sinauer Associates.
Tamura K, Dudley J, Nei M, Kumar S. 2007. MEGA4:molecular evolutionary genetics analysis (MEGA) softwareversion 4.0. Molecular Biology and Evolution 24: 1596–1599.
Triantis KA, Mylonas M. 2009. Greek Islands, biology. In:
Gillespie R, Glague DA, eds. Encyclopedia of islands.Berkeley, CA: University of California Press, 388–392.
Winnepenninckx B, Backeljau T, De Wachter R. 1993.Extraction of high molecular weight DNA from molluscs.Trends in Genetics 9: 407.
Zapparoli M. 2002. Catalogue of the centipedes from Greece.Fragmenta entomologica 34: 1–146.
Zwickl DJ. 2006. Genetic algorithm approaches for the phy-logenetic analysis of large biological sequence datasetsunder the maximum likelihood criterion. D. Phil. Thesis,The University of Texas.
EVOLUTION OF SCOLOPENDRA CINGULATA IN THE AEGEAN 15
© 2012 The Linnean Society of London, Biological Journal of the Linnean Society, 2012, ••, ••–••
Related Documents


