The evolution of the Danube gateway between Central and Eastern Paratethys (SE Europe): Insight from numerical modelling of the causes and effects of connectivity between basins and its expression in the sedimentary record K.A. Leever a, ⁎, L. Matenco a , D. Garcia-Castellanos b , S.A.P.L. Cloetingh a a Netherlands Research Centre for Integrated Solid Earth Science (ISES), Faculty of Earth and Life Sciences, VU University, De Boelelaan 1085, 1081 HV Amsterdam, The Netherlands b Instituto de Ciencias de la Tierra Jaume Almera (ICTJA-CSIC), Group of Dynamics of the Lithosphere (GDL), Solé i Sabarís s/n, 08028 Barcelona, Spain abstract article info Article history: Received 15 June 2009 Received in revised form 4 December 2009 Accepted 9 January 2010 Available online 20 January 2010 Keywords: Connectivity Sedimentary basins Numerical modelling Paleogeography The Pannonian and Dacic Basins in SE Europe are presently connected by the Danube River across the South Carpathians, to which they are in a back-arc and foreland position respectively. Part of the Paratethys realm during the Neogene, open water communication between the basins was interrupted by the Late Miocene uplift of the Carpathians. Different mechanisms have been proposed for the formation of the Danube gateway: capture of the upstream lake or an upstream river or incision of an antecedent river. Estimates on its age range from Late Miocene to Quaternary. A related issue is the effect of the large Mediterranean sea level fall related to the Messinian Salinity Crisis on the Paratethys subbasins, specifically the “isolated” Pannonian Basin. In a synthetic numerical modelling study, using a pseudo-3D code integrating tectonics, surface processes and isostasy, we addressed the causes and effects of changes in connectivity between two large sedimentary basins separated by an elevated barrier. Specifically, we aimed to find the expression of connectivity events in the sedimentary record in general and the consequences for the evolution of the Pannonian–Dacic area in particular. We studied a range of parameters including the geometry and uplift rate of the barrier, downstream sea level change and lithosphere rigidity. We found that changes in connectivity are expressed in the sedimentary record through their effect on base level in the upstream basin and supply in the downstream basin. The most important factors controlling the response are the elevation difference between the basins and the upstream accommodation space at the time of reconnection. The most pronounced effect of reconnection through lake capture is predicted for a large elevation difference and limited upstream accommodation space. Downstream increase in sediment supply is dependent on the latter rather than the reconnection event itself. Of the parameters we tested, the rigidity of the lithosphere was found to be of major importance by its control on sediment loaded subsidence and generation of accommodation space. A downstream sea level change is unlikely to induce capture, but may affect the upstream lake level by enhancing incision in a pre-existing gateway. In the Pannonian–Dacic region, the mechanically weak, continuously subsiding Pannonian lithosphere allowed accommodation of significant volumes of continental sedimentation and as a consequence, transfer of excess sediment to the downstream Dacic Basin was only gradual. The Messinian sea level fall in the Dacic Basin could have been recorded in the Pannonian Basin only if a connection between the basins already existed. More detailed modelling of river incision taking into account lateral differences in erodibility in the South Carpathians will be required to give better time constraints on the formation of the Danube Gateway. © 2010 Elsevier B.V. All rights reserved. 1. Introduction Paratethys, extending from the foreland of the Alps to the Aral Sea (Fig. 1a), was a large brackish epicontinental sea that was separated from the world oceans during the progressive closure of the Tethys Ocean and associated rising of the Alpine chain. In Southeast Europe, formation and Late Miocene uplift of the Carpathians disrupted open water communication between the Central/Western and Eastern Paratethys, corresponding to the Pannonian Basin and the Dacic Basin respectively (Fig. 1). The separation of the basins led to the evolution of separate faunas and different biostratigraphies (e.g. Rögl, 1996) making stratigraphic correlations problematic. The Pannonian Basin to the west and the Dacic Basin to the east (Fig. 1) are in a back-arc and foreland position relative to the Carpathians, respectively. The Pannonian Basin system formed as a result of back-arc extension during the Miocene (Horváth et al., 2006) and features the Tectonophysics 502 (2011) 175–195 ⁎ Corresponding author. Presently at: Department of Geosciences, University of Oslo, P.O. Box 1047, Blindern, 0316 Oslo, Norway. E-mail address: [email protected] (K.A. Leever). 0040-1951/$ – see front matter © 2010 Elsevier B.V. All rights reserved. doi:10.1016/j.tecto.2010.01.003 Contents lists available at ScienceDirect Tectonophysics journal homepage: www.elsevier.com/locate/tecto

Welcome message from author
This document is posted to help you gain knowledge. Please leave a comment to let me know what you think about it! Share it to your friends and learn new things together.
Transcript

Tectonophysics 502 (2011) 175–195
Contents lists available at ScienceDirect
Tectonophysics
j ourna l homepage: www.e lsev ie r.com/ locate / tecto
The evolution of the Danube gateway between Central and Eastern Paratethys(SE Europe): Insight from numerical modelling of the causes and effects ofconnectivity between basins and its expression in the sedimentary record
K.A. Leever a,⁎, L. Matenco a, D. Garcia-Castellanos b, S.A.P.L. Cloetingh a
a Netherlands Research Centre for Integrated Solid Earth Science (ISES), Faculty of Earth and Life Sciences, VU University, De Boelelaan 1085, 1081 HV Amsterdam, The Netherlandsb Instituto de Ciencias de la Tierra Jaume Almera (ICTJA-CSIC), Group of Dynamics of the Lithosphere (GDL), Solé i Sabarís s/n, 08028 Barcelona, Spain
⁎ Corresponding author. Presently at: Department of GP.O. Box 1047, Blindern, 0316 Oslo, Norway.
E-mail address: [email protected] (K.A. Leever).
0040-1951/$ – see front matter © 2010 Elsevier B.V. Aldoi:10.1016/j.tecto.2010.01.003
a b s t r a c t
a r t i c l e i n f oArticle history:Received 15 June 2009Received in revised form 4 December 2009Accepted 9 January 2010Available online 20 January 2010
Keywords:ConnectivitySedimentary basinsNumerical modellingPaleogeography
The Pannonian and Dacic Basins in SE Europe are presently connected by the Danube River across the SouthCarpathians, to which they are in a back-arc and foreland position respectively. Part of the Paratethys realmduring the Neogene, openwater communication between the basins was interrupted by the Late Miocene upliftof the Carpathians. Different mechanisms have been proposed for the formation of the Danube gateway: captureof the upstream lake or an upstream river or incision of an antecedent river. Estimates on its age range from LateMiocene to Quaternary. A related issue is the effect of the large Mediterranean sea level fall related to theMessinian Salinity Crisis on the Paratethys subbasins, specifically the “isolated” Pannonian Basin.In a synthetic numerical modelling study, using a pseudo-3D code integrating tectonics, surface processes andisostasy, we addressed the causes and effects of changes in connectivity between two large sedimentary basinsseparated by an elevated barrier. Specifically, we aimed to find the expression of connectivity events in thesedimentary record in general and the consequences for the evolution of the Pannonian–Dacic area in particular.We studied a range of parameters including the geometry and uplift rate of the barrier, downstream sea levelchange and lithosphere rigidity.We found that changes in connectivity are expressed in the sedimentary record through their effect on base levelin the upstream basin and supply in the downstream basin. The most important factors controlling the responseare the elevation difference between the basins and the upstream accommodation space at the time ofreconnection. Themost pronounced effect of reconnection through lake capture is predicted for a large elevationdifference and limited upstream accommodation space. Downstream increase in sediment supply is dependenton the latter rather than the reconnection event itself.Of the parameters we tested, the rigidity of the lithospherewas found to be ofmajor importance by its control onsediment loaded subsidence and generation of accommodation space. A downstream sea level change is unlikelyto induce capture, but may affect the upstream lake level by enhancing incision in a pre-existing gateway. In thePannonian–Dacic region, the mechanically weak, continuously subsiding Pannonian lithosphere allowedaccommodation of significant volumes of continental sedimentation and as a consequence, transfer of excesssediment to the downstream Dacic Basin was only gradual. The Messinian sea level fall in the Dacic Basin couldhavebeen recorded in thePannonianBasin only if a connectionbetween thebasins already existed.Moredetailedmodelling of river incision taking into account lateral differences in erodibility in the South Carpathians will berequired to give better time constraints on the formation of the Danube Gateway.
eosciences, University of Oslo,
l rights reserved.
© 2010 Elsevier B.V. All rights reserved.
1. Introduction
Paratethys, extending from the foreland of the Alps to the Aral Sea(Fig. 1a), was a large brackish epicontinental sea that was separatedfrom the world oceans during the progressive closure of the TethysOcean and associated rising of the Alpine chain. In Southeast Europe,
formation and Late Miocene uplift of the Carpathians disrupted openwater communication between the Central/Western and EasternParatethys, corresponding to the Pannonian Basin and the Dacic Basinrespectively (Fig. 1). The separation of the basins led to the evolution ofseparate faunas and different biostratigraphies (e.g. Rögl, 1996)makingstratigraphic correlations problematic.
The Pannonian Basin to the west and the Dacic Basin to the east(Fig. 1) are in aback-arc and forelandposition relative to theCarpathians,respectively. The Pannonian Basin system formed as a result of back-arcextension during the Miocene (Horváth et al., 2006) and features the

176 K.A. Leever et al. / Tectonophysics 502 (2011) 175–195

177K.A. Leever et al. / Tectonophysics 502 (2011) 175–195
weakest continental lithosphere of Europe (Cloetingh et al., 2006). Thesubsidence in the Getic Depression (westernmost part of the DacicBasin) was due to its transtensional opening during the clockwiserotation of the orogen along the Moesian platform and later orogenicloading (Matenco et al., 1997; Fuegenschuh and Schmid, 2005).
Other than by tectonic structuring, the connectivity between theParatethys subbasins was influenced by climate through its control onsea level. Effects of themajor sea level fall in the adjacentMediterraneanSea related to the Messinian Salinity Crisis (>1000 m, Clauzon, 1978)have been reported in the Paratethys subbasins, both the Black Sea(Gillet et al., 2007), the Dacic Basin (Clauzon et al., 2005; Leever et al.,2009) and the Pannonian Basin (Csató et al., 2007; Leever et al., 2009).
Presently, the Pannonian and Dacic Basins are exposed andconnected by the Danube River, deeply incised into its gorges acrossthe South Carpathians (Fig. 1b). The morphology of the long-studiedfeature has been explained by the contrasting models of either streamcapture (Peters, 1876), lake overflow (Toula, 1896) or incision of anantecedent river (Cvijic, 1908), while estimates on the age of theirformation range fromSarmatian toQuaternary (seeMarovic et al., 1997,for a review). Thesemodels are fundamentally different in the sense thatthe “capture model” assumes that the river carved its bed into a pre-existing topography by headward erosion, while the “antecedent rivermodel” assumes that river incision was able to keep pace with uplift ofthemountains—implying that thefluvial connection between the basinswas never lost.
Recent modelling work addressed the evolution of gateways acrosselevated barriers by investigating the factors controlling capture(piracy) of tectonic lakes (Garcia-Castellanos, 2006) and even anocean (Loget and Van Den Driessche, 2006): capture of the AtlanticOcean across the strait of Gibraltar reputedly allowed flooding of theMediterranean, restoring its sea level and ending theMessinian SalinityCrisis. The time required for capture was found to be dependent mostlyon the precipitation/evaporation budget in the captured drainage basin(upstreamof the barrier), the rate of tectonic uplift at the barrier and theflexural isostatic response of the lithosphere (Garcia-Castellanos et al.,2003; Garcia-Castellanos, 2006) and on the base level in the lower(downstream) basin (Loget and Van Den Driessche, 2006).
In this paperweuse forward numericalmodelling of coupled surfaceprocesses and lithosphere response to determine the effect of changingconnectivity between two large sedimentary basins on depositionalgeometries and sediment partitioning. The aim is to define the signatureof connectivity events on the stratigraphic record, i.e. what to look for inseismic data. In other words, applied to the study area: are observationsof sedimentary architecture from seismic sequence stratigraphy of anyuse to decide which of the models for formation and evolution of theDanube gateway (capture vs. incision of an antecedent river) is correct?We address questions such as: what is the influence of the stronglycontrasting lithosphere strength in the Pannonian and Dacic Basins?Could the effects of the Mediterranean sea level fall of the MessinianSalinity Crisis have extended to the Pannonian Basin, and how? Did itinfluence the evolution of the Danube Gateway and as such theconnectivity between the Pannonian and Dacic basins?
2. Tectonic and paleogeographic setting of Paratethys in SE Europe
2.1. Tertiary tectonic evolution
The Pannonian–Carpathian region evolved during Alpine deforma-tions in the tectonic context of the Mediterranean, which is character-
Fig. 1. Study area. a. Late Miocene (Messinian) paleogeography of Paratethys and theMediterb. DEM of the Pannonian–Carpathian area. Blue lines indicate the extent of Lake Pannon (aftsteps postdating the mid-Sarmatian disconnection of the two domains (M–U Sm, Middle–UFig. 2). White lines are drainage divides and indicate the boundaries of the present day Dadrainage basin, the Carpathians and northern Balkans divide the Dacic (200×103 km2) and(and sediment source) areas of the modeled parts of the Pannonian and Dacic basins. The Drealms in the South Carpathian Orocline.
ized byhighly arcuate plate boundaries resulting from the roll-back andsteepening of subducted lithosphere into land-locked remnant oceanicbasins (Wortel and Spakman, 2000; Fig. 1a).
The South Carpathian orocline, located between the Balkans in thesouth and theSouthCarpathians in thenortheast (Fig. 1),was structuredin a polyphase tectonic history that started in theMiddle Cretaceous andcontinuedwell into theMiocene (Sandulescu, 1984; 1988;Matenco andSchmid, 1999; Fuegenschuh and Schmid, 2005). Paleogene to EarlyMiocene rotation of the Cretaceous belt around the western edge of theMoesian promontory led to orogen-parallel extension which culminat-ed in the Late Eocene and large displacement along curved strike–slipfaults during the Oligocene to EarlyMiocene (Cerna Jiu and Timok fault,Fig. 1) Locally, the exhumation inducedby theupliftwas large enough tobe recorded by apatite fission track data (Fuegenschuh and Schmid,2005 and references therein).
In the Moesian foreland plate, the transcurrent motions led to thetranstensional opening of the Getic Depression as a dextral pull-apartbasin during the Early Miocene. In the course of the Miocene, thetectonic regime changed to transpression,with the strike slipmotions inthewesternGetic Depression gradually changing to thrusting in the east(Rabagia and Fülöp, 1994; Rabagia andMatenco, 1999). Thrusting of thebelt onto theMoesian Platform led to additional subsidence in the SouthCarpathian foredeep. The effective elastic thickness of the Moesianlithosphere has been estimated at 30 km (e.g. Cloetingh et al., 2006).
The ongoing Neogene E-ward movement of the internal Carpathianunits, driven by slab roll back, led to extension in the intra-Carpathianarea, affecting both Tisza–Dacia in the south and the Alcapa block in thenorth (Ustaszewski et al., 2008). The formation of the Pannonian basinsystem by rifting and transtension (Horváth et al., 2006) was controlledby three main tectonic processes, gravitational collapse, subductionrollbackand asthenosphereupdoming, the relative importance ofwhichis still a topic of intense debate (Cloetingh et al., 2006 and referencestherein). In particular the latter process led to weakening of thelithosphere in the Pannonian Basin, its effective elastic thickness beingestimated at 5–10 km by Lankreijer et al. (1997). In the last stage of itsevolution, basin formation and extension in the Intra-Carpathian regionhave come to an end. Structural inversion of the Pannonian basin iscurrently in progress, driven by the push of the Adriatic plate (e.g. Badaet al., 1999) and evidenced by significant late-stage uplift andsubsidence anomalies during Late Pliocene through Quaternary times(Horváth and Cloetingh, 1996).
2.2. Paleogeographic evolution
2.2.1. Biostratigraphic constraints on connectivityUntil the Middle Sarmatian (Bessarabian, Fig. 2), the Central and
Eastern Paratethys were connected over the South Carpathian orocline(Fig. 1), as evidenced by the brackish water fauna common to Centraland Eastern Paratethys found in the intramontane basins on its westflank (Marinescu et al., 1981 and references therein; Gagic, 1997).
During the Sarmatian, uplift of the South Carpathian orocline led tothe disconnection of the two basins. Open water communicationceased and Central Paratethys continued its evolution as the endemicLake Pannon, the divergence in the faunal evolution due to theseparation defining the onset of the Pannonian stage. In the DacicBasin the Sarmatian stage continued into the Khersonian (Fig. 2).
During the Pannonian stage, corresponding to the Upper Sarmatianand Meotian of the Dacic Basin (Fig. 2), the fauna in the two basins aredifferent (e.g. Rögl, 1996; Rögl, 1999). However, in Meotian sediments
ranean showing location of gateways and study area. Modified from Popov et al. (2006).er Magyar et al., 1999a) and the Dacic Basin (after Saulea et al., 1969) at different timepper Sarmatian; Meot, Meotian; U Pont–Dc, Upper Pontian–Dacian; see time scale in
nube drainage basin. Black rectangle represents the modeled area. Within the DanubePannonian (600×103 km2) realms. Note the difference in the extent of the drainage
anube crosses the drainage divide between the Pannonian back-arc and Dacic foredeep
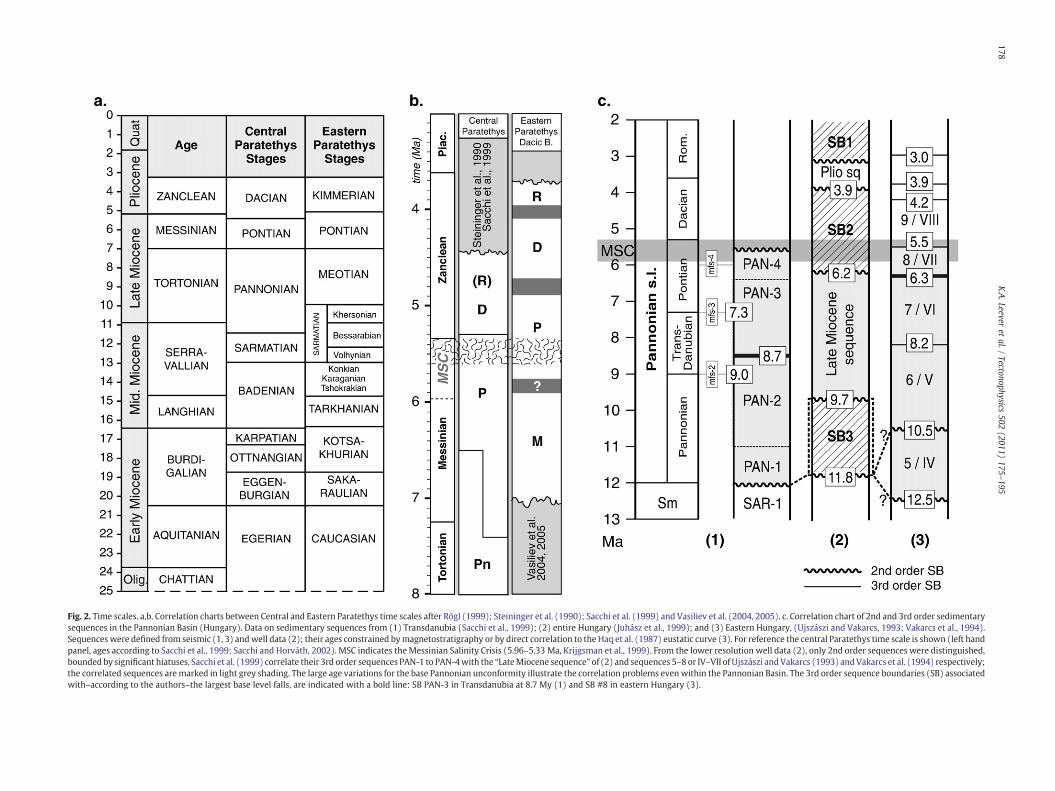
Fig. 2. Time scales. a,b. Correlation charts between Central and Eastern Paratethys time scales after Rögl (1999); Steininger et al. (1990); Sacchi et al. (1999) and Vasiliev et al. 04, 2005). c. Correlation chart of 2nd and 3rd order sedimentarysequences in the Pannonian Basin (Hungary). Data on sedimentary sequences from (1) Transdanubia (Sacchi et al., 1999); (2) entire Hungary (Juhász et al., 1999); and (3) ern Hungary, (Ujszászi and Vakarcs, 1993; Vakarcs et al., 1994).Sequences were defined from seismic (1, 3) andwell data (2); their ages constrained bymagnetostratigraphy or by direct correlation to the Haq et al. (1987) eustatic curve (3 r reference the central Paratethys time scale is shown (left handpanel, ages according to Sacchi et al., 1999; Sacchi and Horváth, 2002). MSC indicates the Messinian Salinity Crisis (5.96–5.33 Ma, Krijgsman et al., 1999). From the lower res ion well data (2), only 2nd order sequences were distinguished,bounded by significant hiatuses. Sacchi et al. (1999) correlate their 3rd order sequences PAN-1 to PAN-4with the “LateMiocene sequence” of (2) and sequences 5–8 or IV–VII o szászi andVakarcs (1993) andVakarcs et al. (1994) respectively;the correlated sequences aremarked in light grey shading. The large age variations for the base Pannonian unconformity illustrate the correlation problems evenwithin the P onian Basin. The 3rd order sequence boundaries (SB) associatedwith–according to the authors–the largest base level falls, are indicated with a bold line: SB PAN-3 in Transdanubia at 8.7 My (1) and SB #8 in eastern Hungary (3).
178K.A.Leever
etal./
Tectonophysics502
(2011)175
–195
(20East). Foolutf Ujann

179K.A. Leever et al. / Tectonophysics 502 (2011) 175–195
in the Dacic Basin, Pannonian-derived Congeria, typical for freshwaterenvironments, have been found (Olteanu, 1979), suggesting a fluvialinflux from Lake Pannon into the Dacic Basin.
In the Lower Pontian (Eastern Paratethys definition, Fig. 2), the faunain the Pannonian, Dacic and Euxinic realms again show commoncharacteristics. The reconnection has been attributed to the “Odessiantransgression” (Olteanuand Jipa, 2006). Pannonian type faunaare foundover the entire Paratethys. However, no Eastern Paratethys forms havebeen found in the Central Paratethys (Magyar et al., 1999b).
2.2.2. Seismic sequence stratigraphic constraints on base level changesLake Pannon (Magyar et al., 1999a) inherited its complex bottom
topography from the rifting and transtension stage that led to theopening of the PannonianBasin. Subsidence rates andwater depthweretherefore different in the individual subbasins. Disconnected from theworld oceans during the Pannonian endemic stage (Fig. 2), the waterlevel of the lakewas controlled by the balance between evaporation andwater supply from contributing rivers and precipitation (Garcia-Castellanos, 2006), both controlled by climatic variations (Kázmér,1990; Juhász et al., 1999). The surrounding mountain chains providedabundant sedimentary influx. The basin was progressively filled byfluvial–deltaic and turbiditic sediments dominantly fromnorthwesterly(palaeo-Danube) and northeasterly directions (palaeo-Tisza) (Vakarcset al., 1994).
The variations in rate of progradation to aggradation of the delta-fed shelf-slope systems, led to the recognition of third and fourth orderseismic sequences (Vakarcs et al., 1994; Sacchi et al., 1999) and in-dicate that the relative lake level varied significantly both in space andtime. The most detailed sequence stratigraphic studies have beencarried out in the Hungarian part of the basin, both to the west of theDanube in Transdanubia (Ujszászi and Vakarcs, 1993; Sacchi et al.,1999) and to the east in theGreatHungarianPlain (Pogácsás et al., 1990;Pogácsás et al., 1992; Csató, 1993; Vakarcs et al., 1994; Csató et al., 2007;Juhász et al., 2007). Estimates of the Pannonian lake level change varyfrom “tens of meters” to 200 m. Due to the scarcity of reliable ageconstraints, the correlation between the sequences is not straightfor-ward (Fig. 2).
The northwestern part of theDacic Basin is coincidentwith theGeticDepression, its subsidence history controlled by transtension andsubsequent foreland flexure (cf. Section 2.1). From a detailed study ofseismic sequence stratigraphy at the margins of the Getic Depression,Rabagia and Matenco (1999) concluded that the observed base levelchanges until the Late Miocene were predominantly tectonicallycontrolled, eustatic changes playing only a subordinate role. A regionalseismic sequence stratigraphic interpretation in the western part of theDacic Basin focused on the Latest Miocene–Pliocene basin fill evolution(Leever et al., 2009). In this stage of its evolution, in contrast to theearlier stage and the Pannonian Basin, control by differential tectonicsubsidencewas less important. A sudden base level fall in the lower partof the Pontian was attributed to the Messinian lowering of the waterlevel in the Black Sea below the threshold of the Dobrogea barrier. LatePontian sediments associated with a subsequent base level risetransgressively cover the older deposits (Leever et al., 2009).
3. Numerical modelling of the signature of changing connectivityon the sedimentary record
We use numerical modelling to study the factors influencingconnectivity and determine its signature on the sedimentary record.The conceptual model considers two adjacent basins separated by anelevated barrier, with or without a pre-existing gateway. In the lattercase, afluvial connection is established by capture of the upstreambasinas the result of its higher lake level and the erosion of the barrier.Coupled forward modelling of tectonics, surface processes and isostasyis used to determine the response of the system in terms of depositionalgeometries to parameters such as tectonic uplift, downstreambase level
changes and flexural rigidity, the importance of which in controllinglake capture and the evolution of tectonic lakes has been established inprevious studies (Garcia-Castellanos et al., 2003; Garcia-Castellanos,2006; Leever et al., 2009).
3.1. The numerical method: TISC
TISC is a pseudo-3D (planform) forward finite difference code(Garcia-Castellanos, 2002; Garcia-Castellanos et al., 2003) in whichtectonics, surface processes and flexural isostasy are fully coupled. It isdesigned to study the interaction between surface mass redistributionand the lithospheric response by uplift and subsidence on largetemporal (105–106 y) and spatial scales (of an entire sedimentarybasin and/or orogenic belt). The rate of surface uplift (and subsidence) isthus a function of the rate of tectonic uplift, erosion and sedimentation,and flexural isostatic rebound. It does not allow–nor do we aim–fordetailed reconstructions of morphological evolution or prediction ofhigher than first order sedimentary sequences.
Tectonic uplift (of the barrier, in our case) is kinematically defined.Resulting surface mass redistribution is calculated at time steps of1000 yr following the stream power-law formulation by Kooi andBeaumont (1994) including short-range diffusive and long-range lineartransport functions that represent hillslope and fluvial processesrespectively. Fluvial transport is calculated by explicitly calculating thedrainage network during the topographic evolution, accounting for theformation of lakes in local topographic minima. These lakes becomeclosed (endorheic) if evaporation in its surface becomes larger than thewater they collect. The time step for imposed tectonic uplift andcalculated flexural isostatic response is 0.5 Ma. Flexural calculationsfollow an elastic thin plate model characterized by the effective elasticthickness Te, and account for the loading of sediment and water as wellas unloading due to erosion.
3.2. Modelling setup and boundary conditions
The model setup and boundary conditions (Fig. 3) are derived fromthe main characteristics of the study area (Fig. 1). The Pannonian andDacic basins are in very different stages of their tectono-thermalevolution, and as a consequence have greatly different lithosphericrigidities (Te of 5–10and30 kmrespectively; Cloetingh et al., 2006). Thebasins are in restricted connection over a topographic high, with only asmall elevation difference between them. The drainage area and hencethe initial sediment supply in the Pannonian basin were much largerthan those of the downstream Dacic basin (Fig. 1).
In the model, where the area of both basins is equal, the largerdrainage area and sediment supply in the upstream basin arerepresented by a water and sediment input at the western edge of themodel (Fig. 3). The surrounding topography prevents any sedimentfrom leaving the model domain. No vertical movements due to flexureare allowed at themodel edges, except on the eastern side. This is basedon the assumption of a steady-state topography in the mountainssurrounding the basins, while the Dacic Basin has a larger extenteastward than its model counterpart (Fig. 1b). In the model, thesediment loading is larger than the erosion due to the external sedimentsource, and these flexural boundary conditions are required to preventexcess downward deflection. The parameters used by the surfaceprocess model are listed in Table 1 and have been validated in previousmodelling studies (e.g. Garcia-Castellanos et al., 2003). Themodelswererun for a period of 15 My. All model runs have a 400×200 km modeldomain and 2×2 km grid cell size (Fig. 3). In our reference model, theinitial maximum elevation of the surrounding topography is 800 m andthe maximum initial depth of the basins is 400 m. Tested variations ofthis scenario are summarized in Table 2. An example ofmodel evolutionis shown in Fig. A1.

Fig. 3. Model setup. a. 2 km resolution DEM of the modeled area. b. Initial topography and boundary conditions for the conceptual model series: 400×200 km, 2 km grid cells.Topography in this figure corresponds to the initial elevations for Model 2, 5 and 6. The geometry of the barrier separating the two basins is different for the various model runs, seeTable 2. All model boundaries are fixed for deflection, only the eastern side is allowed to move freely. A sediment source on the western side of the model (1.3 103 km3/Ma)represents the flux from the large Pannonian drainage area. Sediment is allowed to leave the model at all sides. c. Model setup and parameters in cross section. Qs_ext, externalsediment input; P, precipitation rate; E, evaporation rate; S, slope; H, max. elevation of surrounding topography; Hb, elevation of barrier; Hg, elevation of gateway; dH, elevationdifference between base levels at time of capture; U, uplift rate. Parameter values are listed in Table 1 and 2.
180 K.A. Leever et al. / Tectonophysics 502 (2011) 175–195
3.3. Results
3.3.1. Model 1—reference modelIn the referencemodel, the basins are separated by a threshold at sea
level. The surrounding topography is 800 m (Fig. 3, Table 2). Modelresults after 15 My are shown in Fig. 4.
3.3.1.1. Rates of sedimentation and erosion. In the upstream basin,sedimentation initially occurs at a higher rate than in the downstreambasin (Fig. 4a, b). This is due to the external sediment source that feedsthe upstream basin (Fig. 3), while the downstream basin is initiallyonly sourced by erosion from the surrounding mountains. Between6.5 and 9 My, the relative sedimentation rates are inverted: the

Table 1Parameters for the surface processmodel. Transport and diffusion coefficients and erosionand deposition length scales according to the formulation of Kooi and Beaumont (1994).
Parameters Values
Model resolution (grid cell size) 2×2 kmTransport coefficient Kf 60 kg/m3
Diffusion coefficient Ks 0.05 m2/sSurface processes time step 0.05 MyTectonic/isostatic time step 0.5 MyErosion length scale lf
Basement 120 kmSediments 60 km
Deposition length scale lf 25 km
181K.A. Leever et al. / Tectonophysics 502 (2011) 175–195
upstream basin is filling up and excess sediment is transferred to thedownstream basin. In the upstream basin, the sedimentation ratesdecrease to zero as the basin is completely filled (Fig. 4).
The erosion rates show an overall decreasing trend in both basins,due to the declining topography. Erosion rates are higher in theupstream basin, which is surrounded by topography on three sideswhile the downstream basin is lined by topography only on the N and Sside (Fig. 3). The initial decreasing trend in sedimentation rates in theupstream basin (0 to 6 My, Fig. 4b) reflects the decrease in supply fromlocal erosion. The sedimentation rates in the downstream basin,however, do not reflect the local erosion rates: some sediment istransferred from the upstream source into the downstream basin alsobefore the bulk shift in sedimentation between 6.5 and 9 My.
3.3.1.2. Depositional geometries. The increase in sedimentation rates inthe downstream basin is evident from the increasing spacing betweenthe0.5 My time lines from6My(Fig. 4c). Also theupstreambasin showslocally increased sedimentation rates after 6 My, when looking at thetime lines. The local increase is due to the decreased accommodationspace and is not reflected in the sedimentation rates integrated over theentire upstream basin (Fig. 4b–c). Sediment loading resulted in flexuralisostatic subsidence in the entire model area: more than 400 m in thebasins (the basin floorwas initially at –400 m, Table 2) and some 200 mon top of the “barrier” (Fig. 4c). In the upstream basin, subsidence led toa concave shape of the initially flat shelf edge trajectory.
Table 2Model setup.
Geometry
Max elevationH (m)
Barrier elevationHb (m)
GatewaHg (m)
1 Reference model (Fig. 4) 800 0 –
2 Gateway elevation (Fig. 5) 800 800 0100200
3 Barrier slope (Figs. 6, 7) 400 400 –
4 Uplift rate (Figs. 8, 9) 800 0 to 400 –
5 Te constant (Figs. 10, 11) 800 800 200
6 Te varied (Figs. 11, 12) 800 800 200
7 Sea level change (Fig. 13) 400 400 –
3.3.2. Effect of the barrier geometry (models 2-3)The effect of barrier geometry is studied in different ways. In Model
2, the basins are connected across an existing gateway, the elevation ofwhich is varied. In the subsequent models, the basins are initiallydisconnected and the elevation and slope of the barrier are varied.
3.3.2.1. Model 2: elevation of a pre-existing gateway. Model 2 addressesthe effect of the initial elevation of a pre−existing gateway in thebarrierbetween the two basins (Table 2, Fig. 3). The results are shown in Fig. 5,with those of Model 1 for comparison.
3.3.2.1.1. Rates of sedimentation and erosion. During the first 7 My,the gateway elevation has virtually no effect on the infill of the basins:the cumulative sedimentation is equal for the three cases (Fig. 5a). Onlyin the second model stage, after the shift of the bulk sedimentation tothedownstreambasin, do themodels showsomedifference in sedimentvolume. The difference with the referencemodel (inwhich no barrier ispresent) ismorepronounced than thedifferencebetween the individualcases: the bulk sedimentation shift occurs earlier for all cases inModel 2than in the reference model. Moreover, sedimentation continuesafterward, albeit at a lower rate.
An initial difference in erosion rates in the upstream basin (Fig. 5b),reflecting the initial difference in base level controlled by the elevationof the outlet of the basin, disappears after 2 My. This is the time requiredto bring the gateway to an equal elevation for all three models, byallowing the river in the gateway to become graded in a dynamicequilibrium. In the downstream basin, the erosion rates are exactlyequal for all three models during the entire model time (Fig. 5b).
3.3.2.1.2. Depositional geometries. The depositional geometries inModel 2, i.e. the shelf edge trajectory and the spacing between timelines, are very similar to the reference model. A major difference is thatsedimentation in the upstream basin continues after the bulksedimentation shift, accommodating a large volume offluvial sediments(Fig. 5, subparallel subhorizontal time lines). The volume of continentalsediments in the threemodels is different, however; the largest volumebeing accommodated by the model with the initially highest gateway(Fig. 5c). The fluvial sedimentation and the difference in volumes can beexplained from the river profiles at the final time step. The erodingbarrier between the two basins is uplifting by flexural isostatic rebound.This is the main difference with the reference model, in which the“barrier” was initially at sea level, was loaded by sediments and, as a
Max barrieruplift rateU (m/Ma)
Te (km)W–E
Rate of sealevel change(m/Ma)
y elevation Max slopeS (degrees)
– – 10 –
2.7 – 10 –
0.75 – 10 –
232.7 100 10 –
200400
2.7 – 30 –
20105
2.7 – 20–30 –
10–305–30
2 – 10 20010066.650

182 K.A. Leever et al. / Tectonophysics 502 (2011) 175–195
result, subsided. The gateway between the two basins is more resistantto erosion than the sediments in the basins (Table 1), resulting in aknickpoint in the river profile. Upstream of this knickpoint, i.e. in the
upstreambasin, the river accumulates sediments inorder tomaintain itsgradient and keep the ability to cross the barrier (see also Snow andSlingerland, 1990).

183K.A. Leever et al. / Tectonophysics 502 (2011) 175–195
3.3.2.2. Model 3: slopes of the barrier. In thismodel, in contrastwith thepreviousmodels, there is no pre-existing gateway of reduced elevationas a way of communication between the basins. The surroundingtopography is 400 m (Table 2). The effect of barrier slope wasaddressed in three different models, with a slope on the downstreamside of the barrier of max 0.75, 2 and 3° respectively. The slope on theupstream side of the barrier is 2°, in order to keep the volume of theupstream basin constant. Sedimentation and erosion rates are shownin Fig. 6, profiles in Fig. 7.
3.3.2.2.1. Rates of sedimentation and erosion. The model with thelowest slopes has the largest exposed area and hence the highesterosion rates in the downstream basin (Fig. 6). The sedimentationrates in the downstream basin are initially equal to the local erosionrates: the only supply to the downstream basin is from the localerosion. The moment of capture (Fig. 6, marked by x) may berecognized from the breakdown of this relationship: sedimentationrates start increasing while the erosion rates keep decreasing. Captureoccurs first for the model with the steepest slope (Fig. 6): due to thesteeper slope the barrier is narrower and less erosion is required tooversteepen the slopes at the drainage divide. This asymmetry allowsthe local backward migration and lowering of the drainage divide andthereby capture of the upstream lake—of which the level has risen tothe top of the barrier (Fig. 7).
It is important to notice that, after capture of the upstream basin,the sedimentation rates in the downstream basin initially increaseonly gradually. The strongest increase occurs later and is due to theoverfilling of the upstream basin. The capture-induced increase insedimentation rates in the downstream basin is not reflected by asimilar decrease in the upstream basin: the water level drop thatresults from the capture leads to a larger exposed area and therefore toincreased supply, balancing the sediment outflow to the downstreambasin (Fig. 6). Moreover, the capture time influences the timing of thebulk sedimentation shift, because capture and subsequent lowering ofthe outlet by erosion lead to lowering of the base level in the upstreambasin and reduction of the accommodation space. As such, the soonerthe capture, the sooner the upstream basin is filled, and the sooner thesedimentation shifts to the downstream basin.
The lacustrine–continental transition in the upstream basin occursduring or after the strongest decrease in sedimentation rates.Compared to the previous model series, only a very small amount ofcontinental sediments are deposited in the upstream basin (compareFig. 5c and 7), before sedimentation rates drop to zero or even becomenegative (implying erosion of previously deposited sediments).
3.3.2.2.2. Depositional geometries. The implications of lake captureon depositional geometry are shown inmore detail in Fig. 7 for each ofthe three scenarios. In the left series of panels the sediment geometryin the upstream basin before capture and resulting erosion is shown.The initial progradation, seen from the shelf edge trajectory, is due tothe high sediment input close to the source (Fig. 3). The sediments areprogressively spread over a larger area and consequently develop amore aggradational character, also due to the larger subsidence in thecenter of the basin.
Capture occurs first for steeper slopes (Fig. 7c). Following capture(time line highlighted in Fig. 7, right hand panels), sediments in the up-stream basin are deposited in a downstepping geometry during theongoingwater level fall that results fromerosional lowering of theoutlet,lasting ∼2 My in all cases. The sediment accumulation area in theupstream basin is reduced by the water level fall, resulting in a local
Fig. 4. Model 1: referencemodel. a. Cumulative sediment volumes, derived from local erosion aThe sedimentation rate is the rate of variation of the total sediment volume, while the erosiondeposited sediments.Note that the initial sediment accumulation rates in theupstreambasingrea. and b. marks the period of bulk sedimentation shift from thewestern to the eastern basin, chacontinental transition in the upstream basin (t=8My). The (restricted) connection between thfromthestart, as seen fromthesedimentation rates in thedownstreambasin that exceed the locat the final time step (15 My) with time lines for each 0.5 My. The onset of increased sedimentainfill of the upstream basin (t=8My) by a heavy broken line. Shelf-slope break indicated by s
increase in sedimentation rates (see spacing of time lines in Fig. 7, righthand panels) even though the total rate in the whole basin remainslargely unchanged. The downstream basin shows higher sedimentationrates (wider spacing of the time lines in cross section, Fig. 7, cf. Fig. 6)after capture.
The moment of capture determines the total amount of sedimentsthat can be accommodated in the upstream basin, and therefore theamount of sediments transferred to the downstream basin. The longerthedurationof the isolated stage of theupstreambasin,with its elevatedbase level, the more sediment can be accommodated. The duration ofthe lacustrine stage in the upstream basin is thereforemost extended incase of the low slope model (upper panels): the upstream basin is notcompletelyfilled even after 15 My. Delay in themoment of capture, i.e. alonger isolated life time of the lake at local elevated base level, leads to ahigher degree of overfilling. The resulting high river gradient aftercapture causes erosion rather than fluvial sedimentation in theupstream reaches in order to attain equilibrium (compare Figs. 5, 7).
3.3.3. Effect of barrier uplift rate (Model 4)In this model, the two basins are initially separated by a barrier at
0 m(as in the referencemodel),which is subsequently uplifted. The rateof theuplift is varied in the three caseswhile itsmagnitude is constant at400 m (Table 2). The width of the uplifting zone is ∼50 km and hasslopes of ∼3°. The base level or maximum lake level in the upstreambasin is kept at 200 mbyanoutlet at theNmargin of theupstreambasin,simulating the effect of the precipitation–evaporation ratio in thePannionian Basin, which has a larger area in nature than in the model.The surrounding topography is 800 m.Results are shown inFigs. 8 and9.
3.3.3.1. Rates of sedimentation and erosion. The conditions and initialmodel evolution, before the onset of uplift at 2 My, are equal toModel 1.During this stage, some sediment is transferred from the upstream tothe downstream basin, shown by the sedimentation rates in thedownstream basin that exceed the local supply (Fig. 8b). In the absenceof an initial gradient, the two basins are disconnected the moment thebarrier rises above 200 m, the maximum lake level of the upstreambasin.
Uplift of the barrier leads to an increase of the erosion rates in thedownstream basin (Fig. 8a), while the erosion rates in the upstreambasin decrease. The changes are most pronounced for themodels withthe high uplift rates.
The approximately constant sedimentation rates in the downstreambasin during the uplift period for low uplift rates (U=100m/Ma,Fig. 8b) reflect the continuous connection between the basins,maintained by the barrier erosion that is able to keep upwith the uplift.
The sedimentation rates in the downstream basin start increasinggradually after the end of the uplift stage from 6 My on, due to erosionallowering of the barrier and increasing sediment transfer from theupstream basin. For the other models (U=200, 400 m/Ma), thesedimentation rates in the downstream basin match the local supplyrates from the moment of disconnection onward (Fig. 8b). Capture inthese models (marked by x in Fig. 8b) directly leads to the onset of thebulk shift in sedimentation between the basins, as shown by the suddenand fast increase of sedimentation rates in the downstream basin.
3.3.3.2. Depositional geometries. Sedimentation patterns are shown inFig. 9. In the left panels, the time step preceding capture is shown. Notethat the basins in the low uplift rate scenario (U=100m/Ma, upper
nd external sediment input. b. Rates of sedimentation (bold lines) and erosion (thin lines).rate represents the total eroded volume per time step, including bedrock and previouslyatly exceed theerosion ratesdue to theexternal sediment input (see Fig. 3)Grey shading inracterized by rapidly changing sediment accumulation rates and related to the lacustrine–e two basins allows some sediment transfer from the upstream to the downstream basin
al supply (erosion) rates. c.W–E cross sectionat the centerof themodel (y=0,cf FigureA1)tion rates in the downstream basin (t=6.5 My) ismarked by a bold line; the final stage ofhort dash in both basins.

Fig. 5.Model 2: effect of gateway elevation. a. Cumulative sediment volumes. For comparison the results of Model 1 are shown. In contrast to Model 1, sedimentation continues in the upstream basin after the bulk sedimentation shift, albeit atlower rates. The transition from lacustrine to fluvial sedimentation is marked by box (cf Fig. 5c). b. Erosion rates. Rates are equal in the downstream basin for all model runs (dashed lines), independent of the gateway elevation, but different inthe upstream basin during the first 2 My. c. W–E cross sections at t=15 My. Lacustrine–continental transition is indicated by bold line, shelf-slope break by short dash. The volume of continental sediments deposited in the upstream basinsince 8 My is largest for the model with the initially highest gateway elevation of 200 m (lower panel).
184K.A.Leever
etal./
Tectonophysics502
(2011)175
–195

Fig. 6.Model 3: effect of barrier slope. Sedimentation and erosion rates indicated by bold and thin lines respectively. High slopes correspond to a narrow barrier (see also Figs. 3c, 7),and lead to faster capture of the upstream basin (marked by X). Capture results in increasing sedimentation rates in the downstream basin, which were initially declining and equalto the local erosion rates. Increasing erosion rates in the upstream basin after capture reflect the increased exposed area due to the falling base level. The largest increase insedimentation in the downstream basin corresponds to the end of lacustrine sedimentation and filling up of the upstream basin (marked by arrows).
185K.A. Leever et al. / Tectonophysics 502 (2011) 175–195
panels) were repeatedly connected and disconnected during the periodof uplift, as incision was able to keep up with uplift. The uplifted,elevated barrier represents a load that causes deflection of the basinfloor adjacent to the barrier (compare Fig. 9, upper left panel and Fig. 7,lower left). The sedimentation patterns in the upstream and down-streambasins subsequent to capture are similar to those inModel 3 (seeFig. 7). However, in Models 4b and 4c, because the barrier rises to anelevation exceeding the maximum upstream lake level, and because–despite the subsidence induced by the barrier uplift–the availableaccommodation space preceding capture is smaller (base level at 200 minstead of 400 m), the basin fill is in a more advanced stage at themoment of capture than in Model 3. The capture is followed by animmediate strong increase in sedimentation rates in the downstreambasin (lower panels, see also Fig. 8b), instead of the more gradualincrease in sedimentation rates characterizing the low uplift rate ofModel 4a, and also Model 3 for low slope values.
3.3.4. Effect of flexural rigidity (Models 5–6)In these models, the effect of flexural isostatic response is studied
by varying the effective elastic thickness Te.
3.3.4.1. Model 5: constant Te. The initial setup of this model is equal toModel 2 (Fig. 3) with an initial gateway at 200 m elevation in an800 m surrounding topography. Based on estimates of lithosphererigidities (Lankreijer et al., 1997; Cloetingh et al., 2006), we varied Tevalues between 5 and 30 km (Table 2), constant over the entire modelarea. The results are shown in Fig. 10.
In Fig. 10a the sedimentation rates in the upstreamand downstreambasin are compared for different Te. Onset of the (enhanced) decrease ofsedimentation rates in the upstreambasin occurs first for themost rigidplate (Te=30 km, at ∼3.5 My) and results in a very pronounced andsudden increase in sedimentation rates in the downstream basin(Fig. 10a, peak at 5.5 My). The required time to completely fill up theupstreambasin is shortest on the highly rigid plate (Figs. 10 and 11). ForTe=30 km, even the downstream basin is filled up by 10 My. For theweaker plates, the onset time of decreasing sedimentation rates in theupstreambasin is later, and the changemoregradual.Muchmore time isrequired to completely fill the basin: the low rigidities allow thegeneration of significant additional accommodation space by sediment
loading. The onset of fluvial sedimentation in the upstreambasin occursjust before the peak in sedimentation rates in the downstream basin forallmodels. Sedimentation rates in the downstreambasin start graduallyincreasing long before the onset of the fluvial stage in the upstreambasin. In Fig. 10b, the time to the lacustrine/continental transition andthe complete filling of the basin is plotted as a function of Te. In caseof a weak lithosphere, the basin infill not only takes much longer tocomplete, but it is also preceded by a protracted stage of fluvial sedi-mentation (cf. Fig. 11, upper panels).
3.3.4.2. Model 6: lateral transition in Te. These models address theeffect of a lateral (W–E) change in Te. Based on the lithosphererigidities in the Pannonian and Dacic Basins, the Te in the east is keptat 30 km, while its value in the upstream basin is varied between 5and 30 km (Table 2). The transition is gradual over a distance of 60 kmbelow the barrier.
The results of this model (Fig. 11, lower panel; Fig. 12) are similar tothose of the previous model. The rigidity of the lithosphere underlyingthe upstream basin determines its infill time, and as such the time andrate of the shift of bulk sedimentation to the downstream basin. Peaksedimentation in the downstream basin is again most pronounced incase of a rigid upstream lithosphere. The bulk sedimentation shift occurs∼0.5 My earlier for all scenarios than in the previous model, because ofreduced subsidence of the downstream margin of the upstream basin.
3.3.5. Effect of downstream base level change (Model 7)In this model, the basins are initially disconnected by a 400 m high
barrier (Table 2). A sea level fall of 200 m starts at t=0My andproceeds at different rates, until the initial level is reached again at8 My (Fig. 13a). In case of the fastest sea level fall, this leads to a 6 Mylowstand period. The 8 My time interval was chosen based on theresults of Model 3, which has the same setup except the sea levelchange, and where capture is predicted at t=7.5 My (Fig. 7).
The results are presented in Fig. 13b, which shows only thesedimentation and erosion rates in the downstream basin. The modelsshow an initial increase in erosion and sedimentation rates, because thefalling water table leads to the exposure of a larger area. The rate ofchange reflects the rate of the sea level fall. The sedimentation anderosion rates decrease again during the subsequent sea level rise.

Fig. 7.Model 3: effect of barrier slope (continued). Cross sections for Model 3. Vertical scale in m, horizontal in km. The left panels show the time step (in My) preceding the captureof the upstream basin. The corresponding time line is marked by a bold line in the right hand panels (cross sections at the model end time, 15 My). The other highlighted (long dash,dotted) time lines represent the end of base level fall and the final stage of lacustrine sedimentation in the upstream basin respectively. For the low slope scenario (S=0.75°), thewestern basin is not completely filled after 15 My. The shelf-slope break is indicated by a dashed line in all panels. Note the difference in depth to basement in the upstream basin andthe (apparent) increase in sedimentation rates in both basins after capture. Further discussion in the text.
186 K.A. Leever et al. / Tectonophysics 502 (2011) 175–195
Capture of the upstream basin (marked by arrows, Fig. 13) occurs onlyafter the sea level has returned to its initial level and is likely triggeredbythe loading effect of the rising sea level which subdues the incisedbarrier. From these results it follows that a base level fall does notaccelerate the capture of the upstream basin. To the contrary, thecapture occurs 0.5 to 1 My later than inModel 3 (without sea level fall).
4. Discussion
4.1. Controls on depositional geometry and sediment partitioning
The individually tested parameters in the differentmodel runs lead tomarked differences in the patterns of sedimentary infill in the two basins.However, we found that the tested parameters are not critical bythemselves, but only to the degree by which they influence the true
parameters that control the downstream sedimentation rates in relationto changes in connectivity. These are the elevation difference and up-stream accommodation space at the time of capture, outlined in Fig. 14.
The difference between the water levels in the two basins beforeconnection has a large effect on the depositional geometries in theupstreambasin since it determines themagnitudeof the capture-inducedupstreambase level fall by erosional lowering of the outlet. The elevationdifference is dependent on the barrier geometry and uplift rate: a largeelevationdifferenceat the timeof capture ismore likely for awidebarrier,high uplift rates and low erodibility (Model 3, 4). The remainingaccommodation space in the upstream basin at the time of capturedetermines the time lag for the bulk shift of sedimentation to thedownstream basin (e.g. Model 1, 2 in Figs. 4 and 5). The remainingupstream accommodation space is not an independent parameter, it isdependent on the timing of capture and moreover it correlates with the

Fig. 8. Model 4: effect of uplift rate. a. Erosion rates. Uplift period is indicated by bars. The vertical scales for the respective basins are offset by 100 m for better distinction.b. Sedimentation rates. Crosses mark moment (period) of capture. Legend as in 8a.
187K.A. Leever et al. / Tectonophysics 502 (2011) 175–195
elevation difference between the basins. Generation of accommodationspace by sediment loading is enhanced by low Te values (Models 5 and6).
These parameters are discussed in more detail below for differentstages in basin evolution: the disconnected (endorheic) and connectedlacustrine stages and the subsequent (upstream) continental stage.Though the modelling setup was based on the characteristics of thePannonian–Dacic realm, the general results may be extended to otherareas where elevated topography divides two sedimentary basins, suchas the Ebro Basin (foredeep to the Pyrenees) and the adjacentextensional Valencia trough (Garcia-Castellanos et al., 2003), separatedby the Catalan Coastal Ranges.
4.1.1. Disconnected stage and capture of the upstream endorheic lake
4.1.1.1. Upstream basin. The elevation difference between the basinsafter capture (and therefore the magnitude of the base level fall) isdetermined by the equilibrium gradient of the river connecting them
which is a function of the erodibility and the width of the barrier. If theupstream basin is still in the deep lacustrine stage with ampleaccommodation space at the time of capture, the capture-inducedbase level fall results in thedepositionof a strongly progradational serieswith a downstepping geometry (e.g. Model 4, Fig. 9). In case of a largeelevation difference and/or limited remaining accommodation space atthe time of capture, the sedimentation rates in the upstream basin arelocally significantly increased because of the reduced sedimentaccumulation area (Fig. 9) and capturemay lead to accellerated infillingof the remaining accommodation space, ending the lacustrine stage.
4.1.1.2. Downstream basin. The sedimentary response to capture in thedownstream basin is mainly sensitive to the remaining upstreamaccommodation space. If the upstreambasin is capturedwhen it still hasample accommodation space, the response in the downstream basin islimited regardless of the elevation of the upstream basin. Though theoverall increase in sedimentation rates in the downstream basin aftercapture is small in these cases (e.g. Model 3, Fig. 6: low uplift rate in

Fig. 9. Model 4: effect of uplift rate (continued). Cross sections. Left panels show the time step preceding capture; right panels represent the final time step (15 My). Sedimentsdeposited during the uplift stage are shaded. Vertical scale in m, horizontal in km. In the right panels, the highlighted time lines represent the time step preceding capture, the end ofbase level fall in the upstream basin, and the final stage of lacustrine deposition (solid, long dash and dotted lines respectively). The capture-triggered increase in sedimentation ratesin the downstream basin is much more pronounced for the higher uplift rates (200, 400 m/Ma): the moment of capture coincides with the last stages of lacustrine infill of theupstream basin. No fluvial sedimentation is accommodated in any of the models.
188 K.A. Leever et al. / Tectonophysics 502 (2011) 175–195
Model 4, Fig. 8b), the effect is focused at the inlet and will be locallysignificant (Model 3, Fig. 7). In contrast, the bulk sediment shift to thedownstream basin will be triggered directly by capture if the remainingupstream accommodation space is small at the time of capture, and/orsufficiently reduced by the capture-induced base level fall (high upliftrates inModel 4, Fig. 8). The latter requires a large pre-capture elevationdifference between the basins.
In other words, lake capture is expressed in the sedimentary recordby affecting base level in the upstream basin and supply in thedownstream basin. The most significant increase in downstreamsedimentation rates, however, is not necessarily directly linked to thecapture event (Figs. 6 and 14).
4.1.2. Connected stageThe upstream accommodation space is controlled by changes in the
lake level as discussed above and, in the absence of tectonic subsidence,
the subsidencedue to sediment loading. The latter is strongly dependenton the rigidity of the lithosphere below the upstream basin: a weaklithosphere (low effective elastic thickness, Te) allowsmore subsidenceand results in the generation of a larger accommodation space (Model5). A strong lithosphere supporting theupstreambasin leads to a suddenincrease in the supply to thedownstreambasin,while a lowTe results ina gradual increase in downstream sedimentation rates (Model 5 and 6;Figs. 11–13).
4.1.3. Continental stage in the upstream basin: fluvial incision and depositionThe (post-capture) continental evolution of the upstream basin
and the gateway is determined by fluvial processes which are afunction of the difference between the actual and the equilibrium rivergradient: the river tends to its equilibrium gradient and does so byeither incision or deposition (e.g. Kooi and Beaumont, 1994). The

Fig. 10. Model 5: effect of lithosphere rigidity. a. Sedimentation rates for different values of effective elastic thickness (Te). Transition from lacustrine to fluvial sedimentation in theupstream basin is marked by stars, the horizontal bars indicate the preceding period of increasing sedimentation rates in the downstream basin. Erosion rates in the downstreambasin are shown for reference. b. In the upstream basin: transition time from lacustrine to fluvial sedimentation, and fill-up time as a function of Te. t0 is the minimum time requiredto fill the basin and is a function of the basin volume and the supply rate. Hatch: period of fluvial sedimentation.
189K.A. Leever et al. / Tectonophysics 502 (2011) 175–195
response–incision or deposition–is determined by elevation and thedegree of overfill of the upstream basin at the lacustrine–continentaltransition.
If capture occurs in a late stage, when the upstream accommodationspace is nearlyfilled, theupstreambasinwill be overfilled andexhumed,a process much dependent on the elevation difference between thebasins. The larger the elevation difference, the larger the degree ofoverfill and the larger the subsequent river incision (Model 3, 4). Ifcapture happens in an earlier stage, with ample upstream accommo-dation space, fluvial sedimentation is likely in case of low lithosphererigidities (Model 2 and Model 6, 7 in Figs. 11 and 12).
The volume of continental sediments is influenced by the initialelevation of a preexisting gateway. The results fromModel 2 show that,due to the erosion-resistant barrier, the initial elevation of the gateway(and as such, upstream base level) controls the upstream accommoda-tion space and corresponding continental sedimentation in the laststage of basin fill evolution, causing differences in the total depositedvolumes (Fig. 5). This is despite the fact that the same gradient isestablished between the upstream and downstream basin in all threemodels within the first 2 My (Fig. 5b).
Even after capture and completion of the lacustrine infill of theupstreambasin, the barrier keeps controlling the upstreambase level byforming a knickpoint in the river long profile.
The mechanisms underlying the knickpoint formation promoteupstream fluvial sedimentation as can be seen by comparing the resultsfromModel 1 and 2. In Model 2, the barrier, uplifting by flexural isostaticrebound in response to erosion, separates two depocenters in the modelarea. Inorder tomaintain its gradient across the erosion-resistantupliftingbarrier, the river responds by upstream deposition (see also Snow andSlingerland, 1990). The larger theupstreamgenerationof accommodationspace by subsidence, the larger the accumulationoffluvial sediments. Thisiswell expressed by the results ofModel 6 (Figs. 10 and 11),where lowTevalues lead to large subsidence in the basins (and higher uplift of thebarrier), accommodating a large volume of continental sedimentscompared to the high Te values. In case of Model 1, the initial elevationof the barrier is at sea level over its entire length. It subsides with the sed-iment loaded adjacent basins, and is buried by sediment itself. Thewavelength of the subsiding area is different in this case, even though therigidity of the supporting lithosphere is the same inbothmodels. The riveris able to maintain its gradient across the former barrier without anydeposition or incision and is consequently at grade over its entire length.
4.2. Implications for the evolution of the Pannonian–Dacic area
Since the Sarmatian, Lake Pannon and the Dacic Basin existed as twowater masses at a relatively small elevation difference (in comparison

Fig. 11.Model 5, 6: lithosphere rigidity. Cross sections at 15 My. Vertical line marks change in orientation from W–E to S–N. Bold line indicates onset of fluvial sedimentation in theupstream basin, short dashmarks the shelf-slope break. a. Model 5, Te=30 km. b. Model 5, Te=5 km. Note the difference in volume of continental sediments with Fig. 5a. c. Model 6,Te west=5 km, Te east=30 km. Te transition over 60 km across the center of the model is marked schematically at the bottom of the panel.
190 K.A. Leever et al. / Tectonophysics 502 (2011) 175–195
with e.g. the Ebro Basin and the Mediterranean, see Garcia-Castellanoset al., 2003), separated by an elevated barrier. Themodelling results allowsome inferences on the evolution of the Pannonian and Dacic Basins as afunctionof their connectivity. As discussed above (Section4.1, Fig. 14), themodelling predicts that in a system such as the Pannonian–Dacic region,changes in connectivity may be recognized mainly from base level
changes in the upstream basin and supply changes in the downstreambasin, though the two may be separated by a time lag.
4.2.1. Pannonian BasinConstraints on base level evolution have been derived from
sequence stratigraphy (see Section 2). The rapid retreat of the coastline

Fig. 12. Model 6: lateral change in lithosphere rigidity. Sedimentation rates for different Te in the western (upstream) basin, Te in eastern basin is constant at 30 km (Table 2).Transition to continental sedimentation in the upstream basin is marked by x. The lithosphere rigidity below the upstream basin influences the expression of the peak sedimentationin the downstream basin, even though its Te is equal in all model scenarios.
191K.A. Leever et al. / Tectonophysics 502 (2011) 175–195
of Lake Pannon between 6.5 and 4.5 Ma, as reconstructed by Magyaret al. (1999a) (Fig. 1) closely matches in time the 2nd order sequenceboundary observed in theHungarianpart of the PannonianBasin (Fig. 2)and suggests that this sequence boundary is indeed associated with anabsolute lake level fall (rather than reduced tectonic subsidence).Estimates of its magnitude vary from 10s of meters (Sacchi et al., 1999)to200 m(Vakarcs et al., 1994). The hiatus associatedwith this boundaryhas been dated at 5–6 My (Csató et al., 2007).
Both capture (restoring connectivity) and enhanced incision by anantecedent river will affect the Pannonian lake level. In case of lakecapture, themagnitude of the lake level fall would be determined by therelative elevation of the Pannonian Lake with respect to the down-stream Dacic Basin at the time of capture (cf Model 3). Alternatively, incase of an existing fluvial connection, the adaptation of the rivergradient in the Danube gateway to the MSC-related lowering of the sealevel in the Dacic Basin would lower the Pannonian lake level as well(see also Tari et al., 1992). This raises the question, which mechanismcaused the “Messinian” sequence boundary in the Pannonian Basin?
The lake capture model assumes that the Sarmatian uplift defeatedthe river crossing the barrier and created an endorheic Pannonian Lake.Once disconnected, any lake level changes were due to local climaticfactors (i.e., the balance between water influx and evaporation in thedrainage area; see e.g. Juhász et al., 1999). Capture of the PannonianLake, restoring connectivity to theDacic Basin,would lead to a base levelfall. A capture-induced Pannonian lake level fall needs not be associatedwith a dry climate. To the contrary, capture was likely triggered by anincrease in the precipitation/evaporation ratio in the Pannonian Basin,inducing an initial rise in the lake level. This rise might triggerreconnection by “overspill and eventually lead to a lake level fall instead(see also Garcia-Castellanos (2006) for a more detailed discussion onthe parameters influencing lake capture).
Large uplift rates delay or even inhibit the reconnection (Figs. 8 and9), while the rise of the upstream lake level is a prerequisite (Garcia-Castellanos, 2006). Lake level changes in the Pannonian Basin in theorder of 10s of meters (Sacchi et al., 1999) imply that the Sarmatianuplift of the South CarpathianOroclinewas limited, otherwise capture isimpossible.
However, Sarmatian apatite fission track ages along the Danubegorgeswhich are interpreted to result froma tectonic uplift phase (Bojaret al., 1998) argue for a much larger uplift, in which case a major rise inthe Pannonian lake levelwould have been required for capture to occur.These data are in conflict and contradict the capture model. However,
lateral differences in erodibility in the South Carpathian orocline alongthemajor strike slip faults (such as the Cerna–Jiu fault, Fig. 1) may havecontributed to keeping the actual “barrier” at reduced elevation byfacilitating river incision despite large tectonic uplift. In addition, rapidlocalized incision would reduce the isostatic rebound due to erosionalunloading and thus accelerate capture.
Sea level fall does not accelerate lake capture in our particularsynthetic scenario.Water unloading related to sea level fall produces abarrier rebound that delays the capture process (Fig. 13), in a wayidentical to what Govers et al. (2009) propose for the onset of theMSCin the Mediterranean. Therefore, even if the lake level fall of thePannonian Basin were induced by capture, it is difficult to attribute itto the sea level fall in the Dacic Basin during the MSC.
Additional modelling givingmore precise estimates on the balancebetween uplift and incision, and taking into account lateral differencesin erodibility is required before the capture model can be discarded.
According to the antecedent river model, the fluvial connectionbetween the basins was maintained despite the Sarmatian upliftbecause the incision of the Paleo-Danube could keep upwith the upliftin the belt. The Pannonian lake level was controlled by the elevation ofthe outlet, and kept at a more or less constant level depending on thebalance between (isostatic) uplift rate of the barrier and river incision.
By calculating the water balance in the Pannonian drainage area(Fig. 15), the endorheic lake size that would be attained if the Danubewere blocked at the South Carpathian orocline can be predicted. Thecalculations show that for the present day range of precipitation andevaporation values, the predicted lake size exceeds even the maximumextent of Lake Pannon during the Sarmatian (Fig. 1, Magyar et al.,1999a). The Early Late Miocene precipitation in Western and CentralParatethys is estimated at 1200 mm/y (Böhme et al., 2006) and wouldlead to an even larger endorheic lake size (Fig. 15). These numberssuggest that after the Sarmatian uplift closed the open water con-nections between the Pannonian and Dacic Basins, a fluvial connectionshould have evolved in order to maintain the lake size.
The low salinity of Lake Pannon during its endemic Pannonianstage is an additional argument for a persistent fluvial connectionbetween the two basins (Kázmér, 1990) even if the outflow occurredalong subsurface karstic channels (Menkovic and Koscal, 1997) andthe surface expression of the Danube Gorges is younger. A pre-Pontianfluvial connection may explain the occurrence of freshwater Congeriaof Meotian age derived from the Pannonian Basin in the western partof the Dacic Basin (Olteanu, 1979). The water balance calculations

Fig. 13. Model 7: downstream base level change. a. Sea level curve in downstream basin for extreme scenarios (cf Table 2) b. Sedimentation and erosion rates in downstream basincompared with results fromModel 3 (same setup; no sea level fall). Increase in sedimentation and erosion rates reflects increase in exposed area due to base level fall. Arrows markcapture time for the three presented models.
192 K.A. Leever et al. / Tectonophysics 502 (2011) 175–195
(Fig. 15) therefore prompt further investigation of the relationshipbetween endorheism and endemism, but suggest that endorheism isnot a prerequisite for the Pannonian endemism.
A permanent open-water connection would be in conflict withthe well established endemism in the Pannonian basin during thePannonian/Meotian stage (Fig. 2) since it would equilibrate the entirefauna between the two basins. Considering the decreasing salinity alsoin the Dacic Basin since the Sarmatian (Popov et al., 2006), even afluvial connection between the basins might have led to faunaequilibration. This does not occur until the Pontian and would be anargument against the antecedent river model.
If the Pannonian lake level lowering resulted from the deeperincision of anexisting river into its gatewaydue to the largeMSC-relatedbase level fall in theDacic Basin (Clauzon et al., 2005; Leever et al., 2009),the two events of base level fall can be directly correlated. This wouldconstrain the time of the Pannonian lake level fall to theMiddle Pontian(of the Eastern Paratethys), i.e. at∼5.5 My (Vasiliev et al., 2004; Vasilievet al., 2005).
4.2.2. Dacic BasinThe models predict that the onset of a fluvial connection between
Dacic and Pannonian lakes should be marked by locally increasedsedimentation rates in front of the Danube gateway in the Dacic Basin,even if the reconnection occurred before the upstream Pannonian Lakecompleted its infill and attained its fluvial stage. A much morepronounced increase in sedimentation rates would be associated withthe overfilling of the PannonianBasin. The overfilling and bulk sedimentshift can be directly related to capture only in the special case of a smallremaining upstream accommodation space in combinationwith a largeelevation difference (see Section 4.1, Fig. 14).
No strong indications of enhanced sedimentation in front of theDanube gorges with respect to other locations are found in publishedseismic data in the western Dacic Basin prior to the Pontian (Rabagiaand Matenco, 1999; Tarapoanca et al., 2007; Leever et al., 2009). Thisfits with the model predictions (Model 5, 6). The weak Pannonianlithosphere would allow ongoing generation of accommodation spacein the upstream basin even after the end of the lacustrine stage, while

Fig. 14. Factors controlling sedimentary response to lake capture.
193K.A. Leever et al. / Tectonophysics 502 (2011) 175–195
no pronounced increase in sedimentation rates is to be expected inthe Dacic Basin, even if a connection between the basins exists. Alsothe limited elevation difference between the basins would inhibit astrong signature of a potential reconnection (Fig. 14).
Within the limitations of the 2D seismic data, enhanced sedimen-tation in front of the Danube gorges may be inferred starting with theMiddle Pontian sea-level drop, coeval with theMessinian event (Leeveret al., 2009). The enhanced sedimentation in the front of the Danubeindicates that the Pannonian basin has reached an overfilled stage andthat aweak, accommodating Pannonian lithosphere (Fig. 11c) no longerexplains the behaviour of the system. A likelymechanism to explain thechange in its “strength”–or its reduced sink capacity–would be theinversion of the Pannonian basin starting in the latest Miocene (∼6 Ma,Vrabec and Fodor, 2004; Leever et al., 2009). Modelling results fromJarosinski et al. (this volume)predict uplift in theentire Pannonianbasinand show concentration of strain and differential verticalmovements atthe limit between the basin and the Dinarides, in close proximity withthe Danube basin outlet.
To determine the relative importance of sea level fall (in the Dacicbasin) and basin inversion (leading to changes in lithosphereresponse to loading in the Pannonian basin and differential verticalmotions around the South Carpathian orocline), additional data arerequired, such as estimates of sediment volumes for both basins andmore detailed exhumation analysis of the gateway area in the SouthCarpathian orocline. Further modelling studies of river incision andgateway formation should take into account the effect of intraplatestresses (Cloetingh et al., 1985) and lateral changes in erodibility.
5. Conclusions
Numerical modelling showed that changes in connectivity betweentwo adjacent sedimentary basins are expressed in the sedimentaryrecord through its effect on lake level (accommodation space) in theupstream basin and sediment supply in the downstream basin. The keyfactors controlling the sedimentary response are the upstream
accommodation space and the elevation of the upstream basin at thetime of capture. We found that lithosphere rigidity, through its controlon accommodation space, is ofmajor influenceon sedimentpartitioningand depositional geometries. In the configuration of our model,downstream sea level changes will only affect the upstream basin if agateway already exists.
Lake level changes in the upstream basin, affecting depositionalgeometries by changing accommodation space, aremost pronounced fora large pre-capture elevation difference between the basins. Dependingon both the elevation difference and the remaining accommodationspace, the capture-induced lake level fall may lead to locally stronglyincreased sedimentation rates and final infilling of the upstream basin.
In addition to the elevation difference between the basins andassuming that the climatic conditions are steady and well constrained,the rigidity of the lithosphere is the most important parameterinfluencing the post-capture sedimentary evolution. It controls boththe timing and the rate of the bulk sediment shift from the upstream tothe downstream basin. A strong upstream lithosphere will lead to a fastand sudden shift while for a weak lithosphere the response is moregradual. The capture event itself will not lead to a strong downstreamchange in sedimentation rates, unless it triggers the sediment overfill ofthe upstream basin. This is more likely to occur for a large elevationdifference between the basins.
Sea level fall does not accelerate lake capture in our particularsynthetic scenario. Water unloading related to sea level fall produces abarrier rebound that delays the capture process (see also Govers et al.,2009).
As for the Pannonian and Dacic Basins, themodelling results suggestthat, after the Sarmatian uplift of the South Carpathians, the fluvialconnection between the basins was never lost. Calculations of a waterbalance for the Pannonian drainage area and the low salinity of LakePannon during the endemic Pannonian stage (Kázmér, 1990) also arguein favor of the antecedent rivermodel. This model may ormay not be indisagreement with the overall endemism of Pannonian and Meotianfaunas. Alternatively, occasional incursions of Pannonian faunas in the

Fig. 15. Equilibrium endorheic surface for Lake Pannon. a. Water balance within a drainage area. b. Equilibrium surface (Aw) of a hypothetical endorheic Lake Pannon for differentprecipitation (P) and evaporation rates (at land, El), as a function of evaporation at the lake (Ew). Curves (a) and (b) are based on the average present day outflowQout of the Danubeat the Iron Gates of 5450 m3/s (http://www.grdc.sr.unh.edu/). If zero evaporation on land is assumed, this yields an average annual precipitation of 287 mm/y over the Pannoniandrainage area (a). The actual present-day annual precipitation is 600 mm/y in Hungary (Vituki, 2002), corresponding to an El of 313 mm/y (b). Assuming the average Mioceneprecipitation values (1200 mm/y, Böhme et al., 2006) leads to a much larger estimate of endorheic lake size (c, d). Heavy horizontal dashed line represents maximum MiddleMiocene surface area of Lake Pannon (Magyar et al., 1999a); the surface area in the present-day Pannonian drainage area below 100 and 200 m (derived from SRTM DEM) is shownfor reference. These equations show that, within the range of present day evaporation rates at Lake Balaton, an endorheic lake is unlikely for any of the considered P/El ratios andsuggest that a permanent outflow must have existed.
194 K.A. Leever et al. / Tectonophysics 502 (2011) 175–195
Dacic basin may be explained by overspill events rather than by apermanent connection. The Messinian sea level fall in the Dacic Basinresulted in deeper fluvial incision into the Danube gateway, whichcaused the lowering of the Pannonian lake level; the connectionbetween the basins was permanent from then on. The lowering of thePannonian lake level marked the end of the 2nd order “Late Miocenesequence” (sensu Juhász et al., 1999), enhanced the final infilling of thebasin and increased the sedimentation rates into the Dacic Basin.
Combined with constraints from basin-scale seismic sequencestratigraphy, the modelling technique used here is a promising toolfor reconstructing paleogeographic evolution, aiding the interpretationof the existing biostratigraphic database and outlining the need foradditional (field) constraints on the vertical motions in the barrier andits flanking basins.
Acknowledgements
This research was part of KAL's PhD thesis sponsored by ISES. Twoanonymous reviewers provided useful comments on an earlierversion of the manuscript.
Appendix A. Supplementary data
Supplementary data associated with this article can be found, inthe online version, at doi:10.1016/j.tecto.2010.01.003.
References
Bada, G., Horvath, F., Gerner, P., Fejes, I., 1999. Review of the present-day geodynamics ofthe Pannonian Basin; progress and problems. Journal of Geodynamics 27, 501–527.

195K.A. Leever et al. / Tectonophysics 502 (2011) 175–195
Böhme, M., Ilg, A., Ossig, A., Küchenhoff, H., 2006. New method to estimatepaleoprecipitation using fossil amphibians and reptiles and the middle and lateMiocene precipitation gradients in Europe. Geology 425–428.
Bojar, A.-V., Neubauer, F., Fritz, H., 1998. Cretaceous to Cenozoic thermal evolution ofthe southwestern South Carpathians: evidence from fission-track thermochronol-ogy. Tectonophysics 297, 229–249.
Clauzon, G., 1978. The Messinian Var canyon (Provence, southern France)—paleogeo-graphic implications. Marine Geology 27 (3–4), 231–246.
Clauzon, G., et al., 2005. Influence of Mediterranean sea-level changes on the DacicBasin (Eastern Paratethys) during the late Neogene: the Mediterranean Lago Marefacies deciphered. Basin Research 17 (3), 437–462.
Cloetingh, S., et al., 2006. Models of Basin (de)formation, lithospheric strength andvertical motions in the Pannonian–Carpathian system: inferences from thermo-mechanical modelling. In: Gee, D.G., Stephenson, R. (Eds.), European LithosphereDynamics, Memoirs. Geological Society, London, pp. 207–221.
Cloetingh, S., McQueen, H., Lambeck, K., 1985. On a tectonic mechanism for regionalsealevel variations. Earth and Planetary Science Letters 75, 157–166.
Csató, I., 1993. Neogene sequences in the Pannonian basin, Hungary. Tectonophysics226 (1–4), 377–400.
Csató, I., Kendall, C., Moore, P.D., 2007. The Messinian problem in the Pannonian basin,eastern Hungary—insights from stratigraphic simulations. Sedimentary Geology201 (1–2), 111–140.
Cvijic, J., 1908. Entwicklungsgeschichte des Eisernen Tores. Peterm, MitteilungenErgänzungsheft. 160.
Fuegenschuh, B., Schmid, S., 2005. Age and significance of core complex formation in avery curved orogen: evidence from fission track studies in the South Carpathians(Romania). Tectonophysics 404 (1–2), 33–53.
Gagic, N., 1997. Neogene brachyhaline and freshwater microfossil association inZagubica Basin. In: Grubic, A., Berza, T. (Eds.), International Symposium on Geologyin the Danube Gorges. Geoinstitut, Donji Milanovac/Orsova, pp. 61–64.
Garcia-Castellanos, D., 2002. Interplay between lithospheric flexure and river transportin foreland basins. Basin Research 14, 89–104.
Garcia-Castellanos, D., 2006. Long-term evolution of tectonic lakes: climatic controls onthe development of internally drained basins. GSA Special Paper 398, 283–294.
Garcia-Castellanos, D., Verges, J., Gaspar-Escribano, J., Cloetingh, S.A.P.L., 2003. Interplaybetween tectonics, climate, and fluvial transport during the Cenozoic evolution ofthe Ebro Basin (NE Iberia). Journal of Geophysical Research 108 (B7), 2347.
Gillet, H., Lericolais, G., Rehault, J.P., 2007. Messinian event in the Black Sea: evidence ofa Messinian erosional surface. Marine Geology 244 (1–4), 142–165.
Govers, R., Meijer, P., Krijgsman, W., 2009. Regional isostatic response to MessinianSalinity Crisis events. Tectonophysics 463 (1–4), 109–129.
Haq, B.U., Hardenbol, J., Vail, P.R., 1987. Chronology of fluctuating sea levels since theTriassic. Science 235 (4793), 1156–1167.
Horváth, F., et al., 2006. Formation and deformation of the Pannonian Basin: constraintsfrom observational data. In: Gee, D.G., Stephenson, R. (Eds.), European LithosphereDynamics, Memoirs. Geological Society, London, pp. 191–206.
Horváth, F., Cloetingh, S.A.P.L., 1996. Stress-induced late-stage subsidence anomalies inthe Pannonian Basin. Tectonophysics 266, 287–300.
Juhász, E., et al., 1999. Late Neogene sedimentary facies and sequences in the PannonianBasin, Hungary. In: Durand, B., Jolivet, L., Horváth, F., Séranne, M. (Eds.), TheMediterranean Basins: Tertiary Extension Within the Alpine Orogen. SpecialPublications. Geological Society, London, pp. 335–356.
Juhász, G., Pogácsás, G., Magyar, I., Vakarcs, G., 2007. Tectonic versus climatic control onthe evolution of fluvio-deltaic systems in a lake basin, Eastern Pannonian Basin.Sedimentary Geology 202 (1–2), 72–95.
Kázmér, M., 1990. Birth, life and death of the Pannonian Lake. Palaeogeography,Palaeoclimatology, Palaeoecology 79, 171–188.
Kooi, H., Beaumont, C., 1994. Escarpment evolution on high-elevation rifted margins:insights derived from a surface processes model that combines diffusion, advection,and reaction. Journal of Geophysical Research 99 (B6), 12191–12209.
Krijgsman,W., Hilgen, F.J., Raffi, I., Sierro, F.J., Wilson, D.S., 1999. Chronology, causes andprogression of the Messinian salinity crisis. Nature 400 (6745), 652–655.
Lankreijer, A., Mocanu, V., Cloetingh, S.A.P.L., 1997. Lateral variations in lithospherestrength in the Romanian Carpathians: constraints on basin evolution. Tectono-physics 272 (2–4), 269–290.
Leever, K.A., Matenco, L., Rabagia, T., Cloetingh, S., Krijgsman, W., Stoica, M., 2009.Messinian sea level fall in the Dacic Basin (Eastern Paratethys): palaeogeographicalimplications from seismic sequence stratigraphy. Terra Nova 22 (1), 12–17.
Loget, N., Van Den Driessche, J., 2006. On the origin of the Strait of Gibraltar.Sedimentary Geology—The Messinian Salinity Crisis Revisited 188–189, 341–356.
Magyar, I., Geary, D.H., Müller, P., 1999a. Paleogeographic evolution of the Late MioceneLake Pannon in Central Europe. Palaeogeography, Palaeoclimatology, Palaeoecol-ogy 147, 151–167.
Magyar, I., Geary, D.H., Suto-Szentai, M., Lantos, M., Muller, P., 1999b. Integratedbiostratigraphic, magnetostratigraphic and chronostratigraphic correlations of theLate Miocene Lake Pannon deposits. Acta Geologica Hungarica 42, 5–31.
Marinescu, F., Ghenea, C., Papaianopol, I., 1981. Stratigraphy of the Neogene and thePleistocene boundary. Guide to Excursion A6, Carpatho-BalkanGeological AssociationXII Congress. Guidebook Series. Institute of Geology and Geophysics, Bucharest.
Marovic, M., Grubic, A., Djokovic, I., Toljic, M., Vojvodic, V., 1997. The genesis of Djerdapgorge. In: Grubic, A., Berza, T. (Eds.), International Symposium on Geology in theDanube Gorges. Geoinstitut, Donji Milanovac/Orsova, pp. 99–104.
Matenco, L., Bertotti, G., Dinu, C., Cloetingh, S.A.P.L., 1997. Tertiary tectonic evolution ofthe external South Carpathians and the adjacent Moesian platform (Romania).Tectonics 16 (6), 896–911.
Matenco, L., Schmid, S., 1999. Exhumation of the Danubian nappes system (southCarpathians) during the early Tertiary: inferences from kinematic and paleostressanalysis at the Getic/Danubian nappes contact. Tectonophysics 314 (4), 401–422.
Menkovic, L., Koscal, M., 1997. Geomorphological features and morphogenesis ofDjerdap gorge. In: Grubic, A., Berza, T. (Eds.), International Symposium on Geologyin the Danube Gorges. Geoinstitut, Donji Milanovac/Orsova, pp. 89–98.
Olteanu, R., 1979. Signification biostratigraphique des ostracodes Méotiens et Pontiensdu Bassin Dacique. Rev. Roum. Géol., Geophys. et Geogr., Géologie, 23(1): 77–87
Olteanu, R., Jipa, D., 2006. Dacian Basin environmental evolution during Upper Neogenewithin the Paratethys domain. Geo-Eco-Marina 12, 91–105.
Peters, K.F., 1876. Die Donau und ihr Gebiet: Eine geologische Skizze. F.A. Brockhaus,Leipzig. 375 pp.
Pogácsás, G., et al., 1990. Chronostratigraphic relations of Neogene formations of theGreat Hungarian Plain, based on interpretation of seismic and paleomagnetic data.International Geology Review 32 (5), 449–467.
Pogácsás, G., Szabó, A., Szalay, J., 1992. Chronostratigraphic relations of the progradationaldelta sequence of the Great Hungarian Plain. Acta Geologica Hungarica 35, 311–327.
Popov, S.V., et al., 2006. Late Miocene to Pliocene palaeogeography of the Paratethysand its relation to the Mediterranean. Palaeogeography, Palaeoclimatology,Palaeoecology 238, 91–106.
Rabagia, T. and Fülöp, A., 1994. Syntectonic sedimentation history in the SouthernCarpathians foredeep. In: T. Berza (Editor), ALPACA: II. Geological evolution of theAlps–Carpathian–Pannonian System. Rom. J. Tecton. Reg. Geol., pp. 48.
Rabagia, T., Matenco, L., 1999. Tertiary tectonic and sedimentological evolution of theSouth Carpathians foredeep: tectonic versus eustatic control. Marine and PetroleumGeology 16 (7), 719–740.
Rögl, F., 1996. Stratigraphic correlation of the Paratethys Oligocene and Miocene.Mitteilungen Gesellschaft Geologie- und Bergbaustudien Österreich 41, 65–73.
Rögl, F., 1999. Mediterranean and Paratethys. Facts and hypotheses of an Oligocene toMiocene paleogeography. Geologica Carpathica 50, 339–349.
Sacchi, M., Horváth, F., 2002. Towards a new time scale for the UpperMiocene continentalseries of the Pannonian Basin (Central Paratethys). In: Cloetingh, S.A.P.L., Horváth, F.,Bada, G., Lankreijer, A. (Eds.), Neotectonics and Surface Processes: the PannonianBasin and Alpine/Carpathian System. EGU StephanMueller Special Publication Series.Copernicus GMBH, Katlenburg-Lindau, pp. 79–204.
Sacchi, M., Horváth, F., Magyari, O., 1999. Role of unconformity-bounded units instratigraphy of continental record: a case study from the Late Miocene of westernPannonian Basin, Hungary. In: Durand, B., Jolivet, L., Horváth, F., Séranne, M. (Eds.),The Mediterranean Basins: Tertiary Extension Within the Alpine Orogen.Geological Society Special Publication, London, pp. 357–390.
Sandulescu, M., 1984. Geotectonica României (translated title: GeoTectonics ofRomania). Ed. Tehnica, Bucharest, 450 pp.
Sandulescu, M., 1988. Cenozoic tectonic history of the Carpathians. In: Royden, L.H.,Horváth, F. (Eds.), AAPG Memoir, pp. 17–25.
Saulea, E., Popescu, I., Sandulescu, J., 1969. Lithofacies Atlas. Institutul de Geologie siGeofizica, Bucharest.
Snow, R.S., Slingerland, R., 1990. Stream profile adjustment to crustal warping:nonlinear results from a simple model. Jounal of Geology 98, 699–708.
Steininger, F.F., Bernor, R.L., Fahlbusch, V., Mein, P., 1990. European Neogene marine/continental chronologic relations. In: Lindsay, E.H., Fahlbusch, V., Mein, P. (Eds.),European Neogene Mammal Chronology. Plenum Press, New York, pp. 15–46.
Tarapoanca, M., Tambrea, D., Avram, V., Popescu, B., 2007. The geometry of the SouthCarpathian sole thrust and the Moesia boundary: the role of inherited structures inestablishing a transcurrent contact on the concave side of the Carpathians. In:Lacombe, O., Lavé, J., Roure, F., Verges, J. (Eds.), Thrust Belts and Foreland Basins:From Fold Kinematics to Hydrocarbon Systems. Frontiers in Earth Sciences. Springer,pp. 369–384.
Tari, G., Horváth, F., Rumpler, J., 1992. Styles of extension in the Pannonian Basin.Tectonophysics 208 (1–3), 203–219.
Toula, F., 1896. Uber den Durchbruch der Donau durch das Banategebirge. Vort. Ver. zurVerbreitung der natur., Kennt. Wien.
Ujszászi, K., Vakarcs, G., 1993. Sequence stratigraphic analysis in the south Transdanubianregion, Hungary. Geophysical Transactions 38 (2–3), 69–87.
Ustaszewski, K., et al., 2008. A map-view restoration of the Alpine–Carpathian–Dinaridic system for the Early Miocene. Swiss Journal of Geosciences 101, 273–294.
Vakarcs, G., et al., 1994. Third order Middle Miocene–Early Pliocene depositionalsequences in the prograding delta complex of the Pannonian Basin. Tectonophysics240 (1–4), 81–106.
Vasiliev, I., et al., 2004. Towards an astrochronological framework for the easternParatethys Mio-Pliocene sedimentary sequences of the Focsani Basin (Romania).Earth and Planetary Science Letters 227, 231–247.
Vasiliev, I., Krijgsman, W., Stoica, M., Langereis, C., 2005. Mio-Pliocene magnetostrati-graphy in the southern Carpathian foredeep and Mediterranean–Paratethyscorrelations. Terra Nova 17 (4), 376–385.
Vituki, 2002. A Balatoni vízpótlás lehetöségeinek vizsgálata. Vituki Rt, Budapest.Vrabec, M., Fodor, L., 2004. Late Cenozoic tectonics of Slovenia: structural styles at the
northeastern corner of the Adriatic microplate. In: Pinter, N., Grenerczy, G., Weber, J.,Stein, S., Medak, D. (Eds.), NATOAdvanced ResearchWorkshop on AdriaMicroplate—GPS Geodesy, Tectonics and Hazards, Veszprem, HUNGARY, pp. 151–168.
Wortel, M.J.R., Spakman, W., 2000. Subduction and slab detachment in theMediterranean–Carpathian region. Science 290, 1910–1917.
Related Documents